Project Final Report BUBO BUBO - University of Colorado Boulder
124
Project Final Report BUBO BUBO University of Colorado Department of Aerospace Engineering Sciences ASEN 4028 Monday 4 th May, 2020 Name: Charlotte Bellerjeau Email:[email protected] Phone: 516-492-9363 Position: Aerodynamics Lead Name: Andrew Fendel Email: [email protected] Phone: 303-888-2020 Position: Systems Engineer Name: Keaton Fitton Email: keaton.fi[email protected] Phone: 541-306-9973 Position: Structures Lead Name: Ethan Gabrielle Email: [email protected] Phone: 720-494-0183 Position: Manufacturing Lead Name: Karim Krarti Email: [email protected] Phone: 720-238-9792 Position: FADS and Propulsion Lead Name: Nickolas Mororo Email: [email protected] Phone: 720-206-7792 Position: Financial Officer Name: Kaitlyn Olson Email: [email protected] Phone: 561-762-9066 Position: Project Manager Name: Seif Said Email: [email protected] Phone: 720-218-4711 Position: Software and Controls Lead Name: Jesse Williams Email: [email protected] Phone: 605-280-2626 Position: Test and Safety Lead Name: Jeremy Yanowitz Email: [email protected] Phone: 831-252-0149 Position: Electrical Lead and Pilot Customer: Dr. Brian Argrow: Department Chair, Ann and H.J. Smead Aerospace Engineering Sciences Christopher Choate: Aircraft Engineer and Pilot in Command, Integrated Remote and In Situ Sensing (IRISS) Supervised by: Dr. Donna Gerren: Teaching Professor, Ann and H.J. Smead Aerospace Engineering Sciences
-
Upload
khangminh22 -
Category
Documents
-
view
0 -
download
0
Transcript of Project Final Report BUBO BUBO - University of Colorado Boulder

Project Final ReportBUBO BUBO
University of Colorado
Department of Aerospace Engineering Sciences
ASEN 4028
Monday 4th May, 2020
Name: Charlotte BellerjeauEmail:[email protected]: 516-492-9363Position: Aerodynamics Lead
Name: Andrew FendelEmail: [email protected]: 303-888-2020Position: Systems Engineer
Name: Keaton FittonEmail: [email protected]: 541-306-9973Position: Structures Lead
Name: Ethan GabrielleEmail: [email protected]: 720-494-0183Position: Manufacturing Lead
Name: Karim KrartiEmail: [email protected]: 720-238-9792Position: FADS and Propulsion Lead
Name: Nickolas MororoEmail: [email protected]: 720-206-7792Position: Financial Officer
Name: Kaitlyn OlsonEmail: [email protected]: 561-762-9066Position: Project Manager
Name: Seif SaidEmail: [email protected]: 720-218-4711Position: Software and Controls Lead
Name: Jesse WilliamsEmail: [email protected]: 605-280-2626Position: Test and Safety Lead
Name: Jeremy YanowitzEmail: [email protected]: 831-252-0149Position: Electrical Lead and Pilot
Customer:Dr. Brian Argrow: Department Chair, Ann and H.J. Smead Aerospace Engineering SciencesChristopher Choate: Aircraft Engineer and Pilot in Command, Integrated Remote and In Situ Sensing (IRISS)
Supervised by:Dr. Donna Gerren: Teaching Professor, Ann and H.J. Smead Aerospace Engineering Sciences
Aerospace Senior Projects ASEN 4028
Table of Contents
Acronyms and Nomenclature 9
1 Project Purpose 131.1 Mission Statement . . . . . . . . . . . . . . . . . . . . . . . . . . . . . . . . . . . . . . . . . . . . . . . . . 131.2 Description . . . . . . . . . . . . . . . . . . . . . . . . . . . . . . . . . . . . . . . . . . . . . . . . . . . . . 13
2 Project Objectives and Functional Requirements 142.1 Objectives . . . . . . . . . . . . . . . . . . . . . . . . . . . . . . . . . . . . . . . . . . . . . . . . . . . . . . 142.2 Functional Requirements . . . . . . . . . . . . . . . . . . . . . . . . . . . . . . . . . . . . . . . . . . . . . 152.3 Concept of Operations . . . . . . . . . . . . . . . . . . . . . . . . . . . . . . . . . . . . . . . . . . . . . . . 162.4 Functional Block Diagram . . . . . . . . . . . . . . . . . . . . . . . . . . . . . . . . . . . . . . . . . . . . . 16
3 Design Process and Outcome 183.1 Trade Studies . . . . . . . . . . . . . . . . . . . . . . . . . . . . . . . . . . . . . . . . . . . . . . . . . . . . 18
3.1.1 Rationale . . . . . . . . . . . . . . . . . . . . . . . . . . . . . . . . . . . . . . . . . . . . . . . . . . . 183.1.2 Trades Conducted and Results . . . . . . . . . . . . . . . . . . . . . . . . . . . . . . . . . . . . . . 18
3.2 Design Requirements Flowdown . . . . . . . . . . . . . . . . . . . . . . . . . . . . . . . . . . . . . . . . . 183.3 Final Design . . . . . . . . . . . . . . . . . . . . . . . . . . . . . . . . . . . . . . . . . . . . . . . . . . . . . 23
3.3.1 Control System . . . . . . . . . . . . . . . . . . . . . . . . . . . . . . . . . . . . . . . . . . . . . . . 233.3.2 Airframe . . . . . . . . . . . . . . . . . . . . . . . . . . . . . . . . . . . . . . . . . . . . . . . . . . . 233.3.3 Electrical Circuit . . . . . . . . . . . . . . . . . . . . . . . . . . . . . . . . . . . . . . . . . . . . . . 24
4 Manufacturing 274.1 Mechanical Manufacturing Scope . . . . . . . . . . . . . . . . . . . . . . . . . . . . . . . . . . . . . . . . 274.2 Electrical Manufacturing Scope . . . . . . . . . . . . . . . . . . . . . . . . . . . . . . . . . . . . . . . . . 284.3 Software Manufacturing Scope . . . . . . . . . . . . . . . . . . . . . . . . . . . . . . . . . . . . . . . . . . 294.4 Outcome of Manufacturing Tasks . . . . . . . . . . . . . . . . . . . . . . . . . . . . . . . . . . . . . . . . 29
4.4.1 Outcome of Mechanical Manufacturing . . . . . . . . . . . . . . . . . . . . . . . . . . . . . . . . . 304.4.2 Outcome of Electrical Manufacturing . . . . . . . . . . . . . . . . . . . . . . . . . . . . . . . . . . 304.4.3 Outcome of Software Manufacturing . . . . . . . . . . . . . . . . . . . . . . . . . . . . . . . . . . 30
4.5 Manufacturing Challenges . . . . . . . . . . . . . . . . . . . . . . . . . . . . . . . . . . . . . . . . . . . . 314.6 Component Integration . . . . . . . . . . . . . . . . . . . . . . . . . . . . . . . . . . . . . . . . . . . . . . 31
5 Verification and Validation 365.1 Whiffletree Test . . . . . . . . . . . . . . . . . . . . . . . . . . . . . . . . . . . . . . . . . . . . . . . . . . . 36
5.1.1 Reason for Test . . . . . . . . . . . . . . . . . . . . . . . . . . . . . . . . . . . . . . . . . . . . . . . 365.1.2 Predictive Modeling . . . . . . . . . . . . . . . . . . . . . . . . . . . . . . . . . . . . . . . . . . . . 365.1.3 Test Setup . . . . . . . . . . . . . . . . . . . . . . . . . . . . . . . . . . . . . . . . . . . . . . . . . . 365.1.4 Data Collected . . . . . . . . . . . . . . . . . . . . . . . . . . . . . . . . . . . . . . . . . . . . . . . . 375.1.5 Data Analysis and Comparisons to Predictive Modeling . . . . . . . . . . . . . . . . . . . . . . . 395.1.6 Validation . . . . . . . . . . . . . . . . . . . . . . . . . . . . . . . . . . . . . . . . . . . . . . . . . . 39
5.2 Thrust Test . . . . . . . . . . . . . . . . . . . . . . . . . . . . . . . . . . . . . . . . . . . . . . . . . . . . . . 395.2.1 Reason for Test . . . . . . . . . . . . . . . . . . . . . . . . . . . . . . . . . . . . . . . . . . . . . . . 395.2.2 Predictive Modeling . . . . . . . . . . . . . . . . . . . . . . . . . . . . . . . . . . . . . . . . . . . . 395.2.3 Test Setup . . . . . . . . . . . . . . . . . . . . . . . . . . . . . . . . . . . . . . . . . . . . . . . . . . 405.2.4 Data Collected . . . . . . . . . . . . . . . . . . . . . . . . . . . . . . . . . . . . . . . . . . . . . . . . 415.2.5 Data Analysis and Comparisons to Predictive Modeling . . . . . . . . . . . . . . . . . . . . . . . 415.2.6 Validation . . . . . . . . . . . . . . . . . . . . . . . . . . . . . . . . . . . . . . . . . . . . . . . . . . 44
5.3 FADS Test . . . . . . . . . . . . . . . . . . . . . . . . . . . . . . . . . . . . . . . . . . . . . . . . . . . . . . . 445.3.1 Reason for Test . . . . . . . . . . . . . . . . . . . . . . . . . . . . . . . . . . . . . . . . . . . . . . . 445.3.2 Predictive Modeling . . . . . . . . . . . . . . . . . . . . . . . . . . . . . . . . . . . . . . . . . . . . 445.3.3 Test Setup . . . . . . . . . . . . . . . . . . . . . . . . . . . . . . . . . . . . . . . . . . . . . . . . . . 445.3.4 Data Collected . . . . . . . . . . . . . . . . . . . . . . . . . . . . . . . . . . . . . . . . . . . . . . . . 455.3.5 Data Analysis and Comparisons to Predictive Modeling . . . . . . . . . . . . . . . . . . . . . . . 465.3.6 Validation . . . . . . . . . . . . . . . . . . . . . . . . . . . . . . . . . . . . . . . . . . . . . . . . . . 46
05/04/20 2 of 124
University of Colorado Boulder
FFR

Aerospace Senior Projects ASEN 4028
5.4 Controls Testing . . . . . . . . . . . . . . . . . . . . . . . . . . . . . . . . . . . . . . . . . . . . . . . . . . . 465.4.1 Reason for Test . . . . . . . . . . . . . . . . . . . . . . . . . . . . . . . . . . . . . . . . . . . . . . . 465.4.2 Predictive Modeling . . . . . . . . . . . . . . . . . . . . . . . . . . . . . . . . . . . . . . . . . . . . 465.4.3 Test Setup . . . . . . . . . . . . . . . . . . . . . . . . . . . . . . . . . . . . . . . . . . . . . . . . . . 475.4.4 Data Collected . . . . . . . . . . . . . . . . . . . . . . . . . . . . . . . . . . . . . . . . . . . . . . . . 475.4.5 Data Analysis and Comparisons to Predictive Modeling . . . . . . . . . . . . . . . . . . . . . . . 475.4.6 Validation . . . . . . . . . . . . . . . . . . . . . . . . . . . . . . . . . . . . . . . . . . . . . . . . . . 47
5.5 Power/Endurance Test . . . . . . . . . . . . . . . . . . . . . . . . . . . . . . . . . . . . . . . . . . . . . . . 485.5.1 Reason for Test . . . . . . . . . . . . . . . . . . . . . . . . . . . . . . . . . . . . . . . . . . . . . . . 485.5.2 Predictive Modeling . . . . . . . . . . . . . . . . . . . . . . . . . . . . . . . . . . . . . . . . . . . . 485.5.3 Test Setup . . . . . . . . . . . . . . . . . . . . . . . . . . . . . . . . . . . . . . . . . . . . . . . . . . 495.5.4 Data Collected . . . . . . . . . . . . . . . . . . . . . . . . . . . . . . . . . . . . . . . . . . . . . . . . 495.5.5 Data Analysis and Comparisons to Predictive Modeling . . . . . . . . . . . . . . . . . . . . . . . 505.5.6 Validation . . . . . . . . . . . . . . . . . . . . . . . . . . . . . . . . . . . . . . . . . . . . . . . . . . 50
5.6 Stability/Glide Test . . . . . . . . . . . . . . . . . . . . . . . . . . . . . . . . . . . . . . . . . . . . . . . . . 505.6.1 Reason for Test . . . . . . . . . . . . . . . . . . . . . . . . . . . . . . . . . . . . . . . . . . . . . . . 505.6.2 Predictive Modeling . . . . . . . . . . . . . . . . . . . . . . . . . . . . . . . . . . . . . . . . . . . . 505.6.3 Test Setup . . . . . . . . . . . . . . . . . . . . . . . . . . . . . . . . . . . . . . . . . . . . . . . . . . 505.6.4 Data Collected . . . . . . . . . . . . . . . . . . . . . . . . . . . . . . . . . . . . . . . . . . . . . . . . 515.6.5 Data Analysis and Comparisons to Predictive Modeling . . . . . . . . . . . . . . . . . . . . . . . 515.6.6 Validation . . . . . . . . . . . . . . . . . . . . . . . . . . . . . . . . . . . . . . . . . . . . . . . . . . 51
5.7 Flight Test . . . . . . . . . . . . . . . . . . . . . . . . . . . . . . . . . . . . . . . . . . . . . . . . . . . . . . 515.7.1 Reason for Test . . . . . . . . . . . . . . . . . . . . . . . . . . . . . . . . . . . . . . . . . . . . . . . 515.7.2 Predictive Modeling . . . . . . . . . . . . . . . . . . . . . . . . . . . . . . . . . . . . . . . . . . . . 515.7.3 Test Setup . . . . . . . . . . . . . . . . . . . . . . . . . . . . . . . . . . . . . . . . . . . . . . . . . . 525.7.4 Data Collected . . . . . . . . . . . . . . . . . . . . . . . . . . . . . . . . . . . . . . . . . . . . . . . . 525.7.5 Data Analysis and Comparisons to Predictive Modeling . . . . . . . . . . . . . . . . . . . . . . . 535.7.6 Validation . . . . . . . . . . . . . . . . . . . . . . . . . . . . . . . . . . . . . . . . . . . . . . . . . . 53
6 Risk Assessment and Mitigation 546.1 Technical Challenge - Static Margin . . . . . . . . . . . . . . . . . . . . . . . . . . . . . . . . . . . . . . . 546.2 Logistical Challenge - Thrust Testing . . . . . . . . . . . . . . . . . . . . . . . . . . . . . . . . . . . . . . . 546.3 Safety Challenge - LiPo Batteries . . . . . . . . . . . . . . . . . . . . . . . . . . . . . . . . . . . . . . . . . 55
7 Project Planning 577.1 Organization Chart . . . . . . . . . . . . . . . . . . . . . . . . . . . . . . . . . . . . . . . . . . . . . . . . . 577.2 Work Breakdown Structure . . . . . . . . . . . . . . . . . . . . . . . . . . . . . . . . . . . . . . . . . . . . 577.3 Work Plan . . . . . . . . . . . . . . . . . . . . . . . . . . . . . . . . . . . . . . . . . . . . . . . . . . . . . . 587.4 Cost Plan . . . . . . . . . . . . . . . . . . . . . . . . . . . . . . . . . . . . . . . . . . . . . . . . . . . . . . . 607.5 Test Plan . . . . . . . . . . . . . . . . . . . . . . . . . . . . . . . . . . . . . . . . . . . . . . . . . . . . . . . 61
8 Lessons Learned 62
9 Individual Report Contributions 64
05/04/20 3 of 124
University of Colorado Boulder
FFR

Aerospace Senior Projects ASEN 4028
List of Figures
1 Concept of Operations for BUBO BUBO. . . . . . . . . . . . . . . . . . . . . . . . . . . . . . . . . . . . . 162 Functional block diagram of BUBO BUBO with integration status at cutoff . . . . . . . . . . . . . . . . 173 Overall Electronics Circuit Diagram . . . . . . . . . . . . . . . . . . . . . . . . . . . . . . . . . . . . . . . 254 FADS Bay Circuit Diagram . . . . . . . . . . . . . . . . . . . . . . . . . . . . . . . . . . . . . . . . . . . . . 265 Mechanical Manufacturing Component List . . . . . . . . . . . . . . . . . . . . . . . . . . . . . . . . . . 276 Manufactured and Off the Shelf Components . . . . . . . . . . . . . . . . . . . . . . . . . . . . . . . . . 287 Aircraft Circuit Integration Layout . . . . . . . . . . . . . . . . . . . . . . . . . . . . . . . . . . . . . . . . 298 Intermediate Mechanical Manufacturing Step . . . . . . . . . . . . . . . . . . . . . . . . . . . . . . . . . 309 Wing sections showing bays used for airframe integration of various subsystem components as well
as integrated elevons . . . . . . . . . . . . . . . . . . . . . . . . . . . . . . . . . . . . . . . . . . . . . . . . 3210 Launch Hook and Pogo Integration . . . . . . . . . . . . . . . . . . . . . . . . . . . . . . . . . . . . . . . 3311 Power and Electronics Integration . . . . . . . . . . . . . . . . . . . . . . . . . . . . . . . . . . . . . . . . 3412 Controls Integration . . . . . . . . . . . . . . . . . . . . . . . . . . . . . . . . . . . . . . . . . . . . . . . . 3513 Propulsion Integration . . . . . . . . . . . . . . . . . . . . . . . . . . . . . . . . . . . . . . . . . . . . . . . 3514 FEA Deflection . . . . . . . . . . . . . . . . . . . . . . . . . . . . . . . . . . . . . . . . . . . . . . . . . . . 3615 FEA Stress . . . . . . . . . . . . . . . . . . . . . . . . . . . . . . . . . . . . . . . . . . . . . . . . . . . . . . 3616 Whiffletree Setup . . . . . . . . . . . . . . . . . . . . . . . . . . . . . . . . . . . . . . . . . . . . . . . . . . 3717 Whiffletree result - top wing . . . . . . . . . . . . . . . . . . . . . . . . . . . . . . . . . . . . . . . . . . . . 3818 Whiffletree results - bottom wing . . . . . . . . . . . . . . . . . . . . . . . . . . . . . . . . . . . . . . . . . 3819 Example of Predicted Thrust and Efficiency . . . . . . . . . . . . . . . . . . . . . . . . . . . . . . . . . . 4020 Example of Predicted Power Draw . . . . . . . . . . . . . . . . . . . . . . . . . . . . . . . . . . . . . . . . 4021 Thrust test setup . . . . . . . . . . . . . . . . . . . . . . . . . . . . . . . . . . . . . . . . . . . . . . . . . . 4122 Thrust Profile Comparisons . . . . . . . . . . . . . . . . . . . . . . . . . . . . . . . . . . . . . . . . . . . . 4223 RPM Comparisons . . . . . . . . . . . . . . . . . . . . . . . . . . . . . . . . . . . . . . . . . . . . . . . . . 4224 Power Draw Comparisons . . . . . . . . . . . . . . . . . . . . . . . . . . . . . . . . . . . . . . . . . . . . . 4325 Voltage and Current Profiles . . . . . . . . . . . . . . . . . . . . . . . . . . . . . . . . . . . . . . . . . . . . 4426 Preliminary FADS circuit . . . . . . . . . . . . . . . . . . . . . . . . . . . . . . . . . . . . . . . . . . . . . . 4527 FADS Pressure Readings . . . . . . . . . . . . . . . . . . . . . . . . . . . . . . . . . . . . . . . . . . . . . . 4528 FADS Humidity Readings . . . . . . . . . . . . . . . . . . . . . . . . . . . . . . . . . . . . . . . . . . . . . 4529 FADS Temperature Readings . . . . . . . . . . . . . . . . . . . . . . . . . . . . . . . . . . . . . . . . . . . 4630 Eigenmodes of Longitudinal Dynamics . . . . . . . . . . . . . . . . . . . . . . . . . . . . . . . . . . . . . 4731 Eigenmodes of Lateral Dynamics . . . . . . . . . . . . . . . . . . . . . . . . . . . . . . . . . . . . . . . . . 4732 AVL Calculated Drag Polar . . . . . . . . . . . . . . . . . . . . . . . . . . . . . . . . . . . . . . . . . . . . . 4833 Glide test setup . . . . . . . . . . . . . . . . . . . . . . . . . . . . . . . . . . . . . . . . . . . . . . . . . . . 5134 BUBO in-flight . . . . . . . . . . . . . . . . . . . . . . . . . . . . . . . . . . . . . . . . . . . . . . . . . . . . 5235 BUBO post-flight . . . . . . . . . . . . . . . . . . . . . . . . . . . . . . . . . . . . . . . . . . . . . . . . . . 5336 Cooper-Harper ratings for all maneuvers tested in first flight test . . . . . . . . . . . . . . . . . . . . . . 5337 Change in risk after mitigation . . . . . . . . . . . . . . . . . . . . . . . . . . . . . . . . . . . . . . . . . . 5438 Change in risk after mitigation . . . . . . . . . . . . . . . . . . . . . . . . . . . . . . . . . . . . . . . . . . 5539 Change in risk after mitigation . . . . . . . . . . . . . . . . . . . . . . . . . . . . . . . . . . . . . . . . . . 5640 BUBO BUBO Team Organization Chart . . . . . . . . . . . . . . . . . . . . . . . . . . . . . . . . . . . . . 5741 Work Breakdown Structure for BUBO BUBO . . . . . . . . . . . . . . . . . . . . . . . . . . . . . . . . . . 5842 BUBO BUBO work plan. Critical path is shown in green. . . . . . . . . . . . . . . . . . . . . . . . . . . . 5943 Final Budget Breakdown . . . . . . . . . . . . . . . . . . . . . . . . . . . . . . . . . . . . . . . . . . . . . . 6044 Expected Budget . . . . . . . . . . . . . . . . . . . . . . . . . . . . . . . . . . . . . . . . . . . . . . . . . . 6045 Actual Budget . . . . . . . . . . . . . . . . . . . . . . . . . . . . . . . . . . . . . . . . . . . . . . . . . . . . 6046 Total Budget Evolution . . . . . . . . . . . . . . . . . . . . . . . . . . . . . . . . . . . . . . . . . . . . . . . 6147 BUBO BUBO test plan. Critical path is shown in red. . . . . . . . . . . . . . . . . . . . . . . . . . . . . . 6148 Sample Delta Wing Design . . . . . . . . . . . . . . . . . . . . . . . . . . . . . . . . . . . . . . . . . . . . 6749 Sample Reflected Sweep Design . . . . . . . . . . . . . . . . . . . . . . . . . . . . . . . . . . . . . . . . . 6850 Sample Straight Wing Design . . . . . . . . . . . . . . . . . . . . . . . . . . . . . . . . . . . . . . . . . . . 6851 Sample Single Sweep Design . . . . . . . . . . . . . . . . . . . . . . . . . . . . . . . . . . . . . . . . . . . 6952 Sample Symmetric Sweep Design . . . . . . . . . . . . . . . . . . . . . . . . . . . . . . . . . . . . . . . . 6953 Single Centered Boom Design Concept . . . . . . . . . . . . . . . . . . . . . . . . . . . . . . . . . . . . . 7354 Double Boom Design Concept . . . . . . . . . . . . . . . . . . . . . . . . . . . . . . . . . . . . . . . . . . 74
05/04/20 4 of 124
University of Colorado Boulder
FFR

Aerospace Senior Projects ASEN 4028
55 ArduPilot Mega . . . . . . . . . . . . . . . . . . . . . . . . . . . . . . . . . . . . . . . . . . . . . . . . . . . 7656 BetaFlight F4 . . . . . . . . . . . . . . . . . . . . . . . . . . . . . . . . . . . . . . . . . . . . . . . . . . . . . 7757 iNAV Matek F405 . . . . . . . . . . . . . . . . . . . . . . . . . . . . . . . . . . . . . . . . . . . . . . . . . . 7858 PixHawk 2 . . . . . . . . . . . . . . . . . . . . . . . . . . . . . . . . . . . . . . . . . . . . . . . . . . . . . . 7859 PixHawk 4 . . . . . . . . . . . . . . . . . . . . . . . . . . . . . . . . . . . . . . . . . . . . . . . . . . . . . . 7960 Power Configuration Diagram . . . . . . . . . . . . . . . . . . . . . . . . . . . . . . . . . . . . . . . . . . 9461 Power Configuration Diagram . . . . . . . . . . . . . . . . . . . . . . . . . . . . . . . . . . . . . . . . . . 9562 Power Configuration Diagram . . . . . . . . . . . . . . . . . . . . . . . . . . . . . . . . . . . . . . . . . . 9663 Power Configuration Diagram . . . . . . . . . . . . . . . . . . . . . . . . . . . . . . . . . . . . . . . . . . 9764 Double Pusher with Reflexed Wing, Side View . . . . . . . . . . . . . . . . . . . . . . . . . . . . . . . . . 10165 Puller Configuration, Side View . . . . . . . . . . . . . . . . . . . . . . . . . . . . . . . . . . . . . . . . . . 10266 Single Motor Pusher, Top View . . . . . . . . . . . . . . . . . . . . . . . . . . . . . . . . . . . . . . . . . . 10367 Centered Double Pusher, Front View . . . . . . . . . . . . . . . . . . . . . . . . . . . . . . . . . . . . . . 10368 Multi-Engine Configuration, Top View . . . . . . . . . . . . . . . . . . . . . . . . . . . . . . . . . . . . . . 10469 IRISS Table-Bungee Diagram . . . . . . . . . . . . . . . . . . . . . . . . . . . . . . . . . . . . . . . . . . . 11670 IRISS Hand-Bungee Diagram . . . . . . . . . . . . . . . . . . . . . . . . . . . . . . . . . . . . . . . . . . . 11671 RECUV Rail-Bungee Diagram . . . . . . . . . . . . . . . . . . . . . . . . . . . . . . . . . . . . . . . . . . . 11772 Pneumatic System Diagram . . . . . . . . . . . . . . . . . . . . . . . . . . . . . . . . . . . . . . . . . . . . 11873 Car Roof System Diagram . . . . . . . . . . . . . . . . . . . . . . . . . . . . . . . . . . . . . . . . . . . . . 11874 Risk Matrix . . . . . . . . . . . . . . . . . . . . . . . . . . . . . . . . . . . . . . . . . . . . . . . . . . . . . . 12375 Risk Matrix continued . . . . . . . . . . . . . . . . . . . . . . . . . . . . . . . . . . . . . . . . . . . . . . . 12376 Risk Matrix continued . . . . . . . . . . . . . . . . . . . . . . . . . . . . . . . . . . . . . . . . . . . . . . . 124
05/04/20 5 of 124
University of Colorado Boulder
FFR

Aerospace Senior Projects ASEN 4028
List of Tables
1 Success levels for BUBO BUBO mission objectives. . . . . . . . . . . . . . . . . . . . . . . . . . . . . . . 152 Delta Wing Pros and Cons . . . . . . . . . . . . . . . . . . . . . . . . . . . . . . . . . . . . . . . . . . . . . 673 Reflected Sweep Pros and Cons . . . . . . . . . . . . . . . . . . . . . . . . . . . . . . . . . . . . . . . . . . 684 Straight Wings Pros and Cons . . . . . . . . . . . . . . . . . . . . . . . . . . . . . . . . . . . . . . . . . . . 685 Single Sweep Pros and Cons . . . . . . . . . . . . . . . . . . . . . . . . . . . . . . . . . . . . . . . . . . . . 696 Symmetric Sweep Pros and Cons . . . . . . . . . . . . . . . . . . . . . . . . . . . . . . . . . . . . . . . . . 707 Weighting of Trade Criteria . . . . . . . . . . . . . . . . . . . . . . . . . . . . . . . . . . . . . . . . . . . . 708 Flight Performance Scoring Definition . . . . . . . . . . . . . . . . . . . . . . . . . . . . . . . . . . . . . . 709 Manufacturability Scoring Definition . . . . . . . . . . . . . . . . . . . . . . . . . . . . . . . . . . . . . . 7010 Structural Integrity Scoring Definition . . . . . . . . . . . . . . . . . . . . . . . . . . . . . . . . . . . . . . 7111 System Integration Scoring Definition . . . . . . . . . . . . . . . . . . . . . . . . . . . . . . . . . . . . . . 7112 Wing Configuration Trade Study Matrix . . . . . . . . . . . . . . . . . . . . . . . . . . . . . . . . . . . . . 7313 Single Boom Pros and Cons . . . . . . . . . . . . . . . . . . . . . . . . . . . . . . . . . . . . . . . . . . . . 7314 Two Booms Pros and Cons . . . . . . . . . . . . . . . . . . . . . . . . . . . . . . . . . . . . . . . . . . . . . 7415 Weighting of Trade Criteria . . . . . . . . . . . . . . . . . . . . . . . . . . . . . . . . . . . . . . . . . . . . 7416 Structural Integrity Scoring Definition . . . . . . . . . . . . . . . . . . . . . . . . . . . . . . . . . . . . . . 7417 Total Added Mass Scoring Definition . . . . . . . . . . . . . . . . . . . . . . . . . . . . . . . . . . . . . . . 7518 Data Interference Scoring Definition . . . . . . . . . . . . . . . . . . . . . . . . . . . . . . . . . . . . . . . 7519 Potential Vibration Scoring Definition . . . . . . . . . . . . . . . . . . . . . . . . . . . . . . . . . . . . . . 7520 Boom Configuration Trade Study Matrix . . . . . . . . . . . . . . . . . . . . . . . . . . . . . . . . . . . . . 7621 ArduPilot Pros and Cons . . . . . . . . . . . . . . . . . . . . . . . . . . . . . . . . . . . . . . . . . . . . . . 7722 BetaFlight Pros and Cons . . . . . . . . . . . . . . . . . . . . . . . . . . . . . . . . . . . . . . . . . . . . . 7723 iNAV Pros and Cons . . . . . . . . . . . . . . . . . . . . . . . . . . . . . . . . . . . . . . . . . . . . . . . . . 7824 PixHawk 2 Pros and Cons . . . . . . . . . . . . . . . . . . . . . . . . . . . . . . . . . . . . . . . . . . . . . 7925 PixHawk 4 Pros and Cons . . . . . . . . . . . . . . . . . . . . . . . . . . . . . . . . . . . . . . . . . . . . . 7926 Weighting of Autopilot Trade Criteria . . . . . . . . . . . . . . . . . . . . . . . . . . . . . . . . . . . . . . 8027 Optimization Scoring Definition . . . . . . . . . . . . . . . . . . . . . . . . . . . . . . . . . . . . . . . . . 8028 Available Support Scoring Definition . . . . . . . . . . . . . . . . . . . . . . . . . . . . . . . . . . . . . . 8029 Complexity of Setup Scoring Definition . . . . . . . . . . . . . . . . . . . . . . . . . . . . . . . . . . . . . 8030 Control Response & Accuracy Scoring Definition . . . . . . . . . . . . . . . . . . . . . . . . . . . . . . . . 8131 Weight Scoring Definition . . . . . . . . . . . . . . . . . . . . . . . . . . . . . . . . . . . . . . . . . . . . . 8132 Price Scoring Definition . . . . . . . . . . . . . . . . . . . . . . . . . . . . . . . . . . . . . . . . . . . . . . 8133 Autopilot Trade Study Matrix . . . . . . . . . . . . . . . . . . . . . . . . . . . . . . . . . . . . . . . . . . . 8234 Traditional FADS Pros and Cons . . . . . . . . . . . . . . . . . . . . . . . . . . . . . . . . . . . . . . . . . 8335 Simplified FADS Pros and Cons . . . . . . . . . . . . . . . . . . . . . . . . . . . . . . . . . . . . . . . . . . 8336 Weighting of Trade Criteria . . . . . . . . . . . . . . . . . . . . . . . . . . . . . . . . . . . . . . . . . . . . 8437 Implementation Scoring Definition . . . . . . . . . . . . . . . . . . . . . . . . . . . . . . . . . . . . . . . 8438 Manufacturing Scoring Definition . . . . . . . . . . . . . . . . . . . . . . . . . . . . . . . . . . . . . . . . 8439 Weight Scoring Definition . . . . . . . . . . . . . . . . . . . . . . . . . . . . . . . . . . . . . . . . . . . . . 8440 Vulnerability and Repair Scoring Definition . . . . . . . . . . . . . . . . . . . . . . . . . . . . . . . . . . 8441 FADS Configuration Trade Study Matrix . . . . . . . . . . . . . . . . . . . . . . . . . . . . . . . . . . . . . 8542 LiPo Pros and Cons . . . . . . . . . . . . . . . . . . . . . . . . . . . . . . . . . . . . . . . . . . . . . . . . . 8543 Li-Ion Pros and Cons . . . . . . . . . . . . . . . . . . . . . . . . . . . . . . . . . . . . . . . . . . . . . . . . 8644 NiCd Pros and Cons . . . . . . . . . . . . . . . . . . . . . . . . . . . . . . . . . . . . . . . . . . . . . . . . 8645 NiMH Pros and Cons . . . . . . . . . . . . . . . . . . . . . . . . . . . . . . . . . . . . . . . . . . . . . . . . 8646 SLA Pros and Cons . . . . . . . . . . . . . . . . . . . . . . . . . . . . . . . . . . . . . . . . . . . . . . . . . 8747 Weighting of Trade Criteria . . . . . . . . . . . . . . . . . . . . . . . . . . . . . . . . . . . . . . . . . . . . 8748 Energy Density Scoring Definition . . . . . . . . . . . . . . . . . . . . . . . . . . . . . . . . . . . . . . . . 8749 Voltage Output Scoring Definition . . . . . . . . . . . . . . . . . . . . . . . . . . . . . . . . . . . . . . . . 8750 Current Output Scoring Definition . . . . . . . . . . . . . . . . . . . . . . . . . . . . . . . . . . . . . . . . 8851 Risk Scoring Definition . . . . . . . . . . . . . . . . . . . . . . . . . . . . . . . . . . . . . . . . . . . . . . . 8852 Self Discharge Scoring Definition . . . . . . . . . . . . . . . . . . . . . . . . . . . . . . . . . . . . . . . . . 8853 Maintenance Scoring Definition . . . . . . . . . . . . . . . . . . . . . . . . . . . . . . . . . . . . . . . . . 8854 Battery Type Trade Study Matrix . . . . . . . . . . . . . . . . . . . . . . . . . . . . . . . . . . . . . . . . . 8955 Arduino Pros and Cons . . . . . . . . . . . . . . . . . . . . . . . . . . . . . . . . . . . . . . . . . . . . . . . 90
05/04/20 6 of 124
University of Colorado Boulder
FFR

Aerospace Senior Projects ASEN 4028
56 FPGA Pros and Cons . . . . . . . . . . . . . . . . . . . . . . . . . . . . . . . . . . . . . . . . . . . . . . . . 9057 Raspberry Pi Pros and Cons . . . . . . . . . . . . . . . . . . . . . . . . . . . . . . . . . . . . . . . . . . . . 9058 Weighting of Trade Criteria . . . . . . . . . . . . . . . . . . . . . . . . . . . . . . . . . . . . . . . . . . . . 9159 Ease of Use Scoring Definition . . . . . . . . . . . . . . . . . . . . . . . . . . . . . . . . . . . . . . . . . . . 9160 Modularity Scoring Definition . . . . . . . . . . . . . . . . . . . . . . . . . . . . . . . . . . . . . . . . . . 9161 Team Experience Scoring Definition . . . . . . . . . . . . . . . . . . . . . . . . . . . . . . . . . . . . . . . 9162 Sampling Rate Scoring Definition . . . . . . . . . . . . . . . . . . . . . . . . . . . . . . . . . . . . . . . . 9263 Availability Scoring Definition . . . . . . . . . . . . . . . . . . . . . . . . . . . . . . . . . . . . . . . . . . 9264 Microcontroller Architecture Trade Study Matrix . . . . . . . . . . . . . . . . . . . . . . . . . . . . . . . . 9365 One Circuit / One Battery Pros and Cons . . . . . . . . . . . . . . . . . . . . . . . . . . . . . . . . . . . . 9466 One Circuit / Parallel Batteries Pros and Cons . . . . . . . . . . . . . . . . . . . . . . . . . . . . . . . . . 9567 Two Circuits Pros and Cons . . . . . . . . . . . . . . . . . . . . . . . . . . . . . . . . . . . . . . . . . . . . 9668 Three Circuits Pros and Cons . . . . . . . . . . . . . . . . . . . . . . . . . . . . . . . . . . . . . . . . . . . 9769 Weighting of Trade Criteria . . . . . . . . . . . . . . . . . . . . . . . . . . . . . . . . . . . . . . . . . . . . 9870 Weight Scoring Definition . . . . . . . . . . . . . . . . . . . . . . . . . . . . . . . . . . . . . . . . . . . . . 9871 Design Requirement Scoring Definition . . . . . . . . . . . . . . . . . . . . . . . . . . . . . . . . . . . . . 9872 Volume Scoring Definition . . . . . . . . . . . . . . . . . . . . . . . . . . . . . . . . . . . . . . . . . . . . . 9873 Risk Scoring Definition . . . . . . . . . . . . . . . . . . . . . . . . . . . . . . . . . . . . . . . . . . . . . . . 9874 Relative Cost Scoring Definition . . . . . . . . . . . . . . . . . . . . . . . . . . . . . . . . . . . . . . . . . 9875 Power Configuration Trade Study Matrix . . . . . . . . . . . . . . . . . . . . . . . . . . . . . . . . . . . . 10076 Double Pusher / Reflexed Pros and Cons . . . . . . . . . . . . . . . . . . . . . . . . . . . . . . . . . . . . 10177 Puller Configuration Pros and Cons . . . . . . . . . . . . . . . . . . . . . . . . . . . . . . . . . . . . . . . 10278 Single Pusher/ Centered Pros and Cons . . . . . . . . . . . . . . . . . . . . . . . . . . . . . . . . . . . . . 10379 Double Pusher / Centered Pros and Cons . . . . . . . . . . . . . . . . . . . . . . . . . . . . . . . . . . . . 10480 Multiple Engine Pros and Cons . . . . . . . . . . . . . . . . . . . . . . . . . . . . . . . . . . . . . . . . . . 10481 Weighting of Propulsion Trade Criteria . . . . . . . . . . . . . . . . . . . . . . . . . . . . . . . . . . . . . 10582 Survivability Scoring Definition . . . . . . . . . . . . . . . . . . . . . . . . . . . . . . . . . . . . . . . . . 10583 Implementation Scoring Definition . . . . . . . . . . . . . . . . . . . . . . . . . . . . . . . . . . . . . . . 10584 Weight Scoring Definition . . . . . . . . . . . . . . . . . . . . . . . . . . . . . . . . . . . . . . . . . . . . . 10585 Manufacturing Scoring Definition . . . . . . . . . . . . . . . . . . . . . . . . . . . . . . . . . . . . . . . . 10686 Price Scoring Definition . . . . . . . . . . . . . . . . . . . . . . . . . . . . . . . . . . . . . . . . . . . . . . 10687 Propulsion Configuration Trade Study Matrix . . . . . . . . . . . . . . . . . . . . . . . . . . . . . . . . . 10788 One meter wingspan Pros and Cons . . . . . . . . . . . . . . . . . . . . . . . . . . . . . . . . . . . . . . . 10789 Two meter wingspan Pros and Cons . . . . . . . . . . . . . . . . . . . . . . . . . . . . . . . . . . . . . . . 10890 Weighting of Trade Criteria . . . . . . . . . . . . . . . . . . . . . . . . . . . . . . . . . . . . . . . . . . . . 10891 Launch Systems Scoring Definition . . . . . . . . . . . . . . . . . . . . . . . . . . . . . . . . . . . . . . . . 10892 Survivability Scoring Definition . . . . . . . . . . . . . . . . . . . . . . . . . . . . . . . . . . . . . . . . . 10993 System Integration Scoring Definition . . . . . . . . . . . . . . . . . . . . . . . . . . . . . . . . . . . . . . 10994 Manufacturability Scoring Definition . . . . . . . . . . . . . . . . . . . . . . . . . . . . . . . . . . . . . . 10995 Mass Scoring Definition . . . . . . . . . . . . . . . . . . . . . . . . . . . . . . . . . . . . . . . . . . . . . . 10996 Sensor Integration Scoring Definition . . . . . . . . . . . . . . . . . . . . . . . . . . . . . . . . . . . . . . 11097 Wing Size Trade Study Matrix . . . . . . . . . . . . . . . . . . . . . . . . . . . . . . . . . . . . . . . . . . . 11198 Skid Landing Pros and Cons . . . . . . . . . . . . . . . . . . . . . . . . . . . . . . . . . . . . . . . . . . . . 11199 Landing Gear Pros and Cons . . . . . . . . . . . . . . . . . . . . . . . . . . . . . . . . . . . . . . . . . . . 112100 Net Landing Pros and Cons . . . . . . . . . . . . . . . . . . . . . . . . . . . . . . . . . . . . . . . . . . . . 112101 "Catch"/Moving Landing Pros and Cons . . . . . . . . . . . . . . . . . . . . . . . . . . . . . . . . . . . . 112102 Parachute Landing Pros and Cons . . . . . . . . . . . . . . . . . . . . . . . . . . . . . . . . . . . . . . . . 113103 Weighting of Landing Method Trade Criteria . . . . . . . . . . . . . . . . . . . . . . . . . . . . . . . . . . 113104 Complexity Scoring Definition . . . . . . . . . . . . . . . . . . . . . . . . . . . . . . . . . . . . . . . . . . 113105 Risk to Aircraft Scoring Definition . . . . . . . . . . . . . . . . . . . . . . . . . . . . . . . . . . . . . . . . 113106 Safety Scoring Definition . . . . . . . . . . . . . . . . . . . . . . . . . . . . . . . . . . . . . . . . . . . . . 113107 Burden to Aircraft Scoring Definition . . . . . . . . . . . . . . . . . . . . . . . . . . . . . . . . . . . . . . 114108 Reliability Scoring Definition . . . . . . . . . . . . . . . . . . . . . . . . . . . . . . . . . . . . . . . . . . . 114109 Landing Method Trade Study Matrix . . . . . . . . . . . . . . . . . . . . . . . . . . . . . . . . . . . . . . . 115110 IRISS Table-Bungee Pros and Cons . . . . . . . . . . . . . . . . . . . . . . . . . . . . . . . . . . . . . . . . 116111 IRISS Hand-Bungee Pros and Cons . . . . . . . . . . . . . . . . . . . . . . . . . . . . . . . . . . . . . . . . 117
05/04/20 7 of 124
University of Colorado Boulder
FFR

Aerospace Senior Projects ASEN 4028
112 RECUV Rail-Bungee Pros and Cons . . . . . . . . . . . . . . . . . . . . . . . . . . . . . . . . . . . . . . . 117113 Pneumatic System Pros and Cons . . . . . . . . . . . . . . . . . . . . . . . . . . . . . . . . . . . . . . . . 118114 Car Roof System Pros and Cons . . . . . . . . . . . . . . . . . . . . . . . . . . . . . . . . . . . . . . . . . . 119115 Launch Method Criteria Weighting . . . . . . . . . . . . . . . . . . . . . . . . . . . . . . . . . . . . . . . . 119116 Launch Speed Reliability Scoring Definition . . . . . . . . . . . . . . . . . . . . . . . . . . . . . . . . . . 119117 Force Range Scoring Definition . . . . . . . . . . . . . . . . . . . . . . . . . . . . . . . . . . . . . . . . . . 119118 System Interference Scoring Definition . . . . . . . . . . . . . . . . . . . . . . . . . . . . . . . . . . . . . . 119119 Stress on Airframe Scoring Definition . . . . . . . . . . . . . . . . . . . . . . . . . . . . . . . . . . . . . . 120120 Mechanical Complexity Scoring Definition . . . . . . . . . . . . . . . . . . . . . . . . . . . . . . . . . . . 120121 Cost of Replacement Scoring Definition . . . . . . . . . . . . . . . . . . . . . . . . . . . . . . . . . . . . . 120122 Team Safety Scoring Definition . . . . . . . . . . . . . . . . . . . . . . . . . . . . . . . . . . . . . . . . . . 120123 Launching Method Trade Study Matrix . . . . . . . . . . . . . . . . . . . . . . . . . . . . . . . . . . . . . 122
05/04/20 8 of 124
University of Colorado Boulder
FFR

Aerospace Senior Projects ASEN 4028
Acronyms
APM ArduPilot MEGA
AR Aspect Ratio
AVL Athena Vortex Lattice
BAS Boulder Aeromodeling Society
BEC Battery Eliminator Circuit
BUBO BUBO Big Unmanned Boxwing Operation & Bigger Unmanned Boxwing Operation
CAD Computer Aided Design
CDD Conceptual Design Document
CDR Critical Design Review
CFD Computational Fluid Dynamics
CG Center of Gravity
ConOps Concept of Operations
COTS Commercial Off-the-Shelf
CPE Critical Project Element
DR Design Requirement
DBF Design Build Fly
EPP Expanded PolyPropylene
ESC Electronic Speed Controller
FAA Federal Aviation Administration
FADS Flush Air Data Sensing
FBD Functional Block Diagram
Free Body Diagram
FEM Finite Element Method
FFR Fall Final Review
FMU Flight Management Unit
FOS Factor of Safety
FR Functional Requirement
GPS Global Positioning System
IMU Inertial Measurement Unit
IRISS Integrated Remote and In-Situ Sensing
LiPo Lithium Polymer
LVC Low Voltage Cutoff
MHP Multi-Hole Probe
MSR Manufacturing Status Review
NiCad Nickel Cadmium
NiMH Nickel-Metal Hydride
PAAS Pressure - Angle of Attack - Sideslip
PAB Project Advisory Board
PCB Printed Circuit Board
PD Proportional Derivative
PDD Preliminary Design Document
PDR Preliminary Design Review
PFR Project Final Report
PID Proportional Integral Derivative
PMB Power Management Board
PVC PolyVinyl Chloride
PWM Pulse Width Modulation
PX2 Pixhawk 2
05/04/20 9 of 124
University of Colorado Boulder
FFR

Aerospace Senior Projects ASEN 4028
RC Radio Control
RECUV Research and Engineering Center for Unmanned Vehicles
RPM Revolutions Per Minute
RTSB Rectangular Top Swept Bottom
SCL Serial Clock
SDA Serial Data
SFR Spring Final Review
SLF Steady Level Flight
TBD To Be Determined
TRR Test Readiness Review
UAS Unmanned Aircraft System
V&V Verification and Validation
WBS Work Breakdown Structure
05/04/20 10 of 124
University of Colorado Boulder
FFR

Aerospace Senior Projects ASEN 4028
Nomenclature
h Rate of Climbm Mass Flow Rateν Poisson’s Ratioφ,θ,ψ State Variables Describing Aircraft‘s Attitude~u Control Surface Deflection Vector~x State VectorA Aerodynamic Stability Matrix
Cross Sectional Areaa Acceleration
Airfoil Lift SlopeAR Aspect RatioB Control Derivative Matrixb SpanCD Coefficient of DragCL Coefficient of LiftCD,0 Coefficient of Skin Friction DragCD,i Coefficient of Induced DragD Dragd Propeller Diameter
Gap (Vertical Distance Between Wings)E Modulus of ElasticityF Forcef Force of Frictiong Acceleration Due to GravityK Control Gains Matrixk Spring Constant of BungeesL LiftL/D Lift-to-Drag RatioM Momentm Mass of AircraftN Normal Forcen Load FactorP Power
Pressurep, q,r State Variables Describing Aircraft‘s Angular Velocityq Dynamic PressureR Turn Radius
Specific Gas ConstantS Planform Areas Stagger (Horizontal Distance Between Wings)T Thrust
TemperatureTension on Bungees
t Time (s)u, v, w State Variables Describing Aircraft‘s VelocityV Velocity
VoltageW Weightx, y, z State Variables Describing Aircraft‘s Positionα Angle of Attackβ Sideslip Angle∆ Prefix Indicating Changeδ Control Surface Deflection Angleε,e Span Efficiency Factor
05/04/20 11 of 124
University of Colorado Boulder
FFR

Aerospace Senior Projects ASEN 4028
γ Glide AngleMaximum Climb Angle
∞ Subscript Indicating Free Streamλ Eigenvalueµ Dynamic Coefficient of Frictionω Imaginary Eigenvalue Component
Angular Rateρ Densityσ Real Eigenvalue Componentτ Shear Stress
Torque
05/04/20 12 of 124
University of Colorado Boulder
FFR

Aerospace Senior Projects ASEN 4028
1. Project Purpose
Author: Kaitlyn Olson
1.1. Mission Statement
The goal of BUBO BUBO is to design, build, and test an unmanned, radio-controlled (RC), box-wing aircraft. Theaircraft will be a scalable data collection platform for a Flush Air Data Sensing (FADS) system, which will collectpressure data to aid in the study of turbulence by Dr. Brian Argrow of the University of Colorado Boulder.
1.2. Description
Unmanned Aircraft Systems (UAS) are becoming increasingly popular in research due to their low cost, relativeease of use, and ability to reach and survive harsh environments that are inaccessible and even hazardous forhumans. While UAS have the potential to expand research, aid efforts, and contribute to countless other pursuits,their use is currently limited by the understanding of how these small aircraft fly and interact with the surroundingatmosphere. The current wind models available are great for large aircraft at high altitudes and Reynolds numbers,however they do not model small aircraft at low Reynolds numbers and altitudes as well. This shortcoming mustbe overcome to enable the safe operation and optimized design of small UAS as their potential continues to berealized and expanded. The development of these models requires extensive research of airflow and turbulenceexperienced by UAS. While seemingly counter-intuitive, one of the best ways to conduct this needed research iswith UAS themselves. One way UAS enable this research is to directly measure turbulence. To collect this noveldata, one could take the same aircraft, scale it by wingspan, and collect relative wind velocity and other air datawith each size. While this can be done in various ways, BUBO BUBO will implement a flush air data sensing (FADS)system into a balsa-monokote airframe that can be easily scaled both up and down in size. The BUBO BUBO teamcould find no evidence to suggest a scalability effort such as the one being undertaken has previously occurred tostudy turbulence, nor evidence to suggest a FADS system has previously been integrated into a balsa-monokoteconstruction.
The FADS system was selected due to the fact that it is one of the most cost-efficient and aerodynamically ben-eficial ways to collect the relevant data needed, the relative wind vector. FADS systems have the massive benefitof requiring no externally mounted hardware. Unlike more conventional sensor configurations such as air databooms and multi-hole probe solutions, this protects expensive sensors and instrumentation from damage. 2 Thissetup saves time and money by preventing the need to replace such instrumentation. Additionally, the flush na-ture of a FADS system can significantly reduce the drag the aircraft experiences. 4 This advantage can dramaticallyimprove the aerodynamic performance of small, lightweight aircraft. 3
The purpose of this project is to design, assemble, and test an unmanned, radio-controlled (RC), box-wingaircraft with an integrated FADS system. The unique box-wing configuration reduces the disturbance of the airflowthrough the two wings and allows for optimal sensor configuration according to the research of Dr. Roger Laurence.The FADS system will collect pressure data to be used to calculate the aircraft’s relative wind vector. The aircraftwill have an endurance of one hour and an integrated autopilot to be used during the data collection phase of theflight profile. The aircraft will also be reusable, being capable of completing at least ten takeoff and landing cycleswithout undergoing any major repairs. The direct scalability of the aircraft by wingspan will also be investigatedthrough a feasibility analysis of the design. This feasibility study will focus on how the performance of the aircraftwill change as the wingspan is altered, with the hope that the customer can apply the team’s design to differentsized airframes in the future. A fleet of various box-wing aircraft would be able to collect data at various altitudesin varied conditions.
05/04/20 13 of 124
University of Colorado Boulder
FFR
Aerospace Senior Projects ASEN 4028
2. Project Objectives and Functional Requirements
Author: Andrew Fendel, Kaitlyn Olson
2.1. Objectives
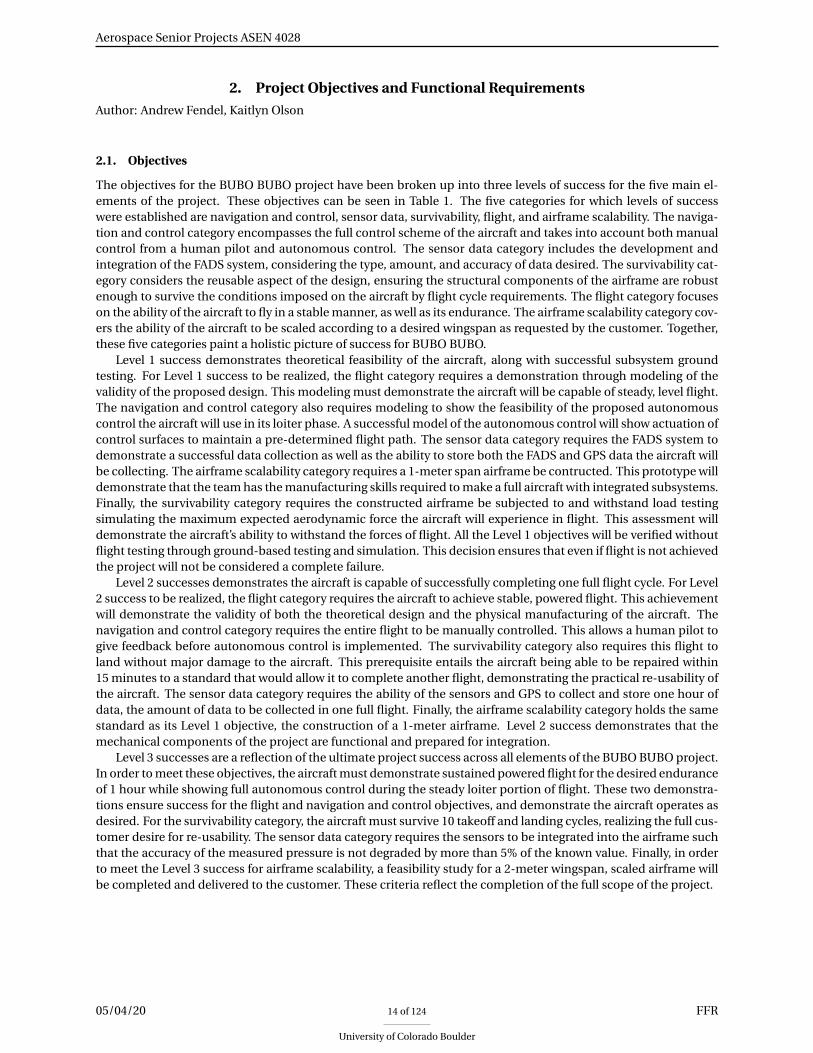
The objectives for the BUBO BUBO project have been broken up into three levels of success for the five main el-ements of the project. These objectives can be seen in Table 1. The five categories for which levels of successwere established are navigation and control, sensor data, survivability, flight, and airframe scalability. The naviga-tion and control category encompasses the full control scheme of the aircraft and takes into account both manualcontrol from a human pilot and autonomous control. The sensor data category includes the development andintegration of the FADS system, considering the type, amount, and accuracy of data desired. The survivability cat-egory considers the reusable aspect of the design, ensuring the structural components of the airframe are robustenough to survive the conditions imposed on the aircraft by flight cycle requirements. The flight category focuseson the ability of the aircraft to fly in a stable manner, as well as its endurance. The airframe scalability category cov-ers the ability of the aircraft to be scaled according to a desired wingspan as requested by the customer. Together,these five categories paint a holistic picture of success for BUBO BUBO.
Level 1 success demonstrates theoretical feasibility of the aircraft, along with successful subsystem groundtesting. For Level 1 success to be realized, the flight category requires a demonstration through modeling of thevalidity of the proposed design. This modeling must demonstrate the aircraft will be capable of steady, level flight.The navigation and control category also requires modeling to show the feasibility of the proposed autonomouscontrol the aircraft will use in its loiter phase. A successful model of the autonomous control will show actuation ofcontrol surfaces to maintain a pre-determined flight path. The sensor data category requires the FADS system todemonstrate a successful data collection as well as the ability to store both the FADS and GPS data the aircraft willbe collecting. The airframe scalability category requires a 1-meter span airframe be contructed. This prototype willdemonstrate that the team has the manufacturing skills required to make a full aircraft with integrated subsystems.Finally, the survivability category requires the constructed airframe be subjected to and withstand load testingsimulating the maximum expected aerodynamic force the aircraft will experience in flight. This assessment willdemonstrate the aircraft’s ability to withstand the forces of flight. All the Level 1 objectives will be verified withoutflight testing through ground-based testing and simulation. This decision ensures that even if flight is not achievedthe project will not be considered a complete failure.
Level 2 successes demonstrates the aircraft is capable of successfully completing one full flight cycle. For Level2 success to be realized, the flight category requires the aircraft to achieve stable, powered flight. This achievementwill demonstrate the validity of both the theoretical design and the physical manufacturing of the aircraft. Thenavigation and control category requires the entire flight to be manually controlled. This allows a human pilot togive feedback before autonomous control is implemented. The survivability category also requires this flight toland without major damage to the aircraft. This prerequisite entails the aircraft being able to be repaired within15 minutes to a standard that would allow it to complete another flight, demonstrating the practical re-usability ofthe aircraft. The sensor data category requires the ability of the sensors and GPS to collect and store one hour ofdata, the amount of data to be collected in one full flight. Finally, the airframe scalability category holds the samestandard as its Level 1 objective, the construction of a 1-meter airframe. Level 2 success demonstrates that themechanical components of the project are functional and prepared for integration.
Level 3 successes are a reflection of the ultimate project success across all elements of the BUBO BUBO project.In order to meet these objectives, the aircraft must demonstrate sustained powered flight for the desired enduranceof 1 hour while showing full autonomous control during the steady loiter portion of flight. These two demonstra-tions ensure success for the flight and navigation and control objectives, and demonstrate the aircraft operates asdesired. For the survivability category, the aircraft must survive 10 takeoff and landing cycles, realizing the full cus-tomer desire for re-usability. The sensor data category requires the sensors to be integrated into the airframe suchthat the accuracy of the measured pressure is not degraded by more than 5% of the known value. Finally, in orderto meet the Level 3 success for airframe scalability, a feasibility study for a 2-meter wingspan, scaled airframe willbe completed and delivered to the customer. These criteria reflect the completion of the full scope of the project.
05/04/20 14 of 124
University of Colorado Boulder
FFR

Aerospace Senior Projects ASEN 4028
Table 1. Success levels for BUBO BUBO mission objectives.
Navigation
and ControlSensor Data Survivability Flight
Airframe
Scalability
Level 1
Simulated
autonomous
control of
pre-made
flight path
Able to collect
and store FADS
pressure data
and GPS data
Airframe withstands
maximum expected
aerodynamic forces
during structural
testing
Models demonstrate
aircraft achieves
steady level flight
Build 1 meter
span box-wing
airframe
Level 2
Flight with
manual
control
Able to collect
and store data
for one full
flight
Lands with minimal
field repairs (max.
15 minutes with
field materials)
Aircraft achieves
stable powered
flight
Same as Level 1
Level 3
Autonomous
control during
loiter in-flight
Integration of
sensors does not
degrade accuracy
by more than
5%
Survives 10 takeoff
and landing cycles
Aircraft can sustain
flight for a
minimum of 1 hour
Feasibility
study for
scaled airframe
During the course of this project, the BUBO BUBO team has completed a Preliminary Design Document (PDD),Conceptual Design Document (CDD), Preliminary Design Review (PDR), Critical Design Review (CDR), Fall FinalReport (FFR), Manufacturing Status Review (MSR), Test Teadiness Review (TRR), Final Oral Review (FOR), and thisdocument, the Project Final Report (PFR). Each of these documents and presentations were delivered to both thecourse’s Project Advisory Board (PAB) and the client. The results of this project were also intended to be deliveredin a comprehensive package to the client, to include the fully functioning 1-meter span aircraft, as well as a fullscalibility study of the 2-meter span aircraft. This scalability study would have included aerodynamic force mod-eling, stability modeling, control requirements modeling and potential resizing, and a weight change estimate inaddition to performance metrics of the 2-meter span aircraft including power requirements, stall speed, and con-trol responses (yaw rate, bank angle, etc.). Due to the shortened timeline of the project, the scalability study wasunable to be completed, however, the 1-meter span aircraft manufactured and flown by the BUBO BUBO team, aswell as all modeling and analysis required to construct that aircraft, will be delivered.
2.2. Functional Requirements
The functional requirements (FR’s) the BUBO BUBO team shall adhere to are listed in the following section. Theseoutline the main goals of the project and provide a baseline for the flow down of design requirements presented inSection 3.2. Each of these functional requirements was derived from the customer’s requests for this project.
FR 1: The aircraft shall be a box-wing configuration with a scalable span.
FR 2: The aircraft shall integrate a Flush Air Data Sensing (FADS) system that can collect pressure data for thepurpose of deriving the relative wind vector.
FR 3: The aircraft shall be able to complete 10 flight cycles without major damage.
FR 4: The aircraft shall be capable of sustained powered flight with an endurance of 1 hour.
FR 5: The aircraft shall be piloted by an autopilot during the loiter phase of the mission profile.
FR 1 expresses the customer’s desire for a scalable box-wing aircraft. The box-wing design allows for uniquesensor configurations the customer would like to explore. FR 2 provides framework necessary to collect the de-sired data, the relative wind vector. The specification of the Flush Air Data Sensing system as the method for thisdata collect is to utilize the method researched by the customer and his associates. FR 3 is a direct result of thecustomer’s request for each aircraft to be reusable for a minimum of 10 flight cycles. This factor of re-usabilityhelps to keep costs down and makes this aircraft a viable and affordable method for continuous research and data
05/04/20 15 of 124
University of Colorado Boulder
FFR

Aerospace Senior Projects ASEN 4028
collections. FR 4 gives sufficient flight time for the desired data collection. A full hour of flight will allow the mea-surement of the relative wind vector over a timescale accounting for the possibility of changing wind and weatherconditions, while allowing the turbulence and uncertainty associated with takeoff and landing to be excluded fromthe analyzed data. Finally, FR 5 allows the flight of the aircraft to be autonomous for the majority of the aircraft’sflight pattern, minimizing the workload of the research team who must operate the aircraft in the field.
2.3. Concept of Operations
Figure 1 shows the concept of operations of the BUBO BUBO project.
Figure 1. Concept of Operations for BUBO BUBO.
The concept of operations is a brief visual representation of the functional objectives of the mission. For thisproject, the concept of operations is divided into seven segments; these seven segments span the entire length ofthe mission and include the primary stages of the mission from the transportation of the aircraft to the recovery ofdata after landing. The first stage is the transportation of the aircraft to the area of operations. This stage highlightsthe ability of the aircraft to be transported by reasonable means (i.e. in a truck or car) to a location where theuser is interested in capturing data. Immediately following transportation, a pre-flight checklist is completed toensure all on-board systems are fully powered and functioning, and all control surfaces are unobstructed andresponsive to commands. Next comes the launch phase of the mission, performed using the table and bungeemethod developed by the Integrated Remote and In-Situ Sensing (IRISS) program at CU Boulder. After takeoff, theaircraft will climb to data capture altitude through pilot commands sent through an RC transmitter/receiver pair.Once it reaches the appropriate altitude, the aircraft will begin its circular loiter stage, capturing data and storingit on-board while being controlled by an autopilot. For a full flight cycle, the aircraft will remain in this loiter forapproximately one hour. Following data collection, the aircraft will descend via pilot control to land. After landing,the ground team will offload data, inspect the aircraft for damages, make any necessary repairs, and relaunch if sodesired.
2.4. Functional Block Diagram
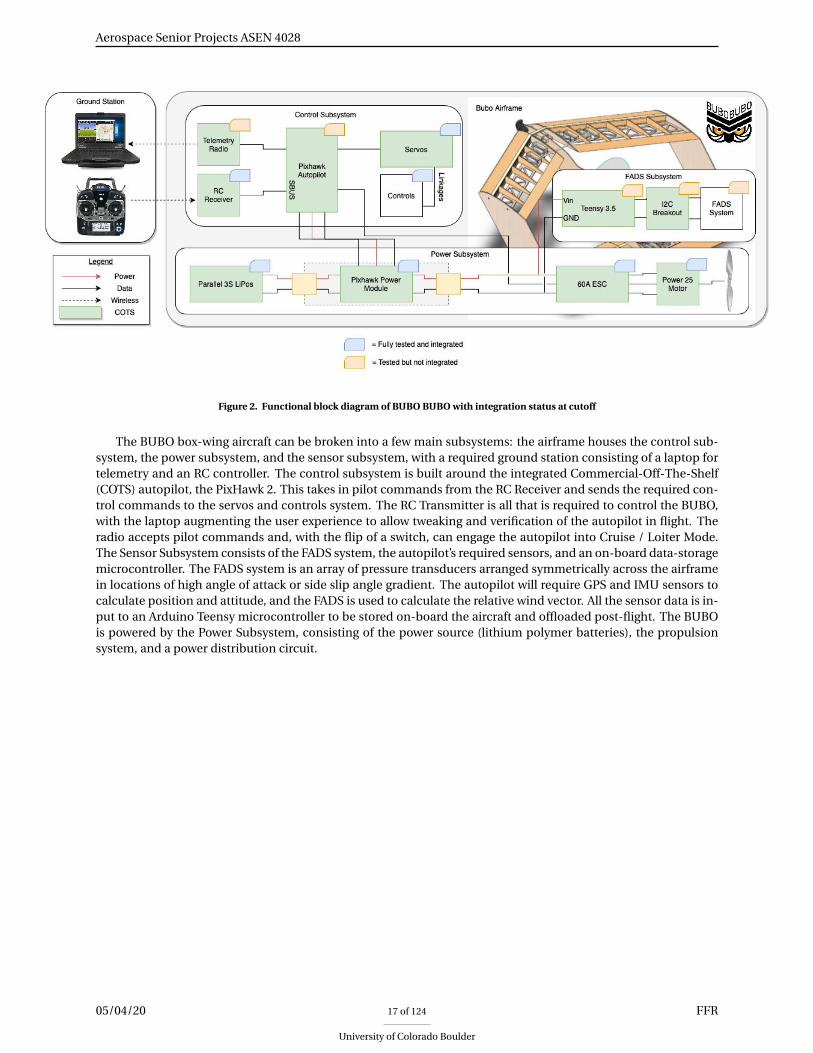
Figure 2 shows the functional block diagram of the BUBO BUBO project.
05/04/20 16 of 124
University of Colorado Boulder
FFR
Aerospace Senior Projects ASEN 4028
Figure 2. Functional block diagram of BUBO BUBO with integration status at cutoff
The BUBO box-wing aircraft can be broken into a few main subsystems: the airframe houses the control sub-system, the power subsystem, and the sensor subsystem, with a required ground station consisting of a laptop fortelemetry and an RC controller. The control subsystem is built around the integrated Commercial-Off-The-Shelf(COTS) autopilot, the PixHawk 2. This takes in pilot commands from the RC Receiver and sends the required con-trol commands to the servos and controls system. The RC Transmitter is all that is required to control the BUBO,with the laptop augmenting the user experience to allow tweaking and verification of the autopilot in flight. Theradio accepts pilot commands and, with the flip of a switch, can engage the autopilot into Cruise / Loiter Mode.The Sensor Subsystem consists of the FADS system, the autopilot’s required sensors, and an on-board data-storagemicrocontroller. The FADS system is an array of pressure transducers arranged symmetrically across the airframein locations of high angle of attack or side slip angle gradient. The autopilot will require GPS and IMU sensors tocalculate position and attitude, and the FADS is used to calculate the relative wind vector. All the sensor data is in-put to an Arduino Teensy microcontroller to be stored on-board the aircraft and offloaded post-flight. The BUBOis powered by the Power Subsystem, consisting of the power source (lithium polymer batteries), the propulsionsystem, and a power distribution circuit.
05/04/20 17 of 124
University of Colorado Boulder
FFR

Aerospace Senior Projects ASEN 4028
3. Design Process and Outcome
Author: All team members; individual contributions listed in Section 9.
3.1. Trade Studies
3.1.1. Rationale
At the beginning of the design process, several trade studies were conducted in the following manner to informimportant design decisions. First, the subject of the trade study was identified, with the focus of the more impor-tant trades being on overarching architecture of particular subsystems, or even the project and aircraft as a whole.Once the subject of the trade study was identified, the various options for that design element were identified andresearched, and the pros and cons of each option were tabulated. Once each option was thoroughly explored, thecriteria by which the options would be evaluated was formally established and defined. Each criterion was thenassigned an individual weight in the form of a percentage based on the importance of each criterion to the overallsuccess of the project, as it relates to that element. The larger the weight, the more important the criteria wasdetermined to be, with the summation of the weights of all the criteria for each trade study being unity. Once thecriteria had been identified and weighted, each design option was scored in each category on a scale from one tofive, with five being the best. Each criterion score was multiplied by its respective weight for every design option.These multiplied figures were then summed for each design option, with the largest total signifying the best designchoice. A full list of the trades conducted and their outcomes can be found in the following Section 3.1.2.
3.1.2. Trades Conducted and Results
A list of each trade study conducted, organized by subsystem, is shown here. The design options considered arelisted for each trade study, with the ultimate design choice indicated in bold. The full trades studies which yieldedthese results can be found in Appendix A: Trade Studies.
AerodynamicsWing Configuration: Delta Wing, Straight Wing, Reflected Sweep, Single Sweep, Symmetric SweepBoom Configuration: One Centered Boom, Two Booms Attached to Side Walls
ControlsAutopilot Controller: Pixhawk 4, Pixhawk 2, BetaFlight F4, ArduPilot Mega, iNAV Matek F405
FADSFADS Configuration: Traditional (Pneumatic Tubes), Simplified (Direct Trandsucer Exposure)
PowerBattery Type: LiPo, Li-Ion, NiCd, NiMH, SLAMicrocontroller Architecture: Arduino, FPGA, Raspberry PiPower Configuration: One Circuit One Battery, One Circuit Parallel, Two Circuits, Three Circuits
PropulsionPropulsion Configuration: Two Pushers, One Puller, One Pusher Centered, Two Pusher Centered, Multiple
StructuresWing Span: One Meter, Two MeterLanding Method: Skid/Hard Landing, Landing Gear, Net, Moving Landing, ParachuteLaunch Method: IRISS Table Bungee, IRISS Hand Bungee, RECUV Rail Bungee, Pneumatic System, Car Roof Sys-tem
3.2. Design Requirements Flowdown
The Design Requirements are derived from the top-level Functional Requirements outlined in Section 2.2. DesignRequirements delve further into the specifics of each Functional Requirement and are meant to define the design
05/04/20 18 of 124
University of Colorado Boulder
FFR
Aerospace Senior Projects ASEN 4028
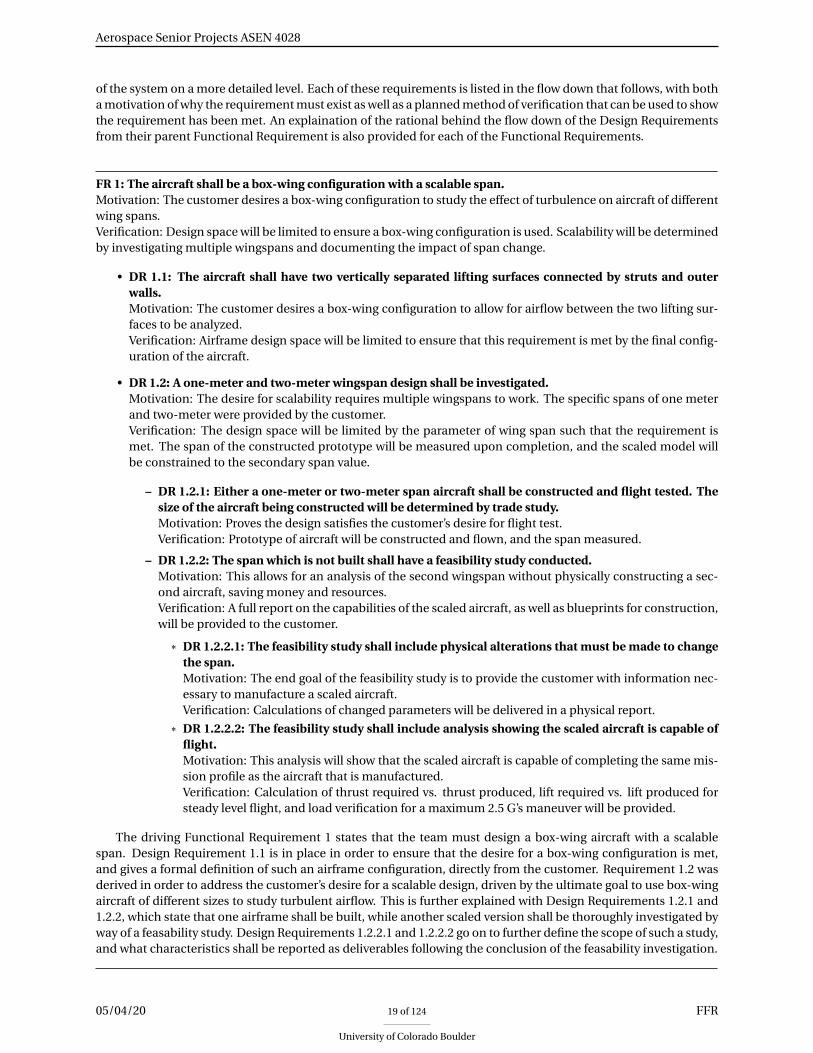
of the system on a more detailed level. Each of these requirements is listed in the flow down that follows, with botha motivation of why the requirement must exist as well as a planned method of verification that can be used to showthe requirement has been met. An explaination of the rational behind the flow down of the Design Requirementsfrom their parent Functional Requirement is also provided for each of the Functional Requirements.
FR 1: The aircraft shall be a box-wing configuration with a scalable span.Motivation: The customer desires a box-wing configuration to study the effect of turbulence on aircraft of differentwing spans.Verification: Design space will be limited to ensure a box-wing configuration is used. Scalability will be determinedby investigating multiple wingspans and documenting the impact of span change.
• DR 1.1: The aircraft shall have two vertically separated lifting surfaces connected by struts and outerwalls.Motivation: The customer desires a box-wing configuration to allow for airflow between the two lifting sur-faces to be analyzed.Verification: Airframe design space will be limited to ensure that this requirement is met by the final config-uration of the aircraft.
• DR 1.2: A one-meter and two-meter wingspan design shall be investigated.Motivation: The desire for scalability requires multiple wingspans to work. The specific spans of one meterand two-meter were provided by the customer.Verification: The design space will be limited by the parameter of wing span such that the requirement ismet. The span of the constructed prototype will be measured upon completion, and the scaled model willbe constrained to the secondary span value.
– DR 1.2.1: Either a one-meter or two-meter span aircraft shall be constructed and flight tested. Thesize of the aircraft being constructed will be determined by trade study.Motivation: Proves the design satisfies the customer’s desire for flight test.Verification: Prototype of aircraft will be constructed and flown, and the span measured.
– DR 1.2.2: The span which is not built shall have a feasibility study conducted.Motivation: This allows for an analysis of the second wingspan without physically constructing a sec-ond aircraft, saving money and resources.Verification: A full report on the capabilities of the scaled aircraft, as well as blueprints for construction,will be provided to the customer.
* DR 1.2.2.1: The feasibility study shall include physical alterations that must be made to changethe span.Motivation: The end goal of the feasibility study is to provide the customer with information nec-essary to manufacture a scaled aircraft.Verification: Calculations of changed parameters will be delivered in a physical report.
* DR 1.2.2.2: The feasibility study shall include analysis showing the scaled aircraft is capable offlight.Motivation: This analysis will show that the scaled aircraft is capable of completing the same mis-sion profile as the aircraft that is manufactured.Verification: Calculation of thrust required vs. thrust produced, lift required vs. lift produced forsteady level flight, and load verification for a maximum 2.5 G’s maneuver will be provided.
The driving Functional Requirement 1 states that the team must design a box-wing aircraft with a scalablespan. Design Requirement 1.1 is in place in order to ensure that the desire for a box-wing configuration is met,and gives a formal definition of such an airframe configuration, directly from the customer. Requirement 1.2 wasderived in order to address the customer’s desire for a scalable design, driven by the ultimate goal to use box-wingaircraft of different sizes to study turbulent airflow. This is further explained with Design Requirements 1.2.1 and1.2.2, which state that one airframe shall be built, while another scaled version shall be thoroughly investigated byway of a feasability study. Design Requirements 1.2.2.1 and 1.2.2.2 go on to further define the scope of such a study,and what characteristics shall be reported as deliverables following the conclusion of the feasability investigation.
05/04/20 19 of 124
University of Colorado Boulder
FFR

Aerospace Senior Projects ASEN 4028
FR 2: The aircraft shall integrate a Flush Air Data Sensing (FADS) system that can collect pressure data for thepurpose of deriving the relative wind vector.Motivation: Customer requires relative wind vector for aerodynamic research.Verification: Data collected from the FADS system during a ground test will be used to compute relative windvector and compared to pitot static probe reference.
• DR 2.1: The FADS system shall be integrated into the wing of the aircraft such that the sensors are flushwith the wing surface.Motivation: Flushness reduces the impact on the airflow over the wings and the risk of damage.Verification: Visual validation that sensors do not protrude above aircraft’s mold line.
• DR 2.2: An array of pressure transducers shall be integrated into the airframe at locations of high coeffi-cient of pressure (Cp ) gradient.Motivation: High Cp gradient allows for high sensitivity to relative wind vector orientation.Verification: Either analytical model or CFD model of Cp differential will be used to verify the locations se-lected have a high Cp gradient.
• DR 2.3: An on-board processor shall be integrated with the sensors to capture data.Motivation: Data must be stored so it can be accessed for post-flight analysis.Verification: Verify that test data was collected by uploading it to a computer.
– DR 2.3.1: The on-board processor shall be capable of recording sensor data at a rate of at least 6 Hz.Motivation: Prior research done by the customer indicates this is an acceptable rate to record data.Verification: Timestamps on data agree with the required sampling rate.
– DR 2.3.2: The on-board processor shall be capable of storing at least a one-hour flight’s worth ofdata.Motivation: The customer desires one hour of data collection in flight.Verification: One hour’s worth of flight data does not completely fill up the data storage.
Functional Requirement 2 states that the aircraft designed by team BUBO BUBO shall feature an integratedFADS system in order to recover the relative wind vector. Design Requirement 2.1 states that the sensors shall beflush to the aircraft’s surfaces, i.e. not protruding over the outer mold line of the wings or sidewalls. This flushnature not only allows for less airflow interruption (and thereby a reduction in drag), but also greatly reduces therisk of damage upon landing by eliminating the need for any protruding sensors or probes. Design Requirement2.2 dictates the location of the FADS sensors themselves, constraining them to locations of high pressure gradientin order to more accurately capture useful insight into the changing relative wind vector through the capture ofpressure data alone. Design Requirement 2.3 and its subsequent flow down requirements state that the FADSsystem shall be integrated with an on-board processor that can collect data at a high enough sampling rate of 6 Hz,while storing enough data to encompass a full hour of collection.
FR 3: The aircraft shall be able to complete 10 flight cycles without major damage.Motivation: The customer has requested the aircraft be capable of being reused for a minimum of 10 flight cycles.Verification: Flight test will show the capability of 10 flight cycles without major damage. The customer has defined“major damage” as damage requiring a repair exceeding 15 minutes of work in the field.
• DR 3.1: The aircraft shall demonstrate a pilot-controlled takeoff.Motivation: Risk associated with automated takeoff is much higher than that associated with a manual take-off.Verification: Flight test will show the capability of 10 flight cycles without major damage. The customer hasdefined “major damage” as damage requiring a repair exceeding 15 minutes of work in the field.
– DR 3.1.1: The launch system shall be deployable in the field in less than 15 minutes.Motivation: Customer requests aircraft can be launched within 15 minutes of recovery.Verification: Stopwatch will be used to ensure the launch is set up and deployed in less than 15 minutes.
– DR 3.1.2: The launch system shall integrate with the airframe such that no major damage is im-parted to the aircraft.Motivation: The aircraft must survive the launch phase of the mission profile in order to complete aflight cycle.Verification: Flight test shows no major damage.
05/04/20 20 of 124
University of Colorado Boulder
FFR

Aerospace Senior Projects ASEN 4028
• DR 3.2: The aircraft shall demonstrate stable flight in a loiter pattern within visual range.Motivation: The mission profile calls for a data collection segment over a singular area, and FAA require-ments state that unmanned aircraft operators must maintain visual contact with the aircraft during flight.Verification: GPS data confirms acceptable loiter path, variant based on flight condition.
– DR 3.2.1: The aircraft shall have dynamically stable flight characteristics upon small perturbations(less than 10◦) to the aircraft’s pitch, yaw, and roll.Motivation: Stable flight characteristics are necessary to remain in loiter pattern for data collection.Verification: Computed stability derivatives shall show dynamic stability.
• DR 3.3: The aircraft shall land and be able to fly again within 15 minutes.Motivation: The customer intends to use the aircraft for multiple flights, and may need to collect several datasets at the same location with limited repair time and materials available.Verification: Any repairs needed after each flight cycle will be timed with a stopwatch to confirm that theytake 15 minutes or less.
– DR 3.3.1: The power source shall be interchangeable.Motivation: The in-between flight setup shall take an average time of 15 minutes.Verification: A stopwatch shall be used to measure turnaround time for battery replacement.
– DR 3.3.2: The aircraft shall be able to land in a field.Motivation: Landing location will be, at best, minimally prepared. Aircraft should be able to land oversmall stones and bumps without catastrophic damage.Verification: Inspect frame for landing-related major damage after each flight cycle.
Functional Requirement 3 is concerned with the aircraft’s ability to perform 10 successive flight tests withoutthe need for any major repairs. The flow down requirements from this are thereby concerned with the three mainphases of a typical flight profile; takeoff, loiter, and landing. Design Requirement 3.1 discusses the necessity forthe craft to complete a takeoff while under the control of a human pilot. DR 3.1.1 further specifies that whatevermethod is used to launch the aircraft is quickly deployable in no more than fifteen minutes, while 3.1.2 specifiesthat the launch method shall integrate with the airframe such that there is no lasting damage imparted duringthe launch process. These two requirements ensure that launch does not hinder the success of the project as faras meeting the functional requirements. Design Requirement 3.2 then specifies that the aircraft shall be stableand fly in a loiter pattern within visual range. The stability requirement is to ensure that the pilot does not losecontrol of the aircraft during flights. This is further described in requirement 3.2.1, which states that the aircraftshall be able to demonstrate dynamic stability when subjected to small perturbations. The third driving DesignRequirement in this series, 3.3, has to do with the landing and subsequent repairs of the aircraft between flights,constraining these to no more than fifteen minutes. The flow down requirements, 3.3.1 and 3.3.2, go on to definethat the power source shall be easily interchangeable, and that the aircraft shall be able to land in an open field.These two requirements are in place to clearly define how the aircraft shall achieve its fifteen minute turn aroundtime.
FR 4: The aircraft shall be capable of sustained powered flight with an endurance of 1 hour.Motivation: The customer requested a minimum flight time of 1 hour.Verification: Ground tests shall demonstrate the operational capability of all systems for the total flight time.
• DR 4.1: The aircraft shall possess an internal power system.Motivation: The aircraft shall be capable of autonomous powered flight. It shall be able to operate in thisway for a minimum of 1 hour.Verification: Ground-based testing for the full flight duration with all systems active, including propulsion(at 1.3x trim throttle) and control mechanisms.
– DR 4.1.1: Power shall be distributed to each subsystem that requires it such that the needs of eachpowered system are met.Motivation: In order for the system to function as a whole, the power requirements of each subsystemneed to be met.Verification: A voltmeter shall be used to determine if the voltage across each internal component is inaccordance with the manufacturer’s specifications. A full electrical systems test prior to the installationshall be used as a final verification.
05/04/20 21 of 124
University of Colorado Boulder
FFR

Aerospace Senior Projects ASEN 4028
• DR 4.2: The propulsion system shall support sustained flight for a minimum of one hour at standard op-erating loads.Motivation: In order to meet the endurance goals set by the customer, the propulsion system must be cor-rectly sized so as to provide adequate thrust for the aircraft.Verification: Flight testing shall verify propulsive sufficiency by maintaining a consistent flight speed for anextended time.
– DR 4.2.1: The propulsion system shall generate sufficient thrust to overcome the expected dragforces on the aircraft.Motivation: For sustained flight, the propulsion system must be able to overcome the drag forces actingon the airframe during flight.Verification: Thrust performance shall be determined on the ground via static thrust testing.
– DR 4.2.2: The propulsion system shall be positioned to prevent damage to the motors.Motivation: In the interest of rapid turn around and ease of repair, the propulsion system should beprotected from undue damage on landing. Propeller damage is admissible due to the availability ofreplacement propellers.Verification: Motor units shall not be damaged during flight testing.
Functional Requirement 4 specifies the aircraft’s powered endurance goal of one hour, per customer request.Design Requirement 4.1 goes on to further specify that the aircraft shall achieve this endurance using an internal,integrated power system. This internal system shall be able to meet the power needs of all on-board components,as specified by the flow down requirement 4.1.1. Design Requirement 4.2 deals with the propulsion system neededto support sustained flight for the full hour of required endurance. The derivative requirement 4.2.1 goes on todefine this support as producing enough thrust to overcome the drag forces that arise from steady flight at theexpected cruise velocity. Requirement 4.2.2 concerns the positioning of the propulsion system within the airframeitself, ensuring that the motor is not damaged upon landing or any other phases of flight testing.
FR 5: The aircraft shall be piloted by an autopilot during the loiter phase of the mission profile.Motivation: Autopilot will remove human error from the loiter stage of flight, enabling a more consistent methodof data collection.Verification: The autopilot’s response to inputs from typical flight conditions will be tested to ensure the desiredresponse is achieved.
• DR 5.1: The flight controller shall receive manual commands from the RC pilot.Motivation: The customer requires that takeoff, landing, and general maneuverability be manually control-lable. These phases of the flight profile are generally very difficult to control via autopilot.Verification: Pilot commands transmitted by the aircraft controller are executed by the flight controller onthe servos during ground testing.
• DR 5.2: The autopilot system shall contain the sensors necessary to implement feedback control for asteady flight.Motivation: In order for the feedback system to adjust the aircraft, onboard state determination shall berequired to calculate the necessary control outputs.Verification: Flight information fed from the flight controller to ground control matches the conditions setfor the test such as pressure, rotation, and changes in altitude.
– DR 5.2.1: The flight controller shall have the ability to ensure path deviations in loitering are under15 meters.Motivation: The aircraft will be collecting data through the FADS system, and thus must not deviateover time from the location of interest.Verification: The aircraft does not deviate away from the designated flight path more than the specifieddeviation range of ±15 meters.
• DR 5.3: The RC pilot shall be able to switch from manual control to autopilot control for loitering flight.Motivation: Due to the expected time of flight which will be approximately 1 hour, the customer requiresthat an autopilot be used for steady flight as it will be the major portion of the flight.Verification: The flight controller switches from manual control to autopilot control when the RC controllerswitch is activated.
05/04/20 22 of 124
University of Colorado Boulder
FFR

Aerospace Senior Projects ASEN 4028
Functional Requirement 5 defines the need for an autopilot aboard the airframe, and the implementation ofthis autopilot during the loiter portion of the flight profile. Design Requirement 5.1 first states that the aircraftshall be able to receive manual commands from an RC pilot on the ground. This is in place so that should an erroroccur with the autopilot during loiter, the aircraft can still be recovered and flown. It also allows for human controlduring the takeoff and landing portions of flight, stages of the flight profile which pose much higher risk than theloiter period due to changing flight conditions and close proximity to the ground. Requirement 5.2 then goes on todefine the necessary features of the autopilot, and specifically, the inclusion of sensors that allow for closed loopfeedback control to be implemented. The flow down requirement, 5.2.1, then defines the maximum deviationdeemed acceptable from the planned loiter flight path while the autopilot is running. This value of fifteen meterswas selected to ensure that the aircraft does not leave visual range at any point during flight, and also continuesto collect data at desired locations and altitudes. Design Requirement 5.3 reconciles the two methods of controlby stating that the switch from manual to automated control take place in flight. This requirement is in place toensure that the autopilot can be switched on and off as necessary during flight testing.
3.3. Final Design
3.3.1. Control System
Controls was one of the few subsystems that had not had any significant progress in testing at the time the projectwas stopped. However, the aircraft itself proved to be highly stable during the flight test as predicted by the stabilitymodels. The iteration of the BUBO used for the flight test did not feature fully autonomous flight capabilities, asthe PixHawk2 (PX2) had not yet been configured for the unconventional airframe that is a box-wing. Instead, thisiteration had a manual-only control system that consisted of an RC receiver, an RC transmitter, and two servosattached to the elevons on the back wing. Servo tuning was accomplished using the RC transmitter, while controlauthority was achieved using elevons that combine the functionalities of an aileron and an elevator for directcontrol of pitch and roll. The aircraft does not contain a rudder of any sort, as yaw is indirectly controlled usinglateral coupling to establish relationships between roll angle and induced yaw rates.
The final aircraft iteration would have contained a fully autonomous-capable control system setup with thePixHawk2, GPS module, servos, radio telemetry, and elevons, as well as an RC receiver and transmitter to still allowfor manual control during takeoff and landing. For this final design, the PX2 and its internal ArduPilot softwarerequired slight reconfiguration to account for the unconventional design of the aircraft. Though it was adjustedto interface with the elevons using the default option available in the firmware, the selection of the gains for PDcontrol was not complete. Further tests were needed for PD control setup, including a ground test with the fullsetup of the control system to compare with the developed dynamics model of the aircraft. In addition, flightmodes required signal setup (PWM signals) on the RC transmitter to ensure that the pilot can switch betweenautonomous loiter flight and manual flight without any issues. Further necessary alterations included setting upa fail-safe mechanism in the case of any RC control loss. In such a scenario, the aircraft would automatically lockinto RTL (Return To Launch) mode and return to the site of its launch using GPS data. A ground station was to beused as well to send commands to the aircraft during flight as well as receive flight data pertaining to the roll, pitch,and yaw for further comparison with the models. This also required a ground test where the telemetry capabilitywould have been tested with a radio attached to the PixHawk in the full control system setup and radio attachedto a computer to act as the ground station.
3.3.2. Airframe
The iteration of the BUBO that was used in the flight test was a 1-meter span box-wing aircraft with a straightbottom wing and a 30° swept top wing. The bottom wing had a 5° decalage, or fixed angle of attack, while the topwing was level. The top wing had a cambered NACA6412 airfoil and the bottom wing had a reflexed NACA23112airfoil. The combination produced a positive pitching moment designed to counteract the negative pitch inducedby the ballast. The airframe had solid panels on both outboard ends connecting the two wings as well as a centerstrut that joined the wings and served as the mounting location for the motor mount, launch hook, and autopilotbay.
The airframe itself was built using a modular approach. It can disassemble into seven main components: twotop wing sections, two bottom wing sections, two end panels, and one center pylon. These components are con-nected in several ways. The wing sections are secured to the center pylon with three separate methods. First, fouraluminum rods run spanwise through the center pylon to connect the left and right wing sections, with two rods
05/04/20 23 of 124
University of Colorado Boulder
FFR

Aerospace Senior Projects ASEN 4028
for the top wing and two for the bottom. These rods are intended to transfer shear and bending loads in the air-frame. Second, a singe screw and nut fastened in tension connects each wing section to the center pylon. Thesesecure the wing sections and prevent them from separating in the spanwise direction from the center pylon. Lastly,strapping tape is used along the outside of the connecting junctions in order to cover any gaps and improve aero-dynamic performance. The outer panels are connected to the outboard ends of the wing sections via four screwseach (two for each wing section). Nut plates were built into the wing sections in order to reduce the complexity ofassembly. The screws attaching the lower wing section to the outer panels also serve as the mounting location forthe landing skids. This was done to reduce the amount of fasteners required, therefore lowering part count, cost,and weight.
All seven main components of the airframe were constructed using various woods and adhesives as describedin previous reports. A mixture of balsa for its low weight and ease of manufacturing, plywood for its strengthand versatility, and basswood for its ideal tensile and flexural properties were utilized. The landing skids and theautopilot bay were made using 3D-printed PLA in order to support rapid prototyping of these relatively complexshapes. In addition, these parts serve as some of the main landing protection for the aircraft and therefore have ahigh likelihood of breaking. By 3D-printing these components, we were able to have multiple spare parts on handin the field should a landing skid need replacing. Additional bracing for landing was provided by the ballastedboom protruding from the front of the aircraft, made by attaching mass to a beech wood dowel. Originally intendedjust to move the center of gravity forward for stability reasons, this boom proved to be a valuable asset in landingdue to its tendency to strike the ground before the leading edge of the top wing, thereby absorbing a great deal ofkinetic energy. Similar to the landing skids, the boom was designed to be easy and inexpensive to replace should itbreak upon landing, and in fact, it was preferred to break so as to protect the rest of the airframe.
All wetted surfaces on the airframe (surfaces that are exposed to the airflow during flight) except for the centerpanel were covered in Monokote, a thin, transparent, and easily repairable plastic sheeting commonly used inhobbyist RC aircraft as a skin material. Not only does it provide a smooth aerodynamic surface, but it is significantlystrong in tension and therefore makes an airframe much stronger when applied. When lightening holes wereadded to the outer panels to help improve performance, monokote was used to cover the holes in order to preventlarge amounts of turbulence drag coming from these open areas.
Because there is no fuselage in a box-wing aircraft to house the avionics, the airframe had to be designed suchthat all onboard electronics were housed within the wing sections. To accomplish this, a bay-floor made of plywoodwas added to each wing section along with pass-through holes in every rib section for wiring. Certain componentssuch as the FADS sensors and the numerous batteries were to be located in the wing sections, while more criticalflight components like the telemetry radio, ESC, and the autopilot were made to live inside the structure of thecenter pylon. Not only do some of these avionics components require being on the centerline of the aircraft, but bybeing in the innermost structure they are also theoretically the most protected from damage upon impact. This wasa priority for some of our more expensive components, such as the autopilot controller. A 3D-printed component,known as the autopilot bay, was designed and fabricated that acts as the floor of the lower wing section of thecenter pylon. It attaches to the center panel with two screws in shear and helps transfer some compressive loadsspanwise through the lower wing. It has screw holes made specifically for our PixHawk autopilot controller so thatthe PixHawk’s exact orientation within the aircraft is known and so the PixHawk does not come loose during flight.The orientation of the autopilot is important for accurate autopilot feedback and controls.
3.3.3. Electrical Circuit
The final circuit design schematic for the aircraft is shown in Figure 3. The electrical system design of the BUBO fillsmultiple functions. Primarily, it ensures that power is properly distributed through the aircraft to all componentsthat require it. Second, it makes sure that data collected on the aircraft is saved and able to be processed afterthe flight, and that control commands from the pilot or autopilot are properly executed by the aircraft. Finally,the power system must be able to handle a sustained flight load for an endurance of one hour, as defined bythe requirements laid out previously. The key design requirements that dictate the electronics design are shownpreviously. These requirements motivated the modeling and testing done to create the electrical system design forthe aircraft.
05/04/20 24 of 124
University of Colorado Boulder
FFR

Aerospace Senior Projects ASEN 4028
Figure 3. Overall Electronics Circuit Diagram
The power subsystem consists of the batteries, Pixhawk Power Module, and the propulsion system, the speedcontroller (ESC) and motor. Design Requirement 4.1 states that the aircraft must have an internal power system,and therefore an internal power source. In the conceptual design phase, trade studies were conducted on differ-ent battery types and configurations to power the aircraft in an efficient and manageable way. Lithium Polymer(LiPo) batteries were chosen for their reliability, energy density, and ease of acquisition. Additionally, many smallbatteries in parallel was the chosen configuration, as it works very well with the structural design, which has manybays in the wings able to hold many small batteries easily. This allows the user to move batteries between the twowings to adjust the center of gravity of the aircraft in the field. Ideally, to maximize power efficiency, a high cellcount battery would be chosen, as higher cell counts store the energy at higher voltage. However, as cell countsincrease, the thickness of batteries increase as well, making high cell count batteries impossible to fit in the wingof the aircraft. Ultimately, three cell LiPos were chosen, specifically Thunderpower Prolite 25C 3S 910mAh packs.These are small enough to fit two batteries in any wing bay, yet provide enough capacity to limit the total num-ber of batteries required in the aircraft. The group has experience with Thunderpower, where they have provento produce quality batteries for a respectable price and availability. The amount of parallel batteries required forour aircraft is driven by Design Requirement 4.2, which states our aircraft must achieve an endurance of one hour.This drove the development of the endurance model, which allows us to predict our battery count requirements,and will be discussed later.
The control subsystem consists of the Pixhawk autopilot, GPS and radios, and servo actuated controls. ThePixhawk autopilot is further discussed in the control system design section. The RC receiver communicates withthe pilot’s transmitter to get pilot commands to the control subsystem. The choice of transmitter, which is a FutabaT8J, drives the choice of receiver as it defines the communication protocol. The transmitter was chosen as it is avery capable computer radio that the team’s test pilot has used for years. A radio is a significant investment, andas a capable one was already on hand, it was decided to go forward using it. The Futaba T8J uses the S-FHSScommunication protocol, so a matching receiver needed to be selected. To keep the receiver as light as possible,an SBUS receiver was chosen, which lets the receiver connect to the autopilot, send data, and receive power by justa single wire, eliminating the need for multiple channels of wires for each channel of pilot control. This aircraftdoes not need a long range receiver, as it is designed to complete circular loiter pattern missions within visualrange. Given these requirements, the Superior Hobby RSFSB 8 receiver was chosen.
Finally, the sensor subsystem consists of the FADS circuit, shown in Figure 4, and it’s accompanying data stor-age microcontroller. The Flush Air Data Sensing (FADS) system, as required by Design Requirements 2.1 and 2.3,consists of the data storage microcontroller and the bays of I2C breakout and pressure transducer boards.
05/04/20 25 of 124
University of Colorado Boulder
FFR

Aerospace Senior Projects ASEN 4028
Figure 4. FADS Bay Circuit Diagram
In the conceptual design phase, an Arduino-architectured microcontroller was settled on for its ease of useand prior group experience. A Teensy 3.5 was selected for its small profile, integrated SD card, and three I2Crails. This setup allows the user to connect up to three bays of pressure transducers and store data from themin a way that is easily and quickly switched out between flights. The Teensy operates at 3-6V, making it the onlycomponent on the aircraft that is powered directly by the aircraft batteries that can not accept the battery voltageof 10-12V. A solution was designed using a resistor to dissipate enough power to drop the voltage to the requiredlevel. This was the simplest solution but not the most robust, and will be discussed in the next section. Assumingthe Teensy is successfully powered, it will be the hub of the FADS system, connecting directly to the sensor baysspread throughout the aircraft and saving the data to be analyzed post-flight. Arduino’s are programmed using amodified C++ derived programming environment. The environment comes with many useful libraries, includingthe Inter-integrated Circuit (I2C) transmission library that includes very useful scripts for dealing with the I2Ccommunication that the digital pressure transducers use. This makes programming data storage from the pressuretransducers extremely simple.
The pressure transducers selected for the FADS system are digital BME280s that send digital pressure data overI2C communication. To simplify the FADS bay circuit, a version integrated into an Adafruit breakout board waschosen, allowing four-strand ribbon wire to be used to easily connect the pressure transducers to an I2C breakoutboard. This is required as the pressure transducers are fixed address, so multiple transducer boards cannot beconnected to the same I2C bus using addressed I2C. The Adafruit I2C breakout allows multiple transducers to beconnected and addressed into one I2C bus that can be connected to the Teensy’s I2C busses, as shown in Figure 4.This allows up to eight pressure transducers to be connected to each of the three I2C ports on the Teensy, lettingthe airframe house up to 24 flush FADS pressure ports. These groupings of FADS transducers and a breakout boardmake up the individual FADS bays, which is discussed more in the FADS section.
05/04/20 26 of 124
University of Colorado Boulder
FFR

Aerospace Senior Projects ASEN 4028
4. Manufacturing
Author:
4.1. Mechanical Manufacturing Scope
The scope of the mechanical manufacturing tasks for team BUBO BUBO can be described by the componentsgiven in Figure 5. The components here include all of the necessary hardware items to construct a fully function-ing BUBO aircraft, most of which were successfully manufactured and placed into the aircraft for the first flighttest. Components that did not make it into the aircraft are assigned a red status indicator. It is worth noting thatthe only components that did not achieve full implementation (from a hardware standpoint) were the hardwarecomponents of the FADS system. These components were planned to be implemented in the second test flight.More information on the planned FADS integration will be given in the Section 4.2. In terms of subsystems, thelarge majority of the mechanical manufacturing scope belonged to the structures subsystem where most of thosecomponents were easily manufactured via the laser cutter in the SMEAD aerospace building.
Figure 5. Mechanical Manufacturing Component List
Part of the scope of the mechanical manufacturing for team BUBO BUBO was the decision to purchase certaincomponents rather than manufacture them in house. Commercial off-the-shelf (COTS) components will be de-fined as any part of the aircraft which is purchased and not physically modified in any way before being integratedinto the fully constructed aircraft. The following Figure 6 gives a visual representation of which components wereCOTS (shown in green) and which were manufactured (shown in white) by the BUBO BUBO team. Note that manyof the COTS components are electrical, where the top wing houses batteries, GPS and RC receiver and the bot-tom wing houses more batteries, the FADS system, servos and the autopilot. This gives a reference for the sheerquantity of components that were required to construct a single BUBO aircraft and the general placement of theelectrical components inside of the airframe.
05/04/20 27 of 124
University of Colorado Boulder
FFR

Aerospace Senior Projects ASEN 4028
Figure 6. Manufactured and Off the Shelf Components
4.2. Electrical Manufacturing Scope
The electrical manufacturing scope of the BUBO was defined by the circuit design created in the fall semester, asshown in Figure 3. Excepting the FADS system, the aircraft circuit is designed as an integration of many COTS,hobby-grade aircraft components including standard servos, motor/ESC, etc. The FADS system can be regardedas a closed sensor system that is only powered by the rest of the aircraft circuit, with the circuit previously shownin Figure 4. The overall aircraft circuit manufacturing/integration design is shown in the following Figure 7. Thewire gauges chosen were guided by the American Wire Gauge (AWG) standard for the calculated maximum currentrunning through them.
The largest section of manufacturing work for electronics was completely constructing the aircraft circuit out-side of the actual airframe for testing and verification. This included the power, propulsion, control, and sen-sor subsystems all tied together and working as commanded and intended. Power distribution and quality waschecked and validated for all components, the autopilot commanded the servos in response to IMU perturbationsin stabilized mode, the motor was throttled up through the RC radio, and the FADS microcontroller was verifiedto store data on an SD card. As shown in Figure 7, all systems were designed with physical connectors betweencomponents to allow wing-sections to be entirely swappable in the field with no soldering required.
The next step in the manufacturing and integration process was to prepare the BUBO airframe for the initialflight test. In order to ensure the highest chance of success with only one shot to fly the aircraft before the COVID-19 cutoff, the electrical setup in the aircraft was simplified and lightened as much as possible. Due to C ratings,the minimum number of batteries required to fly the aircraft safely, without overheating, is four; this limited theinitial flight test endurance to just around five minutes. The FADS system was entirely removed from the circuit,along with the autopilot and all of it’s components. This made the aircraft circuit just four LiPo batteries, the RCreceiver, ESC, motor, and two servos. The overall integration layout of components in the aircraft was very similarto the design in Figure 7, however the ESC and receiver were moved to the center section of the top wing, leavingthe servos the only electrical components in the bottom wing (all four batteries were placed in the top wing baysonly).
The rest of the electrical manufacturing scope for the BUBO was left incomplete due to the suddenly-imposedtime restraints. The first of these incompleted tasks was to integrate the Pixhawk autopilot system into the testedairframe. This would include integrating the Pixhawk IMU, power module, telemetry radio, and GPS module intothe aircraft. This integration would allow the BUBO to complete the autopilot loiter section of the mission profile,completing the autopilot-controlled one-hour endurance goal (which would require a full battery suite, predictedto be around sixteen 910 mAh LiPo batteries). It would also allow the team to start onboard FADS testing. Theautopilot system was fully tested outside of the airframe and would have been an easy stepping stone along thepath to full electrical integration.
05/04/20 28 of 124
University of Colorado Boulder
FFR

Aerospace Senior Projects ASEN 4028
Figure 7. Aircraft Circuit Integration Layout
Once the autopilot system had been fully integrated, tested, and validated, the FADS system would be inte-grated into the BUBO for flight testing. This would start with the full manufacturing and testing of three FADSbays of four sensors each connected to the data-storage microcontroller. Each bay would be tested for sensor iso-lation and data integrity outside of the aircraft, and then the FADS bays would be secured in the wing bays withvelcro, and tubing would be piped from the leading edge and side panels to the sensors. The system would then beflight tested through an autopilot loiter phase at multiple attitudes. Ideally, a calibration system would have beendeveloped and the goal was to deliver a full data set at multiple altitudes for future processing and interpretation.
4.3. Software Manufacturing Scope
The software selected to configure the autopilot was ArduPlane, a free off-the-shelf software that was designedto be compatible with a range of flight controllers, including the PixHawk 2. This software contains a graphicaluser interface that allows the user to change parameters and configure firmwares that could be uploaded on to theflight controller. For the initial successful phases of the autopilot setup, the flight controller was being configuredto communicate with the GPS Module, servos, motor, and the telemetry radios. The next phase was to adjustcertain parameters for flight such as the type of control surfaces to be used by the flight controller, the gains onpitch, roll, yaw, the fail-safe mechanism, the flight modes, and data capture of flight behavior. These parameterswere not adjusted in time for the flight test and, thus, the flight controller was not used. However, for the finaliteration the PixHawk would have been fully ready for use in flight and capable of autonomous loiter flight hadtesting not been cutoff.
4.4. Outcome of Manufacturing Tasks
The outcome of the manufacturing tasks in this project was a fully constructed airframe as well as functioningpower, RC control and propulsion systems with the capability of supplying additional systems (such as the FADSsystem) with ample amounts of power. Each of these successful manufacturing tasks can be grouped into threemajor subsystems of the manufacturing process, these being mechanical, electrical, and software oriented manu-facturing tasks.
05/04/20 29 of 124
University of Colorado Boulder
FFR

Aerospace Senior Projects ASEN 4028
4.4.1. Outcome of Mechanical Manufacturing
The mechanical subsystem of the manufacturing process included all of the hardware components on the aircraftthat do not require electrical power to serve their primary purpose. The outcome of the mechanical manufactur-ing was one successful airframe, which was comprised of approximately 150 components cohesively working todistribute aerodynamic loads across the airframe during flight. These 150 components put together created largeassemblies which included: four wing sections, a center strut, side panels, landing skids, pylon floor, weightedboom, boom attachment mechanism, motor mount, launch hook, and bay door access hatches. Each of theselarger assemblies could then be connected via screws and guide rods for an extremely modular design which isboth easy to assemble and extremely impact resistant. An intermediate step in this modular construction is shownin the following Figure 8. In addition to the airframe, the mechanical subsystem of the manufacturing processalso yielded a pogo style nose wheel (depicted in Figure 10) which was designed to detach from the aircraft upontakeoff. This pogo mechanism was simple as it was comprised of five components: a wheel, two triangular braces,an axle, and a rectangular spacer between each of the triangular braces. This pogo was essential in the success ofthe test flight as it kept the aircraft at a nose-up attitude during launch.
Figure 8. Intermediate Mechanical Manufacturing Step
4.4.2. Outcome of Electrical Manufacturing
The outcome of the electrical manufacturing, integration, and testing, was limited to the initial flight test modeldescribed in Section 4.2. All further tasks, including autopilot integration and FADS integration into the airframe,were left incomplete due to the time cutoff put in place due to COVID-19. Despite the amount of work left to do,the aircraft performed well in the testing that was conducted, and if time was left to complete, further successeswere expected throughout the remaining work.
4.4.3. Outcome of Software Manufacturing
There was no major software outcome as the software that was used to configure the PixHawk was off-the-shelf,and, thus, required no development. The only major task was to understand how the GUI of the software operatedto allow for configuration and firmware setup in the PixHawk.
05/04/20 30 of 124
University of Colorado Boulder
FFR

Aerospace Senior Projects ASEN 4028
4.5. Manufacturing Challenges
Team BUBO BUBO experienced many project related challenges throughout the semester; this section will specif-ically dive into the manufacturing challenges associated with building a small scale UAS in a collegiate, non-industry setting. The three primary challenges faced with the manufacturing of the BUBO aircraft were materialsprocurement, delegation of personnel for manufacturing tasks, and build quality tolerance issues. In addition toidentifying these challenges, this section will also explain the primary causes of each of these challenges and howthese challenges were overcome by the project management, systems engineer and manufacturing lead.
The first major challenge that the team experienced during the development of the BUBO aircraft was materialsprocurement. Since the BUBO was constructed of a multitude of hobbyist wood types, most of the procurementof materials had to occur via hobby stores local to the University of Colorado. Local procurement was an issue forthe team because there was no way of knowing if the hobby stores had the exact types of wood that were neededin stock. As such, many of the stores did not have the materials required for the project which caused the scheduleto be pushed back further and further. In addition to scheduling issues, there were also issues with the quality ofthe wood procured from each of the local stores. Much of the wood was far too warped to be used on the aircraftand, as such, had to be scrapped for fear of building stress into the airframe during construction by bending thewood back into alignment. Although these issues were frustrating, they were easily remedied by purchasing selectwood materials online and pressing the warped wood back into alignment. Certain wood types could be orderedonline for low cost and fast shipping times so that the project could continue manufacturing without a major delayin the project schedule. On top of this, warped wood procured by the financial team could be soaked in water andpressed using 45 lb plates to eventually straighten it for manufacturing use.
The second major challenge that the team experienced during the development of the BUBO was the delega-tion of personnel for manufacturing tasks when the project was in the height of its manufacturing phase. As thisproject had more than 150 parts to fabricate to come together into a full aircraft, a system had to be put in placefor delegating certain people to adopt certain manufacturing tasks to stay on the aggressive project schedule thatwas set for the team. One of the major challenges of this system is finding out which personnel were best suitedfor each specialized task of the manufacturing process. Failing to delegate personnel correctly could lead to a se-vere decrease in build quality of the aircraft which could result in aerodynamic or structural deficiencies duringflight. To remedy the issue of the assignment of manufacturing tasks, the project manager and manufacturinglead worked together to determine who should work on each manufacturing process based on previous manufac-turing experience while also inspecting the work of the individual during and after their manufacturing task wascomplete. The correct assignment of personnel allowed the manufacturing lead to implement a combined man-ufacturing strategy of linear manufacturing at the beginning of second semester which then shifted into a parallelmanufacturing strategy at the end of the semester. This strategy allowed for the detailed development of buildplans during the linear development of wing sections which could be distributed to the manufacturing personnelduring the parallel manufacturing phase for ease of manufacturing.
The third major challenge that the team experienced during the development of the BUBO was the build qualityand tolerance issues associated with working with prototypical manufacturing methods. As displayed previouslyin Figure 5, the primary manufacturing method for most of the airframe components was laser cutting. Lasercutters are beneficial because they can cut out multiple parts in a matter of seconds, however, they have one majordrawback in that they cannot cut through materials at any angle other than straight vertical. This factor played amajor role in the tolerance issues that the team experienced because the entire top wing of the aircraft is sweptback at an angle; therefore, the ribs of the aircraft must have their slots cut precisely in order to fit into the bay floorwithout twisting drastically during assembly. To remedy this issue, the team constructed a foam model in the firstsemester to test the assembly methods and tolerance calculations for the final aircraft which was constructed inthe second semester. This foam model verified the construction method used on the final design and informed theteam that the spar/bay floor construction method would yield the best results in terms of tolerancing, strength, andmanufacturing time. If any tolerancing issues came about after the development of the foam model, they couldalso be addressed using hand tools as the lightweight woods used to construct the aircraft were easily manipulatedby a dremel tool and sharp edges.
4.6. Component Integration
To end the manufacturing section of this report it is necessary to show the final component integration of how eachof the parts listed in Figure 5, as well as the electrical components were integrated into the flight-tested aircraft.This section will feature the component integration descriptions for the entire aircraft which includes the airframe,launch hook/pogo, power and electronics, controls and propulsion. Note that the components integrated in this
05/04/20 31 of 124
University of Colorado Boulder
FFR

Aerospace Senior Projects ASEN 4028
section are not reflective of the desired final aircraft as they do not include component integration which wasplanned for after the COVID-19 shutdown.
Figure 9 shows the airframe integration for the aircraft. Specifically, this shows the internal integration of thelow level system components such as the ribs, bay floor, spar, shear webs, elevon back wall, elevons, leading edge,leading edge sheeting, trailing edge sheeting and center pylon guide tubes. The four wing sections shown in Figure9 interface with the center panel via aluminum rods which keep the wings from shearing off of the aircraft. In ad-dition, the wing sections interface with the side walls via eight machine screws with cap nuts set into the outboardsections of the wing panels. Nut plates were also added to the inboard sections of the wing panels to secure thewing sections to the center panel with more horizontal security. In terms of inclusion of components, all of theplanned airframe components were integrated before the project cutoff due to COVID-19 and this was one of theprimary reasons for the success of the project even when the project timeline was cut short.
Figure 9. Wing sections showing bays used for airframe integration of various subsystem components as well as integrated elevons
The next two components integrated into the airframe to be discussed are the launch hook and pogo shownin Figure 10. As can be seen, both the launch hook and the pogo are mounted on the leading edge of the centerpylon of the aircraft. The placement of these components was estimated using simple force balance calculations,and finalized immediately before the first flight test. The launch hook was attached to the center pylon via twomachine screws and washers while the pogo was merely attached to the aircraft by a friction fit. The friction fit ofthe pogo was designed so that, in the event of the aircraft launching from the table, the pogo would keep the wingsof the aircraft at a positive angle of attack until ultimately falling to the ground upon lift off. In addition, a safetytether was added to the pogo and tied to a stake in the ground which would pull the pogo off of the aircraft just incase the friction fit did not release in time.
05/04/20 32 of 124
University of Colorado Boulder
FFR

Aerospace Senior Projects ASEN 4028
Figure 10. Launch Hook and Pogo Integration
Figure 11 shows the electronics integration and power setup for the aircraft right before the stability glide testwas performed. As can be seen, the electronic speed controller (ESC) is connected to lead wires which branchout into the wings where the batteries are housed, with additional lead wires routed down the center pylon whichprovide power to the propulsion unit on the center pylon. Note that for the actual flight test, the aircraft flewwith four batteries (two in each top wing section) where each wing bay (space between each rib) can house twobatteries. The batteries interface with the airframe using stick-on velcro strips to ensure the center of gravity of theaircraft stays in place during flight, and the battery bays are covered by two balsa wood access hatches which arefolded open for this picture.
05/04/20 33 of 124
University of Colorado Boulder
FFR

Aerospace Senior Projects ASEN 4028
Figure 11. Power and Electronics Integration
Figure 12 shows the controls integration into the airframe of the aircraft. The controls subsystem is comprisedof seven components; these being the servo, servo arm, control horn, control rod, elevon, servo mounting plateand servo lead wires. As observed in Figure 12, the servo receives power and controls signals from the servo leadwires which extend to the radio receiver in the center pylon of the aircraft. The servo has an arm which extendsthrough the monokote skin of the aircraft to a control rod which manipulates the control horn that deflects theelevon. The servo itself is mounted to a servo mount plate via adhesive and screws where the servo mount plate isattached to the bay floor via wood screws.
05/04/20 34 of 124
University of Colorado Boulder
FFR

Aerospace Senior Projects ASEN 4028
Figure 12. Controls Integration
Finally, Figure 13 presents the integration of the propulsion system on the trailing edge of the center pylon.The propulsion system is comprised of a propeller, brushless motor, motor mount, machine screws and lead wireswhich extend to the ESC. The propeller is attached to the brushless motor with a friction fit and cap nut where themotor is attached to the motor mount via four machine screws with washers and lock nuts to limit the possibilityof the motor vibrating loose during flight. The motor mount is attached to the center pylon via machine screwsand nuts at two points to ensure the security of the motor mount on the center pylon during flight.
Figure 13. Propulsion Integration
05/04/20 35 of 124
University of Colorado Boulder
FFR

Aerospace Senior Projects ASEN 4028
5. Verification and Validation
Author: All team members; individual contributions listed in Section 9Verification and validation is the process of determining the accuracy of models, as well as ensuring that the
design will fulfill the functional requirements and the levels of success defined early on in the project. Tests areessential in the verification and validation process, and several tests will be presented laying out what has beentested and what was planned to be tested, what results were gained from those tests, and how those results wereused to verify and validate the models and functional requirements of the project.
5.1. Whiffletree Test
5.1.1. Reason for Test
The whiffletree test verified the ability of the constructed wing sections to withstand the maximum expected aero-dynamic loads. It allowed for the construction of additional wing sections and for testing to progress. I practice,the test illustrated that the aircraft structure may have been over-designed and that certain modifications couldbe made to reduce the weight of the aircraft, thereby improving endurance, while still ensuring the integrity ofthe structure. Notably, just under half of the ribs could be removed from each wing while maintaining structuralstability.
5.1.2. Predictive Modeling
A single loading condition for a standalone wing section was conducted using FEA. This loading condition ana-lyzed the maximum expected flight loads, a 2.5G upwards loading during the pitching maneuver. The FEA resultsgave deformation/displacement of the wing section, as well as Von Mises stress. For deflection, Figure 14, the FEAmodeling, predicted a maximum wing deflection of approximately 1.8mm. Additionally, the resulting stresses, Fig-ure 15, in the airframe did not predict failure at this load as they did not exceed any of the yield or ultimate stressesof the materials used, even with a factor of safety (FOS) of 2 included.
Figure 14. FEA Deflection Figure 15. FEA Stress
5.1.3. Test Setup
The test was conducted using canvas straps placed over the ribs of the wing section connected to the bars usedin the ASEN 2001 whiffletree lab. The weight was distributed to approximate the loads experienced during flight,determined using a MATLAB, script which took inputs of the expected load distribution and outputs the relative barpositioning needed to simulate this load. At the bottom of the whiffletree was a bucket used to hold the weights;the dry weight of the whiffletree setup was approximately 2 lb. A sheet of graph paper with 1cm squares wasplaced behind the aircraft so that displacement could be measured. Videos were recorded from 2 different anglesto measure the displacement digitally. Figure 16 illustrates the setup of the whiffletree test.
05/04/20 36 of 124
University of Colorado Boulder
FFR

Aerospace Senior Projects ASEN 4028
Figure 16. Whiffletree Setup
Once the setup was complete, the test began by adding weights first in 5 lb increments, then 2.5 lb incrementsas the structure came closer to failure. For each increment, the wing was inspected for possible failure beforeadding more weight. For the top wing test, weight was added until failure occurred; for the bottom wing, thebucket was filled with weights before a failure occurred.
5.1.4. Data Collected
The top wing withstood 70lb of force without failure. The only significant deformation occurred in the trailing edgeof the wing, where the straps were pulling down on the edge of the wing. The displacement of the wings was under1cm, a displacement deemed negligible, and unable to be well captured due to camera resolution. Figure 17 showsthe results of the whiffletree test on the top wing section.
05/04/20 37 of 124
University of Colorado Boulder
FFR

Aerospace Senior Projects ASEN 4028
Figure 17. Whiffletree result - top wing
The bottom wing withstood 65lb of force, at which point it failed. The failure occurred with a horizontal crackat the middle of the three center ribs. Figure 18 shows the results for the bottom wing section with the damagecircled.
Figure 18. Whiffletree results - bottom wing
05/04/20 38 of 124
University of Colorado Boulder
FFR

Aerospace Senior Projects ASEN 4028
5.1.5. Data Analysis and Comparisons to Predictive Modeling
During the test, the deflection at the 2.5G load was too small to be measured with the cameras being used. How-ever, the deflections measured at the maximum loads of 60+lb f were less than 1cm. Linearly scaling the predicteddeflection at the 2.5G load up to 65lb f gives a smaller deflection than 1cm, so with respect to deflection, these pre-dictions slightly underestimated what was seen in the test.
Concerning stress, the ultimate load observed in the test compared to the defined maximum operational loadgave the wing sections a FOS of approximately 8. This factor of safety is extremely high and means two things: first,the structural design and manufacturing process are exceptionally good, and we should not expect any significantdamage during flight barring a worst-case scenario. Secondly, the structural design has been potentially over-engineered for the defined operational environment of the airframe. This was deemed not a significant concernat the time since the wing sections were not overweight. In fact, the dry weight of the airframe was almost exactlywhat had been projected by the CAD model. Since the chosen design did not come at any significant weightpenalty and gave our aircraft excellent survivability traits, a redesign was deemed unnecessary for the first flighttest. Further flights with the full 1-hour endurance requirement could have benefited from removing some ribs tomaximize weight reduction.
For failure modes, the cracking of rib sections correlates reasonably well with the FEA results. The beginning ofsome stress concentrations can be seen at these same locations on the rib sections. Overall, no unexpected failuremodes were observed, which was desirable. All of this concluded to validate the current structural design.
5.1.6. Validation
The whiffletree test partially validated Functional Requirement 3 for survivability. It demonstrated that the planecould withstand loads well beyond what was expected in flight. The final validation would have required flyingthe aircraft 10 times to see if the structure could withstand the repeated stress of multiple flights. Additionally, itmeant that the Level 1 success criteria seen previously in Table 1 was satisfied.
5.2. Thrust Test
5.2.1. Reason for Test
The thrust test verified that the thrust produced by the motor and propeller were adequate for sustained flight. Theresult confirmed the motor and propeller combination, allowed for model verification, ensured the componentswould not overheat in-flight, and allowed testing to continue.
5.2.2. Predictive Modeling
The modeling completed for the propulsion system was based on vortex lattice models produced by APC Pro-pellers, using NASA’s TAIR fluid dynamics code and the geometry of APC’s on-offer propellers. These models werethen incorporated into a MATLAB code that would, through an involved analysis process, select the most effectivepossible propulsion setup, given airframe constraints. This model would also provide predicted values for thrustand power as a function of motor RPM, thereby allowing us a nearly complete understanding of the propulsionsystem at different throttle values. A more complete description of this model is included in the FFR.
Figures 19 and 20 are examples of the predictive modeling used for the propulsion system. Note that thesemodels provide a good baseline from which to select a motor, but are limited by the lack of provisions for electricalheating and power considerations. For these, manufacturer specifications are required.
05/04/20 39 of 124
University of Colorado Boulder
FFR
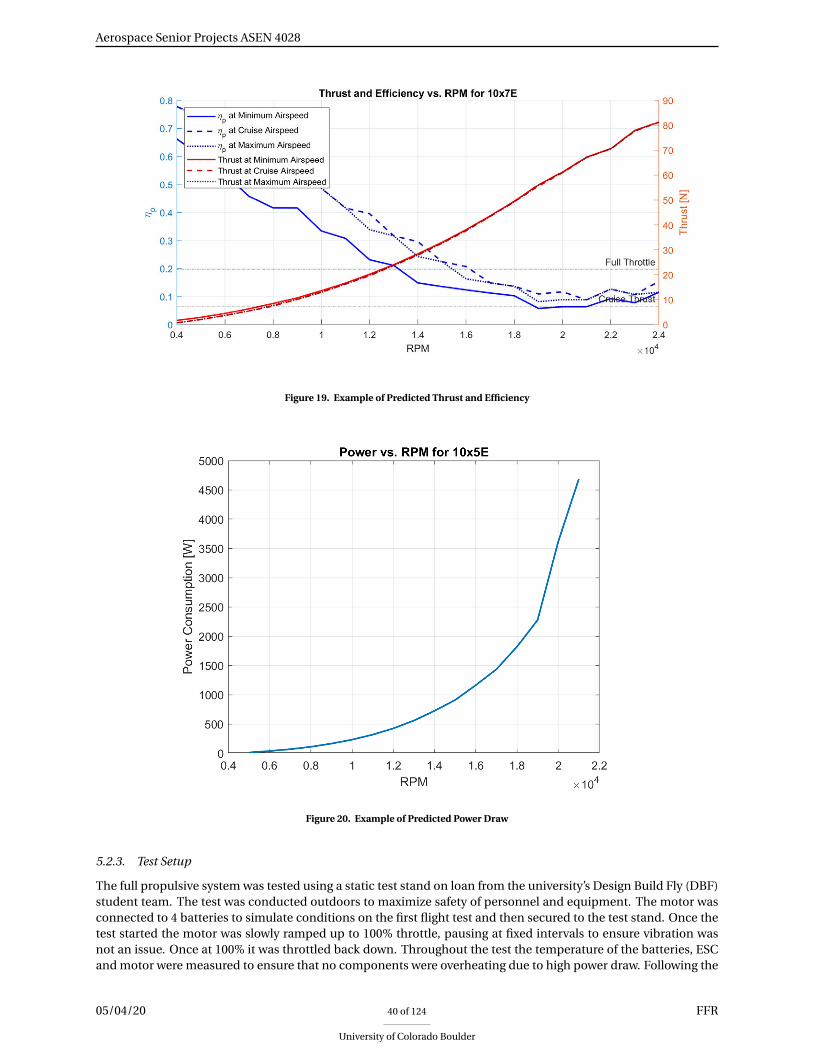
Aerospace Senior Projects ASEN 4028
Figure 19. Example of Predicted Thrust and Efficiency
Figure 20. Example of Predicted Power Draw
5.2.3. Test Setup
The full propulsive system was tested using a static test stand on loan from the university’s Design Build Fly (DBF)student team. The test was conducted outdoors to maximize safety of personnel and equipment. The motor wasconnected to 4 batteries to simulate conditions on the first flight test and then secured to the test stand. Once thetest started the motor was slowly ramped up to 100% throttle, pausing at fixed intervals to ensure vibration wasnot an issue. Once at 100% it was throttled back down. Throughout the test the temperature of the batteries, ESCand motor were measured to ensure that no components were overheating due to high power draw. Following the
05/04/20 40 of 124
University of Colorado Boulder
FFR

Aerospace Senior Projects ASEN 4028
test, all gathered data was saved and processed. The setup of the static thrust test is shown in Figure 21.
Figure 21. Thrust test setup
5.2.4. Data Collected
The DBF static thrust stand collects data for thrust, torque, current, voltage, power (both mechanical and electri-cal), RPM, vibration, and efficiency. Only a few of these were used in data analysis, though all are useful for verifyingtest accuracy. The most important aspects of the collected data are that the maximum thrust achieved is about 15N, with a maximum electrical power draw of 400 W. These values alone, ensure that the selected propulsion systemwill be sufficient to fly our aircraft. A more complete discussion of the test’s results and analysis follows.
5.2.5. Data Analysis and Comparisons to Predictive Modeling
The static thrust test results were generally in line with expectations from the predictive models, with some incon-sistencies.
Figure 22 compares the static thrust measured against that which was predicted. There is a relatively consistent2 N (12.5%) discrepancy between the two. This discrepancy arises from two possible sources. The predictive modelused a simple air density correction to account for altitude, where in reality the translation from non-dimensionalvalues should include several other terms. In addition, the vortex lattice modeling originally used to arrive atthe non-dimensional descriptive values somewhat understates the magnitude of drag forces, which could furtherexacerbate the error.
05/04/20 41 of 124
University of Colorado Boulder
FFR
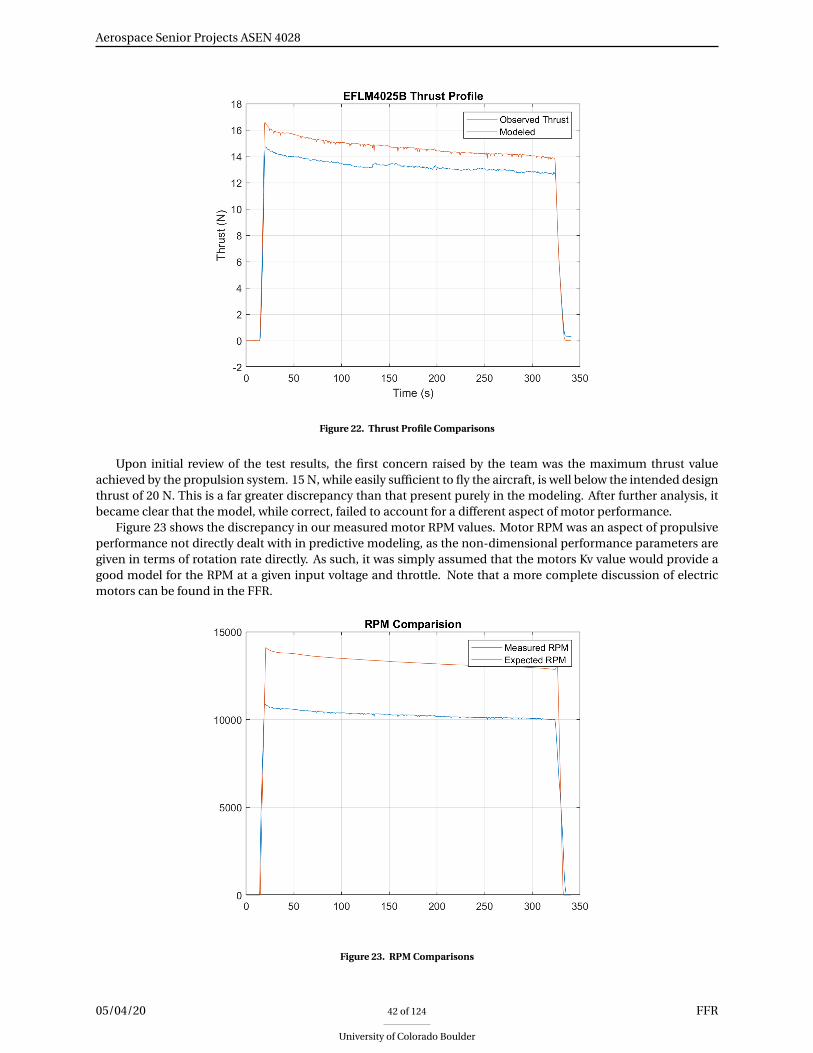
Aerospace Senior Projects ASEN 4028
Figure 22. Thrust Profile Comparisons
Upon initial review of the test results, the first concern raised by the team was the maximum thrust valueachieved by the propulsion system. 15 N, while easily sufficient to fly the aircraft, is well below the intended designthrust of 20 N. This is a far greater discrepancy than that present purely in the modeling. After further analysis, itbecame clear that the model, while correct, failed to account for a different aspect of motor performance.
Figure 23 shows the discrepancy in our measured motor RPM values. Motor RPM was an aspect of propulsiveperformance not directly dealt with in predictive modeling, as the non-dimensional performance parameters aregiven in terms of rotation rate directly. As such, it was simply assumed that the motors Kv value would provide agood model for the RPM at a given input voltage and throttle. Note that a more complete discussion of electricmotors can be found in the FFR.
Figure 23. RPM Comparisons
05/04/20 42 of 124
University of Colorado Boulder
FFR
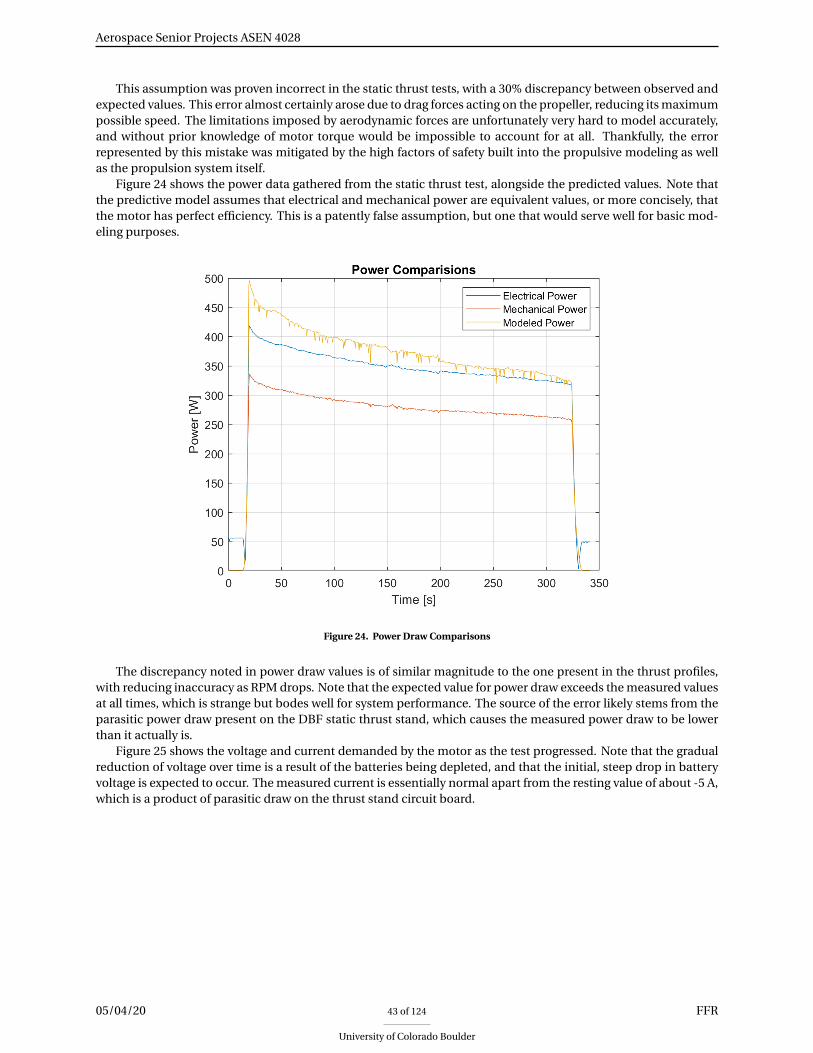
Aerospace Senior Projects ASEN 4028
This assumption was proven incorrect in the static thrust tests, with a 30% discrepancy between observed andexpected values. This error almost certainly arose due to drag forces acting on the propeller, reducing its maximumpossible speed. The limitations imposed by aerodynamic forces are unfortunately very hard to model accurately,and without prior knowledge of motor torque would be impossible to account for at all. Thankfully, the errorrepresented by this mistake was mitigated by the high factors of safety built into the propulsive modeling as wellas the propulsion system itself.
Figure 24 shows the power data gathered from the static thrust test, alongside the predicted values. Note thatthe predictive model assumes that electrical and mechanical power are equivalent values, or more concisely, thatthe motor has perfect efficiency. This is a patently false assumption, but one that would serve well for basic mod-eling purposes.
Figure 24. Power Draw Comparisons
The discrepancy noted in power draw values is of similar magnitude to the one present in the thrust profiles,with reducing inaccuracy as RPM drops. Note that the expected value for power draw exceeds the measured valuesat all times, which is strange but bodes well for system performance. The source of the error likely stems from theparasitic power draw present on the DBF static thrust stand, which causes the measured power draw to be lowerthan it actually is.
Figure 25 shows the voltage and current demanded by the motor as the test progressed. Note that the gradualreduction of voltage over time is a result of the batteries being depleted, and that the initial, steep drop in batteryvoltage is expected to occur. The measured current is essentially normal apart from the resting value of about -5 A,which is a product of parasitic draw on the thrust stand circuit board.
05/04/20 43 of 124
University of Colorado Boulder
FFR

Aerospace Senior Projects ASEN 4028
Figure 25. Voltage and Current Profiles
5.2.6. Validation
The thrust test partially validated Functional Requirement 4, ensuring that flight was possible given the motor andpropeller combination. The power and endurance test would have validated the ability of the plane to fly for onehour.
5.3. FADS Test
5.3.1. Reason for Test
Initial FADS tests verified the circuit was correctly acquiring data. Further tests would have verified accuracy ofdata, as well as the change in accuracy as the system was integrated into the aircraft.
5.3.2. Predictive Modeling
There was no proper predictive modeling conducted for the FADS system tests, as this system is fundamentallydifficult to predict or model. Later calibration of the system would have used neural networks to build relationshipsbetween raw data and desired outputs, making no attempt at deriving analytical relationships between the two.However, some analysis was done for the FADS system in the modeling phase, in order to determine the pressureport locations. This modeling involved using AVL to generate pressure gradients across the surface of the aircraftin order to find areas of high sensitivity. A more complete discussion of this modeling exists in the FFR.
5.3.3. Test Setup
The preliminary FADS circuit included an Adafruit TCA9548A multiplexer, an Arduino Teensy 3.5 microcontroller,and an Adafruit BME 280 pressure transducer. These three components were wired together the same way thefull circuit would be and code was developed to gather data from the transducer; the code was modular so addingmore transducers would be as simple as plugging them in and data collection could begin immediately. This earlytesting circuit is depicted in Figure 26 This simplified circuit proved that accurate data could be effectively collectedby this setup. Further tests would have verified transducer isolation and accurate data gathering in the completeFADS setup, with the possibility of calibration and flight verification if a wind tunnel could be secured.
05/04/20 44 of 124
University of Colorado Boulder
FFR

Aerospace Senior Projects ASEN 4028
Figure 26. Preliminary FADS circuit
5.3.4. Data Collected
The BME 280 pressure transducers gathered pressure, humidity and temperature data for the duration of the test.This data is shown in the following Figures 27, 28 and 28.
Figure 27. FADS Pressure Readings Figure 28. FADS Humidity Readings
05/04/20 45 of 124
University of Colorado Boulder
FFR

Aerospace Senior Projects ASEN 4028
Figure 29. FADS Temperature Readings
In each of these tests, the pressure transducer was put in varying conditions in order to induce changes in eachof the readings, and thus measure accuracy, sensitivity, and noise. For pressure readings, the circuit was raisedand lowered such that atmospheric pressure changed over the duration of the test. For temperature and humidityreadings, touching the transducer with a fingertip seemed to suffice for verification purposes.
5.3.5. Data Analysis and Comparisons to Predictive Modeling
As stated before, no predictive modeling was completed for this test. However, it is clear from the completedtesting is that the pressure transducer is indeed accurate, and quite sensitive to environmental changes. For ourpurposes pressure readings are the most important, and even on the scale of a few meters of altitude change, thetransducer is capable of measuring pressure differentials. This also serves as a verification of the manufacturer’sspecifications. It is also worth noting that all gathered data took up less than 200 kB on the 8 GB SD card thatwas used for storage, meaning several hours of data could feasibly be gathered, even with all pressure transducersoperational.
5.3.6. Validation
Further FADS testing would have validated Functional Requirement 2 for the development of a FADS system. Theinitial test verified that data was accurately acquired outside of the aircraft, thereby satisfying the first two levels ofsuccess for the Sensor Data category, as seen previously in Figure 1.
5.4. Controls Testing
5.4.1. Reason for Test
Controls testing encompasses multiple tests, including manual control, response to PixHawk IMU data, and au-topilot simulating a predetermined flight path; the autopilot test was not completed. The controls tests verifiedthe ability of the control surfaces to respond correctly to manual and autopilot input. Initial tests showed that thecurrent configuration did not allow the control surfaces to achieve their full range of motion, so minor changeswere made to adjust this.
5.4.2. Predictive Modeling
A linearized model was developed to analyze the stability of the aircraft using AVL. State transition matrices andcontrol input matrices were generated to simulate the dynamics of the aircraft about different flight conditions,including steady and banked flight. A MATLAB code was then used to analyze the aircraft’s behavior from thatgenerated data. Based on the requirement for the aircraft to be dynamically stable for perturbations between 0°and 10° for pitch, roll, and yaw, MATLAB simulations were performed for that range. For the iteration of the BUBO
05/04/20 46 of 124
University of Colorado Boulder
FFR

Aerospace Senior Projects ASEN 4028
used for the flight test, the model predicted that the aircraft would be statically and dynamically stable. The resultscan be viewed in Figures 30 and 31.
Figure 30. Eigenmodes of Longitudinal Dynamics Figure 31. Eigenmodes of Lateral Dynamics
Lateral Eigenmodes Longitudinal Eigenmodes
-0.0001 ± 3.8205i -0.3581 ± 0.4041i
-3.4329 -3.7016
-0.0075 -0.4823
5.4.3. Test Setup
No special facilities or materials are needed for these tests. The manual control test connected the control surfacesto the remote controller and each maneuver was tested to ensure the responses were correct. The PixHawk controltest connected the control surfaces to the PixHawk and the unit was rotated - the rotation was captured by theinternal IMU, and a signal was sent to the servos to actuate the control surfaces in response. These responses werethen compared to expectations. The final control test would have used the autopilot and ArduPilot to simulate apredetermined flight path. The elevon deflection would have been measured and compared to models.
5.4.4. Data Collected
Unfortunately, there was no measurable data that was collected as the project had to cease all testing abruptly. Thegoal was to collect data captured from a ground test with the control system as well as a flight test. That data wouldhave been used in comparison with the model results. However, since the PixHawk and therefore the telemetryradio were not integrated into the flight tested iteration of the aircraft, such quantitative data was never recorded.Instead, the only measures captured were of the Cooper-Harper ratings the pilot provided for the aircraft’s flightperformance, which can be related to controls and stability of the aircraft, but do not provide any quantitative datafor comparison.
5.4.5. Data Analysis and Comparisons to Predictive Modeling
No analysis could be performed as none of the tests were started and completed, as previously discussed.
5.4.6. Validation
While the first two controls test didn’t specifically validate any Functional Requirements, they verified that con-trolled flight was possible. The autopilot test would have validated Functional Requirement 5 for an autopilotloiter phase of flight.
05/04/20 47 of 124
University of Colorado Boulder
FFR

Aerospace Senior Projects ASEN 4028
5.5. Power/Endurance Test
5.5.1. Reason for Test
The initial test verified that power draw from the smaller number of batteries used on the first test flight was safeand that the batteries would not overheat. A further endurance test would have verified that the sixteen-batteryconfiguration planned for the later flight tests would have been able to complete a one hour flight.
5.5.2. Predictive Modeling
To fulfill Design Requirement 4.2, the aircraft must achieve an hour of endurance. In order to predict the requirednumber of batteries to achieve that endurance goal, a model was constructed to predict the battery requirementsof the aircraft, considering battery cell count, cruise velocity, and endurance required.
The endurance model requires an accurate estimation of drag on the aircraft. AVL allows computation of theaircraft’s estimated drag polar, a graph of lift versus drag. This is shown in Figure 32.
Figure 32. AVL Calculated Drag Polar
The drag polar can be defined using Equation 1.
CD = k ×C 2L +CD,0 (1)
With a parabolic fit to the calculated drag polar, the zero lift drag coefficient is found to be CD,0 = 0.039, and thelift-based elliptical coefficient, k, is found to be 0.25. With power required for flight equal to the drag force timesthe flight velocity, and the drag force equal to the drag coefficient times the wing area and dynamic pressure, thepower required for flight can be expressed with Equation 2.
Pr eq = 1
2ρU 3SCD,0 + 2W 2k
ρU S(2)
Where W is the estimation of aircraft weight, and U is the cruise velocity. Peukert’s equation, Equation 3, esti-mates the amount of time a battery will last.
t = Rt
i n
( C
Rt
)n(3)
In this equation, t is time in hours, i is current being pulled from the battery, C is the capacity of the batteryin Ah, Rt is the battery rating in hours, the discharge time over which the capacity was determined, and n is the
05/04/20 48 of 124
University of Colorado Boulder
FFR

Aerospace Senior Projects ASEN 4028
discharge parameter, which is dependent on battery type and temperature. For small LiPos, a battery rating ofone hour and discharge parameter of 1.3 can be assumed, as established by Lance Traub’s Range and EnduranceEstimates for Battery-Powered Aircraft 5. From Watt’s Law, power is equal to voltage times current, and substitutingthe current in Peukert’s battery equation results in Equation 4.
PB =VC
Rt
(Rt
t
) 1n
(4)
Finally, setting power in the battery equal to power required, along with a power efficiency term, results in theendurance relationship in Equation 5.
(Rt
t
) 1n( C
Rt
)= 1
ηtot V
[1
2ρU 3SCD,0 + 2W 2k
ρU S
](5)
Solving for endurance results in Equation 6.
E = t = Rt 1−n[
ηtot V ×C12ρU 3SCD,0 + 2W 2k
ρU S
]n
(6)
As mentioned before, to get a good estimate of endurance, a good estimate of the aircraft weight must beknown. As such, the endurance model runs iteratively to optimize the endurance for the weight of the aircraft. Thefirst run assumes the aircraft weight is just the aircraft dry weight. The needed battery weight is then added forthe next iteration and that process continues adding battery weight to the new estimated aircraft weight until itconverges to determine a good estimation of endurance and aircraft / battery weight.
With an accurate estimation of aircraft weight and drag, additional useful information can be gained from themodel. The drag condition for maximum flight endurance is given by the relationship in Equation 7.
CD,0 = 1
3kC 2
L (7)
From this, the cruise velocity for maximum endurance efficiency can be calculated. The resulting relationshipis shown in Equation 8.
UE =√√√√2W
ρS
√k
3CD,0(8)
For a pessimistic, worst-case model, to account for the many inefficiencies present in small, hobby grade air-craft electrical systems, a power efficiency of 50% was assumed. Using three cell LiPos, to hit the one hour en-durance mark, around 16 Ah of battery capacity is estimated to be required. The BUBO uses 910 mAh batterypacks to easily fit two per wing bay. The structural design allows for the ability to house even more than sixteenbatteries if needed. The calculated optimum cruise speed is found to be 11.5 m/s, which is slightly lower thanplanned cruise speed, but isn’t far off, so flight should be fairly efficient. The model estimates that sixteen batterieswould weigh 12.5 N or just under three pounds, which is about 40% of the aircraft dry weight, which is in the properrange expected for a small aircraft of this size with such a lofty endurance requirement.
5.5.3. Test Setup
This test would have taken place on the DBF static thrust test stand. The configuration for the first flight testutilized just four batteries, so four batteries were connected to the motor for this initial power test. The motorwas run at a constant thrust of 10 N for five minutes. Power consumption and temperature of the batteries wasmeasured frequently to ensure safe operation for the test and in-flight. The complete endurance test would haveused all sixteen batteries, with an attempted test duration of one hour.
5.5.4. Data Collected
As discussed in the propulsion testing section, motor thrust, torque, RPM, voltage, current, mechanical and elec-trical power, and several other values are gathered by the static thrust test stand. For the power and endurance test,the battery voltage reading is the most valuable of these, though all relevant data streams will be logged. Thrust isalso of some importance, because the voltage drop over the course of the flight may result in problems remainingairborne later in the flight.
05/04/20 49 of 124
University of Colorado Boulder
FFR

Aerospace Senior Projects ASEN 4028
5.5.5. Data Analysis and Comparisons to Predictive Modeling
Because this test was not conducted before the cutoff date, there is no data to compare our predictive models to.Nonetheless, a preliminary attempt can be made using the data gathered during the short propulsion test. Duringthis test, thrust dropped from 15 to 13 N over the course of the 5 minute test. Assuming that the full endurancetest utilizes 4 times the number of batteries used during the short test, and that 10 N is the threshold required forsustained flight, we can expect the full endurance test to continue for about 50 minutes. Taking into considerationthe fact that the short endurance test was conducted at full throttle, rather than a steady 10 N as we might expectfrom actual flight, an hour of flight time is well within the reach of our propulsion system.
5.5.6. Validation
The sixteen-battery configuration power and endurance test would have validated Functional Requirement 4 forreaching an endurance of 1 hour, as well as the related Level 3 success criteria in the Flight category.
5.6. Stability/Glide Test
5.6.1. Reason for Test
The stability and glide test verified that the aircraft was stable and controllable enough to continue on to the flighttest. A glide has much less potential for catastrophic failure than a full launch, so it was used to verify that thecenter of pressure and weight distribution allowed for longitudinal stability.
5.6.2. Predictive Modeling
The aerodynamic model produced in AVL predicted that with the minimal mass configuration used in the glide testthe stall speed was around 6.5 m/s. The center of pressure (cp) is located at 20.2 cm ahead of the trailing edge ofthe bottom wing, according to this model. By placing the 4 batteries used in the glide test as far forward as possiblethe center of gravity (cg) was balanced about this point. This means that, according to the AVL model, the glidetest configured BUBO is longitudinally stable at speeds above 6.5 m/s, and should be able to glide successfully andrespond to controls.
5.6.3. Test Setup
The test was performed in a parking lot with a smooth, straight, and slightly downhill path into the wind. Two teammembers, wearing helmets and riding on skateboards, held a tube that went through holes on the side panels ofthe aircraft allowing for free longitudinal rotation. The goal was to allow the aircraft to travel approximately levelto the ground and near or slightly above stall speed, at which point the controls could be used to pitch the aircraftto an angle of attack that provided lift. Figure 33 shows how the aircraft was supported during the glide test.
05/04/20 50 of 124
University of Colorado Boulder
FFR
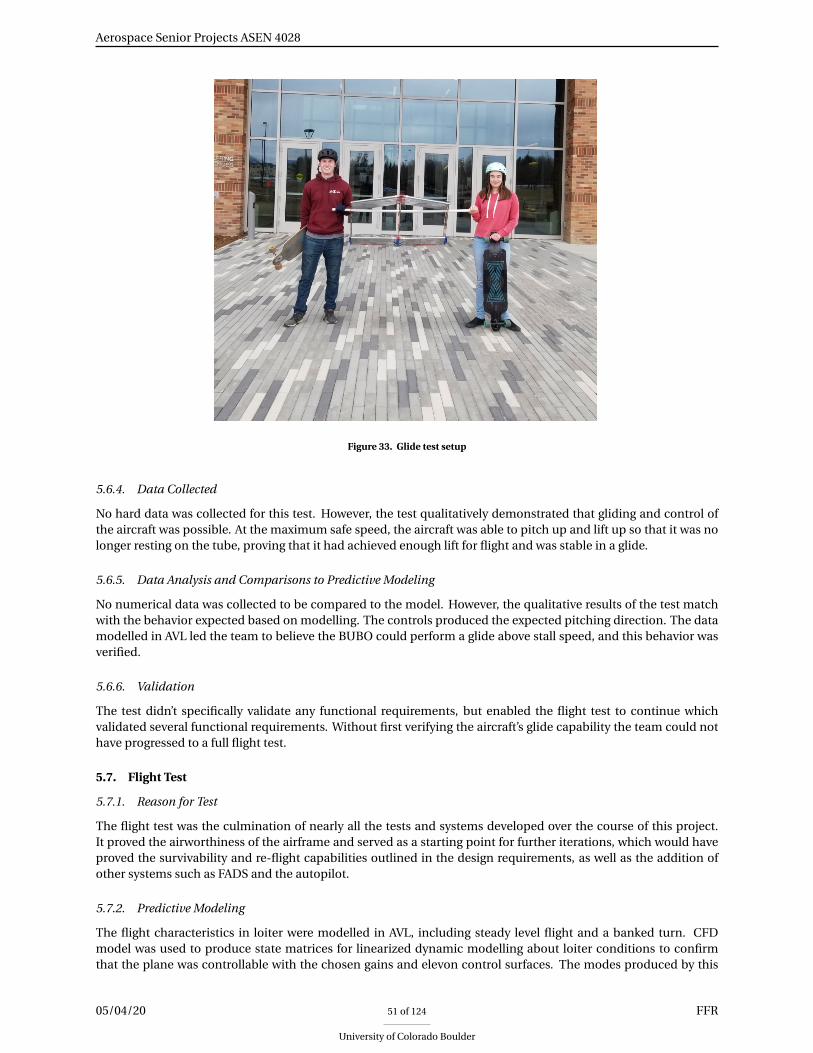
Aerospace Senior Projects ASEN 4028
Figure 33. Glide test setup
5.6.4. Data Collected
No hard data was collected for this test. However, the test qualitatively demonstrated that gliding and control ofthe aircraft was possible. At the maximum safe speed, the aircraft was able to pitch up and lift up so that it was nolonger resting on the tube, proving that it had achieved enough lift for flight and was stable in a glide.
5.6.5. Data Analysis and Comparisons to Predictive Modeling
No numerical data was collected to be compared to the model. However, the qualitative results of the test matchwith the behavior expected based on modelling. The controls produced the expected pitching direction. The datamodelled in AVL led the team to believe the BUBO could perform a glide above stall speed, and this behavior wasverified.
5.6.6. Validation
The test didn’t specifically validate any functional requirements, but enabled the flight test to continue whichvalidated several functional requirements. Without first verifying the aircraft’s glide capability the team could nothave progressed to a full flight test.
5.7. Flight Test
5.7.1. Reason for Test
The flight test was the culmination of nearly all the tests and systems developed over the course of this project.It proved the airworthiness of the airframe and served as a starting point for further iterations, which would haveproved the survivability and re-flight capabilities outlined in the design requirements, as well as the addition ofother systems such as FADS and the autopilot.
5.7.2. Predictive Modeling
The flight characteristics in loiter were modelled in AVL, including steady level flight and a banked turn. CFDmodel was used to produce state matrices for linearized dynamic modelling about loiter conditions to confirmthat the plane was controllable with the chosen gains and elevon control surfaces. The modes produced by this
05/04/20 51 of 124
University of Colorado Boulder
FFR

Aerospace Senior Projects ASEN 4028
modelling are shown in the Controls Testing section in Figures 30 and 31. All of the modes shown are negative onthe real axis, meaning the BUBO should be stable about these flight conditions.
AVL was also used to model other basic flight characteristics including a stall speed of 6.5m/s, a cruise velocityof 13m/s, and a trim angle of attack of 5 degrees. The predicted control deflection at this trim state is 1.5 degrees.The low magnitude control deflection at trim means that the longitudinal moments produced by aerodynamicforces and weight distribution are well balanced.
Based on predictive modelling of flight characteristics and control capabilities, as well as physical data col-lected in the glide test the team was confident that controlled flight was achievable.
5.7.3. Test Setup
The flight test was conducted at CU Boulder South on a breezy day. Setup consisted of setting up the tables thatacted as a ramp for the aircraft and setting up the bungie system which provided the initial acceleration to theaircraft. Once the aircraft was ready to fly and the pre-flight checklist was complete, the aircraft was launchedwith a force of approximately 45lbs - measured using a fishhook scale attached to the bungie before launch. Theaircraft climbed to an altitude of about 100 feet, at which point several maneuvers were attempted, such as bankedturns and power-off stall. Once these maneuvers were completed after about 5 minutes of flight, the aircraft wasbrought to a landing. The aircraft was then inspected for damage and an estimate for a re-flight time was given.Cooper-Harper ratings were recorded for each maneuver in order to determine which aspects of flight may havewarranted design changes. An image of the aircraft in-flight is shown in Figure 34.
Figure 34. BUBO in-flight
5.7.4. Data Collected
The plane successfully flew and landed with minimal damage; the only significant damage was to the aircraftboom, which would have taken very little time to replace. This is shown in Figure 35.
05/04/20 52 of 124
University of Colorado Boulder
FFR

Aerospace Senior Projects ASEN 4028
Figure 35. BUBO post-flight
Cooper-Harper ratings were acquired for all phases of flight as well as power-off stall, which handled excep-tionally well. The list of the Cooper-Harper ratings for each maneuver are available in Figure 36.
Figure 36. Cooper-Harper ratings for all maneuvers tested in first flight test
5.7.5. Data Analysis and Comparisons to Predictive Modeling
The flight test did not result in any numerical data to compare to modeling. The qualitative analysis provided byour pilot, Jeremy, matches with the behavior expected based on AVL and controls modeling. The low stall speedand small intrinsic pitching moment discussed earlier are consistent with the incredibly docile stall characteris-tics demonstrated during the power off stall maneuver. The BUBO slowed down before landing very successfully,which is also indicative of the low stall speed predicted by AVL. These behaviors will make the BUBO a safe, stable,and reliable platform for the FADS system.
5.7.6. Validation
The flight test partially validated Functional Requirement 3 - full validation would require 10 flights without majordamage. It also partially validated Functional Requirement 4 proving that sustained powered flight was possible -full validation would have required an hour-long flight. Further flight tests would have also validated FunctionalRequirement 2 with the FADS system integration and Functional Requirement 5 with the autopilot integration.
05/04/20 53 of 124
University of Colorado Boulder
FFR

Aerospace Senior Projects ASEN 4028
6. Risk Assessment and Mitigation
Author: Jesse Williams
This section will identify three different types of risks associated with the project, strategies that were employedto mitigate them, and how effectively those strategies reduced the risk. Risks from all aspects of the project havebeen investigated including technical, logistical, and safety risks. While many more risks were considered, only onefrom each category will be investigated in detail; the full risk matrix is available in Appendix B. A risk matrix basedon the FAA’s was used in assessing risks, with scores assigned based on the likelihood and severity of a risk/failure.A score of 1 indicates very low likelihood or a failure that has a minor impact on the project, while a score of 5is very likely or would be catastrophic to the project. Scores were assigned both before and after mitigation, todetermine the overall impact the mitigation strategy had on the risk.
6.1. Technical Challenge - Static Margin
One major technical risk faced in this project was the unstable "Tumble Mode" associated with a negative staticmargin; that is, the center of pressure was located ahead of the center of gravity. This mode was excited by a suddendeceleration in the airspeed, meaning that as the aircraft approached stall it would likely lead to a hard pitchingdown motion that would cause it to tumble and crash. Fixing this required moving the center of pressure back, thecenter of gravity forward, or both.
Initial strategies focused on minor adjustments to the design, such as moving internal components like bat-teries to shift the center of gravity, or adjusting the stagger between the wings to relocate the center of pressure.These alone were not enough to produce a positive static margin, so more significant design changes had to beconsidered. Ultimately, the decision was made to add a ballast attached to a boom, shifting the center of gravity toa predetermined location. This successfully provided a positive static margin, but it also introduced a large nega-tive pitching moment. This was corrected by changing the airfoils from Clark-Y on top and bottom to a camberedfoil on top and a reflexed foil on bottom. The new foil combination produces a positive pitching moment thatcounteracts the unfavorable weight distribution. With this, the aircraft was found to be controllable and have nounstable eigenmodes.
Figure 37 shows how the risk related to the aircraft stability changed as these mitigation strategies were em-ployed.
Figure 37. Change in risk after mitigation
6.2. Logistical Challenge - Thrust Testing
Thrust testing was initially planned to be one of the first tests conducted and seemed to be fairly straightforward.Difficulties arose when it was found that there was no easily available dynamometer for testing. Building one fromscratch would be a significant effort that the team simply did not have time for. Instead, the team turned to DBF,who had a dynamometer on hand. As it turned out, their dynamometer was not working and would take timeto repair. This issue meant that delays to propulsion testing were not short term and that plans must change to
05/04/20 54 of 124
University of Colorado Boulder
FFR
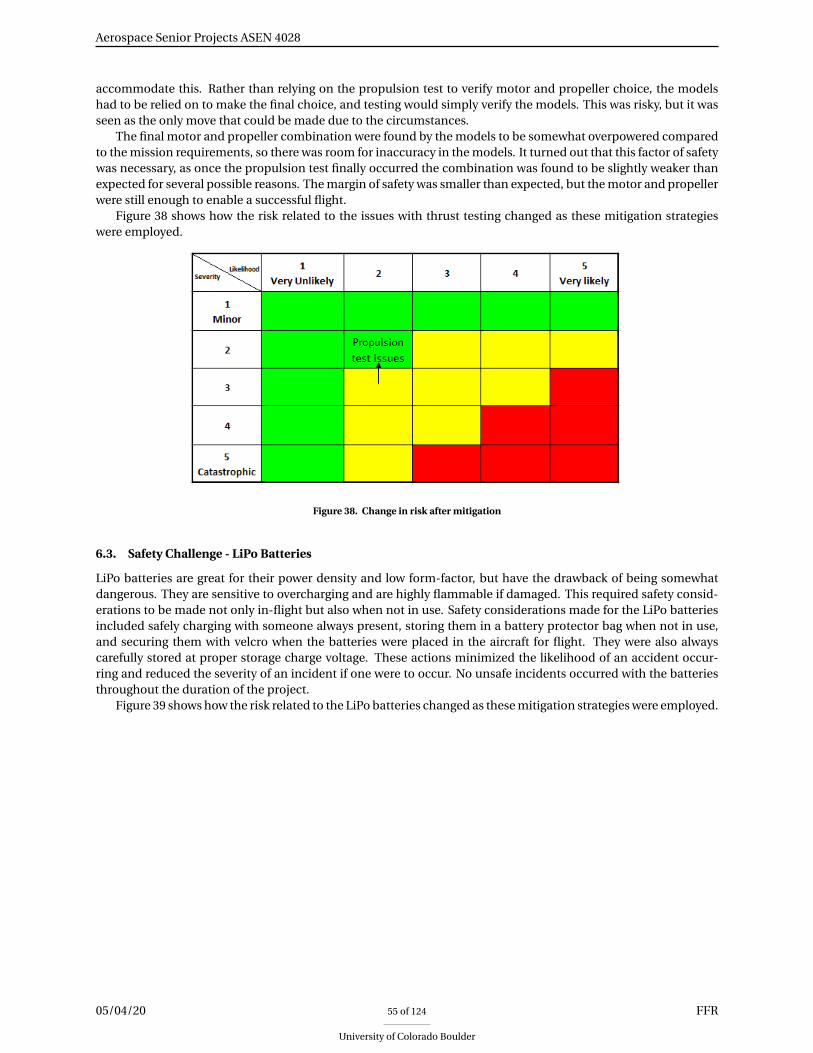
Aerospace Senior Projects ASEN 4028
accommodate this. Rather than relying on the propulsion test to verify motor and propeller choice, the modelshad to be relied on to make the final choice, and testing would simply verify the models. This was risky, but it wasseen as the only move that could be made due to the circumstances.
The final motor and propeller combination were found by the models to be somewhat overpowered comparedto the mission requirements, so there was room for inaccuracy in the models. It turned out that this factor of safetywas necessary, as once the propulsion test finally occurred the combination was found to be slightly weaker thanexpected for several possible reasons. The margin of safety was smaller than expected, but the motor and propellerwere still enough to enable a successful flight.
Figure 38 shows how the risk related to the issues with thrust testing changed as these mitigation strategieswere employed.
Figure 38. Change in risk after mitigation
6.3. Safety Challenge - LiPo Batteries
LiPo batteries are great for their power density and low form-factor, but have the drawback of being somewhatdangerous. They are sensitive to overcharging and are highly flammable if damaged. This required safety consid-erations to be made not only in-flight but also when not in use. Safety considerations made for the LiPo batteriesincluded safely charging with someone always present, storing them in a battery protector bag when not in use,and securing them with velcro when the batteries were placed in the aircraft for flight. They were also alwayscarefully stored at proper storage charge voltage. These actions minimized the likelihood of an accident occur-ring and reduced the severity of an incident if one were to occur. No unsafe incidents occurred with the batteriesthroughout the duration of the project.
Figure 39 shows how the risk related to the LiPo batteries changed as these mitigation strategies were employed.
05/04/20 55 of 124
University of Colorado Boulder
FFR

Aerospace Senior Projects ASEN 4028
Figure 39. Change in risk after mitigation
05/04/20 56 of 124
University of Colorado Boulder
FFR

Aerospace Senior Projects ASEN 4028
7. Project Planning
Author: Kaitlyn Olson, Nickolas Mororo
7.1. Organization Chart
The organization of the BUBO BUBO team is displayed in Figure 40.
Figure 40. BUBO BUBO Team Organization Chart
The project manager holds team and client meetings, keeps the team organized, facilitates communicationbetween team members, and ensures all scheduling and deadlines are upheld. The financial lead is responsiblefor the funding, budgets, and purchases of the team. The systems lead oversees the progress of each sub-team,ensuring their system can be integrated into the airframe while satisfying all the requirements laid out in Section3.2. The test and safety lead is responsible for the planning, coordination, and execution of all tests that will beused to verify the work of the technical leads. They also ensure these tests and the systems which they investigateare safe. The six technical leads, aerodynamics, structures, propulsion and FADS, electrical, software and controls,and manufacturing, are each responsible for the design of their respective subsystem. These technical leads per-form modeling, analysis, prototyping, and minor testing for the areas for which they are responsible. The workbreakdown structure in Section 7.2 provides further detail about the undertakings and responsibilities of each ofthese technical leads as they oversee the development of their critical project element. Each of the ten members ofthe BUBO BUBO team assists in areas outside of their primary focus when necessary, and together are responsiblefor all deliverables the team must submit. These deliverables are collected by the customers, Dr. Brian Argrow andChristopher Choate, and our advisor, Dr. Donna Gerren, all of whom provide relevant feedback and counseling.
7.2. Work Breakdown Structure
The work breakdown structure for Team BUBO BUBO can be found in the Figure 41. This shows a high level break-down of the work products for the team, broken into nine categories; deliverables, management, manufacturing,along with the six critical project elements (aerodynamics, structures, autopilot and controls, power and avionics,propulsion, and FADS). The status of each work product is signified by the following color code; green shows thatthe work has been completed, yellow shows that work was in progress at the time of the cutoff, and red signifieswork that was unable to be completed.
05/04/20 57 of 124
University of Colorado Boulder
FFR
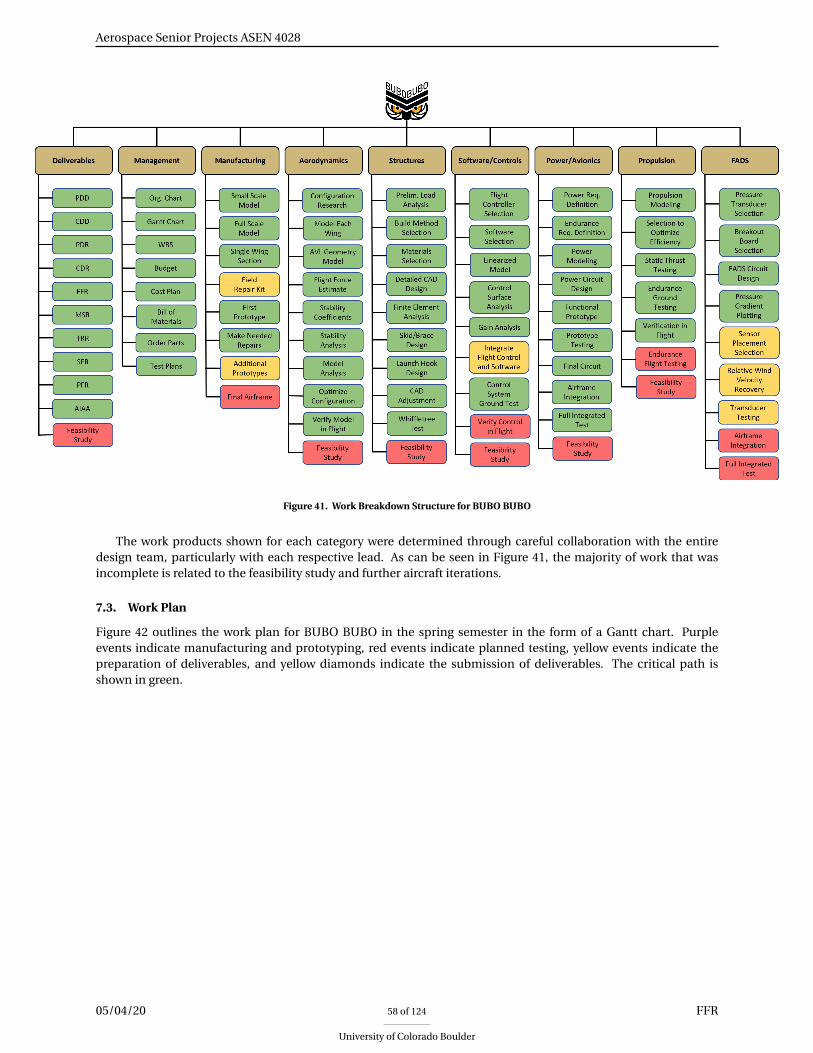
Aerospace Senior Projects ASEN 4028
Figure 41. Work Breakdown Structure for BUBO BUBO
The work products shown for each category were determined through careful collaboration with the entiredesign team, particularly with each respective lead. As can be seen in Figure 41, the majority of work that wasincomplete is related to the feasibility study and further aircraft iterations.
7.3. Work Plan
Figure 42 outlines the work plan for BUBO BUBO in the spring semester in the form of a Gantt chart. Purpleevents indicate manufacturing and prototyping, red events indicate planned testing, yellow events indicate thepreparation of deliverables, and yellow diamonds indicate the submission of deliverables. The critical path isshown in green.
05/04/20 58 of 124
University of Colorado Boulder
FFR

Aerospace Senior Projects ASEN 4028
Figure 42. BUBO BUBO work plan. Critical path is shown in green.
The nature of aircraft projects result in the majority of the work being on the critical path. In this case, thecritical path starts with wing section manufacturing.
The schedule was created using a backwards sequencing technique, starting with a goal date of completionand working backwards to establish what steps needed to be completed, when, in order for that goal completiondate to be met. During this scheduling, high risk elements and activities were identified with the systems lead andgiven due margin to ensure any mistakes or delays did not significantly impact the schedule.
05/04/20 59 of 124
University of Colorado Boulder
FFR

Aerospace Senior Projects ASEN 4028
7.4. Cost Plan
Figure 43. Final Budget Breakdown
The actual project budget turned out to be significantly less than the expected budget from the Fall Semester. Themain reason for this positive budget outcome was the team’s ability to implement cost-beneficial materials andmanufacturing methods. Furthermore, some of the required RC components were donated by team members,driving the cost further down. Through these donations and procurement from both locally based stores as wellas online suppliers, the team was able to source all the necessary parts to build new planes from the ground-up.Figure 43 shows a pie-chart with the final budget breakdown for BUBO BUBO. The team had more than enoughheadroom to construct two more iterations of the aircraft with completely independent avionics and electronicssystems. The remaining balance was to be kept as collateral to any eventuality that might happen with the subsys-tems.
Figure 44. Expected Budget Figure 45. Actual Budget
The budget for a single BUBO was also below the numbers predicted in the Fall. The primary cause of thischange in budget were the changes done to the architecture of the FADS system. The subsystem lead was ableto come up with an alternative design that saved close to 52% of the previously expected value. All this led to adecrease of approximately 25% in the total cost of a single aircraft. Finally, Figures 44 and 45, present a visual rep-resentation of the expected and the actual budgets for a single UAS. Nonetheless, these quantities did not include
05/04/20 60 of 124
University of Colorado Boulder
FFR

Aerospace Senior Projects ASEN 4028
any of the fixed costs involved in operating and/or manufacturing. Therefore, items such as the remote controllerand manufacturing tools were not accounted for. Finally, Figure 46, shows a comprehensive comparison betweenthe expected and actual cost of each one of the subsystems.
Figure 46. Total Budget Evolution
7.5. Test Plan
Figure 47 outlines the test plan for the duration of the project. All testing done occurred during the spring semester,starting in January and ending at the testing cutoff. Seven major tests were conducted: whiffletree, thrust, pow-er/endurance, controls, glide, flight, and FADS. Each test has its own color, with bars showing the duration of atask and yellow diamonds representing milestones. The critical path is shown in red.
Figure 47. BUBO BUBO test plan. Critical path is shown in red.
All testing was conducted on campus at the University of Colorado Boulder, with all but the flight test occurringon East Campus. The flight test was conducted at CU Boulder South with permission and advisement from CUDirector of Flight Operations Dan Hesselius.
05/04/20 61 of 124
University of Colorado Boulder
FFR

Aerospace Senior Projects ASEN 4028
8. Lessons Learned
Over the course of the past year, the team encountered a myriad of problems and challenges in all aspects of theproject. From these difficulties, many important lessons were learned, from general engineering projects perspec-tives, as well as lessons specifically relating to certain project disciplines, such and systems engineering and projectmanagement.
One of the biggest lessons learned in this project was the importance of correctly using a top-down designapproach from the very beginning of the design. This lesson came from the multitude of issues and delays thatresulted from the necessity for a change in airfoils at a late stage in the design process.
In the initial design phases, the team had neither the knowledge nor the access to proper modeling tools (suchas Computational Fluid Dynamics, or CFD, software) to conduct a formal trade study on airfoil shapes. Therefore,we followed recommendations from experts such as Dan Hesselius, CU’s Director of Flight Operations, and ini-tially selected a Clark Y airfoil. This particular airfoil was selected due to its flat-bottomed nature providing ease ofmanufacturing, while still providing adequate lift to sustain flight for an aircraft with similar wing area and charac-teristics to the BUBO. For these reasons, the Clark-Y is extremely common in aircraft projects, especially in UAVs.Other airfoil shapes were considered only in a passing manner, as the team had little tangible information outsideof this expert input and simple two-dimensional lift calculations to form a basis for the decision. Therefore, theClark-Y airfoil shape was hard-coded into the initial aircraft structural model, and used as the highest level of a topdown geometric design, with all subsequent designs and modeling based off of this shape.
As the fidelity of aerodynamic modeling increased with the use of AVL, it became obvious that the aircrafthad serious longitudinal stability issues in the form of an easily excitable, highly unstable mode. As discussed inSection 6.1, this risk was mitigated by adding a ballasted boom to the front of the aircraft to shift the CG forward,thereby making the static margin positive and the aircraft longitudinally stable. This effectively eliminated the riskof exciting this unstable "Tumble Mode"; however, it presented its own problem in the form of an unfavorablenegative pitching moment that was too strong for the control system to properly address. This problem couldnot be addressed with any sort of further mass redistribution, and after thorough investigation it was decidedthat the best option moving forward would be to change the airfoils on both the top and bottom wings, to therespective cambered NACA 6412 and reflexed NACA 23112 foils seen in the final design. While this solution didgive the aircraft a naturally neutral pitching moment with minimal control input, it presented a major problemfor the structural modeling of the aircraft, as the initial airfoil was defined assuming it would not be changed. TheClark-Y had become so embedded in the geometry of all structural members in the CAD model that changing theshape caused all previous associations, and therefore the entire geometry of the aircraft, to break. The team had todevote a significant amount of work through a series of strictly defined change control processes over the courseof a month to redefine all necessary structural and CAD models before manufacturing could begin.
From this mishap, it became glaringly obvious how important high level adaptability is when implementingsuch a top down design. With the entire design dependent on this top level, it is imperative that lower level designdependencies are defined such that any changes made to the top level do not compromise the references used bylower level components of the design. This was not the case in the first iteration of design, and the team ensuredthat every iteration thereafter had easily altered defining qualities (such as airfoil shape) at all levels.
Another key lesson learned came from the management of the team’s schedule, which is most pertinent to themanagement of the project itself. In the first semester, the schedule was fairly loosely defined due to the fact thatmost work at this time was purely theoretical and therefore hard to set many tangible deadlines for beyond fullcompletion of tasks. As the second semester began, however, more regimented scheduling practices were put inplace is ensure project success.
The aforementioned airfoil change was a very large catalyst for this shift in scheduling philosophy. As the firstsemester ended, the team was faced with the daunting task of finishing any remaining design work while simulta-neously reworking the structural design laid out in the original CAD to fit the new geometric constraints. Almosthalf of the team was needed to complete the reworking of the CAD, and as such, the rest of the team had to be farmore efficient with their design work to support the project’s progress. This was accomplished by organizing alltasks left to be completed and planning them out on an extremely detailed, day-to-day basis. This took consid-erable effort, as previous scheduling iterations had far less definition, but ultimately allowed for the team to stayon track and hold better accountability. With this level of detail in place, it was far easier to adjust the scheduleshould delays arise. Additionally, if a task was finished earlier than planned, those team members who otherwisewould have been working on that task could be assigned to help with other work, thereby helping to acceleratethe schedule. This was especially important towards the end of the project testing window, as having a clearly laidout plan made fast tracking tasks much easier when it became obvious that a COVID-19 related cutoff was immi-nent. This ability to quickly reschedule and track necessary tasks was instrumental in the team’s successful flight
05/04/20 62 of 124
University of Colorado Boulder
FFR

Aerospace Senior Projects ASEN 4028
testing before the cutoff, and highlighted the importance of having all key workflow processes fully defined in theschedule.
Outside of the management and systems side of the project, perhaps the most important general engineeringlesson learned from this design process was to not let the design process be overly influenced by those outsideof the customer and design team, and on a similar vein, not relying heavily on similar outside entities. Designdecisions should ultimately be up to the team so long as they satisfy the requirements defined by the customer,and such decisions should be finalized based on confidence of the team, not input from others unfamiliar with theproject.
Throughout the project, the team received push back from members of the PAB with regards to flight testingwithout first modeling and testing the aircraft in a wind tunnel. Multiple attempts were made to satisfy this request,but ultimately the team was barred from utilizing any wind tunnels of the size needed to complete the desiredtesting. Instead, the team opted for a manual glide test, as described in Section 5.6. Though wind tunnel testing wasstill recommended by PAB members, and those in charge of wind tunnel operations were very much made aware ofthese requests, access was still not made available. At this point, the team decided to proceed with flight testing dueto a shared sense of confidence in the extensive glide testing and CFD modeling accomplished. All work pointedtowards successful flight being achievable, and thus the team proceeded despite not getting the verification ofwind tunnel testing. As evidenced by the overwhelming success of the completed flight test, particularly in thesteady loiter portion of the flight profile, this confidence was well founded, and though it would have added to theverification process, the team felt entirely justified in not using a wind tunnel.
A somewhat similar situation occurred with the static thrust test stand. The department did not have a workingtest stand at the beginning of the year, although it was made very clear that some sort of thrust testing would beneeded for verification before flight testing could take place. The team agreed with this assessment; however, locat-ing a working test apparatus still proved incredibly challenging. Eventually, the DBF team at CU was kind enoughto allow for use of their test stand, although there was assumed to be an issue with the data collection board, asdiscussed in Section 5.2, that resulted in the observed thrust data being negatively offset from the predicted curveobtained through extensive modeling. The team was assured that the test stand’s manufacturer would diagnoseand recommend a fix for the issue, however this fix never came to fruition. It was then decided as a team that themodeling, coupled with data from the motor and propeller suppliers, provided an accurate enough prediction toproceed with flight testing using the selected propulsive setup. This confidence was further backed up by the sim-ilarities in the profiles of the thrust curves, and the problem with the test stand was narrowed down to an issue inRPM reporting, which would lead to a purely translational offset. Finally, it was determined that even if the thruststand was properly recording data and all modeling was off, the motor still produced adequate thrust to sustainflight, albeit with a slight efficiency penalty.
Using these conclusions, the team proceeded with flight testing without having absolute agreement betweenthe predicted and observed thrust values. This decision was not without push-back, as the PAB expressed concernsabout uncertainties in the propulsion system. Ultimately this was no issue, again as evidenced by the total successthat was flight testing. This only further drove home the point that ultimately design decisions are up to the projectteam, and although the advice from outside sources, such as non-advisory members of the PAB, should be dulynoted and considered, it should not always be taken as an absolute requirement.
Thanks to the team’s ability to quickly apply lessons they have collectively learned, these lessons truly didhelp make the project into an overwhelming success. Effective top down design, efficient and well documentedscheduling, an independent found sense of confidence in the team’s abilities, and many more small lessons learnedalong the way were all paramount in the ability to finish the project in a successful manner, even when the timelinewas drastically reduced due to the threat of COVID-19. These lessons are applicable to engineering projects farbeyond the confines of this course, and can be applied throughout engineering careers. As such, these lessons willhelp guide the members of this team towards success in life, much as they did for this project.
05/04/20 63 of 124
University of Colorado Boulder
FFR

Aerospace Senior Projects ASEN 4028
9. Individual Report Contributions
Bellerjeau, Charlotte:
• Aerodynamic Design
• Stability Test Modelling
• Flight Test Modelling
• Static Margin Risk Assessment
Fendel, Andrew:
• Objectives
• Functional Requirements
• Design Requirements Flowdown
• Lessons Learned
• General editing of every section
Fitton, Keaton:
• Airframe Design
• Whiffletree Test
Gabrielle, Ethan:
• Mechanical Manufacturing
• Manufacturing Challenges
• Component Integration
Krarti, Karim:
• Thrust Testing
• FADS Testing
• Endurance Testing
Mororo, Nickolas:
• Cost Plan
• Review and Corrections
Olson, Kaitlyn:
• Project Purpose
• Objectives
• Functional Requirements
• Concept of Operations
• Trade Studies
• Design Requirements Flowdown
• Organization Chart
• Work Breakdown Structure
05/04/20 64 of 124
University of Colorado Boulder
FFR

Aerospace Senior Projects ASEN 4028
• Work Plan
• Test Plan
• General editing of every section
• General outlining of every section
Said, Seif:
• Final Design - Control system
• Software Manufacturing Scope
• Controls Testing
Williams, Jesse:
• Risk Analysis
• Test Scheduling
• Test Cards/Checklists
Yanowitz, Jeremy:
• Electrical Design
• Electrical Manufacturing
• Electrical Testing
• Flight Testing Pilot
05/04/20 65 of 124
University of Colorado Boulder
FFR

Aerospace Senior Projects ASEN 4028
References
[1] Matweb Material Property Database, http://www.matweb.com/
[2] Data, B. A., “Flush Airdata Sensing,” Basic Airdata Available: http://www.basicairdata.eu/knowledge-center/measurement/flush-airdata-sensing/.
[3] Laurence, R. J., and Argrow, B., “Flight Results from a Small UAS Distributed Flush Airdata System,” 9th AIAAAtmospheric and Space Environments Conference, Feb. 2017.
[4] Quindlen, J., and Langelaan, J., “Flush Air Data Sensing for Soaring-Capable UAVs,” 51st AIAA Aerospace Sci-ences Meeting including the New Horizons Forum and Aerospace Exposition, May 2013.
[5] Lance W. Traub,Embry-Riddle Aeronautical University. “Range and Endurance Estimates for Battery-PoweredAircraft.” Journal of Aircraft, 22 May 2012, https://arc.aiaa.org/doi/abs/10.2514/1.C031027.
[6] Etkin, Bernard, and Lloyd Duff. Reid. Dynamics of Flight: Stability and Control. Wiley, 1996.
[7] Theodore. A. Talay. Langley. Research Center. "Introduction to the Aerodynamics of Flight", NASA SP-367,(1975)
[8] Barcala, M., Cuerno-Rejado, C., "Experimental Investigation on Box-Wing Configuration for UAS" 26th BristolInternational Unmanned Air Vehicle Systems Conference, (2011)
[9] Gall, Peter, D., "An Experimental and Theoretical Analysis of the Aerodynamic Characteristics of a Biplane-Winglet Configuration" NASA Technical Memorandum 85815, (June 1984)
[10] Martinez, M., Cuerno, C., "Preliminary Aerodynamic Investigation of an Unmanned Box-wing Aircraft" 28thInternational Congress of the Aeronautical Sciences, (2012)
[11] Kang, Hantea, Genco, Nicola, "Gap and Stagger Effects on Biplanes with End Plates" 47th AIAA AerospaceSciences Meeting, (January 2009)
[12] “XFLR5.” XFLR5, SourceForge, 7 July 2019, https://sourceforge.net/projects/xflr5/.
[13] Kroo,I., "Nonplanar Wing Concepts for Increased Aircraft Efficiency" VKI lecture series on Innovative Config-urations and Advanced Concepts for Future Civil Aircraft (2005)
05/04/20 66 of 124
University of Colorado Boulder
FFR

Aerospace Senior Projects ASEN 4028
Appendix A: Trade Studies
This section detailed the preliminary design work performed by the team in order to determine the overall design.This design phase was mainly completed through ten comprehensive trade studies, which resulted in the overallbaseline design that has been continued on throughout the semester. Following is a detailed look at each of thesestudies, broken up by the corresponding critical project element that each investigation falls under. For each tradestudy, the designs will be explained, along with a table of pros and cons. The exact method, weighting, and resultsof each respective study will then be reported, and the final design selection given.
Aerodynamics and Stability
Wing Configuration
The range of wing configurations considered reflect several variations in wing sweep and shape. Other variationsin configuration such as stagger, gap, and decalage have been researched, but were not decided on at this phase inthe design process.
Delta Wing
The delta wing has a pentagonal shape and is most distinct from the others in its low relative aspect ratio, as seenin Figure 48. As a result, this configuration is expected to experience more drag. This delta wing was also used inthe Eagle Owl designed by team SCUA in 2013, which is referred to among other things in the pros and cons, Table2.
Figure 48. Sample Delta Wing Design
Table 2. Delta Wing Pros and Cons
Pros Cons
- Sweep adds lateral stability
- Flight heritage with SCUA
- Previous FADS research
- Most internal volume for other systems
- Structural stability
- Lower aspect ratio for given span
- Excess surface area adds drag
- High drag coefficient at low speeds
- Potential for increased flow
interaction between wings
Reflected Sweep
The reflected sweep design, shown in Figure 49, features a top wing with negative sweep and a bottom wing withpositive sweep. This configuration has been proven by CFD analysis and wind tunnel testing in research at otheruniversities to have high stability and relative lift coefficients. The main disadvantage in this design is the presenceof multiple pointed corners, each of which introduces vulnerability to the structure. These and other factors arelisted in the pros and cons of Table 3.
05/04/20 67 of 124
University of Colorado Boulder
FFR

Aerospace Senior Projects ASEN 4028
Figure 49. Sample Reflected Sweep Design
Table 3. Reflected Sweep Pros and Cons
Pros Cons
- Sweep variation adds lateral and longitudinal stability
-Decreased interaction between wings increases lift
- Low structural stability
- Complex manufacture
- Difficult system (propulsion) integration
Straight Wings
The straight wing configuration seen in Figure 50 has a rectangular form most noted for its simplicity. This designwas selected by team ARES last year. Although this configuration may be advantageous for manufacturing, it posessevere challenges for the flight stability of the aircraft. These and other pros and cons are listed in Table 4.
Figure 50. Sample Straight Wing Design
Table 4. Straight Wings Pros and Cons
Pros Cons
- Ease of manufacture
- Project heritage with ARES
- Ease of aerodynamic modelling
- Structural stability
- Low aerodynamic stability
- Lack of existing data on
flight characteristics
05/04/20 68 of 124
University of Colorado Boulder
FFR

Aerospace Senior Projects ASEN 4028
Single Sweep
The single sweep design has a top wing with negative sweep and a straight bottom wing, as visualized in Figure 51.It has the stability advantages that come with a change in sweep angle between the two wings, and the structuralsimplicity of one straight wing. This option reaches a compromise between several different project priorities,which can be seen in the pros and cons of Table 5.
Figure 51. Sample Single Sweep Design
Table 5. Single Sweep Pros and Cons
Pros Cons
- Sweep variation adds lateral and longitudinal stability
-Straight wing adds simplicity of manufacture and system
integration
- More wing interaction than diamond at tips
- Low internal volume
- Structural vulnerability at tip of top wing
Symmetric Sweep
The symmetric sweep design shown in Figure 52 features two identical negative swept wings, staggered apart pos-itively. It has the lateral stability advantages of a swept wing, but lacks the longitudinal stability granted by a dif-ference in sweep angle between the two wings. It also has the manufacturing benefit of two identical wings. Thesefactors and others are listed in the pros and cons of Table 14.
Figure 52. Sample Symmetric Sweep Design
05/04/20 69 of 124
University of Colorado Boulder
FFR

Aerospace Senior Projects ASEN 4028
Table 6. Symmetric Sweep Pros and Cons
Pros Cons
- High aspect ratio for given span
- Sweep adds lateral stability
- Low wing interaction with constant chord along span
- Less longitudinal stability due to same sweep
- Structural vulnerability at tip of top wing
Wing Configuration Trade Study
Criteria
The criteria for this trade study include flight performance, structural integrity, systems integration, and manu-facturability. These were chosen as each factor in itself can cause the mission to fail if it is neglected, and eachstands alone as a distinct requirement for the airframe. The flight performance score will be based on the stabilityand relative aerodynamic performance of each design. These evaluations will be based on outside research con-ducted on box wing aircraft configurations and shapes. The structural integrity portion will be assessed based onthe simplicity and the number of potential failure points. Systems integration scores indicate the ease with whichother subsystems can be installed effectively on the airframe, such as electronics and sensors inside the airframe,or propulsion systems on the wing. Finally, manufacturability is based on how easy it will be to construct the pro-posed design, which will be a deciding factor in the delivery of a successful product. The weighting for each ofthese categories is shown in the following Table 15.
Table 7. Weighting of Trade Criteria
Criterion: Flight Performance Manufacturability Structural Integrity System Integration
Weight: 0.35 0.15 0.30 0.20
Flight Performance - The scoring for flight performance is based on research performed in the past century onbox wing performance while selectively varying a few key parameters including relative sweep, aspect ratio, andstagger, and is shown in Table 8. CFD analysis of several box wing configurations indicates the most longitudinalstability and lift when the wings have a sweep differential of 30 degrees or more. Lateral stability is increased withthe addition of negative sweep. These and other design characteristics that demonstrate higher lift coefficients,lower induced drag, and more stability have received the highest scores and the rest of the scores were assignedrelatively.
Table 8. Flight Performance Scoring Definition
Flight Performance
(Similarity to Theoretical
Ideal Characteristics):
Least Similar Moderate Similarity Most Similar
Score: 1 2 3 4 5
Manufacturability - The criteria for scoring this category is based on the perceived complexity of each design.Assuming the construction method is the same for each, the score is based on estimated time and resources forconstruction. If the manufacturing techniques are the same for each design the new skills that will need to beacquired and cost of materials are about the same, so the only difference is in the actual construction time anddifficulty. It is possible that with damage to the aircraft during testing, a reconstruct or repair may be required, sothis time difference could be compounded over the course of the year. The scores are assigned relatively for thissection as well due to the difficulty in giving a precise time estimate at this stage in the design process, as shown inthe following Table 9.
Table 9. Manufacturability Scoring Definition
Manufacturability
(Relative Predicted Manufacturing Time):Most Time Moderate Time Least Time
Score: 1 2 3 4 5
05/04/20 70 of 124
University of Colorado Boulder
FFR

Aerospace Senior Projects ASEN 4028
Structural Integrity - As complex structural analysis cannot be performed on each model in a timely manner,the scoring of structural integrity is based on simplicity of the required structural design and the number of per-ceived points of failure relative to the other design options being considered. Since the scoring is from one to fiveand there are five design options being considered, the worst design is assigned a one and the best a five, with theremaining design options falling in between, as shown in Table 19.
Table 10. Structural Integrity Scoring Definition
Structural Integrity: Highest Moderate Lowest
Score: 1 2 3 4 5
System Integration - Since a box-wing configuration implies that there is no fuselage to house the avionics andbattery components inside of, these components will have to be housed inside the airframe itself. The scoring wasdefined by the number of straight wing sections and the internal space inside of the wing, and is given in the fol-lowing Table 11. This is driven by the assumption that a straight wing will more easily accept avionics componentswithin the airframe, and that a larger wing allows for more internal space for components.
Table 11. System Integration Scoring Definition
System Integration
(Relative Simplicity and Internal Volume):Most Moderate Least
Score: 1 2 3 4 5
Delta Wing Scores
Flight Performance: 2 - The high degree of overlap between the two wings, assuming the stagger is set to one chordlength, means that less lift will be generated overall. In addition, the increased area will lead to more drag than theother designs with the same span.
Manufacturability: 3 -The wings are the exact same shape for this configuration, which would make manufac-turing inherently easier. However, the swept shape as well as the added material increase the complexity and timerequired. The balance of these two factors gives the delta wing a moderate score.
Structural Integrity: 5 - The delta wing configuration not only consists of two wing sections that both allowfor continuous spars across the entire wingspan (unlike a swept wing), but it also adds more volume to the wingsections and therefore more internal structure. This is demonstrated with this design more than the other designoptions, therefore this design received the highest score.
System Integration: 4 - The increased internal volume is the largest positive factor for system integration in thiscase. This shape would have the most space inside the wing for housing other components.
Straight Wing Scores
Flight Performance: 1 - This design is predicted to have the least stability, based on the lack of sweep, or relativesweep differential between the two wings. This also decreases the expected lift coefficient for the straight wingdesign.
Manufacturability: 5 - The straight wing would be the most simple and least time consuming design to man-ufacture. The cross section of the wing would be the same along the span of both wings, greatly simplifying themanufacture and construction.
Structural Integrity: 4 - The straight wing configuration allows for continuous spars to span across the entirewingspan of both wings. Unlike the delta wing, the straight wing has less wing volume near the centerline andtherefore less internal structure, such as ribs and spars, to stiffen the structure. The only clear points of potentialfailure are at the wingtips where they connect to the end panels, therefore this design is second best and receives ascore of four.
System Integration: 3 - The straight wing received a high score for system integration based on the apparentsimplicity of integrating the propulsion system. A propeller or propellers could be placed at any point along thewings with the same distance to the center of gravity. The propulsive forces for this configuration would be theeasiest to balance. However, the internal volume would be less than most of the other designs.
05/04/20 71 of 124
University of Colorado Boulder
FFR

Aerospace Senior Projects ASEN 4028
Reflected Sweep Scores
Flight Performance: 5 - The reflected wing allows for optimum variation in sweep angle between the two wingswhich maximizes the theoretical lift coefficient and longitudinal stability. This wing configuration is the theoreticalidealized design for a box wing arrived at by several research studies utilizing both CFD analysis and wind tunneltesting.
Manufacturability: 2 - This design received the lowest score for manufacturability based on the added com-plexity of sweep and having two different wings to build. The combination of these two factors makes this the mostdifficult wing to build in terms of time and complexity, which adds the potential for error and more lost time.
Structural Integrity: 2 - The reflected sweep configuration introduces several potential points of failure, partic-ularly along the centerline where the sweep transitions. Because there are no straight wing sections, there can beno continuous spars spanning the entire wingspan. With this considered, it is still a design better than the sym-metric sweep configuration because this results in a greater positive stagger along the centerline. This is ideal forlanding scenarios because it allows for a more distributed landing skid across the airframe, thus resulting in lessconcentrated forces.
System Integration: 2 - The lack of a straight wing section and the greater influence of stagger on the distancebetween the wings makes propulsion integration the most difficult for this design. In addition, the integration ofthe FADS system is made more difficult by the complex angles of the design and the lack of available research onoptimum pressure port placement.
Single Sweep Scores
Flight Performance: 4 - The Single sweep has the advantage of a sweep differential between the two wings whichprovides more lift and longitudinal stability. The sweep on the top wing adds lateral stability, which is reinforcedwith positive stagger, because the top wing is he first to interact with the airflow. This combination of flight perfor-mance features is a slightly more moderate version of the ideal case presented in the reflected sweep design.
Manufacturability: 4 - A straight wing planform is the simplest design to manufacture. Having only one sweptwing and one straight wing simplifies the manufacturing process.
Structural Integrity: 3 - The single-sweep design has the favorable stability from a straight wing along the bot-tom. While the centerline on the top wing introduces a potential point of failure, it is a good middle-of-the-roadoption that still minimizes potential failure modes.
System Integration: 4 - As with the other categories, a straight wing on the bottom allows for simple bays to bemade within the wing sections for housing components. In addition, the swept top wing gives more clearance forthe propulsion system to be potentially located between the wings along the centerline.
Symmetric Sweep Scores
Flight Performance: 3 - This design received a moderate score. Some sweep is more laterally stable than no sweep,but it lost points because of the increased flow interference between the two identical wings.
Manufacturability: 3 - While a swept wing is more complex than a straight wing, having both the top andbottom wings be an identical or near-identical design would help simplify the manufacturing process.
Structural Integrity: 1 - Having no straight spars across the span of the aircraft leads to more potential foraeroelasticity issues, specifically with the swept wing sections bending back and inwards towards the centerline.Additionally, both wings have points of higher potential failure along the centerline where the sweep transitions.
System Integration: 3 - Integrating avionics components into a swept wing is not much different from a straightwing, however the shape of the bays is now more constrained to the sweep of the wing. This design also lends itselfto a pusher-propeller configuration due to the negative space behind the wings along the centerline.
Scoring Summary
The results of the Wing Configuration trade study in Table 12 show that the Single Sweep configuration is the bestdesign option of those considered. Moving forward, this will be the base airframe configuration that both scaledversions of the aircraft will be designed from.
05/04/20 72 of 124
University of Colorado Boulder
FFR

Aerospace Senior Projects ASEN 4028
Table 12. Wing Configuration Trade Study Matrix
Delta
Wing
Straight
Wing
Reflected
Sweep
Single
Sweep
Symmetric
Sweep
Evaluation Criteria Weighting Score Score Score Score Score
Flight Performance 0.35 2 1 5 4 3
Manufacturability 0.15 3 5 2 4 3
Structural Integrity 0.3 5 4 2 3 1
System Integration 0.2 4 3 2 4 3
Total Score (Normalized to 5) 3.45 2.9 3.05 3.7 2.4
Boom Configuration
The boom configuration trade study includes the location and number of booms used to address the negativestatic margin problem. This decision is also affected by the amount of ballast required to balance the plane. Wehave assumed a fully loaded scenario for the sake of this trade study and have included an range of ballast masses.After choosing a boom configuration a ballast mass will be selected in pre-flight preparation based on the prioritiesof each individual flight test.
One Centered Boom
This design choice includes a single boom attached to the center pylon directly underneath the top wing with aweight at the end. The single
Figure 53. Single Centered Boom Design Concept
Table 13. Single Boom Pros and Cons
Pros Cons
- Simpler construction
- Less required boom projection
- Less total added mass
- Greater mass on end of boom
- Possible air data disruption
Two Booms Attached to Side Walls
The double boom design features one boom attached to each side wall with a ballast at the end of each boom. Thepotential benefits are less mass required on the end of each boom, meaning less vibration potentially making theaircraft unstable. The motivation behind this proposed design is to create a corridor of completely undisturbedairflow for the FADS sensors.
05/04/20 73 of 124
University of Colorado Boulder
FFR

Aerospace Senior Projects ASEN 4028
Figure 54. Double Boom Design Concept
Table 14. Two Booms Pros and Cons
Pros Cons
- Cleaner air data
- Less mass on end of boom
- More total added mass
- Greater boom projection
Boom Configuration Trade Study
Criteria
The criteria for this trade study include required mass, boom projection, data interference, and vibration potential.These factors are most likely to interfere with the performance of the aircraft as a whole. All additional mass willincrease demand on the power system and decrease endurance, while making takeoff and landing more difficult byraising the stall speed. Boom projection effects the performance of the aircraft by making it structurally unsoundand more likely to sustain damage on landing. Data interference is a priority for our customer, who would like theFADS system to be as undisturbed as possible. Finally, vibration caused by the ballast may lead to or exacerbateunstable behavior in flight, so it should be minimized. The weighting of each of the criteria is shown in the tablebelow.
Table 15. Weighting of Trade Criteria
Criterion: Boom Projection Total Added Mass Data Interference Potential Vibration
Weight: 0.25 0.30 0.30 0.15
Boom Projection
The amount of boom projection in front of the top wing should be minimized to reduce vibration. Some projectionis good because it will absorb shock on landing, but too much will be structurally unsound and aesthetically dis-pleasing. This criteria is evaluated base on calculating the required boom length and accounting for the mountinglocation to determine how much of the dowel is projecting in front of the plane, This is done for multiple fixedballast weights.
Table 16. Structural Integrity Scoring Definition
Boom Projection: Most Moderate Least
Score: 1 2 3 4 5
05/04/20 74 of 124
University of Colorado Boulder
FFR

Aerospace Senior Projects ASEN 4028
Added Mass with Fixed Ballast
The amount of mass added by the combined boom and ballast should be minimized for the sake of endurance andstall speed. A heavier plane will be harder to launch, fly, and power. The total added mass is calculated using thesame methodology as for the boom projection criteria. The weight of the ballast as well as the boom itself is takeninto account for several fixed ballast weights.
Table 17. Total Added Mass Scoring Definition
Total Added Mass: Most Moderate Least
Score: 1 2 3 4 5
Data Interference
Data interference is evaluated by comparing the leading edge area of the top wing that is free from turbulence.This area would be available for FADS sensor placement in completely clean airflow.
Table 18. Data Interference Scoring Definition
Data Interference: Most Moderate Least
Score: 1 2 3 4 5
Potential Vibration
The potential vibration of each design is evaluated by comparing the amount of mass that would have to be acedat the end of each boom. A larger mass at the end of a boom will lead to more vibration which could cause stabilityissues.
Table 19. Potential Vibration Scoring Definition
Potential Vibration: Most Moderate Least
Score: 1 2 3 4 5
One Centered Boom: Scoring
Boom Projection - 4: The single boom design leads to less projection in front of the top wing than the double boomdesign for every ballast mass modelled.Total Added Mass - 5The combined mass of the ballast weights and the wooden dowels for the single boom designis less for every ballast mass modelled.Data Interference - 2: The downside of the single boom design is its placement directly in front of the center of thetop wing. The turbulence created by the boom and ballast may interfere with data collection.Potential Vibration - 3 The amount of mass required at the end of the boom is greater for the single boom designwhich may lead to more vibration and less stability.
Two Booms Attached to Side Walls: Scoring
Boom Projection - 2: The boom projection in front of the top wing is greater for the double boom design than forthe single, which may be less structurally stable.Total Added Mass - 2: The total mass added by the double boom design is greater than that of the single boom,which leads to poorer flight performance and more demand on power and propulsion.Data Interference - 5: The greatest benefit of the double boom design is its low interference with the FADS datacollection. Attaching the ballast to the side walls leaves the front of the swept wing uninterrupted for sensorsplacement.Potential Vibration - 4: The mass at he end of each boom is less for this design, decreasing the potential for vibra-tion. However, the scores for this criteria are very close for each design because the difference between them is
05/04/20 75 of 124
University of Colorado Boulder
FFR

Aerospace Senior Projects ASEN 4028
small and the magnitude of the modelled vibration is low.
Scoring Summary
The finals scores for each boom design are shown below. The single centered boom was selected with a final scoreof 3.55 compared to the 3.2 earned by the double boom design. This decision is largely due to the fact that thisproject prioritized the development of a flying platform for the FADS system. Improvement of data collectioncomes second to flight performance for this iteration of the Eagle Owl legacy project. The exact nature of thecentered boom’s interference with the FADS sensors could be investigated in future iterations using AVL or windtunnel models.
Table 20. Boom Configuration Trade Study Matrix
One Boom Two Booms
Criteria Weight Score Score
Boom Projection 0.25 4 2
Added Mass 0.30 5 3
Data Interference 0.30 2 5
Vibration Potential 0.15 3 4
Total Score (Normalized to 5) 3.55 3.2
Controls
Autopilot Controller
In order to aid the pilot in controlling the aircraft and achieve steady flight, an autopilot flight controller is required.The flight controller will receive commands from the RC pilot for complicated maneuvers such as takeoff andlanding. The autopilot will only be operated for loitering. The autopilot will be activated through a switch availableon the vehicle controller for the RC pilot to use. A software and a flight controller board will be chosen through aweighted criteria score. The autopilot system configurations chosen for the study are ArduPilot Mega, BetaFlightF4, iNAV Matek F405, PixHawk 2 (Cube), and PixHawk 4.
ArduPilot Mega
Figure 55. ArduPilot Mega
The ArduPilot Mega is a versatile autopilot that is used for a variety of vehicles including fixed wing aircraft, multi-rotor helicopters, and traditional helicopters. The ArduPilot software used for the flight controller is designedto ensure that no modification of the source code is necessary to adapt the controller to a specific flight case orairframe. In addition, there are algorithms available from the developers and the community for a multitude of
05/04/20 76 of 124
University of Colorado Boulder
FFR

Aerospace Senior Projects ASEN 4028
airframes. However, the flight controller does not come with any sensors or GPS receivers. The pros and cons ofthe ArduPilot Mega can be viewed in Table 21.
Table 21. ArduPilot Pros and Cons
Pros Cons
- Availability of algorithms for different airframes - Difficult to find on the market
- Weighs the least out of the available options - Does not come with sensors
- Require little to no source code modification
BetaFlight F4
Figure 56. BetaFlight F4
The BetaFlight F4 flight controller is used for multi-rotor UAV vehicles, though the firmware and the flight con-troller board can be modified and optimized for a fixed wing aircraft. The flight controller does not come withthe necessary cables for setup. In addition, the BetaFlight F4 has only an accelerometer and a gyroscope with noaltitude measuring sensors such as a magnetometer or a barometer. However, the flight controller has one of thehighest processing capabilities for control response. The pros and cons of the BetaFlight F4 can be viewed in Table22.
Table 22. BetaFlight Pros and Cons
Pros Cons
- High processing capabilities - Designed and optimized for quadcopters
- Has an overall more compact build - Does not have many servo outputs
- Developer/community support
05/04/20 77 of 124
University of Colorado Boulder
FFR

Aerospace Senior Projects ASEN 4028
iNAV Matek F405
Figure 57. iNAV Matek F405
The iNAV Matek F405 is a flight controller that is optimized specifically for fixed wing flight. It is relatively new andhas not been tested as much as the other options. The iNAV Matek F405 uses the same processor as the BetaFlightF4. Thus, it possesses high processcing capabilities. The support available for this configuration is not substantialenough to predict any problems that might arise. The pros and cons of the iNAV Matek F405 can be viewed in Table23.
Table 23. iNAV Pros and Cons
Pros Cons
- High processing capability - No substantial community/developer support
- Optimized for fixed wing flight - The least tested configuration out of the available options
- Requires little to no source code modification
PixHawk 2 (Cube)
Figure 58. PixHawk 2
PixHawk 2 is the conventionally used PixHawk product, specifically, in CU’s UAV programs such as IRISS. Theproduct comes with the same kit that is provided with PixHawk 4. It has lower processing capabilities than thePixHawk 4. Furthermore, it is the heaviest option with a weight of 200 grams. However, it has been tested anddeveloped extensively which will facilitate further studies in its use and the possible complications that mightarise. PixHawk 2 operates on the same firmware as PixHawk 4, and is priced at $238 which makes it one of themore expensive options along with the PixHawk 4. The pros and cons of the PixHawk 2 can be viewed in Table 24.
05/04/20 78 of 124
University of Colorado Boulder
FFR

Aerospace Senior Projects ASEN 4028
Table 24. PixHawk 2 Pros and Cons
Pros Cons
- Controller has extensive community support - Weighs the heaviest of the options available
- Triple redundant on power supply - Cost
- Pixhawk 4 has the largest community support
- CU heritage
PixHawk 4
Figure 59. PixHawk 4
The PixHawk 4 is one of the newest flight controllers from the options stated above. It comes with a kit that in-cludes a power management board, a GPS module, and a variety of cables for the inputs and outputs of the board.PixHawk 4 has a high processing capability, and contains multiple sensors, a barometer, an accelerometer, a gyro-scope, and a magnetometer. The software and the flight controller are designed to operate on different multirotorand fixed wing configurations. As a result, little to no programming will be required. The firmware used for Pix-Hawk 4 has extensive support, and the controller is priced at $211. The pros and cons of the PixHawk 4 can beviewed in Table 25.
Table 25. PixHawk 4 Pros and Cons
Pros Cons
- High processing capability - Newly released hardware, with no extensive community support
- Triple redundant on power supply - Has not been considerably tested
- PX4 Software has the largest community support - Cost
Autopilot Trade Study
Criteria
The most important criteria for the autopilot/flight controller are optimization, available support, complexity ofsetup, controls response time, weight, and price. It is important to determine the optimization level of the flightcontroller for a fixed wing vehicle; it will be time consuming to reconfigure a flight controller that is designed forquad copters for a fixed wing vehicle. It is important to ensure that an abundant amount of support is available tounderstand the configuration of the flight controller. The flight controller setup must be simple as to not crowd theinterior of the wing frame and ensure equal weight distribution. Ideally, the flight controller would also come with
05/04/20 79 of 124
University of Colorado Boulder
FFR

Aerospace Senior Projects ASEN 4028
a kit that includes all the necessary cables and connectors. The highest weighted criterion is the control responsetime. It is vital for the aircraft to respond to the turbulence that will cause the aircraft to lose altitude or fly off-pathin a short amount of time. The aircraft must return to the flight path promptly. The price and weight are alsoimportant factors to consider. If the flight controller contributes significantly to the weight of the aircraft, it willbe necessary to consider that factor into the overall design of the aircraft. If the flight controller is costly and isdamaged in one of the test flights, it may become problematic to replace it. The assigned weights for this study aregiven in the following Table 26.
Table 26. Weighting of Autopilot Trade Criteria
Criterion Optimization Available Support Complexity of Setup Controls Response Time Weight Price
Weight 0.15 0.15 0.2 0.3 0.05 0.1
Optimization - This criterion specifies the level of optimization the flight controller has for fixed wing flight.Some controllers have general use for multi-rotor vehicles and fixed wing vehicles. Others are on the extremes andare designed more for either multi-rotor vehicles or fixed wing vehicles. Flight controllers optimized for fixed wingflight will have more outputs (more than 4) as to connect to multiple control surfaces and the propulsion system.In addition, the software will not require any modification if there are readily available airframe options for thecontrol algorithms. The derived scoring system is given in Table 27.
Table 27. Optimization Scoring Definition
Optimization: Not Optimized Low Moderate High Fully optimized
Score : 1 2 3 4 5
Available Support - The available support from developers/community will be a critical factor in assessing andsolving any unforeseen complications that might arise. A higher level of support will result in less time consump-tion for setup. Furthermore, the extent of tests performed on the flight controller in the community will allow forthe prediction of possible complications and the modification of the source code if necessary. For flight controllerswith moderate to very high levels of support, there are dedicated websites and forums to troubleshoot commonlyencountered issues, as well as general instructions on how to modify the physical board or the software if needed.This resulted in the following scoring system shown in the following Table 28.
Table 28. Available Support Scoring Definition
Available Support: Scarce Low Moderate High Very High
Score : 1 2 3 4 5
Complexity of Setup - This criterion specifies the level of detail needed to set up the software/flight controlleroutputs with other systems such as the propulsion and mechanical systems. The flight controller must be capableof producing the necessary voltage outputs to maneuver the servos and to toggle the thrust. The flight controllermust also be compatible with various fixed wing structures as it will be placed inside the structure of the wing. Thesetup must also not create uneven weight distributions that might affect the overall performance of the aircraft.Scoring for this criterion is given in the following Table 29.
Table 29. Complexity of Setup Scoring Definition
Complexity of Setup: Difficult High Moderate Low Elementary
Score : 1 2 3 4 5
Control Response & Accuracy - The control system must respond in a specified amount of time to return theaircraft into the original flight path and be within a certain accuracy. The specified time and accuracy are 7 secondsand 15 meters, respectively. This criterion is essential for determining the best performance; however, all of theflight controllers fall within these requirements for standard day conditions in Boulder where the wind speed istypically under 5 m/s. To account for unpredictable weather changes, the highest possible processing capabilitymust be used. This resulted in the following scoring system in Table 30.
05/04/20 80 of 124
University of Colorado Boulder
FFR

Aerospace Senior Projects ASEN 4028
Table 30. Control Response & Accuracy Scoring Definition
Control Response & Accuracy: Very Low Low Moderate High Very High
Score : 1 2 3 4 5
Weight - It is important to consider the weight that the flight controller will contribute to the overall system.The weight of the flight controller must not affect other design parameters significantly. However, it is not a crucialfactor in choosing a flight controller. Thus, it is given the smallest weighting. The scoring for autopilot weight areshown in Table 31
Table 31. Weight Scoring Definition
Weight: Very Heavy Heavy Moderate Light Very Light
Score : 1 2 3 4 5
Price - The price will be critical for the replacement of the flight controller. It is not expected that the flightcontroller will be damaged; however, it is important to consider the possibility of a second purchase. It is essentialthat it does not exceed the allocated amount from the budget. The resulting scoring system for pricing is given inthe following Table 32
Table 32. Price Scoring Definition
Price: Very High High Moderate Low Very Low
Score : 1 2 3 4 5
PixHawk 4 Scores
Optimization: 3 - PixHawk 4 is designed for general use and not specifically for fixed wing aircraft.Available Support: 2 - The PixHawk 4 uses PX4 which is software with extensive support; however, the actual
flight controller does not have much support.Complexity of Setup: 3 - PixHawk 4 is relatively new and thus poses some potential for integration issues. It has
not been tested much at all.Control Response & Accuracy: 4 - PixHawk 4 has one of the highest processing capabilities from the given op-
tions.Weight: 4 - PixHawk 4 weighs approximately 15.8 gramsPrice: 1 - PixHawk 4 is one of the more expensive options at a price of $211.
PixHawk 2 Scores
Optimization: 4 - PixHawk 2 has been used considerably for fixed wing flight. It is also commonly used at CU forthe development of UAVs.
Available Support: 5 - PixHawk 2 has been a popular choice for fixed wing flight, specifically, at CU. It has beentested and modified for many airframes and flight cases.
Complexity of Setup: 4 - There are many sources for the setup of PixHawk 2 such as the UAV developers at CU.Control Response & Accuracy: 3 PixHawk 2 has a moderate processing capability that will achieve the require-
ments of the response.Weight: 2 - PixHawk 2 is the heaviest option, weighing 200 grams.Price: 1 - PixHawk 2 is the most expensive option from the 5 flight controllers at a price of $238.
BetaFlight F4 Scores
Optimization: 1 - The BetaFlight F4 was mainly designed for quad copters in terms of software and hardware.Available Support: 3 - There is moderate support for fixed wing flights with the BetaFlight F4. However, the
support is mainly for quad copters.Complexity of Setup: 2 - The BetaFlight F4 will require reconfiguration to support fixed wing flight.Control Response & Accuracy: 4 - The BetaFlight F4 is another option that has high processing capabilities.Weight: 5 - The Betaflight F4 weighs approximately 6.6 grams
05/04/20 81 of 124
University of Colorado Boulder
FFR

Aerospace Senior Projects ASEN 4028
Price: 3 - The Betaflight F4 is priced at $40.
ArduPilot Mega Scores
Optimization: 4 - ArduPilot Mega is a highly versatile configuration that is used for a variety of vehicles includingfixed wing vehicles
Available Support: 3 - ArduPilot Mega has moderate support for fixed wing flight.Complexity of Setup: 2 - The ArduPilot Mega has potential for difficulty in setup due to its general use.Control Response & Accuracy: 3 - The ArduPilot Mega has a moderate processing capability.Weight: 4 - The ArduPilot Mega weighs approximately 22 grams.Price: 3 - The ArduPilot Mega is priced at $40.
iNAV Matek F405 Scores
Optimization: 4 - iNAV Matek F405 has all the necessary specifications for a fixed wing vehicle. It has a versatilesoftware for flight design.
Available Support: 2 - The iNAV Matek F405 is a relatively new configuration and thus has little support avail-able.
Complexity of Setup: 4 - The setup is easy due to the flexibility of the softwareControl Response & Accuracy: 3 - The iNAV Matek F405 has a moderate processing capabilityWeight: 4 - The iNAV Matek F405 has a weight of 25 grams.Price: 3 - The iNAV Matek F405 is priced at $50.
Scoring Summary
The full results of this trade study are shown in the following Table 33. PixHawk 2 had the highest total score.Optimization, available support, and complexity of setup are very important criteria for the flight controller, andthe Pixhawk 2 scores exceptionally across all three.
Table 33. Autopilot Trade Study Matrix
PixHawk
4
PixHawk
2
BetaFlight
F4
ArduPilot
Mega
iNAV Matek
F405
Evaluation
CriteriaWeighting Score Score Score Score Score
Optimization 0.15 3 4 1 4 4
Available Support 0.15 2 5 3 3 2
Complexity of Setup 0.2 3 4 2 2 4
Control Response and Accuracy 0.3 4 3 4 3 3
Weight 0.1 4 2 5 4 4
Price 0.05 1 1 3 3 3
Total Score (Normalized to 5) 3.2 3.4 3.1 3.1 3.35
FADS
FADS Configuration
Though the design of the FADS system is not technically a part of this project, the loss of legacy hardware in thisarea has created the opportunity to potentially redesign the system to serve the project’s requirements and limita-tions. The purpose of the FADS system is to derive the relative wind vector of the flow around the aircraft. It doesthis by sampling pressure at several points across the aircraft surface. Wind vector can then be calculated via eitherbasic fluid computations or a neural network solution.
05/04/20 82 of 124
University of Colorado Boulder
FFR

Aerospace Senior Projects ASEN 4028
Traditional Setup
One possible layout for the FADS system is heavily based on the work by Dr. Roger Laurence. This prior workwas based on a centralized transducer bay, with all sensor transducers integrated in a set of PCBs. The circuitboard is fitted with a covering that maintains pneumatic isolation of each pressure transducer. Sampling pointsare accessed using thin urethane tubing. This method aids in modularity and electronic design of our system,though it poses a significant challenge from a manufacturing and integration perspective, and its inherent prosand cons are shown in the following Table 34.
Table 34. Traditional FADS Pros and Cons
Pros Cons
- Flight Tested - Implementation poses a challenge
- Ease of Replacement - Heavier
- Protects Components -Requires more Design and Manufcaturing complexity
Simplified Setup
An alternative layout is a more dispersed FADS system, in which pressure transducers are placed adjacent to thedesired sampling points, with no tubing or casing needed. Instead, data and power wiring would be fed to trans-ducer positions directly, significantly reducing the mass of the FADS system. The biggest drawback of this layout isthat it is untested. Though the basic premise is arguably more accurate than the traditional layout, and will sufferfrom much less lag due to surface proximity, this kind of FADS system has never been attempted before, openingit up for any number of unforeseen failures. Beyond the simple risk of the unknown, there are several structuraland integration concerns that come along with this layout. Pressure transducers near the surface of the aircraft aremuch more vulnerable to damage during takeoff and landing, and feeding bundles of wires to the extremities ofthe aircraft can be just as difficult to account for as the pneumatic tubing. Perhaps worst of all, this FADS setupwill make modularity and replacement of components difficult without significant time investment. The pros andcons of this setup are shown in Table 35.
Table 35. Simplified FADS Pros and Cons
Pros Cons
- Ease of Manufacturing and Design - Implementation poses a challenge
- More Accurate - Has not been tested
- Reduced Mass -Vulnerable to damage and difficult to replace or repair
FADS Trade Study
Criteria
The most important criteria for this subsystem is that of flight turnaround and field repair. Having a system thatwill break during every flight cycle and will require several hours to extract and replace is unacceptable. Thespeed of this replacement scheme is important largely because of the functional requirement which calls for quickturnaround as well as the implementation of a FADS. The level of accuracy in the latter component need not beverified. In general, the approach to FADS design is driven by the basic implementation requirement, not that offunctionality. The final aircraft should be configured to accept a FADS system, but not necessarily boast a workingexample. For that reason, accuracy of each option is weighted rather lightly. In addition, manufacturing difficultyis weighted less to avoid over-correcting for this consideration, as previous teams have. Even the most technicallycomplex FADS system is not completely infeasible to construct, and the traditional setup will require no more thansome 3D printed components and tube integration to see to fruition. These weights are reported in the followingTable 36.
05/04/20 83 of 124
University of Colorado Boulder
FFR

Aerospace Senior Projects ASEN 4028
Table 36. Weighting of Trade Criteria
Criterion Implementation Manufacturing Weight Vulnerability and Repair
Weight 0.30 0.15 0.15 0.40
Implementation - A measure of the expected difficulty in incorporating the FADS system into the structure ofthe aircraft. This includes the support structures, holes, and electronic wiring required to operate the FADS system.Scoring for this criterion is shown in Table 37.
Table 37. Implementation Scoring Definition
Implementation: Difficult High Moderate Low Elementary
Score : 1 2 3 4 5
Manufacturing - The scoring given in Table 38 represents a measure of the expected difficulty in manufacturingthe FADS system. This includes all components that need to be made entirely by our team, such as casings andwiring setups.
Table 38. Manufacturing Scoring Definition
Manufacturing: Difficult High Moderate Low Elementary
Score : 1 2 3 4 5
Weight - The expected mass of the FADS system, and the resulting impact it will have on all other systemsconsiderations. The resulting scoring system is given in the following Table 39.
Table 39. Weight Scoring Definition
Weight: Significant High Moderate Low Negligible
Score : 1 2 3 4 5
Vulnerability and Repair - A measure of the expected complications in flight and during repair and redeploy-ment cycles of the aircraft. This scoring, shown in Table 40 includes the likelihood of component damage as wellas the turnaround time that may result from replacement or repair of the subsystem.
Table 40. Vulnerability and Repair Scoring Definition
Vulnerability and Repair: Difficult High Moderate Low Elementary
Score : 1 2 3 4 5
Traditional
Implementation: 3 - The traditional FADS layout involves potentially significant disruption of the aircraft structureto incorporate FADS sensor bays and pneumatic tubing.
Manufacturing: 2 - The casing and tubing systems of the traditional FADS system could present serious man-ufacturing complications.
Weight: 3 - Casing and tubing will be slightly heavier than wire bundles.Vulnerability and Repair: 5 - By incorporating pressure transducers into the wing structure, the somewhat
expensive sensing equipment is spared the worst of launch and landing damage.
Simplified
Implementation: 3 - The difficulties in implementing the simplified FADS system will likely be just as complex asthose for the traditional system, with tubing replaced by wiring, and separate, miniaturized support structures inplace of a single large one.
05/04/20 84 of 124
University of Colorado Boulder
FFR

Aerospace Senior Projects ASEN 4028
Manufacturing: 5 - There are few components in need of manufacture with the simplified FADS system. In-deed, all components can be purchased commercially and incorporated relatively easily.
Weight: 4 - Wires will be slightly lighter than tubing and casing, but not by very much.Vulnerability and Repair: 1 - Transducers directly on the surface of the aircraft are in danger of being seriously
damaged during landings, which are not expected to be graceful. In addition, the decentralized approach makestimely part replacement almost impossible.
Scoring Summary
The results of this trade study are shown in Table 41. The traditional FADS system is clearly the superior of the two.Its significant advantages in the field repair and replacement domain are critical for the success of the project’sbasic driving design parameters.
Table 41. FADS Configuration Trade Study Matrix
Traditional Simplified
Evaluation Criteria Weighting Score Score
Implementation 0.30 3 3
Manufacturing 0.15 2 5
Weight 0.15 3 4
Vulnerability and Repair 0.40 5 1
Total Score (Normalized to 5) 3.65 2.65
Power
Battery Type
Many types of batteries are commonly used to power small Unmanned Aerial System (sUAS) aircraft and hobbygrade RC aircraft. This trade study examines the feasibility of Lithium-Ion Polymer (LiPo), Lithium-Ion (Li-Ion),Nickel Cadmium (NiCd), Nickel-Metal Hydride (NiMH), and Sealed Lead Acid (SLA) batteries.
LiPo
Lithium-ion Polymer (LiPo) batteries are the industry standard for powering RC and sUAS aircraft. This is welldeserved due to their excellent energy density and flexible, light form factor. Lithium-based batteries are moresensitive to overcharging than other battery types, and are flammability hazards when damaged, increasing theirrisk compared to non-lithium battery types. The pros and cons for LiPo batteries are listed in Table 42.
Table 42. LiPo Pros and Cons
Pros Cons
- Low profile - Lower energy density than Li-Ion
- Flexible form factor - Not overcharge tolerant
- Light weight - Dangerous if damaged
- Safer than Li-Ion
- Widely available
- Industry standard
Li-Ion
Lithium Ion (Li-Ion) batteries have extremely high energy density and are very stable over long periods of time,having very low self-discharge and requiring little maintenance. However, they are one of the most dangerous typesof batteries, requiring protection circuits and being subject to transport regulations as a result. Their premiumperformance also comes with a high price tag, and, as with LiPo batteries, they are a flammability hazard whendamaged, increasing their risk compared to non-lithium based battery types. The pros and cons of Li-Ion batteriesare listed in Table 43.
05/04/20 85 of 124
University of Colorado Boulder
FFR

Aerospace Senior Projects ASEN 4028
Table 43. Li-Ion Pros and Cons
Pros Cons
- High energy density - Not safe - protection circuit required
- Relatively low self-discharge - Subject to transport regulations
- Low maintenance - Expensive
NiCd
Nickel Cadmium (NiCd) batteries are tried and true, a mature and well-understood technology. They chargequickly and simply, perform well under load, and are forgiving and consistent. They are also reliable and veryeconomical. Unfortunately, they have very low energy density and must be used and recharged constantly to bemaximally effective. This particularity is due to their high self-discharge and the memory effect, which is a growthof crystals on the cell plates that causes a large loss of performance over time and is only delayed by exercising thebattery. The pros and cons for NiCd batteries are listed in Table 44.
Table 44. NiCd Pros and Cons
Pros Cons
- Fast and simple charge - Low energy density
- Good load performance - Memory effect
- Forgiving and consistent - High self-discharge
- Economical - Environmentally unfriendly
NiMH
Nickel-Metal Hydride (NiMH) batteries aim to fix the biggest problems with NiCd batteries, offering higher energydensity and showing much more resilience to the memory effect. These upgrades don’t come without signifi-cant down-grades, however. NiMH batteries are less durable than NiCd, suffer under load performance, and havehigher self-discharge. They also use a more complicated charge and have a limited service life. It is "widely ac-cepted that NiMH is an interim step to Lithium battery technology" ? . The pros and cons for NiMH batteries arelisted in Table 45.
Table 45. NiMH Pros and Cons
Pros Cons
- Higher energy density than NiCd - Limited service life
- Less prone to memory - Difficult charge
- High self-discharge
- High maintenance requirement
SLA
The Sealed Lead Acid (SLA) battery is an inexpensive and reliable battery. They are not subject to memory butinstead suffer from sulfation, where if stored in a non-charged state, the battery can become difficult if not im-possible to recharge. They can never be fully charged due to gassing and water depletion, and lose capacity whendeep-cycled, meaning the battery prefers to stay in a medium-charged state. They also have a very slow chargeand low energy density, along with being environmentally unfriendly due to the lead. The pros and cons for SLAbatteries are listed in Table 46.
05/04/20 86 of 124
University of Colorado Boulder
FFR

Aerospace Senior Projects ASEN 4028
Table 46. SLA Pros and Cons
Pros Cons
- Inexpensive - Hard to store
- Reliable - Low energy density
- Low self-discharge - Limited lifetime
- Low maintenance
Battery Type Trade Study
Criteria
The most important criteria for an aircraft battery are energy density, current output, and risk. High energy densityis critical to have the maximum capacity at a minimum weight, allowing the achievement of a one hour flight timewith a light aircraft. The current output is important as all power required by the high current draw propulsionsystem, and the rest of the aircraft electronics are all coming from one power source with the one circuit/parallelbattery power configuration traded on. Risk is also significant, as it is key to keep the overall risk level low as aircraftinherently have more risk factors than land-based craft. This top tier of important criteria is weighted to 20%.
The next tier of importance, weighted to 15%, is voltage output and self-discharge. Voltage output is less impor-tant than current, as voltage can be stepped up or down. However, it can be passively stepped down but requiresan active circuit to be stepped up, so it is a benefit to only have to step down voltage, therefore, have a higher volt-age battery. Self-discharge is important as batteries will be charged in advance and then used after some time inwhich they can self-discharge; however, this amount of time will be limited to hours, not days, so it is not the mostimportant.
The lowest tier of importance, weighted 10%, consists only of the batteries’ maintenance requirement. Thiscriterion is important if extra complications are to be avoided, however with how often batteries will be changed,charged, and used, there are plenty of opportunities for maintenance, and the batteries will be regularly exercised.
These weights are compiled in the following Table 47.
Table 47. Weighting of Trade Criteria
Criterion: Energy Density Voltage Output Current Output Risk Self Discharge Maintenance
Weight: 0.20 0.15 0.20 0.20 0.15 0.10
Energy Density - Gravimetric energy density is measured in Wh/kg, and average energy density for the batterytype will be used. Higher energy density is better, as seen in Table 48.
Table 48. Energy Density Scoring Definition
Energy Density (Wh/kg): ~40 ~60 ~90 ~115 ~135
Score : 1 2 3 4 5
Voltage Output - Voltage output is measured in volts, looking at nominal voltage per cell of an average battery.Higher voltage is better as it is easier to step down voltage than step up, as shown in Table 49.
Table 49. Voltage Output Scoring Definition
Voltage Output (V): 0.5 1 1.25 2 3.6
Score : 1 2 3 4 5
Current Output - Battery current output is measured with Coulomb’s C scale, where a 2200mAh 1C battery willprovide 2.2A for 1 hour. This criterion will use the battery average best result load current, where higher is betteras it provides more current for the propulsion system. This scoring system is given in Table 50
05/04/20 87 of 124
University of Colorado Boulder
FFR

Aerospace Senior Projects ASEN 4028
Table 50. Current Output Scoring Definition
Current Output (C): 0.05 0.1 0.2 0.5 1
Score : 1 2 3 4 5
Risk - Risk is a combined metric of battery overcharge tolerance, charge difficulty, and damage risk. As it is aunitless metric, it will be measured in general levels, where lower risk is better, as shwon in Table 51.
Table 51. Risk Scoring Definition
Risk (Unitless): Very high High Moderate Low Very low
Score : 1 2 3 4 5
Self Discharge - The self-discharge rate is measured in capacity percentage of depletion per month. Averagebattery expected rates when stored at room temperature are used, with lower rates being ideal, as can be seen inthe following Table 52.
Table 52. Self Discharge Scoring Definition
Self Discharge (capacity/month): 40% 30% 20% 10% 5%
Score : 1 2 3 4 5
Maintenance Requirement - A battery’s maintenance requirement is measured in Mean Time To Failure (MTTF)when not regularly exercised or when in storage. As Table 53shows, the highest/ideal level is batteries that don’trequire maintenance, with shorter times being worse.
Table 53. Maintenance Scoring Definition
Maintenance (days): 25 45 75 135 inf
Score : 1 2 3 4 5
LiPo Scores
Energy Density: 4 - LiPo batteries have an average energy density of 115 Wh/kg, just slightly less than Li-Ion.Voltage Output: 5 - LiPo batteries have a nominal 3.6V per cell.Current Output: 5 - LiPo batteries have a best result load current of 1C.Risk: 3 - LiPo batteries have moderate risk, are a flammability hazard when damaged, but are otherwise safe.Self Discharge: 4 - LiPo batteries have an average self-discharge rate of 10% capacity per month.Maintenance: 5 - LiPo batteries do not require periodic maintenance or exercising.
Li-Ion Scores
Energy Density: 5 - Li-Ion batteries have an average energy density of 135 Wh/kg, the best of considered.Voltage Output: 5 - Li-Ion batteries have a nominal 3.6V per cell.Current Output: 5 - Li-Ion batteries have a best result load current of 1C.Risk: 2 - Li-Ion batteries are the most dangerous battery type looked at for this trade study, being extremely
overcharge intolerant, requiring protection circuits, and being subject to export control due to this high level ofrisk.
Self Discharge: 4 - Li-Ion batteries have an average self-discharge rate of 10% capacity per month.Maintenance: 5 - Li-Ion batteries do not require periodic maintenance or exercising.
NiCd Scores
Energy Density: 2 - NiCd batteries have an average energy density of 60 Wh/kg, slightly higher than SLA.Voltage Output: 3 - NiCd batteries have a nominal 1.25V per cell.Current Output: 5 - NiCd batteries have a best result load current of 1C.
05/04/20 88 of 124
University of Colorado Boulder
FFR
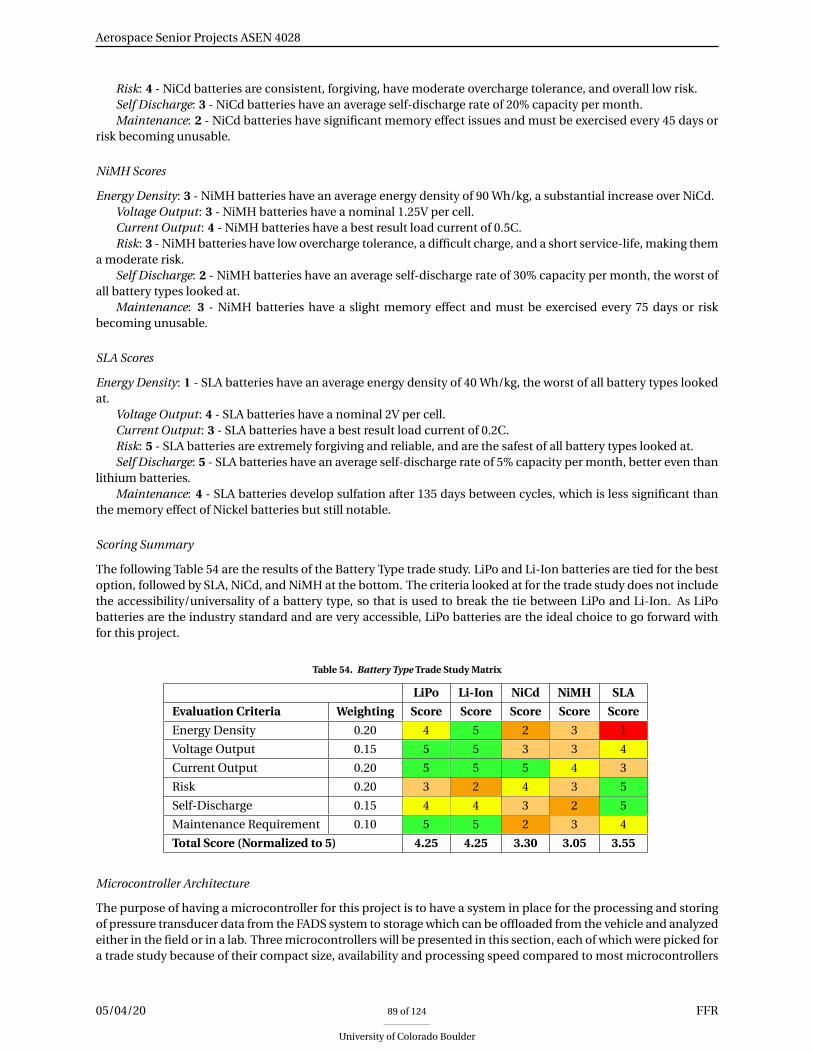
Aerospace Senior Projects ASEN 4028
Risk: 4 - NiCd batteries are consistent, forgiving, have moderate overcharge tolerance, and overall low risk.Self Discharge: 3 - NiCd batteries have an average self-discharge rate of 20% capacity per month.Maintenance: 2 - NiCd batteries have significant memory effect issues and must be exercised every 45 days or
risk becoming unusable.
NiMH Scores
Energy Density: 3 - NiMH batteries have an average energy density of 90 Wh/kg, a substantial increase over NiCd.Voltage Output: 3 - NiMH batteries have a nominal 1.25V per cell.Current Output: 4 - NiMH batteries have a best result load current of 0.5C.Risk: 3 - NiMH batteries have low overcharge tolerance, a difficult charge, and a short service-life, making them
a moderate risk.Self Discharge: 2 - NiMH batteries have an average self-discharge rate of 30% capacity per month, the worst of
all battery types looked at.Maintenance: 3 - NiMH batteries have a slight memory effect and must be exercised every 75 days or risk
becoming unusable.
SLA Scores
Energy Density: 1 - SLA batteries have an average energy density of 40 Wh/kg, the worst of all battery types lookedat.
Voltage Output: 4 - SLA batteries have a nominal 2V per cell.Current Output: 3 - SLA batteries have a best result load current of 0.2C.Risk: 5 - SLA batteries are extremely forgiving and reliable, and are the safest of all battery types looked at.Self Discharge: 5 - SLA batteries have an average self-discharge rate of 5% capacity per month, better even than
lithium batteries.Maintenance: 4 - SLA batteries develop sulfation after 135 days between cycles, which is less significant than
the memory effect of Nickel batteries but still notable.
Scoring Summary
The following Table 54 are the results of the Battery Type trade study. LiPo and Li-Ion batteries are tied for the bestoption, followed by SLA, NiCd, and NiMH at the bottom. The criteria looked at for the trade study does not includethe accessibility/universality of a battery type, so that is used to break the tie between LiPo and Li-Ion. As LiPobatteries are the industry standard and are very accessible, LiPo batteries are the ideal choice to go forward withfor this project.
Table 54. Battery Type Trade Study Matrix
LiPo Li-Ion NiCd NiMH SLA
Evaluation Criteria Weighting Score Score Score Score Score
Energy Density 0.20 4 5 2 3 1
Voltage Output 0.15 5 5 3 3 4
Current Output 0.20 5 5 5 4 3
Risk 0.20 3 2 4 3 5
Self-Discharge 0.15 4 4 3 2 5
Maintenance Requirement 0.10 5 5 2 3 4
Total Score (Normalized to 5) 4.25 4.25 3.30 3.05 3.55
Microcontroller Architecture
The purpose of having a microcontroller for this project is to have a system in place for the processing and storingof pressure transducer data from the FADS system to storage which can be offloaded from the vehicle and analyzedeither in the field or in a lab. Three microcontrollers will be presented in this section, each of which were picked fora trade study because of their compact size, availability and processing speed compared to most microcontrollers
05/04/20 89 of 124
University of Colorado Boulder
FFR

Aerospace Senior Projects ASEN 4028
on the market. A good microcontroller should make it easy for the user of the aircraft to collect data from theatmosphere and retrieve that data in a simple process for analysis after the mission is complete.
Arduino
The first option for consideration for the data storage microcontroller is an Arduino. Arduinos are known for beingsmall and compact while at the same time having a large amount of documentation online for the user to effec-tively implement the microcontroller into any system they wish. The following Table 55 lists the pros and consfound from the manufacturers website for using an Arduino to store pressure transducer data. Note that it is vitalthat the microcontroller be a system that the team has used before, thus, team experience is also considered in thepros and cons.
Table 55. Arduino Pros and Cons
Pros Cons
- High team experience - Moderate processing speed
- C and C++ based - No OS
- Heavy documentation
- Easily integrated
- Built in ADC
FPGA
The FPGA (field-programmable gate array) is a microcontroller that is known for having fast processing speedswhile maintaining a small profile for mounting onto vehicles. The fast processing speeds of FPGA’s makes theman ideal option for this project, as more data can bring higher fidelity results to the customer. FPGA’s do have adownside, however, as they are based on hardware description language (HDL), which means that the user needsto program every function of the FPGA from the ground up. This creates a large amount of work for such a simpleoperations as data storage. The pros and cons for the FPGA microcontroller are given in Table 9.
Table 56. FPGA Pros and Cons
Pros Cons
- Behavior is user specified - No team experience
- Re-programmable in field - HDL based
- Fast processing - Heavy development for simple functions
Raspberry Pi
The Raspberry Pi is the last microcontroller for consideration in this list of three storage devices. Raspberry Pi’shave many advantages, including the use of operating systems and the ability to be modular. However, only twomembers of the design team have any experience using Raspberry Pi, and learning how to code with a this mi-crocontroller is an extended process that takes months to master. In addition, Raspberry Pi’s have many systemson-board that are not necessary for the scope of what the data capture system has to accomplish; these systems inturn waste power and add additional weight to the aircraft that is unnecessary. The pros and cons for the RaspberryPi microcontroller are given in Table 57.
Table 57. Raspberry Pi Pros and Cons
Pros Cons
- OS for standard data storage methods - Difficult to learn
- High modularity - Heavy and large
- Python based - Excess systems drawing power
- Plugin support - Slow startup
05/04/20 90 of 124
University of Colorado Boulder
FFR

Aerospace Senior Projects ASEN 4028
Microcontroller Architecture Trade Study
Criteria
The data storage microcontroller selection is of little concern to the final goal of producing a flying unmannedaerial system. As such, the criteria for the microcontroller trade study were selected based on the parameters whichwould make implementing data storage to the design of the vehicle simple and efficient. Therefore, ease of use isthe primary criterion for the microcontroller with 30% weight as the controller’s only function is to store data fromsensors onto local storage; thus, the least amount of time possible must be spent configuring the microcontrollerfor storage of data. Modularity, team experience, and sampling rate have all bee given a weight of 20% since theyare each important to the success of the mission but not as important as ease of use, which will free up the team’stime. Modularity is essential as adding data capture boards to the controller may help data be processed faster.Team experience was given the same weight as modularity because, in the event of any programming mistakes,the rest of the team may step in to help based on previous knowledge of the microcontroller. The sampling ratewas also given a weight of 20% due to the sampling requirement for this project is relatively simple at 6 Hz samplingfrequency which can be stretched to a more lofty goal like 10 Hz and beyond. Finally, availability was given a 15%weight because all of the analyzed options are readily available online; however, if a microcontroller fails, it isessential to know which of them can be purchased on short notice. These weights are compiled in the followingTable 58.
Table 58. Weighting of Trade Criteria
Criterion: Ease of Use Modularity Team Experience Sampling Rate Availability
Weight: 0.30 0.20 0.20 0.20 0.10
Ease of Use - The first criterion is ease of use, which is defined by how much documentation there is availableto the team to assist with any programming issues that could be a result of learning a new way to program amicrocontroller. The highest achievable level for ease of use is that there is online documentation for storingdata from custom sensors as this is the primary purpose of the controller in this project, as shown in the scoringbreakdown given in Table 59.
Table 59. Ease of Use Scoring Definition
Ease of Use: No Info Little Info Manufacturer Info Community Info Sensor Data Storage Info
Score : 1 2 3 4 5
Modularity - The second criterion is modularity which is defined by the range of modular products whichcan be purchased with a given microcontroller. As an example, Arduinos can be purchased with many additionalcuircuit boards which add to the capability of the Arduino to perform certain functions (functions such as storingdata from sensors). Modular products that are sold with a microcontroller can include but are not limited to GPSsensors, data processing boards, barometers, and accelerometers. The scoring system used to evaluate modularityis given in Table 60.
Table 60. Modularity Scoring Definition
Modularity: Very Low Low Moderate High Very High
Score : 1 2 3 4 5
Team Experience - The third criterion is team experience, which is defined by the amount of prior knowledgethat the team has given a specific kind of microcontroller. The highest achievable level for team experience is if allteam members are fluent with the architecture and can process data with no assistance from external sources, asshown in Table 61.
Table 61. Team Experience Scoring Definition
Team Experience: None Basic Knowledge Well Versed Classes Taken Mastered Architecture
Score : 1 2 3 4 5
05/04/20 91 of 124
University of Colorado Boulder
FFR

Aerospace Senior Projects ASEN 4028
Sampling Rate - The fourth criterion is the sampling rate, which is the frequency at which the microcontrolleris storing data. Note that for the levels of scoring, there are no specific values given in hertz; this is because a par-ticular board configuration of a controller architecture may have faster processing capabilities than another boardconfiguration. Thus, the scoring will be done based on general trends in the processing speed of the architecturerather than the specific quantified values for the sampling rate, as seen in Table 62.
Table 62. Sampling Rate Scoring Definition
Sampling Rate: Very slow Slow Moderate Fast Very fast
Score : 1 2 3 4 5
Availability - The fifth criterion is the availability, which is defined by the commonality of the controller throughdifferent avenues of purchase, such as websites and box stores. As an example, Arduinos can be found in typicalbox stores such as Best Buy, where FPGA’s might only be able to be purchased online; in this example, the Arduinowould be the more available microcontroller. These evaluations of availability translated into the following scoringsystem, shown in Table ??.
Table 63. Availability Scoring Definition
Availability: None Second Hand Only Special Order Few Retailers Online and In Store
Score : 1 2 3 4 5
Arduino
Ease of Use: 4 - Arduino is known for its use in STEM high schools for teaching students how to learn microcon-troller programming and systems engineering. Thus, there is plenty of documentation if the team needs it, makingArduino easy to use.
Modularity: 5 - Arduino offers many upgrade boards that can interface with a standard Arduino to add func-tions to the original microcontroller. Thus, Arduino earns a 5 in this category.
Team Experience: 3 - Every member of the team has at least some experience with coding an Arduino due toelectronics for aerospace engineers at CU.
Sampling Rate: 3 - Due to the small processing power of most Arduinos, its sampling rate isn’t quite as fast asthe ones for an FPGA or a Raspberry Pi.
Availability: 5 - Arduinos can be purchased almost anywhere standardized electronics such as laptops can bepurchased (in stores or online). Therefore, Arduinos are available to the point where if one fails on the team, a newArduino is easily attainable in a short amount of time.
FPGA
Ease of Use: 2 - FPGA is coded using a language called HDL (hardware description language), which means thatthe architecture is built from the ground up by the user. This particularity makes this system, not a viable optionsince the microcontroller is not the primary goal of the project.
Modularity: 4 - Much like the Arduino, additional boards that add functions to the FPGA can be purchased.However, the way the additional boards are used is determined by the architecture created by the user.
Team Experience: 1 - Only one member of the team has experience programming an FPGA.Sampling Rate: 5 - Since FPGAs are mostly used for logical operations, the sampling rate for the FPGA is the
highest out of all the controllers due to the user’s ability to make the processes of the controller more efficient.Availability: 4 - FPGAs are not as readily available as Arduinos, but they can still be purchased off of most
electronics websites. However, if the board fails, it may be challenging to find a fast replacement.
Raspberry Pi
Ease of Use: 3 - Since the Raspberry Pi has an operating system, the user may interface in the same way someonecan interface with a regular computer. However, this microcontroller is coded in Python, thus making them slightlymore challenging to program.
05/04/20 92 of 124
University of Colorado Boulder
FFR

Aerospace Senior Projects ASEN 4028
Modularity: 3 - Like the other two controllers, Raspberry Pis can be purchased with additional circuit boards toincrease their functionality. Note that because the system runs off of an operating system and is coded in Python,interfacing with the modular boards can be challenging.
Team Experience: 2 - Two of the team members have experience working with Raspberry Pis, but little experi-ence coding with them.
Sampling Rate: 4 - Raspberry Pis usually have powerful processors for being microcontrollers. However, thefact that the data must be processed through an operating system instead of stored directly to a storage device likean FPGA makes the sampling rate slightly slower for Raspberry Pi.
Availability: 5 - Much like Arduinos, Raspberry Pis can be found in stores as well as online readily and are easilyavailable to the team.
Scoring Summary
The results of the trade study for the data storage microcontroller are given in Table 64. Note that the Arduinoarchitecture surpassed the FPGA and Raspberry Pi for scoring since the Arduino scored the highest in the mostimportant criteria for the trade study, which were ease of use, modularity, and team experience. Due to the overallunimportance of the data storing method, the team selected the microcontroller that scored highest in ease of use,as well as in the total score. It is vital that programming a data storage path does not take up the team’s preciouswork time.
Table 64. Microcontroller Architecture Trade Study Matrix
Arduino FPGA Raspberry Pi
Evaluation Criteria Weighting Score Score Score
Ease of use 0.30 4 2 3
Modularity 0.20 5 4 3
Team experience 0.20 3 1 2
Sampling Rate 0.20 3 5 4
Availability 0.10 5 4 5
Total Score (Normalized to 5) 3.90 3.00 3.20
Power Configuration
There are many ways to power an aircraft, from one central power source being distributed to the different sub-systems to multiple power sources for the multiple systems. This trade study examines one circuit configurationswith both one battery and multiple, along with two and three circuit configurations.
One Circuit / One Battery
The first method to power the aircraft is one large battery hooked up to a central, custom designed Power Dis-tribution Board (PDB). This configuration, shown in Figure 60, is the simplest and requires the least number ofparts. This circuit would take power from the battery and condition it, however, required to supply the voltage andcurrent requirements of the different subsystems of the aircraft, namely Propulsion, Control, and Data. Althoughlikely the most straightforward setup, it requires a lot of space, as the single battery must be able to power the entirecraft, and would likely be large and heavy. Batteries of such size also come with price tags of equal magnitude, tothe point that the batteries would likely become a sizeable budgetary sink of the project. Having only one powersource also makes a fail-safe system impossible, making power loss a guaranteed fatal occurrence. The pros andcons for the one circuit, one battery configuration are listed in Table 9.
05/04/20 93 of 124
University of Colorado Boulder
FFR

Aerospace Senior Projects ASEN 4028
Figure 60. Power Configuration Diagram
Table 65. One Circuit / One Battery Pros and Cons
Pros Cons
- Most simple setup - Single point of failure
- Light weight - PDB design required
- Reliable - Expensive battery
- Large battery form factor
One Circuit / Parallel Batteries
This power configuration, seen in Figure 61, is very similar to the one battery, one circuit configuration, and man-ages to solve many of that configuration’s issues as well. The large, heavy, and expensive single battery is replacedwith multiple light, small, and cheap and accessible batteries. This configuration maintains simplicity while al-lowing for a fail-safe system, where power loss in one battery doesn’t guarantee failure as the other batteries stilloperate in parallel and can supply at least enough power to land the aircraft safely. The most complicated part ofthis power configuration is the design requirement of the PDB, which, while not insubstantial, is within the scopeand ability of the project group. The pros and cons for the one circuit, parallel batteries configuration are listed inTable 66.
05/04/20 94 of 124
University of Colorado Boulder
FFR

Aerospace Senior Projects ASEN 4028
Figure 61. Power Configuration Diagram
Table 66. One Circuit / Parallel Batteries Pros and Cons
Pros Cons
- Cheaper, more accessible batteries - Could be heavier than one battery
- Maintains simplicity - PDB design required
- Reliable
- Parallel batteries act as fail-safes
Two Circuits
This power configuration splits the aircraft’s electronics into two distinct circuits powered by separate batteries,the Propulsion subsystem getting a large battery to itself with power going straight to the motor, and a smallerbattery powering a more straightforward PDB design that directs the power to the Control and Data subsystems.This design can be seen in Figure 62. The PDB would be much easier to design than the one circuit configurationas it would be dealing with much lower current requirements. This configuration also has the advantage of a one-way fail-safe system, where if the propulsion subsystem experiences power-loss, control to the aircraft can remain,and a glided-in landing can be still possible. However, having multiple battery systems will likely be heavier than aone circuit system and could be more prone to failure due to complications. The pros and cons for the two circuitspower configuration are listed in Table 67.
05/04/20 95 of 124
University of Colorado Boulder
FFR

Aerospace Senior Projects ASEN 4028
Figure 62. Power Configuration Diagram
Table 67. Two Circuits Pros and Cons
Pros Cons
- Control survives propulsion failure - Complicated
- Less design required PDB - Only one-way fail-safe
- Heavy
Three Circuits
The final power configuration examined for this trade study is having a battery to power each subsystem on theaircraft, roughly three circuits in total, as shown in Figure 63. This setup avoids the design requirement of the PDB,as batteries could be picked to be tailored to each subsystem, requiring no extra power management or condition-ing. All those batteries, however, could mean a significant weight and space requirement. The separation of thesubsystems also invites circuit interactions, and each circuit would have to be carefully grounded and insulatedfrom the others. A backup\fail-safe system would be possible just like the two circuit configuration, but failureswould likely happen more often as the configuration is so complicated. The pros and cons for the three circuitspower configuration are listed in Table 68.
05/04/20 96 of 124
University of Colorado Boulder
FFR

Aerospace Senior Projects ASEN 4028
Figure 63. Power Configuration Diagram
Table 68. Three Circuits Pros and Cons
Pros Cons
- No PDB required - Very complicated
- Backup / fail-safe system possible - Heavy
- Circuit interactions
Power Configuration Trade Study
Criteria
The most important criteria for the aircraft’s power configuration are weight and cost. Weight is an obvious impor-tant metric, as aircraft need to be as light as possible in order to fly as efficiently as possible, with low wing-loading.Cost is also essential for this trade study, as the one battery configuration is so much more expensive than usingthe smaller, more accessible batteries, it is worried that the large batteries could become quite the budgetary sinkon the project. These criteria will be weighted to 0.25 each.
The next tier of importance down, weighted at 0.20, is risk. This criterion encapsulates the likelihood of failure,the possibility of a fail-safe system, and possible circuit interactions. These are all very important to the aircraft,which naturally have a large amount of risk associated with them, so it is essential to try to minimize the additionalrisk as much as possible to keep the overall risk level low.
The final tier of importance, weighted to 0.15, includes the design requirement and space requirement of thepower configuration. The design requirement, mostly affected by a configurations need for a custom PDB, is a lowpriority for this project, as the design should be well within the scope and skills of this project group. Volume is, ofcourse, important as there must be space on the aircraft to place the required power configuration; however, space
05/04/20 97 of 124
University of Colorado Boulder
FFR

Aerospace Senior Projects ASEN 4028
is much less important than weight, so the weighting of these criteria is low, as seen in the following Table 69.
Table 69. Weighting of Trade Criteria
Criterion: Weight Design Requirement Volume Risk Relative Cost
Weight: 0.25 0.15 0.15 0.20 0.25
Weight - The expected weight/mass of a power configuration, while usually measured, will instead be compar-atively scaled across the trade study, as it can only be estimated at this stage in design. This modeling results in thefollowing scoring system shown in Table 70.
Table 70. Weight Scoring Definition
Weight (kg): Heaviest Heavy Moderate Light Lightest
Score : 1 2 3 4 5
Design Requirement - The expected amount of time required to design the power configuration, while usuallymeasured, will instead be scaled across the trade study, as it can only be estimated at this stage in the design, asseen in Table 71.
Table 71. Design Requirement Scoring Definition
Design Requirement (h): Highest High Moderate Low Lowest
Score : 1 2 3 4 5
Volume - The expected space requirement of the power configuration, while usually measured, will instead bescaled across the trade study as seen in Table 72, as it can only be estimated at this stage in the design.
Table 72. Volume Scoring Definition
Volume (m3): Highest High Moderate Low Lowest
Score : 1 2 3 4 5
Risk - Risk is a combined metric of the likelihood of failure, the possibility of a fail-safe system, and possiblecircuit interactions. As it is a unitless metric, it will be measured in general levels, where lower risk is better. Theselevels are shown in the following Table 73.
Table 73. Risk Scoring Definition
Risk (Unitless): Very High High Moderate Low Very Low
Score : 1 2 3 4 5
Relative Cost - Relative cost is measured in comparative price across the power configuration, as seen in Table74. This metric is mostly looking at the cost of the battery, and will be estimated at this stage in the design.
Table 74. Relative Cost Scoring Definition
Relative Cost ($): Highest High Moderate Low Lowest
Score : 1 2 3 4 5
One Circuit / One Battery Scores
Weight: 5 - One circuit / one battery is likely the lightest configuration possible due to the simplicity.Design Requirement: 3 - One circuit / one battery has a moderate design requirement due to the complicated
PDB required.Volume: 3 - One circuit / one battery has a moderate space requirement due to the large size of the battery
powering the entire aircraft.
05/04/20 98 of 124
University of Colorado Boulder
FFR

Aerospace Senior Projects ASEN 4028
Risk: 4 - The simplicity of the one circuit / one battery configuration minimizes risk; however, no fail-safesystem is possible with only one battery.
Relative Cost: 2 - This is likely one of the most expensive power configurations due to the high price of such alarge battery.
One Circuit / Parallel Batteries Scores
Weight: 4 - Due to the increase in the number of batteries, this configuration is likely slightly heavier than the onebattery configuration, however, it maintains the simplicity of one circuit and therefore is still relatively light.
Design Requirement: 3 - One circuit/parallel batteries has a moderate design requirement due to the compli-cated PDB required.
Volume: 5 - With small batteries and a simple power configuration, one circuit/parallel batteries is likely theleast space using power configuration.
Risk: 5 - The parallel batteries can act as fail-safes for each other, as if one battery loses power, the aircraftmaintains power from the others. With the simplicity maintained (and therefore no circuit interactions), the onecircuit/parallel batteries power configuration is very safe.
Relative Cost: 5 - The expensive single battery is replaced with multiple cheap, accessible batteries, making theone circuit/parallel batteries power configuration very economical.
Two Circuits
Weight: 3 - Two circuits are more complicated than one, and with multiple batteries, this power configuration islikely heavier than the one circuit configurations.
Design Requirement: 4 - The two circuit configuration uses a much less complicated PDB, reducing the designrequired for this power configuration.
Volume: 4 - Two circuits likely take up more space than one with parallel batteries, but still use less than theenormous size of the one single battery.
Risk: 5 - The two circuit power configuration is one-way fail-safe, as control can remain if propulsion fails.There is moderate circuit interaction levels from the two circuits. Overall, this power configuration pretty safe.
Relative Cost: 4 - While cheaper than the single large battery, this system still probably is more expensive thanthe one circuit, parallel batteries configuration due to its complication.
Three Circuits
Weight: 3 - The three circuit power configuration is very complicated, has many batteries, and would likely, there-fore, be moderately heavy.
Design Requirement: 5 - Three circuits means power to each subsystem can be tailored to exactly what isneeded, and therefore no PDB design is required for this power configuration.
Volume: 3 - With the many batteries three circuits requires, and the required insulation to prevent circuit inter-actions, three circuits would likely be moderately space heavy.
Risk: 4 - Three circuits allows for a fail-safe system, and keeping each subsystem independent increases thelikelihood for a safe recovery after any power failure. However, with the complications and circuit interactions,there is still room for risk in this power configuration.
Relative Cost: 3 - With three circuits requiring three separate sets of batteries, this power configuration is likelymoderately priced.
Scoring Summary
Table 75 shows the results of the Power Configuration trade study. The One Circuit / Parallel Batteries configurationcame out as the clear winner of the study and seems the most logical choice of configuration overall. Therefore,the baseline design will go forward with the one circuit, parallel power configuration.
05/04/20 99 of 124
University of Colorado Boulder
FFR

Aerospace Senior Projects ASEN 4028
Table 75. Power Configuration Trade Study Matrix
One Circuit
One Battery
One Circuit
ParallelTwo Circuits Three Circuits
Evaluation Criteria Weighting Score Score Score Score
Weight 0.25 5 4 3 3
Design Requirement 0.15 3 3 4 5
Volume 0.15 3 5 4 3
Risk 0.20 4 5 5 4
Relative Cost 0.25 2 5 4 3
Total Score (Normalized to 5) 3.45 4.45 3.95 3.50
Propulsion
Propulsion Configuration
The box-wing design profoundly influences the configuration of the propulsive elements of the aircraft. It is cru-cial to select the proper setup so that internal moments, weight, and power consumption are diminished whileefficiency, thrust, and stability are prioritized.
The choice between different kinds of propulsive units is not part of this study, as the choice of feasible solu-tions is extremely limited. RC aircraft rarely step outside the domain of electric motors in the modern industry.Alternatives to a standard propeller, such as a gas-powered or a miniaturized jet propulsion unit exist, but areeither inefficient, impractical, or wildly outside the limitations of the team’s budget and expertise. As such onlyconfigurations of a standard electric motor/propeller combo were examined.
Double Pusher / Reflexed
The double pusher design, shown in Figure 64, consists of a twin motor assembly. These motors are to be locatedat the trailing edge of the wing, configured such that the propellers are behind most of the airframe, pushing theaircraft forward. This assembly would hold the motor casings far from the ground, preventing damage duringlanding. However, the shape of the airfoils would have to be modified to account for the off-center thrust vector,as well as the implementation of the motors into the wing structure. When mounted on the top wing, the bot-tom wing must present reflexed camber to produce pitch stability. This arrangement would significantly limit theoperational capacity of the aircraft, as only a small range of flight speeds would allow for pitch stability. Finally,the motors would have to be housed at a certain distance underneath the airfoil, so no losses in the thrust areexperienced. The pros and cons for such a setup are given in Table 76.
05/04/20 100 of 124
University of Colorado Boulder
FFR

Aerospace Senior Projects ASEN 4028
Figure 64. Double Pusher with Reflexed Wing, Side View
Table 76. Double Pusher / Reflexed Pros and Cons
Pros Cons
- Negligible flow disturbances and data noise
- Decreased mass and power consumption
- Pitch stable at effective speed
- Distributed structural load
- Easy maintenance
- Thrust loss due to disturbed wing flow
- Precise machining of the lower airfoil
- Small operation range of speeds
- Extra mass on the system
- More power is necessary
Puller Configuration (Double/Single + Reflexed Wing)
The puller configuration, seen in Figure 65, consists of a motor assembly ahead of the airframe. This configura-tion presents a significant increase in propulsive performance, as the flow of air over the wing is accelerated bythe propellers, generating more lift and improving the overall performance of the aircraft. Nevertheless, this con-figuration presents difficulties in protecting the motors, as the aircraft likely would tip over on landing with thisconfiguration. Just as in the wing-mounted pusher case, flight stability can only be achieved when a reflexed wingis introduced to the system to counterbalance the propulsive pitching moment. The operational speed range ofthe aircraft is significantly decreased to maintain equilibrium. Pros and cons of the puller configuration are givenin Table 77.
05/04/20 101 of 124
University of Colorado Boulder
FFR
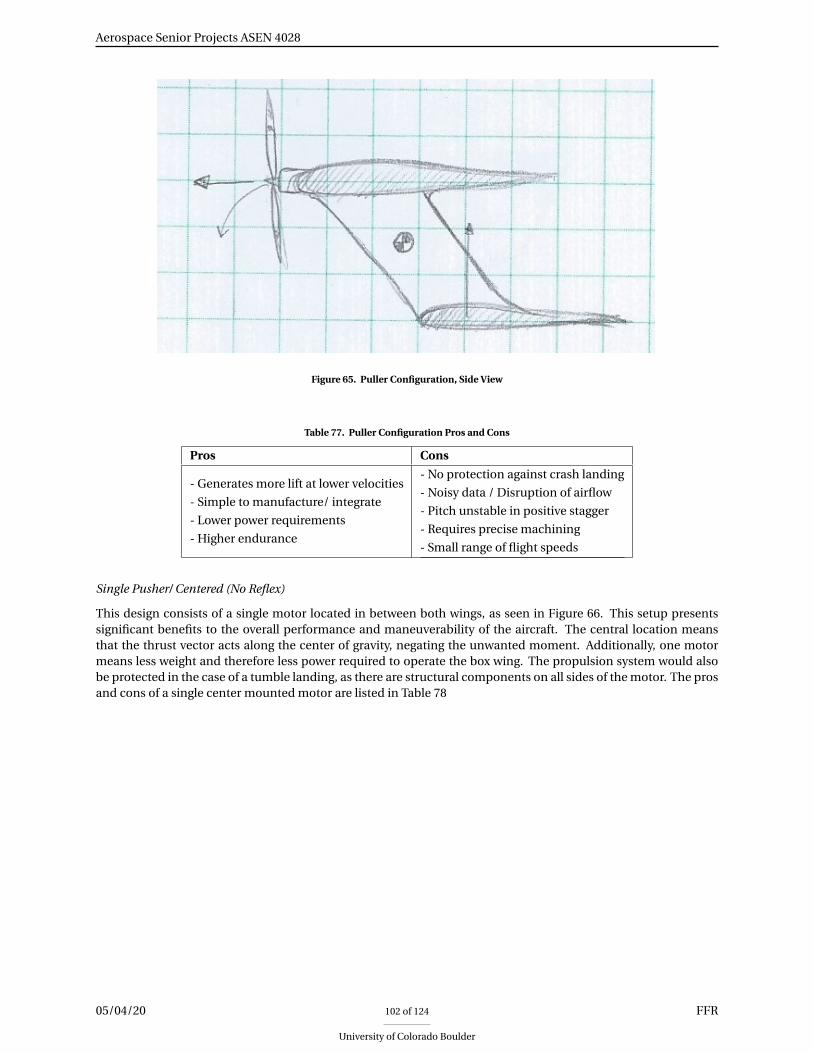
Aerospace Senior Projects ASEN 4028
Figure 65. Puller Configuration, Side View
Table 77. Puller Configuration Pros and Cons
Pros Cons
- Generates more lift at lower velocities
- Simple to manufacture/ integrate
- Lower power requirements
- Higher endurance
- No protection against crash landing
- Noisy data / Disruption of airflow
- Pitch unstable in positive stagger
- Requires precise machining
- Small range of flight speeds
Single Pusher/ Centered (No Reflex)
This design consists of a single motor located in between both wings, as seen in Figure 66. This setup presentssignificant benefits to the overall performance and maneuverability of the aircraft. The central location meansthat the thrust vector acts along the center of gravity, negating the unwanted moment. Additionally, one motormeans less weight and therefore less power required to operate the box wing. The propulsion system would alsobe protected in the case of a tumble landing, as there are structural components on all sides of the motor. The prosand cons of a single center mounted motor are listed in Table 78
05/04/20 102 of 124
University of Colorado Boulder
FFR

Aerospace Senior Projects ASEN 4028
Figure 66. Single Motor Pusher, Top View
Table 78. Single Pusher/ Centered Pros and Cons
Pros Cons
- Less mass
- No interference in wing structure
- Stable flight at a range of speeds
- No reflexed airfoil
- Cheaper
- Less thrust compared to a twin system
- No thrust differential possible
- Disruption of airflow
- Structural concerns
Double Pusher / Centered (No Reflex)
The double centered pusher system is a very reliable and well-tested design. This setup, pictured in Figure ??allows for the maximum amount of thrust to be delivered while still maintaining the negligible internal momentsand protecting the motors from potential impacts. This system allows for the implementation of differential thrustto aid with yaw control. Nevertheless, this method also introduces additional weight and undesired noise in thedata collected in the FADS system due to the location of the propellers and size of their influence. Pros and cons ofsuch a setup can be seen in Table 9.
Figure 67. Centered Double Pusher, Front View
05/04/20 103 of 124
University of Colorado Boulder
FFR

Aerospace Senior Projects ASEN 4028
Table 79. Double Pusher / Centered Pros and Cons
Pros Cons
- Propellers allow for rapid acceleration
- Simple manufacturing and integration
- Better structural support
- Integration of other systems is compromised
- Splits fuselage section in two
- Disrupts airflow
- Noisy data
- Extra mass
Multiple Engine
The multi-engine setup presents a simple and intuitive solution to the propulsion configuration, and can be seenin Figure 68. Nevertheless, it presents significant drawbacks. The implementation of the multiple motors presentsa substantial increase in both the mass and power required in the system. Furthermore, it is known that the vastmajority of the autopilot boards are not able to integrate this multi-engine setup. Additionally, the structural andelectrical integration of this setup would be an extremely challenging design. A multi-engine setup’s pros and conscan be found in Table 9.
Figure 68. Multi-Engine Configuration, Top View
Table 80. Multiple Engine Pros and Cons
Pros Cons
- Distributed Structural loading
- Better maneuverability
- No reflexed airfoil
- Redundancy
- Reliable
- Manufacturing and integration difficulties
- Not protected from crash landing
- Significantly more expensive
- More power required
- More mass
05/04/20 104 of 124
University of Colorado Boulder
FFR

Aerospace Senior Projects ASEN 4028
Propulsion Configuration Trade Study
Criteria
The selection criteria were divided into three degrees of importance. Higher tiers represented more critical ele-ments for mission success. Accordingly, the first level consisted of survivability and implementation of the setup.Survivability is directly related to the required 10 flight cycles. The propulsive system should be able to withstandall cycles without major damages. The implementation criterion ensures that the selected setup presents negligi-ble interference in the performance of all remaining onboard systems and airflow. The second tier incorporatesweight and manufacturing of each setup. The weight criterion accounts for all the mass necessary for the setupto function. Manufacturing accounts for housing integration, wiring, and autopilot integration. Lastly, due to thelimited budget, pricing was considered. These criteria and their weights can be seen in Table 81.
Criterion: Survivability Implementation Reliability Manufacturing Price
Weight: 0.25 0.25 0.20 0.20 0.10
Table 81. Weighting of Propulsion Trade Criteria
Survivability - The survivability is directly related to the location of the motors. The system should be pro-tected from a possible crash. Therefore, the safest location is at the center of the airframe, where structural com-ponents can provide physical shielding. This is followed by the trailing edge of the top wing. This position allowsthe propulsive units to be as far from the ground as possible. Finally, the least desirable positions are along thefront of the aircraft, as the aircraft is expected to tip forward on landing, almost certainly damaging the propulsiveelements. This translated into the following scoring system seen in Table 82.
Table 82. Survivability Scoring Definition
Survivability: Bottom Front Top Front Bottom Back Top Back Middle
Score: 1 2 3 4 5
Implementation - The implementation criterion is intimately related to the utilized number of motors. Asshown in Table 83, a greater number of motors can cause challenges in the installation process, as well as introduceflow disturbances, which add noise in the collected data.
Table 83. Implementation Scoring Definition
Implementation: Five Motors Four Motors Triple Motor Twin Motor Single Motor
Score: 1 2 3 4 5
Weight - As is the case with all aerospace projects, weight is a critical factor to keep under consideration. Inthe interest of extending the flight duration and maneuverability of the aircraft, the design should seek to reduceweight as much as possible. Nonetheless, due to the added thrust force imparted by more powerful propulsion sys-tems, one could also expect to achieve some advantages by using a more substantial propulsive unit. The resultingscoring system is given in Table 84.
Table 84. Weight Scoring Definition
Weight: Five Motors Four Motors Triple Motor Twin Motor Single Motor
Score: 1 2 3 4 5
Manufacturing - Based on previous experience building remote control model planes, the team was able toestimate an approximate time frame for assembling each propulsive setup. Front-mounting engines takes approx-imately 2 hours, back-mounting engines take 4 hours, and middle-mounted engines approximately take 3 hours.These times were then propagated by the number of motors each setup uses, and resulted in the scoring systemlaid out by Table 85.
05/04/20 105 of 124
University of Colorado Boulder
FFR

Aerospace Senior Projects ASEN 4028
Table 85. Manufacturing Scoring Definition
Manufacturing (Hours): 20 16 10 8 <5
Score: 1 2 3 4 5
Price - The propulsion system tends to be one of the more expensive components in a remote-controlled modelalong with the batteries. Therefore, the price was taken into consideration. The cost will vary with both the quantityand size of the motors. Nevertheless, this criterion will focus only on the number of motors, since sizing can onlybe determined at later stages of the design process. This is reflected in the scoring system shown in Table 86.
Table 86. Price Scoring Definition
Price: Five Motors Four Motors Triple Motor Twin Motor Single Motor
Score: 1 2 3 4 5
Double Pusher / Reflexed Wing Scores
Survivability: 4 - Position at the top and back of the aircraft will distance the motor units from the ground onlanding.
Implementation: 4 - Motor casing will alter airfoil somewhat, though FADS will be almost free of disturbance.Weight: 2 - Two motors and casings will be heavier than one.Manufacturing: 2 - Implementing into the wing structure could present a technical challenged, though this
heavily depends on the design chosen for the wing.Price: 4 - Two motors and casings represent a middle-ground between single motor configurations and more
complex ones.
Puller Configuration + Reflexed Wing Scores
Survivability: 2 - Propellers will likely be damaged when the aircraft tips over, though sweep may prevent this if thelanding is slow enough.
Implementation: 3 - Similar to the other wing-mounted configurations, though FADS will be heavily impactedWeight: 3 - Similar to other double-wing mounted configurationsManufacturing: 2 - Similar to other double-wing mounted configurationsPrice: 5 - Similar to other double-wing mounted configurations, though the likelihood of propellers breaking
must also be considered.
Single Pusher / Centered (No Reflex) Scores
Survivability: 4 - Structure shields the motor and propellers against all but the most severe landings, but fewerstructural components weakens the frame as a whole.
Implementation: 4 - Motor casing can be readily implemented into strut, with wiring running through thestructural component. No thrust differential, but limited disruption of airflow for FADS.
Weight: 5 - Only one motor, with a lightweight plastic casing.Manufacturing: 5 - Casing can be 3D printed without much technical challenge.Price: 5 - Again, only one engine with a simple, cheap casing.
Double Pusher / Centered (No Reflex) Scores
Survivability: 5 - Structure protects propeller unitsImplementation: 4 - Can be readily implemented into a double-strut structural configuration. Also allows for
thrust differential control if need be.Weight: 2 - Added weight from both the structural components and the propulsive units.Manufacturing: 4 - Relatively simple to integrate into vertical struts.Price: 4 - Two motors is twice as much as one. The additional structural component may add to price.
05/04/20 106 of 124
University of Colorado Boulder
FFR

Aerospace Senior Projects ASEN 4028
Multiple Engine Scores
Survivability: 2 - More chances for crippling damage, but shielded by the wing surfaces.Implementation: 3 - Wiring and integration will extend to every wing surface and modify the aerodynamic
properties of the aircraft significantly. However, decentralizing propulsion limits the structural impact, as well asthe magnitude of airflow disturbances.
Weight: 2 - Potentially quadruple the weight of a single-engine configuration, though smaller engines will likelybe used.
Manufacturing: 1 - Requires more manufacturing time than any other configuration.Price: 1 - More engines means more money.
Scoring Summary
The scoring summary in Table 87 presents an overview of each configuration. As a general trend, all multi-motorsetups suffered under the criteria of implementation, weight, and price. Conversely, all single-engine designsexcelled in these same criteria. The center placement of the motors also presented a definite advantage. Finally,the single centered pusher achieved high scores in all categories and was the clear winner by a significant margin,and will be what conceptual design goes forward with.
Table 87. Propulsion Configuration Trade Study Matrix
2 Pusher Puller 1 Pusher / Centered 2 Pusher / Centered Multiple
Evaluation Criteria Weighting Score Score Score Score Score
Survivability 0.25 4 2 4 5 2
Implementation 0.25 4 3 4 4 3
Weight 0.20 2 3 5 2 2
Manufacturing 0.20 2 2 5 4 1
Price 0.10 4 5 5 4 1
Total Score (Normalized to 5) 3.2 2.75 4.5 3.85 1.95
Structures
Wing Span
One Meter Span
A one meter span is the smaller of the two choices. This aircraft would measure one meter from wingtip to wingtip.A smaller wingspan requires less resources from a logistics standpoint, with less mass and material, a lower overallprototype cost, and easier transport; however, it may require more inventive solutions than a larger wing for inte-gration of systems into the wing. A smaller span experiences less severe moments at the wingtips, meaning it hasa better chance of survival on a rough landing. The pros and cons of a one meter wingspan are listed in Table 88.
Table 88. One meter wingspan Pros and Cons
Pros Cons
- Less mass and structure
- Lower material cost
- Easier to manufacture
- Greater chance for multiple prototypes
- Handles launch and landing stresses better
- More compatible with available launch methods
- Easier to transport
- Greater maneuverability in flight
- Requires larger control surfaces
- More susceptible to wind and turbulence
- Less wing space to integrate payload and electronics
- Integration of sensors will have a greater impact on
the coefficient of lift because it will deform a larger
portion of the wing surface
05/04/20 107 of 124
University of Colorado Boulder
FFR

Aerospace Senior Projects ASEN 4028
Two Meter Span
A two meter span is the larger of the two choices. This aircraft would measure two meters from wingtip to wingtip.A larger wingspan is less susceptible to wind and turbulence in flight as it is heavier and has the potential for morerobust control surfaces. Additionally, a larger planform allows for more flexibility with placement of subsystems,electronics, and sensors, and the aerodynamics of the wing will be less affected by the integration of those sensorssince less of the wing surface is being deformed. The pros and cons of a two meter wingspan are listed in Table 89.
Table 89. Two meter wingspan Pros and Cons
Pros Cons
- Requires smaller control surfaces
- Less susceptible to wind and turbulence
- More wing space to integrate payload and electronics
- Integration of sensors will have a smaller impact on
the coefficient of lift because it will deform a smaller
portion of the wing surface
- More mass and structure
- Greater material cost
- Harder to manufacture
- Smaller chance for multiple prototypes
- Handles launch and landing stresses worse
- Less compatible with available launch methods
- Harder to transport
- Less maneuverability in flight
Wing Span Trade Study
Criteria
The criteria for this trade study include launch methods, survivability, system integration, manufacturability, sen-sor integration, and mass. The launch methods that are compatible with the different spans is a hugely importantconsideration. The ability to safely and consistently launch the aircraft is paramount to the success of the mission,and the size of the airframe can be a limiting factor with some of the launching methods being investigated. Sur-vivability is also an extremely important consideration. The aircraft must be able to make ten consecutive flightsso the effect of the size of the airframe on that ability is a major consideration. Since these two metrics are the mostimportant and the most limiting, they are weighted the highest at 0.25.
The second tier of criteria consists of the compatibility of system integration. The ability to include all nec-essary systems on the plane must be considered, however is less limiting than survivability and launch methodbecause there is a greater potential for creative solutions. Since system integration is of nearly the same impor-tance as survibability and launch methods, it is weighted at 0.20.
The final tier of criteria consists of manufacturability, mass, and system integration effect. Manufacturabilityand mass can be more easily accommodated for and have a plethora of potential viable solutions to mitigate theireffects, however they should still be considered so as not to unnecessarily increase the complexity of the design.The effect of the sensor integration should be small since the sensors will be flush with the wingform, however it isa significant requirement and should therefore be considered. These criteria are weighted the lowest at 0.10.
The weighting of these criteria has been compiled in the following Table 90 for convenience.
Table 90. Weighting of Trade Criteria
Criterion: Launch Systems Survivability System Integration Manufacturability Mass Sensor Integration
Weight: 0.25 0.25 0.20 0.10 0.10 0.10
Launch Systems - The scoring for launch system compatibility, given in Table 91, is dependent on the numberof considered launch systems the airframe is compatible with. Compatibility with a launch method requires thelaunch method be able to interface with the airframe given it’s wingspan with no major modifications needing tobe made to the launch system.
Table 91. Launch Systems Scoring Definition
Launch Systems: Zero Compatible Methods One Method Two Methods Three Methods Four to Five
Score: 1 2 3 4 5
05/04/20 108 of 124
University of Colorado Boulder
FFR

Aerospace Senior Projects ASEN 4028
Survivability - The scoring for survivability is dependent on how the wingspan affects the ability of the airframeto complete takeoff, flight, and landing with no major damage. This takes into account how much the airframewill be affected by an impact during a hard landing or takeoff, as well as how the airframe will react to forces inflight. "Low" survivabibility means the aircraft would be drastically affected by the impact in launch, landing, andflight due to the wingspan, imposing severe limitations on the flight envelope of the aircraft and requiring rigorousreinforcement for launch and landing. "High" survivability means the aircraft would be unaffected by the impactof launch, landing, and flight due to the wingspan, imposing no limitations on the flight envelope of the aircraftand requiring no reinforcements for launch and landing. This is reflected in the scoring system shown in Table 92.
Table 92. Survivability Scoring Definition
Survivability: Low Moderate High
Score: 1 2 3 4 5
System Integration - The scoring for system integration is dependent on how easily storage space for the dif-ferent systems can be found or created in the airframe and how much variation there can be in this placement.The placement of systems will have an immediate impact on the aircraft’s center of gravity and thus the airframemust be able to support a subsystem configuration which will allow for a centerline center of gravity for stability. Alarger and thicker wing will provide the greatest opportunity for variation in placement. "Low" system integrationmeans there are no possible configurations in the given wingspan which would allow for a centerline center ofgravity and protection of these systems. "High" system integration means there are many possible configurationswhich would allow for a centerline center of gravity and several which allow for full protection of all subsystems.This relative scale can be seen in Table 93.
Table 93. System Integration Scoring Definition
System Integration: Low Moderate High
Score: 1 2 3 4 5
Manufacturability - The scoring for manufacturability, shown in Table 94, will consider the time, complexity,tooling, and material needs for the given wingspan. The time it takes to build a single prototype from start to finishwill be a factor, with a shorter build time receiving a better score. The techniques required for construction of alarger member may be more complicated to provide the same level of structural integrity as a smaller member. Thecomplexity of the techniques required to maintain the needed strength will be a factor, with more complex tech-niques scoring lower. The availability and cost of tooling required to build a given wingspan is a consideration,with more expensive and difficult to access tooling scoring lower. Finally, the material needs for a given design willbe considered, including the quantity, price, and availability of those materials. A "Low" score for manufacturabil-ity takes the longest time, is the most complex, requires the most expensive\difficult to access tooling, and has thehighest material needs. A "High" score for manufacturability takes the shortest amount of time, is the simplest,requires the least expensive\easiest to find materials, and has the lowest material needs.
Table 94. Manufacturability Scoring Definition
Manufacturability: Low Neutral High
Score: 1 2 3 4 5
Mass - The scoring for mass is dependent on the mass of the airframe. "Heavy" means the mass of the airframedue to the size of the wingspan is a burden on the design and would require extensive mitigation to achieve flight."Light" means the mass of the airframe due to the size of the wingspan is very easy to accommodate. This resultedin the scoring system shown in the following Table 95.
Table 95. Mass Scoring Definition
Mass: Heavy Neutral Light
Score: 1 2 3 4 5
05/04/20 109 of 124
University of Colorado Boulder
FFR

Aerospace Senior Projects ASEN 4028
Sensor Integration - The scoring for sensor integration will consider the variation capability of sensor place-ment and the effect the integration will have on the aerodynamic performance of the aircraft. This effect on theaerodynamic performance will be considered based on the effect on the coefficient of lift due to the percentage ofthe wingform that must be deformed to fully integrate the sensors. A "Large" effect for senor integration means anarray of sensors would be difficult to place in locations on the wing to experience different aspects of flow over thewing and the sensors would encompass a large portion of the wing surface. A "Small" effect for sensor integrationmeans an array of sensors would be extremely easy to place in various ways to measure the flow and encompassan extremely small percentage of the wing surface. The scoring scale derived from these determinations is givenin Table 96.
Table 96. Sensor Integration Scoring Definition
Sensor Integration: Large Moderate Small
Score: 1 2 3 4 5
One Meter Span
Launch System: 5 - All the launch systems investigated are able to be used with the one meter wingspan basedsolely on the wingspan constraint.
Survivabiltiy: 4 - The smaller airframe of the one meter wing span means forces applied at the ends of the wingscreate smaller moments than those which would be created on a larger airframe. This implies the one meter spanwould handle launch and landing forces with relatively little re-enforcement compared to the two meter span. Theshorter wing would also require a higher force to break it at the center, meaning the aerodynamic forces the onemeter span could handle in flight would exceed those of the two meter. However, the smaller wingspan wouldhave a lower wing loading, making the aircraft more susceptible to turbulence and wind and therefore more likelyto crash.
System Integration: 3 - The smaller and thinner wing of the one meter is more difficult to arrange the subsys-tems in than the larger and thicker wing of the two meter, but it is still possible to configure the subsystems in away to produce a center-line center of gravity. However, it is probable that not all of these configurations would beable to fully protect each of the subsystems.
Manufacturability: 5 - The one meter span aircraft will take less time to construct and fewer materials. Manymaterials are sold in one meter sections and would therefore be easily obtainable. The majority of the toolingavailable to the team can be used on this scale and the manufacturing techniques of aircraft at a one meter spanare well documented and easy to comprehend.
Mass: 5 - The mass of the one meter airframe will be considerable less due to having less material in the wing.This will be much easier to accommodate in the subsystems (such as needing smaller propulsive elements) thanthe two meter span.
Sensor Integration: 2 - The much smaller wing area of the one meter span limits sensor placement options andmakes the effect on the coefficient of lift of the aircraft of the sensors being integrated much more pronouncedthan that of the two meter aircraft. It would be much more difficult to produce a sensor array placement thatwould be exposed to many elements of the flow without interference from each other with the one meter spanaircraft.
Two Meter Span
Launch System: 2 - The two meter span is only compatible with the table-bungee and the rail-bungee system. Theother three launch systems would require extensive modification to use.
Survivabiltiy: 2 - The two meter wingspan has more to be damaged in the event of a rough landing. Addition-ally, the larger wingspan creates a longer moment arm so equal forces at the wingtips will be more severe for thetwo meter than the one meter.
System Integration: 5 - The larger and thicker wing of the two meter is easier to arrange the subsystems in thanthe smaller and thinner wing of the one meter. There are also many configurations which the subsystems would befully protected due to the increased volume of the two meter wing and the ability to nest subsystems safely insidethe wing.
Manufacturability: 2 - The two meter span aircraft will take more time to construct and more materials. Thenecessary materials may be difficult to find and expensive to obtain in such large pieces. More complex structural
05/04/20 110 of 124
University of Colorado Boulder
FFR

Aerospace Senior Projects ASEN 4028
components and higher quality materials may need to be used to compensate for the decreased rigidity of thelarger members, adding unneeded burden to the manufacturing process.
Mass: 3 - The mass of the two meter airframe will be considerably more due to having more material in thewing. This will be much harder to accommodate in the subsystems (such as needing larger propulsive elements)than the one meter span, but is not so burdensome as to prevent a feasible design.
Sensor Integration: 5 - The much larger wing area of the two meter span allows for various sensor arrangementsand makes the area of the wing deformed by the sensors a smaller percentage of the total wing area than the onemeter span, improving the aerodynamic performance of the two meter aircraft compared to the one meter.
Scoring Summary
The results of the wing size trade study are given in Table 97. The trade shows the one meter span is better than thetwo meter for the purposes of this project. The consideration of the available launch systems and the survivabilityhad a huge influence on the decision, with the one meter span being decisively better in both of these categories.While the two meter span had better scores in system and sensor integration, the potential for creative solutionsfor these two categories allows this disadvantage to be disregarded and the one meter span to be selected.
Table 97. Wing Size Trade Study Matrix
One Meter Span Two Meter Span
Evaluation Criteria Weighting Score Score
Launch Systems 0.25 5 2
Survivability 0.25 4 2
System Integration 0.20 3 5
Manufacturability 0.20 5 2
Mass 0.10 5 3
Sensor Integration 0.10 2 5
Total Score (Normalized to 5) 4.55 3.20
Landing Method
Landing safely is critical to ensuring the survivability of the aircraft. For the aircraft to be able to survive 10 flightcycles, it must be able to land without taking damage that would be detrimental to future flights. A successfullanding method is one that prioritizes safety and minimizes damage. Complexity, additional weight/drag, andreliability must also be considered when choosing a landing method.
Skid/Hard Landing
This landing would have skids attached to the bottom of the aircraft so that it could slide along the ground. Someadditional bracing on the nose of the aircraft would protect the airframe from damage if/when it tips over as wellas prevent it from rolling over. The pros and cons for a skid landing are listed in Table 98.
Table 98. Skid Landing Pros and Cons
Pros Cons
- Minimal cost/time to develop - Risk of damage to all parts of aircraft
- Land almost anywhere - Landings must be precise
- Low additional mass - May not scale to larger aircraft
Landing Gear
Landing gear is a very safe method of landing, but requires significant efforts to develop. Landing locations are alsosignificantly limited with landing gear - even gravel roads may be too uneven. While the additional mass added bythe landing gear is small, additional drag is significant. The pros and cons for landing gear are listed in Table 99.
05/04/20 111 of 124
University of Colorado Boulder
FFR

Aerospace Senior Projects ASEN 4028
Table 99. Landing Gear Pros and Cons
Pros Cons
- Lowest risk of damage - Requires very precise landing
- Low additional mass - Significant additional drag
- Requires smooth terrain for landing
- Mechanical/structural complexity
- Requires redesign for scaling
Net
A net is a method which requires minimal additional mass (if any) to the aircraft for system interface; all the massthat goes into ensuring a safe landing would be on the ground. The net also scales well because forces are dis-tributed throughout the wing. A major downside is that damage could occur, especially if the propulsion systemwere to get tangled in the net or if the aircraft misses the net entirely. The pros and cons for a net landing are listedin Table 100.
Table 100. Net Landing Pros and Cons
Pros Cons
- Land anywhere net can be deployed - Requires precise landing
- No/minimal additional mass/drag - Possible damage to/from propulsion getting tangled
- Distributed forces
- Scales well
"Catch"/Moving Landing
This landing would involve a moving vehicle matching speeds with the aircraft, allowing it to softly touch downeither on the roof or in a trailer behind the vehicle. While this could theoretically provide the softest landing forthe aircraft, safety is a serious issue with this landing. The aircraft and moving vehicle would be a serious risk tothose overseeing the landing and the added complexity of two moving pieces would increase the difficulty of thelanding. The pros and cons for a skid landing are listed in Table 101.
Table 101. "Catch"/Moving Landing Pros and Cons
Pros Cons
- No/minimal additional mass - Limited landing locations (on roads)
- Low risk of damage - Landings must be precise
- Low additional mass - Possibly not safe
Parachute
A parachute is a common method of retrieval for many light aircraft. It allows for a controlled descent and reducesdamage, especially in the case of stall or emergencies. However, there are many issues with parachutes, especiallywith this size of aircraft. The significant mass of a parachute and delicate positioning on the aircraft’s body make itvery undesirable for aircraft this light. Furthermore, windy conditions could significantly impact the performanceof a parachute. It also must be repacked between flights, which adds to the difficulty of achieving a re-flight within15 minutes. The pros and cons for a skid landing are listed in Table 102.
05/04/20 112 of 124
University of Colorado Boulder
FFR

Aerospace Senior Projects ASEN 4028
Table 102. Parachute Landing Pros and Cons
Pros Cons
- Land almost anywhere - Requires very careful placement on aircraft body
- Usable in emergency/stall - May drift to undesirable locations
- Soft landings minimize damage - Heavy
- Requires repacking
- Subject to damage
- Redesign for scaling
Landing Method Trade Study
Criteria
The landing is the most important aspect of the survivability of the aircraft. Here the aircraft is closest to theground and has the highest risk of damage. For this reason, the risk of damage to the aircraft is the second highest-weighted criteria, behind the safety of the group members. After damage and safety are considered, the rest of thecriteria are roughly equally important. The complexity determines how much resources must be devoted to thelanding method; a slightly safer landing method may not be favored if it becomes an entire subsystem on its own.The burden that the method has on the aircraft in flight is also important to consider; will the additional mass ordrag be detrimental to the aircraft flying? Finally, the landing must not be too difficult that it cannot be repeated10 times as required. The easier it is to land safely, the better the survivability of the aircraft. These weights arecompiled in Table 103.
Table 103. Weighting of Landing Method Trade Criteria
Criterion: Complexity Aircraft Risk Safety Aircraft Burden Reliability
Weight: 0.15 0.25 0.30 0.15 0.15
Complexity - This describes the structures and mechanisms involved with the landing, and how much of atime/resource commitment would be required to build this landing method, with scores assigned as shown inTable 104.
Table 104. Complexity Scoring Definition
Complexity Complex Subsystem Significant Effort Moderate Minimal Not Significant
Score: 1 2 3 4 5
Risk to Aircraft - The chance of major damage occurring to the airframe or subsystems, with scores assignedas shown in Table 105.
Table 105. Risk to Aircraft Scoring Definition
Risk to Aircraft Very High High Moderate Low Minimal
Score: 1 2 3 4 5
Safety - Chance of unsafe incidents occurring, with scores assigned as shown in Table 106.
Table 106. Safety Scoring Definition
Safety Unsafe Landing High risk of incident Moderate Very low Zero risk
Score: 1 2 3 4 5
Burden to Aircraft - Additional drag/mass due to landing method, with scores assigned as shown in Table 107.
05/04/20 113 of 124
University of Colorado Boulder
FFR

Aerospace Senior Projects ASEN 4028
Table 107. Burden to Aircraft Scoring Definition
Aircraft Burden Large Moderate Small Minimal None
Score: 1 2 3 4 5
Reliability - Ease or repeatability of landing, with scores assigned as shown in Table 108.
Table 108. Reliability Scoring Definition
Reliability Very Difficult Challenging Easy
Score: 1 2 3 4 5
Skid/Hard Landing Scores
Complexity: 4 - Some resources would go to the design of the skid and/or hardening the aircraft for impacts, butthis will not be a difficult endeavor.
Risk to Aircraft: 3 - Forces, while among the highest of the landing methods, are predictable and the aircraftcan be strengthened in those key areas.
Safety: 5 - Landing can occur a safe distance from the group.Burden to Aircraft: 4 - Skid/structural support may add some mass, minimal drag.Reliability: 3 - Landings will be fairly easy to repeat, but certain situations may cause extra damage to airframe.
Landing Gear Scores
Complexity: 1 - Likely a subsystem in itself, significant resources will have to go to the structure of a landing gearset-up.
Risk to Aircraft: 3 - Dependent on structure and placement of landing gear it could be much better, but due tothe difficulty of landing there is moderate risk.
Safety: 5 - Landing can occur a safe distance from the group.Burden to Aircraft: 2 - Landing gear would add a moderate amount of mass and a significant amount of drag.Reliability: 2 - Landing would require a straight, flat stretch of road; even gravel may make this method nearly
impossible.
Net Landing Scores
Complexity: 4 - Quite simple, some work would go into finding the right size and tension of the net and someresources may be necessary to strengthen the aircraft.
Risk to Aircraft: 2 - Net may damage the aircraft, especially the propulsion systems. Reliability also poses a riskif the aircraft misses the net.
Safety: 5 - Landing can occur a safe distance from the group.Burden to Aircraft: 5 - Very little to no mass or drag would be added to the aircraft.Reliability: 3 - Depending on the size of the net, landing could be very difficult or easy; moderate is chosen as
the in-between case.
"Catch"/Moving Landing Scores
Complexity: 3 - Moderate efforts to integrate vehicle and landing system, as well as minimizing the risk to theaircraft.
Risk to Aircraft: 2 - Reliability of landing poses serious risk to aircraft, good landings pose little/no risk toaircraft.
Safety: 2 - Landing would have to occur near one or several group members while at speed.Burden to Aircraft: 5 - Little/no additional mass would be added to the aircraft.Reliability: 2 - Landing in a small area while matching the speed of the catch vehicle would be very difficult.
05/04/20 114 of 124
University of Colorado Boulder
FFR

Aerospace Senior Projects ASEN 4028
Parachute Landing Scores
Complexity: 3 - Moderate efforts to ensure the right size/placement of parachute to minimize risk to aircraft.Risk to Aircraft: 4 - Generally low risk, but vulnerable in windy conditions.Safety: 4 - Generally safe, but windy conditions could be unsafe to group.Burden to Aircraft: 1 - Would add significant mass and drag to the aircraft.Reliability: 3 - Landing is generally easy/safe, but windy conditions impact reliability. Repacking parachute
would also impact reflight times/capabilities.
Scoring Summary
Table 109 displays the results of the landing method trade study. Skid/Hard Landing is the best choice, slightlybetter than the net landing due to the lower risk to the aircraft.
Table 109. Landing Method Trade Study Matrix
Skid/Hard Landing Landing Gear Net Moving Landing Parachute
Evaluation Criteria Weighting Score Score Score Score Score
Complexity 0.15 4 1 4 3 3
Risk to Aircraft 0.25 3 3 2 2 4
Safety 0.30 5 5 5 2 4
Burden to Aircraft 0.15 4 2 5 5 1
Reliability 0.15 3 2 3 2 3
Total Score (Normalized to 5) 3.90 3.00 3.80 2.60 3.25
Launch Method
The launching method for previous iterations of the Eagle-Owl system proved to be unsuccessful and ultimatelywere a large contributing factor in the hindrance of sustained powered flight. For this reason, the team is onlyconsidering launch systems previously used and verified by CU Boulder RC teams, specifically by the IRISS andRECUV groups on campus.
IRISS Table-Bungee Method
This method of launch involves the use of a folding card table, a bungee cord, a stake, and a quick release mecha-nism. The bungee cord is pulled back, with the tension in the cord measured using a simple force gauge accurateto about 0.5 lbf. Once the tension is at the desired value, the cord is run through a quick release mechanism andstaked down to the ground. The aircraft is then attached to the bungee using a hook, and placed on the card tablethat has been set up with a roughly 15°inclination. The team then moves away from the set up, and pulls a stringattached to the quick release mechanism. This releases the bungee, and propels the vehicle forward along the tableand into the air. This process can be seen in Figure 69, while pros and cons of the table-bungee method are listedin Table 110.
05/04/20 115 of 124
University of Colorado Boulder
FFR

Aerospace Senior Projects ASEN 4028
Figure 69. IRISS Table-Bungee Diagram
Table 110. IRISS Table-Bungee Pros and Cons
Pros Cons
- Reliable - Hook must be integrated into airframe
- Accurate force measurements - Relatively high set up time
- Appropriate forces for aircraft
- No team members immediately present
- Simple mechanical design
IRISS Hand-Bungee Method
This method is very similar to the Table-Bungee launch in that the bungee is pulled back to the desired, measuredtension and then staked down through a quick release mechanism. The cord is again attached to the aircraft usingan integrated hook, but instead of being placed on a table, the aircraft is placed in the hands of a designated teammember. This member is not throwing the aircraft into the air, but instead is simply guiding the vehicle as thebungee propels it forward. An illustration of this launch method can be found in Figure 70, while pros and cons ofthe hand-bungee method are listed in Table 111.
Figure 70. IRISS Hand-Bungee Diagram
05/04/20 116 of 124
University of Colorado Boulder
FFR

Aerospace Senior Projects ASEN 4028
Table 111. IRISS Hand-Bungee Pros and Cons
Pros Cons
- Reliable - Team member must be immediately present
- Accurate force measurements - Hook must be integrated into airframe
- Appropriate forces for aircraft
- Simple Mechanical Design
RECUV Rail-Bungee Method
The RECUV team at CU Boulder uses a similar method to the two described previously. For this type of launch, abungee cord is also used, although the tension in this cord is measured simply by feel. The bungee is then placedthrough an integrated hook on the airframe, and the aircraft is placed on a set of inclined rails. A team memberholds the vehicle on the rails and then lets go, which allows the bungee to propel the aircraft up the rails and intothe air. Figure 71 shows a visual representation of this system, while Table 112 shows the pros and cons.
Figure 71. RECUV Rail-Bungee Diagram
Table 112. RECUV Rail-Bungee Pros and Cons
Pros Cons
- Reliable launches - Team member must be immediately present
- Simple mechanical design - No exact force measurement method
- Lower force range than needed for aircraft
- Hook must be integrated into airframe
Pneumatic Launcher Method
The existing pneumatic launching system used by CU Boulder teams is mounted on the roof of an SUV. Air iskept in a pressurized tank and slowly allowed into a secondary chamber where pressure builds until it reaches anappropriate value. Once this value is reached, the incoming flow of air is cut off, and the pressure in the chamberis then released in order to propel the aircraft up the launch rail. While the aircraft sits on this rail, it is supportedby a simple L-shaped stand that works to keep it upright as it travels down the rail. A simplified diagram of such asystem, along with a table of pros and cons, can be seen in Figure 72 and Table 113
05/04/20 117 of 124
University of Colorado Boulder
FFR

Aerospace Senior Projects ASEN 4028
Figure 72. Pneumatic System Diagram
Table 113. Pneumatic System Pros and Cons
Pros Cons
- Reliable launch speeds - Much higher forces than needed by aircraft
- Little modification needed to airframe - High mechanical complexity
- Team member must be immediately present
- Customer prefers not to use this method
Car Roof Method
This method is very straight forward. As the name implies, the aircraft is simply secured to the roof of a car. Thecar then drives down a straight road at the appropriate speed, and the clamps securing the aircraft to the car’s roofare opened. The aircraft is then propelled into the air by its own motor and lift production. Once again, a diagram(Figure 73) and table of pros and cons (Table 114) is given for the car launch method.
Figure 73. Car Roof System Diagram
05/04/20 118 of 124
University of Colorado Boulder
FFR

Aerospace Senior Projects ASEN 4028
Table 114. Car Roof System Pros and Cons
Pros Cons
- Reliable launch speeds - High stress on airframe
- Unknown forces acting on aircraft
- Restricted to launch only roads
- Customer prefers not to use this method
Launching Method Trade Study
Criteria
Seven different criteria, shown in Table 115, were evaluated when considering different launching methods for theBUBO. These criteria were broken up into tiers based on importance, with these tiers then used to determine therespective weighting.
Table 115. Launch Method Criteria Weighting
Criterion:Launch Speed
Reliability
Force
Range
System
Interference
Stress on
Airframe
Number of
Components
Cost of
Replacements
Team
Safety
Weighting: 0.20 0.10 0.15 0.15 0.10 0.10 0.20
Launch Speed Reliability - The scoring for launch speed reliability is meant to encapsulate the accuracy andrepeatability of the aircraft’s speed at launch. This is closely related to how accurately the propelling forces can bemeasured, and how accurate of a model there is for determining the launch speed from these forces. The lowestexpected score for this criterion corresponds to only knowing a rough order of magnitude estimate for launchspeed (within 10 m/s), while the highest score corresponds to being able to predict launch speed to within 1 m/s.The ranges of certain launch speed reliability’s were estimated using input from experienced RECUV and IRISSpilots who have previously operated the systems. These scores are shown in the following Table 116.
Table 116. Launch Speed Reliability Scoring Definition
Launch Speed Deviation (m/s): > 10 7.5-10 5-7.5 2.5-5 0-2.5
Score : 1 2 3 4 5
Force Range - The scoring for force range of each launch system considered was based on how close the normaloperating force of launch is to the estimated force needed to propel the aircraft into the air. After discussions withvarious experienced RC pilots, it was estimated that this vehicle will require approximately 40-50 lbf during launch.This was the value used in scoring as the baseline, "target" range, with deviations from this range assigned scoresas laid out in Table 117.
Table 117. Force Range Scoring Definition
Force Range Deviation from Target (lbf ): > 15 11-15 6-10 1-5 0 (force inside target range)
Score : 1 2 3 4 5
System Interference - System interference scores were determined based on how many modifications had tobe made to the airframe in order to accommodate the launch system, and if these modifications were fixed inposition or could be placed in multiple locations on the airframe. This is reflected in the following scoring systemshown in Table 118.
Table 118. System Interference Scoring Definition
Modifications
Needed:
3 variable location or
2 fixed location2 variable location 1 fixed location 1 variable location None
Score: 1 2 3 4 5
05/04/20 119 of 124
University of Colorado Boulder
FFR

Aerospace Senior Projects ASEN 4028
Stress on Airframe - The scores for stress imparted by the launch method on the airframe were developedbased on the advice and expertise of Christopher Choate, an experienced RC pilot at CU Boulder. Since extensivestress testing could not be performed for each launch method in the time allotted, the imparted stress was eval-uated more qualitatively, with considerations taken as to how violent the launch is, how much force is involved,and what moments are imparted throughout the launch process. These all factor into the relative scoring systemshown in Table 119.
Table 119. Stress on Airframe Scoring Definition
Anticipated Stress Highest High Moderate Low Lowest
Score : 1 2 3 4 5
Mechanical Complexity - Mechanical complexity was evaluated by looking at how many moving parts eachsystem uses, as well as how intricately these parts are combined to form the launch system. Without the time tofully examine each and every part of every system, this was evaluated using a relative scale shown in Table 120.
Table 120. Mechanical Complexity Scoring Definition
Mechanical Complexity Highest High Moderate Low Lowest
Score : 1 2 3 4 5
Cost of Replacements - In order to score the replacement cost for components of each subsystem, the compo-nents with the highest chance of failing first had to be identified. Then, the cost of finding replacements or repairswas considered, and ultimately used to create a relative scale from most expensive system to least expensive, whichis given in Table 121.
Table 121. Cost of Replacement Scoring Definition
Cost of Replacement Highest High Moderate Low Lowest
Score : 1 2 3 4 5
Team Safety - One of the most vital aspects of this trade study, team safety scores were based on how manyteam members must be in the vicinity of the launch as it happens. If team members are needed nearby, the scoreswere further broken down by how much relative force is present in the launch system, which directly correspondsto how much risk the team member is exposed to. These scores were compiled by discussing the methods andfailures with pilots experienced in using each launch system, and the exact scale is given in Table 122.
Table 122. Team Safety Scoring Definition
Team Safety 2 members present1 member present;
high forces
1 member present;
moderate forces
1 member present;
low forcesNo members present
Score : 1 2 3 4 5
IRISS Table-Bungee Scores
Launch Speed Accuracy: 5 - Use of a force gauge allows for very precise knowledge of bungee tension, and launchspeed can be easily obtained from this.
Force Range: 5 - Force range typically around 45-50 lbf, right in the desired range for this aircraft.System Interference: 4 - Only needs one small hook located along center line of aircraft bottom, can be moved
fore and aft to accommodate for other systems.Stress on Airframe: 5 - Based on Chris Chaote’s advice, this method supports aircraft while not overly imparting
forcesMechanical Complexity: 4 - Only quick release mechanism, bungee, pull cord and table needed, all of which
are very simple in design.Cost of Replacements: 4 - All components are fairly cheap to replace, with the table being the main concern
should it fail.
05/04/20 120 of 124
University of Colorado Boulder
FFR

Aerospace Senior Projects ASEN 4028
Team Safety: 5 - Team members can all stand a safe distance away and simply pull the cord to launch.
IRISS Hand-Bungee Scores
Launch Speed Accuracy: 4 - Force gauge used similar to table-bungee system, but some uncertainty imparted bythe use of a human to guide during launch.
Force Range: 3 - Hand-bungee method typically used for forces of roughly 30 lbf.System Interference: 4 - Only needs one small hook located along center line of aircraft bottom, can be moved
fore and aft to accommodate for other systems.Stress on Airframe: 5 - Similar to table-bungee system, it was advised that this method does not impart a great
deal of stress on the airframe.Mechanical Complexity: 5 - This design is the most simple of all considered, needing only a bungee, quick
release mechanism, and a pull cord.Cost of Replacements: 5 - Due to the very simple design, replacement parts will not be at all expensive.Team Safety: 3 - Team member must hold aircraft as it is launched, and is subjected to moderate relative forces
in doing so.
RECUV Rail-Bungee Scores
Launch Speed Accuracy: 2 - Force in the bungee is simply measured by feel, not with any sort of gauge or otherdevice. This translates to a large unknown when attempting to calculate speed.
Force Range: 2 - This launch system is estimated to usually impart about 20-25 lbf during launchSystem Interference: 4 - Only needs one small hook located along center line of aircraft bottom, can be moved
fore and aft to accommodate for other systems.Stress on Airframe: 4 - Low stress imparted on airframe during launch, although having only two rails support-
ing near wingtips could impart bending moments near the aircraft’s center.Mechanical Complexity: 4 - Fairly simple set up, although rails need some bracing in order to support the load.Cost of Replacements: 3 - Rail braces are manufactured out of ski poles, and rails themselves are fairly large and
could be expensive to replace should they fail.Team Safety: 4 - Team member must be present but is exposed to very little tension and therefore very little
risk; teams have experienced failure with all members present and no injuries or concerns reported.
Pneumatic System Scores
Launch Speed Accuracy: 5 - Pressure gauge reading allows for accurate knowledge of forces being imparted, whichcan then be used to calculate launch speed.
Force Range: 1 - Forces typically used with pneumatic system are in the 350-400 lbf range, which is far abovethe desired range.
System Interference: 5 - Use of an L-shaped stand in theory should result in no modifications to be made toairframe.
Stress on Airframe: 1 - High forces and launch speed would impart entirely too much stress on airframe de-signed for low speed flights.
Mechanical Complexity: 1 - System is very complex with many components inside and outside of the car it ishoused in.
Cost of Replacements: 1 - Pressure valves and tanks are expensive to replace, and rail system is custom built andfitted to the car used to deploy.
Team Safety: 2 - Team member must be on hand to flip switch, very close to components moving with highforces.
Car Roof System Scores
Launch Speed Accuracy: 5 - Car’s speedometer should be accurate enough for desired launch speeds.Force Range: 3 - Forces imparted by launching are hard to model and understand, but should be somewhat
close to desired range.System Interference: 2 - System requires something to clamp onto on either side of aircraft, which can be moved
fore and aft.
05/04/20 121 of 124
University of Colorado Boulder
FFR

Aerospace Senior Projects ASEN 4028
Stress on Airframe: 1 - Aircraft sitting on top of car is subject to turbulent flow coming off of car’s hood. Due tothe large height of the aircraft, this would impart large moments on the sidewalls of the box-wing.
Mechanical Complexity: 3 - Must fit a clamps and supports to a car and design them to be operated from insidethe vehicle.
Cost of Replacements: 2 - Design components wouldn’t be extremely expensive, but there is the risk of crashingthe car used which could significantly increase cost.
Team Safety: 4 - Team member must be present, but they are inside of the car and therefore are only subjectedto the normal risks of driving.
Scoring Summary
Table 123 shows the scoring results for all 5 launch system options considered. As can be seen, the IRISS Table-Bungee system Scored the highest, and offers the best overall option when all criteria are considered. This methodscored the highest in the two Tier 1 categories of launch speed accuracy, which were determined to be the twomost important criteria in selecting a launching method for this project.
Table 123. Launching Method Trade Study Matrix
IRISS
Table-Bungee
IRISS
Hand-Bungee
RECUV
Rail-Bungee
Pneumatic
System
Car-Roof
System
Evaluation
CriteriaWeighting Score Score Score Score Score
Launch Speed Accuracy 0.2 5 4 2 5 5
Force Range 0.1 5 3 2 1 3
System Interference 0.15 4 4 4 5 2
Stress on Airframe 0.15 5 5 4 1 1
Number of Moving Parts 0.1 4 5 4 1 1
Cost of Replacements 0.1 4 5 3 1 2
Team Safety 0.2 5 3 4 2 4
Total Score (Normalized to 5) 4.65 4.05 3.30 2.60 2.85
05/04/20 122 of 124
University of Colorado Boulder
FFR

Aerospace Senior Projects ASEN 4028
Appendix B: Risk Matrix
Figure 74. Risk Matrix
Figure 75. Risk Matrix continued
05/04/20 123 of 124
University of Colorado Boulder
FFR

Aerospace Senior Projects ASEN 4028
Figure 76. Risk Matrix continued
05/04/20 124 of 124
University of Colorado Boulder
FFR