Probability Analysis for prediction of rainfall of Raipur region (Chhattisgarh)
151
1 M.Sc. Student, Dean and Professor, Professor Sundaresan School of A.H. and Dairying SHIATS, Allahabad – 211007 (U.P.) The Allahabad Farmer Vol. LXVII, January - 2012 No. 2 Effect of lactation order on quality of raw milk in crossbred cows Mahakar Singh , Jagdish Prasad and Neeraj ABSTRACT Present study was undertaken to determine fat, protein, lactose, ash, water, sp. gr., S.N.F. and T.S. for compositional quality and to determine standard plate count (SPC), proteolytic bacterial count (PBC), lipolytic bacterial count (LBC), lactic acid bacterial count (LABC) and coliforms for bacterial quality of raw milk as influenced by lactation order of crossbred cows at SHIATS Dairy Farm, Allahabad. The analysis of variance showed significant effect of lactation order on T.S., fat, water, acidity; but non-significant differences in SPC, LABC, PBC, LBC, CC; Sp. gr., S.N.F., protein, lactose, and ash in raw milk. Results revealed non significant effect of lactation order on bacterial parameters of raw milk quality. Among the chemical parameters a significant effect of lactation order on T.S., fat, water and acidity was found but no significant effect on sp. gr., S.N.F., protein, lactose and ash was observed. Key Words: Lactation order, crossbred cows, milk quality INTRODUCTION Contamination of milk with spoilage and disease producing microorganisms may occur at any stage from production to distribution. Microbial population depends upon the conditions associated with the production and handling of milk. Though India has become the largest milk producer of 114 million tons in year 2010-11 but quality of raw milk particularly the bacteriological quality is far below from satisfaction (Bhasin, 2011). Lactation yield is an important trait of dairy animals because it gives return to the milk producers. It depends upon duration in milk and lactation order of animal (Bhaskar and Gupta, 1992). Whether lactation order has any influence on the bacterial as well as chemical quality of milk, the present investigation has been undertaken.
Transcript of Probability Analysis for prediction of rainfall of Raipur region (Chhattisgarh)

1
rrrrrM.Sc. Student, mmmmmDean and Professor, nnnnnProfessor
Sundaresan School of A.H. and Dairying
SHIATS, Allahabad – 211007 (U.P.)
The Allahabad Farmer Vol. LXVII, January - 2012 No. 2
Effect of lactation order on quality of raw milk incrossbred cows
Mahakar Singhrrrrr, Jagdish Prasadmmmmm and Neerajnnnnn
ABSTRACT
Present study was undertaken to determine fat, protein, lactose, ash, water, sp.
gr., S.N.F. and T.S. for compositional quality and to determine standard plate
count (SPC), proteolytic bacterial count (PBC), lipolytic bacterial count (LBC),
lactic acid bacterial count (LABC) and coliforms for bacterial quality of raw milk
as influenced by lactation order of crossbred cows at SHIATS Dairy Farm,
Allahabad. The analysis of variance showed significant effect of lactation order
on T.S., fat, water, acidity; but non-significant differences in SPC, LABC, PBC,
LBC, CC; Sp. gr., S.N.F., protein, lactose, and ash in raw milk. Results revealed
non significant effect of lactation order on bacterial parameters of raw milk quality.
Among the chemical parameters a significant effect of lactation order on T.S.,
fat, water and acidity was found but no significant effect on sp. gr., S.N.F.,
protein, lactose and ash was observed.
Key Words: Lactation order, crossbred cows, milk quality
INTRODUCTIONContamination of milk with spoilage and disease producing microorganisms may
occur at any stage from production to distribution. Microbial population depends uponthe conditions associated with the production and handling of milk. Though India hasbecome the largest milk producer of 114 million tons in year 2010-11 but quality of rawmilk particularly the bacteriological quality is far below from satisfaction (Bhasin, 2011).Lactation yield is an important trait of dairy animals because it gives return to the milkproducers. It depends upon duration in milk and lactation order of animal (Bhaskar andGupta, 1992). Whether lactation order has any influence on the bacterial as well aschemical quality of milk, the present investigation has been undertaken.

2
MATERIALS AND METHODSJersey × Sindhi crossbred cows of livestock unit of Sam Higginbottom Institute of
Agriculture, Technology and Sciences were subjected to Californian Mastitis Test and24 cows with healthy udders and without any noticeable injury on udder between 150 to200 days in lactation were selected. Four cows were kept in each of six lactation order.Sanitary precautions like clipping of long hairs on the udder and flank, grooming, washingof udder and teat with clean water before milking mammary quarters, wiping with towelsoaked in 2% benzytol disinfecting solution, tying tail with leg were taken care prior tocollection of milk samples. Cows were milked by full hand diagonal method of milking.Two streams of fore-milk from each quarter of udder were discarded as perrecommendation of Singh and Prasad (1987). Then a representative sample of 200 mlmilk was collected from udder directly into sterilized conical flask and plugs replacedimmediately. Samples were brought to laboratory for determination of standard platecount (SPC) and four physiological groups of bacteria viz. lactic acid bacterial count(LABC), proteolytic bacterial count (PBC), lipolytic bacterial count (LBC) and coliformsas per Chalmers (1953). After microbial analysis the samples were used for determiningchemical quality in terms of T.S., fat, S.N.F., lactose, protein and ash percentage in milk.
RESULTS AND DISCUSSIONBacteriological Parameters
Mean population densities of different bacterial groups per ml of raw milk is givenin Table 1. Mean SPC/ml (104) was 188.1, 232.4, 199.9, 243.5, 294.7 and 238.9 in rawmilk of crossbred cows of first, second, third, fourth, fifth and sixth lactation order,respectively. The differences in these values of SPC were non significant. Theseobservations were in agreement with the results of Neeraj and Prasad (1991). LABC/ml (103) was recorded as 25.42, 24.1, 29.8, 42.26, 18.4 and 19.75 in raw milk of crossbredcows of first, second, third, fourth, fifth and sixth lactation order, respectively. Thedifferences in these results of LABC were also found non significant. Results withregard to poplation densities of LABC in milk were in agreement with Anna and Prasad(1989). Similarly mean LBC/ml (102) was recorded as 17.09, 12.25, 14.6, 18.18, 18.95and 12.5 in raw milk of crossbred cows of first, second, third, fourth, fifth and sixthlactation order, respectively. The differences in LBC were not significant. Results indicateda reduction in LBC count per ml of milk after fourth lactation but not significant. Withregard to population densities per ml, results of LBC in raw milk were in agreement withSingh and Prasad (1987). Another physiological group PBC/ml (102) was recorded as
Mahakar Singh, Jagdish Prasad and Neeraj

3
21.96, 23.55, 18.55, 21.98, 19.55 and 16.0 in raw milk of crossbred cows of first, second,third, fourth, fifth and sixth lactation order. The differences in these values were alsofound not significant. The data showed that mean PBC per ml of milk decreased constantlyafter second lactation with the increase in lactation order but this decrease was notsignificant. The population density of PBC in the present study was higher than reportedby Raj and Prasad (1982). Mean coliform per ml was recorded as 0.1, 0.0, 1.4, 1.0, 0.6and 0.7 in raw milk of crossbred cows of first, second, third, fourth, fifth and sixthlactation order. The differences in these results of coliform were not significant.
Chemical ParametersMean values of different components of milk of cows of different lactation order
are presented in Table 1. It may be noted that highest mean fat per cent recorded was5.02 in third lactation, followed by first lactation 4.89, sixth lactation 4.83, fourth lactation3.97 and fifth lactation 3.91 per cent, respectively. This clearly showed that significantlyhigher fat per cent was recorded in raw milk of crossbred cows of III lactation thancrossbred cows of II and Vth lactation; however it was at par with crossbred cows underI, IV and VI lactation. Fat percent in raw milk of VI lactation was also at par with rawmilk of crossbred cows of II lactation and IVth lactation. Fat content in raw milk ofcrossbred cows of II, IV and V lactation did not differ significantly. Protein in milk of I,II, III, IV , V and VI lactation order of cows ranged from 3.42 to 3.76, 3.39 to 3.98, 3.30to 3.99, 3.39 to 3.91, 3.37 to 3.96 and 3.32 to 3.95, respectively. Results showed thatprotein was not significantly influenced by lactation order. These results were in the linewith the observation of Sharma and Singh (2003). Mean lactose in milk of I, II, III, IV,V and VI lactation order was 4.639, 4.675, 4.668, 4.639, 4.609 and 4.609 per cent,respectively but differences in these values in milk of all six lactation order were notsignificant, which showed a non significant effect of lactation order of cows on lactose inmilk. Similarly ash in milk of six lactation order of cows ranged from 0.65 to 0.67, 0.62 to0.72, 0.61 to 0.72, 0.63 to 0.71, 0.61 to 0.71 and 0.61 to 0.72. Statistical analysis revealedthat ash also was not significantly influenced by lactation order. Another parameter i.e.T.S. in milk was found highest in cows of lactation order III (13.876), followed by I(13.134), VI (13.719), IV (13.134), II (13.025) and V (12.536) and the differences inthese values were found significant, indicating thereby a significant effect of lactationorder on T.S. of milk. These results were in agreement with Prasad (2001). Cows inearly order of lactation III registered significantly higher total solids than milk of II, IV, Vand VI lactation, however it was at par with milk of cow of I lactation. Total solids ofmilk between crossbred cows of I, II, V and VI order were not significantly different.
The Allahabad Farmer Vol. LXVII, January - 2012 No. 2
4
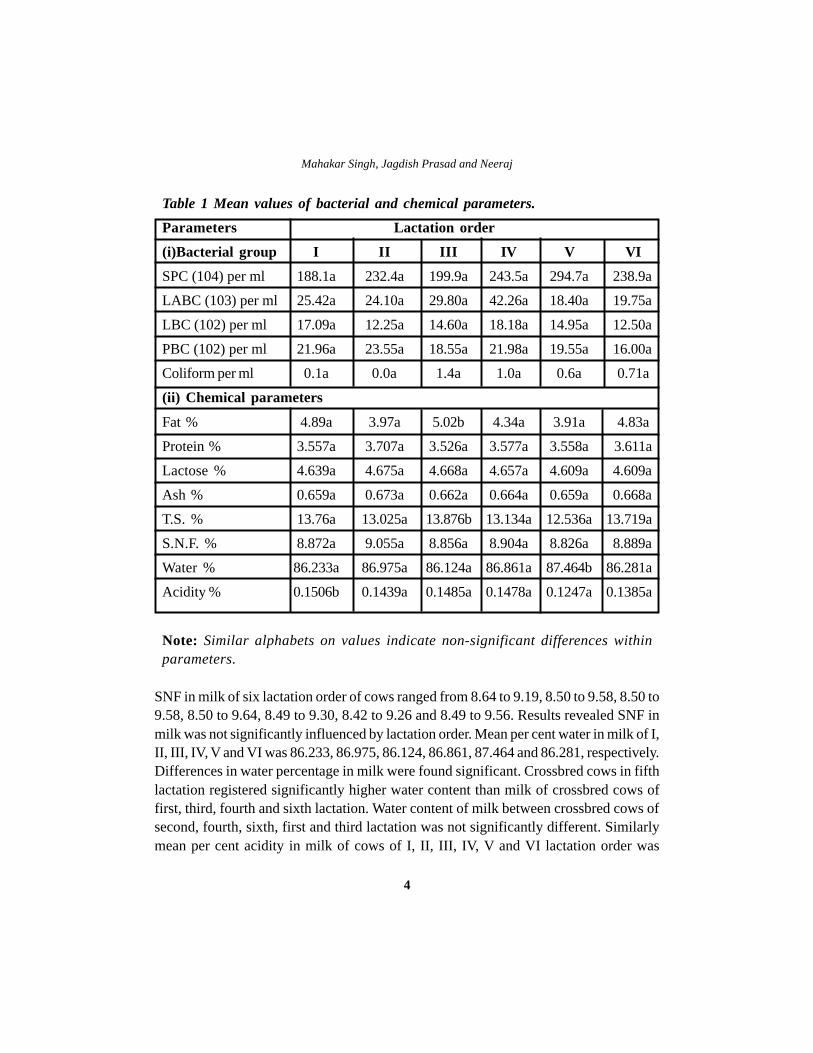
Table 1 Mean values of bacterial and chemical parameters.
Parameters Lactation order
(i)Bacterial group I II III IV V VI
SPC (104) per ml 188.1a 232.4a 199.9a 243.5a 294.7a 238.9a
LABC (103) per ml 25.42a 24.10a 29.80a 42.26a 18.40a 19.75a
LBC (102) per ml 17.09a 12.25a 14.60a 18.18a 14.95a 12.50a
PBC (102) per ml 21.96a 23.55a 18.55a 21.98a 19.55a 16.00a
Coliform per ml 0.1a 0.0a 1.4a 1.0a 0.6a 0.71a
(ii) Chemical parameters
Fat % 4.89a 3.97a 5.02b 4.34a 3.91a 4.83a
Protein % 3.557a 3.707a 3.526a 3.577a 3.558a3.611a
Lactose % 4.639a 4.675a 4.668a 4.657a 4.609a 4.609a
Ash % 0.659a 0.673a 0.662a 0.664a 0.659a 0.668a
T.S. % 13.76a 13.025a 13.876b 13.134a 12.536a 13.719a
S.N.F. % 8.872a 9.055a 8.856a 8.904a 8.826a 8.889a
Water % 86.233a 86.975a 86.124a 86.861a87.464b 86.281a
Acidity % 0.1506b 0.1439a 0.1485a 0.1478a 0.1247a 0.1385a
Note: Similar alphabets on values indicate non-significant differences withinparameters.
SNF in milk of six lactation order of cows ranged from 8.64 to 9.19, 8.50 to 9.58, 8.50 to9.58, 8.50 to 9.64, 8.49 to 9.30, 8.42 to 9.26 and 8.49 to 9.56. Results revealed SNF inmilk was not significantly influenced by lactation order. Mean per cent water in milk of I,II, III, IV , V and VI was 86.233, 86.975, 86.124, 86.861, 87.464 and 86.281, respectively.Differences in water percentage in milk were found significant. Crossbred cows in fifthlactation registered significantly higher water content than milk of crossbred cows offirst, third, fourth and sixth lactation. Water content of milk between crossbred cows ofsecond, fourth, sixth, first and third lactation was not significantly different. Similarlymean per cent acidity in milk of cows of I, II, III, IV, V and VI lactation order was
Mahakar Singh, Jagdish Prasad and Neeraj
5
0.1506, 0.1439, 0.1485, 0.1478, 0.1247 and 0.1385, respectively. The differences in thesevalues of acidity due to lactation order were found significant. Crossbred cows in firstlactation, registered significantly higher acidity content in raw milk than milk of crossbredcows of II, IV, V and VI lactation. Acidity content of raw milk between II, III, IV, V andVIth order was not significantly different.
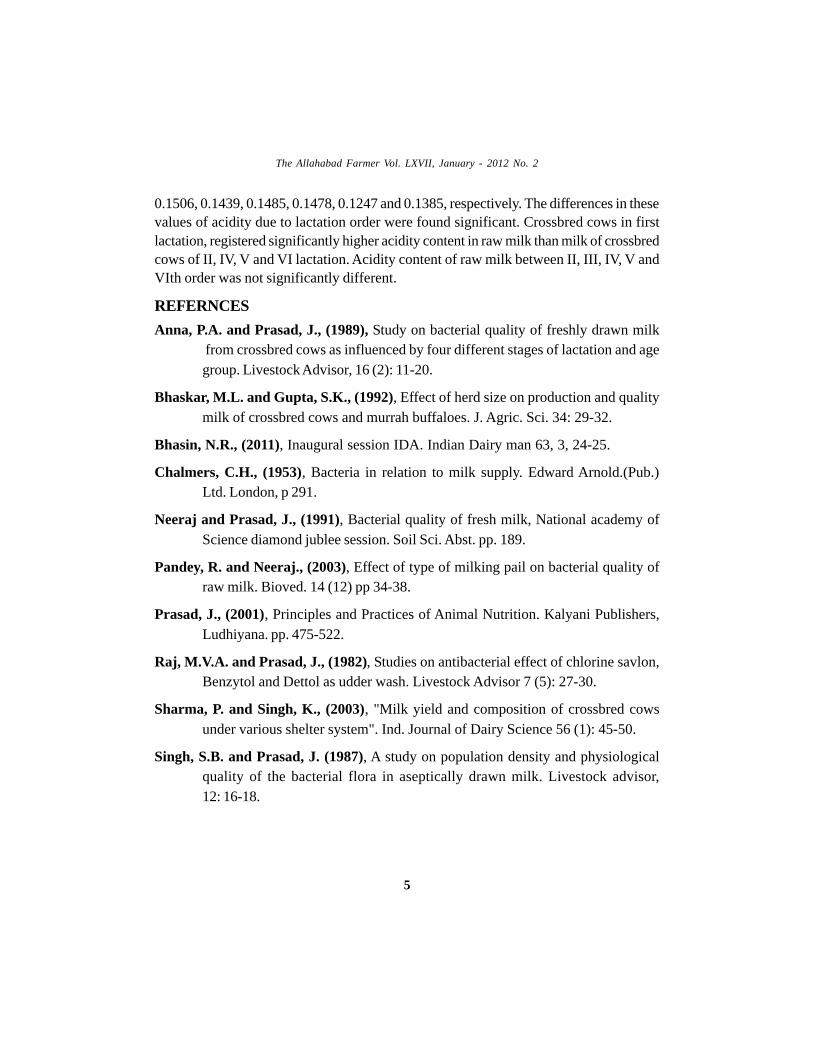
REFERNCES
Anna, P.A. and Prasad, J., (1989), Study on bacterial quality of freshly drawn milk from crossbred cows as influenced by four different stages of lactation and agegroup. Livestock Advisor, 16 (2): 11-20.
Bhaskar, M.L. and Gupta, S.K., (1992), Effect of herd size on production and qualitymilk of crossbred cows and murrah buffaloes. J. Agric. Sci. 34: 29-32.
Bhasin, N.R., (2011), Inaugural session IDA. Indian Dairy man 63, 3, 24-25.
Chalmers, C.H., (1953), Bacteria in relation to milk supply. Edward Arnold.(Pub.)Ltd. London, p 291.
Neeraj and Prasad, J., (1991), Bacterial quality of fresh milk, National academy ofScience diamond jublee session. Soil Sci. Abst. pp. 189.
Pandey, R. and Neeraj., (2003), Effect of type of milking pail on bacterial quality ofraw milk. Bioved. 14 (12) pp 34-38.
Prasad, J., (2001), Principles and Practices of Animal Nutrition. Kalyani Publishers,Ludhiyana. pp. 475-522.
Raj, M.V.A. and Prasad, J., (1982), Studies on antibacterial effect of chlorine savlon,Benzytol and Dettol as udder wash. Livestock Advisor 7 (5): 27-30.
Sharma, P. and Singh, K., (2003), "Milk yield and composition of crossbred cowsunder various shelter system". Ind. Journal of Dairy Science 56 (1): 45-50.
Singh, S.B. and Prasad, J. (1987), A study on population density and physiologicalquality of the bacterial flora in aseptically drawn milk. Livestock advisor,12: 16-18.
The Allahabad Farmer Vol. LXVII, January - 2012 No. 2

6
Probability Analysis for prediction of rainfall of Raipurregion (Chhattisgarh)
Shiulee Chakrabortyttttt, M. Imtiyaznnnnn and R. K. Isaaclllll
ABSTRACT
Consecutive days of annual maximum rainfall data corresponding to different
return periods are required for economic planning and design of hydraulic
structures like small dams, bridges, culverts, drainage works etc. Different
probability distribution models namely, Normal, Log Normal, Log Pearson type
III and Gumbel were tested for Raipur Region by comparing the Chi-square
values. The Gumbel distribution was found to be fit best for one day annual
maximum rainfall. Log Pearson type III distribution was found to be best fitted
for two, three and four consecutive days of annual maximum rainfall. Normal
distribution was found to be best fitted for five consecutive days annual maximum
rainfall. The one day annual maximum rainfall and two to five consecutive days
annual maximum rainfall exhibited strong Linear relationships (R2 = 0.9191 to
0.9494). The regression equations developed in the present studies can be
successfully used for prediction of rainfall of consecutive days ranging from
two to five annual maximum rainfalls with one day annual maximum rainfall for
Raipur region.
Keywords : Probability analysis, rainfall, probability models, Raipur region
INTRODUCTIONRainfall is one of the important hydrologic variable for which historical data are
available. This helps in the probability based analysis of various aspects of the rainfalldata. The different aspects of the rainfall are its intensity, daily, seasonal or annual totals,onset of monsoon, occurrence of the consecutive non-rainy days etc. Each of these isrelevant to different activities in the agricultural production process such as crop sowing,
tttttPostgraduate Student, nnnnnDean and Professor, lProfessor
Department of Soil Water Land Engineering & Management, Vaugh School of Agricultural Engineering andTechnology, SHIATS, Allahabad – 211007 (U.P.)
The Allahabad Farmer Vol. LXVII, January - 2012 No. 2

7
irrigation, drainage etc. Based on theoretical probability distributions, it could be possibleto forecast the incoming rainfall of various magnitudes with different return periods(Rizvi et. al., 2001). From the past studies it has been established that for estimatingthe drainage coefficient of agricultural crops, one needs to know the total rainfall overduration of crop tolerance period. Normally, the tolerance period of commercially growncrops vary from one day (for pulses) to six days (for rice). If the crops remain waterloggedfor more days, these show signs of irreversible damage, resulting in low yield. Theprocedure for determination of consecutive day rainfall, summed up with the desiredrecurrence interval is rather laborious and can hardly be done without the help of acomputer. The analysis becomes comparatively much easier with one day rainfall data.Therefore, it is required to use two or more consecutive days of rainfall, which can bedone expeditiously if the rainfall for the desired consecutive day could be predicted witha reasonable accuracy from one day rainfall values. Consecutive days of maximumrainfall of different return periods is important for safe and economical planning anddesign of small and medium hydraulic structures such as dams, bridges, culverts, drainagework etc. This would also be useful for forecasting the flood down below. There is nowidely accepted procedure to forecast the one-day maximum rainfall. However, ahydrological probability analysis has an application for predicting the future events onprobability basis/return period. Probability analysis of one day and consecutive daysannual maximum rainfall has been attempted for different places in India by using differentprobability distributions models (Prakash and Rao, 1986; Dalabehra et al., 1993 ;Kumar, 2000; Panigrahi and Panda, 2001; Rizvi et al., 2001; Singh, 2001; Tomarand Ranade 2002; George and Kollapadan, 2002 ; Kumar, 2003; Dingre andAtre, 2005; Dingre and Sahi, 2006; Pandey and Bisht, 2006; Kumar et al., 2007;Pilare and Durbude, 2007).
The computation of consecutive days maximum rainfall is a tedious and timeconsuming process, therefore in the present studies an attempt was made to determineone to five consecutive days annual maximum rainfall for Raipur region with differentprobability distribution models.
MATERIAL AND METHODSStudy Ar ea and Collection of Data
The study area falls under the basin of river Mahanadi Seonath watershed .It islocated between latitude 21014' N, 81039' E longitude, covering an area of 3877.25 ha(Fig. 1).The elevation of watershed is approximately 298 m above mean sea level. The
Shiulee Chakraborty, M. Imtiyaz and R. K. Isaac

8
Daily rainfall data recorded at the Water Resource Department Chhattisgarh, Raipurregion, for a period of 29 years (1979- 2007) have been used in the present analysis. Thedaily data, in a particular year, has been converted to two to five days of consecutivedays rainfall by summing up the rainfall of corresponding previous days and averagemonthly rainfall by summing up all the average of monthly rainfall. The maximum amountof one day and two to five consecutive days of annual rainfall and average monthlyrainfall for each year was taken for analysis.
Fig 1. Location Map of the Study area
The Allahabad Farmer Vol. LXVII, January - 2012 No. 2

9
Statistical Analysis of DataThe mean, standard deviation and coefficient of variation which describe the
variability of rainfall were computed.
The mean rainfall was computed by the following formula:
(1)
where, = mean, ΣX = Sum of rainfall, N = total number of observations
The standards deviation (?n) which measure the variability of rainfall was estimatedby the following formula:
σn = (2)
The Coefficient of Variation (Cv) was calculated by the following formula:
Cv = σn / (3)
One day to five consecutive days of annual maximum rainfall data were fitted tovarious probability distribution functions.
Frequency Analysis using Frequency Factors
Gumbel Distribution
XT = X + K x σn (4)
K = (5)
Where, XT = Predicted rainfall amount for return period of T years, K = Frequency
factor of Gumbel distribution
Log Pearson type III distribution
XT = Z + K σn (6)
XΣ X
N=
X
X
Shiulee Chakraborty, M. Imtiyaz and R. K. Isaac
√Σ (X-X)
N

10
f
Where K = Frequency factor of Log Pearson type III distribution
Predicted rainfall were calculated as
XT= antilog (Z
T)
Log Normal distribution
XT = X+ K σn (7)
Predicted rainfall were calculated as
XT = antilog (X
T)
Normal distribution
(8)
Where σn2 = Variance of normal distribution
Testing the Goodness of FitThe χ2 test (Hogg and Tanis, 1977) is generally used to test the closeness of the
expected values obtained by the fitted theoretical distribution and the observed values.For the return period T were calculated as
χ2 = (9)
where:
O = Observed values for the return period, E = Expected values for the returnperiod
One of the most commonly used tests for testing the goodness of fit of empiricaldata to specify theoretical, distribution of χ2 is the chi-square distribution with v = n-cdegrees of freedom. In conducting the goodness of fit test using the chi-square test, aconfidence level, often expressed as 1- α, is chosen (where α is referred to as thesignificance level ). Typically, 95% is chosen as the confidence limit. The null hypothesisfor the test is that the proposed probability fits the data adequately. This hypothesis isrejected if the value of χ
c2 is larger than a limiting value, χ2
v,
1-α (which is determinedfrom the χ2 distribution with ? degree of freedom at 5 % level of significance. Otherwiseit was rejected. The least sum of the Chi-square values gives the best fit (Agarwal et al1988).
The Allahabad Farmer Vol. LXVII, January - 2012 No. 2

11
RESULTS AND DISCUSSIONStatistical parameters of 1-day to five consecutive day annual maximum rainfalland average monthly rainfall
The statistical parameters for one day and two to five consecutive days annualmaximum rainfall are presented in Table 1. The mean value of one day maximum rainfallwas 24.3mm with standards deviation and co-efficient of variation of 17.8 and 0.77
respectively. The mean value of annual maximum rainfall, standard deviation co-efficientof Skewness and co-efficient if variation ranged from 56.1 to 142.1mm, 43.6 to 77.9,-0.18 to -1.25 and 0.54 to 0.73 respectively for 2 to 5 consecutive days annual maximumrainfall Table 2 (Tomar and Ranade, 2002).
Fitting of various probability distribution functionsOne day annual maximum rainfall, 2 to 5 consecutive days annual maximum rainfall
and average monthly rainfall in its original form was fitted to different probability distributionfunctions i.e., Normal, Log Normal, Log Persons type III and Gumbel distribution.Calculated Chi - square values were compared with tabular values at 5% level ofsignificance. It was observed that all the probability distribution functions fitted significantly.As per Chi - square value, Gumbel distribution was found to be best fitted to one day, logpersons type III for second, third and fourth consecutive day annual maximum rainfall
Table 1. Statistical parameters of 1-day to five consecutive day annualmaximum rainfall and average monthly rainfall
S.No. Parameters 1-day 2-days 3-days 4-days 5-daysAveragemonthly
1 Minimum (mm) 1.2 6.3 6.3 12.6 15.3 23.63
2 Maximum (mm) 81.6 208 281 304 348 46.71
3 Mean (mm) 24.3 56.1 82.3 108.3 142.1 34.1
4 Standard deviation 17.8 43.6 58.1 69.3 77.9 6.4
5 Coefficient of -1.2 -0.18 -0.871 -0.876 -1.25 0.25Skewness
6 Coefficient of 0.77 0.73 0.705 0.64 0.54 0.18variation
Shiulee Chakraborty, M. Imtiyaz and R. K. Isaac

12
data. Normal distribution was found to be best fitted model for five days as well asaverage monthly rainfall. The result revealed that the above mentioned probabilitydistribution models are suitable above for predication of the rainfall for differentconsecutive days of the present study area (Table 2). The similar attempt has beenmade by Mohanty et. al. (2000) by comparing the values of normal, log normal, extremevalue type - I and log person III distributions.
Estimation of 1-day to 5 consecutive days annual maximum rainfall and averagemonthly rainfall for different return periods
The 1-day and 2 to 5 consecutive days consecutive days annual maximum rainfalland average monthly rainfall for different return periods as determined by selectedprobability distributions models are presented in table 3. A maximum of 23.1 mm in 1day, 38.1 mm in 2 days, 64.8 mm in 3 days, 92 mm in 4 days 138.9 mm in 5 days and 32.6mm average monthly rainfall is expected to occur at every 2 years at Raipur region. Fora recurrence interval of 15 years, the maximum rainfall expected in 1 day, 2 days, 3 days,4 days, 5 days and average monthly rainfall is 60 mm, 122.5 mm, 163 mm, 235.4 mm,269.4 mm and 46.64 mm respectively. The two to fifth years is sufficient return periodfor the design of soil and water conserving structures, construction of dams, irrigationand drainage network design etc (Pandey and Bisht, 2006; Kwaku and Duke, 2007).
Table 2. Chi-square value for different distribution.
Consecutive Normal Log Log Pearson Gumbel Degree of Critical Chidays Normal type III freedom -square
values
One day 5.883 8.68 3.772 2.9038 2 5.991
Two day 7.8 3.893 3.438 7.827 2 5.991
Three day 4.59 11.25 1.61 7.2 2 5.991
Four day 9.06 5.945 0.773 1.46 2 5.991
Five day 1.98 41.2 4.26 4.87 2 5.991
Average 0.5227 0.5655 0.7019 0.5485 2 5.991monthly
The Allahabad Farmer Vol. LXVII, January - 2012 No. 2

13
Development of the relationshipThe relation between different consecutive days annual maximum with 1 day annual
maximum rainfall as given in table 4. It was revealed that the slope of the equation wasdecreasing while intercept was changing but not in same manner. The decreasing trendof positive intercept showed that consecutive day of annual maximum rainfall wasincreases as the number of days increases. The value of coefficient of determinationshould tend towards zero. The coefficient of determination 0.9494, was observed for4day v/s 1 day annual maximum rainfall which showed better dependence of 4 consecutivedays annual maximum rainfall on 1 day annual maximum rainfall.
Table 3. 1 day as well as consecutive day's maximum rainfall for variousreturn periods and probability levels.
Probability Return 1 day 2 days 3 days 4 days 5 daysAveragelevels (%) Period monthly
50 2 23.1 38.1 64.8 92 138.9 32.64
40 2.5 25.6 51.7 83.3 107.2 163.9 34.104
20 5 30 96.1 130.7 164.2 201.4 39.74
10 10 55.9 110.5 162.5 212.6 244.6 46.203
6.6 15 60 122.5 163 235.4 269.4 46.64
Table 4. Relationship of two to five consecutive days of maximum annualrainfall with one day annual maximum rainfall
Relationship Developed (R²)between one day and equation(s)consecutive days
1st day vs 2nd day Y= 2.3368x -0.8025 0.9191
1st day vs 3rd day Y = 3.1636x + 5.3436 0.9469
1st day vs 4th day Y= 3.7727x+ 16.465 0.9494
1st day vs 5th day Y = 4.2057x + 39.664 0.9363
Shiulee Chakraborty, M. Imtiyaz and R. K. Isaac

14
CONCLUSIONThe Gumbel distribution values was found very near to the observed rainfall for
one day annual maximum rainfall (mm), Log Pearsons type III distribution was found tobe best model for predicting two, three and four consecutive days annual maximumrainfall (mm) and Normal distribution was found to be best model for predicting fiveconsecutive days annual maximum rainfall and average monthly rainfall respectively.The coefficient of determination for all the consecutive days was (0.9191, 0.9469, 0.9494,0.9363) close to 1 which showed better dependence of consecutive days maximumrainfall on one day annual maximum rainfall.
REFERENCESAgarwal, M.C., Katiyar, V.S. and Ram Babu (1988). Probability analysis of annual
maximum daily rainfall of U.P., Himalaya. Indian Journal of Soil Cons. 16(1):pp: 35-42.
Chow, V.T. (1964). Hand Book of Applied Hydrology. Chapter-8. Mc, Graw Hill booksCo. Inc.
Dalabehra, M., Sahoo, J. and Bala, M.K. (1993). Probability models for predictionof annual maximum rainfall. Indian Journal Soil Conservation, Vol.21, No.3,pp: 71-76.
Dingre, S and Atr e, A.A. (2005). Probability analysis for prediction of annual maximumdaily rainfall of Srinagar region (Kashmir Valley) Indian J. Soil Cons. 33(3),pp: 262-263.
Dingre, S. and Shahi, N.C. (2006).Consecutive days maximum rainfall predicted fromone day maximum rainfall for Srinagar in Kashmir valley Indian Journal SoilCons.,Vol.34(2), pp:153-156.
Goerge, C. and Kolappadan, C. (2002). Probability analysis for prediction of annualmaximum daily rainfall of Periyar Basin in Kerala. Indian Journal SoilConservation. Vol.30. No.3, pp: 273-276.
Hogg, R.V. and Tanis, E.A. (1977). Probability and Statistical interference. MacmilanPublishing Co. Inc., New York.
Islam, A. and Kumar, A. (2003). HYDRO: A program of frequency Analysis of RainfallData Journal of Institution of Engineers (India) Agricultural Engineering Division,Vol.84, June 2003 pp:1-5.
Kumar, S. and Kumar, D. (1989). Frequency of seasonal antecedent rainfall conditions.Indian Journal Soil Conservation, Vol. 17, No.1, pp: 25-29.
The Allahabad Farmer Vol. LXVII, January - 2012 No. 2
15
Kumar, A. (2000). Probability analysis of rainfall for crop planning in Garhwal HimalayanRegion. Indian Journal Soil Conservation, Vol.28 (3), pp: 245-246.
Kumar, V. (2003). Frequency analysis of consecutive days maximum rainfall at Srinagar(Jammu and Kashmir) .Indian J. Soil Cons. Vol. 31(2), pp: 295-298.
Kumar, A., Kaushal, K.K. and Singh, R.D. (2007). Prediction of annual maximumdaily rainfall of Almora based on probability analysis. India J. Soil Cons.,35(1), pp: 82- 83.
Mohanty S., Marathe R. A. and Singh Shyam (2000). Probability models forpredication of annual maximum daily rainfall for Nagpur. Indian Journal of SoilConservation, Vol. 44 No. 1, PP. 38-40.
Prakash, C. and Rao, D.H. (1986). Frequency analysis of rain fall data for cropplanning, Kota .Indian J. Soil Cons .14 (2) ,pp:23-26.
Panigrahi, B. and Panda, S.S. (2001). Analysis of weekly rainfall for crop planning inrainfed region. Journal of Agricultural Engg., 38 (4),pp:75-76.
Panday, S.C. and Bisht, K.K.S. (2006). Probability analysis for prediction of annualmaximum daily rainfall for Hawalbagh (Almora). Indian Journal Soil Conservation,Vol. 34 (1), pp: 75-76.
Pilare,V.R. and Durbude , D.G. (2007). Probability analysis of maximum one day anddaily monsoon rainfall at CIAE Bhopal .Indian J. Soil Cons.6(3), pp:146-151.
Rizvi, R.H., Singh, R., Yadav, R.S., Tiwari, R.K., Dadhwal, K.S. and Solanki,K.R. (2001). Probability analysis of annual maximum daily rainfall for Bundelkhand
region of U.P., Indian Journal Soil Conservation , Vol.29 , No.3 , pp:259-262.
Singh, R.K. (2001). Probability analysis for prediction of maximum daily rainfall ofEastern Himalaya (Sikkim Mid Hills).Indian Journal Soil ConservationVol.29, No.3, pp: 263-265.
Subramanya (1984). Engineering Hydrology, Tata Mc Graw -Hill Publishing CompanyLtd. , New Delhi, pp : 242-253.
Tomar, A.S. and Ranade, D.H. (2002). Prediction of consecutive day maximum rainfallfrom one day maximum rainfall for semi arid Indore Region of Madhya Pradesh.Journal of Soil and Water Conservation, Vol. 1, pp: 16-20.
Upadhyay, A. and Singh, S.R. (1998). Estimation of consecutive days maximum rainfallby various methods and their comparison. Indian Journal Soil ConservationVol. 26(3), pp: 193-201.
Shiulee Chakraborty, M. Imtiyaz and R. K. Isaac

16
Physico-chemical Characteristics of Extruded Sev Developedfrom Multipurpose flour by incorporating Spinach,
Curr y, Coriander and Mint Leaves Powder
Hena Imtiyazttttt, R. N. Shuklannnnn and K. C. Yadavnnnnn
ABSTRACT
The present study focused on use of leafy vegetable dried powder to improve
the nutritional status of ready to eat Indian extruded sev. Different content of
spinach, curry, coriander and mint leaves powder were incorporated in flour
made from gram and rice to study the moisture, fat, vitamin C and ash content in
extruded sev during storage. The moisture and fat content of extruded sev
decreased significantly with increase in spinach, curry, coriander and mint leaves
powder. The vitamin C content of extruded sev increased significantly with the
increase in spinach (1.8 to 5.6%), curry (1.0 to 2.4%), coriander (1.3 to 4.9%) and
mint leaves powder (1.6 to 5.2%). The moisture, fat, vitamin C and ash content of
extruded sev were slightly influenced by ambient storage and packaging materials.
The overall result reveals that value addition by incorporation of spinach, curry,
coriander and mint powder is useful to improve the quality and nutritional status
of extruded sev.
INTRODUCTIONSev is a popular extruded salty Indian snack which can be eaten as well as added
in other Indian snacks such as Bhel puri, Sev puri etc. The yellow colored spicy sevsnack is a favourate among young and old alike. The sev which is available in market isdeficient in vitamin and mineral content and rich in fat content. The green leafy vegetablesowing to high moisture content are highly perishable and are sold at very low price in thepeak season resulting in heavy losses to the producers (Pande et al., 2000).
tttttMaster Student, nnnnnAssistant ProfessortttttAsian Institute of Technology, Bangkok, ThailandnnnnnDepartment of Food Process Engineering, Vaugh School of Agricultural Engineering and Technology,
SHIATS, Allahabad – 211007 (U.P.)
The Allahabad Farmer Vol. LXVII, January - 2012 No. 2

17
Spinach is one of the richest sources of beta carotene. It also contains vitamin B1which acts as a co-enzyme that facilitates the conversion of glucose into muscular andnerve energy. It is also rich in minerals, calcium, copper, iron, magnesium, phosphorusand zinc. Curry (Murraya Koenigi) leaves are slightly bitter and aromatic and it contains66.3% moisture, 6.1% protein, 1.0% fat, 16.0% carbohydrates, 6.4% fiber and 4.2%mineral matter. The mineral and vitamin contents in curry leaves are calcium, phosphorus,iron, nicotinic acid and vitamin C. Coriander (Coriander sativum L.) is an annual herbthat belongs to the carrot family (Umbelliferae). Coriander is a commonly used fordomestic remedy, valued especially for its effect on the digestive system, treating flatulence,diarrhea and colic. Mint (Mentha Piperita) which is generally known as menta in latinand minthee in greek, the species name piperita refers to the peppery and pungenttaste. It is also known as pudina in India. It comes in many varieties such as spearmint,peppermint and pennyroyal etc., each with distinct flavor. Mint is generally a sweetflavor imparting a cool sensation to the mouth. Peppermint has the highest concentrationsof menthol, while pennyroyal is strong with a medicinal flavor. Mint is refreshing simulative,diaphoretic, stomachic and antispasmodic.
Different types of the products like pakodu, vegetable biryani (Lakshmi and Vimala,2000) biscuits (Singh and Awasthi, 2003), instant mixes such as dhal powder (Lalithaand Sathya, 2003), Paneer (Kaur and Bajwa, 2003) has been developed by variousgreen leafy vegetables such as drum stick beans, coriander, curry leaves etc.
Deep fat frying is commonly used for the production of snack foods bothcommercially and at household level. Fried foods are considered as concentrated sourcesof energy and fat, along with improving the digestibility of legumes. Deep frying helps toreduce the moisture content of foods and thereby increases shelf life, combined withimparting characteristics such as colour, texture, and flavor to the product (Ravi andSusheelamma 2004). The shelf life of the snack food products depend on storagecondition such as temperature, humidity and light. The crispiness of the snack food ishighly desirable for marketing but moisture content gain during storage ultimately leadsto poor texture (Taoukis et. al., 1988). The most common parameter for assessmentof deep fried snack food is moisture, ash, fat content etc (BIS, 1989).
In India, sev is a good source of zinc folate, protein, and dietary fiber but low invitamin and ash contents. However, the vegetable leaves which are rich in protein andmineral contents can be incorporated in gram flour to improve the quality and nutritionalvalue of the extruded sev. Therefore, the objective of the present study was to develop
The Allahabad Farmer Vol. LXVII, January - 2012 No. 2

18
value added extruded sev by incorporating spinach, curry, coriander and mint leavespowder.
MATERIALS AND METHODSThe required materials to prepare the extruded sev such as spinach, curry, coriander
and mint leaves, gram flour, rice flour, salt, soybean oil (Saffola) and packaging materialswere procured from the local market of Allahabad. The spinach, curry, coriander andmint leaves were dried by micro wave and tray dryer. Four kg of rice flour was mixedwith twenty four kg of gram flour (1:6) to prepare the multipurpose flour. The differentcombination of spinach (T
1-1%, T
2 - 3%, T
3 - 5%), curry (T
4-1%, T
5 - 3%, T
6 - 5%),
coriander (T7-1%, T
8 - 3%, T
9 - 5%) and mint (T
10-1%, T
11 - 3%, T
12 - 5%) leaves dried
powder were mixed with multipurpose flour. The water was added slowly to multipurposeflour and mixed thoroughly until the dough formation was completed. The dough mixturewas extruded with the help of the extruder. The 500 grams of the extruded sev sample ofeach treatment was fried in Soy bean cooking oil (Saffola) at 1650± 20C for 2 minutes.The deep fried extruded sev was packed and sealed in High Density Polyethylene (HDPE)and Aluminium Foil for physico - chemical analysis.
The physico-chemical properties of extruded sev such as moisture, fat, vitamin Cand ash content were analysed by standard methods (Ranganana, 1995). The datawas analysed using single factor ANOVA in MSEXCEL (Micr osoft office, 2010). Thesignificance level at P< 0.05 was applied to results to test the significant difference.
RESULTS AND DISCUSSIONMoisture Content
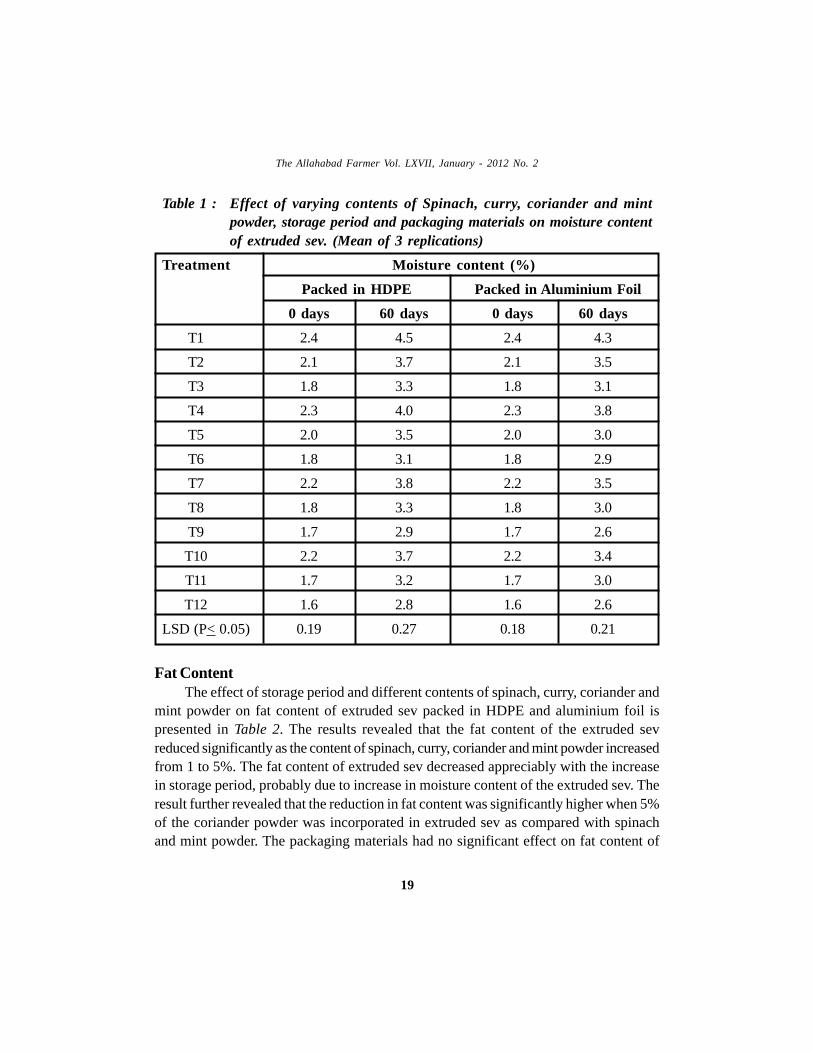
The effect of storage period and different contents of spinach, curry, coriander andmint powder on moisture content of extruded sev packed in HDPE and aluminium foil ispresented in Table 1. The moisture content of extruded sev decreased significantly withincrease in content of spinach, curry, coriander and mint powder. The moisture contentof extruded sev increased considerably due to increase in storage period. The increasein moisture content with the increase in storage period was comparatively less in extrudedsev packed in aluminium foil than the HDPE due to low permeation of air (Table 2). Theincrease in moisture content in extruded sev was probably due to storage condition andquality of packaging material. Moisture absorption by food product reduces its shelf lifeand creates favourable condition for microbial growth which consequently affects thequality of the food product (Labuza and Schmidl, 1985; Uma et. al., 2011).
Hena Imtiyaz, R. N. Shukla and K. C. Yadav
19
Fat ContentThe effect of storage period and different contents of spinach, curry, coriander and
mint powder on fat content of extruded sev packed in HDPE and aluminium foil ispresented in Table 2. The results revealed that the fat content of the extruded sevreduced significantly as the content of spinach, curry, coriander and mint powder increasedfrom 1 to 5%. The fat content of extruded sev decreased appreciably with the increasein storage period, probably due to increase in moisture content of the extruded sev. Theresult further revealed that the reduction in fat content was significantly higher when 5%of the coriander powder was incorporated in extruded sev as compared with spinachand mint powder. The packaging materials had no significant effect on fat content of
Table 1 : Effect of varying contents of Spinach, curry, coriander and mintpowder, storage period and packaging materials on moisture contentof extruded sev. (Mean of 3 replications)
Tr eatment Moisture content (%)
Packed in HDPE Packed in Aluminium Foil
0 days 60 days 0 days 60 days
T1 2.4 4.5 2.4 4.3
T2 2.1 3.7 2.1 3.5
T3 1.8 3.3 1.8 3.1
T4 2.3 4.0 2.3 3.8
T5 2.0 3.5 2.0 3.0
T6 1.8 3.1 1.8 2.9
T7 2.2 3.8 2.2 3.5
T8 1.8 3.3 1.8 3.0
T9 1.7 2.9 1.7 2.6
T10 2.2 3.7 2.2 3.4
T11 1.7 3.2 1.7 3.0
T12 1.6 2.8 1.6 2.6
LSD (P< 0.05) 0.19 0.27 0.18 0.21
The Allahabad Farmer Vol. LXVII, January - 2012 No. 2

20
extruded sev during storage period. The major concern of the quality of snack food is theaddition of the fat content during the process of deep frying (Sahin et al., 1999). Theoverall results revealed that incorporation of spinach, curry, coriander and mint powdercan considerably improve the quality of extruded sev by reducing fat content (Table 2).
Table 2 - Effect of varying contents of Spinach, curry, coriander and mintpowder, storage period and packaging materials on fat content ofextruded sev (Mean of 3 replications)
Tr eatment Fat content (%)
Packed in HDPE Packed in Aluminium Foil
0 days 60 days 0 days 60 days
T1 36.7 27.2 36.7 27.8
T2 35.1 26.5 35.1 26.9
T3 34.0 25.8 34.0 26.1
T4 36.0 26.8 36.0 27.5
T5 35.0 25.7 35.0 26.2
T6 34.2 24.5 34.2 25.1
T7 36.5 25.7 36.5 26.2
T8 35.2 25.2 35.2 25.8
T9 33.0 24.7 33.0 25.1
T10 36.1 24.8 36.1 25.4
T11 34.5 24.2 34.5 24.8
T12 33.5 23.8 33.5 24.2
LSD (P? 0.05) 0.76 0.50 0.51 0.41
Vitamin 'C' ContentThe effect of storage period and different contents of spinach, curry, coriander and
mint powder on vitamin C content of extruded sev packed in HDPE and aluminium foilis presented in Table 3.
Hena Imtiyaz, R. N. Shukla and K. C. Yadav

21
The vitamin C content of extruded sev increased significantly due to increase incontents of spinach (1.83 to 5.63%), curry (1.02 to 2.39%), coriander (1.32 to 4.94%)and mint (1.57 to 5.17%) dried leafy powder. The storage period and packaging materialhad no significant effect on vitamin C content of extruded sev. The overall results revealedthat by incorporation of spinach, curry, coriander and mint powder in gram flour which iscommonly used for preparation of the extruded Indian sev is highly beneficial to improvethe quality particularly vitamin C content. The results further revealed that spinach powderwas more effective to improve the vitamin C content of extruded sev followed by mint,coriander and curry powder (Table 3). Similar results were reported for other snackfoods under wide range of ingredients (Ewida, 1988; Beaton 1993; Manjunath et al.2003).
Table 3- Effect of varying contents of Spinach, curry, coriander and mintpowder, storage period and packaging materials on vitamin C contentof extruded sev (Mean of 3 replications)
Tr eatment Vitamin C content (%)
Packed in HDPE Packed in Aluminium Foil
0 days 60 days 0 days 60 days
T1 1.8 1.9 1.9 1.8
T2 4.9 4.9 4.9 4.9
T3 5.6 5.6 5.7 5.7
T4 1.0 1.0 1.0 1.0
T5 1.3 1.3 1.3 1.3
T6 2.4 2.4 2.4 2.4
T7 1.3 1.3 1.4 1.4
T8 3.7 3.7 3.7 3.7
T9 4.9 4.9 4.9 4.9
T10 1.6 1.6 1.6 1.6
T11 3.0 3.0 3.0 3.0
T12 5.2 5.2 5.1 5.1
LSD (P? 0.05) 0.07 0.05 0.05 0.04
The Allahabad Farmer Vol. LXVII, January - 2012 No. 2

22
Table 4 : Effect of varying contents of Spinach, curry, coriander and mintpowder, storage period and packaging materials on Ash content ofextruded sev (Mean of 3 replications)
Tr eatment Ash content (%)
Packed in HDPE Packed in Aluminium Foil
0 days 60 days 0 days 60 days
T1 1.8 1.8 1.9 1.8
T2 2.3 2.3 2.4 2.3
T3 2.8 2.7 2.8 2.7
T4 1.9 1.9 1.9 1.8
T5 2.6 2.6 2.7 2.6
T6 3.4 3.4 3.4 3.4
T7 1.6 1.6 1.6 1.5
T8 2.2 2.2 2.3 2.2
T9 3.1 3.0 3.2 3.1
T10 2.0 2.0 2.0 2.0
T11 2.6 2.6 2.6 2.5
T12 3.7 3.7 3.7 3.6
LSD (P? 0.05) 0.06 0.07 0.06 0.04
Ash ContentThe effect of storage period and different content of spinach, curry, coriander and
mint powder on ash content of extruded sev packed in aluminium foil is presented inTable 4. The ash content of extruded sev increased significantly due to increase (1 to5%) in spinach, curry, coriander and mint powder. The ash content of extruded sev wassignificantly higher when mint powder (2.0 to 3.7%) was incorporated in multipurposeflour followed by curry, (1.9 to 3.4%), coriander (1.6 to 3.1%) and spinach (1.8 to 2.8%)powder. The ash content of extruded sev decreased with increase in storage period,probably due to absorption of moisture by the product. The packaging material had nosignificant effect on ash content of extruded sev during storage (Table 4). Srima andRachada (2010) reported the similar results for modified Taro flour.
Hena Imtiyaz, R. N. Shukla and K. C. Yadav
23
CONCLUSIONThe results obtained from the present investigation revealed that spinach, curry,
coriander and mint powder can be incorporated in extruded sev to improve its quality andnutritional status. The results further revealed that the moisture and fat content decreased,whereas vitamin C and ash content increased significantly due to increase in contents ofspinach, curry, coriander and mint powder in extruded sev. The vitamin C content washigher in extruded sev when spinach powder was incorporated in multipurpose flour.The storage period and packaging material had no significant effect on vitamin C andash content of extruded sev.
REFERENCES
Beaton (1993). Effectiveness of vitamin - A, a supplementation in the control of youngchildren morbidity and mortality in developing countries. A summary reportpresented at ACC/SCN. 20th session SCN News.
BIS, (1989). Potato French fries - specification. Bureau of Indian Standards, IS 12569.2.
Ewida (1988). Amino acid fortification. In evaluation of protein for Humans.AVI publishing Co., West port, CT.
Kaur, J. and Bajwa, U. (2003). Effect of Pre-treatments of green leafy vegetables onthe quality attributes of vegetable impregnated paneer. Indian Journal of Nutr.Diet., 42: 425-431.
Labuza, T.P., and Schmidl, M. K. (1985). Shelf - life of food products. FoodTechnologist, 39 (9): 57-62.
Lakshmi, B. and Vimala, V. (2000). Nutritive Value of dehydrated green leafy vegetablepowders. Journal of Food Science Technology. 37 (5) : 465-471.
Lalitha, R. and Sathya, K. (2003). Enrichment of instant food mixes with ß - carotenethrough green leafy vegetables; acceptability characteristics. Proceeding ofInternational Food Conferences, SS - 02: 75.
Manjunatha, S.S., Mohan Kumar, B.K. and Das Gupta, D.K. (2003). Developmentand evaluation of carrot kheer mix. Journal of Food Science and Technology,40 (3): 310-312.
The Allahabad Farmer Vol. LXVII, January - 2012 No. 2

24
Pande, V. K., Sonune, A. V. and Philip, S. K. (2000), Solar drying of coriander andmethi. Journal of Food Science Technology, 37 (2) : 110-113.
Ranganna, S. (1995). Handbook of analysis and quality control for fruits and vegetablesproducts. Tata McGraw-Hill Publishing Company Limited, Asif Ali Road,New Delhi.
Ravi, R. and Susheelamma, N. S. (2004), The effect of the concentration of battermade from chickpea (Cicer arietinum L.) Flour on the quality of a deep friedsnack. International Journal of Food Science and Technology, 39: 755-762.
Sahin, S., Sastry, S. K. and Bayindirilli, L. (1999). Heat transfer during frying ofpotato slices. Lebensmittel-wisswnschaft und-technologie, 32 : 19-24.
Singh, P. and Awasthi, P., (2003). Sensory and nutritional quality evaluation of greenleafy vegetable (GLV) powder incorporated food products. Proceeding ofInternational Food Conference, SS-07 : 77.
Sirima, C. and Rachada, M. (2010). Chemical and physical properties of taro flourand the application of restructured taro strip product. World Applied SciencesJournal. 9 (6): 600-604.
Taoukis, P.S., Elmeskine, A. and Labuza, T. P. (1988). Moisture transfer and shelflife of packaging foods. In J.H. Hotchkiss (Ed.), Food and packaging interactions.ACS symposium series no. 365 (19) : 243 - 261.
Uma, T., Gunasekaran, M., Jaganmohan, R., Alagusundaram and Tiwari, B. K.(2011). Quality Characteristic and shelf life studies of deep fried snack prepared from
rice brokens and legumes by product. Food Bioprocess Technology, 4:1172-1178.
Hena Imtiyaz, R. N. Shukla and K. C. Yadav

25
Formulation of Conventional Food Products UsingWater Chestnut (Trapa natans)
Priyanka Yadav* and Ritu Prakash Dubey**
ABSTRACT
Two food products were prepared namely Halwa, and Chestnut Roll, with four
Treatment for each product, i.e. T1, T
2, T
3 and T
4 at 20 %, 40 %, 60 %, and 80 %
respectably. The observations were recorded, tabulated and statistically analyzed
by following analysis of variance and critical difference technique. The
organoleptic analysis of these products was done by "Nine Point Hedonic Scale"
and calculate the Nutritive Value of Indian foods by C. Gopalan, (2004) Sensory
scores of Halwa with and without incorporation of water chestnut showed that
the overall acceptability was Highest in T4 (80%), In Chestnut Roll the sensory
score of T1 (20%) was best, by the panel of judge. In nutrient estimation of
Halwa two nutrients namely Energy, calcium were found to decreased, increase
in addition levels, the nutrient like Fibre, Carbohydrate, Iron and Fat.In nutrients
estimation of Chestnut Roll, all the nutrient were found to increase in incorporation
levels the calories, Fat, Calcium contents were found to be highest treatment T4
(80%) of Chestnut Roll, The decrease level of Carbohydrate and Iron content
were also highest in T4 (80%) treatment.
INTRODUCTIONThe water chestnut (Trapa natans) is a tuber vegetable, or more accurately, the
corn of the plant. Water chestnut is sweet and aromatic. The nut is found under theleaves and drops off when it is ripe and is scooped out with the help of a net. Ahmed(2008). The nutritional composition of fresh water chestnut is 70%. Moisture, 4.7 g.
*M.Sc. FND Student, **Assisstant Professor (Sr.Sc.)
Department of Food and Nutrition
Halina School of Home Science
SHIATS, Allahabad – 211007 (U.P.)
The Allahabad Farmer Vol. LXVII, January - 2012 No. 2

26
protein, 0.3 g. fat, 1.1 g. mineral, 0.6 g. Fiber,23.3 g. CHO, 115 kcal energy, 20 mgcalcium, 150 mg. phosphorus, 1.35 mg. iron. The nutritional composition of dry waterchestnut powder is 48.2%. Moisture, 3.4 g. protein, 0.2 g. fat, 3.3gm sugar, 32.1 g. CHO,730 kcal energy, 17.6 mg calcium, , 0.7 mg. iron,0.4 mg zinc,468mg. potassium. ) Waterchestnuts are known to posses a remarkable nutritional composition, which makes theman excellent food source that can be a dietary staple. For this reason, they are set apartfrom all the other nuts. The best part is that they are free of any cholesterol and arealmost fat-free. They are also gluten-free. They have a white and crispy flesh and small,rounded corms that can also be eaten raw. Water chestnuts are a popular ingredient inthe Chinese cuisine. Lily (2010) Water chestnuts are known to posses a remarkablenutritional composition, which makes them an excellent food source that can be a dietarystaple. For this reason, they are set apart from all the other nuts. The best part is thatthey are free of any cholesterol and are almost fat-free. They are also gluten-free. Theyhave a white and crispy flesh and small, rounded corms that can also be eaten raw.Water chestnuts are a popular ingredient in the Chinese cuisine. Nicks J (2010)
MATERIALS AND METHODThe study entitled "FORMULATION OF CONVENTIONAL FOOD PRODUCTS
USING WATER CHESTNUT, (Trapa natans)" was conducted in the ResearchLaboratory of Foods and Nutrition. Halina School of Home Science. Sam HigginbottomInstitute of Agriculture Technology& Sciences (Deemed to be University) Allahabad.
Basically fresh water chestnut and water chestnut flour were used for developmentof products namely - Halwa, chestnut roll,. Sensory evaluation of the products viz- Halwaand chestnut roll was done by a panel of 5 judges. They all were Associate Professorsand Assistant Professors of Halina School of Home Science. They were chosen as theyare specialist in the field related to the present research. The judges were requested toscore the product with the help of 9- point hedonic scale score card specially preparedfor the purpose.Nutrients of these products: Energy, Carbohydrates, Fats, Fiber, Calciumand Iron were calculated by using the values obtained of fresh water chestnut and waterchestnut flour as well as the values of raw ingredients used as given by Gopalan et al.(2004).
DETAILS OF TREATMENT1. T
0 (control) In this, the product was prepared with only standard ingredients without
any incorporation of water chestnut.
Priyanka Yadav and Ritu Prakash Dubey

27
2. T1 (20%) In this treatment 20% of fresh Water chestnut was incorporated in 80%
of Wheat flour for Halwa and potato for Chestnut roll.
3. T2 (40%) In this treatment 40% of fresh Water chestnut was incorporated in 60%
of Wheat flour for Halwa and potato for Chestnut roll.
4. T3 (60%) In this treatment 60% of fresh Water chestnut was incorporated in 40%
of Wheat flour for Halwa and potato for Chestnut roll.
5. T4 (80%) In this treatment 80% of fresh Water chestnut was incorporated in 20%
of Wheat flour for Halwa and potato for Chestnut roll.
The data obtained from the experiment was statistically analyzed using analysis ofvariance technique, Two-Way Classification and Critical Difference.
RESULTS AND DISCUSSIONThe entire experiment was undertaken to prepare flour based products -Halwa and
Chestnut roll using wheat flour + fresh water chestnut, refined wheat flour + fresh waterchestnut roll at 20,40,60, and 80 percent level respectively.
SENSORY SCORESTable 1 Organoleptic analysis of Halwa incorporated with (wheat flour + fresh
water chestnut) at different levels.
Parameters Overall
Tr eatments Color Texture Flavor & Taste Acceptability
T0
6.5 6.55 6.4 7.24
T1
7.05 6.95 6.85 6.94
T2
7.3 7.3 7.25 7.27
T3
7.65 7.95 7.9 7.82
T4
8.05 8.5 8.6 8.35
The data illustrated in the above pertaining to the average sensory scores of differentparameters in control and treated sample of Halwa, clearly indicates that treatments T
4
(8.05) had the highest score followed by T3 (7.65), T
2 (7.3), T
1 (7.05), and T
0 (6.5)
making it quite obvious that the addition of 80 % fresh water chestnut did not in any wayeffect the colour of Halwa. While an increase in the amount of fresh water chestnutincreased the colour acceptability of Halwa.
The Allahabad Farmer Vol. LXVII, January - 2012 No. 2

28
Table 2 Organoleptic analysis of Chestnut roll incorporated with (refined wheatflour + fresh water chestnut) at different levels.
Parameters Overall
Tr eatments Color Texture Flavor & Taste Acceptability
T0
8.35 8.1 8.15 8.19
T1
8.55 8.75 8.9 8.72
T2
7.9 7.95 7.85 7.89
T3
7.7 7.7 7.85 7.74
T4
7.5 7.8 7.85 7.71
The data shown that in the table pertaining to the effect of adding different level ofWater chestnut on the colour of chestnut roll clearly indicates that treatment T
1 (8.55)
had the highest score for the colour of chestnut roll as compared to control T0 (8.35) and
treatments T2 (7.9), T
3 (7.7), T
4 (7.5). It is quite clear that addition at 20% incorporation
level of Water chestnut to chestnut roll improved the appearance of the product.
NUTRITIONAL COMPOSITION OF PRODUCTS:
Average percentage of nutrients in control and treatments sample of Halwa.
Tr eatment &Nutrient T 0 T 1 T2 T 3 T 4 F-Test
Fat (g) 14.31 14.17 14.03 13.89 13.75 NS
Fibre (g) 2.27 2.14 2.01 1.88 1.75 S
Carbohydrate (g) 63.23 58.62 54.01 47.07 44.79 S
Energy (Kcal) 582 559 537 514 492 NS
Calcium(mg) 107 104.2 101.4 98.6 95.8 NS
Iron (mg) 4.04 3.685 3.33 2.975 2.62 NS
The table presented above shows the nutrient contents of Chestnut roll with andwithout incorporation of Water chestnut at four different level- 20%, 40%, 60%, and80% of T
1, T
2, T
3 and T
4 respectively. With increase in addition levels, the nutrient like
Fibre, Carbohydrate, Iron and Fat, Energy, calcium are decreased. Gopalan et.al (2002)
Priyanka Yadav and Ritu Prakash Dubey

29
reported that water chestnut is 70%. Moisture, 4.7 g. protein, 0.3 g. fat, 1.1 g. mineral,0.6 g. Fiber,23.3 g. CHO, 115 kcal energy, 20 mg calcium, 150 mg. phosphorus, 1.35 mg.iron,this is a good sources of energy.The energy content of Halwa ranged between582.4 (Kcal)/100g and 492/100g. Treatment T
0 had the highest content of Energy followed
by T1, T
2, T
3, and T
4 respectively.
Average percentage of nutrients in control and treatments sample of Chestnutroll.
Tr eatment &Nutrient T0 T1 T2 T3 T4 F-Test
Fat (g) 52.06 55.09 51.15 51.17 51.19 S
Fibre (g) 1.52 1.64 1.56 1.58 1.6 S
Carbohydrate (g) 89.27 89.34 89.41 89.48 89.55 NS
Energy (Kcal) 869 871 872 874 876 S
Calcium(mg) 66.58 67.58 68.58 69.58 70.58 S
Iron (mg) 3.802 3.889 3.976 4.063 4.15 S
The table presented above shows the nutrient contents of Chestnut roll with andwithout incorporation of Water chestnut at four different level- 20%, 40%, 60%, and80% of T
1, T
2, T
3 and T
4 respectively.With increase in addition levels, the nutrient like
Fibre, Fat, and calcium Energy,chabohydrate and iron are decreased. Kala et. al (2001)The all nutrient content was also observed to increase with the increase in the amount ofWater chestnut with T
4 having the highest content and control T
0 having lowest content.
The calcium and iron content of chestnut roll were found to range between 66.58-70.58mg/100g and 3.802-4.15 mg/100g respectively. Waukegan(2010)
The Allahabad Farmer Vol. LXVII, January - 2012 No. 2

30
Average Scores of overall acceptability of Halwa
Average Scores of overall acceptability of Chestnut roll
Priyanka Yadav and Ritu Prakash Dubey

31
CONCLUSIONFrom the result being summarized, it can be concluded that Water chestnut can
suitably be incorporated with T4 and 80 percent level in Halwa, T
1 20 percentages level
in Chestnut roll. In nutrient estimation of Halwa two nutrients namely Energy, calciumwere found to decreased, increase in addition levels, the nutrient like Fibre, Carbohydrate,Iron and Fat.In nutrients estimation of Chestnut Roll, all the nutrient were found toincrease in incorporation levels the calories, Fat, Calcium contents were found to behighest treatment T
4 (80%) of Chestnut Roll, The decrease level of Carbohydrate and
Iron content were also highest in T4 (80%) treatment.
REFERENCES
Gopalan C., Sastri B.V. Rama (2002): "Nutritive value of Indian Foods", Indian Councilof Medical Research, pp-47-58.
Gopalan C., Sastri B.V. Rama (2004): "Nutritive value of Indian Foods", Indian Councilof Medical Research, pp-47-58.
Lily(2010) Benefits of water chestnut.http://www.unp.co.in/f150/benefits- of-waterchestnut. Kala et. al (2001)
Kala, A; Jamuna, P; Prakash, J. (2001) "Chemical composition and sensory attributesof differently cooked starchy vegetables". Indian Journal of Nutrition, 38, 10 :338 - 349.
Ahmed M. Shafique (2008) Singhara:anaquaticfruit -www.dawn.com/weekly/review/archive/080117/review13.htm
Nicks J (2010) Benefits of Water chestnut.
Waukegan (2010) Agro food Processing emporium. Access to Asian Foods, 3, 7.
The Allahabad Farmer Vol. LXVII, January - 2012 No. 2

32
To Study the Factors Associated with Descriminationof Girl Child
Anita P. Patel*, Manjari S. Acharyannnnn
ABSTRACT
To study the characteristics, relationships and attitudes of selected sample from
one girl child and boy child in the family within the age group of 12 to 18. The
total sample comprised of 90 respondents from the three income group i.e. LIG,
MIG and HIG from Baroda city in year 1991 and find a striking difference in the
attitude of mothers towards girl child was observed is compared to girls (33-5%).
The boys (54-4%) were allowed to take higher education, girls treated with
remedies where as boys were provided allopathic treatment. In case of attitude
of mothers towards girl child. It was found that majority of the respondents in
LIG had negative attitude towards girl child and majority of the respondents in
MIG & HIG had natural attitude towards girl child.
Key Words:- Positive Attitude, Negative Attitude, Neutral Attitude, Girl-childdiscrimination, Decision making opportunity.
INTRODUCTIONThe status of women cannot be regarded as a socially static phenomenon. It changes
under the stress of multifarious socio-economic, political, technological and ideologicalflow of the period. Through the ages, Indian culture had placed women on a pedestal"mother of mankind. "The concept of "Ardhanariswara" in our Hindu philosophy is asymbolic representation of the fact that man is incomplete without woman and both areinterconnected for the betterment of the society. But the ideology of female-subordinationand gender discrimination has been weaved into our socio-economic and political fabricfrom the ancient period. It is pervasive and has penetrated into every layer of our societyaffecting our views and ethos. For centuries women in India are suffering due to
*HOD, nnnnnProfessor
*Home Science Department, Arts, Com. & Sci. College, Bethak Road, Khambhat, Gujarat - 388620nnnnnFamily, Resource Management, P.G. Dept of Home Science, Sardar Patel University, Vallabh Vidyanagar
The Allahabad Farmer Vol. LXVII, January - 2012 No. 2

33
discrimination, exploitation and exposed to various kinds of harassment. It is believedthat all sorts of social discrimination among men and women are the outcome of theman-made scriptures, man-made laws, and literature from the later Vedic period onwhich the people relied; all these pointed the women as the weaker sex.
Though we have entered the new millennium, the status of women has not improvedmainly due to traditional bias and prejudices towards that section of our society. Thediscrimination stems not so much from legislative insufficiency as from the attitudinalbias of the society. (Dr. Praharaj.B, 2010)
(It is found that "altogether women constitute 50% of population, perform 2/3 workand produce 50% of the food consumed by the Indians, they earn only 1/3 of theremunerations and 10% of property of the country." (Kurukshetra, 1994) So there is agreat difference between women's consumption and contribution to our society.)
As per 2001 Population Census of India, the current Sex Ratio of India 2011is 914females/1000 males, Total Male Population in India 2011 is 623.7million and Total FemalePopulation in India 2011 is 586.5 million. Sex Ratio of India as per Census 1991 was 927which have improved to 933 in 2001. (www.sexratio of India)
As per 2001 Population Census of India, the Literacy rate of India has shownimprovement at 65.38%. Male literacy rate is 75.96% and female literacy rate is 54.28%.(www.literacyrate in India)
According to the percentage distribution of Women in Organized and Public Sectors,Indian women work for 69 hours a week, while men work 59 hours per week.(www.languagein india.com)
An Indian women is expected to work, clean and take care of the children andeven earn, if need be. But never in her lifetime is she expected to build her own self orthink about her own self.
The attitude towards girl child is, of course, a reflection of Indian Society's attitudetowards women in general. Reason for the low status of women in Indian society, areboth institutional and attitudinal. It is mainly because of absence of attitudinal change thatthe reforms to improve the status of women have not attained the desired results.
It is pity that despite of tremendous advances made by women in varied fields andthe fact that society can forge ahead only on the basis of equal partnership of men andwomen; the birth of girl child does not arouse as much ado and excitement as the birth ofa boy. The fact is that, the scientific test like amniocentesis is being abused too convenientlyto get rid of female fetuses.
Anita P. Patel, Manjari S. Acharya

34
Hence, it is very important for the people to change their attitude towards girls.Thus, in order to decrease the rate of female feticide and to decrease the discriminationtowards girl child, one will have to start right from their family itself which is one of theunits of the society. So, the change of behavior at micro level will definitely affect thesociety as a whole, at macro level.
JUSTIFICA TIONThe girl child is a vital resource which the family utilizes to the maximum. They
contribute to the household world at an early age and assume responsibility which themale child would not be given even when he is quite grown-up. In spite of her contributionto family's resources in both material and human, she is neglected, discriminated and notwelcomed in the family which motivated the investigator to study the factors whichdirectly or indirectly affects the treatment towards girl child in the family.
OBJECTIVES1. To assess the attitude of mothers towards male and female child.
2. To study the differences in the decision making opportunity given male and femalechild on the following aspects:-
a. Educational aspects
b. Health and Nutrition aspects
c. Recreational aspects
DELIMIT ATION1. The study was delimited to the households in Baroda City (Patel.A.P, 1991) and to
Vallabhvidyanagar (Suthar.R, 2010) with at least one girl child and one boy childwithin the age group of 12 to 18 years.
2. The study was also delimited to the treatment of girl child on selected aspects.
ASSUMPTIONIt was assumed that their exists the differences in the treatment of girl child as
compared to boys in the family.
METHODOLOGYResearch Design facilitates the smooth sailing of various research operations and
thereby makes research as efficient as possible yielding maximal information.
The Allahabad Farmer Vol. LXVII, January - 2012 No. 2
35
The following factors were kept in mind to find out the Research Design appropriatefor the present research study.
The means of obtaining informationa) Both, Secondary and Primary data were obtained together necessary information.
The secondary data was collected from the Income Tax Office, for the categorizationof the three Income groups. (LIG, MIG and HIG).
Primary source: For the present study the data was collected through InterviewSchedule.
b) The focus of the study was on the discrimination towards girl-child on differentaspects like health and nutrition, pattern of serving food, education, and opportunitygiven for decision making and attitude of mothers towards their daughters.
Thus, on the basis of all the above considerations, the Descriptive Research Designwas considered to be the most appropriate method to study the characteristics, relationshipand attitude of the selected sample.
SAMPLE AND SAMPLINGThe unit of inquiry for the present study was the home makers having at least one
male and female child within the age group of 12-18 years.
Purposive Random sampling method was used to select the respondents fromthree Income Group i.e., LIG (Rs 1 to 18,000 per annum), MIG (Rs 18,001 to 50,000 perannum) & HIG (Rs 50,001 and above).
An Interview Schedule was pre-tested and structured was used to collect the data.The total sample comprised of 90 respondents, 30 each from LIG, MIG & HIG.
RESULTS AND DISCUSSION1 Table No.1 shows, a striking difference in the attitude of mothers towards girl
child was observed. It was found that majority of the respondents in LIG havenegative attitude towards girl child and majority of the respondents in MIG & HIGhave neutral attitude towards girl child. (Patel.A.P.1991) whereas a studyconducted in the year (Suthar.R.2010) reflected that maximum of the mothershave positive attitude towards girl child.
Anita P. Patel, Manjari S. Acharya

36
2 As compared to girls (33.5%), the boys (54.4%) were allowed to take highereducation (Patel.A.P.1991). Whereas less of the differences were observedregarding educational aspect of boys (65.1%) and for girls (63.8%) were allowedto take higher education.(Suthar.R.2010)
The Allahabad Farmer Vol. LXVII, January - 2012 No. 2
Table No: 1 Attitude of respondent towards girl child.
No Attitude scores/Income LIG MIG HIG TOTAL
1 Positive - 6 9 15
2 Neutral 2 24 21 47
3 Negative 28 - - 28
TOTAL 30 30 30 90
A Comparative view of difference in the Attitude of Mothers towards girl-child.

37
Anita P. Patel, Manjari S. Acharya
Table No: 2 Frequency & percentage distribution according to the age up towhich girls should be educated.
Total N=90
Age Group GIRLS BOYS
F % F %
16-20 41 45.5 19 21.1
21-25 32 35.5 49 54.4
26-30 17 18.8 22 24.3
TOTAL 90 99.8 90 99.8
3 Regarding Health & Nutrition aspect, during illness, 27.6% girls were treated withhome remedies and ayurvedic medicine whereas 77.7% boys were providedallopathic treatment (Patel.A.P.1991). Whereas 54% of the girls and 56% of theboys were given allopathic treatment (Suthar.R.2010).

38
A comparative picture showing differences in the treatment during illness.
YEAR 1991
The Allahabad Farmer Vol. LXVII, January - 2012 No. 2
Year 2010
GIRLS BOYS
F % F %
92 44.0 118 56.0
Table No: 3 Frequency & percentage distribution according to the type of thetreatment provided.
Year 1991
Tr eatment GIRLS BOYS
F % F %
Allopathic 65 72.2 70 77.7
Ayurvedic 17 18.8 15 16.6
Home Remedies 08 8.8 05 5.5
TOTAL 90 99.8 90 99.8
YEAR 2010

39
4 Regarding the recreational activities, 91.1% allowed boys, but only 67.7% girlswere allowed to go for recreational activities (Patel.A.P.1991). Whereas 53.0%boys and 52.0% girls were given the opportunity to take independent decisionsregarding recreational activities. (Suthar.R.2010)
Anita P. Patel, Manjari S. Acharya
Year 2010
GIRLS BOYS
F % F %
55 52.0 56 53.0
Table No: 4 Frequency & percentage distribution regarding recreationalactivities.
Year 1991
Activity GIRLS BOYS
F % F %
Recreational act. 61 67.7 82 91.1
A comparative picture showing opportunity to take decision regarding recreationalactivity.
YEAR 1991

40
The Allahabad Farmer Vol. LXVII, January - 2012 No. 2
YEAR 2010
CONCLUSIONPerhaps, the difference is seen because probably the parents have given lee-way
to the children and the discrimination between the genders has reduced. Looking at theabove given findings, it can be concluded that after the time span of almost 20 years,there is a positive impact on the traditional attitudes and decision making pattern in thefamilies and hence, inter generation changes in the families are marching towards positivitythrough which gender sensitization can be highlighted which enables to improve thequality of life in the family.
REFERENCES
Dr. Praharj. B, "Women's status in India and Empowering them through Education",Abhijit Publication, Delhi, 2010. P.1
Kurukshetra (1994), Vol. 11/12
Patel A.P, "A study of factors associated with discrimination of girl child", Master'sThesis, Faculty of Home Science, M.S. University of Baroda, 1991.
Suthar. R, "A comparative study of Decision Making ability among adolescent girls andboys", Master's Thesis, S. P. University, Vallabhvidyanagar, 2010.
www.languageinindia.com
www.literacyrateinindia
www.sexratioinindia

41
Growth and Instability of Pulses Productionin India
Punit Kumar Agarwalttttt, O. P. Singhvvvvv, Dheeraj Kumar Vermattttt, Ku. Sushilattttt and C. Sennnnnn
ABSTRACTSustained growth in agricultural production and productivity is essential foroverall stability of the developing economy. Indian agriculture has to step up itsgrowth over and above the rate already achieved and an accelerated growth inagriculture production will help in achieving reduction in rural poverty. Pulses,which are the main source of protein in Indian diet has high nutritional value.India is the world's largest producer of pulses, but the average productivity of638 kg/ha is far less than the world average. Total pulses import in the countrywas 2.79 million tonnes in 2007. The objective of present study was to study thegrowth trained of area, production and productivity and to find out major factorsresponsible for accelerating pulses production in the country. The study wasused data pertaining for the period of 1970-71 to 2007-08. The highest growth inarea was observed in case of lentil followed by arhar and gram. The studysuggests that area allocated by the farmers under gram, arhar and lentil wereshowing positive trend and it was augmented with the compound growth rate of0.45, 1.10 and 1.92 per cent per annum, respectively. In case of production highestgrowth was observed in case of lentil and it was expanding with a compoundgrowth rate of 3.24 per cent per annum followed by gram and arhar. In case ofproductivity, gram and lentil were registered positive growth trend, while in caseof arhar it was negative during the study period. The area was one of the importantfactors for growth of production of arhar and lentil crops, whereas, yield was
responsible for augmentation of gram production is the country.
Key words- Pulse Production, Compound Growth Rate (CGR), Instability,Decomposition analysis
tttttResearch Scholar, vvvvvAssistant Professor, nnnnnProfessortttttDepartment of Agricultural Economics, Institute of Agricultural Sciences, Banaras Hindu University,Varanasi – 221 005v,nnnnnDepartment of Agricultural Economics, Institute of Agricultural Economics, Institute of AgriculturalSciences, Banaras Hindu University, Varanasi – 221 005
The Allahabad Farmer Vol. LXVII, January - 2012 No. 2

42
1.0 INTRODUCTIONAgriculture is one of the strongholds of the Indian economy and accounts for 14.6
per cent of the country's gross domestic product (GDP) in 2009-10. Agriculture contributesabout 10.23 per cent of the total India's exports. Furthermore, the sector providedemployment to 58.2 per cent of the work force (GOI, 2010). But the aggregate growthin agriculture has remained fairly stable and unchanged in the first two decades of thepost Green Revolution period. What is really required at the present stage of developmentof Indian agriculture is to step up its growth over and above the rate already achieved inthe past an accelerated growth in agriculture production would help in achieving a higherreduction in rural poverty. In 1990, total production of pulses in the country was 13.3million tonnes and it was declined to 13.1 million tonnes in 2005-06. Efforts to attainpulses production of 15 million tonnes have proved unsuccessful in the country. Whileproduction has stagnated at around 13 million tonnes, consumption has been hoveringaround 17 million tonnes a year. The per capita availability of pulses has dropped from22.5 kg per annum in 1965-66 to 10.6 kg in 2003-04. (www.hindubusinessline.com)
The area under pulses recorded a poor exponential growth rate of only 0.02 percent during1960-2000, due to stagnation of area between 20-24 millions hectares.Productivity of pulses has almost hovered around 500-600 kg/ha with a growth rate of0.68 per cent from 1960-61 to1999-2000 due to several constraint viz. crop grown underrain-fed and marginal and sub-marginal lands, high susceptibility to pest and disease,weather aberration. The contribution of area under pulse crops to total cropped arearemained stagnant in the country over the past three decades accounting for 13 per cent.The gap between demand and supply of pulses in the country is being met out throughimports. There would be difficult in pulse supply, which will be in the order of 13.65million tonnes by 2010, the country has to produce an incremental output of 1.37 milliontonnes per year to meet out the demand in 2010.
As the area and production of pulses crop vary from state to state in depth studieson variation in growth rate assume great practical significance. Present studies would behelpful in judge the overall country's pulses scenario and formulating & development ofsuitable strategies to augment pulse production in country. The present study was thereforeundertaken to examine the growth rate in area, production and productivity of majorpulses; to measure the instability in production of major pulses and to estimate the relativecontribution of area and productivity in growth of production of major pulses.
Punit Kumar Agarwal, O. P. Singh, Dheeraj Kumar Verma, Ku. Sushila and C. Sen

43
2.0 METHODOLOGYThe study was based on secondary data and it was pertaining to the period of 1970-
71 to 2006-07. The period of study was divided into four sub-periods i.e. sub-period-I(1970-79), sub-period-II (1980-89), sub-period-III (1990-1999) and sub-period IV (2000-2007)
The data was collected from different sources like Centre for Monitoring IndianEconomy (CMIE), Ministry of Agriculture, The Hindu survey, Economic Survey, IndianAgriculture Statistics, Directorate of Economics and Statistics and Indian Institute ofPulse Research.
2.1 Estimation of growth rateGrowth rates was worked out to examine the tendency of variable to increase,
decrease or stagnant over a period of time. It also indicates the magnitude of the rate ofchange in the variable under consideration per unit of time.
The rate of change of 'Yt' per unit of time to express as a function of the magnitudeof 'Yt' itself is usually termed as the compound growth rate (GCR) which can be expressedmathematically as:
………………………. (i)
The above expression if multiplied by 100 gives the compound growth rate of 'Yt' inpercentage term.
There are many alternative forms of growth function viz., linear exponential,modified exponential, Cobb-Douglas etc. which have been developed and used by theresearcher.
The mathematical form of log-linear function (also known as exponential function)is as follows:
Yt = A
ebt ........................................................... (2)
The log transformation of this function is as follows:
Loge Y
t = log
e A + b
t
Differentiating it with reference to 't' gives,
= b
The Allahabad Farmer Vol. LXVII, January - 2012 No. 2

44
Or,
..................................................... (3)
The formula for calculating Compound Growth Rate (CGR) from the log-linearequation can be derived as follows:
Let "Y0" be the value of variable under study in the base period.
'Yt' be the value of variable in time 't'. 'Y' be the value of Compound Growth Rate(CGR), then using the compounding formula, we get,
Yt = Y
0 (1 + r)t.
Log - transformation of the above i.e.
Log Yt = log Y
0 + t log (1+r).
Assuming,
Log Y0 = log A.
Log (1+r) = b,
The same expression can be put as-
Log Yt = log A + bt
From the log-linear form, CGR can be worked out as follows:
By differentiating,
But, the estimate of 'b' in the log-linear function is in semi-log terms. Therefore, toconvert it into the original form of Y
t the following transformation is done (Kaushik,
1993)
Since b = log (1+r)
Antilog (b) = 1 + r
r = (Antilog 'b') - 1
CGR in percentage = [(Antilog 'b') - 1] x 100
Punit Kumar Agarwal, O. P. Singh, Dheeraj Kumar Verma, Ku. Sushila and C. Sen

45
2.2 Measurement of instabilityInstability is the deviation from the trend. It can be measured by using co-efficient
of variation. The standard deviation as percentage of mean is called as co-efficient ofvariation (Chandel, 2006).
CV =
Where,
CV = Co-efficient of variation
σ = Standard deviation of the variable
= Mean of the variable.
2.3 DECOMPOSITION OF ANAL YSIS To estimate the contribution of area, productivity and interaction of the two in total
production, the following additive scheme of decomposition was used (Singh and Singh,1997):
Where,
P = Change in production
A0 = Area in base year
An = Area in current year
Y0 = Yield in base year
Yn = Yield in current year
∆A = Change in area (An - A
0)
∆Y = Change in yield (Yn - Y
0).
The Allahabad Farmer Vol. LXVII, January - 2012 No. 2
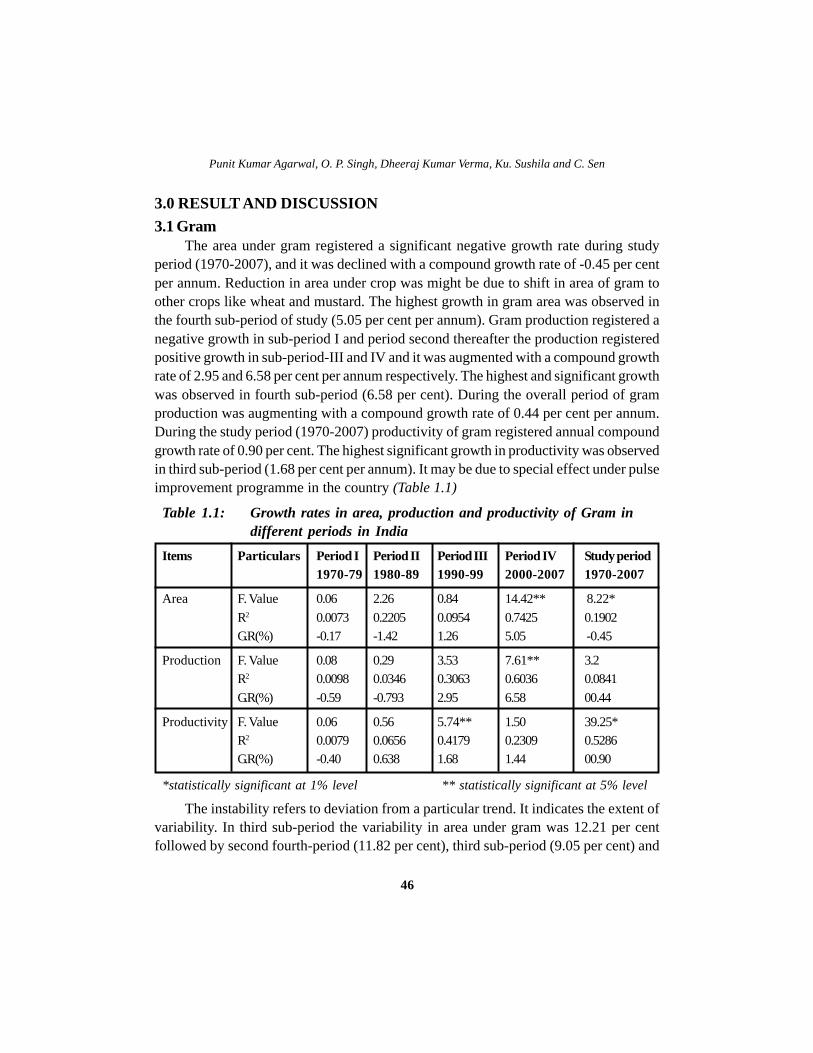
46
3.0 RESULT AND DISCUSSION3.1 Gram
The area under gram registered a significant negative growth rate during studyperiod (1970-2007), and it was declined with a compound growth rate of -0.45 per centper annum. Reduction in area under crop was might be due to shift in area of gram toother crops like wheat and mustard. The highest growth in gram area was observed inthe fourth sub-period of study (5.05 per cent per annum). Gram production registered anegative growth in sub-period I and period second thereafter the production registeredpositive growth in sub-period-III and IV and it was augmented with a compound growthrate of 2.95 and 6.58 per cent per annum respectively. The highest and significant growthwas observed in fourth sub-period (6.58 per cent). During the overall period of gramproduction was augmenting with a compound growth rate of 0.44 per cent per annum.During the study period (1970-2007) productivity of gram registered annual compoundgrowth rate of 0.90 per cent. The highest significant growth in productivity was observedin third sub-period (1.68 per cent per annum). It may be due to special effect under pulseimprovement programme in the country (Table 1.1)
Table 1.1: Growth rates in area, production and productivity of Gram indifferent periods in India
Items Particulars Period I Period II Period III Period IV Study period1970-79 1980-89 1990-99 2000-2007 1970-2007
Area F. Value 0.06 2.26 0.84 14.42** 8.22*
R2 0.0073 0.2205 0.0954 0.7425 0.1902G.R(%) -0.17 -1.42 1.26 5.05 -0.45
Production F. Value 0.08 0.29 3.53 7.61** 3.2R2 0.0098 0.0346 0.3063 0.6036 0.0841
G.R(%) -0.59 -0.793 2.95 6.58 00.44
Productivity F. Value 0.06 0.56 5.74** 1.50 39.25*R2 0.0079 0.0656 0.4179 0.2309 0.5286G.R(%) -0.40 0.638 1.68 1.44 00.90
*statistically significant at 1% level ** statistically significant at 5% level
The instability refers to deviation from a particular trend. It indicates the extent ofvariability. In third sub-period the variability in area under gram was 12.21 per centfollowed by second fourth-period (11.82 per cent), third sub-period (9.05 per cent) and
Punit Kumar Agarwal, O. P. Singh, Dheeraj Kumar Verma, Ku. Sushila and C. Sen

47
the lowest in first sub-period i.e. 6.22 per cent. During the whole study period (1970-2007) the variability in gram area was observed to be 10.88 per cent. Production variabilitywas highest in first sub-period i.e. 17.06 per cent followed by fourth sub-period (16.62per cent) and third sub-period (15.92 per cent) and lowest in second sub-period (12.89per cent). During the whole study period (1970-2007) the variability in Gram productionwas observed 16.13 per cent. Yield variability of gram was highest in first sub-period i.e.13.04 per cent followed by third sub-period (7.73 per cent) and second sub-period (7.57per cent) and lowest in fourth sub-period (6.31 per cent). During the whole study period(1970-2007) variability in gram yield was estimated to be 12.79 per cent (Table 2.1).
Table 2.1: Variability in area, production and productivity of Gram in differentperiods in India
Items Particulars Study period Period I Period II Period III Period IV1970-2007 1971-80 1981-90 1991-2000 2001-07
Area SD 0.76 0.47 0.63 0.85 0.77Mean 7.06 7.64 6.97 6.96 6.52CV % 10.88 6.22 9.05 12.21 11.82
Production SD 0.81 0.83 0.60 0.85 0.87
Mean 5.03 4.87 4.68 5.39 6.24CV % 16.13 17.06 12.89 15.92 16.62
Productivity SD 91.19 82.75 50.80 59.78 50.43
Mean 712.97 634.5 671.1 773.1 799CV % 12.79 13.04 7.57 7.73 6.31
SD: Standard deviation
The contribution of area, yield and interaction between area and yield in the productiongrowth of gram in India, during the study period is presented in Table 3. The analysissuggests that per hectare yield of gram, influence the overall growth of the gram productionin the country (150.94 per cent) during the study period, while area and interaction ofarea and production shows negative effect in the study period (-40.37 per cent) and(-10.57per cent), respectively.
From the above discussion it is clear that area under gram allocated by the farmersare erratic and when farmers are getting irrigation facility or good rainfall they shift areafrom gram to other crops and this affects overall growth in production of gram in the
The Allahabad Farmer Vol. LXVII, January - 2012 No. 2

48
country. If we want to enhance production we need to develop high yielding varietiessuitable for rainfed condition and provide incentives to the farmers to put sufficient areaunder gram
3.2 Ar harArea under arhar registered significant growth during whole study period (1970-
2007) as well as in second sub-period and it was highest growth rate (2.31 per cent).During the whole study period, area allocated by the farmers under arhar registeredpositive growth and it was growing with a compound growth rate of 1.10 per cent perannum. Arhar production registered a significant growth during study period and sub-periods second. During whole study period (1970-2007) it was growing less than one percent per annum (0.95 per cent). The highest growth was observed in second sub period(2.85 per cent) and lowest in first sub period (0.59 per cent). During the overall periodproduction of arhar increased significantly due to the neutralizing effect of decrease inproductivity and significant increased in the area of crop. Arhar productivity registered anegative growth in whole study period and sub-period first. During the overall studyperiod (1970-2007) it was shrinking with a compound growth rate of -0.14 per cent perannum. The highest growth rate in productivity was registered during sub period thirdwith a compound growth rate of 1.59 per cent per annum (Table 1.2).
Table 1.2: Growth rates in area, production and productivity of Arhar indifferent periods in India
Items Particulars Period I Period II Period III Period IV Study period1970-79 1980-89 1990-99 2000-2007 1970-2007
Area F. Value 3.53 55.80** 6.34** 0.55 117.56*R2 0.3064 0.8746 0.4422 0.0995 0.7706Growth rate 0.86 2.31 -0.65 0.47 01.10
Production F. Value 0.23 8.18** 0.42 2.32 23.28*
R2 0.0280 0.5055 0.0502 0.3169 0.4004Growth rate 0.59 2.85 0.95 1.92 00.95
Productivity F. Value 0.05 0.51 1.42 1.54 0.89R2 0.0066 0.0599 0.1510 0.2352 0.0247
Growth rate -0.30 0.54 1.59 1.49 -00.14
*statistically significant at 1% level ** statistically significant at 5% level
Punit Kumar Agarwal, O. P. Singh, Dheeraj Kumar Verma, Ku. Sushila and C. Sen

49
The second sub-period registered highest variability in arhar area i.e. 7.44 per centfollowed by first (4.62 per cent) and fourth sub-period (3.21 per cent). The lowest variabilityin area registered during third sub-period (2.96 per cent). During the whole study periodvariability in area of arhar was observed to be 12.87 per cent. Arhar production variabilitywas found maximum in the third sub-period (12.36 per cent) followed by second (11.76per cent) and first sub-period (10.23 per cent). The lowest variability was observed infourth sub-period (7.71 per cent). During the whole study period (1970-07), variability ofarhar production was 15.57 per cent. Instability in production was shared by the variationboth in area and productivity. The yield variability was observed highest in third sub-period (12.08 per cent) followed by first (10.71 per cent) and fourth sub-periods (6.81per cent). The lowest variability was noticed during second sub-period (6.64 per cent).During the whole study period yield of arhar registered 9.90 per cent variability (Table2.2).
Table 2.2: Variability in area, production and productivity of Arhar indifferent periods in India
Items Particulars Study period Period-I Period-II Period-III Period-IV1970-2007 1971-80 1981-90 1991-2000 2001-07
Area SD 0.40 0.11 0.23 0.10 0.11Mean 3.16 2.58 3.19 3.48 3.5
CV % 12.87 4.62 7.44 2.96 3.21
Production SD 0.34 0.18 0.280 0.29 0.18Mean 2.22 1.81 2.38 2.39 2.35CV % 15.57 10.23 11.76 12.36 7.71
Productivity SD 69.70 75.34 49.51 83.02 45.76
Mean 704.05 703.1 745 686.9 671.42CV % 9.90 10.71 6.64 12.08 6.81
SD: Standard deviation
In case of production growth of arhar during the study period area affect more (73per cent) followed by yield (18.77 per cent) and interaction effect with 8.10 per cent(Table 3). The analysis reflects that area under crop is one of the responsible factors toaugment production in the country. Due to the fluctuation in area allocation under thecrop, overall growth in arhar production in the country is fluctuating. As we know, farmersare growing arhar under poor crop management condition and they allocated more area
The Allahabad Farmer Vol. LXVII, January - 2012 No. 2

50
during poor rainfall year and lower area under good rainfall area. Therefore, it is importantto provide incentives to the pulse grower to allocate more area under arhar crop.
3.3 LentilThe area under lentil registered a significant and positive growth rate during overall
study period (1970-2007). The highest growth was observed during first sub-period (2.72per cent) and lowest in sub period fourth (0.34 per cent). The lentil acreage allocated bythe farmers registered a compound growth rate of 1.92 per cent per annum during theoverall study period. Lentil production registered significant and positive growth in thewhole study period and sub period second. Durign whole study period, production wasaugmented with a compound growth rate of 3.29 per cent per annum. Significant increasedproduction of lentil was noticed in the country as a whole which was due to increasedgrowth of variable viz. area and productivity. Lentil productivity registered significantand positive growth (1.33 per cent per annum) in whole study period (1970-2007). Thehighest growth was observed in second sub-period and it was expanding with a compoundgrowth rate of 3.43 per cent for which responsible was good input supply and bettermanagement practices (Table 1.3).
Table 1.3: Growth rate in area production and productivity of lentil indifferent periods in India
Items Particulars Period I Period II Period III Period IV Study period1970-79 1980-89 1990-99 2000-2007 1970-2007
Area F. Value 4.46 25.16* 24.28* 0.26 347.01*
R2 0.3579 0.7587 0.7522 0.0486 0.908G.R(%) 2.72 1.98 02.34 0.34 01.92
Production F. Value 0.30 99.59* 3.84 0.03 268.96*R2 0.0364 0.9256 0.3246 0.0051 0.885
G.R(%) 0.92 5.40 2.44 0.19 03.29
Productivity F. Value 7.01** 52.77* 0.00 0.00 67.49*R2 0.4669 0.8683 0.0012 0.0018 0.6586G.R(%) -1.81 3.43 0.08 -0.12 01.33
Statistically significant at 1% level ** statistically significant at 5% level
The first sub-period registered relatively higher variability in lentil area (12.72 percent) followed by second sub-period (8.26 per cent), third sub-period (6.79 per cent) andlowest in fourth sub-period (3.34 per cent). During the whole study period (1970-07),
Punit Kumar Agarwal, O. P. Singh, Dheeraj Kumar Verma, Ku. Sushila and C. Sen

51
variability of lentil area was found to be 21.04 per cent. Lentil production variability wasmaximum in second sub-period (16.40 per cent) followed by first sub-period (14.18 percent), third sub-period (13.42 per cent) and lowest in fourth sub-period (5.92 per cent).During the whole study period (1970-2007), lentil production variability was estimated tobe 34.37 per cent. Yield variability of lentil was highest in second sub-period (10.88 percent), followed by first sub-period (7.79 per cent) and third sub-periods (7.39 per cent).Thelowest in fourth sub period (6.45 per cent). During the whole study period lentil yieldvariability was registered 16.87 per cent (Table 2.3).
Table 2.3: Variability in area, production and productivity of lentil in differentperiods in India
Items Particulars Study period Period-I Period-II Period-III Period-IV1970-2007 1971-80 1981-90 1991-2000 2001-07
Area SD 0.23 0.10 0.06 0.10 0.04
Mean 1.12 0.86 1.02 1.26 1.45CV % 21.04 12.72 6.79 8.26 3.34
Production SD 0.23 0.05 0.09 0.11 0.05Mean 0.67 0.39 0.59 0.84 0.95
CV % 34.37 14.18 16.40 13.42 5.92
Productivity SD 98.54 35.50 62.98 49.28 44.33Mean 58.89 45.54 580 666.5 655CV % 16.87 7.79 10.88 7.39 6.76
SD: Standard deviation
Table 3: Area effect, yield effect and interaction effect on production growthof Pulses crops in India
S. No. Description Gram Arhar Lentil
1 Change in yield variance (%) 150.94 18.77 23.50
2 Change in area variance (%) -40.37 73.14 52.36
3 Interaction between changes in mean area and mean-10.57 8.10 24.14yield (%)
The Allahabad Farmer Vol. LXVII, January - 2012 No. 2

52
In the lentil, area effect remained prominent factor in the production growth duringthe study period. The contribution of yield remained (23.50 per cent), lower than areaeffect which was 52.30 per cent while the interaction impact was 24.14 per cent.
4.0 SUMMARY AND CONCLUSIONThe compound growth trained analysis for area, production and productivity of
pulse crops show a clear picture that area under total pulses gets shrinking, which bringsdrastic reduction in production making country more dependence on imports of pulses.The study suggests that area allocated by the farmers under gram, arhar and lentil wereshowing positive trend. The area was one of the important factors for growth of productionof arhar and lentil crops, whereas, yield was responsible for augmentation of gramproduction is the country.
For improving the productivity of pulses, there is a need to encourage the farmersto use appropriate amount of inputs viz., fertilizers, improved seed, pesticide and provideone or two irrigation. Crop insurance scheme particularly for major pulses should beintroduced as an incentive to pulse producers. The technology innovations so far generatedby the State Government, ICAR Institutions and other agencies for improving the pulseproduction should be transferred to the farmers by State extension agencies. To attractthe pulse growers, there is an utmost need to fix the procurement price of pulse crop athigher side keeping in view the importance of the crop its low production and high demand.
REFERENCES
Indian Institute of Pulses Research, (2007). Annual Report-2006-2007. IndianInstitute of Pulses Research Kanpur.
Government of India, (2008). Agricultural Statistics at a glance. Department ofagriculture and Cooperation, Ministry of Agriculture, Government of India,New Delhi.
Chandel, S.R.S., (2006). A Handbook of Agricultural statistics p-99
Gajja,M.M., (2004). Analysis of growth of pulses in arid zone of Rajasthan. CurrentAgriculture, 28(1/2): 63-68.
Ipe, C. V., (1990). Growth and instability in production of spices in Kerala. Journal ofPlantation Crops, 18(2): 96-105.
Punit Kumar Agarwal, O. P. Singh, Dheeraj Kumar Verma, Ku. Sushila and C. Sen

53
Jain,K.K. and Singh,A.J., (1991). An economic analysis of Growth and instability inpulses production in Punjab. Agriculture Situation in India, 46(1): 3-8
Jha,G.K.D.and Khare,H.P., (2006). "Analysis of Growth and instability ofchickpea(gram) production in Madhya Pradesh. Agriculture Situation in India,63(4): 435-438.
Kumar, H. and Kumar, D.S., (2005). "Production Scenario of Chickpea in India:Growthand decomposition analysis. Indian Journal of Pulse Research, 18(2):199-201.
Kumar, D.H., (2005). "Growth and instability in pulses production in Uttar PradeshIndia. Indian Journal of Pulses Research, 18(1): 100-101.
Kaushik, K.K., (1993). Growth and Instability of oilseed production. Indian Journalof Agricultural Economics, 48(3): 334-338
Mahendradv, S., (1987). Growth and instability in food grains production. Economicsand Political Weekly, 22(31): 482.
Panda, R.K., (1992). Growth and instability in the agriculture of Orissa. AgricultureSituation in India, 46(12): 915-920 .
Prasher, R.S. and Bhal, S.K., (1998). Growth and instability in Himachal Pradesh.Bihar Journal of Agriculture Marketing, 6(1):43-49
Pal, S., (1989). Stagnant production and changing production instability of oilseed inIndia. Agricultural Situation in India, 44(5): 353-358.
Priya, R.K., (1996). Pulse production in north Bihar during post Green Revolutionperiod. Bihar Journal of Agricultural Marketing, 4(4): 407-416.
Rao, I. V. Y. R.and Raju, V. T., (2005). Growth and instability of groundnut, Arachishypogaea L. production in Andhra Pradesh. Journal of Oilseeds Research,22(1): 141-149.
Rangi, P.S. and Kaur,H.S., (2002). Present status and Future prospects of Pulses inIndin. Economic Af fairs, 47(1): 32-36.
Sharma, M.P.and Jain, H.O., (2006). Contribution of area and productivity towardsgrowth of soybean production in Madhya Pradesh. Soybean Research,4 (1/6): 54-62.
The Allahabad Farmer Vol. LXVII, January - 2012 No. 2

54
Siju, T. and Kambairaju, S., (2001). Growth performance of rice production in India:a trend and decomposition analysis. Agriculture Situation in India, 58(4):143-162.
Singh, A. J. Kaur,P., (1993). Growth and instability in oilseeds in India" .AgriculturalSituation in India, 48(1): 9-16.
Singh, J.P. and Gangwar, A.C., (1986). Instability in cereals production in Haryana:A decomposition Analysis. Recent Advances in Agricultural Statistics Research,Wiley Eastern Limited, New Delhi, p.130.
Singh, V. P. and O. P. Singh., (1997). Specio-temporal Variation in Production ofGroundnut, Rapeseed-mustard, Sesamum and Linseed crops: A DecompositionApproach: Agricultural Situation in India, 54(5): 241-246.
Swain, H., (2007). Growth and variability of oilseeds production in Rajasthan".Agricultural Situation in India, 64(8): 367-375.
Punit Kumar Agarwal, O. P. Singh, Dheeraj Kumar Verma, Ku. Sushila and C. Sen

55
Novel Intervention in transition of farmwomen - NAVEEN SICKLE
Neerubala*, Verma, A*
ABSTRACT
Indian agriculture is predominantly managed by farm women in all its
interventions. Agriculture operations in which farm implements and equipments
are mainly used and generally handled by farm women. The one of the
intervention use of Naveen sickles, this Naveen sickle was found superior over
traditional sickle. It was found to be effective, economical, time saver, labour
saver, and of better out put. This intervention is a major source of transition in
farm families.
Key words: Naveen sickle, novel, intervention, intellectual, allied fields
INTRODUCTIONCapacity building of farm women is a way of defining over coming of barriers in
farm women's life through which her ability to shape her life and environment. It is anactive multidimensional process which should enable women to realize their full identityand power in all spheres of life. Since time immemorial farm women have played andcontinue to play a key role in conservation of basic life support system such as landwater flora and fauna. Rural women play a crucial role in agricultural development andallied fields including crop production, livestock production, horticulture, post-harvestoperations, fisheries, etc. Without total intellectual and physical participation of women, itis not possible to achieve the goals of rural uplift.
It is estimated that women are responsible for 70 percent of actual farm work andconstitute up to 60 percent of the farming population Khatik G L (1990). It is mostunfortunate that the role of women in agriculture has not been highlighted. Women mustbe empowered by enhancing their awareness, knowledge, skills and technology useefficiency so that agricultural production multiplies at a faster pace environmental
Assistant Professor*
Department of Foods & Nutrition, Halina School of Home Science, SHIATS, Allahabad – 211007 (U.P.)
The Allahabad Farmer Vol. LXVII, January - 2012 No. 2

56
degradation is reduced and conservation of resources is practiced earnestly, thereby,facilitating overall development of the society.
Women do many of the difficult farm tasks in India .transplanting, weeding, harvestingand post-harvest of produce. All of these tasks are time consuming and full of drudgery.Some improved implements like wheel hoe, paddy transplanter, Naveen sickle canreduce drudgery and physical exertion.
Naveen sickle is the best suited for harvesting wheat and rice crops. It has awooden handle with a special hand grip shaped to make harvesting easier. The sickleblade ,made of serrated carbon steel, is riveted to a 12-mm wide. U shaped strip whichis fixed to the handle. (C.I.A.E Bhopal)
The study was under taken with following objectives.
1- To study the socio economic profile of the farm women.
2- To study the impact of naveen sickle over traditional.
3- To study the level of transition in farm families because of novel intervention.
MATERIALS & METHODSThe present study pertaining to the topic was carried out with overall clear objectives.
The problems aimed was first to find out the socio-economic profile of farm women inthe near by villages and secondly the need assessment of these farm women speciallythe use of Naveen sickle.
Selection of villageThe two villages named Tikari Taluka and Kulhadia block Jasra, District-Allahabad
was selected based upon the primary information collected from district statistical book.The village Tikari Taluka is situated on national highway No-27 around 25km. from theSam Higginbottom Institute of Agriculture, Technology & Sciences (SHIATS). The othervillage Kulhadiya is also situated around 30 km.from the SHIATS.
Selection of respondentsThe 100 farm women aged 25-45 years were randomly randomly selected for
present study.
Collection of dataThe secondary data was collected through RRA(Rapid rural appraisal)techniques
and was updated, verified through PRA (participatory rural appraisal) techniques. Thestructured questionnaire was prepared and used in survey work (Mukherjee,1993).
Neerubala, Verma, A

57
Need assessmentAfter the survey and verification of data of the areas specific need assessment
was carried out through PLA (participatory learning appraisal). The technique helped inarriving the individual need for specific training intervention in a given farming situation.The PLA helped in ascertaining the need of drudgery reduction of the farm women.Result oriented demonstration was organized in village Tikri and Kulhadia. 50 traineeswere selected for the demonstration of Naveen sickle in paddy crop.
RESULTS& DISCUSSION70% farm women are in the age range of 25-35 years. It is also evident that 82%
farm women were found to be married. It is interesting to note that 76% women arepredominantly occupied in agricultural activity and 8% in the cast based occupation,76% farm women work as farm labours. They earn additional livelihood from thisoccupation and this category of the farm women are subjected to drudgery.
Table-1:Social-economical profile of farm women:
Sl. No. Variable Categories Frequency Percentage
1 Age 25-35 years 35 7035-45 years 15 30
2 Marital status Un-married 4 8 Married 41 82Widowed 5 10
3 Family occupation Agriculture 38 76 Caste based occupation 4 8Others 8 16
4 Working status Work in own field 12 28work in others field 38 76
Table-2:Field capacity of naveen sickle
Sl.No Use of Sickle Capacityout Capacity out put Cost of operationput(ha/hr) (Man/hr/ha) (Rs/ha)
1 Traditional sickle 0.007-0.008 120-140 1920-2240
2 Naveen sickle 0.009-0.01 90-110 1440-1760
The Allahabad Farmer Vol. LXVII, January - 2012 No. 2

58
It is evident from the table no 2, that the use of traditional sickle gave the capacityoutput is lowest (120-140 mn/hr/ha) whereas Naveen sickle resulted into (90-110 mn/hr/ha) and subsequently resulted into less cost of operation, whereas use of traditionalsickle was found to be costlier.Table N.o 3 drudgery reduction through naveen sickle.(percentage)
Intervention Labour saving Time saving Cost saving
Naveen sickle 25-33 25 25
It has been observed from table no. 3 that Naveen sickle is efficient for drudgeryreduction in farm women saving in labour, cost & time are all 25% because man / hoursharvesting is directly proportional to time and cost.
CONCLUSIONSIt is evident from the present study that the family occupation of the of the farm
women are predominantly agriculture(76%) and similarly out of the total work forceengaged in the farming. 70% farm women are in the age group was 25-35 years. 28%farm women were engaged in their own field and 76% farm women were working asagricultural labours .In this 76% women force were subjected drudgery.
It is also interesting to note the use of traditional sickle was cuberson (120-140 mn/hr/ha) with a heavy cost of operation 900-1080 hr/ha but the naveen sickle has an edgeover in traditional sickle. It helps in drudgery reduction in farm women saving the labour,reducing the cost around 25%. Hence it is evident that the use of Naveen sickle willdefiantly help in transitions of families because it saves the family's time, enhance thecapacities of the workers, improves the output ratio thus increases profitability per unitarea and brings about overall transitions in the farming families
REFERENCES
Khatik, G.L. (1990). "Role of farm women in agricultural development". M.Sc. Thesis,RAU.
Mukherjee, N. (1993). Participatory rural appraisal , methodology and applications.Concept publishing company New Delhi-110059.
Director, Central Institute of Agricultural Engineering, Nabi Bagh, Berasia Road,Bhopal - 462018 (MP).
Neerubala, Verma, A

59
Estimation of Genetic Diversity in MungbeanGermplasm
Deepak Kumarttttt, Ashok Kumar S. M.lllll and G. Roopa Lavanyannnnn
ABSTRACT
An experiment was conducted to assess genetic diversity in mungbean germplasm
for ten quantitative characters. Genotypes were grouped into eight clusters as
per D2 analysis. The cluster III included six genotypes, forming the largest cluster.
Highest inter-cluster distance was observed between cluster VII and VIII followed
by III and VIII, II and VIII, suggesting that crossing between the genotypes
included in these clusters is expected to generate heterotic combination and
thus facilitate the isolation of desirable genotypes. Percent contribution to genetic
distance was found maximum for days to maturity, pod length and number of
pods per plant, indicating that priority should be given to above characters
while selecting the parents for hybridization in mungbean.
Keywords: Mungbean, diversity, D2 analysis, cluster distance, percentcontribution
INTRODUCTIONMungbean (Vigna radiata L. Wilczek) is an important pulse crop of India. The
protein present in greengram is easily digestible and therefore recommended as medicaldiet besides rich in vitamin B and thus regarded as a remedy for Beri-beri disease. InIndia, the total area under pulses has remained unchanged (22-24 million hectare) withalmost stable production (12-14 million tons) over the last decades (Asthana andChaturvedi, 1999). In fact, average yield of mungbean is very low not only in India(425 kg/ha) but in entire tropical and subtropical Asia, being ascribed to the inherentlylow yielding potential of the cultivars and their susceptibility to diseases. Hence, it isimportant that genetic reconstruction of plant type is required for developing high yieldingvarieties by incorporating and improving the yield and its component characters. The
ttttt,lStudent, M.Sc. (Ag.), nnnnnAssistant Professor
Department of Genetics and Plant Breeding, Allahabad School of Agriculture,
SHIATS, Allahabad – 211007 (U.P.)
The Allahabad Farmer Vol. LXVII, January - 2012 No. 2

60
information about the nature and magnitude of genetic diversity existing in the availablegermplasm collections of a crop is essential for selection of diverse parents, which uponhybridization may provide a wide spectrum of gene recombination for quantitativelyinherited characters. Genetic diversity has become one of the most important criteria forselecting the parents for hybridization. Therefore, the present experiment was aimed tostudy genetic diversity present among mungbean genotypes for yield and other componentcharacters.
MATERIAL AND METHODSThe experiment comprising of 23 mungbean genotypes was conducted during kharif,
2007 at the Field Experimentation Centre, Department of Genetics and Plant Breeding.The experiment was conducted in randomized complete block design in three replicationswith 30 cm and 10 cm inter and intra row spacing, respectively. Observations wererecorded on 10 morphological characters viz., plant height (cm), number of primarybranches per plant, number of clusters per plant, number of pods per plant, days tomaturity, number of seeds per pod, pod length (cm), harvest index (%), 100-seed weight(g) and seed yield per plant (g) on five randomly selected plants from each genotype.Recommended cultural practices and plant protection measures were followed to raise ahealthy crop. The pooled data were subjected to multivariate analysis as suggested byMahalanobis (1936) and genotypes were grouped into different clusters based ondistances by non-hierarchical Euclidean cluster analysis (Spark, 1973).
RESULTS AND DISCUSSIONThe analysis of variance showed a wide range of significant variation for all
characters under study except for primary branches per plant (Table 1) which revealedpresence fo ample amount of variability among genotypes. The above findings are inagreement with findings of Reddy et al. (2004) and Bhattacharya and Vijayalaxmi(2005). In present study, 23 genotypes were grouped into eight clusters, cluster IIIcomprised six genotypes evolved as the largest cluster, followed by cluster II and IVwith five genotypes each while cluster V, VI, VII and VIII emerged as monogenotypicand constitute one genotype i.e., KM7-191, KM7-211, KM7-173, KM7-189 respectivelywhereas cluster I included three genotypes. Distribution of genotypes into differentclusters, suggested the presence of substantial genetic divergence among the germplasmand indicated that this material may serve as good source for selecting diverse parentsfor hybridization programme in mungbean (Loganathan et al., 2001 and Ahmad etal., 2007).
Deepak Kumar, Ashok Kumar S. M. and G. Roopa Lavanya

61
Table 1: Analysis of variance for 10 characters in mungbean germplasm
S. No Characters Mean sum of Squares
Replication Tr eatment Error
Degree of freedom 2 22 44
1 Plant height 20.316 158.851** 11.689
2 Primary branches/plant 0.00051 0.718 0.242
3 Number of clusters/plant 22.059 9.644** 5.175
4 Number of pods/ plant 51.617 199.527** 17.789
5 Days to maturity 11.536 114.055** 4.869
6 Number of seeds/pod 0.319 1.385** 0.612
7 Pod length 0.423 3.960** 0.199
8 Harvest index 3.024 444.49** 30.169
9 100-Seed weight 0.121 1.404** 0.27
10 Seed yield/plant 3.483 7.323** 2.44
*and ** significant at 0.05 and 0.01 level of significance, respectively
Table 2: Distribution of mungbean genotypes into different clusters
S. No Cluster Numbers of Genotypes includedNo. genotypes
1 I 3 KM7-187, KM7-198, KM7-180
2 II 5 KM7-203, KM7-207, KM7-176, KM7-192,KM7-202
3 III 6 KM7-190, KM7-200, KM7-174, KM7-178,KM7-179, KM7-175
4 IV 5 KM7-181, KM7-184, KM7-182, KM7-193,KM7-212
5 V 1 KM7-191
6 VI 1 KM7-211
7 VII 1 KM7-173
8 VIII 1 KM7-189
The Allahabad Farmer Vol. LXVII, January - 2012 No. 2

62
The intra and inter- cluster average distances among eight clusters were variable(Table 3). The maximum intra cluster distance (D2) was registered for cluster IV (20.79)followed by cluster III (11.56). Inter cluster distance (D2) was found maximum betweenclusters VII and VIII (142.56) followed by cluster III and VIII (93.83) and cluster II andVIII (84.09). Clusters with maximum inter- cluster distance was found to be highlydivergent groups. Hence, inter cluster distance must be taken into consideration, whileselecting the parents for hybridization (Reddy et al., 2004 and Ahmad et al., 2007).
Mean performance of different clusters revealed wide range of differences fordifferent characters (Table 4). Cluster VII showed highest mean performance for seedyield per plant, harvest index, number of pods per plant, number of clusters per plant,primary branches per plant and early maturity. Cluster VIII recorded maximum mean
Table 3: Intra (diagonal) and inter-cluster average distances (D2) in mungbean
Cluster No. I II III IV V VI VII VIII
I 5.24 17.81 27.46 21.90 11.69 22.37 65.61 55.06(2.29) (4.22) (5.24) (4.68) (3.42) (4.73) (8.10) (7.42)
II 10.96 24.11 20.70 25.50 30.80 63.80 84.09(3.31) (4.91) (4.55) (5.05) (5.55) (7.99) (9.17)
III 11.56 36.00 29.48 27.98 22.85 96.83(3.40) (6.00) (5.43) (5.29) (4.78) (9.84)
IV 20.79 43.03 55.06 81.00 81.90(4.56) (6.56) (7.42) (9.00) (9.05)
V 0.00 8.82 62.73 57.15(0.00) (2.97) (7.92) (7.56)
VI 0.00 47.19 63.04(0.00) (6.87) (7.94)
VII 0.00 142.56(0.00) (11.94)
VIII 0.00(0.00)
D value is represented in parenthesis
Deepak Kumar, Ashok Kumar S. M. and G. Roopa Lavanya

63
Table 4: Cluster mean values of eight clusters for 10 characters in mungbean.
S. No Cluster No. I II III IV V VI VII VIII
Characters
1 Plant height 64.92 66.9 60.56 74.1 56.24 54.02 59.59 58.45
2 Primarybranches/ plant 3.29 3.42 3.09 3.23 2.51 2.66 3.44 2.22
3 Number ofclusters/ plant 13.81 13.8 12.24 13.319.78 12.44 14.33 9.55
4 Number ofpods/ plant 24.81 27.02 31.16 20.1232 38.01 48.88 32.11
5 Days to maturity82.89 81.13 71.39 79.53 83.00 83.6766 84.33
6 Number ofseeds/ pod 11.77 11.57 11.33 11.53 11.11 11.33 12.11 12.55
7 Pod length 8.11 7.91 7.67 8.82 7.63 7.27 7.4 12.23
8 Harvest index 51.40 24.09 43.53 32.34 48.67 46.37 57.88 50.32
9 100-seed weight3.97 4.21 4.38 4.56 3.52 4.18 4.09 6.02
10 Seed yield/ plant10.87 9.79 11.18 10.71 8.3 12.97 14.4 11.9
performance for number of seeds per pod, pod length and 100-seed weight with latematurity, while cluster IV recorded maximum mean performance for plant height. However,cluster VI was characterized with short plant height.
CONCLUSIONBest performing genotypes included in distant clusters like VII, VIII, IV and VI
should be selected since choice of appropriate parents plays a vital role in hybridizationprogramme,. The genetically distance genotypes selected may be further utilized asparents in mungbean breeding programme for yield improvement.
REFERENCES
Ahmad Nasier, Lavanya, G.R. and Kole, C. (2007). Estimation of genetic divergencein mungbean (Vigna radiata (L.) Wilczek). J. of Maharashtra Agric. Univ., 32(3):430-432.
The Allahabad Farmer Vol. LXVII, January - 2012 No. 2

64
Asthana, A. N. and Chaturvedi, S. K. (1999). A little impetus needed. In: the Hindu-Survey of Indian Agriculture. Edited by N. Ravi. Chennai, India. pp. 61-66.
Bhattacharya, A. and Vijayalaxmi, R. (2005). Genetic diversity in mungbean (Vignaradiata (L.) Wilczek) for phenological, physiological and yield forming traits.Legume Res., 28(1): 1-6.
Loganathan, P., Saravanan, K. and Ganesan, J. (2001). Genetic variability ingreengram. Res. on Crops, 2(3): 396-397.
Mahalanobis, P.C. (1936). On the generalized distance in statistics. Proc.of Natl. Inst.of Sci India, pp: 12-49.
Reddy, D.M., Rao, Y.K., Mur thy, S.S.M. and Reddy, M.V. (2004). Genetic variabilityand divergence in mungbean. Indian J. Pulses Res., 17(1): 77-79.
Spark, D. N. (1973). Euclidean cluster analysis. Algoritm Appl. Statistics,22: 126 - 130.
Deepak Kumar, Ashok Kumar S. M. and G. Roopa Lavanya

65
Antifungal Activity of Sticta nylanderiana andHypotrachyna scytophylla against some
Post-harvest Pathogens
Seweta Srivastavattttt, Manisha Srivastavattttt and Asha Sinhannnnn
ABSTRACT
Acetone extracts of the two lichen species Sticta nylanderiana Nyl. and
Hypotrachyna scytophylla (Kurok.) Hale were collected in bulk from the temperate
Himalayan region of India and brought to laboratory to study the antifungal
activity against six post harvest fungi viz. Penicillium digitatum, Penicillium
italicum, Alternaria brassicicola, Alternaria alternata, Colletotrichum falcatum
and Geotrichum candidum. At 1.25% concentrations both Sticta nylanderiana
and Hypotrachyna scytophylla showed activity against Penicillium italicum and
Alternaria brassicicola. Maximum inhibition zones, i.e., 2mm were shown by
Penicillium italicum, Alternaria brassicicola by Sticta nylanderiana and
Hypotrachyna scytophylla at 5% acetone extract. The known antifungal
components, i.e., Nystatin (Ns100) and Ketoconazole (Kt10) showed no inhibition
zone while all the acetone extract concentrations of Sticta nylanderiana inhibited
the growth of Penicillium italicum.
Key words: Sticta nylanderiana, Hypotrachyna scytophylla, antifungal activity,postharvest fungi, Nystatin (Ns100), Ketoconazole (Kt10).
INTRODUCTIONLichens are symbiotic organisms of fungal and algal and/or cyanobacterial partner.
They are considered edible or used for their medicinal properties. They synthesise avariety of secondary metabolites ''lichen substances'', mostly from fungal metabolism(Brennan et al. 2009). Lichen substances include aliphatic, cycloaliphatic, aromaticand terpenic components. Till now, about 350 biologically active components are known
tttttResearch Scholar, nnnnnProfessortttttDepartment of Mycology and Plant Pathology, Institute of Agriculture Sciences, B.H.U., VaranasinnnnnDepartment of Botany, Harish Chandra P.G. College, Varanasi - 221 001
The Allahabad Farmer Vol. LXVII, January - 2012 No. 2

66
from lichens and approximately 200 have been characterized (Chand et al. 2009 andTay et al. 2004). They are extracellular products of relatively low molecular weightcrystallized on the hyphal cell walls. Also, they are usually insoluble in water and can beextracted into organic solvents (Otzurk et al. 1999). They make even more than 30%of the dry mass of thallus (Galun, 1988). Lichens and their metabolites have variousbiological activities such as antimicrobial, antifungal, antiviral, anti-tumor, anti-inflammatory,analgesic, antipyretic, antiprotizoal, antiproliferative, antioxidant and anti-inflammatory(Behera et al. 2005; Halama and Van Haluwin, 2004; Ingolfsdottir, 2002; Muller,2001; Perry et al. 1999; Yamamoto et al. 1998; Huneck, 1999 and Lawrey, 1986).Antifungal activity of lichen extracts and lichen acids against plant pathogenic fungi hasbeen reported by several workers (Gulluce et al. 2006; Halama and Van Haluwin,2004; Oh et al. 2006 and Rankovi et al. 2007). In spite of the wide spectrum ofbiological activities shown by the lichens, they have long been neglected by mycologistsand overlooked by agrochemical industries because of their slow growth in nature anddifficulties in the artificial cultivation of organisms. Hence, the large-scale industrialproduction of the lichen metabolites has never been accomplished. However, use oflichen-forming fungi (LFF) can overcome the disadvantage of natural lichen extracts forindustrialization of their metabolites because of their much faster growth and largerproduction of the metabolites in culture than the natural thalli (Oh et al. 2006). Keepingthe above in view an in vitro investigation was taken up to evaluate the antimicrobialactivity of the acetone and aqueous extract of the chosen lichens and their componentsagainst six post-harvest disease causing fungi.
MATERIALS AND METHODSThe whole experiment was conducted in Lichenology Laboratory, Plant Biodiversity
& Conservation Division, National Botanical Research Institute, Lucknow from December2004 to January 2005.
Lichens species Studied: Sticta nylanderiana Nyl. and Hypotrachyna scytophylla(Kurok.) Hale were collected in bulk from the temperate Himalayan region of India andbrought to Lichenology Laboratory, National Botanical Research Institute, Lucknow fortheir antifungal studies. The material was washed with distilled water and dried at roomtemperature. Ten gram of washed lichen material was crushed into powder with the helpof mortar and pestle. The major chemical constituent of Sticta nylanderiana is a lichenacid named as gyrophoric acid and Hypotrachyna scytophylla has gyrophoric acid andatranorin.
Seweta Srivastava, Manisha Srivastava and Asha Sinha

67
Preparation of Acetone Extracts: After the maceration process, 5g of Stictanylanderiana (A) and 5g of Hypotrachyna scytophylla (B) was taken in two differentconical flasks, i.e., (A) and (B) and in both the conical flasks 50ml of acetone was addedand macerated lichen material was mixed with acetone.
After weighing, different concentrations of acetone, i.e., 5%, 2.5%, 1.25% wereprepared. Then the test discs (made of filter paper dipped in lichen extract) of differentconcentration (6 discs of each concentration of Sticta nylanderiana and 6 discs ofHypotrachyna scytophylla, i.e., total 36) were made.
Preparation of Water Extracts: Water extracts were prepared by adding 5g ofmacerated material of Sticta nylanderiana (A) and Hypotrachyna scytophylla (B) indifferent conical flasks with 150ml of distilled water and heated until the solution becomes100ml. Then these solutions were filtered into two different conical flasks (A and B) byWhatman's filter paper. Then the test discs of 5% concentration (6 discs of Stictanylanderiana and 6 discs of Hypotrachyna scytophylla, i.e., total 12) were prepared.
PDA (potato dextrose agar) medium of 0.2% agar was used during the study. Pre-sterilized PDA (potato dextrose agar) medium was poured into Petri dishes. Aftersolidifying culture media six post-harvest fungal pathogens viz., Penicillium digitatum,Penicillium italicum, Alternaria brassicicola, Alternaria alternata, Colletotrichumfalcatum and Geotrichum candidum were inoculated in Petri dishes. After inoculation,put the already prepared test discs of different concentrations of acetone in 12 petriplates,i.e., 6 petriplates of Sticta nylanderiana and 6 petriplates of Hypotrachyna scytophyllawere placed. Taking 12 petriplates again in which 6 different post-harvest fungal pathogenswere already inoculated over the agar follows this. After drying, 3mm wells (cup-platemethod) were cut with a sterile cork borer and 100µl of lichen extract was added to eachwell. Three replications of each control set were prepared by using known antifungalcomponents, i.e., Nystatin (Ns100):- Susceptibility Test-Discs 100µg/disc and Ketoconazole(Kt10):- Susceptibility Test-Discs 10µg/disc. All Petri plates were incubated for 2-3 daysin incubator.
Statistical Analysis: Mean value with standard error was calculated to check thevariation of inhibition zone found at different concentrations of acetone and water extractof Sticta nylanderiana and Hypotrachyna scytophylla. The term 'Standard Error' ofany estimate is used for a measure of the average magnitude of the difference betweenthe sample estimate and the population parameter taken over all possible samples of thesame size, from the population (Chandel, 2002).
The Allahabad Farmer Vol. LXVII, January - 2012 No. 2

68
RESULTS AND DISCUSSIONData presented in Table-I reveal that the occurrence of inhibition zone is recorded
in terms of mean value with standard error. According to data, effect of water extractsof both the lichen species at 5% concentration exhibit no inhibition zone against all the sixpost-harvest fungal pathogens except Alternaria brassicicola, which shows 1mm inhibitionzone with Hypotrachyna scytophylla. At 1.25% concentration both Sticta nylanderianaand Hypotrachyna scytophylla shows activity against Penicillium italicum and Alternariabrassicicola. The 2.5% acetone extract of both the lichens exhibited almost no activityagainst pathogens except Penicillium italicum where the inhibition zone of 1mm is shownby Sticta nylanderiana and Alternaria brassicicola where also the inhibition zone of 1mmis shown by Hypotrachyna scytophylla. Maximum inhibition zones, i.e., 2mm were shownby Penicillium italicum and Alternaria brassicicola by Sticta nylanderiana and Hypotrachynascytophylla at 5% acetone extract, respectively. The fungal pathogen Geotrichumcandidum is not affected by any concentration of both the lichens except 5% Stictanylanderiana acetone extract which shows 1mm inhibition zone. Among both the lichenspecies Sticta nylanderiana 5% acetone extract is more effective than that ofHypotrachyna scytophylla. Between both the controls, Nystatin (Ns100) exhibitedmaximum inhibition of Alternaria brassicicola, i.e., 1.8cm followed by Alternaria alternataand Penicillium digitatum (both have 3mm inhibition zone). The other control, i.e.,Ketoconazole (Kt10) showed maximum activity against Colletotrichum falcatum by making6mm inhibition zone followed by Alternaria alternata which shows 5mm inhibition zoneand Alternaria brassicicola which shows 2mm inhibition zone.
Methanol or acetone extracts of several lichen thalli are already proved to havestrong antifungal activity against various plant pathogenic fungi (Gulluce et al. 2006and Halama and Van Haluwin, 2004). Both the lichen species tested against the differentfungal pathogens exhibit moderate activity. The tested lichen extracts and lichens acidshow a relatively strong antimicrobial activity. The intensity of the antimicrobial effectdepended on the sort of the extract, its concentration and the tested microorganism.Similar results were also noticed by other investigators (Rankovi et al. 2007). Theaqueous extracts of the tested lichens did not show any antimicrobial activity. That isprobably because the active components produced by lichens are either insoluble orpoorly soluble in water (Kinoshita et al. 1994). It is interesting to note that both theknown antifungal components, i.e., Nystatin (Ns100) and Ketoconazole (Kt10) showed noinhibition zone while all the acetone extract concentrations of Sticta nylanderiana inhibitthe growth of Penicillium italicum. Thus, Sticta nylanderiana acetone extract can be
Seweta Srivastava, Manisha Srivastava and Asha Sinha

69
Table-I: Antifungal activity of two lichen species against six different post-harvest fungal pathogens.
S. No. Fungal Mean±S.E. of Inhibition Zone (mm)
Pathogen Sticta nylanderiana Hypotrachyna scytophylla Control
Acetone Extract Water Acetone Extract Water Nystatin KetoconazoleExtract Extract (Ns100) (Kt10)
5 % 2.5% 1.25% 5 % 5 % 2.5% 1.25% 5 % 100µ/disc 10mcg/disc
1. Alternaria
alternata - - - - - - - - 3±1.00 4.5±1.50
2. Alternaria
brassicicola 2±0.00 - 1±0.00 - 2±0.00 1±0.00 1±0.00 1±0.001.8±0.20 2±0.00
3. Colletotrichum
falcatum - - - - - - - - - 6±1.00
4. Geotrichum
candidum 1±0.00 - - - - - - - - -
5. Penicillium
digitatum - - - - - - - - 3±1.00 -
6. Penicillium
italicum 2±0.00 1±0.00 1±0.00 - - - - - - -
- = No inhibition zone
The A
llahabad Farm
er Vol. LX
VII, January - 2012 N
o. 2

70
used as a control of Penicillium italicum. Both the lichen species have gyrophoric acid asmajor lichen substance, which is well known for its inhibitory activity. The gyrophoricacid significantly inhibited the light dependent synthesis of ATP and uncoupled electrontransport on the reducing side of photo system-II in freshly lysed, illuminated spinachchloroplast (Rojas et al. 2000). The atranorin exhibit cytotoxic activity and inhibit LTB4biosynthesis in polymorphonuclear leukocyte (Kumar and Muller, 1999). Only fewantifungal activities of lichen substances are so far known and the present investigationis a preliminary study in the area.
REFERENCES
Behera, B.C., Verma, N., Sonone, A. and Makhija, U. (2005). Evaluation ofantioxidant potential of the cultured mycobiont of a lichen Usnea ghattensis.Phytother. Res. 19: 58-64.
Brennan, J., Vaden, M., Lester, C., Crixell, S. and Vattem, A. D. (2009). Biologicalactivity of some common lichens. FASEB J. 23: 716.10.
Chand, P., Singh, M. and Rai, M. (2009). Antibacterial activity of some Indian Lichens.J. Ecophysiol. Occup. Health 9: 23-29.
Chandel, S. R., (2002). A handbook of agricultural statistics. Achal Prakashan Mandir,India, pp: A-100.
Galun, M. (1988). CRC Handbook of Lichenology. CRC Press, Boca Raton, Florida.
Gulluce, M., Aslan, A., Sokmen, M., Adiguzel, A., Agar, G. And Sokmen, A.(2006). Screening the antioxidant and antimicrobial properties of the lichens Parmelia
saxatilis, Plastismatia glauca, Ramalina pollinaria, Ramalina polymorpha andUmbilicaria nylanderiana. Phytomedicine 13: 515-521.
Halama, P. and Van Haluwin, C. (2004). Antifungal activity of lichen extracts andlichenic acids. Bio. Cont. 49: 95-107.
Huneck, S. (1999). The significance of lichens and their metabolites.Naturwissenschaften 86: 559-570.
Ingolfsdottir , K. (2002). Molecules of interest: usnic acid. Phytochemistry64: 729-736.
Seweta Srivastava, Manisha Srivastava and Asha Sinha

71
Kinoshita, K., Matsubara, H., Koyama, K., Takahashi, K., Yoshimura, I.,Yamamuto, Y., Miura, Y., Kinoshita, Y. and Kawai, K.I. (1994). Topics in the
chemistry of lichen compounds. J. Hattori. Bot. Lab. 76: 227-233.
Kumar, K.C. and Muller, K. (1999). Lichen metabolites. 1. Inhibitory action againstleukotriene B<sub>4</sub> biosynthesis by a non-redox mechanism. J. Nat.Prod. 62: 817-820.
Lawr ey, J. D. (1986). Biological role of lichen substances. Bryol. 89: 111-122.
Muller , K. (2001). Pharmaceutically relevant metabolites from lichens. Appl. Microbiol.Biotrchnol. 56: 9-16.
Oh, S.-O., Jeon, H.-S., Lim, K.-M., Koh, Y. J. and Hur, J.-S. (2006). Antifungalactivity of lichen-forming fungi isolated from Korean and Chinese lichen speciesagainst plant pathogenic fungi. Plant Pathol. J. 22: 381-385.
Otzurk, S., Guvenç, S., Arikan, N. and Yylmaz, O. (1999). Effect of usnic acid onmitotic index in root tips of Allium cepa L. Lagascalia 21: 47-52.
Perry, N. B., Benn, M. H., Brennan, N. J., Burgess, E. J., Ellis, G., Galloway, D.J., Lorimer, S. D. and Tangney, R. S. (1999). Antimicrobial, antiviral and cytotoxic
activity of New Zealand lichens. Lichenologist 31: 627-636.
Rankovi, B., Miši, M., Sukdolak, S. and Milosavljevi, D. (2007). Antimicrobialactivity of the lichen Aspicilia cinerea, Collema cristatum, Ochrolechia androgyna,Physcia aipolia and Physcia caesia. Ital. J. Food Sci. 4: 461-469.
Rojas, I.S., Hennsen, B. L. and Mata, R. (2000). Effect of lichen metabolites onthylakoid electron transport and photophosphorylation in isolated spinachchloroplasts. J. Nat. Prod. 63(10): 1396-1399.
Tay, T., Turk, A. O., Yilmaz, M., Turk, H., Kivanc, M. (2004). Evolution of theantimicrobial activity of the acetone extract of the lichen Ramalina farinaceaand its (+)- usnic acid, norstictic acid and protocetraric acid constituents.Z. Naturforsch. C. 59: 384-388.
Yamamoto, Y., Kinoshita, Y., Matsubara, H., Kinoshita, K., Koyama, K.,Takahashi, K., Kurokawa, T. and Yoshimura, I. (1998). Screening of biological
activities and isolation of biological active compounds from lichens. Recent Res.Dev. Phytochem. 2: 23-34.
The Allahabad Farmer Vol. LXVII, January - 2012 No. 2

72
Effect of different doses of gamma irradiation on yieldand yield contributing traits of wheat
(cultivar HD-2867)
Shubhra Singhttttt, Ram. Muuuuu, S. Markernnnnn, B. Abrar Yasinttttt, Akhilesh Kumar ttttt, Vinod Kumarmmmmm andEkta Singhrrrrr
ABSTRACTDifferent doses of gamma rays (20kR, 25kR and 30kR) were used to irradiateseeds of wheat cultivar HD-2867. Treated seeds were sown along with control tostudy the induced variation and improvement in yield and yield contributing
traits in M2 and M
3 generations. The results revealed significant differences
among the treatments. All three doses were quite effective in inducing geneticvariability. The mean performance showed improvement in most of mutagenic
treatments in M3 as compared to the corresponding treatments in M
2 generation
over untreated check. The most beneficial dose was 20kR. The impact of thisdose was promising in days to flowering, number of tillers/plant, plant height,
days taken from anthesis to maturity, days to maturity, test weight and yield/plant. However, high reduction in the mean value for all the characters wereobtained in response to higher dose of gamma rays (30kR). It was concluded
from this study that there was significant genetic variability induced through allthe three mutagenic treatments. Significant enhancement in yield and yieldcontributing traits were observed at 20kR followed by 25kR. Under the influence
of higher dose of gamma rays (30kR) significant reduction were observed inyield and yield attributes. It indicates that inducing genetic variability andimprovement in quantitative traits would be possible through gamma rays.
Key words: Gamma rays, wheat cultivar, variability, yield and yield traits
INTRODUCTIONMutation breeding is recognized as one of the driving force of evolution. Mutation
breeding is relatively quicker method for improvement of various crop species. It is an
rrrrr,mmmmm,tttttPh.D. Student, uuuuuProfessor, nnnnnAssociate Professorttttt,nnnnnDepartment of Genetics and Plant Breeding, mmmmmDepartment of Agricultural Economics & ABMrrrrrDepartment of Biological Science, SHIATS, Allahabad – 211007 (U.P.)
The Allahabad Farmer Vol. LXVII, January - 2012 No. 2

73
important tool to create variability for quantitatively inherited traits in different plants andis considered as an alternative method to increase genetic variability in plant breeding(Camargo et al., 2000). It is often used to correct defects in a cultivar, which has a setof good agronomic characteristics (Sigurbjornsson 1977). Among various physicalmutagens such as X-rays, fast neutrons, thermal neutrons, ultraviolet and beta radiation,gamma rays in particular are well known with their effect on the plant growth anddevelopment by inducing cytological, physiological and morphological changes in cell andtissues (Thapa, 2004). Gamma radiation is an important tool for inducing the geneticvariability, enhancing yield and yield contributing traits. However, there is a need topredict the most beneficial dose of gamma rays for improvement of specific traits ofcrop plants because gamma radiation can induce useful as well as harmful effects.According to Badr.et al., (1997), Melki and Sallami (2008) low doses of gammarays have positive effects on crop species. In wheat, much radiation raises the frequencyof occurring certain rare types of mutants of special nature to a level where they canusefully employed by the plant breeder to achieve the results that would not be possibleto be accomplished by other means. In India NP-836 which is an awned mutant from theawnless wheat variety NP-799, Sharbati Sonara which is an amber grain colour mutantfrom the red grain colour wheat variety Sonora-64 (Singh B.D 2000). Reddy andViswanathan (1999) induced rust resistance in wheat variety WH-147. Mackey (1954)reported some beneficial radiation induced mutants in wheat with increase straw strength,resistance to stem rust and slightly early maturity. So far in the world 222 mutant varietiesof wheat have been released (Phundhan Singh 2010). The present investigation wasundertaken with the objective to induce genetic variability, study the effect of variousdoses of gamma rays on yield and yield components of wheat cultivar HD-2867 and findout useful mutants in M
2 and M
3 generations under field conditions.
MATERIALS AND METHODSThe present investigation was carried out in Field Experimentation Centre,
Department of Genetics and Plant Breeding, Sam Higginbottom Institute of Agriculture,Technology and Sciences, (Deemed-to-be-University), Allahabad. Dry seeds of wheatcv. HD-2867 irradiated with 20, 25 and 30 kR doses of gamma rays from radioactiveelement cobalt-60 (60Co) source at National Botanical Research Institute (NBRI),Lucknow. As per the availability of literature regarding beneficial dose of gamma rays inwheat crop, 10, 15, 20, 25 and 30 kR are considered to be much perfect dose for inducinggenetic variability and producing desirable mutants (Arora et al.,1989, Drozed 1994,Shkvarnikov and Kulik 1987). The effect of various doses of gamma rays was studied
Shubhra Singh, Ram. M, S. Marker, B. Abrar Yasin, Akhilesh Kumar, Vinod Kumar and Ekta Singh

74
in M2 and M
3 generations (M
1 generation was already being raised during rabi 2007-08).
Sowing of M2 generation was done during rabi season 2008-09 (25th November) and
M3 generation during rabi season 2009-10 (27th November). The experiment was laidout in randomized block design with three replications. Each plot consisted of 4 rows, 2.5mt. in length with row and plant to plant distance of 25 and 15 cm, respectively. In eachplot about 65 treated seeds from 15 mutants that were already selected from each treatment(20, 25 and 30 kR) in M
1 generation were dibbled along with non-irradiated seeds (control)
to raise M2 and subsequently M
3 generation. Selection was carried out in M
2 generation
and desirable plants from each treatment were harvested individually. The M3 progeny
was raised from selected M2 plants and selection was further advanced on the basis of
single plant selection method. The recommended cultural practices were followed duringthe crop growth period. The observations were recorded for days to flowering, numberof tillers/plant, spike length, grains per spike, plant height, days taken from anthesis tomaturity, days to maturity, 1000 grain weight and yield/plant. Data for no. of tillers/plant,spike length, no. of grains per spike and plant height were recorded on five randomlyselected plants in each plot. Data on 1000 grain weight and yield per plant were recordedin gram. The data recorded for the above mentioned characters were averaged andsubjected to statistical analysis as outlined by Steel and Torrie (1980) and subsequentlyDuncans Multiple Range Test (Leclarg et al., 1963) was used to establish thedifferences among the different treatment means.
RESULTS AND DISCUSSIONThe differences in the mean value of all the traits due to different radiation doses
were highly significant in both M2 and M
3 generation. The results correspond to those of
Jamil and Khan (2002), who irradiated wheat cultivar Bakhtawar-92 by gamma raysat 5, 10, 15 and 25 kR, observed highly significant differences in the mean value due todifferent radiation doses. It is revealed from the tables 1-2 that significant delay inflowering was recorded in cv HD-2867 at different radiation doses, as the doses increasedto higher level, a delay in days to flowering was noted. An increase of 91 and 92 dayswas recorded by 30kR followed by 25kR dose (89 and 90 days) and 20kR (87 and 88days) as compared to control (85 days) and also the extent of variability was recordedhigher for this trait both in M
2 and M
3 generation. The present results are in conformity
with the finding reported by Rahim et al. (2003). It was observed (tables 1 and 2) thatnumber of tillers per plant varied significantly when radiated with various doses of gammarays. 20kR dose increased number of tillers per plant in both M
2 (14.16) and M
3 (15.26)
generations followed by 25kR dose. The highest dose of 30kR caused reduction in tillers
The Allahabad Farmer Vol. LXVII, January - 2012 No. 2

75
per plant (8.40 in M2 generation and 9.31 in M
3 generation) as compared to control. The
results are in conformity with those of Din et al. (2003); who found significant decreasein number of tillers per plant of different wheat varieties at higher intensity of gammaradiation. The data regarding spike length showed significant variability for wheat cultivarHD 2867 due to different radiation doses. However, all the radiation doses showedreduction in spike length while comparing the mean values of gamma rays with oneanother. The minimum spike length (8.71 in M
2 and 9.67cm in M
3 generation) was recorded
with 30kR dose and maximum spike length (12.21 in M2 and 12.29 cm in M
3 generation)
was recorded in control. The findings are in agreement with those already reported byKhan et al. (2003). It was inferred from the tables 1-2 that both in M
2 and M
3
generations there was significant variation observed for number of grains per spike. Bycomparing the mean values due to various radiation doses with one another it was observedthat the number of grains per spike was reduced as the radiation dose increased. Themaximum decrease in number of grains per spike was observed due to 30kR dose ofgamma rays, 52.13 in M
2 and 53.32 in M
3 generation as compared to control. These
results are in agreement with those of Khamankar (1989). It was apparent from theresults (Tables 1-2) that extent of variability in plant height increased in both thegenerations. The radiation dose of 30kR gamma rays reduced plant height, 84.48cm inM
2 generation and 85.28cm in M
3 generation over the control. It was noted that plants
radiated with 20kR gamma rays showed significant increase in plant height, 91.55cm inM
2 and 92.34cm in M
3 generation over untreated check. So, all the doses adversely
affected the average plant height. Plant height was inversely proportional to the increasein the radiation intensity. The results are in conformity with Muhammad and Khalid(2001). In response to various doses of gamma rays, significant differences in the meanvalues were observed for days taken from anthesis to maturity. By comparing the effectof various radiation doses, it was observed that all the doses (except 30kR) increaseddays taken from anthesis to maturity in both the generations, 34 days in M
2 and 35 days
in M3 generation by 20kR followed by 25kR over control. It was found from the present
investigation that days to maturity significantly increased due to various doses of gammaradiation over untreated control. The extent of variability for this trait was higher in bothM
2 and M
3 generations. The differences in the mean values for 1000 grain weight due to
various doses of gamma rays varied significantly both in M2 and M
3 generations. By
comparing the mean values of various doses with one another it was found that 1000grain weight significantly decreased due to 30kR radiation dose, 38.57g in M
2 and 39.11g
in M3 generation as compared to control. The maximum increase in 1000 grain weight
Shubhra Singh, Ram. M, S. Marker, B. Abrar Yasin, Akhilesh Kumar, Vinod Kumar and Ekta Singh

76
Table-1 : Mean performance of various characters of wheat cultivar HD-2687 treated with differentdoses of gamma rays in M2 generation
Radiation Days to No. of Spike No. of Plant Days taken Days to 1000 Yield/plantdose (kR) flowering tillers/ length per grains height to from anthesis maturity grain (g)
plant (cm) spike (cm) maturity wt (g)
Control 85d 10.54c 12.21a 56.43a 90.39b 32c 116d 40.53c 10.39c
20 87c 14.16a 10.87b 54.38b 91.55a 34a 121a 43.31a 12.16a
25 89b 13.32b 9.68c 53.34c 88.71c 33b 120b 42.46b 11.36b
30 91a 8.40d 8.71d 52.13d 84.48d 30d 118c 38.57d 9.43d
Mean values sharing same letter does not differ significantly at 5% level of probability (P>0.05)
Table-2 : Mean performance of various characters of wheat cultivar HD-2687 treated with differentdoses of gamma rays in M3 generation
Radiation Days to No. of Spike No. of Plant Days taken Days to 1000 Yield/plantdose (kR) flowering tillers/ length per grains height to from anthesis maturity grain (g)
plant (cm) spike (cm) maturity wt (g)
Control 85d 10.41c 12.29a 56.59a 90.41b 33c 117d 40.83c 10.68c
20 88c 15.26a 11.68b 55.51b 92.34a 35a 122a 44.28a 13.16a
25 90b 14.41b 10.54c 54.21c 89.53c 34b 121b 43.16b 12.21b
30 92a 9.31d 9.67d 53.32d 85.28d 31d 119c 39.11d 10.22c
Mean values sharing same letter does not differ significantly at 5% level of probability (P>0.05)
The A
llahabad Farm
er Vol. LX
VII, January - 2012 N
o. 2

77
(gm) was observed in response to 20kR radiation dose, 43.31g in M2 and 44.28g in M
3
generation followed by 25kR radiation dose over untreated check. In general, gradualdecrease in 1000 grain weight appeared due to increase in radiation intensity both in M
2
and M3 generation. These findings are inline with Zhu et al. (1991) and Muhammad
et al. (2003). The differences in the mean values for grain yield per plant due to differentdoses of gamma rays were highly significant. The data from the tables 1-2 revealed thatthere was significant increase in the grain yield per plant at 20kR radiation dose, 12.16gin M
2 and 13.05g in M
3 generation followed by 25kR radiation dose over control. The
results are in agreement to those of Jamil and Khan (2002) and Khan et al. (2003).However, at 30kR radiation dose grain yield decreases significantly, 9.43g in M2 and10.22g in M3 generation as compared to control.
Change brought by mutation is permanent and heritable. If the changes would bebrought by environment they are not fixable and heritable. For example, from presentinvestigation it has been observed that in both M
2 and M
3 generation there is continuous
induction of genetic variability and all the treatments are showing their effect continuously.If it will be due to environmental fluctuation such permanent changes could not observedgeneration after generation.
From the above foregoing results and discussion, it is concluded that different dosesof gamma rays in HD-2867 wheat cv. provide enough scope by developing a wide rangeof variation in desirable plant attributes to select high yielding mutants. From the presentstudy significant genetic variability was induced through all the three mutagenic treatmentand also enhancement in yield and yield contributing traits were observed at 20kR followedby 25kR. Under the influence of higher dose of gamma rays (30kR) significant reductionwere observed in yield and yield attributes. It indicates that inducing genetic variabilityand improvement in quantitative traits would be possible through gamma rays. Hence,gamma ray played a pivotal role in crop breeding through mutation and stability of geneticvariability should be analyzed in succeeding generations and selection of desirable mutantscould be performed for a successful breeding programme.
REFERENCESArora, R., N. Maherchandani and S. Uppal, (1989) Modulation of radiation effects
in wheat by growth regulators. Ann. Biol., Ludhiana, 5: 109-113.
Badr, H.M., Alsadon, A.A. and Al-Harbi, A.R. (1997) Stimulation effects of gammaradiation on growth and yield of two tomato (Lycoperiscon esculentum Mill)cultivars. Agri Sci. 95: 277-286.
Shubhra Singh, Ram. M, S. Marker, B. Abrar Yasin, Akhilesh Kumar, Vinod Kumar and Ekta Singh

78
Camargo, C.E.D.O., Neto, A.T., Filho, A.W.P.F. and Felico, J.C. (2000) Geneticcontrol of aluminium tolerance in mutant lines of the wheat cultivar Anahuac.Euphy. 114:47-53.
Din, R., Khan, M.M., Qasim, M., Jehan, S. and Khan, M.M.I. (2003). Inducedmutability studies in three wheat (Triticum aestivum L.) varieties for somemorphological and agronomical characteristics. Asian J. of Pl. Sci. 17 (2):1179-1182.
Drozed, D. (1994). The effect of radiation on spring wheat properties. Int. Agrophys.8: 209-213.
Khamankar, Y.G. (1989). Gamma ray irradiation and selection for yield componentsin bread wheat. PKV Res. J. 13:1-5.
Khan, M.M., Din, R., Qasim, M., Jehan, S. and Iqbal, M.M. (2003). Inducedmutability studies for yield and yield related characters in three wheat (Triticum aestivum L.) varieties for some morphological and agronomical characteristics.Asian J. of Pl. Sci. 2: 1183-1187.
Leclarg, R.L., W.H. Leonard and A.G. Clark (1962). Field plot technique. 2nd ed.Burgees publish. Co.South Minnesota. pp; 144-146.
Madina Jamil and Umer Q. Khan (2002). Study of genetic variation in yieldcomponents of wheat cultivar buktawar-92 as induced by gamma radiation.Asian J. of Pl. Sci. 1 (5): 579-580.
Mackey, J. (1954) Neutron and x-ray experiments in wheat and revision of speltoidproblem. Hereditas, 40:65-180.
Melki, M. and Sallami, D. (2008) Studies the effect of low dose of gamma rays onthe behaviour of chickpea under various conditions. Pak J. of Bio. Sci.11:2226-2330.
Muhammad Irfaq and Khalid Nawab (2001) Effect of gamma irradiation on somemorphological characteristics of three wheat (Triticum aestivum L.) cultivars.Online J. of Bio. Sci. 1 (10): 935-937
The Allahabad Farmer Vol. LXVII, January - 2012 No. 2

79
Muhammad Mohibullah Khan, Rahim Din, Muhammad Qasim, Shah Jehan andMalik Muhammad Iqbal (2003) Induced mutability studies for yield and yield related
characters in three wheat (Triticum aestivum L.) varieties. Asian J. of Pl. Sci.2 (17-24).
Phundan Singh (2010) Essentials of Plant Breeding, Kalyani Publishers, New Delhi,pp 219.
Rahim Din, Muhammad Qasim, Khalil Ahmad and Shah Jehan (2003) Study ofdays taken to earing initiation and earing completion in M1 generation of differentwheat genotypes irradiated with different doses of gamma radiation. Asian J.of Pl. Sci. 2 (12) 894-896.
Reddy, V.R.K., and P. Viswanathan (1999) Induced rust resistant mutants in hexaploidwheat "WH-147", Crop Research (Hisar). pp 443-445.
Shkvarnikov, P. K., and Kulik, M. I. (1987) Induction of mutation in wheat, Academyof Sciences, Ukrainian SSR, Kiev, USSR. 41: 204-217.
Sigurbjörnsson, B. (1977) Introduction Mutations in Plant Breeding Programs. Manualon Mutation Breeding Second Edition Tech. Report Series. 119 IAEA,Vienna, pp.1-6.
Singh, B.D. (2000) Plant Breeding, Kalyani Publishers, New Delhi, pp 627-628.
Steel, R.G.D. and Torrie, J.H. (1980) Principles and procedures of statistics.McGraw Hill Book Comp. Inc., New York
Thapa, C.B. (2004). Effect of acute exposure of gamma rays on seed germination andseedling growth of Pinus kesiya gord and P. wallichiana A.B. jacks. OurNature 2:13-17.
The Allahabad Farmer Vol. LXVII, January - 2012 No. 2

80
Response of Nitrogen and Phosphorus levels onGrowth and Seed yield of Ashwagandha
(Withania somnifera L )
S. C. Swainttttt and Vijay Bahadurnnnnn
ABSTRACT
A field experiment was conducted at Regional Research and Technology Transfer
Station, Semiliguda, Koraput, Orissa, to evaluate the "Response of nitrogen and
phosphorus on growth and seed yield of Ashwagandha (Withania sominifera
L)" during Kharif season of 2006 and 2007. There were twelve treatment
combinations with three nitrogen levels viz. 0, 30 and 60 kg ha-1and four levels of
phosphorus viz 0, 25, 50 and 75 kg ha-1. The experiment was laid out in Factorial
Randomized Block Design with three replications. The results of the investigation
indicated that the vegetative growth of Ashwagandha in terms of plant height
and biomass were increased with higher level of nitrogen and lower levels of
phosphorus (60kg N and 25 kg P2O
5 per ha). Significantly highest seed yield of
Ashwagandha (250.30 kg ha-1) was obtained with the application of 60 kg N and
25 kg P2O
5 per ha.
Key words: Ashwagandha, seed yield, nitrogen and phosphorus levels
INTRODUCTIONAshwagandha (Withania somnifera L.) is an important cultivated Medicinal crop.
There is a good demand of seeds and roots of this plant. Several types of alkaloids arefound in this plant, out of which, withanine and somniferine are important (Dastur, 1970).The pharmacological activity of the roots is attributed to the alkaloids. The roots are usedfor preparing medicines for hiccup, bronchitis, rheumatism, dropsy, stomach and lungsinflammation, skin diseases and several female disorders. However, the roots are mostly
tttttAssistant Professor, nnnnnAssociate Professorttttt(Horticulture), College of Agriculture, Orissa University of Agriculture & Technology, Bhawanipatna,Dist-Kalahandi, Orissa-766001.nnnnnDepartment of Horticulture, SHIATS, Allahabad – 211007 (U.P.)
The Allahabad Farmer Vol. LXVII, January - 2012 No. 2

81
used for curing general and sexual debility. It is an important cash crop for greening thegray areas of the dry land zone and a profit maker crop for the wasteland. But very lessinformation is available regarding fertilizer and manurial requirement in order to improveseed yield. Hence, the present investigation was carried out to study the response ofnitrogen and phosphorus levels on growth and seed yield of Ashwagandha.
MATERIALS AND METHODSThe experiment was conducted at Regional Research and Technology Transfer
Station, Semiliguda (Orissa University of Agriculture and Technology), Koraput, Orissaduring the year 2006-07 and 2007-08. The trial was laid out in FRBD with twelve treatmentcombinations having three levels of N i.e. 0, 30, 60 kg ha-1 and four levels of P
2O
5 i.e. 0,
25, 50, 75 kg ha-1 with three replications. Basal application of half dose of N and full doseof P
2O
5 was applied at the time of sowing and remaining half dose of nitrogen were
applied at 30 days after sowing as per the treatment schedule. Observation on plantheight, days to 50% flowering, days to harvesting of seed was taken. Total biomass andseed yield per hectare were recorded.
RESULTS AND DISCUSSIONEffect of Nitrogen
Data presented in Table 1 indicated that the plant height was significantly increasedwith increased nitrogen levels. The maximum plant height (79.80 cm) of Ashwagandhawas recorded under treatment N
2 (60 kg N ha-1) and least under control (63.20 cm). The
difference between these levels of nitrogen was significant due to the favourable effectof nitrogen in promoting the growth of Ashwagandha. Plant height may be increased dueto the fact that nitrogen is a major nutrient and mainly responsible for promoting thegrowth of plant. It is largely used in synthesis of protein. So, when nitrogen supply isadequate, protein are formed from manufactured carbohydrates, which help in increasingthe plant height. The significant increase in height with the increasing nitrogen levels wasalso observed by Maheshwari, et al. (1981), Dahatonde et al. (1983), Maitra et al.(1998), Muthumanickam and Balkrishnamurthy (1999) and Pawar (2000) inAshwagandha,
Significant differences were noted for days required to 50%flowering from sowing.The treatment N
2 (60 kg N ha-1) took significantly maximum number of days for 50%
flowering (86.30 days) and 50% fruit setting (98.80 days) over all other treatments. Thedays required for harvesting of seed was increased with the application of higher level ofnitrogen. The maximum days required for harvesting of seed (167.80 days) was with the
S. C. Swain and Vijay Bahadur

82
application of 60 kg N ha-1. The application of 30 kg N ha-1 took medium period whereasleast period was recorded under control. The influence of nitrogen on biomass of plantwas found to be significant. The maximum dry weight of plant (90.20 g) was producedwith the application of 60 kg N ha-1. The favourable effect of nitrogen promoting thegrowth and dry weight of plant might be due to the fact that nitrogen is a major nutrientand mainly responsible for promoting the growth of plant. As vegetative growth of plantis more, the dry weight of plant is also more. It may be due to the positive action ofnitrogen on the vegetative growth of plant for which biomass of plant might be increase.Similar results were observed by Dahatonede et al. (1983), Maitra et al. (1998),Muthumanickam and Balkishanmurthy (1999) and Pawar (2000) in Ashwagandha.
Table 1. Vegetative growth and seed yield of Ashwagandha as influenced bygraded doses of Nitrogen and Phosphorus.
Treatment Plant Days Days to Days to Total Seed yieldheight to 50% fruit set harvesting biomass (Kg ha-1)(cm) flowering of seeds (g)
Nitrogen levelsN
0 (0 kg ha-1) 63.20 80.33 92.20 150.70 48.54 158.30
N1 (30 kg ha-1) 76.30 84.50 95.40 162.40 78.84 199.70
N2 (60 kg ha-1) 79.80 86.30 98.80 167.80 90.20 230.00
'F' Test Sig. Sig. Sig. Sig. Sig. Sig.
CD at 5% 1.36 0.70 0.73 0.72 10.18 6.70
Phosphorus LevelsP
0 (0 Kg ha-1) 65.00 63.70 95.50 154.89 56.00 168.50
P1 (25 Kg ha-1) 76.82 62.30 95.93 157.00 80.73 198.30
P2 (50 Kg ha-1) 75.34 83.74 99.03 158.00 75.40 206.30
P3 (75 Kg ha-1) 75.23 84.00 99.54 162.80 72.10 210.90
'F' Test Sig. Sig. Sig. N.S. Sig. Sig.
CD at 5% 0.43 0.77 0.83 --- 11.79 7.86
Interaction
'F' Test Sig. --- N.S. N.S. N.S. Sig.
CD at 5% 2.69 --- --- 13.58
The Allahabad Farmer Vol. LXVII, January - 2012 No. 2

83
Seed yield per hectare with the application of 60 kg N ha-1 was found to be statisticallysuperior over all other treatments. The maximum seed yield (230.00 kg ha-1) was producedwith 60 kg N/ha and least under control (158.30 kg ha-1). This might be due to increasedvigour of plant and utilization of proteinacious metabolites for built up new tissues. Theincrease in seed yield with the application of nitrogen has been reported by Pawar (2000)in Ashwagandha.
EFFECT OF PHOSPHOROUSThe maximum plant height was recorded with the application of 25 kg P
2O
5 ha-1
(76.82 cm) which was statistically at par with each other and lowest mean plant height(65.00 cm) was recorded under control. Phosphorous played an important role in celldivision. It also promoted root growth which might be responsible for promoting growthof plant. Similar trends were observed by Maheshwari et al. (1981), Muthumanickamand Balkrishanmur thy (1999) in Ashwagandha. The effect of phosphorous levels ondays required for 50% flowering and fruit setting from sowing were found to be significant.Application of 75 kg P
2O
5 ha-1 required maximum number of days to 50% flowering
(84.00 days) and fruit setting (99.54 days) followed by 50 kg P2O
5 ha-1. Similar findings
were obtained by Pawar (2002) in Ashwgandha. The effect of phosphorous levels ondays required for harvesting of seed was found to be non-significant. The application ofphosphorous also increased the biomass of plant. Significantly more biomass of plant(80.73 g) was produced with the application of 25 kg P
2O
5 ha-1. Application of 50kg
P2O
5 and 75 kg P
2O
5 ha-1 were found statistically at par with each other. Whereas, the
control treatment showed minimum dry weight of plant (56.00 g). Phosphorous play animportant role in cell division and development of plant. It also promotes root growthwhich might be responsible for promoting growth and dry weight of plant. Similar resultswere obtained by Maheshwari et al. (1981), Maitra et al.(1998) andMuthumanickam and Balkrishnamur thy (1999) in Ashwagandha. Application of 75kg P
2O
5 ha-1 had produced 210.90 kg seed yield per hectare and it was followed by 50 kg
P2O
5 ha-1. The increased in seed yield might have been due to improvement in growth
component with the phosphorous application. The results are in close agreement withthe findings of Singh and Cheema (1972) and Mishara (1987).
Interaction Effects
The interaction effect on nitrogen and phosphorus were significant on plant heightwith higher doses of nitrogen and lower dose of phosphorus (60 kg N ha-1 and 25 kgP
2O
5 ha-1). Data presented in Table 2 revealed that the maximum plant height (86.56
S. C. Swain and Vijay Bahadur

84
cm) was recorded with the application of 60 kg N ha-1 and 50kg P2O
5 ha-1 and lowest
plant height (59.20 cm) was recorded under control. It might be due to the fact thatapplication of nitrogen and phosphorus accelerate the synthesis of chlorophyll and aminoacid, which are associated with major plant processes. Similar results were obtained byMaheshwari et al. (1981), Muthumanickam and Balkrishnamurthy (1999) andPawar (2000) in Ashwagandha. The interaction effect due to nitrogen and phosphoruswere found to be non-significant for 50% flowering fruit setting, seed harvesting andbiomass production of Ashwagandha.
The interaction effect due to nitrogen and phosphorus had also significantly influencedthe seed yield per hectare (Table 3). Application of higher dose of nitrogen was foundeffective in increasing the seed yield when phosphorus was applied in lower doses. The
Table 2. Interaction effect of nitrogen and phosphorus levels on plant height(cm) of Ashwagandha.
Nitrogen levels Phosphors Level Mean
P0
P1
P2
P3
N0
59.20 64.10 63.00 66.50 63.20
N1
66.96 79.80 79.34 79.10 76.30
N2
68.84 86.56 83.70 80.10 79.80
Mean 65.00 76.82 75.34 75.23
'F' Test S S S
CD at 5% 1.36 0.43 2.69
Table 3. Interaction effect of nitrogen and phosphorus levels on seed yield ofAshwagandha (Kg.ha-1).
Nitrogen levels Phosphors Level MeanP
0P
1P
2P
3
N0
143.30 155.50 168.30 167.10 158.30
N1
178.60 189.10 205.00 226.10 199.70
N2
184.60 250.30 245.60 239.50 230.00
Mean 168.50 198.30 206.30 210.90
'F' Test Sig Sig Sig
CD at 5% 6.70 7.86 13.58
The Allahabad Farmer Vol. LXVII, January - 2012 No. 2

85
highest seed yield (250.30 kg ha-1) was obtained with the application of 60 kg N ha-1 and25 kg P
2O
5 ha-1 and least under control (142.30 kg N ha-1). This might be due to better
assimilation of nitrogen in presence of lower phosphorus content. Similar results havebeen reported by Singh and Cheema (1972), Mishara (1987) in radish and Pawar(2000) in Ashwagandha.
CONCLUSIONFrom the finding, it could be concluded that in case of Ashwagandha, graded doses
of nitrogen and phosphorus have beneficial effect on plant growth, days to flowering,fruit set, total biomass and seed yield. In the present studies highest seed yield ofAshwagandha (250.30 kg ha-1 ) were obtained with the application of 60 kg N and 25 kgP
2O
5 per ha.
REFERENCESDahatonde, B. N.; B.G. Joshi and D. G. Vitkar e (1983). Studies on response of
nitrogen fertilization on root yield of Ashwagandha. PKV. Res. J.,7 (1): 7-8.
Dastur, J. F. (1970), Medicinal plants of India and Pakistan. Taraporevala sons and co-operative private Ltd. Treasure house of books, Bombay; 177-178.
Gupta, R. (1967). Medicinal and Aromatic plant. Handbook of Agriculture (3rd Edition)ICAR, New Delhi, 1192-1193.
Maheshwari, S. K.; S.Y. Yadav and S. K. Gangule (1981). Response of Aswagandha(Withania Sominifera) to variable of nitrogen and phosphours. 4th All IndiaWorkshop at Maduria (31st August to 3rd Sept.) 1981.
Maitra, S. K.; K. Janab and S. Debnath (1998). Response of plant nutrients ongrowth and alkaloids content of Ashwagandha. J Intera ca demicia. 2 (4):243-246.
Mishara, H. P. (1987). Effect of NPK on growth, seed yield and quality of radishcv. Pusa Reshmi grown in the calcareous soil of Bihar. Indian J. Hort.44 (1-2):69.
Muthamanickam, D. and G. Balakrishiamurthy, (1999). Studies on nutritionalrequirement for Ashwagandha in sheverog hills of TamilNadu. Indian J. spicesand Aromatic crops. 8 (2): 179-183.
Pawar, V. N. (2000). Seed yield and seed quality as influenced by plant density andfertilizer levels in Ashwagandhas . M.Sc. Theis, MPKV, Rahuri.
Singh, K. and G. S. Cheema (1972). Effect of nutrition and irrigation on radish seedproduction. Indian J. Hort. 36 (4):330-335.
S. C. Swain and Vijay Bahadur

86
Studies on preparation and preservationof herbal Jam of Aonla (Emblica officinalis Geartn.).
Balaji Vikram ttttt, V.M. Prasadppppp, Atul Anand Mishral and Surya Narayannnnnn
ABSTRACT
Aonla herbal jam was prepared and evaluated for TSS, pH & overall acceptability.
Three levels of each Tulsi, Cardamom and Ginger were used as herbal additives.
All the herbal treatments were found better in respect of TSS & ascorbic acid
content over Control. Highest mean TSS (69.26%) and pH content (3.56%) were
obser ved in T9 (ginger extract @1.5%), where as overall acceptability which was
depend on Colour, Texture & Flavor was recorded highest (8.33 score) in T8
(ginger extract @1.0%),. Precisely, on the basis of results obtained it may be
concluded that treatment T8 (ginger extract @1.0%) can be used in
commercialization of Aonla herbal jam preparation. This recipe may also be
advocated for safe storage at ambient temperature up to 8 months.
Key Words: Aonla herbal Jam, Tulsi, Ginger, Cardamom, TSS, pH, Storability,Quality.
INTRODUCTIONFruits are an important supplement to the human diet as they provide almost all the
vital components required for normal growth and development of the human body leadingto the healthy physique and mind. The edible fruit tissue of Aonla contains about 3 timesas much protein and 160 times as much vitamin 'C' as apple (Barthakur and Arnold,1991).Normally one Aonla fruit contains 20 times as much as vitamin 'C' in terms ofanti- ascorbic value as oranges. The fruit contains a chemical substance calledleucanthocyanin which retards the oxidation of vitamin 'C'. Singh et al. (1993) notedmarked antioxidant effect of Gallic acid, present in Aonla fruit. Its vitamin 'C' content isin no way lower than that of Barbados cherry (Mustard et al., 1952). These are a-
tttttResearch Scholar, pppppAssociate Professor, lAssistant Professor, nnnnnSenior Lecturarttttt,pppppDepartment of Horticulture, lDepartment of Food Processing & Technology, SHIATS, Allahabad –211007 (U.P.)nnnnnDepartment of Horticulture K.A.P.G. College, Allahabad.
The Allahabad Farmer Vol. LXVII, January - 2012 No. 2

87
ready-source of energy with a unique capacity to ground against many deficiency diseases.Because of their peculiar characteristics of high moisture content and rapid rate ofmetabolism, they are more prone to deteriorate rapidly after harvest. A number of theproducts like jam, squash, candy, dried shreds, powder, tablets, chutney, murabba andpreserve may be prepared from aonla fruit. Aonla fruit is valued as ant-scorbutic, diureticand laxative. Fresh fruits are highly acidic and astringent make unsuitable for the directconsumption. Therefore fruits are essentially forced to process into palatable products.Though, preserve is most common of aonla product and have been prepared by variousmethods (Sethi and Anand, 1982 and Tripathi et al., 1988) Preserves prepared byusing the optimum fruit maturity also keep longer with better organoleptic qualities (Jainet al., 11). Unfortunately, preserve can't be fortified with desired ingredients for particularpurpose as therapeutics. Preserves also need a slandered maturity indices and cultivarfor ideal product. Contrary to this, aonla jam has no such limitations and judiciously maybe fortified with differed maturity fruits.
Extract of Tulsi is used in Ayurvedic remedies for common colds, headaches,stomach disorders, inflammation, heart disease, various forms of poisoning, and malaria.Traditionally, Tulsi is taken in many forms as an herbal tea, dried powder, fresh leaf, ormixed with ghee. Bandyopadhyay (2006) Chodhery et al. (2007) Prakash and Gupta(2005) Kothari (2005)
Young ginger rhizomes are juicy and fleshy with a very mild taste. They are oftenpickled in vinegar or sherry as a snack or just cooked as an ingredient in many dishes.They can also bestrewed in boiling water to make ginger tea, to which honey is oftenadded. Mature ginger roots are fibrous and nearly dry. The juice from old ginger roots isextremely potent and is often used as a spice in Indian recipes & Chinese cuisine toflavor dishes such as seafood or goat meat and vegetarian cuisine. Ginger acts as auseful food preservative and has been proven to kill the harmful bacteria Salmonella. Itis used fresh to spice tea especially in winter. Ginger powder is also used in certain foodpreparations particularly for pregnant or nursing women. Baghurst (2006).
Green cardamom in South Asia is broadly used to treat infections in teeth andgums, to prevent and treat throat troubles, congestion of the lungs and pulmonarytuberculosis, inflammation of eyelids and digestive disorders. It also used to break upkidney stones and gall stones, and was reportedly used as an antidote for both snake andscorpion venom. Cardamom is used as a spice and as an ingredient in traditional medicinein systems of the traditional Chinese medicine in China, in Ayurveda in India, Japan,
Balaji Vikram, V.M. Prasad, Atul Anand Mishra and Surya Narayan

88
Korea and Vietnam. Green cardamom powder is used as a spice for sweet dishes aswell as traditional flavouring in coffee and tea. Njallani (2008).
Therefore, it shows great opportunity to fortify the aonla jam with Tulsi, Cardamomand Ginger with desired concentration. Such fortified jam with said herbals will not onlyaugment the vital components but also will increase therapeutic properties of the product.Storability is the key factor for processed products especially in Indian conditions wherehygienic and climatic factors are found to discoursing the processing industry. Theseherbals certainly may increase the storability of jam due to their germicidal, antibiotic andpreservative properties. After value addition the flavor, taste and nutritional values mayalso be increased this increases the demand in international markets as well. Moreprocessing industry can be established and the post harvest losses of Aonla fruits can bereduced considerably.
Keeping these aspects in view, the experiment was undertaken to find out suitablekinds & quantity of herbs to be added for maximum storability, quality and nutrition ofproduct.
MATERIALS AND METHODSThe experimental work of preparation and preservation of value added herbal
products of aonla was conducted in the P.G. laboratory, Deportment of Horticulture, SamHigginbottom Institute of Agriculture Technology & Sciences (Deemed-to-be-University),Allahabad, during the year 2008-2009. The investigation was laid out in CRD with threereplications. Tulsi, cardamom and ginger extracts were prepared and three levels ofeach i.e. 0.1%, 1.0% and 1.5% were used forming 10 treatment combations viz- T0(Control), T
1 (Tulsi 0.5%), T
2 (Tulsi 1.0%), T
3 (Tulsi 1.5%), T
4 (Cardamom 0.5% ), T
5
(Cardamom 1.0%) , T6 (Cardamom 1.5%), T
7 (Ginger 0.5% ), T
8 (Ginger 1.0%) and T
9
(Ginger 1.5%). General procedure for jam preparation was adopted in each treatment.The Aonla herbal jam products were stored for eight months at ambient temperature.
RESULTS AND DISCUSSIONTSS of Aonla herbal Jam was found to increased with increase in storage duration.
After 8 months of storage, the level of TSS was reached up to 69.55% which was being68.06% only in the initial stage. The effect of treatments on TSS changes was observedsignificantly. The lowest mean TSS (68.50%) was recorded in control while the highestTSS (69.26%) was observed in T
9 closely followed by T
8 (69.07%). All the ginger levels
of treatment were proved better in relation to TSS over cardamom & Tulsi respectively.
The Allahabad Farmer Vol. LXVII, January - 2012 No. 2

89
Balaji V
ikram, V.M
. Prasad, A
tul Anand M
ishra and Surya Narayan
Table 1 : Effect of herbals on Storability and TSS (%) of Aonla herbal jam (2008-09)
Tr eatments Period of storage (month)
0 1 2 3 4 5 6 7 8 Mean
T0
68.04 68.18 68.27 68.31 68.52 68.67 68.78 68.84 68.87 68.50
T1
68.05 68.14 67.92 68.39 68.53 68.74 68.85 68.93 69.12 68.52
T2
68.05 68.15 68.28 68.37 68.60 68.83 68.99 69.23 69.31 68.65
T3
68.08 68.19 68.34 68.49 68.74 68.96 69.23 69.34 69.48 68.76
T4
68.03 68.16 68.32 68.47 68.63 68.91 69.17 69.31 69.43 68.71
T5
68.04 68.16 68.32 68.45 68.67 68.89 69.26 69.58 69.69 68.78
T6
68.08 68.21 68.42 68.59 68.88 69.13 69.29 69.52 69.77 68.88
T7
68.06 68.19 68.34 68.47 68.69 68.91 69.26 69.49 69.53 68.77
T8
68.07 68.22 68.49 68.78 69.14 69.39 69.65 69.83 70.02 69.07
T9
68.08 68.33 68.59 68.88 69.67 69.69 69.68 70.13 70.32 69.26
Mean 68.06 68.19 68.33 68.52 68.81 69.01 69.22 69.42 69.55
F- test S S S S S S S S S
S. Ed. (±) 0.003 0.003 0.149 0.003 0.298 0.015 0.130 0.013 0.005
C. D. (P = 0.05) 0.005 0.005 0.311 0.005 0.622 0.032 0.271 0.027 0.011

90
The Allahabad Farmer Vol. LXVII, January - 2012 No. 2

91
Table 2 : Effect of herbals on Storability and pH of Aonla herbal Jam (2008-09
Tr eatments Period of storage (month)
0 1 2 3 4 5 6 7 8 Mean
T0
3.48 3.47 3.45 3.42 3.38 3.34 3.29 3.25 3.18 3.36
T1
3.50 3.50 3.49 3.47 3.44 3.41 3.37 3.34 3.28 3.42
T2
3.51 3.51 3.50 3.48 3.46 3.43 3.37 3.37 3.31 3.44
T3
3.52 3.52 3.51 3.50 3.48 3.46 3.43 3.40 3.35 3.46
T4
3.53 3.52 3.51 3.49 3.46 3.43 3.40 3.36 3.32 3.45
T5
3.54 3.54 3.53 3.51 3.49 3.47 3.44 3.40 3.35 3.47
T6
3.56 3.56 3.55 3.54 3.52 3.50 3.48 3.46 3.42 3.51
T7
3.57 3.57 3.56 3.54 3.53 3.52 3.50 3.48 3.43 3.52
T8
3.59 3.59 3.58 3.57 3.55 3.53 3.51 3.49 3.42 3.54
T9
3.60 3.57 3.60 3.59 3.55 3.57 3.53 3.57 3.47 3.56
Mean 3.54 3.53 3.53 3.51 3.49 3.47 3.43 3.41 3.35
F- test S S S S S NS S S S
S. Ed. (±) 0.026 0.030 0.037 0.041 0.047 0.074 0.060 0.037 0.047
C. D. (P = 0.05) 0.054 0.062 0.076 0.087 0.098 0.153 0.124 0.076 0.098
Balaji V
ikram, V.M
. Prasad, A
tul Anand M
ishra and Surya Narayan

92
The A
llahabad Farm
er Vol. LX
VII, January - 2012 N
o. 2
Storage Period
Fig-2 : Change in pH Aonla herbal jam during ambient storage (2008-09)

93
Table 3 : Effect of herbals on Storability and overall acceptability of Aonla herbal jam (2008-09).
Tr eatments Period of storage (month)
0 1 2 3 4 5 6 7 8 Mean
T0
6.17 6.08 5.94 5.80 5.67 5.47 5.33 5.18 5.03 5.63
T1
6.58 6.49 6.35 6.21 6.08 5.94 5.81 5.64 5.47 6.06
T2
5.76 5.67 5.47 5.33 5.17 5.03 4.89 4.76 4.62 5.19
T3
5.52 5.39 5.23 5.09 4.95 4.82 4.68 4.53 4.39 4.96
T4
7.03 6.94 6.80 6.70 6.55 6.41 6.27 6.14 6.00 6.54
T5
8.38 8.33 8.24 8.12 8.06 7.97 7.88 7.79 7.69 8.05
T6
7.79 7.69 7.61 7.45 7.29 7.12 6.99 6.85 6.71 7.28
T7
8.11 8.02 7.92 7.83 7.74 7.62 7.47 7.32 7.20 7.69
T8
8.65 8.61 8.52 8.43 8.33 8.24 8.15 8.06 7.97 8.33
T9
7.60 7.33 7.20 7.03 6.89 6.76 6.62 6.48 6.35 6.92
Mean 7.16 7.06 6.93 6.80 6.67 6.54 6.41 6.28 6.14
F- test S S S S S S S S S
S. Ed. (±) 0.067 0.085 0.062 0.116 0.044 0.031 0.039 0.083 0.258
C. D. (P = 0.05) 0.140 0.178 0.129 0.242 0.092 0.065 0.081 0.172 0.539
Balaji V
ikram, V.M
. Prasad, A
tul Anand M
ishra and Surya Narayan

94
The Allahabad Farmer Vol. LXVII, January - 2012 No. 2
95
Among the herbs Tulsi was found to inferior in improving the TSS level of the Aonla jamin all the treatments higher level of herbs yielded higher value of TSS. Dobhal (2000)
pH content of Aonla herbal Jam was found to decrease with increase in storageduration. At initial stage mean Ascorbic acid content was (3.48) which was decreasedup to (3.18) after 8th months of storage. pH content was found to vary with herbaltreatment. The highest level of pH content was observed (3.56) in T
9 closely followed by
T8 (3.54). Among the herbs Ginger was better to improved pH content, followed by Tulsi
and cardamom respectively. The lowest value was observed (3.36) in control. Howeverdeclining trend of pH was noticed, which might be due to increasing of acidity in Jam.Similar results were reported by Chobe (1999) in case of pomegranate juice. Patil andJadhav (2001) in case of sweet orange juice and these findings agreed with the findingsof Khurdia and Roy (1984) in jamun squash and Jam during storage.
Overall acceptability was influenced significantly with the treatment. Higher levelof herbal could not produce top acceptability due to deviation from standard Colour,Texture, Flavor of the product retained after 8th month of strange. Though, the bestresult was recorded (8.33 score) in T8 (Ginger @ 1.0 %). Closely followed by (8.05score) in T
5 Cardamom @ 1.0 %. Even control was proved better as compared to high
level of Tulsi. No certain pattern was observed with overall acceptability with treatmentconcerned. Strong duration had influence on overall acceptability which was initially7.16 score and reduced 6.14 score after 8th months of storage.
Aonla herbal Jam showed decreasing trend in all the treatments during storageperiod may be due to changes in colour as indicated by increase in browning and changesin texture of Aonla herbal Jam samples during storage indicated by the texture scoresawarded by judges (Singh, 1985).
REFERENCES
Aubertine, C. (2004), Cardamom (Amomum spp.) in Lao PDR: the hazardous futureof an agro forest system product, in 'Forest products, livelihoods and conservation:case studies of non-timber forest products systems vol. 1-Asia, Center forInternational Forest Research. Jakarta, Indonesia.
Afshari, Ali Taghizadeh et al. (2007)."The effect of ginger on diabetic nephropathy,plasma antioxidant capacity and lipid peroxidation in rats".Food Chemistry(Elsevier) 101.
Balaji Vikram, V.M. Prasad, Atul Anand Mishra and Surya Narayan

96
Álvarez, L. (2008). 'Cardamom prices leads to a re-emergence of the green gold'. [5]
Amin, Zainab M. et al. (2006). "Anti-diabetic and hypolipidaemic properties of ginger(Zingiber officinale) in streptozotocin-induced diabetic rats, British J. of Nutrition(Cambridge University Press) 96: 660-666.
Chen, Jaw-Chyun; Li-Jiau Huang, Shih-Lu Wu, Sheng-Chu Kuo, Tin-Yun Ho,Chien-Yun Hsiang (2007). "Ginger and Its Bioactive Component Inhibit Enterotoxigenic
Escherichia coli Heat-Labile Enterotoxin-Induced Diarrhoea in Mice". J. of Agri.& Food Chemistry 55 (21): 8390-8397.
Dobhal, P. (2000). Studies on preparation and preservation of phalsa beverages. M.Sc.Thesis, N.D. Univ. of agric. And Tech., Faizabad (U.P.).
Ernst, E.; & Pittler , M.H. (01 Mar 2000). "Efficacy of ginger for nausea and vomiting:a systematic review of randomized clinical trials (PDF). British J. of Anesthesia84 (3): 367-371.
Mark Mor ton (2004). Cupboard Love, A Dictionary of Culinary Curiosities, (InsomniacPress, Toronto, Canada.)
Mayo Clinic(2006). "Drugs & Supplements: Ginger (Zingiber officinale Roscoe)"
Mousa, M., Sagar V. R. and Khurdiya D. S. (2004). Studies on preparation ondehydrated ginger slices. J. of Food Scie. and Tech., 41 (4): pp. 423-426
Nath, V., Singh, I. S. and Kumar, S. (1992). Evaluation of aonla (Emblica officinalisGaertn.) cultivars for their self-life at ambient temperature. Narendra DevJ. Agric. Res. 7:117-120.
Pathak, R. K. & Singh, I. S. (1998). Aonla production and post harvest tech., 30-31.
Pathak, R.K., Pandey, D. Haseeb M. and Tandon D. K. (2003). The Aonla bull.CISH, Lucknow, India.
Singh, S. (2002b) Studies on preparation and preservation of ginger (Ginger officinalisL.) beverages. M.Sc. Thesis of Agri. Of Tech. Faizabad (U.P.).
Srivastava, R.P. and Kumar, S. (2007). Fruit and vegetable preservation of principlesand practices 3rd Revised & Enlarged Edition. International book distributingco. Lucknow.University of Maryland Medical Centre (2006). www.umm.edu/Gingerch.html.
The Allahabad Farmer Vol. LXVII, January - 2012 No. 2
97
Development of erosivity model on daily rainfallbasis for Hazaribagh region
Pravendra Kumar
ABSTRACTA study was conducted with the objective to develop erosivity models for
Hazaribagh district of Jharkhand state to calculate the erosivity index values
and to establish the most effective relationship between erosivity index and
daily rainfall values for the study area. Two types of relationship namely linear
and exponential relationship between erosivity index and daily rainfall values
have been developed in this study. The performance of the models was evaluated
by statistical performance tests such as absolute prediction error and coefficient
of efficiency. Absolute prediction error was found to be 18.2% and 23.9% for
linear and exponential relationship respectively. Coefficient of efficiency was
found 89.3% and 76.9% for linear and exponential relationships respectively.
Both the developed models are applicable for Hazaribagh region. However, based
on quantitative evaluation, the linear model was found to be better.
Key words: Absolute prediction error, Coefficient of efficiency, erosivity index,linear model
INTRODUCTIONThe factors controlling soil erosion are the erosivity of rainfall, the erodibility of soil,
the slope of land, the nature of the plant cover and the land management. Rain splash isthe major agent of detachment process. Soil particles may be thrown in the air over adistance of several centimeters due to the impact of raindrop on a bare soil surface. Thecontinuous exposure of bare soil surface over an intensive rainfall weakens soil cohesion.Mechanical weathering due to alternate drying and wetting and freezing and thawing aswell as the frost action makes the soil particles easily detachable from the soil surface.Biochemical processes, human activities and management practices such as tillageoperation and flowing water and wind also loosen the soil particles making them moresusceptible to erosion.
Assistant Professor, Department of Soil and Water Conservation Engineering, G. B. Pant University ofAgriculture & Technology, Pantnagar-263 145, Uttarakhand
The Allahabad Farmer Vol. LXVII, January - 2012 No. 2

98
Four basic steps in erosion process (Mayer and Wischmeier 1969) aredetachment by raindrop splash, transportation by raindrop splash, detachment by surfacerunoff and transportation by surface runoff. Scientific planning for soil conservation andwater management requires knowledge of the relationship among those parameters thatcause the soil loss or reduce it. These parameters can be found by careful analysis of thecontrolled experimentation. There are several models that have been developed andapplied for estimation of weekly, monthly and annual erosivity index based on rainfallamount (Tiwari, 1986; Goardon and Madramootoo, 1989; Bullock et al., 1990;Kusre, 1995; Satpaty et al., 2000 and Zang et al., 2005). The present study hasbeen undertaken with the following objectives: (i) To determine erosivity index of somerandomly selected storms events. (ii) To develop and establish the most effectiverelationship between erosivity index and daily rainfall amount. (iii) To compare the suitabilityof the developed models.
MATERIALS AND METHODSThe daily rainfall data from recording type rain gauge was collected from Soil
Conservation Departments, Damodar Valley Corporation, Hazaribagh, Jharkhand.Hazaribagh is located at 24o North latitudes and 85o22' East longitudes at an altitude of615.39m above mean sea level. Nine rainfall events, having magnitude greater than15mm, were selected from a period of 3 years viz.1992-1994.
Determination of erosivity indexRainfall erosivity (R factor) describes the soil loss potential caused by rainfall. It is
calculated from two rainfall characteristics; total kinetic energy (E) of the storm times its30 minutes intensity (I
30). This product reflects the combined potential of rainfall impact
and turbulence of runoff to transport dislodged soil particles from the field (Wischmeierand Smith 1978) and is given by:
EI = E. I30
…(1)
where, E is the Kinetic energy in MJ/ha and I30
is the 30 minutes maximum energyin mm/h and EI is the erosivity index.
Erosivity index is not simply as an energy parameter. The data show that the rainfallenergy itself is not a good indicator of erosive potential. The storm energy indicates thevolume of rainfall and runoff, but a lower intensity rain for a longer duration may havethe same energy value as a shorter duration of much higher intensity. The I
30 components
indicate the prolonged peak rates of detachment and runoff. Thus, the term erosivity
Pravendra Kumar

99
index is a statistical interaction that reflects how total energy and peak intensity arecombined in each particular storm. Technically; it indicates how particle detachment iscombined with transport capacity (ARS, 1961).
In practice, the total of the storm energy is calculated for time intervals of equalintensity with the help of the following equation (Foster et al., 1981).
E= Σ ej . pj … (2)
in which
ej= 0.119 + 0.0873 log10
ij ; ij < 76mm/h
ej= 0.283 ; ij > 76mm/h …(3)
where, ej is the Kinetic energy for time interval j in MJ/ha.mm, ij is the intensity ofrainfall for time interval j in mm/h, E is the energy for the event in MJ/ha and p
j is the
rainfall for time interval j in mm. A limit of 76mm/h is imposed on intensity 'I' becausemedium drop size, which directly affects the rain intensity, does not continue to increasewhen intensities exceeds 76mm/h (Laws and Parson 1943).
The following form of the exponential equation as suggested by Richardson (1983)has been tried in the present study:
EI = a Pb + ε … (4)
where, EI is the erosivity index in MJ.mm/ha.h and P is the daily rainfall amount inmm. In the above equation a Pb is the deterministic component with a and b as equationparameters and ε is the random error component with zero mean and unit variance.
The step wise procedure for estimating erosivity index is described below: (i) Thestorm is subdivided into the time intervals of uniform intensity; (ii) The Kinetic energy ofrainfall per millimeter of rainfall for the jth time interval is calculated using Eq. 3; (iii) Thetotal storm energy is obtained using equation (2); (iv) The 30 minute maximum intensity'I
30' of rainfall is determined by selecting that 30 minute period during which the slope is
maximum in the rain gauge chart; (v) The obtained storm energy (step 4) and the 30minute maximum intensity I
30 multiplied to get the erosivity index for that storm.
A regression analysis is performed between erosivity index 'EI" and daily rainfallamount 'P' with the help of following form of the linear equation:
EI= a + b. P … (5)
The Allahabad Farmer Vol. LXVII, January - 2012 No. 2

100
where, EI is the dependent variable and P is independent variable. a and b areregression parameters and can be determined as,
a = … (6)
b = … (7)
Random error component is the difference between computed erosivity index andthe deterministic component aPb for the given storm. The random error component is theresult of rainfall intensity that can occur within an event of a given rainfall amount andthe equation (4) can be linearized by logarithmic transformation as
log EI = log a + b log P + έ ... (8)
and thus the equation parameters can be estimated by the least square method asdescribed above through Eq. 6 to 7.
The random component ? is determined by rearranging the Eq. (8) as
έ
= log EI - (log a + b log P) ... (9)
Quantitative performance Evaluation
The acceptability of the model is judged by the goodness of fit between observedvalues and values estimated by a model. For quantitative performance between observedand estimated values, the following statistical measures are employed in this study.
Absolute prediction error
The absolute prediction error values are determined by the following equation asproposed by the World Meteorological Organization Statistics (1975).
… (10)
where, APE is absolute prediction error in percentage and Oi and E
i are calculated
and predicted values of erosivity index respectively.
Σ EI - b . PΣn
nΣ EI. P - ΣP. ΣEI
n ΣP2 - (ΣP)2
Pravendra Kumar

101
Coefficient of efficiencyThe use of another goodness of fit parameter known as coefficient of efficiency
(CE) for evaluating model performance has been recommended by many researcher inthe field of hydrology. The coefficient of efficiency as defined by Nash and Sutcliffe(1970) is the proportion of the initial variance accounted by that model. The coefficientof efficiency is determined by the following equation:
… (11)
where, CE is coefficient of efficiency in percentage and O is the mean of measuredvalues.
RESULTS AND DISCUSSIONThe erosivity index (EI) values for various storm events have been estimated using
the procedure described above. The estimated values of erosivity index for storm eventsdated June 18, 1994 are presented in Table1. For better comparison, EI and I30 values
Table 1: Computation of erosivity index for storm event dated June 18, 1994
Cumulative Kinetic Total KineticTime Duration Rainfall Rainfall Intensity Energy EnergyPeriod (min.) (mm) (mm) (mm/h) (MJ/ha.mm) (MJ/ha)
4.34-4.49 A.M 15 0 0 0 0 0
4.49-5.04 A.M 15 0.2 0.2 0.8 0.11054 0.022108
5.04-5.19 A.M 15 0.5 0.3 1.2 0.125913 0.037774
5.19-5.34 A.M 15 8.5 8 32 0.2504 2.003197
5.34-5.49 A.M 15 14.7 6.2 24.8 0.240736 1.492561
5.49-6.04 A.M 15 15.7 1 4 0.17156 0.17156
6.04-6.19 A.M 15 16 0.3 1.2 0.125913 0.037774
6.19-6.34 A.M 15 16 0 0 0 0
TOTAL 16 3.764973
I30 = 28.4 mm/h
EI30 = 106.92523 MJ.mm/ha.h
The Allahabad Farmer Vol. LXVII, January - 2012 No. 2

102
for all 9 storm events are shown in Table 2. From Table 2, it can be observed thatvariation in I30 and EI values ranges from 14.4mm/h to 73mm/h and 54.36 MJ.mm/ha.hto 1074.35 MJ.mm/ha.h, respectively.
Development of models for erosivity Index and rainfall Amount
Linear and exponential models have been developed between different erosivityindex and rainfall values for Hazaribagh region.
Linear model
A linear model between erosivity index (EI) as dependent variable and rainfall (P)as independent variable has been developed and the following form of equation has beenobtained with correlation coefficient equal to 0.977 between erosivity index and dailyrainfall amount.
EI30
= 21.917 P - 302.479 … (12)
From the above equation, it can be observed that the calculated value of erosivityindex for rainfall amount less than 14mm comes out to be negative which is physicallyinfeasible. Hence, the equation proves to be good for rainfall depth exceeding 14mmonly. (Wischmeier and Smith 1978) also observed through their study that the rainfall
Table 2: Storm-wise computed EI and I30 values
Date Rainfall Computed EI I30(mm) (MJ.mm/ha.h) (mm/h)
June 24-25, 1992 18.9 64.23 17.1
Oct. 12-13, 1993 64.2 964.95 62
Nov. 2-3, 1993 15.1 65.48 20.2
June 14, 1994 18.6 54.36 14.4
June 18, 1994 16 106.92 28.4
July 4, 1994 16.6 84.17 23.0
Aug. 13, 1996 41.2 668.10 62.4
Sept. 15, 1996 56.2 1074.35 73
Oct. 15-16, 1996 21.5 75.61 16.9
EI is the erosivity index and I30
is the 30 minute maximum rainfall intensity.
Pravendra Kumar

103
amounts less than 13mm contributes very little to erosivity.Thus, the rainfall amounts lessthan 15mm have been neglected for the development of the above relationship in thepresent study.
Exponential model
As per the procedure detailed above, an exponential relationship has been obtainedbetween erosivity index (EI) as the dependent variable and rainfall amount (P) as theindependent variable with coefficient of correlation equal to 0.956. The equation thusobtained is in the following form:
EI30
= 0.174 P 2.123 + ε … (13)
where, EI30
is the erosivity index in MJ.mm/ha.h and P is the daily rainfall amountin mm, and ε is the random error component. The model parameters were estimated bythe least square method as described above using Equation 6 to 7.
The random error component ε is linearized by logarithmic transformation and theestimated storm-wise values of
έ
have been shown in Table 3. It is clear from the table
Table 3: Estimation of storm-wise random component εεεεε
ExponentiallyDate Rainfall Computed EI Predicted EI
(mm) (MJ.mm/ha.h) (MJ.mm/ha.h) εεεεε
June 24-25, 1992 18.9 64.23 89.29821 -0.1430
Oct. 12-13, 1993 64.2 964.95 1197.954 -0.0939
Nov. 2-3, 1993 15.1 65.48 55.44453 0.0722
June 14, 1994 18.6 54.36 86.31547 -0.2008
June 18, 1994 16 106.92 62.69653 0.2318
July 4, 1994 16.6 84.17 67.79382 0.0939
Aug. 13, 1996 41.2 668.10 467.1145 0.1554
Sept. 15, 1996 56.2 1074.35 903.0661 0.07543
Oct. 15-16, 1996 21.5 75.61 117.4072 -0.1910
Mean = 0.0000SD = 0.1595
The Allahabad Farmer Vol. LXVII, January - 2012 No. 2

104
that the mean of
έ
values is zero and the standard deviation is 0.1595. The values ofcoefficient a, exponent b and residual term ? are within the range according to Richardsonet al. (1983).
Quantitative performance of models
The validity of the developed models was checked for seven randomly selectedstorm events from years 1994-1997. Two statistical indices viz. absolute prediction errorand coefficient of efficiency were used for evaluating the quantitative performance ofthe models and are given in Table 4. The absolute prediction error and coefficient ofefficiency were found to be 18.2% and 89.3% for linear relationship and 23.9% and76.9% for the exponential relationship. These values are within the recommended rangeof less than 25 % for absolute prediction error (World Meteorological OrganizationStatistics, 1975) and above 75% for coefficient of efficiency (Nash and Sutcliffe,1970). Thus, it is evident that both the relationships give good results and both of themcan be applied for Hazaribagh in particular and its surrounding in general. However, thelinear relationship gave better results in comparison to exponential relationship. The linearmodel is recommended for use because of ease in computational procedure for EI values.
Table 4: Quantitative performance evaluation of models
S.No. Rainfall Computed EI Linearly Predicted EI Exponentially Predicted EI(mm) (MJ.mm/ha.h) (MJ.mm/ha.h) (MJ.mm/ha.h)
June 11. 1994 63.4 933.36 1087.05 1165.15
October 9, 1994 40 704.88 574.201 438.25
June 25, 1995 25.8 152.85 262.97 172.74
July 7, 1995 32.1 397.06 401.05 274.70
August 7, 1995 48 757.73 749.53 645.39
July 19, 1996 27.9 194.94 309.00 203.97
July 31, 1997 22 107.28 179.69 123.17
APE = 18.26 % APE = 23.9 %
CE = 89.30 % CE = 76.9 %
Pravendra Kumar

105
CONCLUSIONThe linear and exponential models were applicable for Hazaribagh region. However,
the linear model was found to be better.
REFERENCES
Agricultural Research Services, USDA (1961). A universal equation for predictingrainfall erosion losses. ARS, pp. 22-26.
Bullock, P.R., Jong, Ede and Kiss, J.J. (1990). An assessment of rainfall erosionpotential in Southern Saakatchewan from daily rainfall records. Canadian.Agric.Engg., 32: 17-24.
Foster, G.R., McCool, D.K., Renard, K.G. and Molden Haver, W.C. (1981).Conversion of Universal Soil Loss Equation to SI metric units. J. Soil and WaterCons., 36: 355-359.
Gordon, R. and Madramootoo, C.A. (1989). Snowmelt adjusted USLE erosivityestimates for Maritime Provinces of Canada. J. Canadian AgriculturalEngineering, 31 (2): 95-99.
Kusre, B.C. (1995). Development and validation of weekly runoff & sediment yieldmodels for a Himalayan Catchment. M.Tech. Thesis in Agricultural Engg.,G.B.Pant University of Agriculture and Technology, Pantnagar.
Laws, J.O. and Parson, D.A. (1943). The relation of Raindrop size to intensity.Transaction American Geo-Physical Union, 24: 452-459.
Mayer, L.D. and Wischmeier, W.H. (1969). Mathematical simulation of the processof soil erosion by water. Trans. of the American Society of Agricultural Engineers,12(6): 754-758.
Nash, J.E. and Sutcliffe (1970). River flow forecasting through conceptual modelPart I-A. Discussion of the principles. J.Hydro. 10: 282-290.
Richardson, C.W., Foster, G.R. and Wright, D.A. (1983). Estimation of erosionindex from daily rainfall amounts. Transactions of the American Society ofAgricultural Engineers, 26 (1): 153-156.
The Allahabad Farmer Vol. LXVII, January - 2012 No. 2

106
Pravendra Kumar
Satapathy, K.K., Jena, S.K. and Daschaudhuri, D. (2000). Erosion Index Analysisof Umiam, Meghalaya. Indian J. Soil Cons., 28(3): 193-197
Wischmeier, W.H. and Smith, D.D. (1978). Predicting rainfall erosion losses: A guideto conservation planning. Agriculture Handbook, Science and Education
Administration, United States Department of Agriculture, Washington D.C, 537.
World Meteorological Organization (1975). Statistics, Inter-comparison of Conceptualmodels used in Operational Hydrological forecasting, Operational HydrologyReport No.7, World Meteorological Organization, Geneva.
Zang, G.H., Nearing, M.A. and Liu, B.Y. (2005). Potential Effects of Climate Changeon Rainfall Erosivity in the tallow River basin of China. Trans. American Societyof Civil Engineers, Vol.48 (II): 511-517.

107
Effect of sulphur doses on different quantitativeparameters of cowpea varieties
(Vigna unguiculata L. walp.)
Tripti Pandeyttttt, R.P. Singhnnnnn, A.B. Abidi lllll and K.D.N. Singhvvvvv Rekhaooooo
ABSTRACT
The present investigation was carried out to observe the response of sulphur
on physical parameters of cowpea. The experiment was conducted during Zaid
season of 2006-2007 at vegetable farm of N.D. University of Agriculture and
Technology, Kumarganj, Faizabad. Five varieties namely Pusa Komal, NDCP 2,
NDCP 1, Arya Vaibhav Laxmi and Indra Hari 2 were selected for the
experimentation. The sulphur doses were 0, 20, 40 and 60 kg/ha. The results
showed high variation among physical traits. Length of pods varied from (28.48
to 32.11 cm), number of grains varied from 24.50 to 31.50 per pod, size of grain
(0.66 to 1.78 cm), yield varied from (87.84 to 88.13 q/ha). Moisture content (74.30
to 81.69). The sulphur doses were helpful to increase all the parameters. The
best result was found in variety NDCP 2@60 kg S applied plots.
INTRODUCTIONCowpea is an important legume crop and mostly used as vegetable often grown as
a green manure for soil improvement. Besides a rich source of protein, this is also importantfor sustainable agriculture as it improves physical, chemical and biological properties ofsoil and functions as a mini nitrogen factory crop. It is the cheapest source of protein ascompared to other sources (Berrosoni; 1985). The application of zinc, sulphur, mangneseand boron significantly increased yield, oil content, protein content and dry matter incowpea and pea crop. (Sethi et al. 1979). The soils of most part of Uttar Pradeshwhere vegetables are grown were light and medium in texture, marginal to deficient insulphur. Sulphur containing fertilizers are gypsum, potassium sulphate. Elemental sulphur,
tttttResearch Associate, nnnnnAssociate Professor, lEx. Professor & HOD, vProfessor & HOD, oooooPh. D. ScholaroooooDepartment of Biotechnology, ttttt,nnnnn,l,vDepartment of Biochemistry, N.D. University and Technology,Kumarganj, Faizabad.
The Allahabad Farmer Vol. LXVII, January - 2012 No. 2

108
pyrite and Ammonium sulphate which could be quite useful in augmenting the cowpeaproduction. Considering the importance of sulphur as nutrient, the present study hasbeen planned to observe various physical parameters of cowpea.
MATERIALS AND METHODSAn experiment was conducted in a randomized block design with three replication
at Vegetable Farm of N.D. University of Agriculture and Technology, Narendra Nagar,Kumarganj, Faizabad (U.P.) during Zaid season of 2006-07 Five newly introduced varietiesof cowpea namely NDCP 1, NDCP 2, Arya Vaibhav Laxmi, Indra Hari 2 and Pusakomal were used as experimental material Sulphur nutrition was applied as basal dose @0, 20, 40 and 60 kg/ha, The length of pods. Number of grains per pod, size of green grain,yield of grains and moisture content in green pods were observed. After picking thefresh pods, the grains found inside the pods were counted and expressed as number ofgrains per pod. The size of grains were measured with the help of Varnier Caliper andmean values were worked out and expressed in cm. After picking the fresh pods, yieldof each plot was seperately weighed in kilogram and converted into quintal. The moisturecontent of green grain was determined by oven drying method. The data recorded onthese factors were subjected to statistical analysis as described by Fisher and Yates(1949).
RESULTS AND DISCUSSIONLength of pod -
The data pertaining to the length of pod is shown in Table 1. It is evident thatvariety NDCP 2 was superior among all the varieties during both the experimental year.The NDCP 2 showed (28.48, 24.11 cm) pod length during 2006 which was maximum,while variety AVL has given minimum length (18.05, 19.38 cm) as compared to othervarieties. Various sulphur doses gave significant effect on the length of pod. The maximumlength was found (23.12, 24.29 cm) 60 kg sulphur, which was at par with (22.65, 23.11cm) at 40 kg sulphur. The increasing level of sulphur affected significantly the length ofpods at maturity level during 2006-07. Garner (1951) found that sulphur plays a keyrole in plant metabolism.
Tripti Pandey, R.P. Singh, A.B. Abidi and K.D.N. Singh Rekha

109
Number of grains per pod: Date pertaining to varieties and sulphur levels on numberof grains have been presented in Table 2. The highest number of grain was recorded invariety NDCP 2 (24.50, 21.25) and lowest number of grain was noticed in Arya vaibhavLaxmi (21.25, 15.50) during 2006-07. Maximum number of grain was found with 60 kgsulphur per ha while minimum was noticed in control treatment of the study period.According as Giri et al. (1983) and Ali (1984) number of grains per pod of variety isgoverned by the genetic character of a variety. Several research workers have alsoreported significant effect of sulphur application on number of grains in legume crop(Mehta and Singh, 1979).
Table 1: Effect of varieties and sulphur levels on length of pods in cowpea.
Tr eatments Length of pod (cm )
Varieties 2006 2007
Pusa komal 21.55 22.24
NDCP 1 19.00 20.09
NDCP 2 28.48 24.11
Arya Vaibhav Laxmi 18.05 19.38
Indra Hari 2 20.06 21.35
SEm± 0.48 0.50
CD at 5% 1.37 1.41
Sulphur level (kg/ha)
0 17.39 17.07
20 18.54 20.90
40 22.65 23.17
60 23.12 24.59
SEm± 0.43 0.45
CD at 5% 1.23 1.27
The Allahabad Farmer Vol. LXVII, January - 2012 No. 2

110
Size of grains: Data pertaining to the size of grains as influenced by different sulpurdoses are given in Table 3. The data revealed that NDCP 2 was superior among othervarieties with maximum size (0.66 and 0.86 cm) during both year. Pusa Komal had gotsecond rank in both study seasons over other varieties. The minimum size of grains wasobserved in variety AVL (0.45, 0.45 cm) during both the years. The 60 kg S/ha produced(0.60 and 0.68 cm) highest grain size in both the years of investigation. The size of grainof a variety is a genetic character as reported by Singh and Sharma (1996); Sharmaand Singh, (1997).
Table 2: Effect of varieties and sulphur levels on number of grains per pod ofcowpea.
Tr eatments Number of grains per pod
Varieties 2006 2007
Pusa komal 23.00 18.00
NDCP 1 21.50 16.25
NDCP 2 24.50 21.75
Arya Vaibhav Laxmi 21.25 15.50
Indra Hari 2 22.00 17.25
SEm± 0.53 0.41
CD at 5% 1.49 1.17
Sulphur levels (kg/ha)
0 16.60 12.80
20 22.80 17.00
40 24.80 20.00
60 25.60 21.20
SEm± 0.47 0.37
CD at 5% 1.37 1.04
Tripti Pandey, R.P. Singh, A.B. Abidi and K.D.N. Singh Rekha

111
Grain yield of cowpea: Data pertaining to grain yield of cowpea as influenced byvarieties and sulphur have been presented in Table 4. The highest grain yied (87.84 and88.13 q/ha) was recorded in variety NDCP 2 followed by variety Pusa Komal (85.99and 85.71 q/ha) on the both years of experiment. Variety Indra Hari 2 gave at par resultwith NDCP 1 while variety AVL was recorded lowest yield during (2006-07). It is observedfrom the data that significant difference were noticed between each variety for theyield. However, various sulphur doses adopted for the grain yield had produced significantresponse over the varieties. The highest yield was found with 60 kg S/ha applied plotsduring both season. The increasing level of sulphur significantly increase the grain yieldof cowpea. Upto 20 kg S/ka is registered higher yield than control on the both years ofstudy. Sulphur is an essential plant nutrient required for the sysnthesis of sulphur containingamino acids, This ultimately resulted in higher number of pods per plant and grains perpod which ultimately resulted in higher yield. Patel and Patel (1992) have conducted
Table-3 Effect of varieties and sulphur levels on size of grain in cowpea.
Tr eatments Size of grain (cm)
Varieties 2006 2007
Pusa komal 0.56 0.65
NDCP 1 0.47 0.48
NDCP 2 0.66 0.86
Arya Vaibhav Laxmi 0.45 0.45
Indra Hari 2 0.51 0.59
SEm± 0.01 0.01
CD at 5% 0.04 0.04
Sulphur level (kg/ha)
0 0.43 0.40
20 0.51 0.60
40 0.58 0.65
60 0.60 0.68
SEm± 0.01 0.01
CD at 5% 0.03 0.04
The Allahabad Farmer Vol. LXVII, January - 2012 No. 2

112
multi- locational trails under All India Co-ordinated Research Project on pulses revealedthat application of sulphur increased the yield of the most of the pulses The optimumdose was found to be 60 kg/ha sulphur. Ali (1984) and Tiwari et al(1989) found thatsulphur application was effective in increasing the growth and yield of cowpea. Khuranaet al. (2002) have observed the role of sulphur in improving the yield and quality of lentilcrop.
Table 4: Effect of varieties and sulphur level on grain yield of cowpea
Tr eatments Yield (q/ha)
Varieties 2006 2007
Pusa komal 85.99 85.71
NDCP 1 81.23 81.86
NDCP 2 87.84 88.13
Arya Vaibhav Laxmi 79.07 72.23
Indra Hari 2 82.82 83.20
SEm± 1.99 2.00
CD at 5% 5.66 5.68
Sulphur levels (kg/ha)
0 74.13 67.38
20 80.51 80.53
40 86.56 87.25
60 92.35 92.34
SEm± 1.78 1.79
CD at 5% 5.06 5.07
Moisture content: Data on moisture content in green pods of cowpea as affectedby various levels of sulphur have been presented in Table 5. Maximum moisture contentwas found in variety AVL (81.69, 79.25%) Vareity Indra Hari- 2 was at par with varietyPusa Komal (77.80, 77.62%) and variety NDCP -1 (76.03, 73.29%) during both the yearof experimentation. While the minimum moisture content was recorded in variety NDCP2(74.30, 73.68%). The result was non significant among the varieties. Doses of sulphur
Tripti Pandey, R.P. Singh, A.B. Abidi and K.D.N. Singh Rekha

113
did not affect the moisture level. Highest moisture level was found in control plots during2006-07 while upto 60 kg sulphur per ha. produced at par result with 40 kg sulphur perha. The probable reason of increasing and decreasing moisture content might be due toadvancement of maturity, there was a gradual and constant increase in dry matter, crudefibre, and ash content however water and crude proteins tend to decrease (Gupta andPradhan, 1975). It is well known fact that with the advancement of maturity, waterdecreases while structural carbohydrates tends to increases in plants (Awasthi andAbidi, 1985).
The Allahabad Farmer Vol. LXVII, January - 2012 No. 2
Table 5: Effect of varieties and sulphur levels on moisture content in cowpea
Tr eatments Yield (q/ha)
Varieties 2006 2007
Pusa komal 77.80 77.62
NDCP 1 76.03 73.89
NDCP 2 74.30 73.68
Arya Vaibhav Laxmi 81.69 79.25
Indra Hari 2 78.88 76.45
SEm± 1.92 1.88
CD at 5% NS NS
Sulphur levels (kg/ha) 77.19
0 79.29 77.19
20 78.45 77.44
40 76.25 75.03
60 76.97 74.57
SEm± 1.72 1.68
CD at 5% NS NS.
ACKNOWLEDGEMENTThe authors are thankful to Hon'ble Vice Chanceller Prof. (Dr.) Basant Ram N.D.
University of Agriculture and Technology, Kumarganj, Faizabad; Late Prof. (Dr.)Jagdamba Dixit H.O.D. Vegetable science for their kind help and support to carry outthe experiment.

114
REFERENCESAwasthi, C.P and Abidi, A.B. (1985). Bio-chemical composition and nutritional values
of some Indian vegetables. Prog. Hort., 17 (2):118-121.Ali, M. (1984). All India coordinated Pulse Improvement Project (ICAR) Rabi Work
Shop, 17-20 September; Project Directorate, Pulses, Kanpur.Berrosoni, R. (1985). Nutritive value of cowpea; Cowpea Research Production and
Utilization; John Wiley and Sons. New York. 353-359.
Fisher, R.A. and Yates, R. (1949). Statistical analysis for Biological and AgriculturalResearch, Oliver and Boyed Edenberg, 5th Edition. pp 136-141.Giri, A.N. and Balerao, S.S. (1983). A note on response of rainfed pea varieties on
row to row spacing and phosphate levels. Indian J. Agron., 29 (3):386-387.Garner, W.W. (1951). The production of legume crops. The Blackiston Company.
Philadelphia, U.S.A.
Gupta, P.C. and Pradhan, K. (1975). Effect of stage of maturity on chemicalcomposition vitro nutrients digestibility of legumes. Indian J. Agril. Sci.,44:614-617.
Khurana, M.P.; Bansal, R.L. and Nayyar, V.K. (2002). Effect of sulphur fertilizationon yield and quality of lentil crop. Ann. Agril. Res., 23(2):244-247.
Mehta, U.R. and Singh, HB. (1979). Response of cowpea to sulphur on calcarioussoils. Indian J. Agric. Sci., 49(9):703-706.
Patel, L.R. and Patel, R.H. (1992). Response of cowpea varieties to sulphur fertilizationunder different levels of nitrogen and phosphorus. Indian J. Agron., 37(9):43-45.
Sethi, A.K.; Singh, V.K. and Chauhan, R. (1979). Effect of sulphur on field pea andcowpea. Indian J. Agron., 42(4):650-652.
Saharia, D. (1984). Performance of cowpea varieties at different sowing dates underrainfed condition. Indian J. Agric. Sci.,
Singh, J. and Sharma, S. (1996). Direct and residual effect of sulphur on yield ofcowpea. J. Indian Soil Sci., 39 (2): 328-331.
Sharma, M. and Singh, R. (1997). Effect of date of sowing and phosphorus applicationon growth and yield of cowpea. Annals of Agric. Res., 18(4): 564-566.
Singh, B.N. (1994). Response of kharif pulses to sulphur and phosphorus fertilizerNews, 39 (9):43-45.
Tiwari, K.N. (1989). Sulphur Research and Agriculture Production in U.P., Bulletin,C.S.A. U.A. and T. Kanpur (U.P.).
Tripti Pandey, R.P. Singh, A.B. Abidi and K.D.N. Singh Rekha

115
An exploration of standardizing rich protein and aminoacid food
Aparna Dubettttt, Pratibha Singhnnnnn, A.B. Abidi ooooo and R. Shuklal
ABSTRACT
Pulses, the wizard of the health, own a vital strategic position in agricultural
economy of India. Food legumes or a pulse as they are commonly known
constitute articles of food all over the world and their use is particularly
widespread in the tropical and sub-tropical regions. The present investigation
was carried out to assess the effect of mixing of various pulses after cooking.
Five pulses namely (Cajanus cajan L., Cicer arietinum L., Vigna radiata L.,
Vigna mungo L. and Lens esculenta) were taken. Pulses were mixed in three
ratios i.e. 1:1, 2:1 and 1:1:1 then cooked and finally flour was prepared and
subjected for bio-chemical analysis. Some combination of pulses was highest in
Tryptophan and Cysteine content (Cajanus cajan L.: Vigna radiata L.viz. 1:1),
some other was best for Cystine, methionine and Lysine content and some one
was superior in total protein content only (Cicer arietinum L.: Vigna radiata L.:
Lens esculenta viz 1:1:1).
Key Words: pulse, amino acids, protein, bio-chemical analysis
INTRODUCTIONPulse crops provide superb energy and symbiotic as an umbrella for people as
dietary proteins, further pulse crops are a boon to livestock as it is a source of greennutritious fodder and a feed for soil as these enrich soil by working as a mini-nitrogenplant and green manure (Ajewole, 2004). At present, diets of large segments of thepopulation in tropical areas are based predominantly on plant foods and will continue to
tttttPh.D. Student in Biochemistry, nnnnnAssociate Professor, oooooProfessor, lPh.D. Student in BiotechnologynnnnnDepartment of Biochemistry, College of Agriculture, N.D. University of Agriculture & Technology,Kumarganj, Faizabad-224229ttttt,ooooo,lDepartment of Biochemistry, SHIATS, Allahabad – 211007 (U.P.)
The Allahabad Farmer Vol. LXVII, January - 2012 No. 2

116
be so, for decades to come pulse meet the needs of proteins of a large section of Indianpeople particularly that of the poor, since the majority of people can not afford animalproteins as they are costly or do not use them because of religions beliefs. Pulses areconsidered to be "Poor man's meat" (Arora, 1982). Most of the cost-effective proteinsare those, derived from plant materials which, although in abundance in many developingcountries (Arora et al., 2004). The search for novel high-quality but cheap sources ofprotein and energy as continued to be of major concern to governments and other bodiescharged with the responsibility for food and nutrition in many parts of the developingworld. Leguminous seeds are important sources of protein in the diet of millions of people.(Fathima and Mohan, 2009).
In the same way there are wide variations in protein, fat, carbohydrate, minerals,amino acids and other nutrients among various pulses. Some pulses may be very rich inparticular nutrients while other may be short of or deficient for the same. Need forsearching the new food sources, nutritionally improved plants within the domesticatedgenotypic lines (Arinathan et al., 2009). Some, mixibility studies of pulses can be apossible way to supplement of nutrients in the diet of human being and thus nutritionalstatus and quality of low type pulses can be improved. There has been a constant searchfor new legumes combinations with highest protein content and suggestions for utilizationof unconventional cooking combination of legumes.
MATERIAL AND METHODSTen varieties of different pulses selected naming Cajanus cajan L., Cicer arietinum
L., Vigna mungo L., Lens esculenta and Vigna radiata L. for biochemical analysis.The pulses were mixed in three ratios i.e. 1:1, 2:1, and 1:1:1 were cooked in water byadding a pinch of salt. It was then dried and ground uniformly and flour was prepared.The flour was obtained and subjected for biochemical analysis. The pulse varieties withtheir respective colours, used for the biochemical analysis are mentioned in Table 1, anddifferent pulse combination ratios are presented in Table 2.
The biochemical analysis of the experimental material was carried out in the ofbiochemistry research laboratory to determine various biochemical parameters. Thecontent of protein was determined by Lowr y's method (1951). Lysine content wasestimated by the method of Felker et al. (1978). Tryptophan content by Spies andChamber (1949) methods. Methionine was analysed as described by Horn et al. (1946).Cystine and Cysteine in protein hydrolysate was estimated in well ground sample by themethod of Leach (1966).
Aparna Dube, Pratibha Singh, A.B. Abidi and R. Shukla

117
RESULT AND DISSCUSSIONEssential observations on biochemical characteristics in mixed pulses after cooking
have been presented as under:
1. Protein content of mixed pulses in different ratios after cooking:
Table 2 showed protein content in the range of (21.54-23.22 per cent) in variousratios. Highest content of protein was recorded in treatment T
11 (Cicer arietinum L.:
Vigna radiata L.: Lens esculenta) followed by treatment T8 (Cicer arietinum L.: Vigna
mungo L.: Lens esculenta) and treatment T9 (Cicer arietinum L.: Lens esculenta).
Lowest protein content was found in treatment T1 (Cajanus cajan L.: Cicer arietinum
L.). All the treatments regarding protein content were found significant at different ratiosof the mixed pulses. It might be due to highest protein content found in Lens esculenta(Arkr oyd and Doughty, 1964). Mixing of Lens esculenta with Vigna radiata L. &Cicer arietinum L. has enhanced the protein content considerably. The lowest proteincontent was found in Cajanus cajan L.: Cicer arietinum L. (1:1) combination, due toinfluence of protein content available from mixing of Cicer arietinum L. because Cicerarietinum L. has got less value of protein (Arkr oyd and Doughty, 1964; Jambunathanand Singh, 1980; Srivastava et al., 1990; Hira and Chopra, 1995) mixed withCajanus cajan L. (Nwokolo, 1987; Kumar et al., 1991). There was a slight changein protein content of pulses after cooking than raw pulses. But the content of protein didnot vary significantly to their mixing.
2. Methionine content of mixed pulses in different ratios after cooking:
The data pertaining to Methionine content of mixed pulses in various ratios aftercooking have been given (Table-2). Methionine content was observed in the range of(0.77-1.36g /16gN) in various ratios. Highest content of Methionine was recorded in
Table 1 Colours and respective verities of pulses:
S. No. Name of pulses Seed colour Varieties
1. Arhar (Cajanus cajan L.) Brown NDA-1, Bahar
2. Lentil (Lens esculenta L.) Blackish brown PL-639, DPL-15
3. Urd (Vigna mungo L.) Black NDU-1, PU-19
4. Moong (Vigna radiata L.) Green NDM-1Shining green PDM-11
5. Gram (Cicer arietinum L.) Brown Pusa-256, Udai
The Allahabad Farmer Vol. LXVII, January - 2012 No. 2

118
Table-2: Protein, Methionine, Lysine, Cystine, Cysteine content of mixed pulsesin different ratios after cooking:
Tr eat- Pulse ratios Protein Methionine Lysine Cystine Cysteine Tr yptophan
ments Content Content Content Content Content Content
(%) (g/16gN) (g/16gN) (g/16gN) (g/16gN) (g/16gN)
T1
Cajanus cajan L. :Cicer arietinum L. (1:1) 21.54 1.33 5.83 2.10 0.61 0.68
T2 Cajanus cajan L. :Cicer arietinum L. (2:1) 21.80 1.32 6.12 1.65 0.62 0.71
T3 Cajanus cajan L. :Vigna mungo (1:1) 22.48 1.14 6.00 1.21 0.64 0.86
T4
Cajanus cajan L. :Vigna mungo L. (2:1) 22.84 1.12 6.16 1.29 0.63 0.73
T5
Cajanus cajan L. :Cicer arietinum L. : 22.36 1.21 5.89 1.90 0.62 0.71
Vigna mungo L. (1:1:1)
T6 Cicer arietinum L. :Vigna radiate L. (1:1) 22.64 1.36 5.67 1.92 0.58 0.61
T7
Cicer arietinum L. :Vigna radiate L. (2:1) 22.02 1.35 5.73 2.26 0.55 0.65
T8
Cicer arietinum L. :Vigna radiata L.: 23.13 1.28 5.47 1.78 0.58 0.53
Lens esculenta M. (1:1:1)
T9 Cicer arietinum L. :Lens esculenta M. (1:1) 22.93 1.17 5.34 1.47 0.55 0.56
T10 Cicer arietinum L. :Lens esculenta M. (2:1) 22.23 1.23 5.63 1.81 0.52 0.64
T11
Cicer arietinum L. :Vigna mungo : 23.22 0.77 5.48 0.48 0.60 0.65
Lens esculenta (1:1:1)
SEm ± 0.434 0.029 0.163 0.046 0.013 0.019
CD at 5% 1.279 0.084 0.481 0.136 0.040 0.057
treatment T6 (Cicer arietinum L.: Vigna mungo L.) followed by treatment T
7 (Cicer
arietinum L.: Vigna mungo L.) and T1 (Cajanus cajan L.: Cicer arietinum L.). Lowest
Methionine content was found in the treatment T11 (Cicer arietinum L.: Vigna radiata
L.: Lens esculenta). All the treatments regarding Methionine content varied significantly
Aparna Dube, Pratibha Singh, A.B. Abidi and R. Shukla

119
at different ratios of the pulses. Highest methionine in mixed treatment of Cicer arietinumL.: Vigna mungo L. have been influenced by mixing of Cicer arietinum L. and Vignamungo L. because both contain high amount of methionine (Singh, 1991) and lowestvalue might be due to less availability of methionine in Lens esculenta (Gupta and Das,1955; Gupta, 1969a, b and 1971c; Kapoor and Gupta, 1977; Gupta and Kapoor,1978). Methionine amino acid was also slightly reduced in dal after cooking as comparedto raw pulses; our results are supported by finding of Fleming and Sosulski (1977).
3. Lysine content of mixed pulses in different ratios after cooking:
The data pertaining to Lysine content of mixed pulses in various ratios after cookinghave been given in Table-2. Lysine content was observed in the range of (5.34-6.16 g/16gN). Highest content of Lysine was recorded in treatment T
4 (Cajanus cajan L.:
Vigna radata L.) followed by treatment T2 (Cajanus cajan L.: Cicer arietinum L.)
and T3 (Cajanus cajan L.: Vigna radiate L.), lowest Lysine content was found in the
treatment T9 (Cicer arietinum L.: Lens esculenta) (Milner , 1972). All the treatments
regarding Lysine content varied significantly at different ratios of the mixed pulses. Lowestcontent of lysine was found in the treatment of Cicer arietinum L.: Lens esculenta(1:1) ratio. This is only that Lens esculenta contains fairly low amount of lysine ascompared to other in present study, lysine value also decreases slightly in pulses aftercooking as compared to raw pulses mixture (Goyal and Mathews, 1985).
4. Cystine content of mixed pulses in different ratios after cooking:
Cystine content was observed in the range of (0.48-2.26 g/16gN) in various ratios.Highest content of Cystine was recorded in the treatment T
7 (Cicer arietinum L.: Vigna
mungo L.) followed by treatment T1 (Cajanus cajan L.: Cicer arietinum L.) and T
6
(Cicer arietinum L.: Vigna mungo L.). Lowest Cystine content was found in thetreatment T
11 (Cicer arietinum L.: Vigna radiata L.: Lens esculenta). All the Treatments
regarding Cystine content varied significantly at different ratios of these pulses. HighestCystine content in mixed treatment of Cicer arietinum L.: Vigna mungo L. (1:1) havebeen influenced by mixing of Cicer arietinum L. because Cicer arietinum L. containhigh amount of Cystine (Singh, 1991). Lowest value of Cystine was observed in atreatment of Cicer arietinum L.: Vigna radiata L.: Lens esculenta, it might be due tolowest value of Cystine found in Lens esculenta (Geervani and Theophilus, 1980).
5. Cysteine content of mixed pulses in different ratios after cooking:
Cysteine content was observed in the range of (0.52-0.64 g/16gN). Highest contentof Cystine was recorded in the treatment T
3 (Cajanus cajan L.: Vigna radiata L.)
The Allahabad Farmer Vol. LXVII, January - 2012 No. 2

120
followed by treatment T4 (Cajanus cajan L.: Vigna radiata L.) as well as T
5 (Cajanus
cajan L.: Cicer arietinum L.: Vigna radiata L.) both have same Cysteine content.Lowest Cysteine content was found in the treatment T
10 (Cicer arietinum L.: Lens
esculenta). Treatments regarding Cysteine content varied significantly. Highest Cysteinecontent of mixed pulses was observed in the treatment Cajanus cajan L.: Vigna radiataL. It might be due to higher Cysteine content found in Vigna radiata L. The lowestCysteine content was found in the treatment of Cicer arietinum L.: Lens esculentaratio, due to poor Cysteine in Cicer arietinum L. (Geervani and Theophilus, 1980;Singh, 1991).
6. Tr yptophan content of mixed pulses in different ratios after cooking:
After cooking, Tryptophan content was observed in the range of (0.53 - 0.86 g/16gN). Highest content of Tryptophan was recorded in the treatment T
3 (Cajanus cajan
L.: Vigna radiata L.) followed by treatment T4 (Cajanus cajan L.: Vigna radiata L.)
and T5 (Cajanus cajan L.: Cicer arietinum L.: Vigna radiata L.). Lowest Tryptophan
content was found in the treatment T8 (Cicer arietinum L.: Vigna mungo L.: Lens
esculenta). Tryptophan content varied significantly at different ratios of these pulses.Highest Tryptophan content was observed due to influence of mixing of Vigna radiataL. which has high amount of Tryptophan content as compared to Cajanus cajan L. Thelowest Tryptophan content was found in treatment Cicer arietinum L.: Vigna mungoL.: Lens esculenta. It may be due to the mixing of Lens esculenta, which has got lowTryptophan content. Gupta and Das (1955); Gupta (1969a, b and 1971c), Kapoorand Gupta (1977) and Gupta and Kapoor (1978) reported that Lens esculentaspoorest in Tryptophan content as compared to Cicer arietinum L., Cajanus cajan L.,Vigna radiata L. and Vigna mungo L..
CONCLUSIONThe investigation comprised two sets of experiments. In the first experiment various
pulses (Cajanus cajan L., Cicer arietinum L., Vigna radiata L., Vigna mungo L. andLens esculenta), used in the present study were cleaned, washed, dried in sun. In thesecond set of experiment the above pulses were mixed in three ratio's (1:1), (2:1) and(1:1:1) and dried in oven at 700C and then ground in pestle and mortar to prepare theflour. The flours of various pulses mixtures were subjected for an analysis of variousbiochemical components in terms of proteins, methionine, cystine, cysteine, lysine andtryptophan. The salient features of present finding obtained after physical and biochemicalanalysis of mixed pulses in three ratio's are summarized here. The colour of different
Aparna Dube, Pratibha Singh, A.B. Abidi and R. Shukla

121
varieties of pulses was found accordingly as NDA-1 and Bahar of Cajanus cajan L.has brown colour, PL-639 and DPL-15 of Lens esculenta contain blackish brown colour,NDU-1 and PU-19 of Vigna radiata L. was found black in colour, while NDM-1 andPDM-11 of Vigna mungo L. has green and shining green colour and lastly PUSA-256and Uday of Cicer arietinum L. contain brown colour. Highest protein content wasfound in treatment T
11 (23.22 percent) followed by treatment T
8 (23.13 percent) and T
9
(22.93 percent). Lowest protein content was found in treatment T1 (21.54 percent) at
different ratios of the mixed pulses. Highest Methionine content of mixed pulses in variousratios after cooking was found treatment T
6 (1.36 g/16gN) followed by treatment T
7
(1.35 g/16gN) and T1 (1.33 g/16gN). Lowest Methionine content was recorded in the
treatment T11
(0.77 g/16gN). Highest Lysine content of mixed pulses in various ratiosafter cooking was observed in treatment T
4 (6.16 g/16gN) followed by treatment T
2
(6.12 g/16gN) and T3 (6.00 g/16gN). Lowest Lysine content was found in the treatment
T9 (5.34 g/16gN). Maximum Cystine content of mixed pulses in various ratios in mixed
pulses after cooking was recorded treatment T7 (2.26 g/16gN) followed by treatment T
1
(2.10 g/16gN) and T6 (1.92 g/16gN). Lowest Cystine content was found in the treatment
T11
(0.48 g/16gN). Cysteine content of mixed pulses in various ratios after cooking wasrecorded maximum in treatment T
3 (0.64 g/16gN) followed by treatment T
4 (0.63 g/
16gN) and T2 as well as T
5 both have same Cysteine content (0.62 g/16gN). Lowest
Cysteine content was found in the treatment T10
(0.52 g/16gN). Maximum Tryptophancontent of mixed pulses various ratios after cooking was recorded in treatment T
3 (0.86
g/16gN) followed by treatment T4 (0.73 g/16gN) and T
2 and T
5 (0.71 g/16gN). Lowest
Tryptophan content was found in the treatment T8 (0.53 g/16gN).
Hence, it is recommended that the dal prepared from the mixture of Cicer arietinumL.: Vigna radiata L.: Lens esculenta (1:1:1) (T
11) ratio of all component were superior
to supply of protein and combination of Cajanus cajan L.: Vigna radiata L. (1:1) wasgood for supplying Tryptophan, Lysine and Cysteine content. While Cicer arietinum L.:Vigna mungo L. (2:1) was superior in Cystine and Methionine.
REFERENCESAjewole K., (2002). Investigation into the lesser known Pulse - Canavalia ensiformis:
Chemical composition and Fatty acid profile. The Journal of Food Technology inAfrica Vol. 7 No. 3, 2002, pp. 82-84.
Arinathan, V., V.R. Mohan, A. Maruthupandian and T. Athiperumalsami, (2009).Chemical Evaluation of Raw Seeds of Certain Tribal Pulses in Tamil Nadu,India. Tropical and Subtropical Agroecosystems, 10: 287 - 294.
The Allahabad Farmer Vol. LXVII, January - 2012 No. 2

122
Ar ora P., Ghugre P., Udipi S., (2004) Nutrient dense mixes for enteral feeding inIndia, Nutrition & Food Science, Vol. 34 Iss: 6, pp.277 - 281
Ar ora, S.K. (1982). Chemistry and Biochemistry of Legumes, Nutritive Value of FoodLegumes. Oxford and IBH Publishing Co. Janpath, New Delhi, pp. 288.
Aykr oyd, W.R. and Doughty, J. (1964). Legume in Human Nutrition, F.A.O. NutritionalStudies. 19, F.A.O., Rome.
Fathima, K.R. and V.R. Mohan, (2009). Nutritional and Antinutritional Assessmentof Mucuna atropurpurea DC: An Underutilized Tribal Pulse. African J. of Basic& Appl. Sci., 1 (5-6): 129-136.
Felker, C.; Libanuskas, C.K. and Wainer, G. (1978). Crop Science. 18 (3):489-490.
Fleming, S.E. and Sosulski, F.W. (1977). Nutritive value of bread fortified withconcentrated plant protein and lysine. Cereal Chem. 54(6): 1238-1248
Geervani, P. and Theophilus, F. (1980). Effort of home processing on the nutrientcomposition of certain high yielding legume varieties. The Ind. J. Nutr. Dietet.17(12): 443.
Goyal, M. and Mathews, S. (1985). A study of the effect of cooking on protein, lysine,tryptophan and sugar content of cereals and pulses with special reference tocereal pulses reference to cereal pulse combination preparation. The Ind.J. Nutr. Dietet. 22(3): 73.
Gupta, Y.P. (1969a). Improving the quality and quantity of protein through geneticmanipulation. Symp. on New trends in Agriculture. I.C.A.R. Kanpur, pp. 18-19.
Gupta, Y.P. (1969b). Protein quality of pulses. Proc. Third annual work shop conferenceon pulse crop by I.C.A.R. New Delhi, p. 157.
Gupta, Y.P. (1971c). Influence of genetic factor on the quality and quantity of proteinsin cereals and pulses. First Asian Congress of Nutrition, ResearchCommunications, Hyderabad, p.10.
Gupta, Y.P. and Das, N.B. (1955). Amino acid content of pure strains of Indian Pulses.I. Methionine, Cystine and tryptophan. Ann. Biochem. 15: 75-78.
Aparna Dube, Pratibha Singh, A.B. Abidi and R. Shukla

123
Gupta, Y.P. and Kapoor, A.C. (1978). Potential of soybean for human consumption.Indian Fmg. 27: 10-12.
Hira, CK, Chopra, N. (1995). Effects of roasting on protein quality of chickpea (Cicerarietinum) and peanut (Arachis hypogaea). Journal of Food Science andTechnology, 32: 501-503.
Horn, J.M.; Jones, D.B. and Blum, A.E. (1946). Colorimetric determination ofmethionine in protein and foods. J. Biol. Chem. 1(16): 313.
Jambunathan, R. and U. Singh, (1980). Studies on Desi and Kabuli chickpea (Cicerarietinum) cultivars. In Proceedings of the International Workshop on ChickpeaImprovement. ICRISAT, Hydrabad, India, 28 February to 2 nd March, 1979.
Kapoor, A.C. and Gupta, Y.P. (1977). Distribution of nutrients in the anatomical partsof soybean seed and different phosphorus compounds in the seed and its proteinfraction. Indian J. Nutr. and Dietet. 41: 100-107.
Kumar, S, Kumar, S, Singh, GK, Kumar, R, Bhatia, NK, Aswathi, CP. (1991):Variation in quality trait of pigeonpea (Cajanus cajan Mill sp.) varieties. Journalof Food Science and Technology, 28: 173-174.
Leach, S.J. (1966). A laboratory manual of analytical method of protein chemistry(P. Alexander and H.P. Lundgren Ed.) Pergamon Press, Oxford. 4: 1.
Lowr y, O.H.; Roserbrough, N.J., Farm, A.L. and Randall, R.J. (1951). Proteinmeasurement with folin phenol reagent, J. Bio. Chem., 193: 265-275.
Milner , M. (1972). Nutritional improvement of food legumes by breeding. Proceedingsof a symposium sponsored by Protein. Advisory Group of United Nations System,New York.
Nwokolo, E., (1987). Nutritional evaluation of pigeon peas meal. Pl. Food. Hum. Nutri.,37: 283-290.
Singh, U., Subrahmanyam, N. and Kumar, J. (1991), Cooking quality and nutritionalattributes of some nely developed cultivars of chickpea (Cicer arietinum). Journalof the Science of Food and Agriculture, 55: 37-46. doi: 10.1002/jsfa.2740550106
Spies, J.T. and Chamber, D.C. (1949). Chemical determinate ion of tryptophan inprotein. Anally. Chem. 21: 1249.
Srivastava, PP, Das, K, Prasad, S. (1990). Effect of roasting process variables on invitro protein digestibility of bengalgram, maize and soybean. Food Chemistry, 35:31-37.
The Allahabad Farmer Vol. LXVII, January - 2012 No. 2

124
Effect of Bean common mosaic virus infection on yieldof Hyacinth bean (Lablab purpureus L.)
Manisha Srivastavattttt, U.P. Guptal and Asha Sinhannnnn
ABSTRACT
In present experiment the effect of Bean common mosaic virus on yield of
Hyacinth bean has been studied. Observation made on the Plant height, weight
of leaves, weight of stem and weight of root, number of pods/plant, weight of
pod/plant, number of seeds/pod and weight of 100-seeds. The result showed
reduction in the Plant height, weight of leaves, weight of stem and weight of
root, number of pods/plant, size of pod (length and breadth), weight of pod/
plant, number of seeds/pod and weight of 100-seeds was more in early-inoculated
plants than the mid and late inoculated ones. Disease index was recorded
maximum in early-inoculated plants, then mid inoculated and minimum in late
inoculated plants respectively.
Key words: BCMV, Dolichos lablab, Fruit, Inoculation, Leguminous vegetable,Reduction.
INTRODUCTIONHyacinth bean is a dual purpose (human food and animal feed) legume. Flowers
and immature pods also used as a vegetable. Hyacinth bean can produce valuablesupplemental quality protein along with vitamins and minerals. As a legume crop it haspotential to enrich soil. Bean common mosaic virus can infect beans and many otherlegumes. Bean common mosaic virus is seed borne and efficiently transmitted by severalaphid species. Moderate and severe bean common mosaic viruses caused 50% and60% reduction in number of pods per plant respectively and seed yield showed loss by53% and 58% (Hampton, 1975).
tttttResearch Scholar, lAssociate Professor, nnnnnProfessorttttt,lDepartment of Botany, Harish Chandra P.G. College, Varanasi-221001, U. P., India.nnnnnDepartment of Mycology and Plant Pathology, Institute of Agriculture Sciences, B.H.U., Varanasi-221005.U. P. India.
The Allahabad Farmer Vol. LXVII, January - 2012 No. 2

125
Yield loss in urd bean (Vigna mungo) infected with mung bean yellow mosaic virusobserved by (Vohra and Beniwal, 1979; Gupta, 2003). Singh and Srivastava (1985)reported that Urd bean mosaic virus reduced the number of pods/ plant, Seed/pod andgrain weight in urd bean with higher reduction in early-inoculated plants. Bashir, Mughaland Malik (1991) assessed yield losses due to leaf crinkle virus in Urd bean (Vignamungo L. Hepper). Infection with ULCV reduced plant height by 8% decreased thenumber of pods per plant by 90% and decreased pod length and the number of seeds perpod by 18 and 26% respectively. On an average, yield loss per plant was 81% comparedwith uninfected plant.
Different cultivars of mung bean and stages of the crop at the time of infectionshowed different yield parameters when the plants were subjected to yellow mosaicvirus infection was found by (Yadav and Brar, 2005; Singh and Awasthi, 2007;Yadav and Brar, 2010). Hashmathunnisa Begam and Madhusudan (1989) foundreduction in the number of flowers/plant and also higher yield in healthy seeds, in clusterbean mosaic virus infection of cluster bean plants. Verma et al. (2004) observed 70-90% yield loss per plant in soybean infected with Peanut Bud necrosis Tospovirus(PBNV).
Yield of any commercially important crop is one of the most essential factors to beconsidered while making any wide range cultivation. Therefore, the present experimentwas planned with a view to study the effect of Bean common mosaic virus on the yieldlosses in Hyacinth bean under field condition.
MATERIALS AND METHODThis experiment was conducted during July 2009 to February 2010 in Institute of
Agricultural Sciences, Banaras Hindu University, Varanasi. It was observed during presentinvestigation that there were major constraints in increasing the production and widespread cultivation of Hyacinth bean crop due to severity of Bean common mosaic virusinfection in Varanasi and adjoining places in eastern U.P. Hyacinth bean was grown inexperimental fields, which had sandy loam soil. The plants were inoculated with theinfective sap of Bean common mosaic virus using 600 mesh Carborundum powder as anabrasive. The plants were early inoculated (15 days), mid inoculated (45 days) and lateinoculated (75 days) with Bean common mosaic virus. The healthy plants were treatedsimilarly by using phosphate buffer solution. 0.1 percent Malathion solution was sprayedonce in every week to control insect infection. Watering of the plants was done regularlyonce in a week. Following observations were made regularly.
Manisha Srivastava, U.P. Gupta and Asha Sinha

126
1. Plant height
2. Weight of leaves
3. Weight of stem
4. Weight of roots
5. Number of pods (fruits) / plant
6. Weight of pods / plant
7. Number of seeds / plant
8. Weight of seeds (100)
The percentage of yield loss due to viral infection was determined using the followingformula of (Dereje, 1993). Statistical analysis has been done by following formula
t =Difference between two means
Standard error of their difference
= X1 - X2
√ (SE1)2 + (SE2)2
Where,
t is 't' test of significance
X1 = means of observations of 1st case
X2 = means of observations of 2nd case
SE = Standard error
RESULTS AND DISCUSSIONIt was observed that BCMV infection decreased the Plant height, weight of leaves,
weight of stem and weight of root in (Table 1), (Plate I) and number of pods/plant,weight of pod/plant (Plate II), number of seeds/pod and weight of 100-seeds in (Table2), (Plate III) in comparison to their healthy counterparts.
Table 1 representing effect of BCMV infection in plant height and fresh weightand dry weight of plant has been observed. Yield loss ranged from 3.66% to 42.424% inplant height. Maximum yield loss occurred in weight of stem (78.764%), followed byweight of leaves (63%) and weight of root (51.038%) on fresh weight basis and weightof stem 71.923%, Weight of leaves 58.474% and weight of roots 49.561% on dry weightbasis respectively.
The Allahabad Farmer Vol. LXVII, January - 2012 No. 2

127
Manisha Srivastava, U.P. Gupta and Asha Sinha
Table 1: Effect of BCMV infection at different periods on Plant height and weightin Hyacinth bean plant
Parameters Days after Healthy Diseased % Yield t value atinoculation loss 5% level of
significance
Plant height EI 13.2 7.6 42.424 0.786
(cm.) MI 89.0 52.8 40.674
LI 110.2 69.8 36.660
Fresh weight
Weight of EI 1.238 0.458 63 5.634
leaves (g.) MI 1.595 0.600 62.382
LI 1.748 0.701 59.897
Weight of EI 2.364 0.502 78.764 0.705
stem (g.) MI 2.402 0.560 76.686
LI 2.695 0.799 70.352
Weight of EI 0.337 0.165 51.038 8.182
roots (g.) MI 0.395 0.210 46.835
LI 0.410 0.226 44.878
Dry weight
Weight of EI 0.944 0.392 58.474 6.0
leaves (g.) MI 1.127 0.479 57.497
LI 1.259 0.570 54.726
Weight of EI 1.617 0.454 71.923 8.872
stem (g.) MI 1.790 0.550 69.273
LI 2.046 0.696 65.982
Weight of EI 0.228 0.115 49.561 5.4
roots (g.) MI 0.235 0.132 43.829
LI 0.285 0.176 38.245
EI = Early inoculationMI = Mid inoculationLI = Late inoculation

128
Table 2 representing effect of BCMV infection on pod and seed of Hyacinth beanplant. In number of pod/plant yield loss ranged from 40% to 66.666%. Weight of pod/plant ranged from 53.504% to 68.009%. In number of seeds/plant yield loss ranged from33.333 to 60%. Weight of 100 seeds ranged from 79.069% to 87.474%. Yield loss washigher in early-inoculated plants than the mid and late inoculated ones.
Disease index was recorded maximum 77.78% in early inoculated plants, then midinoculated that was 55.56% and minimum was 33.33% in late inoculated plantsrespectively.
Statistical analysis representing the observed value of 't' for (Plant height, weight ofstem on fresh weight basis, number of pods/plant, weight of pod/plant and number ofseeds/plant) is less than 2.776, the value of 't' at 5% level of significance for 4 degree offreedom, it is proved to be non - significant and testing is reliable. The value of 't' for(fresh and dry weight of leaves, dry weight of stem and fresh and dry weight of rootsand weight of 100 seeds) which, being greater than 2.776, the value of 't' at 5% level ofsignificance for 4 degree of freedom, is proved to be significant. Therefore, the conclusionis that the two treatments differ from each other significantly.
Diseased (Left side) and Healthy Plants (Right side) of Hyacinth beanPlate I
The Allahabad Farmer Vol. LXVII, January - 2012 No. 2

129
Healthy (above) and Diseased (below) pods of Hyacinth beanPlate II
Table 2: Yield of Hyacinth bean at different periods of BCMV infection.
Parameters Days after Healthy Diseased loss t value atinoculation % Yield 5% level of
significance
No. of EI 6 2 66.666 1.765pods/plant MI 13 5 61.538
LI 15 9 40
Weight of EI 20.412 6.530 68.009 2.285pod/ plant (g.) MI 30.513 13.5 55.756
LI 44.060 20.486 53.504
No. of EI 5 2 60 1.622seeds/plant MI 7 3 57.141
LI 9 6 33.333
Weight of EI 39.92 5 87.474 23.402100 seeds MI 41 7 82.926(g.) LI 43 9 79.069
EI = Early inoculation
MI = Mid inoculation
LI = Late inoculation
Manisha Srivastava, U.P. Gupta and Asha Sinha

130
It was observed that BCMV infection had significantly reduced the Plant height,weight of leaves, weight of stem and weight of root in (Table 1) and number of pods/plant, weight of pod/plant, number of seeds/pod and weight of 100-seeds in (Table 2).
A greater reduction in these yield parameters were observed in the early-inoculatedplants as compared to late inoculated ones. These findings are coherent with findings ofother workers in different host-virus combinations. Matthews (1970), Gupta (1977),Singh et al. (1983) and Singh and Srivastava (1985) found that the yield loss wasvery high in early infection of the hosts.
Bashir et al. (1991) reported yield in Urd bean plants infected with Urd bean leafcrinkle virus. Infection with ULCV reduced plant height by 8%, decreased the numberof pods per plant by 90% and decreased pod length and number of seeds per pod by 18and 26 percent respectively. Mishra et al. (1994) also obtained similar results with Urdbean cv. T-9 infected with ULCV. Yield loss in urd bean (Vigna mungo) infected withmung bean yellow mosaic virus observed by (Gupta, 2003). Yadav and Brar (2005,2010) also reported that yield attributes in mungbean decreased with increased level ofMungbean yellow mosaic India virus on yield parameters viz., plant height, number ofseeds/pod and seed yield/plant.
Healthy (above) and Diseased (below) seeds of Hyacinth beanPlate III
The Allahabad Farmer Vol. LXVII, January - 2012 No. 2

131
The growth and yield of the buffer inoculated control plants were significantlyhigher than those of the virus inoculated plants in Cowpea with viral interactions. Inoculationof plants at an early age of 10 DAP resulted in more severe effect than inoculations at alater stage of 30 DAP. The average values of plant height and number of leaves producedby plants inoculated 30 DAP were higher than those produced by plants inoculated 10DAP (Kar eem and Taiwo, 2007).
Ladhalakshmi et al. (2004) reported complete yield loss (100%) in black graminfected with tobacco streak virus. Similarly, Verma et al. (2004) observed considerablereduction in plant height, number of pods and number of nodules in Soybean infectedwith Peanut bud necrosis virus (PBNV). Virus infection affects the yield by reducing thephotosynthetic rate or by enhancing respiration. But a cumulative effect of both of thesefactors seems to be the most plausible cause.
REFERENCES
Bashir, M.; Mughal, S.M. and Malik, B.A. (1991). Assessment of yield losses dueto leaf crinkle virus on urd bean (Vigna mungo L.) Hepper J. Pakistan Jr.of Botany, 23 (1): 140 - 142.
Dereje, G. (1993). Yield loss of faba bean caused by foot rot Fusarium avenaceaum.FABIS News letter., 33: 24- 27.
Gupta, A.K. (1977). Effect of Bean common mosaic virus infection on metabolism,cytology and crop yield of Frenchbean (Phaseolus vulgaris L.). Ph.D. Thesis,Univ. of Gorakhpur, U.P., India.
Gupta, O. (2003). Resistance to mungbean yellow mosaic virus, phenotypic charactersand yield components in urdbean. Indian Phytopath., 56: 110-111.
Hampton, R.O. (1975). The nature of bean yield reduction by bean yellow and beancommon mosaic viruses. Phytopathology, 65: 1342-1346.
Hashmathunnisa, Begam and Madhusudan, T. (1989). Effect of mosaic virusinfection on growth and yield of cluster bean. Indian Journal of MycologicalResearch, 27 (2): 191 - 194.
Kar eem, KT and Taiwo, M.A. (2007). Interactions of viruses in Cowpea: effects ongrowth and yield parameters. Virology Journal, 4: 15.
Manisha Srivastava, U.P. Gupta and Asha Sinha

132
Ladhalakshmi, D.; Ramiah, M.; Ganapathu, T.; Khabbaz, S.E.; Sajeena, A.;Suanthi, C.; Sarvana Kumar, D. and Karunakarun, S. (2004). Effects of AVPS
(Antiviral proteins) against Tobacco streak virus (TSV) causing necrosis diseasein Blackgram. Nat. Sym. On Molecular Diagnostics for the managementof viral diseases. 14 - 16 Oct., 2004, IARI, New Delhi, P. 82 (Abstr.).
Matthew, R.E.F. (1970). Plant Virology. Academic Press, New York, 778.
Mishra, A.; Gohel, V.R. and Patel, J.G. (1994). Extent of seed transmission of urdbean leaf crinkle virus in Gujarat. Gujarat Aric. Univ. Research Jr., 19 (2):130-132.
Singh A.K. and Srivastav, S.K. (1985). Effect of urd bean mosaic virus infectionon the yield and chemical composition of urd bean fruits. Indian Phytopatholoy,38 (1): 85 - 89.
Singh, B.R.; Singh, M. and Yadav, M.D. (1983). Estimation of yield losses in soybeandue to yellow mosaic. Madaras Agricultural Journal, 70 (5): 312- 315.
Singh, S. and Awasthi, L.P. (2007). Effect of mungbean yellow mosaic virus infectionon growth and yield attributes of mungbean. New Botanist, 34: 35-39.
Verma. K.P.; Dantre, P.K.; Toorray, N.K. and Thakur, M.P. (2004). Effect ofdate of sowing and varieties on incidence of Bud Blight of soybean. Nat. Sym.On molecular diagnostics for the management of viral diseases. 14 - 16th Oct.2004, IARI, New Delhi, Page 74 (Abstr.).
Vohra, K. and Beniwal, S.P.S. (1979). Effect of mungbean yellow mosaic viruson yield and seed quality of urd bean (V. mungo). Seed Research, 7: 168 - 174.
Yadav, M.S. and Brar, K.S. (2005). Screening of Vigna radiata genotypes againstmungbean yellow mosaic virus and estimation of yield losses. Pl. Dis. Res.,20: 90.
Yadav, M.S. and Brar, K.S. (2010). Assessment of yield losses due to mungbeanyellow mosaic India virus and evaluation of mungbean genotypes for resistancein South - West Punjab. Indian Phytopath., 63 (3): 318-320.
The Allahabad Farmer Vol. LXVII, January - 2012 No. 2

133
tttttStudent MPH 1st YeartttttCentre for Public Health, Centre for Emerging Areas in Science and Technology, Panjab University,Chandigarh
Cross - Sectional study assessing obesity and dietarypattern of student at Panjab University, Chandigarh
Ranjan Hemangittttt, Sethi Swatittttt
ABSTRACT
Obesity is the most alarming word in today's society, be it India or other parts of
the world. Obesity results from excessive calorie intake that body doesn't need.
Genetic, environmental, behavioral factor along with the most important factors
like sedentary lifestyle and poor diet are associated with the onset of obesity. It
affects all age groups, genders and races. Therefore, the present study reports
the prevalence of obesity and dietary pattern in students of Panjab University.
The Objectives of our study were to assess the dietary pattern in the students of
Panjab University and; to assess the obesity pattern in the students of Panjab
University with tools like body mass index (BMI) and Index of Central Obesity
(ICO). For this a random sample of 50 students in the age group 20 - 30 years was
taken and a pre-structured questionnaire was designed to determine the dietary
pattern of the students of Panjab University during the period from month of
December along with the anthropometric measurements like weight and height
were taken of each subject. Results showed that 14% of the respondents were
Underweight, 68% were Normal, 16% were Overweight and 2% were Obese.
Although, out of 50 students, 76% were found to be having higher than normal
calorie intake, only 28% were found to be Obese. Out of 27 females, 3.7% was
found to be Obese even if the Calorie Intake was normal, whereas, 55% females
were found to be within normal limits of BMI with high Calorie Intake. Out of 23
Males, 4.34% was found to be Obese even if the Calorie Intake was normal,
whereas, 47.82% males were found to be within normal limits of BMI with high
Calorie Intake.
The Allahabad Farmer Vol. LXVII, January - 2012 No. 2

134
INTRODUCTIONObesity is a medical condition in which excess body fat has accumulated to the
extent that it may have an adverse effect on health, leading to reduced life expectancyand/or increased health problems. Obesity increases the likelihood of various diseases,particularly heart disease, type 2 diabetes, breathing difficulties during sleep, certaintypes of cancer, and osteoarthritis. Obesity is most commonly caused by a combinationof excessive dietary calories, lack of physical activity, and genetic susceptibility, althougha few cases are caused primarily by genes, endocrine disorders, medications or psychiatricillness. Evidence to support the view that some obese people eat little yet gain weightdue to a slow metabolism is limited; on average obese people have a greater energyexpenditure than their thin counterparts due to the energy required to maintain an increasedbody mass. The World Health Organization (WHO) predicts that overweight and obesitymay soon replace more traditional public health concerns such as under-nutrition andinfectious diseases as the most significant cause of poor health. Obesity is a public healthand policy problem because of its prevalence, costs, and health effects. In addition to itshealth impacts, obesity leads to many problems including disadvantages in employmentand increased business costs. These effects are felt by all levels of society from individuals,to corporations, to governments. Although obesity was initially most visible in developedcountries, principally the United States, it gained traction in many developing countriesduring a time when concern about malnutrition remained dominant. As developing countrieshave become wealthier, adopted increasingly Westernized lifestyles characterized byincreases in energy intake and reductions in energy expenditure and witnessed massivemigration from rural to urban areas, obesity inevitably followed in the wake of thesedevelopments. Because obesity has been linked to numerous chronic conditions and iscostly to societies, the spectre of increases in the prevalence of obesity carries potentiallyserious implications for the future health of populations and health care expenditures ofcountries.
MATERIALS AND METHODSRandom sample of 50 students in the age group 20 - 30 years was taken by convenient
sampling method and a pre-structured questionnaire was designed to determine the 24-hour dietary pattern of the students of Panjab University during the period in month ofDecember along with the anthropometric measurements like weight and height weretaken of each subject. For measuring height of the students, a standard anthropometerwas used and for measuring weight of the students a standardized weighing machine
Ranjan Hemangi, Sethi Swati

135
was used. Both the instruments were standardized timely to avoid any instrumental errors.Total daily calorie intake was calculated by addition of calorific values of various fooditems and deducting the calories expended during any form of physical exercise. Thestandards of calorific values of food items and the energy expenditure were taken fromDietary Guidelines for Indians by ICMR, Hyderabad. According to RecommendedDietary Intake for Indians by ICMR , New Delhi, students were divided into those havingnormal calorie intake and those having high calorie intake, as given below -
Males Females
Normal Calorie Intake <=2425 <=1875
High Calorie Intake >2425 >1875
The practical and clinical definition of Obesity is based on Body Mass Index [BMI= Weight (kgs) /Height (m2)]. The critical limits of BMI WHO, 1998, were utilized-
Underweight < 18.5
Normal range 18.5-24.9
Overweight 25.0-29.9
Obese (Grade I) 30.0-34.9
Obese (Grade II) 35.0-39.9
Obese (Grade III) >= 40
To assess the risk of developing Non - Communicable diseases in obese subjects,Index of Central Obesity (ICO) by Parikh, was taken [ICO= Waist Circumference(cm)/Height (cm)]. The limits for ICO are -
ICO for Males - 0.54
ICO for Females - 0.52
The Allahabad Farmer Vol. LXVII, January - 2012 No. 2

136
Fig.2. Dietary and Obesity Pattern in males and females in frequency
Fig.1. Frequency Distribution of respondents as per Body Mass Index
Ranjan Hemangi, Sethi Swati

137
RESULTS AND DISCUSSIONSample size was 50 (Males = 23, Females = 27) with Mean Age Group of 23.8.
Percentage of the respondents who belonged to upper socioeconomic class was 52%while the rest were in upper middle class. The Mean BMI was found to be 22.2 and theMean ICO was 0.48. Although, out of 50 students, 76% were found to be having higherthan normal calorie intake, only 28% were found to be Obese. Out of 27 females, 3.7%were found to be Obese even if the Calorie Intake was normal, whereas, 55% femaleswere found to be within normal limits of BMI with high Calorie Intake. Out of 23 Males,4.34% was found to be Obese even if the Calorie Intake was normal, whereas, 47.82%males were found to be within normal limits of BMI with high Calorie Intake. Resultsshowed that 14% of the respondents were Underweight, 68% were Normal, 16% wereOverweight and 2% were Obese. According to ICO, 4% males and 10% females wereat risk of developing lifestyle diseases later in life.
The results above show more prevalence of obesity in the females. This relateswith the, Wang and Beydoun's detailed characterizations of variations in prevalenceand, in some cases, trends by gender, age, socioeconomic status, race/ethnicity, place ofbirth, and geography identify high-risk subgroups within the United States.
There are various kinds of factors that lead to obesity. These include geneticproblems, heredity and other ailments. Most of these causes are due to hormones andnot eating habits. But one of the most influential factors of obesity is calories. The caloriesconsumed by the body depend on the metabolic rate of the body and related internalfactors. But the calories which are consumed through food into the body are totallydependent on the diet of a person.
There are many people who continue to remain slim and trim in spite of eatingtwice as compared to someone else who is overweight or obese, even though their foodconsumption may be less. This factor is one of the main reasons for which the caloriesconsumed by the body should be regulated. If the metabolism rate of an individual is slowthen the chances of burning high calorie food will be restricted. Hence the person shouldeat foods which have lower calorie counts but include all the other ingredients which arerequired by the body. This is demonstrated in the results above that despite having a highcalorie intake; some of the respondents have normal BMI while the others are obesedespite having a normal calorie intake. The findings are also supported by a study presentedin May 2009 at the European Congress on Obesity which is the first to examine thequestion of the proportional contributions to the obesity epidemic by combining metabolic
The Allahabad Farmer Vol. LXVII, January - 2012 No. 2

138
relationships, the laws of thermodynamics, epidemiological data and agricultural data.The researchers found that in children, the predicted and actual weight increase matchedexactly, indicating that the increases in energy intake alone over the 30 years studiedcould explain the weight increase. For adults, they predicted that excess food intake stillexplains the weight gain, but that there may have been increases in physical activity overthe 30 years that have blunted what would otherwise have been a higher weight gain.The genetic predisposition is explained by Wang and Beydoun who quantify a possiblefuture scenario for obesity in the US population. They project that 75 percent of adultswill be overweight (body mass index >25 kg/m2) or obese (body mass index >30 kg/m2)and that 41 percent will be obese by 2015. Projections for children and adolescents arethat the body mass index levels of one in four will be at or above the 95th referencepercentiles. Childhood obesity causes morbidity during childhood and predisposes to obesityin adulthood.
Being slim or overweight depends on the pattern in which the body receives anduses carbohydrates, protein and fat calories. It should be noted that not all people reactto the same food in the same manner. There had been a series of tests conducted involvingthis matter and the reaction of the body, to the number of calories consumed, depends onthe quantity of each type of calorie which is consumed by the body each day. This is alsoone of the main reasons that childhood obesity is not different from adult obesity.
Hence calories have a direct impact on obesity as demonstrated in the SystemicReview by Vasanti S Malik, Matthias B Schulze and Frank B Hu which includedthirty studies. Of these, 15 were cross-sectional, 10 were prospective cohorts, and 5were experimental. Most of the cross-sectional studies, especially the large ones, founda positive association between the consumption of sugar-sweetened beverages and bodyweight. Three prospective studies that included repeated measures of both soft drinksand weight found that an increase in the consumption of sugary soft drinks was significantlyassociated with greater weight gain and greater risk of obesity over time in both childrenand adults. Similarly, George A Bray, Samara Joy Nielsen and Barry M Popkin intheir study propose that the introduction of High-Fructose Corn Syrup and the increasedintakes of soft drinks and other sweetened beverages have led to increases in totalcaloric and fructose consumption that are important contributors to the current epidemicof obesity.
Again it should be remembered that starving or not having food is not the solutionto the problem of obesity. It will only aggravate the problem further because the body
Ranjan Hemangi, Sethi Swati

139
starts to deposit more fat as a defense mechanism to the starvation period. Hence it isessential that the body gets a diet which includes all the required food nutrients at frequentintervals.
Eating frequently, but consuming foods which are lower in calories helps to improvethe metabolism of the body. The body stops to deposit fat in its store and uses up thelower calorie foods and converts the same into energy.
CONCLUSIONIt was concluded that, though 38, i.e. 76%, students out of the sample of 50 have
higher than normal calorie intake; only 14, i.e. 28%, of them are obese. Thus, obesitycannot be attributed alone to the high calorie intake. There must be some other factorscontributing to obesity, such as genetic predisposition, sedentary lifestyle, alcoholconsumption and the like. In the present study, there are no results showing any associationbetween these factors and obesity. Obesity is now considered the most prevalent nutritionaldisease of young adults. However, data on the relationships between patterns of eatingand obesity are sparse. Several epidemiologic studies have attempted to relate nutrientintakes with obesity, but the results have been disappointing. One limitation withepidemiologic surveys examining the role diet and eating patterns in obesity is the highlyinterrelated nature of dietary exposures. Thus, it is often difficult to distinguish theindependent effects of nutrients, foods, or even specific eating patterns on weight status.
REFERENCES
Doucet E, Tremblay A. Food intake, Energy Balance and Body Weight Control. EuropeanJournal of Clinical Nutrition; 1997; 51: 846-55.
Earl S. Ford, Ali H . Mokdad. Epidemiology of Obesity in the Western Hemisphere.The Journal of Clinical Endocrinology & Metabolism 93; 11.
Freedland SJ, Platz EA. Obesity and prostate cancer: making sense out of apparentlyconflicting data. Epidemiol Rev 2007; 29:88-97.
George A Bray, Samara Joy Nielsen, Barry M Popkin. Consumption of high-fructosecorn syrup in beverages may play a role in the epidemic of obesity. AmericanJournal of Clinical Nutrition, Vol. 79, No. 4, 537-543, April 2004
Hill JO . Understanding and Addressing the Epidemic of Obesity: An Energy BalancePerspective. Endocrine Review; 2006; 27: 750-61.
The Allahabad Farmer Vol. LXVII, January - 2012 No. 2

140
ICMR (1990). Recommended Dietary Intakes for Indians, New Delhi.
ICMR (1998). Dietary Guidelines for Indians, National Institute of Nutrition, ICMR,Hyderabad.
Jakobsen MU, Berentzen T, Sørensen TIA, et al. Abdominal obesity and fattyliver. Epidemiol Rev 2007;29:77-87.
Kelishadi R. Childhood overweight, obesity, and the metabolic syndrome in developingcountries. Epidemiol Rev 2007;29:62-76.
McLar en L. Socioeconomic status and obesity. Epidemiol Rev 2007;29:29-48.
Musaad S, Haynes EN. Biomarkers of obesity and subsequent cardiovascular events.Epidemiol Rev 2007;29:98-114.
Rakesh M Parikh, Shashank R Joshi, Padmavathy S Menon, Nalini S Shah.Index of Central Obesity - A novel parameter. Medical Hypotheses 2007;68: 1272-1275
Smelser JN, Wilson WJ,Mitchell F. Vol 1. Washington, DC: National AcademiesPress; 2001. America becoming: racial trends and their consequences.
Vasanti S Malik, Matthias B Schulze and Frank B Hu. Intake of sugar-sweetenedbeverages and weight gain: a systematic review. American Journal of ClinicalNutrition, Vol. 84, No. 2, 274-288, August 2006
WHO . Obesity : Preventing and Managing the Global Epidemic. Geneva : WHO, 1998
WHO . Report of a WHO Consultation. Geneva, Switzerland: World Health Organization;2000. Obesity: preventing and managing the global epidemic. (WHO technicalreport series 894).
WHO Expert Consultation. Appropriate body-mass index for Asian populations andits implications for policy and intervention strategies. Lancet 2004; 363:157-63.Erratum in: Lancet 2004; 363:902.
Wang Y, Beydoun MA. The obesity epidemic in the United States-gender, age,socioeconomic, racial/ethnic, and geographic characteristics: a systematic reviewand meta-regression analysis. Epidemiol Rev 2007; 29:6-28.
Yang W, Kelly T,He J. Genetic epidemiology of obesity. Epidemiol Rev 2007;29:49-61.
Ranjan Hemangi, Sethi Swati
izksQslj jktsUnz ch0 yky] dqyifrizksQslj jktsUnz ch0 yky] dqyifrizksQslj jktsUnz ch0 yky] dqyifrizksQslj jktsUnz ch0 yky] dqyifrizksQslj jktsUnz ch0 yky] dqyifrProf. Rajendra B. Lal, Vice-ChancellorPh.D. Soil Science (Kansas State, U.S.A.)P.D.F. Soil Environmental Quality(Kansas State U.S.A.)Ph.D. Ag. Botany (India)FISAC, GAMMA SIGMA DELTA Scholar
Office : 91-0532-2684284, 2684290
Fax : 91-0532-2684593
E-Mail : [email protected]
Website : www.shiats.edu.in
Estab l i shed 1910
PREFACE
The Allahabad Farmer (A Journal of Agricultural Science and Technology) anofficial Journal of Allahabad Agricultural Institute-Deemed University was for thefirst time published in the year 1925. Thus it is the foremost and pioneering Journalof Agricultural Science and Technology in India. Perhaps we can mention that it isone of the oldest journal of Agricultural research in whole of Asia.
This is an important publication with all aspects of agricultural rural life,educational research and appropriate technology research, applied to sustainableAgricultural production. This journal is dedicated to farm life development with avision of "Feed the hungry" as commanded to the founders of the Institute by ourLord Jesus Christ. Feed the hungry does not only mean to acquire and supply thefood to the hungry people but it means to disseminate the latest technology ofAgriculture to the farmers in order to enable them to produce more food. The objectivesof the journal are to further the work and interest of Agricultural research and scientistsand to facilitate cooperation among them through research, to foster scientific honourin order to improve the effectiveness of Agricultural sciences, human resourcedevelopment and welfare through technology, to enhance public understanding throughAgriculture news and to appreciate the importance of innovation and creativenessthrough agreed highlights. The Allahabd Farmer is a forum for preservation andreviewing of burning issues pertaining to the advancement of sustainable Agricultureon planet earth.
With all good wishes.Sincerely
Prof. (Dr.) Rajendra B. LalEditor-in-Chief
The Allahabad Farmer(A Journal of Agricultural Science and Technology)
lSe fgfXxuckWVe baLVhV~;wV vkWQ ,xzhdYpj] VsDukWykWth ,.M lkbalst+Sam Higginbottom Institute of Agriculture, Technology & Sciences
(A Chris t ian Univers i ty of Rural Life)Allahabad - 211 007 U.P. India

EDITORIAL BOARD
Editor-in-ChiefRajendra B. Lal
Managing EditorArif Albrecht Broadway
Technical EditorsH. Shepherd, Jagdish Prasad, P. C. Jaiswal, D. B. Singh, A. K. Gupta,
R. M. Stevens, P. W. Ramteke, Mrs. P. Gupta, S. Herbert,Mrs. S. Sheikh, P. D. Jayapandian
Associate EditorsNahar Singh, S.B. Lal, A.K.A. Lawrence, S. Solomon, P. Kumar,
T. Thomas, R.K. Isaac, Amit Chattre, Neena Gupta
The Allahabad Farmer Journal
Year of First Publication : 1925
Frequency of Publication : Bi-Annual (January & July)
I.S.S.N. No. : 0971-9075
Correspondence : Managing Editor
The Allahabad Farmer JournalUniversity Publication Division,Sam Higginbottom Institute of AgricultureTechnology & SciencesAllahabad - 211 007, (U.P.), INDIAPhone : 0532 - 2684278, 2684296Fax # : 0532 - 2684406E-mail : [email protected]
[email protected] : www.shiats.edu.in

ADVISORY BOARD
Dr. A.M. MichaelFormer Vice Chancellor
Kerala Agricultural University,Vellanikkara - 680 654, Thrissur,
Kerala, INDIA
Dr. Anwar AlamExecutive Secretary
(National Academy of Agricultural Science)
Former Vice ChancellorSher-e-Kashmir University of Agricultural Sciences & Technology, Jammu
NASC Complex, DPS Marg, Pusa RoadNew Delhi-110012
Dr. Gyanendra SinghVice Chairman
Patel Group of Educational InstitutionsBhopal
Dr. B.S. HansaraDirector
Indira Gandhi National Open UniversityNew Delhi-110068
Dr. David N. SenProfessor of Botany (Retired),P.O. Box 14, Zion 41B/B1/A
P.W.D. Colony, Jodhpur-342 001, Rajasthan, INDIA
Dr. David E. KisselFormer Editor-in-Chief,
Soil Science Society of America Journal,Professor, Department of Agronomy,University of Georgia, Athens, U.S.A.
Dr. Gary PoslerProfessor & Head,
Department of Agronomy,Throck Mortam Hall,
Kansas State University, Manhattan,Kansas - 66506, U.S.A.
Dr. J.A. OliverChairman
Christian Education of IndiaVijayapuri,
Hyderabad - 500 017,INDIA
Prof. (Dr.) A.K. SrivastavaDirector
National Dairy Research InstituteKarnal
Haryana, INDIA
Dr. S.P. SinghAdditional Director Research
Narendra Deva University of Agriculture & TechnologyKumarganj,
Faizabad, (U.P.) INDIA
Dr. R.P. KatiyarDirector Research
Chandra Shekhar Azad University of Agriculture & TechnologyKanpur-208 002
(U.P.) INDIA

CONTENT
AF-IVeterinary Science, Animal Husbandry & Fisheries
1. Effect of lactation order on quality of raw milk incrossbred cows 1 - 5Mahakar Singh, Jagdish Prasad and Neeraj
AF-IIEngineering & Technology, Dairy Technology & Food Technology
2. Probability Analysis for prediction of rainfall of Raipurregion (Chhattisgarh) 6 - 15Shiulee Chakraborty, M. Imtiyaz and R. K. Isaac
3. Physico-chemical Characteristics of Extruded SevDeveloped from Multipurpose flour by incorporatingSpinach, Curry, Coriander and Mint Leaves Powder 16 - 24Hena Imtiyaz, R. N. Shukla and K. C. Yadav
AF-IIIAgricultural Economics & Farm Management, Agricultural Extension and Rural
Development, Home Economics
4. Formulation of Conventional Food Products Using WaterChestnut (Trapa natans) 25 - 31Priyanka Yadav and Ritu Prakash Dubey
5. To Study the Factors Associated with Descrimination ofGirl Child 32 - 40Anita P. Patel, Manjari S. Acharya

6. Growth and Instability of Pulses Production in India 41 -54Punit Kumar Agarwal, O. P. Singh, Dheeraj Kumar Verma,Ku. Sushila and C. Sen
7. Novel Intervention in transition of farm women -NAVEEN SICKLE 55 - 58Neerubala, Verma, A
AF-IVPlant Pathology, Nematology, Entomology, Genetics & Plant
Breeding, Plant Protection and other Biological Science
8. Estimation of Genetic Diversity in Mungbean Germplasm 59 - 64Deepak Kumar, Ashok Kumar S. M. and G. Roopa Lavanya
9. Antifungal Activity of Sticta nylanderiana and Hypotrachynascytophylla against some Post-harvest Pathogens 65 - 71Seweta Srivastava, Manisha Srivastava and Asha Sinha
10. Effect of different doses of gamma irradiation on yieldand yield contributing traits of wheat (cultivar HD-2867) 72 - 79Shubhra Singh, Ram. M, S. Marker, B. Abrar Yasin,Akhilesh Kumar, Vinod Kumar and Ekta Singh
AF-VAgronomy, Horticulture and Forestry
11. Response of Nitrogen and Phosphorus levels on Growthand Seed yield of Ashwagandha (Withania somnifera L ) 80 - 85S. C. Swain and Vijay Bahadur
12. Studies on preparation and preservation of herbal Jamof Aonla (Emblica officinalis Geartn.). 86 - 96Balaji Vikram, V.M. Prasad, Atul Anand Mishra andSurya Narayan

AF-VISoil and Environmental Sciences
13. Development of erosivity model on daily rainfall basisfor Hazaribagh region 97-106Pravendra Kumar
AF-VIIBio Chemistry, Bio- Technology & Microbiology
14. Effect of sulphur doses on different physical parametersof cowpea varieties (Vigna unguiculata L. walp.) 107-114Tripti Pandey, R.P. Singh, A.B. Abidi and K.D.N. Singh Rekha
15. An exploration of standardizing rich protein and aminoacid food 115-123Aparna Dube, Pratibha Singh, A.B. Abidi and R. Shukla
AF-VIIIBasic Sciences
16. Effect of Bean common mosaic virus infection on yieldof Hyacinth bean ((Lablab purpureus (L.)) 124-132Manisha Srivastava, U.P. Gupta and Asha Sinha
AF-IXRural Health Science
17. Cross - Sectional study assessing obesity and dietarypattern in studies of Panjab University, Chandigarh 133-140Ranjan Hemangi, Sethi Swati
Guidelines for Contributors
Subscription Information & Subscription Form

Guidelines For AuthorsSubmission of Manuscripts :
The manuscripts should be addressed to Prof. (Dr.) R.B. Lal, Editor-in-Chief, TheAllahabad Farmer, Sam Higginbottom Institute of Agriculture, Technology & Sciences, Allahabad-211 007 (U.P.), India. Articles must be the original material previously unpublished elsewhere.The authors must strictly adhere to the formatof the journal and should consult a recent issue ofthe journal for style and layout, while preparing their manuscripts. The manuscript will be returnedto authors, if it departs any way from the required format and style. After review each manuscriptwill be accepted for publication upon recommendation of the Editorial Committee. Manuscriptssubmitted should be related to any of the undermentioned divisions.
AF-I Veterinary Science, Animal Husbandry & Fisheries
AF-II Engineering & Technology, Dairy Technology & Food Technology
AF-III Agricultural Economics & Farm Management, Agricultural Extensionand Rural Development, Home Science & Women’s Development
AF-IV Plant Pathology, Nematology, Entomology, Genetics & Plant Breeding,Plant Protection and other Biological Science.
AF-V Agronomy, Horticulture and Forestry.
AF-VI Soil and Environmental Sciences
AF-VII Bio Chemistry, Bio- Technology & Microbiology
AF-VIII Basic Sciences
AF- IX Rural Health Science
PREPARATION OF MANUSCRIPT:The Manuscript should be submitted in triplicate, typed/printed to double space on one
side of A4 size/bond paper. The pages should be numbered and the paper should be written in the
following order.Title Page, Abstract, Introduction, Material and methods, Result and discussion,
Acknowledgement, Literature cited, Tables and Figures.
TITLE PAGE:The Title page should include Title of Article, Name of the author/authors,
designation and postal addresses, department and Institution.
ABSTRACT:An accurate and short citation of the entire paper highlighting the important findings.
INTRODUCTION:It should give the appropriate background of the research and state clearly the objectives
of the work done and what new findings have been achieved in this research.

MATERIAL AND METHODS:This includes the equipments, instruments, apparatus, chemicals, animals, plants etc.
used in the experiment. It also includes the brief statement of the methodology adopted inexperimentation.
RESULTS AND DISCUSSIONS:It should be under single head to avoid repetition and should be confined to details of
facts and the interpretation of results and their relation with previous work for relevant studies.The results may be given as a table, graph or in statistical or methodological equations,
but duplication of expression of results in one form or the other is not permitted. The authors areadivsed to use one kind of result for their experiments which means same data should not begiven as graph, if table is given.
ACKNOWLEDGEMENT:Authors are responsible to include the name of individuals/organizations/institutions
who have contributed in conducting the studies.
LITERATURE CITED/REFERENCES:References should be cited alphabetically and the following system should be used for
arranging references :a. Journal papers : Example- Elbaz-Poulichet, F., Guan, D.M. Martin, J.M., 1991. Trace
metal behaviour in a highly stratified Mediterranean estuary, Marine Chemistry, 32:211-224.
b. Monographs : Example- Zhdanov, M.S. and Keller, G.V., 1994. The GeoelectricalMethods in Geophysical Exploration. Elsevier, Amsterdam.
c. Edited volume papers : Example- Thomas, E., 1992. Middle Eocene-late Oligocenebathyal benthic foraminifera (Weddell Sea) : faunal changes and implications for oceancirculation. In: D.R. Prothero and W.A. Berggren (Editors), Eocene-Oligocene Climaticand Biotic Evolution. Princeton Univ. Press, Princeton, NJ, pp. 245-271.
d. Conference proceedings papers : Example- Smith, M.W., 1988. The significance ofclimatic change for the permafrost environment. Final Proc. Int. Conf. Permafrost. Tapir,Trondheim, Norway, pp. 18-23.
e. Unpublished theses, reports, etc (e.g. technical report, Ph.d. thesis, institute etc.) :Example- Moustakas, N., 1990. Relationships of morpholoical and physicochemicalproperties of Vertisols under Greek climate conditions, Ph.D. Thesis, Agricultural Univ.Athens, Greece.
TABLES:Type each table double spaced on a separate sheet. Tables should be numbered
consecutively in Arabic numeral in order of reference in the text. Each table should have a briefbut meaningful title which should be given below the table number.

ILLUSTRATIONS:All illustrations must be presented separate from the manuscript unfolded, and as originals.
Each illustration must be sharp and drafted at high density on bright white paper, on glossy paperor on drawing film.
Experimental data may be presented in graphic and tabular form, but the same datashould not be presented in both forms. Never use clips on photographs in any way. Graphs anddrawings should be inked with heavy black lines to ensure clarity after reduction in size. Place theauthor’s name on the back of each figure submitted. Figures should be numbered consecutivelyin Arabic numerals.
INTERNATIONAL UNITS:For all measurement the expression should be SI unit.
A CERTIFICATE OF ORIGINALITY:I/We hereby certify that the paper titled ......................................................................is
the original paper of my/our research work and has not been submitted elsewhere for publication.I/We have acknowledged the names of individual/sponsoring institutions who have contributedto this research.
Main Author...................................... Co-Author ............................
Date ..........................
This certificate of originality should accompany the manuscript.

SUBSCRIPTION FORMName :................................................................................................Designation :................................................................................................Institutional address:................................................................................................
.................................................................................................
.................................................................................................Postal Address :................................................................................................
.................................................................................................
.................................................................................................Phone No......................Fax No .............................E-mail......................
(Tick the appropriate)Category: Life Membership/Sustaining/Annual (Student/Ordinary/Organizational)Mode of Payment: Cheque/Demand Draft
No. :.............................................Bank :.............................................Dated :.............................................Amount Rs. :...........................................
(Signature)
The Allahabad Farmer (A Journal ofAgricultural Science and Technology), is a bi-annual publication of Sam HigginbottomInstitute of Agriculture, Technology &Sciences, Allahabad published in the monthof January & July. All communicationsregarding submission of manuscript forpublication, subscription etc. should beaddressed to, Prof. (Dr.) Arif. A. Broadway,Managing Editor, The Allahabad Farmer.
The Editorial Board is assisted by manydistinguished scientists in an honorarycapacity in examining the manuscripts receivedfor publication. Papers are accepted forpublication only from members of TheAllahabad Farmer Journal.
Please send your remittance through Cheque/Demand Draft drawn in favour of "SHIATS,Publication Account” payable, at State Bank ofIndia, Agricultural Institute Branch and mail it toProf. (Dr.) Arif. A. Broadway, Managing Editor,The Allahabad Farmer.(Please add Rs. 25/- for outstation cheques)
Information for Subscribers
Two issues yearly in one volume.
Subscription per annum
Students : 150.00
Ordinary : 250.00
Organisational : 600.00
Overseas (Annual) : $150.00
Life Membership : 3000.00
Sustaining : 8000.00