Prince George Community Energy Design Charrette - Summary Report
30
Housing, Buildings, Communities, & Simulation Group Prince George Community Energy Design Charrette Summary Report April 2011 Source: City of Prince George The Prince George Community Energy Design Charrette was funded by BC Hydro Sustainable Communities Program. In-kind modelling and simulation support using the Spatial Community Energy Carbon and Cost Characterization Model was provided by Natural Resources Canada under the auspices of the Program of Energy Research and Development, Built Environment Sub-Program. This report was produced with contributions from Brett Korteling of Vive le Monde Mapping, Adrian Partridge of Environ Corporation, Jessica Webster, Natural Resources Canada and Adrian Mohareb from the City of Prince George. The organizers would like to thank participants for their valuable contribution to the advancement of community energy modelling and planning.
Transcript of Prince George Community Energy Design Charrette - Summary Report
Housing, Buildings, Communities, & Simulation Group
Prince George Community Energy Design Charrette
Summary Report
April 2011
Source: City of Prince George
The Prince George Community Energy Design Charrette was funded by BC Hydro Sustainable
Communities Program. In-kind modelling and simulation support using the Spatial Community Energy Carbon and Cost Characterization Model was provided by Natural Resources Canada under the auspices of the Program of Energy Research and Development, Built Environment Sub-Program. This
report was produced with contributions from Brett Korteling of Vive le Monde Mapping, Adrian Partridge of Environ Corporation, Jessica Webster, Natural Resources Canada and Adrian Mohareb from the City of Prince George. The organizers would like to thank participants for their valuable contribution to the
advancement of community energy modelling and planning.

2
APPENDICES
CONTENTS
1 Introduction ...............................................................................................................................3 1.1 Project Scope................................................................................................................4 1.2 Charrette Overview .......................................................................................................4
2 Pre-Charrette Research and Analysis...................................................................................5 3 SCEC3 Model Inputs and Scenarios.....................................................................................5
3.1 Existing and New Dwellings in the Crescents ...............................................................5 3.2 Housing Retrofit Combinations......................................................................................7 3.3 Apartment Building Retrofit Combinations ....................................................................8 3.4 New Construction..........................................................................................................8 3.5 Neighbourhood Retrofit Scenarios ................................................................................9 3.6 Developing a Scenario with Input from Participants......................................................9
4 Municipal Legal and Policy Context ....................................................................................14 4.1 What building policies can municipalities legally implement? .....................................14 4.2 Policy options to achieve market transformation.........................................................16
5 Opportunities for Achieving Natural Gas Conservation.......................................................18 6 Opportunities for Achieving Electricity Conservation ..........................................................18
6.1 Regulatory Opportunities for Existing Homes .............................................................18 6.2 Moral Suasion & Voluntary Opportunities – Existing Homes ......................................20 6.3 Regulatory Opportunities – New Homes .....................................................................20 6.4 Moral Suasion & Voluntary Opportunities – New Homes............................................20
7 Participants’ Residential Energy and Emissions Scenario..................................................21 8 Proposed Implementation Plan ...........................................................................................25
8.1 City Can Act Directly (Redistributive/Distributive) .......................................................25 8.2 City Can Act Directly (Distributive) ..............................................................................25 8.3 City providing information/advice (Moral Suasion / Voluntary)....................................25 8.4 City working with Government (Regulatory)................................................................26
9 Lessons Learned.................................................................................................................26
A Agenda…………………………………………………………………………………………….28 B Attendees………………………………………………………………………………………….29 C References………………………………………………………………………………………..30
3
1 Introduction The City of Prince George (the City) is one of the participating municipalities in the Partners for Climate Protection (PCP) program and is committed to reducing greenhouse gas (GHG) emissions for both Corporate and Community sectors based on the Five Milestone Framework approach. The City set GHG reduction goals for its corporate and community inventories, pledging to achieve 10% and 2% below 2002 GHG emission levels respectively by year 2012. The Community Energy Design Charrette was commissioned in association with these targets and objectives.
BC Hydro developed the Power Smart Sustainable Communities Program to help local governments and developers meet the challenges and green their projects by providing a range of services in expertise, education, program support and financial incentives. One of the programs is the Energy Design Charrette program. BC Hydro provides 100% of the funding of up to $20,000 for the electricity component to help facilitate workshop(s) to integrate energy conservation into land use planning for a specific area. This financing supports expertise to participate on the multi-disciplinary planning team, provide data and consultation.
For the City of Prince George, the main objective the Community Energy Design Charrette was to elevate the level of energy expertise and analysis of energy efficiency options related to the Official Community Plan (OCP) update process.
The specific goals of the City of Prince George in the charrette were to:
review options to attain reductions in electricity and fossil fuel consumption over the next 30 years;
assess cost and feasibility of recommended measures; assess and examine policy tools that can be used to help achieve the desired levels of
reduction; assess implications for extending developed strategies to the entire City; and develop a strategy that presents energy use reduction options and associated costs.
Charrette outcomes are intended to be included in the City’s new Official Community Plan, which will include a section on addressing energy use in the community and in civic facilities. CanmetENERGY’s research objectives specific to the event included to:
share information from the SCEC3 model with community members and technical experts on the energy, GHG and cost implications for the residential sector arising from land use scenarios developed in the myPG sustainability planning process;
demonstrate the effectiveness of model outputs to inform policies and actions for the housing sector in support of Prince George’s 2% GHG emissions reduction target; and
test visualizations and obtain feedback on the quality and impact of SCEC3 model outputs in the context of a community engagement process.

4
1.1 Project Scope
The Crescents neighbourhood was defined as the study area. For the purposes of the charrette, the neighbourhood was expanded to the east to include the west side of Victoria Street (see map on title page). The Crescents is a mainly residential area containing a variety of housing types, plus a school, hospital and associated buildings and some small retail establishments. This neighbourhood was selected by City of Prince George staff due to the large number of residences, and the potential for modelling mixed-use buildings on its periphery. The extension was made to incorporate the potential of more multi-unit residential buildings (MURBs) and mixed-use buildings, as, during the processes for both myPG and the update to the Official Community Plan, the residents were resistant to new MURBs west of Vancouver St. Figure 1 shows the current zoning in the area and the various land uses. Main activities included conducting pre-charrette research and analysis, planning and facilitation of the charrette and follow-up with participants after the event and preparation of a final report including key recommendations
1.2 Charrette Overview
The charrette was held at the Prince George Civic Centre on February 21, 2011. There were 37 attendees in total, including presenters and facilitators. A list of attendees and agenda can be found in Appendix 1. Not typical of a standard design charrette, it was of one-day duration as opposed to three or four days. A specific agenda was designed to generati discussion on energy usage reduction in the Crescents neighbourhood.
Activities consisted of a mix of presentations and round table and group discussions. Facilitator Adrian Patridge welcomed participants, outlining the day’s objectives and agenda. A backgrounder was provided on the City’s GHG reduction targets, Official Community Plan, the Crescents Neighbourhood, along with the BC building code and costing information.
Jessica Webster reviewed SCEC3 model inputs and housing scenarios and led attendees through an interactive questionnaire to solicit their preferences for retrofit, renewable and new construction for the residential housing stock in the neighbourhood. City planner Dan Milburn and BC Hydro policy specialist Katherine Rossokha reviewed the municipal legal and policy context. Round table discussions focused on identifying feasible cost-effective natural gas and electrical efficiency actions that could be supported through policy.
Results from the questionnaire were fed into the SCEC3 model during the day. Report backs from round-table discussions and the results of the interactive modelling exercise were presented at the end of the event.

5
2 Pre-Charrette Research and Analysis Background research was undertaken to review charrette methodology and previous community energy and emissions planning initiatives. A walk around of the Crescents neighbourhood was conducted on January 27, 2011. Environ Canada held consultations with a variety of organizations, in particular:
BC Hydro - Paul Bouman and Katherine Rossokha City of Prince George - Dan Milburn, Dan Adamson, Jocelyn White and Adrian Mohareb Natural Resources Canada - Jessica Webster and Brett Korteling
Under development since the Smart Growth on the Ground initiative in 2008, the Spatial Energy Carbon and Cost Characterization Model (SCEC3) was further improved in 2010 during the Integrated Community Sustainability Planning process, known as myPG. Refinements prepared for the charrette included the integration of the ‘Nodes and Corridors’ land use strategy developed in the myPG process. Using an existing set of LiDAR data from the City’s Engineering Department, University of British Columbia PhD candidate Rory Tooke calculated rooftop areas in the city suitable for solar panel placement; CanmetENERGY’s Raymond Boulter provided advice on roof orientations and used RETScreen to develop factors for typical solar domestic hot water installations in Prince George. With Raymond’s expertise, rules of thumb for district energy connections were also integrated into the model. Drawing upon the City’s previous energy and emissions reports and information in the SCEC3 model, the City of Prince George, Natural Resources Canada and Vive le Monde Mapping worked collaboratively to establish ‘pre-packaged’ baseline and future scenarios for the Crescents neighbourhood, for use in the charrette. Additional work was undertaken to design a survey instrument that would enable the SCEC3 model to be run dynamically, by collecting participants’ responses to questions using an Audience Response System. 3 SCEC3 Model Inputs and Scenarios
The following outline provides an assessment of the existing housing stock, the housing and building energy simulation performed, and the details of four neighbourhood scale scenarios..
3.1 Existing and New Dwellings in the Crescents
In the study area, there are 646 Single Family Dwellings (SFD), 376 units of row housing (ROW) and 222 apartments (APTs). The number of residential units by dwelling type as a percentage of neighbourhood and city-wide totals are shown in Figures 1a and 1b.

6
Figure 1a. Residential Mix in the Crescents Neighbourhood
Figure 1b. Residential Mix for the City of Prince George Source: SCEC3 model
Figure 2. Single Family Dwellings in the Crescents Neighbourhood
Source: Adrian Mohareb Housing and building energy modelling and simulation had been previously conducted (2009/10) for a total of 9 existing and new housing and apartment types. These representative types were identified through comparing and contrasting ecoENERGY Retrofit Audit Records and building attribute information for the entire city held by BC Assessment. Energy modelling and simulation was conducted both in HOT2000 and The Screening Tool for New Building Design.

7
Table 1 summarizes the nine representative housing types and baseline total annual energy use and energy intensity. These values were input into the SCEC3 model to calculate baseline energy performance at the neighbourhood scale. Table 1. Building attributes and baseline energy consumption for new and existing houses and apartment types considered in the charrette.
Housing Type
Age Storeys
Floor Area (m2)
Total Annual Energy (GJ)
Energy Intensity (GJ/m2)
Total Annual Energy (kwh)
Energy Intensity (kwh/m2)
SFD1 ’43-‘77 1 192 149 0.77 41302 215
SFD2 ’78-‘96 1 217 145 0.67 40193 185
SFD3 ’78-‘96 2 282 167 0.59 46387 164
ROW1 ’63-‘92 1 161 85 .52 23065 147
MURB/suite ‘72 <5 77 36 .47 12750 165
Exi
stin
g
MURB/suite ‘73 >5 59 39 .67 11294 192
SFD 2008 code
2 259 73 0.28 33114 122
SFD next-gen R-2000
2 270 119 0.44 21600 80
New
Row 2008 code
2 240 87 .36 24110 100
3.2 Housing Retrofit Combinations
Houses and buildings are systems, with energy efficiency improvements having synergistic effects. This results in cumulative not additive savings, with different combinations of retrofits achieving different energy efficiency improvements. To simplify matters for the charrette, pre-selected retrofit combinations were established for existing single-family dwellings and row houses. Housing energy modelling and simulation was performed in HOT2000 for the following retrofit combinations:
Furnace
Air Source Heat Pump (ASHP)
Retrofit Combination #1 Furnace to 92% AFUE Windows to argon-filled double glazed, 0.4 heat gain coefficient Basement insulation to R20

8
Retrofit Combination #2 Furnace to 92% AFUE Windows to argon-filled double glazed, 0.4 heat gain coefficient Basement insulation to R20 Air-source heat pump 10.5 kW
Table 2 lists the energy intensity values associated with the retrofit combinations on the various single family dwellings and row houses. To account for retrofits occurring over time, these different retrofit packages for the individual housing and building types were attributed to different percentage of the housing stock to develop the neighbourhood-scale scenarios presented in the charrette. Table 2. Energy Intensity of Housing Types under Different Retrofit Combinations Retrofit Combo
Baseline Furnace Upgrade
Air-Source Heat Pump
Retrofit Combo #2
Retrofit Combo #2
GJ/ m2/
year
kWh/m2 /year
GJ/m2
/year kWh/m2
/year
GJ/ m2/
year
kWh/m2/
year
GJ/ m2/
year
kWh/m2/
year
GJ/ m2/
year
kWh/m2/
year
SFD1 0.77 215 0.60 167 0.55 152 0.55 154 0.43 119
SFD2 0.67 185 0.52 145 0.47 132 0.48 133 0.37 104
SFD3 0.59 164 0.46 126 0.42 116 0.42 116 0.32 89
ROW1 0.53 147 0.40 110 0.36 100 0.37 103 0.28 78
3.3 Apartment Building Retrofit Combinations
Two retrofit scenarios for apartment buildings, also known as Multi-Unit Residential Buildings (MURBs) were considered: apartment buildings with less than 5 storeys and apartment buildings with more than 5 storeys. Retrofits to apartments are typically done on a whole building basis, as are energy simulations to calculate efficiency improvements. To present simple information for participants, efficiency thresholds were specified instead of the various combinations of whole building retrofits. Table 3. Energy Intensity of MURB Retrofit Combinations Retrofit Combo
Baseline 10% increase in efficiency
20% increase in efficiency
30% increase in efficiency
GJ/ m2
/year
kWh/m2
/year
GJ/ m2
/year
kWh/m2/
year
GJ/ m2
/year
kWh/m2/
year
GJ/ m2
/year
kWh/m2/
year
Apt < 5 storeys
.47 167 0.42 150 0.38 133 0.33 117
Apt > 5 storeys
.67 192 0.60 172 0.53 153 0.47 133
3.4 New Construction
As summarized in Table 1, three types of new construction were considered: one single

9
family dwelling built to the 2008 BC Building Code, a second single family dwelling built to the next generation R-2000 standard (approximately equivalent to an EnerGuide Rating of 86), and a new row house, also modelled to BC 2008 Building Code.
3.5 Neighbourhood Retrofit Scenarios
Energy intensity values calculated for houses and apartments for baseline and retrofit scenarios were integrated into the SCEC3 model through multiplication of energy intensity by the floor area attribute associated with the BC Assessment housing and building data. To enable modelling of scenarios at the neighbourhood scale, the ‘Nodes and Corridors’ land use scenario identified in the myPG process asrthe preferred Growth option in process was leveraged. In advance of the charrette, the SCEC3 model was prepared and run for four neighbourhood-scale scenarios:
Business as Usual (BAU) Low Efficiency Mid Efficiency High Efficiency
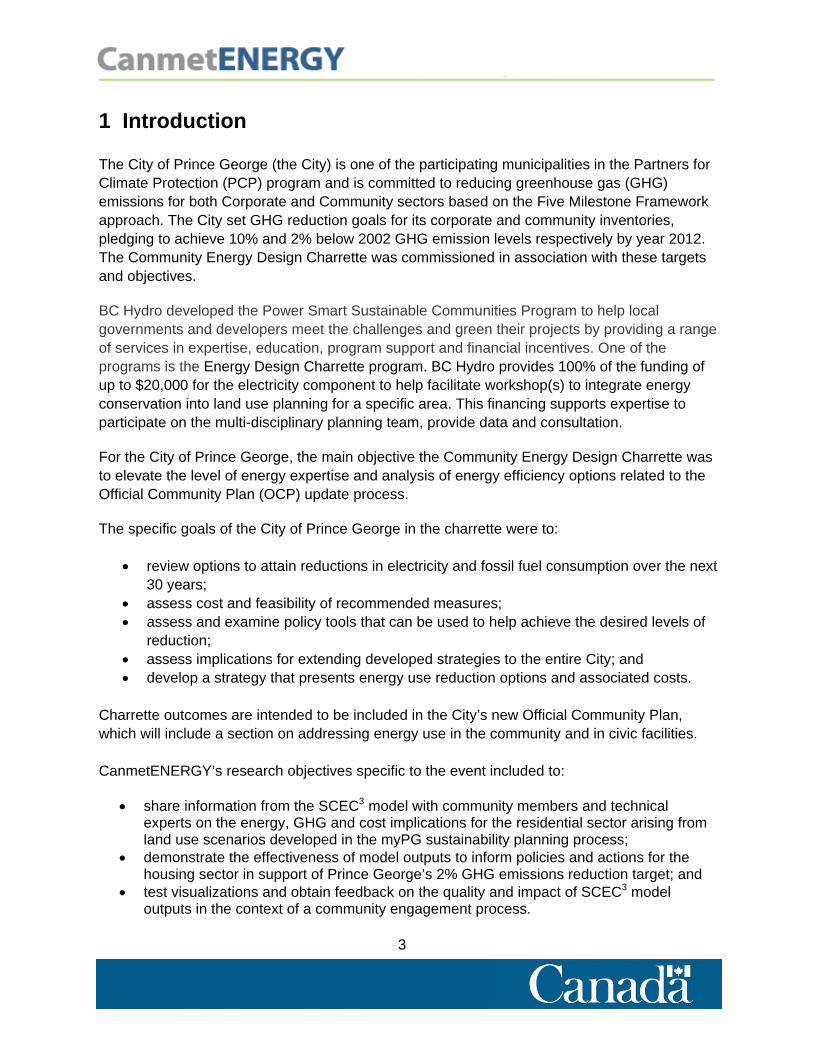
The scenarios specified the number of units to undergo retrofits, units of new construction and, for renewable energy technologies, the number of solar domestic hot water systems and district energy connections. Figures 5-8 summarize the details of the model baseline and BAU, low, mid and high efficiency scenarios. These were also presented in a series of maps, similar to that found in Figure 4.
3.6 Developing a Scenario with Input from Participants
In addition to the four ‘pre-packaged’ scenarios for the Crescents, an interactive questionnaire was used to develop what was called a ‘preferred scenario’. This was developed by asking questions about the preferred housing mix in the neighbourhood, the percentage of retrofits and the installation of solar hot water systems. Answers were captured using an interactive Audience Response System. Results were then loaded into the SCEC3 model to run a new neighbourhood-scale scenario presented at the end of the day.

10
Figure 3. A ‘Reply Mini’ Audience Response System Clicker Source: Amanda Mitchell
Figure 4. SCEC3 2008 Model Baseline, Total Energy Use per Dwelling in the Crescents (modelled) Figure 5 through Figure 8 on the following page provide scenario details for the BAU, low efficiency, mid efficiency and high efficiency. These scenarios specify the combination of retrofits to existing single-family dwellings, row houses, and apartments (MURBS), the numbers and types of new construction, as well as the number of district energy connections and solar domestic hot water installations.
11
Figure 5. Business as Usual Scenario Details
Figure 6. Low Efficiency Scenario Details
Figure 7. Medium Efficiency Scenario Details
Figure 8. High Efficiency Scenario Details

Figure 9. Comparison of 2040 Business as Usual and 2040 High Efficiency Energy Scenarios

13
Figure 10. Comparison of 2040 Business as Usual and 2040 High Efficiency Emissions Scenarios

14
4 Municipal Legal and Policy Context
4.1 What building policies can municipalities legally implement?
Dan Milburn, Manager of Long-Range Planning, made a brief presentation about policy options available to Prince George, and what has already been pursued. Legal analysis completed by the Pembina Institute as a part of the Green Building Leaders Program reviewed policies pertaining to new and existing buildings, and the integration of renewable energy technologies and measures. Pembina reviewed the Local Government Act to identify where municipalities have concurrent authority with the province and also for ease of implementation within local government.
Relating these research findings to Prince George, Mr. Milburn discussed the council’s ability to say no to rezoning, stating that any development permit that fits within the OCP must be approved. There is a significant amount of latent density in the downtown core that could be developed; 18 stories and 280 units per hectare are possible. Current conditions however are not conducive to such high density infill. Discussing existing buildings, Mr. Milburn stated that according to current legislation, the envelope is only part of a building that can be regulated. The city also has the potential to issue covenants for the land that it owns and sells. Phased Development Agreements can provide certainty for developers when councils change their mind on a development without compensation. He also discussed the potential for amenity bonusing, though there may not be much use for it in Prince George, as Floor Space Ratios generally do not exceed maximums.
Figure 11. City of Prince George Planner Dan Milburn Reviews Legal and Locally-Applicable Policies for
New and Existing Buildings Source: Adrian Mohareb

15
Table 4 summarizes the Pembina Institute’s analysis. A colour-coding scheme was assigned where:
red – measures that were not possible within current municipal jurisdiction yellow – partial municipal implementation is possible within existing jurisdiction green – municipal implementation clearly possible with existing jurisdiction
Table 4. Summary of Legal Analysis of Existing Jurisdictions for Energy Efficiency Measures
Source: The Pembina Institute – Green Building Leaders Program

16
4.2 Policy options to achieve market transformation
BC Hydro conducts research and assists local governments in the province of British Columbia to achieve energy efficiency through planning support and its Power Smart program. The policy goals of BC Hydro are to: reduce electricity demand; reuse waste heat; use renewable heat; and use renewable electricity. In the context of these goals, BC Hydro’s Katherine Rossokha discussed policies and the potential for local governments to contribute to them. She provided an overview of the types of policies available to municipal governments (Figure 12), policy categories based on an increasing level of stringency. Moral suasion and voluntary policies educate and encourage people to take action on energy efficiency without any specific financial incentive to do so. Distributive measures provide financial incentives through grants, loans and subsidies. Re-distributive policies provide a benefit to one group of people at the expense of another group. An example is a ‘fee-bate’ system where the buyer of a fuel-efficient vehicle receives a rebate paid for by a fee charged on a less efficient vehicle. Regulatory measures are those enshrined in law to control the behaviour of people and organizations. Selected City of Prince George measures were reviewed and categorised as such as community engagement and promotion of federal, provincial and utility programs (moral suasion/voluntary) and rebates for homes built to EnerGuide 80, builders who have taken the Built Green training and for home energy labelling at the time of sale (incentive).
Ms. Rossokha outlined the energy savings potential of different measures and the ease of policy development and implementation. No measure ranks high in all three categories, but density linked requirements and floor space ratio (FSR) restrictions ranked as moderate in energy saving potential and ease of development and easy in ease of implementation. The concept of hard and soft policy goals was also presented; hard goals include prescriptive requirements (how to do something) and performance requirements, while soft goals include processes, (how to disclose or measure something), and energy information such as labelling. The removal of barriers and disincentives, were also discussed. Examples provided were FSR exclusions to reduce a disincentive to building thick walls and reducing height exclusions to allow renewable energy and green roof elements.
Audiences for policy measures in Table 4 and Figure 12, include on the supply side builders, developers and service providers, and on the demand side, property owners and occupants.

17
Figure 12. Overview of Range of Local Government Policy Measures Source: BC Hydro
Table 5 shows cost and usage projections for electricity, fossil fuel and total energy for the various scenarios. It also projects the growth of renewable energy and the cost of district heating. Figure 14. through Figure 17. show the data in graphical form. Note that cost projections have been based on information received from BC Hydro and FortisBC. Table 5. The Crescents Energy Usage and Cost Projections
2040 Projections
Present BAU
Low efficiency
Medium Efficiency
High Efficiency
Preferred Efficiency
Electricity Usage (kWh) 9,200,693 11,392,990 10,006,740 13,751,347 13,723,395 13,510,623
Electricity Cost (2040 $) $1,264,155 $1,491,617 $1,386,923 $1,877,182 $1,873,523 $1,845,666
Fossil Fuel Usage (m3) 2,621,526 2,674,364 2,566,053 1,894,067 1,295,036 1,450,153
Fossil Fuel Cost (2040 $) $2,403,040 $2,483,759 $2,380,982 $1,806,864 $1,266,195 $1,398,720
Total Energy Usage (GJ) 130,722 140,940 135,214 127,417 111,027 109,981
Total En’ Cost (2040 $) $3,667,195 $3,975,376 $3,863,710 $3,840,693 $3,413,069 $3,419,185
Renewable En’ Usage (GJ) 0 359 3,656 7,396 13,409 7,354
District Htg Cost (2040 $) $0 n/a $95,805 $156,646 $273,352 $174,799

18
5 Opportunities for Achieving Natural Gas Conservation Following the presentation and interactive session on the SCEC3 model, participants were asked to identify measures that would reduce natural gas consumption. The identified options are categorized by three categories – technological, policy (voluntary) and policy (mandatory). Technological solutions:
Encourage drain water heat recovery and sewage waste heat recovery. Encourage solar hot water readiness and passive solar design in new buildings. Encourage improved insulation in buildings and residences (eg thermal blankets on hot
water tanks, heat recovery ventilators. Encourage geoexchange heating. Provide assistance for installing energy efficiency upgrades.
Voluntary policy solutions:
Engage utilities and residents around on-bill financing for energy efficiency upgrades. Engage financial institutions to develop energy efficiency products. Encourage more users to connect to the downtown district energy system. Provide property tax or other rebates to homeowners who improve the energy efficiency
of their homes. Mandatory policy solutions:
Consider the Merton Rule – requiring 10% of energy from on-site generation. Create density-linked requirements for new developments. Mandate energy audits for new homes and sale of existing homes. Mandate individual energy meters for houses and apartment units. Work with utilities and the Province to determine the potential of tying property taxes to
energy use.
6 Opportunities for Achieving Electricity Conservation The electricity conservation measures identified in section 3.3.1 for existing homes fall into two policy ‘buckets’ ‘Regulatory’ and ‘Moral Suasion & Voluntary’.
6.1 Regulatory Opportunities for Existing Homes
Mandate that only Energy Star appliances be sold in B.C. Improve the efficiency of building envelopes. Restructure electricity rates to reflect time-of-use. Increase electricity rates to reflect the marginal cost of power production.

19
These measures depend on policy changes at the federal and/or provincial government levels; however, the following Power Smart programs address savings in these areas using Moral Suasion & Voluntary policy approaches:
Power Smart Appliance Rebate Program (promoting Energy Star equipment) Power Smart Windows Rebate Program (promoting Energy Star windows) Power Smart Fridge Buy Back Program
Technological measures that could improve the electrical efficiency in existing in new homes include Smart Meters and Advanced Metering Infrastructure (AMI) as well as home dashboards, or virtual displays showing the amount and cost of electricity being used. It is understood that BC Hydro has plans and programs in place to work towards deployment of AMI. While not improving efficiency, allowing home-based generation through net metering and feed-in tariffs are initiatives that would also require changes to provincial legislation.
Figure 13. Charrette participants brainstorm electrical efficiency measures with Dan Adamson (City of Prince George) and Katherine Rossohka (BC Hydro) Source: Adrian Mohareb

20
6.2 Moral Suasion & Voluntary Opportunities – Existing Homes
In roundtable discussions, participants identified electrical efficiency opportunities.
Install timers on lighting and equipment, occupancy sensors in rooms. Install motion sensors for outdoor lighting. installing high efficiency lighting. installing solar photovoltaic for home electricity generation. Energy draw tester. Encourage clothes lines. Decrease water use. Reduce usage of plasma TVs. Encourage use of induction cook tops. Install programmable thermostats to improve control of electric heating. Mitigate hot top floors and cold lower floors by closing doors.
The following Power Smart programs address savings in these areas: Power Smart Lighting Specials Power Smart Home Electronics program Power Smart Online Rebates Program Power Smart Product Incentive Program (commercial)
6.3 Regulatory Opportunities – New Homes
Orient homes for solar panel placement and optimize the location and type of
windows Require energy efficient lighting plans Require natural daylight design
These opportunities are not directly covered by Power Smart programs other than the ones detailed under ‘existing homes’ above.
6.4 Moral Suasion & Voluntary Opportunities – New Homes
increase lighting power density harnessing natural light with light tubes
These opportunities are not directly covered by Power Smart programs other than the ones detailed under ‘existing homes’ above.

21
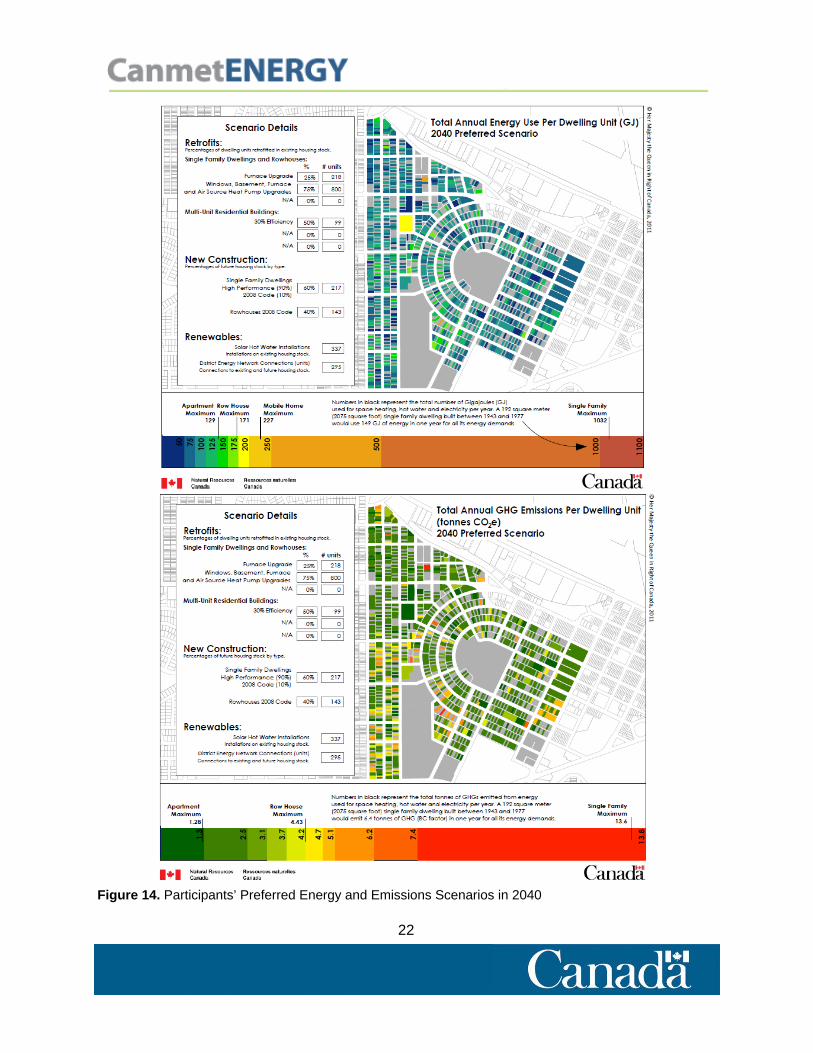
7 Participants’ Residential Energy and Emissions Scenario
In the last part of the afternoon, Jessica Webster presented the scenario that had been run in the SCEC3 model developed using participants’ responses to questions on housing type, retrofit and renewable integration rates. As illustrated in Figures 14 to 17, participants’ preferred scenario was more ambitious in terms of energy efficiency and emissions reductions than the pre-packaged high efficiency scenario. It is well known that Prince George is a progressive community with respect to energy and emissions planning; in this respect, the scenario results seemed consistent. However by engaging charette participants in discussion on the scenario and experience with the Audience Response System, a flaw in the survey design was revealed. Several of the questions had asked audience members to make choices on the basis of energy intensity information; missing was the operating energy and capital costs associated with the various retrofit, and renewable energy technology options. Respondents selected technologies for their resulting energy performance, but were not able to take the associated costs into consideration. Additionally, presenting the results of the pre-packaged neighbourhood scenarios prior to asking audience members to vote on various housing retrofit and technology options, possibly influenced respondents to make more efficient choices than they would have otherwise. While the questionnaire and the Audience Response System enabled the SCEC3 model to be run successfully using input from participants, audience responses and the resulting ‘preferred scenario’ were most likely more ambitious than if the content of the presentation had been delivered in a different order and costing information had also been provided when asking the questions.
22
Figure 14. Participants’ Preferred Energy and Emissions Scenarios in 2040

23
Figure 15. Comparison of average annual household energy consumption
Figure 16. Residential GHG emissions in 2040 under different scenarios; the bar on the right shows reductions achieved by integrating solar hot water in addition to retrofits
24
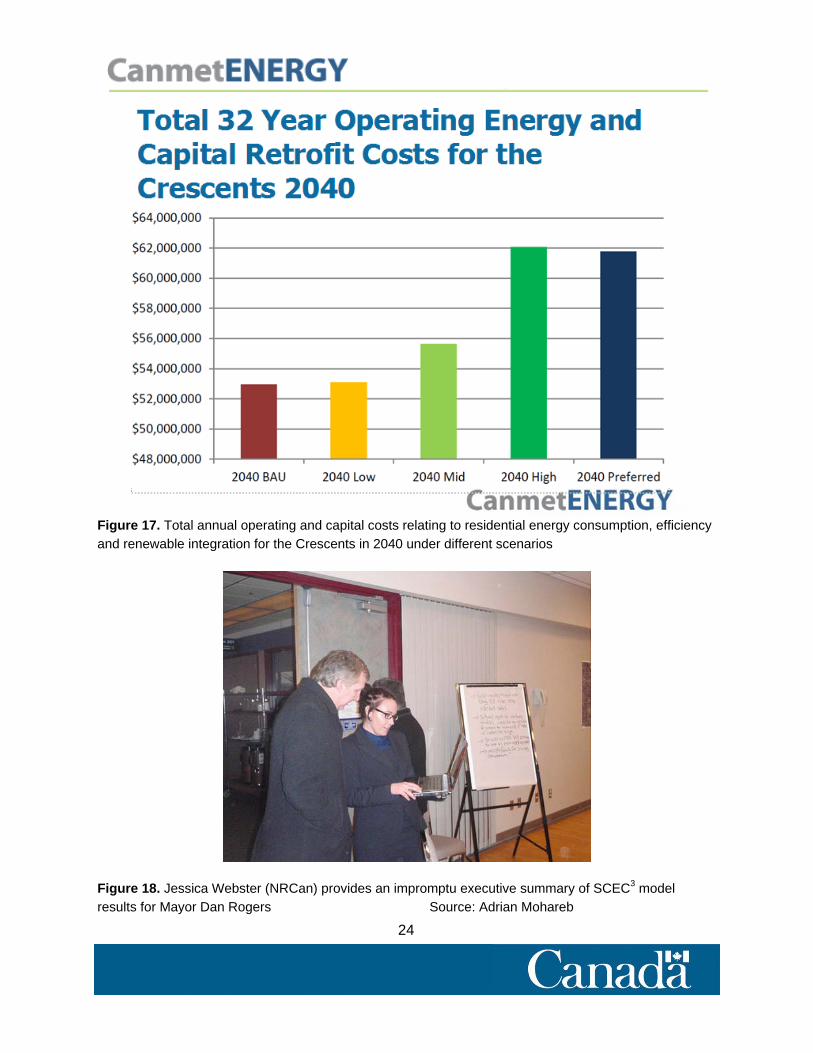
Figure 17. Total annual operating and capital costs relating to residential energy consumption, efficiency and renewable integration for the Crescents in 2040 under different scenarios
Figure 18. Jessica Webster (NRCan) provides an impromptu executive summary of SCEC3 model results for Mayor Dan Rogers Source: Adrian Mohareb

25
8 Proposed Implementation Plan Over the course of the day, several key potential actions for consideration by City of Prince George emerged. These actions could reduce the community’s reliance on electricity and fossil fuels and mitigate GHG emissions in future years.
8.1 City Can Act Directly (Redistributive/Distributive)
Link property taxes to energy use (a recurring theme in the charette and possibly a
priority for the City to investigate) possibly associated with an energy labelling initiative or with incentives from utilities.
8.2 City Can Act Directly (Distributive)
Use the District Energy System as catalyst for change by expanding into areas making
financial sense; this is an opportunity for existing and new buildings. Develop incentives for retrofitting existing buildings is critical to improving the efficiency
of the building stock as a whole. Develop financial incentives to encourage builders and buyers to build to a higher
standard – a problem was identified with the low potential profit builders and developers in the downtown core, worse performing buildings.
Develop incentives/policies to encourage MURBS and infill – MURBS are considerably
more efficient than single family dwellings and it was felt that more could be done to encourage development of MURBs in the city.
Rebate the cost of energy efficiency audits against the cost of building permits for
renovations – this would enable confirmation of the EnerGuide rating prior to occupancy, ensuring a certain standard for new homes in the city.
8.3 City providing information/advice (Moral Suasion / Voluntary)
The city should take a pivotal role in informing residents and businesses on energy and
GHG emissions, the associated costs and incentives available The City can work with utilities to provide ‘retrokits’ – packs of energy information
highlight savings measures and incentives. eg. BC Hydro EcoFitt energy saving kits. The city could work with the banks to develop energy efficiency financing options

26
8.4 City working with Government (Regulatory)
Continue to work with provincial and federal governments to promote energy related
issues such as legislation to mandate a percentage of renewably sourced energy in new developments, feed in tariffs, rate changes and alterations to the BC building code.
9 Lessons Learned While the charrette ran fairly successfully on the day and feedback was positive overall, a number improvements to the process can be identified to improve similar future events:
A different ordering of activities and a longer time over which to complete them is suggested. A possible schedule for a two-day charrette could include:
Day One: Icebreaker, introductory presentations (including objectives, linkages of charrette to other planning activities and role of modelling), walk around of neighbourhood and/or PowerPoint with images, policy options overview, facilitated table top energy and emissions opportunity identification exercise. On the evening of day one, modellers incorporate participants’ suggestions and run scenarios.
Day Two: Results of modelling presented and group work to identify policy mechanisms and actions to implement retrofit and technology measures.
Logistical aspects of room set-up improving execution include situating the table containing background materials by the door. Ensure the table holding the projector is of a sufficient size to accommodate presenters’ laptops and any additional equipment.
Present energy information in a consistent way throughout. Ensure all presenters are using the same units to describe building energy intensity (GJ/m2/year or kWh/m2/year).
Prepare multiple types of visualizations to convey energy information including histograms, line graphs and scatter plot graphs. Present photos of housing and building types alongside their energy intensity values. Develop Sankey diagrams (Figure 19) to show energy inputs and energy services. Prepare maps at different geographic scales, preferring aggregated representations to the neighbourhood or census tract scale; avoid representation of energy or GHG information at the parcel level for public audiences.
Information on energy costs and savings of different technology measures should be presented alongside energy and GHG information.
An Audience Response System can add a highly dynamic element to an event. Review questions with a sample group beforehand. Do a run-through of the system in the room where it is to be used. Provide context on how voting shapes final recommendations.

Figure 19. Sankey diagrams developed based on participants feedback, including the need to identify additional low-cost retrofit combos. Source: Liz Saikali
27

28
AGENDA 10:00 – 10:05am: Welcome and presentation of overall objectives 10:05 – 10:15am: Participants introduction 10:15 – 10:45am: Background (Adrian Partridge, ENVIRON Canada) 10:45 – 11:15am: SCEC3 Model Outputs (Jessica Webster, NRCan) 11:15 – 12:15pm: Roundtable / group discussion on energy efficiency measures to achieve
various levels of fossil fuel reduction 12:15 – 1.00pm: Lunch 1:00 – 1:15pm: Presentation on local government policy tools (Katherine Rossokha, BC
Hydro) 1:15 – 2:15pm: Roundtable / group discussion on energy efficiency measures to achieve
various levels of electricity reduction plus general discussion on potential policies
2:15 – 2:30pm: Summary of energy efficiency measures and policies discussions 2:30 – 2:45pm: Break 2:45 – 3:15pm: Associated costs, implications, feasibility, options roundtable discussion
continued 3:15 – 3:45pm: Implications for expanding policies to all of Prince George 3:45 – 4:30pm: Implementation plan recommendations 4:30 pm: Closing remarks

29
ATTENDEES
Name Organization Sector
Russell Reimer Versa the Design Group Architecture
Mark Peil CHBA - Northern BC Building
Allen Creuzot Creuzot Homes & Construction Ltd. Building
Ed Rebelo Fortwood Homes Building
Gordon Bliss Investgo Ventures Ltd. Building
Joe Myatovic Myatovic Construction Building
Adrian Mohareb City of Prince George City Staff
Nelson Wight City of Prince George City Staff
Dan Adamson City of Prince George City Staff
Tiina Watt City of Prince George City Staff
Jocelyn White City of Prince George City Staff
Gina Layte-Liston City of Prince George City Staff
Marco Fornari City of Prince George City Staff
Dan Milburn City of Prince George City Staff
Mark Fercho City of Prince George City Staff
Bob Radloff City of Prince George City Staff
Dan Rogers Mayor, City of Prince George City Staff
Dave Mosure BC Hydro Energy Efficiency
Rod Croome Hometech Energy Solutions Inc. Energy Efficiency
Ken Parker The House Whisperers Energy Efficiency
David Claus UNBC Energy Efficiency
Dale Littlejohn BC Community Energy Association External Expert
Katherine Rossokha BC Hydro External Expert
Paul Bouman BC Hydro External Expert
Amanda Mitchell City of Vancouver External Expert
Adrian Partridge ENVIRON Canada External Expert
Jessica Webster Natural Resource Canada External Expert
Doug Jeffrey Crescents Community Association Local Resident
Brad Gagnon Zoe's Java House Local Resident
Joan Chess Fraser Basin Council Planning
Pascal Charest Generations Land Use Planning & Consulting Planning
Claire Negrin L&M Engineering Planning
Orland Wilkerson School of Environmental Planning, UNBC Planning
Derek de Candole UNBC Planning
Daniel Sturgeon UNBC Planning
Dean Coleman Royal Lepage Realty Real Estate
Graig Pearen Pearen Ventures / BCSEA, Prince George Renewable Energy

30
REFERENCES
Al-Kodmany, K. 1999. “Using visualization techniques for enhancing public participation in planning and design: process, implementation, and evaluation.” Landscape and Urban Planning 45: 37-45.
BC Hydro. 2009. BC Hydro’s Strategy to Advance Local Government Energy Efficiency Policies.
http://www.bchydro.com/etc/medialib/internet/documents/power_smart/sustainable_communities/advanci
ng_local_govt_energy_efficiency_policies.Par.0001.File.advancing_local_govt_energy_efficiency_policie
s.pdf
BC Ministry of the Environment. 2010. Community Energy and Emissions Inventory: City of Prince George. http://www.env.gov.bc.ca/cas/mitigation/ceei/RegionalDistricts/Fraser-
Fort_George/ceei_2007_prince_george_city.pdf
Cain, Jeff, and Evan Robinson. 2008. “A Primer on Audience Response Systems: Current Applications and Future Considerations.” American Journal of Pharmaceutical Education 72(2): 1-6.
City of Prince George. 2010. myPG: an Integrated Sustainability Plan for Prince George
http://www.mypg.ca/about/Documents/myPG_Part_1_web[1].pdf
Condon, Patrick M. 2008. Design Charrettes for Sustainable Communities. Washington: Island Press
Green Car Congress. 2007. http://www.greencarcongress.com/2007/11/study-canadian.html. HB Lanarc. 2010. Official Community Plan Growth Options Summary. http://www.mypg.ca/progress/Documents/4%20Options%20Detailed%20Overview.pdf
Pembina Institute. 2010. Green Building Leaders. Phase 1 Partner Meetings.
Salter, Jonathan D., Cam Campbell, Murray Journeay, and Stephen R. J. Sheppard. 2009. “The digital
workshop: Exploring the use on interactive and immersive visualisation tools in participatory planning.” Journal of Environmental Management 90: 2090-9101.
Smart Growth BC. 2009. Downtown Prince George Concept Plan.