Criteria and prerequisites for the use of flexible robots in small ...
Upload
khangminh22Category
view
0download
0
PAEA RESEARCH
Curriculum Report 4 PrerequisitesBy the Numbers | Data from the 2018 Prerequisite Curriculum Survey

COPYRIGHT © 2019 by the Physician Assistant Education Association
This report is distributed under the terms of the Creative Commons Attribution-NonCommercialShareAlike 4.0 International license. A reference copy of this license may be found at http://creativecommons.org/licenses/by-nd-nc/1.0/
Acknowledgements
PAEA acknowledges the Research Mission Advancement Commission (RMAC) and its current chair, Richard Dehn, MPA, PA-C, for their review and guidance. The PAEA Research Team was responsible for the development and administration of the survey as well as for the preparation of this report. For any questions regarding the contents of this report, please contact [email protected].
PAEA Research Team: Cynthia X. Yuen, MA, Director of Research & Data Analysis Ryan Chitwood, MS, Research & Data Analyst David Keahey, MSPH, PA-C, Chief Policy and Research Officer Dominique Frias, Research Coordinator
The PAEA RMAC and Research Team would like to thank the program directors, faculty, and staff who provided these data. Also, thank you to Editorial Director Elizabeth Alesbury for her editing contributions and to The YGS Group for designing the report.
Recommended Citation
Physician Assistant Education Association, By the Numbers: Curriculum Report 4: Data from the 2018 Prerequisite Curriculum Survey, Washington, DC: PAEA; 2019. doi: 10.17538/CR4.2019.003

i | CURRICULUM REPORT 4| TABLE Of CONTENTS
BY THE NUMBERSCURRiCULUM REPORT 4: DATA FROM THE 2018 PREREQUISITE CURRICULUM SURVEY
TABLE OF CONTENTS
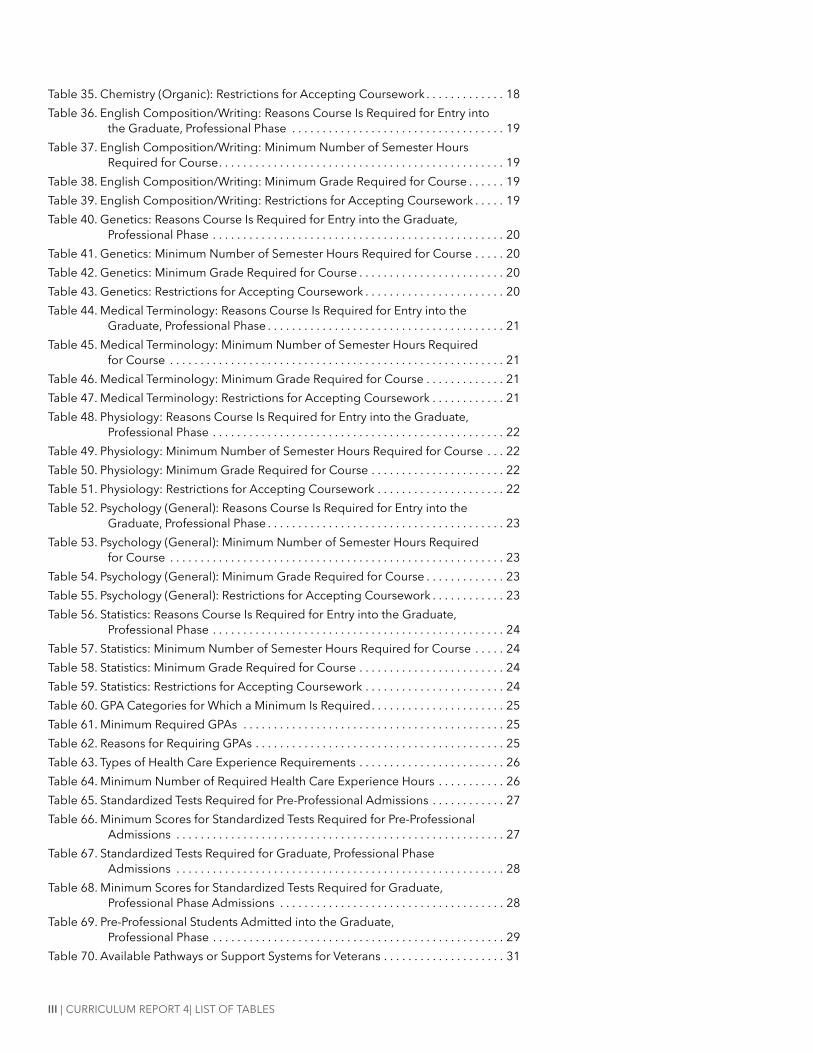
INTRODUCTION . . . . . . . . . . . . . . . . . . . . . . . . . . . . . . . . . . . . . . . . . . . . . . . . . . . . . . . V
METHODS . . . . . . . . . . . . . . . . . . . . . . . . . . . . . . . . . . . . . . . . . . . . . . . . . . . . . . . . . . . . VSurvey Instrument . . . . . . . . . . . . . . . . . . . . . . . . . . . . . . . . . . . . . . . . . . . . . . . . . . . . v
Survey Administration . . . . . . . . . . . . . . . . . . . . . . . . . . . . . . . . . . . . . . . . . . . . . . . . . v
Data Cleaning & Analysis . . . . . . . . . . . . . . . . . . . . . . . . . . . . . . . . . . . . . . . . . . . . . . vi
Questions & Data Requests . . . . . . . . . . . . . . . . . . . . . . . . . . . . . . . . . . . . . . . . . . . . . vi
SECTION 1 . PROGRAM CHARACTERISTICS . . . . . . . . . . . . . . . . . . . . . . . . . . . . . . . . .1
SECTION 2 . REQUIRED PREREQUISITE COURSEWORK, HEALTH CARE EXPERIENCE, AND TESTS . . . . . . . . . . . . . . . . . . . . . . . . . . . . . . . . . . . . . . . . . . . . . . . .5
Prerequisite Coursework . . . . . . . . . . . . . . . . . . . . . . . . . . . . . . . . . . . . . . . . . . . . . . . 6
Prerequisite Profiles . . . . . . . . . . . . . . . . . . . . . . . . . . . . . . . . . . . . . . . . . . . . . . . . . . 12
Anatomy . . . . . . . . . . . . . . . . . . . . . . . . . . . . . . . . . . . . . . . . . . . . . . . . . . . . . . . . . . . 13
Biochemistry . . . . . . . . . . . . . . . . . . . . . . . . . . . . . . . . . . . . . . . . . . . . . . . . . . . . . . . . 14
Biology (General) . . . . . . . . . . . . . . . . . . . . . . . . . . . . . . . . . . . . . . . . . . . . . . . . . . . . 15
Biology (Microbiology) . . . . . . . . . . . . . . . . . . . . . . . . . . . . . . . . . . . . . . . . . . . . . . . . 16
Chemistry (General) . . . . . . . . . . . . . . . . . . . . . . . . . . . . . . . . . . . . . . . . . . . . . . . . . . 17
Chemistry (Organic) . . . . . . . . . . . . . . . . . . . . . . . . . . . . . . . . . . . . . . . . . . . . . . . . . . 18
English Composition/Writing . . . . . . . . . . . . . . . . . . . . . . . . . . . . . . . . . . . . . . . . . . 19
Genetics . . . . . . . . . . . . . . . . . . . . . . . . . . . . . . . . . . . . . . . . . . . . . . . . . . . . . . . . . . . 20
Medical Terminology . . . . . . . . . . . . . . . . . . . . . . . . . . . . . . . . . . . . . . . . . . . . . . . . . 21
Physiology . . . . . . . . . . . . . . . . . . . . . . . . . . . . . . . . . . . . . . . . . . . . . . . . . . . . . . . . . . 22
Psychology (General) . . . . . . . . . . . . . . . . . . . . . . . . . . . . . . . . . . . . . . . . . . . . . . . . . 23
Statistics . . . . . . . . . . . . . . . . . . . . . . . . . . . . . . . . . . . . . . . . . . . . . . . . . . . . . . . . . . . 24
Required Minimum GPAs . . . . . . . . . . . . . . . . . . . . . . . . . . . . . . . . . . . . . . . . . . . . . 25
Required Health Care Experience . . . . . . . . . . . . . . . . . . . . . . . . . . . . . . . . . . . . . . . 26
Required Standardized Tests . . . . . . . . . . . . . . . . . . . . . . . . . . . . . . . . . . . . . . . . . . . 27
SECTION 3: APPLICATIONS AND ADMISSIONS . . . . . . . . . . . . . . . . . . . . . . . . . . . . 29Types of Students Admitted . . . . . . . . . . . . . . . . . . . . . . . . . . . . . . . . . . . . . . . . . . . 29
Application Materials . . . . . . . . . . . . . . . . . . . . . . . . . . . . . . . . . . . . . . . . . . . . . . . . . 33
SECTION 4 . CURRICULAR DESIGN . . . . . . . . . . . . . . . . . . . . . . . . . . . . . . . . . . . . . . . 41

ii | CURRICULUM REPORT 4 | LIST Of TABLES
LiST OF TABLESTable 1. Sponsoring Institution Attributes . . . . . . . . . . . . . . . . . . . . . . . . . . . . . . . . . . . . . . . 1Table 2. Geographic Distribution of PA Programs . . . . . . . . . . . . . . . . . . . . . . . . . . . . . . . . 3Table 3. Total PA Program Length (Months) . . . . . . . . . . . . . . . . . . . . . . . . . . . . . . . . . . . . . . 3Table 4. Number of Academic Credits Required for Program Completion . . . . . . . . . . . 3Table 5. Credentials Offered to Graduates Entering the PA Program in 2019 . . . . . . . . . 4Table 6. Estimated Size of Incoming Class . . . . . . . . . . . . . . . . . . . . . . . . . . . . . . . . . . . . . . . 4Table 7. Prerequisite Courses Required for Entry into the Graduate,
Professional Phase . . . . . . . . . . . . . . . . . . . . . . . . . . . . . . . . . . . . . . . . . . . . . . . . . 7Table 8. Reasons Prerequisite Courses are Required for Entry into the Graduate,
Professional Phase . . . . . . . . . . . . . . . . . . . . . . . . . . . . . . . . . . . . . . . . . . . . . . . . . 9Table 9. Minimum Number of Semester Hours Required for Prerequisite Courses . . . 10Table 10. Minimum Grade Required for Prerequisite Courses . . . . . . . . . . . . . . . . . . . . . 11Table 11. Restrictions for Accepting Required Prerequisite Coursework . . . . . . . . . . . . 12Table 12. Anatomy: Reasons Course Is Required for Entry into the Graduate,
Professional Phase . . . . . . . . . . . . . . . . . . . . . . . . . . . . . . . . . . . . . . . . . . . . . . . . 13Table 13. Anatomy: Minimum Number of Semester Hours Required for Course . . . . . 13Table 14. Anatomy: Minimum Grade Required for Course . . . . . . . . . . . . . . . . . . . . . . . . 13Table 15. Anatomy: Restrictions for Accepting Coursework . . . . . . . . . . . . . . . . . . . . . . . 13Table 16. Biochemistry: Reasons Course Is Required for Entry into the
Graduate, Professional Phase . . . . . . . . . . . . . . . . . . . . . . . . . . . . . . . . . . . . . . . 14Table 17. Biochemistry: Minimum Number of Semester Hours Required for Course . 14Table 18. Biochemistry: Minimum Grade Required for Course . . . . . . . . . . . . . . . . . . . . 14Table 19. Biochemistry: Restrictions for Accepting Coursework . . . . . . . . . . . . . . . . . . . 14Table 20. Biology (General): Reasons Course Is Required for Entry into the
Graduate, Professional Phase . . . . . . . . . . . . . . . . . . . . . . . . . . . . . . . . . . . . . . . 15Table 21. Biology (General): Minimum Number of Semester Hours Required for
Course . . . . . . . . . . . . . . . . . . . . . . . . . . . . . . . . . . . . . . . . . . . . . . . . . . . . . . . . . . 15Table 22. Biology (General): Minimum Grade Required for Course . . . . . . . . . . . . . . . . 15Table 23. Biology (General): Restrictions for Accepting Coursework . . . . . . . . . . . . . . . 15Table 24. Biology (Microbiology): Reasons Course Is Required for Entry into the
Graduate, Professional Phase . . . . . . . . . . . . . . . . . . . . . . . . . . . . . . . . . . . . . . . 16Table 25. Biology (Microbiology): Minimum Number of Semester Hours Required
for Course . . . . . . . . . . . . . . . . . . . . . . . . . . . . . . . . . . . . . . . . . . . . . . . . . . . . . . . 16Table 26. Biology (Microbiology): Minimum Grade Required for Course . . . . . . . . . . . 16Table 27. Biology (Microbiology): Restrictions for Accepting Coursework . . . . . . . . . . 16Table 28. Chemistry (General): Reasons Course Is Required for Entry into the
Graduate, Professional Phase . . . . . . . . . . . . . . . . . . . . . . . . . . . . . . . . . . . . . . . 17Table 29. Chemistry (General): Minimum Number of Semester Hours Required for
Course . . . . . . . . . . . . . . . . . . . . . . . . . . . . . . . . . . . . . . . . . . . . . . . . . . . . . . . . . . 17Table 30. Chemistry (General): Minimum Grade Required for Course . . . . . . . . . . . . . . 17Table 31. Chemistry (General): Restrictions for Accepting Coursework . . . . . . . . . . . . . 17Table 32. Chemistry (Organic): Reasons Course Is Required for Entry into the
Graduate, Professional Phase . . . . . . . . . . . . . . . . . . . . . . . . . . . . . . . . . . . . . . . 18Table 33. Chemistry (Organic): Minimum Number of Semester Hours Required
for Course . . . . . . . . . . . . . . . . . . . . . . . . . . . . . . . . . . . . . . . . . . . . . . . . . . . . . . . 18Table 34. Chemistry (Organic): Minimum Grade Required for Course . . . . . . . . . . . . . . 18
iii | CURRICULUM REPORT 4| LIST Of TABLES
Table 35. Chemistry (Organic): Restrictions for Accepting Coursework . . . . . . . . . . . . . 18Table 36. English Composition/Writing: Reasons Course Is Required for Entry into
the Graduate, Professional Phase . . . . . . . . . . . . . . . . . . . . . . . . . . . . . . . . . . . 19Table 37. English Composition/Writing: Minimum Number of Semester Hours
Required for Course . . . . . . . . . . . . . . . . . . . . . . . . . . . . . . . . . . . . . . . . . . . . . . . 19Table 38. English Composition/Writing: Minimum Grade Required for Course . . . . . . 19Table 39. English Composition/Writing: Restrictions for Accepting Coursework . . . . . 19Table 40. Genetics: Reasons Course Is Required for Entry into the Graduate,
Professional Phase . . . . . . . . . . . . . . . . . . . . . . . . . . . . . . . . . . . . . . . . . . . . . . . . 20Table 41. Genetics: Minimum Number of Semester Hours Required for Course . . . . . 20Table 42. Genetics: Minimum Grade Required for Course . . . . . . . . . . . . . . . . . . . . . . . . 20Table 43. Genetics: Restrictions for Accepting Coursework . . . . . . . . . . . . . . . . . . . . . . . 20Table 44. Medical Terminology: Reasons Course Is Required for Entry into the
Graduate, Professional Phase . . . . . . . . . . . . . . . . . . . . . . . . . . . . . . . . . . . . . . . 21Table 45. Medical Terminology: Minimum Number of Semester Hours Required
for Course . . . . . . . . . . . . . . . . . . . . . . . . . . . . . . . . . . . . . . . . . . . . . . . . . . . . . . . 21Table 46. Medical Terminology: Minimum Grade Required for Course . . . . . . . . . . . . . 21Table 47. Medical Terminology: Restrictions for Accepting Coursework . . . . . . . . . . . . 21Table 48. Physiology: Reasons Course Is Required for Entry into the Graduate,
Professional Phase . . . . . . . . . . . . . . . . . . . . . . . . . . . . . . . . . . . . . . . . . . . . . . . . 22Table 49. Physiology: Minimum Number of Semester Hours Required for Course . . . 22Table 50. Physiology: Minimum Grade Required for Course . . . . . . . . . . . . . . . . . . . . . . 22Table 51. Physiology: Restrictions for Accepting Coursework . . . . . . . . . . . . . . . . . . . . . 22Table 52. Psychology (General): Reasons Course Is Required for Entry into the
Graduate, Professional Phase . . . . . . . . . . . . . . . . . . . . . . . . . . . . . . . . . . . . . . . 23Table 53. Psychology (General): Minimum Number of Semester Hours Required
for Course . . . . . . . . . . . . . . . . . . . . . . . . . . . . . . . . . . . . . . . . . . . . . . . . . . . . . . . 23Table 54. Psychology (General): Minimum Grade Required for Course . . . . . . . . . . . . . 23Table 55. Psychology (General): Restrictions for Accepting Coursework . . . . . . . . . . . . 23Table 56. Statistics: Reasons Course Is Required for Entry into the Graduate,
Professional Phase . . . . . . . . . . . . . . . . . . . . . . . . . . . . . . . . . . . . . . . . . . . . . . . . 24Table 57. Statistics: Minimum Number of Semester Hours Required for Course . . . . . 24Table 58. Statistics: Minimum Grade Required for Course . . . . . . . . . . . . . . . . . . . . . . . . 24Table 59. Statistics: Restrictions for Accepting Coursework . . . . . . . . . . . . . . . . . . . . . . . 24Table 60. GPA Categories for Which a Minimum Is Required . . . . . . . . . . . . . . . . . . . . . . 25Table 61. Minimum Required GPAs . . . . . . . . . . . . . . . . . . . . . . . . . . . . . . . . . . . . . . . . . . . 25Table 62. Reasons for Requiring GPAs . . . . . . . . . . . . . . . . . . . . . . . . . . . . . . . . . . . . . . . . . 25Table 63. Types of Health Care Experience Requirements . . . . . . . . . . . . . . . . . . . . . . . . 26Table 64. Minimum Number of Required Health Care Experience Hours . . . . . . . . . . . 26Table 65. Standardized Tests Required for Pre-Professional Admissions . . . . . . . . . . . . 27Table 66. Minimum Scores for Standardized Tests Required for Pre-Professional
Admissions . . . . . . . . . . . . . . . . . . . . . . . . . . . . . . . . . . . . . . . . . . . . . . . . . . . . . . 27Table 67. Standardized Tests Required for Graduate, Professional Phase
Admissions . . . . . . . . . . . . . . . . . . . . . . . . . . . . . . . . . . . . . . . . . . . . . . . . . . . . . . 28Table 68. Minimum Scores for Standardized Tests Required for Graduate,
Professional Phase Admissions . . . . . . . . . . . . . . . . . . . . . . . . . . . . . . . . . . . . . 28Table 69. Pre-Professional Students Admitted into the Graduate,
Professional Phase . . . . . . . . . . . . . . . . . . . . . . . . . . . . . . . . . . . . . . . . . . . . . . . . 29Table 70. Available Pathways or Support Systems for Veterans . . . . . . . . . . . . . . . . . . . . 31

IV | CURRICULUM REPORT 4 | LIST Of TABLES
Table 71. Preferences or Special Consideration for Specific Student Characteristics . . 32Table 72. Narrative or Personal Statement Requirement . . . . . . . . . . . . . . . . . . . . . . . . . . 33Table 73. Minimum Number of Required Written References . . . . . . . . . . . . . . . . . . . . . 33Table 74. Types of References Required . . . . . . . . . . . . . . . . . . . . . . . . . . . . . . . . . . . . . . . . 34Table 75. Supplemental Application fee ($) . . . . . . . . . . . . . . . . . . . . . . . . . . . . . . . . . . . . 34Table 76. Reasons for Requiring an On-Site Interview . . . . . . . . . . . . . . . . . . . . . . . . . . . . 35Table 77. On-Site Interview format . . . . . . . . . . . . . . . . . . . . . . . . . . . . . . . . . . . . . . . . . . . . 35Table 78. Participants in Programs’ On-Site Interview Process . . . . . . . . . . . . . . . . . . . . . 36Table 79. Types of On-Site Exams Required . . . . . . . . . . . . . . . . . . . . . . . . . . . . . . . . . . . . 37Table 80. Uses for On-Site or Extemporaneous Writing Sample . . . . . . . . . . . . . . . . . . . 37Table 81. Applicants, Acceptances, and Matriculants, 2015–2018 . . . . . . . . . . . . . . . . . . 38Table 82. Acceptance and Matriculation Rates, 2015–2018 (%) . . . . . . . . . . . . . . . . . . . . 39Table 83. Amount of Program Deposit Required to Secure Seat ($) . . . . . . . . . . . . . . . . 39Table 84. Refundable Deposits . . . . . . . . . . . . . . . . . . . . . . . . . . . . . . . . . . . . . . . . . . . . . . . 40Table 85. Program Mission . . . . . . . . . . . . . . . . . . . . . . . . . . . . . . . . . . . . . . . . . . . . . . . . . . . 41Table 86. Curricular focus . . . . . . . . . . . . . . . . . . . . . . . . . . . . . . . . . . . . . . . . . . . . . . . . . . . 41Table 87. Pedagogical Approach. . . . . . . . . . . . . . . . . . . . . . . . . . . . . . . . . . . . . . . . . . . . . . 42Table 88. formula for Converting Clock Hours to Credit Hours: Lecture Instruction . . 42Table 89. formula for Converting Clock Hours to Credit Hours: Laboratory
Instruction . . . . . . . . . . . . . . . . . . . . . . . . . . . . . . . . . . . . . . . . . . . . . . . . . . . . . . . 43
LiST OF FiGURESfigure 1. U.S. Census Bureau Regions and Divisions . . . . . . . . . . . . . . . . . . . . . . . . . . . . . . 2figure 2. Support for Universal Prerequisites . . . . . . . . . . . . . . . . . . . . . . . . . . . . . . . . . . . . 5figure 3. Is a Bachelor’s Degree Required for Entry into the Graduate Program? . . . . . 5figure 4. Prerequisite Courses Required for Entry into the Graduate, Professional
Phase (%) . . . . . . . . . . . . . . . . . . . . . . . . . . . . . . . . . . . . . . . . . . . . . . . . . . . . . . . . . 8figure 5. Health Care Experience Requirements . . . . . . . . . . . . . . . . . . . . . . . . . . . . . . . . 26figure 6. Time Limits on Health Care Experiences . . . . . . . . . . . . . . . . . . . . . . . . . . . . . . . 27figure 7. Programs with a Pre-Professional Track . . . . . . . . . . . . . . . . . . . . . . . . . . . . . . . . 29figure 8. Programs that Accept Transfer Students from Other PA Programs . . . . . . . . . 30figure 9. Programs that Accept International Applicants . . . . . . . . . . . . . . . . . . . . . . . . . 30figure 10. Programs with Pathways or Support Systems for Veterans . . . . . . . . . . . . . . . 30Figure 11. Programs with Preferences for Specific Student Characteristics . . . . . . . . . . 31figure 12. Master’s Completion for Currently Practicing PAs . . . . . . . . . . . . . . . . . . . . . . 32figure 13. CASPA Participation . . . . . . . . . . . . . . . . . . . . . . . . . . . . . . . . . . . . . . . . . . . . . . . 33figure 14. Supplemental Application Required . . . . . . . . . . . . . . . . . . . . . . . . . . . . . . . . . 34figure 15. On-Site Interview Required . . . . . . . . . . . . . . . . . . . . . . . . . . . . . . . . . . . . . . . . . 35figure 16. On-Site Exams Required . . . . . . . . . . . . . . . . . . . . . . . . . . . . . . . . . . . . . . . . . . . 36figure 17. On-Site or Extemporaneous Writing Sample Required . . . . . . . . . . . . . . . . . 37figure 18. Schedule of Admissions Decisions . . . . . . . . . . . . . . . . . . . . . . . . . . . . . . . . . . . 38figure 19. Deposit Required to Secure Seat . . . . . . . . . . . . . . . . . . . . . . . . . . . . . . . . . . . . 39figure 20. Special Tracks Offered . . . . . . . . . . . . . . . . . . . . . . . . . . . . . . . . . . . . . . . . . . . . . 42figure 21. Part-Time Option Offered . . . . . . . . . . . . . . . . . . . . . . . . . . . . . . . . . . . . . . . . . . . 43figure 22. Distance or Online Learning Opportunities Offered . . . . . . . . . . . . . . . . . . . . 44

V | CURRICULUM REPORT 4| LIST Of TABLES
iNTRODUCTiONPhysician Assistant Education Association
Founded in 1972, the Physician Assistant Education Association (PAEA) is the only national organization representing PA education programs in the United States. At the time of the 2018 Prerequisite Curriculum Survey administration in June 2018, PAEA represented 236 PA programs. For more information about PAEA and our products and services, visit PAEAonline.org.
METHODSSurvey instrument
The 2018 Prerequisite Curriculum Survey collected data that are reported in the following sections:
Section 1. Program characteristicsIncludes general information regarding the types of PA programs represented in the dataset (e.g., geographic information, administrative housing) as collected in the 2018 Program Survey, as well as information on credits, credentials, and incoming class sizes.
Section 2. Required prerequisite coursework, health care experience, and testsIncludes information on the types of required prerequisite coursework, health care experiences, and standardized tests, as well as reasons and restrictions for these requirements.
Section 3: Applications and admissionsIncludes information on types of students admitted, student preferences and pathways, and components of the application and interview processes.
Section 4: Curricular designIncludes information on program mission, curricular focus, special tracks, and more.
The data in all sections of the survey reflect the 2017–2018 academic year.
Survey Administration
The Curriculum Survey is administered in three parts that rotate annually and that correspond to the major phases of PA school: the prerequisites/admissions phase, the didactic phase, and the clinical phase. Thus far, the Prerequisite Curriculum Survey has been administered in 2015 and 2018, the Didactic Curriculum Survey administered in 2016 and 2019, and the Clinical Curriculum Survey administered in 2017. Reports on each of the survey results are published the year following administration.
To streamline data collection, the 2018 Prerequisite Curriculum Survey was combined with the 2018 Program Directory Survey, which collected information for PAEA’s Program Directory, a searchable repository of PA programs. The content of the two surveys overlapped significantly but not entirely. All items pertaining to the Prerequisite Curriculum Survey were required of the 236 accredited programs. Participation in the Program Directory is a PAEA member benefit; thus, response to items specific to the Program Directory Survey was optional. All items that pertained to the Prerequisite Curriculum Survey only were clearly marked.
The combined 2018 Program Directory and Prerequisite Curriculum Survey was sent to the program directors of all PAEA programs, including both developing and accredited programs. This report only includes data from the 236 accredited member programs. The PAEA Research Team sent email reminders to non-respondents and conducted follow-up calls between April and October 2018 until all 236 accredited member programs had completed the survey. The survey closed in October 2018. Completion of both portions of the combined survey was optional for developing programs but Prerequisite Curriculum Survey completion was required of all 236 accredited member programs. Based on the 236 accredited member programs targeted for the Prerequisite Curriculum Survey, the survey yielded an overall response rate of 100%; however, the response rate varied for individual items.

VI | CURRICULUM REPORT 4 | METHODS
Data Cleaning & Analysis
Responses to multiple-choice questions were checked for logical consistency and examined for extreme values and possible errors. In cases of obvious misinterpretations or inconsistencies in the responses to specific items, respondents were contacted for clarification. Responses that fell outside of reasonable parameters were not included in the analyses. The number of responses to individual survey items varied slightly. The tables and figures presented in this report display aggregate data from the respondents.
In general, analyses of the data consisted of calculating descriptive statistics on the variables of interest — percentage, minimum and maximum values (range), arithmetic mean (M), standard deviation (SD), median (Mdn), and percentiles (P). Tables describing financial information also include a 10% trimmed mean (M (T)), or the mean when the bottom and top 10% of responses are excluded. For some tables and figures, percentages will not equal 100% due to rounding or when multiple responses were allowed. Total columns on tables and figures are designated by n. Exact financial data were not reported if there were fewer than five respondents. Any other notations not described here are defined in the body of the report.
Questions & Data Requests
The data from the 2018 Prerequisite Curriculum Survey, as well as custom reports using these data, are available upon request. More information is available in PAEA’s Data Request & Sharing Policies. Please direct inquiries regarding data requests or this report to the Research Team at [email protected].

1 | CURRICULUM REPORT 4| SECTION 1. PROGRAM CHARACTERISTICS
SECTiON 1. PROGRAM CHARACTERiSTiCS
TABLE 1. SPONSORiNG iNSTiTUTiON ATTRiBUTES
n %Type of institution
Private, non-profit 147 62.3Public 71 30.1Private, for-profit 15 6.4Public/private hybrid 2 0.8Military 1 0.4
AHC statusNon-Academic Health Center 167 70.8Academic Health Center 69 29.2
Administrative housingSchool of Allied Health/ Health Professions/ Health Sciences 120 50.8
Department of PA Studies/PA Program 39 16.5College/School of Medicine 36 15.3College of Arts and Sciences 13 5.5College of Graduate and Professional Studies 13 5.5Other health discipline (e.g., Nursing, Pharmacy, Podiatry, etc.) 9 3.8
Science Department 6 2.5Total 236 100.0
Note: This information was collected in the Program Survey, which was administered concurrently. Please see Program Report 34 for more information.

2 | CURRICULUM REPORT 4 | SECTION 1. PROGRAM CHARACTERISTICS
FiGURE 1. U.S. CENSUS BUREAU REGIONS AND DIVISIONS
pacific east north central
new england
west south central
middle atlantic
mountain west north central
south atlantic
east south central
west
midwest
south
northeast
REGION 1 NORTHEAST 68 PROGRAMS
DIVISION 1 NEW ENGLANDConnecticut (6)Maine (1)Massachusetts (8)New Hampshire (2)Rhode Island (2)Vermont (0)DIVISION 2 MIDDLE ATLANTICNew Jersey (3)New York (23)Pennsylvania (23)
REGION 2 MIDWEST 55 PROGRAMS
DIVISION 3 EAST NORTH CENTRALIllinois (6)Indiana (7)Michigan (6)Ohio (13)Wisconsin (5)DIVISION 4 WEST NORTH CENTRALIowa (4)Kansas (1)Minnesota (4)Missouri (4)Nebraska (3)North Dakota (1)South Dakota (1)
REGION 3 SOUTH 79 PROGRAMS
DIVISION 5 SOUTH ATLANTICDelaware (0)District of Columbia (1)florida (14)Georgia (4)Maryland (2)North Carolina (11)South Carolina (5)Virginia (8)West Virginia (3)DIVISION 6 EAST SOUTH CENTRALAlabama (2)Kentucky (3)Mississippi (1)Tennessee (8)DIVISION 7 WEST SOUTH CENTRALArkansas (2)Louisiana (3)Oklahoma (3)Texas (9)
REGION 4 WEST 34 PROGRAMS
DIVISION 8 MOUNTAINArizona (3)Colorado (3)Idaho (1)Montana (1)Nevada (2)New Mexico (2)Utah (2)Wyoming (0)DIVISION 9 PACIfICAlaska (0)California (16)Hawaii (0)Oregon (2)Washington (2)
Note: Numbers in parentheses indicate the number of PAEA member programs in each state.
19
3718
14
49
48
1417
20

3 | CURRICULUM REPORT 4| SECTION 1. PROGRAM CHARACTERISTICS
TABLE 2. GEOGRAPHiC DiSTRiBUTiON OF PA PROGRAMS
n %Northeast Region
New England Division 19 8.1Middle Atlantic Division 49 20.8Subtotal 68 28.8
Midwest RegionEast North Central Division 37 15.7West North Central Division 18 7.6Subtotal 55 23.3
South RegionSouth Atlantic Division 48 20.3East South Central Division 14 5.9West South Central Division 17 7.2Subtotal 79 33.5
West RegionMountain Division 14 5.9Pacific Division 20 8.5Subtotal 34 14.4
Total 236 100.0
TABLE 3. TOTAL PA PROGRAM LENGTH (MONTHS)
n Range M SD MdnPA program length 236 20.0–36.0 26.8 2.5 27.0
TABLE 4. NUMBER OF ACADEMIC CREDITS REQUIRED FOR PROGRAM COMPLETION
n Range M SD P10 P25P50
(Mdn) P75 P90Didactic coursework/Classroom phase 231 26.5–141.0 65.3 15.7 48.0 55.8 65.0 72.0 86.0Clinical rotations/Clinical coursework/Supervised clinical practice 231 10.0–81.0 45.7 12.4 30.0 37.0 46.0 52.0 61.0
Other hours 39 2.0–50.0 9.0 10.3 3.0 4.0 6.0 8.0 14.6Total credits 231 54.0–187.0 112.6 21.2 90.0 99.0 110.0 123.0 142.0
Note: Zeroes were excluded from calculations of “other hours.” Total credits was calculated by summing the number of required diactic, clinical, and other credits.
4 | CURRICULUM REPORT 4 | SECTION 1. PROGRAM CHARACTERISTICS
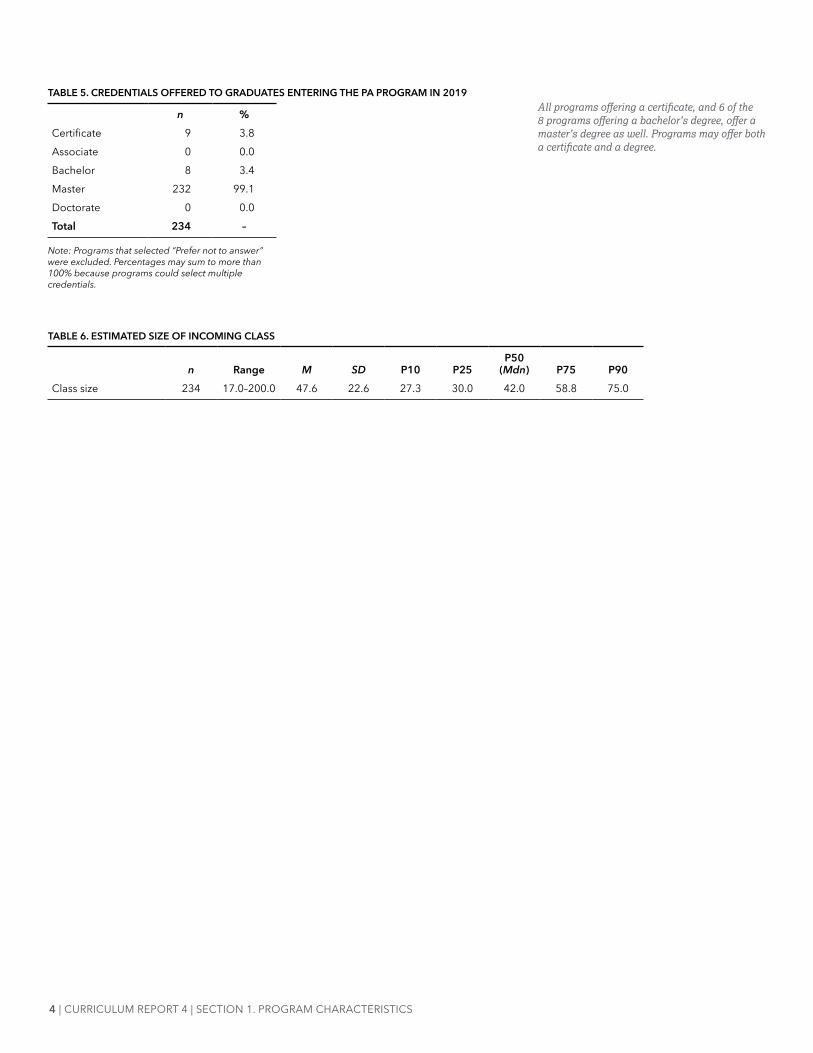
TABLE 5. CREDENTiALS OFFERED TO GRADUATES ENTERiNG THE PA PROGRAM iN 2019
n %Certificate 9 3.8Associate 0 0.0Bachelor 8 3.4Master 232 99.1Doctorate 0 0.0Total 234 –
Note: Programs that selected “Prefer not to answer” were excluded. Percentages may sum to more than 100% because programs could select multiple credentials.
TABLE 6. ESTiMATED SiZE OF iNCOMiNG CLASS
n Range M SD P10 P25P50
(Mdn) P75 P90Class size 234 17.0–200.0 47.6 22.6 27.3 30.0 42.0 58.8 75.0
All programs offering a certificate, and 6 of the 8 programs offering a bachelor’s degree, offer a master’s degree as well. Programs may offer both a certificate and a degree.

5 | CURRICULUM REPORT 4| SECTION 2. REqUIRED PREREqUISITE COURSEWORK, HEALTH CARE ExPERIENCE, AND TESTS
SECTION 2. REQUIRED PREREQUISITE COURSEWORK, HEALTH CARE EXPERiENCE, AND TESTS
FiGURE 2. SUPPORT FOR UNIVERSAL PREREQUISITES
Would support: 67.8%
Would notsupport: 32.2%
Note: n = 233 responding programs
FiGURE 3. IS A BACHELOR’S DEGREE REQUIRED FOR ENTRY INTO THE GRADUATE PROGRAM?Bachelor’s degree is not required: 5.6%
Bachelor’s degree is required: 94.4%
Note: n = 234 responding programs
Anecdotally and as quantified in this report, there is wide variability among PA programs regarding the prerequisites required for admission. Programs were asked whether they would support an effort by PA education to develop a list of universal academic course prerequisites for admission to all PA programs.
These data include programs that admit students into a pre-professional phase prior to completing a bachelor’s degree, ultimately resulting in a master’s degree upon completion of PA training.

6 | CURRICULUM REPORT 4 | SECTION 2. REqUIRED PREREqUISITE COURSEWORK, HEALTH CARE ExPERIENCE, AND TESTS
Prerequisite Coursework
Programs were asked to indicate which of a list of courses they required prospective students to complete prior to entering the graduate, professional phase of the program. Subsequently, for each required prerequisite course, programs were asked to report their reasons for the requirement, the minimum number of semester hours required, the minimum grade required, and any restrictions upon accepting the coursework.
Results are presented in two ways. First, results for all courses are presented together (pp. 7–12). Second, the results are re-organized into “Prerequisite Profiles” for the 12 prerequisite courses required by at least 20% of responding programs. These Prerequisite Profiles contain the same information reported in the aggregate tables but are organized individually by course for easy reference. These 12 courses are:
• Anatomy
• Biochemistry
• Biology (general)
• Biology (microbiology)
• Chemistry (general)
• Chemistry (organic)
• English composition/Writing
• Genetics
• Medical terminology
• Physiology
• Psychology (general)
• Statistics
7 | CURRICULUM REPORT 4| SECTION 2. REqUIRED PREREqUISITE COURSEWORK, HEALTH CARE ExPERIENCE, AND TESTS
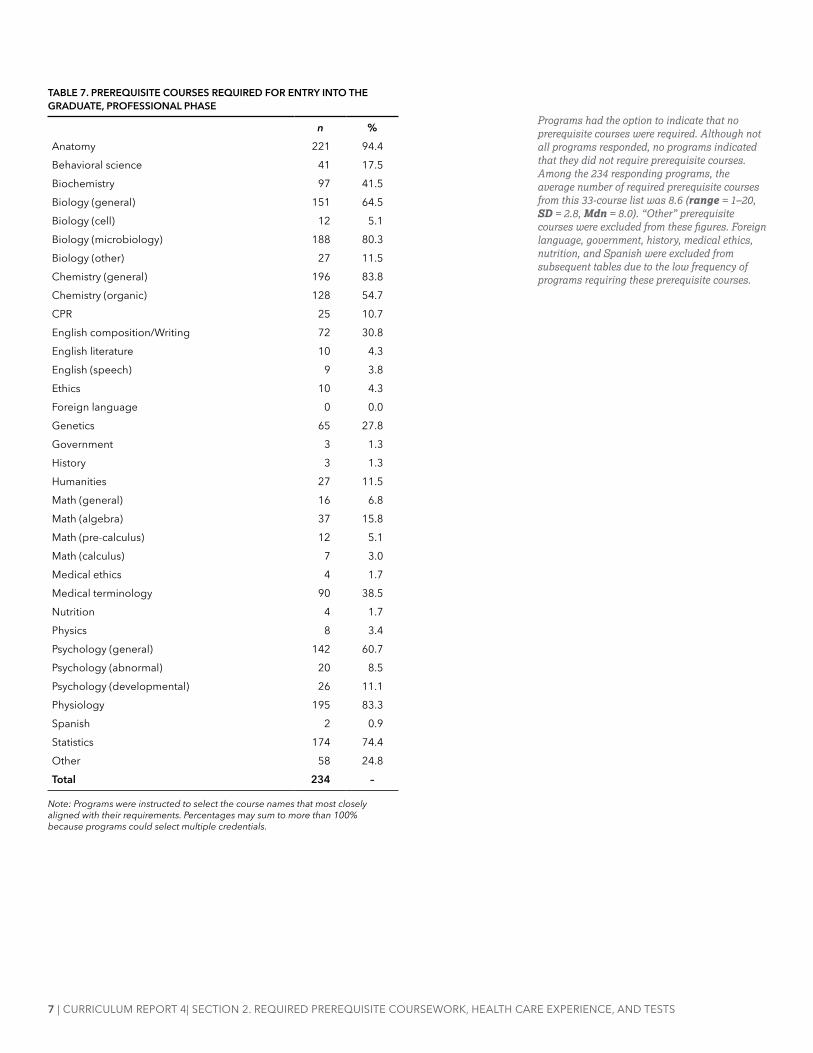
TABLE 7. PREREQUISITE COURSES REQUIRED FOR ENTRY INTO THE GRADUATE, PROFESSiONAL PHASE
n %Anatomy 221 94.4Behavioral science 41 17.5Biochemistry 97 41.5Biology (general) 151 64.5Biology (cell) 12 5.1Biology (microbiology) 188 80.3Biology (other) 27 11.5Chemistry (general) 196 83.8Chemistry (organic) 128 54.7CPR 25 10.7English composition/Writing 72 30.8English literature 10 4.3English (speech) 9 3.8Ethics 10 4.3foreign language 0 0.0Genetics 65 27.8Government 3 1.3History 3 1.3Humanities 27 11.5Math (general) 16 6.8Math (algebra) 37 15.8Math (pre-calculus) 12 5.1Math (calculus) 7 3.0Medical ethics 4 1.7Medical terminology 90 38.5Nutrition 4 1.7Physics 8 3.4Psychology (general) 142 60.7Psychology (abnormal) 20 8.5Psychology (developmental) 26 11.1Physiology 195 83.3Spanish 2 0.9Statistics 174 74.4Other 58 24.8Total 234 –
Note: Programs were instructed to select the course names that most closely aligned with their requirements. Percentages may sum to more than 100% because programs could select multiple credentials.
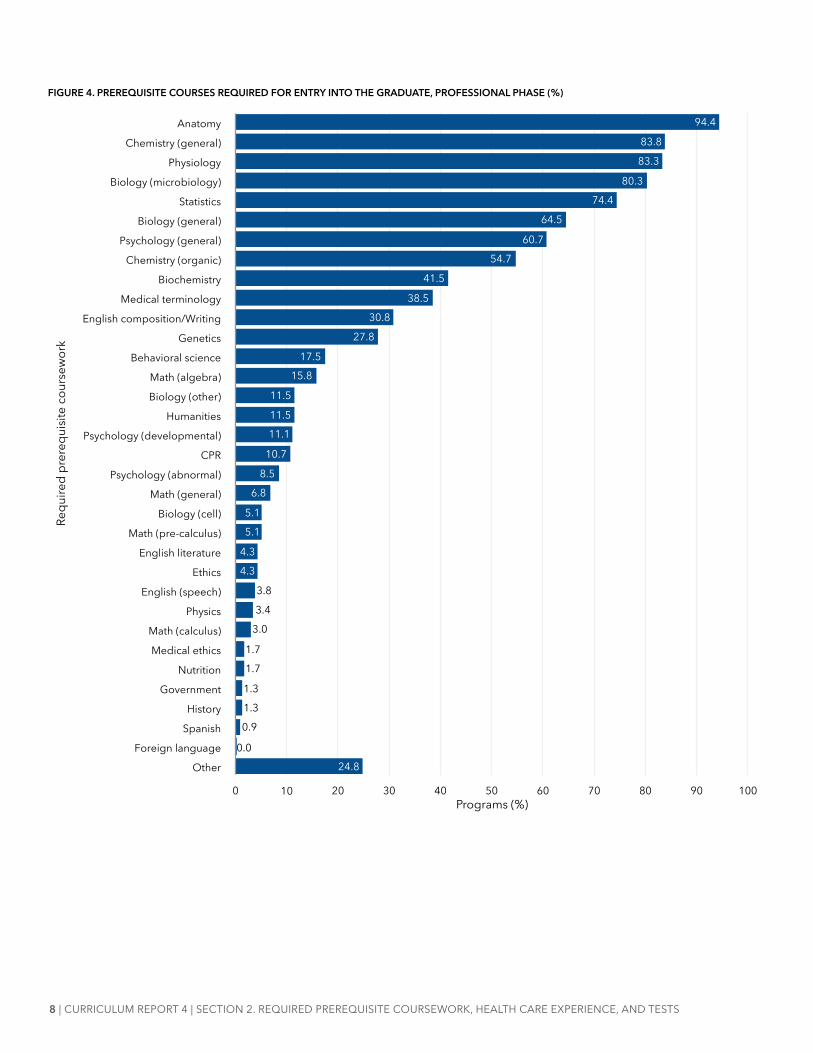
Programs had the option to indicate that no prerequisite courses were required. Although not all programs responded, no programs indicated that they did not require prerequisite courses. Among the 234 responding programs, the average number of required prerequisite courses from this 33-course list was 8.6 (range = 1–20, SD = 2.8, Mdn = 8.0). “Other” prerequisite courses were excluded from these figures. Foreign language, government, history, medical ethics, nutrition, and Spanish were excluded from subsequent tables due to the low frequency of programs requiring these prerequisite courses.
8 | CURRICULUM REPORT 4 | SECTION 2. REqUIRED PREREqUISITE COURSEWORK, HEALTH CARE ExPERIENCE, AND TESTS
FiGURE 4. PREREQUISITE COURSES REQUIRED FOR ENTRY INTO THE GRADUATE, PROFESSIONAL PHASE (%)
0 10 20 30 40 50 60 70 80 90 100
Other
foreign language
Spanish
History
Government
Nutrition
Medical ethics
Math (calculus)
Physics
English (speech)
Ethics
English literature
Math (pre-calculus)
Biology (cell)
Math (general)
Psychology (abnormal)
CPR
Psychology (developmental)
Humanities
Biology (other)
Math (algebra)
Behavioral science
Genetics
English composition/Writing
Medical terminology
Biochemistry
Chemistry (organic)
Psychology (general)
Biology (general)
Statistics
Biology (microbiology)
Physiology
Chemistry (general)
Anatomy
Programs (%)
Requ
ired
prer
equi
site
cour
sew
ork
94.4
83.8
83.3
80.3
74.4
64.5
60.7
54.7
41.5
38.5
30.8
27.8
17.5
15.8
11.5
11.5
11.1
10.7
8.5
6.8
5.1
5.1
4.3
4.3
3.8
3.4
3.0
1.7
1.7
1.3
1.3
0.9
0.024.8

9 | CURRICULUM REPORT 4| SECTION 2. REqUIRED PREREqUISITE COURSEWORK, HEALTH CARE ExPERIENCE, AND TESTS
TABLE 8. REASONS PREREQUISITE COURSES ARE REQUIRED FOR ENTRY INTO THE GRADUATE, PROFESSIONAL PHASE
Foundation for program
course(s)
Substitute for course(s) not included in the program curriculum
institutional requirement
State requirement Other reason
N n % n % n % n % n %Anatomy 220 220 100.0 2 0.9 6 2.7 1 0.5 0 0.0Behavioral science 41 39 95.1 0 0.0 5 12.2 0 0.0 0 0.0Biochemistry 95 95 100.0 0 0.0 3 3.2 0 0.0 0 0.0Biology (general) 150 149 99.3 2 1.3 5 3.3 0 0.0 1 0.7Biology (cell) 120 12 10.0 0 0.0 1 0.8 0 0.0 0 0.0Biology (microbiology) 187 187 100.0 4 2.1 6 3.2 0 0.0 0 0.0Biology (other) 27 26 96.3 1 3.7 0 0.0 0 0.0 0 0.0Chemistry (general) 195 189 96.9 5 2.6 7 3.6 1 0.5 5 2.6Chemistry (organic) 127 124 97.6 2 1.6 3 2.4 0 0.0 3 2.4CPR 25 21 84.0 0 0.0 3 12.0 0 0.0 3 12.0English composition/Writing 72 61 84.7 2 2.8 12 16.7 3 4.2 3 4.2English literature 9 5 55.6 0 0.0 5 55.6 0 0.0 0 0.0English (speech) 5 5 100.0 0 0.0 5 100.0 0 0.0 0 0.0Ethics 10 7 70.0 0 0.0 3 30.0 0 0.0 0 0.0Genetics 65 65 100.0 0 0.0 0 0.0 0 0.0 0 0.0Humanities 26 19 73.1 1 3.8 10 38.5 1 3.8 0 0.0Math (general) 16 14 87.5 0 0.0 3 18.8 0 0.0 0 0.0Math (algebra) 35 35 100.0 3 8.6 4 11.4 1 2.9 0 0.0Math (pre-calculus) 11 8 72.7 0 0.0 2 18.2 1 9.1 0 0.0Math (calculus) 7 7 100.0 0 0.0 0 0.0 0 0.0 0 0.0Medical terminology 90 89 98.9 5 5.6 2 2.2 0 0.0 1 1.1Physics 8 8 100.0 0 0.0 0 0.0 0 0.0 0 0.0Psychology (general) 141 137 97.2 1 0.7 4 2.8 1 0.7 1 0.7Psychology (abnormal) 20 20 100.0 0 0.0 1 5.0 0 0.0 0 0.0Psychology (developmental) 26 25 96.2 0 0.0 3 11.5 1 3.8 0 0.0Physiology 194 194 100.0 3 1.5 6 3.1 1 0.5 0 0.0Statistics 172 170 98.8 1 0.6 6 3.5 0 0.0 1 0.6
Note: N refers to the total number of programs that reported reasons for requiring each course. n refers to the number of programs that reported requiring each course for a particular reason. Percentages may sum to more than 100% because programs could select multiple reasons.

10 | CURRICULUM REPORT 4 | SECTION 2. REqUIRED PREREqUISITE COURSEWORK, HEALTH CARE ExPERIENCE, AND TESTS
TABLE 9. MINIMUM NUMBER OF SEMESTER HOURS REQUIRED FOR PREREQUISITE COURSES
n%
reporting Range M SD MdnAnatomy 202 91.4 1.0–8.0 4.2 1.5 4.0Behavioral science 35 85.4 3.0–9.0 4.5 1.9 3.0Biochemistry 81 83.5 3.0–4.0 3.1 0.3 3.0Biology (general) 140 92.7 3.0–16.0 5.7 2.3 4.0Biology (cell) 10 83.3 3.0–8.0 3.8 1.5 3.0Biology (microbiology) 168 89.4 1.0–5.0 3.5 0.6 4.0Biology (other) 25 92.6 3.0–16.0 5.3 3.4 4.0Chemistry (general) 180 91.8 1.0–16.0 6.4 2.4 8.0Chemistry (organic) 119 93.0 1.0–8.0 4.1 1.4 4.0CPR 7 28.0 1.0–6.0 2.3 2.0 1.0English composition/Writing 65 90.3 1.0–8.0 4.2 1.6 3.0English literature 10 100.0 3.0–6.0 3.6 1.3 3.0English (speech) 7 77.8 1.0–2.0 1.1 0.4 1.0Ethics 7 70.0 3.0–4.0 3.1 0.4 3.0Genetics 58 89.2 2.0–4.0 3.1 0.4 3.0Humanities 25 92.6 3.0–16.0 6.2 3.3 6.0Math (general) 16 100.0 3.0–6.0 3.4 1.0 3.0Math (algebra) 36 97.3 3.0–6.0 3.1 0.5 3.0Math (pre-calculus) 11 91.7 3.0–3.0 3.0 0.0 3.0Math (calculus) 7 100.0 3.0–6.0 3.4 1.1 3.0Medical terminology 76 84.4 1.0–3.0 1.4 0.7 1.0Physics 7 87.5 3.0–4.0 3.4 0.5 3.0Psychology (general) 132 93.0 2.0–9.0 3.3 1.2 3.0Psychology (abnormal) 17 85.0 2.0–3.0 2.9 0.3 3.0Psychology (developmental) 25 96.2 1.0–3.0 2.9 0.4 3.0Physiology 176 90.3 3.0–8.0 3.8 1.1 4.0Statistics 160 92.0 1.0–9.0 3.0 0.7 3.0
Note: % reporting refers to the proportion of programs requiring each course that also reported a minimum number of semester hours for that course. Zeroes were excluded prior to analysis. Prerequisite courses for which fewer than 5 programs reported minimum semester hours were excluded from this table (i.e., government, history, medical ethics, nutrition, Spanish).
Programs were asked to report the minimum number of semester credit hours required for each required prerequisite course. In cases when a program reported a range, we retained the minimum value. For example, a report of 3–4 minimum semester credit hours would be recoded as 3.

11 | CURRICULUM REPORT 4| SECTION 2. REqUIRED PREREqUISITE COURSEWORK, HEALTH CARE ExPERIENCE, AND TESTS
TABLE 10. MINIMUM GRADE REQUIRED FOR PREREQUISITE COURSES
B+ B B– C+ C C– Pass
N%
reporting n % n % n % n % n % n % n %Anatomy 171 77.4 2 1.2 27 15.8 17 9.9 3 1.8 115 67.3 7 4.1 0 0.0Behavioral science 31 75.6 0 0.0 1 3.2 2 6.5 1 3.2 24 77.4 3 9.7 0 0.0Biochemistry 71 73.2 1 1.4 8 11.3 5 7.0 1 1.4 53 74.6 3 4.2 0 0.0Biology (general) 113 74.8 0 0.0 18 15.9 11 9.7 1 0.9 77 68.1 6 5.3 0 0.0Biology (cell) 7 58.3 0 0.0 1 14.3 0 0.0 0 0.0 6 85.7 0 0.0 0 0.0Biology (microbiology) 145 77.1 2 1.4 21 14.5 13 9.0 2 1.4 100 69.0 7 4.8 0 0.0Biology (other) 20 74.1 0 0.0 2 10.0 1 5.0 0 0.0 14 70.0 3 15.0 0 0.0Chemistry (general) 146 74.5 1 0.7 22 15.1 15 10.3 3 2.1 98 67.1 7 4.8 0 0.0Chemistry (organic) 96 75.0 0 0.0 6 6.3 10 10.4 3 3.1 71 74.0 6 6.3 0 0.0CPR 13 52.0 0 0.0 1 7.7 1 7.7 0 0.0 5 38.5 1 7.7 5 38.5English composition/Writing 53 73.6 0 0.0 6 11.3 4 7.5 1 1.9 39 73.6 3 5.7 0 0.0
English literature 9 90.0 0 0.0 1 11.1 2 22.2 1 11.1 4 44.4 1 11.1 0 0.0English (speech) 5 55.6 0 0.0 0 0.0 0 0.0 1 20.0 4 80.0 0 0.0 0 0.0Ethics 8 80.0 0 0.0 1 12.5 0 0.0 1 12.5 5 62.5 1 12.5 0 0.0Genetics 54 83.1 0 0.0 9 16.7 6 11.1 2 3.7 33 61.1 4 7.4 0 0.0Humanities 21 77.8 0 0.0 2 9.5 3 14.3 1 4.8 14 66.7 1 4.8 0 0.0Math (general) 13 81.3 0 0.0 2 15.4 1 7.7 1 7.7 9 69.2 0 0.0 0 0.0Math (algebra) 27 73.0 0 0.0 4 14.8 2 7.4 1 3.7 18 66.7 2 7.4 0 0.0Math (pre-calculus) 7 58.3 0 0.0 1 14.3 2 28.6 1 14.3 3 42.9 0 0.0 0 0.0Math (calculus) 7 100.0 0 0.0 0 0.0 1 14.3 0 0.0 3 42.9 3 42.9 0 0.0Medical terminology 67 74.4 1 1.5 9 13.4 5 7.5 1 1.5 46 68.7 4 6.0 1 1.5Physics 5 62.5 0 0.0 1 20.0 1 20.0 1 20.0 2 40.0 0 0.0 0 0.0Psychology (general) 106 74.6 1 0.9 16 15.1 9 8.5 2 1.9 75 70.8 3 2.8 0 0.0Psychology (abnormal) 13 65.0 0 0.0 2 15.4 1 7.7 1 7.7 9 69.2 0 0.0 0 0.0Psychology (developmental) 19 73.1 1 5.3 3 15.8 1 5.3 1 5.3 12 63.2 1 5.3 0 0.0
Physiology 150 76.9 2 1.3 26 17.3 15 10.0 2 1.3 98 65.3 7 4.7 0 0.0Statistics 137 78.7 1 0.7 23 16.8 10 7.3 3 2.2 94 68.6 6 4.4 0 0.0
Note: N refers to the total number of programs that reported a minimum grade for each course. n refers to the number of programs that reported each minimum required grade. % reporting refers to the proportion of programs requiring each course that reported a minimum grade for that course.
Programs were asked to report the minimum grade required for each required prerequisite course. Programs could report either a numeric grade, using a 4.0 scale, or a letter grade. Prior to analysis, all numeric grades were converted to letter grades using CollegeBoard’s conversion guidelines. For example, a program-reported minimum grade of 1.7 would be converted to a C- letter grade. Some programs wrote “pass” for CPR and medical terminology; this was not converted to a letter grade but reported separately.

12 | CURRICULUM REPORT 4 | SECTION 2. REqUIRED PREREqUISITE COURSEWORK, HEALTH CARE ExPERIENCE, AND TESTS
TABLE 11. RESTRICTIONS FOR ACCEPTING REQUIRED PREREQUISITE COURSEWORK
Time limitNot
web-basedUpper
division
Lower/introductory
levelFull
sequenceLab
requiredOther
restriction
N%
reporting n % n % n % n % n % n % n %Anatomy 201 91.0 105 52.2 54 26.9 32 15.9 11 5.5 42 20.9 144 71.6 7 3.5Behavioral science 19 46.3 8 42.1 5 26.3 0 0.0 8 42.1 1 5.3 0 0.0 0 0.0Biochemistry 63 64.9 35 55.6 9 14.3 29 46.0 1 1.6 0 0.0 9 14.3 1 1.6Biology (general) 130 86.1 49 37.7 33 25.4 15 11.5 14 10.8 18 13.8 103 79.2 2 1.5Biology (cell) 11 91.7 3 27.3 4 36.4 5 45.5 0 0.0 0 0.0 5 45.5 0 0.0Biology (microbiology) 162 86.2 79 48.8 29 17.9 8 4.9 8 4.9 117 72.2 5 3.1 9 5.6Biology (other) 24 88.9 9 37.5 6 25.0 11 45.8 0 0.0 0 0.0 7 29.2 0 0.0Chemistry (general) 174 88.8 67 38.5 40 23.0 21 12.1 21 12.1 31 17.8 146 83.9 6 3.4Chemistry (organic) 107 83.6 48 44.9 8 7.5 8 7.5 5 4.7 10 9.3 74 69.2 3 2.8CPR 10 40.0 6 60.0 0 0.0 1 10.0 2 20.0 1 10.0 0 0.0 0 0.0English composition/Writing 28 38.9 13 46.4 4 14.3 1 3.6 10 35.7 2 7.1 0 0.0 0 0.0
English literature 4 40.0 1 25.0 1 25.0 0 0.0 2 50.0 1 25.0 0 0.0 0 0.0English (speech) 2 22.2 1 50.0 0 0.0 0 0.0 1 50.0 0 0.0 0 0.0 0 0.0Ethics 6 60.0 4 66.7 1 16.7 0 0.0 0 0.0 0 0.0 0 0.0 0 0.0Genetics 41 63.1 26 63.4 8 19.5 8 19.5 3 7.3 1 2.4 3 7.3 3 7.3Humanities 19 70.4 2 10.5 2 10.5 1 5.3 4 21.1 1 5.3 0 0.0 0 0.0Math (general) 6 37.5 3 50.0 1 16.7 1 16.7 1 16.7 1 16.7 0 0.0 0 0.0Math (algebra) 19 51.4 5 26.3 4 21.1 5 26.3 6 31.6 1 5.3 0 0.0 0 0.0Math (pre-calculus) 7 58.3 4 57.1 1 14.3 2 28.6 2 28.6 1 14.3 0 0.0 0 0.0Math (calculus) 5 71.4 2 40.0 1 20.0 0 0.0 2 40.0 0 0.0 0 0.0 0 0.0Medical terminology 39 43.3 26 66.7 1 2.6 4 10.3 8 20.5 1 2.6 0 0.0 2 5.1Physics 6 75.0 3 50.0 0 0.0 1 16.7 2 33.3 0 0.0 2 33.3 0 0.0Psychology (general) 72 50.7 39 54.2 9 12.5 4 5.6 22 30.6 1 1.4 1 1.4 2 2.8Psychology (abnormal) 14 70.0 8 57.1 1 7.1 3 21.4 3 21.4 0 0.0 0 0.0 1 7.1Psychology (developmental) 15 57.7 6 40.0 2 13.3 5 33.3 3 20.0 0 0.0 0 0.0 2 13.3
Physiology 168 86.2 95 56.5 42 25.0 27 16.1 11 6.5 35 20.8 96 57.1 8 4.8Statistics 90 51.7 55 61.1 13 14.4 12 13.3 19 21.1 3 3.3 1 1.1 4 4.4
Note: N refers to the total number of programs that reported coursework restrictions. n refers to the number of programs that reported a particular restriction for each course. % reporting refers to the proportion of programs requiring each course that reported at least one coursework restriction. Percentages may sum to more than 100% because programs could select multiple restrictions.
Prerequisite Profiles
In this section, the results from the previous tables are re-organized into “Prerequisite Profiles” for the 12 prerequisite courses required by at least 20% of responding programs. These Prerequisite Profiles contain the same information reported in the aggregate tables but are organized individually by course for easy reference.

13 | CURRICULUM REPORT 4| SECTION 2. REqUIRED PREREqUISITE COURSEWORK, HEALTH CARE ExPERIENCE, AND TESTS
Anatomy
94.4% (n = 221) of responding programs required students to take anatomy before entering the graduate, professional phase of the program.
TABLE 12. ANATOMY: REASONS COURSE IS REQUIRED FOR ENTRY INTO THE GRADUATE, PROFESSiONAL PHASE
n %foundation for program course(s) 220 100.0Substitute for course(s) not included in the program curriculum 2 0.9Institutional requirement 6 2.7State requirement 1 0.5Other reason 0 0.0Total 220 –
Note: Percentages may sum to more than 100% because programs could select multiple reasons.
TABLE 13. ANATOMY: MINIMUM NUMBER OF SEMESTER HOURS REQUIRED FOR COURSE
n Range M SD MdnSemester hours 202 1.0–8.0 4.2 1.5 4.0
TABLE 14. ANATOMY: MINIMUM GRADE REQUIRED FOR COURSE
n %B+ 2 1.2B 27 15.8B– 17 9.9C+ 3 1.8C 115 67.3C– 7 4.1Total 171 100.0
TABLE 15. ANATOMY: RESTRiCTiONS FOR ACCEPTiNG COURSEWORK
n %Time limit 105 52.2Not web-based 54 26.9Upper division 32 15.9Lower/Introductory level 11 5.5full sequence 42 20.9Lab required 144 71.6Other restriction 7 3.5Total 201 –
Note: Percentages may sum to more than 100% because programs could select multiple restrictions.

14 | CURRICULUM REPORT 4 | SECTION 2. REqUIRED PREREqUISITE COURSEWORK, HEALTH CARE ExPERIENCE, AND TESTS
Biochemistry
41.5% (n = 97) of responding programs required students to take biochemistry before entering the graduate, professional phase of the program.
TABLE 16. BIOCHEMISTRY: REASONS COURSE IS REQUIRED FOR ENTRY INTO THE GRADUATE, PROFESSIONAL PHASE
n %foundation for program course(s) 95 100.0Substitute for course(s) not included in the program curriculum 0 0.0
Institutional requirement 3 3.2State requirement 0 0.0Other reason 0 0.0Total 95 –
Note: Percentages may sum to more than 100% because programs could select multiple reasons.
TABLE 17. BIOCHEMISTRY: MINIMUM NUMBER OF SEMESTER HOURS REQUIRED FOR COURSE
n Range M SD MdnSemester hours 81 3.0–4.0 3.1 0.3 3.0
TABLE 18. BIOCHEMISTRY: MINIMUM GRADE REQUIRED FOR COURSE
n %B+ 1 1.4B 8 11.3B– 5 7.0C+ 1 1.4C 53 74.6C– 3 4.2Total 71 100.0
TABLE 19. BiOCHEMiSTRY: RESTRiCTiONS FOR ACCEPTiNG COURSEWORK
n %Time limit 35 55.6Not web-based 9 14.3Upper division 29 46.0Lower/Introductory level 1 1.6full sequence 0 0.0Lab required 9 14.3Other restriction 1 1.6Total 63 –
Note: Percentages may sum to more than 100% because programs could select multiple restrictions.

15 | CURRICULUM REPORT 4| SECTION 2. REqUIRED PREREqUISITE COURSEWORK, HEALTH CARE ExPERIENCE, AND TESTS
Biology (General)
64.5% (n = 151) of responding programs required students to take biology (general) before entering the graduate, professional phase of the program.
TABLE 20. BIOLOGY (GENERAL): REASONS COURSE IS REQUIRED FOR ENTRY INTO THE GRADUATE, PROFESSIONAL PHASE
n %foundation for program course(s) 149 99.3Substitute for course(s) not included in the program curriculum 2 1.3
Institutional requirement 5 3.3State requirement 0 0.0Other reason 1 0.7Total 150 –
Note: Percentages may sum to more than 100% because programs could select multiple reasons.
TABLE 21. BIOLOGY (GENERAL): MINIMUM NUMBER OF SEMESTER HOURS REQUIRED FOR COURSE
n Range M SD MdnSemester hours 140 3.0–16.0 5.7 2.3 4.0
TABLE 22. BIOLOGY (GENERAL): MINIMUM GRADE REQUIRED FOR COURSE
n %B+ 0 0.0B 18 15.9B– 5 7.0C+ 1 0.9C 77 68.1C– 6 5.3Total 113 100.0
TABLE 23. BiOLOGY (GENERAL): RESTRiCTiONS FOR ACCEPTiNG COURSEWORK
n %Time limit 49 37.7Not web-based 33 25.4Upper division 15 11.5Lower/Introductory level 14 10.8full sequence 18 13.8Lab required 103 79.2Other restriction 2 1.5Total 130 –
Note: Percentages may sum to more than 100% because programs could select multiple restrictions.

16 | CURRICULUM REPORT 4 | SECTION 2. REqUIRED PREREqUISITE COURSEWORK, HEALTH CARE ExPERIENCE, AND TESTS
Biology (Microbiology)
80.3% (n = 188) of responding programs required students to take biology (microbiology) before entering the graduate, professional phase of the program.
TABLE 24. BIOLOGY (MICROBIOLOGY): REASONS COURSE IS REQUIRED FOR ENTRY INTO THE GRADUATE, PROFESSiONAL PHASE
n %foundation for program course(s) 187 100.0Substitute for course(s) not included in the program curriculum 4 2.1
Institutional requirement 6 3.2State requirement 0 0.0Other reason 0 0.0Total 187 –
Note: Percentages may sum to more than 100% because programs could select multiple reasons.
TABLE 25. BIOLOGY (MICROBIOLOGY): MINIMUM NUMBER OF SEMESTER HOURS REQUIRED FOR COURSE
n Range M SD MdnSemester hours 168 1.0–5.0 3.5 0.6 4.0
TABLE 26. BIOLOGY (MICROBIOLOGY): MINIMUM GRADE REQUIRED FOR COURSE
n %B+ 2 1.4B 21 14.5B– 13 9.0C+ 2 1.4C 100 69.0C– 7 4.8Total 145 100.0
TABLE 27. BiOLOGY (MiCROBiOLOGY): RESTRiCTiONS FOR ACCEPTiNG COURSEWORK
n %Time limit 79 48.8Not web-based 29 17.9Upper division 8 4.9Lower/Introductory level 8 4.9full sequence 117 72.2Lab required 5 3.1Other restriction 9 5.6Total 162 –
Note: Percentages may sum to more than 100% because programs could select multiple restrictions.

17 | CURRICULUM REPORT 4| SECTION 2. REqUIRED PREREqUISITE COURSEWORK, HEALTH CARE ExPERIENCE, AND TESTS
Chemistry (General)
83.8% (n = 196) of responding programs required students to take chemistry (general) before entering the graduate, professional phase of the program.
TABLE 28. CHEMISTRY (GENERAL): REASONS COURSE IS REQUIRED FOR ENTRY INTO THE GRADUATE, PROFESSiONAL PHASE
n %foundation for program course(s) 189 96.9Substitute for course(s) not included in the program curriculum 5 2.6
Institutional requirement 7 3.6State requirement 1 0.5Other reason 5 2.6Total 195 –
Note: Percentages may sum to more than 100% because programs could select multiple reasons.
TABLE 29. CHEMISTRY (GENERAL): MINIMUM NUMBER OF SEMESTER HOURS REQUIRED FOR COURSE
n Range M SD MdnSemester hours 180 1.0–16.0 6.4 2.4 8.0
TABLE 30. CHEMISTRY (GENERAL): MINIMUM GRADE REQUIRED FOR COURSE
n %B+ 1 0.7B 22 15.1B– 15 10.3C+ 3 2.1C 98 67.1C– 7 4.8Total 146 100.0
TABLE 31. CHEMiSTRY (GENERAL): RESTRiCTiONS FOR ACCEPTiNG COURSEWORK
n %Time limit 67 38.5Not web-based 40 23.0Upper division 21 12.1Lower/Introductory level 21 12.1full sequence 31 17.8Lab required 146 83.9Other restriction 6 3.4Total 174 –
Note: Percentages may sum to more than 100% because programs could select multiple restrictions.

18 | CURRICULUM REPORT 4 | SECTION 2. REqUIRED PREREqUISITE COURSEWORK, HEALTH CARE ExPERIENCE, AND TESTS
Chemistry (Organic)
54.7% (n = 128) of responding programs required students to take chemistry (organic) before entering the graduate, professional phase of the program.
TABLE 32. CHEMISTRY (ORGANIC): REASONS COURSE IS REQUIRED FOR ENTRY INTO THE GRADUATE, PROFESSiONAL PHASE
n %foundation for program course(s) 124 97.6Substitute for course(s) not included in the program curriculum 2 1.6
Institutional requirement 3 2.4State requirement 0 0.0Other reason 3 2.4Total 127 –
Note: Percentages may sum to more than 100% because programs could select multiple reasons.
TABLE 33. CHEMISTRY (ORGANIC): MINIMUM NUMBER OF SEMESTER HOURS REQUIRED FOR COURSE
n Range M SD MdnSemester hours 119 1.0–8.0 4.1 1.4 4.0
TABLE 34. CHEMISTRY (ORGANIC): MINIMUM GRADE REQUIRED FOR COURSE
n %B+ 0 0.0B 6 6.3B– 10 10.4C+ 3 3.1C 71 74.0C– 6 6.3Total 96 100.0
TABLE 35. CHEMiSTRY (ORGANiC): RESTRiCTiONS FOR ACCEPTiNG COURSEWORK
n %Time limit 48 44.9Not web-based 8 7.5Upper division 8 7.5Lower/Introductory level 5 4.7full sequence 10 9.3Lab required 74 69.2Other restriction 3 2.8Total 107 –
Note: Percentages may sum to more than 100% because programs could select multiple restrictions.

19 | CURRICULUM REPORT 4| SECTION 2. REqUIRED PREREqUISITE COURSEWORK, HEALTH CARE ExPERIENCE, AND TESTS
English Composition/Writing
30.8% (n = 72) of responding programs required students to take English composition/writing before entering the graduate, professional phase of the program.
TABLE 36. ENGLISH COMPOSITION/WRITING: REASONS COURSE IS REQUIRED FOR ENTRY INTO THE GRADUATE, PROFESSiONAL PHASE
n %foundation for program course(s) 61 84.7Substitute for course(s) not included in the program curriculum 2 2.8
Institutional requirement 12 16.7State requirement 3 4.2Other reason 3 4.2Total 72 –
Note: Percentages may sum to more than 100% because programs could select multiple reasons.
TABLE 37. ENGLISH COMPOSITION/WRITING: MINIMUM NUMBER OF SEMESTER HOURS REQUIRED FOR COURSE
n Range M SD MdnSemester hours 65 1.0–8.0 4.2 1.6 3.0
TABLE 38. ENGLISH COMPOSITION/WRITING: MINIMUM GRADE REQUIRED FOR COURSE
n %B+ 0 0.0B 6 11.3B– 4 7.5C+ 1 1.9C 39 73.6C– 3 5.7Total 53 100.0
TABLE 39. ENGLiSH COMPOSiTiON/WRiTiNG: RESTRiCTiONS FOR ACCEPTiNG COURSEWORK
n %Time limit 13 46.4Not web-based 4 14.3Upper division 1 3.6Lower/Introductory level 10 35.7full sequence 2 7.1Lab required 0 0.0Other restriction 0 0.0Total 28 –
Note: Percentages may sum to more than 100% because programs could select multiple restrictions.

20 | CURRICULUM REPORT 4 | SECTION 2. REqUIRED PREREqUISITE COURSEWORK, HEALTH CARE ExPERIENCE, AND TESTS
Genetics
27.8% (n = 65) of responding programs required students to take genetics before entering the graduate, professional phase of the program.
TABLE 40. GENETICS: REASONS COURSE IS REQUIRED FOR ENTRY INTO THE GRADUATE, PROFESSiONAL PHASE
n %foundation for program course(s) 65 100.0Substitute for course(s) not included in the program curriculum 0 0.0
Institutional requirement 0 0.0State requirement 0 0.0Other reason 0 0.0Total 65 –
Note: Percentages may sum to more than 100% because programs could select multiple reasons.
TABLE 41. GENETICS: MINIMUM NUMBER OF SEMESTER HOURS REQUIRED FOR COURSE
n Range M SD MdnSemester hours 58 2.0–4.0 3.1 0.4 3.0
TABLE 42. GENETICS: MINIMUM GRADE REQUIRED FOR COURSE
n %B+ 0 0.0B 9 16.7B– 6 11.1C+ 2 3.7C 33 61.1C– 4 7.4Total 54 100.0
TABLE 43. GENETiCS: RESTRiCTiONS FOR ACCEPTiNG COURSEWORK
n %Time limit 26 63.4Not web-based 8 19.5Upper division 8 19.5Lower/Introductory level 3 7.3full sequence 1 2.4Lab required 3 7.3Other restriction 3 7.3Total 41 –
Note: Percentages may sum to more than 100% because programs could select multiple restrictions.

21 | CURRICULUM REPORT 4| SECTION 2. REqUIRED PREREqUISITE COURSEWORK, HEALTH CARE ExPERIENCE, AND TESTS
Medical Terminology
38.5% (n = 90) of responding programs required students to take medical terminology before entering the graduate, professional phase of the program.
TABLE 44. MEDICAL TERMINOLOGY: REASONS COURSE IS REQUIRED FOR ENTRY INTO THE GRADUATE, PROFESSiONAL PHASE
n %foundation for program course(s) 89 98.9Substitute for course(s) not included in the program curriculum 5 5.6
Institutional requirement 2 2.2State requirement 0 0.0Other reason 1 1.1Total 90 –
Note: Percentages may sum to more than 100% because programs could select multiple reasons.
TABLE 45. MEDICAL TERMINOLOGY: MINIMUM NUMBER OF SEMESTER HOURS REQUIRED FOR COURSE
n Range M SD MdnSemester hours 76 1.0–3.0 1.4 0.7 1.0
TABLE 46. MEDICAL TERMINOLOGY: MINIMUM GRADE REQUIRED FOR COURSE
n %B+ 1 1.5B 9 13.4B– 5 7.5C+ 1 1.5C 46 68.7C– 4 6.0Total 67 100.0
TABLE 47. MEDiCAL TERMiNOLOGY: RESTRiCTiONS FOR ACCEPTiNG COURSEWORK
n %Time limit 26 66.7Not web-based 1 2.6Upper division 4 10.3Lower/Introductory level 8 20.5full sequence 1 2.6Lab required 0 0.0Other restriction 2 5.1Total 39 –
Note: Percentages may sum to more than 100% because programs could select multiple restrictions.

22 | CURRICULUM REPORT 4 | SECTION 2. REqUIRED PREREqUISITE COURSEWORK, HEALTH CARE ExPERIENCE, AND TESTS
Physiology
83.3% (n = 195) of responding programs required students to take physiology before entering the graduate, professional phase of the program.
TABLE 48. PHYSIOLOGY: REASONS COURSE IS REQUIRED FOR ENTRY INTO THE GRADUATE, PROFESSiONAL PHASE
n %foundation for program course(s) 194 100.0Substitute for course(s) not included in the program curriculum 3 1.5
Institutional requirement 6 3.1State requirement 1 0.5Other reason 0 0.0Total 194 –
Note: Percentages may sum to more than 100% because programs could select multiple reasons.
TABLE 49. PHYSIOLOGY: MINIMUM NUMBER OF SEMESTER HOURS REQUIRED FOR COURSE
n Range M SD MdnSemester hours 176 3.0–8.0 3.8 1.1 4.0
TABLE 50. PHYSIOLOGY: MINIMUM GRADE REQUIRED FOR COURSE
n %B+ 2 1.3B 26 17.3B– 15 10.0C+ 2 1.3C 98 65.3C– 7 4.7Total 150 100.0
TABLE 51. PHYSiOLOGY: RESTRiCTiONS FOR ACCEPTiNG COURSEWORK
n %Time limit 95 56.5Not web-based 42 25.0Upper division 27 16.1Lower/Introductory level 11 6.5full sequence 35 20.8Lab required 96 57.1Other restriction 8 4.8Total 168 –
Note: Percentages may sum to more than 100% because programs could select multiple restrictions.

23 | CURRICULUM REPORT 4| SECTION 2. REqUIRED PREREqUISITE COURSEWORK, HEALTH CARE ExPERIENCE, AND TESTS
Psychology (General)
60.7% (n = 142) of responding programs required students to take psychology (general) before entering the graduate, professional phase of the program.
TABLE 52. PSYCHOLOGY (GENERAL): REASONS COURSE IS REQUIRED FOR ENTRY INTO THE GRADUATE, PROFESSiONAL PHASE
n %foundation for program course(s) 137 97.2Substitute for course(s) not included in the program curriculum 1 0.7
Institutional requirement 4 2.8State requirement 1 0.7Other reason 1 0.7Total 141 –
Note: Percentages may sum to more than 100% because programs could select multiple reasons.
TABLE 53. PSYCHOLOGY (GENERAL): MINIMUM NUMBER OF SEMESTER HOURS REQUIRED FOR COURSE
n Range M SD MdnSemester hours 132 2.0–9.0 3.3 1.2 3.0
TABLE 54. PSYCHOLOGY (GENERAL): MINIMUM GRADE REQUIRED FOR COURSE
n %B+ 1 0.9B 16 15.1B– 9 8.5C+ 2 1.9C 75 70.8C– 3 2.8Total 106 74.6
TABLE 55. PSYCHOLOGY (GENERAL): RESTRiCTiONS FOR ACCEPTiNG COURSEWORK
n %Time limit 39 54.2Not web-based 9 12.5Upper division 4 5.6Lower/Introductory level 22 30.6full sequence 1 1.4Lab required 1 1.4Other restriction 2 2.8Total 72 –
Note: Percentages may sum to more than 100% because programs could select multiple restrictions.

24 | CURRICULUM REPORT 4 | SECTION 2. REqUIRED PREREqUISITE COURSEWORK, HEALTH CARE ExPERIENCE, AND TESTS
Statistics
74.4% (n = 174) of responding programs required students to take statistics before entering the graduate, professional phase of the program.
TABLE 56. STATISTICS: REASONS COURSE IS REQUIRED FOR ENTRY INTO THE GRADUATE, PROFESSiONAL PHASE
n %foundation for program course(s) 170 98.8Substitute for course(s) not included in the program curriculum 1 0.6
Institutional requirement 6 3.5State requirement 0 0.0Other reason 1 0.6Total 172 –
Note: Percentages may sum to more than 100% because programs could select multiple reasons.
TABLE 57. STATISTICS: MINIMUM NUMBER OF SEMESTER HOURS REQUIRED FOR COURSE
n Range M SD MdnSemester hours 160 1.0–9.0 3.0 0.7 3.0
TABLE 58. STATISTICS: MINIMUM GRADE REQUIRED FOR COURSE
n %B+ 1 0.7B 23 16.8B– 10 7.3C+ 3 2.2C 94 68.6C– 6 4.4Total 137 100.0
TABLE 59. STATiSTiCS: RESTRiCTiONS FOR ACCEPTiNG COURSEWORK
n %Time limit 55 61.1Not web-based 13 14.4Upper division 12 13.3Lower/Introductory level 19 21.1full sequence 3 3.3Lab required 1 1.1Other restriction 4 4.4Total 90 –
Note: Percentages may sum to more than 100% because programs could select multiple restrictions.

25 | CURRICULUM REPORT 4| SECTION 2. REqUIRED PREREqUISITE COURSEWORK, HEALTH CARE ExPERIENCE, AND TESTS
Required Minimum GPAs
From a list of different grade point average (GPA) categories, programs were asked to indicate the GPA categories for which a minimum was required. Programs’ reports of “Other” GPAs were excluded from analysis. Subsequently, for each required GPA category, programs were asked to report the minimum GPA accepted for entry into the program and the reasons for the requirements.
TABLE 60. GPA CATEGORIES FOR WHICH A MINIMUM IS REQUIRED
n %Overall undergraduate GPA 183 83.6Science undergraduate GPA 121 55.3Non-science undergraduate GPA 9 4.1Biology, chemistry, and physics (BCP) GPA 10 4.6Prerequisite GPA 72 32.9No minimum GPAs required 12 5.5Total 219 –
Note: Percentages may sum to more than 100% because programs could select multiple required GPAs.
TABLE 61. MINIMUM REQUIRED GPAs
n%
reporting Range M SD MdnOverall undergraduate GPA 181 98.9 2.50–3.40 3.0 0.1 3.0Science undergraduate GPA 119 98.3 2.75–3.40 3.0 0.1 3.0Non-science undergraduate GPA 9 100.0 2.33–3.25 2.9 0.3 3.0Biology, chemistry, and physics (BCP) GPA 10 100.0 2.75–3.25 3.0 0.1 3.0Prerequisite GPA 71 98.6 2.00–3.50 2.9 0.3 3.0
Note: % reporting refers to the proportion of programs requiring each GPA that also reported the minimum GPA required.
TABLE 62. REASONS FOR REQUIRING GPAs
University or graduate school
requirement
Shown to predict ability
to complete the program
Narrow the applicant pool Other reason
N%
reporting n % n % n % n %Overall undergraduate GPA 182 99.5 64 35.2 132 72.5 85 46.7 5 2.7Science undergraduate GPA 119 98.3 21 17.6 98 82.4 54 45.4 5 4.2Non-science undergraduate GPA 9 100.0 3 33.3 5 55.6 3 33.3 0 0.0Biology, chemistry, and physics (BCP) GPA 10 100.0 1 10.0 9 90.0 4 40.0 1 10.0Prerequisite GPA 72 100.0 13 18.1 54 75.0 33 45.8 6 8.3
Note: N refers to the total number of programs that reported reasons for requiring a particular type of GPA. % reporting refers to the proportion of programs requiring each GPA that also reported their reasons for the requirement. n refers to the number of programs that reported a particular reason for each type of GPA. Percentages may sum to more than 100% because programs could select multiple reasons.
“No minimum GPAs required” was an exclusive response, meaning that, if a program selected this option, they could not then select other required GPA categories in addition. 5.5% of responding programs indicated that they did not have any minimum GPA requirements.
26 | CURRICULUM REPORT 4 | SECTION 2. REqUIRED PREREqUISITE COURSEWORK, HEALTH CARE ExPERIENCE, AND TESTS
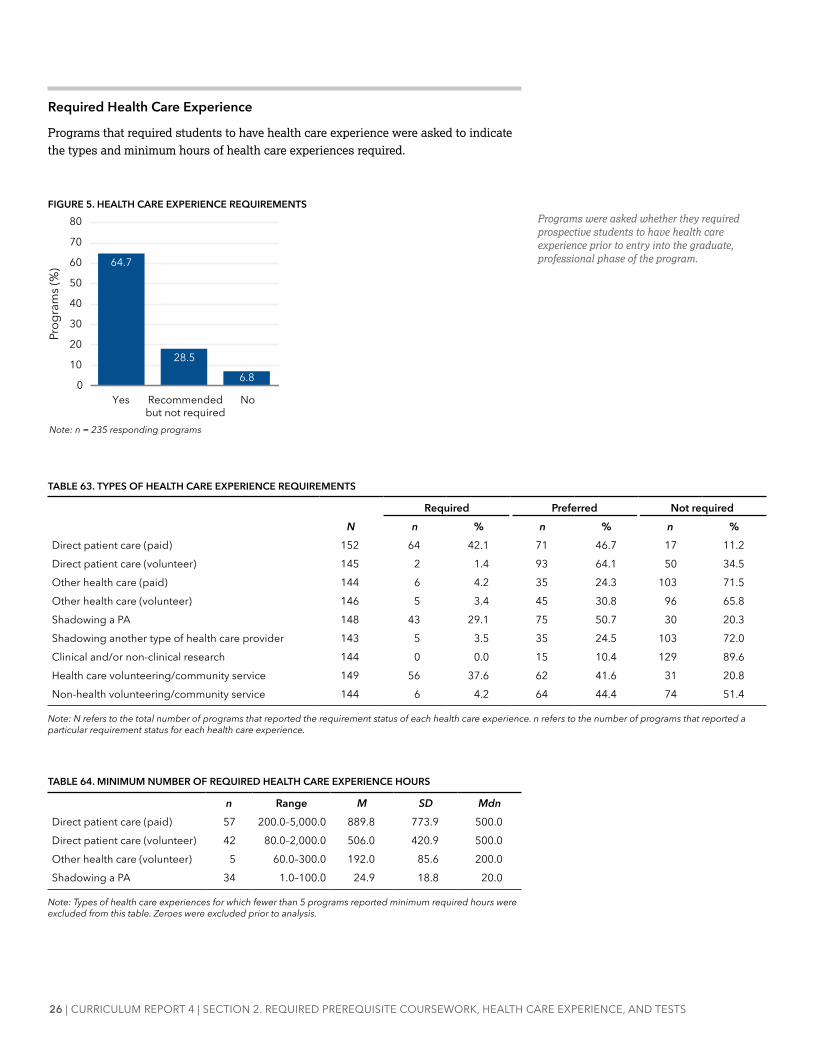
Required Health Care Experience
Programs that required students to have health care experience were asked to indicate the types and minimum hours of health care experiences required.
FiGURE 5. HEALTH CARE EXPERIENCE REQUIREMENTS
64.7
28.5
0
10
20
30
40
50
60
80
70
Yes Recommendedbut not required
6.8
No
Prog
ram
s (%
)
Note: n = 235 responding programs
TABLE 63. TYPES OF HEALTH CARE EXPERIENCE REQUIREMENTS
Required Preferred Not requiredN n % n % n %
Direct patient care (paid) 152 64 42.1 71 46.7 17 11.2Direct patient care (volunteer) 145 2 1.4 93 64.1 50 34.5Other health care (paid) 144 6 4.2 35 24.3 103 71.5Other health care (volunteer) 146 5 3.4 45 30.8 96 65.8Shadowing a PA 148 43 29.1 75 50.7 30 20.3Shadowing another type of health care provider 143 5 3.5 35 24.5 103 72.0Clinical and/or non-clinical research 144 0 0.0 15 10.4 129 89.6Health care volunteering/community service 149 56 37.6 62 41.6 31 20.8Non-health volunteering/community service 144 6 4.2 64 44.4 74 51.4
Note: N refers to the total number of programs that reported the requirement status of each health care experience. n refers to the number of programs that reported a particular requirement status for each health care experience.
TABLE 64. MINIMUM NUMBER OF REQUIRED HEALTH CARE EXPERIENCE HOURS
n Range M SD MdnDirect patient care (paid) 57 200.0–5,000.0 889.8 773.9 500.0Direct patient care (volunteer) 42 80.0–2,000.0 506.0 420.9 500.0Other health care (volunteer) 5 60.0–300.0 192.0 85.6 200.0Shadowing a PA 34 1.0–100.0 24.9 18.8 20.0
Note: Types of health care experiences for which fewer than 5 programs reported minimum required hours were excluded from this table. Zeroes were excluded prior to analysis.
Programs were asked whether they required prospective students to have health care experience prior to entry into the graduate, professional phase of the program.

27 | CURRICULUM REPORT 4| SECTION 2. REqUIRED PREREqUISITE COURSEWORK, HEALTH CARE ExPERIENCE, AND TESTS
FiGURE 6. TiME LiMiTS ON HEALTH CARE EXPERiENCESTime limits on health careexperiences: 13.8%
No time limits on health careexperiences: 86.2%
Note: n = 152 responding programs
Required Standardized Tests
This section refers to the following standardized tests using their abbreviations.
• GRE: Graduate Record Examinations
• IELTS: International English Language Testing System
• MCAT: Medical College Admission Test
• TOEFL: Test of English as a Foreign Language
TABLE 65. STANDARDIZED TESTS REQUIRED FOR PRE-PROFESSIONAL ADMISSIONS
n %SAT 24 82.8ACT 21 72.4TOEfL Internet-based Test (iBT) 12 41.4TOEfL Paper-based Test (pBT) 9 31.0IELTS 5 17.2Total 29 –
Note: Percentages may sum to more than 100% because programs could select multiple required standardized tests.
TABLE 66. MINIMUM SCORES FOR STANDARDIZED TESTS REQUIRED FOR PRE-PROFESSIONAL ADMiSSiONS
Possible Range n
Observed Range M SD Mdn
SAT 400–1600 19 830.0–1400.0 1161.6 133.4 1170.0ACT 1–36 17 17.0–27.0 24.7 2.7 25.0TOEfL Internet-based Test (iBT) 0–120 11 79.0–114.0 90.9 13.1 83.0
Note: TOEFL pBT and IELTS were excluded due to low responses. “Possible Range” refers to the full range of possible scores on each standardized test. “Observed Range” refers to the observed range of reported minimum test scores for each standardized test. Zeroes and reported scores that fell outside of the possible ranges for each exam were excluded prior to analysis.
Of the 152 programs that required students to have health care experience, 13.8% (n = 21) required that health care experiences be completed within a certain time limit. On average, these programs required that health care experiences occur within the past 5.1 years (range = 1.0–10.0 years, SD = 2.8, Mdn = 5.0).
Programs with an undergraduate, pre-professional track (n = 39, 16.6%) were asked to indicate which standardized tests were required for entry. 9 of these programs (23.1%) reported having no required standardized tests for undergraduate, pre-professional admissions.

28 | CURRICULUM REPORT 4 | SECTION 2. REqUIRED PREREqUISITE COURSEWORK, HEALTH CARE ExPERIENCE, AND TESTS
TABLE 67. STANDARDIZED TESTS REQUIRED FOR GRADUATE, PROFESSIONAL PHASE ADMISSIONS
n %TOEfL Internet-based Test (iBT) 121 52.8GRE: Total (will not accept MCAT instead) 87 38.0GRE: Verbal reasoning 86 37.6GRE: quantitative reasoning 86 37.6GRE: Analytic writing 73 31.9TOEfL Paper-based Test (pBT) 63 27.5IELTS 24 10.5GRE: Total (will accept MCAT instead) 18 7.9ACT 3 1.3SAT 3 1.3Other 11 4.8None 23 10.0Total 229 –
Note: Percentages may sum to more than 100% because programs could select multiple required standardized tests.
TABLE 68. MINIMUM SCORES FOR STANDARDIZED TESTS REQUIRED FOR GRADUATE, PROFESSiONAL PHASE ADMiSSiONS
n Range M SD MdnTOEfL Internet-based Test (iBT) 96 1.0–550.0 100.7 71.3 90.0GRE: Total (will not accept MCAT instead) 24 280.0–302.0 296.1 5.9 300.0GRE: Verbal reasoning 22 130.0–155.0 146.2 5.9 147.0GRE: quantitative reasoning 22 130.0–155.0 145.3 6.0 145.5GRE: Analytic writing 20 1.0–4.2 3.4 0.7 3.5TOEfL Paper-based Test (pBT) 32 550.0–650.0 570.2 28.8 550.0IELTS 19 6.0–8.0 6.7 0.5 7.0
Note: ACT, SAT, and total GRE scores among programs that accepted the MCAT instead were excluded due to low responses. Zeroes and reported scores that fell outside of the possible ranges for each exam were excluded prior to analysis.
29 | CURRICULUM REPORT 4| SECTION 3: APPLICATIONS AND ADMISSIONS
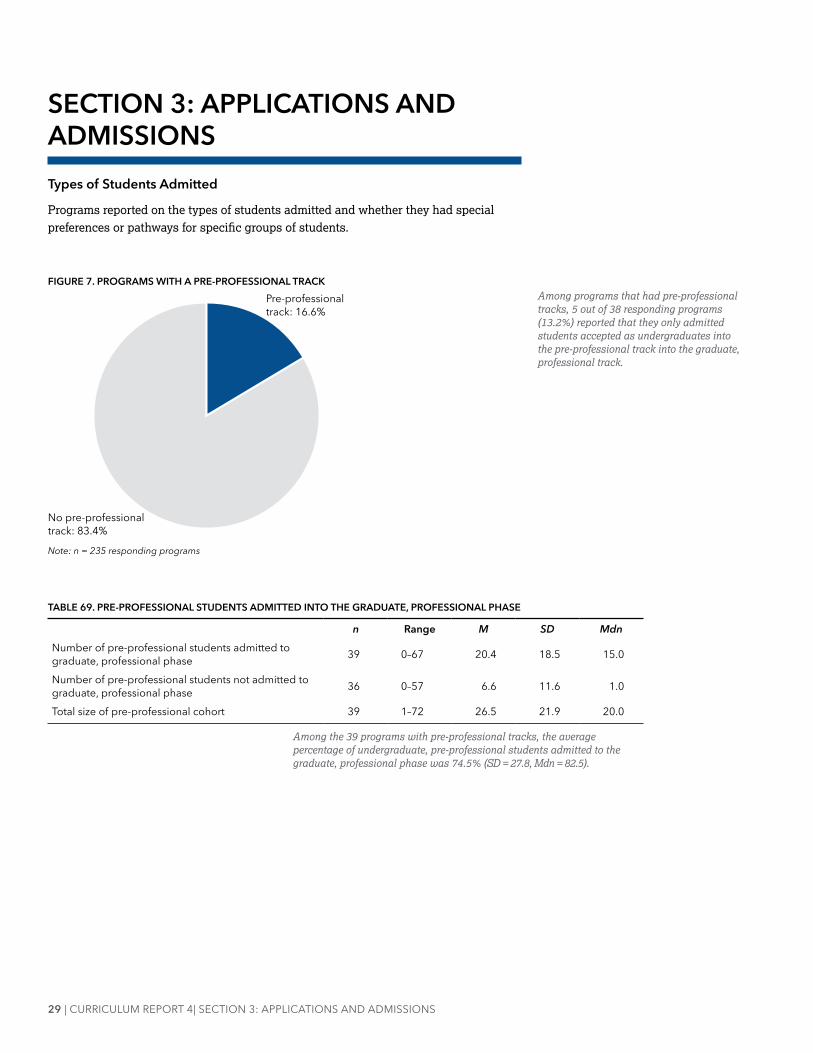
SECTiON 3: APPLiCATiONS AND ADMiSSiONSTypes of Students Admitted
Programs reported on the types of students admitted and whether they had special preferences or pathways for specific groups of students.
FiGURE 7. PROGRAMS WiTH A PRE-PROFESSiONAL TRACKPre-professionaltrack: 16.6%
No pre-professionaltrack: 83.4%
Note: n = 235 responding programs
TABLE 69. PRE-PROFESSiONAL STUDENTS ADMiTTED iNTO THE GRADUATE, PROFESSiONAL PHASE
n Range M SD MdnNumber of pre-professional students admitted to graduate, professional phase 39 0–67 20.4 18.5 15.0
Number of pre-professional students not admitted to graduate, professional phase 36 0–57 6.6 11.6 1.0
Total size of pre-professional cohort 39 1–72 26.5 21.9 20.0
Among programs that had pre-professional tracks, 5 out of 38 responding programs (13.2%) reported that they only admitted students accepted as undergraduates into the pre-professional track into the graduate, professional track.
Among the 39 programs with pre-professional tracks, the average percentage of undergraduate, pre-professional students admitted to the graduate, professional phase was 74.5% (SD = 27.8, Mdn = 82.5).

30 | CURRICULUM REPORT 4 | SECTION 3: APPLICATIONS AND ADMISSIONS
FiGURE 8. PROGRAMS THAT ACCEPT TRANSFER STUDENTS FROM OTHER PA PROGRAMSAccept transfer students: 3.1%
Do not accepttransfer students: 96.9%
Note: n = 223 responding programs
FiGURE 9. PROGRAMS THAT ACCEPT iNTERNATiONAL APPLiCANTS
Accept international applicants: 67.3%
Do not accept internationalapplicants: 32.7%
Note: n = 208 responding programs
FiGURE 10. PROGRAMS WITH PATHWAYS OR SUPPORT SYSTEMS FOR VETERANS
Have veteran pathways: 81.9%
Do not have veteranpathways: 18.0%
Note: n = 188 responding programs

31 | CURRICULUM REPORT 4| SECTION 3: APPLICATIONS AND ADMISSIONS
TABLE 70. AVAILABLE PATHWAYS OR SUPPORT SYSTEMS FOR VETERANS
n %Yellow Ribbon program: Institutional participation in the Yellow Ribbon Schools program, a university-funded scholarship program for veterans 81 52.6
Special admission consideration: Processes that recognize military veterans 70 45.5Veteran faculty: faculty members who have veteran status 66 42.9Clinical partnerships: Partnerships with veteran organizations for rotations 57 37.0Veteran scholarships: Scholarship or financial assistance like reduced or in-state tuition 35 22.7SOC member: Institutional participation in the Servicemembers Opportunity Colleges (SOC) programs, a consortium of colleges that recognizes the unique needs of veterans in achieving their educational goals. Many of these institutions offer special benefits such as tuition reduction or credit for experiential learning.
12 7.8
Total 154 –
Note: Percentages may sum to more than 100% because programs could select multiple types of pathways or support systems offered to veterans. This table only includes those programs that reported having a veteran pathway or support system.
FiGURE 11. PROGRAMS WiTH PREFERENCES FOR SPECiFiC STUDENT CHARACTERiSTiCS
Have studentpreferences: 71.4%
Do not have studentpreferences: 28.6%
Note: n = 231 responding programs

32 | CURRICULUM REPORT 4 | SECTION 3: APPLICATIONS AND ADMISSIONS
TABLE 71. PREFERENCES OR SPECiAL CONSiDERATiON FOR SPECiFiC STUDENT CHARACTERiSTiCS
n %Veteran preference 76 49.0from an underserved area 57 36.8Underrepresented minorities 50 32.3Alumnus/Legacy preference 46 29.7Economically disadvantaged 44 28.4State residents 43 27.7Deferrals from previous year 38 24.5first-generation students 37 23.9Articulation agreement with other colleges/universities 32 20.6
Environmentally/Educationally disadvantaged 32 20.6Rural 31 20.0Local area students 30 19.4Other 38 24.5Total 155 –
Note: Percentages may sum to more than 100% because programs could select multiple types of preferences or special considerations. This table excludes those programs that did not report having preferences or special considerations for specific student characteristics. First-generation was not defined in the survey but typically refers to students who are the first generation in their family to attend college.
FiGURE 12. MASTER’S COMPLETiON FOR CURRENTLY PRACTiCiNG PAsMaster’s completion offered: 4.3%
Master’s completion not offered: 95.7%Note: n = 232 responding programs

33 | CURRICULUM REPORT 4| SECTION 3: APPLICATIONS AND ADMISSIONS
Application Materials
FiGURE 13. CASPA PARTiCiPATiON
Participate in CASPA: 92.8%
Do not participate in CASPA: 7.2%
Note: n = 236 responding programs
TABLE 72. NARRATIVE OR PERSONAL STATEMENT REQUIREMENT
n %Yes, a narrative/personal statement is required
Require CASPA’s narrative/personal statement 138 59.7Require both CASPA’s narrative/personal statement and a supplemental statement 76 32.9
Do not use CASPA but do require a narrative/personal statement 10 4.3
Subtotal 224 97.0No, a narrative/personal statement is not required 7 3.0Total 231 100.0
TABLE 73. MINIMUM NUMBER OF REQUIRED WRITTEN REFERENCES
n Range M SD MdnMinimum required references 229 1–4 2.8 0.4 3.0
97.4% (n = 229) of responding programs required a minimum number of written references from prospective students.

34 | CURRICULUM REPORT 4 | SECTION 3: APPLICATIONS AND ADMISSIONS
TABLE 74. TYPES OF REFERENCES REQUIRED
n %PA 74 63.8Academic reference (e.g., teacher, professor) 54 46.6Physician 49 42.2Employer/Supervisor 47 40.5Other health care provider 39 33.6Other 28 24.1Total 116 -
Note: “Other” write-ins that indicated a preference for type of reference but not a requirement were excluded. Percentages will sum to more than 100% because programs could select multiple types of required references.
FiGURE 14. SUPPLEMENTAL APPLICATION REQUIRED
Do not require a supplemental application: 51.7%
Require a supplemental application: 48.3%
Note: n = 236 responding programs
TABLE 75. SUPPLEMENTAL APPLiCATiON FEE ($)
n Range M SD P10 P25P50
(Mdn) P75 P90fee 99 20.0–300.0 58.7 32.6 25.0 47.5 50.0 67.5 95.0
Note: Zeroes were excluded prior to analysis.
An additional 106 programs (47.7% of all 222 responding programs) indicated that they had no restrictions on the types of references required.

35 | CURRICULUM REPORT 4| SECTION 3: APPLICATIONS AND ADMISSIONS
FiGURE 15. ON-SITE INTERVIEW REQUIREDDo not require an on-site interview: 3.4%
Require an on-site interview: 96.6%
Note: n = 234 responding programs
TABLE 76. REASONS FOR REQUIRING AN ON-SITE INTERVIEW
n %Evaluate applicants’ interpersonal and communication skills 224 99.1Evaluate professionalism and behavioral issues 213 94.2Assess whether applicants’ goals align with the program’s goals/mission 188 83.2Help applicants in their decision to choose a program 180 79.6Evaluate applicants’ dedication to the PA career 174 77.0Evaluate applicants’ ability to work in teams 143 63.3Other 10 4.4Total 226 –
Note: Percentages will sum to more than 100% because programs could select more than one reason for requiring an on-site interview.
TABLE 77. ON-SITE INTERVIEW FORMAT
n %Individual 152 67.6Group/Team 138 61.3Multiple, mini-individual interviews 64 28.4Multiple, mini-group interviews 17 7.6Other 8 3.6Total 225 –
Note: Percentages will sum to more than 100% because programs could select more than one format for their on-site interviews.

36 | CURRICULUM REPORT 4 | SECTION 3: APPLICATIONS AND ADMISSIONS
TABLE 78. PARTICIPANTS IN PROGRAMS’ ON-SITE INTERVIEW PROCESS
n %PA program faculty 225 99.6Graduated students (alumni) 120 53.1Current students 115 50.9PA program staff 113 50.0Preceptors 110 48.7faculty from outside the PA program 109 48.2University administration 59 26.1Community members 52 23.0Other
Admissions advisers/staff 5 2.2All other 11 4.9
Total 226 –
Note: Percentages will sum to more than 100% because programs could indicate more than one participant in their on-site interview process. Programs were not asked about “admissions advisers/staff”; this category was created based on programs’ recoded “other” write-in responses.
FiGURE 16. ON-SITE EXAMS REQUIREDDo not require an on-site exam: 9.0%
Require an on-site exam: 91.0%
Note: n = 223 responding programs

37 | CURRICULUM REPORT 4| SECTION 3: APPLICATIONS AND ADMISSIONS
TABLE 79. TYPES OF ON-SITE EXAMS REQUIRED
n %Basic science 8 40.0Math skills 2 10.0Other
Medical terminology 6 30.0Writing/Composition 4 20.0All other 2 10.0
Total 20 –
Note: Percentages will sum to more than 100% because programs could indicate more than one required on-site exam. Programs were not asked about “medical terminology” or “writing/composition” exams; these categories were created based on programs’ recoded “other” write-in responses.
FiGURE 17. ON-SITE OR EXTEMPORANEOUS WRITING SAMPLE REQUIRED
Require an on-site or extemporaneous writing sample: 55.1%
Do not require an on-site or extemporaneous writing sample: 44.9%
Note: n = 225 responding programs
TABLE 80. USES FOR ON-SiTE OR EXTEMPORANEOUS WRiTiNG SAMPLE
n %To evaluate communication skills 89 71.8Scored as part of review of candidate 83 66.9Comparison between on-the-spot writing and submitted writing sample 45 36.3
Not scored, but considered as part of review of candidate 34 27.4
Other 4 3.2Total 124 –
Note: Percentages will sum to more than 100% because programs could indicate more than one use for prospective students’ writing samples.
38 | CURRICULUM REPORT 4 | SECTION 3: APPLICATIONS AND ADMISSIONS
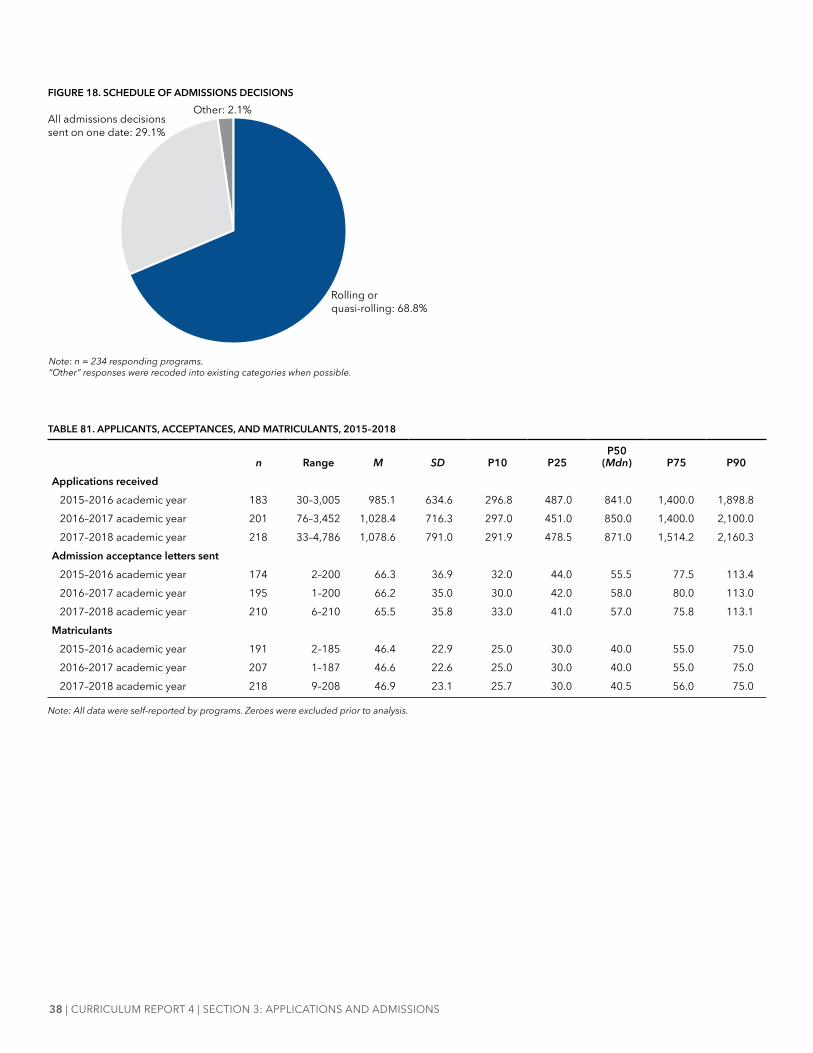
FiGURE 18. SCHEDULE OF ADMiSSiONS DECiSiONS
Rolling or quasi-rolling: 68.8%
All admissions decisions sent on one date: 29.1%
Other: 2.1%
Note: n = 234 responding programs. “Other” responses were recoded into existing categories when possible.
TABLE 81. APPLiCANTS, ACCEPTANCES, AND MATRiCULANTS, 2015–2018
n Range M SD P10 P25P50
(Mdn) P75 P90Applications received
2015–2016 academic year 183 30–3,005 985.1 634.6 296.8 487.0 841.0 1,400.0 1,898.82016–2017 academic year 201 76–3,452 1,028.4 716.3 297.0 451.0 850.0 1,400.0 2,100.02017–2018 academic year 218 33–4,786 1,078.6 791.0 291.9 478.5 871.0 1,514.2 2,160.3
Admission acceptance letters sent2015–2016 academic year 174 2–200 66.3 36.9 32.0 44.0 55.5 77.5 113.42016–2017 academic year 195 1–200 66.2 35.0 30.0 42.0 58.0 80.0 113.02017–2018 academic year 210 6–210 65.5 35.8 33.0 41.0 57.0 75.8 113.1
Matriculants2015–2016 academic year 191 2–185 46.4 22.9 25.0 30.0 40.0 55.0 75.02016–2017 academic year 207 1–187 46.6 22.6 25.0 30.0 40.0 55.0 75.02017–2018 academic year 218 9–208 46.9 23.1 25.7 30.0 40.5 56.0 75.0
Note: All data were self-reported by programs. Zeroes were excluded prior to analysis.

39 | CURRICULUM REPORT 4| SECTION 3: APPLICATIONS AND ADMISSIONS
TABLE 82. ACCEPTANCE AND MATRiCULATiON RATES, 2015–2018 (%)
n Range M SD P10 P25P50
(Mdn) P75 P90Acceptance rates
2015–2016 academic year 172 0.2–100.0 10.2 12.2 3.2 4.5 7.1 11.0 19.62016–2017 academic year 193 0.3–98.7 9.6 9.5 2.8 4.7 6.9 11.5 18.62017–2018 academic year 208 0.5–96.2 9.7 11.0 2.6 4.0 6.6 11.6 19.4
Matriculation rates based on applications received2015–2016 academic year 183 0.2–100.0 7.7 11.0 2.4 3.3 4.9 8.9 13.32016–2017 academic year 201 0.3–98.7 7.0 8.1 2.3 3.1 5.0 9.0 12.42017–2018 academic year 214 0.6–96.2 7.4 9.8 2.2 3.0 4.8 8.5 13.9
Matriculation rates based on acceptance letters sent2015–2016 academic year 174 43.6–100.0 75.4 16.1 53.6 63.5 74.5 89.3 100.02016–2017 academic year 195 30.8–100.0 74.7 15.6 55.7 63.0 73.2 85.7 100.02017–2018 academic year 208 30.8–100.0 75.5 15.7 53.9 64.5 76.7 86.7 100.0
FiGURE 19. DEPOSIT REQUIRED TO SECURE SEAT
Deposit isrequired: 95.3%
Deposit is notrequired: 4.7%
Note: n = 236 responding programs
TABLE 83. AMOUNT OF PROGRAM DEPOSIT REQUIRED TO SECURE SEAT ($)
n Range M SD P10 P25 P50 (Mdn) P75 P90Deposit amount 222 50–2,000 760 395 255 500 750 1,000 1,500
Acceptance rates were calculated by dividing programs’ self-reported number of admission acceptance letters sent by the number of applications received for each academic year. Matriculation rates based on applications received were calculated by dividing programs’ self-reported number of matriculants by the number of applications received for each academic year. Matriculation rates based on acceptance letters sent were calculated by dividing programs’ self-reported number of matriculants by the number of admission acceptance letters sent for each academic year.

40 | CURRICULUM REPORT 4 | SECTION 3: APPLICATIONS AND ADMISSIONS
TABLE 84. REFUNDABLE DEPOSiTS
n %No 189 84.4Yes, for emergencies only 12 5.4Yes, fully refundable 8 3.6Yes, partially refundable 5 2.2Other 10 4.5Total 224 100.0

41 | CURRICULUM REPORT 4| SECTION 4. CURRICULAR DESIGN
SECTiON 4. CURRiCULAR DESiGN
TABLE 85. PROGRAM MiSSiON
n %Primary care 160 69.3Underserved 98 42.4Generalist 76 32.9Rural 51 22.1Specialist 2 0.9Other 17 7.4No overall focus 10 4.3Total 231 –
Note: Percentages will sum to more than 100% because programs could select multiple focuses of their mission.
TABLE 86. CURRiCULAR FOCUS
n %Organ-based/Systems-based learning 166 74.8Collaborative or team-based learning 69 31.1Hybrid of traditional or case-based learning 67 30.2Early clinical exposure 65 29.3Problem-based learning 64 28.8Case-based learning 62 27.9Asynchronous learning 19 8.6Other 10 4.5No curricular focus 28 12.6Total 222 –
Note: Percentages will sum to more than 100% because programs could select multiple curricular focuses.
Programs were asked to describe their curriculum’s overall mission, based on their mission statements.

42 | CURRICULUM REPORT 4 | SECTION 4. CURRICULAR DESIGN
TABLE 87. PEDAGOGiCAL APPROACH
n %Organ-based/Systems-based learning 154 69.7Collaborative or team-based learning 96 43.4Case-based learning 91 41.2Hybrid of traditional or case-based learning 80 36.2Problem-based learning 79 35.7Early clinical exposure 69 31.2Asynchronous learning 27 12.2Other 11 5.0No specific pedagogical approach 27 12.2Total 221 –
Note: Percentages will sum to more than 100% because programs could select multiple pedagogical approaches.
FiGURE 20. SPECiAL TRACKS OFFEREDSpecial tracks offered: 12.7%
No special tracks offered: 87.3%Note: n = 229 responding programs
TABLE 88. FORMULA FOR CONVERTING CLOCK HOURS TO CREDIT HOURS: LECTURE INSTRUCTION
n %1 credit = 15 clock/contact hours 108 47.41 credit = 16 clock/contact hours 21 9.21 credit = 10 clock/contact hours 17 7.51 credit = 14 clock/contact hours 14 6.11 credit = 12 clock/contact hours 13 5.7Other formula 17 7.5No formula 38 16.7Total 228 100.0
Of 26 programs that provided specifics regarding special tracks offered, 8 (30.8%) reported having a rural track and 7 (26.9%) reported having an underserved track. Programs could describe multiple special tracks.

43 | CURRICULUM REPORT 4| SECTION 4. CURRICULAR DESIGN
TABLE 89. FORMULA FOR CONVERTING CLOCK HOURS TO CREDIT HOURS: LABORATORY iNSTRUCTiON
n %1 credit = 30 clock/contact hours 44 19.41 credit = 15 clock/contact hours 28 12.31 credit = 45 clock/contact hours 28 12.31 credit = 20 clock/contact hours 13 5.71 credit = 8 clock/contact hours 8 3.51 credit = 32 clock/contact hours 7 3.11 credit = 24 clock/contact hours 5 2.21 credit = 12 clock/contact hours 4 1.81 credit = 16 clock/contact hours 3 1.31 credit = 36 clock/contact hours 3 1.31 credit = 25 clock/contact hours 1 0.4Other formula 21 9.3No formula 62 27.3Total 227 100.0
FiGURE 21. PART-TiME OPTiON OFFEREDPart-time option offered: 1.7%
No part-time option offered: 98.3%Note: n = 235 responding programs

44 | CURRICULUM REPORT 4 | SECTION 4. CURRICULAR DESIGN
FiGURE 22. DiSTANCE OR ONLiNE LEARNiNG OPPORTUNiTiES OFFEREDDistance/Online learning offered: 5.1%
No distance/online learning offered: 94.9%Note: n = 234 responding programs
Copyright © 2022 FDOKUMEN