
Preamble - IK Gujral Punjab Technical University - Mohali Campus II
Upload
khangminh22Category
view
0download
0
1
BRAND GUIDELINES
2
BRAND GUIDELINES
3
PreambleThe Non-Bank Financial Institutions Regulatory Authority (NBFIRA), also known as the Regulatory Authority is required, under Section 34 of the NBFIRA Act, 2016 (CAP
46:08), to publish an Annual Report for its financial year.
The 2020 Annual Report is published in fulfilment of the statutory requirements, and highlights the Regulatory Authority’s financial and operational performance for the financial year 2019/20. Financial performance of regulated entities is however largely based on the audited financial statements for the calendar year ended December 31, 2019. Information for the period ended March 31, 2020 and historical
data is reported for purposes of emphasis of developments pertaining to the review period.
BRAND GUIDELINES
BRAND GUIDELINES
4
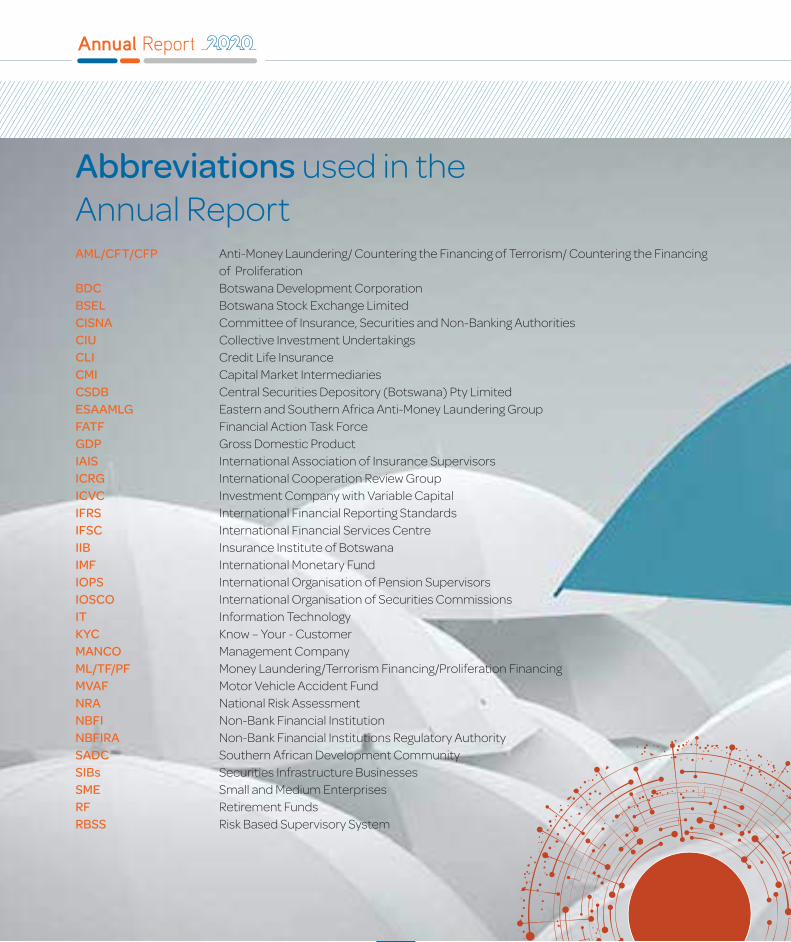
Abbreviations used in the Annual ReportAML/CFT/CFP Anti-Money Laundering/ Countering the Financing of Terrorism/ Countering the Financing of Proliferation BDC Botswana Development CorporationBSEL Botswana Stock Exchange LimitedCISNA Committee of Insurance, Securities and Non-Banking AuthoritiesCIU Collective Investment UndertakingsCLI Credit Life InsuranceCMI Capital Market IntermediariesCSDB Central Securities Depository (Botswana) Pty LimitedESAAMLG Eastern and Southern Africa Anti-Money Laundering GroupFATF Financial Action Task ForceGDP Gross Domestic ProductIAIS International Association of Insurance Supervisors ICRG International Cooperation Review Group ICVC Investment Company with Variable CapitalIFRS International Financial Reporting StandardsIFSC International Financial Services CentreIIB Insurance Institute of BotswanaIMF International Monetary FundIOPS International Organisation of Pension SupervisorsIOSCO International Organisation of Securities CommissionsIT Information TechnologyKYC Know – Your - Customer MANCO Management CompanyML/TF/PF Money Laundering/Terrorism Financing/Proliferation FinancingMVAF Motor Vehicle Accident FundNRA National Risk AssessmentNBFI Non-Bank Financial InstitutionNBFIRA Non-Bank Financial Institutions Regulatory AuthoritySADC Southern African Development CommunitySIBs Securities Infrastructure BusinessesSME Small and Medium EnterprisesRF Retirement FundsRBSS Risk Based Supervisory System

5
Glossary of terms
Asset Manager:means a person who, under an agreement with another person, applies assets of the other person by way of investment, whether the asset manager makes those investments in its own name or not but does not include a custodian or a trustee.
Administrator of a pension or provident fund:means a person who provides administration or similar services to the fund.
Beneficiary Fund:means a fund which is established with the objective of receiving, administering, investing and paying benefits on behalf of beneficiaries.
Central Securities Depository:means a facility for the deposit, clearing or settlement of securities transactions, whether physically, electronically or otherwise.
Collective Investment Undertaking:means an arrangement, where the principal object of which is the collective investment of its funds in real or personal property of whatever kind, including securities and other liquid financial assets, with the aim of giving its members, or section-holders the benefit of the result of the management of funds and spreading investment risk and the units of which are at the request of holders, purchased, directly or indirectly out of those undertakings assets. A collective investment undertaking can be constituted as a section trust or as an investment company with variable capital whose articles provide that the actual value of the paid up share capital of the company shall at all times be equal to the net asset value of the company and the shares of the company shall have no par value.
Custodian:means a person who holds property of another person for safekeeping.
Finance and Leasing Company:means a body corporate that provides loans, advances or leasing products, but does not include a bank or a deposit taking institution.
Financial Group:means a group of companies under common control comprised of one or more prudentially regulated non-bank financial institutions and their subsidiaries.

6
Financial Services Laws:means any of the following- NBFIRA Act, Insurance Industry Act, Financial Intelligence Act, International Insurance Act, Retirement Funds Act, Part XVI of the Income Tax Act, insofar as it relates to NBFIs, Securities Act, Collective Investments Undertakings Act, a law that declares itself to be a financial services laws for the purposes of this definition or such legislation as the Minister may, by order, prescribe.
Friendly Society:means an association of persons established with no share capital for the purpose of aiding members of the association or their dependents, being an association that does not employ a person whose main occupation is canvassing for members of, or collecting contributions or subscriptions for, the association.
Insurance Agent:means a person who solicits applications for insurance for an insurer.
Insurance Broker:means a person who arranges insurance otherwise than as agent of the insurer.
Insurer:means a person who undertakes liabilities by way of insurance (including general insurance, life insurance and reinsurance), whether or not as a member of an association of underwriters.
International Insurance Firm:means an undertaking which carries on international insurance business and includes an insurance manager, a principal insurance representative and an insurance agent.
Investment Advisor:means a person who gives other people investment advice or recommendations (including about holding and disposing of investments) in relation to securities or other assets.
Management Company for a Collective Investment Undertaking:means an incorporated body responsible for the establishment, promotion, management and administration of a collective investment undertaking.
Member of the Insurance Industry:means an insurance surveyor, a risk manager, a loss assessor, a loss adjuster or a claims settlement agent.
Glossary of terms (continued)

7
Micro Lender:means a person who advances loans to persons, where the loans do not exceed a prescribed amount, but does not include a person licensed in terms of the Banking Act or the Building Societies Act.
Pension Fund:means any fund the principal objective of which is to provide for the payment of a pension to a person, who has been a member of the fund, on his retirement.
Provident Fund:means any fund which is not a pension fund where a lump sum payment is made at retirement.
Risk Based Supervisory Model:means a forward looking approach designed to assist the regulator to allocate its resources more effectively, prioritizing supervision to those firms presenting greatest risk.
Securities Broker/Dealer:means a person who carries on the business of buying and selling securities on behalf of other persons or a person who regularly buys or sells securities on his own behalf otherwise than through a licensed securities dealer.
Securities Exchange:means a market, exchange, place or facility that provides for bringing together, on a regular basis, buyers and sellers of securities to negotiate or conclude sales of securities.
Trustee of a Collective Investment Undertaking:means a person acting as a trustee of a section trust.
Trustee of a Pension or Provident Fund: means a person acting as a trustee of a pension or provident fund.
Umbrella Funds:means a fund which is established for the benefit of employees of different small employers to facilitate cost savings and pooled investments.
Umbrella Act:means the Non-Bank Financial Institutions Regulatory Authority Act (2016).
8
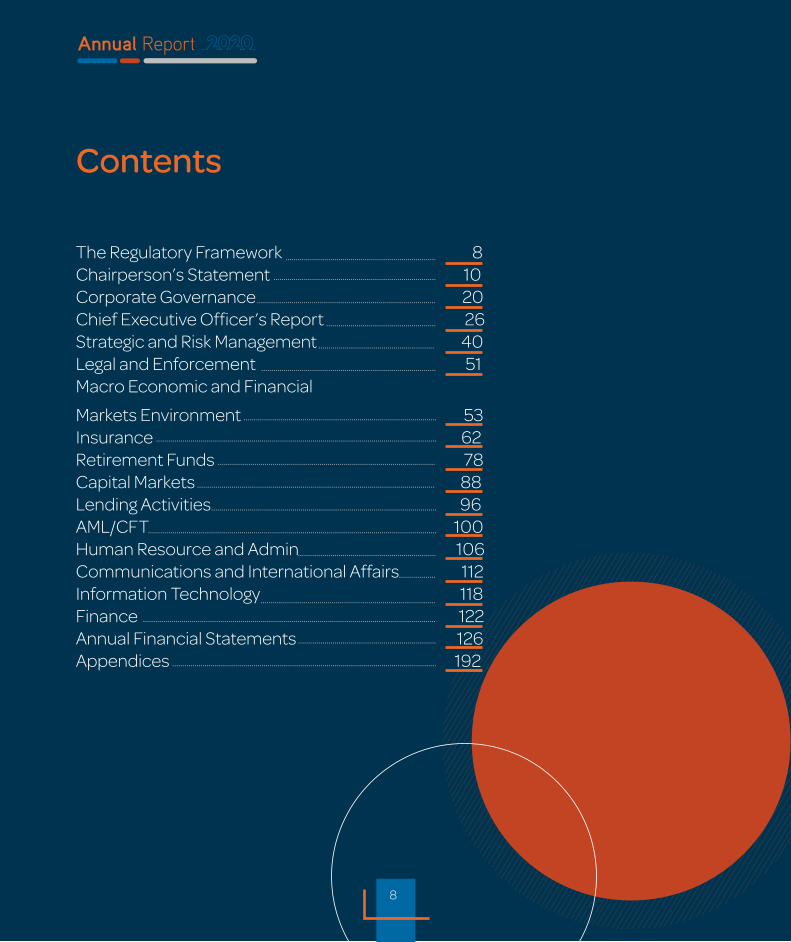
The Regulatory Framework 8Chairperson’s Statement 10Corporate Governance 20Chief Executive Officer’s Report 26 Strategic and Risk Management 40Legal and Enforcement 51Macro Economic and Financial
Markets Environment 53 Insurance 62Retirement Funds 78Capital Markets 88Lending Activities 96AML/CFT 100Human Resource and Admin 106Communications and International Affairs 112Information Technology 118Finance 122Annual Financial Statements 126Appendices 192
Contents
8

99

10
The regulatory framework for the NBFI sector
The legislative framework governing the operations of both the Regulatory Authority and the regulated NBFIs is known as the “financial services laws”. The NBFIRA Act (2016) is the umbrella act of the financial services laws for regulation of the NBFI sector. The NBFIRA Act (2016) prescribes the operations, responsibilities and accountabilities of the Regulatory Authority, including corporate governance, staffing, finances, and reporting to stakeholders. It also provides a comprehensive licensing regime for supervised entities and provides the Regulatory Authority with powers to remedy imprudent practices, unethical conduct, and contraventions of the law.
The regulated NBFIs and activities in Table 1 below are listed in Section 2 of the NBFIRA Act (2016).
The Umbrella Act - The Non-Bank Financial Institutions Regulatory Authority Act, 2016 (Cap 46:08)
Name of Industry Act Supporting Rules and Regulations Types of NBFIs
Insurance IndustryThe Insurance Industry Act (2015).
The International Insurance Act (2005).
Insurance Industry Regulations (2019);
Insurance Prudential Rules (2012).
Re-insurer;Insurer;Insurance Broker;Insurance Corporate Agent and Representatives (natural persons)
International Insurance Firm
Medical Aid Funds
Retirement Funds IndustryRetirement Funds Act (2014).Part IV of the Income Tax Act.
Retirement Funds Regulations (2016)Pensions Administrative Rules, 2012;
Retirement Funds;Trustees of Retirement Funds; andRetirement Fund Administrators
Table 1: Financial Services Laws and Their Application to the Regulated NBFIs
Financial Intelligence Act of 2019
Financial Intelligence Act Regulations
All NBFIs

11
Capital Markets IndustrySecurities Act (2014)
Income Tax Act Part XVI.
The Collective Investment
Undertaking Act (2001).
NBFIRA Commodities Exchange Licensing Regulations (2008);
Securities (Institutions Licensing) Regulations (2017)
Securities (Persons Operating a securities infrastructure business) regulations (2017)
NBFIRA Market Intermediaries Licensing Rules( 2012);
NBFIRA Securities Business Corporate Governance Rules (2012)CIU Regulations;
NBFIRA Market Intermediaries ‘Conduct of Business Rules (2012)
NBFIRA Persons Operating a Securities Infrastructure Business Rules (2012)
The operator of a securities exchange;
A person operating a central securities depository (CSD);and
A securities Dealer/Broker
International Financial Services Centre (IFSC) Accredited NBFIs
A trustee of a collective investment undertaking;A collective investment undertaking that is an investment company with variable capital;A person operating a collective investment undertaking other than one described above;A custodian;Management Company for a collective investment undertaking (MANCO);An Asset Manager; andInvestment Advisor.
Lending Activities IndustryMicro Lending Regulations (2012) Micro Lenders;
Finance or Leasing CompaniesPawnshops
Note: Other laws applicable to all NBFIs include, inter alia, the Companies Act, the Income Tax Act, the Financial Intelligence Act, Competition Act, Financial Reporting Act and their supporting regulations.

12
Chairperson’s Statement
12

13
During the financial year ended March 31, 2020, the Non-Bank Financial Institutions Regulatory Authority (the Regulatory Authority) continued to enforce the legal regulatory framework promulgated by Parliament and the supporting Regulations prescribed by the Ministry of Finance and Economic Development (MFED) to regulate and supervise non-bank financial institutions.
In the endeavor to be responsive, transparent and effective in delivery of its mandate, the Management continually engaged and sought strategic leadership of the Board of Directors to review and enhance supervisory tools to improve effectiveness of supervisory and oversight function, to foster financial safety and soundness, fairness, efficiency and orderliness of market conduct; and development of the non-bank financial sector and thus contributing to the stability of the financial system as a whole.
The last quarter of the financial year-ended March 31, 2020, coincided with the global outbreak of the Covid-19 pandemic. However, locally, the impact of Covid-19 and the response thereof commenced after the financial year-end, with
a national lockdown beginning on April 2, 2020. As a result, this Annual Report covers the operations and supervisory activities for the 12 months ended March 31, 2020 and, therefore, excludes information on the impact of Covid-19 pandemic and the policy responses thereof.
It is against this background that I present the Non-Bank Financial Institutions Regulatory Authority’s (NBFIRA) Annual Report for the year ended March 31, 2020. The Annual Report is published in accordance with the provisions of Section 34 of the NBFIRA Act (2016). Key highlights of the operations and supervisory activities of NBFIRA for the 12 months’ period are presented in four broad categories, namely,
(a) Strategy and Risk Management; (b) Corporate and Legal Services; (c) Regulatory, Supervisory and Oversight; and (d) Audited Financial Statements:
(a) Strategy and Risk Management
2019/20 marks the fourth year of the implementation of the Regulatory Authority’s strategic plan covering the calendar years 2016 – 2021. The Board continued to drive the strategic objectives of building
capacity to achieve the mandate of the Regulatory Authority through a risk based supervisory approach which is more pre-emptive and pro-active in identifying and mitigating emerging financial stability risks. To that end, the Regulatory Authority conducts annual reviews of the strategy to align it to the prevailing macro-economic and operational environment. The annual strategic plan review was undertaken in October 2019 and the key adjustment to the plan was the addition of the initiative to “Develop and Implement Ethics Policy” to enhance attainment of the objective of “Improving Stakeholder Confidence” by emphasising transparency and openness in the Regulatory Authority’s relations with stakeholders.
The Board of Directors provides strategic oversight over the risk management function of the Regulatory Authority. The enterprise risk management is embedded in the strategic planning, objectives setting, budgeting and performance management processes to ensure effective execution of the corporate strategic plan, projects and any other business or activity. The Regulatory Authority also continuously monitors emerging
13

14
Chairperson’s Statement (continued)
risks and issues and updates its risk profile accordingly.
(b) Corporate and Legal Services
The Board carries out its oversight role guided by the NBFIRA Act (2016), the King IV Report on the Code of Corporate Governance as well as the Board Charter and the Board Committees’ Terms of Reference. The Board has the overall responsibility for risk governance and assurance. In a quest to improve the statutory framework, the Regulatory Authority collaborated with Government to ensure the alignment of the framework to the international best practices. The commencement of the NBFIRA Act, 2016, raised a need to review industry specific Acts or to have some promulgated by Parliament. As a result, the Insurance Industry Act, 2015 and its supporting Regulations commenced with effect from May 17, 2019, and the Insurance Industry Act, 1987, was repealed. In the non-bank lending sector, the industry specific legislation was drafted and licensing/exemption guidelines were issued to the market in March 2020. In addition, following the Financial Action Task Force’s (FATF’s) decision to place Botswana under an enhanced
monitoring process in October 2018, the revised Financial Intelligence Act, 2019 and its supporting Regulations commenced on September 4, 2019.
The Terms of Reference for the three Board Committees were reviewed, in line with best practice in corporate governance. The Licensing & Enforcement Committee (LEC) was renamed the Regulatory and Enforcement Committee (REC) to reflect the strategic nature of the Committee. The Committee’s oversight responsibilities are overarching and encompass regulatory oversight rather than just licensing. In addition, work commenced on the improvement of the supervisory tools outlined in the Chief Executive Officer’s Report. Furthermore, the scope of the Finance and Audit Committee (FAC) was expanded to include overseeing tendering and procurement and as a result was renamed the Finance, Audit and Tender Committee (FATC.)
The Regulatory Authority maintained affiliations to various local, regional and international standard setting bodies in the regulation of the financial services sector and to adopt and benchmark on best practices. This has enabled the Regulatory Authority to keep abreast
of the latest developments in the regulation of the financial services sector. As at March 31, 2020, the Regulatory Authority had entered into 17 Memoranda of Understanding with both local, regional and international organisations.
The staff establishment of the Regulatory Authority was increased by six posts to 100 at the end of the financial year 2019/2020 compared to 94 in the prior year. The additional resources were required for the establishment of a fully-fledged Anti-Money Laundering/Counter Financing of Terrorism (AML/CFT) Department. By year-end March 31, 2020, 97 staff were in post compared to 87 in the previous year. For the 12 months ended March 31, 2020, staff turnover was low at 3 percent compared to 8 percent in 2018/19 and 99 percent of the posts were localised.
The Regulatory Authority was able to maintain the Information Technology (IT) infrastructure with minimal disruption and security breaches. However, a consultancy was carried out to conduct IT systems penetration testing and vulnerability assessment in order to ensure its security both internally and externally. The project also evaluated the effectiveness of the deployed security measures. Based on the findings, the Regulatory
14
15
Authority put measures in place to address identified deficiencies.
(c) Regulatory, Supervisory and Oversight Function
The Financial Stability Council (FSC) meeting of August 6, 2019 approved “A Macro Prudential Policy Framework for Botswana” to promote a coordinated approach for attainment of financial system stability and directed financial regulators, including NBFIRA to present the framework to respective boards of directors for consideration and adoption. The paper is scheduled for Board deliberations in the next financial year and applies to all financial institutions and markets; and other financial intermediaries in Botswana. A full report, will therefore be included in the next annual report of the Regulatory Authority. In the interim, the Regulatory Authority has started contributing to the work of the FSC in the recent bi-annual publications of the national financial stability report.
In 2019, the pace of global economic activity was weak. In particular, momentum in the manufacturing sector weakened substantially. This was against the background of rising
trade and geopolitical tensions which increased uncertainty about the future of the global trade and international cooperation more generally. As a result, this took a toll on business confidence, investment decisions, and global trade. To counter this, there was a notable shift toward accommodative monetary policy — through both action and communication - to cushion the impact of the tensions on financial market sentiment and economic activity. Generally, the service sector remained resilient and thus supported employment growth. The domestic economy was not spared as Real GDP registered a slower growth rate of 3.0 percent in 2019, compared to a faster expansion of 4.5 percent in 2018. Subsequently, and with the global outbreak of Covid-19 pandemic, the outlook turned more bleak and requires close monitoring of macroeconomic activity and the authorities’ policy responses.
The domestic Non-Bank Financial Institutions (NBFIs) were profitable during the review period. Profits before tax excluding retirement funds income were P1.7 billion during the year ended December 31, 2019, compared to P 1.4 billion in the prior year. The return on assets ratio increased to 6 percent
in 2019 from 5 percent in 2018. The NBFI sector registered a 4 percent increase in assets from P121 billion in the prior year to P126 billion in 2019. At this level, the NBFI sector maintained its dominance of the domestic financial system at 54 percent market share, albeit one percent lower than in the prior year.
Retirement Funds assets increased by 8 percent from P82 billion in 2018 to P89 billion in 2019 (based on audited figures for financial year ends during the period January 1 – December 31). Retirement funds continued to dominate the NBFI sector with a market share of 70 percent in 2019 compared to 68 percent in 2018. However, the significant growth in retirement funds was not seen across the aggregate NBFI sector where overall assets grew by only 4 percent. The NBFI sector capital position increased by 10 percent from P6.8 billion in 2018 to P7.5 billion in 2019. The liquidity position also increased as evidenced by a significant 14 percent reduction in liabilities from P24 billion in 2018 to P21 billion in 2019. Overall, the NBFI sector was assessed to be stable and financially sound.
Subsequent to the year-end audits, management accounts of
15
16
Chairperson’s Statement (continued)
Retirement Funds as at December 31, 2019 recorded an increase to P93 billion compared with P78 billion in the corresponding period in 2018. This was attributed to an upsurge in investment income from P2.5 billion in 2018 to P7.0 billion in 2019, due to good performance in the global financial markets. While employment creation continued to be a challenge, total contributions to the retirement funds by both the employees and the employers increased by 6.8 percent from P4.3 billion in 2018 to P4.6 billion in 2019,
partly, as a result of civil service salary increments. The offshore/onshore asset allocation split was 61/39 percent in 2019 compared to 59/41 percent in 2018, as a result of flight to safety of the US dollar and a search of higher yield in offshore investments.
(d) NBFIRA Audited Financial Statements
The Regulatory Authority recorded a surplus of P6.4 million in the 2019/20 financial year representing
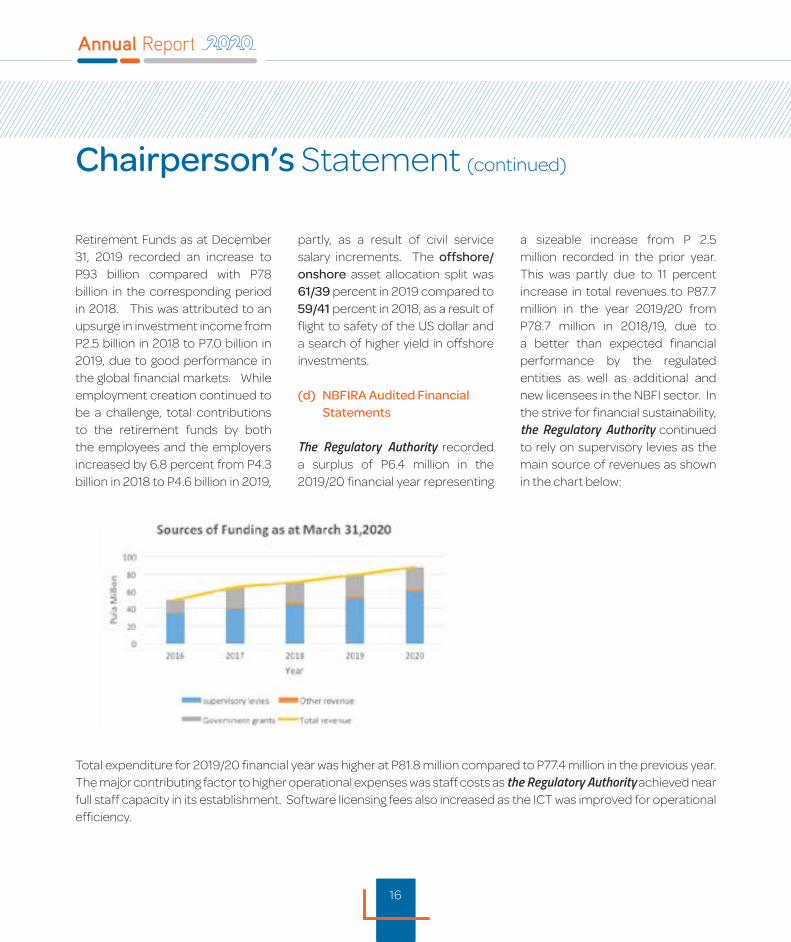
a sizeable increase from P 2.5 million recorded in the prior year. This was partly due to 11 percent increase in total revenues to P87.7 million in the year 2019/20 from P78.7 million in 2018/19, due to a better than expected financial performance by the regulated entities as well as additional and new licensees in the NBFI sector. In the strive for financial sustainability, the Regulatory Authority continued to rely on supervisory levies as the main source of revenues as shown in the chart below:
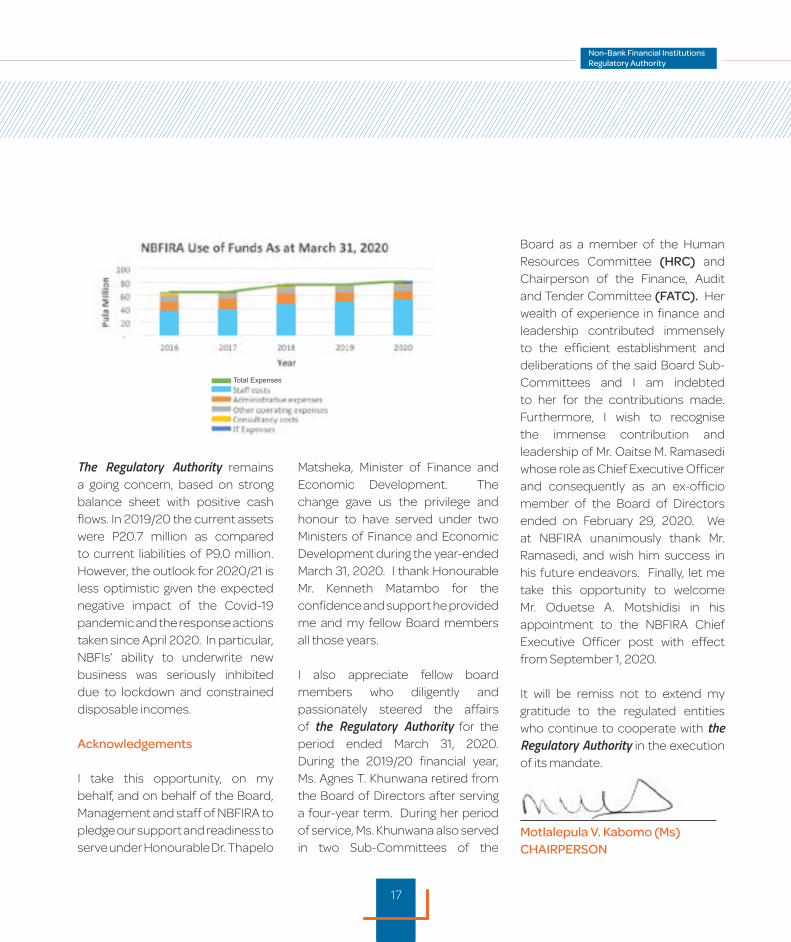
Total expenditure for 2019/20 financial year was higher at P81.8 million compared to P77.4 million in the previous year. The major contributing factor to higher operational expenses was staff costs as the Regulatory Authority achieved near full staff capacity in its establishment. Software licensing fees also increased as the ICT was improved for operational efficiency.
16
17
The Regulatory Authority remains a going concern, based on strong balance sheet with positive cash flows. In 2019/20 the current assets were P20.7 million as compared to current liabilities of P9.0 million. However, the outlook for 2020/21 is less optimistic given the expected negative impact of the Covid-19 pandemic and the response actions taken since April 2020. In particular, NBFIs’ ability to underwrite new business was seriously inhibited due to lockdown and constrained disposable incomes.
Acknowledgements
I take this opportunity, on my behalf, and on behalf of the Board, Management and staff of NBFIRA to pledge our support and readiness to serve under Honourable Dr. Thapelo
Matsheka, Minister of Finance and Economic Development. The change gave us the privilege and honour to have served under two Ministers of Finance and Economic Development during the year-ended March 31, 2020. I thank Honourable Mr. Kenneth Matambo for the confidence and support he provided me and my fellow Board members all those years.
I also appreciate fellow board members who diligently and passionately steered the affairs of the Regulatory Authority for the period ended March 31, 2020. During the 2019/20 financial year, Ms. Agnes T. Khunwana retired from the Board of Directors after serving a four-year term. During her period of service, Ms. Khunwana also served in two Sub-Committees of the
Board as a member of the Human Resources Committee (HRC) and Chairperson of the Finance, Audit and Tender Committee (FATC). Her wealth of experience in finance and leadership contributed immensely to the efficient establishment and deliberations of the said Board Sub-Committees and I am indebted to her for the contributions made. Furthermore, I wish to recognise the immense contribution and leadership of Mr. Oaitse M. Ramasedi whose role as Chief Executive Officer and consequently as an ex-officio member of the Board of Directors ended on February 29, 2020. We at NBFIRA unanimously thank Mr. Ramasedi, and wish him success in his future endeavors. Finally, let me take this opportunity to welcome Mr. Oduetse A. Motshidisi in his appointment to the NBFIRA Chief Executive Officer post with effect from September 1, 2020.
It will be remiss not to extend my gratitude to the regulated entities who continue to cooperate with the Regulatory Authority in the execution of its mandate.
Motlalepula V. Kabomo (Ms)CHAIRPERSON
Total Expenses
17

18
Board of Directors
a. b. c.
Ms. Motlalepula Kabomo (Chairperson)
Ms. Hilda Hlanti Dr. L.S. Senatla Member(ex officio member from Bank of Botswana)
18

19
d. e.
Ms. Ivy Ramalohlanye Mr. Keletsositse Olebile
19

20
Board of Directors
g.
Ms. Ludo Tema Ms. Patrinah Masalela (ex officio member from Ministry of Finance and Economic Development)
f.
20

2121
Ms. Lerang Lephole
h. i.
Mr. Oduetse Motshidisi
Chief Executive Officer and (ex officio member)

2222
Corporate Governance
2323
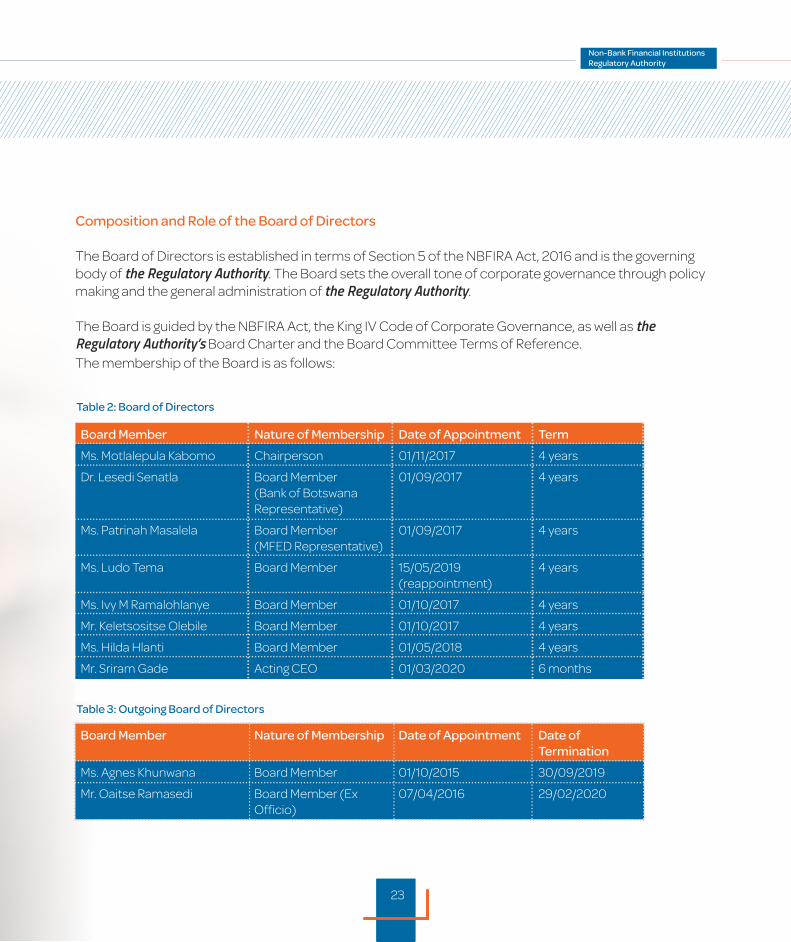
Composition and Role of the Board of Directors
The Board of Directors is established in terms of Section 5 of the NBFIRA Act, 2016 and is the governing body of the Regulatory Authority. The Board sets the overall tone of corporate governance through policy making and the general administration of the Regulatory Authority.
The Board is guided by the NBFIRA Act, the King IV Code of Corporate Governance, as well as the Regulatory Authority’s Board Charter and the Board Committee Terms of Reference.The membership of the Board is as follows:
Board Member Nature of Membership Date of Appointment Term
Ms. Motlalepula Kabomo Chairperson 01/11/2017 4 years
Dr. Lesedi Senatla Board Member(Bank of Botswana Representative)
01/09/2017 4 years
Ms. Patrinah Masalela Board Member(MFED Representative)
01/09/2017 4 years
Ms. Ludo Tema Board Member 15/05/2019 (reappointment)
4 years
Ms. Ivy M Ramalohlanye Board Member 01/10/2017 4 years
Mr. Keletsositse Olebile Board Member 01/10/2017 4 years
Ms. Hilda Hlanti Board Member 01/05/2018 4 years
Mr. Sriram Gade Acting CEO 01/03/2020 6 months
Board Member Nature of Membership Date of Appointment Date of Termination
Ms. Agnes Khunwana Board Member 01/10/2015 30/09/2019
Mr. Oaitse Ramasedi Board Member (Ex Officio)
07/04/2016 29/02/2020
Table 2: Board of Directors
Table 3: Outgoing Board of Directors
24
Corporate Governance (continued)
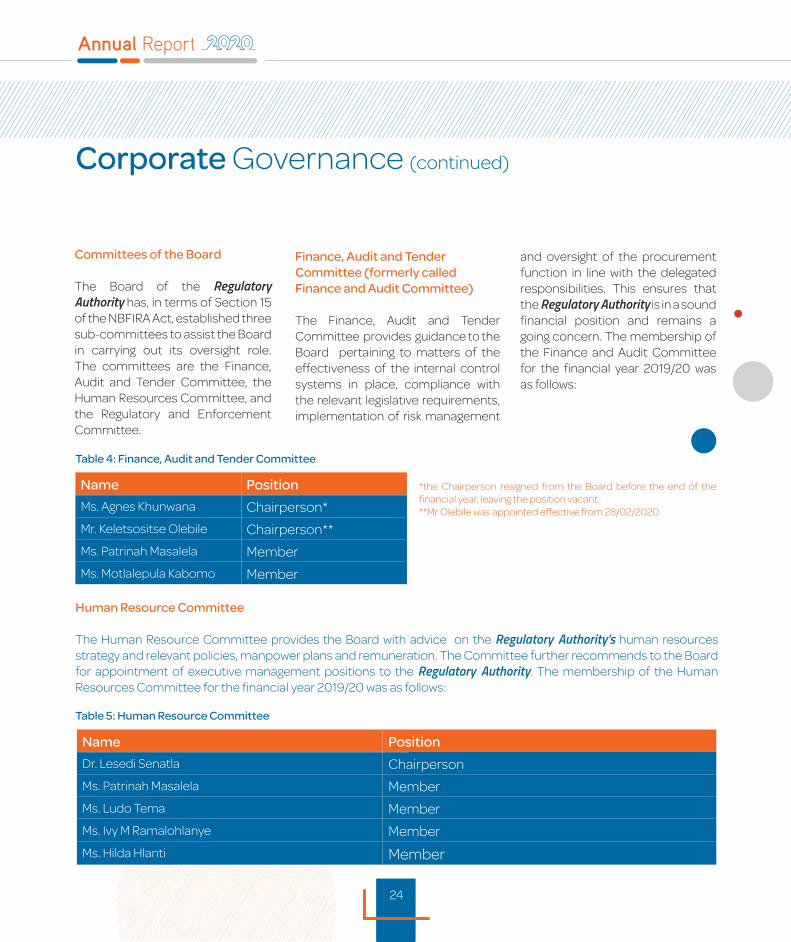
Committees of the Board
The Board of the Regulatory Authority has, in terms of Section 15 of the NBFIRA Act, established three sub-committees to assist the Board in carrying out its oversight role. The committees are the Finance, Audit and Tender Committee, the Human Resources Committee, and the Regulatory and Enforcement Committee.
Finance, Audit and Tender Committee (formerly called Finance and Audit Committee) The Finance, Audit and Tender Committee provides guidance to the Board pertaining to matters of the effectiveness of the internal control systems in place, compliance with the relevant legislative requirements, implementation of risk management
and oversight of the procurement function in line with the delegated responsibilities. This ensures that the Regulatory Authority is in a sound financial position and remains a going concern. The membership of the Finance and Audit Committee for the financial year 2019/20 was as follows:
Table 4: Finance, Audit and Tender Committee
Table 5: Human Resource Committee
Name Position
Ms. Agnes Khunwana Chairperson*
Mr. Keletsositse Olebile Chairperson**
Ms. Patrinah Masalela Member
Ms. Motlalepula Kabomo Member
Name Position
Dr. Lesedi Senatla Chairperson
Ms. Patrinah Masalela Member
Ms. Ludo Tema Member
Ms. Ivy M Ramalohlanye Member
Ms. Hilda Hlanti Member
*the Chairperson resigned from the Board before the end of the financial year, leaving the position vacant.**Mr Olebile was appointed effective from 28/02/2020
Human Resource Committee
The Human Resource Committee provides the Board with advice on the Regulatory Authority’s human resources strategy and relevant policies, manpower plans and remuneration. The Committee further recommends to the Board for appointment of executive management positions to the Regulatory Authority. The membership of the Human Resources Committee for the financial year 2019/20 was as follows:
24

25
Table 6: Regulatory and Enforcement Committee
Table 7: Number of Board and Committee Meetings
Regulatory and Enforcement Committee (formerly called Licensing and Enforcement Committee)
The Regulatory and Enforcement Committee is responsible for providing oversight and advice on the licensing, regulation and enforcement pertaining to NBFIRA regulated entities in line with the NBFIRA Act, Financial Services Laws and other applicable legislation. The membership of the Regulatory and Enforcement Committee for the financial year 2019/20 was as follows:
Name Position
Ms. Ludo Tema Chairperson
Ms. Hilda Hlanti Member
Dr. Lesedi Senatla Member
Mr. Keletsositse Olebile Member
Board and Committee Meetings The Board meets at least four times annually in accordance with Section 13(2) of the NBFIRA Act, to discuss matters relating to, amongst other things, strategy and performance, financial position, risk management, human resource matters, sustainability and governance.
The Board committees also meet at least four times annually i n accordance with the committees’ respective terms of reference to assist the Board in effectively carrying out its mandate. Table 7 below shows the number of meetings held during the year 2019/2020.
1st Quarter 2nd Quarter 3rd Quarter 4th Quarter Total
Main Board 20 June 2019 28 August 2019 28 November 2019 27 February 2020
4
Finance, Audit & Tender Committee
23 May 2019 14 August 2019 14 November 2019 6 February 2020
4
Human Resource Committee 7 May 2019 6 August 2019 18 November 201928 November 2019
5 February 2020
5
Regulatory & Enforcement Committee
13 June 2019 8 August 2019 14 November 2019 15 January 20206 February 2020
5
25

2626
27
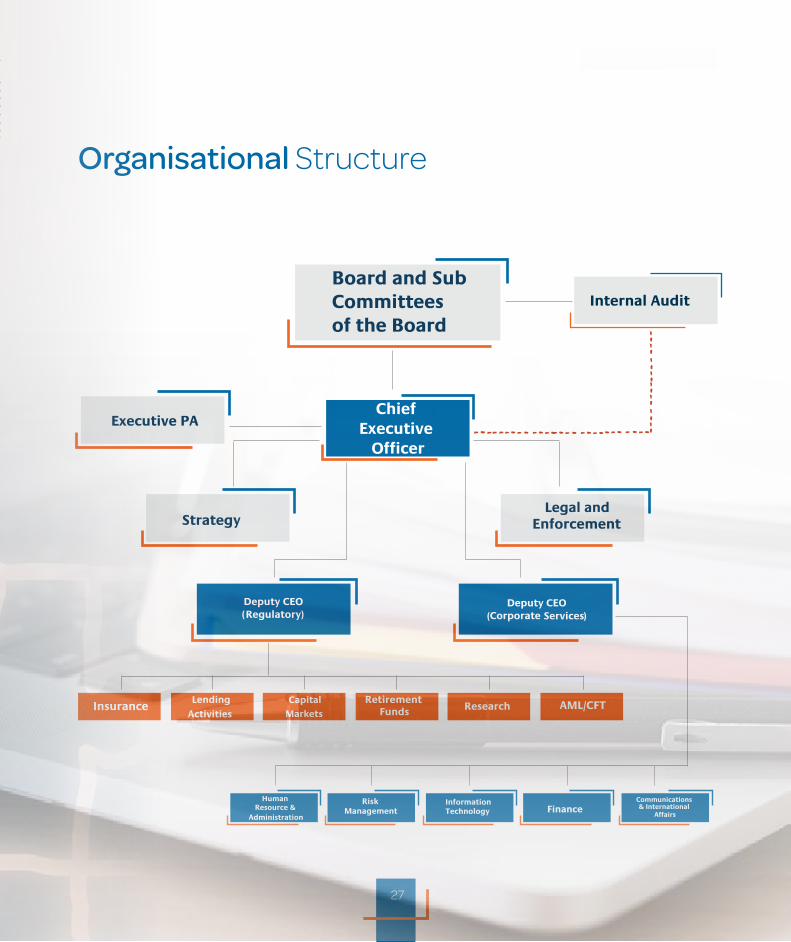
Organisational Structure
Internal Audit
Chief Executive
Officer
Executive PA
Enforcement Strategy
InsuranceLending
Activities
Capital
Markets
Retirement Funds Research AML/CFT
Human Resource &
Administration
RiskManagement
Information Technology Finance
Communications & International
Affairs
Deputy CEORegulatory
Deputy CEO
Legal and
)( Corporate Services)(
27

28
Chief Executive Officer’s Report
28
29
Implementing the Strategy
The financial year ended March 31, 2020 saw continued emphasis on the implementation of the 2016 – 2021 five-year strategic plan, which is focused on supporting the perspectives of Regulatory and Stakeholder; Business Process; Learning and Growth; and Financial, in order to achieve the Regulatory Authority’s mandate. During the year, the strategic objectives were fine-tuned taking into account the emerging operational environment in order to drive the Regulatory Authority’s vision of being “an efficient and effective regulatory and supervisory authority in line with international best practices”. The aim is to promote financial soundness and good market conduct of the NBFI sector and thus improving safety and stakeholder confidence. In addition, the Regulatory Authority continued to exert effort to promote fairness, orderliness and transparency of the markets. To that end, an ethics policy to enhance market conduct was developed and will be independently managed by a third party service provider. The
AML/CFT function continued to be capacitated to effectively deter financial crimes so that the country can meet the Financial Action Task Force (FATF) requirements.
Driving the Regulatory and Supervisory Mandate
The Management continued to review the supervisory tools to align them to international best practice and the changing legal framework. Furthermore, IT policies and procedures were reviewed in order to align IT functionality to the current trends and standards. In a broader context, the Regulatory Authority collaborated with the Financial Stability Council Secretariat in the development of “A Macro Prudential Policy Framework for Botswana” and its approval by the Financial Stability Council in August 2019.
Prudential regulations for insurers were developed and released to the market. In the capital markets, the oversight of the Botswana Stock Exchange as a self-regulatory organisation (SRO) commenced in March 2020 and a Directive was
issued to issuers of unlisted bonds, under the BSE Memorandum, requiring them to register the bonds with the Central Securities Depository of Botswana (CSDB). This was meant to dematerialise the securities and to promote automated trading and digital record keeping. Companies operating under the auspices of the Botswana International Financial Services Centre (IFSC) companies, were re-assigned to sector specific Departments in order to avoid supervisory arbitrage and risks that arise from grey area supervisory responsibilities. In addition, a public notice to provide guidance on the understanding, interpretation and application of provisions of Regulation 35 (9) of the Retirement Regulations was issued. This provision allows members to make withdrawals of a maximum of 25 percent of the preserved retirement benefits prior to reaching retirement age, subject to the approval of the Board of Trustees of the Fund and payment of tax where applicable. In implementing the Retirement Funds Act, 2014 and its supporting Regulations, the Regulatory Authority had with effect from September 1, 2019, revised the validity period of the
29

30
Retirement Funds Administrators license renewal from annual to three-year period.
The global outbreak of Covid-19 pandemic towards the end of the 2019/20 financial year has raised concern regarding the financial markets’ resilience and impact on investment returns. To monitor the situation, the Regulatory Authority, has on March 24, 2020, issued a Circular which required the Retirement Funds to submit updates on a regular basis to facilitate proactive policy response. In addition, licensing guidelines were issued to the non-bank lending sector in March 2020.
Furthermore, the Regulatory Impact Assessment (RIA) methodology was piloted in collaboration with the Ministry of Investment, Trade and Industry (MITI) to develop a framework for assessment of policy and/or regulatory intervention.
Chief Executive Officer’s Report (continued)
The report and adoption of the methodology is scheduled for the next financial year.Table 9 on page 42 presents a high-level overview of corporate performance against the targets as set out in the strategic plan. The Regulatory Authority has overall attained its strategic objectives for the year.
The Risk Based Supervisory Model
The Risk Based Supervisory (RBS) approach remained the cornerstone of the supervisory activities in order to foster the safety and financial soundness of the NBFIs and thus ensuring the overall stability of the financial system. The RBS model assists in decision making to deploy resources to entities identified to be of relative systemic importance for effective monitoring and proactive assessment and
mitigation of emerging risks to the financial system. In that regard, the Regulatory Authority contributed to the assessments of emerging vulnerabilities and bi-annual publication of the national financial stability report by the Financial Stability Council. Furthermore, NBFIs were monitored and assisted in understanding the provisions of the amended Financial Intelligence Act, 2019, with the objective of effectively deterring financial crimes and the financing of terrorist activities.
Compliance and Enforcement Activities
Supervisory tools were utilised to monitor compliance to the regulatory requirements and where necessary, enforcement actions ensued, which included, amongst others, imposition of punitive administrative penalties, litigations and intrusive supervision through the appointment of statutory managers. Furthermore,
30
31
the Regulatory Authority continued to supervise non-bank financial institutions specified by Part 4 of the FIA Act, 2019 for compliance with the requirements to assess customer AML/CFT/CFP risks, through customer due diligence, profiling, monitoring and reporting of suspicious transactions.
The Regulatory Authority continued to leverage on available information technology applications to improve operational efficiency and almost all processes are executed through IT systems. The Regulatory Authority has identified the need to upgrade the Risk Based Supervisory System (RBSS) to enhance information retrieval and automation of compliance processes to improve offsite analysis and the risk rating process. Funds were secured for the project which is expected to be implemented in the next financial year. On the other hand, the Enterprise Resource Planning (ERP) System for human resources and finance functions, together with Board Management System served
the purposes effectively. The latter was also utilised to serve Management Committees, including the Executive, Management Tender and other Committees.
Capacity Building and Human Capital Development
Following the completion of a consultancy to assist with the revision of the organisational structure to ensure that it supports both prudential and market conduct supervision as well as improving operational efficiency, a decision was made to defer implementation to the financial year 2020/21. This was to allow for the development of the 2021-2026 strategic plan and to accommodate transition in organisational leadership following the retirement of the CEO in February 2020. In the interim, the Regulatory Authority continued the drive to recruit and build organisational capacity, improve employee engagement and promote a culture of high performance.
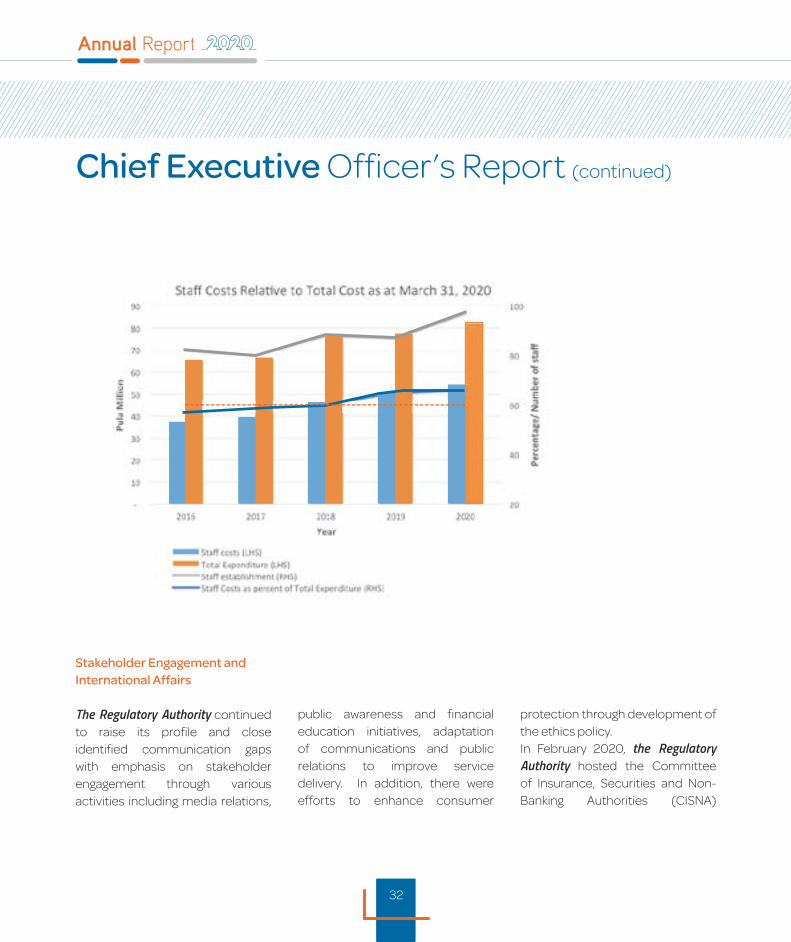
The establishment was increased by six positions for the newly established AML/CFT Department. The Regulatory Authority ended the year 2019/20 with 97 staff members in post compared to a headcount of 87 in the previous year, and against an approved establishment of 100 (94 in the prior year). During the financial year, staff attrition was 3 percent compared to 8 percent in the previous year. At this level, the attrition rate was below the Regulatory Authority’s threshold level of 5 percent. Both long-term (part time basis) and short-term training were undertaken to improve and augment academic and regulatory skills, respectively and the utilisation rate of the training and travel budget vote was at 96 percent as competing programmes for capacity building were accessed. The ratio of staff costs to total operating costs was 66 percent up to March 2020 which is in line with expenditure patterns for similar regional regulators. The five-year trend for the Regulatory Authority is as shown in the chart below.
31
32
Stakeholder Engagement and International Affairs
The Regulatory Authority continued to raise its profile and close identified communication gaps with emphasis on stakeholder engagement through various activities including media relations,
public awareness and financial education initiatives, adaptation of communications and public relations to improve service delivery. In addition, there were efforts to enhance consumer
protection through development of the ethics policy. In February 2020, the Regulatory Authority hosted the Committee of Insurance, Securities and Non-Banking Authorities (CISNA)
Chief Executive Officer’s Report (continued)
32

33
Strategic Planning and Performance Review meeting in Gaborone. As a member of International Standard Setting Bodies, the Regulatory Authority continued to participate in the relevant technical committees. While these engagements expose the staff to best regulatory practices, they also ensure that the Regulatory Authority participates in multilateral agreements. One additional Memorandum of Understanding (MoU) was signed with National Credit Regulator (NCR) of South Africa on December 18, 2019, resulting in a total of 17 MoUs between the Regulatory Authority and other domestic and international organisations.
Acknowledgements
I wish to thank the Board for the strategic leadership and commitment in guiding the Management to discharge the statutory and operational responsibilities of the Regulatory Authority. Equally important, let me acknowledge all NBFIs for continued engagement and cooperation during the review period. Their collective conduct and performance has contributed a great deal to the overall stability of the
financial sector in Botswana. Lastly, I wish to commend the Management team and Staff for continued dedication and contributions towards fulfilling the Regulatory Authority’s mandate. Your proactive efforts in addressing business matters is exemplary and an inspiration to not only the Board of NBFIRA but the entire country.
Mr. Oduetse A. Motshidisi CHIEF EXECUTIVE OFFICER
33

34
Executive Management team
Mr. Sriram GadeDeputy Chief Executive Officer (Regulatory)
Mr. Oduetse MotshidisiChief Executive Officer
Mr. Mao SegageDeputy Chief Executive Officer (Corporate Services)
34

35
Ms. Ghadie SeromeloChief Internal Audit Executive
Ms. Ditshetsa MakepeDirector - Legal and Enforcement
Ms. Juliana WhiteDirector - Capital Markets
35

36
Executive Management team
Ms. Ntema ModongoDirector – Lending Activities
Mr. Phineas SesinyiActing Director - Retirement Funds
Ms. Matlakala RaphakaDirector - Insurance
36

37
Senior Management team
Ms. Motsisi MongatiHead, Anti-Money Laundering and Countering Financing of Terrorism (AML/CFT)
Mr. Elvis NcaagaeHead of Finance
Mr. Dumedisang DumedisangHead of Human Resources and Administration
37

38
Senior Management team
Ms. Boa ChombahHead of Communicationsand International Affairs
Mr. Wabo BungileHead of Risk Management
Mr. Patrick RamphaHead of Information Technology
38

39
Ms. Oakantse ModisaHead of Research
Ms. Gakepeo MasikeHead of Strategy Management
The Global Outbreak of Covid -19 begun
to disrupt Botswana’s macroeconomic activity in April 2020 as Government policy response included lockdowns
and social distancing amongst others
Exco Complies to Covid -19 Protocols
39

40
Senior Management team
Ms. Mojadi KwerepeDeputy Directory- Capital Markets
Ms. Angelina MpeDeputy Director-Legal and Enforcement
Mr. Kaelo Radira Deputy Director-Legal and Enforcement
40

41
Mr Mothusi KebalefetseDeputy Director- Lending Activities
Ms. Veronica NamateDeputy Director-Insurance
41

42
Strategy Management
The Regulatory Authority ensures effective and efficient discharge of its mandate through the consistent development, implementation and review of its Strategic Plans. The Regulatory Authority is committed to implementation of its strategic plans through regular reviews and quarterly reporting of performance to the Board of Directors.
The year 2020/21 marks the final year of the implementation of the Regulatory Authority’s strategic plan 2016 – 2021
In positioning itself to respond to and address the challenges posed by the ever evolving and changing environment in which the Regulatory Authority operates, management reviewed the strategic plan in October 2019.The current Strategic objectives were deemed relevant and sufficient in assisting the Regulatory Authority to achieve its mandate for the remaining strategic planning period. New initiatives arising from the Strategy review identified the development of ethics policy as key.
42
43
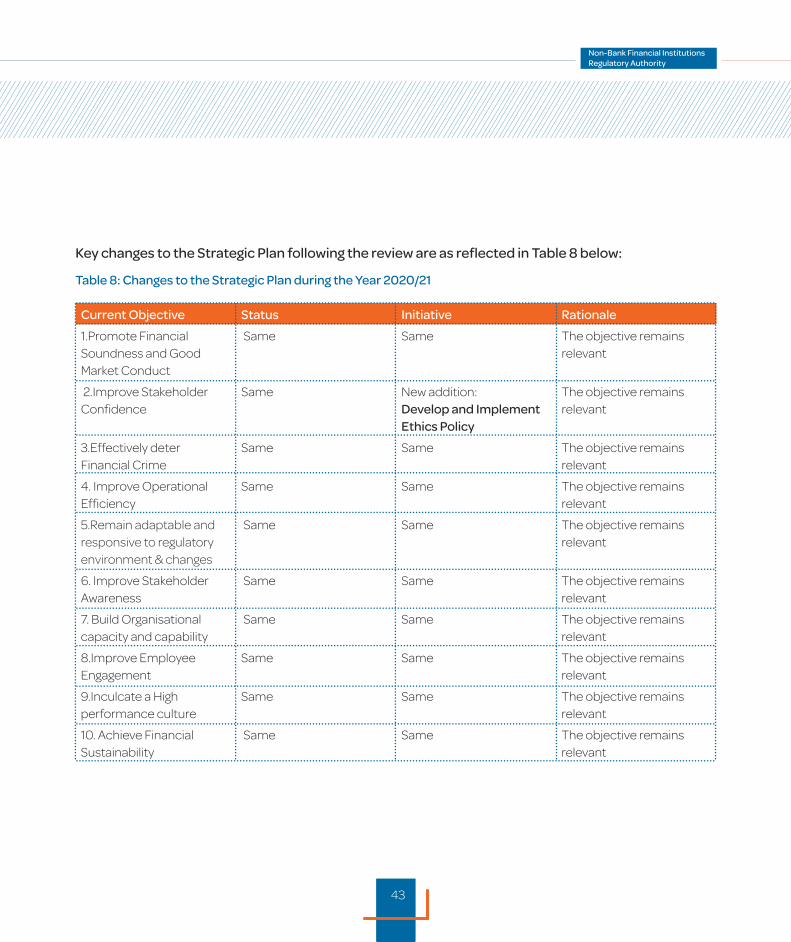
Key changes to the Strategic Plan following the review are as reflected in Table 8 below:
Table 8: Changes to the Strategic Plan during the Year 2020/21
Current Objective Status Initiative Rationale
1.Promote Financial Soundness and Good Market Conduct
Same Same The objective remains relevant
2.Improve Stakeholder Confidence
Same New addition:Develop and Implement Ethics Policy
The objective remains relevant
3.Effectively deter Financial Crime
Same Same The objective remains relevant
4. Improve Operational Efficiency
Same Same The objective remains relevant
5.Remain adaptable and responsive to regulatory environment & changes
Same Same The objective remains relevant
6. Improve Stakeholder Awareness
Same Same The objective remains relevant
7. Build Organisational capacity and capability
Same Same The objective remains relevant
8.Improve Employee Engagement
Same Same The objective remains relevant
9.Inculcate a High performance culture
Same Same The objective remains relevant
10. Achieve Financial Sustainability
Same Same The objective remains relevant
43
44
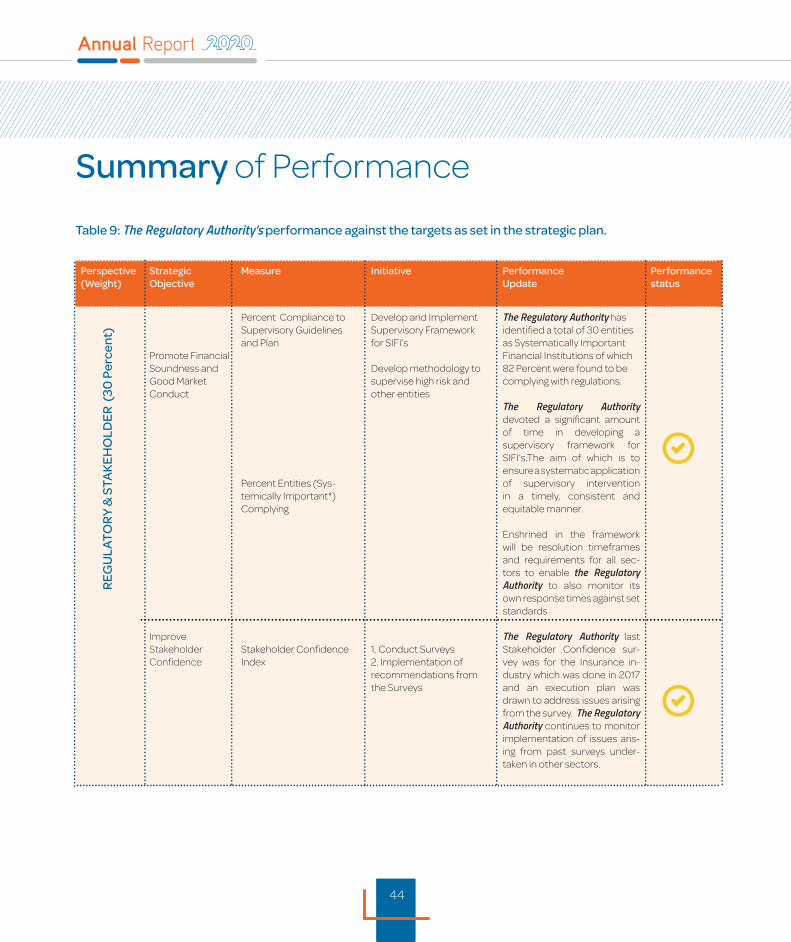
Perspective(Weight)
Strategic Objective
Measure Initiative Performance Update
Performance status
Promote Financial Soundness and Good Market Conduct
Improve Stakeholder Confidence
Percent Compliance to Supervisory Guidelines and Plan
Percent Entities (Sys-temically Important*) Complying
Stakeholder Confidence Index
Develop and Implement Supervisory Framework for SIFI’s
Develop methodology to supervise high risk and other entities
1. Conduct Surveys2. Implementation of recommendations from the Surveys
The Regulatory Authority has identified a total of 30 entities as Systematically Important Financial Institutions of which 82 Percent were found to be complying with regulations.
The Regulatory Authority devoted a significant amount of time in developing a supervisory framework for SIFI’s.The aim of which is to ensure a systematic application of supervisory intervention in a timely, consistent and equitable manner.
Enshrined in the framework will be resolution timeframes and requirements for all sec-tors to enable the Regulatory Authority to also monitor its own response times against set standards
The Regulatory Authority last Stakeholder Confidence sur-vey was for the Insurance in-dustry which was done in 2017 and an execution plan was drawn to address issues arising from the survey. The Regulatory Authority continues to monitor implementation of issues aris-ing from past surveys under-taken in other sectors.
Table 9: The Regulatory Authority’s performance against the targets as set in the strategic plan.
RE
GU
LAT
OR
Y &
STA
KE
HO
LDE
R (
30 P
erce
nt)
Summary of Performance
44
45
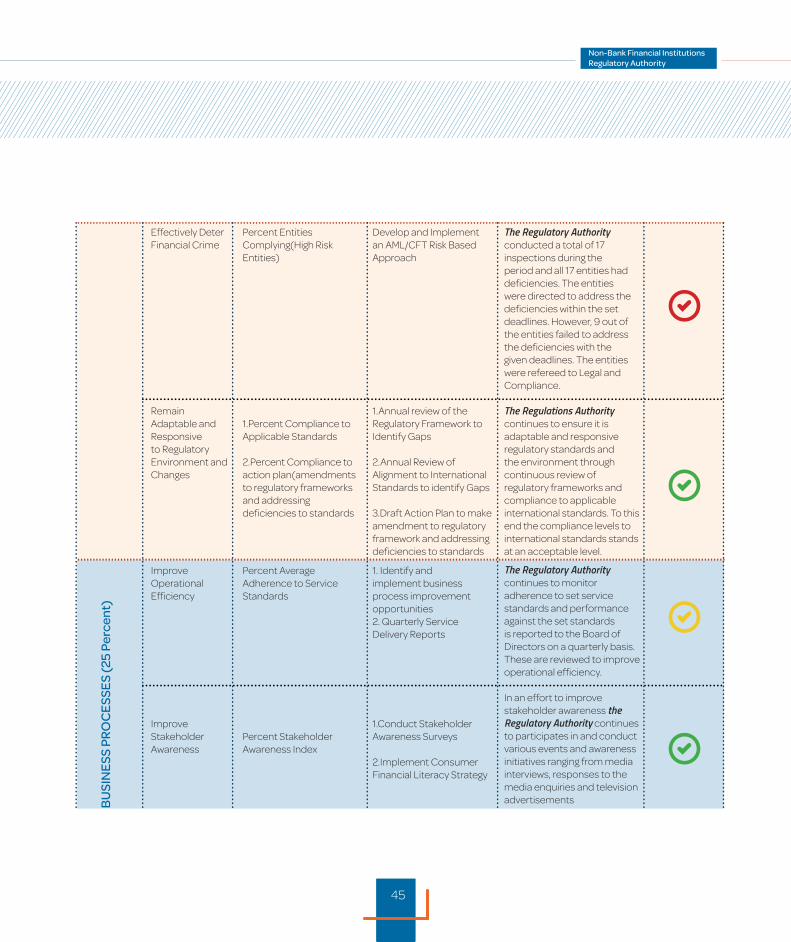
Effectively Deter Financial Crime
Remain Adaptable and Responsive to Regulatory Environment and Changes
Percent Entities Complying(High Risk Entities)
1.Percent Compliance to Applicable Standards
2.Percent Compliance to action plan(amendments to regulatory frameworks and addressing deficiencies to standards
Develop and Implement an AML/CFT Risk Based Approach
1.Annual review of the Regulatory Framework to Identify Gaps
2.Annual Review of Alignment to International Standards to identify Gaps
3.Draft Action Plan to make amendment to regulatory framework and addressing deficiencies to standards
The Regulatory Authority conducted a total of 17 inspections during the period and all 17 entities had deficiencies. The entities were directed to address the deficiencies within the set deadlines. However, 9 out of the entities failed to address the deficiencies with the given deadlines. The entities were refereed to Legal and Compliance.
The Regulations Authority continues to ensure it is adaptable and responsive regulatory standards and the environment through continuous review of regulatory frameworks and compliance to applicable international standards. To this end the compliance levels to international standards stands at an acceptable level.
Improve Operational Efficiency
Improve Stakeholder Awareness
Percent Average Adherence to Service Standards
Percent Stakeholder Awareness Index
1. Identify and implement business process improvement opportunities2. Quarterly Service Delivery Reports
1.Conduct Stakeholder Awareness Surveys
2.Implement Consumer Financial Literacy Strategy
The Regulatory Authority continues to monitor adherence to set service standards and performance against the set standards is reported to the Board of Directors on a quarterly basis. These are reviewed to improve operational efficiency.
In an effort to improve stakeholder awareness the Regulatory Authority continues to participates in and conduct various events and awareness initiatives ranging from media interviews, responses to the media enquiries and television advertisementsB
USI
NE
SS P
RO
CE
SSE
S (2
5 Pe
rcen
t)
45

46
Perspective(Weight)
Strategic Objective
Measure Initiative Performance Update
Performance status
Build Organisational Capacity and Capability
Improve Employee Engagement
Inculcate a High Performance Culture
PercentEmployees with requisite skills and competencies
Employee Engagement Level
Percent of employees rated level 2 and above *
1.Review and develop fit for purpose Organisational Design
2.Review and Implement Talent Management Strategy
3.Development and Implementation of Succession Plans
1. Implement Human Capital Strategies (Review General Conditions of Employment, Wellness Policy, Training Policy, etc.)
1.To develop and Implement a Rewards Policy(revisit existing draft)
2.Review the existing PMS and Implement
The Regulatory Authority this financial year embarked on an Organisational Structure Review Project which is aimed at addressing issues of building organisational capacity as well as ensure alignment of Structure to strategy .To this end the project is near completion with the expected implementation in 2021/2
The Regulatory Authority continues to participate in the annual Best Company to work for Survey. Through feedback obtained from the surveys management has been able to come up with policies, programmes that continues to improve and strengthen employee participation in the Organisational performance.
The Regulatory Authority continues to implement and strengthened a high performance culture through a number of initiatives such as Best Company to Work For survey, Organisational Structure review
LEA
RN
ING
& G
RO
WT
H (3
0 P
erce
nt)
Summary of Performance (continued)
46

47
Perspective(Weight)
Strategic Objective
Measure Initiative Performance Update
Performance status
Achieve Financial Sustainability
Percent Cost to Income Ratio-
1.Engage Government for sustainable and predictable funding model
2.Prudent Cost Management
The Regulatory Authority’s effort of achieving financial sustainability is on the right track with a number of effective engagements done with Ministry of Finance and Economic Development and regulated entities
FIN
AN
CIA
L (1
5 Pe
rcen
t)
LEGEND
80 - 100 65 - 79 0 - 64 Unrated
....................................................................
....................................................................
....................................................................
....................................................................
....................................................................
....................................................................
....................................................................
47
48
Risk Management
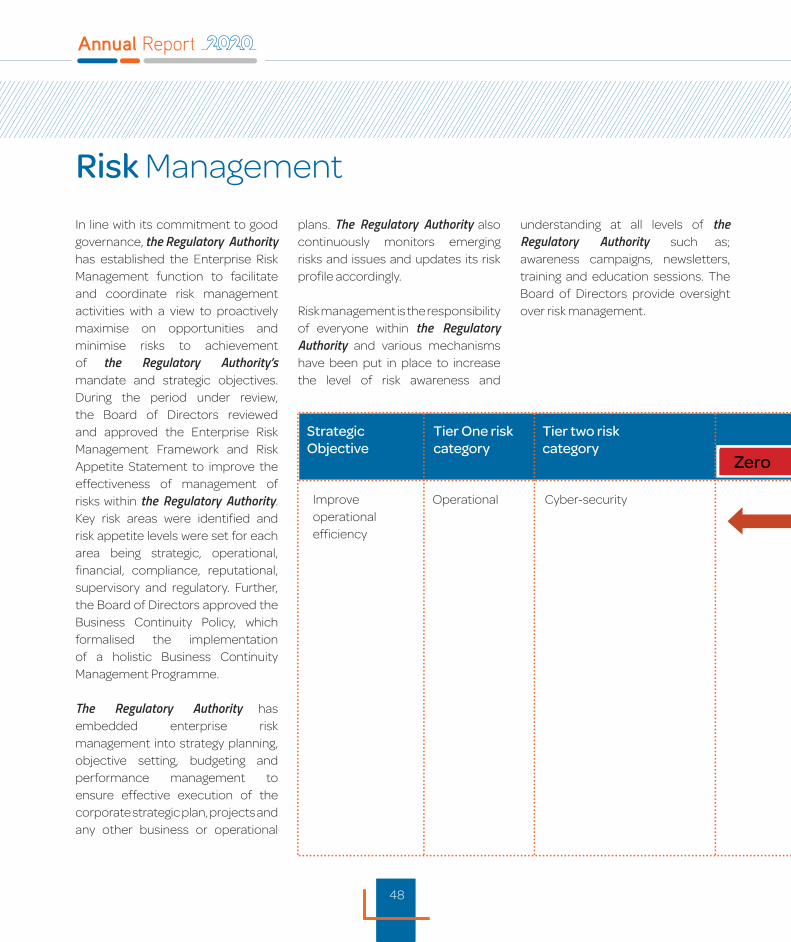
In line with its commitment to good governance, the Regulatory Authority has established the Enterprise Risk Management function to facilitate and coordinate risk management activities with a view to proactively maximise on opportunities and minimise risks to achievement of the Regulatory Authority’s mandate and strategic objectives. During the period under review, the Board of Directors reviewed and approved the Enterprise Risk Management Framework and Risk Appetite Statement to improve the effectiveness of management of risks within the Regulatory Authority. Key risk areas were identified and risk appetite levels were set for each area being strategic, operational, financial, compliance, reputational, supervisory and regulatory. Further, the Board of Directors approved the Business Continuity Policy, which formalised the implementation of a holistic Business Continuity Management Programme.
The Regulatory Authority has embedded enterprise risk management into strategy planning, objective setting, budgeting and performance management to ensure effective execution of the corporate strategic plan, projects and any other business or operational
plans. The Regulatory Authority also continuously monitors emerging risks and issues and updates its risk profile accordingly.
Risk management is the responsibility of everyone within the Regulatory Authority and various mechanisms have been put in place to increase the level of risk awareness and
understanding at all levels of the Regulatory Authority such as; awareness campaigns, newsletters, training and education sessions. The Board of Directors provide oversight over risk management.
Improve operational efficiency
Operational Cyber-security
Strategic Objective
Tier One riskcategory
Tier two riskcategory
Zero
48

49
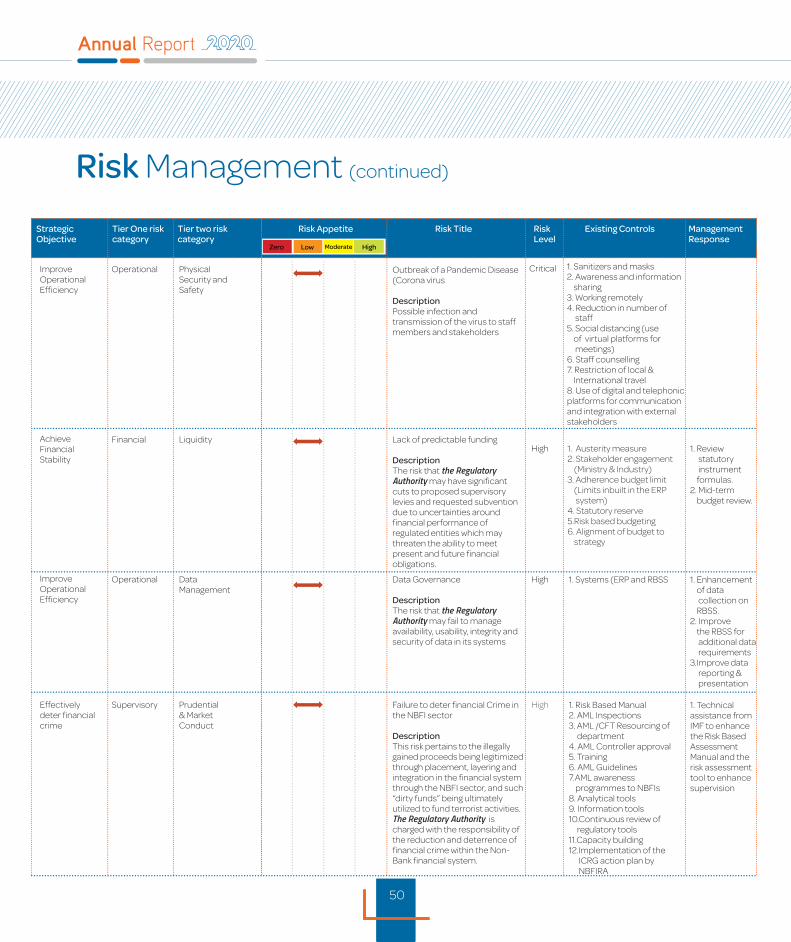
KEY RISKS
The Regulatory Authority’s top strategic risks are aligned to its mandate and strategic objectives. The table below shows key risks, risk appetite, existing controls and the Regulatory Authority’s response to the identified risk. The risks identified cut across different risk categories and sub categories.
Table 10: Top Risks
CriticalCyber-attack
DescriptionCyber-attack risk relates to the possibility of disruption or damage to the Regulatory Authority’s computer system through a virus, malware, a hacker, phishing or through other means. Attacks may come from inside or outside the organisation. The Regulatory Authority has automated its processes, and cyber-attacks may lead to non-availability of IT systems, resulting in business interruptions and financial loss to the Regulatory Authority.
1. Firewall2. Anti-virus systems3. Security policies4. Security awareness 5. Security updates and patches6. Currently using the latest operating systems7. Periodical Vulnerability Assessment and Penetration Testing
1. Review of security and IT policies
2. Enhancement of IT security awareness of staff.
Risk Appetite Risk Title Risk Level
Existing Controls ManagementResponse
Low HighModerate
49
50
Risk AppetiteStrategic Objective
Tier One riskcategory
Tier two riskcategory
Risk Title Risk Level
Existing Controls ManagementResponse
Zero Low HighModerate
..........................................................................................................................................................................................................................................................................
..........................................................................................................................................................................................................................................................................
..........................................................................................................................................................................................................................................................................
..........................................................................................................................................................................................................................................................................
Improve Operational Efficiency
Achieve Financial Stability
Improve Operational Efficiency
Effectively deter financial crime
Operational
Financial
Operational
Supervisory
CriticalPhysical Security and Safety
Liquidity
Data Management
Prudential & Market Conduct
High
High
High
Lack of predictable funding
DescriptionThe risk that the Regulatory Authority may have significant cuts to proposed supervisory levies and requested subvention due to uncertainties around financial performance of regulated entities which may threaten the ability to meet present and future financial obligations.
Data Governance
DescriptionThe risk that the Regulatory Authority may fail to manage availability, usability, integrity and security of data in its systems
Failure to deter financial Crime in the NBFI sector
DescriptionThis risk pertains to the illegally gained proceeds being legitimized through placement, layering and integration in the financial system through the NBFI sector, and such “dirty funds” being ultimately utilized to fund terrorist activities. The Regulatory Authority is charged with the responsibility of the reduction and deterrence of financial crime within the Non-Bank financial system.
1. Austerity measure 2. Stakeholder engagement (Ministry & Industry)3. Adherence budget limit (Limits inbuilt in the ERP system)4. Statutory reserve5.Risk based budgeting6. Alignment of budget to strategy
1. Systems (ERP and RBSS
1. Risk Based Manual2. AML Inspections3. AML /CFT Resourcing of department4. AML Controller approval5. Training6. AML Guidelines7.AML awareness programmes to NBFIs8. Analytical tools9. Information tools10.Continuous review of regulatory tools11.Capacity building12.Implementation of the ICRG action plan by NBFIRA
1. Review statutory instrument formulas.2. Mid-term budget review.
1. Enhancement of data collection on RBSS.2. Improve the RBSS for additional data requirements3.Improve data reporting & presentation
1. Technical assistance from IMF to enhance the Risk Based Assessment Manual and the risk assessment tool to enhance supervision
Outbreak of a Pandemic Disease (Corona virus
DescriptionPossible infection and transmission of the virus to staff members and stakeholders
1. Sanitizers and masks2. Awareness and information sharing3. Working remotely4. Reduction in number of staff5. Social distancing (use of virtual platforms for meetings)6. Staff counselling 7. Restriction of local & International travel8. Use of digital and telephonic platforms for communication and integration with external stakeholders
..........................................................................................................................................................................................................................................................................
..........................................................................................................................................................................................................................................................................................................................................................................................................................................................................................................
............................................ .....................................................................................................................................................................................
........................................................................................................................................................................................................................... .....
Risk Management (continued)
50
51
...............................................................................................................
...............................................................................................................
...............................................................................................................
................................................................... ............................................
...............................................................................................................
...............................................................................................................
...............................................................................................................
...............................................................................................................
...............................................................................................................
Risk AppetiteStrategic Objective
Tier One riskcategory
Tier two riskcategory
Risk Title Risk Level
Existing Controls ManagementResponse
Zero Low HighModerate
..........................................................................................................................................................................................................................................................................
..........................................................................................................................................................................................................................................................................
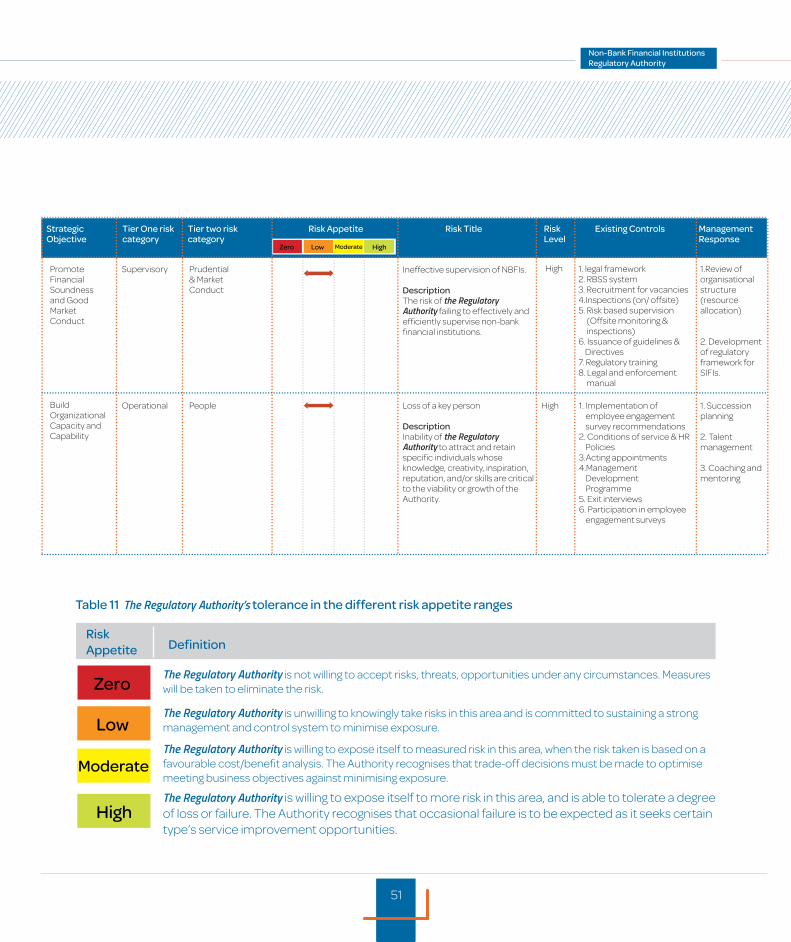
Promote Financial Soundness and Good Market Conduct
Build Organizational Capacity and Capability
Supervisory
Operational
HighPrudential & Market Conduct
People HighLoss of a key person
DescriptionInability of the Regulatory Authority to attract and retain specific individuals whose knowledge, creativity, inspiration, reputation, and/or skills are critical to the viability or growth of the Authority.
1. Implementation of employee engagement survey recommendations2. Conditions of service & HR Policies3.Acting appointments4.Management Development Programme5. Exit interviews6. Participation in employee engagement surveys
1. Succession planning
2. Talent management
3. Coaching and mentoring
1.Review of organisational structure (resource allocation)
2. Development of regulatory framework for SIFIs.
Ineffective supervision of NBFIs.
DescriptionThe risk of the Regulatory Authority failing to effectively and efficiently supervise non-bank financial institutions.
1. legal framework2. RBSS system3. Recruitment for vacancies4.Inspections (on/ offsite)5. Risk based supervision (Offsite monitoring & inspections)6. Issuance of guidelines & Directives7. Regulatory training8. Legal and enforcement manual
.......................................................................................................................................................................................................................................................................................................................................................................................
............................................................................................................
............................................................................................................
Table 11 The Regulatory Authority’s tolerance in the different risk appetite ranges
Risk Appetite Definition
The Regulatory Authority is not willing to accept risks, threats, opportunities under any circumstances. Measures will be taken to eliminate the risk.
The Regulatory Authority is unwilling to knowingly take risks in this area and is committed to sustaining a strong management and control system to minimise exposure.
The Regulatory Authority is willing to expose itself to more risk in this area, and is able to tolerate a degree of loss or failure. The Authority recognises that occasional failure is to be expected as it seeks certain type’s service improvement opportunities.
The Regulatory Authority is willing to expose itself to measured risk in this area, when the risk taken is based on a favourable cost/benefit analysis. The Authority recognises that trade-off decisions must be made to optimise meeting business objectives against minimising exposure.
51

52
Risk appetite statement
The risk appetite articulates the level of risk the Regulatory Authority is willing to accept in pursuit of its strategic and operational objectives. All strategic and operational decisions are taken within the Board approved risk tolerance levels. Performance against the risk tolerance levels is monitored and any breaches are escalated to the Board of Directors.
Business continuity
The Regulatory Authority has a robust Business Continuity Management Programme (BCMP) in place to meet its statutory obligations and support its vision, values and strategic objectives. The Regulatory Authority is committed to ensuring minimal disruption to provision of mission critical services following a disruptive event/disaster. The BCMP ensures a holistic management of business continuity across the Authority. Business Continuity provides a consolidated and organised coordination of the recovery of mission critical business functions in managing and supporting the
business recovery in the event of an office building disruption, disaster and or extended service outages caused by factors beyond the Regulatory Authority’s control. It also guides restoration of operations to the widest extent possible within a minimum time-frame. This was a critical development especially during the challenges presented by the extreme social distancing as directed by Government in efforts to control and contain the spread of COVID-19.
Ethics Policy
The Regulatory Authority is committed to the highest standards of ethical, moral and business conduct. The Regulatory Authority has begun the process of implementing a Ethics Policy, which will be referred to as an “Ethics Hot Line” to report any unethical behaviour, theft, fraud/corruption, intimidation, harassment and dishonesty by employees and service providers. The platform will be managed by a Deloitte subsidiary called “Tip-Offs Anonymous”.
ETHICS HOTLINE “Be Part Of The Solution!”
Free - call: [email protected]
www.tip-offs.comP. O. Box 448, Gaborone
52

53
The Regulatory Authority ensures strict compliance to the NBFIRA Act (2016),Financial Services Laws and other applicable legislation. The powers bestowed on the Regulatory Authority to enforce include:• Request of information and production of such records or documents as required;• Issuance of directives;• Imposition of administrative penalties• Suspension of licences;• Cancellation of licences; • Disqualification of controllers;• Temporary closure and freezing of accounts;• Appointment statutory managers;• Winding up of entity.
Figure 1: The number of enforcement actions taken during the financial year 2018/19 against contravening NBFIs:
Legal and Enforcement
53
54
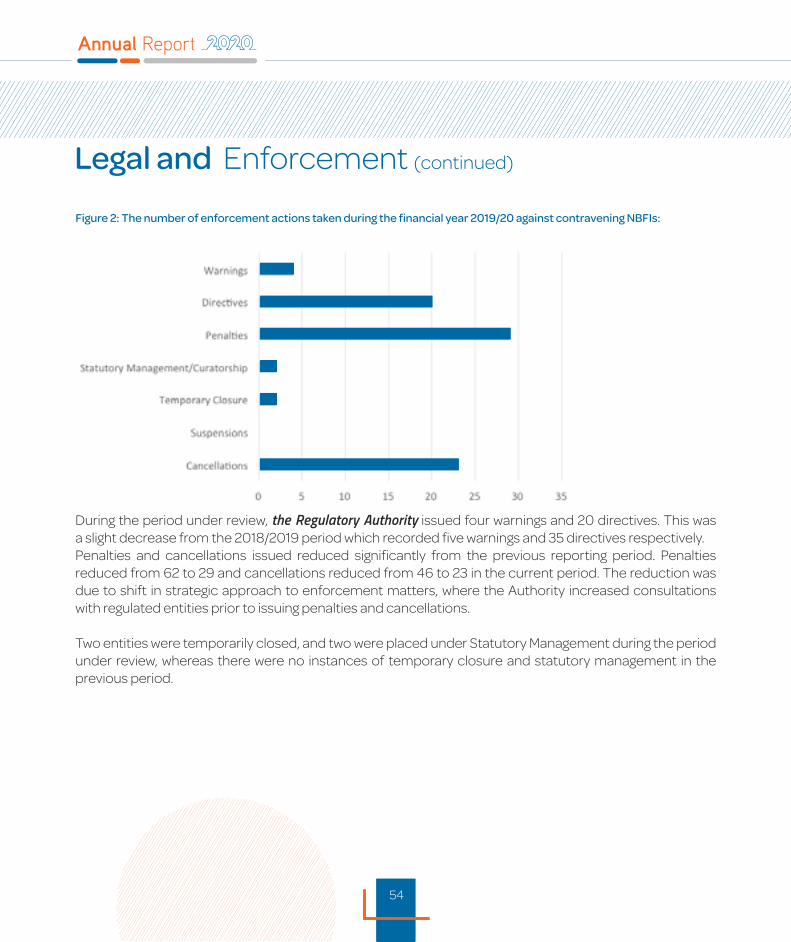
Figure 2: The number of enforcement actions taken during the financial year 2019/20 against contravening NBFIs:
During the period under review, the Regulatory Authority issued four warnings and 20 directives. This was a slight decrease from the 2018/2019 period which recorded five warnings and 35 directives respectively. Penalties and cancellations issued reduced significantly from the previous reporting period. Penalties reduced from 62 to 29 and cancellations reduced from 46 to 23 in the current period. The reduction was due to shift in strategic approach to enforcement matters, where the Authority increased consultations with regulated entities prior to issuing penalties and cancellations.
Two entities were temporarily closed, and two were placed under Statutory Management during the period under review, whereas there were no instances of temporary closure and statutory management in the previous period.
Legal and Enforcement (continued)
54

55
Macro Economic and Financial Markets Environment
The Regulatory Authority, through the Research Department, seeks to conduct market intelligence within the NBFI sector. This is achieved by tracking recent developments in the economy, and most importantly, in the financial sector, for the purpose of informing policy formulation, review and implementation, thus facilitate strategic and operational decision making for supervision and regulation of the non-bank financial sector.
Global Economic overview
Global economic growth continued to decline in 2019 as result of geopolitical tensions in major economies, especially between China and United States of America. Gross Domestic Product for advanced economies declined from 2.7 percent in 2018 to 1.7 percent in 2019. In the Euro area economic growth fell undermined largely by subdue economic growth together with uncertainties surrounding the Brexit; GDP fell from 1.9 percent in 2018 to 1.2 percent in 2019. Emerging and developing economies registered a fall in economic growth from 4.5 percent in 2018 to 3.7 percent in 2019. The Sub-Saharan region GDP contracted in 2018 to 3.1 percent in 2019.
Figure 3: Global Real GDP Growth for Year - ending December 31, 2019(%)
Figure 4: Global Inflation for the Year-ending December 31, 2019 (%)
Overall global economic activity decreased from 3.6 percent to 2.9 percent 2019 from 3.6 percent in 2018.
Global InflationGlobal inflation increased by 0.2 percent from 3.6 percent in 2018 to 3.8 percent in 2019. Emerging markets and developing economies and Sub Saharan Africa also registered an increase in the inflation rate from 4.8 percent in 2018 to 5.5 percent in 2019 and 7.8 percent in 2018 to 9.4 percent in 2019, respectively. Advanced economies registered a decrease in inflation from 1.6 percent in 2018 to 1.5 percent in 2019. In the Euro area inflation fell from 1.5 percent in 2018 to 1.3 percent in 2019. Lower Inflation was due to subdued consumer demand and declining international oil prices.
2018 2019
55

56
Domestic Real GDP
Domestic Real GDP registered a slower growth of 2.9 percent in 2019, compared to a faster expansion of 4.6 percent in 2018. The contraction in the mining and non-mining output were attributable to the lower demand for commodities.The global mining output registered a contraction of 3.9 percent in 2019 compared to 7.6 percent expansion recorded in 2018, due to weaker performance of the diamond, soda ash, copper and coal subsectors. The non-mining sector, on the other hand, registered a slower growth rate of 3.8 percent in 2019 against the 4.1 percent recorded in 2018, due
Domestic Inflation, Interest Rates and Credit Developments
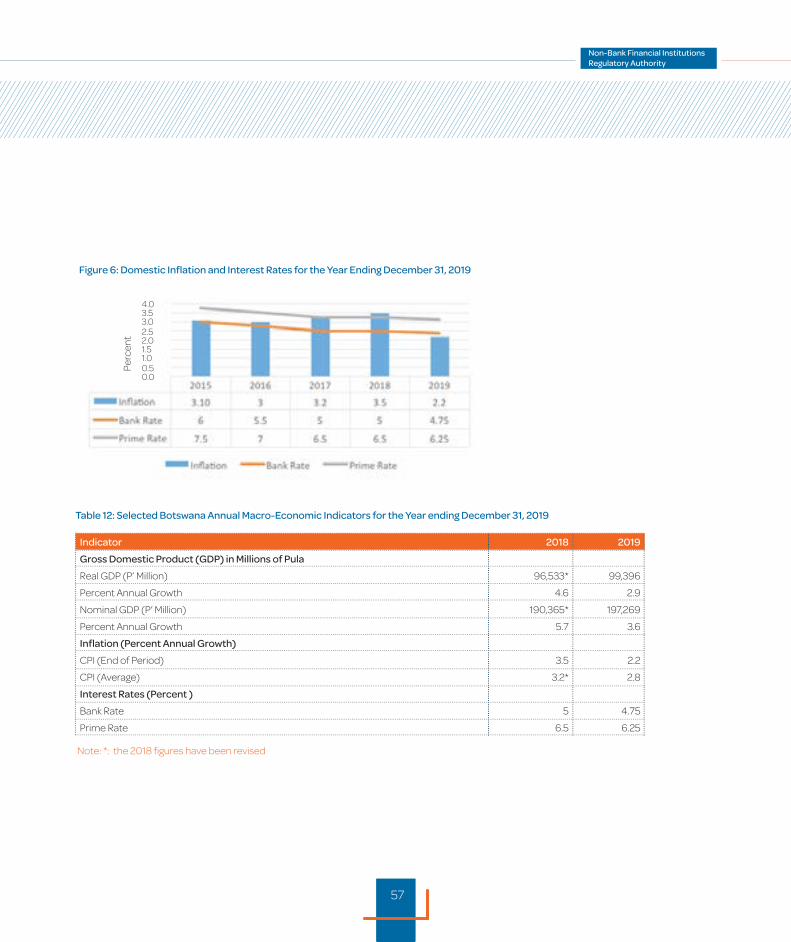
Domestic inflation decreased from 3.5 percent in 2018 to 2.2 percent in 2019 and was below the Bank of Botswana monetary policy objective range of 3-6 percent. Factors that contributed to the inflation level are domestic demand pressures which were influenced by moderate increase in personal incomes and modest increase in foreign prices. The Bank of Botswana reduced the Bank Rate by 25 basis points from 5 percent at end of 2018 to 4.75 percent at the end of 2019. The prime lending rate also fell by 25 basis points from 6.5 percent to 6.25 percent, in the same period. Growth in commercial bank credit remained high at 7.6 percent in 2019, and almost at 7.7 percent in 2018. The stagnant credit growth was mainly due to a reduced demand for credit facilities by some companies, more especially those in the diamond cutting and polishing industry.
to slower growth in manufacturing, construction, transport and communications and social and personal services sectors. The overall sector was however, cushioned by
acceleration in the trade, hotels and restaurants sectors. Nominal GDP fell to 3.6 percent in 2019 from 5.7 percent in 2018.
Figure 5: Domestic Real GDP Growth for Year - ending December 31, 2019
Perc
ent
Percent Change
Macro Economic and Financial Markets Environment (continued)
Pul
a M
illio
n
56
57
Figure 6: Domestic Inflation and Interest Rates for the Year Ending December 31, 2019
Table 12: Selected Botswana Annual Macro-Economic Indicators for the Year ending December 31, 2019
Indicator 2018 2019
Gross Domestic Product (GDP) in Millions of Pula
Real GDP (P’ Million) 96,533* 99,396
Percent Annual Growth 4.6 2.9
Nominal GDP (P’ Million) 190,365* 197,269
Percent Annual Growth 5.7 3.6
Inflation (Percent Annual Growth)
CPI (End of Period) 3.5 2.2
CPI (Average) 3.2* 2.8
Interest Rates (Percent )
Bank Rate 5 4.75
Prime Rate 6.5 6.25
Note: *: the 2018 figures have been revised
Perc
ent
0.00.51.01.52.02.53.03.54.0
57
58
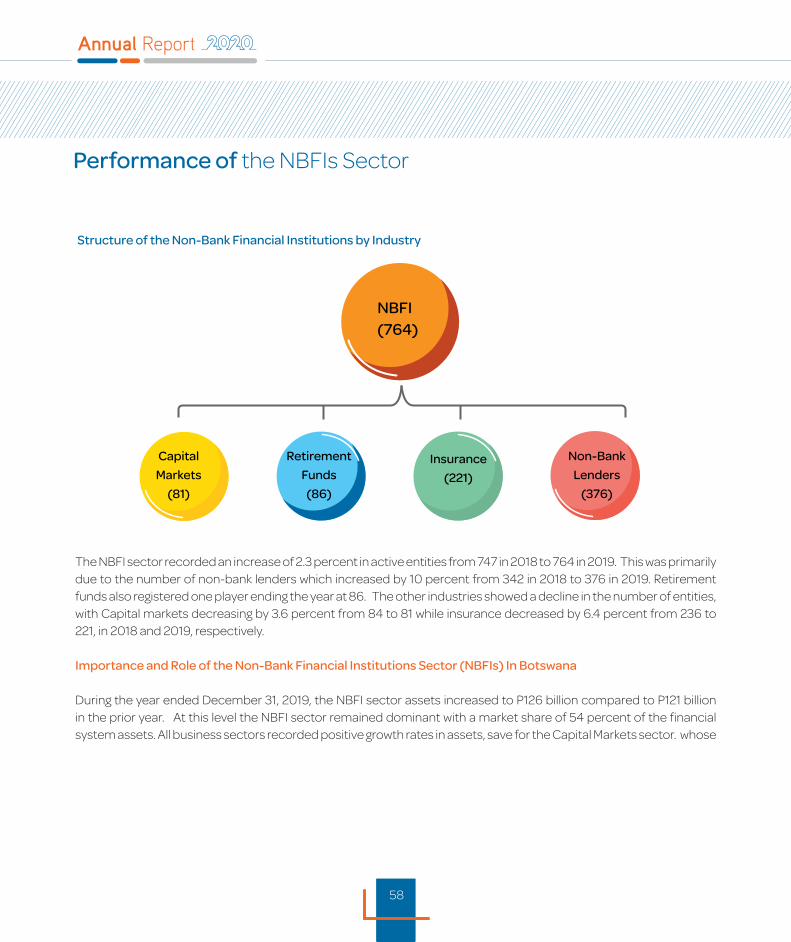
Structure of the Non-Bank Financial Institutions by Industry
NBFI(764)
Capital
Markets
(81)
Retirement
Funds
(86)
Insurance
(221)
Non-Bank
Lenders
(376)
The NBFI sector recorded an increase of 2.3 percent in active entities from 747 in 2018 to 764 in 2019. This was primarily due to the number of non-bank lenders which increased by 10 percent from 342 in 2018 to 376 in 2019. Retirement funds also registered one player ending the year at 86. The other industries showed a decline in the number of entities, with Capital markets decreasing by 3.6 percent from 84 to 81 while insurance decreased by 6.4 percent from 236 to 221, in 2018 and 2019, respectively.
Importance and Role of the Non-Bank Financial Institutions Sector (NBFIs) In Botswana
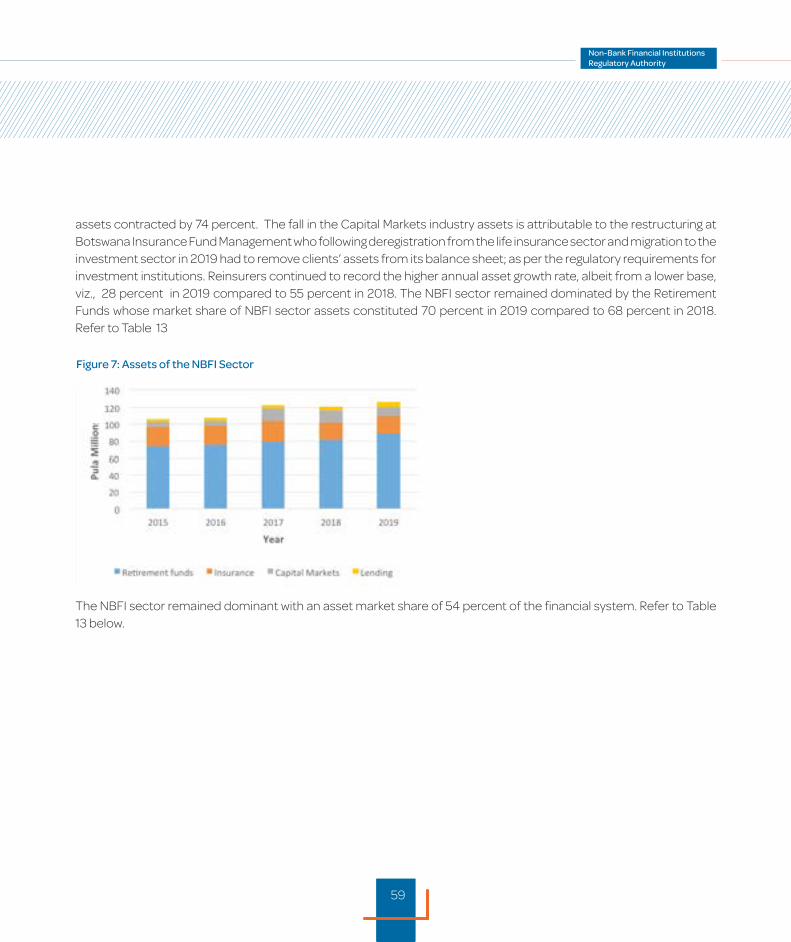
During the year ended December 31, 2019, the NBFI sector assets increased to P126 billion compared to P121 billion in the prior year. At this level the NBFI sector remained dominant with a market share of 54 percent of the financial system assets. All business sectors recorded positive growth rates in assets, save for the Capital Markets sector. whose
Performance of the NBFIs Sector
58
59
Figure 7: Assets of the NBFI Sector
The NBFI sector remained dominant with an asset market share of 54 percent of the financial system. Refer to Table 13 below.
assets contracted by 74 percent. The fall in the Capital Markets industry assets is attributable to the restructuring at Botswana Insurance Fund Management who following deregistration from the life insurance sector and migration to the investment sector in 2019 had to remove clients’ assets from its balance sheet; as per the regulatory requirements for investment institutions. Reinsurers continued to record the higher annual asset growth rate, albeit from a lower base, viz., 28 percent in 2019 compared to 55 percent in 2018. The NBFI sector remained dominated by the Retirement Funds whose market share of NBFI sector assets constituted 70 percent in 2019 compared to 68 percent in 2018. Refer to Table 13
59

60
Financial Institution Number of Institutions
Assets in P‘Million 2018
Assets in P ‘Million 2019
Percentage of Total Assets
Annual
Percentage
change
Banking Sector *1 13 98,814 107,510 46.0 8.8
Commercial Banks 10 91,331 98,685 42.3 8.1
Statutory Banks *2 2 3,466 4,184 1.8 20.7
Building Societies 1 4,017 4,641 2.0 15.5
Non-Bank Sector 428 121,093 126,047 54.0 4.1
Life Insurance 8 16,222 17,183 7.4 5.9
General Insurance 12 1,980 2,270 1.0 14.6
Re-Insurer 3 394 505 0.2 28.2
AUM for Retail & Private *3 n/a 8,034 8,863 3.8 10.3
Retirement Funds *4 86 81,819 88,573 37.9 8.3
Capital Markets *5 37 6,314 1,621 0.7 -74.3
Micro Lenders (Top 64) *6 64 4,852 5,437 2.3 12.1
Others (Estimate) *7 218 1,478 1,595 0.7 4.5
Grand Total * 1 441 219,860 233,543 100 6.2
Financial Institution P’Million2018
P’Million2019
Year – on -Year Percent change
Bank of Botswana (the central bank) 72,150 65,990 -8.5
Botswana Development Corporation 2,812 3,603 28.1
Motor Vehicle Accident Fund *8 3,764 4,086 8.5
SACCOS and IFSC (estimate) 0.6 0.6 0
Citizen Empowerment and Development Agency (CEDA) 2,106 2,295 8.9
Total 80,833 75,973 -6.0
Note 1 The banking sector assets and subsequently the financial system assets excludes the Bank of Botswana, CEDA, MVAF, BDC, SACCOS and the IFSC. These are
detailed below.
Table 13: Structure of the Botswana Financial System as at December 31, 2019
Performance of the NBFIs Sector (continued)
60
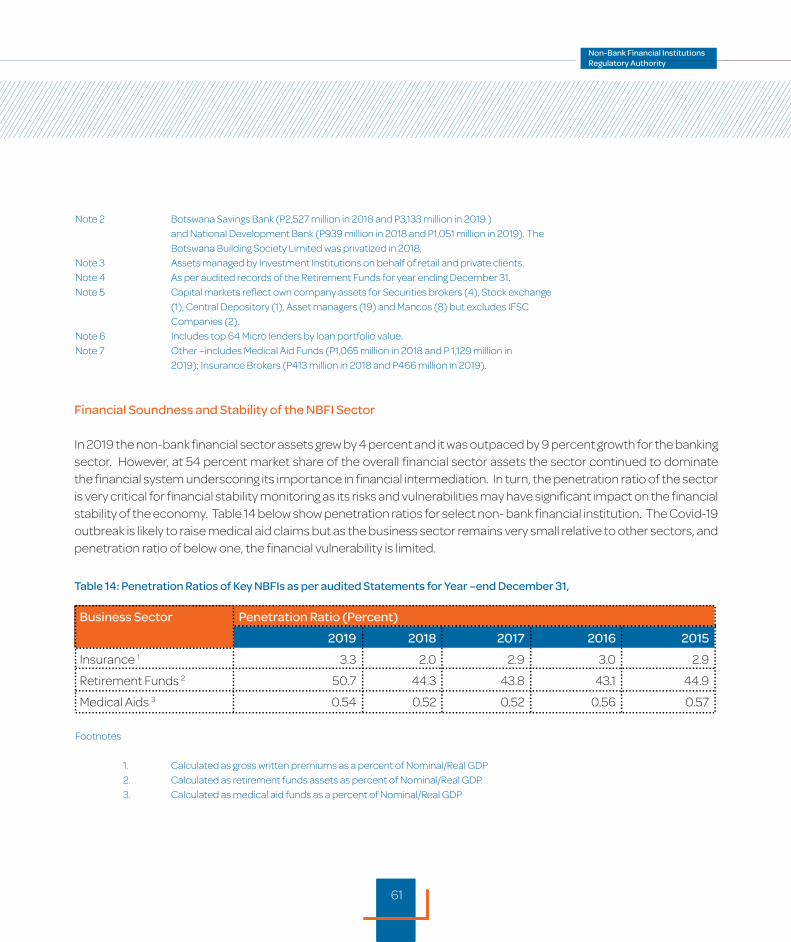
61
Financial Soundness and Stability of the NBFI Sector
In 2019 the non-bank financial sector assets grew by 4 percent and it was outpaced by 9 percent growth for the banking sector. However, at 54 percent market share of the overall financial sector assets the sector continued to dominate the financial system underscoring its importance in financial intermediation. In turn, the penetration ratio of the sector is very critical for financial stability monitoring as its risks and vulnerabilities may have significant impact on the financial stability of the economy. Table 14 below show penetration ratios for select non- bank financial institution. The Covid-19 outbreak is likely to raise medical aid claims but as the business sector remains very small relative to other sectors, and penetration ratio of below one, the financial vulnerability is limited.
Note 2 Botswana Savings Bank (P2,527 million in 2018 and P3,133 million in 2019 )
and National Development Bank (P939 million in 2018 and P1,051 million in 2019). The
Botswana Building Society Limited was privatized in 2018.
Note 3 Assets managed by Investment Institutions on behalf of retail and private clients.
Note 4 As per audited records of the Retirement Funds for year ending December 31.
Note 5 Capital markets reflect own company assets for Securities brokers (4), Stock exchange
(1), Central Depository (1), Asset managers (19) and Mancos (8) but excludes IFSC
Companies (2).
Note 6 Includes top 64 Micro lenders by loan portfolio value.
Note 7 Other –includes Medical Aid Funds (P1,065 million in 2018 and P 1,129 million in
2019); Insurance Brokers (P413 million in 2018 and P466 million in 2019).
Business Sector Penetration Ratio (Percent)
2019 2018 2017 2016 2015
Insurance 1 3.3 2.0 2.9 3.0 2.9
Retirement Funds 2 50.7 44.3 43.8 43.1 44.9
Medical Aids 3 0.54 0.52 0.52 0.56 0.57
Footnotes
1. Calculated as gross written premiums as a percent of Nominal/Real GDP
2. Calculated as retirement funds assets as percent of Nominal/Real GDP
3. Calculated as medical aid funds as a percent of Nominal/Real GDP
Table 14: Penetration Ratios of Key NBFIs as per audited Statements for Year –end December 31,
61
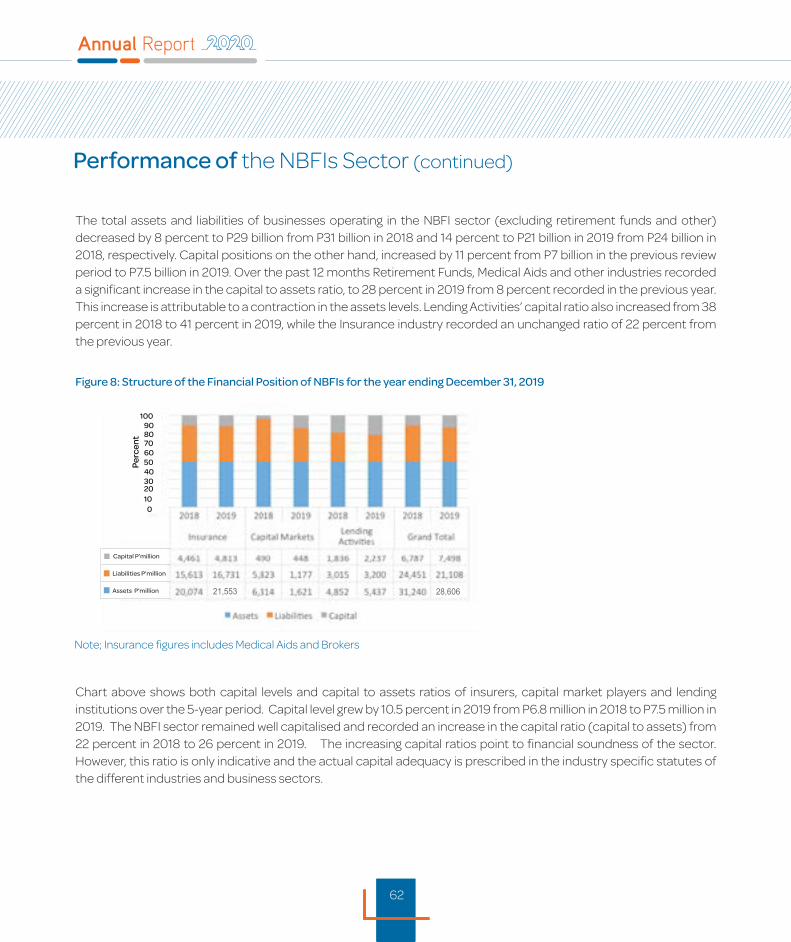
62
Figure 8: Structure of the Financial Position of NBFIs for the year ending December 31, 2019
The total assets and liabilities of businesses operating in the NBFI sector (excluding retirement funds and other) decreased by 8 percent to P29 billion from P31 billion in 2018 and 14 percent to P21 billion in 2019 from P24 billion in 2018, respectively. Capital positions on the other hand, increased by 11 percent from P7 billion in the previous review period to P7.5 billion in 2019. Over the past 12 months Retirement Funds, Medical Aids and other industries recorded a significant increase in the capital to assets ratio, to 28 percent in 2019 from 8 percent recorded in the previous year. This increase is attributable to a contraction in the assets levels. Lending Activities’ capital ratio also increased from 38 percent in 2018 to 41 percent in 2019, while the Insurance industry recorded an unchanged ratio of 22 percent from the previous year.
Chart above shows both capital levels and capital to assets ratios of insurers, capital market players and lending institutions over the 5-year period. Capital level grew by 10.5 percent in 2019 from P6.8 million in 2018 to P7.5 million in 2019. The NBFI sector remained well capitalised and recorded an increase in the capital ratio (capital to assets) from 22 percent in 2018 to 26 percent in 2019. The increasing capital ratios point to financial soundness of the sector. However, this ratio is only indicative and the actual capital adequacy is prescribed in the industry specific statutes of the different industries and business sectors.
100908070605040302010
0
Perc
ent
Capital P’million
Liabilities P’million
Assets P’million
Performance of the NBFIs Sector (continued)
62
Note; Insurance figures includes Medical Aids and Brokers
21,553 28,606

63
Figure 9: Profitability ratios
Profitability of the NBFI sector
The NBFI sector was profitable in 2019 and registered an increase in profit before tax from P1.4 billion in 2018 to P1.7 billion in 2019. This was attributed to increases in profits of the Insurance and Lending industries. The return on assets increased from 4.5 percent in 2018 to 5.8 percent in 2019 (see Figure 9 below).
P’million
P’million
P’million
Pul
a M
illio
n
Perc
ent
RHS
63
Note; Insurance figures includes Medical Aids and Brokers
21,553 28,606

64
Insurance
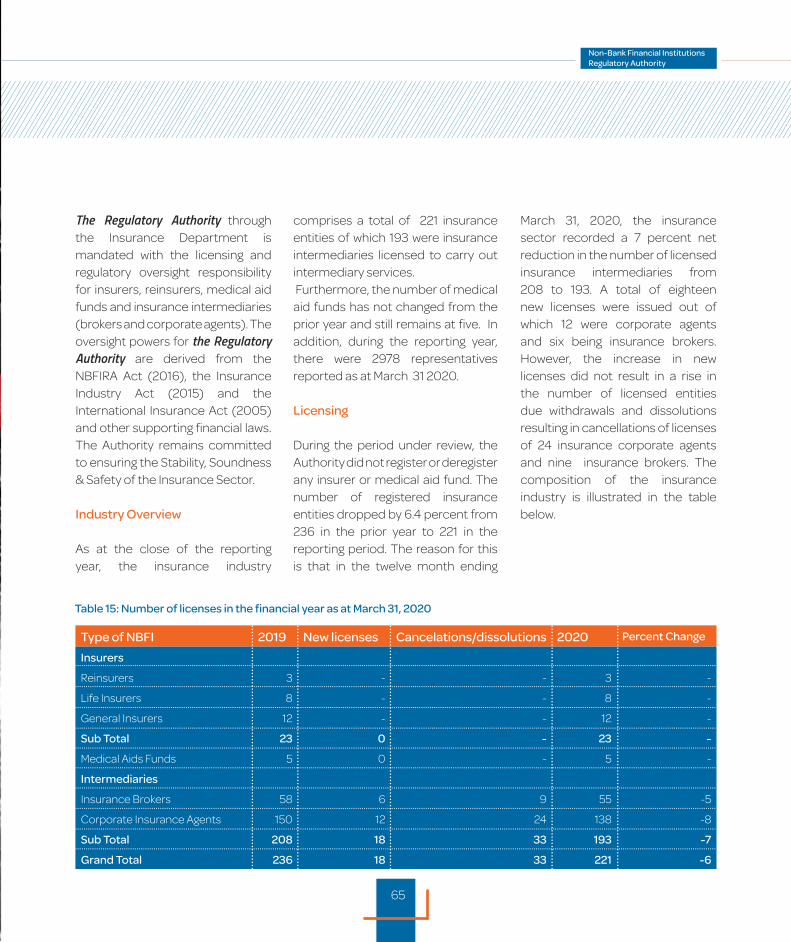
65
The Regulatory Authority through the Insurance Department is mandated with the licensing and regulatory oversight responsibility for insurers, reinsurers, medical aid funds and insurance intermediaries (brokers and corporate agents). The oversight powers for the Regulatory Authority are derived from the NBFIRA Act (2016), the Insurance Industry Act (2015) and the International Insurance Act (2005) and other supporting financial laws. The Authority remains committed to ensuring the Stability, Soundness & Safety of the Insurance Sector.
Industry Overview
As at the close of the reporting year, the insurance industry
comprises a total of 221 insurance entities of which 193 were insurance intermediaries licensed to carry out intermediary services. Furthermore, the number of medical aid funds has not changed from the prior year and still remains at five. In addition, during the reporting year, there were 2978 representatives reported as at March 31 2020.
Licensing
During the period under review, the Authority did not register or deregister any insurer or medical aid fund. The number of registered insurance entities dropped by 6.4 percent from 236 in the prior year to 221 in the reporting period. The reason for this is that in the twelve month ending
March 31, 2020, the insurance sector recorded a 7 percent net reduction in the number of licensed insurance intermediaries from 208 to 193. A total of eighteen new licenses were issued out of which 12 were corporate agents and six being insurance brokers. However, the increase in new licenses did not result in a rise in the number of licensed entities due withdrawals and dissolutions resulting in cancellations of licenses of 24 insurance corporate agents and nine insurance brokers. The composition of the insurance industry is illustrated in the table below.
Type of NBFI 2019 New licenses Cancelations/dissolutions 2020 Percent Change
Insurers
Reinsurers 3 - - 3 -
Life Insurers 8 - - 8 -
General Insurers 12 - - 12 -
Sub Total 23 0 - 23 -
Medical Aids Funds 5 0 - 5 -
Intermediaries
Insurance Brokers 58 6 9 55 -5
Corporate Insurance Agents 150 12 24 138 -8
Sub Total 208 18 33 193 -7
Grand Total 236 18 33 221 -6
Table 15: Number of licenses in the financial year as at March 31, 2020

66
Table 15 above shows that insurance sector has experienced a reduction in numbers for both insurance brokers and insurance corporate agents as indicated by 5 percent and 8 percent fall in insurance brokers and agents, respectively. This has resulted in an overall fall in insurance entities by 6 percent.
The following is a summarised structure of the insurance industry under supervision of NBFIRA.
Insurers (23) Reinsurers (3)
General Insurers(12)
Intermediaries(193) Brokers (55) Corporate Agents (138)
Regulated
(221)
Medical Aid Funds (5)
Figure 10: Structure of the Insurance Industry as at March 31, 2020.
Entities
Life Insurers(8)
66

67
Figure 11: Abridged Statement of Financial Position of the Insurance Industry
Regulatory Developments
During the period under review, important regulatory developments included the commencement of the new Insurance Industry Act 2015 and its supporting regulations. The Act commenced in May 2019 following the approval of the regulations and was later followed by the implementation of the Policyholder Protection Rules (PPR). The PPR’s objective is to enhance the protection of policyholders and foster greater transparency and accountability of industry players. It brought about requirements for improved conduct of business, more disclosures and freedom of choice among others and to facilitate the policyholders
awareness of their rights and obligations under the policy.
Supervisory Developments
The Authority issued an information letter NBFIRA 9/6/10 on 11 June 2019. The purpose of this letter was to inform insurers and insurance intermediaries of the implementation dates of the newly promulgated Insurance Industry Act 2015.
Financial Overview of the Insurance Sector; Segmentation between General and Life
Life insurance continues to dominate the insurance industry in
the share of assets and gross written premium under-written during the year ending December 31, 2019. The market share of industry assets and Gross Written Premiums for the Life Insurers were 86 percent and 72 percent respectively. The latter was a slight decline from 74 percent registered in 2018 depicting that consumer preferences for life insurance products continues to dominate non-life products but at a slight decreasing rate. Total liabilities of the Life insurers accounted for around 72 percent of the total insurance industry assets for the year ending December 31, 2019. This is a significant reduction from the 81 percent recorded in the previous review period.
100
90
80
70
60
50
40
30
20
10
0
Perc
ent
(P Million)
2019 2018
Total Capital 3,716 3,639
Total Liabilities 16,229 15,372
Total Assets 19,944 19,011
67
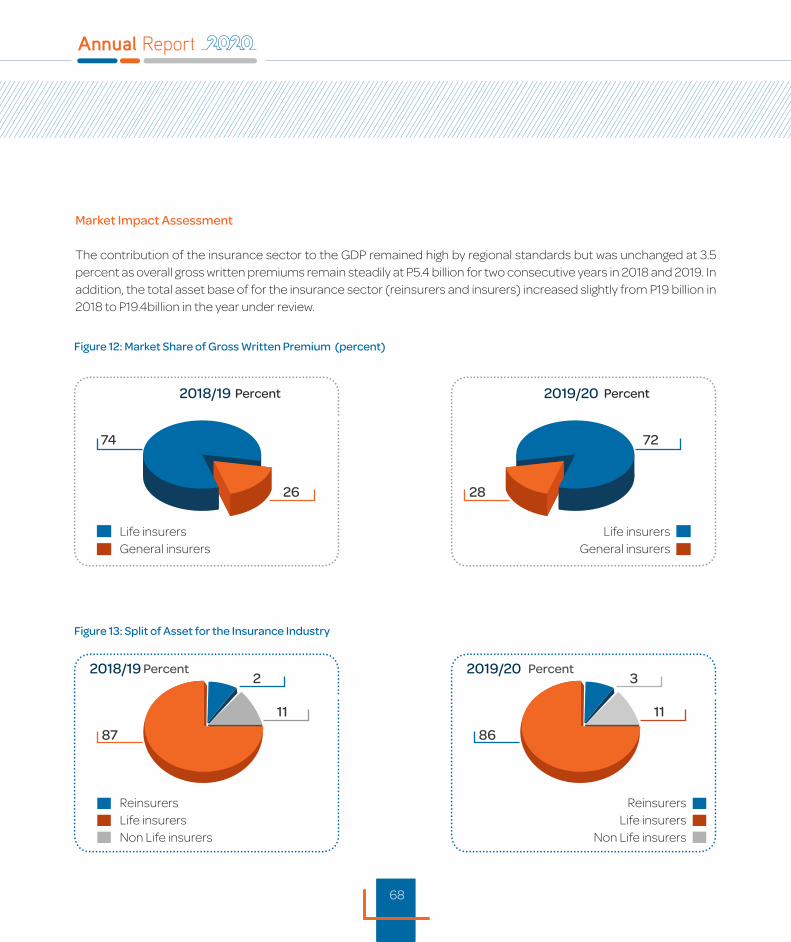
68
Market Impact Assessment
The contribution of the insurance sector to the GDP remained high by regional standards but was unchanged at 3.5 percent as overall gross written premiums remain steadily at P5.4 billion for two consecutive years in 2018 and 2019. In addition, the total asset base of for the insurance sector (reinsurers and insurers) increased slightly from P19 billion in 2018 to P19.4billion in the year under review.
Figure 12: Market Share of Gross Written Premium (percent)
Figure 13: Split of Asset for the Insurance Industry
2018/19
2018/19 2019/20
2019/20
Life insurersGeneral insurers
ReinsurersLife insurersNon Life insurers
ReinsurersLife insurers
Non Life insurers
Life insurersGeneral insurers
26
11 11
2 3
87 86
28
74 72
Percent
Percent Percent
Percent
68
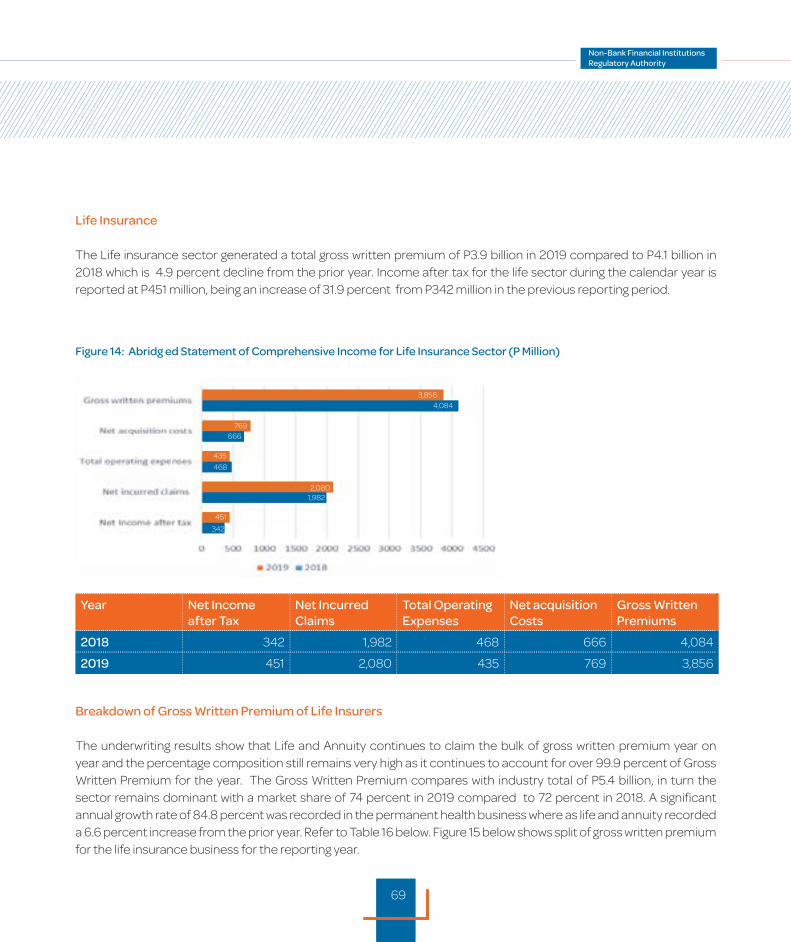
69
Figure 14: Abridg ed Statement of Comprehensive Income for Life Insurance Sector (P Million)
Life Insurance
The Life insurance sector generated a total gross written premium of P3.9 billion in 2019 compared to P4.1 billion in 2018 which is 4.9 percent decline from the prior year. Income after tax for the life sector during the calendar year is reported at P451 million, being an increase of 31.9 percent from P342 million in the previous reporting period.
Breakdown of Gross Written Premium of Life Insurers
The underwriting results show that Life and Annuity continues to claim the bulk of gross written premium year on year and the percentage composition still remains very high as it continues to account for over 99.9 percent of Gross Written Premium for the year. The Gross Written Premium compares with industry total of P5.4 billion, in turn the sector remains dominant with a market share of 74 percent in 2019 compared to 72 percent in 2018. A significant annual growth rate of 84.8 percent was recorded in the permanent health business where as life and annuity recorded a 6.6 percent increase from the prior year. Refer to Table 16 below. Figure 15 below shows split of gross written premium for the life insurance business for the reporting year.
3,856
769666
435
468
2,0801,982
451
342
4,084
Year Net Income after Tax
Net Incurred Claims
Total Operating Expenses
Net acquisition Costs
Gross WrittenPremiums
2018 342 1,982 468 666 4,084
2019 451 2,080 435 769 3,856
69
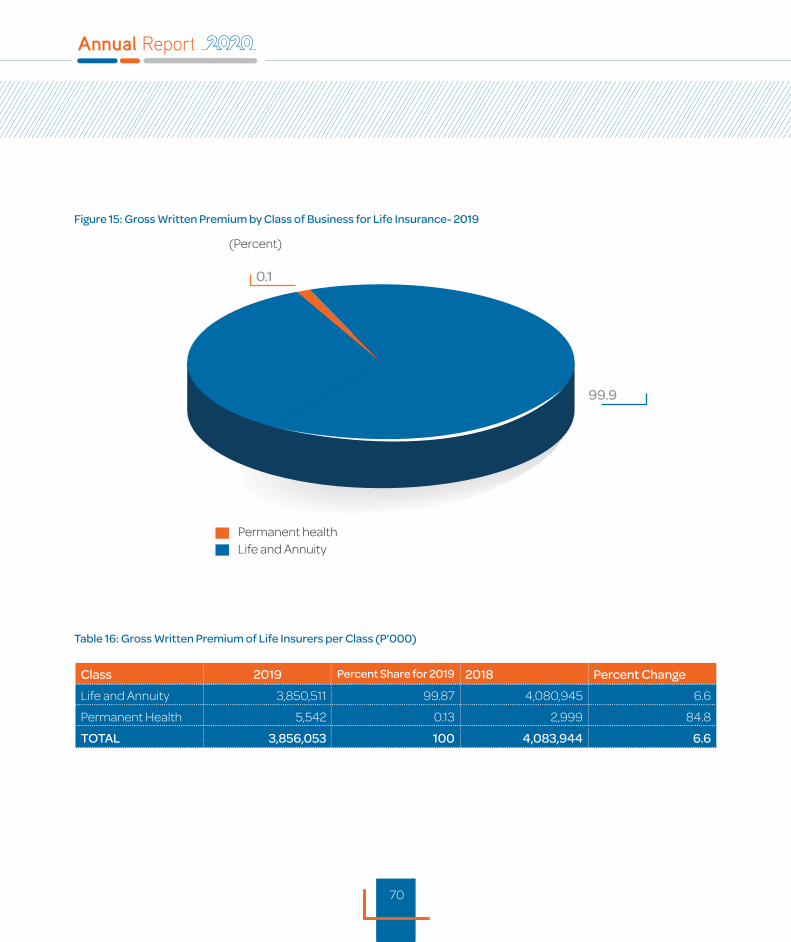
70
Figure 15: Gross Written Premium by Class of Business for Life Insurance- 2019
Table 16: Gross Written Premium of Life Insurers per Class (P’000)
Class 2019 Percent Share for 2019 2018 Percent Change
Life and Annuity 3,850,511 99.87 4,080,945 6.6
Permanent Health 5,542 0.13 2,999 84.8
TOTAL 3,856,053 100 4,083,944 6.6
Permanent healthLife and Annuity
(Percent)
99.9
0.1
70
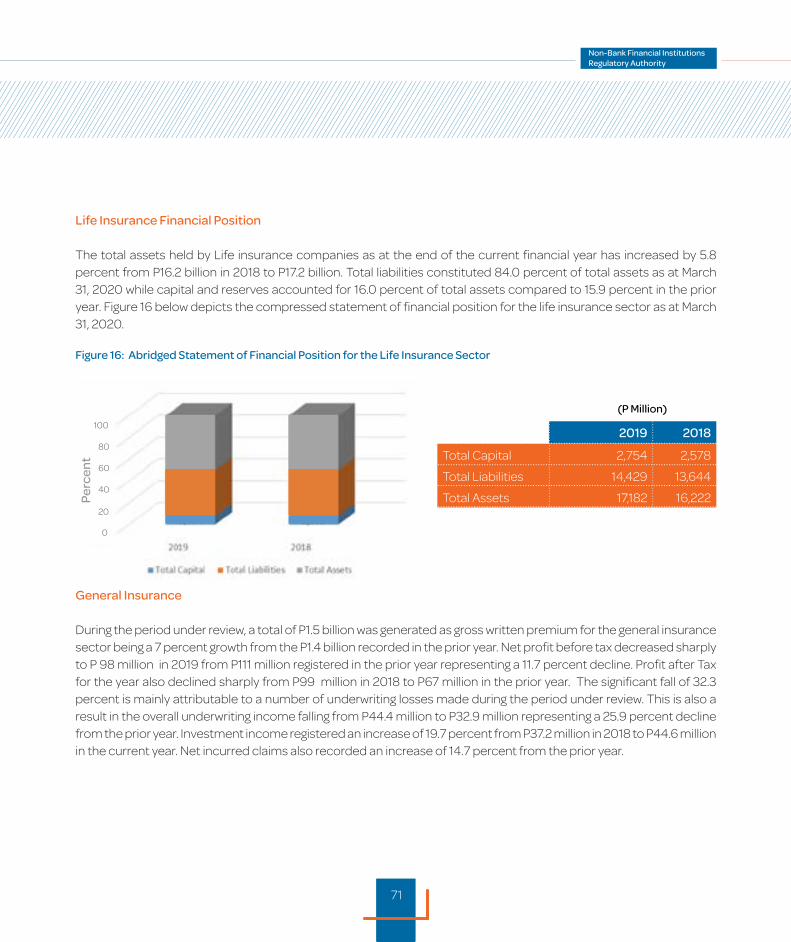
71
Life Insurance Financial Position
The total assets held by Life insurance companies as at the end of the current financial year has increased by 5.8 percent from P16.2 billion in 2018 to P17.2 billion. Total liabilities constituted 84.0 percent of total assets as at March 31, 2020 while capital and reserves accounted for 16.0 percent of total assets compared to 15.9 percent in the prior year. Figure 16 below depicts the compressed statement of financial position for the life insurance sector as at March 31, 2020.
Figure 16: Abridged Statement of Financial Position for the Life Insurance Sector
2019 2018
Total Capital 2,754 2,578
Total Liabilities 14,429 13,644
Total Assets 17,182 16,222
General Insurance
During the period under review, a total of P1.5 billion was generated as gross written premium for the general insurance sector being a 7 percent growth from the P1.4 billion recorded in the prior year. Net profit before tax decreased sharply to P 98 million in 2019 from P111 million registered in the prior year representing a 11.7 percent decline. Profit after Tax for the year also declined sharply from P99 million in 2018 to P67 million in the prior year. The significant fall of 32.3 percent is mainly attributable to a number of underwriting losses made during the period under review. This is also a result in the overall underwriting income falling from P44.4 million to P32.9 million representing a 25.9 percent decline from the prior year. Investment income registered an increase of 19.7 percent from P37.2 million in 2018 to P44.6 million in the current year. Net incurred claims also recorded an increase of 14.7 percent from the prior year.
0
20
40
60
80
100
Perc
ent
(P Million)
71

72
Figure 17: Abridged Statement of Comprehensive Income for General Insurance Sector (P Million)
Year Net Income after tax
Net incurred claims
Total operating expenses
Net acquisition costs
Gross written premiums
2018 99 423 248 120 1,366
2019 67 485 267 96 1,502
Gross Written Premium by Class of Business for General Insurance
During the year motor dominated the share of gross written premiums for the first time in the past decade at 31.4 percent share followed by property and liability with 30.9 percent and 12.3 percent respectively with the rest falling below the 10 percent share. In the previous year property accounted for 35 percent which means it has only dropped by less than 4 percent from the previous year while motor declined by 0.6 percent from 32 percent in the previous year. The market share of gross written premium by individual classes is presented in Figure 18 below:
1,502
1,366
96
120
267
485
423
67
99
248
72
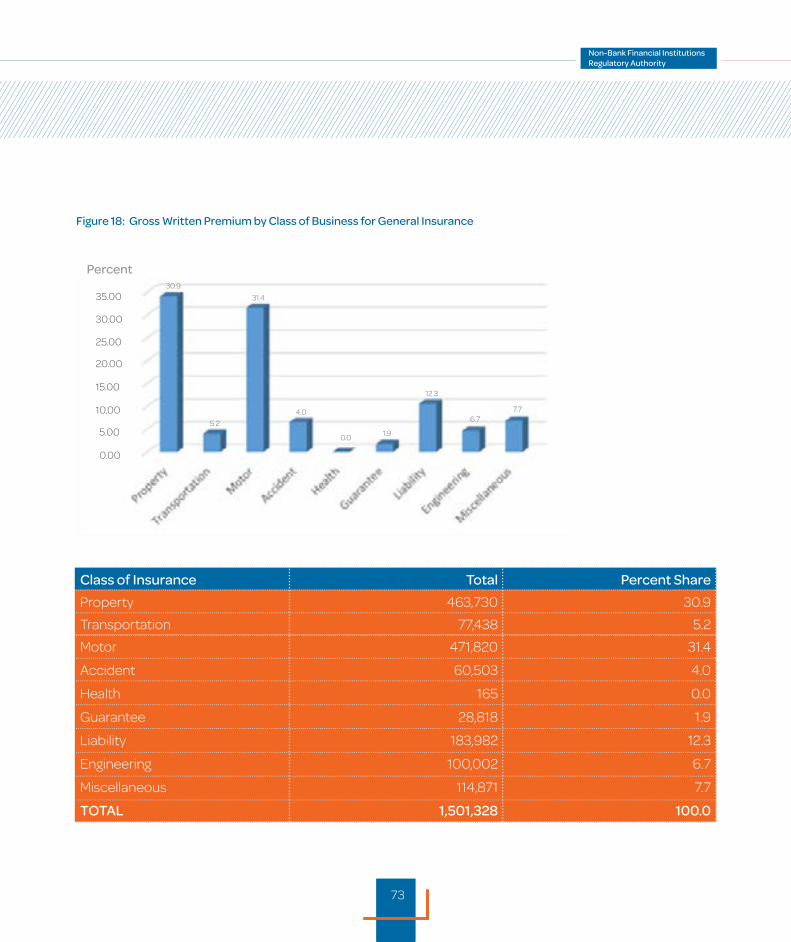
73
Class of Insurance Total Percent Share
Property 463,730 30.9
Transportation 77,438 5.2
Motor 471,820 31.4
Accident 60,503 4.0
Health 165 0.0
Guarantee 28,818 1.9
Liability 183,982 12.3
Engineering 100,002 6.7
Miscellaneous 114,871 7.7
TOTAL 1,501,328 100.0
Figure 18: Gross Written Premium by Class of Business for General Insurance
0.00
5.00
10.00
15.00
20.00
25.00
30.00
35.00
Percent30.9
31.4
4.0
0.01.9
12.3
6.77.7
5.2
73
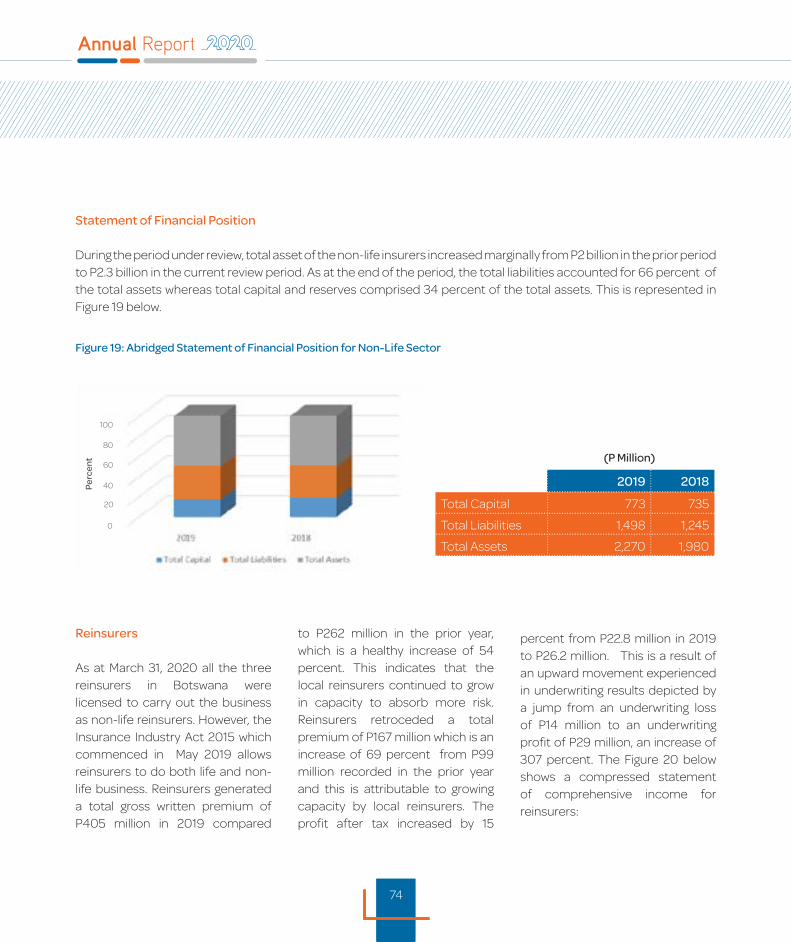
74
Statement of Financial Position
During the period under review, total asset of the non-life insurers increased marginally from P2 billion in the prior period to P2.3 billion in the current review period. As at the end of the period, the total liabilities accounted for 66 percent of the total assets whereas total capital and reserves comprised 34 percent of the total assets. This is represented in Figure 19 below.
Figure 19: Abridged Statement of Financial Position for Non-Life Sector
Reinsurers
As at March 31, 2020 all the three reinsurers in Botswana were licensed to carry out the business as non-life reinsurers. However, the Insurance Industry Act 2015 which commenced in May 2019 allows reinsurers to do both life and non-life business. Reinsurers generated a total gross written premium of P405 million in 2019 compared
to P262 million in the prior year, which is a healthy increase of 54 percent. This indicates that the local reinsurers continued to grow in capacity to absorb more risk. Reinsurers retroceded a total premium of P167 million which is an increase of 69 percent from P99 million recorded in the prior year and this is attributable to growing capacity by local reinsurers. The profit after tax increased by 15
percent from P22.8 million in 2019 to P26.2 million. This is a result of an upward movement experienced in underwriting results depicted by a jump from an underwriting loss of P14 million to an underwriting profit of P29 million, an increase of 307 percent. The Figure 20 below shows a compressed statement of comprehensive income for reinsurers:
0
20
40
60
80
100
Perc
ent
2019 2018
Total Capital 773 735
Total Liabilities 1,498 1,245
Total Assets 2,270 1,980
(P Million)
74

75
Figure 20: Abridged Statement of Comprehensive Income for Reinsurers (P Million)
During the period under review, the total asset base of reinsurers increased by 28.2 percent from P394 million in 2018 to P505 million in the current year. The increase in total asset base of reinsurers demonstrates increasing underwriting capacity of the local reinsurance market. Reinsurers’ total liabilities experienced a 46 percent
increase from P230 million in 2018 to P315 million during the current reporting period. Reserves fell sharply by 60 percent from P66.3 million in 2018 to P26.3 million during the current review period, while retained earnings increased nearly six fold from P2.4 million in 2018 to P16.7 million during the current review period. The proportion
of total liabilities to total assets increased from 58 percent in 2018 to 63 percent in the current review period while the proportion of capital to total assets fell from 42 percent in 2018 to 37.5 percent during the current review period. Figure 21 below shows a condensed statement of financial position for reinsurers.
Figure 21: Abridged Statement of Financial Position for Reinsurers
0
20
40
60
80
100
Perc
ent 2019 2018
Total Capital 189 164
Total Liabilities 315 230
Total Assets 505 394
(P Million)
2019 2018
Gross Written Premiums 405 262
Total Operating Expenses 59 43
Net Profit after Tax 26 23
(P Million)
75
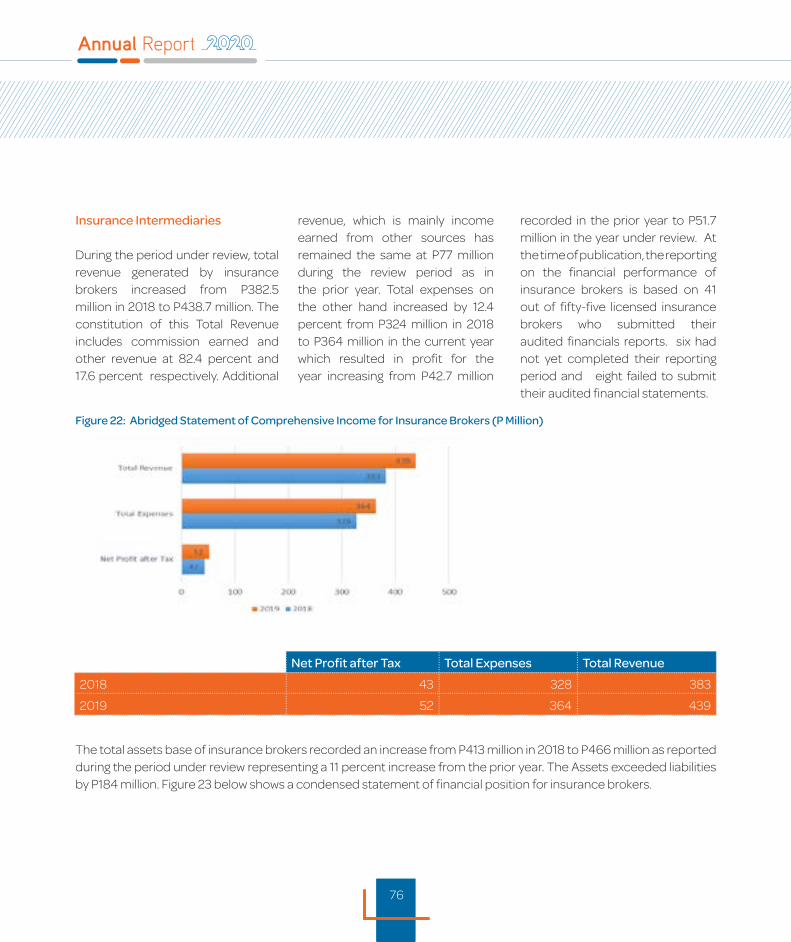
76
Insurance Intermediaries
During the period under review, total revenue generated by insurance brokers increased from P382.5 million in 2018 to P438.7 million. The constitution of this Total Revenue includes commission earned and other revenue at 82.4 percent and 17.6 percent respectively. Additional
revenue, which is mainly income earned from other sources has remained the same at P77 million during the review period as in the prior year. Total expenses on the other hand increased by 12.4 percent from P324 million in 2018 to P364 million in the current year which resulted in profit for the year increasing from P42.7 million
recorded in the prior year to P51.7 million in the year under review. At the time of publication, the reporting on the financial performance of insurance brokers is based on 41 out of fifty-five licensed insurance brokers who submitted their audited financials reports. six had not yet completed their reporting period and eight failed to submit their audited financial statements.
Figure 22: Abridged Statement of Comprehensive Income for Insurance Brokers (P Million)
Net Profit after Tax Total Expenses Total Revenue
2018 43 328 383
2019 52 364 439
The total assets base of insurance brokers recorded an increase from P413 million in 2018 to P466 million as reported during the period under review representing a 11 percent increase from the prior year. The Assets exceeded liabilities by P184 million. Figure 23 below shows a condensed statement of financial position for insurance brokers.
76

77
Figure 23: Abridged Statement of Financial Position for Insurance Brokers
Capital Requirements
The Insurance Industry Act (2015) which commenced in May 2019 requires that Insurance entities maintain a minimum capital requirement of P5 million for general insurers and P10 million for life insurers/reinsures. Insurance intermediaries are also required to maintain a minimum statutory capital of at least P100 000 and
P30,000 for insurance brokers and Corporate Agents respectively. A life insurer is considered financially sound when its assets exceed its liabilities whereas a short term insurer is considered to be financially sound when its solvency ratio is 125 percent or more. However, with the alignment of the Insurance Industry Act and the risk based supervision approach, a more risk based capital will be required for all regulated
entities. During the year under review, the financial performance showed that insurance players maintained a good level of capital adequacy and solvency except for a few which fell below the expected levels. However, all those that were below the required levels corrected their situation except a few which are subject to NBFIRA regulatory intervention.
0
20
40
60
80
100
Perc
ent
2019 2018
Total Capital 189 161
Total Liabilities 281 256
Total Assets 470 416
( P Million)
77

78
Medical Aid Funds
The Medical Aid Funds are classified as non-bank financial institutions regulated and supervised under the NBFIRA Act 2016 and hence the need for the development of the regulatory framework of the sector. The development of the Medical Aid Funds regulations is not yet complete and they continue to be regulated as per the conditions set in their exemption letters whilst awaiting the conclusion of industry specific legislation for the sector.The principal membership of
the Medical Aid Funds stood at 142,783 in 2019, compared to 139,953 reported during the prior year. The sector also recorded an overall total membership base of 340,200, which is 14.6 percent of the population. This is a 3.5 percent increase from the 328, 788 insured last year. At the time of publication, the reported figures are based on four registered medical aid funds as one has not submitted.
Medical Aid Funds recorded an increase of 6.6 percent in total contributions from P1.72 billion
in 2018 to P1.84 billion reported in the current review period. An upward trend was also experienced in medical claims which grew from P1.44 billion in 2018 to P1.58 billion during the current review period representing an increase of 9.9 percent. Net surplus for the industry continues to experience a downward trend as it fell from P107 million in 2018 to P67 million in the current review period. The downward trend was due to the reduction in net income from contributions and the marginal increase in non-health expenditure.
Figure 24: Abridged Statement of Comprehensive Income for Medical Aid Funds (P Million)
78
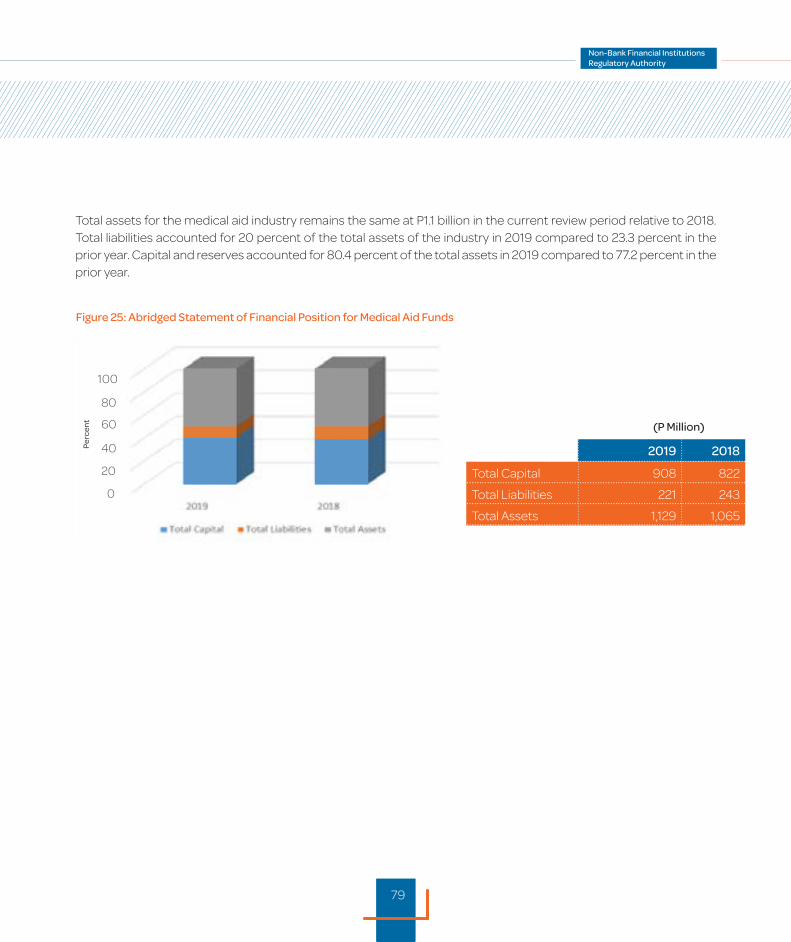
79
Total assets for the medical aid industry remains the same at P1.1 billion in the current review period relative to 2018. Total liabilities accounted for 20 percent of the total assets of the industry in 2019 compared to 23.3 percent in the prior year. Capital and reserves accounted for 80.4 percent of the total assets in 2019 compared to 77.2 percent in the prior year.
Figure 25: Abridged Statement of Financial Position for Medical Aid Funds
0
40
60
80
100
20
Perc
ent
2019 2018
Total Capital 908 822
Total Liabilities 221 243
Total Assets 1,129 1,065
(P Million)
79

80
Retirement Funds
80
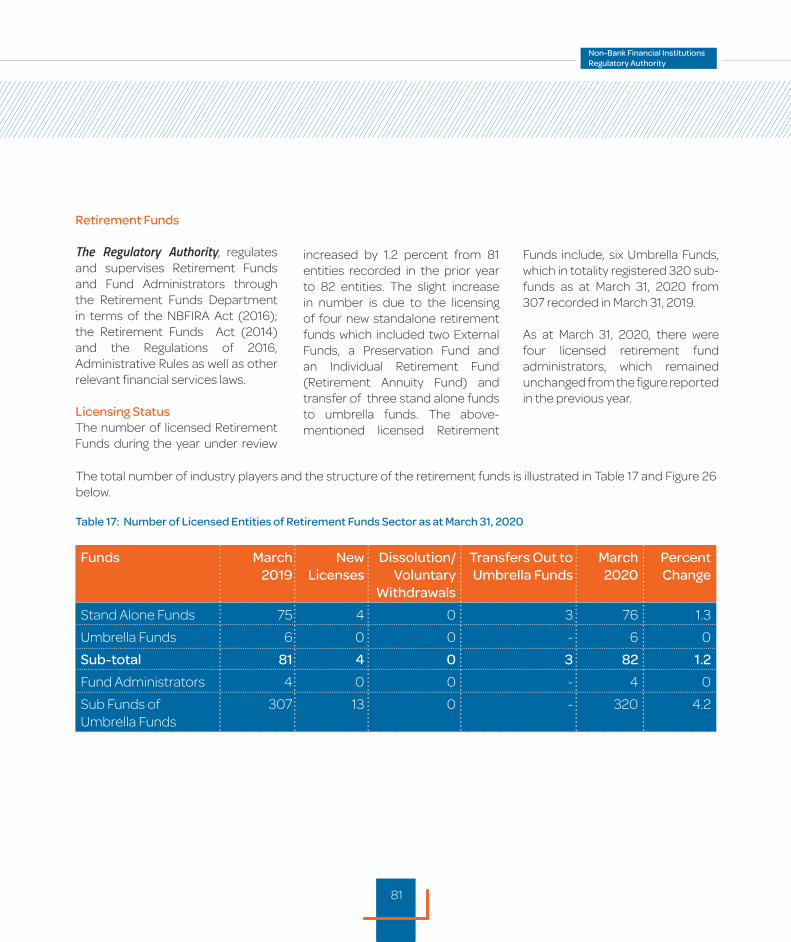
81
Retirement Funds
The Regulatory Authority, regulates and supervises Retirement Funds and Fund Administrators through the Retirement Funds Department in terms of the NBFIRA Act (2016); the Retirement Funds Act (2014) and the Regulations of 2016, Administrative Rules as well as other relevant financial services laws.
Licensing Status The number of licensed Retirement Funds during the year under review
increased by 1.2 percent from 81 entities recorded in the prior year to 82 entities. The slight increase in number is due to the licensing of four new standalone retirement funds which included two External Funds, a Preservation Fund and an Individual Retirement Fund (Retirement Annuity Fund) and transfer of three stand alone funds to umbrella funds. The above-mentioned licensed Retirement
Funds March 2019
New Licenses
Dissolution/Voluntary
Withdrawals
Transfers Out to Umbrella Funds
March 2020
Percent Change
Stand Alone Funds 75 4 0 3 76 1.3
Umbrella Funds 6 0 0 - 6 0
Sub-total 81 4 0 3 82 1.2
Fund Administrators 4 0 0 - 4 0
Sub Funds of Umbrella Funds
307 13 0 - 320 4.2
Funds include, six Umbrella Funds, which in totality registered 320 sub-funds as at March 31, 2020 from 307 recorded in March 31, 2019.
As at March 31, 2020, there were four licensed retirement fund administrators, which remained unchanged from the figure reported in the previous year.
The total number of industry players and the structure of the retirement funds is illustrated in Table 17 and Figure 26 below.
Table 17: Number of Licensed Entities of Retirement Funds Sector as at March 31, 2020
81

82
Figure 26: Retirement Funds Structure
Retirement Funds
Industry(86)
Retirement Funds (82)
Provident Funds (4)
[Disbursement:
Lump sum]
Stand Alone Funds
(3)
Umbrella Funds
(1)
Sub-funds (36)
Sub-funds (284)
Stand Alone Funds
(73)
Umbrella Funds
(5 )
Pension Funds (78)
[Disbursement: 1/3 cash payment &
2/3 annuity investment]
Fund Administrators
(4)
..............................
..............................
...........................................................................
...........................................................
........................................
..........................................................................
...........
.... ............................................................
82
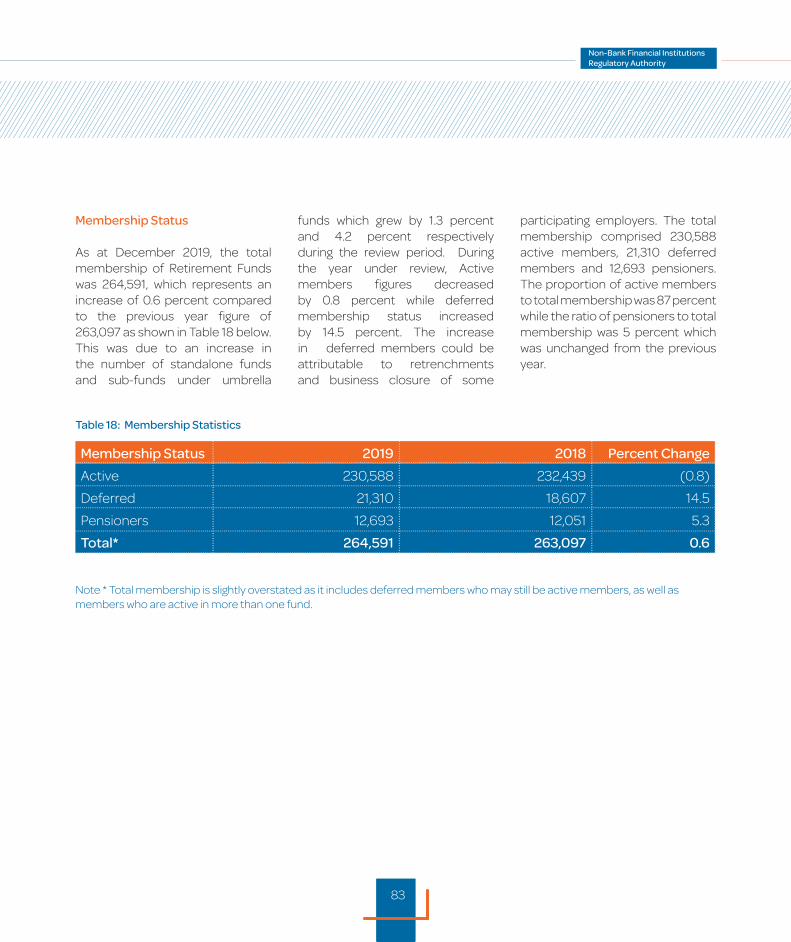
83
Membership Status
As at December 2019, the total membership of Retirement Funds was 264,591, which represents an increase of 0.6 percent compared to the previous year figure of 263,097 as shown in Table 18 below. This was due to an increase in the number of standalone funds and sub-funds under umbrella
funds which grew by 1.3 percent and 4.2 percent respectively during the review period. During the year under review, Active members figures decreased by 0.8 percent while deferred membership status increased by 14.5 percent. The increase in deferred members could be attributable to retrenchments and business closure of some
participating employers. The total membership comprised 230,588 active members, 21,310 deferred members and 12,693 pensioners. The proportion of active members to total membership was 87 percent while the ratio of pensioners to total membership was 5 percent which was unchanged from the previous year.
Membership Status 2019 2018 Percent Change
Active 230,588 232,439 (0.8)
Deferred 21,310 18,607 14.5
Pensioners 12,693 12,051 5.3
Total* 264,591 263,097 0.6
Table 18: Membership Statistics
Note * Total membership is slightly overstated as it includes deferred members who may still be active members, as well as members who are active in more than one fund.
83

84
ActiveDeferredPensioners
88
7
5
Market Performance
The Retirement Funds Sector recorded an increase of 69 percent in total income from P6.9 billion in 2018 to P 11.8 billion in 2019. The top five retirement funds accounted for P10.5 billion of the industry total income. This was attributed to an upsurge in investment income by 179 percent from P2.5 billion in 2018 to P7.0 billion in the current year, due to good performance in the global equities and bond markets
during the period under review. However, total contributions by both the employees/members and the employers increased slightly by 6.8 percent from P4.3 billion in 2018 to P4.6 billion in the period under review. This was as a result of increases in additional voluntary contributions made by some fund members.
During the review period, total expenditure for retirement funds was P3.7 billion (2018: P4.5 billion)
which is a decrease of 17 percent from the previous year. Benefit payments made to members and beneficiaries declined by 22 percent from P3.8 billion in 2018 to P3.0 billion in 2019 (see table 19 below). The decrease was due to the reduction of transfers, liquidations and dissolutions during the period under review.
Figure 27 and 28 above illustrate the proportion of active members (those who are still contributing or having contributions made on their behalf), deferred members (members who are no longer contributing but have preserved pension rights from prior employers) and pensioners (those receiving pension) to total membership.
Figure 27: Membership Statistics as at December 31, 2019 Figure 28: Membership Statistics as at December 31, 2018
ActiveDeferredPensioners
87
Percent Percent8
5
84
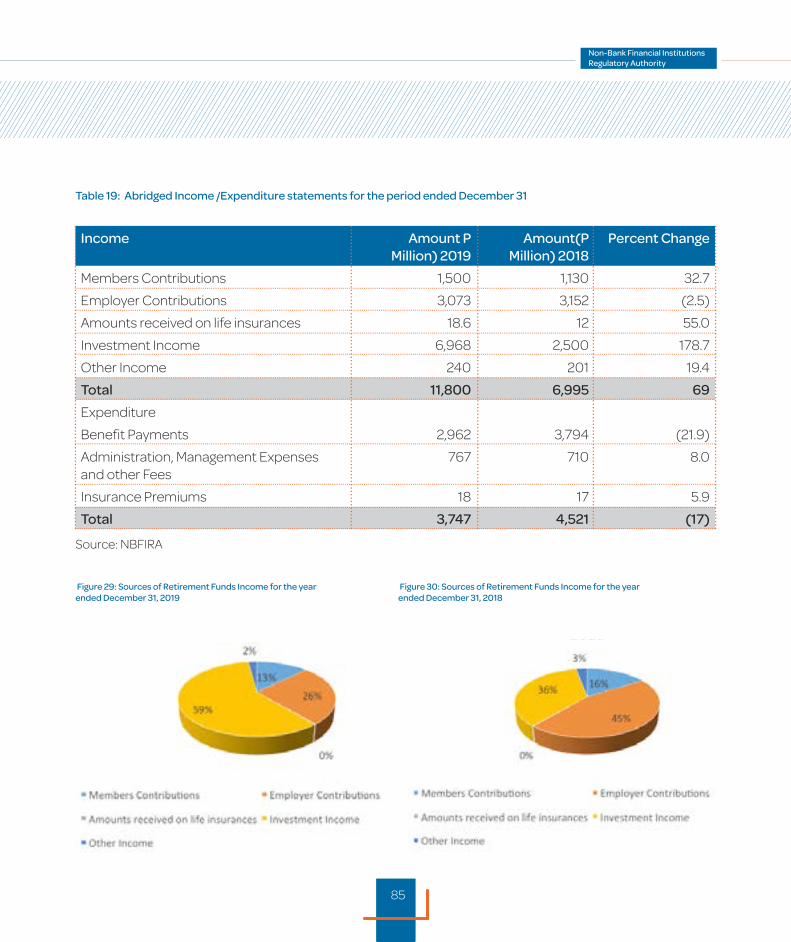
85
Table 19: Abridged Income /Expenditure statements for the period ended December 31
Figure 29: Sources of Retirement Funds Income for the year ended December 31, 2019
Figure 30: Sources of Retirement Funds Income for the year ended December 31, 2018
Income Amount P Million) 2019
Amount(P Million) 2018
Percent Change
Members Contributions 1,500 1,130 32.7
Employer Contributions 3,073 3,152 (2.5)
Amounts received on life insurances 18.6 12 55.0
Investment Income 6,968 2,500 178.7
Other Income 240 201 19.4
Total 11,800 6,995 69
Expenditure
Benefit Payments 2,962 3,794 (21.9)
Administration, Management Expenses and other Fees
767 710 8.0
Insurance Premiums 18 17 5.9
Total 3,747 4,521 (17)
Source: NBFIRA
85

86
Figure 31: Retirement Funds Income and Expenses
Figure 29 and 30 above depicts that investment income account for the largest share in terms of total income received by retirement funds at 59 percent in 2019 compared to a share of 36 percent in the previous year followed closely by employer contributions at 26 percent compared to 35 percent in the prior year.
Figure 31 above depicts a relationship between retirement funds income and expenditure over a two year period (2018-2019)
Amount (P Million)2018
Amount (P Million)2019 11,800 2,962
6,995 3,794 710 3,811
767 2,980
Total Income Benefit Payments Total ManagementExpenses Total Expenditure
86
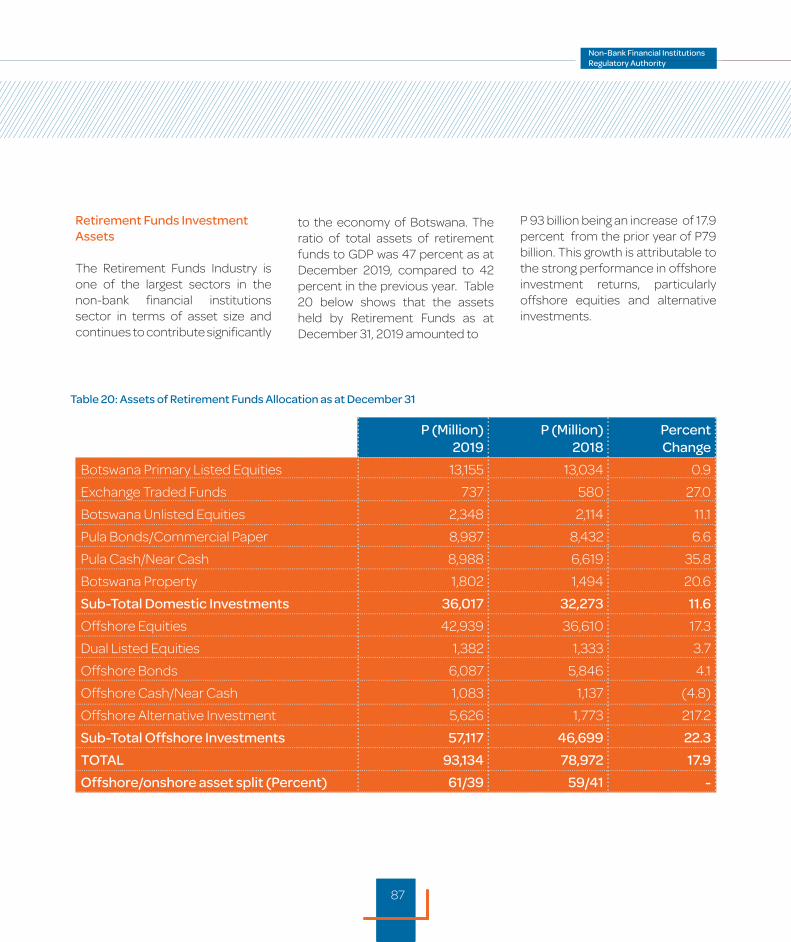
87
Table 20: Assets of Retirement Funds Allocation as at December 31
P (Million)2019
P (Million) 2018
PercentChange
Botswana Primary Listed Equities 13,155 13,034 0.9
Exchange Traded Funds 737 580 27.0
Botswana Unlisted Equities 2,348 2,114 11.1
Pula Bonds/Commercial Paper 8,987 8,432 6.6
Pula Cash/Near Cash 8,988 6,619 35.8
Botswana Property 1,802 1,494 20.6
Sub-Total Domestic Investments 36,017 32,273 11.6
Offshore Equities 42,939 36,610 17.3
Dual Listed Equities 1,382 1,333 3.7
Offshore Bonds 6,087 5,846 4.1
Offshore Cash/Near Cash 1,083 1,137 (4.8)
Offshore Alternative Investment 5,626 1,773 217.2
Sub-Total Offshore Investments 57,117 46,699 22.3
TOTAL 93,134 78,972 17.9
Offshore/onshore asset split (Percent) 61/39 59/41 -
Retirement Funds Investment Assets
The Retirement Funds Industry is one of the largest sectors in the non-bank financial institutions sector in terms of asset size and continues to contribute significantly
to the economy of Botswana. The ratio of total assets of retirement funds to GDP was 47 percent as at December 2019, compared to 42 percent in the previous year. Table 20 below shows that the assets held by Retirement Funds as at December 31, 2019 amounted to
P 93 billion being an increase of 17.9 percent from the prior year of P79 billion. This growth is attributable to the strong performance in offshore investment returns, particularly offshore equities and alternative investments.
87

88
Figure 32: Percentage Share of Retirement Funds Asset as at December 31, 2019
experienced a positive growth during the period under review save for offshore cash/near cash which recorded a decrease of 4.8 percent.Total equities emerged as the leading asset class amounting to P58 billion, which accounted for 63 percent of the retirement funds assets under management. Total bonds accounted for 16.2 percent of total retirement funds assets during the review period, comprising of domestic bonds of P 9 billion and offshore bonds at P6.1 billion. Cash and near cash accounted for 10.8 percent of invested assets comprising P9.0 billion and an equivalent of P1.1 billion
in foreign cash, while the remaining P8.2 billion or 8.8 percent of total assets were held in Exchange Traded Funds, Local Property and Alternative Investments. This represents a shift in asset allocation for offshore equities and offshore alternatives, with an increase in allocation of Alternative Investments by more than 200 percent in 2019. The increase in offshore equities is congruent with the global market performance. Refer to Table 20 and Figure 32 above.
Offshore/Onshore Investment Asset Split
Pension Fund Rule 2 (PFR 2) allows retirement funds to invest not less
than 30 percent of their Pension assets in the domestic market and the balance of the pension assets may be invested offshore. As at December 31, 2019 offshore investments of retirement funds were P57.1 billion or 61 percent of total retirement funds assets while local assets accounted for P36 billion or 39 percent. Comparably, as at December 31, 2018, offshore investments of retirement funds were P 46.7 billion or 59 percent of total retirement funds assets while local investments accounted for P32.3 billion or 41 percent.
Figure 32 illustrates that offshore equities account for the largest share in terms of total retirement funds investments assets at 46 percent, followed by Botswana listed equities at 14 percent.
Source: NBFIRA
All investment assets classes
3%
88

8989

90
Capital Markets
90
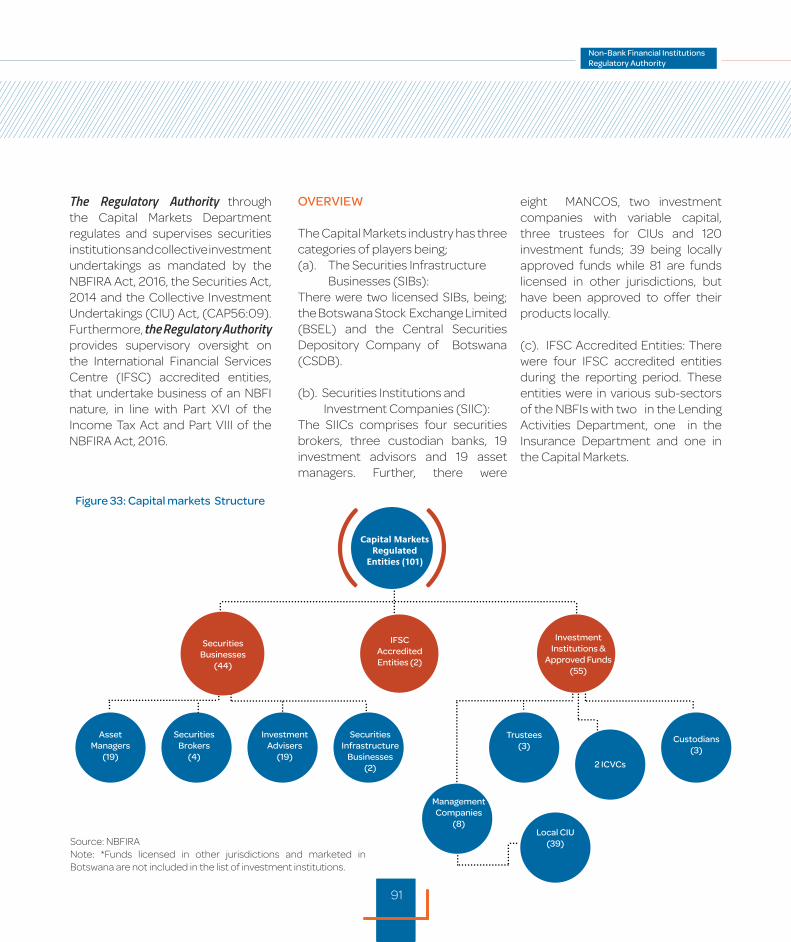
91
The Regulatory Authority through the Capital Markets Department regulates and supervises securities institutions and collective investment undertakings as mandated by the NBFIRA Act, 2016, the Securities Act, 2014 and the Collective Investment Undertakings (CIU) Act, (CAP56:09). Furthermore, the Regulatory Authority provides supervisory oversight on the International Financial Services Centre (IFSC) accredited entities, that undertake business of an NBFI nature, in line with Part XVI of the Income Tax Act and Part VIII of the NBFIRA Act, 2016.
OVERVIEW
The Capital Markets industry has three categories of players being; (a). The Securities Infrastructure Businesses (SIBs):There were two licensed SIBs, being; the Botswana Stock Exchange Limited (BSEL) and the Central Securities Depository Company of Botswana (CSDB).
(b). Securities Institutions and Investment Companies (SIIC): The SIICs comprises four securities brokers, three custodian banks, 19 investment advisors and 19 asset managers. Further, there were
eight MANCOS, two investment companies with variable capital, three trustees for CIUs and 120 investment funds; 39 being locally approved funds while 81 are funds licensed in other jurisdictions, but have been approved to offer their products locally.
(c). IFSC Accredited Entities: There were four IFSC accredited entities during the reporting period. These entities were in various sub-sectors of the NBFIs with two in the Lending Activities Department, one in the Insurance Department and one in the Capital Markets.
Capital Markets Regulated
Entities (101)
IFSCAccredited Entities (2)
Asset Managers
(19)
Securities Infrastructure
Businesses (2)
Management Companies
(8)Local CIU
(39)
Trustees (3)
2 ICVCs
Custodians (3)
Investment Institutions &
Approved Funds (55)
Securities Businesses
(44)
Securities Brokers
(4)
Source: NBFIRANote: *Funds licensed in other jurisdictions and marketed in Botswana are not included in the list of investment institutions.
....
Figure 33: Capital markets Structure
91
Investment Advisers
(19)
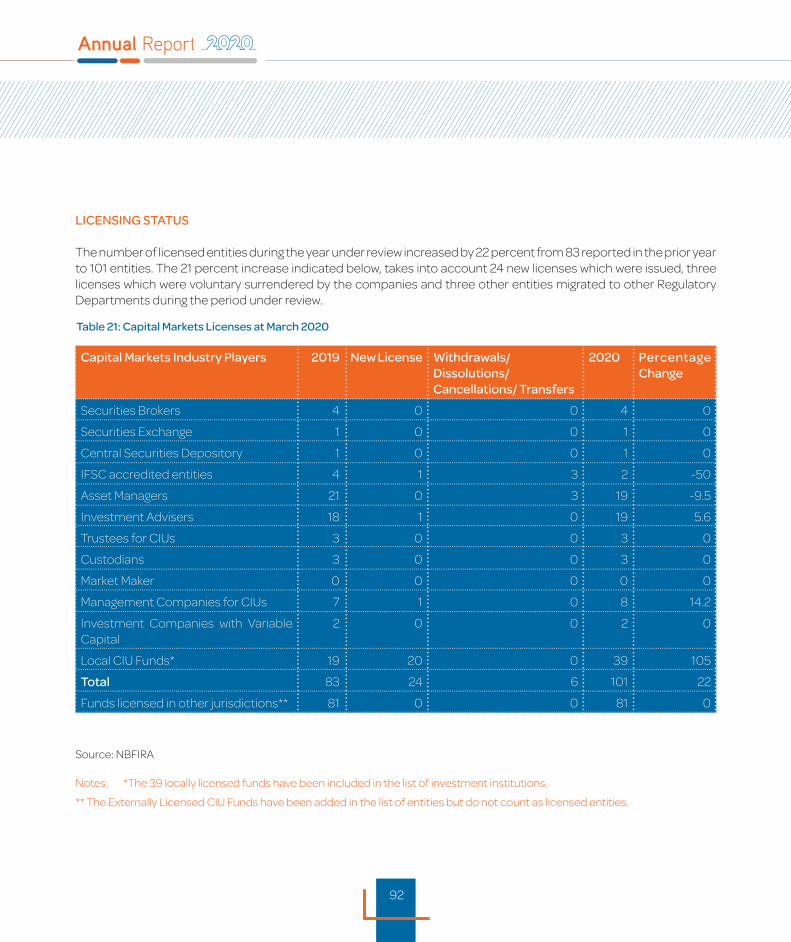
92
LICENSING STATUS
The number of licensed entities during the year under review increased by 22 percent from 83 reported in the prior year to 101 entities. The 21 percent increase indicated below, takes into account 24 new licenses which were issued, three licenses which were voluntary surrendered by the companies and three other entities migrated to other Regulatory Departments during the period under review.
Capital Markets Industry Players 2019 New License Withdrawals/Dissolutions/ Cancellations/ Transfers
2020 Percentage Change
Securities Brokers 4 0 0 4 0
Securities Exchange 1 0 0 1 0
Central Securities Depository 1 0 0 1 0
IFSC accredited entities 4 1 3 2 -50
Asset Managers 21 0 3 19 -9.5
Investment Advisers 18 1 0 19 5.6
Trustees for CIUs 3 0 0 3 0
Custodians 3 0 0 3 0
Market Maker 0 0 0 0 0
Management Companies for CIUs 7 1 0 8 14.2
Investment Companies with Variable Capital
2 0 0 2 0
Local CIU Funds* 19 20 0 39 105
Total 83 24 6 101 22
Funds licensed in other jurisdictions** 81 0 0 81 0
Source: NBFIRA
Notes: *The 39 locally licensed funds have been included in the list of investment institutions.
** The Externally Licensed CIU Funds have been added in the list of entities but do not count as licensed entities.
Table 21: Capital Markets Licenses at March 2020
92

93
Risk Based Supervision
The Capital Markets Department (CMD) has adopted the Risk Based Supervision approach in performing its function. In this approach, entities have been categorised into two, Systemically Important Entities (SIFIs) and non -Systemically Important Entities. During the year under review, CMD developed a criteria for identifying SIFIs and 10 entities were identified as such as at December 31, 2019 and they were
all compliant with Securities Laws as at December 31, 2019. In addition to SIFIs and non-SIFIs, there are entities classified as high-risk entities. The methodology for supervising high-risk entities is based on identified regulatory processes that include the following; off-site analysis, whistle blowing reports, media reports, amongst others.During the period under review, the ladder of intervention was implemented.
Financial Performance of Securities Infrastructure Businesses (SIBs) SIBs performed fairly well during the year under review, ending the year with a total revenue of P39.4 million, which increased by 1.8 percent from P38.7 million in 2018. Total expenses grew by 5.1 percent from P31.4 million in 2018 to P33.0 million in 2019, resulting in Net Profit Before Tax of P6.4 million, representing a decrease of 12.3 percent from P7.3 million in 2018.
Figure 34: Abridged Statement of Comprehensive Income for SIBs (P Million)
Million (P)
Source: NBFIRA
The SIBs sector maintained a healthy financial position with total assets of P123.1 million, reflecting an increase of 14.6 percent from P107.4 million in 2018. Total equity grew by 7.6 percent from P84.2 million in 2018 to P90.6 million in 2019. Total liabilities recorded the highest increase of 39.9 percent from P23.3 million as at December 31, 2018 to P32.6 million as at December 31, 2019.
93
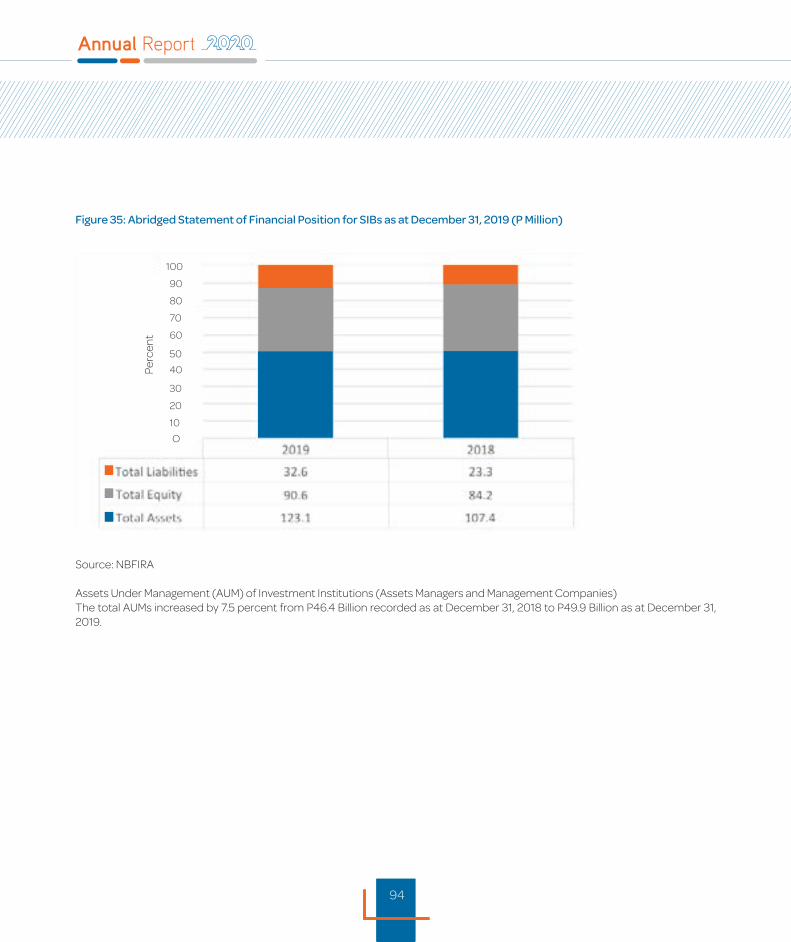
94
Figure 35: Abridged Statement of Financial Position for SIBs as at December 31, 2019 (P Million)
Source: NBFIRA
Assets Under Management (AUM) of Investment Institutions (Assets Managers and Management Companies)The total AUMs increased by 7.5 percent from P46.4 Billion recorded as at December 31, 2018 to P49.9 Billion as at December 31, 2019.
Perc
ent
O
10
20
30
40
50
60
70
80
90
100
94
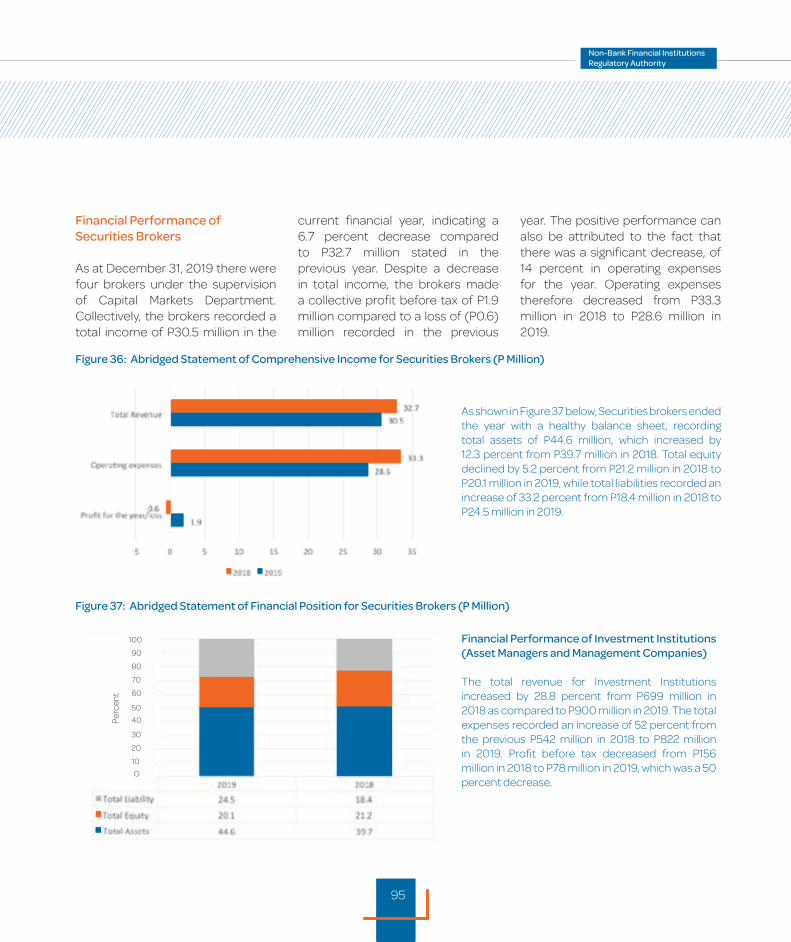
95
Figure 36: Abridged Statement of Comprehensive Income for Securities Brokers (P Million)
Figure 37: Abridged Statement of Financial Position for Securities Brokers (P Million)
Financial Performance of Securities Brokers
As at December 31, 2019 there were four brokers under the supervision of Capital Markets Department. Collectively, the brokers recorded a total income of P30.5 million in the
current financial year, indicating a 6.7 percent decrease compared to P32.7 million stated in the previous year. Despite a decrease in total income, the brokers made a collective profit before tax of P1.9 million compared to a loss of (P0.6) million recorded in the previous
year. The positive performance can also be attributed to the fact that there was a significant decrease, of 14 percent in operating expenses for the year. Operating expenses therefore decreased from P33.3 million in 2018 to P28.6 million in 2019.
As shown in Figure 37 below, Securities brokers ended the year with a healthy balance sheet, recording total assets of P44.6 million, which increased by 12.3 percent from P39.7 million in 2018. Total equity declined by 5.2 percent from P21.2 million in 2018 to P20.1 million in 2019, while total liabilities recorded an increase of 33.2 percent from P18.4 million in 2018 to P24.5 million in 2019.
Financial Performance of Investment Institutions (Asset Managers and Management Companies)
The total revenue for Investment Institutions increased by 28.8 percent from P699 million in 2018 as compared to P900 million in 2019. The total expenses recorded an increase of 52 percent from the previous P542 million in 2018 to P822 million in 2019. Profit before tax decreased from P156 million in 2018 to P78 million in 2019, which was a 50 percent decrease.
Perc
ent
O
10
20
30
40
50
60
70
80
90
100
95
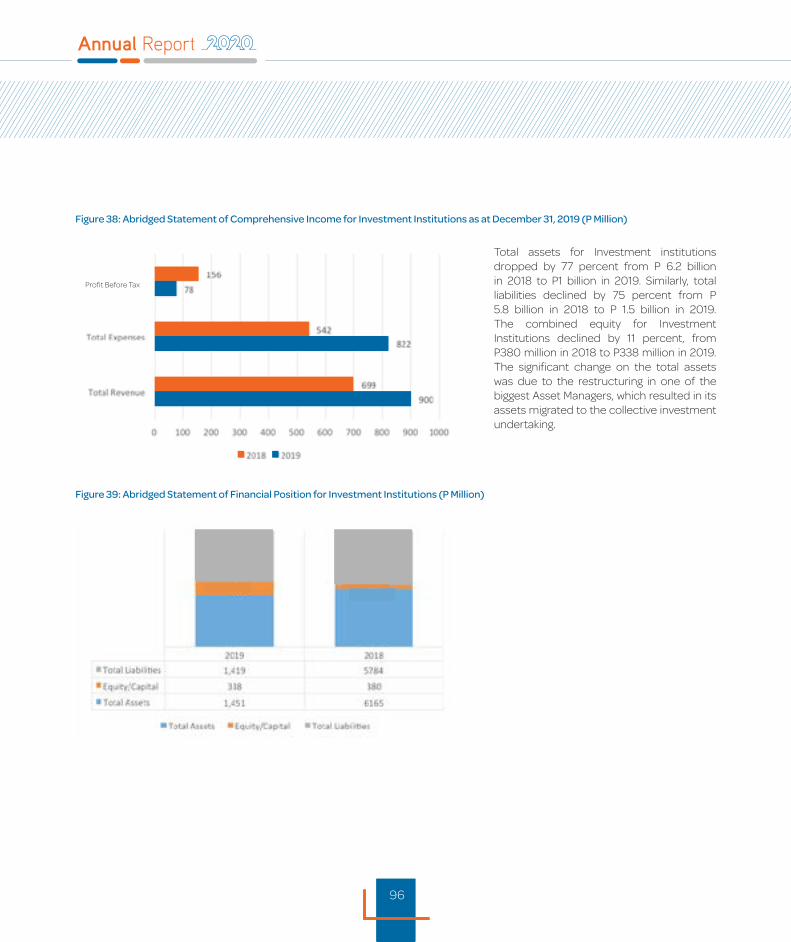
96
Figure 38: Abridged Statement of Comprehensive Income for Investment Institutions as at December 31, 2019 (P Million)
Figure 39: Abridged Statement of Financial Position for Investment Institutions (P Million)
Total assets for Investment institutions dropped by 77 percent from P 6.2 billion in 2018 to P1 billion in 2019. Similarly, total liabilities declined by 75 percent from P 5.8 billion in 2018 to P 1.5 billion in 2019. The combined equity for Investment Institutions declined by 11 percent, from P380 million in 2018 to P338 million in 2019. The significant change on the total assets was due to the restructuring in one of the biggest Asset Managers, which resulted in its assets migrated to the collective investment undertaking.
Profit Before Tax
96

9797

98
Lending Activities
98
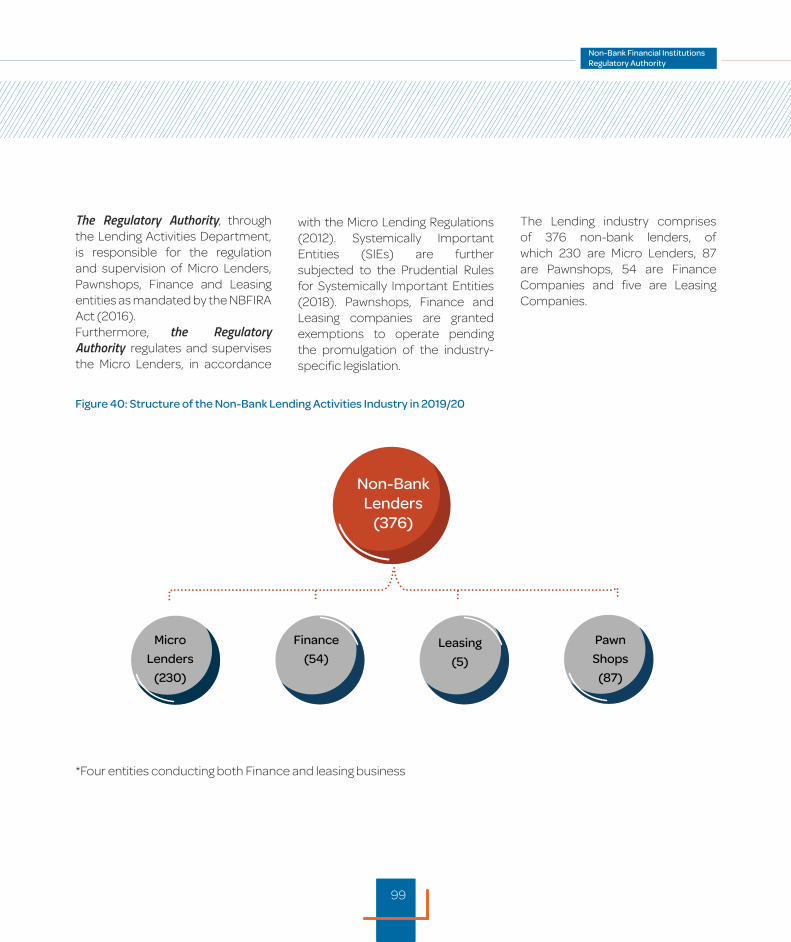
99
The Regulatory Authority, through the Lending Activities Department, is responsible for the regulation and supervision of Micro Lenders, Pawnshops, Finance and Leasing entities as mandated by the NBFIRA Act (2016).Furthermore, the Regulatory Authority regulates and supervises the Micro Lenders, in accordance
with the Micro Lending Regulations (2012). Systemically Important Entities (SIEs) are further subjected to the Prudential Rules for Systemically Important Entities (2018). Pawnshops, Finance and Leasing companies are granted exemptions to operate pending the promulgation of the industry-specific legislation.
The Lending industry comprises of 376 non-bank lenders, of which 230 are Micro Lenders, 87 are Pawnshops, 54 are Finance Companies and five are Leasing Companies.
Figure 40: Structure of the Non-Bank Lending Activities Industry in 2019/20
Non-Bank Lenders
(376)
Micro
Lenders
(230)
Finance
(54)Leasing
(5)
Pawn
Shops
(87)
....................................................................
*Four entities conducting both Finance and leasing business
99
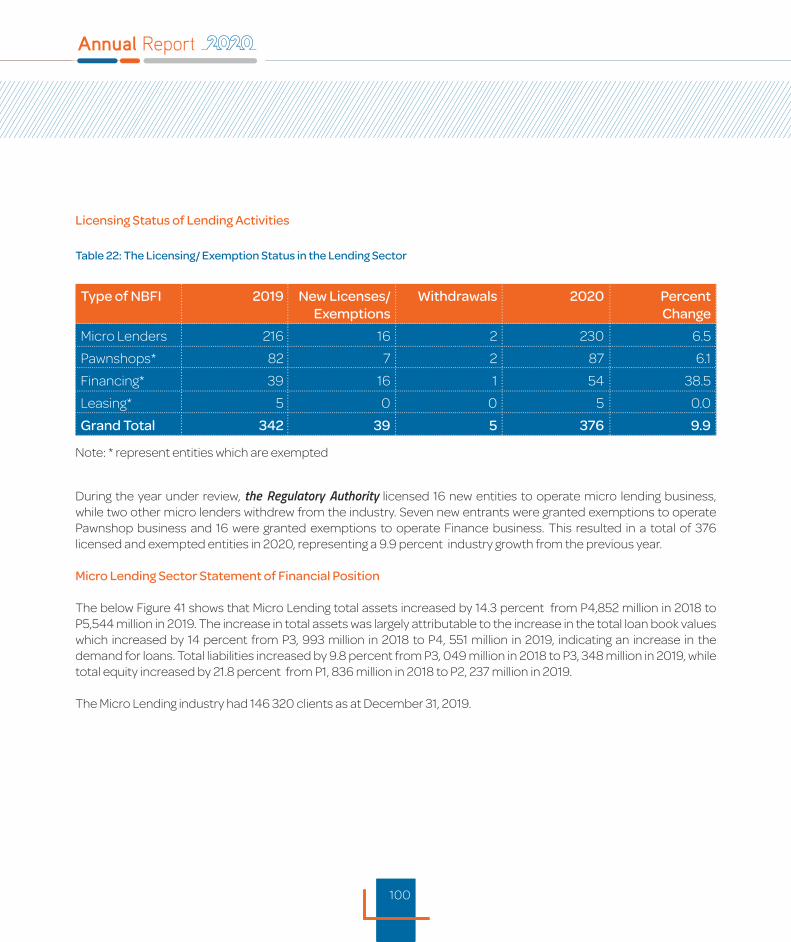
100
Licensing Status of Lending Activities
Type of NBFI 2019 New Licenses/Exemptions
Withdrawals 2020 PercentChange
Micro Lenders 216 16 2 230 6.5
Pawnshops* 82 7 2 87 6.1
Financing* 39 16 1 54 38.5
Leasing* 5 0 0 5 0.0
Grand Total 342 39 5 376 9.9
Note: * represent entities which are exempted
During the year under review, the Regulatory Authority licensed 16 new entities to operate micro lending business, while two other micro lenders withdrew from the industry. Seven new entrants were granted exemptions to operate Pawnshop business and 16 were granted exemptions to operate Finance business. This resulted in a total of 376 licensed and exempted entities in 2020, representing a 9.9 percent industry growth from the previous year.
Micro Lending Sector Statement of Financial Position
The below Figure 41 shows that Micro Lending total assets increased by 14.3 percent from P4,852 million in 2018 to P5,544 million in 2019. The increase in total assets was largely attributable to the increase in the total loan book values which increased by 14 percent from P3, 993 million in 2018 to P4, 551 million in 2019, indicating an increase in the demand for loans. Total liabilities increased by 9.8 percent from P3, 049 million in 2018 to P3, 348 million in 2019, while total equity increased by 21.8 percent from P1, 836 million in 2018 to P2, 237 million in 2019.
The Micro Lending industry had 146 320 clients as at December 31, 2019.
Table 22: The Licensing/ Exemption Status in the Lending Sector
100
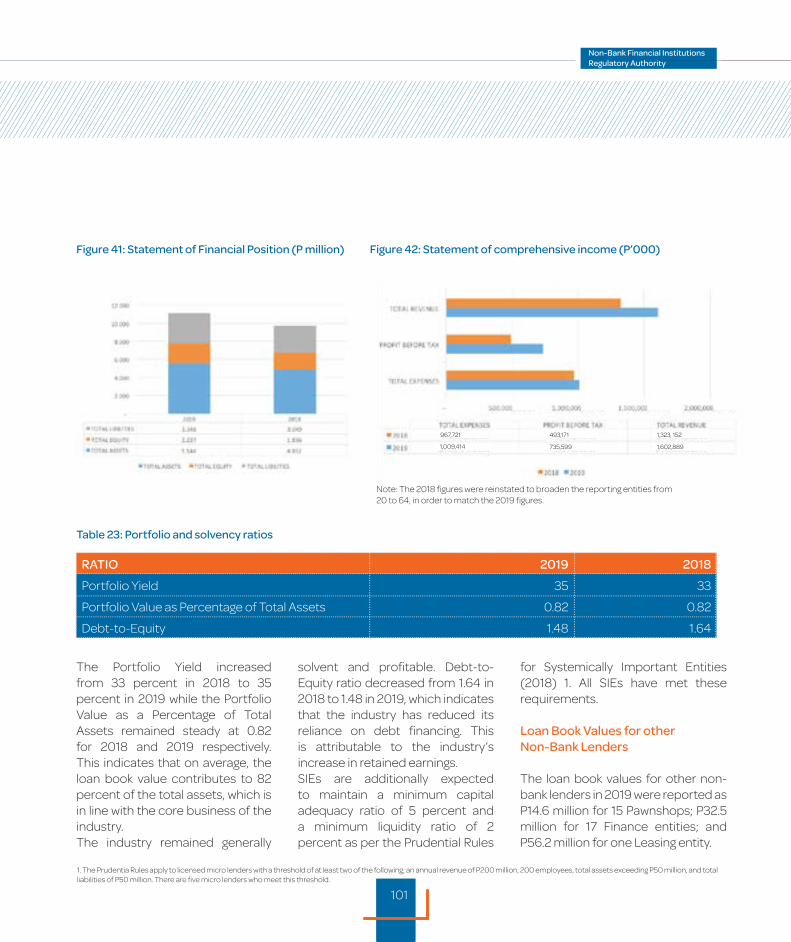
101
Figure 41: Statement of Financial Position (P million)
Table 23: Portfolio and solvency ratios
Figure 42: Statement of comprehensive income (P’000)
Note: The 2018 figures were reinstated to broaden the reporting entities from 20 to 64, in order to match the 2019 figures.
The Portfolio Yield increased from 33 percent in 2018 to 35 percent in 2019 while the Portfolio Value as a Percentage of Total Assets remained steady at 0.82 for 2018 and 2019 respectively. This indicates that on average, the loan book value contributes to 82 percent of the total assets, which is in line with the core business of the industry. The industry remained generally
RATIO 2019 2018
Portfolio Yield 35 33
Portfolio Value as Percentage of Total Assets 0.82 0.82
Debt-to-Equity 1.48 1.64
solvent and profitable. Debt-to-Equity ratio decreased from 1.64 in 2018 to 1.48 in 2019, which indicates that the industry has reduced its reliance on debt financing. This is attributable to the industry’s increase in retained earnings. SIEs are additionally expected to maintain a minimum capital adequacy ratio of 5 percent and a minimum liquidity ratio of 2 percent as per the Prudential Rules
for Systemically Important Entities (2018) 1. All SIEs have met these requirements.
Loan Book Values for other Non-Bank Lenders
The loan book values for other non-bank lenders in 2019 were reported as P14.6 million for 15 Pawnshops; P32.5 million for 17 Finance entities; and P56.2 million for one Leasing entity.
1. The Prudentia Rules apply to licensed micro lenders with a threshold of at least two of the following; an annual revenue of P200 million, 200 employees, total assets exceeding P50 million, and total liabilities of P50 million. There are five micro lenders who meet this threshold.
967,721 493,171 1,323, 152
735,599 1,602,8891,009,414
101
102
AML/CFT
102
103
Overview
Botswana promotes and safeguards the integrity of the financial sector through implementation of AML/CFT/CFP legal and institutional frameworks. Accordingly, Botswana continues to strengthen the AML/CFT/CFP system in compliance with its membership obligations of the Eastern and Southern Africa Anti-Money Laundering Group (ESAAMLG). The Group requires members to adopt and implement the Financial Action Task Force (FATF) Standards on combating of ML/TF/PF.
The Anti-Money Laundering (AML/CFT) Department is the specialised organ of the Regulatory Authority charged with the responsibility of ensuring that NBFIs comply with the AML/CFT obligations. In addition, the AML Department has the responsibility to supervise and monitor NBFIs for compliance with countering the financing of proliferation (CPF) obligations.
Legislation, National Strategies and International Standards (Progress from the previous year)
FATF Recommendation 27 requires supervisors of financial institutions to have powers to supervise and monitor affected entities for compliance with AML/CFT/CFP obligations. The powers include having
access to relevant information to conduct comprehensive inspections and issue corrective actions or sanctions for failure to comply with AML/CFT obligations. Countries are required to identify, assess and understand ML/TF/PF risks facing the country, and implement policies and measures to mitigate and manage the risks.
The revised FATF Standards explicitly require supervisors to understand ML/TF/FF risks of their supervised entities, and design and implement RBA to AML/CFT/CFP to regulate, supervise and monitor regulated entities for compliance with AML/CFT/CFP obligations. This is explicitly set out in the FATF Immediate Outcome 3, as follows: “Supervisors appropriately supervise, monitor, and regulate financial institutions…for compliance with AML/CFT/CFP requirements commensurate with their risks”.
As the supervisory authority responsible for NBFIs, the Regulatory Authority through its AML/CFT Department has adopted a Risk Based Approach to AML/CFT. This is because FATF Recommendation 26 requires countries to ensure that financial institutions are subject to risk-based regulation and supervision. It also requires that for financial institutions subject to Core Principles, the regulation and
supervision measures that apply to prudential purposes, and which are also relevant to money laundering and terrorist financing, should apply in a similar manner for AML/CFT/CFP purposes”.
During the year under review, the Financial Intelligence Act of 2019was amended and commenced on September 4, 2019.The specific AML/CFT/CFP supervisory role of the NBFIRA is now under Section 4(e) of the NBFIRA Act and Section 44 of the Financial Intelligence Act.
The FI Act designates the the Regulatory Authority as the AML/CFT/CFP supervisor for NBFIs under its purview, as follows:
(a). Regulate and supervise specified parties for compliance with the FI Act, including through on-site examinations;(b). In consultation with the Financial Intelligence Agency, issue instructions, guidelines or recommendations to help regulated entities comply with the FI Act;
103
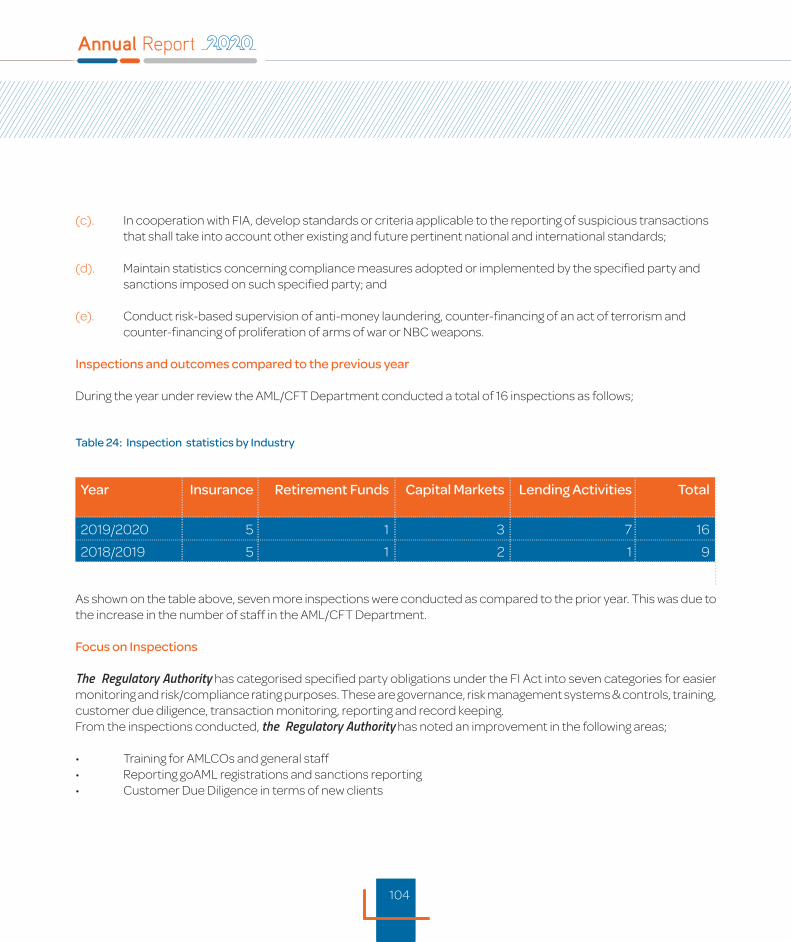
104
(c). In cooperation with FIA, develop standards or criteria applicable to the reporting of suspicious transactions that shall take into account other existing and future pertinent national and international standards;
(d). Maintain statistics concerning compliance measures adopted or implemented by the specified party and sanctions imposed on such specified party; and
(e). Conduct risk-based supervision of anti-money laundering, counter-financing of an act of terrorism and counter-financing of proliferation of arms of war or NBC weapons.
Inspections and outcomes compared to the previous year
During the year under review the AML/CFT Department conducted a total of 16 inspections as follows;
Table 24: Inspection statistics by Industry
Year Insurance Retirement Funds Capital Markets Lending Activities Total
2019/2020 5 1 3 7 16
2018/2019 5 1 2 1 9
As shown on the table above, seven more inspections were conducted as compared to the prior year. This was due to the increase in the number of staff in the AML/CFT Department.
Focus on Inspections
The Regulatory Authority has categorised specified party obligations under the FI Act into seven categories for easier monitoring and risk/compliance rating purposes. These are governance, risk management systems & controls, training, customer due diligence, transaction monitoring, reporting and record keeping. From the inspections conducted, the Regulatory Authority has noted an improvement in the following areas;
• Training for AMLCOs and general staff• Reporting goAML registrations and sanctions reporting• Customer Due Diligence in terms of new clients
104
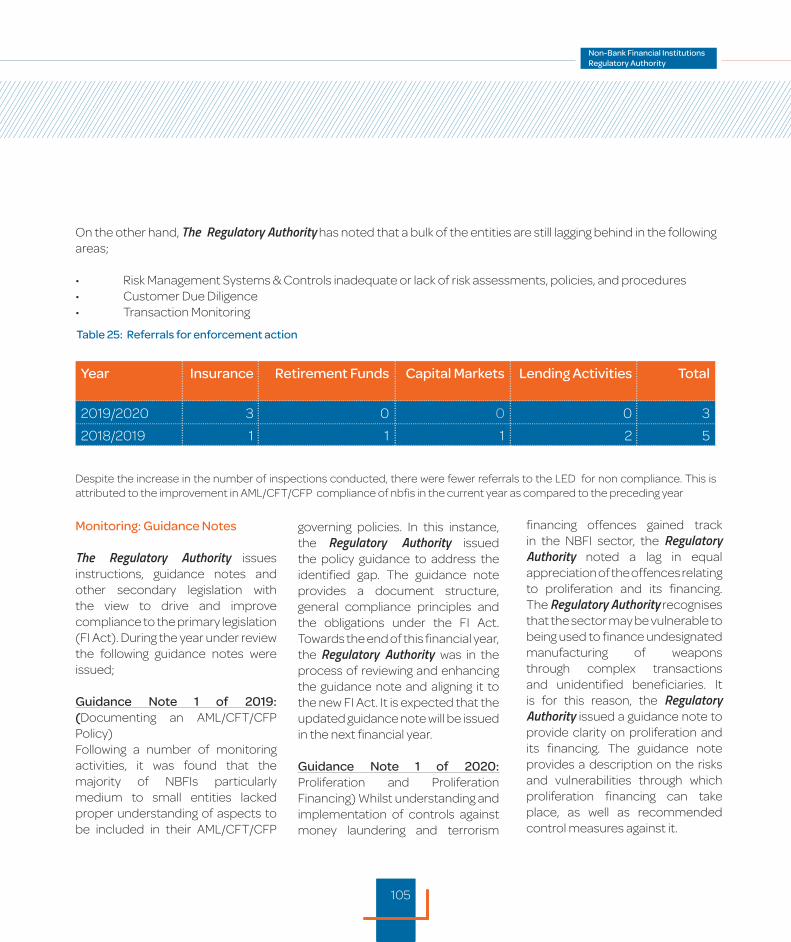
105
Year Insurance Retirement Funds Capital Markets Lending Activities Total
2019/2020 3 0 0 0 3
2018/2019 1 1 1 2 5
On the other hand, The Regulatory Authority has noted that a bulk of the entities are still lagging behind in the following areas;
• Risk Management Systems & Controls inadequate or lack of risk assessments, policies, and procedures • Customer Due Diligence • Transaction Monitoring
Table 25: Referrals for enforcement action
Monitoring: Guidance Notes
The Regulatory Authority issues instructions, guidance notes and other secondary legislation with the view to drive and improve compliance to the primary legislation (FI Act). During the year under review the following guidance notes were issued;
Guidance Note 1 of 2019: (Documenting an AML/CFT/CFP Policy)Following a number of monitoring activities, it was found that the majority of NBFIs particularly medium to small entities lacked proper understanding of aspects to be included in their AML/CFT/CFP
governing policies. In this instance, the Regulatory Authority issued the policy guidance to address the identified gap. The guidance note provides a document structure, general compliance principles and the obligations under the FI Act. Towards the end of this financial year, the Regulatory Authority was in the process of reviewing and enhancing the guidance note and aligning it to the new FI Act. It is expected that the updated guidance note will be issued in the next financial year.
Guidance Note 1 of 2020: Proliferation and Proliferation Financing) Whilst understanding and implementation of controls against money laundering and terrorism
financing offences gained track in the NBFI sector, the Regulatory Authority noted a lag in equal appreciation of the offences relating to proliferation and its financing. The Regulatory Authority recognises that the sector may be vulnerable to being used to finance undesignated manufacturing of weapons through complex transactions and unidentified beneficiaries. It is for this reason, the Regulatory Authority issued a guidance note to provide clarity on proliferation and its financing. The guidance note provides a description on the risks and vulnerabilities through which proliferation financing can take place, as well as recommended control measures against it.
Despite the increase in the number of inspections conducted, there were fewer referrals to the LED for non compliance. This is attributed to the improvement in AML/CFT/CFP compliance of nbfis in the current year as compared to the preceding year
105
106
AML/CFT/CFP Awareness Campaign
During the year under review, Regulatory Authority conducted awareness workshops in Jwaneng, Maun, Letlhakane and Francistown.These workshops followed country-wide seminars conducted in the previous financial year with main aim being to sensitise the regulated entities on AML/CFT/CFP in general. The workshops also covered compliance principles, FI Act obligations and receiving feedback on compliance released challenges
Seminars on Risk Assessment
Following the commencement of the FI Act in 2019, NBIFIRA conducted seminars emanating from new obligations specifically for the specified parties to conduct risk assessment on;(a) business relationships and transactions,(b) pre-existing products, practices, technologies and delivery mechanisms,(c) new products, practices, technologies and delivery mechanisms, prior to their launch, and(d) life insurance services.
goAML Training
The Regulatory Authority also conducted training in conjunction with the FIA on goAMLreporting system registration. The purpose of this training was for regulated entities to be able to register and adopt the goAML system and eventually improve on their reporting obligations.
Cooperation with other Legal Enforcement Agencies (LEAs)
During the year under review, the chairmanship of the Botswana AML/CFT Supervisory Forum was conferred upon Regulatory Authority. The objectives of the AML/CFT Supervisory Forum are as follows:
To ensure coordination and consistency in the application of supervisory rules/procedures. To influence or give Policy direction with regard to supervision for AML/CFT purposes in the country. To promote the exchange of information and discuss emerging issues on AML/CFT; To facilitate constant and consistent interaction amongst all supervisory authorities that will create the necessary operational intelligence with regard to preventing compliance and enforcement challenges; To encourage effective communication between the Agency and supervisory authorities concerning compliance and enforcement of the FI Act; and To provide guidance to supervisory authorities on the interpretation of the FI Act
106

107107

108
HUMAN RESOURCES
AND ADMINISTRATION
108
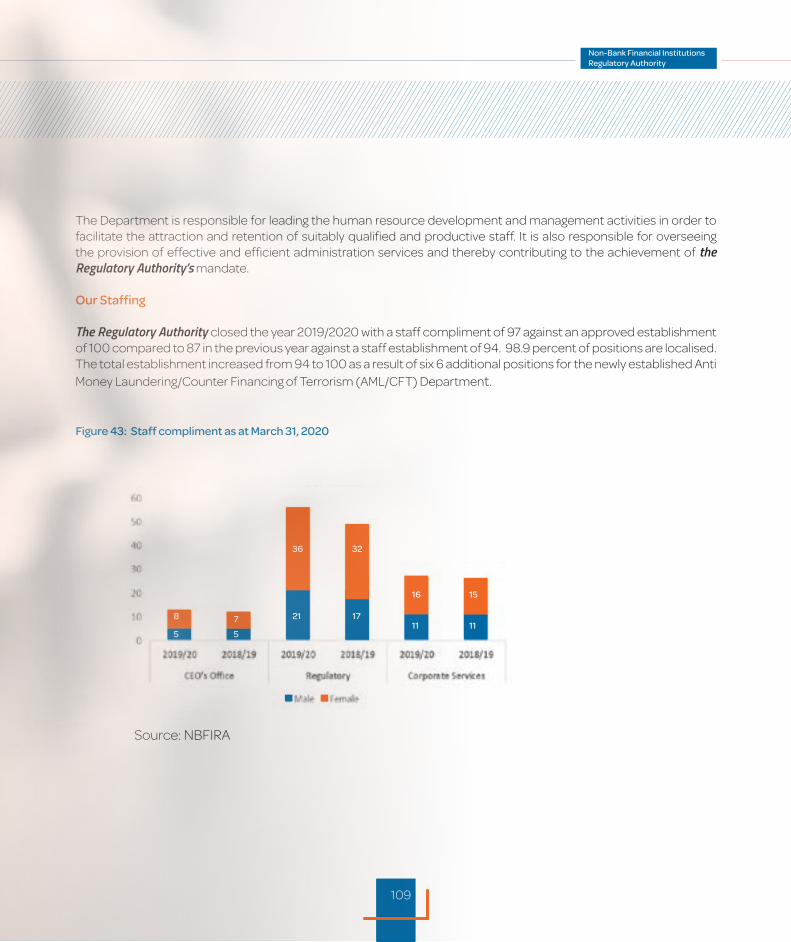
109
The Department is responsible for leading the human resource development and management activities in order to facilitate the attraction and retention of suitably qualified and productive staff. It is also responsible for overseeing the provision of effective and efficient administration services and thereby contributing to the achievement of the Regulatory Authority’s mandate.
Our Staffing
The Regulatory Authority closed the year 2019/2020 with a staff compliment of 97 against an approved establishment of 100 compared to 87 in the previous year against a staff establishment of 94. 98.9 percent of positions are localised. The total establishment increased from 94 to 100 as a result of six 6 additional positions for the newly established Anti Money Laundering/Counter Financing of Terrorism (AML/CFT) Department.
Figure 43: Staff compliment as at March 31, 2020
Source: NBFIRA
8 7
36 32
16 15
11 1121 17
5 5
109
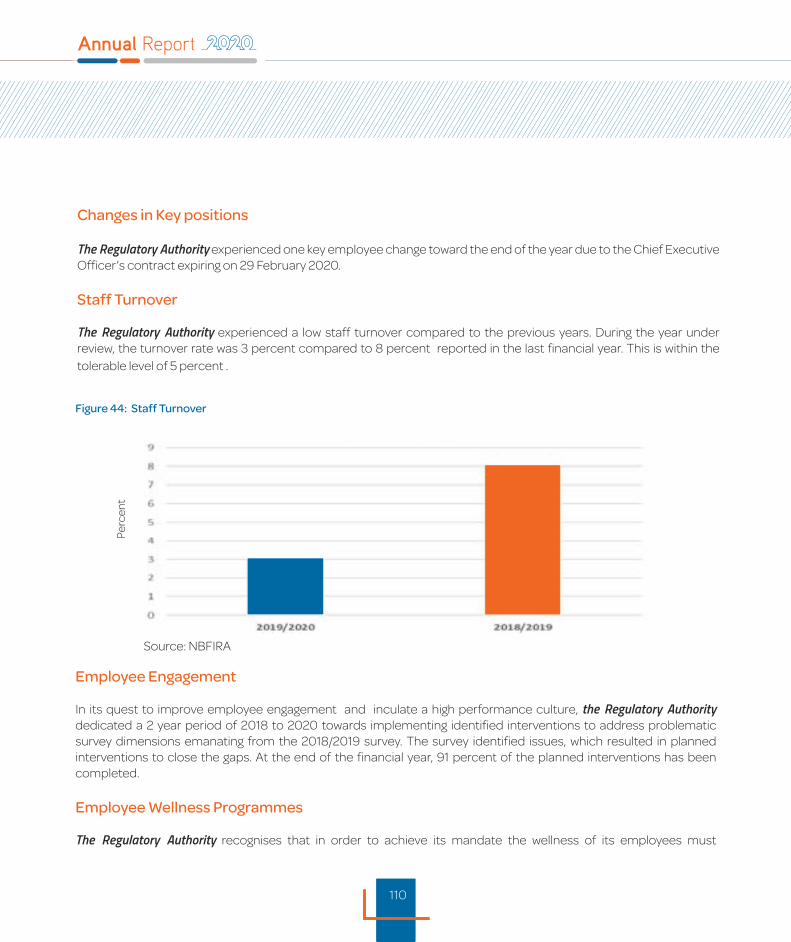
110
Changes in Key positions
The Regulatory Authority experienced one key employee change toward the end of the year due to the Chief Executive Officer’s contract expiring on 29 February 2020.
Staff Turnover
The Regulatory Authority experienced a low staff turnover compared to the previous years. During the year under review, the turnover rate was 3 percent compared to 8 percent reported in the last financial year. This is within the tolerable level of 5 percent .
Figure 44: Staff Turnover
Perc
ent
Source: NBFIRA
Employee Engagement
In its quest to improve employee engagement and inculate a high performance culture, the Regulatory Authority dedicated a 2 year period of 2018 to 2020 towards implementing identified interventions to address problematic survey dimensions emanating from the 2018/2019 survey. The survey identified issues, which resulted in planned interventions to close the gaps. At the end of the financial year, 91 percent of the planned interventions has been completed.
Employee Wellness Programmes
The Regulatory Authority recognises that in order to achieve its mandate the wellness of its employees must
110
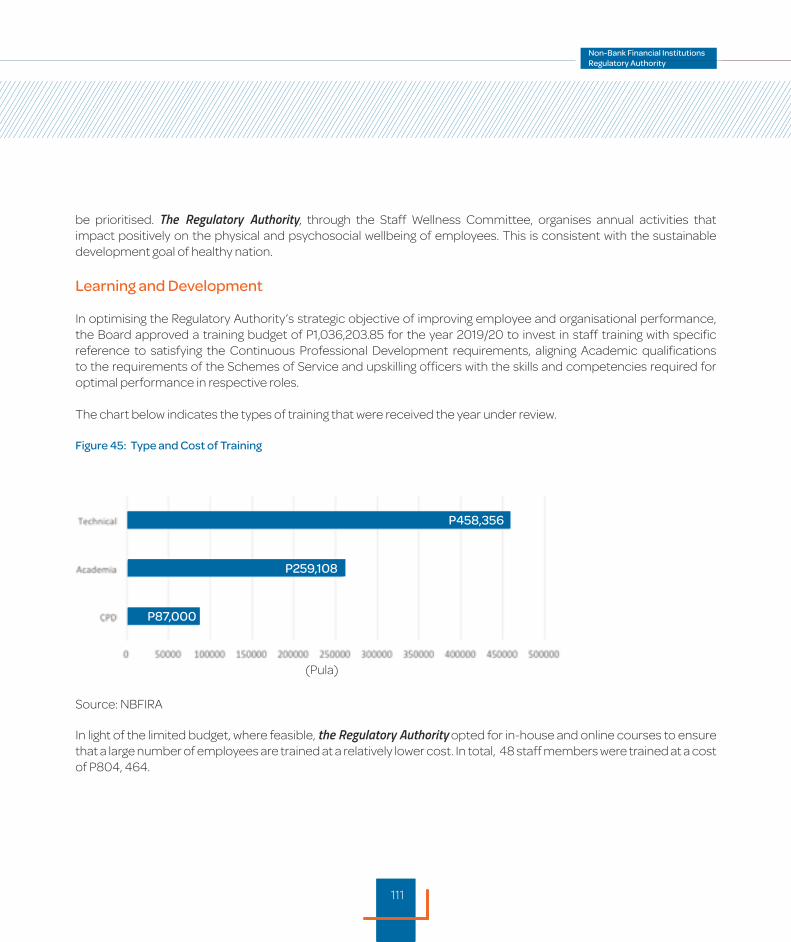
111
Figure 45: Type and Cost of Training
be prioritised. The Regulatory Authority, through the Staff Wellness Committee, organises annual activities that impact positively on the physical and psychosocial wellbeing of employees. This is consistent with the sustainable development goal of healthy nation.
Learning and Development
In optimising the Regulatory Authority’s strategic objective of improving employee and organisational performance, the Board approved a training budget of P1,036,203.85 for the year 2019/20 to invest in staff training with specific reference to satisfying the Continuous Professional Development requirements, aligning Academic qualifications to the requirements of the Schemes of Service and upskilling officers with the skills and competencies required for optimal performance in respective roles.
The chart below indicates the types of training that were received the year under review.
Source: NBFIRA
(Pula)
In light of the limited budget, where feasible, the Regulatory Authority opted for in-house and online courses to ensure that a large number of employees are trained at a relatively lower cost. In total, 48 staff members were trained at a cost of P804, 464.
P458,356
P259,108
P87,000
111

112
Source: NBFIRA
Figure 46: Number of Staff Trained Per Type of Course
The chart below depicts the number of participants that attended the proposed trainings.
29
5
13Continuous Professional Development
Academia
Technical
112

113113

114
COMMUNICATIONS AND INTERNATIONAL
AFFAIRS
114
115
CommunicationsIt is through the corporate communication strategy that the Regulatory Authority continues to implement initiatives designed to meet its communications objectives as per its corporate strategy.
The Regulatory Authority within the reporting year continued to engage stakeholders through various initiatives primarily using mass media platforms. Key activities included:
1. Media Relations efforts were strengthened through various initiatives that include media interviews, responses to media enquiries and press releases, in order to enhance information dissemination and understanding of the implementation of the Regulatory Authority’s mandate.
2. Public awareness and financial education initiatives were primarily enhanced through educational advertisements and informative regulatory notices. These were publicised through print and broadcast media, social media and the corporate website.
3. The Introduction of an Ethics Hotline, in an effort to strengthen corporate governance structures. The Ethics Hotline facility provides a mechanism for the early detection and deterrence of fraud, corruption and unethical behaviour within the Regulatory Authority or in the NBFIs it supervises. The facility also provides staff and stakeholders with a secure, impartial and confidential platform to anonymously report unethical conduct. Additionally, this facility will enhance the Regulatory Authority’s ability to more efficiently identify and address gaps in its internal controls and processes.
4. Benchmarking activities to enhance service delivery.
Financial Inclusion
The Regulatory Authority participates in the National Financial Inclusion Strategy overseen by The Ministry of Investment Trade and Industry. The financial inclusion initiatives enhance the Regulatory Authority’s role in consumer protection and strengthening consumer confidence, through participation in the priority areas below:
Priority 3: Develops accessible risk mitigation products and improves usage of existing products (Coordinated by the Regulatory Authority).
Priority 5: Promotes Consumer Empowerment and Protection (Coordinated by the Ministry of Investment Trade and Industry’s Consumer Protection Unit).
Financial EducationThe Regulatory Authority’s consumer financial education efforts focused on various aspects relating to the consumer’s financial rights and responsibilities in relation to the capital markets, insurance, lending activities, retirement funds industries as well as requirements related to AML/CFT/CFP obligations. This was achieved through the combined
115
116
use of print media, radio and television advertisements. The educational messages were also duly shared on the Regulatory Authority’s online communications platforms.
International and Regional Collaborations
The Regulatory Authority exists in a global financial community where the continuous interfacing of opportunities, challenges and risks for the NBFIs defines the contemporary developments presented. The Regulatory Authority has established sound international cooperation which is critical and provides the foundation for an open, fair and sound local NBFI sector.
The Regulatory Authority’s participation in regional cooperation and international affairs is largely premised on Memoranda of Understanding. This regional and international cooperation also includes the membership to and participation in fora availed by international standard setting bodies.
Memoranda of Understanding
A framework for consistent cooperation efforts is ordinarily embodied either in the form of MoUs between institutions or alternatively Multilateral Memoranda of Understanding (MMoU) between member countries of international organisations, with respect to participation on multilateral platforms.
Memoranda of Understanding define the purpose and scope of cooperation between institutions with an emphasis on mutual information sharing and technical assistance.
In the year under review, the Regulatory Authority, signed an additional MoU with the National Credit Regulator of South Africa, on December 18, 2019. This brings the Regulatory Authority’s total number of MoUs to 17.
116
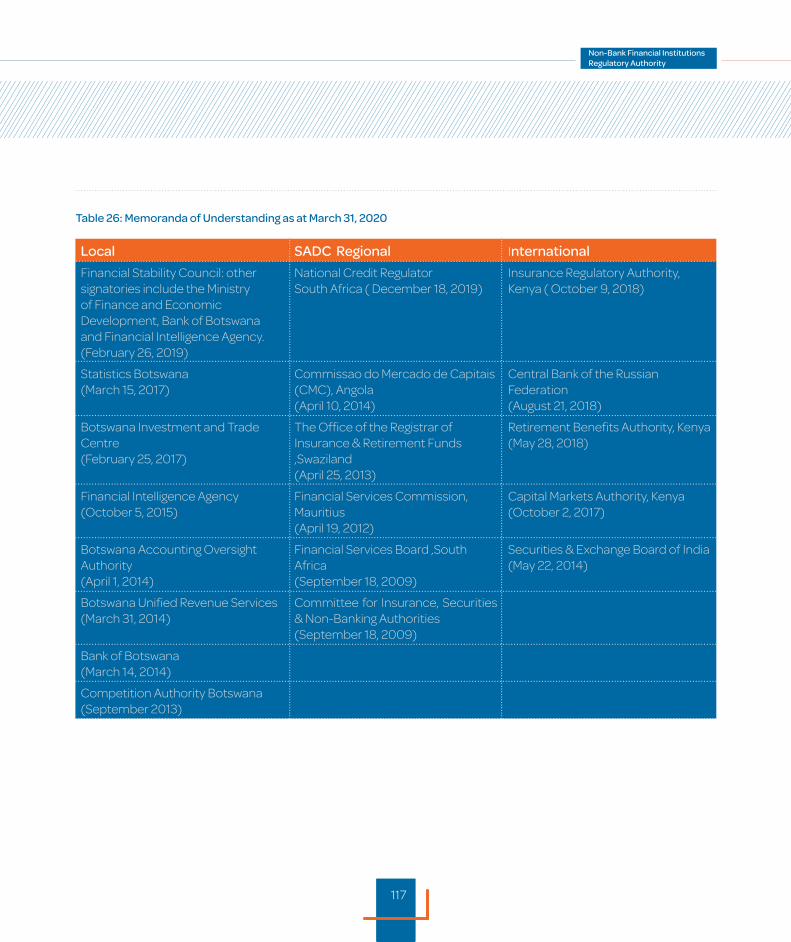
117
Local SADC Regional International
Financial Stability Council: other signatories include the Ministry of Finance and Economic Development, Bank of Botswana and Financial Intelligence Agency.(February 26, 2019)
National Credit Regulator South Africa ( December 18, 2019)
Insurance Regulatory Authority, Kenya ( October 9, 2018)
Statistics Botswana (March 15, 2017)
Commissao do Mercado de Capitais (CMC), Angola(April 10, 2014)
Central Bank of the Russian Federation(August 21, 2018)
Botswana Investment and Trade Centre (February 25, 2017)
The Office of the Registrar of Insurance & Retirement Funds ,Swaziland(April 25, 2013)
Retirement Benefits Authority, Kenya(May 28, 2018)
Financial Intelligence Agency (October 5, 2015)
Financial Services Commission, Mauritius(April 19, 2012)
Capital Markets Authority, Kenya(October 2, 2017)
Botswana Accounting Oversight Authority (April 1, 2014)
Financial Services Board ,South Africa(September 18, 2009)
Securities & Exchange Board of India(May 22, 2014)
Botswana Unified Revenue Services(March 31, 2014)
Committee for Insurance, Securities & Non-Banking Authorities(September 18, 2009)
Bank of Botswana(March 14, 2014)
Competition Authority Botswana (September 2013)
Table 26: Memoranda of Understanding as at March 31, 2020
117

118
Engaging Local and International stakeholders
During the period under review, the Regulatory Authority continued to facilitate information exchange and cooperation with its local and international institutional stakeholders. The Regulatory Authority recognises the importance of international cooperation in furthering its regulatory, supervisory and enforcement duties as it contributes to the financial stability of the local economy.
To this end, the Regulatory Authority has maintained its posture of proactively engaging its counterparts in reciprocal requests for information exchange and technical assistance from diverse stakeholders including but not limited to international agencies such as the International Monetary Fund and Moody’s Rating Agency. The Regulatory Authority also hosted a delegation of financial sector regulators and representatives from the Ministry of Finance Zimbabwe on a benchmarking exercise. During the period under review, The Regulatory Authority participated in international conferences namely the African Insurance Organisation (AIO) Conference and the International Organisation of Pension Supervisors. Additionally, the Regulatory Authority has been actively engaged in developing the NBFI component of the national trade in services schedule of commitments protocol for the African Continental Free Trade Area (AfCFTA).
Membership of International Standard Setting Bodies
The Regulatory Authority, through its memberships, has the opportunity to benchmark and ensure that its vision to efficiently and effectively regulate and supervise in line with international best practice is achieved.
Adherence to international standards and best practice strengthens regulatory reforms, cross-border cooperation and assistance, compliance with international standards and reputational profile both domestically and internationally. The Regulatory Authority interacts with international standard-setting bodies through various modes including attending conferences and meetings and information sharing.
The Regulatory Authority is a member of the following standard setting bodies:
118

119
Standard Setting Body Purpose and Participation
ESAAMLG Eastern and Southern Africa Anti-Money Laundering Group (ESAAMLG), is a regional organisation founded to combat money laundering through the implementation of anti-money laundering strategies on member countries.
The strategies of ESAAMLG include implementation of the Financial Action Task Force (FATF) recommendations with particular focus on the Eastern and Southern Africa regions
IAIS International Association of Insurance Supervisors (IAIS), was established in 1994, with a mission to promote effective and globally consistent supervision of the insurance industry in order to develop and maintain fair, safe and stable insurance markets for the benefit and protection of policyholders and to contribute to global financial stability.
IOSCO International Organisation of Securities Commissions (IOSCO), is the leading international policy forum for securities regulators and is recognised as the global standard-setting body for securities.
The Regulatory Authority has been an Associate Member of IOSCO since August 2015 and has prioritised attaining full Ordinary membership.
Table 27: Membership in International Organization’s as at March 31, 2020.
IOPS International Organisation of Pension Supervisors (IOPS) is an independent international body representing those involved in the supervision of private pension arrangements. Formed in July 2004, the major objective of IOPS is to improve the quality and effectiveness of the supervision of private pension systems throughout the world. The Regulatory Authority has been re-elected into the Executive committee of IOPS.
CISNA Committee of Insurance, Securities and Non-Banking Financial Authorities (CISNA), consists of non-banking financial institutions authorities from the SADC region and reports to the SADC Committee of Ministers of Finance. Its aim is to promote and maintain financial stability and growth in the SADC region through a process of co-operation, exchange of information and engagement between regional regulators.
The Regulatory Authority hosted the CISNA Strategic Planning and Performance Review Committee (SPPRC) in February 2020.
119

120
INFORMATION TECHNOLOGY
120

121
The Non-Bank Financial Institutions Regulatory Authority (NBFIRA) is dependent on the Information Technology for the provision of services. The aim is to continually maintain high standard of information technology services in order to keep up with the ever changing user requirements. The Regulatory Authority in the current year focused on the support and maintenance of the existing infrastructure and systems as it continues to be the cornerstone of the Non–Bank Financial Institutions Regulatory Authority’s operations. The Regulatory Authority provides almost all its processes through information technology.
IT Infrastructure and Network security
The Regulatory Authority has been able to maintain the infrastructure with very minimal disruption and security breaches. However, the Regulatory Authority carried out a penetration testing and vulnerability assessment in order to ensure that the deployed systems are secure both internally and externally and also to check the effectiveness of the deployed security measures. Following this report, the Regulatory Authority is putting measures in place to address any identified deficiencies and implementing new measures.
Management Information Systems
It is very critical that Regulatory Authority maintains and enhances its key systems namely the Enterprise Resource Planning (ERP) system and the Risk Based Supervision System (RBSS) to ensure that they remain relevant for their purpose. During the period under review the ERP database was upgraded to improve its functionality and security.
121

122
IT Policies The Regulatory Authority continues to improve the IT management through the review of its IT policies and procedures. During the period under review the Regulatory Authority reviewed the existing policies to align them with the current IT trends and standards.
Internal User Satisfaction Survey The Regulatory Authority carried out an internal user satisfaction survey on its regulatory system (The Risk Based Supervision System) to check if the system still serves its purpose. The survey covered the following dimensions. • Availability of the system, • The Speed of the System, • The User friendliness of the system • The Support of the System and • Meeting expectations
The results generally showed that the users are satisfied with the user friendliness of the system at 94 percent however, they require more functionality of the system to meet their requirements as the satisfaction level meeting expectation sits at 59 percent.
122
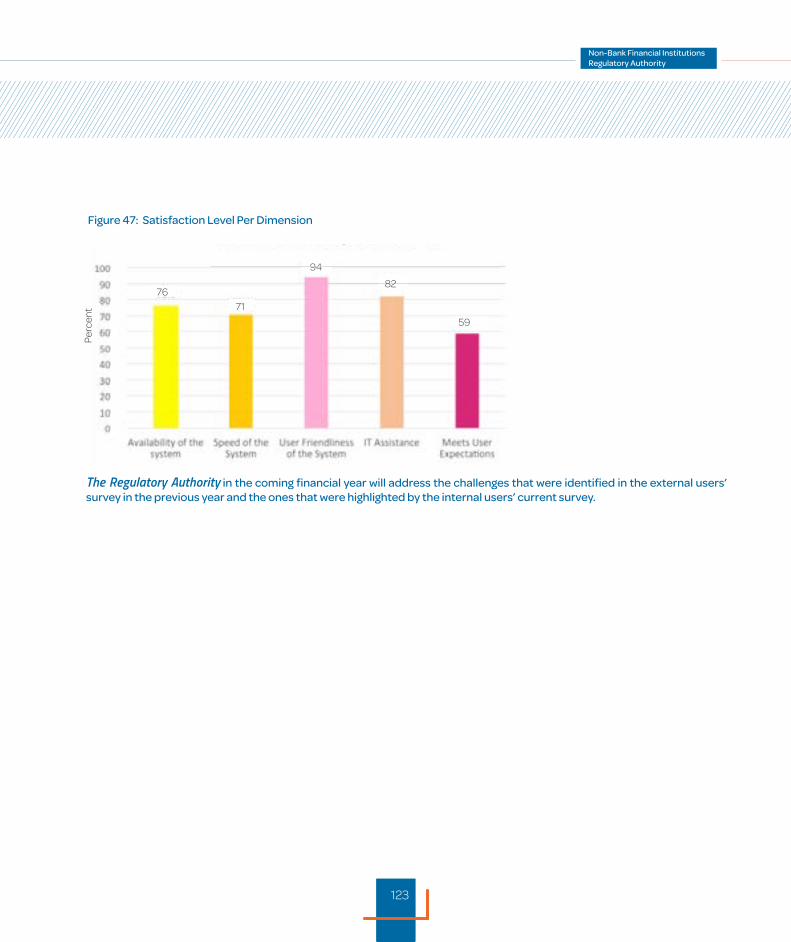
123
Figure 47: Satisfaction Level Per Dimension
Perc
ent
The Regulatory Authority in the coming financial year will address the challenges that were identified in the external users’ survey in the previous year and the ones that were highlighted by the internal users’ current survey.
7671
94
82
59
123

124
FINANCE
124

125
Figure 48: NBFIRA Total Income as at March 31, 2020(P’000)
Total expenditure was increased by 6 percent to P81.8 million in 2019/2020, higher than the P77.4 million recorded in the previous financial year. During the year the Regulatory Authority incurred total staff costs at P54.4 million compared to P49.6 million in the 2018/2019, reflecting an increase of 6 percent.
Financial Performance
The Regulatory Authority was financed/funded with Government subvention of P20 million (25 percent) and supervisory levies P58.8 million (75 percent) paid by the regulated entities.
The Regulatory Authority recorded surplus of P 6.4 million in 2019/2020 from a surplus of P 2.5million in 2018/2019. This was a result of an increase in total revenue by 11 percent to P87.7 million compared to P78.7 million in the previous year. This was underpinned by inclusion of new sectors in the collection of levies and increased asset base of regulated entities.
125
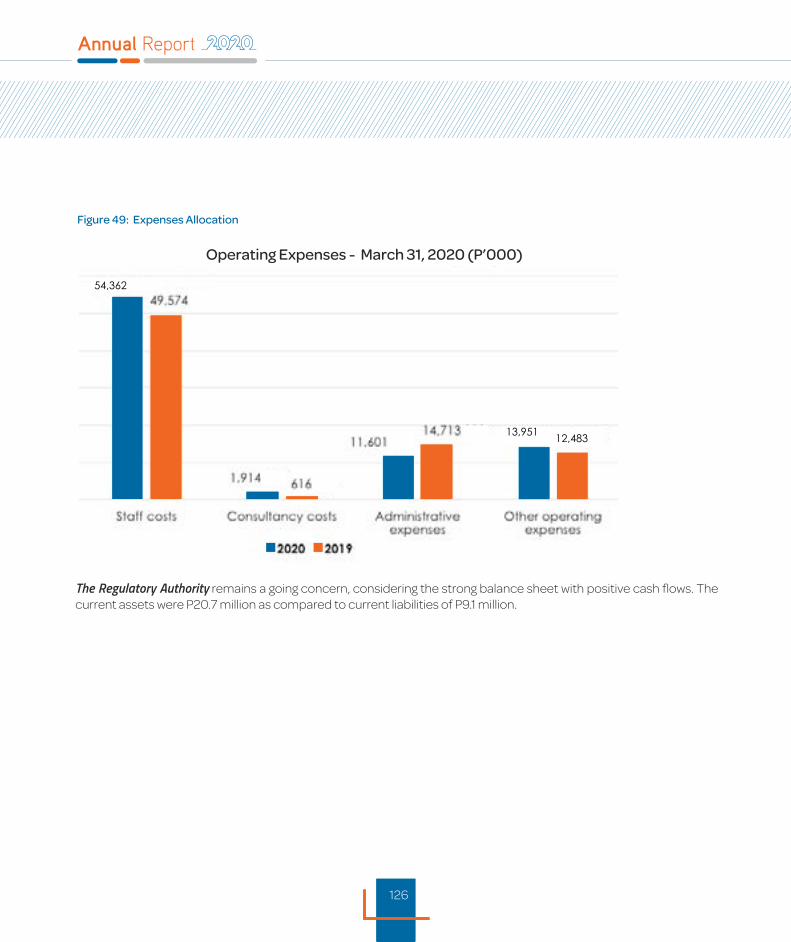
126
Figure 49: Expenses Allocation
The Regulatory Authority remains a going concern, considering the strong balance sheet with positive cash flows. The current assets were P20.7 million as compared to current liabilities of P9.1 million.
Operating Expenses - March 31, 2020 (P’000)
54,362
13,95112,483
126

127
Figure 50: Current Assets and Current Liabilities March 31, 2020 (P’000)
20, 680
9,087
14,547
6,940
127

128
ANNUAL FINANCIAL STATEMENTS
128

129
Non-Bank Financial Institutions Regulatory AuthorityAnnual Financial Statements for the year ended 31 March 2020
General Information
Country of domicile Botswana
Nature of operations and principal activities Safeguard the fairness, stability and efficiency of the non-bank financial sector.
Directors Ms. M. V. Kabomo (Chairperson) Ms. L. T. Tema Ms. A. T. Khunwana ( Tenure ended: 30 September 2019) Ms. P. Masalela Dr. L. S. Senatla Mr. K. Olebile Ms. I. M. Ramalohlanye Ms. H. D. Hlanti
Chief Executive Officer Mr. S. Gade (Acting) Mr. O. M. Ramasedi (Tenure ended: 28 February 2020)
Registered office 3rd Floor Exponential Building Plot 54351 Central Business District Off P G Matante Gaborone
Business address Plot 54351 Central Business District Off PG Matante Gaborone Botswana
Bankers Stanbic Bank of Botswana Limited
Auditors Grant Thornton Chartered Accountants A Botswana Member of Grant Thornton International Ltd
Functional currency Botswana Pula BWP”
129

130
Non-Bank Financial Institutions Regulatory AuthorityAnnual Financial Statements for the year ended 31 March 2020
Contents Board Responsibilities and Approval of the Annual Financial Statements 129
Independent Auditor’s Report 131
Statement of Profit or Loss and Other Comprehensive Income for the year ended 31 March 2020 136
Statement of Financial Position 137
Statement of Changes in Funds for the year ended 31 March 2020 138
Statement of Cash Flows for the year ended 31 March 2020 139
Accounting Policies 140
Notes to the Annual Financial Statements 161
The following supplementary information does not form part of the annual financial statements and is unaudited: Detailed Income Statement 190
130

131
Non-Bank Financial Institutions Regulatory AuthorityAnnual Financial Statements for the year ended 31 March 2020
Board Responsibilities and Approval of the Annual Financial Statements
The directors are required in terms of the Non-Bank Financial Institutions Regulatory Authority Act, 2016 to maintain adequate accounting records and are responsible for the content and integrity of the annual financial statements and related financial information included in this report. It is their responsibility to ensure that the annual financial statements fairly present the state of affairs of the Authority as at the end of the financial year and the results of its operations and cash flows for the period then ended, in conformity with International Financial Reporting Standards. The external auditors are engaged to express an independent opinion on the annual financial statements.
The annual financial statements are prepared in accordance with International Financial Reporting Standards and are based upon appropriate accounting policies consistently applied and supported by reasonable and prudent judgements and estimates.
The directors acknowledge that they are ultimately responsible for the system of internal financial control established by the Authority and place considerable importance on maintaining a strong control environment. To enable the directors to meet these responsibilities, the board of directors sets standards for internal control aimed at reducing the risk of error or loss in a cost effective manner. The standards include the proper delegation of responsibilities within a clearly defined framework, effective accounting procedures and adequate segregation of duties to ensure an acceptable level of risk. These controls are monitored throughout the Authority and all employees are required to maintain the highest ethical standards in ensuring the Authority’s business is conducted in a manner that in all reasonable circumstances is above reproach. The focus of risk management in the Authority is on identifying, assessing, managing and monitoring all known forms of risk across the Authority. While operating risk cannot be fully eliminated, the Authority endeavours to minimise it by ensuring that appropriate infrastructure, controls, systems and ethical behaviour are applied and managed within predetermined procedures and constraints.
The directors are of the opinion, based on the information and explanations given by management, that the system of internal control provides reasonable assurance that the financial records may be relied on for the preparation of the annual financial statements. However, any system of internal financial control can provide only reasonable, and not absolute, assurance against material misstatement or loss.
The directors have reviewed the Authority’s cash flow forecast for the year to 31 March 2021 and, in light of this review and the current financial position, they are satisfied that the Authority has or had access to adequate resources to continue in operational existence for the foreseeable future.
131
Non-Bank Financial Institutions Regulatory AuthorityAnnual Financial Statements for the year ended 31 March 2020
Contents Board Responsibilities and Approval of the Annual Financial Statements 129
Independent Auditor’s Report 131
Statement of Profit or Loss and Other Comprehensive Income for the year ended 31 March 2020 136
Statement of Financial Position 137
Statement of Changes in Funds for the year ended 31 March 2020 138
Statement of Cash Flows for the year ended 31 March 2020 139
Accounting Policies 140
Notes to the Annual Financial Statements 161
The following supplementary information does not form part of the annual financial statements and is unaudited: Detailed Income Statement 190
132
Non-Bank Financial Institutions Regulatory AuthorityAnnual Financial Statements for the year ended 31 March 2020
Board Responsibilities and Approval of the Annual Financial Statements (continued )
The external auditors are responsible for independently auditing and reporting on the Authority’s annual financial statements. The annual financial statements have been examined by the Authority’s external auditors and their report is presented on page s 4 to 7.
The annual financial statements set out on pages 9 to 38, which have been prepared on the going concern basis, were approved by the board of directors on......................................and were signed on their behalf by:
Approval of financial statements
Director Director
Gaborone
10/09/2020
132
133
Independent Auditor’s Report
To the members of Non-Bank Financial Institutions Regulatory Authority
Opinion
We have audited the accompanying annual financial statements of Non-Bank Financial Institutions Regulatory Authority set out on pages 8 to 35, which comprise the statement of financial position as at 31 March 2020, and the statement of profit or loss and other comprehensive income, statement of changes in funds and statement of cash flows for the year then ended, and notes to the annual financial statements, including a summary of significant accounting policies.
In our opinion, the annual financial statements give a true and fair view of, the financial position of Non-Bank Financial Institutions Regulatory Authority as at 31 March 2020, and its financial performance and cash flows for the year then ended in accordance with International Financial Reporting Standards and in the manner required by the Non-Bank Financial Institutions Regulatory Authority Act, 2016.
Basis for opinion
We conducted our audit in accordance with International Standards on Auditing. Our responsibilities under those standards are further described in the Auditor’s Responsibilities for the audit of the annual financial statements section of our report. We are independent of the Authority in accordance with the International Ethics Standards Board for Accountants Code of Ethics for Professional Accountants (Parts A and B) (IESBA Code) and other independence requirements applicable to performing audits of annual financial statements in Botswana. We have fulfilled our other ethical responsibilities in accordance with the IESBA Code and in accordance with other ethical requirements applicable to performing audits in Botswana. We believe that the audit evidence we have obtained is sufficient and appropriate to provide a basis for our opinion.
133
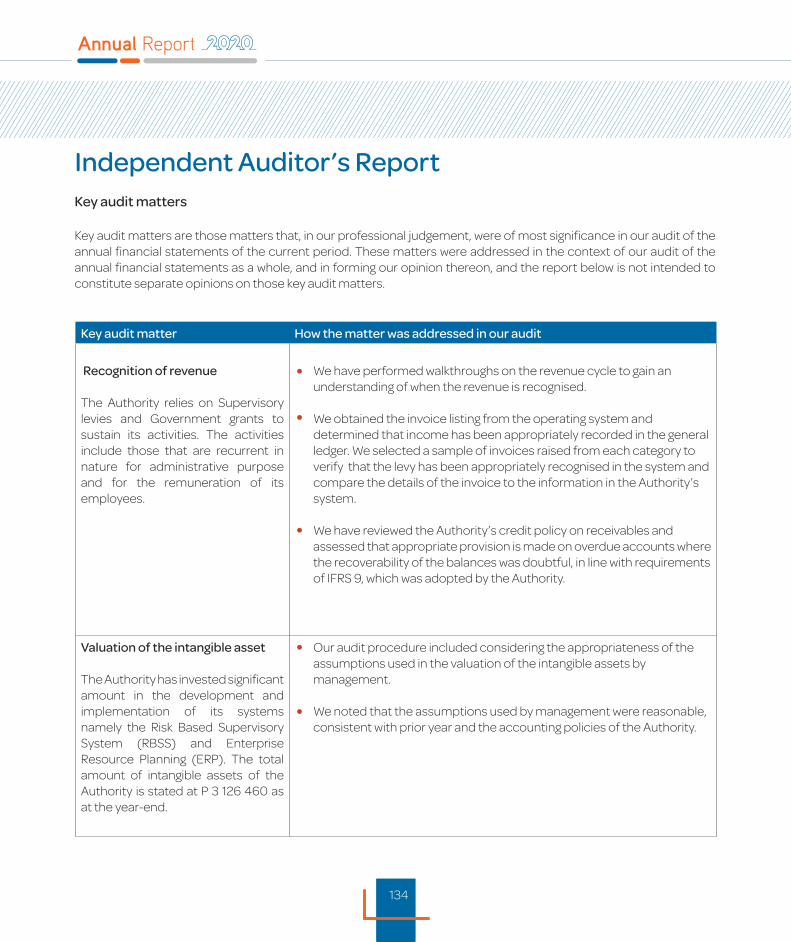
134
Independent Auditor’s ReportKey audit matters
Key audit matters are those matters that, in our professional judgement, were of most significance in our audit of the annual financial statements of the current period. These matters were addressed in the context of our audit of the annual financial statements as a whole, and in forming our opinion thereon, and the report below is not intended to constitute separate opinions on those key audit matters.
Key audit matter How the matter was addressed in our audit
Recognition of revenue
The Authority relies on Supervisory levies and Government grants to sustain its activities. The activities include those that are recurrent in nature for administrative purpose and for the remuneration of its employees.
We have performed walkthroughs on the revenue cycle to gain an understanding of when the revenue is recognised.
We obtained the invoice listing from the operating system and determined that income has been appropriately recorded in the general ledger. We selected a sample of invoices raised from each category to verify that the levy has been appropriately recognised in the system and compare the details of the invoice to the information in the Authority’s system.
We have reviewed the Authority’s credit policy on receivables and assessed that appropriate provision is made on overdue accounts where the recoverability of the balances was doubtful, in line with requirements of IFRS 9, which was adopted by the Authority.
Valuation of the intangible asset
The Authority has invested significant amount in the development and implementation of its systems namely the Risk Based Supervisory System (RBSS) and Enterprise Resource Planning (ERP). The total amount of intangible assets of the Authority is stated at P 3 126 460 as at the year-end.
Our audit procedure included considering the appropriateness of the assumptions used in the valuation of the intangible assets by management.
We noted that the assumptions used by management were reasonable, consistent with prior year and the accounting policies of the Authority.
134
135
Other information
The directors are responsible for the other information. The other information comprises the general information and Statement of Director Responsibility, which we obtained prior to the date of this auditor’s report, and other sections of the annual report, which are expected to be made available to us after that date. Other information does not include the annual financial statements and our auditor’s report thereon.
Our opinion on the annual financial statements does not cover the other information and we do not express an audit opinion or any form of assurance conclusion thereon.
In connection with our audit of the annual financial statements, our responsibility is to read the other information and, in doing so, consider whether the other information is materially inconsistent with the annual financial statements or our knowledge obtained in the audit, or otherwise appears to be materially misstated. If, based on the work we have performed, we conclude that there is a material misstatement of this other information, we are required to report that fact. We have nothing to report in this regard. Responsibilities of the directors for the Annual Financial Statements
The directors are responsible for the preparation and fair presentation of the annual financial statements in accordance with International Financial Reporting Standards, and for such internal control as the directors determine is necessary to enable the preparation of annual financial statements that are free from material misstatement, whether due to fraud or error.
In preparing the annual financial Statements, the directors are responsible for assessing the Authority’s ability to continue as a going concern, disclosing, as applicable, matters related to going concern and using the going concern basis of accounting unless the directors either intend to liquidate the Authority or to cease operations, or have no realistic alternative but to do so.
Those charged with governance are responsible for overseeing the Authority’s financial reporting process.
Auditor’s responsibilities for the audit of the Annual Financial Statements
Our objectives are to obtain reasonable assurance about whether the annual financial statements as a whole are free from material misstatement, whether due to fraud or error, and to issue an auditor’s report that includes our opinion. Reasonable assurance is a high level of assurance, but is not a guarantee that an audit conducted in accordance with International Standards on Auditing will always detect a material misstatement when it exists. Misstatements can
135
136
Independent Auditor’s Report
arise from fraud or error and are considered material if, individually or in the aggregate, they could reasonably be expected to influence the economic decisions of users taken on the basis of these annual financial statements.
As part of an audit in accordance with International Standards on Auditing, we exercise professional judgement and maintain professional scepticism throughout the audit. We also:
Identify and assess the risks of material misstatement of the annual financial statements, whether due to fraud or error, design and perform audit procedures responsive to those risks, and obtain audit evidence that is sufficient and appropriate to provide a basis for our opinion. The risk of not detecting a material misstatement resulting from fraud is higher than for one resulting from error, as fraud may involve collusion, forgery, intentional omissions, misrepresentations, or the override of internal control.
Obtain an understanding of internal control relevant to the audit in order to design audit procedures that are appropriate in the circumstances, but not for the purpose of expressing an opinion on the effectiveness of the Authority’s internal control.
Evaluate the appropriateness of accounting policies used and the reasonableness of accounting estimates and related disclosures made by the directors.
Conclude on the appropriateness of the directors’ use of the going concern basis of accounting and based on the audit evidence obtained, whether a material uncertainty exists related to events or conditions that may cast significant doubt on the Authority’s ability to continue as a going concern. If we conclude that a material uncertainty exists, we are required to draw attention in our auditor’s report to the related disclosures in the annual financial statements or, if such disclosures are inadequate, to modify our opinion. Our conclusions are based on the audit evidence obtained up to the date of our auditor’s report. However, future events or conditions may cause the Authority to cease to continue as a going concern.
Evaluate the overall presentation, structure and content of the annual financial statements, including the disclosures, and whether the annual financial statements represent the underlying transactions and events in a manner that achieves fair presentation.
We communicate with the directors regarding, among other matters, the planned scope and timing of the audit and significant audit findings, including any significant deficiencies in internal control that we identify during our audit.

137
We also provide the directors with a statement that we have complied with relevant ethical requirements regarding independence, and to communicate with them all relationships and other matters that may reasonably be thought to bear on our independence, and where applicable, related safeguards.
From the matters communicated with the directors, we determine those matters that were of most significance in the audit of the annual financial statements of the current year and are therefore the key audit matters. We describe these matters in our auditor’s report unless law or regulation precludes public disclosure about the matter or when, in extremely rare circumstances, we determine that a matter should not be communicated in our report because the adverse consequences of doing so would reasonably be expected to outweigh the public interest benefits of such communication.
Reporting on Other Legal and Regulatory Requirements
As required by the Non-Bank Financial Institutions Regulatory Authority Act, 2016. we report to you, based on our audit, that: all the information and explanation which, to the best of the auditor’s knowledge and belief, were necessary for the performance of the auditor’s duties;
The accounts and related records of the Regulatory Authority have been properly kept The Regulatory Authority has complied with all the financial provisions of this Act with which it is its duty to comply with: and
The statement of accounts prepared by the Authority was prepared on a basis consistent with that of the preceding year and represents a true and fair view of the transactions and financial affairs of the Regulatory Authority.
Chartered Accountants GaboroneCertified Auditor: Sunny Mulakulam (Memb No:20050097) Certified Auditor of Public Interest EntityCertificate Number: CAP 0034 2020
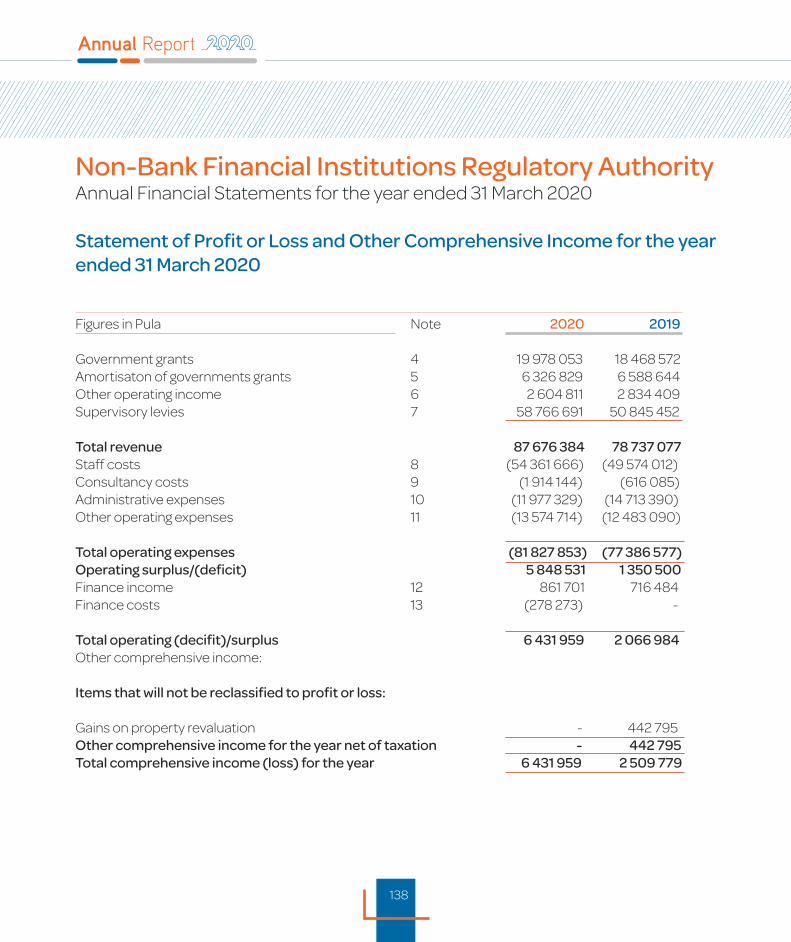
138
Non-Bank Financial Institutions Regulatory AuthorityAnnual Financial Statements for the year ended 31 March 2020
Statement of Profit or Loss and Other Comprehensive Income for the year ended 31 March 2020
Figures in Pula Note 2020 2019
Government grants 4 19 978 053 18 468 572Amortisaton of governments grants 5 6 326 829 6 588 644Other operating income 6 2 604 811 2 834 409Supervisory levies 7 58 766 691 50 845 452
Total revenue 87 676 384 78 737 077Staff costs 8 (54 361 666) (49 574 012)Consultancy costs 9 (1 914 144) (616 085)Administrative expenses 10 (11 977 329) (14 713 390)Other operating expenses 11 (13 574 714) (12 483 090)
Total operating expenses (81 827 853) (77 386 577)Operating surplus/(deficit) 5 848 531 1 350 500Finance income 12 861 701 716 484Finance costs 13 (278 273) -
Total operating (decifit)/surplus 6 431 959 2 066 984Other comprehensive income: Items that will not be reclassified to profit or loss:
Gains on property revaluation - 442 795Other comprehensive income for the year net of taxation - 442 795Total comprehensive income (loss) for the year 6 431 959 2 509 779
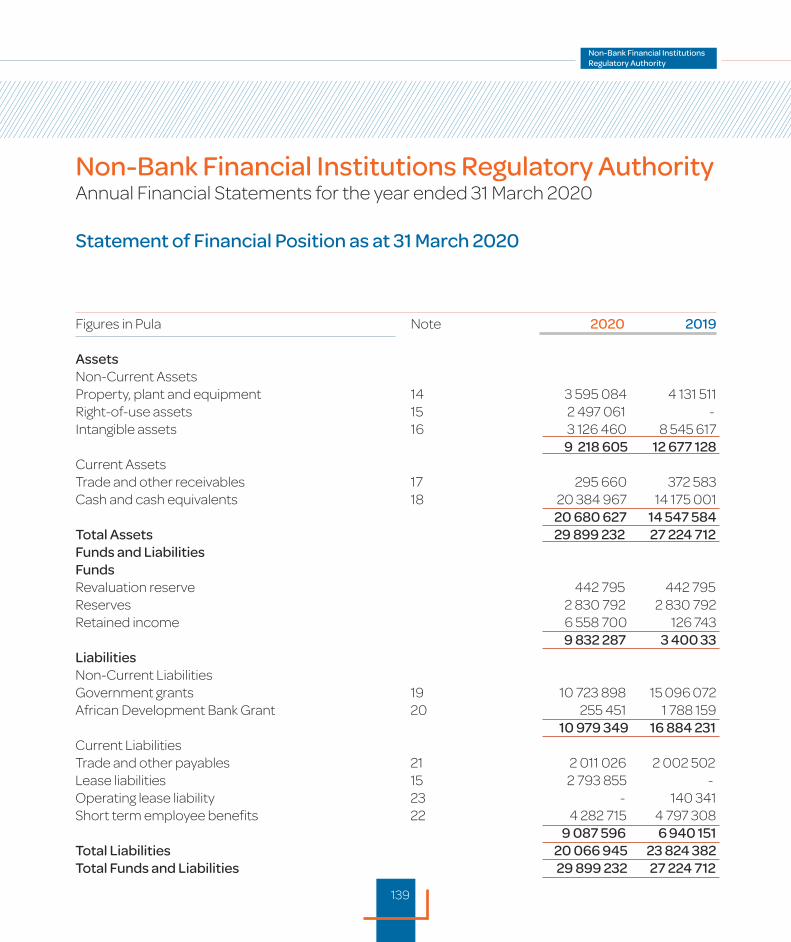
139
Non-Bank Financial Institutions Regulatory AuthorityAnnual Financial Statements for the year ended 31 March 2020
Statement of Financial Position as at 31 March 2020
Figures in Pula Note 2020 2019
AssetsNon-Current Assets Property, plant and equipment 14 3 595 084 4 131 511Right-of-use assets 15 2 497 061 -Intangible assets 16 3 126 460 8 545 617 9 218 605 12 677 128Current AssetsTrade and other receivables 17 295 660 372 583Cash and cash equivalents 18 20 384 967 14 175 001 20 680 627 14 547 584Total Assets 29 899 232 27 224 712Funds and Liabilities FundsRevaluation reserve 442 795 442 795Reserves 2 830 792 2 830 792Retained income 6 558 700 126 743 9 832 287 3 400 33Liabilities Non-Current LiabilitiesGovernment grants 19 10 723 898 15 096 072African Development Bank Grant 20 255 451 1 788 159 10 979 349 16 884 231Current LiabilitiesTrade and other payables 21 2 011 026 2 002 502Lease liabilities 15 2 793 855 -Operating lease liability 23 - 140 341Short term employee benefits 22 4 282 715 4 797 308 9 087 596 6 940 151Total Liabilities 20 066 945 23 824 382Total Funds and Liabilities 29 899 232 27 224 712
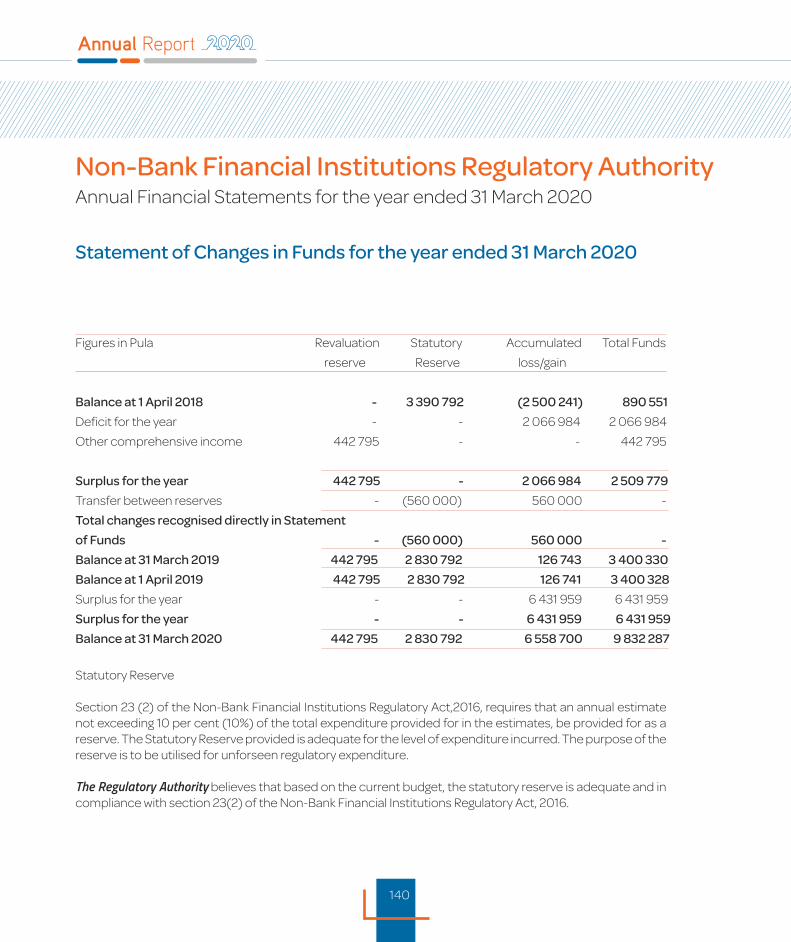
140
Non-Bank Financial Institutions Regulatory AuthorityAnnual Financial Statements for the year ended 31 March 2020
Statement of Changes in Funds for the year ended 31 March 2020
Figures in Pula Revaluation Statutory Accumulated Total Funds
reserve Reserve loss/gain
Balance at 1 April 2018 - 3 390 792 (2 500 241) 890 551
Deficit for the year - - 2 066 984 2 066 984
Other comprehensive income 442 795 - - 442 795
Surplus for the year 442 795 - 2 066 984 2 509 779
Transfer between reserves - (560 000) 560 000 -
Total changes recognised directly in Statement
of Funds - (560 000) 560 000 -
Balance at 31 March 2019 442 795 2 830 792 126 743 3 400 330
Balance at 1 April 2019 442 795 2 830 792 126 741 3 400 328
Surplus for the year - - 6 431 959 6 431 959
Surplus for the year - - 6 431 959 6 431 959
Balance at 31 March 2020 442 795 2 830 792 6 558 700 9 832 287
Statutory Reserve
Section 23 (2) of the Non-Bank Financial Institutions Regulatory Act,2016, requires that an annual estimate not exceeding 10 per cent (10%) of the total expenditure provided for in the estimates, be provided for as a reserve. The Statutory Reserve provided is adequate for the level of expenditure incurred. The purpose of the reserve is to be utilised for unforseen regulatory expenditure.
The Regulatory Authority believes that based on the current budget, the statutory reserve is adequate and in compliance with section 23(2) of the Non-Bank Financial Institutions Regulatory Act, 2016.
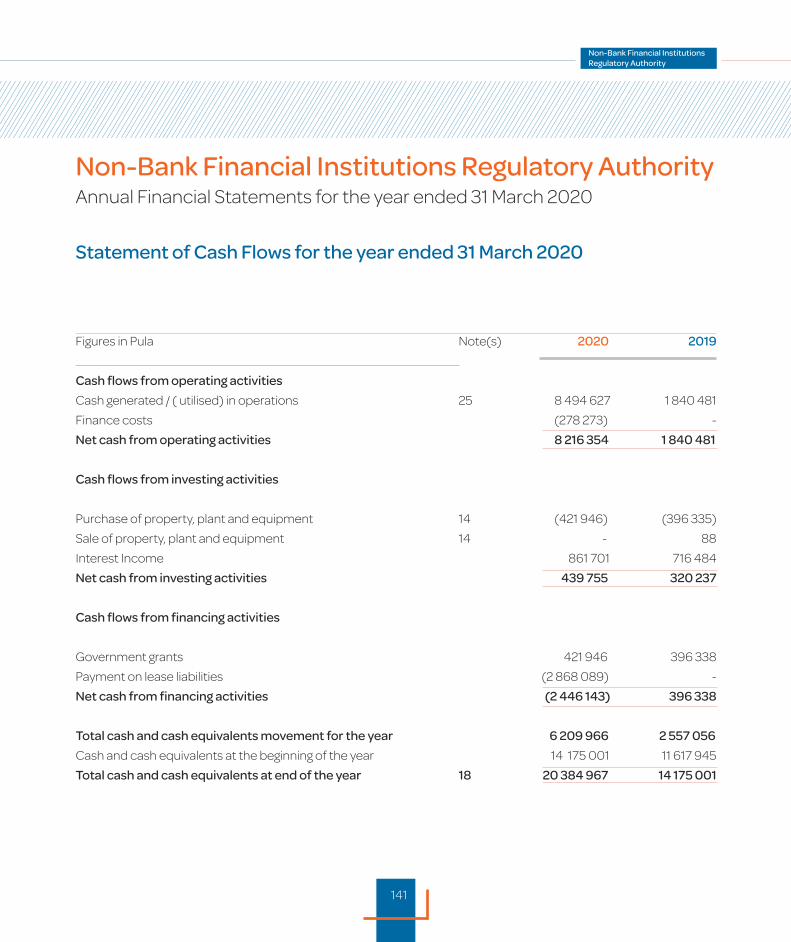
141
Non-Bank Financial Institutions Regulatory AuthorityAnnual Financial Statements for the year ended 31 March 2020
Statement of Cash Flows for the year ended 31 March 2020
Figures in Pula Note(s) 2020 2019
Cash flows from operating activities
Cash generated / ( utilised) in operations 25 8 494 627 1 840 481
Finance costs (278 273) -
Net cash from operating activities 8 216 354 1 840 481
Cash flows from investing activities
Purchase of property, plant and equipment 14 (421 946) (396 335)
Sale of property, plant and equipment 14 - 88
Interest Income 861 701 716 484
Net cash from investing activities 439 755 320 237
Cash flows from financing activities
Government grants 421 946 396 338
Payment on lease liabilities (2 868 089) -
Net cash from financing activities (2 446 143) 396 338
Total cash and cash equivalents movement for the year 6 209 966 2 557 056
Cash and cash equivalents at the beginning of the year 14 175 001 11 617 945
Total cash and cash equivalents at end of the year 18 20 384 967 14 175 001

142
Non-Bank Financial Institutions Regulatory AuthorityAnnual Financial Statements for the year ended 31 March 2020
Accounting Policies
1. Significant accounting policies
The annual financial statements have been prepared in accordance with International Financial Reporting Standards. The annual financial statements have been prepared on the historical cost basis, except for certain financial instruments measured at fair value, and incorporate the principal accounting policies set out below. They are presented in Pula.
These accounting policies are consistent with the previous period except for the new standards and interpretations effective and adopted in the current year as set out in note 2.
1.1 Statement of Compliance
The financial statements have been prepared in accordance with the International Financial Reporting Standards (IFRS) and the Non-Bank Financial Institutions Regulatory Authority Act 2016.
1.2 Significant judgements and sources of estimation uncertainty
The preparation of financial statements in conformity with the International Financial Reporting Standards requires the use of certain critical accounting estimates and judgements concerning the future. Estimates and judgements are continually evaluated and are based on historical factors coupled with expectations about future events that are considered reasonable. In the process of applying the Authority’s accounting policies, management has made the following estimates that have a significant risk of causing material adjustment to the carrying amounts of assets and liabilities within the next year.
Key Areas of estimation and judgement
The key assumption concerning the future and other key sources of estimation uncertainty and judgements at the reporting date, that have a significant risk of causing material adjustment to the carrying amounts of assets and liabilities within the next financial year as this involves assessments or decisions that are particularly complex or subjective, are discussed below:
143
1. Significant accounting policies (continued)
Depreciation charges and residual values
For depreciation purposes, a significant component is defined as equal to or greater than 20% of total cost of the asset and each significant component with different useful lives is depreciated separately. The depreciation methods reflects the pattern in which economic benefits attributable to the assets flow to the entity. The useful lives of these assets can vary depending on a variety of factors, including but not limited to the technological obsolescence, maintenance programs, refurbishments, product life cycles and the intention of management. Residual values of assets are determined by estimating the amount that the entity would currently obtain from the disposal of the asset already of age and in the condition expected at the end of its useful life. The estimation of the useful life and residual values of an asset is a matter of judgement based on the past experience of the Authority with similar assets and the intention of management. Assessment of the asset condition and usefulness are key assumptions used to determine the assets’ useful lives and residual values.
Supervisory Levies
Where supervisory levies are calculated on information that has not been audited, the Regulatory Authority assumes that estimates have been used and will place reliance on the information submitted by the regulated entities as a basis for calculation.
Impairment testing
The recoverable amounts of cash-generating units and individual assets have been determined based on the higher of value- inuse calculations and fair values less costs to sell. These calculations require the use of estimates and assumptions. It is reasonably possible that the assumption may change which may then impact our estimations and may then require a material adjustment to the carrying value of assets.
The entity reviews and tests the carrying value of assets when events or changes in circumstances suggest that the carrying amount may not be recoverable. Assets are grouped at the lowest level for which identifiable cash flows are largely independent of cash flows of other assets and liabilities. If there are indications that impairment may have occurred, estimates are prepared of expected future cash flows for each group of assets. Expected future cash flows used to determine the value in use of assets are inherently uncertain and could materially change over time. They are significantly affected by a number of factors includingsupply and demand, together with economic factors such as exchange rates, inflation and interest.
144
1.2 Significant judgements and sources of estimation uncertainty (continued) Provisions
Provisions were raised and management determined an estimate based on the information available.
1.3 Intangible assets
An intangible asset is recognised when: it is probable that the expected future economic benefits that are attributable to the asset will flow to the entity; and the cost of the asset can be measured reliably.
Intangible assets are initially recognised at cost.Expenditure on research (or on the research phase of an internal project) is recognised as an expense when it is incurred. An intangible asset arising from development (or from the development phase of an internal project) is recognised when: it is technically feasible to complete the asset so that it will be available for use or sale. there is an intention to complete and use or sell it. there is an ability to use or sell it. it will generate probable future economic benefits. there are available technical, financial and other resources to complete the development and to use or sell the asset. the expenditure attributable to the asset during its development can be measured reliably.
The amortisation period and the amortisation method for intangible assets are reviewed every period-end.Amortisation is provided to write down the intangible assets, on a straight line basis, to their residual values as follows:
Item Average useful lifeRisk Based Supervisory System (RBSS) 5 yearsEnterprise Resource Planning (ERP) 5 years
Non-Bank Financial Institutions Regulatory AuthorityAnnual Financial Statements for the year ended 31 March 2020
Accounting Policies (continued)
145
1.4 Property, plant and equipment
Property, Plant and Equipment is stated at cost, net of accumulated depreciation and / or accumulated impairment losses, if any. All plant and equipment are measured at historical cost less depreciation and impairment losses. Historical costs includes expenditure that is directly attributable to the acquisition of the items.
Subsequent costs such as replacement parts and major inspections are included in the asset’s carrying amount or recognised as a separate asset, as appropriate, only when it is probable that future economic benefits associated with the item will flow to the Authority and the cost of the item can be measured reliably. All day-to-day repairs and maintenance are charged to the surplusor deficit during the financial period in which they are incurred.
Motor vehicles is subsequently measured at revalued amount, being the fair value at the date of revaluation less any subsequent accumulated depreciation and subsequent accumulated impairment losses.
Revaluations are made with sufficient regularity such that the carrying amount does not differ materially from that which would be determined using fair value at the end of the reporting year. The assets are revalued every 2-3 years.
When an item of property, plant and equipment is revalued, the gross carrying amount is adjusted consistently with the revaluation of the carrying amount. The accumulated depreciation at that date is adjusted to equal the difference between the gross carrying amount and the carrying amount after taking into account accumulated impairment losses.
When an item of property, plant and equipment is revalued, any accumulated depreciation at the date of the revaluation is eliminated against the gross carrying amount of the asset.
Any increase in an asset’s carrying amount, as a result of a revaluation, is recognised in other comprehensive income and accumulated in the revaluation reserve in equity. The increase is recognised in profit or loss to the extent that it reverses a revaluation decrease of the same asset previously recognised in profit or loss.

146
1.4 Property, plant and equipment (continued)
Any decrease in an asset’s carrying amount, as a result of a revaluation, is recognised in profit or loss in the current year. The decrease is recognised in other comprehensive income to the extent of any credit balance existing in the revaluation reserve in respect of that asset. The decrease recognised in other comprehensive income reduces the amount accumulated in the revaluation reserve in equity.
The revaluation reserve related to a specific item of property, plant and equipment is transferred directly to retained income when the asset is derecognised.
The revaluation reserve related to a specific item of property, plant and equipment is transferred directly to retained income as the asset is used. The amount transferred is equal to the difference between depreciation based on the revalued carrying amount and depreciation based on the original cost of the asset, net of deferred tax.
Depreciation is charged so as to write off the cost of the assets over their estimated useful lives on a straight-line basis, to estimated residual values. Where significant parts of an item have different useful lives to the item itself, these parts are depreciated separately over their useful lives. The methods of depreciation, useful lives and residual values are reviewed annually, with the effect of any change in estimates accounted for prospectively. Depreciation is not charged to an asset if its estimated residual value exceeds or is equal to its carrying amount. Depreciation of an asset ceases at the earlier of the date that the asset is classified as held for sale or derecognised.
The useful lives of items of property, plant and equipment have been assessed as follows:
Item Depreciation method Average useful life
Leasehold property Lease term Lease termFurniture and fixtures Straight line 10 yearsMotor vehicles Straight line 5 yearsOffice equipment Straight line 6-7 yearsComputer equipment Straight line 3-7 years
Non-Bank Financial Institutions Regulatory AuthorityAnnual Financial Statements for the year ended 31 March 2020
Accounting Policies (continued)
147
1.4 Property, plant and equipment (continued)
An item of property, plant and equipment is derecognised upon disposal or when no future economic benefits are expected from its continued use or disposal. Any gain or loss arising from the derecognition of an item of property, plant and equipment, determined as the difference between the net disposal proceeds, if any, and the carrying amount of the item, is included in profit or loss when the item is derecognised.
1.5 Impairment of non-financial assets
At each financial reporting date, the Authority reviews the carrying amount of its tangible assets to determine whether there is any indication that those assets have suffered an impairment loss. If any such indications exist, the recoverable amount of the asset is estimated in order to determine the extent of the impairment loss (if any). Where it is not possible to estimate the recoverable amount of an individual asset, the Authority estimates the recoverable amount of the cash generating section to which the asset belongs.
Recoverable amount is the higher of fair value less costs to sell and value in use. In assessing value in use, the estimated future cash flows are discounted to their present value using a pre-tax discount rate that reflects current market assessments of the time value of money and the risks specific to the asset.
If the recoverable amount of an asset (or cash-generating section) is estimated to be less than its carrying amount, its carrying amount is reduced to its recoverable amount. Impairment losses are recognised in the surplus or deficit in those categories consistent with the function of the impaired asset.
Where an impairment loss subsequently reverses, the carrying amount of the asset (cash-generating-section) is increased to the revised estimate of its recoverable amount. This is done so that the increased carrying amount does not exceed the carrying amount that would have been determined had no impairment loss been recognised in the prior years. A reversal of an impairment loss is recognised in the surplus or deficit.
148
1.6 Revenue from contracts with customers
The Authority recognises revenue from the following major sources:
supervisory levies
License fees
Penalties
Finance income
Government Grant
Revenue is measured based on the consideration specified in a contract with a customer and excludes amounts collected on behalf of third parties. The Authority recognises revenue when it transfers control of a product or service to a customer.
The supervisory levies
The supervisory levies and licence fees were promulgated into law through Statutory Instrument No.52 of 2017 of the Republic of Botswana, which was published in the Government Gazette of the 29 March 2019. Supervisory levies are charged and are payable in two equal portions, on or before the 30th April and 31st October of each financial year. Registered non-bank financial institutions are required to pay levies on an annual basis in terms of the Non-Bank Financial Institutions Regulatory Authority Act
2016. Supervisory levies are recognised at point in time. The Regulatory Authority may, on application, waive payment of some or all of a supervisory levy, penalty levy or a fee.The levies are fixed in nature and there are no separate performance obligations identified.
License fees
License fees are recognised on licensing of the relevant supervised entities and are recognised at the point in time. Some classes of regulated entities are charged annual licence fees, such fees are recognised by the Authority as revenue.
Non-Bank Financial Institutions Regulatory AuthorityAnnual Financial Statements for the year ended 31 March 2020
Accounting Policies (continued)

149
1.6 Revenue from contracts with customers (continued)
Penalties
Penalties are recognised in the surplus or deficit on penalizing those regulated entities that have defaulted in meeting the necessary regulatory guidelines.
Finance income
Revenue is recognised as interest accrues (using the effective interest method). Finance income is recognised in the surplus or deficit.
Government Grant
Government grants are recognised where there is reasonable assurance that the grant will be received and all attached conditions will be complied with. When the grant relates to an expense item, it is recognised as income over the period necessary to match the grant on a systematic basis to the costs that it is intended to compensate. Where the grant relates to the purchase of an asset, it is recognised as capital grant in the statement of financial position and released to the statement of comprehensive income in equal amounts over the expected useful life of the related asset.Where the Authority receives a nonmonetary grant, the asset and the grant are recorded at nominal amounts and released to the total surplus or deficit over the expected useful life of the relevant asset by equal annual installments.
1.7 Translation of foreign currencies
Foreign currency transactions
Transactions in foreign currencies are initially recorded at the functional currency rate ruling at the date of the transaction. Monetary assets and liabilities denominated in foreign currencies are retranslated at the functional currency rate of exchange ruling at the reporting date.
150
1.7 Translation of foreign currencies (continued)
Foreign currency transactions
Non-monetary items that are measured in terms of historical cost in a foreign currency are translated using the exchange rates as at the dates of the initial transactions. Foreign exchange translation gains or losses arising on the settlement of monetary items or on translating monetary items or on translating monetary items at rates different from those used when translating at initial recognition during the period or in the financial statements are taken to the statement of comprehensive income in the period they arise.
1.8 Borrowing costs
Borrowing costs directly attributable to the acquisition, construction or production of an asset that necessarily takes a substantial period of time to get ready for its intended use or sale are capitalised as part of the cost of the respective assets. All other borrowing costs are expensed in the period they occur. Borrowing costs consist of interest and other costs that an entity incurs in connection with the borrowing of funds. The Regulatory Authority had no eligible assets or borrowing costs for the period reported.
1.9 Employee benefits
Pension
The Regulatory Authority operates a defined contribution scheme for the employees. Payments to the scheme are charged as an expense to the statement of comprehensive income as they fall due
The Regulatory Authority provides for gratuity benefits for employees on fixed term contracts in line with the Employment Act Chapter 47:01 and the relevant employment contracts. Gratuity expenses are recognised immediately, to the extent that the benefits are amortised on a straight-line basis over the period of service,
Non-Bank Financial Institutions Regulatory AuthorityAnnual Financial Statements for the year ended 31 March 2020
Accounting Policies (continued)
151
1.9 Employee benefits (continued)
Pension
until the benefits become payable. The charge is made to expenses in the statement of comprehensive income and a separate provision in the statement of financial position.
Leave pay provision
The Regulatory Authority recognises, in full, employee’s right to annual leave entitlement in respect of past service. The recognition is made each year and is calculated based on accrued leave days not taken during the year. The charge is made to expenses in the statement of comprehensive income and a separate provision in the statement of financial position.
1.10 Government grants
Government grants are recognised when there is reasonable assurance that:
the Authority will comply with the conditions attaching to them; and
the grants will be received.
Government grants are recognised as income over the periods necessary to match them with the related costs that they are intended to compensate.
A government grant that becomes receivable as compensation for expenses or losses already incurred or for the purpose of giving immediate financial support to the entity with no future related costs is recognised as income of the period in which it becomes receivable.
Government grants related to assets, including non-monetary grants at fair value, are presented in the statement of financial position by setting up the grant as deferred income or by deducting the grant in arriving at the carrying amount of the asset.

152
Non-Bank Financial Institutions Regulatory AuthorityAnnual Financial Statements for the year ended 31 March 2020
Accounting Policies (continued)
Grants relating to the acquisition of property, plant and equipment are credited to the income statement on a straight line basis over the expected useful lives of the related assets. The related costs are shown at cost less accumulated depreciation. When an asset financed through grants is disposed of, the total unamortised portion of the grant relating to the asset is recognised in profit and loss in the year of disposal.
1.11 Financial instruments
Financial instruments held by the Authority are classified in accordance with the provisions of IFRS 9 Financial Instruments. Broadly, the classification possibilities, which are adopted by the Authority ,as applicable, are as follows:
Financial assets which are debt instruments:
Amortised cost. ( This category applies only when the contractual terms of the instrument give rise, or specified dates, to cash flows that are solely payments of principal and interest on principal and where the instrument is held under a business model whose objective is met by holding the instrument to collect contractual cash flows).
Financial liabilities:
Amortised cost.
Note 28 Financial instruments and risk management presents the financial instruments held by the Authority based on their specific classifications.
All regular way purchases or sales of financial assets are recognised and derecognised on a trade date basis. Regular way purchases or sales are purchases or sales of financial assets that require delivery of assets within the time frame established by regulation or convention in the marketplace.
The specific accounting policies for the classification, recognition and measurement of each type of financial instrument held by the Authority are presented below:
153
1.11 Financial instruments(continued )
Trade and other receivables
Classification
Trade and other receivables, excluding, when applicable, VAT and prepayments, are classified as financial assets subsequently measured at amortised cost (note 17).
They have been classified in this manner because their contractual terms give rise, on specified dates to cash flows that are solely payments of principal and interest on the principal outstanding, and the Authority’s business model is to collect the contractual cash flows on trade and other receivables.
Recognition and measurement
Trade and other receivables are recognised when the Authority becomes a party to the contractual provisions of the receivables. They are measured, at initial recognition, at fair value plus transaction costs, if any.
They are subsequently measured at amortised cost.
The amortised cost is the amount recognised on the receivable initially, minus principal repayments, plus cumulative amortisation (interest) using the effective interest method of any difference between the initial amount and the maturity amount, adjusted for any loss allowance.
Impairment
The Authority recognises a loss allowance for expected credit losses on trade and other receivables, excluding VAT and prepayments. The amount of expected credit losses is updated at each reporting date.
154
Non-Bank Financial Institutions Regulatory AuthorityAnnual Financial Statements for the year ended 31 March 2020
Accounting Policies (continued)
The Authority measures the loss allowance for trade and other receivables at an amount equal to lifetime expected credit losses (lifetime ECL), which represents the expected credit losses that will result from all possible default events over the expected life of the receivable.
Measurement and recognition of expected credit losses
The Authority makes use of a provision matrix as a practical expedient to the determination of expected credit losses on trade and other receivables. The provision matrix is based on historic credit loss experience, adjusted for factors that are specific to the debtors, general economic conditions and an assessment of both the current and forecast direction of conditions at the reporting date, including the time value of money, where appropriate.
The customer base is widespread and does not show significantly different loss patterns for different customer segments. The loss allowance is calculated on a collective basis for all trade and other receivables in totality. Details of the provision matrix is presented in note 17.
An impairment gain or loss is recognised in profit or loss with a corresponding adjustment to the carrying amount of trade and other receivables, through use of a loss allowance account. The impairment loss is included in other operating expenses in profit or loss as a movement in credit loss allowance (note 17).
Write off policy
The Authority writes off a receivable when there is information indicating that the counterparty is in severe financial difficulty and there is no realistic prospect of recovery, e.g. when the counterparty has been placed under liquidation or has entered into bankruptcy proceedings. Receivables written off may still be subject to enforcement activities under the Authority recovery procedures, taking into account legal advice where appropriate. Any recoveries made are recognised in profit or loss.
155
1.11 Financial instruments (continued)
Credit risk
Details of credit risk are included in the trade and other receivables note (note 17) and the financial instruments and risk management note (note 28).
Derecognition
Refer to the derecognition section of the accounting policy for the policies and processes related to derecognition.
Any gains or losses arising on the derecognition of trade and other receivables is included in profit or loss in the derecognition gains (losses) on financial assets at amortised cost line item.
Trade and other payables
Classification
Trade and other payables (note 21), excluding VAT and amounts received in advance, are classified as financial liabilities subsequently measured at amortised cost.
Recognition and measurement
They are recognised when the Authority becomes a party to the contractual provisions, and are measured, at initial recognition, at fair value plus transaction costs, if any.
156
Non-Bank Financial Institutions Regulatory AuthorityAnnual Financial Statements for the year ended 31 March 2020
Accounting Policies (continued)
1.11 Financial instruments (continued)
Recognition and measurement
They are subsequently measured at amortised cost using the effective interest method.
The effective interest method is a method of calculating the amortised cost of a financial liability and of allocating interest expense over the relevant period. The effective interest rate is the rate that exactly discounts estimated future cash payments (including all fees and points paid or received that form an integral part of the effective interest rate, transaction costs and other premiums or discounts) through the expected life of the financial liability, or (where appropriate) a shorter period, to the amortised cost of a financial liability.
Trade and other payables expose the Authority to liquidity risk and possibly to interest rate risk. Refer to note 28 for details of risk exposure and management thereof.
Derecognition
Refer to the “derecognition” section of the accounting policy for the policies and processes related to derecognition.
Cash and cash equivalents
For the purpose of the cash flow statement, cash and cash equivalents consist of cash, cash deposits on call and short-term fixed deposit accounts in banks. Cash and cash equivalents are subsequently carried at amortised cost. Due to the short-term nature of these, the amortised cost approximates its fair value.
The Authority’s financial assets include cash and cash equivalents and trade and other receivables.

157
1.11 Financial instruments (continued)
Derecognition
Financial assets
The Authority derecognises a financial asset only when the contractual rights to the cash flows from the asset expire, or when it transfers the financial asset and substantially all the risks and rewards of ownership of the asset to another party. If the Authority neither transfers nor retains substantially all the risks and rewards of ownership and continues to control the transferred asset, the Authority recognises its retained interest in the asset and an associated liability for amounts it may have to pay. If the Authority retains substantially all the risks and rewards of ownership of a transferred financial asset, the Authority continues to recognise the financial asset and also recognises a collateralised borrowing for the proceeds received.
Financial liabilities
The Authority derecognises financial liabilities when, and only when, the Authority obligations are discharged, cancelled or they expire. The difference between the carrying amount of the financial liability derecognised and the consideration paid and payable, including any non-cash assets transferred or liabilities assumed, is recognised in profit or loss.
1.12 Provisions
Provisions are recognised when the Authority has a present legal or constructive obligation as a result of past events, it is probable that an outflow of resources will be required to settle the obligation; and a reliable estimate of the amount can be made. Provisions are measured at the directors’ best estimate of expenditure required to settle the obligation at the reporting date, and are discounted to present value where the effect of the time value of money is material.

158
Non-Bank Financial Institutions Regulatory AuthorityAnnual Financial Statements for the year ended 31 March 2020
Accounting Policies (continued)
1.13 Leases
The company assesses whether a contract is, or contains a lease, at the inception of the contract.
A contract is, or contains a lease if the contract conveys the right to control the use of an identified asset for a period of time in exchange for consideration.
In order to assess whether a contract is, or contains a lease, management determine whether the asset under consideration is “identified”, which means that the asset is either explicitly or implicitly specified in the contract and that the supplier does not have a substantial right of substitution throughout the period of use. Once management has concluded that the contract deals with an identified asset, the right to control the use thereof is considered. To this end, control over the use of an identified asset only exists when the company has the right to substantially all of the economic benefits from the use of the asset as well as the right to direct the use of the asset.
In circumstances where the determination of whether the contract is or contains a lease requires significant judgement, the relevant disclosures are provided in the significant judgments and sources of estimation uncertainty section of these accounting policies.
Company as lessee
A lease liability and corresponding right-of-use asset are recognised at the lease commencement date, for all lease agreements for which the company is a lessee, except for short-term leases of 12 months or less, or leases of low value assets. For these leases, the company recognises the lease payments as an operating expense (note ) on a straight-line basis over the term of the lease unless another systematic basis is more representative of the time pattern in which economic benefits from the leased asset are consumed.
The various lease and non-lease components of contracts containing leases are accounted for separately, with consideration being allocated to each lease component on the basis of the relative stand-alone prices
159
1.13 Leases (continued)
Company as lessee
of the lease components and the aggregate stand-alone price of the non-lease components (where non-lease components exist).
However as an exception to the preceding paragraph, the company has elected not to separate the non-lease components for leases of land and buildings.
Details of leasing arrangements where the company is a lessee are presented in note 15 Leases (company as lessee).
Lease liability
The lease liability is initially measured at the present value of the lease payments that are not paid at the commencement date, discounted by using the rate implicit in the lease. If this rate cannot be readily determined, the company uses its incremental borrowing rate.
Lease payments included in the measurement of the lease liability comprise the following:
fixed lease payments, including in-substance fixed payments, less any lease incentives;
variable lease payments that depend on an index or rate, initially measured using the index or rate at the commencement date;
the amount expected to be payable by the company under residual value guarantees;
the exercise price of purchase options, if the company is reasonably certain to exercise the option;
lease payments in an optional renewal period if the company is reasonably certain to exercise an extension option;
and
penalties for early termination of a lease, if the lease term reflects the exercise of an option to terminate the lease.

160
Non-Bank Financial Institutions Regulatory AuthorityAnnual Financial Statements for the year ended 31 March 2020
Accounting Policies (continued)
1.13 Leases (continued)
Lease liability
Variable rents that do not depend on an index or rate are not included in the measurement of the lease liability (or right-of-use asset). The related payments are recognised as an expense in the period incurred and are included in operating expenses (note 15).
The lease liability is presented as a separate line item on the Statement of Financial Position.
The lease liability is subsequently measured by increasing the carrying amount to reflect interest on the lease liability (using the effective interest method) and by reducing the carrying amount to reflect lease payments made. Interest charged on the lease liability is included in finance costs (note 13).
The company remeasures the lease liability (and makes a corresponding adjustment to the related right-of-use asset) when:
there has been a change to the lease term, in which case the lease liability is remeasured by discounting the revised lease payments using a revised discount rate;
there has been a change in the assessment of whether the company will exercise a purchase, termination or extension option, in which case the lease liability is remeasured by discounting the revised lease payments using a revised discount rate;
there has been a change to the lease payments due to a change in an index or a rate, in which case the lease liability is remeasured by discounting the revised lease payments using the initial discount rate (unless the lease payments change is due to a change in a floating interest rate, in which case a revised discount rate is used);
there has been a change in expected payment under a residual value guarantee, in which case the lease liability is remeasured by discounting the revised lease payments using the initial discount rate;
a lease contract has been modified and the lease modification is not accounted for as a separate lease, in which case the lease liability is remeasured by discounting the revised payments using a

161
1.13 Leases (continued)
revised discount rate.
When the lease liability is remeasured in this way, a corresponding adjustment is made to the carrying amount of the right-of-use asset, or is recognised in profit or loss if the carrying amount of the right-of-use asset has been reduced to zero.
Right-of-use assets
Right-of-use assets are presented as a separate line item on the Statement of Financial Position. Lease payments included in the measurement of the lease liability comprise the following:
the initial amount of the corresponding lease liability;
any lease payments made at or before the commencement date;
any initial direct costs incurred;
any estimated costs to dismantle and remove the underlying asset or to restore the underlying asset or the site on which it is located, when the company incurs an obligation to do so, unless these costs are incurred to produce inventories; and
less any lease incentives received.
Right-of-use assets are subsequently measured at cost less accumulated depreciation and impairment losses.
Right-of-use assets are depreciated over the shorter period of lease term and useful life of the underlying asset. However, if a lease transfers ownership of the underlying asset or the cost of the right-of-use asset reflects that the company expects to exercise a purchase option, the related right-of-use asset is depreciated over the useful life of the underlying asset. Depreciation starts at the commencement date of a lease.
162
Non-Bank Financial Institutions Regulatory AuthorityAnnual Financial Statements for the year ended 31 March 2020
Accounting Policies (continued)
1.13 Leases (continued)
For right-of-use assets which are depreciated over their useful lives, the useful lives are determined consistently with items of the same class of property, plant and equipment. Refer to the accounting policy for property, plant and equipment for details of useful lives.
The residual value, useful life and depreciation method of each asset are reviewed at the end of each reporting year. If the expectations differ from previous estimates, the change is accounted for prospectively as a change in accounting estimate. Each part of a right-of-use asset with a cost that is significant in relation to the total cost of the asset is depreciated separately.
The depreciation charge for each year is recognised in profit or loss unless it is included in the carrying amount of another asset.

163
Non-Bank Financial Institutions Regulatory AuthorityAnnual Financial Statements for the year ended 31 March 2020
Notes to the Annual Financial Statements
2. New Standards and Interpretations
2.1 Standards and interpretations effective and adopted in the current year
In the current year, the Authority has adopted the following standards and interpretations that are effective for the current financial year and that are relevant to its operations:
IFRS 16 Leases
IFRS 16 Leases is a new standard which replaces IAS 17 Leases, and introduces a single lessee accounting model. The main changes arising from the issue of IFRS 16 which are likely to impact the Authority are as follows:
Authority as lessee:
Lessees are required to recognise a right-of-use asset and a lease liability for all leases, except short term leases or leases where the underlying asset has a low value, which are expensed on a straight line or other systematic basis.
The cost of the right-of-use asset includes, where appropriate, the initial amount of the lease liability; lease payments made prior to commencement of the lease less incentives received; initial direct costs of the lessee; and an estimate for any provision for dismantling, restoration and removal related to the underlying asset.
The lease liability takes into consideration, where appropriate, fixed and variable lease payments; residual value guarantees to be made by the lessee; exercise price of purchase options; and payments of penalties for terminating the lease.
The right-of-use asset is subsequently measured on the cost model at cost less accumulated depreciation and impairment and adjusted for any re-measurement of the lease liability. However, right-of-use assets are measured at fair value when they meet the definition of investment property and all other investment property is accounted for on the fair value model. If a right-of-use asset relates to a class of property, plant and equipment which is measured on the revaluation model, then that right-of-use asset may be measured on the revaluation model.
164
Non-Bank Financial Institutions Regulatory AuthorityAnnual Financial Statements for the year ended 31 March 2020
Notes to the Annual Financial Statements (continued)
2.1 Standards and interpretations effective and adopted in the current year(continued)
The lease liability is subsequently increased by interest, reduced by lease payments and re- measured for reassessments or modifications.
Re-measurements of lease liabilities are affected against right-of-use assets, unless the assets have been reduced to nil, in which case further adjustments are recognised in profit or loss.
The lease liability is re-measured by discounting revised payments at a revised rate when there is a change in the lease term or a change in the assessment of an option to purchase the underlying asset.
The lease liability is re-measured by discounting revised lease payments at the original discount rate when there is a change in the amounts expected to be paid in a residual value guarantee or when there is a change in future payments because of a change in index or rate used to determine those payments.
Certain lease modifications are accounted for as separate leases. When lease modifications which decrease the scope of the lease are not required to be accounted for as separate leases, then the lessee re-measures the lease liability by decreasing the carrying amount of the right of lease asset to reflect the full or partial termination of the lease. Any gain or loss relating to the full or partial termination of the lease is recognised in profit or loss. For all other lease modifications which are not required to be accounted for as separate leases, the lessee re-measures the lease liability by making a corresponding adjustment to the right-of-use asset.
Right-of-use assets and lease liabilities should be presented separately from other assets and liabilities. If not, then the line item in which they are included must be disclosed. This does not apply to right-of-use assets meeting the definition of investment property which must be presented within investment property. IFRS 16 contains different disclosure requirements compared to IAS 17 leases.
Authority as lessor:
Accounting for leases by lessors remains similar to the provisions of IAS 17 in that leases are classified as either finance leases or operating leases. Lease classification is reassessed only if there has been a modification.

165
2.1 New Standards and Interpretations (continued)
A modification is required to be accounted for as a separate lease if it both increases the scope of the lease by adding the right to use one or more underlying assets; and the increase in consideration is commensurate to the stand alone price of the increase in scope.
If a finance lease is modified, and the modification would not qualify as a separate lease, but the lease would have been an operating lease if the modification was in effect from inception, then the modification is accounted for as a separate lease. In addition, the carrying amount of the underlying asset shall be measured as the net investment in the lease immediately before the effective date of the modification. IFRS 9 is applied to all other modifications not required to be treated as a separate lease.
Modifications to operating leases are required to be accounted for as new leases from the effective date of the modification. Changes have also been made to the disclosure requirements of leases in the lessor’s financial statements.
Sale and leaseback transactions:
In the event of a sale and leaseback transaction, the requirements of IFRS 15 are applied to consider whether a performance obligation is satisfied to determine whether the transfer of the asset is accounted for as the sale of an asset.
If the transfer meets the requirements to be recognised as a sale, the seller-lessee must measure the new right-of-use asset at the proportion of the previous carrying amount of the asset that relates to the right-of-use retained. The buyer-lessor accounts for the purchase by applying applicable standards and for the lease by applying IFRS 16
If the fair value of consideration for the sale is not equal to the fair value of the asset, then IFRS 16 requires adjustments to be made to the sale proceeds. When the transfer of the asset is not a sale, then the seller-lessee continues to recognise the transferred asset and recognises a financial liability equal to the transfer proceeds. The buyer-lessor recognises a financial asset equal to the transfer proceeds.
166
Non-Bank Financial Institutions Regulatory AuthorityAnnual Financial Statements for the year ended 31 March 2020
Notes to the Annual Financial Statements (continued)
2.1 New Standards and Interpretations (continued)
The effective date of the standard is for years beginning on or after 1 January 2019.
The company has adopted the standard for the first time in the 2020 annual financial statements. The impact of the standard is not material.
2.2 Standards and interpretations not yet effective
The Authority has chosen not to early adopt the following standards and interpretations, which have been published and are mandatory for the Authority’s accounting periods beginning on or after 1 April 2020 or later periods:
Standard/ Interpretation: Effective date: Expected impact:
Years beginning on or
after
Definition of a business - Amendments to IFRS 3 1 January 2020 Unlikely there will be
a material impact
3. Changes in accounting policy
The annual financial statements have been prepared in accordance with International Financial Reporting Standards on a basis consistent with the prior year except for the adoption of the following new or revised standards.
167
3. Changes in accounting policy (continued)
Application of IFRS 16 Leases
In the current year, the company has adopted IFRS 16 Leases (as issued by the IASB in January 2016) with the date of initial application being 1 April 2019. IFRS 16 replaces IAS 17 Leases, IFRIC 4 Determining whether an Arrangement contains a Lease, SIC-15 Operating Leases - Incentives and SIC 27 - Evaluating the Substance of Transactions Involving the Legal Form of a Lease.
IFRS 16 introduces new or amended requirements with respect to lease accounting. It introduces significant changes to the lessee accounting by removing the distinction between operating and finance leases and requiring the recognition of a right-of- use asset and a lease liability at the lease commencement for all leases, except for short-term leases and leases of low value assets. In contrast to lessee accounting, the requirements for lessor accounting have remained largely unchanged. Details of these new requirements are described in the accounting policy for leases. The impact of the adoption of IFRS 16 on the company’s annual financial statements is described below.
The company has applied the practical expedient available in IFRS 16 which provides that for contracts which exist at the initial application date, an entity is not required to reassess whether they contain a lease. This means that the practical expedient allows an entity to apply IFRS 16 to contracts identified by IAS 17 and IFRIC 4 as containing leases; and to not apply IFRS 16 to contracts that were not previously identified by IAS 17 and IFRIC 4 as containing leases.
IFRS 16 has been adopted by applying the modified retrospective approach, whereby the comparative figures are not restated. Instead, cumulative adjustments to retained earnings have been recognised in retained earnings as at 1 April 2019.
Leases previously classified as operating leases
The Authority undertook the following at the date of initial application for leases which were previously recognised as operating leases:
168
Non-Bank Financial Institutions Regulatory AuthorityAnnual Financial Statements for the year ended 31 March 2020
Notes to the Annual Financial Statements (continued)
3. Changes in accounting policy (continued)
recognised a lease liability, measured at the present value of the remaining lease payments, discounted at the Authority’s incremental borrowing rate at the date of initial application.
recognised right-of-use assets measured on a lease by lease basis, at either the carrying amount (as if IFRS 16 applied from commencement date but discounted at the incremental borrowing rate at the date of initial application) or at an amount equal to the lease liability adjusted for accruals or prepayments relating to that lease prior to the date of initial application.
The Authority applied IAS 36 to consider if these right-of-use assets are impaired as at the date of initial application.
The Authority applied the following practical expedients when applying IFRS 16 to leases previously classified as operating leases in terms of IAS 17. Where necessary, they have been applied on a lease by lease basis:
when a portfolio of leases contained reasonably similar characteristics, the Authority applied a single discount rate to that portfolio;
leases which were expiring within 12 months of 1 April 2019 were treated as short term leases, with remaining lease payments recognised as an expense on a straight-line basis or another systematic basis which is more representative of the pattern of benefits consumed;
initial direct costs were excluded from the measurement of right-of-use assets at the date of initial application.
hindsight was applied where appropriate. This was specifically the case for determining the lease term for leases which contained extension or termination options.
Impact on financial statements
On transition to IFRS 16, the Authority recognised an additional P5 661 944 of right-of-use assets and P5 802 286 of lease liabilities.
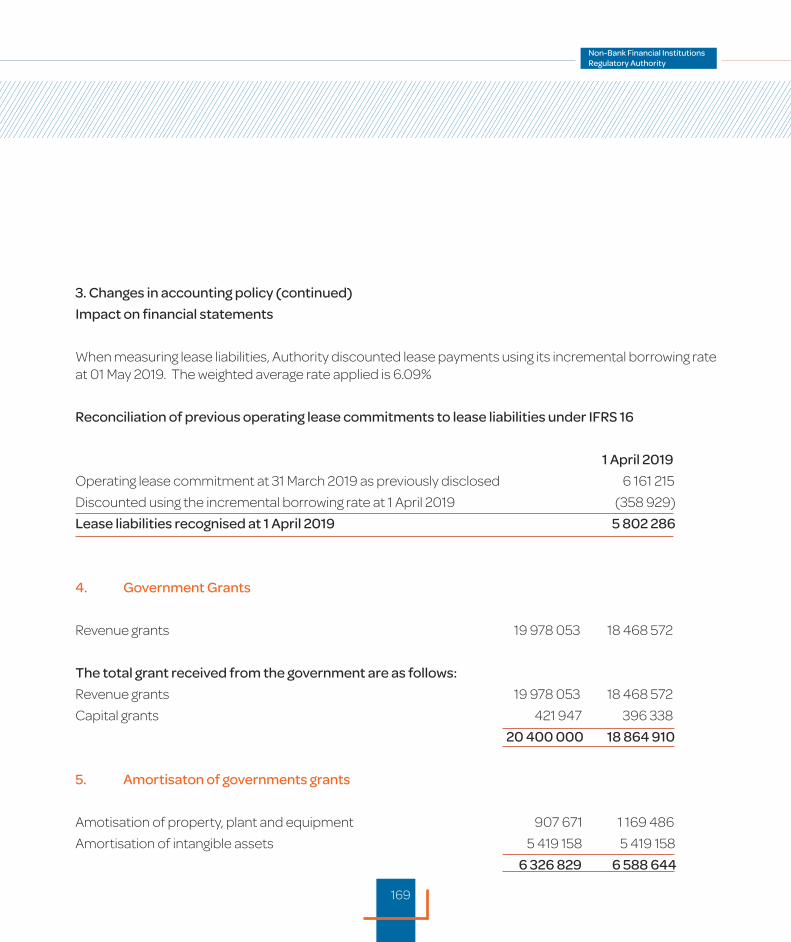
169
3. Changes in accounting policy (continued)
Impact on financial statements
When measuring lease liabilities, Authority discounted lease payments using its incremental borrowing rate at 01 May 2019. The weighted average rate applied is 6.09%
Reconciliation of previous operating lease commitments to lease liabilities under IFRS 16
1 April 2019
Operating lease commitment at 31 March 2019 as previously disclosed 6 161 215
Discounted using the incremental borrowing rate at 1 April 2019 (358 929)
Lease liabilities recognised at 1 April 2019 5 802 286
4. Government Grants
Revenue grants 19 978 053 18 468 572
The total grant received from the government are as follows:
Revenue grants 19 978 053 18 468 572
Capital grants 421 947 396 338
20 400 000 18 864 910
5. Amortisaton of governments grants
Amotisation of property, plant and equipment 907 671 1 169 486
Amortisation of intangible assets 5 419 158 5 419 158
6 326 829 6 588 644
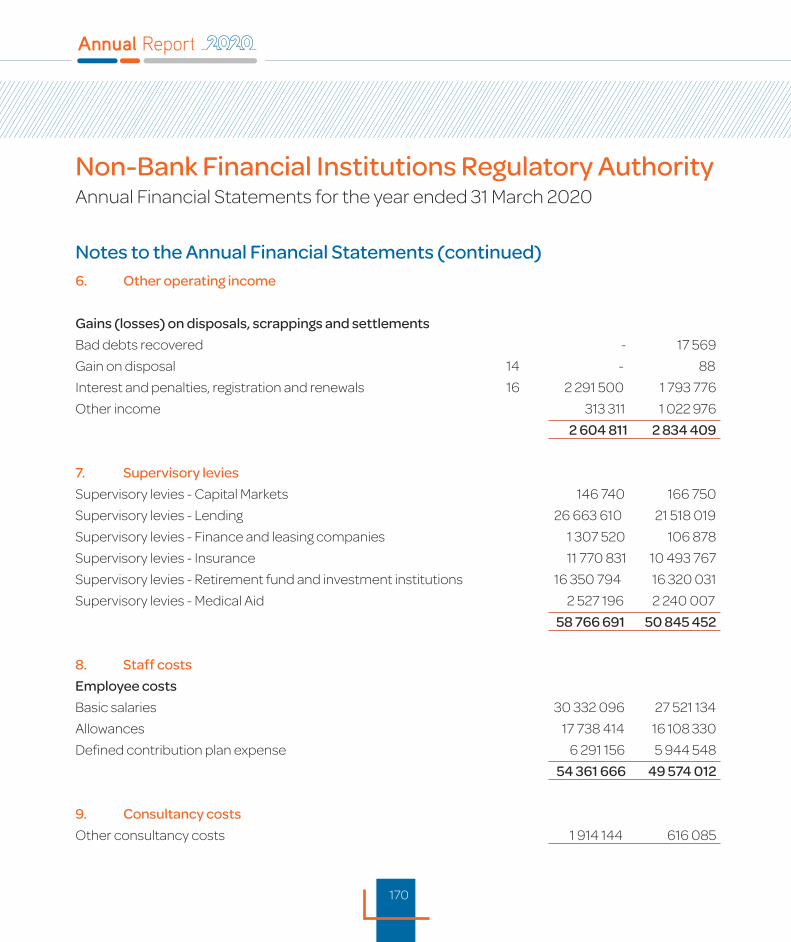
170
Non-Bank Financial Institutions Regulatory AuthorityAnnual Financial Statements for the year ended 31 March 2020
Notes to the Annual Financial Statements (continued)6. Other operating income
Gains (losses) on disposals, scrappings and settlements
Bad debts recovered - 17 569
Gain on disposal 14 - 88
Interest and penalties, registration and renewals 16 2 291 500 1 793 776
Other income 313 311 1 022 976
2 604 811 2 834 409
7. Supervisory levies
Supervisory levies - Capital Markets 146 740 166 750
Supervisory levies - Lending 26 663 610 21 518 019
Supervisory levies - Finance and leasing companies 1 307 520 106 878
Supervisory levies - Insurance 11 770 831 10 493 767
Supervisory levies - Retirement fund and investment institutions 16 350 794 16 320 031
Supervisory levies - Medical Aid 2 527 196 2 240 007
58 766 691 50 845 452
8. Staff costs
Employee costs
Basic salaries 30 332 096 27 521 134
Allowances 17 738 414 16 108 330
Defined contribution plan expense 6 291 156 5 944 548
54 361 666 49 574 012
9. Consultancy costs
Other consultancy costs 1 914 144 616 085
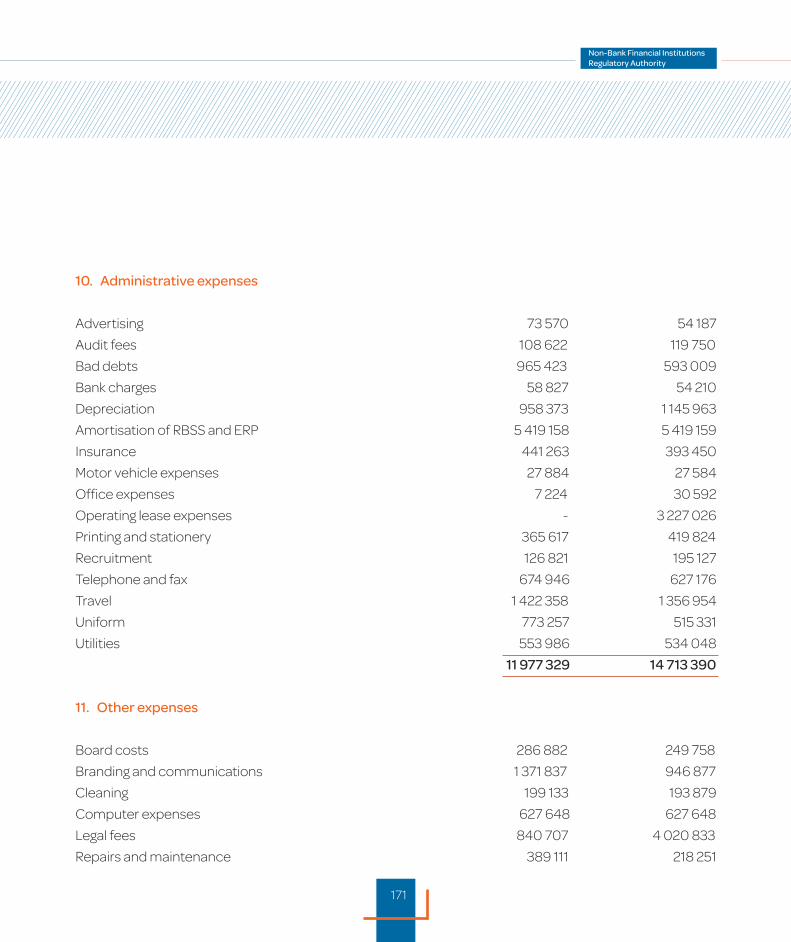
171
10. Administrative expenses
Advertising 73 570 54 187
Audit fees 108 622 119 750
Bad debts 965 423 593 009
Bank charges 58 827 54 210
Depreciation 958 373 1 145 963
Amortisation of RBSS and ERP 5 419 158 5 419 159
Insurance 441 263 393 450
Motor vehicle expenses 27 884 27 584
Office expenses 7 224 30 592
Operating lease expenses - 3 227 026
Printing and stationery 365 617 419 824
Recruitment 126 821 195 127
Telephone and fax 674 946 627 176
Travel 1 422 358 1 356 954
Uniform 773 257 515 331
Utilities 553 986 534 048
11 977 329 14 713 390
11. Other expenses
Board costs 286 882 249 758
Branding and communications 1 371 837 946 877
Cleaning 199 133 193 879
Computer expenses 627 648 627 648
Legal fees 840 707 4 020 833
Repairs and maintenance 389 111 218 251

172
Non-Bank Financial Institutions Regulatory AuthorityAnnual Financial Statements for the year ended 31 March 2020
Notes to the Annual Financial Statements (continued)
11. Other expenses (continued)
License fees 4 141 538 3 124 411
Security 278 332 264 830
Subscriptions 896 717 701 174
Net book value retired - Loss 6 676 90 224
Strategy expenses 313 055 327 491
Training 1 327 835 1 717 714
10 679 471 12 483 090
12. Finance income
Interest income
Investments in financial assets:
Bank 861 701 716 484
13. Finance costs
Interest expense for leasing arrangements 278 273 -
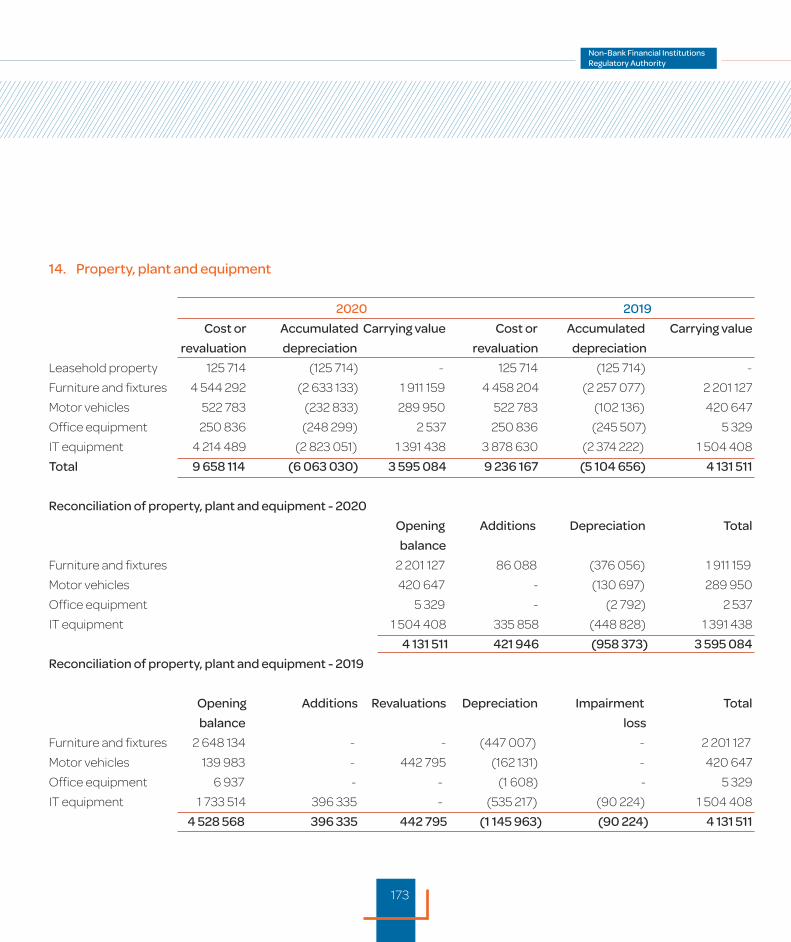
173
14. Property, plant and equipment
2020 2019
Cost or Accumulated Carrying value Cost or Accumulated Carrying value
revaluation depreciation revaluation depreciation
Leasehold property 125 714 (125 714) - 125 714 (125 714) -
Furniture and fixtures 4 544 292 (2 633 133) 1 911 159 4 458 204 (2 257 077) 2 201 127
Motor vehicles 522 783 (232 833) 289 950 522 783 (102 136) 420 647
Office equipment 250 836 (248 299) 2 537 250 836 (245 507) 5 329
IT equipment 4 214 489 (2 823 051) 1 391 438 3 878 630 (2 374 222) 1 504 408
Total 9 658 114 (6 063 030) 3 595 084 9 236 167 (5 104 656) 4 131 511
Reconciliation of property, plant and equipment - 2020
Opening Additions Depreciation Total
balance
Furniture and fixtures 2 201 127 86 088 (376 056) 1 911 159
Motor vehicles 420 647 - (130 697) 289 950
Office equipment 5 329 - (2 792) 2 537
IT equipment 1 504 408 335 858 (448 828) 1 391 438
4 131 511 421 946 (958 373) 3 595 084
Reconciliation of property, plant and equipment - 2019
Opening Additions Revaluations Depreciation Impairment Total
balance loss
Furniture and fixtures 2 648 134 - - (447 007) - 2 201 127
Motor vehicles 139 983 - 442 795 (162 131) - 420 647
Office equipment 6 937 - - (1 608) - 5 329
IT equipment 1 733 514 396 335 - (535 217) (90 224) 1 504 408
4 528 568 396 335 442 795 (1 145 963) (90 224) 4 131 511
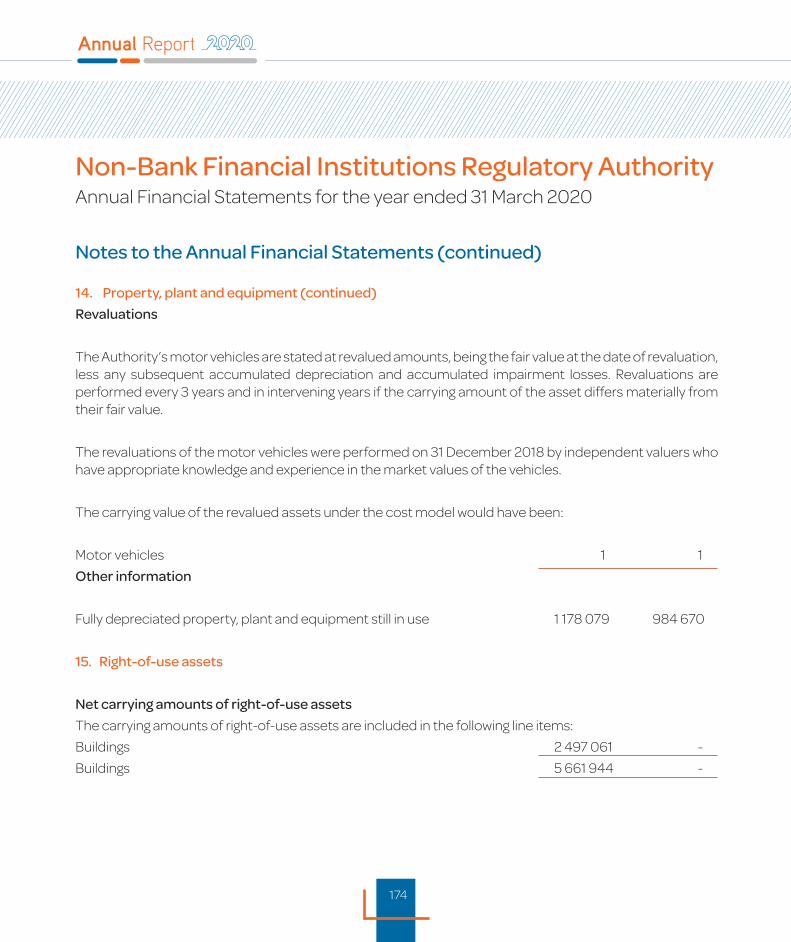
174
Non-Bank Financial Institutions Regulatory AuthorityAnnual Financial Statements for the year ended 31 March 2020
Notes to the Annual Financial Statements (continued)
14. Property, plant and equipment (continued)
Revaluations
The Authority’s motor vehicles are stated at revalued amounts, being the fair value at the date of revaluation, less any subsequent accumulated depreciation and accumulated impairment losses. Revaluations are performed every 3 years and in intervening years if the carrying amount of the asset differs materially from their fair value.
The revaluations of the motor vehicles were performed on 31 December 2018 by independent valuers who have appropriate knowledge and experience in the market values of the vehicles.
The carrying value of the revalued assets under the cost model would have been:
Motor vehicles 1 1
Other information
Fully depreciated property, plant and equipment still in use 1 178 079 984 670
15. Right-of-use assets
Net carrying amounts of right-of-use assets
The carrying amounts of right-of-use assets are included in the following line items:
Buildings 2 497 061 -
Buildings 5 661 944 -
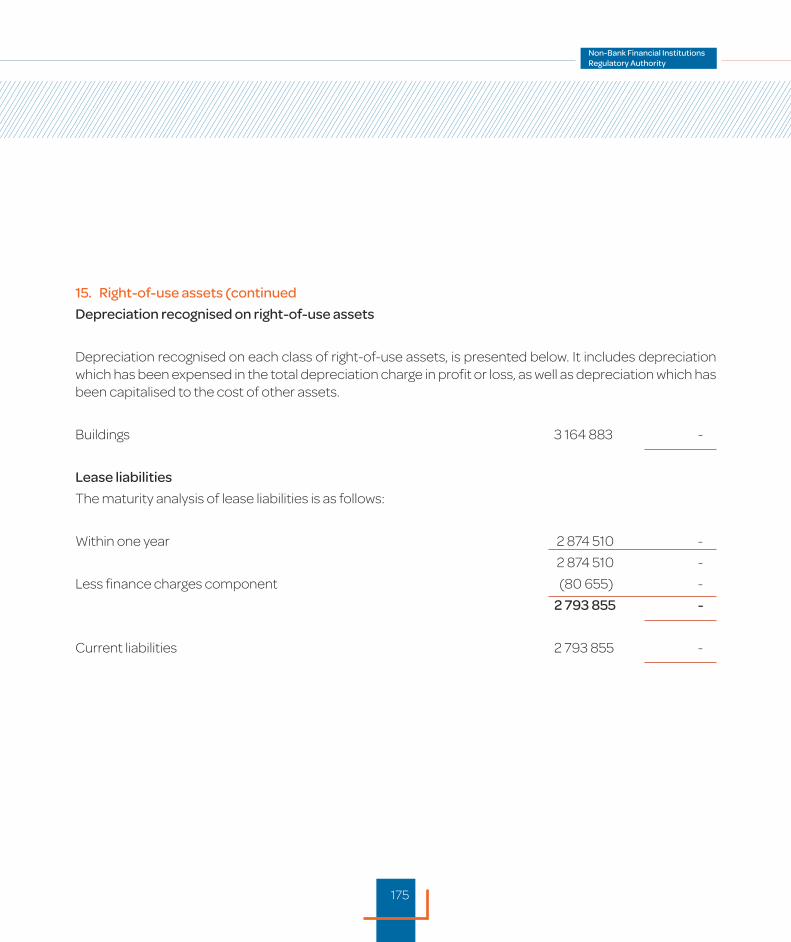
175
15. Right-of-use assets (continued
Depreciation recognised on right-of-use assets
Depreciation recognised on each class of right-of-use assets, is presented below. It includes depreciation which has been expensed in the total depreciation charge in profit or loss, as well as depreciation which has been capitalised to the cost of other assets.
Buildings 3 164 883 -
Lease liabilities
The maturity analysis of lease liabilities is as follows:
Within one year 2 874 510 -
2 874 510 -
Less finance charges component (80 655) -
2 793 855 -
Current liabilities 2 793 855 -
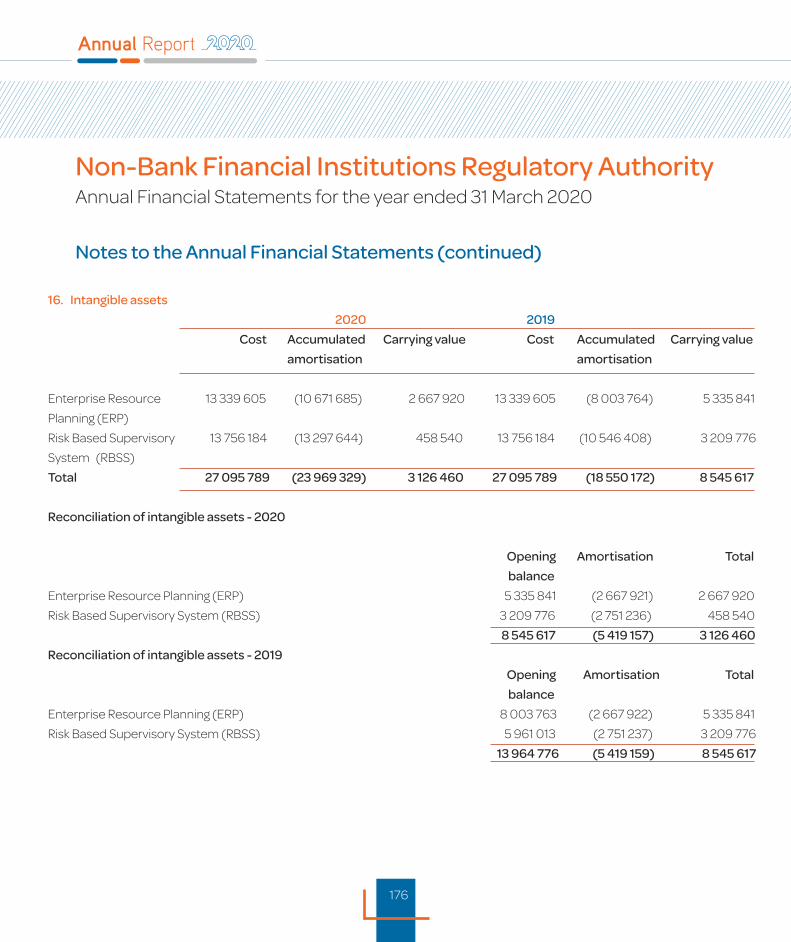
176
Non-Bank Financial Institutions Regulatory AuthorityAnnual Financial Statements for the year ended 31 March 2020
Notes to the Annual Financial Statements (continued)
16. Intangible assets
2020 2019
Cost Accumulated Carrying value Cost Accumulated Carrying value
amortisation amortisation
Enterprise Resource 13 339 605 (10 671 685) 2 667 920 13 339 605 (8 003 764) 5 335 841
Planning (ERP)
Risk Based Supervisory 13 756 184 (13 297 644) 458 540 13 756 184 (10 546 408) 3 209 776
System (RBSS)
Total 27 095 789 (23 969 329) 3 126 460 27 095 789 (18 550 172) 8 545 617
Reconciliation of intangible assets - 2020
Opening Amortisation Total
balance
Enterprise Resource Planning (ERP) 5 335 841 (2 667 921) 2 667 920
Risk Based Supervisory System (RBSS) 3 209 776 (2 751 236) 458 540
8 545 617 (5 419 157) 3 126 460
Reconciliation of intangible assets - 2019
Opening Amortisation Total
balance
Enterprise Resource Planning (ERP) 8 003 763 (2 667 922) 5 335 841
Risk Based Supervisory System (RBSS) 5 961 013 (2 751 237) 3 209 776
13 964 776 (5 419 159) 8 545 617
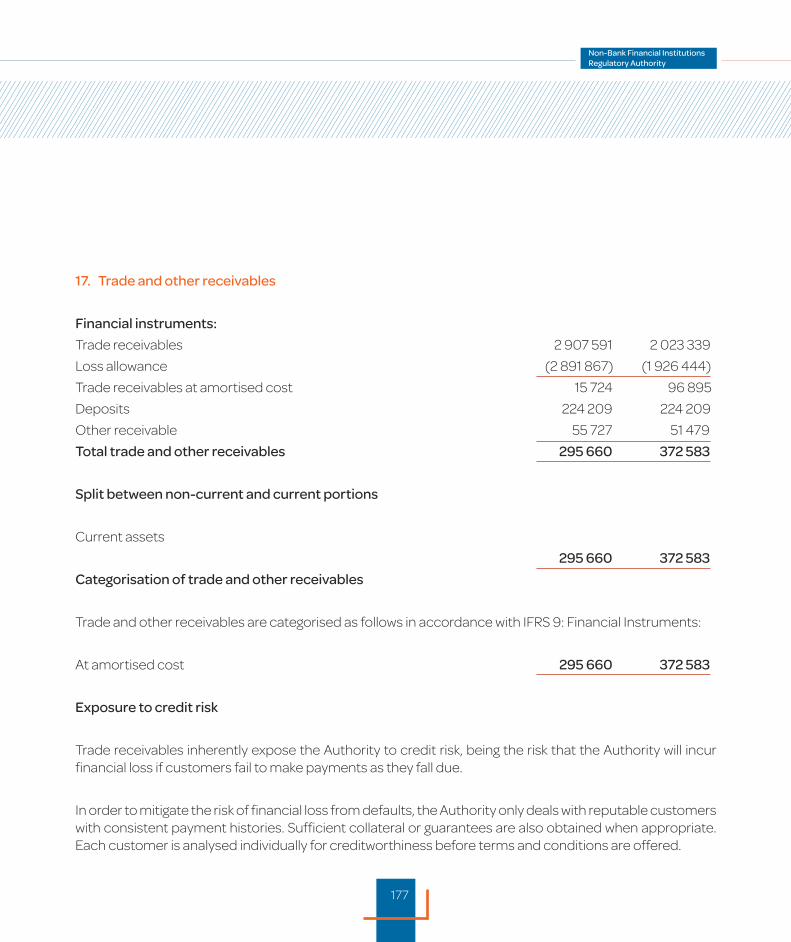
177
17. Trade and other receivables
Financial instruments:
Trade receivables 2 907 591 2 023 339
Loss allowance (2 891 867) (1 926 444)
Trade receivables at amortised cost 15 724 96 895
Deposits 224 209 224 209
Other receivable 55 727 51 479
Total trade and other receivables 295 660 372 583
Split between non-current and current portions
Current assets
295 660 372 583
Categorisation of trade and other receivables
Trade and other receivables are categorised as follows in accordance with IFRS 9: Financial Instruments:
At amortised cost 295 660 372 583
Exposure to credit risk
Trade receivables inherently expose the Authority to credit risk, being the risk that the Authority will incur financial loss if customers fail to make payments as they fall due.
In order to mitigate the risk of financial loss from defaults, the Authority only deals with reputable customers with consistent payment histories. Sufficient collateral or guarantees are also obtained when appropriate. Each customer is analysed individually for creditworthiness before terms and conditions are offered.
178
Non-Bank Financial Institutions Regulatory AuthorityAnnual Financial Statements for the year ended 31 March 2020
Notes to the Annual Financial Statements (continued)
17. Trade and other receivables (continued)
Exposure to credit risk
Statistical credit scoring models are used to analyse customers. These models make use of information submitted by the customers as well as external bureau data (where available). Customer credit limits are in place and are reviewed and approved by credit management committees. The exposure to credit risk and the creditworthiness of customers, is continuously monitored.
There have been no significant changes in the credit risk management policies and processes since the prior reporting period. Trade receivables arise from supervisory levies. The customer base is large and widespread, with a result that there is no specific significant concentration of credit risk from these trade receivables.
A loss allowance is recognised for all trade receivables, in accordance with IFRS 9 Financial Instruments, and is monitored at the end of each reporting period. In addition to the loss allowance, trade receivables are written off when there is no reasonable expectation of recovery, for example, when a debtor has been placed under liquidation. Trade receivables which have been written off are not subject to enforcement activities.
The Authority measures the loss allowance for trade receivables by applying the simplified approach which is prescribed by IFRS 9. In accordance with this approach, the loss allowance on trade receivables is determined as the lifetime expected credit losses on trade receivables. These lifetime expected credit losses are estimated using a provision matrix, which is presented below.
The provision matrix has been developed by making use of past default experience of debtors but also incorporates forward looking information and general economic conditions of the industry as at the reporting date.
The Authority’s historical credit loss experience does not show significantly different loss patterns for different customer segments. The provision for credit losses is therefore based on past due status without disaggregating into further risk profiles. The loss allowance provision is determined as follows:
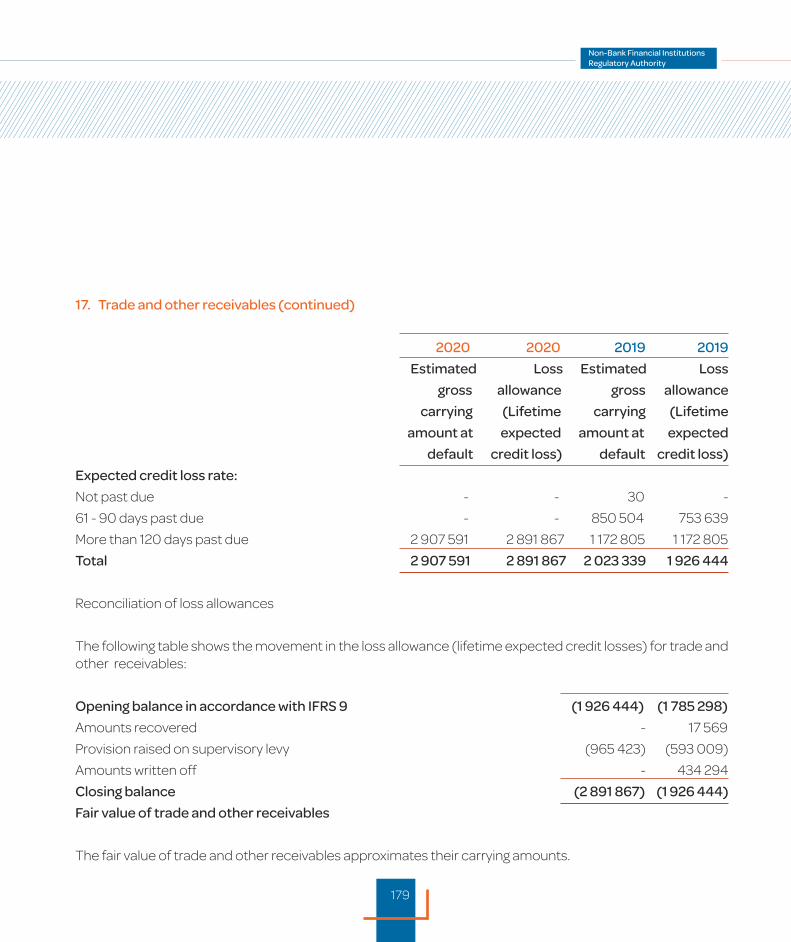
179
17. Trade and other receivables (continued)
2020 2020 2019 2019
Estimated Loss Estimated Loss
gross allowance gross allowance
carrying (Lifetime carrying (Lifetime
amount at expected amount at expected
default credit loss) default credit loss)
Expected credit loss rate:
Not past due - - 30 -
61 - 90 days past due - - 850 504 753 639
More than 120 days past due 2 907 591 2 891 867 1 172 805 1 172 805
Total 2 907 591 2 891 867 2 023 339 1 926 444
Reconciliation of loss allowances
The following table shows the movement in the loss allowance (lifetime expected credit losses) for trade and other receivables:
Opening balance in accordance with IFRS 9 (1 926 444) (1 785 298)
Amounts recovered - 17 569
Provision raised on supervisory levy (965 423) (593 009)
Amounts written off - 434 294
Closing balance (2 891 867) (1 926 444)
Fair value of trade and other receivables
The fair value of trade and other receivables approximates their carrying amounts.
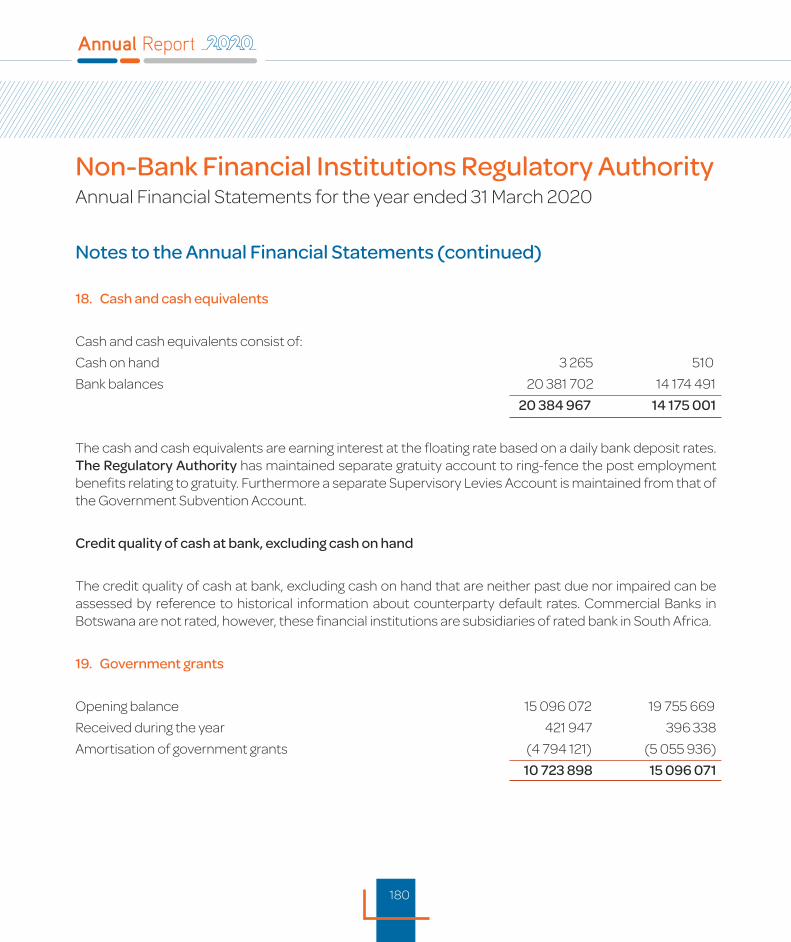
180
Non-Bank Financial Institutions Regulatory AuthorityAnnual Financial Statements for the year ended 31 March 2020
Notes to the Annual Financial Statements (continued)
18. Cash and cash equivalents
Cash and cash equivalents consist of:
Cash on hand 3 265 510
Bank balances 20 381 702 14 174 491
20 384 967 14 175 001
The cash and cash equivalents are earning interest at the floating rate based on a daily bank deposit rates. The Regulatory Authority has maintained separate gratuity account to ring-fence the post employment benefits relating to gratuity. Furthermore a separate Supervisory Levies Account is maintained from that of the Government Subvention Account.
Credit quality of cash at bank, excluding cash on hand
The credit quality of cash at bank, excluding cash on hand that are neither past due nor impaired can be assessed by reference to historical information about counterparty default rates. Commercial Banks in Botswana are not rated, however, these financial institutions are subsidiaries of rated bank in South Africa.
19. Government grants
Opening balance 15 096 072 19 755 669
Received during the year 421 947 396 338
Amortisation of government grants (4 794 121) (5 055 936)
10 723 898 15 096 071
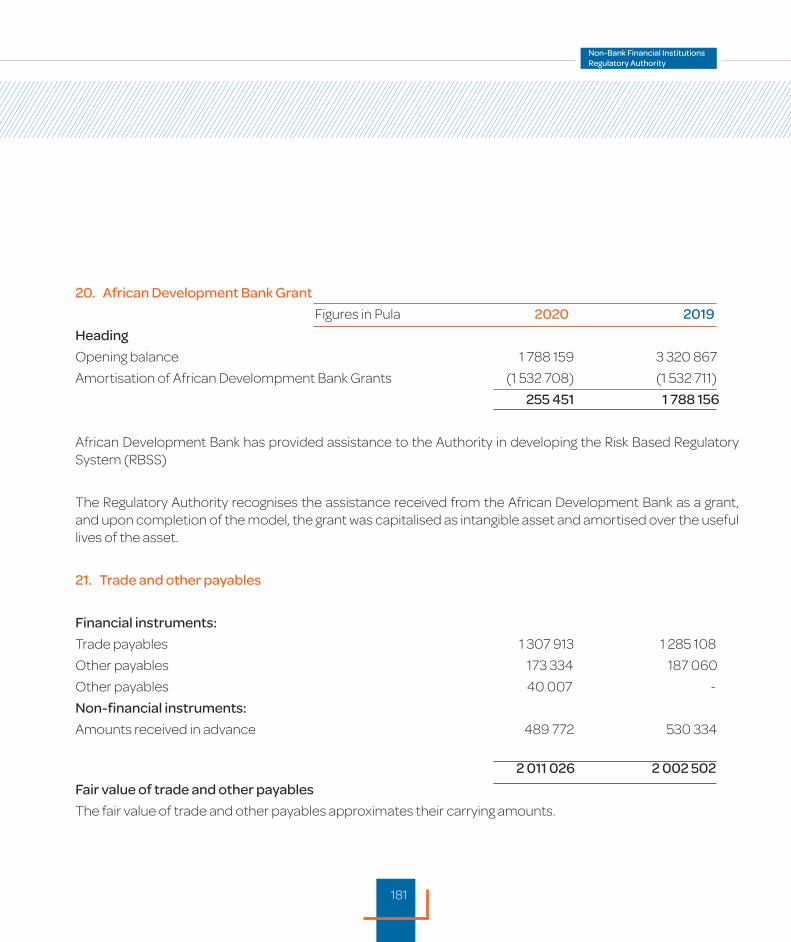
181
20. African Development Bank Grant
Figures in Pula 2020 2019
Heading
Opening balance 1 788 159 3 320 867
Amortisation of African Develompment Bank Grants (1 532 708) (1 532 711)
255 451 1 788 156
African Development Bank has provided assistance to the Authority in developing the Risk Based Regulatory System (RBSS)
The Regulatory Authority recognises the assistance received from the African Development Bank as a grant, and upon completion of the model, the grant was capitalised as intangible asset and amortised over the useful lives of the asset.
21. Trade and other payables
Financial instruments:
Trade payables 1 307 913 1 285 108
Other payables 173 334 187 060
Other payables 40 007 -
Non-financial instruments:
Amounts received in advance 489 772 530 334
2 011 026 2 002 502
Fair value of trade and other payables
The fair value of trade and other payables approximates their carrying amounts.
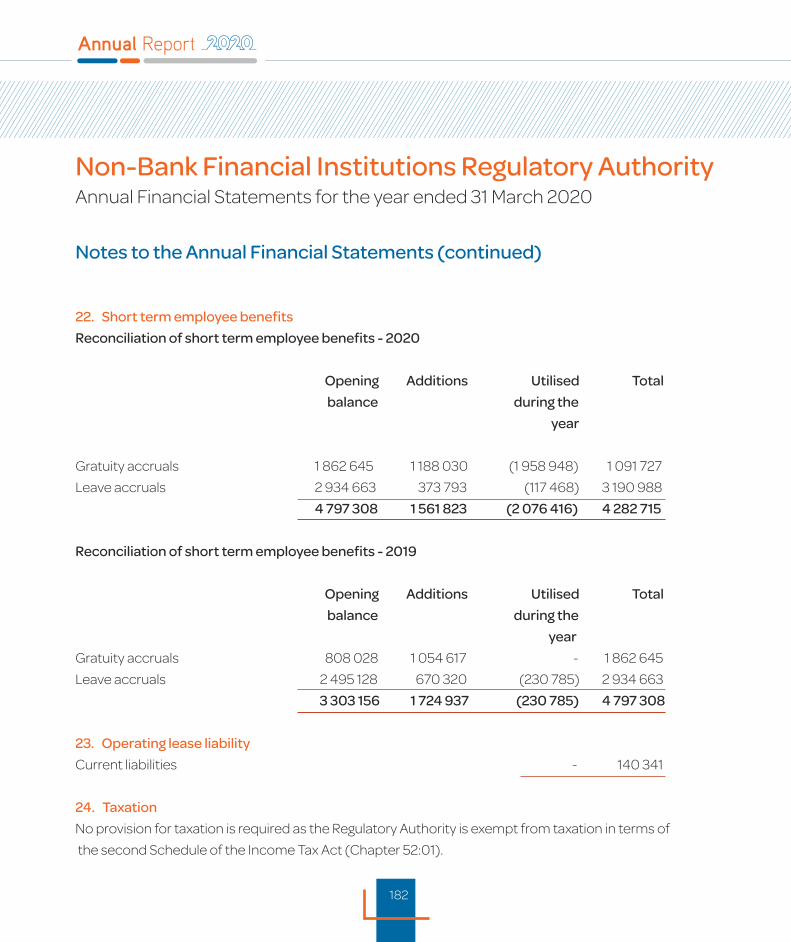
182
Non-Bank Financial Institutions Regulatory AuthorityAnnual Financial Statements for the year ended 31 March 2020
Notes to the Annual Financial Statements (continued)
22. Short term employee benefits
Reconciliation of short term employee benefits - 2020
Opening Additions Utilised Total
balance during the
year
Gratuity accruals 1 862 645 1 188 030 (1 958 948) 1 091 727
Leave accruals 2 934 663 373 793 (117 468) 3 190 988
4 797 308 1 561 823 (2 076 416) 4 282 715
Reconciliation of short term employee benefits - 2019
Opening Additions Utilised Total
balance during the
year
Gratuity accruals 808 028 1 054 617 - 1 862 645
Leave accruals 2 495 128 670 320 (230 785) 2 934 663
3 303 156 1 724 937 (230 785) 4 797 308
23. Operating lease liability
Current liabilities - 140 341
24. Taxation
No provision for taxation is required as the Regulatory Authority is exempt from taxation in terms of
the second Schedule of the Income Tax Act (Chapter 52:01).
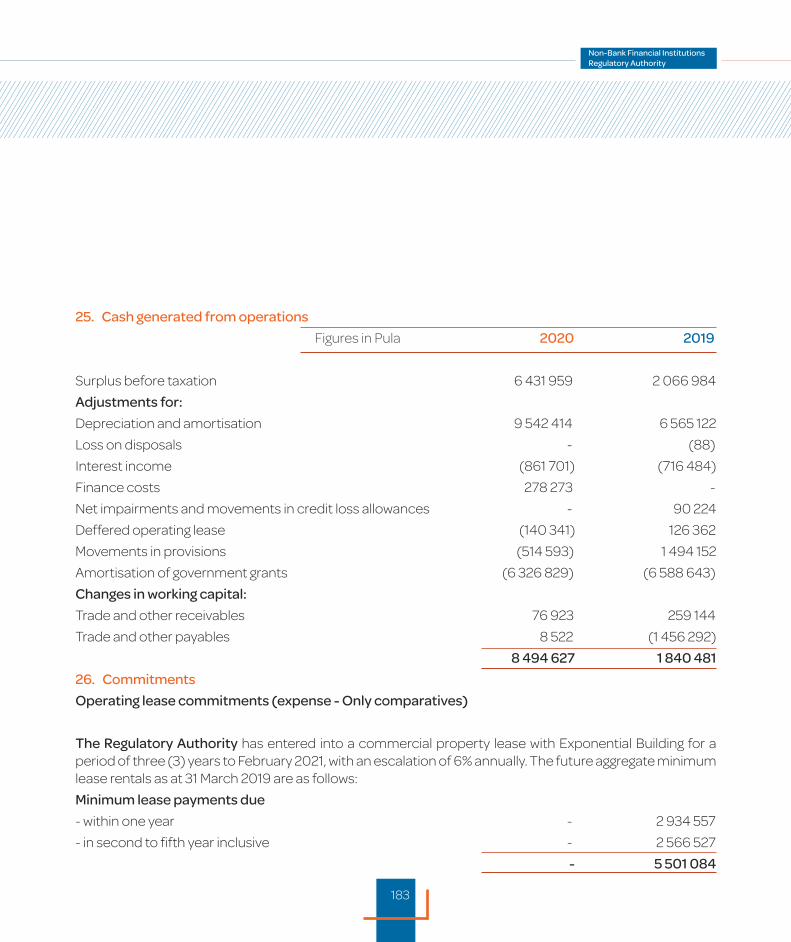
183
25. Cash generated from operations
Figures in Pula 2020 2019
Surplus before taxation 6 431 959 2 066 984
Adjustments for:
Depreciation and amortisation 9 542 414 6 565 122
Loss on disposals - (88)
Interest income (861 701) (716 484)
Finance costs 278 273 -
Net impairments and movements in credit loss allowances - 90 224
Deffered operating lease (140 341) 126 362
Movements in provisions (514 593) 1 494 152
Amortisation of government grants (6 326 829) (6 588 643)
Changes in working capital:
Trade and other receivables 76 923 259 144
Trade and other payables 8 522 (1 456 292)
8 494 627 1 840 481
26. Commitments
Operating lease commitments (expense - Only comparatives)
The Regulatory Authority has entered into a commercial property lease with Exponential Building for a period of three (3) years to February 2021, with an escalation of 6% annually. The future aggregate minimum lease rentals as at 31 March 2019 are as follows:
Minimum lease payments due
- within one year - 2 934 557
- in second to fifth year inclusive - 2 566 527
- 5 501 084

184
Non-Bank Financial Institutions Regulatory AuthorityAnnual Financial Statements for the year ended 31 March 2020
Notes to the Annual Financial Statements (continued)
27. Related parties
Relationships
The Regulatory Authority was set up by the Non-Bank Financial Institutions Regulatory Authority Act, 2016 and is therefore related to the Goverment of the Republic of Botswana. Transactions with relatedparties are in the normal course of business. The following transaction were carried out with related parties
Members of key management:
Mr Ramasedi (Tenure ended on February 28, 2020)
Mr Segage
Mr Gade (Acting CEO)
Ms Seromelo
Ms Modisa
Ms Masike
Ms Makepe
Mr Dumedisang
Mr Ncaagae
Mr Rampha
Ms Modongo
Ms White
Ms Raphaka
Ms Soko
Ms Mongati
Ms Chombah
Mr Bungile

185
27. Related parties (continued)
Related party transactions
Grants received
Government of the Republic of Botswana 20 400 000 18 864 910
Compensation to directors and other key management
Salary 14 328 781 13 224 166
Gratuity and pension 2 577 168 2 292 770
Other benefits 1 403 695 1 315 560
18 309 644 16 832 496
Compensation paid to key personnel of the Authority. The amounts presented comprise 17 executive staff members (2018: 18 executive staff members). Two of the members were on acting appointments.
28. Financial instruments and risk management
Categories of financial instruments
Categories of financial assets
2020
Note Amortised
cost
Trade and other receivables 17 295 660 295 660 295 660
Cash and cash equivalents 18 20 384 967 20 384 967 20 384 967
20 680 627 20 680 627 20 680 627
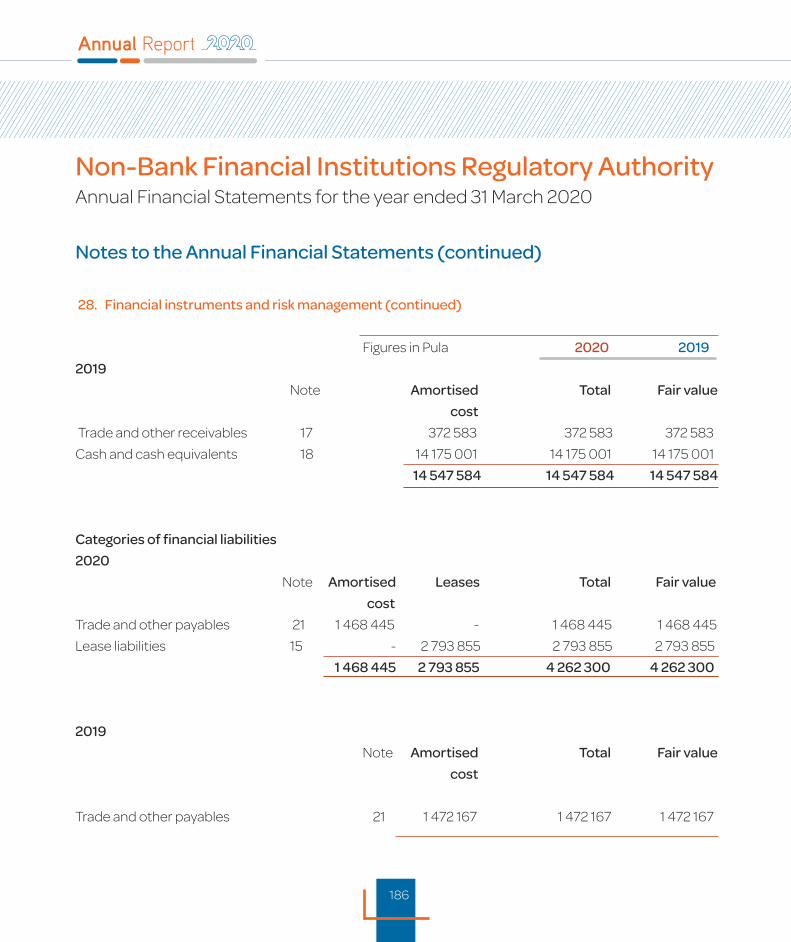
186
Non-Bank Financial Institutions Regulatory AuthorityAnnual Financial Statements for the year ended 31 March 2020
Notes to the Annual Financial Statements (continued)
28. Financial instruments and risk management (continued)
Figures in Pula 2020 2019
2019
Note Amortised Total Fair value
cost
Trade and other receivables 17 372 583 372 583 372 583
Cash and cash equivalents 18 14 175 001 14 175 001 14 175 001
14 547 584 14 547 584 14 547 584
Categories of financial liabilities
2020
Note Amortised Leases Total Fair value
cost
Trade and other payables 21 1 468 445 - 1 468 445 1 468 445
Lease liabilities 15 - 2 793 855 2 793 855 2 793 855
1 468 445 2 793 855 4 262 300 4 262 300
2019
Note Amortised Total Fair value
cost
Trade and other payables 21 1 472 167 1 472 167 1 472 167

187
28. Financial instruments and risk management (continued)
Risk management
Capital includes all funds and reserves as per the face of the statement of financial position. The Authority’s objective when managing funds are to safeguard its ability to continue as a going concern in order to perform the mandate for which it was created for. Management is of the view that these objective are being met. During 2019, the Authority did not have borrowings. The Regulatory Authority is supported by the licensed Non-Bank Financial Institutions and the Government of the Republic of Botswana, currently the necessary support is provided to sustain the operations of the Regulatory Authority. The NBFIRA Act stipulates that an annual estimate of the Regulatory Authority’s expenditure for a financial year shall include provision for a Statutory Reserve of not more than 10% of the total expenditure provided in the estimate.
Based on the regulatory Authority Act the current statutory reserve is adequate and in line with the provisions of the Act.
Financial risk management
Credit risk
The Regulatory Authority has exposure to credit risk, which is the risk that a counterparty will be unable to pay amounts in full when due. Credit risk is the risk that the regulated and supervised Non-Bank Financial Institutions and other counter parties will not be able or willing to pay or fulfil their obligations in accordance with Non-Bank Financial Institutions Regulatory Authority Act. The Authority uses reputable financial institutions for investing purposes.
All cash and cash equivalents are placed with financial institutions registered in Botswana.
The maximum exposure to credit risk is represented by the carrying amount of accounts receivable and cash and cash equivalents, as shown in the statement of financial position.
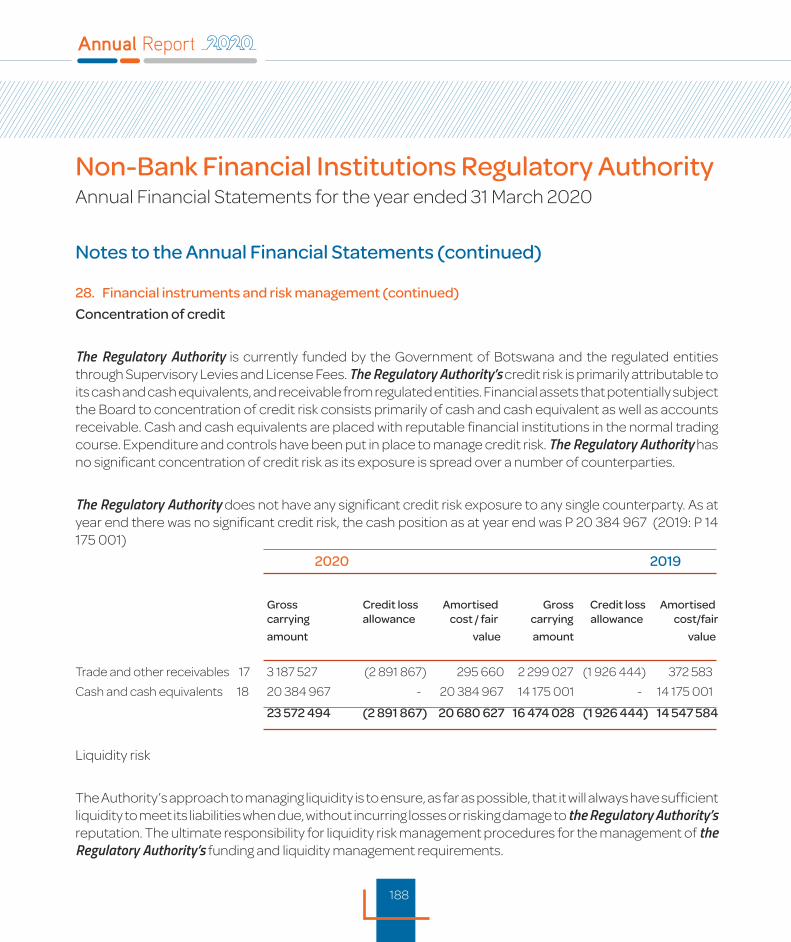
188
Non-Bank Financial Institutions Regulatory AuthorityAnnual Financial Statements for the year ended 31 March 2020
Notes to the Annual Financial Statements (continued)
28. Financial instruments and risk management (continued)
Concentration of credit
The Regulatory Authority is currently funded by the Government of Botswana and the regulated entities through Supervisory Levies and License Fees. The Regulatory Authority’s credit risk is primarily attributable to its cash and cash equivalents, and receivable from regulated entities. Financial assets that potentially subject the Board to concentration of credit risk consists primarily of cash and cash equivalent as well as accounts receivable. Cash and cash equivalents are placed with reputable financial institutions in the normal trading course. Expenditure and controls have been put in place to manage credit risk. The Regulatory Authority has no significant concentration of credit risk as its exposure is spread over a number of counterparties.
The Regulatory Authority does not have any significant credit risk exposure to any single counterparty. As at year end there was no significant credit risk, the cash position as at year end was P 20 384 967 (2019: P 14 175 001)
2020 2019
Gross Credit loss Amortised Gross Credit loss Amortised carrying allowance cost / fair carrying allowance cost/fair
amount value amount value
Trade and other receivables 17 3 187 527 (2 891 867) 295 660 2 299 027 (1 926 444) 372 583
Cash and cash equivalents 18 20 384 967 - 20 384 967 14 175 001 - 14 175 001
23 572 494 (2 891 867) 20 680 627 16 474 028 (1 926 444) 14 547 584
Liquidity risk
The Authority’s approach to managing liquidity is to ensure, as far as possible, that it will always have sufficient liquidity to meet its liabilities when due, without incurring losses or risking damage to the Regulatory Authority’s reputation. The ultimate responsibility for liquidity risk management procedures for the management of the Regulatory Authority’s funding and liquidity management requirements.

189
28. Financial instruments and risk management (continued)
The Regulatory Authority manages liquidity risk by maintaining adequate cash and cash equivalents to settle liabilities when they become due, by continuously monitoring forecasts actual cash flows, and by matching the Government Subvention to the maturity profile of the financial liabilities.
The following table summarises the maturity profile of the Regulatory Authority’s financial liabilities as at 31 March 2020 based on contractual undiscounted payments:
2020
Less than Total Carrying
1 year amount
Current liabilities
Trade and other payables 1 468 445 1 468 445 1 521 256
Lease liabilities - - 2 793 855
2019
Current liabilities
Trade and other payables 21 1 472 167 1 472 167 1 472 167
Interest rate risk
Financial instruments that are sensitive to interest rate risk are bank balances and cash (refer to note 15). Interest rates applicable to these financial instruments compare favourably with those currently available in the market. The following table demonstrates the sensitivity to a reasonable possible change in interest rates at reporting date, with all other variables held constant, of the Regulatory Authority’s (deficit)/surplus for the year (through the impact on floating rate financial instruments), funds and reserves at reporting date. The reasonable possible change is based on past trends of interest and expected future changes. The impact was calculated by applying the reasonable changes to the exposures at reporting date, and with reference to the next 12 months. There is no other direct impact on the Regulatory Authority’s funds and reserves.

190
Non-Bank Financial Institutions Regulatory AuthorityAnnual Financial Statements for the year ended 31 March 2020
Notes to the Annual Financial Statements (continued)
28. Financial instruments and risk management (continued)
Heading
Increase of 0.5% in interest rate 90 515 69 995
Decrease of 2% in interest (362 059) (279 981)
(271 544) (209 986)
29. Events after the reporting period
The impact of the COVID-19 virus on our business continues to evolve. At the date of finalization of the annual financial statements, there were no material events that occurred subsequent to the statement of financial position date that require adjustment to the financial statements. The following material subsequent events however requires disclosure in the financial statements.
On 11 March 2020, the World Health Organization declared the Coronavirus COVID-19 outbreak a global pandemic. This situation continues to advance and is being monitored with various corrective and preventive measures as detailed below:
> requiring self-isolation quarantine by those potentially affected,
> implementing social distancing measures, and
> controlling or closing borders and “locking-down” cities/regions or even entire countries.
191
29. Events after the reporting period (continued)
The pandemic is an extraordinary challenge for humanity and for the economy globally, and at the date of finalization of the financial statements its effects are subject to significant levels of uncertainty. The impact of the coronavirus will be closely monitored and assessed for its impact on the business. The company has undertaken a variety of measures and implemented contingency plans to mitigate the negative impact of the Covid-19 pandemic. The response plan covers operational and credit risk responses to ensure that the company will be able to operate and service clients.Considering the above, management has re-assessed the appropriateness of the use of the going concern assumption in the preparation of these financial statements.
Based on the assessment performed, management is of the view that the significant doubt associated with the current uncertainties related to the Covid-19 virus currently does not result in a material uncertainty related to such events or conditions that may cast significant doubt on the company’s ability to continue as a going concern. The directors agrees with this assessment.

192
Non-Bank Financial Institutions Regulatory AuthorityAnnual Financial Statements for the year ended 31 March 2020
Detailed Income Statement
Figures in Pula Note(s) 2020 2019
Revenue
Government grants 19 978 053 18 468 572
Supervisory levies 58 766 691 50 845 452
Total revenue 78 744 744 69 314 024
Other operating income
Other income 907 671 1 169 486
Amortisation of Capital Grants 5 419 158 5 419 158
5 6 326 829 6 588 644
Other operating gains (losses)
Other operating income 2 604 811 2 834 409
Expenses (Refer to page 38) (81 827 853) (77 386 577)
Operating surplus 5 848 531 1 350 500
Finance income 12 861 701 716 484
Finance costs 13 (278 273) -
Surplus for the year 6 431 959 2 066 984

193
Figures in Pula Note(s) 2020 2019
Other operating expenses Advertising (73 570) (54 187)Amortisation (5 419 158) ( 5 419 159)Auditors remuneration (108 622) (119 750)Bad debts (965 423) (593 009)Bank charges (58 827) (54 210)Cleaning (199 133) (193 879)Branding and communications (1 371 837) (946 877)Cleaning (627 648) (627 648)Consulting and professional fees (1 914 144) (616 085)Consulting and professional fees - legal fees (840 707) (4 020 833)Board fees (286 882) (249 758)Depreciation (4 123 256) (1 145 963)Employee costs (54 361 666) (49 574 012)Office expenses (7 224) (30 592)Recruitment (126 821) (195 127)Strategy expenses (313 055) (327 491)Impairment - (90 224)Insurance (441 263) (393 450)Lease rentals on operating lease - (3 227 026)Motor vehicle expenses (27 884) (27 584)Utilities (553 986) (534 048)Recruitment (365 617) (419 824)Repairs and maintenance (390 931) (218 251)License fees (4 141 538) (3 124 411)Security (125 725) (264 830)Uniform (791 459) (515 331)Subscriptions (909 610) (701 174)Telephone and fax (674 946) (627 176)Training (1 184 563) (1 717 714)Travel (1 422 358) (1 356 954) (81 827 853) (77 386 577)
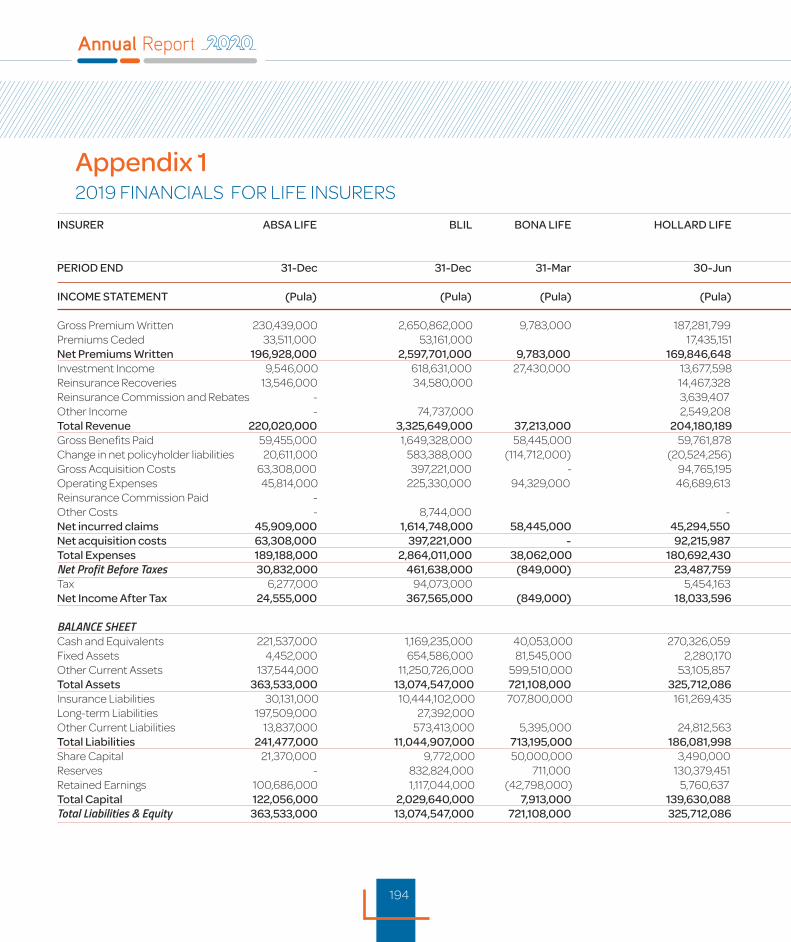
194
Appendix 1 2019 FINANCIALS FOR LIFE INSURERS
INSURER ABSA LIFE BLIL BONA LIFE HOLLARD LIFE LIBERTY LIFE METROPOLITAN LIFE OLD MUTUAL LIFE WESTERN LIFE TOTALS INSURANCE BOTSWANA PERIOD END 31-Dec 31-Dec 31-Mar 30-Jun 31-Dec 30-Jun 31-Dec 28-Feb ****** INCOME STATEMENT (Pula) (Pula) (Pula) (Pula) (Pula) (Pula) (Pula) (Pula) (Pula) Gross Premium Written 230,439,000 2,650,862,000 9,783,000 187,281,799 186,595,343 564,644,000 25,758,209 689,955 3,856,053,306 Premiums Ceded 33,511,000 53,161,000 17,435,151 5,619,589 8,879,000 5,385,451 15,970 124,007,161 Net Premiums Written 196,928,000 2,597,701,000 9,783,000 169,846,648 180,975,754 555,765,000 31,143,660 673,985 3,742,817,047 Investment Income 9,546,000 618,631,000 27,430,000 13,677,598 4,966,334 77,500,000 1,129,353 3,940 752,884,225 Reinsurance Recoveries 13,546,000 34,580,000 14,467,328 1,498,697 3,854,000 1,082,025 - 69,028,050 Reinsurance Commission and Rebates - 3,639,407 - - - 3,639,407 Other Income - 74,737,000 2,549,208 5,411,227 15,436,000 - - 98,133,435 Total Revenue 220,020,000 3,325,649,000 37,213,000 204,180,189 192,852,012 652,555,000 33,355,038 677,925 4,666,502,164 Gross Benefits Paid 59,455,000 1,649,328,000 58,445,000 59,761,878 28,512,953 279,278,000 12,721,208 - 2,147,502,039 Change in net policyholder liabilities 20,611,000 583,388,000 (114,712,000) (20,524,256) 43,512,646 103,006,000 1,189,715 616,471,105 Gross Acquisition Costs 63,308,000 397,221,000 - 94,765,195 66,477,180 147,508,000 1,781,574 49,518 771,110,467 Operating Expenses 45,814,000 225,330,000 94,329,000 46,689,613 25,257,120 77,576,000 14,454,112 5,160,690 534,610,535 Reinsurance Commission Paid - - - - - Other Costs - 8,744,000 - - 1,991,000 16,104,083 - 26,839,083 Net incurred claims 45,909,000 1,614,748,000 58,445,000 45,294,550 27,014,256 275,424,000 11,639,183 - 2,078,473,989 Net acquisition costs 63,308,000 397,221,000 - 92,215,987 66,477,180 147,508,000 1,781,574 49,518 768,561,259 Total Expenses 189,188,000 2,864,011,000 38,062,000 180,692,430 163,759,899 609,359,000 45,060,977 6,399,923 4,096,533,229 Net Profit Before Taxes 30,832,000 461,638,000 (849,000) 23,487,759 29,092,113 43,196,000 (11,705,939) (5,722,010) 569,968,923 Tax 6,277,000 94,073,000 5,454,163 6,421,194 7,897,000 - (1,258,320) 118,864,037 Net Income After Tax 24,555,000 367,565,000 (849,000) 18,033,596 22,670,919 35,299,000 (11,705,939) (4,463,690) 451,104,886 BALANCE SHEET Cash and Equivalents 221,537,000 1,169,235,000 40,053,000 270,326,059 17,808,732 298,959,000 41,228,692 10,039,912 2,069,187,395 Fixed Assets 4,452,000 654,586,000 81,545,000 2,280,170 243,630,049 1,851,000 184,512 1,108,221 989,636,952 Other Current Assets 137,544,000 11,250,726,000 599,510,000 53,105,857 8,440,333 2,055,297,000 17,802,981 1,540,382 14,123,966,553 Total Assets 363,533,000 13,074,547,000 721,108,000 325,712,086 269,879,114 2,356,107,000 59,216,185 12,688,515 17,182,790,900 Insurance Liabilities 30,131,000 10,444,102,000 707,800,000 161,269,435 180,204,665 1,820,555,000 18,282,461 1,189,715 13,363,534,276 Long-term Liabilities 197,509,000 27,392,000 1,176,468 5,284,000 19,199,563 - 250,561,031 Other Current Liabilities 13,837,000 573,413,000 5,395,000 24,812,563 20,783,203 164,096,000 11,768,658 962,472 815,067,896 Total Liabilities 241,477,000 11,044,907,000 713,195,000 186,081,998 202,164,336 1,989,935,000 49,250,682 2,152,187 14,429,163,203 Share Capital 21,370,000 9,772,000 50,000,000 3,490,000 13,258,347 83,271,000 45,000,000 15,000,000 311,161,347 Reserves - 832,824,000 711,000 130,379,451 27,750,970 34,269,000 - - 1,025,934,421 Retained Earnings 100,686,000 1,117,044,000 (42,798,000) 5,760,637 26,705,461 248,632,000 (35,034,497) (4,463,672) 1,416,531,929 Total Capital 122,056,000 2,029,640,000 7,913,000 139,630,088 67,714,778 366,172,000 9,965,503 10,536,328 2,753,627,697 Total Liabilities & Equity 363,533,000 13,074,547,000 721,108,000 325,712,086 269,879,114 2,356,107,000 59,216,185 12,688,515 17,182,790,900
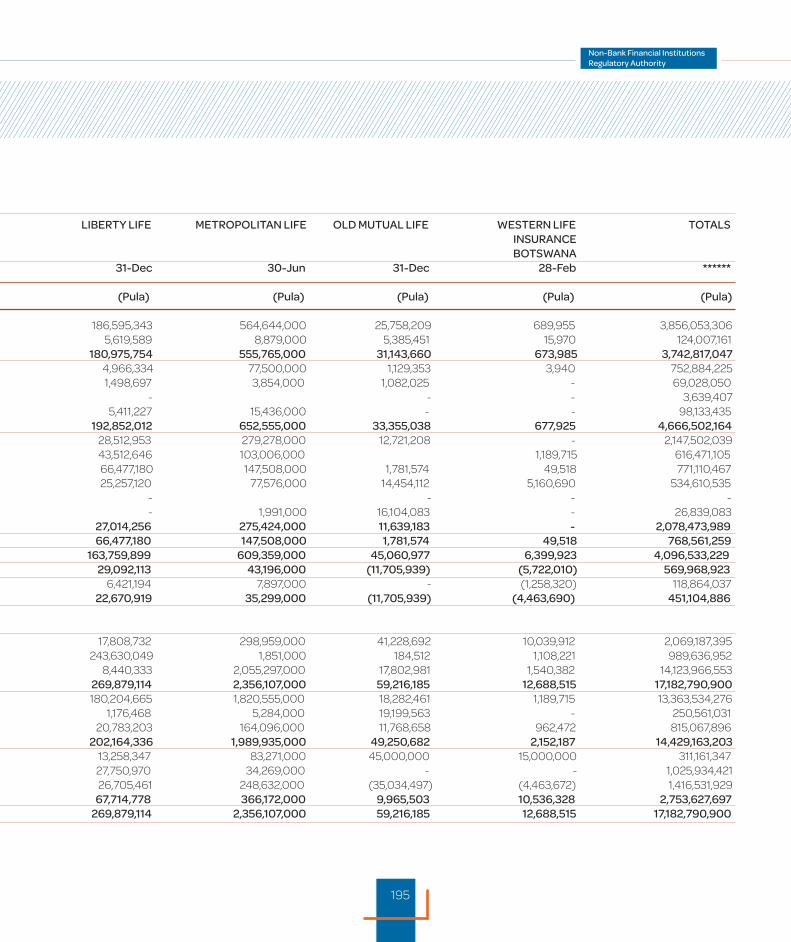
195
INSURER ABSA LIFE BLIL BONA LIFE HOLLARD LIFE LIBERTY LIFE METROPOLITAN LIFE OLD MUTUAL LIFE WESTERN LIFE TOTALS INSURANCE BOTSWANA PERIOD END 31-Dec 31-Dec 31-Mar 30-Jun 31-Dec 30-Jun 31-Dec 28-Feb ****** INCOME STATEMENT (Pula) (Pula) (Pula) (Pula) (Pula) (Pula) (Pula) (Pula) (Pula) Gross Premium Written 230,439,000 2,650,862,000 9,783,000 187,281,799 186,595,343 564,644,000 25,758,209 689,955 3,856,053,306 Premiums Ceded 33,511,000 53,161,000 17,435,151 5,619,589 8,879,000 5,385,451 15,970 124,007,161 Net Premiums Written 196,928,000 2,597,701,000 9,783,000 169,846,648 180,975,754 555,765,000 31,143,660 673,985 3,742,817,047 Investment Income 9,546,000 618,631,000 27,430,000 13,677,598 4,966,334 77,500,000 1,129,353 3,940 752,884,225 Reinsurance Recoveries 13,546,000 34,580,000 14,467,328 1,498,697 3,854,000 1,082,025 - 69,028,050 Reinsurance Commission and Rebates - 3,639,407 - - - 3,639,407 Other Income - 74,737,000 2,549,208 5,411,227 15,436,000 - - 98,133,435 Total Revenue 220,020,000 3,325,649,000 37,213,000 204,180,189 192,852,012 652,555,000 33,355,038 677,925 4,666,502,164 Gross Benefits Paid 59,455,000 1,649,328,000 58,445,000 59,761,878 28,512,953 279,278,000 12,721,208 - 2,147,502,039 Change in net policyholder liabilities 20,611,000 583,388,000 (114,712,000) (20,524,256) 43,512,646 103,006,000 1,189,715 616,471,105 Gross Acquisition Costs 63,308,000 397,221,000 - 94,765,195 66,477,180 147,508,000 1,781,574 49,518 771,110,467 Operating Expenses 45,814,000 225,330,000 94,329,000 46,689,613 25,257,120 77,576,000 14,454,112 5,160,690 534,610,535 Reinsurance Commission Paid - - - - - Other Costs - 8,744,000 - - 1,991,000 16,104,083 - 26,839,083 Net incurred claims 45,909,000 1,614,748,000 58,445,000 45,294,550 27,014,256 275,424,000 11,639,183 - 2,078,473,989 Net acquisition costs 63,308,000 397,221,000 - 92,215,987 66,477,180 147,508,000 1,781,574 49,518 768,561,259 Total Expenses 189,188,000 2,864,011,000 38,062,000 180,692,430 163,759,899 609,359,000 45,060,977 6,399,923 4,096,533,229 Net Profit Before Taxes 30,832,000 461,638,000 (849,000) 23,487,759 29,092,113 43,196,000 (11,705,939) (5,722,010) 569,968,923 Tax 6,277,000 94,073,000 5,454,163 6,421,194 7,897,000 - (1,258,320) 118,864,037 Net Income After Tax 24,555,000 367,565,000 (849,000) 18,033,596 22,670,919 35,299,000 (11,705,939) (4,463,690) 451,104,886 BALANCE SHEET Cash and Equivalents 221,537,000 1,169,235,000 40,053,000 270,326,059 17,808,732 298,959,000 41,228,692 10,039,912 2,069,187,395 Fixed Assets 4,452,000 654,586,000 81,545,000 2,280,170 243,630,049 1,851,000 184,512 1,108,221 989,636,952 Other Current Assets 137,544,000 11,250,726,000 599,510,000 53,105,857 8,440,333 2,055,297,000 17,802,981 1,540,382 14,123,966,553 Total Assets 363,533,000 13,074,547,000 721,108,000 325,712,086 269,879,114 2,356,107,000 59,216,185 12,688,515 17,182,790,900 Insurance Liabilities 30,131,000 10,444,102,000 707,800,000 161,269,435 180,204,665 1,820,555,000 18,282,461 1,189,715 13,363,534,276 Long-term Liabilities 197,509,000 27,392,000 1,176,468 5,284,000 19,199,563 - 250,561,031 Other Current Liabilities 13,837,000 573,413,000 5,395,000 24,812,563 20,783,203 164,096,000 11,768,658 962,472 815,067,896 Total Liabilities 241,477,000 11,044,907,000 713,195,000 186,081,998 202,164,336 1,989,935,000 49,250,682 2,152,187 14,429,163,203 Share Capital 21,370,000 9,772,000 50,000,000 3,490,000 13,258,347 83,271,000 45,000,000 15,000,000 311,161,347 Reserves - 832,824,000 711,000 130,379,451 27,750,970 34,269,000 - - 1,025,934,421 Retained Earnings 100,686,000 1,117,044,000 (42,798,000) 5,760,637 26,705,461 248,632,000 (35,034,497) (4,463,672) 1,416,531,929 Total Capital 122,056,000 2,029,640,000 7,913,000 139,630,088 67,714,778 366,172,000 9,965,503 10,536,328 2,753,627,697 Total Liabilities & Equity 363,533,000 13,074,547,000 721,108,000 325,712,086 269,879,114 2,356,107,000 59,216,185 12,688,515 17,182,790,900
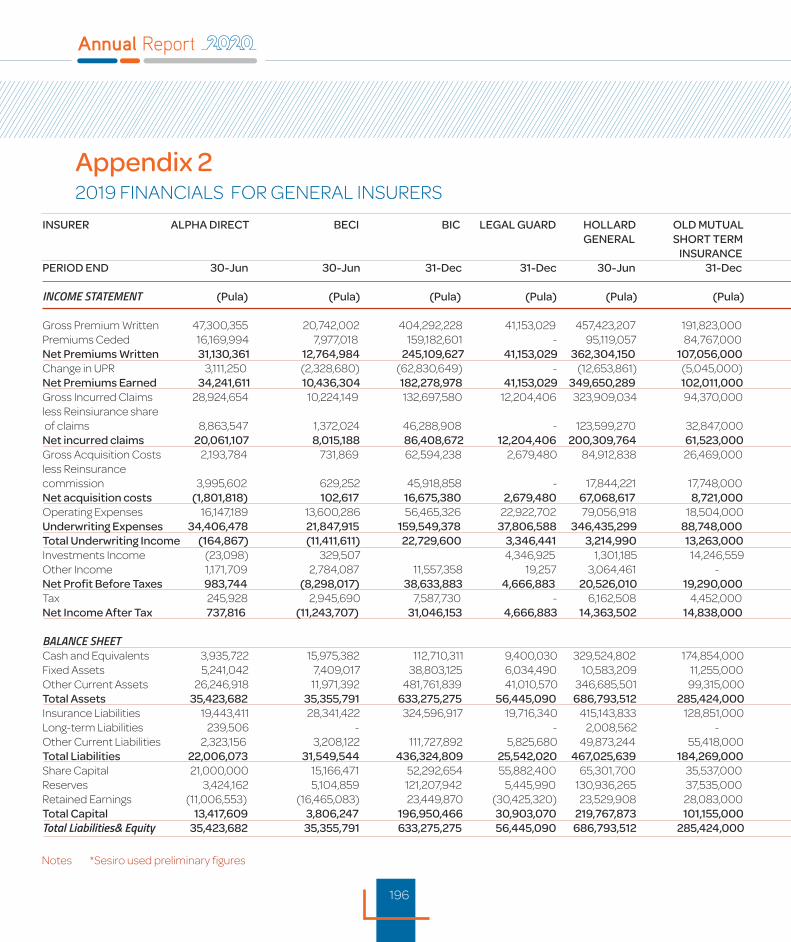
196
Appendix 22019 FINANCIALS FOR GENERAL INSURERS
Notes *Sesiro used preliminary figures
INSURER ALPHA DIRECT BECI BIC LEGAL GUARD HOLLARD OLD MUTUAL PHOENIX LIBERTY SESIRO SUNSHINE BRYTE WESTERN TOTALS GENERAL SHORT TERM GENERAL INSURANCE INSURANCE PERIOD END 30-Jun 30-Jun 31-Dec 31-Dec 30-Jun 31-Dec 31-Dec 31-Dec 31-Dec 30-Jun 31-Dec 28-Feb ****** INCOME STATEMENT (Pula) (Pula) (Pula) (Pula) (Pula) (Pula) (Pula) (Pula) (Pula) (Pula) (Pula) (Pula) (Pula) Gross Premium Written 47,300,355 20,742,002 404,292,228 41,153,029 457,423,207 191,823,000 14,898,965 2,668,863 148,238,147 14,307,279 148,668,000 10,686,420 1,502,201,495 Premiums Ceded 16,169,994 7,977,018 159,182,601 - 95,119,057 84,767,000 3,440,959 1,893,530 124,373,698 3,940,444 47,726,000 6,490,740 551,081,041 Net Premiums Written 31,130,361 12,764,984 245,109,627 41,153,029 362,304,150 107,056,000 11,458,006 775,333 23,864,449 10,366,835 100,942,000 4,195,680 951,120,454 Change in UPR 3,111,250 (2,328,680) (62,830,649) - (12,653,861) (5,045,000) (2,340,850) (331,848) 3,481,408 632,544 10,537,000 (2,275,530) (70,044,216)Net Premiums Earned 34,241,611 10,436,304 182,278,978 41,153,029 349,650,289 102,011,000 9,117,156 443,485 27,345,857 10,999,379 111,479,000 1,920,150 881,076,238 Gross Incurred Claims 28,924,654 10,224,149 132,697,580 12,204,406 323,909,034 94,370,000 4,721,823 2,732,240 20,787,093 4,696,478 115,220,000 5,195,587 755,683,044 less Reinsiurance share of claims 8,863,547 1,372,024 46,288,908 - 123,599,270 32,847,000 1,632,647 1,182,267 7,272,285 - 43,987,000 3,125,237 270,170,185 Net incurred claims 20,061,107 8,015,188 86,408,672 12,204,406 200,309,764 61,523,000 3,831,906 1,549,973 13,514,808 4,696,478 71,233,000 2,070,350 485,418,652 Gross Acquisition Costs 2,193,784 731,869 62,594,238 2,679,480 84,912,838 26,469,000 1,413,447 322,269 - 710,212 27,626,000 533,675 210,186,812 less Reinsurance commission 3,995,602 629,252 45,918,858 - 17,844,221 17,748,000 (345,944) 411,728 15,710,740 - 11,304,000 871,578 114,088,035 Net acquisition costs (1,801,818) 102,617 16,675,380 2,679,480 67,068,617 8,721,000 1,759,391 (89,459) (15,710,740) 710,212 16,322,000 (337,903) 96,098,777 Operating Expenses 16,147,189 13,600,286 56,465,326 22,922,702 79,056,918 18,504,000 4,155,647 8,322,772 13,030,703 6,673,481 20,899,000 6,763,802 266,541,826 Underwriting Expenses 34,406,478 21,847,915 159,549,378 37,806,588 346,435,299 88,748,000 9,746,944 9,783,286 10,834,771 12,080,171 108,454,000 8,496,249 848,189,079 Total Underwriting Income (164,867) (11,411,611) 22,729,600 3,346,441 3,214,990 13,263,000 (629,788) (9,339,801) 16,511,086 (1,080,792) 3,025,000 (6,576,099) 32,887,159 Investments Income (23,098) 329,507 4,346,925 1,301,185 14,246,559 6,027,000 32,364 616,278 3,188,115 9,120,000 4,246 39,189,081 Other Income 1,171,709 2,784,087 11,557,358 19,257 3,064,461 - 1,007,749 (97,104) 2,943,641 2,104,510 1,600,000 - 26,155,668 Net Profit Before Taxes 983,744 (8,298,017) 38,633,883 4,666,883 20,526,010 19,290,000 410,325 (8,820,627) 22,642,842 1,023,718 13,745,000 (6,571,853) 98,231,908 Tax 245,928 2,945,690 7,587,730 - 6,162,508 4,452,000 356,162 1,719,692 3,330,547 287,090 5,786,000 (1,443,535) 31,429,812 Net Income After Tax 737,816 (11,243,707) 31,046,153 4,666,883 14,363,502 14,838,000 54,163 (10,540,319) 19,312,295 736,628 7,959,000 (5,128,318) 66,802,096 BALANCE SHEET Cash and Equivalents 3,935,722 15,975,382 112,710,311 9,400,030 329,524,802 174,854,000 12,935,337 721,674 105,941,666 15,888,435 34,652,000 13,730,920 830,270,279 Fixed Assets 5,241,042 7,409,017 38,803,125 6,034,490 10,583,209 11,255,000 1,736,519 1,875,589 - 3,087,745 6,915,000 925,220 93,865,956 Other Current Assets 26,246,918 11,971,392 481,761,839 41,010,570 346,685,501 99,315,000 7,365,913 14,293,360 90,908,710 13,772,862 200,316,000 12,306,000 1,345,954,065 Total Assets 35,423,682 35,355,791 633,275,275 56,445,090 686,793,512 285,424,000 22,037,769 16,890,623 196,850,376 32,749,042 241,883,000 26,962,140 2,270,090,300 Insurance Liabilities 19,443,411 28,341,422 324,596,917 19,716,340 415,143,833 128,851,000 9,736,210 1,797,279 37,124,855 24,075,007 135,040,000 13,301,650 1,157,167,924 Long-term Liabilities 239,506 - - 2,008,562 - - - 517,887 - - 2,765,955 Other Current Liabilities 2,323,156 3,208,122 111,727,892 5,825,680 49,873,244 55,418,000 3,870,529 3,430,817 85,968,426 213,608 11,977,000 3,788,640 337,625,114 Total Liabilities 22,006,073 31,549,544 436,324,809 25,542,020 467,025,639 184,269,000 13,606,739 5,228,096 123,611,168 24,288,615 147,017,000 17,090,290 1,497,558,993 Share Capital 21,000,000 15,166,471 52,292,654 55,882,400 65,301,700 35,537,000 12,746,586 9,941,016 8,050,092 5,000,000 19,105,000 15,000,000 315,022,919 Reserves 3,424,162 5,104,859 121,207,942 5,445,990 130,936,265 37,535,000 567,539 10,843,703 11,557,466 2,682,396 47,504,000 - 376,809,322 Retained Earnings (11,006,553) (16,465,083) 23,449,870 (30,425,320) 23,529,908 28,083,000 (4,883,095) (9,122,192) 54,481,988 778,031 28,257,000 (5,128,150) 81,549,404 Total Capital 13,417,609 3,806,247 196,950,466 30,903,070 219,767,873 101,155,000 8,431,030 11,662,527 74,089,546 8,460,427 94,866,000 9,871,850 773,381,645 Total Liabilities& Equity 35,423,682 35,355,791 633,275,275 56,445,090 686,793,512 285,424,000 22,037,769 16,890,623 197,700,714 32,749,042 241,883,000 26,962,140 2,270,940,638
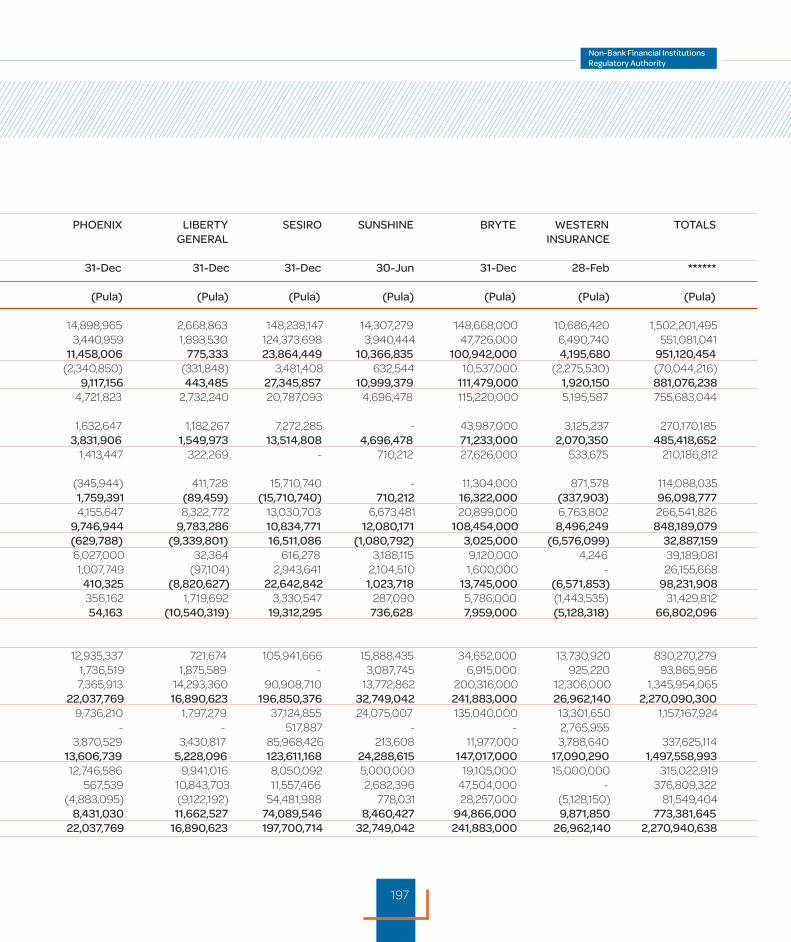
197
INSURER ALPHA DIRECT BECI BIC LEGAL GUARD HOLLARD OLD MUTUAL PHOENIX LIBERTY SESIRO SUNSHINE BRYTE WESTERN TOTALS GENERAL SHORT TERM GENERAL INSURANCE INSURANCE PERIOD END 30-Jun 30-Jun 31-Dec 31-Dec 30-Jun 31-Dec 31-Dec 31-Dec 31-Dec 30-Jun 31-Dec 28-Feb ****** INCOME STATEMENT (Pula) (Pula) (Pula) (Pula) (Pula) (Pula) (Pula) (Pula) (Pula) (Pula) (Pula) (Pula) (Pula) Gross Premium Written 47,300,355 20,742,002 404,292,228 41,153,029 457,423,207 191,823,000 14,898,965 2,668,863 148,238,147 14,307,279 148,668,000 10,686,420 1,502,201,495 Premiums Ceded 16,169,994 7,977,018 159,182,601 - 95,119,057 84,767,000 3,440,959 1,893,530 124,373,698 3,940,444 47,726,000 6,490,740 551,081,041 Net Premiums Written 31,130,361 12,764,984 245,109,627 41,153,029 362,304,150 107,056,000 11,458,006 775,333 23,864,449 10,366,835 100,942,000 4,195,680 951,120,454 Change in UPR 3,111,250 (2,328,680) (62,830,649) - (12,653,861) (5,045,000) (2,340,850) (331,848) 3,481,408 632,544 10,537,000 (2,275,530) (70,044,216)Net Premiums Earned 34,241,611 10,436,304 182,278,978 41,153,029 349,650,289 102,011,000 9,117,156 443,485 27,345,857 10,999,379 111,479,000 1,920,150 881,076,238 Gross Incurred Claims 28,924,654 10,224,149 132,697,580 12,204,406 323,909,034 94,370,000 4,721,823 2,732,240 20,787,093 4,696,478 115,220,000 5,195,587 755,683,044 less Reinsiurance share of claims 8,863,547 1,372,024 46,288,908 - 123,599,270 32,847,000 1,632,647 1,182,267 7,272,285 - 43,987,000 3,125,237 270,170,185 Net incurred claims 20,061,107 8,015,188 86,408,672 12,204,406 200,309,764 61,523,000 3,831,906 1,549,973 13,514,808 4,696,478 71,233,000 2,070,350 485,418,652 Gross Acquisition Costs 2,193,784 731,869 62,594,238 2,679,480 84,912,838 26,469,000 1,413,447 322,269 - 710,212 27,626,000 533,675 210,186,812 less Reinsurance commission 3,995,602 629,252 45,918,858 - 17,844,221 17,748,000 (345,944) 411,728 15,710,740 - 11,304,000 871,578 114,088,035 Net acquisition costs (1,801,818) 102,617 16,675,380 2,679,480 67,068,617 8,721,000 1,759,391 (89,459) (15,710,740) 710,212 16,322,000 (337,903) 96,098,777 Operating Expenses 16,147,189 13,600,286 56,465,326 22,922,702 79,056,918 18,504,000 4,155,647 8,322,772 13,030,703 6,673,481 20,899,000 6,763,802 266,541,826 Underwriting Expenses 34,406,478 21,847,915 159,549,378 37,806,588 346,435,299 88,748,000 9,746,944 9,783,286 10,834,771 12,080,171 108,454,000 8,496,249 848,189,079 Total Underwriting Income (164,867) (11,411,611) 22,729,600 3,346,441 3,214,990 13,263,000 (629,788) (9,339,801) 16,511,086 (1,080,792) 3,025,000 (6,576,099) 32,887,159 Investments Income (23,098) 329,507 4,346,925 1,301,185 14,246,559 6,027,000 32,364 616,278 3,188,115 9,120,000 4,246 39,189,081 Other Income 1,171,709 2,784,087 11,557,358 19,257 3,064,461 - 1,007,749 (97,104) 2,943,641 2,104,510 1,600,000 - 26,155,668 Net Profit Before Taxes 983,744 (8,298,017) 38,633,883 4,666,883 20,526,010 19,290,000 410,325 (8,820,627) 22,642,842 1,023,718 13,745,000 (6,571,853) 98,231,908 Tax 245,928 2,945,690 7,587,730 - 6,162,508 4,452,000 356,162 1,719,692 3,330,547 287,090 5,786,000 (1,443,535) 31,429,812 Net Income After Tax 737,816 (11,243,707) 31,046,153 4,666,883 14,363,502 14,838,000 54,163 (10,540,319) 19,312,295 736,628 7,959,000 (5,128,318) 66,802,096 BALANCE SHEET Cash and Equivalents 3,935,722 15,975,382 112,710,311 9,400,030 329,524,802 174,854,000 12,935,337 721,674 105,941,666 15,888,435 34,652,000 13,730,920 830,270,279 Fixed Assets 5,241,042 7,409,017 38,803,125 6,034,490 10,583,209 11,255,000 1,736,519 1,875,589 - 3,087,745 6,915,000 925,220 93,865,956 Other Current Assets 26,246,918 11,971,392 481,761,839 41,010,570 346,685,501 99,315,000 7,365,913 14,293,360 90,908,710 13,772,862 200,316,000 12,306,000 1,345,954,065 Total Assets 35,423,682 35,355,791 633,275,275 56,445,090 686,793,512 285,424,000 22,037,769 16,890,623 196,850,376 32,749,042 241,883,000 26,962,140 2,270,090,300 Insurance Liabilities 19,443,411 28,341,422 324,596,917 19,716,340 415,143,833 128,851,000 9,736,210 1,797,279 37,124,855 24,075,007 135,040,000 13,301,650 1,157,167,924 Long-term Liabilities 239,506 - - 2,008,562 - - - 517,887 - - 2,765,955 Other Current Liabilities 2,323,156 3,208,122 111,727,892 5,825,680 49,873,244 55,418,000 3,870,529 3,430,817 85,968,426 213,608 11,977,000 3,788,640 337,625,114 Total Liabilities 22,006,073 31,549,544 436,324,809 25,542,020 467,025,639 184,269,000 13,606,739 5,228,096 123,611,168 24,288,615 147,017,000 17,090,290 1,497,558,993 Share Capital 21,000,000 15,166,471 52,292,654 55,882,400 65,301,700 35,537,000 12,746,586 9,941,016 8,050,092 5,000,000 19,105,000 15,000,000 315,022,919 Reserves 3,424,162 5,104,859 121,207,942 5,445,990 130,936,265 37,535,000 567,539 10,843,703 11,557,466 2,682,396 47,504,000 - 376,809,322 Retained Earnings (11,006,553) (16,465,083) 23,449,870 (30,425,320) 23,529,908 28,083,000 (4,883,095) (9,122,192) 54,481,988 778,031 28,257,000 (5,128,150) 81,549,404 Total Capital 13,417,609 3,806,247 196,950,466 30,903,070 219,767,873 101,155,000 8,431,030 11,662,527 74,089,546 8,460,427 94,866,000 9,871,850 773,381,645 Total Liabilities& Equity 35,423,682 35,355,791 633,275,275 56,445,090 686,793,512 285,424,000 22,037,769 16,890,623 197,700,714 32,749,042 241,883,000 26,962,140 2,270,940,638
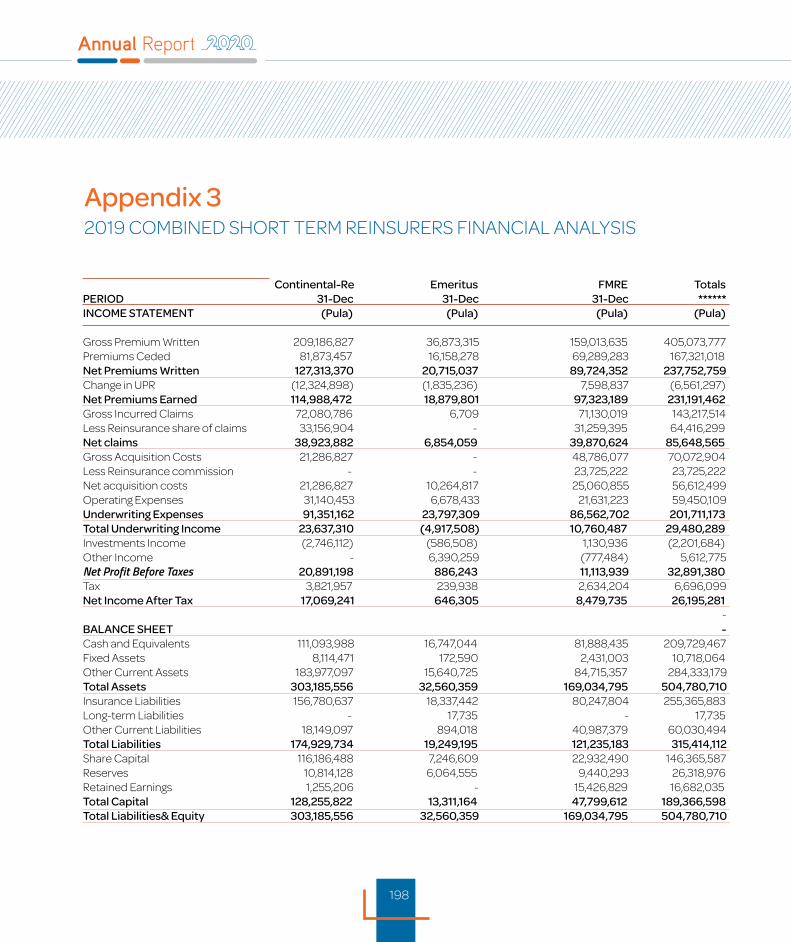
198
192
Continental-Re Emeritus FMRE Totals PERIOD 31-Dec 31-Dec 31-Dec ****** INCOME STATEMENT (Pula) (Pula) (Pula) (Pula)
Gross Premium Written 209,186,827 36,873,315 159,013,635 405,073,777 Premiums Ceded 81,873,457 16,158,278 69,289,283 167,321,018 Net Premiums Written 127,313,370 20,715,037 89,724,352 237,752,759 Change in UPR (12,324,898) (1,835,236) 7,598,837 (6,561,297)Net Premiums Earned 114,988,472 18,879,801 97,323,189 231,191,462 Gross Incurred Claims 72,080,786 6,709 71,130,019 143,217,514 Less Reinsurance share of claims 33,156,904 - 31,259,395 64,416,299 Net claims 38,923,882 6,854,059 39,870,624 85,648,565 Gross Acquisition Costs 21,286,827 - 48,786,077 70,072,904 Less Reinsurance commission - - 23,725,222 23,725,222 Net acquisition costs 21,286,827 10,264,817 25,060,855 56,612,499 Operating Expenses 31,140,453 6,678,433 21,631,223 59,450,109 Underwriting Expenses 91,351,162 23,797,309 86,562,702 201,711,173 Total Underwriting Income 23,637,310 (4,917,508) 10,760,487 29,480,289 Investments Income (2,746,112) (586,508) 1,130,936 (2,201,684)Other Income - 6,390,259 (777,484) 5,612,775 Net Profit Before Taxes 20,891,198 886,243 11,113,939 32,891,380 Tax 3,821,957 239,938 2,634,204 6,696,099 Net Income After Tax 17,069,241 646,305 8,479,735 26,195,281 - BALANCE SHEET - Cash and Equivalents 111,093,988 16,747,044 81,888,435 209,729,467 Fixed Assets 8,114,471 172,590 2,431,003 10,718,064 Other Current Assets 183,977,097 15,640,725 84,715,357 284,333,179 Total Assets 303,185,556 32,560,359 169,034,795 504,780,710 Insurance Liabilities 156,780,637 18,337,442 80,247,804 255,365,883 Long-term Liabilities - 17,735 - 17,735 Other Current Liabilities 18,149,097 894,018 40,987,379 60,030,494 Total Liabilities 174,929,734 19,249,195 121,235,183 315,414,112 Share Capital 116,186,488 7,246,609 22,932,490 146,365,587 Reserves 10,814,128 6,064,555 9,440,293 26,318,976 Retained Earnings 1,255,206 - 15,426,829 16,682,035 Total Capital 128,255,822 13,311,164 47,799,612 189,366,598 Total Liabilities& Equity 303,185,556 32,560,359 169,034,795 504,780,710
Appendix 32019 COMBINED SHORT TERM REINSURERS FINANCIAL ANALYSIS

199
Appendix 4: List of Licensed and Exempted NBFI’s by Industry Table of Contents
Appendix 4 A: List of Medical Aid Funds
Appendix 4 B: List of Life, General and Re-Insurers
Appendix 4 C: List of Licensed Retirement Funds
Appendix 4 D: List of Standalone Pension Funds
Appendix 4 E: List of Sub Funds of Umbrella Funds
Appendix 4 F: List of Management Companies and CIU Funds Licensed in Botswana
Appendix 4 G: Externally Licensed Funds Approved for Marketing in Botswana
Appendix 4 H: Registered Asset Managers
Appendix 4 I: Investment Companies with Variable Capital
Appendix 4 J: Botswana IFSC Accredited Companies
Appendix 4 K: Licensed Trustees for Collective Investment Undertakings (CIUs)
Appendix 4 L: Exchange and Brokers
Appendix 4 M: List of Micro Lenders
Appendix 4 N: List of Exempted Pawnshops
Appendix 4 O: List of Exempted Finance and Leasing Companies
Appendix 4 P: Licensed Investment Advisors
Appendix 4 Q: List of Licensed Custodians

200
Appendix 4A: List of Medical Aid Funds ENTITY NAME CONTACT PERSON TELEPHONE POSTAL ADDRESS EMAIL ADDRESS
Pula Medical Aid Fund Dr. Khumoetsile Mapitse 3650561 P. O Box 1212 Gaborone [email protected] Public Officers’ Medical Aid Scheme Mr. Thulaganyo Molebatsi 3972418 P O Box 1212 Gaborone [email protected] Health Plan (Pty) Ltd Mr Lesego Pule 3624700 P/Bag 00391 Gaborone [email protected] Medical Aid Society Mr. Moraki Mokgosana 3633101 P. O. Box 632, Gaborone [email protected] (Pty) Ltd t/a Doctor’s Aid Medical Aid Scheme Dr. Dikgato Derrick Tlhoiwe 3904924 P O BOX 70587,GABORONE [email protected] [email protected]
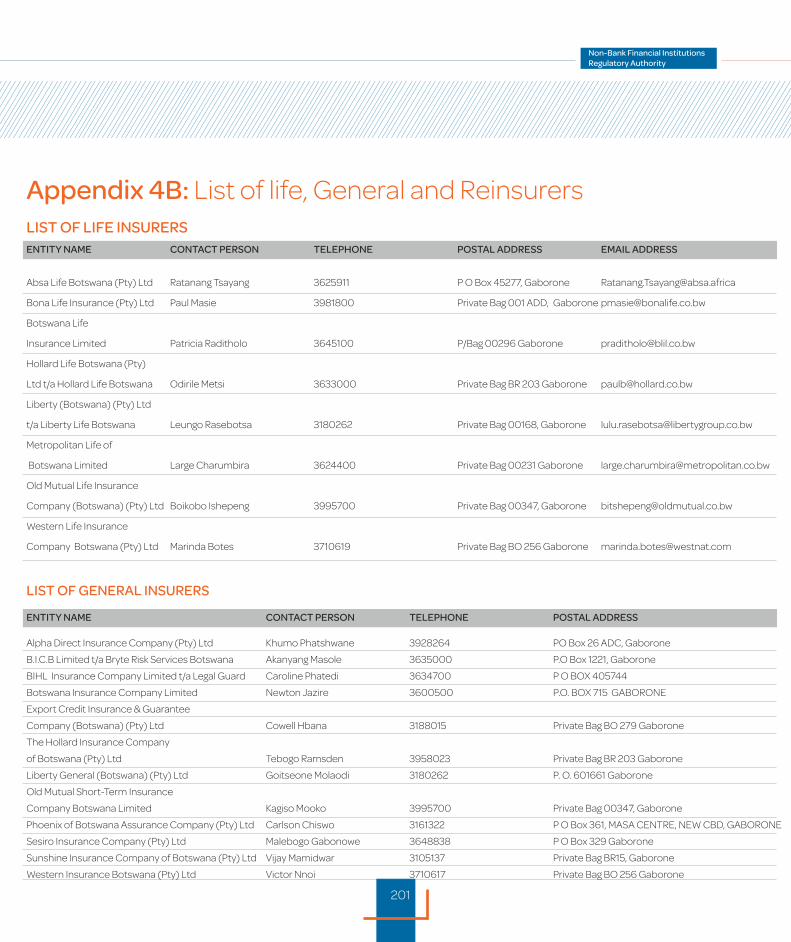
201
Appendix 4B: List of life, General and ReinsurersLIST OF LIFE INSURERSENTITY NAME CONTACT PERSON TELEPHONE POSTAL ADDRESS EMAIL ADDRESS
Absa Life Botswana (Pty) Ltd Ratanang Tsayang 3625911 P O Box 45277, Gaborone [email protected]
Bona Life Insurance (Pty) Ltd Paul Masie 3981800 Private Bag 001 ADD, Gaborone [email protected]
Botswana Life
Insurance Limited Patricia Raditholo 3645100 P/Bag 00296 Gaborone [email protected]
Hollard Life Botswana (Pty)
Ltd t/a Hollard Life Botswana Odirile Metsi 3633000 Private Bag BR 203 Gaborone [email protected]
Liberty (Botswana) (Pty) Ltd
t/a Liberty Life Botswana Leungo Rasebotsa 3180262 Private Bag 00168, Gaborone [email protected]
Metropolitan Life of
Botswana Limited Large Charumbira 3624400 Private Bag 00231 Gaborone [email protected]
Old Mutual Life Insurance
Company (Botswana) (Pty) Ltd Boikobo Ishepeng 3995700 Private Bag 00347, Gaborone [email protected]
Western Life Insurance
Company Botswana (Pty) Ltd Marinda Botes 3710619 Private Bag BO 256 Gaborone [email protected]
LIST OF GENERAL INSURERS
ENTITY NAME CONTACT PERSON TELEPHONE POSTAL ADDRESS Alpha Direct Insurance Company (Pty) Ltd Khumo Phatshwane 3928264 PO Box 26 ADC, Gaborone
B.I.C.B Limited t/a Bryte Risk Services Botswana Akanyang Masole 3635000 P.O Box 1221, Gaborone
BIHL Insurance Company Limited t/a Legal Guard Caroline Phatedi 3634700 P O BOX 405744
Botswana Insurance Company Limited Newton Jazire 3600500 P.O. BOX 715 GABORONE
Export Credit Insurance & Guarantee
Company (Botswana) (Pty) Ltd Cowell Hbana 3188015 Private Bag BO 279 Gaborone
The Hollard Insurance Company
of Botswana (Pty) Ltd Tebogo Ramsden 3958023 Private Bag BR 203 Gaborone
Liberty General (Botswana) (Pty) Ltd Goitseone Molaodi 3180262 P. O. 601661 Gaborone
Old Mutual Short-Term Insurance
Company Botswana Limited Kagiso Mooko 3995700 Private Bag 00347, Gaborone
Phoenix of Botswana Assurance Company (Pty) Ltd Carlson Chiswo 3161322 P O Box 361, MASA CENTRE, NEW CBD, GABORONE
Sesiro Insurance Company (Pty) Ltd Malebogo Gabonowe 3648838 P O Box 329 Gaborone
Sunshine Insurance Company of Botswana (Pty) Ltd Vijay Mamidwar 3105137 Private Bag BR15, Gaborone
Western Insurance Botswana (Pty) Ltd Victor Nnoi 3710617 Private Bag BO 256 Gaborone

202
Appendix 4B: List of life, General and Reinsurers
LIST OF REINSURERSENTITY NAME CONTACT PERSON TELEPHONE POSTAL ADDRESS EMAIL ADDRESS
Continental Reinsurance
Company Limited Thato Hollauf +267 397 4390 P.O.Box 698 ABG, Sebele, [email protected] Gaborone, Botswana
Emeritus Reinsurance
Company (Pty) Ltd Patience Marwiro 3121041/2 P.O. Box 404271Gaborone [email protected]
FMRE Property &
Casualty (Pty) Ltd Bongai Muhau +2673934280 P.O Box 47202, Gaborone, [email protected]
/3934287/93/94 Botswana
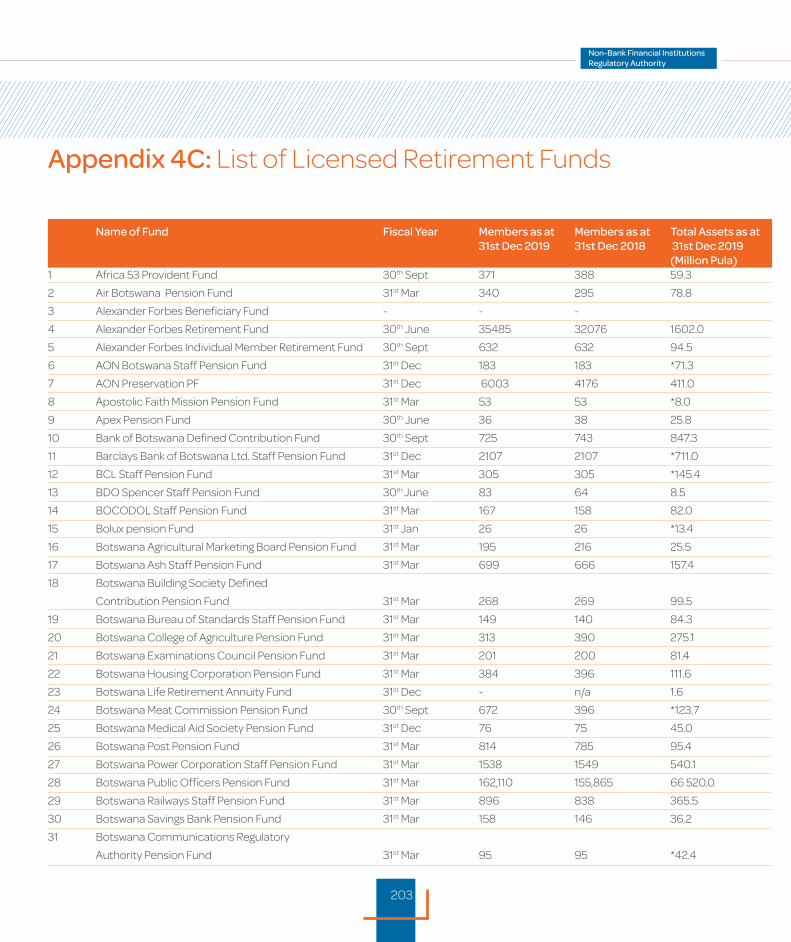
203
Appendix 4C: List of Licensed Retirement Funds
Name of Fund Fiscal Year Members as at Members as at Total Assets as at 31st Dec 2019 31st Dec 2018 31st Dec 2019 (Million Pula)1 Africa 53 Provident Fund 30th Sept 371 388 59.3
2 Air Botswana Pension Fund 31st Mar 340 295 78.8
3 Alexander Forbes Beneficiary Fund - - -
4 Alexander Forbes Retirement Fund 30th June 35485 32076 1602.0
5 Alexander Forbes Individual Member Retirement Fund 30th Sept 632 632 94.5
6 AON Botswana Staff Pension Fund 31st Dec 183 183 *71.3
7 AON Preservation PF 31st Dec 6003 4176 411.0
8 Apostolic Faith Mission Pension Fund 31st Mar 53 53 *8.0
9 Apex Pension Fund 30th June 36 38 25.8
10 Bank of Botswana Defined Contribution Fund 30th Sept 725 743 847.3
11 Barclays Bank of Botswana Ltd. Staff Pension Fund 31st Dec 2107 2107 *711.0
12 BCL Staff Pension Fund 31st Mar 305 305 *145.4
13 BDO Spencer Staff Pension Fund 30th June 83 64 8.5
14 BOCODOL Staff Pension Fund 31st Mar 167 158 82.0
15 Bolux pension Fund 31st Jan 26 26 *13.4
16 Botswana Agricultural Marketing Board Pension Fund 31st Mar 195 216 25.5
17 Botswana Ash Staff Pension Fund 31st Mar 699 666 157.4
18 Botswana Building Society Defined
Contribution Pension Fund 31st Mar 268 269 99.5
19 Botswana Bureau of Standards Staff Pension Fund 31st Mar 149 140 84.3
20 Botswana College of Agriculture Pension Fund 31st Mar 313 390 275.1
21 Botswana Examinations Council Pension Fund 31st Mar 201 200 81.4
22 Botswana Housing Corporation Pension Fund 31st Mar 384 396 111.6
23 Botswana Life Retirement Annuity Fund 31st Dec - n/a 1.6
24 Botswana Meat Commission Pension Fund 30th Sept 672 396 *123.7
25 Botswana Medical Aid Society Pension Fund 31st Dec 76 75 45.0
26 Botswana Post Pension Fund 31st Mar 814 785 95.4
27 Botswana Power Corporation Staff Pension Fund 31st Mar 1538 1549 540.1
28 Botswana Public Officers Pension Fund 31st Mar 162,110 155,865 66 520.0
29 Botswana Railways Staff Pension Fund 31st Mar 896 838 365.5
30 Botswana Savings Bank Pension Fund 31st Mar 158 146 36.2
31 Botswana Communications Regulatory
Authority Pension Fund 31st Mar 95 95 *42.4

204
Name of Fund Fiscal Year Members as at Members as at Total Assets as at 31st Dec 2019 31st Dec 2018 31st Dec 2019 (Million Pula)32 Botswana Telecommunications Corporation
Staff Pension Fund 31st Mar 1442 1403 543.5
33 Botswana Unified Revenue Service
Employees Pension Fund 31st Mar 1948 1935 616.1
34 Botswana International University of Science
and Technology Staff Pension Fund 31st Mar 279 214 65.2
35 Botswana Vaccine Institute Pension Fund 31st Mar 135 88 48.4
36 Caltex Botswana Pension Fund/ Chevron Pension Fund 31st Dec 27 21 6.4
37 Carrier South Africa Provident Fund-External Fund - 457 (5 Batswana) 107.2
38 Citizen Entrepreneurial Development
Agency Staff Pension Fund 31st Mar 244 240 95.1
39 Civil Aviation of Botswana Pension Fund 31st Mar 907 907 *128.9
40 Debswana Pension Fund 31st Dec 12455 12211 8400.1
41 Deferred Pensioners Pension Fund 31st Mar 5306 4971 674.8
42 Deloitte and Touché Staff Pension Fund 31st Dec 75 73 17.3
43 Engen Botswana Retirement Fund 30th Oct 44 42 18.2
44 Ernst & Young Pension Fund 30th June 36 36 *8.6
45 Fiducia Preservation Retirement Fund 31st Dec 691 110 90.1
46 Fiducia Provident Fund 30th Sep - - -
47 Fiducia Umbrella Pension Fund 30th June - 1550 -
48 Fincraft Retirement Fund 31st Mar 67 67 *3.1
49 First National Bank of Botswana Pension Fund 31st Dec 216 1926 503.7
50 Free Standing Additional Voluntary
Contributions Retirement Fund 30th June 220 176 38.5
51 FSN Retirement Plan 31st Mar 186 173 48.1
52 G4S Staff Pension Fund 30th June 1401 1401 *29.6
53 Glenrand MIB Botswana Pension Fund 30th June 18 18 *11.1
54 Glenrand MIB Orphans Fund 30th June 382 382 *22.4
55 Institute of Development Management Pension Fund 30th Sept 58 58 *9.3
56 J. Haskins & Sons Pension Fund 30th June 30 30 17.9
57 Kgalagadi Breweries Limited Pension Fund 30th Sept 1162 1405 145.1
58 Lenmed Bokamoso Private Hospital Staff Pension Fund 31st Dec 430 351 24.9
59 Lenmed Bokamoso Private Hospital Staff Provident Fund 31st Dec 51 55 5.4
Appendix 4C: List of Licensed Retirement Funds
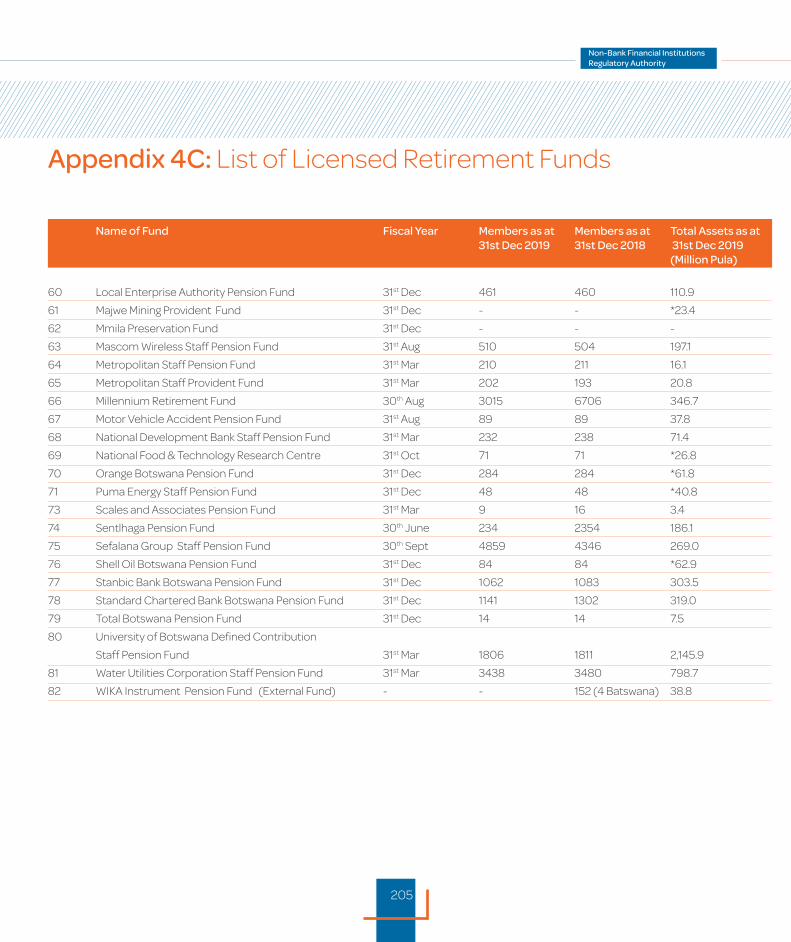
205
Appendix 4C: List of Licensed Retirement Funds
Name of Fund Fiscal Year Members as at Members as at Total Assets as at 31st Dec 2019 31st Dec 2018 31st Dec 2019 (Million Pula)
60 Local Enterprise Authority Pension Fund 31st Dec 461 460 110.9
61 Majwe Mining Provident Fund 31st Dec - - *23.4
62 Mmila Preservation Fund 31st Dec - - -
63 Mascom Wireless Staff Pension Fund 31st Aug 510 504 197.1
64 Metropolitan Staff Pension Fund 31st Mar 210 211 16.1
65 Metropolitan Staff Provident Fund 31st Mar 202 193 20.8
66 Millennium Retirement Fund 30th Aug 3015 6706 346.7
67 Motor Vehicle Accident Pension Fund 31st Aug 89 89 37.8
68 National Development Bank Staff Pension Fund 31st Mar 232 238 71.4
69 National Food & Technology Research Centre 31st Oct 71 71 *26.8
70 Orange Botswana Pension Fund 31st Dec 284 284 *61.8
71 Puma Energy Staff Pension Fund 31st Dec 48 48 *40.8
73 Scales and Associates Pension Fund 31st Mar 9 16 3.4
74 Sentlhaga Pension Fund 30th June 234 2354 186.1
75 Sefalana Group Staff Pension Fund 30th Sept 4859 4346 269.0
76 Shell Oil Botswana Pension Fund 31st Dec 84 84 *62.9
77 Stanbic Bank Botswana Pension Fund 31st Dec 1062 1083 303.5
78 Standard Chartered Bank Botswana Pension Fund 31st Dec 1141 1302 319.0
79 Total Botswana Pension Fund 31st Dec 14 14 7.5
80 University of Botswana Defined Contribution
Staff Pension Fund 31st Mar 1806 1811 2,145.9
81 Water Utilities Corporation Staff Pension Fund 31st Mar 3438 3480 798.7
82 WIKA Instrument Pension Fund (External Fund) - - 152 (4 Batswana) 38.8

206
Appendix 4D: List of Standalone Retirement Funds
GENERAL CONTACT DETAILS OF VARIOUS RETIREMENT FUNDS
Fund Name Financial Physical Address Postal Address Telephone Contact Person Year end
Africa 53 Provident Fund 30-Sep Plot 203 Independence Private Bag 00410, 3651901/48 Mr Paul Masie Avenue, Gaborone Gaborone, Botswana Air Botswana Pension Fund 31-Mar Air Botswana Head Office, P O Box 92, Gaborone, 3952812/ Ms Happy Mphothwe
Sir Seretse Khama Airport Botswana 3688400
Alexander Forbes Individual
Member Retirement Fund 30-Sep Plot 203 Independence Private Bag 00410, 3651901 Mr Paul Masie
Avenue, Gaborone Gaborone, Botswana
Alexander Forbes
Retirement Fund 30-Jun Plot 203 Independence Private Bag 00410, 3651901/48 Ms. Nina Kowa
Avenue, Gaborone Gaborone, Botswana
Aon Defined Contribution 31-Dec Plot 50368, Gaborone P O Box 624, 3617300 Ms. Goitseone Mabua
Business Park, Showgrounds Gaborone, Botswana
Aon Preservation Fund 30-Sep Plot 50368, Gaborone P O Box 624, 3617300 Mr Peter Hikhwa
Business Park, Showgrounds Gaborone, Botswana
Apex Pension Fund 30-Jun New Lobatse Road, 14400/1, P O Box 1751
Gaborone 1751, Botswana Gaborone, Botswana 3617300 Mrs T Mookodi
Bank of Botswana
Defined Contribution
Staff Pension Fund 30-Sep Plot 17938, Khama Private Bag 154, 3606000 Mr Daniel Loeto
Crescent, Gaborone Gaborone, Botswana
ABSA Bank of Botswana
Limited Pension Fund 31-Dec Barclays Bank of Botswana,
6th Floor Barclays House, P O Box 478,
Khama Crescent, Gaborone Gaborone, Botswana 363 3951 Ms Wilheminah Ditirwa
Barloworld Botswana
Retirement Fund 30-Sep Plot 50368, Gaborone
Business Park, P O Box 1616,
Showgrounds, Gaborone Gaborone, Botswana 3973917 Mr Peter Stevenson
BCL Staff Pension Fund 31-Mar BCL Mine Site, P O Box 3,
Selebi-Phikwe Selebi-Phikwe, Botswana 2621391 Mr Joseph Seipato
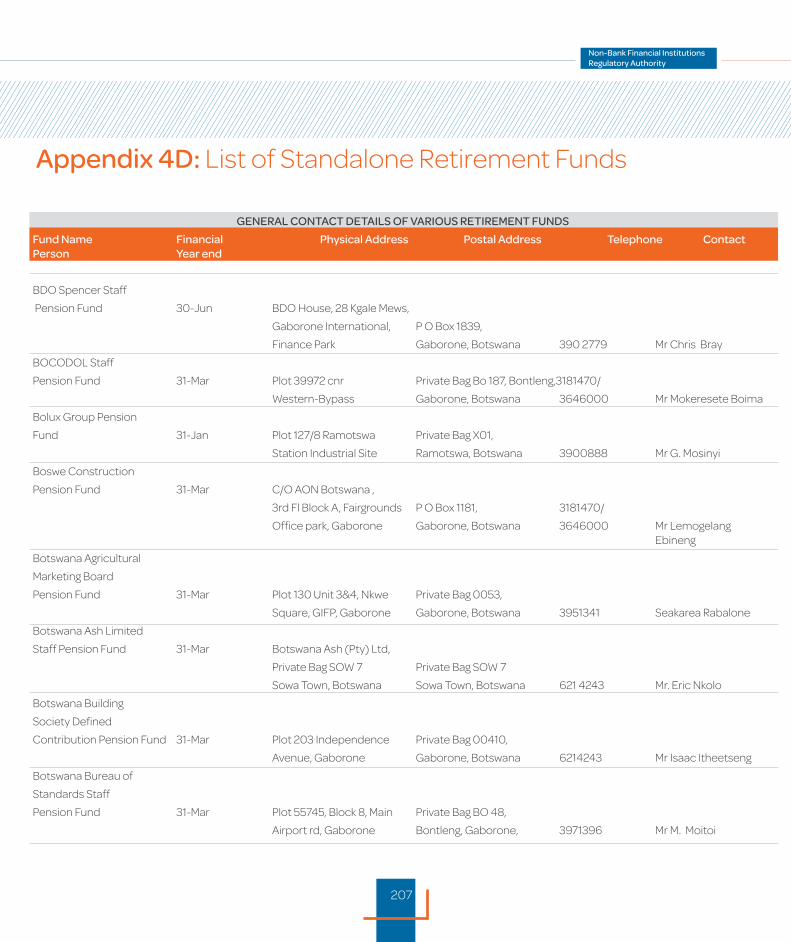
207
GENERAL CONTACT DETAILS OF VARIOUS RETIREMENT FUNDS
Fund Name Financial Physical Address Postal Address Telephone Contact Person Year end
Africa 53 Provident Fund 30-Sep Plot 203 Independence Private Bag 00410, 3651901/48 Mr Paul Masie Avenue, Gaborone Gaborone, Botswana Air Botswana Pension Fund 31-Mar Air Botswana Head Office, P O Box 92, Gaborone, 3952812/ Ms Happy Mphothwe
Sir Seretse Khama Airport Botswana 3688400
Alexander Forbes Individual
Member Retirement Fund 30-Sep Plot 203 Independence Private Bag 00410, 3651901 Mr Paul Masie
Avenue, Gaborone Gaborone, Botswana
Alexander Forbes
Retirement Fund 30-Jun Plot 203 Independence Private Bag 00410, 3651901/48 Ms. Nina Kowa
Avenue, Gaborone Gaborone, Botswana
Aon Defined Contribution 31-Dec Plot 50368, Gaborone P O Box 624, 3617300 Ms. Goitseone Mabua
Business Park, Showgrounds Gaborone, Botswana
Aon Preservation Fund 30-Sep Plot 50368, Gaborone P O Box 624, 3617300 Mr Peter Hikhwa
Business Park, Showgrounds Gaborone, Botswana
Apex Pension Fund 30-Jun New Lobatse Road, 14400/1, P O Box 1751
Gaborone 1751, Botswana Gaborone, Botswana 3617300 Mrs T Mookodi
Bank of Botswana
Defined Contribution
Staff Pension Fund 30-Sep Plot 17938, Khama Private Bag 154, 3606000 Mr Daniel Loeto
Crescent, Gaborone Gaborone, Botswana
ABSA Bank of Botswana
Limited Pension Fund 31-Dec Barclays Bank of Botswana,
6th Floor Barclays House, P O Box 478,
Khama Crescent, Gaborone Gaborone, Botswana 363 3951 Ms Wilheminah Ditirwa
Barloworld Botswana
Retirement Fund 30-Sep Plot 50368, Gaborone
Business Park, P O Box 1616,
Showgrounds, Gaborone Gaborone, Botswana 3973917 Mr Peter Stevenson
BCL Staff Pension Fund 31-Mar BCL Mine Site, P O Box 3,
Selebi-Phikwe Selebi-Phikwe, Botswana 2621391 Mr Joseph Seipato
Appendix 4D: List of Standalone Retirement Funds
GENERAL CONTACT DETAILS OF VARIOUS RETIREMENT FUNDS
Fund Name Financial Physical Address Postal Address Telephone Contact Person Year end
BDO Spencer Staff
Pension Fund 30-Jun BDO House, 28 Kgale Mews,
Gaborone International, P O Box 1839,
Finance Park Gaborone, Botswana 390 2779 Mr Chris Bray
BOCODOL Staff
Pension Fund 31-Mar Plot 39972 cnr Private Bag Bo 187, Bontleng,3181470/
Western-Bypass Gaborone, Botswana 3646000 Mr Mokeresete Boima
Bolux Group Pension
Fund 31-Jan Plot 127/8 Ramotswa Private Bag X01,
Station Industrial Site Ramotswa, Botswana 3900888 Mr G. Mosinyi
Boswe Construction
Pension Fund 31-Mar C/O AON Botswana ,
3rd Fl Block A, Fairgrounds P O Box 1181, 3181470/
Office park, Gaborone Gaborone, Botswana 3646000 Mr Lemogelang Ebineng
Botswana Agricultural
Marketing Board
Pension Fund 31-Mar Plot 130 Unit 3&4, Nkwe Private Bag 0053,
Square, GIFP, Gaborone Gaborone, Botswana 3951341 Seakarea Rabalone
Botswana Ash Limited
Staff Pension Fund 31-Mar Botswana Ash (Pty) Ltd,
Private Bag SOW 7 Private Bag SOW 7
Sowa Town, Botswana Sowa Town, Botswana 621 4243 Mr. Eric Nkolo
Botswana Building
Society Defined
Contribution Pension Fund 31-Mar Plot 203 Independence Private Bag 00410,
Avenue, Gaborone Gaborone, Botswana 6214243 Mr Isaac Itheetseng
Botswana Bureau of
Standards Staff
Pension Fund 31-Mar Plot 55745, Block 8, Main Private Bag BO 48,
Airport rd, Gaborone Bontleng, Gaborone, 3971396 Mr M. Moitoi
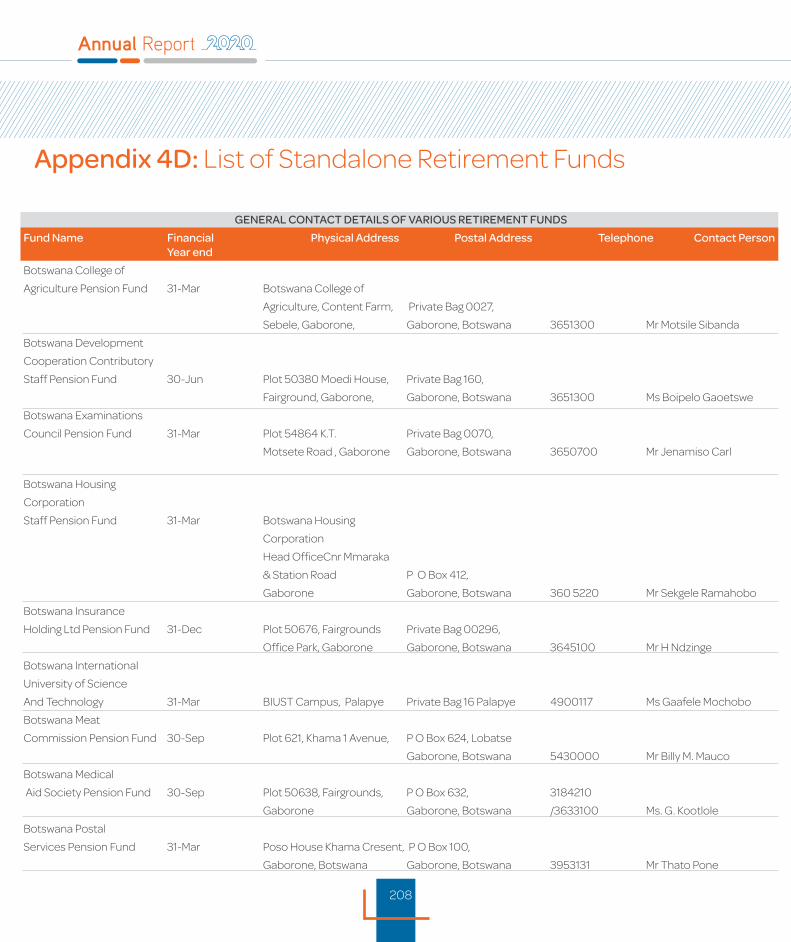
208
Appendix 4D: List of Standalone Retirement Funds
GENERAL CONTACT DETAILS OF VARIOUS RETIREMENT FUNDS
Fund Name Financial Physical Address Postal Address Telephone Contact Person Year end
Botswana College of
Agriculture Pension Fund 31-Mar Botswana College of
Agriculture, Content Farm, Private Bag 0027,
Sebele, Gaborone, Gaborone, Botswana 3651300 Mr Motsile Sibanda
Botswana Development
Cooperation Contributory
Staff Pension Fund 30-Jun Plot 50380 Moedi House, Private Bag 160,
Fairground, Gaborone, Gaborone, Botswana 3651300 Ms Boipelo Gaoetswe
Botswana Examinations
Council Pension Fund 31-Mar Plot 54864 K.T. Private Bag 0070,
Motsete Road , Gaborone Gaborone, Botswana 3650700 Mr Jenamiso Carl
Botswana Housing
Corporation
Staff Pension Fund 31-Mar Botswana Housing
Corporation
Head OfficeCnr Mmaraka
& Station Road P O Box 412,
Gaborone Gaborone, Botswana 360 5220 Mr Sekgele Ramahobo
Botswana Insurance
Holding Ltd Pension Fund 31-Dec Plot 50676, Fairgrounds Private Bag 00296,
Office Park, Gaborone Gaborone, Botswana 3645100 Mr H Ndzinge
Botswana International
University of Science
And Technology 31-Mar BIUST Campus, Palapye Private Bag 16 Palapye 4900117 Ms Gaafele Mochobo
Botswana Meat
Commission Pension Fund 30-Sep Plot 621, Khama 1 Avenue, P O Box 624, Lobatse
Gaborone, Botswana 5430000 Mr Billy M. Mauco
Botswana Medical
Aid Society Pension Fund 30-Sep Plot 50638, Fairgrounds, P O Box 632, 3184210
Gaborone Gaborone, Botswana /3633100 Ms. G. Kootlole
Botswana Postal
Services Pension Fund 31-Mar Poso House Khama Cresent, P O Box 100,
Gaborone, Botswana Gaborone, Botswana 3953131 Mr Thato Pone
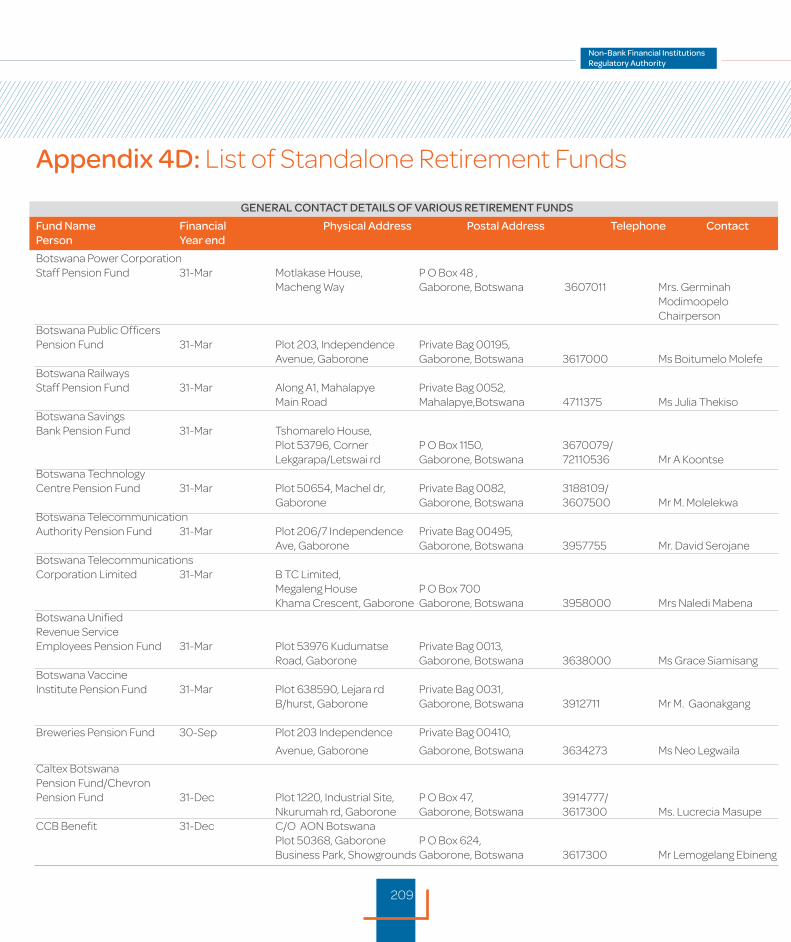
209
GENERAL CONTACT DETAILS OF VARIOUS RETIREMENT FUNDS
Fund Name Financial Physical Address Postal Address Telephone Contact Person Year end
Botswana Power CorporationStaff Pension Fund 31-Mar Motlakase House, P O Box 48 , Macheng Way Gaborone, Botswana 3607011 Mrs. Germinah Modimoopelo ChairpersonBotswana Public OfficersPension Fund 31-Mar Plot 203, Independence Private Bag 00195, Avenue, Gaborone Gaborone, Botswana 3617000 Ms Boitumelo MolefeBotswana Railways Staff Pension Fund 31-Mar Along A1, Mahalapye Private Bag 0052, Main Road Mahalapye,Botswana 4711375 Ms Julia ThekisoBotswana Savings Bank Pension Fund 31-Mar Tshomarelo House, Plot 53796, Corner P O Box 1150, 3670079/ Lekgarapa/Letswai rd Gaborone, Botswana 72110536 Mr A KoontseBotswana Technology Centre Pension Fund 31-Mar Plot 50654, Machel dr, Private Bag 0082, 3188109/ Gaborone Gaborone, Botswana 3607500 Mr M. MolelekwaBotswana Telecommunication Authority Pension Fund 31-Mar Plot 206/7 Independence Private Bag 00495, Ave, Gaborone Gaborone, Botswana 3957755 Mr. David SerojaneBotswana Telecommunications Corporation Limited 31-Mar B TC Limited, Megaleng House P O Box 700 Khama Crescent, Gaborone Gaborone, Botswana 3958000 Mrs Naledi MabenaBotswana Unified Revenue Service Employees Pension Fund 31-Mar Plot 53976 Kudumatse Private Bag 0013, Road, Gaborone Gaborone, Botswana 3638000 Ms Grace SiamisangBotswana Vaccine Institute Pension Fund 31-Mar Plot 638590, Lejara rd Private Bag 0031, B/hurst, Gaborone Gaborone, Botswana 3912711 Mr M. Gaonakgang Breweries Pension Fund 30-Sep Plot 203 Independence Private Bag 00410,
Avenue, Gaborone Gaborone, Botswana 3634273 Ms Neo Legwaila
Caltex Botswana Pension Fund/Chevron Pension Fund 31-Dec Plot 1220, Industrial Site, P O Box 47, 3914777/ Nkurumah rd, Gaborone Gaborone, Botswana 3617300 Ms. Lucrecia Masupe CCB Benefit 31-Dec C/O AON Botswana Plot 50368, Gaborone P O Box 624, Business Park, Showgrounds Gaborone, Botswana 3617300 Mr Lemogelang Ebineng
Appendix 4D: List of Standalone Retirement Funds
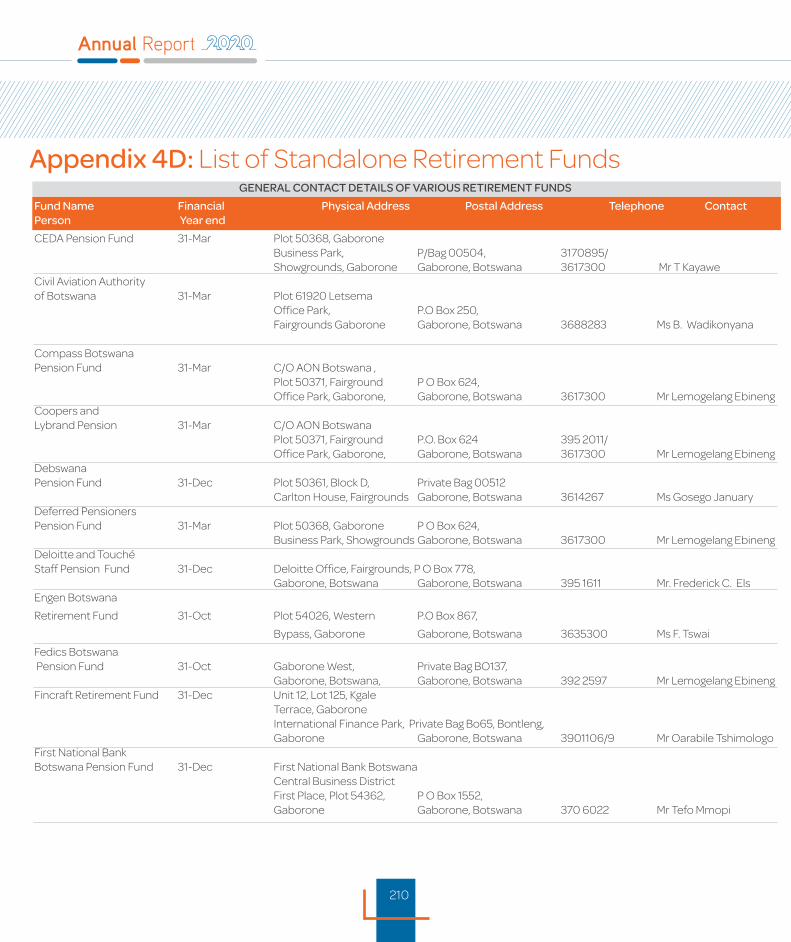
210
GENERAL CONTACT DETAILS OF VARIOUS RETIREMENT FUNDS
Fund Name Financial Physical Address Postal Address Telephone Contact Person Year end
CEDA Pension Fund 31-Mar Plot 50368, Gaborone Business Park, P/Bag 00504, 3170895/ Showgrounds, Gaborone Gaborone, Botswana 3617300 Mr T KayaweCivil Aviation Authority of Botswana 31-Mar Plot 61920 Letsema Office Park, P.O Box 250, Fairgrounds Gaborone Gaborone, Botswana 3688283 Ms B. Wadikonyana Compass Botswana Pension Fund 31-Mar C/O AON Botswana , Plot 50371, Fairground P O Box 624, Office Park, Gaborone, Gaborone, Botswana 3617300 Mr Lemogelang EbinengCoopers and Lybrand Pension 31-Mar C/O AON Botswana Plot 50371, Fairground P.O. Box 624 395 2011/ Office Park, Gaborone, Gaborone, Botswana 3617300 Mr Lemogelang EbinengDebswana Pension Fund 31-Dec Plot 50361, Block D, Private Bag 00512 Carlton House, Fairgrounds Gaborone, Botswana 3614267 Ms Gosego JanuaryDeferred Pensioners Pension Fund 31-Mar Plot 50368, Gaborone P O Box 624, Business Park, Showgrounds Gaborone, Botswana 3617300 Mr Lemogelang EbinengDeloitte and Touché Staff Pension Fund 31-Dec Deloitte Office, Fairgrounds, P O Box 778, Gaborone, Botswana Gaborone, Botswana 395 1611 Mr. Frederick C. Els Engen Botswana
Retirement Fund 31-Oct Plot 54026, Western P.O Box 867,
Bypass, Gaborone Gaborone, Botswana 3635300 Ms F. Tswai
Fedics Botswana Pension Fund 31-Oct Gaborone West, Private Bag BO137, Gaborone, Botswana, Gaborone, Botswana 392 2597 Mr Lemogelang EbinengFincraft Retirement Fund 31-Dec Unit 12, Lot 125, Kgale Terrace, Gaborone International Finance Park, Private Bag Bo65, Bontleng, Gaborone Gaborone, Botswana 3901106/9 Mr Oarabile TshimologoFirst National Bank Botswana Pension Fund 31-Dec First National Bank Botswana Central Business District First Place, Plot 54362, P O Box 1552, Gaborone Gaborone, Botswana 370 6022 Mr Tefo Mmopi
Appendix 4D: List of Standalone Retirement Funds
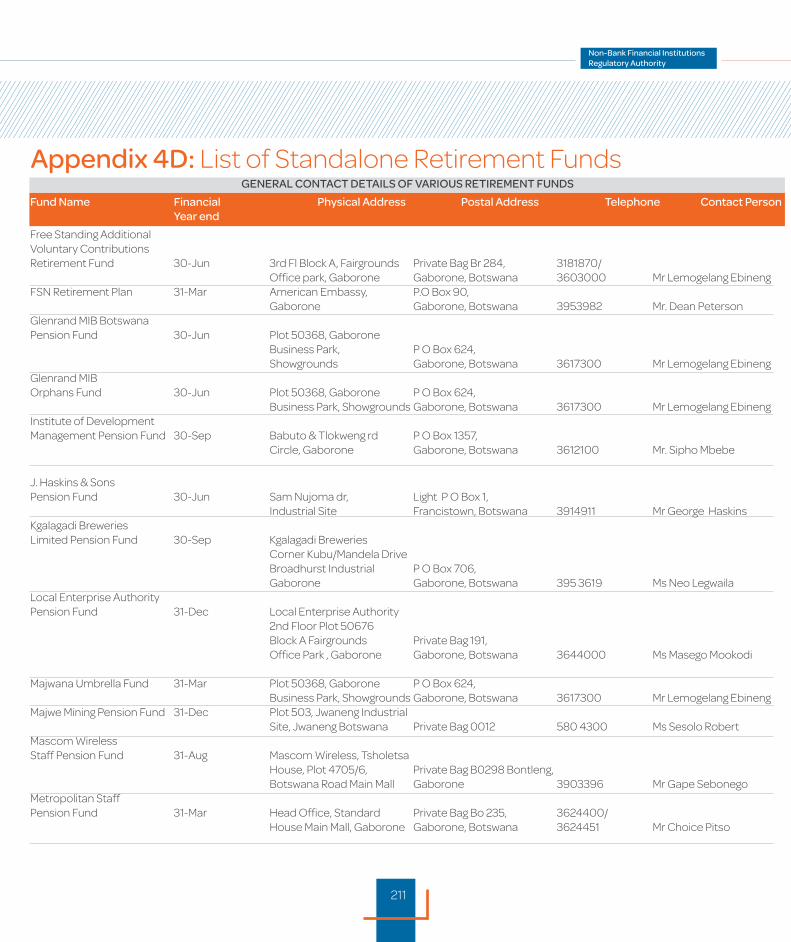
211
Appendix 4D: List of Standalone Retirement FundsGENERAL CONTACT DETAILS OF VARIOUS RETIREMENT FUNDS
Fund Name Financial Physical Address Postal Address Telephone Contact Person Year end
Free Standing Additional Voluntary Contributions Retirement Fund 30-Jun 3rd Fl Block A, Fairgrounds Private Bag Br 284, 3181870/ Office park, Gaborone Gaborone, Botswana 3603000 Mr Lemogelang EbinengFSN Retirement Plan 31-Mar American Embassy, P.O Box 90, Gaborone Gaborone, Botswana 3953982 Mr. Dean PetersonGlenrand MIB Botswana Pension Fund 30-Jun Plot 50368, Gaborone Business Park, P O Box 624, Showgrounds Gaborone, Botswana 3617300 Mr Lemogelang EbinengGlenrand MIB Orphans Fund 30-Jun Plot 50368, Gaborone P O Box 624, Business Park, Showgrounds Gaborone, Botswana 3617300 Mr Lemogelang EbinengInstitute of Development Management Pension Fund 30-Sep Babuto & Tlokweng rd P O Box 1357, Circle, Gaborone Gaborone, Botswana 3612100 Mr. Sipho Mbebe
J. Haskins & Sons Pension Fund 30-Jun Sam Nujoma dr, Light P O Box 1, Industrial Site Francistown, Botswana 3914911 Mr George HaskinsKgalagadi Breweries Limited Pension Fund 30-Sep Kgalagadi Breweries Corner Kubu/Mandela Drive Broadhurst Industrial P O Box 706, Gaborone Gaborone, Botswana 395 3619 Ms Neo LegwailaLocal Enterprise Authority Pension Fund 31-Dec Local Enterprise Authority 2nd Floor Plot 50676 Block A Fairgrounds Private Bag 191, Office Park , Gaborone Gaborone, Botswana 3644000 Ms Masego Mookodi Majwana Umbrella Fund 31-Mar Plot 50368, Gaborone P O Box 624, Business Park, Showgrounds Gaborone, Botswana 3617300 Mr Lemogelang Ebineng Majwe Mining Pension Fund 31-Dec Plot 503, Jwaneng Industrial Site, Jwaneng Botswana Private Bag 0012 580 4300 Ms Sesolo RobertMascom Wireless Staff Pension Fund 31-Aug Mascom Wireless, Tsholetsa House, Plot 4705/6, Private Bag B0298 Bontleng, Botswana Road Main Mall Gaborone 3903396 Mr Gape SebonegoMetropolitan Staff Pension Fund 31-Mar Head Office, Standard Private Bag Bo 235, 3624400/ House Main Mall, Gaborone Gaborone, Botswana 3624451 Mr Choice Pitso
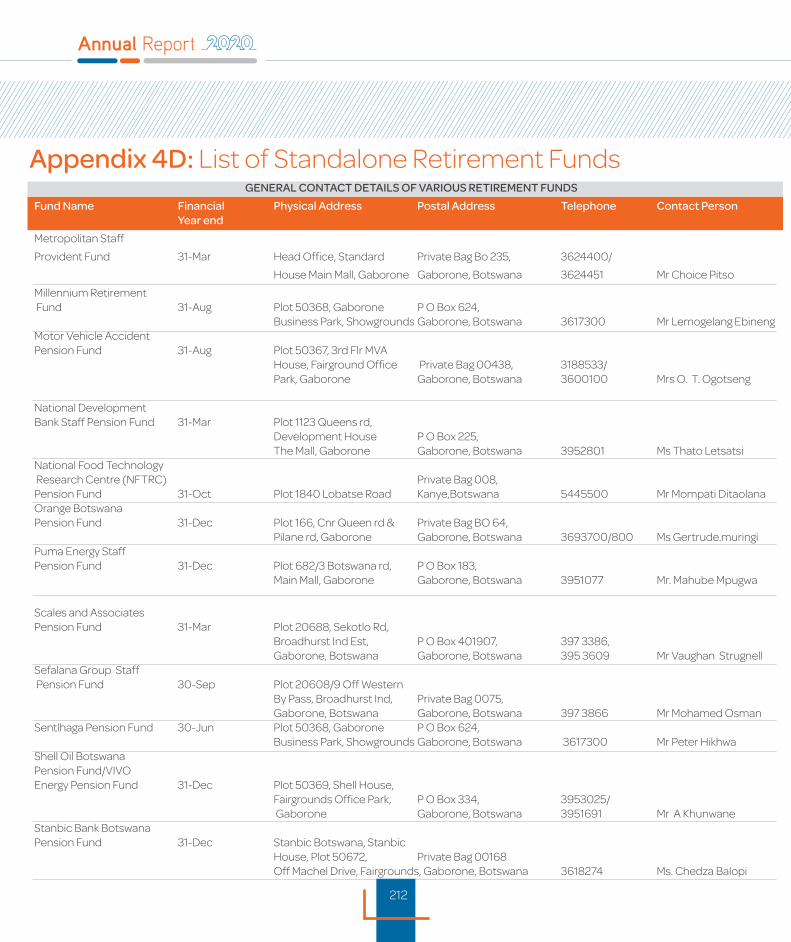
212
GENERAL CONTACT DETAILS OF VARIOUS RETIREMENT FUNDS
Fund Name Financial Physical Address Postal Address Telephone Contact Person Year end
Metropolitan Staff
Provident Fund 31-Mar Head Office, Standard Private Bag Bo 235, 3624400/
House Main Mall, Gaborone Gaborone, Botswana 3624451 Mr Choice Pitso
Millennium Retirement Fund 31-Aug Plot 50368, Gaborone P O Box 624, Business Park, Showgrounds Gaborone, Botswana 3617300 Mr Lemogelang EbinengMotor Vehicle Accident Pension Fund 31-Aug Plot 50367, 3rd Flr MVA House, Fairground Office Private Bag 00438, 3188533/ Park, Gaborone Gaborone, Botswana 3600100 Mrs O. T. Ogotseng National Development Bank Staff Pension Fund 31-Mar Plot 1123 Queens rd, Development House P O Box 225, The Mall, Gaborone Gaborone, Botswana 3952801 Ms Thato LetsatsiNational Food Technology Research Centre (NFTRC) Private Bag 008,Pension Fund 31-Oct Plot 1840 Lobatse Road Kanye,Botswana 5445500 Mr Mompati DitaolanaOrange Botswana Pension Fund 31-Dec Plot 166, Cnr Queen rd & Private Bag BO 64, Pilane rd, Gaborone Gaborone, Botswana 3693700/800 Ms Gertrude.muringiPuma Energy Staff Pension Fund 31-Dec Plot 682/3 Botswana rd, P O Box 183, Main Mall, Gaborone Gaborone, Botswana 3951077 Mr. Mahube Mpugwa
Scales and Associates Pension Fund 31-Mar Plot 20688, Sekotlo Rd, Broadhurst Ind Est, P O Box 401907, 397 3386, Gaborone, Botswana Gaborone, Botswana 395 3609 Mr Vaughan StrugnellSefalana Group Staff Pension Fund 30-Sep Plot 20608/9 Off Western By Pass, Broadhurst Ind, Private Bag 0075, Gaborone, Botswana Gaborone, Botswana 397 3866 Mr Mohamed OsmanSentlhaga Pension Fund 30-Jun Plot 50368, Gaborone P O Box 624, Business Park, Showgrounds Gaborone, Botswana 3617300 Mr Peter HikhwaShell Oil Botswana Pension Fund/VIVO Energy Pension Fund 31-Dec Plot 50369, Shell House, Fairgrounds Office Park, P O Box 334, 3953025/ Gaborone Gaborone, Botswana 3951691 Mr A Khunwane Stanbic Bank Botswana Pension Fund 31-Dec Stanbic Botswana, Stanbic House, Plot 50672, Private Bag 00168 Off Machel Drive, Fairgrounds, Gaborone, Botswana 3618274 Ms. Chedza Balopi
Appendix 4D: List of Standalone Retirement Funds

213
GENERAL CONTACT DETAILS OF VARIOUS RETIREMENT FUNDS
Fund Name Financial Physical Address Postal Address Telephone Contact Person Year end
Standard Chartered Bank Botswana Pension Fund 31-Dec Standard House, The Mall P O Box 496, Gaborone Gaborone, Botswana 360 1628 Mr. Taolo Thobo Gaboilwe
Total Botswana
Pension Fund 31-Dec Plot 22010 P O Box 624,
Kgomokasitwa Road Gaborone, Botswana 3956673 Mr Kabo Semausu
University of Botswana
Staff Pension Fund 31-Mar Corner of Mabutho Private Bag 0022,
& Notwane Gaborone, Botswana 3552031 Mr L. Mosupi
Water Utilities
Corporation Staff
Pension Fund 31-Mar Sedibeng House, Plot 17530 Private Bag 00276,
Luthuli rd, Gaborone Gaborone, Botswana 3604480 Mrs Taboka Muke
Appendix 4D: List of Standalone Retirement Funds
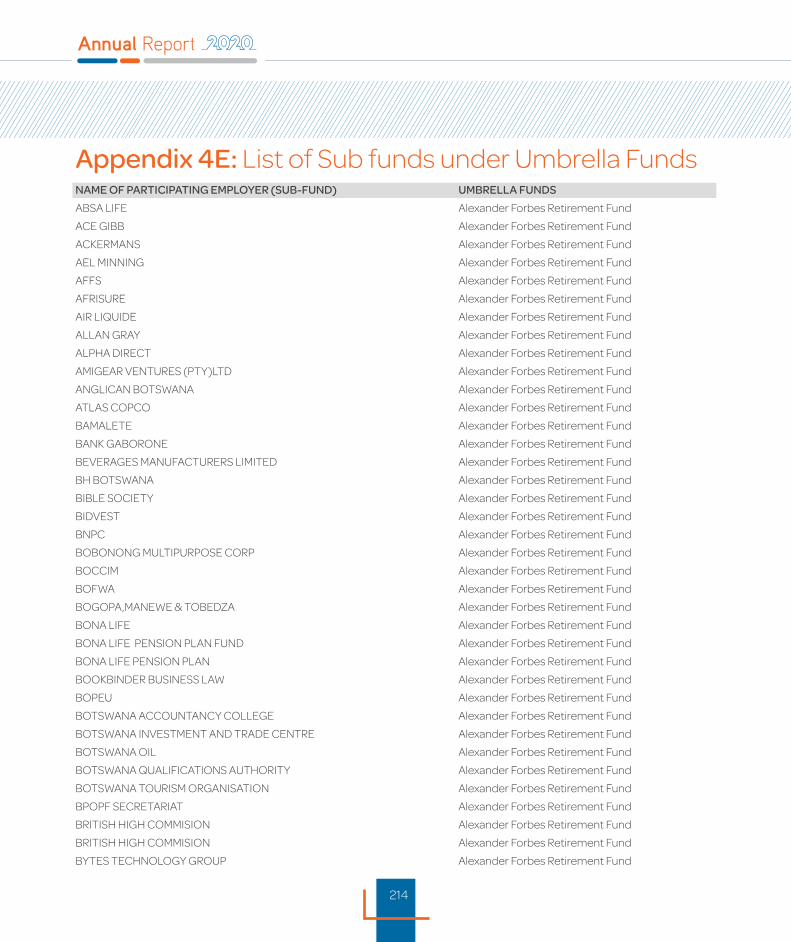
214
Appendix 4E: List of Sub funds under Umbrella FundsNAME OF PARTICIPATING EMPLOYER (SUB-FUND) UMBRELLA FUNDS
ABSA LIFE Alexander Forbes Retirement Fund
ACE GIBB Alexander Forbes Retirement Fund
ACKERMANS Alexander Forbes Retirement Fund
AEL MINNING Alexander Forbes Retirement Fund
AFFS Alexander Forbes Retirement Fund
AFRISURE Alexander Forbes Retirement Fund
AIR LIQUIDE Alexander Forbes Retirement Fund
ALLAN GRAY Alexander Forbes Retirement Fund
ALPHA DIRECT Alexander Forbes Retirement Fund
AMIGEAR VENTURES (PTY)LTD Alexander Forbes Retirement Fund
ANGLICAN BOTSWANA Alexander Forbes Retirement Fund
ATLAS COPCO Alexander Forbes Retirement Fund
BAMALETE Alexander Forbes Retirement Fund
BANK GABORONE Alexander Forbes Retirement Fund
BEVERAGES MANUFACTURERS LIMITED Alexander Forbes Retirement Fund
BH BOTSWANA Alexander Forbes Retirement Fund
BIBLE SOCIETY Alexander Forbes Retirement Fund
BIDVEST Alexander Forbes Retirement Fund
BNPC Alexander Forbes Retirement Fund
BOBONONG MULTIPURPOSE CORP Alexander Forbes Retirement Fund
BOCCIM Alexander Forbes Retirement Fund
BOFWA Alexander Forbes Retirement Fund
BOGOPA,MANEWE & TOBEDZA Alexander Forbes Retirement Fund
BONA LIFE Alexander Forbes Retirement Fund
BONA LIFE PENSION PLAN FUND Alexander Forbes Retirement Fund
BONA LIFE PENSION PLAN Alexander Forbes Retirement Fund
BOOKBINDER BUSINESS LAW Alexander Forbes Retirement Fund
BOPEU Alexander Forbes Retirement Fund
BOTSWANA ACCOUNTANCY COLLEGE Alexander Forbes Retirement Fund
BOTSWANA INVESTMENT AND TRADE CENTRE Alexander Forbes Retirement Fund
BOTSWANA OIL Alexander Forbes Retirement Fund
BOTSWANA QUALIFICATIONS AUTHORITY Alexander Forbes Retirement Fund
BOTSWANA TOURISM ORGANISATION Alexander Forbes Retirement Fund
BPOPF SECRETARIAT Alexander Forbes Retirement Fund
BRITISH HIGH COMMISION Alexander Forbes Retirement Fund
BRITISH HIGH COMMISION Alexander Forbes Retirement Fund
BYTES TECHNOLOGY GROUP Alexander Forbes Retirement Fund
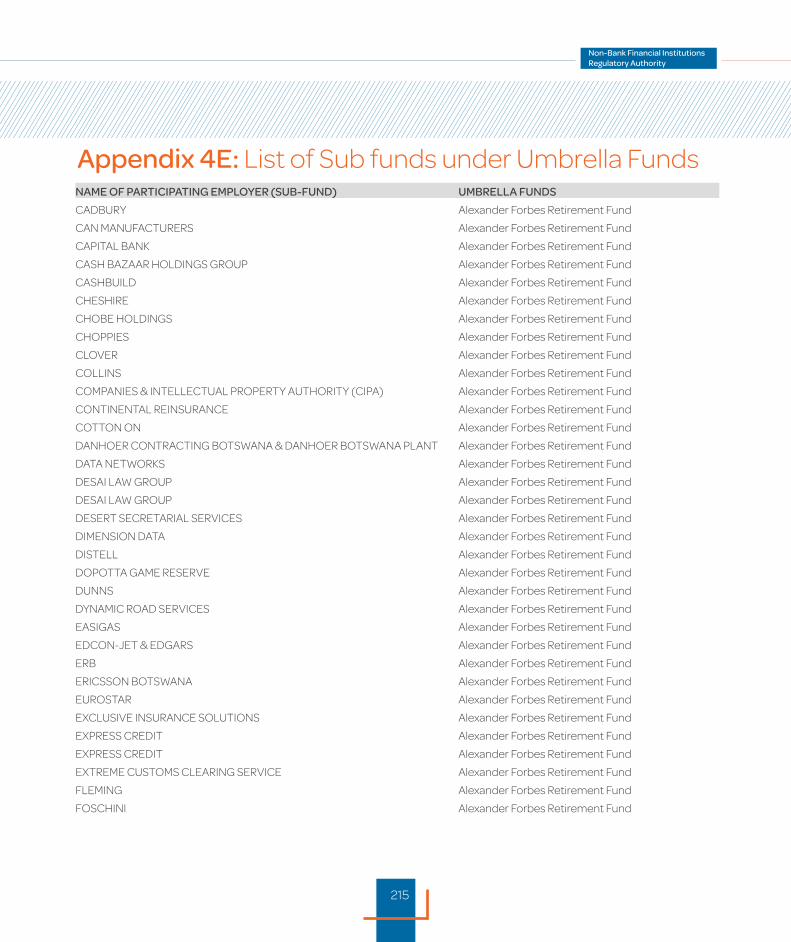
215
Appendix 4E: List of Sub funds under Umbrella FundsNAME OF PARTICIPATING EMPLOYER (SUB-FUND) UMBRELLA FUNDS
CADBURY Alexander Forbes Retirement Fund
CAN MANUFACTURERS Alexander Forbes Retirement Fund
CAPITAL BANK Alexander Forbes Retirement Fund
CASH BAZAAR HOLDINGS GROUP Alexander Forbes Retirement Fund
CASHBUILD Alexander Forbes Retirement Fund
CHESHIRE Alexander Forbes Retirement Fund
CHOBE HOLDINGS Alexander Forbes Retirement Fund
CHOPPIES Alexander Forbes Retirement Fund
CLOVER Alexander Forbes Retirement Fund
COLLINS Alexander Forbes Retirement Fund
COMPANIES & INTELLECTUAL PROPERTY AUTHORITY (CIPA) Alexander Forbes Retirement Fund
CONTINENTAL REINSURANCE Alexander Forbes Retirement Fund
COTTON ON Alexander Forbes Retirement Fund
DANHOER CONTRACTING BOTSWANA & DANHOER BOTSWANA PLANT Alexander Forbes Retirement Fund
DATA NETWORKS Alexander Forbes Retirement Fund
DESAI LAW GROUP Alexander Forbes Retirement Fund
DESAI LAW GROUP Alexander Forbes Retirement Fund
DESERT SECRETARIAL SERVICES Alexander Forbes Retirement Fund
DIMENSION DATA Alexander Forbes Retirement Fund
DISTELL Alexander Forbes Retirement Fund
DOPOTTA GAME RESERVE Alexander Forbes Retirement Fund
DUNNS Alexander Forbes Retirement Fund
DYNAMIC ROAD SERVICES Alexander Forbes Retirement Fund
EASIGAS Alexander Forbes Retirement Fund
EDCON-JET & EDGARS Alexander Forbes Retirement Fund
ERB Alexander Forbes Retirement Fund
ERICSSON BOTSWANA Alexander Forbes Retirement Fund
EUROSTAR Alexander Forbes Retirement Fund
EXCLUSIVE INSURANCE SOLUTIONS Alexander Forbes Retirement Fund
EXPRESS CREDIT Alexander Forbes Retirement Fund
EXPRESS CREDIT Alexander Forbes Retirement Fund
EXTREME CUSTOMS CLEARING SERVICE Alexander Forbes Retirement Fund
FLEMING Alexander Forbes Retirement Fund
FOSCHINI Alexander Forbes Retirement Fund
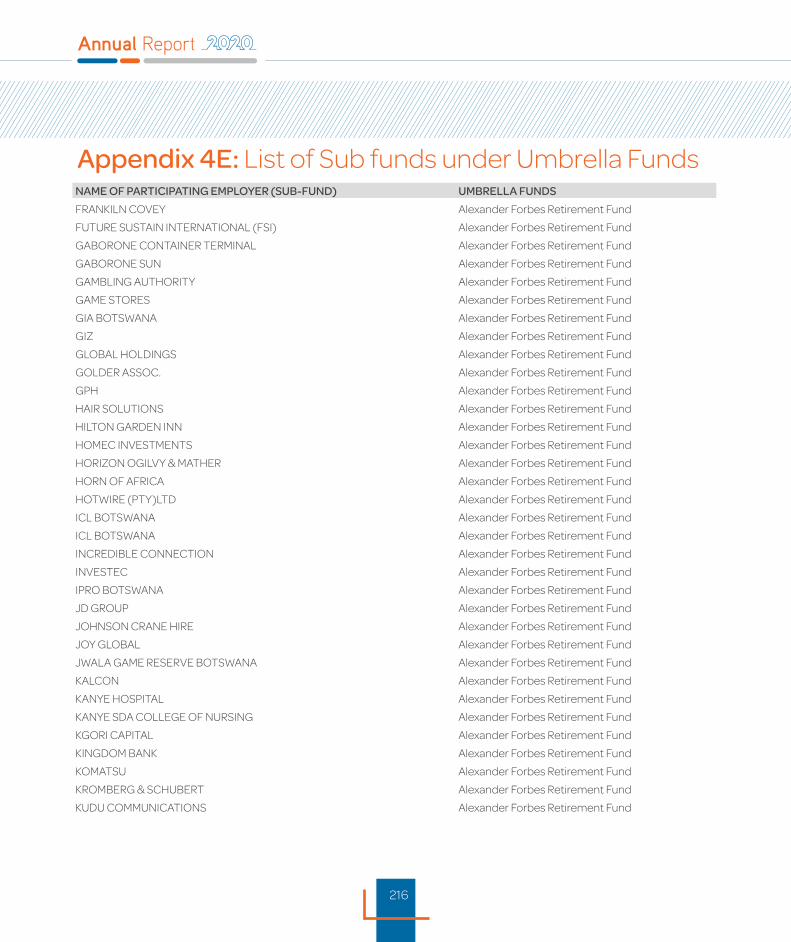
216
NAME OF PARTICIPATING EMPLOYER (SUB-FUND) UMBRELLA FUNDS
FRANKILN COVEY Alexander Forbes Retirement Fund
FUTURE SUSTAIN INTERNATIONAL (FSI) Alexander Forbes Retirement Fund
GABORONE CONTAINER TERMINAL Alexander Forbes Retirement Fund
GABORONE SUN Alexander Forbes Retirement Fund
GAMBLING AUTHORITY Alexander Forbes Retirement Fund
GAME STORES Alexander Forbes Retirement Fund
GIA BOTSWANA Alexander Forbes Retirement Fund
GIZ Alexander Forbes Retirement Fund
GLOBAL HOLDINGS Alexander Forbes Retirement Fund
GOLDER ASSOC. Alexander Forbes Retirement Fund
GPH Alexander Forbes Retirement Fund
HAIR SOLUTIONS Alexander Forbes Retirement Fund
HILTON GARDEN INN Alexander Forbes Retirement Fund
HOMEC INVESTMENTS Alexander Forbes Retirement Fund
HORIZON OGILVY & MATHER Alexander Forbes Retirement Fund
HORN OF AFRICA Alexander Forbes Retirement Fund
HOTWIRE (PTY)LTD Alexander Forbes Retirement Fund
ICL BOTSWANA Alexander Forbes Retirement Fund
ICL BOTSWANA Alexander Forbes Retirement Fund
INCREDIBLE CONNECTION Alexander Forbes Retirement Fund
INVESTEC Alexander Forbes Retirement Fund
IPRO BOTSWANA Alexander Forbes Retirement Fund
JD GROUP Alexander Forbes Retirement Fund
JOHNSON CRANE HIRE Alexander Forbes Retirement Fund
JOY GLOBAL Alexander Forbes Retirement Fund
JWALA GAME RESERVE BOTSWANA Alexander Forbes Retirement Fund
KALCON Alexander Forbes Retirement Fund
KANYE HOSPITAL Alexander Forbes Retirement Fund
KANYE SDA COLLEGE OF NURSING Alexander Forbes Retirement Fund
KGORI CAPITAL Alexander Forbes Retirement Fund
KINGDOM BANK Alexander Forbes Retirement Fund
KOMATSU Alexander Forbes Retirement Fund
KROMBERG & SCHUBERT Alexander Forbes Retirement Fund
KUDU COMMUNICATIONS Alexander Forbes Retirement Fund
Appendix 4E: List of Sub funds under Umbrella Funds

217
Appendix 4E: List of Sub funds under Umbrella FundsNAME OF PARTICIPATING EMPLOYER (SUB-FUND) UMBRELLA FUNDS
LAS Alexander Forbes Retirement Fund
LAURELTON DIAMONDS Alexander Forbes Retirement Fund
LEO SCHACHTER Alexander Forbes Retirement Fund
LETSHEGO HOLDINGS LTD Alexander Forbes Retirement Fund
LEWIS GROUP BOTSWANA Alexander Forbes Retirement Fund
LIMKOKWING Alexander Forbes Retirement Fund
MAGNUM FREIGHT Alexander Forbes Retirement Fund
MANCOSA Alexander Forbes Retirement Fund
MAPLETON GROUP Alexander Forbes Retirement Fund
MARSH Alexander Forbes Retirement Fund
MASS MART Alexander Forbes Retirement Fund
MASTER PRODUCTS Alexander Forbes Retirement Fund
MEDICAL REGULATORY AUTHORITY Alexander Forbes Retirement Fund
MEDLANE HEALTHCARE Alexander Forbes Retirement Fund
MEDPLUS Alexander Forbes Retirement Fund
MG PROPERTIES Alexander Forbes Retirement Fund
MOCHUDI RESOURCE CTR Alexander Forbes Retirement Fund
MOITIRI CAPITAL (PTY)LTD Alexander Forbes Retirement Fund
MOTSWEDI SECURITIES Alexander Forbes Retirement Fund
MR PRICE Alexander Forbes Retirement Fund
MULTICHOICE Alexander Forbes Retirement Fund
MULTIWASTE Alexander Forbes Retirement Fund
MULTOTEC Alexander Forbes Retirement Fund
NAMPAK Alexander Forbes Retirement Fund
NAMPAK DIVFOOD Alexander Forbes Retirement Fund
NBL BOTSWANA Alexander Forbes Retirement Fund
NEW ERA Alexander Forbes Retirement Fund
NGAMILAND ADVENTURE SAFARIS Alexander Forbes Retirement Fund
NON-BANK FINANCIAL INSTITUTIONS REGULATORY AUTHORITY Alexander Forbes Retirement Fund
NTS PICK & PAY Alexander Forbes Retirement Fund
NTT NISSAN GROUP Alexander Forbes Retirement Fund
OLD MUTUAL Alexander Forbes Retirement Fund
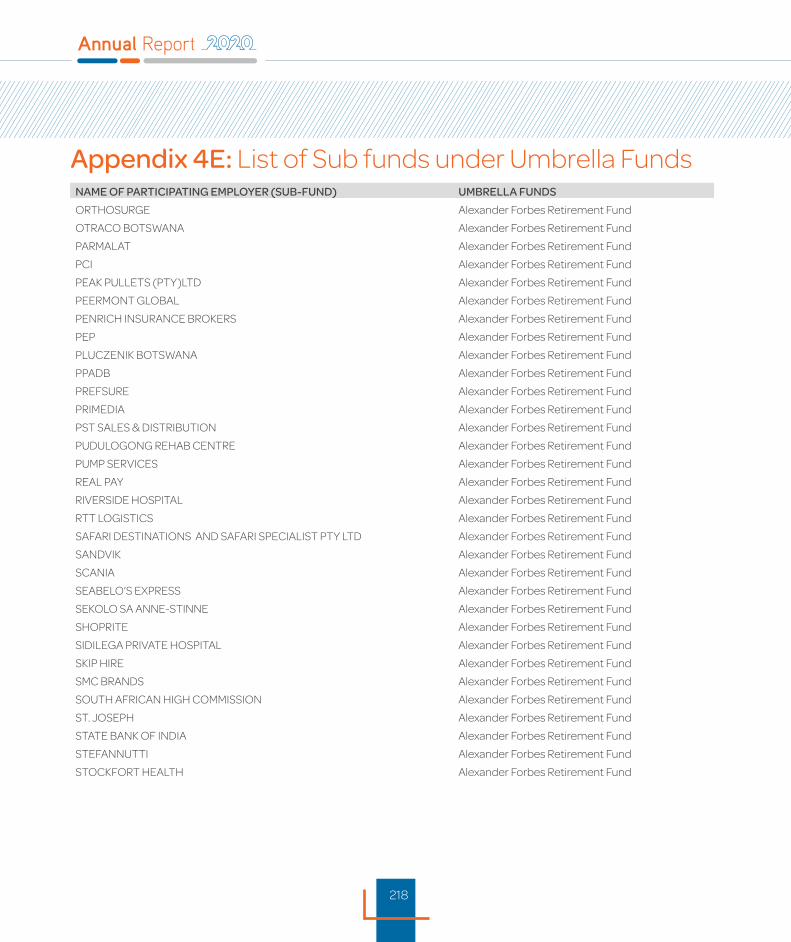
218
NAME OF PARTICIPATING EMPLOYER (SUB-FUND) UMBRELLA FUNDS
ORTHOSURGE Alexander Forbes Retirement Fund
OTRACO BOTSWANA Alexander Forbes Retirement Fund
PARMALAT Alexander Forbes Retirement Fund
PCI Alexander Forbes Retirement Fund
PEAK PULLETS (PTY)LTD Alexander Forbes Retirement Fund
PEERMONT GLOBAL Alexander Forbes Retirement Fund
PENRICH INSURANCE BROKERS Alexander Forbes Retirement Fund
PEP Alexander Forbes Retirement Fund
PLUCZENIK BOTSWANA Alexander Forbes Retirement Fund
PPADB Alexander Forbes Retirement Fund
PREFSURE Alexander Forbes Retirement Fund
PRIMEDIA Alexander Forbes Retirement Fund
PST SALES & DISTRIBUTION Alexander Forbes Retirement Fund
PUDULOGONG REHAB CENTRE Alexander Forbes Retirement Fund
PUMP SERVICES Alexander Forbes Retirement Fund
REAL PAY Alexander Forbes Retirement Fund
RIVERSIDE HOSPITAL Alexander Forbes Retirement Fund
RTT LOGISTICS Alexander Forbes Retirement Fund
SAFARI DESTINATIONS AND SAFARI SPECIALIST PTY LTD Alexander Forbes Retirement Fund
SANDVIK Alexander Forbes Retirement Fund
SCANIA Alexander Forbes Retirement Fund
SEABELO’S EXPRESS Alexander Forbes Retirement Fund
SEKOLO SA ANNE-STINNE Alexander Forbes Retirement Fund
SHOPRITE Alexander Forbes Retirement Fund
SIDILEGA PRIVATE HOSPITAL Alexander Forbes Retirement Fund
SKIP HIRE Alexander Forbes Retirement Fund
SMC BRANDS Alexander Forbes Retirement Fund
SOUTH AFRICAN HIGH COMMISSION Alexander Forbes Retirement Fund
ST. JOSEPH Alexander Forbes Retirement Fund
STATE BANK OF INDIA Alexander Forbes Retirement Fund
STEFANNUTTI Alexander Forbes Retirement Fund
STOCKFORT HEALTH Alexander Forbes Retirement Fund
Appendix 4E: List of Sub funds under Umbrella Funds

219
Appendix 4E: List of Sub funds under Umbrella FundsNAME OF PARTICIPATING EMPLOYER (SUB-FUND) UMBRELLA FUNDS
STOCKFORT HEALTH Alexander Forbes Retirement Fund
STYLE CLOTHING Alexander Forbes Retirement Fund
SYMPHONIC Alexander Forbes Retirement Fund
TESCARECO BOTSWANA Alexander Forbes Retirement Fund
TIME PROJECTS Alexander Forbes Retirement Fund
TRIOPTIMUM LOGISTICS Alexander Forbes Retirement Fund
TSEBO BOTSWANA Alexander Forbes Retirement Fund
TURNSTAR Alexander Forbes Retirement Fund
TYRES SERVICES Alexander Forbes Retirement Fund
UCCSA Alexander Forbes Retirement Fund
UNITRANS Alexander Forbes Retirement Fund
UPT Alexander Forbes Retirement Fund
VDDB Alexander Forbes Retirement Fund
VEOLIA WATER TECHNOLOGIES BOTSWANA Alexander Forbes Retirement Fund
VIRGIN ACTIVE Alexander Forbes Retirement Fund
WEEKEND POST Alexander Forbes Retirement Fund
WESTERN INSURANCE BOTSWANA Alexander Forbes Retirement Fund
WILDERNESS SAFARIS Alexander Forbes Retirement Fund
XCCS PTY LTD Alexander Forbes Retirement Fund
YARONA FM Alexander Forbes Retirement Fund
AIR LIQUIDE Africa 53 Provident Fund
ALPHA DIRECT INSURANCE COMPANY Africa 53 Provident Fund
AMP CONTROL BOTSWANA Africa 53 Provident Fund
BAMALETE Africa 53 Provident Fund
BIDVEST GROUP LIMITED Africa 53 Provident Fund
BOGOPA,MANEWE & TOBEDZA Africa 53 Provident Fund
BOPEU Africa 53 Provident Fund
BOTGOOD INVESTMENTS PROVIDENT FUND Africa 53 Provident Fund
BYTES TECHNOLOGY Africa 53 Provident Fund
C.E.B MAINTENANCE STAFF PENSION FUND Africa 53 Provident Fund
DIALOGUE GROUP Africa 53 Provident Fund
EXCLUSIVE INSURANCE SOLUTIONS Africa 53 Provident Fund
EXPRESS CREDIT Africa 53 Provident Fund
EXTREME CUSTOMS Africa 53 Provident Fund
NAME OF PARTICIPATING EMPLOYER (SUB-FUND) UMBRELLA FUNDS
HORIZON OGILVY & MATHER Africa 53 Provident Fund
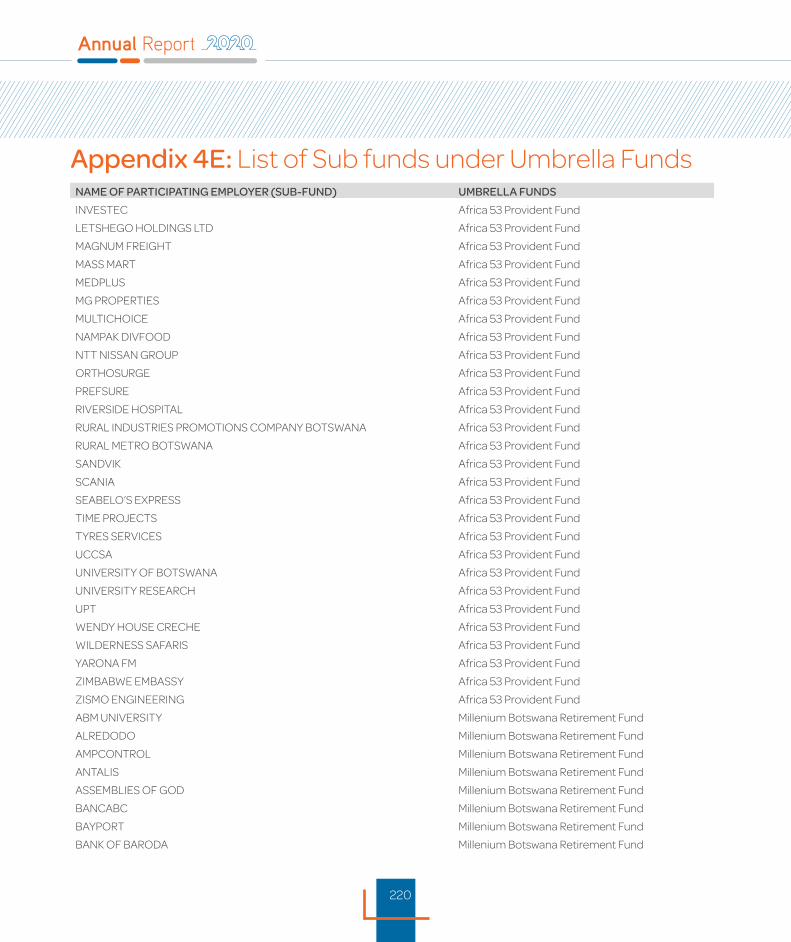
220
NAME OF PARTICIPATING EMPLOYER (SUB-FUND) UMBRELLA FUNDS
INVESTEC Africa 53 Provident Fund
LETSHEGO HOLDINGS LTD Africa 53 Provident Fund
MAGNUM FREIGHT Africa 53 Provident Fund
MASS MART Africa 53 Provident Fund
MEDPLUS Africa 53 Provident Fund
MG PROPERTIES Africa 53 Provident Fund
MULTICHOICE Africa 53 Provident Fund
NAMPAK DIVFOOD Africa 53 Provident Fund
NTT NISSAN GROUP Africa 53 Provident Fund
ORTHOSURGE Africa 53 Provident Fund
PREFSURE Africa 53 Provident Fund
RIVERSIDE HOSPITAL Africa 53 Provident Fund
RURAL INDUSTRIES PROMOTIONS COMPANY BOTSWANA Africa 53 Provident Fund
RURAL METRO BOTSWANA Africa 53 Provident Fund
SANDVIK Africa 53 Provident Fund
SCANIA Africa 53 Provident Fund
SEABELO’S EXPRESS Africa 53 Provident Fund
TIME PROJECTS Africa 53 Provident Fund
TYRES SERVICES Africa 53 Provident Fund
UCCSA Africa 53 Provident Fund
UNIVERSITY OF BOTSWANA Africa 53 Provident Fund
UNIVERSITY RESEARCH Africa 53 Provident Fund
UPT Africa 53 Provident Fund
WENDY HOUSE CRECHE Africa 53 Provident Fund
WILDERNESS SAFARIS Africa 53 Provident Fund
YARONA FM Africa 53 Provident Fund
ZIMBABWE EMBASSY Africa 53 Provident Fund
ZISMO ENGINEERING Africa 53 Provident Fund
ABM UNIVERSITY Millenium Botswana Retirement Fund
ALREDODO Millenium Botswana Retirement Fund
AMPCONTROL Millenium Botswana Retirement Fund
ANTALIS Millenium Botswana Retirement Fund
ASSEMBLIES OF GOD Millenium Botswana Retirement Fund
BANCABC Millenium Botswana Retirement Fund
BAYPORT Millenium Botswana Retirement Fund
BANK OF BARODA Millenium Botswana Retirement Fund
Appendix 4E: List of Sub funds under Umbrella Funds

221
Appendix 4E: List of Sub funds under Umbrella FundsNAME OF PARTICIPATING EMPLOYER (SUB-FUND) UMBRELLA FUNDS
BNSC Millenium Botswana Retirement Fund
BOIB Millenium Botswana Retirement Fund
BOTHO UNIVERSITY Millenium Botswana Retirement Fund
BOTSALO Millenium Botswana Retirement Fund
BOTSWANA COURIERS Millenium Botswana Retirement Fund
BOTUSAFE Millenium Botswana Retirement Fund
BSE Millenium Botswana Retirement Fund
CASHBUILD Millenium Botswana Retirement Fund
CCB Millenium Botswana Retirement Fund
CITF Millenium Botswana Retirement Fund
COWBURN Millenium Botswana Retirement Fund
CRESTA Millenium Botswana Retirement Fund
C1TY LODGE Millenium Botswana Retirement Fund
DYNAMIC Millenium Botswana Retirement Fund
ELLERINE Millenium Botswana Retirement Fund
GENESIS ORTHODONTIS Millenium Botswana Retirement Fund
GEOFLUX Millenium Botswana Retirement Fund
GRANT THORNTON Millenium Botswana Retirement Fund
HEINEMENN Millenium Botswana Retirement Fund
ITC Millenium Botswana Retirement Fund
KHOEMACAU Millenium Botswana Retirement Fund
KHUMO Millenium Botswana Retirement Fund
KHUPE Millenium Botswana Retirement Fund
LCW Millenium Botswana Retirement Fund
LSC Millenium Botswana Retirement Fund
MACMILLAN Millenium Botswana Retirement Fund
MANICA Millenium Botswana Retirement Fund
MASTER FARMER Millenium Botswana Retirement Fund
METROPOLITAN HEALTH Millenium Botswana Retirement Fund
MORE POWER Millenium Botswana Retirement Fund
MURRAY & ROBERTS Millenium Botswana Retirement Fund
OKAVANGO DIAMOND Millenium Botswana Retirement Fund
OTIS Millenium Botswana Retirement Fund
PREFHOLD Millenium Botswana Retirement Fund
PWC Millenium Botswana Retirement Fund
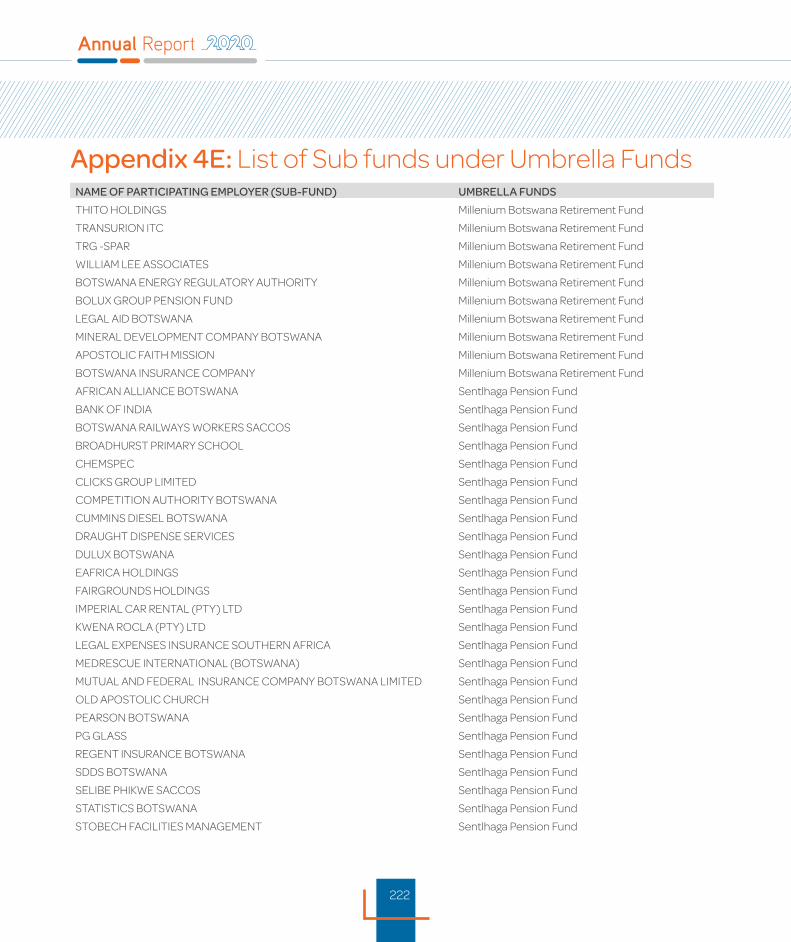
222
NAME OF PARTICIPATING EMPLOYER (SUB-FUND) UMBRELLA FUNDS
THITO HOLDINGS Millenium Botswana Retirement Fund
TRANSURION ITC Millenium Botswana Retirement Fund
TRG -SPAR Millenium Botswana Retirement Fund
WILLIAM LEE ASSOCIATES Millenium Botswana Retirement Fund
BOTSWANA ENERGY REGULATORY AUTHORITY Millenium Botswana Retirement Fund
BOLUX GROUP PENSION FUND Millenium Botswana Retirement Fund
LEGAL AID BOTSWANA Millenium Botswana Retirement Fund
MINERAL DEVELOPMENT COMPANY BOTSWANA Millenium Botswana Retirement Fund
APOSTOLIC FAITH MISSION Millenium Botswana Retirement Fund
BOTSWANA INSURANCE COMPANY Millenium Botswana Retirement Fund
AFRICAN ALLIANCE BOTSWANA Sentlhaga Pension Fund
BANK OF INDIA Sentlhaga Pension Fund
BOTSWANA RAILWAYS WORKERS SACCOS Sentlhaga Pension Fund
BROADHURST PRIMARY SCHOOL Sentlhaga Pension Fund
CHEMSPEC Sentlhaga Pension Fund
CLICKS GROUP LIMITED Sentlhaga Pension Fund
COMPETITION AUTHORITY BOTSWANA Sentlhaga Pension Fund
CUMMINS DIESEL BOTSWANA Sentlhaga Pension Fund
DRAUGHT DISPENSE SERVICES Sentlhaga Pension Fund
DULUX BOTSWANA Sentlhaga Pension Fund
EAFRICA HOLDINGS Sentlhaga Pension Fund
FAIRGROUNDS HOLDINGS Sentlhaga Pension Fund
IMPERIAL CAR RENTAL (PTY) LTD Sentlhaga Pension Fund
KWENA ROCLA (PTY) LTD Sentlhaga Pension Fund
LEGAL EXPENSES INSURANCE SOUTHERN AFRICA Sentlhaga Pension Fund
MEDRESCUE INTERNATIONAL (BOTSWANA) Sentlhaga Pension Fund
MUTUAL AND FEDERAL INSURANCE COMPANY BOTSWANA LIMITED Sentlhaga Pension Fund
OLD APOSTOLIC CHURCH Sentlhaga Pension Fund
PEARSON BOTSWANA Sentlhaga Pension Fund
PG GLASS Sentlhaga Pension Fund
REGENT INSURANCE BOTSWANA Sentlhaga Pension Fund
SDDS BOTSWANA Sentlhaga Pension Fund
SELIBE PHIKWE SACCOS Sentlhaga Pension Fund
STATISTICS BOTSWANA Sentlhaga Pension Fund
STOBECH FACILITIES MANAGEMENT Sentlhaga Pension Fund
Appendix 4E: List of Sub funds under Umbrella Funds
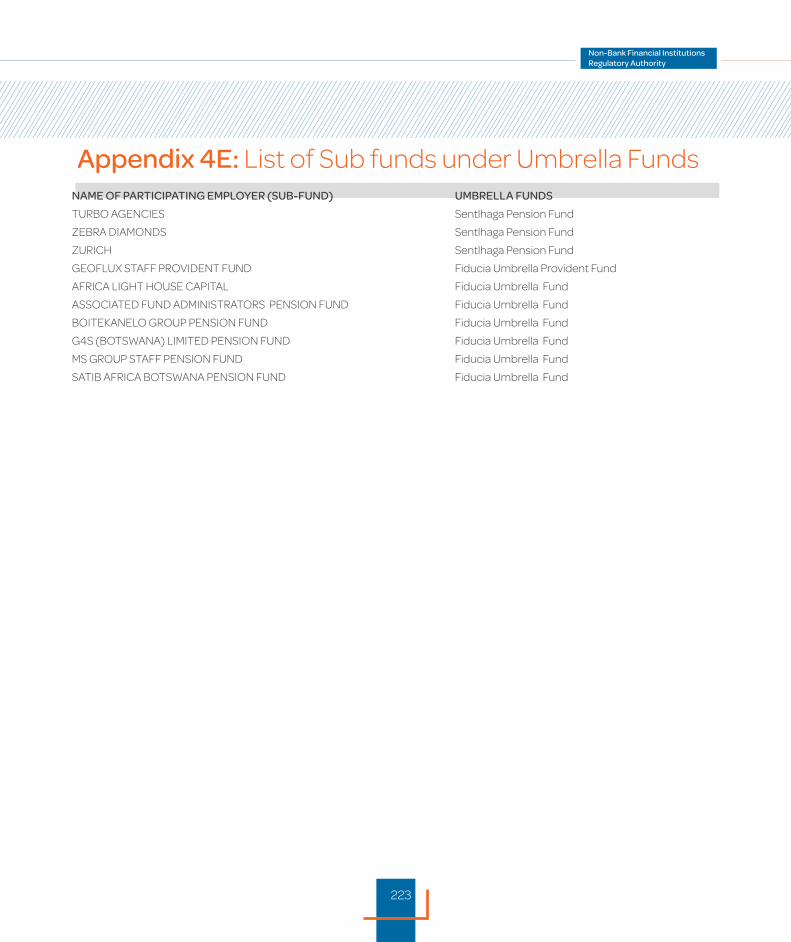
223
Appendix 4E: List of Sub funds under Umbrella FundsNAME OF PARTICIPATING EMPLOYER (SUB-FUND) UMBRELLA FUNDS
TURBO AGENCIES Sentlhaga Pension Fund
ZEBRA DIAMONDS Sentlhaga Pension Fund
ZURICH Sentlhaga Pension Fund
GEOFLUX STAFF PROVIDENT FUND Fiducia Umbrella Provident Fund
AFRICA LIGHT HOUSE CAPITAL Fiducia Umbrella Fund
ASSOCIATED FUND ADMINISTRATORS PENSION FUND Fiducia Umbrella Fund
BOITEKANELO GROUP PENSION FUND Fiducia Umbrella Fund
G4S (BOTSWANA) LIMITED PENSION FUND Fiducia Umbrella Fund
MS GROUP STAFF PENSION FUND Fiducia Umbrella Fund
SATIB AFRICA BOTSWANA PENSION FUND Fiducia Umbrella Fund
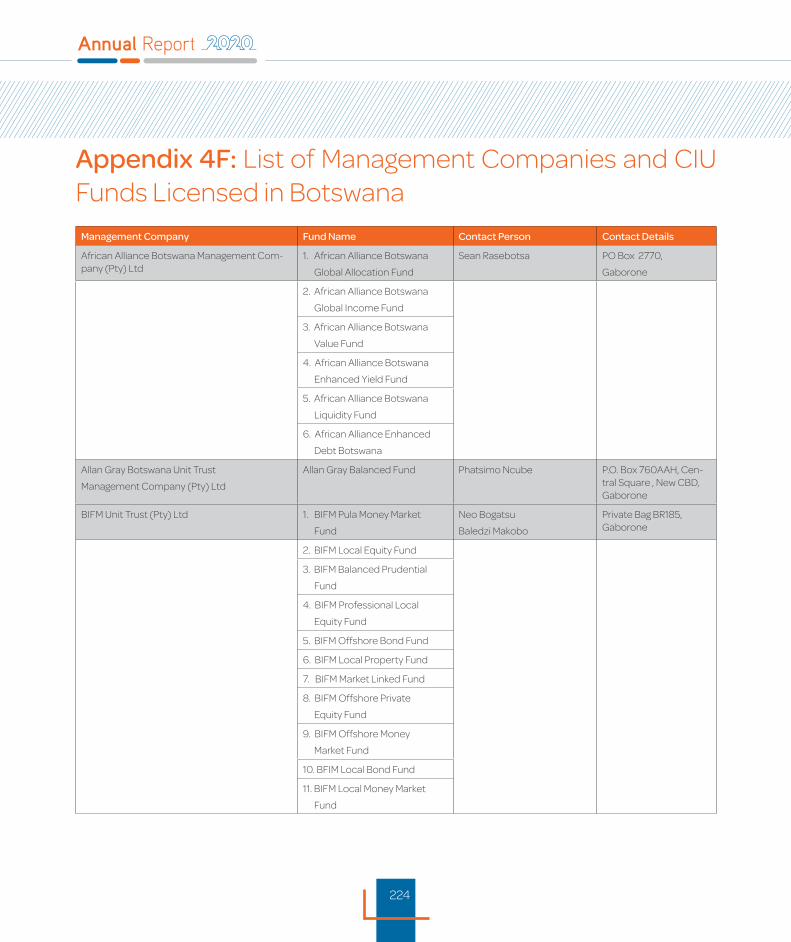
224
Appendix 4F: List of Management Companies and CIU Funds Licensed in Botswana
Management Company Fund Name Contact Person Contact Details
African Alliance Botswana Management Com-pany (Pty) Ltd
1. African Alliance Botswana
Global Allocation Fund
Sean Rasebotsa PO Box 2770,
Gaborone
2. African Alliance Botswana
Global Income Fund
3. African Alliance Botswana
Value Fund
4. African Alliance Botswana
Enhanced Yield Fund
5. African Alliance Botswana
Liquidity Fund
6. African Alliance Enhanced
Debt Botswana
Allan Gray Botswana Unit Trust
Management Company (Pty) Ltd
Allan Gray Balanced Fund Phatsimo Ncube P.O. Box 760AAH, Cen-tral Square , New CBD, Gaborone
BIFM Unit Trust (Pty) Ltd 1. BIFM Pula Money Market
Fund
Neo Bogatsu
Baledzi Makobo
Private Bag BR185, Gaborone
2. BIFM Local Equity Fund
3. BIFM Balanced Prudential
Fund
4. BIFM Professional Local
Equity Fund
5. BIFM Offshore Bond Fund
6. BIFM Local Property Fund
7. BIFM Market Linked Fund
8. BIFM Offshore Private
Equity Fund
9. BIFM Offshore Money
Market Fund
10. BFIM Local Bond Fund
11. BIFM Local Money Market
Fund
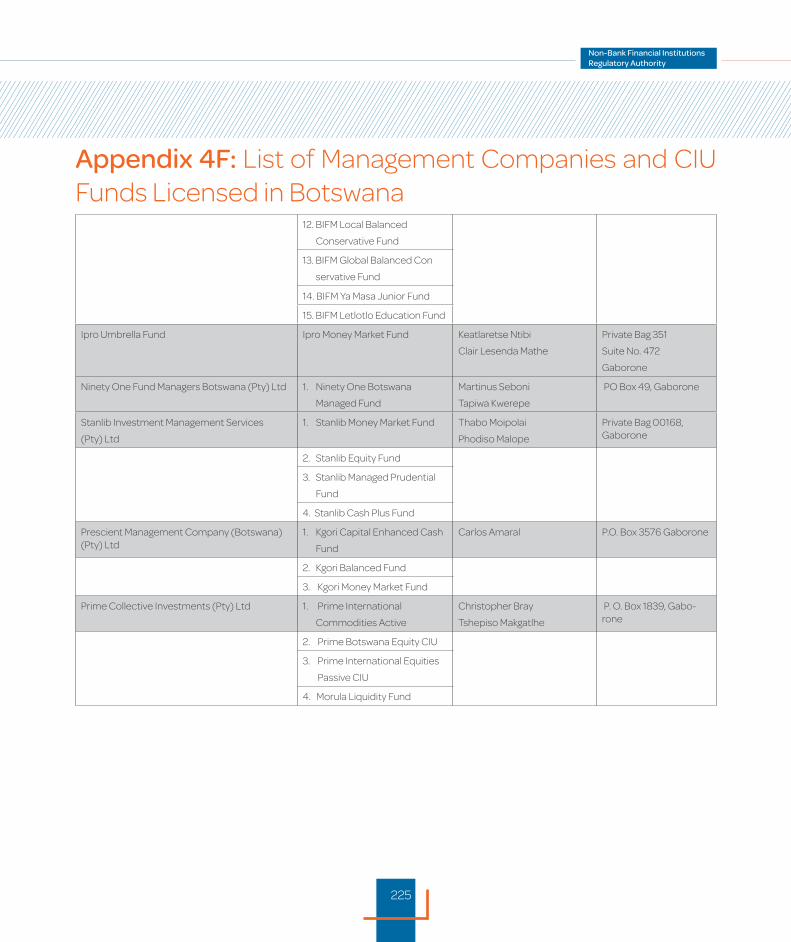
225
12. BIFM Local Balanced
Conservative Fund
13. BIFM Global Balanced Con
servative Fund
14. BIFM Ya Masa Junior Fund
15. BIFM Letlotlo Education Fund
Ipro Umbrella Fund Ipro Money Market Fund Keatlaretse Ntibi
Clair Lesenda Mathe
Private Bag 351
Suite No. 472
Gaborone
Ninety One Fund Managers Botswana (Pty) Ltd 1. Ninety One Botswana
Managed Fund
Martinus Seboni
Tapiwa Kwerepe
PO Box 49, Gaborone
Stanlib Investment Management Services
(Pty) Ltd
1. Stanlib Money Market Fund Thabo Moipolai
Phodiso Malope
Private Bag 00168, Gaborone
2. Stanlib Equity Fund
3. Stanlib Managed Prudential
Fund
4. Stanlib Cash Plus Fund
Prescient Management Company (Botswana) (Pty) Ltd
1. Kgori Capital Enhanced Cash
Fund
Carlos Amaral P.O. Box 3576 Gaborone
2. Kgori Balanced Fund
3. Kgori Money Market Fund
Prime Collective Investments (Pty) Ltd 1. Prime International
Commodities Active
Christopher Bray
Tshepiso Makgatlhe
P. O. Box 1839, Gabo-rone
2. Prime Botswana Equity CIU
3. Prime International Equities
Passive CIU
4. Morula Liquidity Fund
Appendix 4F: List of Management Companies and CIU Funds Licensed in Botswana
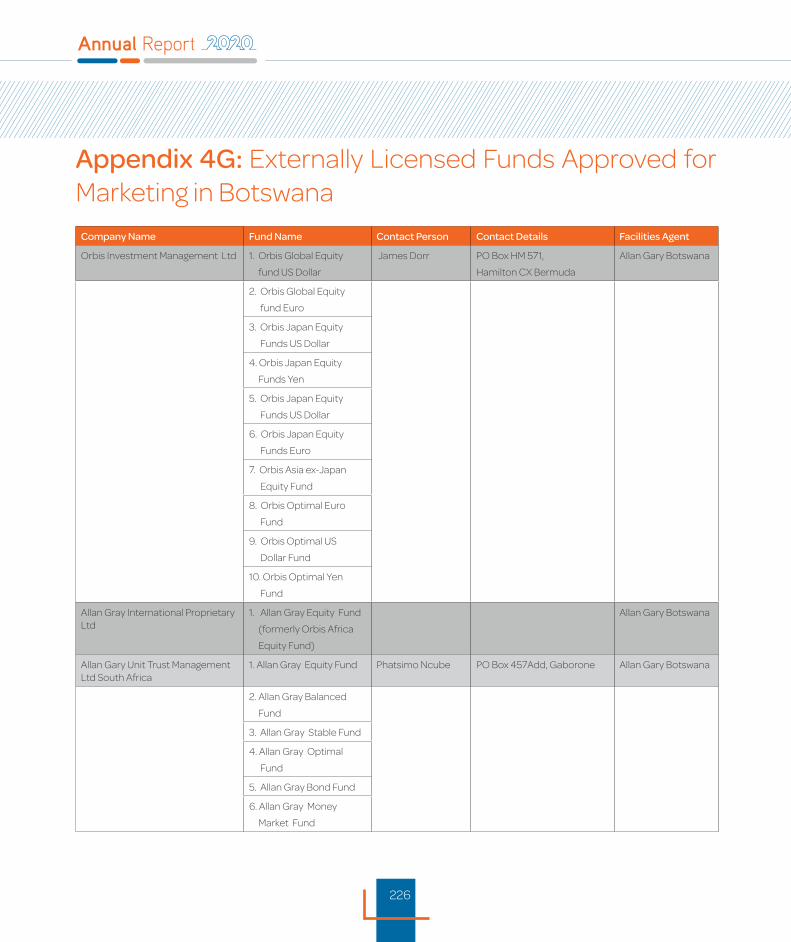
226
Appendix 4G: Externally Licensed Funds Approved for Marketing in Botswana
Company Name Fund Name Contact Person Contact Details Facilities Agent
Orbis Investment Management Ltd 1. Orbis Global Equity
fund US Dollar
James Dorr PO Box HM 571,
Hamilton CX Bermuda
Allan Gary Botswana
2. Orbis Global Equity
fund Euro
3. Orbis Japan Equity
Funds US Dollar
4. Orbis Japan Equity
Funds Yen
5. Orbis Japan Equity
Funds US Dollar
6. Orbis Japan Equity
Funds Euro
7. Orbis Asia ex-Japan
Equity Fund
8. Orbis Optimal Euro
Fund
9. Orbis Optimal US
Dollar Fund
10. Orbis Optimal Yen
Fund
Allan Gray International Proprietary Ltd
1. Allan Gray Equity Fund
(formerly Orbis Africa
Equity Fund)
Allan Gary Botswana
Allan Gary Unit Trust Management Ltd South Africa
1. Allan Gray Equity Fund Phatsimo Ncube PO Box 457Add, Gaborone Allan Gary Botswana
2. Allan Gray Balanced
Fund
3. Allan Gray Stable Fund
4. Allan Gray Optimal
Fund
5. Allan Gray Bond Fund
6. Allan Gray Money
Market Fund
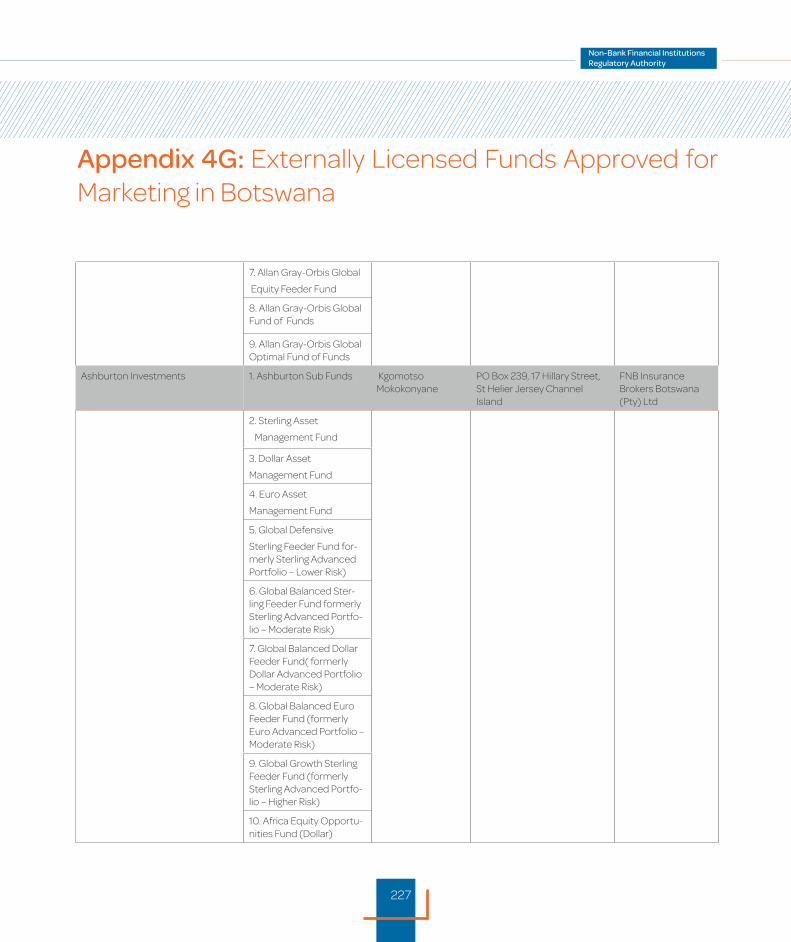
227
7. Allan Gray-Orbis Global
Equity Feeder Fund
8. Allan Gray-Orbis Global Fund of Funds
9. Allan Gray-Orbis Global Optimal Fund of Funds
Ashburton Investments 1. Ashburton Sub Funds Kgomotso Mokokonyane
PO Box 239, 17 Hillary Street, St Helier Jersey Channel Island
FNB Insurance Brokers Botswana (Pty) Ltd
2. Sterling Asset
Management Fund
3. Dollar Asset
Management Fund
4. Euro Asset
Management Fund
5. Global Defensive
Sterling Feeder Fund for-merly Sterling Advanced Portfolio – Lower Risk)
6. Global Balanced Ster-ling Feeder Fund formerly Sterling Advanced Portfo-lio – Moderate Risk)
7. Global Balanced Dollar Feeder Fund( formerly Dollar Advanced Portfolio – Moderate Risk)
8. Global Balanced Euro Feeder Fund (formerly Euro Advanced Portfolio – Moderate Risk)
9. Global Growth Sterling Feeder Fund (formerly Sterling Advanced Portfo-lio – Higher Risk)
10. Africa Equity Opportu-nities Fund (Dollar)
Appendix 4G: Externally Licensed Funds Approved for Marketing in Botswana
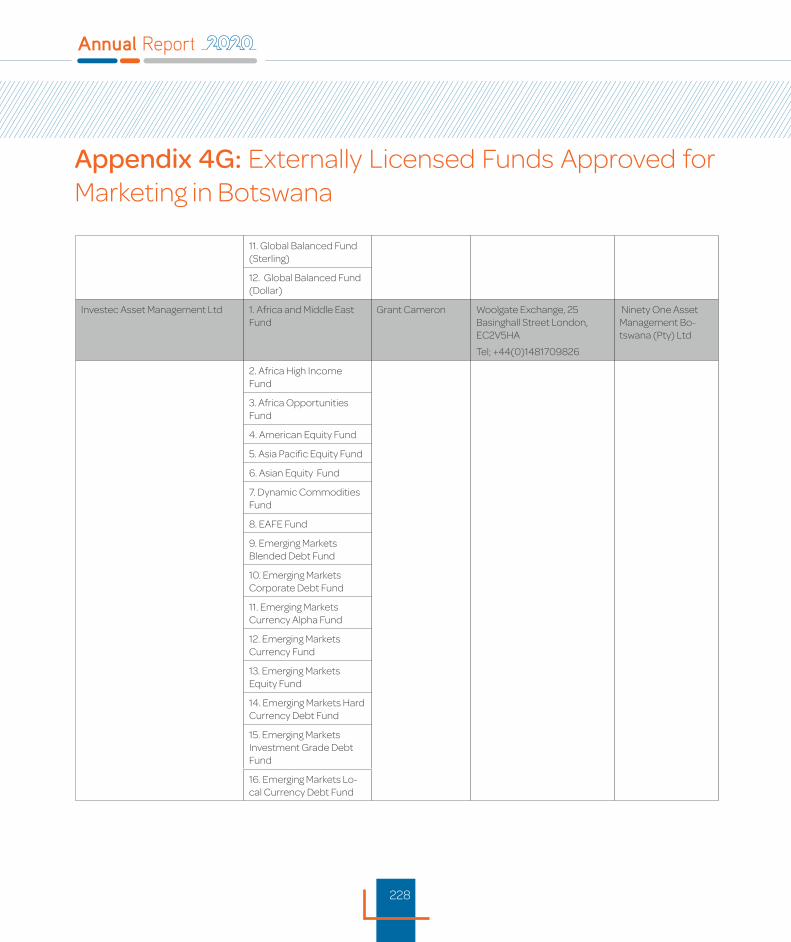
228
11. Global Balanced Fund (Sterling)
12. Global Balanced Fund (Dollar)
Investec Asset Management Ltd 1. Africa and Middle East Fund
Grant Cameron Woolgate Exchange, 25 Basinghall Street London, EC2V5HA
Tel; +44(0)1481709826
Ninety One Asset Management Bo-tswana (Pty) Ltd
2. Africa High Income Fund
3. Africa Opportunities Fund
4. American Equity Fund
5. Asia Pacific Equity Fund
6. Asian Equity Fund
7. Dynamic Commodities Fund
8. EAFE Fund
9. Emerging Markets Blended Debt Fund
10. Emerging Markets Corporate Debt Fund
11. Emerging Markets Currency Alpha Fund
12. Emerging Markets Currency Fund
13. Emerging Markets Equity Fund
14. Emerging Markets Hard Currency Debt Fund
15. Emerging Markets Investment Grade Debt Fund
16. Emerging Markets Lo-cal Currency Debt Fund
Appendix 4G: Externally Licensed Funds Approved for Marketing in Botswana
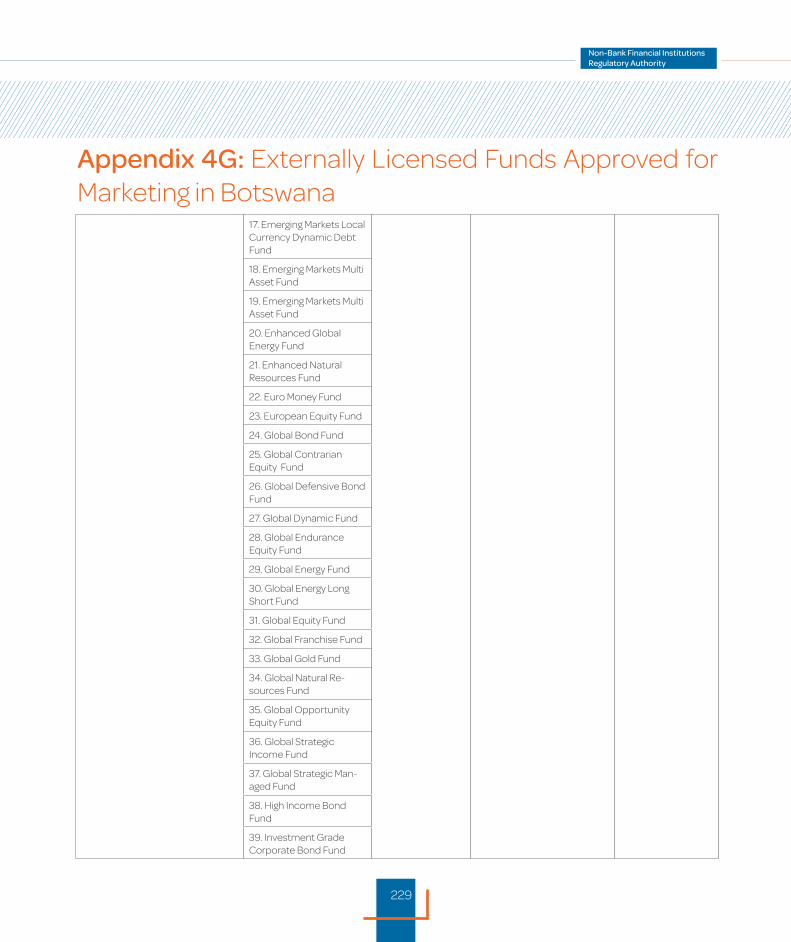
229
17. Emerging Markets Local Currency Dynamic Debt Fund
18. Emerging Markets Multi Asset Fund
19. Emerging Markets Multi Asset Fund
20. Enhanced Global Energy Fund
21. Enhanced Natural Resources Fund
22. Euro Money Fund
23. European Equity Fund
24. Global Bond Fund
25. Global Contrarian Equity Fund
26. Global Defensive Bond Fund
27. Global Dynamic Fund
28. Global Endurance Equity Fund
29. Global Energy Fund
30. Global Energy Long Short Fund
31. Global Equity Fund
32. Global Franchise Fund
33. Global Gold Fund
34. Global Natural Re-sources Fund
35. Global Opportunity Equity Fund
36. Global Strategic Income Fund
37. Global Strategic Man-aged Fund
38. High Income Bond Fund
39. Investment Grade Corporate Bond Fund
Appendix 4G: Externally Licensed Funds Approved for Marketing in Botswana
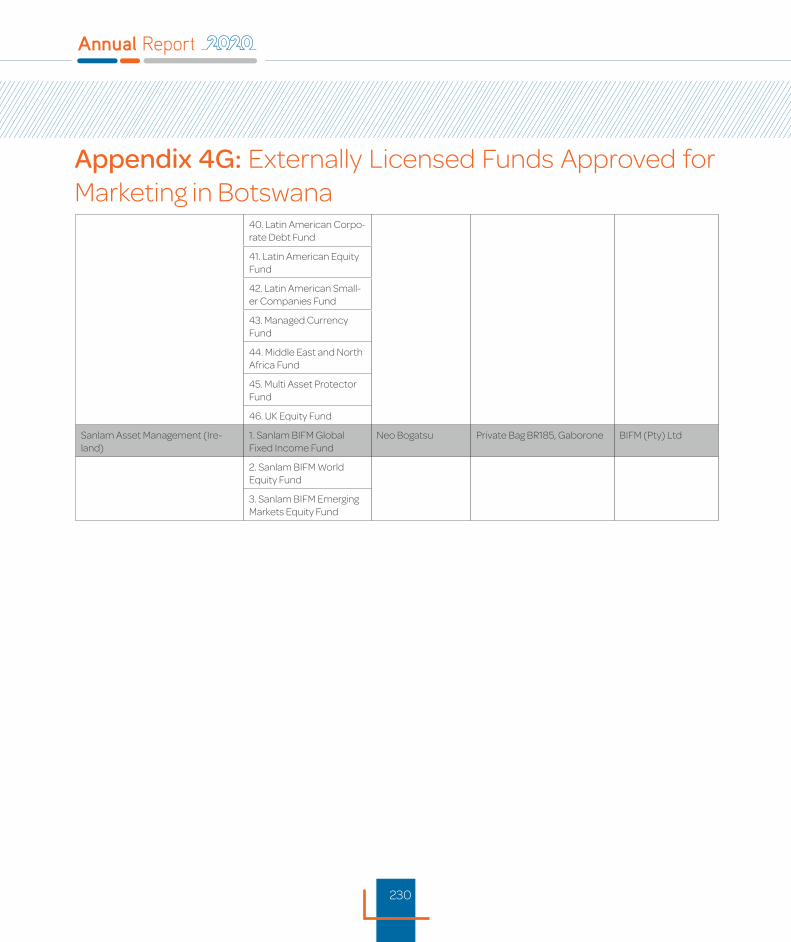
230
40. Latin American Corpo-rate Debt Fund
41. Latin American Equity Fund
42. Latin American Small-er Companies Fund
43. Managed Currency Fund
44. Middle East and North Africa Fund
45. Multi Asset Protector Fund
46. UK Equity Fund
Sanlam Asset Management (Ire-land)
1. Sanlam BIFM Global Fixed Income Fund
Neo Bogatsu Private Bag BR185, Gaborone BIFM (Pty) Ltd
2. Sanlam BIFM World Equity Fund
3. Sanlam BIFM Emerging Markets Equity Fund
Appendix 4G: Externally Licensed Funds Approved for Marketing in Botswana
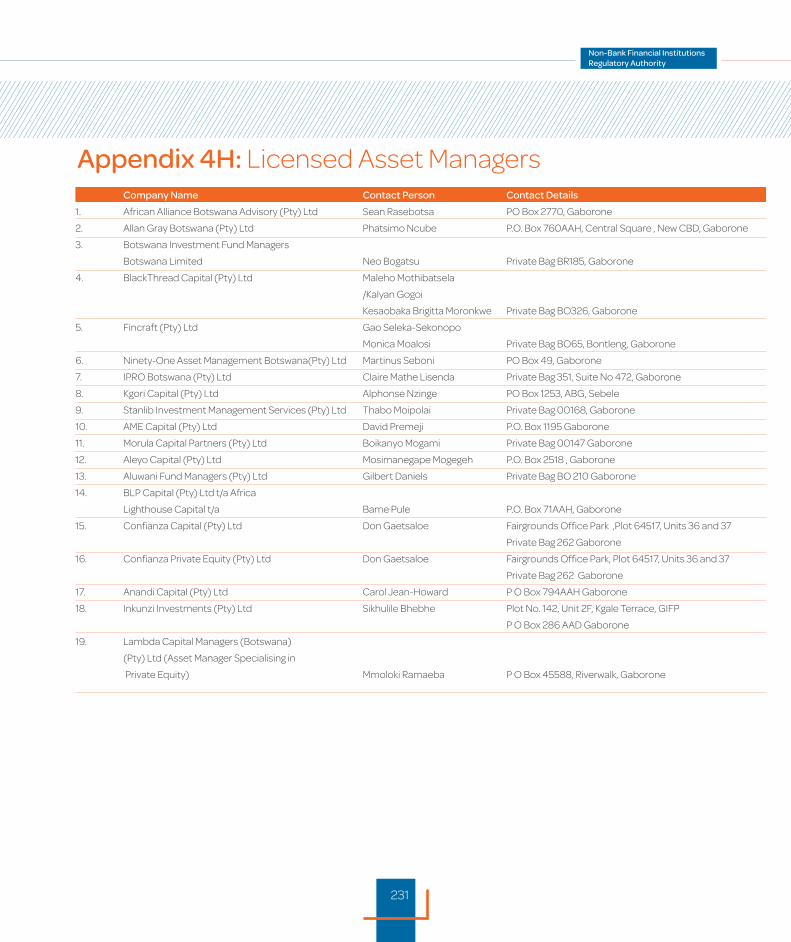
231
Appendix 4H: Licensed Asset Managers Company Name Contact Person Contact Details
1. African Alliance Botswana Advisory (Pty) Ltd Sean Rasebotsa PO Box 2770, Gaborone
2. Allan Gray Botswana (Pty) Ltd Phatsimo Ncube P.O. Box 760AAH, Central Square , New CBD, Gaborone
3. Botswana Investment Fund Managers
Botswana Limited Neo Bogatsu Private Bag BR185, Gaborone
4. BlackThread Capital (Pty) Ltd Maleho Mothibatsela
/Kalyan Gogoi
Kesaobaka Brigitta Moronkwe Private Bag BO326, Gaborone
5. Fincraft (Pty) Ltd Gao Seleka-Sekonopo
Monica Moalosi Private Bag BO65, Bontleng, Gaborone
6. Ninety-One Asset Management Botswana(Pty) Ltd Martinus Seboni PO Box 49, Gaborone
7. IPRO Botswana (Pty) Ltd Claire Mathe Lisenda Private Bag 351, Suite No 472, Gaborone
8. Kgori Capital (Pty) Ltd Alphonse Nzinge PO Box 1253, ABG, Sebele
9. Stanlib Investment Management Services (Pty) Ltd Thabo Moipolai Private Bag 00168, Gaborone
10. AME Capital (Pty) Ltd David Premeji P.O. Box 1195 Gaborone
11. Morula Capital Partners (Pty) Ltd Boikanyo Mogami Private Bag 00147 Gaborone
12. Aleyo Capital (Pty) Ltd Mosimanegape Mogegeh P.O. Box 2518 , Gaborone
13. Aluwani Fund Managers (Pty) Ltd Gilbert Daniels Private Bag BO 210 Gaborone
14. BLP Capital (Pty) Ltd t/a Africa
Lighthouse Capital t/a Bame Pule P.O. Box 71AAH, Gaborone
15. Confianza Capital (Pty) Ltd Don Gaetsaloe Fairgrounds Office Park ,Plot 64517, Units 36 and 37
Private Bag 262 Gaborone
16. Confianza Private Equity (Pty) Ltd Don Gaetsaloe Fairgrounds Office Park, Plot 64517, Units 36 and 37
Private Bag 262 Gaborone
17. Anandi Capital (Pty) Ltd Carol Jean-Howard P O Box 794AAH Gaborone
18. Inkunzi Investments (Pty) Ltd Sikhulile Bhebhe Plot No. 142, Unit 2F, Kgale Terrace, GIFP
P O Box 286 AAD Gaborone
19. Lambda Capital Managers (Botswana)
(Pty) Ltd (Asset Manager Specialising in
Private Equity) Mmoloki Ramaeba P O Box 45588, Riverwalk, Gaborone
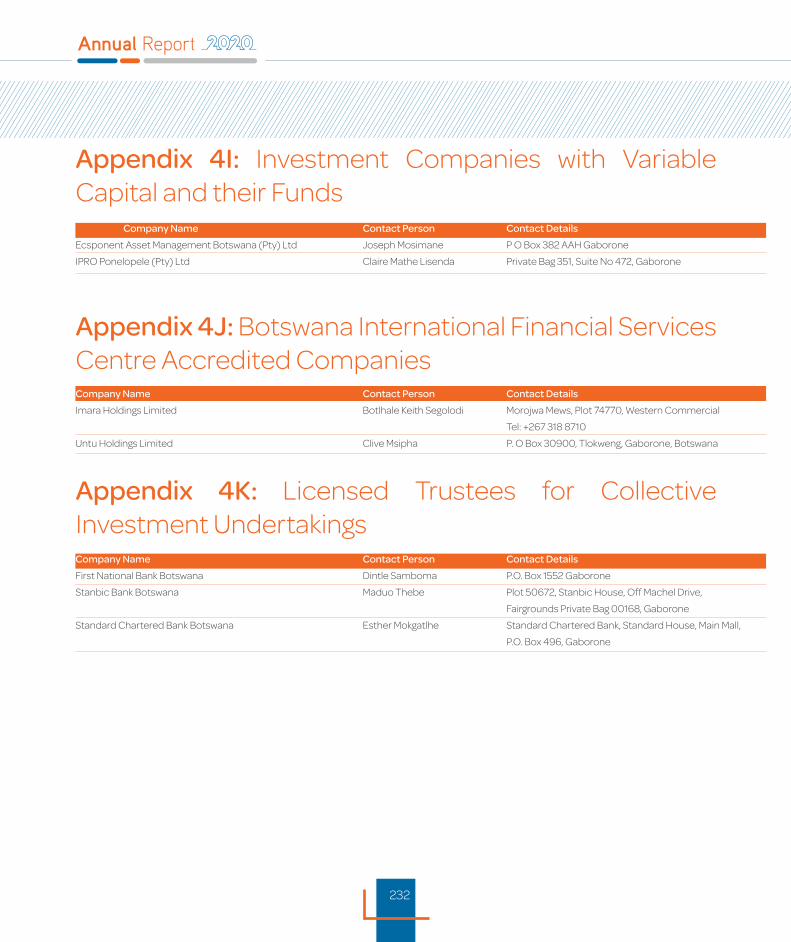
232
Appendix 4I: Investment Companies with Variable Capital and their Funds
Appendix 4J: Botswana International Financial Services Centre Accredited Companies
Appendix 4K: Licensed Trustees for Collective Investment Undertakings
Company Name Contact Person Contact Details
Ecsponent Asset Management Botswana (Pty) Ltd Joseph Mosimane P O Box 382 AAH Gaborone
IPRO Ponelopele (Pty) Ltd Claire Mathe Lisenda Private Bag 351, Suite No 472, Gaborone
Company Name Contact Person Contact Details
Imara Holdings Limited Botlhale Keith Segolodi Morojwa Mews, Plot 74770, Western Commercial
Tel: +267 318 8710
Untu Holdings Limited Clive Msipha P. O Box 30900, Tlokweng, Gaborone, Botswana
Company Name Contact Person Contact Details
First National Bank Botswana Dintle Samboma P.O. Box 1552 Gaborone
Stanbic Bank Botswana Maduo Thebe Plot 50672, Stanbic House, Off Machel Drive,
Fairgrounds Private Bag 00168, Gaborone
Standard Chartered Bank Botswana Esther Mokgatlhe Standard Chartered Bank, Standard House, Main Mall,
P.O. Box 496, Gaborone
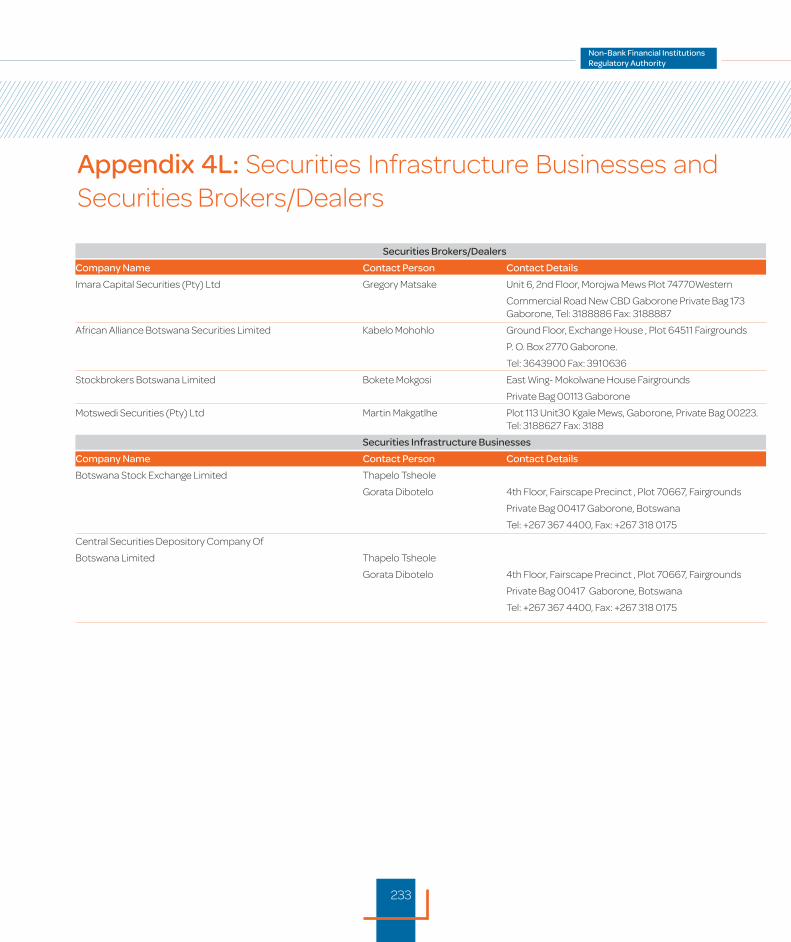
233
Appendix 4L: Securities Infrastructure Businesses and Securities Brokers/Dealers
Securities Brokers/Dealers
Company Name Contact Person Contact Details
Imara Capital Securities (Pty) Ltd Gregory Matsake Unit 6, 2nd Floor, Morojwa Mews Plot 74770Western
Commercial Road New CBD Gaborone Private Bag 173 Gaborone, Tel: 3188886 Fax: 3188887
African Alliance Botswana Securities Limited Kabelo Mohohlo Ground Floor, Exchange House , Plot 64511 Fairgrounds
P. O. Box 2770 Gaborone.
Tel: 3643900 Fax: 3910636
Stockbrokers Botswana Limited Bokete Mokgosi East Wing- Mokolwane House Fairgrounds
Private Bag 00113 Gaborone
Motswedi Securities (Pty) Ltd Martin Makgatlhe Plot 113 Unit30 Kgale Mews, Gaborone, Private Bag 00223. Tel: 3188627 Fax: 3188
Securities Infrastructure Businesses
Company Name Contact Person Contact Details
Botswana Stock Exchange Limited Thapelo Tsheole
Gorata Dibotelo 4th Floor, Fairscape Precinct , Plot 70667, Fairgrounds
Private Bag 00417 Gaborone, Botswana
Tel: +267 367 4400, Fax: +267 318 0175
Central Securities Depository Company Of
Botswana Limited Thapelo Tsheole
Gorata Dibotelo 4th Floor, Fairscape Precinct , Plot 70667, Fairgrounds
Private Bag 00417 Gaborone, Botswana
Tel: +267 367 4400, Fax: +267 318 0175

234
Appendix M: List of MicrolendersName of Micro Lender Addresses Tel/Fax Contact Person
1. Abakwa Investments (Pty) Ltd Plot 54483 Molapo Crossing Gaborone P O Box AE 514 AEU Gaborone Tel: 3922398 Alen Isaac Achu2.Abercorn (Pty) Ltd Plot 135, Unit 7, Kgale Terrace Gaborone P o Box 1621 Mogoditshane Tel: 395 6787 Bob Dintwe3.Adima Morokotso O Monnye (Pty) Ltd Dabo House Office Unit 2, Francistown P O Box 40127 Francistown Tel: 241970 Cell: 72601809 Franciois Jacobs
4. Adimanang (Pty) Ltd Embassy Chambers Building , 11C, Main Mall,Gaborone P O Box 1450 Gaborone Tel: 3974774 Susanna Gouws5. Affluent Wealth (Pty) Ltd Apex Building, Gaborone West Industrial, Gaborone P O Box 1072 Lobatse Cell: 71580344 Atang Morake6. Afritec (Pty) Ltd Plot 10573/4 Magochanya Rd Block 3 Gaborone Private Bag BR 60 Gaborone Tel: 3670702 Fax: 3190096 Christo Klopper
7. Akum Building and Construction t/a Impala Cashloan Office 111 Kollenberg Center Main mall , Gaborone P O Box 5546 Gaborone Tel: 3909651 Fax: 3909641 John Taolo8. Alafisa (Pty) Ltd Plot 2684 Extension 9, Gaborone P O Box 126 Gaborone Tel: 3901165 72400503 Cornelias Baboloki Nkane9. Antonio Bush Gardens Investments (Pty) Ltd Plot 12114 Block 4 Francistown P O Box 343 Masunga Tel: 2405996 Antony Masalila10. Apple Craft Investments (Pty) Ltd Plot 19300 Gaborone West Phase 2 Gaborone P O Box 133ABE Gaborone Cell: 72916445 Mosalela Maleke11. AT &T Monnakgotla Transport (Pty) Ltd T/A Macheng Cashloans Plot 182, Queens Road Main Mall Gaborone P.O. Box 60474 Gaborone Tel: 3938788 Fax: 3500419 Abel Monnakgotla
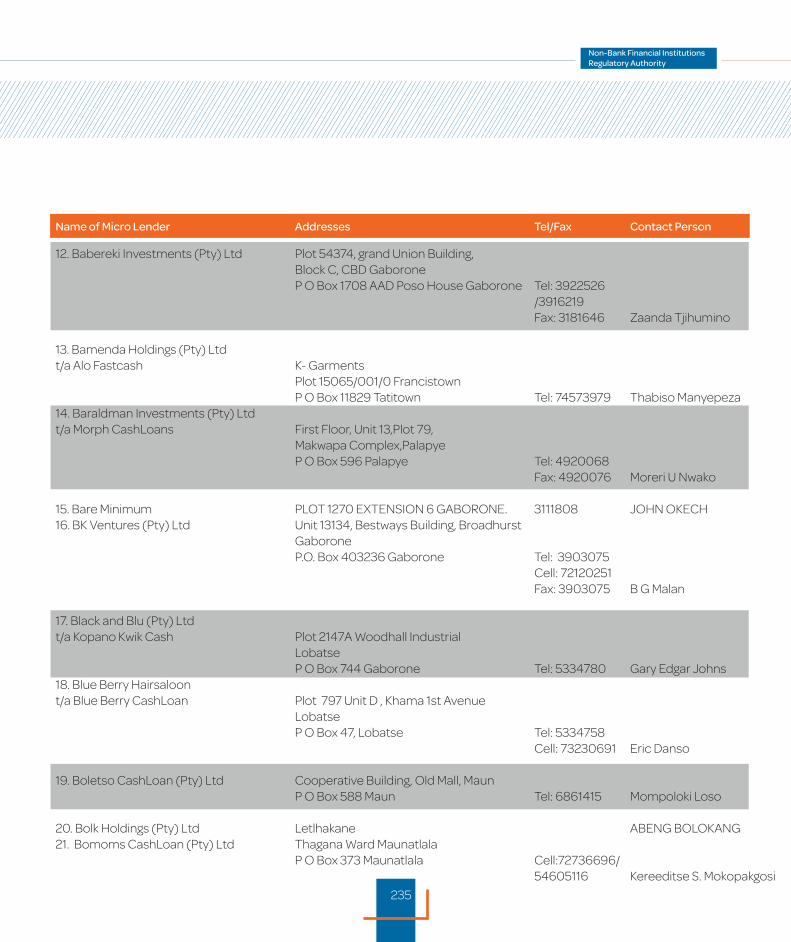
235
12. Babereki Investments (Pty) Ltd Plot 54374, grand Union Building, Block C, CBD Gaborone P O Box 1708 AAD Poso House Gaborone Tel: 3922526 /3916219 Fax: 3181646 Zaanda Tjihumino
13. Bamenda Holdings (Pty) Ltd t/a Alo Fastcash K- Garments Plot 15065/001/0 Francistown P O Box 11829 Tatitown Tel: 74573979 Thabiso Manyepeza14. Baraldman Investments (Pty) Ltd t/a Morph CashLoans First Floor, Unit 13,Plot 79, Makwapa Complex,Palapye P O Box 596 Palapye Tel: 4920068 Fax: 4920076 Moreri U Nwako
15. Bare Minimum PLOT 1270 EXTENSION 6 GABORONE. 3111808 JOHN OKECH16. BK Ventures (Pty) Ltd Unit 13134, Bestways Building, Broadhurst Gaborone P.O. Box 403236 Gaborone Tel: 3903075 Cell: 72120251 Fax: 3903075 B G Malan
17. Black and Blu (Pty) Ltd t/a Kopano Kwik Cash Plot 2147A Woodhall Industrial Lobatse P O Box 744 Gaborone Tel: 5334780 Gary Edgar Johns18. Blue Berry Hairsaloon t/a Blue Berry CashLoan Plot 797 Unit D , Khama 1st Avenue Lobatse P O Box 47, Lobatse Tel: 5334758 Cell: 73230691 Eric Danso
19. Boletso CashLoan (Pty) Ltd Cooperative Building, Old Mall, Maun P O Box 588 Maun Tel: 6861415 Mompoloki Loso
20. Bolk Holdings (Pty) Ltd Letlhakane ABENG BOLOKANG21. Bomoms CashLoan (Pty) Ltd Thagana Ward Maunatlala P O Box 373 Maunatlala Cell:72736696/ 54605116 Kereeditse S. Mokopakgosi
Name of Micro Lender Addresses Tel/Fax Contact Person

236
Appendix M: List of MicrolendersName of Micro Lender Addresses Tel/Fax Contact Person
22. Bong Cash Loan (Pty) Ltd Jwaneng Tumelo Maybe23. Bophirima Investments (Pty) Ltd Unit 8 Carbo Center River walk Gaborone P/Bag BR 154 Gaborone Tel: 3903720 Fax: 3190696 Sadie Serokane24. Botheb’s CashLoan (Pty) Ltd Mokgobele Ward,Orapa P O Box 361 Orapa Tel: 2976720 Fax: 2976200 Kabo Molelwane25. Botlhale Investments (Pty) Ltd Northgate Mall Unit 10,Francistown P/Bag 727 Francistown Tel:2417474 /2147770 Fax: 2410898 Judith Ntelecha
26. Brains (Pty) Ltd t/a The Loan Room Plot 117 Unit 3 Kgale Mews Gaborone P O Box 405702 Broadhurst Gaborone Tel: 3185575 Vincent Mosweu Koloba27. Bramm’s Investments (Pty) Ltd t/a Update loan Investments Plot 2537 Unit 40, Selibe Phikwe , Square P O Box 2395 Selibe Phikwe Tel: 2610720 Tel: 2610720 Ogomoditse Gabakgosi28. Bright Employee Benefits (Pty) Ltd 1ST Floor Capricorn House Plot 165 Pilane Road, Gaborone Private Bag 00348 ,Gaborone Cell: 3188001 Fax: 3188003 Kealeboga Sankoma29. Business Giants (Pty) Ltd Shop No. 17, Plot 17945, Kagiso Centre, Broadhurst Gaborone Private Bag BR 351, Suite 276, Gaborone Tel: 3158466 Fax: 3915691 Adolph Jacobs Jans van Rensburg30. Caftan (Pty) Ltd Plot 684 Botswana Road Gaborone P O Box 45889 Riverwalk Gaborone Tel: 3925344 Cell: 3925223 Gaboetelwe Moloi31. Calvom Investments (Pty) Ltd Plot 59524 Gaborone P O Box 201686 Gaborone Tel: 3186929 Cell: 71539386 Calvin Moilwa32. Capital Express 33. Capristone Investments (Pty) Ltd Plot 1239/6 Haile Selassie Road, Gaborone P O Box 33AAH Gaborone Cell: 72448370 Sanini Moyo

237
34. CASH BRIEFCASE Commerce Park Nopix House Plot 39/2 Unit 2 Gaborone P O Box 3540 Molepolole Tell: 3182343 Phillip Ntokwane35. Cash Connections PLOT 23282 Phase 4, Gaborone P O Box 81300. Gaborone Cell: 71328112 /71328134 Colleen Masala36. Cash Corp Investments (Pty) Ltd Plot 1140 Main Mall Gaborone P O Box 21408, Bontleng Gaborone Tel: 3903616 Cell: 71378936 Ibu Kenosi 37. Catbok Investments (Pty) Ltd 2nd Floor Suite 205 Blue Jacket Square Francistown P O Box 244 Francistown Cell: 71625256 Cathrine Mokgopo38. Chaffinch Investments (Pty) Ltd t/a Cashpower Office No 2 Block 1 The Mall Selibe Phikwe Private Bag 075 Selebi Phikwe Tel/ Fax: 2611832 Cindy Swarts39. Chibaco Cash Loan (Pty) Ltd Tawana ward Letlhakane P O Box 2846, Serowe Tel: 2976585 Kefilwe Motswasele40. Citizen Efforts (Pty) Ltd t/a Tlhabatsi Plot 50667 Unit 4, First Floor Blue Mango Fairgrounds, Gaborone P O Box 45635, Gaborone Tel: 3112971 M. Mothibi41. Clemmar Services (Pty) Ltd Plot 1251 Haile Selassie Road Gaborone P O Box 40785, Gaborone Tel: 3170632 Pule Moreri42. Close Friends Investments (Pty) Ltd Plot 1239/6 Haile Selassie Road Gaborone P O Box 404065,Gaborone Tel: 3933513 Lucky Khatazo43. Con Amor 1 (Pty) Ltd Plot 5681, Kudu Road, Broadhurst Industrial Site PostnetKgale View, Gaborone P O Box 8ADD, Gaborone Tell: 3162111 Cell: 71441500 Fax: 3182787 Cornelia Blokker
44. Cono Enterprises (Pty) Ltd Mokgobelele Ward, Letlhakane P O Box 30847, Francistown Tel: 2419705 Collet Oagile45. Coracle Investments (Pty) Ltd Plot 13128 &13120, Unit 1 BBS Mall, Gaborone Private Bag BR 270 Gaborone Tel: 3925755 Fax: 3925755 Adrian J. Scharnick
46. Coventry (Pty) Ltd t/a Loanstar Plot D25/D26 Old Mall Maun P O Box 2845, Gaborone Tel: 6861843 Monica Kruger
Name of Micro Lender Addresses Tel/Fax Contact Person

238
Appendix M: List of MicrolendersName of Micro Lender Addresses Tel/Fax Contact Person
47. Currency Links (Pty) Ltd UNIT 6, OFFICE 11; HAILLE SELASIE ROAD, Gaborone P O BOX 402709, GABORONE Tel; 3114253 / 3170309 Fax: 3163107 Witness Tobaka48. Damont Holdings (Pty) Ltd Plot 50667, Medical Mews, Fairgrounds Gaborone P O Box 53112, Gaborone Tel: 3913276 Morwadi Adrienne Morwadi49. Derunde Capital Funding (Pty) Ltd Plot 6346, Nswazi Mall, Francistown P O Box 11829 ,Tati town Tel: 2413068 Alonjang C. Andrew50. Destination Reached (Pty) Ltd T/A M & R Eazy-Get-Loans Plot 6164,Ramfurwa, Tlokweng P.O.Box AD50 AAF,Southring, Gaborone Tel: 3960056 Fax: 3917573 Maria Dambuza51. Dobe and Shube Enterprises (Pty) Ltd Plot 1094, Embassy Chambers, Unit 23, Mail Mall, Gaborone P O Box 4593,Gaborone Cell: 72642865 Tel: 3934621 Opelo Gabaatlholwe52. Drizzles (Pty) Ltd b Optical Centre Botswana, Unit 4B, Main Mall Gaborone P O Box 81008 Gaborone Tel: 3953073 Cell: 73670607 Fax: 3959940 Marguerite Serema
53. Duhamel Investments (Pty) Ltd t/a SBB Cashloan Plot 9943 Block 3 Francistown P O Box 11469 , Tatitown Tel: 2421361 Sebonye Randall54. Eagle Flight (Pty) Ltd Plot 20750/8 Gaborone P O Box 502359 Tel: 3165220 Fax: 3165223 Johnson A. Adeleke55. Ecommon Services (Pty) Ltd Plot 129, Unit D Gaborone International Finance Park Montle N. Phuthego56. Eagle Point (Pty) Ltd Nigerian High Commission, First Floor, Main Mall, Plot 1086, Extension 3 P. O. Box 2784, Gaborone Tel: 3957466 Fax: 3957477 Ferdinand J. Niehaus

239
57. Emisang Investments (Pty) Ltd Plot no 6878 Extension 20, Gaborone P O Box 70022 , Gaborone Tel: 71798714 Gabarate R. Mandevu58. Empire State (Pty) Ltd T/A Vix Cashloan PLOT 2871 UNIT 3 EXT 11 GABORONE P O BOX 53470 GABORONE Tel: 3933912 Geraldine Nkombeledzi59. Endless Mega (Pty) Ltd t/a Tshola Cashloan Plot 3348,Phase 1, Rakops P. O. Box 1127, Orapa Cell: 71407051 Mositi Tinah Pusoloso60. Express Credit (Pty) Ltd Fairgrounds Gabz FM Building, Gaborone Plot 64516 P O Box X 2322 AAD ,Gaborone Tel: 3110937 Fax: 3160394 Dineo Saleshando61. Equfin (Pty) Ltd Plot 1277 Clover House, Unit 5 Old Lobatse Road, Gaborone P.O. Box AD 30 AEG Gaborone Tel: 3500163 Gabriel Israel Banda62. Farmers Dream (Pty) Ltd Plot No. 34957, Block 8, Gaborone, P O Box 649, Mogoditshane Tel: 3915218 Jane Ndiwenyu63. The Feel Bay Investments (Pty) Ltd Plot 24538 , Gaborone West P O Box 602327, Gaborone Cell: 71847270 /74639449 /76247729 Kagiso David Motswagae 64. Feron Investments (Pty) Ltd Nigerian High Commission, 1st Floor, Main Mall, Plot 1086, Extension 3, Gaborone P. O. Box 2784, Gaborone Tel: 3181246/7 Fax: 3181210 Ferdinand J. Niehaus
65. Fin- All Enterprises (Pty) Ltd Plot 17974, Gaborone P O Box 20076, Gaborone Tel: 3924923 Fax: 3922795 Kabelo Plato Gaoboi66. Finchoice (Pty) Ltd Office 1, Plot 50362, Showgrounds Office Park, Gaborone P.O. Box 1884, Gaborone, Botswana Tel: 318-8988; 318-8989 Fax: 318-8951; 318-8990 Paul Burnett67. Finaid Botswana (Pty) Ltd Plot 188 Town Center, Gaborone P O Box 2784, Gaborone Tel: 5300180 Ferdinand J. Niehaus
Name of Micro Lender Addresses Tel/Fax Contact Person

240
Appendix M: List of MicrolendersName of Micro Lender Addresses Tel/Fax Contact Person
68. Finfirm (Pty) Ltd Plot 1322 Mafatswa Ward Tlokweng P O Box 1156, Gaborone Cell: 71416000 Mercy Marieta Puso69. Fringilla (Pty) Ltd Plot 17847 G/West Industrial Gaborone P O Box 602400 , Gaborone Tel: 5883920 Fax: 3918019 Janson C. Smith
70. Frigo Court (pty) ltd Plot 50161, Unit 37 the Grand Park Office Complex, Gaborone P O box 461 AAH, Gaborone Cell: 76244136 Unami Petto71. Get Bucks(Pty) Ltd Unit 8, Plot 126, Millennium Office Park, Gaborone Private Bag 19 ,Gaborone Cell: 76102712 Dudu Gaerekwe72. Glambuh Enterprises (Pty) Ltd Office 75 level 7 Barclays Plazza Francistown P O Box 30352, Francistown Tel: 2419409 Gladys Mbulayi
73. Global Credit Solutions Plot 199 Unit 29 Gaborone International P O Box 26384, Gaborone Tel: 3951363 Fax: 3951368 Thapelo Letsholo74. Global Way (Pty) Ltd Plot 178,Unit 3, Commerce Park, Gaborone P O Box 201042, Gaborone Tel: 3932399 Fax: 3932390 Mothataesi Casalis75. GOLDSCREEN (PTY) LTD Office #37 , Plot 4790 Electron House , Gaborone P. O. Box 50394, Gaborone Cell:71790834 GLADYS FEKE76. Goldshire Botswana (Pty) Ltd Plot 2644, Extension 9 Phuti Road, Gaborone P.O Box AD 322 ADD, Postnet Kgale View, Gaborone Tel: 3111362 Armstrong Richard 77. Green Flap (Pty) Ltd T/A Green Flap Cash Loan Plot 1174-1177, Main Mall, Gaborone P O Box 25ABF, Gaborone Cell: 75952906 75952905 Giveus Mathe
78.Grey Wings Enterprises (Pty) Ltd T/A Grey Wings Cashloans Plot 1156, Office 202 Nkoyaphiri, Mogoditshane P O Box 60383 Gaborone Tel: 3924616 Cell: 73361215 Galeme Sosome

241
79. Guile & Khoisan Capital (Pty) Ltd Lot 8824 Khama Cresent Barclays House Government Enclave Gaborone P O Box 3751 , Gaborone Tel: 3133827 Fax: 3133839 Peter Kgomotso
80. Hi-Rated (Pty) Ltd Phikwe square,office 38, Selebi-Phikwe P O Box 3299, Gaborone Cell: 71655721 Mbuya Ntabe81. Hudson Gaborone Gloria Kinnear82. Idah-Kan Investments (Pty) Ltd Plot 1300 Block 9, Francistown P O Box 2927,Francistown Cell:77094548 Idah Ikanyeng
83. Ikaego Investments (Pty) Ltd Plot 6525, Maboledi Ward Tonota P O Box 150075, Tonota Cell: 73433151 Leruo Serufo 84. Incinbo (Pty) Ltd t/a Incinbo Wire Money Moshawana ward, Bokaa P. O Box 203019 Gaborone Cell:75477529 Pamela Johannes85. Insight Consulting Botswana (Pty) Ltd t/a Insight Cash Suite 545 Molapo Crossing, Gaborone Private Bag 254, Gaborone Tel: 3188882 Fax: 3907020 Maureen G Makati-Janowska
86. Inspire Capital Investments Plot 1840, Unit 15A Mebala House, Opposite Western Union Mainmall, Gaborone P O BOX 82167, GABORONE Tel: 3170663 Bando Tlhomani87. Ishanimuse Pty Lts t/a Tlanalothe Cash Loan Phase 1Plot 10525 Kwena Rd, Selebi Phikwe P O Box 1950, Selibe Phikwe Cell: 75603211 /71825631 Fax: 2601222 Malebogo Bagidi88. Jago Investments (Pty) Ltd Jago House, Boikago Ward,Palapye P O Box 1002 , Palapye Tel:4920026 /73602657 Fax: 4920049 Joseph B Gampone Basiyi Galebonwe89. JAJ Investments (Pty) Ltd t/a Mozeks Shop 1 Riverwalk Shopping Centre Tlokweng Rd Gaborone P O Box 3424, Francistown Cell: 74371816 /75646282 Goitsemang Sekeseke
Name of Micro Lender Addresses Tel/Fax Contact Person

242
Appendix M: List of MicrolendersName of Micro Lender Addresses Tel/Fax Contact Person
90. Jak Micro Loans (Pty) Ltd Plot 70717, Phakalane P O Box 4, Gaborone Tel:3928400 Fax: 3928400 Julie May Frohlich91. Jarona investments (Pty) Ltd Tawana Ward, Letlhakane P O Box 338, Orapa Tel: 2978733 Cell: 71417867 71727380 Fax: 2978733 Ontlametse Ratsie
92. Jat Cashloan (Pty) Ltd Office No 3, Jwaneng Shopping Mall, P O Box 731, Jwaneng Cell: 73818283 /71211037 Kgakgamatso Mogorosi
93. Jentles Investments (Pty) Ltd t/a Mbakiso Micro lenders Plot 1019, Tati Siding, P O Box 68, Tati siding Tel: 72260333 /71581896 Chatapiwa Molapisi
94. Jogasi Investments (Pty) Ltd Suite 3 first floor Nswazwi mall Francistown P O Box 301106, Francistown Tel: 2440023 Fax: 2440024 Alex Okoche
95. JRS Venture (Pty) Ltd Plot 687 Extension 2 Gaborone, P O Box 403360, Gaborone Tel: 3181079 Fax: 3934346 Winnifred Fanyan96. Jufel (Pty) Ltd t/a Jufel Micro lending Services Pure Drop, Phase 4, Unit 6, Gaborone P.O Box 2130, Mogoditshane Cell: 71326471 /3115006 Judith Duduzile Mulenga97. Kamogano Rahube t/a Morakamo Investments Plot 691 Extension 2 Gaborone P O Box 2015, Gaborone Cell: 73861002 /71373820 Kamogano Rahube
98. Keshmoni Gaborone Kesego Tshephe
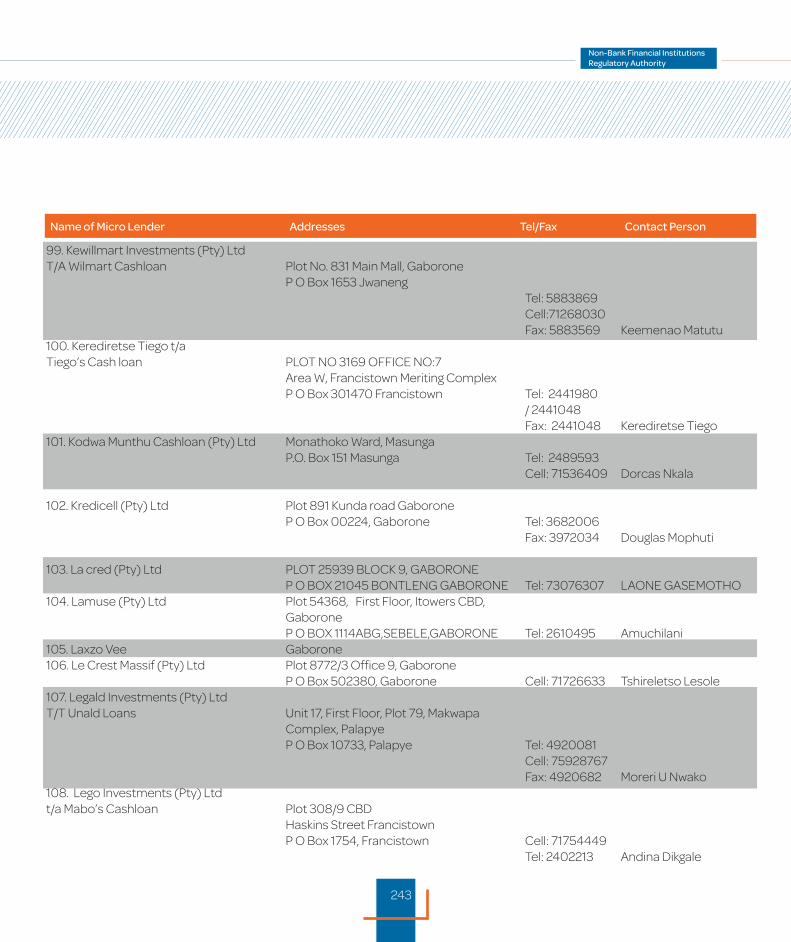
243
99. Kewillmart Investments (Pty) Ltd T/A Wilmart Cashloan Plot No. 831 Main Mall, Gaborone P O Box 1653 Jwaneng Tel: 5883869 Cell:71268030 Fax: 5883569 Keemenao Matutu100. Kerediretse Tiego t/a Tiego’s Cash loan PLOT NO 3169 OFFICE NO:7 Area W, Francistown Meriting Complex P O Box 301470 Francistown Tel: 2441980 / 2441048 Fax: 2441048 Kerediretse Tiego101. Kodwa Munthu Cashloan (Pty) Ltd Monathoko Ward, Masunga P.O. Box 151 Masunga Tel: 2489593 Cell: 71536409 Dorcas Nkala
102. Kredicell (Pty) Ltd Plot 891 Kunda road Gaborone P O Box 00224, Gaborone Tel: 3682006 Fax: 3972034 Douglas Mophuti
103. La cred (Pty) Ltd PLOT 25939 BLOCK 9, GABORONE P O BOX 21045 BONTLENG GABORONE Tel: 73076307 LAONE GASEMOTHO104. Lamuse (Pty) Ltd Plot 54368, First Floor, Itowers CBD, Gaborone P O BOX 1114ABG,SEBELE,GABORONE Tel: 2610495 Amuchilani 105. Laxzo Vee Gaborone 106. Le Crest Massif (Pty) Ltd Plot 8772/3 Office 9, Gaborone P O Box 502380, Gaborone Cell: 71726633 Tshireletso Lesole107. Legald Investments (Pty) Ltd T/T Unald Loans Unit 17, First Floor, Plot 79, Makwapa Complex, Palapye P O Box 10733, Palapye Tel: 4920081 Cell: 75928767 Fax: 4920682 Moreri U Nwako108. Lego Investments (Pty) Ltd t/a Mabo’s Cashloan Plot 308/9 CBD Haskins Street Francistown P O Box 1754, Francistown Cell: 71754449 Tel: 2402213 Andina Dikgale
Name of Micro Lender Addresses Tel/Fax Contact Person

244
Appendix M: List of MicrolendersName of Micro Lender Addresses Tel/Fax Contact Person
109. Letlotlo La Khumo Investments (Pty) Ltd Plot 3993/ M169, Minestone, Francistown P O Box 301782, Francistown Cell: 74302792 Fax: 2420608 Kelebogile Morei110. Letshego Financial Services (Pty) Ltd Ground & First Floor, Letshego Place, Plot 22, Khama Crescent, Gaborone P O Box 381, Gaborone Tel: 3643300 Fax: 3190418 Legae Moetedi
111. Lilly – Tee and Sech Investments (Pty) Ltd Auto lot house Plot 694 CBD Haskins Street, Francistown P O Box 20938, Monarch Francistown Tel: 2405321 Oeme Schele
112. Lims Consortium Botswana Plot 2577, CB Building , Selibe Phikwe P O Box 2625, Selibe Phikwe Tel: 262 000 /75222187 Fax: 3981901 Ntungamili Malima113. Lindenvilla Holdings (Pty) Ltd t/a S& T Micro lenders Plot 6036, Ext. 2 Gaborone P O Box 2316ABG GABORONE Tel: 3114106 Cell: 71608820 Mmoloki S. Mokgwatlhe
114. Lobmicrofin (Pty) Ltd Plot 126 Kgale View 2ND Floor Unit 17 Gaborone International Finance Park P O Box 46534, Gaborone Tel: 3914762 Fax: 3914762 Barulaganyi Keadikang
115. Lotus Enterprises (Pty) Ltd Thito house Nekedi Road Broadhurst, P O.Box 2368, Gaborone Tel: 3170480 Haim Smadja
116. Luisa Enterprises (Pty) Ltd Tawana Extension Letlhakane P O Box 1206, Orapa Tel: 72645445 Aluisia Mahowe
117. Mabote Investments (Pty) Ltd Plot 846, Jwaneng Main Mall,Jwaneng P O Box 120 Jwaneng Tel: 5883433 Fax: 5883433 Kabo Mabote

245
118. Madi Madi Investments (Pty) Ltd Plot 2532, Main Mall, Selibe Phikwe P/Bag 0041 Selibe Phikwe Tel: 2614907 Fax: 2914917 Rene De Waal119. Maisonette Investments (Pty) Ltd Plot 4729, Kimberly Mall, Mahalapye P O Box 602400 Mahalapye Tel: 3918031 Cell: 7178204 Fax: 3922710 Martha Matsebe Mokgohloa120. Malinic Investments (Pty) Ltdt/a Thusa Batho Quick Cash Plot 6575/1 ,Tshekedi Road Selibe Phikwe Private Bag 00150, Selibe Phikwe Tel: 2611744 Fax: 2611744 Jacques Malan121. Mankge Holdings (PTY) Ltd T/A MaatlaCashloans Life and Pensions House, Kgosing Ward, Thamaga P.O. Box 686 Moshupa Tel: 5999801 Cell: 72393096 76071443 Fax: 5999801 Oteng Nkge Victor Moupo122. Manual Workers Union Benefits Scheme Plot 131, Unit 5, Kohinoor Park Offices , Gaborone P O Box 374 Gaborone Tel: 3933316 Fax: 3933317 Ndapiwa Judith Kesalefa123. Mapleton (Pty) Ltd Plot no. 17847, Tasva House 1ST floor Gaborone West Industrial new road P O Box 602400, Gaborone Tel: 3922710 Fax: 3930505 Martha M. Mokgohloa
124. Mapororo Cash Loan (Pty) Ltd Plot No. 3193, (Office No. 15), Union House Meepong road, Selebi Phikwe P O Box 1205, Selibe Phikwe Cell: 73947338 /73267115 Fax: 2600457 D Segakise125. Mapula (Pty) Ltd Plot 173, Khama 1 Avenue, Lobatse P. O. Box 271 Lobatse Tel: 5306879 Fax: 5306879 Baboloki Montsho126. Max-Aur Marketing Services (Pty) Ltd Plot 21100, Gaborone P O Box 301723, Tlokweng Tel: 3164623 Martin Ragontse
Name of Micro Lender Addresses Tel/Fax Contact Person

246
Appendix M: List of MicrolendersName of Micro Lender Addresses Tel/Fax Contact Person
127. Mbaki&Bofelo Holdings (Pty) Ltd Plot 5251, Shop No. 01, Selibe Phikwe P O Box 1298. S/Phikwe Tel: 2622226 Fax: 2622226 Patricia Nkhwanana128. Meadow Investments (Pty) Ltd Plot 3423, Matima Crescent, Extension 12, Gaborone P O Box 46449 Gaborone Cell: 72106997 Patrick C Honnet
129. Melubotah Investments (Pty) Ltd Saoshoko Ward,Shakawe P O Box 162, Shakawe Cell: 76232138 Lucia Moswela
130. MFS Investments (Pty) Ltd Nwako Complex Shop no.11 Old Mall Palapye P O Box 11789, Palapye Tel: 4924869 Fax: 4924869 Mangisi Segadimo131. Mindwalk Investments (Pty) Ltd Plot 20620 Acts House Unit 20 Block 3, Gaborone P O Box 54, Mompane Tel: 3112308 Fax: 3112308 Mogi Mophuti132. Mirage Views (Pty) Ltd t/a Poloko Micro Lenders Plot 548, Tawana Ward, Letlhakane, P O Box 580, Letlhakane Cell: 71301230 Fax: 2978877 Tlhokomelo Setlhomo133. Mocqua Kasane Ntesang Obonetse134. Momatts Investments (Pty) Ltd Plot 54611 Block 5 Gaborone P O Box 30218, Gaborone Tel: 392897 Fax: 3901198 Mompoloki Segokgo135. Money Quest Investments (Pty) Ltd t/a Bayport Financial Services 1st Floor, 204 Independence Avenue (Opposite Time Square), Gaborone P O Box 2748, Gaborone Tel: 3936504 Fax: 3180831 Sinclair Sithole136. Moneywise Botswana (Pty) Ltd Plot 5643 Unit 15 Broad-Hurst Gaborone P O Box 8 ADD Gaborone Tel: 3182787 Cell: 71389094 C. Blokker137. Moola Group (Pty) Ltd t/a Moola Microlender Plot184, tlale house Main Mall, Gaborone, P O Box 1179, AAD Poso house Gaborone Tel: 3933785 Mpho Donnell138. MORE MULA (PTY) LTD Serorome Ward, Palapye P.O. Box 5 Marobela Cell: 72491298/ 73179321 Tel: 492 3704 Timuno Timuno

247
139. Mossmai (Pty) Ltd Plot 1146 Unit 10 Koih-Nor House, Main Mall Gaborone P O Box 4026 Gaborone Cell: 72444913 Moses Matomela
140. Motlhobo Investments (Pty) Ltd Letsibogo Ward, Letlhakane P.O. Box 871, Orapa Tel: 2976618 Cell: 71698580 Fax: 2976618 Tlhomamiso Mogaetsho
141. Mumsy Investments (Pty) Ltd Makgobelelo Ward, Letlhakane P.O. Box 338, Orapa Tel: 2976078 Fax: 2976078 Gladys Mothei
142. Muscat (Pty) Ltd Haleys Comet Complex, Mmalekwa Ward, Kanye P O BOX Box 2845, Gaborone Tel: 5442852 Fax: 5442852 Mrs. M. E Kruger
143. Muttyclee (Pty) Ltd PLOT 61687, UNIT 1 BLOCK 3 INDUSTRIAL GABORONE P O BOX AE 623 AEH, GABORONE, Tel: 391 8237 Fax: 391 8236 Tryagain Mukanga144. My Guy Gaborone 145. Nat-Gat (Pty) Ltd Industrial Site, Jwaneng P O Box 2426, Jwaneng Tel: 73555872 Gadibotsile Modise
146. Navy Stones Letlhakane 147. New Waves Investments (Pty) Ltd t/a Camela Plot 2068,Behind Spar,Mahalapye P O Box 2457,mahaalapye Tel: 4720430 Ulinda Smit148. Ngotwane Investments (Pty) Ltd Barclays Plaza Office 44 Francistown P O Box 2057, Francistown Tel: 2412858 Mbako Nfila149. Nicho’s Cashloan (Pty) Ltd Tawana Ward, Letlhakane P O Box 599, Orapa Tel: 2978133 Cell: 75518137 N. Moikwathai
150. Nnoig (Pty) Ltd Plot 54015 Phase 4, Office no.13, Gaborone P O Box 433 AAH Gaborone Tel: 3113689 Wililane Paphane
Name of Micro Lender Addresses Tel/Fax Contact Person

248
Appendix M: List of MicrolendersName of Micro Lender Addresses Tel/Fax Contact Person
151. North Star Enterprises (Pty) Ltd Plot 13119, BBS Mall, Broadhurst, Gaborone P O Box 2845, Gaborone, Tel: 3933256 Fax: 3162102 Marthiam J. Ferreira
152. Northring Complex (Pty) Ltd T/A Northring Cashloan Blue Jacket Square, Office 105, First Floor,Francistown P O Box 301642, Francistown Tel: 2404350 Cell: 73357213 Fax: 2404350 Gomotsang Rampart153. Notewise (Pty) Ltd Lot 838-841, Blue Jacket Square, Shop 5A, Francistown Private Bag F388 Francistown Tel: 2417027 Fax: 2416474 Barend H. Verwey
154. Nothern Sparrow (Pty) Ltd Plot 6144 Unit 15 Swap Complex, Francistown P O Box 1860 Francistown Tel: 2420836 Fax: 2417992 Patience Samuel155. Nuff Cashloans (Pty) Ltd Suite 126, Plot 17950, Haile Selassie Road, Gaborone. P.O Box V2094 Ramotswa Tel: 3974637 Fax: 3974637 Kgomotso Nakedi
156. Nyika Investments (Pty) Ltd The Mall 1ST Floor Serowe P O Box 2169, Serowe Tel: 4638119 Fax: 4638119 Lorraine Bezuidenhout157. Obmass (Pty) Ltd Plot 171 Sowa Town P O Box 138, Sowa Town Tel: 6213200 Obert Masilo158. O’FM Investments (Pty) T/A Dlamini’s Services Plot 5415, Main Mall Jwaneng P O Box 210, Jwaneng Tel: 5880604 Cell: 5880607 Victor Makuku
159. Ooslo Investments (Pty) Ltd Tawana Ward, Letlhakane P.O Box 338 Orapa Cell: 71417867 Thatayaone Lephodisa
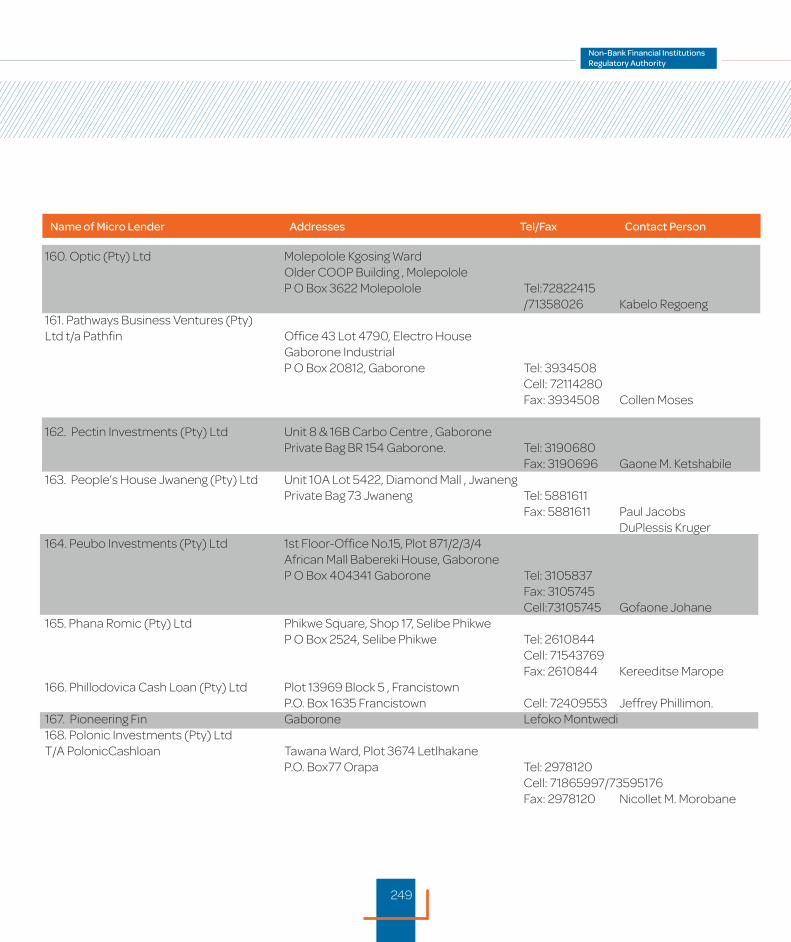
249
160. Optic (Pty) Ltd Molepolole Kgosing Ward Older COOP Building , Molepolole P O Box 3622 Molepolole Tel:72822415 /71358026 Kabelo Regoeng161. Pathways Business Ventures (Pty)Ltd t/a Pathfin Office 43 Lot 4790, Electro House Gaborone Industrial P O Box 20812, Gaborone Tel: 3934508 Cell: 72114280 Fax: 3934508 Collen Moses
162. Pectin Investments (Pty) Ltd Unit 8 & 16B Carbo Centre , Gaborone Private Bag BR 154 Gaborone. Tel: 3190680 Fax: 3190696 Gaone M. Ketshabile163. People’s House Jwaneng (Pty) Ltd Unit 10A Lot 5422, Diamond Mall , Jwaneng Private Bag 73 Jwaneng Tel: 5881611 Fax: 5881611 Paul Jacobs DuPlessis Kruger164. Peubo Investments (Pty) Ltd 1st Floor-Office No.15, Plot 871/2/3/4 African Mall Babereki House, Gaborone P O Box 404341 Gaborone Tel: 3105837 Fax: 3105745 Cell:73105745 Gofaone Johane165. Phana Romic (Pty) Ltd Phikwe Square, Shop 17, Selibe Phikwe P O Box 2524, Selibe Phikwe Tel: 2610844 Cell: 71543769 Fax: 2610844 Kereeditse Marope166. Phillodovica Cash Loan (Pty) Ltd Plot 13969 Block 5 , Francistown P.O. Box 1635 Francistown Cell: 72409553 Jeffrey Phillimon.167. Pioneering Fin Gaborone Lefoko Montwedi168. Polonic Investments (Pty) Ltd T/A PolonicCashloan Tawana Ward, Plot 3674 Letlhakane P.O. Box77 Orapa Tel: 2978120 Cell: 71865997/73595176 Fax: 2978120 Nicollet M. Morobane
Name of Micro Lender Addresses Tel/Fax Contact Person

250
Appendix M: List of MicrolendersName of Micro Lender Addresses Tel/Fax Contact Person
169. Pomma (Pty) Ltd t/a Precise Wealth Cash Loan Plot No. 171 Unit 10 Oasis Motel Tlokweng P O Box 3249 Gaborone Tel: 3911822 Tel: 3911822 Joel Motlhabane170. Prime Employee Benefits Gaborone 171. Puku Holdings (Pty) Ltd t/a Imali Cashloan Shop No: 7 Teemane Mall, Jwaneng P.O. Box 774 Jwaneng Tel: 5881554 Fax: 5881553 William Hampton.172. Pure Partners (Pty) Ltd Old Mall, Maun P O Box 944 Maun Tel: 6863224 / 76499262 Moitse Popo Maruping173. Quick Start Services (Pty) Ltd Plot 529, Mophane Avenue, Maun P.O. Box 839 Maun Tel/Fax: 686 5566 Batshegi Sarefo174. Rachelwa Investments (Pty) Ltd Unit 4, Lot 17973, Setswana Print Complex, Gaborone West Industrial, Gaborone P O Box 504136 Gaborone Tel: 3936046 Cell: 71268013 Fax: 3936046 Neo Gosekwang
175. Realdics (Pty) Ltd 2786 Office 7, Serorome Ward Palapye P/Bag 007 Sefhare Cell:72897746 /75509564 Neo G Modise
176. Reathusa (Pty) Ltd Unit 1 & 2 First Floor, Plot No. 21328, Lobengula Avenue, Francistown P O Box 1204 Francistown Tel: 2416392 Lucas J. Groenwald
177. Reeboz (Pty) Ltd t/a PromptDeal FNB Complex, Shop NU 8, Old Mall, Palapye P.O. Box 10653 Palapye Tel: 4900266 Caroline William178. Reliance Holdings (Pty) Ltd t/a Paper Cash loan Shop 9, Plot 6243 swap Complex, Francistown P O Box 1158, Francistown Cell: 71483656 Tel :2415469 John Kgaje

251
179. Rise & Shine Budget Beaters (Pty) Ltd Kanye Mall, Brigade Complex Unit 6 Mafikana Ward, Kanye P O Box 11426, Kanye Cell: 71232745 Lesole Katlholo180. Robustic Investments (Pty) Ltd t/a Harmite Cashloan Unit 5 ,Plot 6163 Swap Complex Nswasi Mall, Francistown P O Box 500195 Francistown Cell:77601986 /74329946 Clara Boniface Phiri.
181. Rosherville Investments ( Pty) Ltd Plot No 66, Kanye P O BOX 602400, Gaborone Tel: 5480426 Fax: 5480436 Kabelo Golekanye
182. Sapele Holdings (Pty) Ltd Plot 2851, Block 8, Gaborone P O Box 404027 Gaborone Tel: 3924074 Fax: 3924074 Augustin Njei Acho183. Sarakie Investments (Pty) Ltd T/A Sarakie Micro Lending Plot 2891, Unit 4, Jwaneng P. O. Box 2303, Jwaneng Tel: 71720000 Golebaone Keitshokile184. Sentle Central (Serowe, Palapye, Barhnot Complex, Near Markus Filling Station, Maun P O Box 839, Maun Tel: 6870032 Fax: 6861656 David Nicolaas Van Rensburg185. Sentle Investments (Pty) Ltd Barhnot Complex, Near Markus Filling Station P O Box 839, Maun Tel: 6870032 Fax: 6861656 David Nicolaas Van Rensburg
186. Sibonda Investments (Pty) Ltd Plot 15988, Ledumang , Gaborone P O Box 504220, Gaborone Tel: 3924968 Ephi Simon187. Silver Daniel (Pty) Ltd Shop 22, Riverwalk Mall, Gaborone P O Box 81394, Gaborone Tel: 3926378 Fax: 3926379 Coin Ntabe188. SilverDollar Investments (Pty) Ltd Plot 685 Botswana Road, Main Mall Gaborone Private Bag 00467 Gaborone Tel: 3906581 Fax: 3906561 Tina Mosidi
Name of Micro Lender Addresses Tel/Fax Contact Person

252
Appendix M: List of MicrolendersName of Micro Lender Addresses Tel/Fax Contact Person 189. Sizewell (Pty) Ltd Plot 1268, Thusanyo House, Old Lobatse Road, Gaborone West Industrial P O Box 602400 Gaborone Tel: 3902873 Fax: 3902873 Jason Craven Smith
190. Skyquest Gaborone Ramolelwane Makubate191. Skytronix Gaborne KHUMOYAME BATSHEGI192. Sloca Enterprises (Pty) Ltd T/A BonnoCashLoans Plot 17854 Unit 2, Tshipidi House, Gaborone P O Box 405222 Gaborone Tel: 3926986 Cell: 716244334 Fax: 3916325 Kerwele Carol Seloilwe
193. Smartribe (Pty) Ltd Plot 4746 unit 6,Kudu road, Broadhurst,Gaborone P. O. Box 502793, Gaborone Tel: 3918857 Bontle Charles
194. Sonaga Investments (Pty) Ltd Plot 16186, Unit 5 NBC Developments Blue Jacket Street, Francistown Private Bag F150, Francistown Tel/Fax: 2416917 Mpho Sethole195. Spicewekz Cash Loan (Pty) Ltd Xhosa 2 Ward, Mahalapye P.O. Box 2018 Mahalapye Tel: 4712725 Cell:75502774 /72960479 Fax: 4712726 Kesogofetse Tshegang196. Stims Enterprises (Pty) Ltd Plot 1225, Unit 8 Haile Selasie Road, Gaborone Private Bag 272, Gaborone Tel: 3111592 Mamello Ramakele197. Sunset Letsatsi (Pty) Ltd ]t/a Boop Kono Cashloan Plot 2576 CB Building Unit 8 Block 4 , Selibe Phikwe P.O Box 2012 Selebi-Phikwe. Tel: 2615506 Fax: 2615503 Cell: 72492617 Boitumelo Magibisela
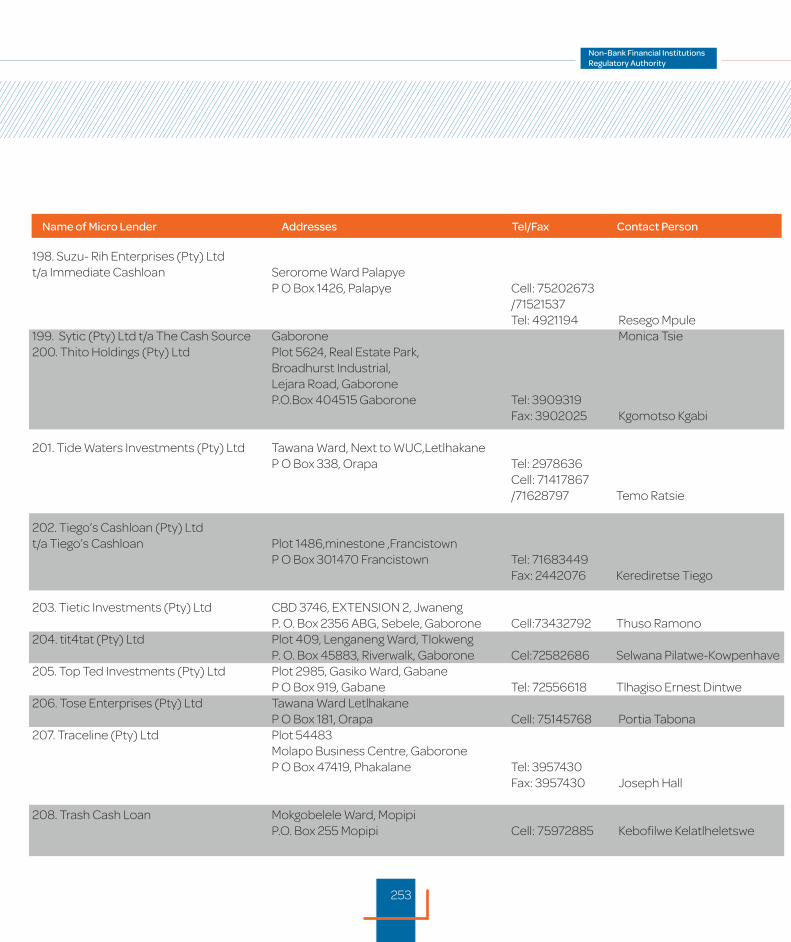
253
198. Suzu- Rih Enterprises (Pty) Ltd t/a Immediate Cashloan Serorome Ward Palapye P O Box 1426, Palapye Cell: 75202673 /71521537 Tel: 4921194 Resego Mpule199. Sytic (Pty) Ltd t/a The Cash Source Gaborone Monica Tsie200. Thito Holdings (Pty) Ltd Plot 5624, Real Estate Park, Broadhurst Industrial, Lejara Road, Gaborone P.O.Box 404515 Gaborone Tel: 3909319 Fax: 3902025 Kgomotso Kgabi
201. Tide Waters Investments (Pty) Ltd Tawana Ward, Next to WUC,Letlhakane P O Box 338, Orapa Tel: 2978636 Cell: 71417867 /71628797 Temo Ratsie
202. Tiego’s Cashloan (Pty) Ltd t/a Tiego’s Cashloan Plot 1486,minestone ,Francistown P O Box 301470 Francistown Tel: 71683449 Fax: 2442076 Kerediretse Tiego
203. Tietic Investments (Pty) Ltd CBD 3746, EXTENSION 2, Jwaneng P. O. Box 2356 ABG, Sebele, Gaborone Cell:73432792 Thuso Ramono204. tit4tat (Pty) Ltd Plot 409, Lenganeng Ward, Tlokweng P. O. Box 45883, Riverwalk, Gaborone Cel:72582686 Selwana Pilatwe-Kowpenhave205. Top Ted Investments (Pty) Ltd Plot 2985, Gasiko Ward, Gabane P O Box 919, Gabane Tel: 72556618 Tlhagiso Ernest Dintwe206. Tose Enterprises (Pty) Ltd Tawana Ward Letlhakane P O Box 181, Orapa Cell: 75145768 Portia Tabona207. Traceline (Pty) Ltd Plot 54483 Molapo Business Centre, Gaborone P O Box 47419, Phakalane Tel: 3957430 Fax: 3957430 Joseph Hall
208. Trash Cash Loan Mokgobelele Ward, Mopipi P.O. Box 255 Mopipi Cell: 75972885 Kebofilwe Kelatlheletswe
Name of Micro Lender Addresses Tel/Fax Contact Person
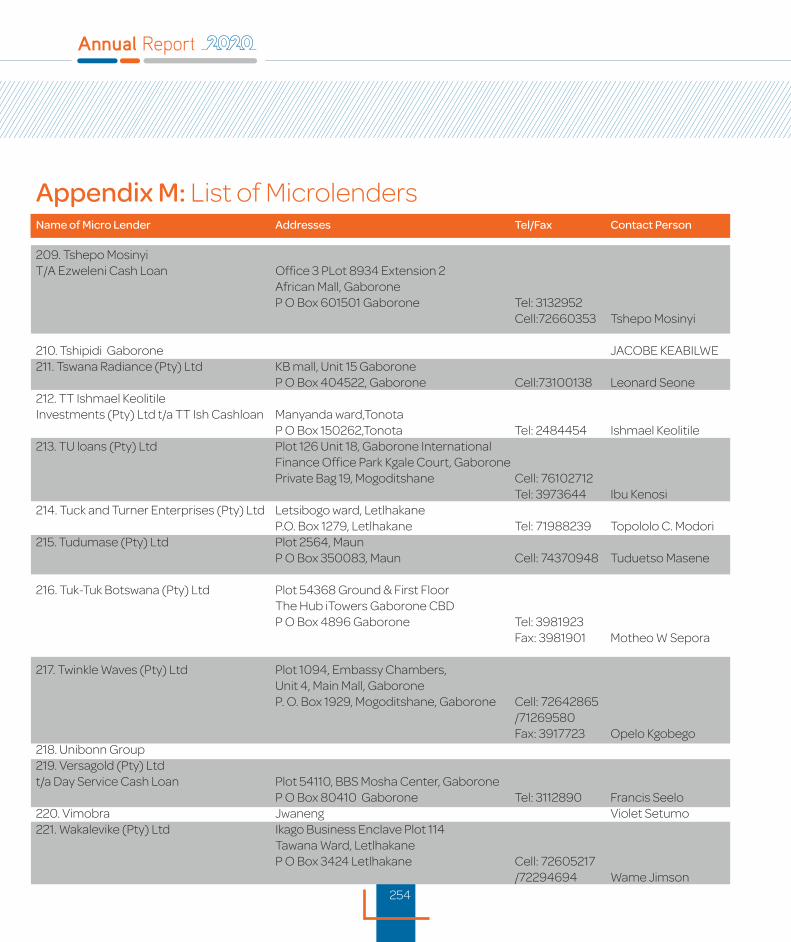
254
Appendix M: List of MicrolendersName of Micro Lender Addresses Tel/Fax Contact Person
209. Tshepo Mosinyi T/A Ezweleni Cash Loan Office 3 PLot 8934 Extension 2 African Mall, Gaborone P O Box 601501 Gaborone Tel: 3132952 Cell:72660353 Tshepo Mosinyi
210. Tshipidi Gaborone JACOBE KEABILWE211. Tswana Radiance (Pty) Ltd KB mall, Unit 15 Gaborone P O Box 404522, Gaborone Cell:73100138 Leonard Seone212. TT Ishmael Keolitile Investments (Pty) Ltd t/a TT Ish Cashloan Manyanda ward,Tonota P O Box 150262,Tonota Tel: 2484454 Ishmael Keolitile 213. TU loans (Pty) Ltd Plot 126 Unit 18, Gaborone International Finance Office Park Kgale Court, Gaborone Private Bag 19, Mogoditshane Cell: 76102712 Tel: 3973644 Ibu Kenosi214. Tuck and Turner Enterprises (Pty) Ltd Letsibogo ward, Letlhakane P.O. Box 1279, Letlhakane Tel: 71988239 Topololo C. Modori215. Tudumase (Pty) Ltd Plot 2564, Maun P O Box 350083, Maun Cell: 74370948 Tuduetso Masene
216. Tuk-Tuk Botswana (Pty) Ltd Plot 54368 Ground & First Floor The Hub iTowers Gaborone CBD P O Box 4896 Gaborone Tel: 3981923 Fax: 3981901 Motheo W Sepora
217. Twinkle Waves (Pty) Ltd Plot 1094, Embassy Chambers, Unit 4, Main Mall, Gaborone P. O. Box 1929, Mogoditshane, Gaborone Cell: 72642865 /71269580 Fax: 3917723 Opelo Kgobego 218. Unibonn Group 219. Versagold (Pty) Ltd t/a Day Service Cash Loan Plot 54110, BBS Mosha Center, Gaborone P O Box 80410 Gaborone Tel: 3112890 Francis Seelo220. Vimobra Jwaneng Violet Setumo221. Wakalevike (Pty) Ltd Ikago Business Enclave Plot 114 Tawana Ward, Letlhakane P O Box 3424 Letlhakane Cell: 72605217 /72294694 Wame Jimson

255
222. Watdon (Pty) Ltd t/a NK 2011 micro lenders Lotsane Ward Palapye P O Box 11419, Palapye Tel: 4970100 Fax: 4970101 Donald Seko Nkete223. Wealth bucket (Pty) Ltd Plot 39102 Block 6,Gaborone P O Box 188,Gaborone Tel: 71715336 Willie Oganeditse224. Whitsun (Pty) Ltd t/a Yours and Mine Plot 2577 Unit 6 CB Building Cash Bazaar Selibe Phikwe P O Box 1095 Selibe Phikwe Tel: 2614786 Cell: 72620782 Tabona Elias225. Wallet Care (Pty) Ltd Shop 23, KB Mall Gaborone P O Box 679, ABG, Sebele, Gaborone Tel: 3113877 Cell: 75980301 Tshepiso Arrisa 226. Wise wallet (Pty) Ltd PLOT 50361, FAIRGROUNDS BLOCK C, Gaborone P O Box AD30 ACG, Gaborone Tel: 3186106 Fax: 3922156 Kealeboga Wesson227. Zufire & Co (Pty) Ltd Plot 54368 West Commercial Road ITowers – First Floor, Office 114 The Hub – CBD, Gaborone Tel:3981925 Cell: 74090789 Michael Mandla Hirschfield228. The Galaxy Micro Lenders (Pty) Ltd Po Box 10758 Plot 3404 Extension 5 Palapye Cell: 71653340 Goeme Ogopoleng229. Sechaba Capfund (Pty) Ltd P.O Box 46237 Gaborone Cell: 71342357 Kesego Mokgetse230. Batho Le Madi (Pty) Ltd P O Box 40003 Francistown Tell: 2415307 Maureen Otlogetswe
Name of Micro Lender Addresses Tel/Fax Contact Person
Name of Micro Lender Addresses Tel/Fax Contact Person

256
Appendix 4N: List of Exempted Pawnshops Name Contact person Telephone Address
1. Abuti’s Pawn Shop D O Boateng Tel:3121260/3973157 P O Box 202554, Bontleng, Gaborone
2. Anthoniorose (Pty) Ltd Prof Abosi Cell: 73554796/76123402 P O Box 70050, UB Gaborone
3. Baymol Investments (Pty) Ltd
t/a Bassie Pawn Shop Basadi Mollentze Cell: 71698232 P O Box 211316, Bontleng
4. Ben Pawn Shop Benjamin Kwarare Cell:71494592/76153883 P O BOX 201366, Bontleng Tlokweng
5. Blue Steel (Pty) Ltd Michelle Blasco Jungo Cell:71973878/71207660 P O Box 3179, Francistown
6. Boileng Multi Constructions (Pty) Ltd Kgosietsile Kebuileng Cell:73841846/72841846 P O Box 151, Maun
7. Bojanour Pawn Shop Bongani Solomon Cell:77145416 P.O. Box 2729, Francistown,
8. Bright Pawn Shop Gabaithuti Mafoko Cell:74273811 Plot 9433, Block 2, Francistown
9. Cash Crusaders (Pty) Ltd Herman Kitshoff Tel: 3910801 P/Bag 351, Suite 498 Gaborone
10. Cash Ride Pawnshop Morulaganyi Tshitoeng Tel: 3936649 P O Box 501618, Gaborone
11. The class (Pty) Ltd t/a City Pawn Shop Sarah Adakwa Tel: 3133812 P. O. BOX 211173, Gaborone
12. Core Matrix (Pty)Ltd
T/A core matrix pawn shop Johannes January 72894292 P.O.Box 41, Molepolole
13. Daniel Miracle Holdings (Pty) Ltd Daniel U. Lwuchukwu 73287694/74146356 P O Box 3253, Serowe
14. Da Dancy Holdings (Pty) Ltd Neo Birchall 74415540 P O Box 50112, Gaborone
15. Donwel (Pty) Ltd
T/A Cash-X-Change Pawn Broker Ipotseng N. Keleofile 76763161 P. O. Box AD 102, Mogoditshane
16. Dela On Desert
t/a Ntshwarelela Pawn Shop Alfred Adkjie klu 75590032 P O Box 202360, Mogoditshane
17. Dynex Two Pawnshop Julia Mosinki 75419884 P. O. Box 1074, Palapye
18. Easy way out Pawnshop Kindwani Chatsama 73901666/71510616 P O Box 70802, Gaborone
19. EdenHill Holdings (Pty) Ltd Lerato Seanego 3951229 P O Box 402644 Gaborone
20. Elijah Pawnshop Baboloki kelegatile 71642523/74933277 P O Box 492, Tobane
21. Empire State (Pty)Ltd
T/A Exchange Pawnshop Lebegang Sebusang 72680891 P.O.Box 53470 Gaborone
22. Ethical Supremacy
Investments (Pty) Ltd Antony Kenosi 72475702 P O Box 3314, Francistown
23. Freeman Pawnshop Benjamin K Boadi 3165441 P O BOX 150152, Mogoditshane
24. Fair Deal Pawn shop (Pty) Ltd Benny Selebe 71282621/76548013 P O BOX V2094
25. Frontier Pawnshop Gaone Keoagile 73495494/77024047 P O Box 635
26. Gracious Concept 73958662 Serorowe Ward Palaye
27. G_Amour Investments ( Pty) Ltd Tebogo Moshashane 73222111/74280870
/3934523/ 74990000 P O BOX 47567, Gaborone
28. Green Flap (Pty) Ltd t/a GF Pawnshop Giveus Mathe 75952906/ 75952905 P O Box 25ABF, Gaborone

257
29. Green Pass Tradings (Pty) Ltd Thatayaone Mokobi 75537780/71267780 P O Box 1243, Gaborone
30. Hartlane projects (Pty) Ltd Andrew Tlokwe 3911943 P O Box 3179
31. Ikyco Investments (Pty) Ltd Innocent Nwosu 71430609/72503309 P O BOX 201366
32. Ikaego Property Holdings (Pty) Ltd Tshekatsheko Setlhomo 71303884,71301230 P O Box 580 Letlhakane
33. Jack Cage Pawn Shop Titus Malunga P. O. Box 80193 Gaborone
34. Jatinwa Investments (Pty) Ltd
t/a Jatinwa Pawn Shop Jane Nwako 71630274/71697685 Francistown, P.O. Box 2729
35. Jobest Holdings (Pty) Ltd James Nwosu 71925082 P O BOX 2679, Selibe Phikwe
36. KG Aabobe Investments Kagiso Aabobe 72337492 Extension 5465 Francistown
37. KG Jon Investments (Pty) Ltd John Kgaje 2415941/71483656 P O Box 1158 Francistown
38. Kagiso Pawn shop (Pty) Ltd Michael T. Ahulu Plot 320, Mogoditshane
39. Kgethang (Pty) Ltd Boitumelo Boikhutso 71435147/73840913 P O Box V1303, Ramotswa
40. Kleinview Holdings (Pty) Ltd Bofelo Ngake 76374797 P. O. Box 4390, Gaborone
41. Kolojane Holdings Kgosietsile Kolojane 71743074/72975773 P O Box 229,Otse
42. Lacox Holdings (Pty) Ltd Siphiwe Cox 72169425/76684536 P O Box 153, Francistown
43. Lanny Capital (Pty) Ltd
t/a Pawn Express Kim Lanny 76000069 P.O. BOX AD 782 ADD, Gaborone
44. Broad works (Pty) Ltd Joel Marapo 72112186/3933962 P O Box 1955, Gaborone
45. Lizah’s pawnshop Kgotlaetsile Omphemetse 71520570/72783656 P O Box 65, Palapye
46. Lient Pawn Shop (Pty) Ltd Mpho Keboatlholetswe 71262558/73545485 P. O. Box 594 Palapye
47. Loapi Pawn Shop
(Sober Deals Investments) ( Pty) Ltd Onkabetse Mogae 71601217 P. O. BOX 60234 Gaborone
48. Lowani Investments (Pty) Ltd Tshenolo Mabone 7322 7759/ 7462 0496 P O Box 503124,Gaborone
49. Martim (Pty) Ltd David P Muir 72105137 P O Box 1243, Gaborone
50. Magic Plum (Pty) Ltd Mr Monde Sempe 74570908/77470220 P O Box 20386, Tlokweng
51. Melikh Pawn Shop (Pty) Limited Oxilia Mantsee- Kuswani 71443397/76239416 P O Box 2621, Francistown
52. Med-tint group Magare Masilonyane 3931969/71449971 Box 500223, Francistown
53. Mutual Harmony Kagelelo Goleanye 71877041 Bontleng Tlokweng
54. Moosad Group (Pty) Ltd
t/a Last Dice Pawn Shop Israel Kgosidiile 71785597/73529598 Private Bag 12, Jwaneng
55. Naibosa Investments (Pty) Ltd Setswakae Nagole 74787525/71425136 P O Box 503124,Gaborone
56. Ndozy Sir Holdings (Pty) Ltd Jean-Marie Kabalisa 72155688 P.O Box 2633 Serowe
57. Nomek Holdings (Pty) Ltd Ishmael C. Nwosu 73965391 P O BOX 792 Lobatse
58. Novel Vision Projects (Pty) Ltd
t/a Pula Pawnshop Lekgotla David Mmakgotso 71676989 P O Box 26344 Gaborone
Name Contact person Telephone Address
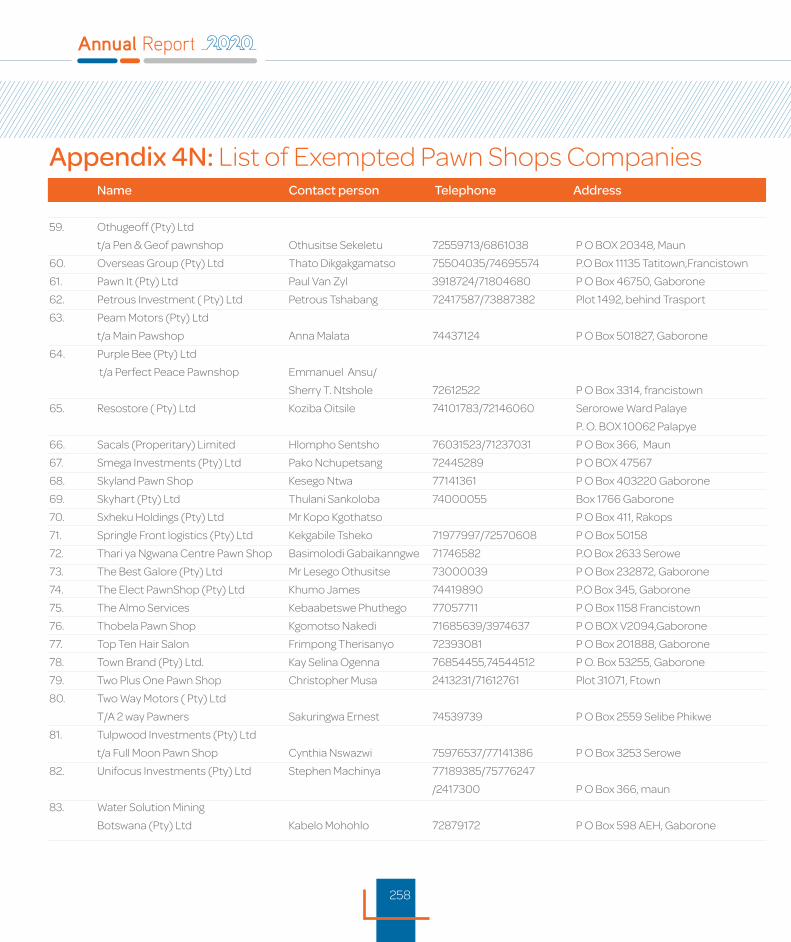
258
Appendix 4N: List of Exempted Pawn Shops Companies Name Contact person Telephone Address
59. Othugeoff (Pty) Ltd
t/a Pen & Geof pawnshop Othusitse Sekeletu 72559713/6861038 P O BOX 20348, Maun
60. Overseas Group (Pty) Ltd Thato Dikgakgamatso 75504035/74695574 P.O Box 11135 Tatitown,Francistown
61. Pawn It (Pty) Ltd Paul Van Zyl 3918724/71804680 P O Box 46750, Gaborone
62. Petrous Investment ( Pty) Ltd Petrous Tshabang 72417587/73887382 Plot 1492, behind Trasport
63. Peam Motors (Pty) Ltd
t/a Main Pawshop Anna Malata 74437124 P O Box 501827, Gaborone
64. Purple Bee (Pty) Ltd
t/a Perfect Peace Pawnshop Emmanuel Ansu/
Sherry T. Ntshole 72612522 P O Box 3314, francistown
65. Resostore ( Pty) Ltd Koziba Oitsile 74101783/72146060 Serorowe Ward Palaye
P. O. BOX 10062 Palapye
66. Sacals (Properitary) Limited Hlompho Sentsho 76031523/71237031 P O Box 366, Maun
67. Smega Investments (Pty) Ltd Pako Nchupetsang 72445289 P O BOX 47567
68. Skyland Pawn Shop Kesego Ntwa 77141361 P O Box 403220 Gaborone
69. Skyhart (Pty) Ltd Thulani Sankoloba 74000055 Box 1766 Gaborone
70. Sxheku Holdings (Pty) Ltd Mr Kopo Kgothatso P O Box 411, Rakops
71. Springle Front logistics (Pty) Ltd Kekgabile Tsheko 71977997/72570608 P O Box 50158
72. Thari ya Ngwana Centre Pawn Shop Basimolodi Gabaikanngwe 71746582 P.O Box 2633 Serowe
73. The Best Galore (Pty) Ltd Mr Lesego Othusitse 73000039 P O Box 232872, Gaborone
74. The Elect PawnShop (Pty) Ltd Khumo James 74419890 P.O Box 345, Gaborone
75. The Almo Services Kebaabetswe Phuthego 77057711 P O Box 1158 Francistown
76. Thobela Pawn Shop Kgomotso Nakedi 71685639/3974637 P O BOX V2094,Gaborone
77. Top Ten Hair Salon Frimpong Therisanyo 72393081 P O Box 201888, Gaborone
78. Town Brand (Pty) Ltd. Kay Selina Ogenna 76854455,74544512 P O. Box 53255, Gaborone
79. Two Plus One Pawn Shop Christopher Musa 2413231/71612761 Plot 31071, Ftown
80. Two Way Motors ( Pty) Ltd
T/A 2 way Pawners Sakuringwa Ernest 74539739 P O Box 2559 Selibe Phikwe
81. Tulpwood Investments (Pty) Ltd
t/a Full Moon Pawn Shop Cynthia Nswazwi 75976537/77141386 P O Box 3253 Serowe
82. Unifocus Investments (Pty) Ltd Stephen Machinya 77189385/75776247
/2417300 P O Box 366, maun
83. Water Solution Mining
Botswana (Pty) Ltd Kabelo Mohohlo 72879172 P O Box 598 AEH, Gaborone

259
84. Weverly Holdings (Pty) Ltd
T/A Weverly Pawn Shop Obi Chigbo Ngwigbo 76000350 P O Box AD 782 ADD
85. Wild Power (Pty) Ltd Shadrack Mokhuchedi, P O Box 357 , Gaborone
86. Wise Matrix (Pty) Ltd Mogomotsi B. Dipowe 77581933 P O Box 1955, Gaborone
87. Zanny OEE (Pty)Ltd Zannel Sealotsa 73136655/3121178 P O Box 81896
Name Contact person Telephone Address
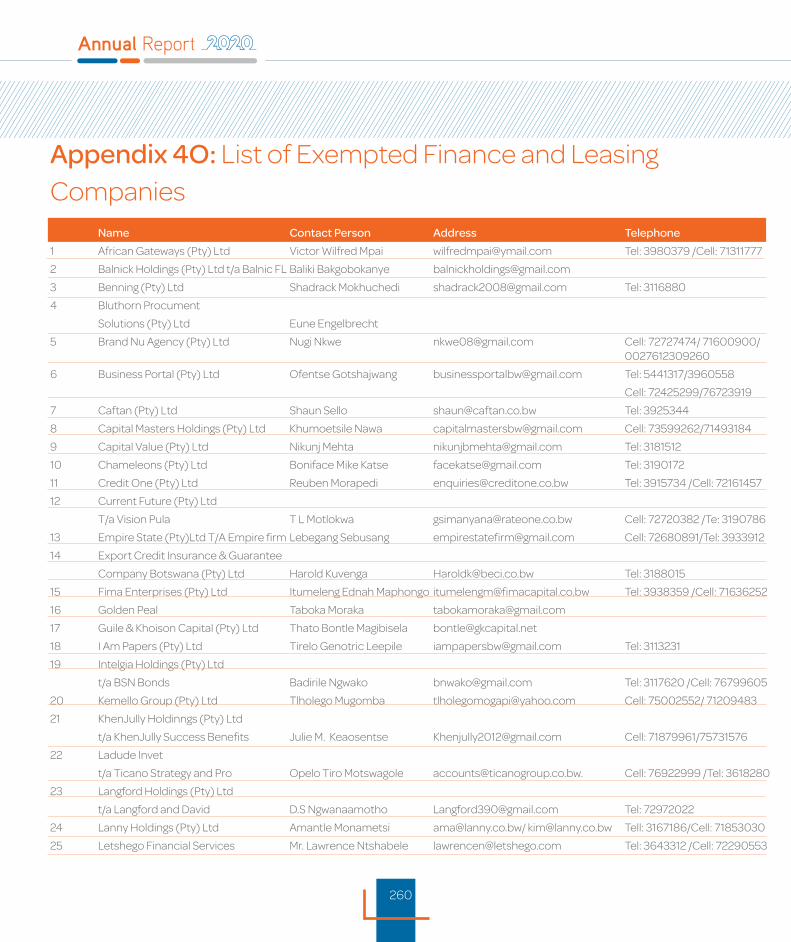
260
Appendix 4O: List of Exempted Finance and Leasing Companies Name Contact Person Address Telephone
1 African Gateways (Pty) Ltd Victor Wilfred Mpai [email protected] Tel: 3980379 /Cell: 71311777
2 Balnick Holdings (Pty) Ltd t/a Balnic FL Baliki Bakgobokanye [email protected]
3 Benning (Pty) Ltd Shadrack Mokhuchedi [email protected] Tel: 3116880
4 Bluthorn Procument
Solutions (Pty) Ltd Eune Engelbrecht
5 Brand Nu Agency (Pty) Ltd Nugi Nkwe [email protected] Cell: 72727474/ 71600900/ 0027612309260
6 Business Portal (Pty) Ltd Ofentse Gotshajwang [email protected] Tel: 5441317/3960558
Cell: 72425299/76723919
7 Caftan (Pty) Ltd Shaun Sello [email protected] Tel: 3925344
8 Capital Masters Holdings (Pty) Ltd Khumoetsile Nawa [email protected] Cell: 73599262/71493184
9 Capital Value (Pty) Ltd Nikunj Mehta [email protected] Tel: 3181512
10 Chameleons (Pty) Ltd Boniface Mike Katse [email protected] Tel: 3190172
11 Credit One (Pty) Ltd Reuben Morapedi [email protected] Tel: 3915734 /Cell: 72161457
12 Current Future (Pty) Ltd
T/a Vision Pula T L Motlokwa [email protected] Cell: 72720382 /Te: 3190786
13 Empire State (Pty)Ltd T/A Empire firm Lebegang Sebusang [email protected] Cell: 72680891/Tel: 3933912
14 Export Credit Insurance & Guarantee
Company Botswana (Pty) Ltd Harold Kuvenga [email protected] Tel: 3188015
15 Fima Enterprises (Pty) Ltd Itumeleng Ednah Maphongo [email protected] Tel: 3938359 /Cell: 71636252
16 Golden Peal Taboka Moraka [email protected]
17 Guile & Khoison Capital (Pty) Ltd Thato Bontle Magibisela [email protected]
18 I Am Papers (Pty) Ltd Tirelo Genotric Leepile [email protected] Tel: 3113231
19 Intelgia Holdings (Pty) Ltd
t/a BSN Bonds Badirile Ngwako [email protected] Tel: 3117620 /Cell: 76799605
20 Kemello Group (Pty) Ltd Tlholego Mugomba [email protected] Cell: 75002552/ 71209483
21 KhenJully Holdinngs (Pty) Ltd
t/a KhenJully Success Benefits Julie M. Keaosentse [email protected] Cell: 71879961/75731576
22 Ladude Invet
t/a Ticano Strategy and Pro Opelo Tiro Motswagole [email protected]. Cell: 76922999 /Tel: 3618280
23 Langford Holdings (Pty) Ltd
t/a Langford and David D.S Ngwanaamotho [email protected] Tel: 72972022
24 Lanny Holdings (Pty) Ltd Amantle Monametsi [email protected]/ [email protected] Tell: 3167186/Cell: 71853030
25 Letshego Financial Services Mr. Lawrence Ntshabele [email protected] Tel: 3643312 /Cell: 72290553
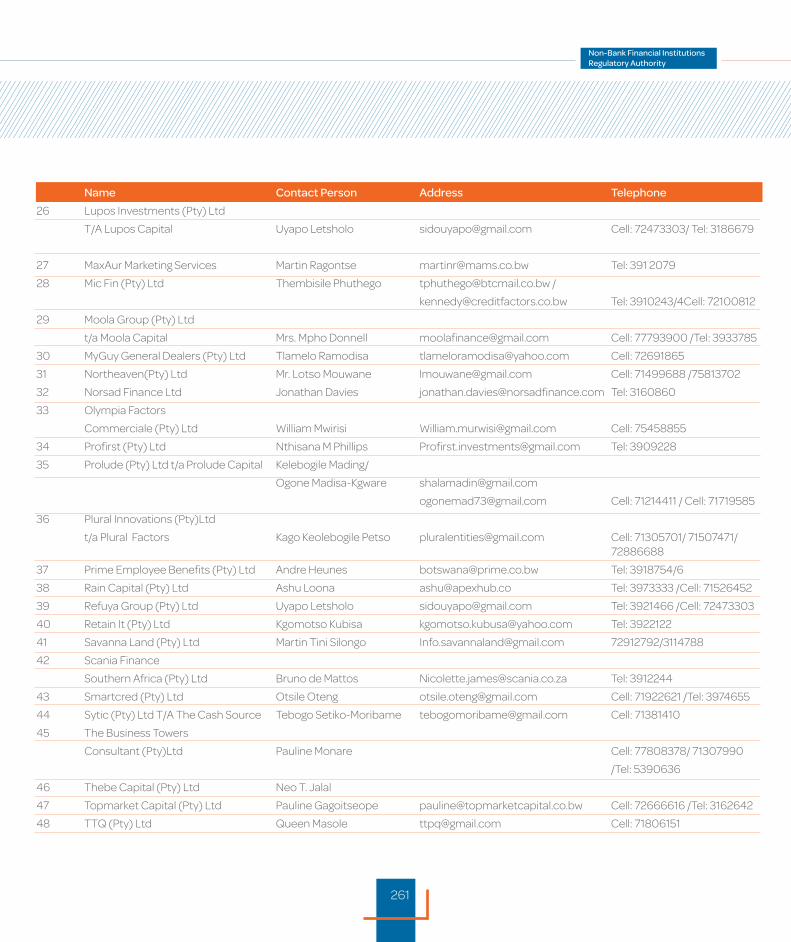
261
Name Contact Person Address Telephone
26 Lupos Investments (Pty) Ltd
T/A Lupos Capital Uyapo Letsholo [email protected] Cell: 72473303/ Tel: 3186679
27 MaxAur Marketing Services Martin Ragontse [email protected] Tel: 391 2079
28 Mic Fin (Pty) Ltd Thembisile Phuthego [email protected] /
[email protected] Tel: 3910243/4Cell: 72100812
29 Moola Group (Pty) Ltd
t/a Moola Capital Mrs. Mpho Donnell [email protected] Cell: 77793900 /Tel: 3933785
30 MyGuy General Dealers (Pty) Ltd Tlamelo Ramodisa [email protected] Cell: 72691865
31 Northeaven(Pty) Ltd Mr. Lotso Mouwane [email protected] Cell: 71499688 /75813702
32 Norsad Finance Ltd Jonathan Davies [email protected] Tel: 3160860
33 Olympia Factors
Commerciale (Pty) Ltd William Mwirisi [email protected] Cell: 75458855
34 Profirst (Pty) Ltd Nthisana M Phillips [email protected] Tel: 3909228
35 Prolude (Pty) Ltd t/a Prolude Capital Kelebogile Mading/
Ogone Madisa-Kgware [email protected]
[email protected] Cell: 71214411 / Cell: 71719585
36 Plural Innovations (Pty)Ltd
t/a Plural Factors Kago Keolebogile Petso [email protected] Cell: 71305701/ 71507471/ 72886688
37 Prime Employee Benefits (Pty) Ltd Andre Heunes [email protected] Tel: 3918754/6
38 Rain Capital (Pty) Ltd Ashu Loona [email protected] Tel: 3973333 /Cell: 71526452
39 Refuya Group (Pty) Ltd Uyapo Letsholo [email protected] Tel: 3921466 /Cell: 72473303
40 Retain It (Pty) Ltd Kgomotso Kubisa [email protected] Tel: 3922122
41 Savanna Land (Pty) Ltd Martin Tini Silongo [email protected] 72912792/3114788
42 Scania Finance
Southern Africa (Pty) Ltd Bruno de Mattos [email protected] Tel: 3912244
43 Smartcred (Pty) Ltd Otsile Oteng [email protected] Cell: 71922621 /Tel: 3974655
44 Sytic (Pty) Ltd T/A The Cash Source Tebogo Setiko-Moribame [email protected] Cell: 71381410
45 The Business Towers
Consultant (Pty)Ltd Pauline Monare Cell: 77808378/ 71307990
/Tel: 5390636
46 Thebe Capital (Pty) Ltd Neo T. Jalal
47 Topmarket Capital (Pty) Ltd Pauline Gagoitseope [email protected] Cell: 72666616 /Tel: 3162642
48 TTQ (Pty) Ltd Queen Masole [email protected] Cell: 71806151
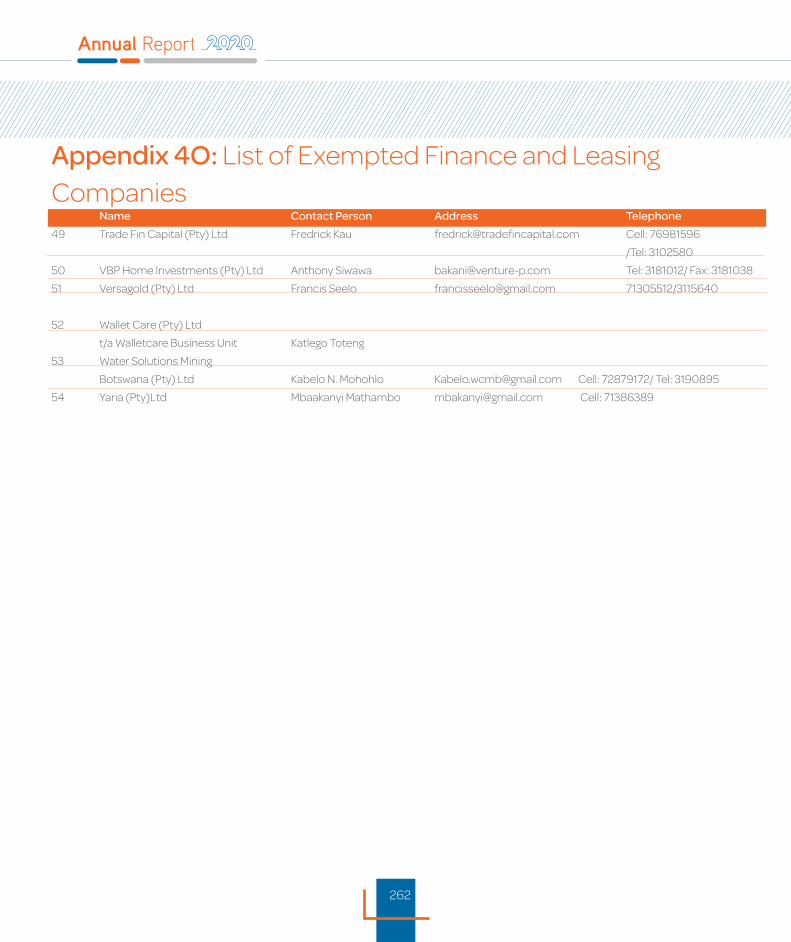
262
Appendix 4O: List of Exempted Finance and Leasing Companies Name Contact Person Address Telephone
49 Trade Fin Capital (Pty) Ltd Fredrick Kau [email protected] Cell: 76981596
/Tel: 3102580
50 VBP Home Investments (Pty) Ltd Anthony Siwawa [email protected] Tel: 3181012/ Fax: 3181038
51 Versagold (Pty) Ltd Francis Seelo [email protected] 71305512/3115640
52 Wallet Care (Pty) Ltd
t/a Walletcare Business Unit Katlego Toteng
53 Water Solutions Mining
Botswana (Pty) Ltd Kabelo N. Mohohlo [email protected] Cell: 72879172/ Tel: 3190895
54 Yaria (Pty)Ltd Mbaakanyi Mathambo [email protected] Cell: 71386389
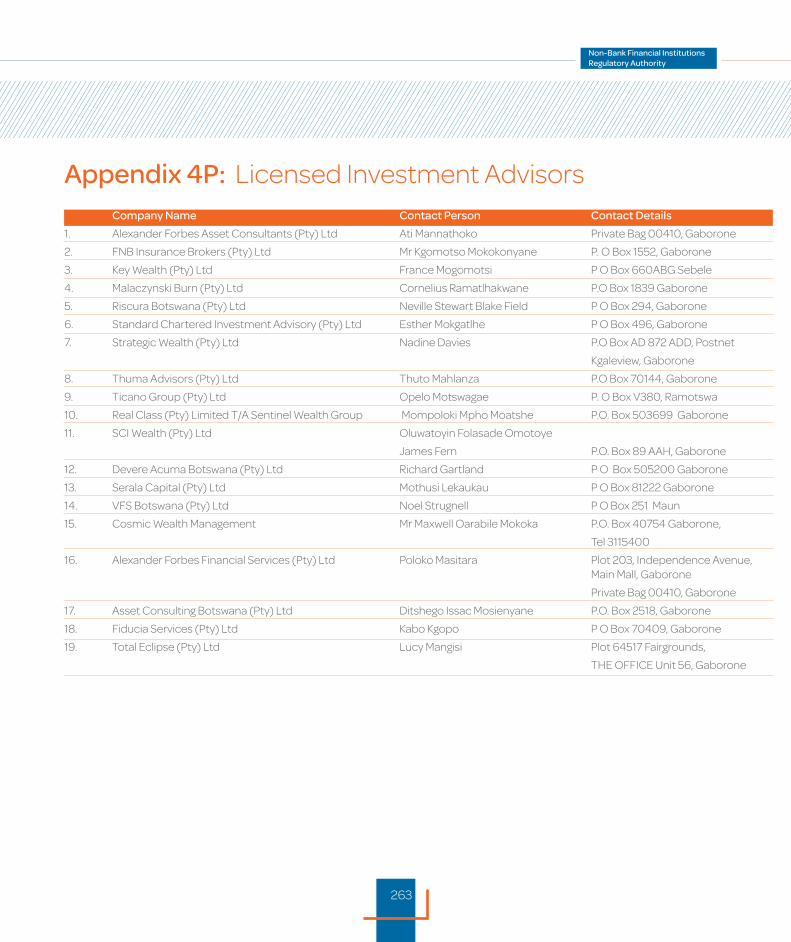
263
Appendix 4P: Licensed Investment Advisors Name Contact Person Address Telephone
Company Name Contact Person Contact Details
1. Alexander Forbes Asset Consultants (Pty) Ltd Ati Mannathoko Private Bag 00410, Gaborone
2. FNB Insurance Brokers (Pty) Ltd Mr Kgomotso Mokokonyane P. O Box 1552, Gaborone
3. Key Wealth (Pty) Ltd France Mogomotsi P O Box 660ABG Sebele
4. Malaczynski Burn (Pty) Ltd Cornelius Ramatlhakwane P.O Box 1839 Gaborone
5. Riscura Botswana (Pty) Ltd Neville Stewart Blake Field P O Box 294, Gaborone
6. Standard Chartered Investment Advisory (Pty) Ltd Esther Mokgatlhe P O Box 496, Gaborone
7. Strategic Wealth (Pty) Ltd Nadine Davies P.O Box AD 872 ADD, Postnet
Kgaleview, Gaborone
8. Thuma Advisors (Pty) Ltd Thuto Mahlanza P.O Box 70144, Gaborone
9. Ticano Group (Pty) Ltd Opelo Motswagae P. O Box V380, Ramotswa
10. Real Class (Pty) Limited T/A Sentinel Wealth Group Mompoloki Mpho Moatshe P.O. Box 503699 Gaborone
11. SCI Wealth (Pty) Ltd Oluwatoyin Folasade Omotoye
James Fern P.O. Box 89 AAH, Gaborone
12. Devere Acuma Botswana (Pty) Ltd Richard Gartland P O Box 505200 Gaborone
13. Serala Capital (Pty) Ltd Mothusi Lekaukau P O Box 81222 Gaborone
14. VFS Botswana (Pty) Ltd Noel Strugnell P O Box 251 Maun
15. Cosmic Wealth Management Mr Maxwell Oarabile Mokoka P.O. Box 40754 Gaborone,
Tel 3115400
16. Alexander Forbes Financial Services (Pty) Ltd Poloko Masitara Plot 203, Independence Avenue, Main Mall, Gaborone
Private Bag 00410, Gaborone
17. Asset Consulting Botswana (Pty) Ltd Ditshego Issac Mosienyane P.O. Box 2518, Gaborone
18. Fiducia Services (Pty) Ltd Kabo Kgopo P O Box 70409, Gaborone
19. Total Eclipse (Pty) Ltd Lucy Mangisi Plot 64517 Fairgrounds,
THE OFFICE Unit 56, Gaborone

264
Appendix 4Q: List of Licensed Custodians Address Telephone
Company Name Contact Person Contact Details
First National Bank Botswana Dintle Samboma P.O. Box 1552, Gaborone
Stanbic Bank Botswana Maduo Thebe Plot 50672, Stanbic House, Off Machel Drive, Fairgrounds Private Bag 00168, Gaborone
Standard Chartered Bank Botswana Esther Mokgatlhe Standard Chartered Bank, Standard House, Main Mall,
P.O. Box 496, Gaborone

265

266
BRAND GUIDELINES
Copyright © 2022 FDOKUMEN