Pre-Service Primary School Teachers' Knowledge and Their ...
15
mathematics Article Pre-Service Primary School Teachers’ Knowledge and Their Interpretation of Students’ Answers to a Measurement Division Problem with Fractions Maximina Márquez 1 , Ceneida Fernández 2, * and Maria Luz Callejo 2,† Citation: Márquez, M.; Fernández, C.; Callejo, M.L. Pre-Service Primary School Teachers’ Knowledge and Their Interpretation of Students’ Answers to a Measurement Division Problem with Fractions. Mathematics 2021, 9, 3163. https://doi.org/ 10.3390/math9243163 Academic Editor: Luis Carlos Contreras-González Received: 16 November 2021 Accepted: 6 December 2021 Published: 8 December 2021 Publisher’s Note: MDPI stays neutral with regard to jurisdictional claims in published maps and institutional affil- iations. Copyright: © 2021 by the authors. Licensee MDPI, Basel, Switzerland. This article is an open access article distributed under the terms and conditions of the Creative Commons Attribution (CC BY) license (https:// creativecommons.org/licenses/by/ 4.0/). 1 Departamento de Ciencias Exactas, Universidad de Los Lagos, Osorno 1046, Chile; [email protected] 2 Departamento de Innovación y Formación Didáctica, Universidad de Alicante, San Vicente del Raspeig, 03690 Alicante, Spain * Correspondence: [email protected] † Deceased in September 2021. Abstract: During the last decades, research in teacher noticing has increased since its development is considered important in teacher training programs. An issue that needs more research is the relationship between teachers’ mathematical knowledge for teaching in a specific mathematical domain and their ability to notice. This study focuses on how pre-service primary school teachers (PPTs) solve a measurement division problem with fractions and interpret (score and justify) students’ answers to this problem. The participants were 84 PPTs who answered two tasks. Task 1 consisted of solving a measurement division problem with fractions. Task 2 involved interpreting (scoring and justifying) the answers of four primary school students to the problem. Responses to Task 1 were classified based on their accuracy and the procedure used. For Task 2, the scores given along with their justifications were analyzed. The results show that PPTs’ knowledge of division with fractions is limited and that they had difficulties in identifying conceptual errors in students’ answers. This study provides information on the relationships between PPTs’ knowledge of these types of problems and how PPTs interpret students’ answers. This information could aid in adjusting mathematical teaching knowledge in training programs. Keywords: noticing; teacher’s mathematical knowledge for teaching; measurement division prob- lems; division of fractions 1. Introduction During the last decades, research in teacher noticing has increased (for instance, see the recent survey paper in ZDM–Mathematics Education by Dindyal, Schack, Choy, and Sherin [1]) since its development is considered important in teacher training programs [2,3]. Following the conceptualization of Sherin [4], professional noticing implies two processes: selective attention (noticing) and knowledge-based reasoning (reasoning). Noticing in- volves teachers’ ability to attend to relevant classroom situations [5]. Reasoning implies making sense of what has been noticed, making connections between specifics of the classroom and broader principles of teaching and learning. A particular focus is professional noticing of children’s mathematical thinking. This construct has been conceptualized through three skills: attending to, interpreting, and deciding [6], and provides “a structure for teachers to better understand and act on their students’ mathematical conceptions and practices” [7] (p. 296). Professional noticing of children’s mathematical thinking implies teachers’ ability to use their knowledge (subject content knowledge and pedagogical content knowledge) to attend to, interpret (reason about the situation), and decide [8]. Therefore, teachers’ mathematical knowledge for teaching [9] and professional noticing are connected [10]. Mathematics 2021, 9, 3163. https://doi.org/10.3390/math9243163 https://www.mdpi.com/journal/mathematics
-
Upload
khangminh22 -
Category
Documents
-
view
0 -
download
0
Transcript of Pre-Service Primary School Teachers' Knowledge and Their ...

mathematics
Article
Pre-Service Primary School Teachers’ Knowledge and TheirInterpretation of Students’ Answers to a Measurement DivisionProblem with Fractions
Maximina Márquez 1, Ceneida Fernández 2,* and Maria Luz Callejo 2,†
�����������������
Citation: Márquez, M.; Fernández,
C.; Callejo, M.L. Pre-Service Primary
School Teachers’ Knowledge and
Their Interpretation of Students’
Answers to a Measurement Division
Problem with Fractions. Mathematics
2021, 9, 3163. https://doi.org/
10.3390/math9243163
Academic Editor: Luis
Carlos Contreras-González
Received: 16 November 2021
Accepted: 6 December 2021
Published: 8 December 2021
Publisher’s Note: MDPI stays neutral
with regard to jurisdictional claims in
published maps and institutional affil-
iations.
Copyright: © 2021 by the authors.
Licensee MDPI, Basel, Switzerland.
This article is an open access article
distributed under the terms and
conditions of the Creative Commons
Attribution (CC BY) license (https://
creativecommons.org/licenses/by/
4.0/).
1 Departamento de Ciencias Exactas, Universidad de Los Lagos, Osorno 1046, Chile;[email protected]
2 Departamento de Innovación y Formación Didáctica, Universidad de Alicante, San Vicente del Raspeig,03690 Alicante, Spain
* Correspondence: [email protected]† Deceased in September 2021.
Abstract: During the last decades, research in teacher noticing has increased since its developmentis considered important in teacher training programs. An issue that needs more research is therelationship between teachers’ mathematical knowledge for teaching in a specific mathematicaldomain and their ability to notice. This study focuses on how pre-service primary school teachers(PPTs) solve a measurement division problem with fractions and interpret (score and justify) students’answers to this problem. The participants were 84 PPTs who answered two tasks. Task 1 consisted ofsolving a measurement division problem with fractions. Task 2 involved interpreting (scoring andjustifying) the answers of four primary school students to the problem. Responses to Task 1 wereclassified based on their accuracy and the procedure used. For Task 2, the scores given along withtheir justifications were analyzed. The results show that PPTs’ knowledge of division with fractionsis limited and that they had difficulties in identifying conceptual errors in students’ answers. Thisstudy provides information on the relationships between PPTs’ knowledge of these types of problemsand how PPTs interpret students’ answers. This information could aid in adjusting mathematicalteaching knowledge in training programs.
Keywords: noticing; teacher’s mathematical knowledge for teaching; measurement division prob-lems; division of fractions
1. Introduction
During the last decades, research in teacher noticing has increased (for instance, seethe recent survey paper in ZDM–Mathematics Education by Dindyal, Schack, Choy, andSherin [1]) since its development is considered important in teacher training programs [2,3].Following the conceptualization of Sherin [4], professional noticing implies two processes:selective attention (noticing) and knowledge-based reasoning (reasoning). Noticing in-volves teachers’ ability to attend to relevant classroom situations [5]. Reasoning impliesmaking sense of what has been noticed, making connections between specifics of theclassroom and broader principles of teaching and learning.
A particular focus is professional noticing of children’s mathematical thinking. Thisconstruct has been conceptualized through three skills: attending to, interpreting, anddeciding [6], and provides “a structure for teachers to better understand and act on theirstudents’ mathematical conceptions and practices” [7] (p. 296). Professional noticing ofchildren’s mathematical thinking implies teachers’ ability to use their knowledge (subjectcontent knowledge and pedagogical content knowledge) to attend to, interpret (reasonabout the situation), and decide [8]. Therefore, teachers’ mathematical knowledge forteaching [9] and professional noticing are connected [10].
Mathematics 2021, 9, 3163. https://doi.org/10.3390/math9243163 https://www.mdpi.com/journal/mathematics

Mathematics 2021, 9, 3163 2 of 15
Interpreting requires knowledge to attend and explain students’ procedures (commonand uncommon); distinguishing their correctness and potential; explaining the origin oftheir errors; or distinguishing scopes and limitations of different types of representationsfor communicating mathematical ideas. Deciding implies knowledge regarding whichaspects of the concept are the easiest or the most difficult ones for students, which are themost adequate strategies or representations for introducing the concept, which are the mostcommon errors related to the concept, or which are the most suitable materials or resourcesfor introducing the concept.
Previous research on teachers’ noticing of students’ mathematical thinking has shownwhich mathematical details of the students’ answers pre-service teachers identified andhow they interpreted students mathematical thinking in specific mathematical domainssuch as algebraic thinking [11], proportional reasoning [12,13], the part-whole meaningof fraction [14], multi-digit addition and subtraction [15] early numeracy [16], or deriva-tives [17]. These studies have shown characteristics of pre-service teachers’ mathematicalknowledge and pedagogical content knowledge related to the mathematical domain thatplay a significant role in noticing students’ mathematical thinking. Particularly, Dick [15]showed specialized content knowledge, a subset of the Mathematical Knowledge forTeaching (MKT, [9]) as an integral part of professional noticing in the specific domain ofmulti-digit addition and subtraction. Dreher and Kuntze [18] identified a weak but signifi-cant correlation between pre-service teachers’ mathematical content knowledge and theirnoticing. Similarly, Sánchez-Matamoros, Fernández and Llinares [17] and Ivars, Fernández,Llinares, and Choy [14] found that pre-service teachers’ abilities to interpret and decide arestrongly connected with their mathematical content knowledge in the specific domains ofderivatives and fractions, respectively. However, in eastern traditions, Yang, Kaiser, König,and Blömeke [19] showed that the relationship between Chinese teachers’ mathematicalcontent knowledge and their noticing is weak and independent from the level of cognitiveunderstanding of mathematics.
From these previous studies, and as it is highlighted by Dindyal et al. [1], similarstudies focused on the relationship between teachers’ mathematical knowledge for teachingin other specific mathematical domains and their ability to notice are needed becausethese findings will have important implications for teacher education and professionaldevelopment. Furthermore, it is important to determine how narrow or broad situation-specific noticing is [1,20]. In other words, to what extend is noticing children’s mathematicalthinking different when children are learning fractions or when they are learning additionsand subtractions. Therefore, studies focused on this relationship in other mathematicaldomains could allow us to continue exploring the generalizability of teacher noticing acrossdifferent content areas or the specificities of each area.
In this study, we focus on the specific domain of multiplicative structures, and, par-ticularly, on measurement division problems with fractions, for the following reasons:(1) the importance of multiplicative structure problems in the primary school curriculum;(2) the strategies and difficulties that arise from fractions for both learning and teachingthem [21–23]; and, finally, (3) the specific difficulties posed by the conceptualization ofdivision with fractions [24]. Our objective is to investigate how a group of pre-serviceprimary school teachers (PPTs) solve a measurement division problem with fractions andinterpret students’ answers to this problem.
2. Theoretical Background
Since our particular mathematical domain is measurement division problems withfractions, first, we present a literature review regarding primary school students’ proce-dures and errors in these problems. Then, we focus on the literature related to the teachers’knowledge and noticing in this mathematical domain.

Mathematics 2021, 9, 3163 3 of 15
2.1. Measurement Division Problems
Vergnaud [25] analyzed the problems in the conceptual field of Multiplicative Struc-tures distinguishing among three structures: ‘isomorphism of measures’, ‘product ofmeasures’ and ‘multiple proportion other than product’. The structure ‘isomorphism ofmeasures’ encompasses problems of simple, direct proportionality between two magni-tudes, M1 and M2, that put four quantities into play, three of which are known, with thefourth being the unknown. In this category, we can identify three types of problems whenone of the quantities is reduced to 1: multiplication, measurement division, and partitivedivision, depending on what the unknown is [24]. Particularly, in measurement divisionproblems, the unknown is the number of groups. An example is: There are some packagesof 4 kilos. If we have 12 kilos in total, how many packages are there?
For each of these problems, we need to consider whether the implied magnitude isdiscrete or continuous and whether the number set is whole or rational. In the divisionproblems, one must consider both the quotient (for example, whole, not whole greater than1, not whole less than 1), and the meaning of the remainder (which sometimes must beconsidered in giving the answer, and, at other times, it must be ignored).
These problems have been broadly studied with primary education students, identify-ing the most common procedures and errors. Bulgar [26] identified three procedures usedby primary school students in division problems of a whole number by a fraction withcontinuous magnitudes: (i) graphically representing the dividend with as many congruentparts as indicated by the denominator of the divisor, and taking the numerator of thedivisor as many times as possible (measurement); (ii) operating with fractions by addingthe divisor repeatedly until approaching the dividend by default, either by subtracting thedividend from the divisor as many times as possible, or by directly dividing fractions (useof fractions); and (iii) taking the denominator of the divisor as a unit and operating withnatural numbers, where, for instance, the operation 3:2/5 becomes the division of 15/5 by2/5, and one considers the division of 15 by 2, the unit of measure being ‘fifths’ (use of nat-ural numbers). Other authors have identified measurement procedures as direct modelingand the use of fraction addition and subtraction as repeated addition and subtraction [22].
The errors identified are of a conceptual and procedural nature. The conceptual errorsinclude not dividing the whole into equal parts, not identifying the unit of measure (suchas thinking that what is left over from dividing 2 by 3/5 is 1/3, and not 1/5), and invertingthe division terms. The procedural errors worthy of note include not counting correctlywhen using a measurement procedure, and not carrying out the algorithm correctly whenoperating with fractions [27].
Therefore, in this mathematical domain, noticing students’ mathematical thinkingimplies the use of knowledge regarding the meanings of the division, the proceduresfor problem-solving measurement division with fractions (measurement, use of naturalnumbers, use of fractions), as well as the scope and the limitations of these procedures andthe most common errors made by students.
2.2. Teachers’ Knowledge of Division with Fractions
Various studies have shown that PPTs have difficulties in solving problems thatinvolve division with fractions [28–34]. Graeber, Tirosh, and Glover [28] showed that manyPPTs tended to interpret division only as partitive division and found it difficult to dealwith situations where the operation had the meaning of measurement division, such asthe division of a whole number by a fraction. Ball [29] also indicated that some pre-serviceteachers were able to interpret division in terms of partition only. Out of a group of 19 pre-service primary and secondary school teachers in training, only five were able to describeor contrive an appropriate story to explain the meaning of the expression 1 3
4 : a half andanother five came up with stories that did not fit the situation; the most common error wasformulating a problem that required dividing by 2, instead of 1
2 . Nillas [30] showed thatthe ability to solve division problems with fractions did not imply having a conceptualunderstanding of the topic, and, consequently, teachers had little success in formulating

Mathematics 2021, 9, 3163 4 of 15
division problems. Koichu, Harel, and Manaster [31] showed that the success or failure ofmathematics teachers in formulating problems in the context of division with fractions waslinked to the conceptualization of the fraction as an operator or as a relationship betweenpart and whole, respectively.
Lo and Lou [32] studied mathematical content knowledge for division with fractionsin a group of PPTs from Taiwan, who had a high degree of success in tasks related tobasic fraction concepts, such as the fraction as part of a whole, the unit, the meaning ofoperations, and so on, that constitute part of teachers’ common content knowledge, butencountered difficulties in the tasks of formulating problems and resolving situationsthrough diagrams or graphic representations, all of which pertain to specialized contentknowledge.
Osana and Royea [33] designed a pre-service teacher intervention focused on fractions.The results revealed an improvement in conceptual knowledge, but not in the capacity forformulating problems. Furthermore, they identified certain cognitive obstacles when thepre-service teachers tried to build solutions and represent them symbolically. Tirosh [34]designed a course for improving PPTs’ knowledge of division with fractions. Prior to theintervention, most of the PPTs were capable of dividing fractions, but did not know how toexplain why the algorithm worked, and attributed the cause of the wrong answers typicalof their students’ to reading comprehension difficulties or to problems in applying thealgorithm; however, by the end of the course, the prospective teachers were able to identifyother causes for the most common mistakes made, such as interpreting the problem as apartitive division, or a limited conception of the notion of fractions or of the properties ofthe operations.
In summary, this previous research has shown PPTs difficulties in solving problemsthat require division with fractions or in the formulation of problems that must be solvedusing division with fractions.
2.3. Teachers Noticing in the Specific Mathematical Domain: Division with Fractions
To date, only a limited number of research papers on noticing this mathematicaldomain have been conducted. Jakobsen, Ribeiro, and Mellone [35] proposed a set of taskson a problem related to partitioning fractions to 49 future Norwegian teachers, in orderto identify their specialized knowledge (MKT) when interpreting and making sense ofstudents’ answers. The results show that, although most of them tried to interpret the stu-dents’ solution, they remained at a descriptive and evaluative level, as these interpretationsinvolve only aspects of the common content knowledge.
Montero and Callejo [36] carried out research with 21 pre-service primary schoolteachers. Pre-service teachers, in a teaching experiment, solve measurement divisionproblems and anticipate and classify student’s procedures to these problems. The resultsshowed that after the training, pre-service teachers were more able to identify the differentprocedures.
We extend this research, examining not only how pre-service teachers interpret stu-dent’s different procedures, but also procedural and conceptual errors. Furthermore,instead of classifying procedures, we will ask PPTs to score primary student’s answers andjustify them. This could provide us with information about pre-service teachers’ knowledgeregarding the scope and limitations of the procedures (validity and generalizability ofprocedures) and the most common errors made by students.
The research questions formulated are:
• How do PPTs solve measurement division problems with fractions?• How do PPTs interpret (score and justify) the answers of primary school students in
measurement division problems with fractions?
3. Materials and Methods
This study employs a qualitative research methodology, particularly, it focuses on howPPTs solve a measurement division problem with fractions and interpret the answers of
Mathematics 2021, 9, 3163 5 of 15
primary school students to this problem. We focus on identifying the different proceduresused by PPTs and the justifications provided to the scores given to primary school students’answers.
3.1. Participants and Context
The participants were 84 PPTs enrolled in a primary education teacher training pro-gram at a university in Spain. These pre-service teachers had received training on themeaning of fractions and operations for compulsory education levels, prior to their enrol-ment in university studies. The study was conducted before their dealing with fractionsand problems with a multiplication structure in the subject related to the teaching andlearning of these contents.
3.2. Instruments
The PPTs answered two tasks. Task 1 consisted in solving a measurement divisionproblem with fractions. The problem they had to solve was as follows:
I have four cakes. I want to give three-fifths of a cake to each child. To how many children can Igive some cake? How much do I have left?
This measurement division problem presents a situation in which fractional portions(3/5 of a cake) of a whole amount (4 cakes) must be made and asks how many portionscan be given (quotient), and how much is left (remainder). It can be solved by a divisionalgorithm or by other methods, such as direct modeling or repeated addition.
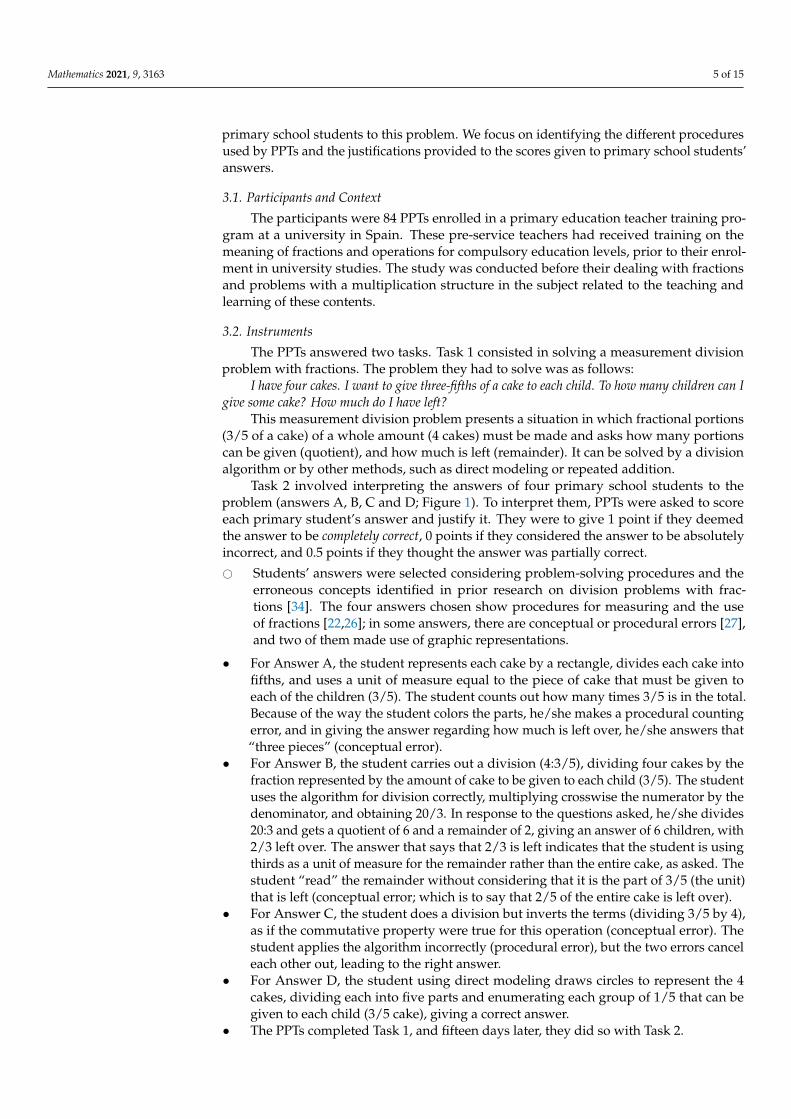
Task 2 involved interpreting the answers of four primary school students to theproblem (answers A, B, C and D; Figure 1). To interpret them, PPTs were asked to scoreeach primary student’s answer and justify it. They were to give 1 point if they deemedthe answer to be completely correct, 0 points if they considered the answer to be absolutelyincorrect, and 0.5 points if they thought the answer was partially correct.
# Students’ answers were selected considering problem-solving procedures and theerroneous concepts identified in prior research on division problems with frac-tions [34]. The four answers chosen show procedures for measuring and the useof fractions [22,26]; in some answers, there are conceptual or procedural errors [27],and two of them made use of graphic representations.
• For Answer A, the student represents each cake by a rectangle, divides each cake intofifths, and uses a unit of measure equal to the piece of cake that must be given toeach of the children (3/5). The student counts out how many times 3/5 is in the total.Because of the way the student colors the parts, he/she makes a procedural countingerror, and in giving the answer regarding how much is left over, he/she answers that“three pieces” (conceptual error).
• For Answer B, the student carries out a division (4:3/5), dividing four cakes by thefraction represented by the amount of cake to be given to each child (3/5). The studentuses the algorithm for division correctly, multiplying crosswise the numerator by thedenominator, and obtaining 20/3. In response to the questions asked, he/she divides20:3 and gets a quotient of 6 and a remainder of 2, giving an answer of 6 children, with2/3 left over. The answer that says that 2/3 is left indicates that the student is usingthirds as a unit of measure for the remainder rather than the entire cake, as asked. Thestudent “read” the remainder without considering that it is the part of 3/5 (the unit)that is left (conceptual error; which is to say that 2/5 of the entire cake is left over).
• For Answer C, the student does a division but inverts the terms (dividing 3/5 by 4),as if the commutative property were true for this operation (conceptual error). Thestudent applies the algorithm incorrectly (procedural error), but the two errors canceleach other out, leading to the right answer.
• For Answer D, the student using direct modeling draws circles to represent the 4cakes, dividing each into five parts and enumerating each group of 1/5 that can begiven to each child (3/5 cake), giving a correct answer.
• The PPTs completed Task 1, and fifteen days later, they did so with Task 2.

Mathematics 2021, 9, 3163 6 of 15
Figure 1. Primary school students’ answers selected for the problem.
3.3. Analysis
The responses by the PPTs to the Cake problem in Task 1 were classified based ontheir accuracy and the procedure used. The responses were analyzed individually by threeresearchers. Disagreements were discussed until we reached agreement.
As regards accuracy, the responses were classified as correct if the procedure usedand the answer were correct; as almost correct if the pre-service teacher used a correctprocedure and indicated how many children could be given cake but said that “two pieces”or “2 thirds of the cake” were left or when they divided a graphic into non-equal parts, yetthey reasoned correctly. Finally, the answers were classified as incorrect when they did notcorrectly interpret the statement of the problem, or the answer made no sense (Table 1).
Table 1. Classification of the accuracy of PPTs’ answers to the “Cake” problem (Task 1).
Answers Examples
Correct
The PPT represented graphically the cakesdividing each cake in five equal parts.He/she said that “I can give 3/5 of the caketo 6 children and the part of the cake left is2/5”
Almost correct
The PPT made a division correctly andindicated that he/she could give 3/5 of thecake to 6 children. However, he/sheindicated that the part of the cake left is 2pieces
Incorrect The PPT answer made no sense

Mathematics 2021, 9, 3163 7 of 15
The PPTs’ procedures were classified into three groups [26]:
• Use of natural numbers. When the PPTs considered the 4 cakes to be 20 fifths andjustified the answer by using natural numbers.
• Measurement. When the PPTs created a unit of measure equal to the piece they weresupposed to give to each child (3/5 of a rectangle or circle) and applied this measureto the 4 cakes.
• Use of fractions. When the PPTs used operations with fractions (such as repeatedadditions, or subtractions, or multiplication, or division with fractions).
Table 2 shows examples of each procedure.
Table 2. Classification of the procedures used by PPTs in solving the problem (Task 1).
Method Example
“The use of natural numbers”This answer was classified as almosst correct since the PPT
did not interpret the remainder
“The first cake is divided in 5 pieces. The second cake in 5 pieces. Thethird and fourth cake also in 5 pieces. So, we have 20 pieces (5 · 4 =
20). If we give to each child 3 pieces, we divide the number of piecesbetween the number of pieces that we have to give to each child”
“We can give cake to 6 children and the part of the cake left is 2pieces”
“Measurement”This answer was classified as correct
“You can give 3/5 of the cake to 6 children. The part of the cake left is2/5”
“The use of fractions”This answer was classified as correct
If you want to give 3/5 of the cake (pastel) to each child
“You can give cake to 6 children and the part of the cake left is 2/5”
For Task 2 (interpreting the primary school students’ answers to the “Cake” problem),the scores given by the pre-service teachers, along with their justifications, were analyzedindividually by three researchers. The justifications were then grouped into four categories:
• Justifications based on the validity of the method. When the PPTs deemed that theprocedure used by the primary school student was or was not valid for the problem.
• Justifications based on the generalizability of the method. When the PPTs believed theprocedures could or could not be applied to other problems with higher quantities.

Mathematics 2021, 9, 3163 8 of 15
• Justifications based on the clarity of the method. When the PPTs felt that the procedurewas explained with clarity.
• Other justifications. When the PPTs considered only the correctness of the result orother aspects.
The justifications given by the PPTs could belong in one or more categories. Table 3shows some examples of the analysis carried out.
Table 3. Examples of analysis of PPTs’ justifications.
Pre-Service Teacher’s Justification Category
“The student applies and develops an appropriate strategyto this problem, and arrives at the right answer” Validity of the method
“This is a correct procedure, but it is not the best one. Ifthe student had larger numbers the procedure would notwork”
Validity-generalizability of the method
“The procedure used to solve the problem (a drawing)clearly shows that the student understands the problemand knows how to solve it. With this procedure we canclearly see the 2/5 of the cake”
Validity/clarity of the method
Similarly, we considered whether the PPTs did or did not identify conceptual orprocedural errors in the answers of primary school students. For example, one PPTidentified a conceptual error in Answer B: “The procedure is correct, but the result is wrong.The number of pieces remaining should be a multiple of 1/5, and the student came up with 2/3. Thestudent made a mistake”, for the teacher realized that the primary student had not correctlyidentified the unit of measure. Another PPT identified the procedural error in Answer A:“The procedure is right, but the result is wrong since the student left one piece uncolored” and theteacher realized that the student did not apply the unit of measure correctly to give eachchild the correct portion.
4. Results
We describe the findings in three sections: (1) problem solving by the PPTs (Task 1);(2) relationship between the problem-solving results (Task 1) and the scoring assigned tothe answers by the primary school students (Task 2); and (3) interpretation of the answersand errors of the primary school students (Task 2).
4.1. How Do Pre-Service Teachers Solve the Measurement Division Problem?
The results of this study indicate that the PPTs found it difficult to solve the proposeddivision problem with fractions, and that they primarily used the measurement procedurewith support from a graphic representation of the quantities. The relationship between theprocedure used and the correctness of the problem is shown in Table 4.
Table 4. Percentage of PPTs giving a correct, almost correct, or incorrect answer and procedures used.
Procedure Correct Almost Correct Incorrect Total
Natural numbers 11.9 8.3 0.0 20.2
Measurement 27.4 2.4 14.3 44.1
Fractions 15.5 4.8 7.1 27.4
Others 0.0 1.2 7.1 8.3
Total 54.8 16.7 28.5
Interestingly, 54.8% of the PPTs gave a correct answer to the problem, 16.7% an almostcorrect answer, and 28.5% solved the problem incorrectly (Table 4). The PPTs who solved

Mathematics 2021, 9, 3163 9 of 15
the problem only as almost correct used an appropriate procedure, but could not expressthe remainder correctly.
Regarding the procedures used, 44.1% of the PPTs used the measurement procedure,using a graphic representation to solve it, and, of them, more than half did so correctly. Onthe other hand, of the 27.4% of the PPTs who used operations with fractions, more than halfused the division algorithm and gave correct answers. Examining as a whole the incorrectand almost correct answers by the PPTs using fractions, one can see that nearly half of thepre-service teachers using operations with fractions were able to express correctly what theremainder of the cake was. In addition, 20.2% turned to natural numbers to carry out thedivision. Approximately two-fifths of them had problems expressing what was left over asa fraction of the cake, due to not recognizing that the unit (the cake) was divided into fifths.This procedure transfers the unit from the cake to one of the pieces (1/5), and, thus, theanswer “two pieces are left over”, even though it is consistent with the procedure, does notreflect the relationship to the unit (the cake was divided into fifths).
4.2. Relationship between Problem Solving and the Scoring Assigned to the PrimaryStudents’ Answers
Table 5 shows the number of PPTs that correctly, almost correctly, or incorrectly solvedthe problem and the scores given to the primary school students’ answers (Task 2).
Table 5. Answers to the Cake problem by PPTs and scores given to primary school students.
Pre-ServiceTeachers’
Answers Task 1
Pre-Service Teachers’ Scores Questionnaire 2
Answer A (Incorrect-Measurement)
Answer B (Incorrect-Useof Fractions without
Interpretation ofRemainder)
Answer C (Incorrect-Useof Fractions with Two
Errors)
Answer D (Correct-Measurement)
0 0.5 1 0 0.5 1 0 0.5 1 0 0.5 1
Correct (45;54.9%) * 14.6 36.6 3.7 8.6 35.4 10.9 8.6 10.9 35.4 2.5 4.8 47.6
Almost Correct(14; 17%) 2.4 14.6 0 4.8 8.5 3.7 2.4 2.4 12.2 0 3.6 13.4
Incorrect (23;28.1%) 9.8 18.3 0 0 24.4 3.7 2.4 4.8 20.9 0 1.2 26.9
Total (82 **, 100%) 26.8 69.5 3.7 13.4 68.3 18.3 13.4 18.1 68.5 2.5 9.6 87.9
* The numbers appearing in parentheses for PPTs’ answers to Task 1 shows the number of teachers (and the percentage) giving a correct,almost correct, or incorrect answer. ** 2 PPTs did not respond to this section of Task 2; of the two, one had correctly solved this problem.
Answers A and B, which show the correct interpretation of the quotient but not of theremainder, were given scores of 0.5 by roughly 2/3 of the PPTs:
• Answer A, which uses a measurement procedure with a graphic representation forsupport, with one procedural and one conceptual error, was given a score of 0.5 by69.5% of the PPTs. The majority argued that the result was incorrect: “Incorrect solution,since there is 2/5 of a piece left over”. This group of teachers considered in their scoringhow the primary school student expressed the amount “left over”.
• Answer B, which uses division with fractions with a conceptual error in the interpreta-tion of the remainder, was given a score of 0.5 by 68.3% of the PPTs. These teachersmaintained that the result was not correct: “The result of the operation or conclusion thestudent reaches is not correct”, but without indicating that the whole had been dividedinto five parts and therefore what was left over could not be thirds, but fifths.
Answers C and D were given scores of 1 point by the majority, although a largermajority for D. Of these, C had one conceptual and one procedural error, and D was correct:
Mathematics 2021, 9, 3163 10 of 15
• Firstly, 68.5% of the PPTs that gave answer C a score of 1 said that both the procedureused and the result were correct: “The strategy and the solution are correct, and I am givingthe student the highest score since he/she understood the problem and has also carried out theright operations to solve it”. These PPTs focused their attention on the fact that the resultfor answer C was correct, but did not notice the two errors in the procedure (inversionof terms and algorithm).
• Secondly, 18.1% of the PPTs gave answer C a score of 0.5, arguing that the result wascorrect and noticing only one error, whether in the algorithm: “I gave him/her a scoreof 0.5 because even though the solution is correct, in the division there is a mistake since indivision with fractions you can’t multiply like that”; or due to the inversion of terms of theoperation: “The result is correct. The division by a fraction would be 4:3/5, but in the end thestudent gets the right result”.
• Finally, 13.4% of the PPTs that gave answer C a score of 0 gave at times the samereasons as those who scored it with 0.5 points: “It’s incorrect because he/she divided whathas to be given to each person by the number of people there are. Later the student realized that3:20 could not be right and corrected it; he/she gives the right answer but the approach, whichis the important thing, is all wrong”. Only two of them noticed both mistakes; in thesecases, the teachers based their score on the incorrect procedure and not on the answer.
Thus, a high percentage of PPTs did not identify the errors in answer C (proceduraland conceptual), noticing only the result and, as a consequence, giving the answer a scoreof 1.
Regarding answer D (correct graphic representation with circles), 87.9% of the PPTsawarded a grade of 1 and 12.1% of 0.5 or 0. The latter teachers did not score this answerwith a 1 because they thought that, although the procedure and the result were correct, thestudents should have used fractions in their operations or, in other words, they pointedout that the procedure used was not generalizable since they used graphics: “With highernumbers or smaller portions this strategy would be unthinkable”, or it could not be pertinent,which suggests a question about the role played by the pre-service teachers’ beliefs aboutmath teaching when it comes to evaluating students’ answers, or how the PPTs evaluatethe pertinence of specific procedures at a given moment of the curriculum.
It is also worth noting that for answers B and C, involving operations with fractions,the PPTs gave lower scores for B, with just one error in the interpretation of the remainder,than for C, which had two errors but whose result was correct (68.3% gave a score of 0.5points to answer B and 68.5% gave 1 point to answer C). Those giving answer B 0.5 pointspointed out the error in interpretation of the parts into which the unit was divided andbelieved the procedure used was correct.
Finally, regarding the relationship between the accuracy of the PPTs in the problemand the scores given to the students’ answers, we would point out that of the PPTs thathad not solved the problem correctly, most of them identified answer D as correct. Inother words, there were PPTs who, though unable to solve the problem correctly or givean adequate interpretation of the remainder, did assign a grade of 1 to this answer by theprimary students.
4.3. How the PPTs Interpreted the Procedures and Errors of the Primary School Students
Table 6 shows in percent the categories into which the types of justification the PPTsgave to the scores assigned to the primary school students’ answers. Most justificationswere focused on the validity of the method (71.4%). However, some given in answers A andD (where the student used a graphic representation) focused on the validity-generalizabilityof the method (7.2% and 17.8%, respectively), and others given for answer D were focusedon the validity/clarity of the method (16.7%).

Mathematics 2021, 9, 3163 11 of 15
Table 6. Percentage of PPTs for each type of justification given to the primary students’ answers.
Answer A Answer B Answer C Answer D Total
Validity 73.8 79.8 76.2 55.9 71.4
Validity/generalizability 7.2 0.0 2.4 17.8 6.9
Validity/clarity 1.2 2.4 3.6 16.7 6.0
Other 17.8 17.8 17.8 9.6 15.7
There was little mention by the PPTs of the errors in the students’ answers (Table 7),and the errors identified were not uniform for the three answers where they were men-tioned. For example, 37.2% of the PPTs identified some type of error in answer A, but only23.8% in answer B and 13.2% in answer C. In addition, the PPTs did not identify conceptualerrors in the same way as procedural errors for all of the answers. Thus, while for answer A32.5% identified the procedural error, only 4.7% mentioned the conceptual one. For answerC, 7.2% of PPTs mentioned the procedural error, while only 4.8% mentioned the conceptualerror, and 1.2% mentioned the procedural/conceptual aspects. It is worth noting how fewteachers identified the errors in answer C since they observed that the result in this answerwas correct (keep in mind that for this answer the errors canceled each other out).
Table 7. Percentage of PPTs identifying the type of error for each of the answers.
Type of Error Answer A Answer B Answer C
Conceptual 4.7 23.8 4.8
Procedural 32.5 - 7.2
Conceptual/procedural 0.0 - 1.2
5. Discussion and Conclusions
This study is framed within the research line on the relationship between teachers’mathematical knowledge for teaching in a specific mathematical domain and their ability tonotice. The specific focus was to examine how PPTs solve and interpret students’ answers(scoring and justifying) with regard to a problem of measurement division with fractions.
The findings of this study seem to suggest that: (1) PPTs’ knowledge of division withfractions is limited; (2) PPTs gave greater weight to the result than the procedure used inanswers where the result was correct but the procedure was not; and (3) Task 2 proposedto the PPTs has the potential to develop mathematical knowledge for teaching, since somepre-service teachers who were unable to solve the problem were able to identify the correctanswer and to identify an incorrect interpretation of the remainder in a division of fractions.
First, our findings indicate that PPTs’ knowledge of division with fractions is limited.This is clear from the percentage of success in solving the problem (54.8%) and the difficultyin identifying errors in the students’ answers (that ranges from 1.2% for recognition oftwo errors in the same answer to 32.5% for recognizing a procedural error in an answer).These results corroborate the findings of a great deal of previous work carried out withpre-service primary and secondary school teachers [28–30]. The procedure resorted to themost by pre-service teachers was measurement with a graphic representation, that is, thedirect modeling confirming the results obtained by [36].
Second, roughly 2/3 of the PPTs were given scores of 0.5 to answer B (division withfractions with a conceptual error in the interpretation of the remainder). These PPTs noticedthat these students had not realized that the whole had been divided into five parts andtherefore what was left over could not be thirds, but fifths.
The majority of PPTs assigned to the incorrect answer C a score of 1, basing theirjustification on the correctness of the result, without noticing that the procedure the studentsfollowed was erroneous (68.3%); this was true for pre-service teachers that solved theproblem correctly (29 out of 45, or 64.4%), almost correct or wrong (27 out of 37, or 72.9%).

Mathematics 2021, 9, 3163 12 of 15
Third, it is worth noting that of the 45 PPTs that solved the problem correctly, 41 gave ascore of 1 to answers that were incorrect (91.1%). These data can be interpreted by twoways: (1) That the PPTs’ knowledge of division with fractions does not allow them to noticethe two errors made in answer C (only two PPTs pointed them out). In this regard, knowinghow to correctly solve a measurement division problem is not enough to be able to interpretstudents’ answers adequately, since it involves both knowing various problem-solvingprocedures and identifying the mistakes made by students; (2) that PPTs might considerit sufficient to review the result due to the belief that “in problem solving the result is moreimportant than the process” [37]. This second interpretation highlights the role that beliefsabout problem solving can play in the process of interpreting and evaluating the answersgiven by primary school students. This is supported by the fact that a greater number ofPPTs evaluated answer C (56 or 68.3%) as the correct answer than B (15, or 18.3%). Thesetwo answers use division with fractions, but while in C there are two errors and the resultis correct, in B the division is correct but the result of what is left over is erroneous.
Regarding answer D (correct graphic representation), most of the PPTs awarded agrade of 1. PPTs who did not score this answer with a 1 gave as a justification that theprocedure used was not generalizable. This result suggests a question about the role playedby the PPTs’ beliefs about math teaching when it comes to evaluating students’ answers,or how the PPTs evaluate the pertinence of specific procedures at a given moment of thecurriculum. However, the smaller percentage in the justification’s category generalizabilitydiverges from findings from another study in which these same PPTs were asked to solvetwo measurement division problems with natural numbers and evaluate each of fouranswers by primary students [38]. In that study, a large number of PPTs believed thatalternative procedures to division such as repeated addition or subtraction or constructionwere difficult to generalize. This can be explained by PPTs’ greater mathematical knowledgefor teaching measurement division with natural numbers than with fractions, since while76% of PPTs were able to correctly solve measurement division problems with naturalnumbers using division, for this problem only 27.4% operated with fractions and 15.5%operated correctly with fractions. Further, most used measurement procedures are backedby graphic representation (44.1%, rectangles or circles).
Third, regarding the relationship between the accuracy of the PPTs in the problemand the scores given to the students’ answers, pre-service teachers who were unableto solve the problem correctly or give an adequate interpretation of the remainder, didassign a grade of 1 to the correct measurement procedure (answer D) and were able toidentify the incorrect interpretation of the remainder in answer B, scoring this answer with0.5. Therefore, the task proposed to the PPTs has the potential to develop mathematicalknowledge for teaching. The task is based on the use of representations of practice (alsocalled vignettes; [39]). Representations of practice are understood as a depiction of aclassroom situation (in this particular case, students’ written answers to the same problemthat show different characteristics of understanding) to promote pre-service teachers’reflection of real-life contexts. In fact, previous studies have provided further supportfor the hypothesis that vignettes provide teachers with real contexts to analyze aspects ofthe teaching and learning of mathematics and provide them with opportunities to relatetheoretical ideas with examples from the practice [2].
Implications for Teacher Training
These findings underline the need to consider training perspectives that impact notonly PPTs’ knowledge of mathematics but also pedagogical content knowledge that, inthe context of the present study, involves the development of the competency to interpretstudents’ answers: taking into account the primary students’ degree of comprehension ofthe meaning of the division, ways of representing the fractions, the level of command ofthe division algorithm over primary education, the most common errors and difficultiesand their causes [34,40,41].
Mathematics 2021, 9, 3163 13 of 15
As it has been shown in our results, the use of tasks similar to the one used in this studyin teacher training programs can help pre-service teachers to enhance noticing. This taskconsists of representations of practice (for instance, student’s answers showing differentfeatures of the concept understanding, transcripts of teacher–student interactions solvingan activity, etc.) and some questions that focus PPTs attention on interpreting students’mathematical thinking. Furthermore, recent studies have proved that the use of documentsas theoretical lenses [42] with mathematical content knowledge and pedagogical contentknowledge informed by mathematics education research focuses PPTs reflection on therepresentations of practice, and therefore, can support pre-service teachers’ enhancementof noticing students’ mathematical thinking.
Our work was focused on both the analysis of measurement division problem-solvingprocedures used by PPTs, as carried out in other studies mentioned at the start of this article,and on how teachers interpret the answers of primary school students using differentprocedures. The findings offer teacher trainers some initial references to PPTs’ knowledgeof measurement division and how they use this knowledge in the tasks they must carryout in their profession: the capacity to interpret their students’ answers.
Author Contributions: Conceptualization, M.M., C.F. and M.L.C.; methodology, M.M., C.F. andM.L.C.; validation, M.M., C.F. and M.L.C.; formal analysis, M.M., C.F. and M.L.C.; investigation,M.M., C.F. and M.L.C.; resources, M.M., C.F. and M.L.C.; writing—original draft preparation, M.M.,C.F. and M.L.C.; writing—review and editing, M.M., C.F. and M.L.C.; visualization, M.M., C.F. andM.L.C.; supervision, M.M., C.F. and M.L.C.; project administration, M.M., C.F. and M.L.C.; fundingacquisition, M.M., C.F. and M.L.C. All authors have read and agreed to the published version of themanuscript.
Funding: “This research was funded, in part (M.M.) by Universidad de Los Lagos (Chile) y suDirección de investigación” and in part (C.F. and M.L.C.) by the project PID2020-116514GB-I00del Ministerio de Ciencia e Innovación (Spain) and by the project coReflect@maths (2019-1-DE01-KA203-004947). coReflect@maths is co-funded by the Erasmus+ Programme of the European Union.The European Commission’s support for the production of this publication does not constitute anendorsement of the contents, which reflect the views only of the authors, and the Commission cannotbe held responsible for any use which may be made of the information contained therein.
Institutional Review Board Statement: All subjects involved gave their informed consent for inclu-sion before they participated in the study.
Informed Consent Statement: Informed consent was obtained from all subjects involved in thestudy.
Data Availability Statement: The data presented in this study are available on request from thecorresponding author.
Conflicts of Interest: The authors declare no conflict of interest.
References1. Dindyal, J.; Schack, E.O.; Choy, B.H.; Sherin, M.G. Exploring the terrains of mathematics teacher noticing. ZDM-Math. Educ. 2021,
53, 1–16. [CrossRef]2. Fernández, C.; Sánchez-Matamoros, G.; Valls, J.; Callejo, M.L. Noticing students’ mathematical thinking: Characterization,
development and contexts. Av. Investig. Educ. Matemática 2018, 13, 39–61. [CrossRef]3. Jacobs, V.R.; Spangler, D.A. Research on core practices in K-12 mathematics teaching. In Compendium for Research in Mathematics
Education; Cai, J., Ed.; National Council of Teachers of Mathematics: Reston, VA, USA, 2017; pp. 766–792.4. Sherin, M.G. The development of teachers’ professional vision in video clubs. In Video Research in the Learning Sciences, 1st ed.;
Goldman, R., Pea, R., Barron, B., Denny, S.J., Eds.; Routlege: New York, NY, USA, 2007; pp. 397–410. [CrossRef]5. Van Es, E.A.; Sherin, M.G. Learning to notice: Scaffolding new teachers’ interpretations of classroom interactions. J. Technol. Teach.
Educ. 2002, 10, 571–595.6. Jacobs, V.; Lamb, L.; Philipp, R. Professional noticing of children’s mathematical thinking. J. Res. Math. Educ. 2010, 41, 169–202.
[CrossRef]7. Thomas, J.; Fisher, M.H.; Jong, C.; Schack, E.O.; Krause, L.R.; Kasten, S. Professional noticing: Learning to teach responsively.
Math. Teach. Middle Sch. 2015, 21, 238–243. [CrossRef]

Mathematics 2021, 9, 3163 14 of 15
8. Brown, L.; Fernández, C.; Helliwell, T.; Llinares, S. Prospective mathematics teachers as learners in university and school contexts:From university–based activities to classroom practice. In International Handbook of Mathematics Teacher Education: Volume 3.Participants in Mathematics Teacher Education, 2nd ed.; Lloyd, G.M., Chapman, O., Eds.; Brill Academic Publishers: Leiden, TheNetherlands, 2020; pp. 343–366. [CrossRef]
9. Ball, D.L.; Thames, M.H.; Phelps, G. Content Knowledge for Teaching: What makes it Special? J. Teach. Educ. 2008, 59, 389–407.[CrossRef]
10. Thomas, J.; Jong, C.; Fisher, M.H.; Schack, E.O. Noticing and knowledge. Exploring theoretical connections between professionalnoticing and mathematical knowledge for teaching. Math. Educ. 2017, 26, 3–25.
11. Magiera, M.; van den Kieboom, L.; Moyer, J. An exploratory study of preservice middle school teachers’ knowledge of algebraicthinking. Educ. Stud. Math. 2013, 84, 93–113. [CrossRef]
12. Buforn, A.; Llinares, S.; Fernández, C.; Coles, A.; Brown, L. Pre-service teachers’ knowledge of the unitizing process in recognizingstudents’ reasoning to propose teaching decisions. Int. J. Math. Educ. Sci. Technol. 2020, 1–19. [CrossRef]
13. Son, J. How preservice teachers interpret and respond to student errors: Ratio and proportion in similar rectangles. Educ. Stud.Math. 2013, 84, 49–70. [CrossRef]
14. Ivars, P.; Fernández, C.; Llinares, S.; Choy, B.H. Enhancing noticing: Using a hypothetical learning trajectory to improvepre-service primary teachers’ professional discourse. Eurasia J. Math. Sci. Technol. Educ. 2018, 14, 3m1599. [CrossRef]
15. Dick, L.K. Investigating the relationship between professional noticing and specialized content knowledge. In Teacher Noticing:Bridging and Broadening Perspectives, Contexts and Frameworks; Schack, E.O., Fisher, M.H., Wilhelm, J.A., Eds.; Springer InternationalPublishing AG: Cham, Switzerland, 2017; pp. 445–466.
16. Schack, E.; Fisher, M.; Thomas, J.; Eisenhardt, S.; Tassell, J.; Yoder, M. Prospective elementary school teachers’ professionalnoticing of children’s early numeracy. J. Math. Teach. Educ. 2013, 16, 379–397. [CrossRef]
17. Sánchez-Matamoros, G.; Fernández, C.; Llinares, S. Relationships among prospective secondary mathematics teachers’ skills ofattending, interpreting and responding to students’ understanding. Educ. Stud. Math. 2019, 100, 83–99. [CrossRef]
18. Dreher, A.; Kuntze, S. Teachers’ professional knowledge and noticing: The case of multiple representations in the mathematicsclassroom. Educ. Stud. Math. 2015, 88, 89–114. [CrossRef]
19. Yang, X.; Kaiser, G.; König, J.; Blömeke, S. Relationship between Chinese mathematics teachers’ knowledge and their professionalnoticing. Int. J. Sci. Math. Educ. 2021, 19, 815–837. [CrossRef]
20. Friezen, M.; Kuntze, S. How context specific is teachers’ analysis of how representations are dealt with in classroom situations?Approaching context-aware measure for teacher noticing. ZDM-Math. Educ. 2021, 53, 181–193. [CrossRef]
21. Behr, M.; Harel, G.; Post, T.; Lesh, R. Rational number, ratio, and proportion. In Handbook of Research on Mathematics Teaching andLearning; Grows, D., Ed.; Macmillan: New York, NY, USA, 1992; pp. 296–333.
22. Empson, S.B.; Levi, L. Extending Children’s Mathematics: Fractions and Decimals; Heinemann: Portsmouth, NH, UK, 2011.23. Lamon, S. Rational number and proportional reasoning: Towards a theoretical framework for research. In Second Handbook of
Research on Mathematics Teaching and Learning; Lester, F.K., Jr., Ed.; National Council of Teachers of Mathematics: Reston, VA, USA,2007; pp. 629–667.
24. Greer, B. Multiplication and division as models of situation. In Handbook of Research on Mathematics Teaching and Learning; Grows,D., Ed.; McMillan: New York, NY, USA, 1992; pp. 276–295.
25. Vergnaud, G. Multiplicative conceptual field: What and why? In The Development of Multiplicative Reasoning in the Learning of theMathematics; Harel, G., Confrey, J., Eds.; State University of New York Press: New York, NY, USA, 1994; pp. 41–59.
26. Bulgar, S. Children’s sense-making of division of fractions. J. Math. Behav. 2003, 22, 319–334. [CrossRef]27. Cramer, K.; Monson, D.; Whitney, S.; Leavitt, S.; Wyberg, T. Dividing fractions and problem solving. Math. Teach. Middle Sch.
2010, 15, 338–346. [CrossRef]28. Graeber, A.O.; Tirosh, D.; Glover, R. Preservice teachers’ misconceptions in solving verbal problems in multiplication and division.
J. Res. Math. Educ. 1986, 20, 95–102.29. Ball, D.L. Prospective elementary and secondary teachers’ understanding division. J. Res. Math. Educ. 1990, 21, 132–144.
[CrossRef]30. Nillas, L. Division of fractions: Preservice teachers’ understanding and use of problem solving strategies. Math. Educ. 2003, 7,
96–113.31. Koichu, B.; Harel, G.; Manaster, A. Ways of thinking associated with mathematics teachers’ problem posing in the context of
division of fractions. Instr. Sci. 2013, 41, 681–698. [CrossRef]32. Lo, J.-J.; Lou, F. Prospective elementary teachers’ knowledge of fractions division. J. Math. Teach Educ. 2012, 15, 481–500.
[CrossRef]33. Osana, H.P.; Royea, D.A. Obstacles and challenges in preservice teachers’ explorations with fractions: A view from a small-scale
intervention study. J. Math. Behav. 2011, 30, 333–352. [CrossRef]34. Tirosh, D. Enhancing prospective teachers’ knowledge of children’s conceptions: The case of division of fractions. J. Res. Math.
Educ. 2000, 31, 5–25. [CrossRef]35. Jakobsen, A.; Ribeiro, C.M.; Mellone, M. Norwegian prospective teachers’ MKT when interpreting pupils’ productions on a
fraction task. Nord. Stud. Math. Educ. 2014, 19, 135–150.
Mathematics 2021, 9, 3163 15 of 15
36. Montero, E.; Callejo, M.L. How prospective teachers interpret primary students’ answers to fractions division-measure problems.In Investigación en Educación Matemática XXII; Rodríguez-Muñiz, L.J., Muñiz-Rodríguez, L., Aguilar-González, A., Alonso, P.,García, F.J., Bruno, A., Eds.; SEIEM: Gijón, Spain, 2018; pp. 378–386.
37. Callejo, M.L.; Vila, A. Approach to mathematical problem solving and students’ belief systems: Two case studies. Educ. Stud.Math. 2009, 72, 11–126. [CrossRef]
38. Fernández, C.; Callejo, M.L.; Márquez, M. Conocimiento de los estudiantes para maestro cuando interpretan respuestas deestudiantes de primaria a problemas de división-medida. Ensen. Cienc. 2014, 32, 407–424. [CrossRef]
39. Buchbinder, O.; Kuntze, S. Mathematics Teachers Engaging with Representations of Practice; A Dynamically Evolving Field; Springer:Cham, Switzerland, 2018.
40. Downton, A. A study of comparative performance on partitive and measurement division in solving division word problems. InProceedings of the 33rd Conference of the International Group for the Psychology of Mathematics Education; Tzekaki, M., Kaldrimidou,M., Sakonidis, H., Eds.; PME: Thessaloniki, Greece, 2009; Volume 2, pp. 465–472.
41. Li, Y.; Silver, E.A. Can younger students succeed where older students fail? An examination of third graders’ solutions of adivision-with-remainder (DWR) problem. J. Math. Behav. 2000, 19, 233–246. [CrossRef]
42. Fernández, C.; Choy, B.H. Theoretical lenses to develop mathematics teacher noticing. In International Handbook of MathematicsTeacher Education: Volume 2. Tools and Processes in Mathematics Teacher Education, 2nd ed.; Llinares, S., Chapman, O., Eds.; BrillAcademic Publishers: Leiden, The Netherlands, 2020; pp. 337–360.