Pore blockage effect of NOM on atrazine adsorption kinetics of PAC: the roles of PAC pore size...
10
Water Research 37 (2003) 4863–4872 Pore blockage effect of NOM on atrazine adsorption kinetics of PAC: the roles of PAC pore size distribution and NOM molecular weight Qilin Li a,1 , Vernon L. Snoeyink a, *, Benito J. Marin˜as a , Carlos Campos b a Department of Civil and Environmental Engineering, University of Illinois at Urbana-Champaign, 205 N Mathews Avenue, Urbana, IL 61801, USA b Suez Environment-CIRSEE, 38 rue du pr ! esident Wilson, 78230 Le Pecq, France Received 28 August 2002; received in revised form 22 July 2003; accepted 14 August 2003 Abstract Natural organic matter (NOM) in natural water has been found to have negative effects on the adsorption of various trace organic compounds by activated carbon through two major mechanisms: direct competition for sites and pore blockage. In this study, the pore blockage effect of NOM on atrazine adsorption kinetics was investigated. Two types of powdered activated carbon (PAC) and three natural waters were tested to determine the roles of PAC pore size distribution and NOM molecular weight distribution in the pore blockage mechanism. When PAC was preloaded with natural water, the pore blockage effect of the NOM was found to cause a reduction of up to more than two orders of magnitude in the surface diffusion rate of atrazine compared to simultaneous adsorption of atrazine and NOM with fresh PAC. The surface diffusion coefficient of atrazine for preloaded PAC decreased with a decrease in PAC dose or an increase in NOM surface concentration. Because of the pore blockage effect of NOM, a 30% drop in atrazine removal was observed in a continuous flow PAC/microfiltration (MF) system after 7 days of contact compared to the removal predicted from the batch isotherm test. Large micropores and mesopores were found to play an important role in alleviating the effect of pore blockage. A PAC with a relatively large fraction of large micropore and mesopores was shown to suffer much less from the pore blockage effect compared with a PAC that had a much smaller fraction of large pores. Natural waters with different NOM molecular weight distribution caused different extent of pore blockage. The NOM molecules with molecular weight between 200 and 700 Dalton appeared to be responsible for the pore blockage effect. r 2003 Elsevier Ltd. All rights reserved. Keywords: Powdered activated carbon; Natural organic matter; Atrazine; Pore blockage; Molecular weight distribution; Pore size distribution 1. Introduction Activated carbon has been widely used in drinking water treatment to remove dissolved organic com- pounds, including background natural organic matter (NOM) and a number of synthetic trace organic compounds. However, due to a limited understanding of the mechanisms of competitive adsorption, there is yet the need for the development of an accurate model that will predict trace organic compound adsorption from natural water. Previous studies often use the ideal adsorbed solution theory (IAST) [1] to model the adsorption equilibrium of a multiple solute system, which assumes equal access of all adsorbates to all adsorption sites and interaction of adsorbates through a ARTICLE IN PRESS *Corresponding author. Tel.: +1-217-333-4700; fax: +1- 217-333-6968. E-mail address: [email protected] (V.L. Snoeyink). 1 Current address: Department of Chemical Engineering, Yale University, 9 Hillhouse Avenue, New Haven, Connecticut 06510. 0043-1354/$ - see front matter r 2003 Elsevier Ltd. All rights reserved. doi:10.1016/j.watres.2003.08.018
Transcript of Pore blockage effect of NOM on atrazine adsorption kinetics of PAC: the roles of PAC pore size...
Water Research 37 (2003) 4863–4872
ARTICLE IN PRESS
*Correspond
217-333-6968.
E-mail addr1 Current ad
Yale University
06510.
0043-1354/$ - se
doi:10.1016/j.w
Pore blockage effect of NOM on atrazine adsorption kineticsof PAC: the roles of PAC pore size distribution and NOM
molecular weight
Qilin Lia,1, Vernon L. Snoeyinka,*, Benito J. Marinasa, Carlos Camposb
a Department of Civil and Environmental Engineering, University of Illinois at Urbana-Champaign, 205 N Mathews Avenue, Urbana,
IL 61801, USAb Suez Environment-CIRSEE, 38 rue du pr!esident Wilson, 78230 Le Pecq, France
Received 28 August 2002; received in revised form 22 July 2003; accepted 14 August 2003
Abstract
Natural organic matter (NOM) in natural water has been found to have negative effects on the adsorption of various
trace organic compounds by activated carbon through two major mechanisms: direct competition for sites and pore
blockage. In this study, the pore blockage effect of NOM on atrazine adsorption kinetics was investigated. Two types of
powdered activated carbon (PAC) and three natural waters were tested to determine the roles of PAC pore size
distribution and NOM molecular weight distribution in the pore blockage mechanism. When PAC was preloaded with
natural water, the pore blockage effect of the NOM was found to cause a reduction of up to more than two orders of
magnitude in the surface diffusion rate of atrazine compared to simultaneous adsorption of atrazine and NOM with
fresh PAC. The surface diffusion coefficient of atrazine for preloaded PAC decreased with a decrease in PAC dose or an
increase in NOM surface concentration. Because of the pore blockage effect of NOM, a 30% drop in atrazine removal
was observed in a continuous flow PAC/microfiltration (MF) system after 7 days of contact compared to the removal
predicted from the batch isotherm test. Large micropores and mesopores were found to play an important role in
alleviating the effect of pore blockage. A PAC with a relatively large fraction of large micropore and mesopores was shown
to suffer much less from the pore blockage effect compared with a PAC that had a much smaller fraction of large pores.
Natural waters with different NOM molecular weight distribution caused different extent of pore blockage. The NOM
molecules with molecular weight between 200 and 700 Dalton appeared to be responsible for the pore blockage effect.
r 2003 Elsevier Ltd. All rights reserved.
Keywords: Powdered activated carbon; Natural organic matter; Atrazine; Pore blockage; Molecular weight distribution; Pore size
distribution
1. Introduction
Activated carbon has been widely used in drinking
water treatment to remove dissolved organic com-
ing author. Tel.: +1-217-333-4700; fax: +1-
ess: [email protected] (V.L. Snoeyink).
dress: Department of Chemical Engineering,
, 9 Hillhouse Avenue, New Haven, Connecticut
e front matter r 2003 Elsevier Ltd. All rights reserve
atres.2003.08.018
pounds, including background natural organic matter
(NOM) and a number of synthetic trace organic
compounds. However, due to a limited understanding
of the mechanisms of competitive adsorption, there is
yet the need for the development of an accurate model
that will predict trace organic compound adsorption
from natural water. Previous studies often use the ideal
adsorbed solution theory (IAST) [1] to model the
adsorption equilibrium of a multiple solute system,
which assumes equal access of all adsorbates to all
adsorption sites and interaction of adsorbates through a
d.
ARTICLE IN PRESSQ. Li et al. / Water Research 37 (2003) 4863–48724864
single mechanism: direct competition for adsorption
sites. It has been realized only recently that NOM affects
trace organic compound adsorption not only by directly
competing for adsorption sites but also by blocking
carbon pores [2–5].
A common example of the pore blockage effect of
NOM in continuous flow adsorption systems is the
‘‘preloading’’ phenomena found in fixed bed GAC
columns. Due to their slower adsorption kinetics,
NOM compounds move down the column faster than
trace organic compounds. As a result, the GAC at the
effluent end of the bed is preloaded with NOM before it
is contacted with the trace organic molecules. In fact, all
the adsorption systems in which activated carbon is held
in the system while water continuously flows through are
vulnerable to the pore blockage effect. In these systems,
including granular activated carbon (GAC) adsorbers,
floc blanket reactors with powdered activated carbon
(PAC) addition, and PAC/membrane systems, the
activated carbon is partially loaded with NOM and
trace organic compounds before more trace organic
compounds enter the system, resulting in pore blockage
when the surface concentration of NOM gets high
enough. The ‘preloading’ effect in GAC adsorbers is
usually attributed to occupation of adsorption sites by
NOM or to pore blockage by NOM that makes
adsorption sites in small pores practically unavailable
to trace organic compounds [6–15]. Therefore, most
competitive adsorption research on the preloading effect
has focused primarily on its impact on the adsorption
equilibrium of trace organic compounds [2–5,15,16].
However, a recent mechanistic study by Li et al. [17]
showed that, in addition to practically reducing adsorp-
tion capacity, pore blockage by large molecules had a
strong effect on the adsorption kinetics of atrazine. It
was also found by Lebeau et al. [18] that both
adsorption capacity and the surface diffusion coefficient
of atrazine decreased as the PAC age in an immersed
microfiltration system increased. The result is that
higher carbon doses are required to achieve given
treatment goals compared to those predicted by batch
isotherm and kinetic tests using fresh carbon.
Since adsorption equilibrium is rarely reached in
continuous flow adsorption systems such as PAC/
membrane reactors and GAC columns, it is critical to
fully understand the effect of NOM on adsorption
kinetics of a trace organic compound so that mean-
ingful, accurate design tools may be developed. How-
ever, NOM in different natural waters varies so much
that it can have dramatically different competitive
adsorption effects [19]. One of the most important
characteristics of NOM that affects adsorption is
molecular weight. Moreover, the heterogeneity of
activated carbon surface is also an important factor in
competitive adsorption. The pore size distribution of
activated carbon relative to the molecular sizes of
adsorbates (e.g. trace organic compounds and NOM)
has been found to determine the dominant mechanism
of competitive adsorption [15,17,20,21]. Therefore, an
accurate evaluation of the roles of NOM molecular
weight distribution (MWD) and PAC properties is
necessary for optimizing system design and operation
to achieve maximum pollutant removal.
The objectives of this study are to: (1) demonstrate the
pore blockage effect of NOM on adsorption kinetics of
trace organic compounds in batch as well as in
continuous flow systems; (2) determine the effect of
NOM surface loading on adsorption kinetics of trace
organic compounds; (3) evaluate the roles of NOM
molecular weight and carbon pore size distributions in
pore blockage. This information is needed to improve
our understanding of the competitive effect of NOM,
which is necessary for better modeling of competitive
adsorption of trace organic compounds in natural water.
The results from this study will also help water utilities
choose the best adsorbent based on NOM characteristics
and the physical/chemical properties of the target
compound.
2. Materials and methods
2.1. Water
Organic-free water was obtained by passing deionized
water through a NANOpure ultrapure water system
(Barnstead, Dubuque, Iowa). The dissolved organic
carbon (DOC) concentration of the organic-free water is
lower than 0.3 mg/L. A central Illinois ground water
(referred to as GW) and two surface waters were used to
study the effect of NOM. The GW was taken from the
source immediately before use. It was treated with a
greensand filter to remove dissolved iron and manganese
and filtered through a 0.45 mm-pore-size microfiltration
cartridge to remove particles. The surface waters were
both taken from Lake Decatur, Decatur, IL. One was
taken shortly before it was used (referred to as FLDW)
and the other was taken and stored for one year before
use (referred to as DLDW). Both waters were stored at
4�C and passed through a 0.45mm-pore-size nylon
membrane filter to remove particulate matter immedi-
ately before use. The DOC concentrations of all three
natural waters were determined using a Phoenix 8000
TOC Analyzer (Tekmar-Dohrmann, Cincinnati, OH).
The initial DOC concentrations were 2.770.2 mg/L for
GW, 4.470.2 mg/L for FLDW and 3.070.0 mg/L for
the DLDW.
2.2. Adsorbents
Two types of commercial PAC, PAC A (Calgon
Carbon Corp., Pittsburgh, PA) and PAC B (NORIT
ARTICLE IN PRESS
Table 1
Relevant characteristics of PACs A and B [17]
Property PAC A PAC B
BET surface area (m2/g) 903 1110
Primary micropore (o8 (A)
volume (cm3/g)
0.278 0.343
Secondary micropore (8–20 (A)
volume (cm3/g)
0.142 0.194
Mesopore (20–500 (A) volume
(cm3/g)
0.072 0.357
Micropore surface area (m2/g) 888 733
Mesopore surface area (m2/g) 15 379
Q. Li et al. / Water Research 37 (2003) 4863–4872 4865
France, S.a.r.l., Le Blanc Mesnil Cedex, France), were
used to demonstrate the effect of pore size distribution
on competitive adsorption mechanisms. Important pore
size distribution parameters of these carbons, obtained
using the N2 adsorption equilibrium technique [22], are
presented in Table 1.
2.3. Adsorbates
Atrazine was used as the target adsorbate. The stock
solution was prepared by mixing 14C-labeled atrazine
(Sigma, St. Louis, MO) and non-labeled atrazine (Chem
Service, Chester, PA) to yield a specific radioactivity of
33.68mCi/mg. The solution was refrigerated until use.
Atrazine samples were analyzed with a liquid scintilla-
tion analyzer (Tri-Carb Model 1600A, Packard Instru-
ment Co., Downers Grove, IL). The analytical
procedures are described elsewhere [22]. The detection
limit was determined to be 0.03mg/L with a confidence
level of 95%.
2.4. MWD analysis of NOM
The MWD of NOM was measured with a high
performance liquid chromatography system (HP 1090,
Series II, Hewlett-Packard Co., Wilmington, DE) using
a size exclusion chromatography (SEC) column (Pro-
tein-PakTM 125, Waters Corporation, Milford, MA) at
40�C and a mobile phase flow rate of 1 mL/min. The
mobile phase consisted of 0.02 M orthophosphate at pH
6.8. NaCl was added to yield an ionic strength of 0.1 M.
Before the analysis, the mobile phase was degassed for at
least two hours to prevent air bubbles from entering the
SEC column. The calibration curve was generated using
poly(styrene sulfonate) (PSS) with molecular weight
(MW) ranging from 1800 to 35,000 Da and acetone
(MW=58 Da) as the standards. The UV absorbance of
PSS and acetone was monitored at 224 nm. When NOM
was analyzed, a 6 mL sample was taken and filtered
through a 0.22 mm nylon membrane filter. The first 4 mL
was wasted to eliminate error due to adsorption of
NOM on the membrane, and the final 2 mL was
transferred to a vial for analysis. The UV absorbance
of the sample was monitored at 260 nm.
2.5. Batch atrazine adsorption kinetic tests with fresh and
preloaded PAC
Atrazine adsorption kinetic tests were conducted
using PAC preloaded with natural water to determine
the effect of NOM preloading on adsorption kinetics of
atrazine. Different doses of fresh PAC were first
preloaded with natural water in 2 L square jars for 4
days to obtain different surface coverage. DOC samples
were taken after preloading to determine the surface
concentrations of NOM. Mixing was maintained when
the samples were taken so that the carbon dose remained
the same after sampling. Atrazine was then spiked into
the solution to obtain the desired initial concentration
and the change of atrazine concentration was monitored
for at least 4 h by taking samples at predetermined times.
Atrazine samples were also taken after 11 and 25 days of
contact to determine the equilibrium concentration of
atrazine, considering the slow adsorption kinetics caused
by NOM preloading. During the 25-day contact, the
square jars were covered to avoid concentration change
by evaporation. In parallel, atrazine adsorption kinetic
tests were also conducted using fresh PAC in natural
water to determine atrazine adsorption kinetics during
simultaneous adsorption of atrazine and NOM. The
experimental procedure is similar to that with the
preloaded PAC and was described elsewhere [22].
Adsorption tests conducted in natural water with fresh
PAC are referred to as simultaneous adsorption hereon.
It should be noticed that for the purpose of comparing
the results for preloaded and simultaneous adsorption
tests, the same total amount of NOM and atrazine,
including the corresponding fractions in liquid and solid
phases, per unit mass of carbon was used for both tests.
2.6. Continuous flow experiment
The continuous flow experiment was conducted in a
bench-scale PAC/MF system. The schematic of the
experimental set-up is shown in Fig. 1. The membrane
unit is a 400 mL Amicon stirred cell (Model 8400,
Amicon Inc., Beverly, MA). A 1mm-pore-size Nucle-
pores MF membrane (Corning, Acton, MA) was
installed at the bottom of the cell that allowed water
to pass while retaining the PAC. Prior to the experiment,
PAC was added to the cell in a slurry form. The pressure
release valve was closed when the cell was filled with
the influent water so that the influent water could be
pumped through the cell at a constant flow rate. The
effluent was continuously circulated back to the influent
tank, and the experiment was run for 7 days. Samples
were taken from the effluent at the end of the 7th day
ARTICLE IN PRESS
PAC
MF Membrane
Stirred cell
Influent reservoir Stirrer
plate
Effluent
Pressure release valve
Compact tubing pump
Fig. 1. Schematic of the bench-scale PAC/MF system.
Q. Li et al. / Water Research 37 (2003) 4863–48724866
and analyzed for atrazine to determine its adsorption
capacity under a continuous flow condition. A pre-
liminary test was conducted by contacting atrazine and
the MF membrane in organic-free water to determine
the atrazine adsorption capacity of the membrane.
3. Results and discussion
3.1. Effect of NOM preloading on atrazine adsorption
kinetics: batch experiments
Batch atrazine adsorption kinetic tests were con-
ducted using PAC preloaded with NOM in natural
water to determine the effect of NOM preloading on
atrazine adsorption kinetics. Doses of 4, 8, 12 and
16 mg/L of PAC A and 2, 4, 8.3 and 12 mg/L of PAC B
were preloaded in 2 L of fresh Lake Decatur water
(FLDW) for 4 days to obtain a range of NOM surface
loading. Following the same procedure, 4, 8, 12 and
20 mg/L of PAC A was preloaded with the one year old
Lake Decatur water (DLDW), and 2 and 4 mg/L of
PAC B was preloaded with the ground water (GW). The
surface concentration of NOM after preloading was
determined from the change of DOC concentration
before and after preloading. Then, atrazine was spiked
into each test jar to obtain initial concentrations of
10mg/L in FLDW and DLDW, and 5mg/L in GW. The
kinetic tests were run for at least 4 h. In parallel,
simultaneous adsorption kinetic tests were conducted
using 4 mg/L of each fresh PAC in all three natural
waters. Atrazine samples were taken after 11 and 25
days to determine its equilibrium concentrations. The
atrazine adsorption capacity of both carbons in GW was
determined in a previous study [22].
The Freundlich model (Eq. (1)) was used to describe
adsorption equilibrium of atrazine and the homoge-
neous surface diffusion model (HSDM) [23] was used to
describe atrazine adsorption kinetics.
qeq ¼ KC1=neq ; ð1Þ
where, Ceq(mg/L) is the equilibrium liquid phase
concentration, qeq(mg/mg) is the equilibrium solid
phase concentration; and K ((mg/mg)(L/mg)1/n) and 1/n
(dimensionless) are Freundlich parameters.
3.1.1. The pore blockage effect of NOM
Figs. 2 and 3 present atrazine adsorption kinetic
curves in FLDW for fresh and preloaded PAC A and
PAC B, respectively. For both PACs, preloading with
FLDW showed a dramatic impact on atrazine adsorp-
tion. For the same PAC dose, 4 mg/L, fresh PAC A and
PAC B achieved 44 and 60% atrazine removal,
respectively, at the end of the 4-hour test, while the
preloaded PACs only obtained 6% and 10% removal of
atrazine, respectively. This discrepancy was attributed to
the pore blockage effect of NOM on both atrazine
adsorption capacity and kinetics.
The adsorption capacity for atrazine was determined
from the equilibrium concentrations of atrazine. A slight
concentration decrease was measured between the 11th
and the 25th day of contact. Therefore, equilibrium was
assumed after contact of 25 days, and the equilibrium
concentrations of atrazine for both preloaded and fresh
PAC are shown in Fig. 4. Also shown in Fig. 4 are
atrazine equilibrium concentrations obtained in DLDW
with fresh and preloaded PAC A. It has been found that
simultaneous adsorption isotherms of atrazine in natural
water are parallel to those in organic-free water at
low concentrations, i.e. the 1/n values are the same
[22,26,27]. Therefore, the 1/n values obtained in organic-
free water were used to evaluate atrazine adsorption
capacity, K, for different doses of preloaded and fresh
PACs. The 1/n values used were 0.41 for PAC A and
0.44 for PAC B [22]. The lines shown in Fig. 4 are
calculated isotherms for the fresh PACs using these 1/n
values based on the data obtained at the carbon dose of
4 mg/L. As shown in Fig. 4, the adsorption capacities of
the preloaded PACs agree with those of the fresh PACs
at high PAC doses, i.e. low Ceq range, showing that
pore blockage by NOM may not affect atrazine
adsorption equilibrium although it seriously impact

ARTICLE IN PRESS
0.0
0.2
0.4
0.6
0.8
1.0
1.2
0 60 120 180 240
Time, min
Atr
azin
e re
mai
nin
g, C
/C0
Fresh PAC, 4mg/L
Preloaded PAC, 4mg/L
Preloaded PAC, 8mg/L
Preloaded PAC, 12mg/L
Preloaded PAC, 16mg/L
HSDM fit
Fig. 2. Atrazine adsorption kinetic curves of PAC A in FLDW
0.0
0.2
0.4
0.6
0.8
1.0
1.2
0 60 120 180 240 300
Time, min
Atr
azin
e re
mai
nin
g,C
/C0
Fresh PAC, 4mg/L
Preloaded PAC,2mg/L
Preloaded PAC,4mg/L
Preloaded PAC,8mg/L
Preloaded PAC,12mg/L
HSDM fit
Fig. 3. Atrazine adsorption kinetic curves of PAC B in FLDW.
0.1
1
10
0.1 1 10Equilibrium atrazine concentration, µg/L
Atr
azin
e ad
sorb
ed, µ
g/m
g
DLDW Preloaded PAC AFLDW preloaded PAC AFresh PAC A in DLDWFresh PAC A in FLDWFLDW preloaded PAC BFresh PAC B in FLDWFresh PAC A, calculatedFresh PAC B, calculated
PAC dose = 4 mg/L
Fig. 4. Atrazine adsorption equilibrium concentrations obtained in natural water (25-day contact).
Q. Li et al. / Water Research 37 (2003) 4863–4872 4867
ARTICLE IN PRESS
1.0E-13
1.0E-12
1.0E-11
1.0E-10
0 50 100 150 200
NOM surface concentration, mg/g
Ds
of
atra
zin
e, c
m2 /m
in
PAC A
PAC B
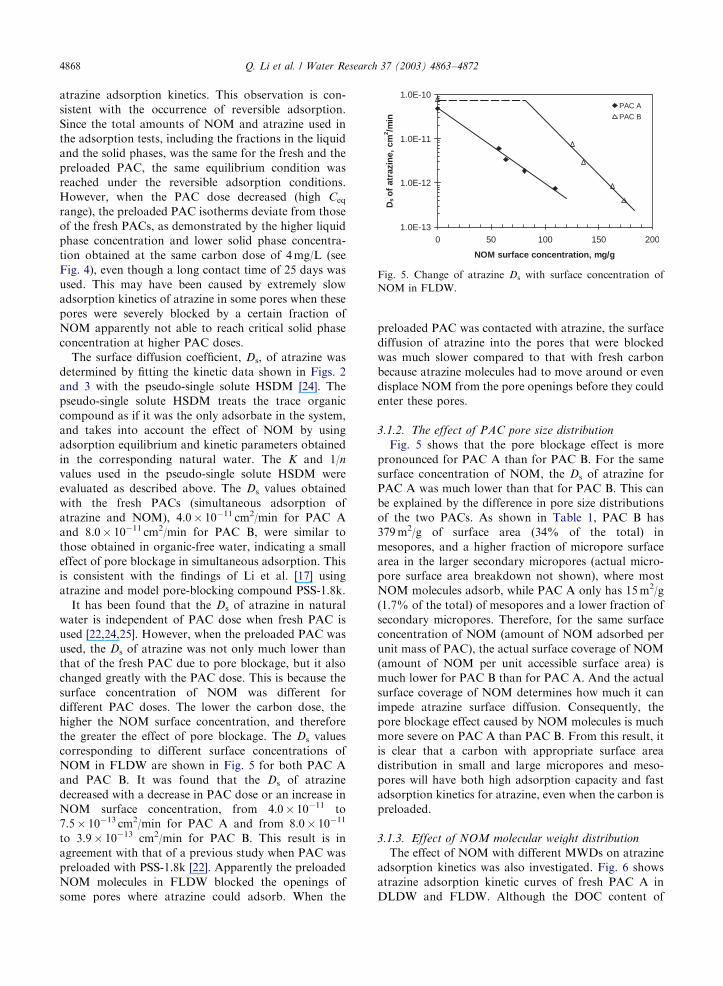
Fig. 5. Change of atrazine Ds with surface concentration of
NOM in FLDW.
Q. Li et al. / Water Research 37 (2003) 4863–48724868
atrazine adsorption kinetics. This observation is con-
sistent with the occurrence of reversible adsorption.
Since the total amounts of NOM and atrazine used in
the adsorption tests, including the fractions in the liquid
and the solid phases, was the same for the fresh and the
preloaded PAC, the same equilibrium condition was
reached under the reversible adsorption conditions.
However, when the PAC dose decreased (high Ceq
range), the preloaded PAC isotherms deviate from those
of the fresh PACs, as demonstrated by the higher liquid
phase concentration and lower solid phase concentra-
tion obtained at the same carbon dose of 4 mg/L (see
Fig. 4), even though a long contact time of 25 days was
used. This may have been caused by extremely slow
adsorption kinetics of atrazine in some pores when these
pores were severely blocked by a certain fraction of
NOM apparently not able to reach critical solid phase
concentration at higher PAC doses.
The surface diffusion coefficient, Ds, of atrazine was
determined by fitting the kinetic data shown in Figs. 2
and 3 with the pseudo-single solute HSDM [24]. The
pseudo-single solute HSDM treats the trace organic
compound as if it was the only adsorbate in the system,
and takes into account the effect of NOM by using
adsorption equilibrium and kinetic parameters obtained
in the corresponding natural water. The K and 1/n
values used in the pseudo-single solute HSDM were
evaluated as described above. The Ds values obtained
with the fresh PACs (simultaneous adsorption of
atrazine and NOM), 4.0� 10�11 cm2/min for PAC A
and 8.0� 10�11 cm2/min for PAC B, were similar to
those obtained in organic-free water, indicating a small
effect of pore blockage in simultaneous adsorption. This
is consistent with the findings of Li et al. [17] using
atrazine and model pore-blocking compound PSS-1.8k.
It has been found that the Ds of atrazine in natural
water is independent of PAC dose when fresh PAC is
used [22,24,25]. However, when the preloaded PAC was
used, the Ds of atrazine was not only much lower than
that of the fresh PAC due to pore blockage, but it also
changed greatly with the PAC dose. This is because the
surface concentration of NOM was different for
different PAC doses. The lower the carbon dose, the
higher the NOM surface concentration, and therefore
the greater the effect of pore blockage. The Ds values
corresponding to different surface concentrations of
NOM in FLDW are shown in Fig. 5 for both PAC A
and PAC B. It was found that the Ds of atrazine
decreased with a decrease in PAC dose or an increase in
NOM surface concentration, from 4.0� 10�11 to
7.5� 10�13 cm2/min for PAC A and from 8.0� 10�11
to 3.9� 10�13 cm2/min for PAC B. This result is in
agreement with that of a previous study when PAC was
preloaded with PSS-1.8k [22]. Apparently the preloaded
NOM molecules in FLDW blocked the openings of
some pores where atrazine could adsorb. When the
preloaded PAC was contacted with atrazine, the surface
diffusion of atrazine into the pores that were blocked
was much slower compared to that with fresh carbon
because atrazine molecules had to move around or even
displace NOM from the pore openings before they could
enter these pores.
3.1.2. The effect of PAC pore size distribution
Fig. 5 shows that the pore blockage effect is more
pronounced for PAC A than for PAC B. For the same
surface concentration of NOM, the Ds of atrazine for
PAC A was much lower than that for PAC B. This can
be explained by the difference in pore size distributions
of the two PACs. As shown in Table 1, PAC B has
379 m2/g of surface area (34% of the total) in
mesopores, and a higher fraction of micropore surface
area in the larger secondary micropores (actual micro-
pore surface area breakdown not shown), where most
NOM molecules adsorb, while PAC A only has 15 m2/g
(1.7% of the total) of mesopores and a lower fraction of
secondary micropores. Therefore, for the same surface
concentration of NOM (amount of NOM adsorbed per
unit mass of PAC), the actual surface coverage of NOM
(amount of NOM per unit accessible surface area) is
much lower for PAC B than for PAC A. And the actual
surface coverage of NOM determines how much it can
impede atrazine surface diffusion. Consequently, the
pore blockage effect caused by NOM molecules is much
more severe on PAC A than PAC B. From this result, it
is clear that a carbon with appropriate surface area
distribution in small and large micropores and meso-
pores will have both high adsorption capacity and fast
adsorption kinetics for atrazine, even when the carbon is
preloaded.
3.1.3. Effect of NOM molecular weight distribution
The effect of NOM with different MWDs on atrazine
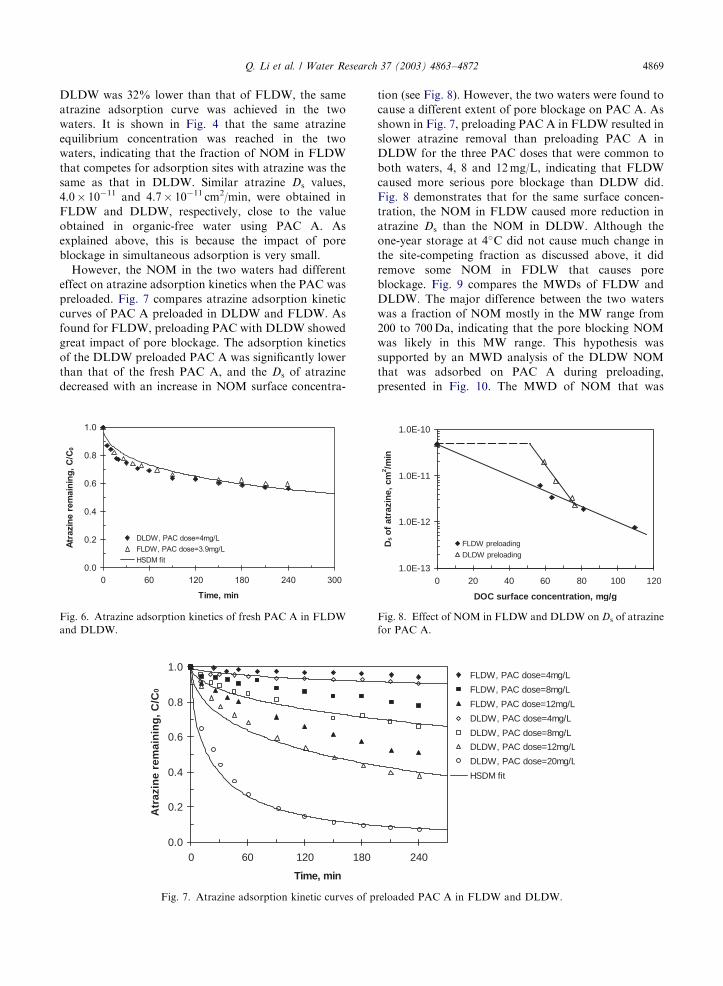
adsorption kinetics was also investigated. Fig. 6 shows
atrazine adsorption kinetic curves of fresh PAC A in
DLDW and FLDW. Although the DOC content of
ARTICLE IN PRESSQ. Li et al. / Water Research 37 (2003) 4863–4872 4869
DLDW was 32% lower than that of FLDW, the same
atrazine adsorption curve was achieved in the two
waters. It is shown in Fig. 4 that the same atrazine
equilibrium concentration was reached in the two
waters, indicating that the fraction of NOM in FLDW
that competes for adsorption sites with atrazine was the
same as that in DLDW. Similar atrazine Ds values,
4.0� 10�11 and 4.7� 10�11 cm2/min, were obtained in
FLDW and DLDW, respectively, close to the value
obtained in organic-free water using PAC A. As
explained above, this is because the impact of pore
blockage in simultaneous adsorption is very small.
However, the NOM in the two waters had different
effect on atrazine adsorption kinetics when the PAC was
preloaded. Fig. 7 compares atrazine adsorption kinetic
curves of PAC A preloaded in DLDW and FLDW. As
found for FLDW, preloading PAC with DLDW showed
great impact of pore blockage. The adsorption kinetics
of the DLDW preloaded PAC A was significantly lower
than that of the fresh PAC A, and the Ds of atrazine
decreased with an increase in NOM surface concentra-
0.0
0.2
0.4
0.6
0.8
1.0
0 60 120 180 240 300
Time, min
Atr
azin
e r
em
ain
ing
, C
/C0
DLDW, PAC dose=4mg/L
FLDW, PAC dose=3.9mg/L
HSDM fit
Fig. 6. Atrazine adsorption kinetics of fresh PAC A in FLDW
and DLDW.
0.0
0.2
0.4
0.6
0.8
1.0
0 60 120 180
Time, min
Atr
azin
e re
mai
nin
g, C
/C0
Fig. 7. Atrazine adsorption kinetic curves of p
tion (see Fig. 8). However, the two waters were found to
cause a different extent of pore blockage on PAC A. As
shown in Fig. 7, preloading PAC A in FLDW resulted in
slower atrazine removal than preloading PAC A in
DLDW for the three PAC doses that were common to
both waters, 4, 8 and 12 mg/L, indicating that FLDW
caused more serious pore blockage than DLDW did.
Fig. 8 demonstrates that for the same surface concen-
tration, the NOM in FLDW caused more reduction in
atrazine Ds than the NOM in DLDW. Although the
one-year storage at 4�C did not cause much change in
the site-competing fraction as discussed above, it did
remove some NOM in FDLW that causes pore
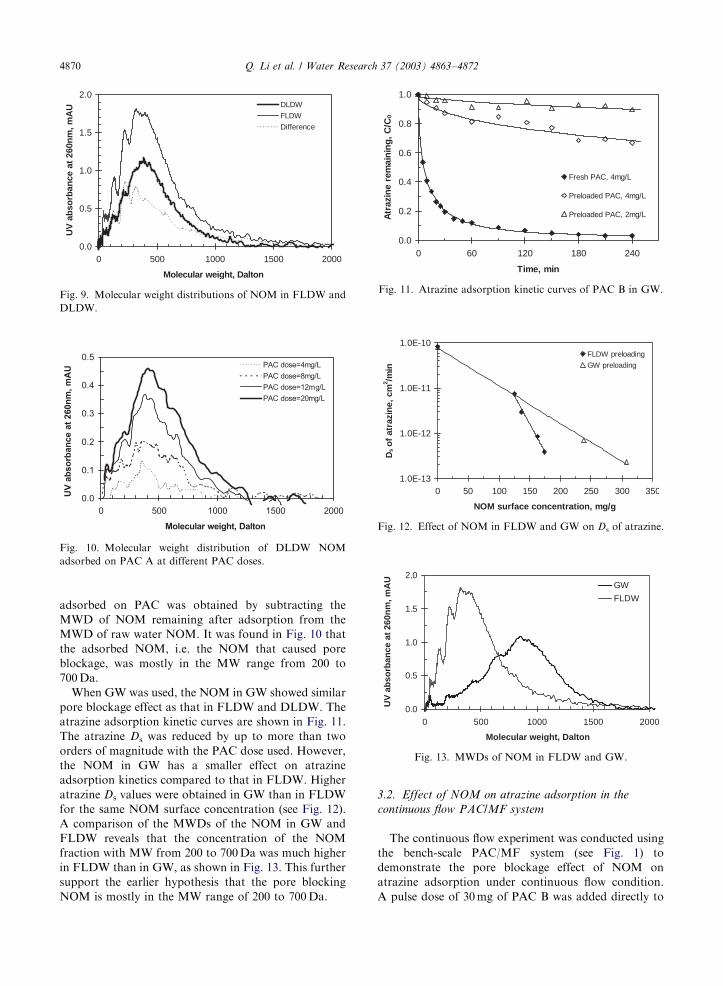
blockage. Fig. 9 compares the MWDs of FLDW and
DLDW. The major difference between the two waters
was a fraction of NOM mostly in the MW range from
200 to 700 Da, indicating that the pore blocking NOM
was likely in this MW range. This hypothesis was
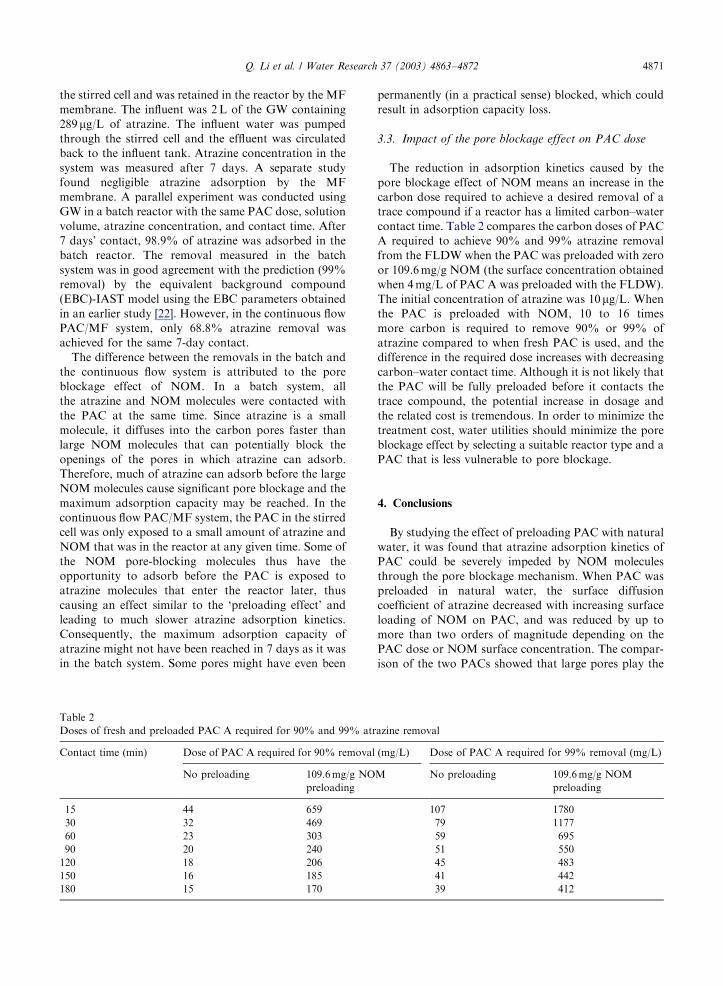
supported by an MWD analysis of the DLDW NOM
that was adsorbed on PAC A during preloading,
presented in Fig. 10. The MWD of NOM that was
240
FLDW, PAC dose=4mg/L
FLDW, PAC dose=8mg/L
FLDW, PAC dose=12mg/L
DLDW, PAC dose=4mg/L
DLDW, PAC dose=8mg/L
DLDW, PAC dose=12mg/L
DLDW, PAC dose=20mg/L
HSDM fit
reloaded PAC A in FLDW and DLDW.
1.0E-13
1.0E-12
1.0E-11
1.0E-10
0 20 40 60 80 100 120
DOC surface concentration, mg/g
Ds
of
atra
zin
e, c
m2 /m
in
FLDW preloading
DLDW preloading
Fig. 8. Effect of NOM in FLDW and DLDW on Ds of atrazine
for PAC A.
ARTICLE IN PRESS
0.0
0.5
1.0
1.5
2.0
0 500 1000 1500 2000
Molecular weight, Dalton
UV
ab
sorb
ance
at
260n
m, m
AU DLDW
FLDW
Difference
Fig. 9. Molecular weight distributions of NOM in FLDW and
DLDW.
0.0
0.1
0.2
0.3
0.4
0.5
0 500 1000 1500 2000
Molecular weight, Dalton
UV
ab
so
rban
ce a
t 260n
m,
mA
U
PAC dose=4mg/L
PAC dose=8mg/L
PAC dose=12mg/L
PAC dose=20mg/L
Fig. 10. Molecular weight distribution of DLDW NOM
adsorbed on PAC A at different PAC doses.
0.0
0.2
0.4
0.6
0.8
1.0
0 60 120 180 240
Time, min
Atr
azin
e re
mai
nin
g,
C/C
0
Fresh PAC, 4mg/L
Preloaded PAC, 4mg/L
Preloaded PAC, 2mg/L
Fig. 11. Atrazine adsorption kinetic curves of PAC B in GW.
0.0
0.5
1.0
1.5
2.0
0 500 1000 1500 2000
Molecular weight, Dalton
UV
ab
sorb
ance
at
260n
m, m
AU
GW
FLDW
Fig. 13. MWDs of NOM in FLDW and GW.
1.0E-13
1.0E-12
1.0E-11
1.0E-10
0 50 100 150 200 250 300 350
NOM surface concentration, mg/g
Ds
of
atra
zin
e, c
m2 /m
in
FLDW preloading
GW preloading
Fig. 12. Effect of NOM in FLDW and GW on Ds of atrazine.
Q. Li et al. / Water Research 37 (2003) 4863–48724870
adsorbed on PAC was obtained by subtracting the
MWD of NOM remaining after adsorption from the
MWD of raw water NOM. It was found in Fig. 10 that
the adsorbed NOM, i.e. the NOM that caused pore
blockage, was mostly in the MW range from 200 to
700 Da.
When GW was used, the NOM in GW showed similar
pore blockage effect as that in FLDW and DLDW. The
atrazine adsorption kinetic curves are shown in Fig. 11.
The atrazine Ds was reduced by up to more than two
orders of magnitude with the PAC dose used. However,
the NOM in GW has a smaller effect on atrazine
adsorption kinetics compared to that in FLDW. Higher
atrazine Ds values were obtained in GW than in FLDW
for the same NOM surface concentration (see Fig. 12).
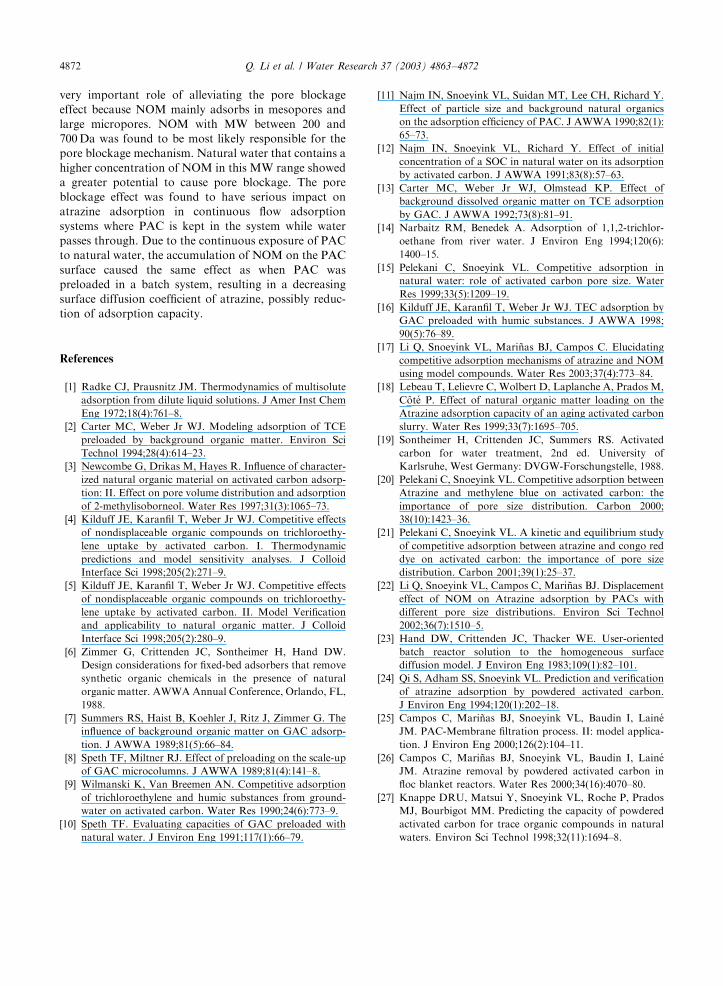
A comparison of the MWDs of the NOM in GW and
FLDW reveals that the concentration of the NOM
fraction with MW from 200 to 700 Da was much higher
in FLDW than in GW, as shown in Fig. 13. This further
support the earlier hypothesis that the pore blocking
NOM is mostly in the MW range of 200 to 700 Da.
3.2. Effect of NOM on atrazine adsorption in the
continuous flow PAC/MF system
The continuous flow experiment was conducted using
the bench-scale PAC/MF system (see Fig. 1) to
demonstrate the pore blockage effect of NOM on
atrazine adsorption under continuous flow condition.
A pulse dose of 30 mg of PAC B was added directly to
ARTICLE IN PRESSQ. Li et al. / Water Research 37 (2003) 4863–4872 4871
the stirred cell and was retained in the reactor by the MF
membrane. The influent was 2 L of the GW containing
289mg/L of atrazine. The influent water was pumped
through the stirred cell and the effluent was circulated
back to the influent tank. Atrazine concentration in the
system was measured after 7 days. A separate study
found negligible atrazine adsorption by the MF
membrane. A parallel experiment was conducted using
GW in a batch reactor with the same PAC dose, solution
volume, atrazine concentration, and contact time. After
7 days’ contact, 98.9% of atrazine was adsorbed in the
batch reactor. The removal measured in the batch
system was in good agreement with the prediction (99%
removal) by the equivalent background compound
(EBC)-IAST model using the EBC parameters obtained
in an earlier study [22]. However, in the continuous flow
PAC/MF system, only 68.8% atrazine removal was
achieved for the same 7-day contact.
The difference between the removals in the batch and
the continuous flow system is attributed to the pore
blockage effect of NOM. In a batch system, all
the atrazine and NOM molecules were contacted with
the PAC at the same time. Since atrazine is a small
molecule, it diffuses into the carbon pores faster than
large NOM molecules that can potentially block the
openings of the pores in which atrazine can adsorb.
Therefore, much of atrazine can adsorb before the large
NOM molecules cause significant pore blockage and the
maximum adsorption capacity may be reached. In the
continuous flow PAC/MF system, the PAC in the stirred
cell was only exposed to a small amount of atrazine and
NOM that was in the reactor at any given time. Some of
the NOM pore-blocking molecules thus have the
opportunity to adsorb before the PAC is exposed to
atrazine molecules that enter the reactor later, thus
causing an effect similar to the ‘preloading effect’ and
leading to much slower atrazine adsorption kinetics.
Consequently, the maximum adsorption capacity of
atrazine might not have been reached in 7 days as it was
in the batch system. Some pores might have even been
Table 2
Doses of fresh and preloaded PAC A required for 90% and 99% atr
Contact time (min) Dose of PAC A required for 90% removal
No preloading 109.6 mg/g NO
preloading
15 44 659
30 32 469
60 23 303
90 20 240
120 18 206
150 16 185
180 15 170
permanently (in a practical sense) blocked, which could
result in adsorption capacity loss.
3.3. Impact of the pore blockage effect on PAC dose
The reduction in adsorption kinetics caused by the
pore blockage effect of NOM means an increase in the
carbon dose required to achieve a desired removal of a
trace compound if a reactor has a limited carbon–water
contact time. Table 2 compares the carbon doses of PAC
A required to achieve 90% and 99% atrazine removal
from the FLDW when the PAC was preloaded with zero
or 109.6 mg/g NOM (the surface concentration obtained
when 4 mg/L of PAC A was preloaded with the FLDW).
The initial concentration of atrazine was 10mg/L. When
the PAC is preloaded with NOM, 10 to 16 times
more carbon is required to remove 90% or 99% of
atrazine compared to when fresh PAC is used, and the
difference in the required dose increases with decreasing
carbon–water contact time. Although it is not likely that
the PAC will be fully preloaded before it contacts the
trace compound, the potential increase in dosage and
the related cost is tremendous. In order to minimize the
treatment cost, water utilities should minimize the pore
blockage effect by selecting a suitable reactor type and a
PAC that is less vulnerable to pore blockage.
4. Conclusions
By studying the effect of preloading PAC with natural
water, it was found that atrazine adsorption kinetics of
PAC could be severely impeded by NOM molecules
through the pore blockage mechanism. When PAC was
preloaded in natural water, the surface diffusion
coefficient of atrazine decreased with increasing surface
loading of NOM on PAC, and was reduced by up to
more than two orders of magnitude depending on the
PAC dose or NOM surface concentration. The compar-
ison of the two PACs showed that large pores play the
azine removal
(mg/L) Dose of PAC A required for 99% removal (mg/L)
M No preloading 109.6 mg/g NOM
preloading
107 1780
79 1177
59 695
51 550
45 483
41 442
39 412
ARTICLE IN PRESSQ. Li et al. / Water Research 37 (2003) 4863–48724872
very important role of alleviating the pore blockage
effect because NOM mainly adsorbs in mesopores and
large micropores. NOM with MW between 200 and
700 Da was found to be most likely responsible for the
pore blockage mechanism. Natural water that contains a
higher concentration of NOM in this MW range showed
a greater potential to cause pore blockage. The pore
blockage effect was found to have serious impact on
atrazine adsorption in continuous flow adsorption
systems where PAC is kept in the system while water
passes through. Due to the continuous exposure of PAC
to natural water, the accumulation of NOM on the PAC
surface caused the same effect as when PAC was
preloaded in a batch system, resulting in a decreasing
surface diffusion coefficient of atrazine, possibly reduc-
tion of adsorption capacity.
References
[1] Radke CJ, Prausnitz JM. Thermodynamics of multisolute
adsorption from dilute liquid solutions. J Amer Inst Chem
Eng 1972;18(4):761–8.
[2] Carter MC, Weber Jr WJ. Modeling adsorption of TCE
preloaded by background organic matter. Environ Sci
Technol 1994;28(4):614–23.
[3] Newcombe G, Drikas M, Hayes R. Influence of character-
ized natural organic material on activated carbon adsorp-
tion: II. Effect on pore volume distribution and adsorption
of 2-methylisoborneol. Water Res 1997;31(3):1065–73.
[4] Kilduff JE, Karanfil T, Weber Jr WJ. Competitive effects
of nondisplaceable organic compounds on trichloroethy-
lene uptake by activated carbon. I. Thermodynamic
predictions and model sensitivity analyses. J Colloid
Interface Sci 1998;205(2):271–9.
[5] Kilduff JE, Karanfil T, Weber Jr WJ. Competitive effects
of nondisplaceable organic compounds on trichloroethy-
lene uptake by activated carbon. II. Model Verification
and applicability to natural organic matter. J Colloid
Interface Sci 1998;205(2):280–9.
[6] Zimmer G, Crittenden JC, Sontheimer H, Hand DW.
Design considerations for fixed-bed adsorbers that remove
synthetic organic chemicals in the presence of natural
organic matter. AWWA Annual Conference, Orlando, FL,
1988.
[7] Summers RS, Haist B, Koehler J, Ritz J, Zimmer G. The
influence of background organic matter on GAC adsorp-
tion. J AWWA 1989;81(5):66–84.
[8] Speth TF, Miltner RJ. Effect of preloading on the scale-up
of GAC microcolumns. J AWWA 1989;81(4):141–8.
[9] Wilmanski K, Van Breemen AN. Competitive adsorption
of trichloroethylene and humic substances from ground-
water on activated carbon. Water Res 1990;24(6):773–9.
[10] Speth TF. Evaluating capacities of GAC preloaded with
natural water. J Environ Eng 1991;117(1):66–79.
[11] Najm IN, Snoeyink VL, Suidan MT, Lee CH, Richard Y.
Effect of particle size and background natural organics
on the adsorption efficiency of PAC. J AWWA 1990;82(1):
65–73.
[12] Najm IN, Snoeyink VL, Richard Y. Effect of initial
concentration of a SOC in natural water on its adsorption
by activated carbon. J AWWA 1991;83(8):57–63.
[13] Carter MC, Weber Jr WJ, Olmstead KP. Effect of
background dissolved organic matter on TCE adsorption
by GAC. J AWWA 1992;73(8):81–91.
[14] Narbaitz RM, Benedek A. Adsorption of 1,1,2-trichlor-
oethane from river water. J Environ Eng 1994;120(6):
1400–15.
[15] Pelekani C, Snoeyink VL. Competitive adsorption in
natural water: role of activated carbon pore size. Water
Res 1999;33(5):1209–19.
[16] Kilduff JE, Karanfil T, Weber Jr WJ. TEC adsorption by
GAC preloaded with humic substances. J AWWA 1998;
90(5):76–89.
[17] Li Q, Snoeyink VL, Marinas BJ, Campos C. Elucidating
competitive adsorption mechanisms of atrazine and NOM
using model compounds. Water Res 2003;37(4):773–84.
[18] Lebeau T, Lelievre C, Wolbert D, Laplanche A, Prados M,
C #ot!e P. Effect of natural organic matter loading on the
Atrazine adsorption capacity of an aging activated carbon
slurry. Water Res 1999;33(7):1695–705.
[19] Sontheimer H, Crittenden JC, Summers RS. Activated
carbon for water treatment, 2nd ed. University of
Karlsruhe, West Germany: DVGW-Forschungstelle, 1988.
[20] Pelekani C, Snoeyink VL. Competitive adsorption between
Atrazine and methylene blue on activated carbon: the
importance of pore size distribution. Carbon 2000;
38(10):1423–36.
[21] Pelekani C, Snoeyink VL. A kinetic and equilibrium study
of competitive adsorption between atrazine and congo red
dye on activated carbon: the importance of pore size
distribution. Carbon 2001;39(1):25–37.
[22] Li Q, Snoeyink VL, Campos C, Marinas BJ. Displacement
effect of NOM on Atrazine adsorption by PACs with
different pore size distributions. Environ Sci Technol
2002;36(7):1510–5.
[23] Hand DW, Crittenden JC, Thacker WE. User-oriented
batch reactor solution to the homogeneous surface
diffusion model. J Environ Eng 1983;109(1):82–101.
[24] Qi S, Adham SS, Snoeyink VL. Prediction and verification
of atrazine adsorption by powdered activated carbon.
J Environ Eng 1994;120(1):202–18.
[25] Campos C, Marinas BJ, Snoeyink VL, Baudin I, Lain!e
JM. PAC-Membrane filtration process. II: model applica-
tion. J Environ Eng 2000;126(2):104–11.
[26] Campos C, Marinas BJ, Snoeyink VL, Baudin I, Lain!e
JM. Atrazine removal by powdered activated carbon in
floc blanket reactors. Water Res 2000;34(16):4070–80.
[27] Knappe DRU, Matsui Y, Snoeyink VL, Roche P, Prados
MJ, Bourbigot MM. Predicting the capacity of powdered
activated carbon for trace organic compounds in natural
waters. Environ Sci Technol 1998;32(11):1694–8.