Population histories of right whales (Cetacea: Eubalaena) Inferred from Mitochondrial Sequence...
20
Molecular Ecology (2005) 14, 3439–3456 doi: 10.1111/j.1365-294X.2005.02664.x © 2005 Blackwell Publishing Ltd Blackwell Publishing, Ltd. Population histories of right whales (Cetacea: Eubalaena) inferred from mitochondrial sequence diversities and divergences of their whale lice (Amphipoda: Cyamus ) ZOFIA A. KALISZEWSKA,* JON SEGER,† VICTORIA J. ROWNTREE,†‡§ SUSAN G. BARCO,¶ RAFAEL BENEGAS, ** PETER B. BEST, †† MOIRA W. BROWN, ‡‡ ROBERT L. BROWNELL JR , §§ ALEJANDRO CARRIBERO, ¶¶ ROBERT HARCOURT, *** AMY R. KNOWLTON, ‡‡ KIM MARSHALL- TILAS, ‡ NATHALIE J. PATENAUDE, *** MARIANA RIVAROLA, ††† CATHERINE M. SCHAEFF, ‡‡‡ MARIANO SIRONI, § WENDY A. SMITH † and TADASU K. YAMADA §§§ * Department of Organismic and Evolutionary Biology, Harvard University, Cambridge, Massachusetts 02138, USA, † Department of Biology, University of Utah, 257 South 1400 East, Salt Lake City, Utah 84112, USA, ‡ Ocean Alliance/Whale Conservation Institute, 191 Weston Rd, Lincoln, Massachusetts 01773, USA, § Instituto de Conservación de Ballenas, Miñones 1986, Buenos Aires C1428ATD, Argentina, ¶ Virginia Marine Science Museum, 717 General Booth Boulevard, Virgina Beach, Virginia 23451, USA, ** Hydro Sport, Av. de las Ballenas S/N, Puerto Pirámides, Chubut, Argentina, †† Mammal Research Institute, University of Pretoria, Pretoria 0002, South Africa, ‡‡ New England Aquarium, Central Wharf, Boston, Massachusetts 02110, USA, §§ Southwest Fisheries Science Center, National Marine Fisheries Service, Pacific Grove, California 93950, USA, ¶¶ Ecocentro, Julio Verne 3784, U9129OJA, Puerto Madryn, Chubut, Argentina, *** Marine Mammal Research Group, Graduate School of Environment, Macquarie University, Sydney, NSW 2109, Australia, ††† ALUAR, Ruta Provincial N° 4, U9120OIA Puerto Madryn, Chubut, Argentina, ‡‡‡Department of Biology, American University, 4400 Massachusetts Avenue, N.W., Washington, DC 20016, USA, §§§National Science Museum, 3-23-1 Hyakunin-cho, Shinjuku-ku, Tokyo 169-0073, Japan Abstract Right whales carry large populations of three ‘whale lice’ (Cyamus ovalis, Cyamus gracilis, Cyamus erraticus) that have no other hosts. We used sequence variation in the mitochondrial COI gene to ask (i) whether cyamid population structures might reveal associations among right whale individuals and subpopulations, (ii) whether the divergences of the three nomin- ally conspecific cyamid species on North Atlantic, North Pacific, and southern right whales (Eubalaena glacialis, Eubalaena japonica, Eubalaena australis) might indicate their times of separation, and (iii) whether the shapes of cyamid gene trees might contain information about changes in the population sizes of right whales. We found high levels of nucleotide diversity but almost no population structure within oceans, indicating large effective popu- lation sizes and high rates of transfer between whales and subpopulations. North Atlantic and Southern Ocean populations of all three species are reciprocally monophyletic, and North Pacific C. erraticus is well separated from North Atlantic and southern C. erraticus. Mitochondrial clock calibrations suggest that these divergences occurred around 6 million years ago (Ma), and that the Eubalaena mitochondrial clock is very slow. North Pacific C. ovalis forms a clade inside the southern C. ovalis gene tree, implying that at least one right whale has crossed the equator in the Pacific Ocean within the last 1–2 million years (Myr). Low-frequency polymorphisms are more common than expected under neutrality for popu- lations of constant size, but there is no obvious signal of rapid, interspecifically congruent expansion of the kind that would be expected if North Atlantic or southern right whales had experienced a prolonged population bottleneck within the last 0.5 Myr. Keywords: Cyamus, cytochrome c oxidase I (COI ), Eubalaena, migration, mitochondrial introgression, population structure, speciation Received 1 January 2005; revision accepted 2 June 2005 Correspondence: Jon Seger, Fax: (801) 581– 4668; E-mail: [email protected]
Transcript of Population histories of right whales (Cetacea: Eubalaena) Inferred from Mitochondrial Sequence...

Molecular Ecology (2005)
14
, 3439–3456 doi: 10.1111/j.1365-294X.2005.02664.x
© 2005 Blackwell Publishing Ltd
Blackwell Publishing, Ltd.
Population histories of right whales (Cetacea:
Eubalaena
) inferred from mitochondrial sequence diversities and divergences of their whale lice (Amphipoda:
Cyamus
)
ZOFIA A. KALISZEWSKA,
*
JON SEGER,
†
VICTORIA J . ROWNTREE,
†‡§
SUSAN G. BARCO,
¶
RAFAEL BENEGAS,
**
PETER B . BEST,
††
MOIRA W. BROWN,
‡‡
ROBERT L . BROWNELL
JR
,
§§
ALEJANDRO CARRIBERO,
¶¶
ROBERT HARCOURT,
***
AMY R. KNOWLTON,
‡‡
KIM MARSHALL-TILAS,
‡
NATHALIE J . PATENAUDE,
***
MARIANA RIVAROLA,
†††
CATHERINE M. SCHAEFF,
‡‡‡
MARIANO SIRONI ,
§
WENDY A. SMITH
†
and TADASU K. YAMADA
§§§
*
Department of Organismic and Evolutionary Biology, Harvard University, Cambridge, Massachusetts 02138, USA,
†
Department of Biology, University of Utah, 257 South 1400 East, Salt Lake City, Utah 84112, USA,
‡
Ocean Alliance/Whale Conservation Institute, 191 Weston Rd, Lincoln, Massachusetts 01773, USA,
§
Instituto de Conservación de Ballenas, Miñones 1986, Buenos Aires C1428ATD, Argentina,
¶
Virginia Marine Science Museum, 717 General Booth Boulevard, Virgina Beach, Virginia 23451, USA,
**
Hydro Sport, Av. de las Ballenas S/N, Puerto Pirámides, Chubut, Argentina,
††
Mammal Research Institute, University of Pretoria, Pretoria 0002, South Africa,
‡‡
New England Aquarium, Central Wharf, Boston, Massachusetts 02110, USA,
§§
Southwest Fisheries Science Center, National Marine Fisheries Service, Pacific Grove, California 93950, USA,
¶¶
Ecocentro, Julio Verne 3784, U9129OJA, Puerto Madryn, Chubut, Argentina,
***
Marine Mammal Research Group, Graduate School of Environment, Macquarie University, Sydney, NSW 2109, Australia,
†††
ALUAR, Ruta Provincial N
°
4, U9120OIA Puerto Madryn, Chubut, Argentina,
‡‡‡
Department of Biology, American University, 4400 Massachusetts Avenue, N.W., Washington, DC 20016, USA,
§§§
National Science Museum, 3-23-1 Hyakunin-cho, Shinjuku-ku, Tokyo 169-0073, Japan
Abstract
Right whales carry large populations of three ‘whale lice’ (
Cyamus ovalis
,
Cyamus gracilis
,
Cyamus erraticus
) that have no other hosts. We used sequence variation in the mitochondrial
COI
gene to ask (i) whether cyamid population structures might reveal associations amongright whale individuals and subpopulations, (ii) whether the divergences of the three nomin-ally conspecific cyamid species on North Atlantic, North Pacific, and southern right whales(
Eubalaena glacialis, Eubalaena japonica, Eubalaena australis
) might indicate their times ofseparation, and (iii) whether the shapes of cyamid gene trees might contain informationabout changes in the population sizes of right whales. We found high levels of nucleotidediversity but almost no population structure within oceans, indicating large effective popu-lation sizes and high rates of transfer between whales and subpopulations. North Atlanticand Southern Ocean populations of all three species are reciprocally monophyletic, andNorth Pacific
C. erraticus
is well separated from North Atlantic and southern
C. erraticus
.Mitochondrial clock calibrations suggest that these divergences occurred around 6 millionyears ago (Ma), and that the
Eubalaena
mitochondrial clock is very slow. North Pacific
C.ovalis
forms a clade inside the southern
C. ovalis
gene tree, implying that at least one rightwhale has crossed the equator in the Pacific Ocean within the last 1–2 million years (Myr).Low-frequency polymorphisms are more common than expected under neutrality for popu-lations of constant size, but there is no obvious signal of rapid, interspecifically congruentexpansion of the kind that would be expected if North Atlantic or southern right whaleshad experienced a prolonged population bottleneck within the last 0.5 Myr.
Keywords
:
Cyamus
, cytochrome
c
oxidase I (
COI
),
Eubalaena
, migration, mitochondrial introgression,population structure, speciation
Received 1 January 2005; revision accepted 2 June 2005
Correspondence: Jon Seger, Fax: (801) 581–4668; E-mail: [email protected]
3440
Z . A . K A L I S Z E W S K A
E T A L .
© 2005 Blackwell Publishing Ltd,
Molecular Ecology
, 14, 3439–3456
Introduction
Most cetaceans carry populations of benign ectoparasitescalled cyamids or ‘whale lice’, which are amphipodcrustaceans (Caprellidea; Cyamidae). Cyamids spend alllife stages on whales, feeding on the outer surface of theirhost’s epidermis (Rowntree 1983, 1996). They roam widelyon their hosts, but because they have no free-swimmingstage they can migrate only between whales that contacteach other. The ecological universe of a cyamid populationis therefore well defined and sharply bounded, consistingof many virtually identical and constantly moving habitatislands (whales) that occasionally replace themselvesthrough a simple birth-and-death process.
As a consequence of this symbiotic relationship, the sizes,structures and histories of cyamid populations are coupleddirectly to those of their hosts. Cyamid populations can bevastly larger than whale populations, however, so they areexpected to maintain higher levels of genetic variation.They also have an additional level of structure, becauseeach individual whale supports a self-sustaining sub-population of cyamids. A calf’s initial infestations arrive byvertical transmission from its mother. If subsequent hori-zontal transfer between unrelated whales were to occurinfrequently, then the genetic relationships of the cyamidsubpopulations on conspecific whales might reflect pat-terns of behavioural interaction among those whales. Herewe ask whether information about the local interactions,large-scale movements and population histories of rightwhales (
Eubalaena
spp.) can be extracted from the distribu-tion of mitochondrial DNA sequence variation in cyamidsfrom right whales in the western North Atlantic, thewestern North Pacific, and three locations in the SouthernHemisphere.
Cyamid diversity and ecology
Around 35 species of cyamids in seven genera have beendescribed to date, but systematic revisions using newmorphological and molecular data are expected to increasethis number substantially (Todd Haney, personal communi-cation). Some cyamid species occur on more than onecetacean species, but few cetaceans normally host more thanone species of cyamid (Leung 1967; Rowntree 1983, 1996).
The slow-swimming right whales and grey whale(
Eschrichtius robustus
) are unusual in that each carries largepopulations of three cyamid species that do not occurregularly on any other cetaceans. The grey whale cyamids(
Cyamus ceti
,
Cyamus kessleri
,
Cyamus scammoni
) are onlydistantly related to each other and to the right whalecyamids, and vice versa (Z.A.K., W.A.S., J.S. and T. Haney,unpublished genetic and morphological data). The rightwhale cyamids are traditionally referred to as
Cyamusovalis
,
Cyamus gracilis
and
Cyamus erraticus
. However, genetic
evidence described below strongly implies that the NorthAtlantic and Southern Hemisphere populations of each ofthese three ‘species’ have been separated long enough to beconsidered distinct biological and phylogenetic species,and that at least two (and probably all three) of the cyamidson North Pacific right whales are also genetically isolatedfrom their nominal conspecifics in the other two oceans. Asystematic revision of
Cyamus
is in preparation (T. Haney,personal communication). Here we combine the traditionalspecies names of right whale cyamids with the ocean-systemnames to distinguish the (apparently) nine geographicalsibling species; for example, we recognize ‘North Atlantic
C. ovalis’
, ‘North Pacific
C. ovalis’
, and ‘Southern Ocean
C. ovalis’
.The three traditional (nominal) species occupy different
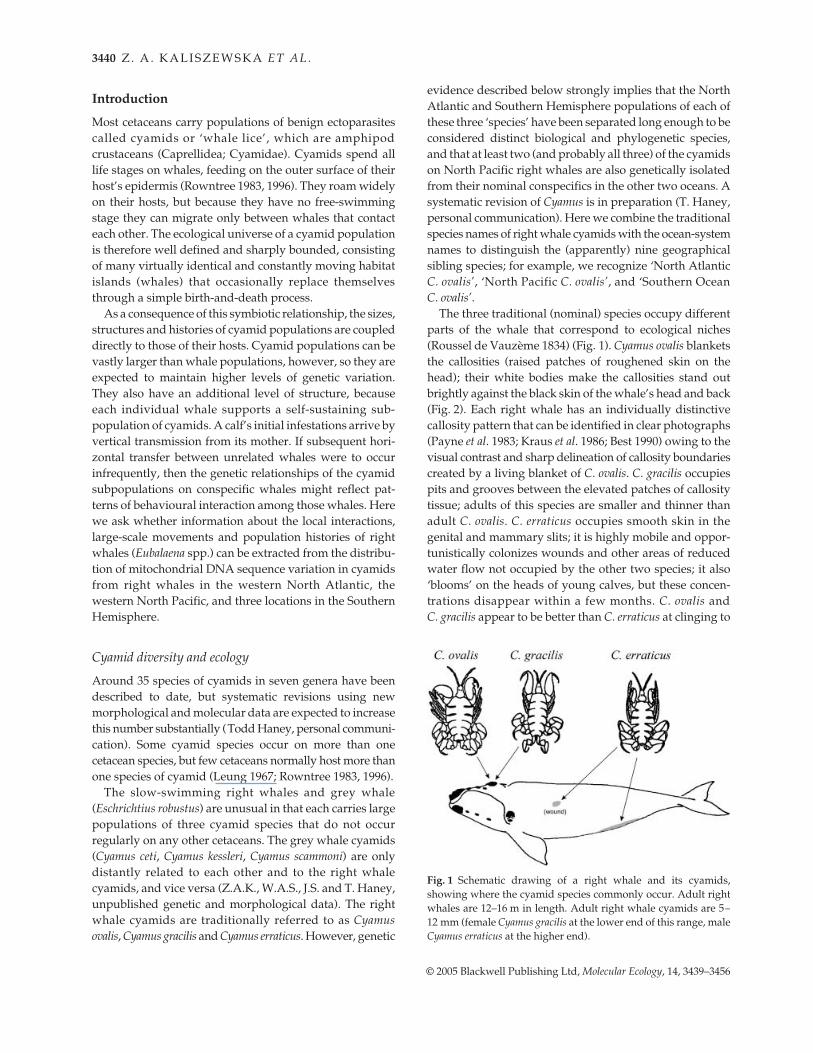
parts of the whale that correspond to ecological niches(Roussel de Vauzème 1834) (Fig. 1).
Cyamus ovalis
blanketsthe callosities (raised patches of roughened skin on thehead); their white bodies make the callosities stand outbrightly against the black skin of the whale’s head and back(Fig. 2). Each right whale has an individually distinctivecallosity pattern that can be identified in clear photographs(Payne
et al
. 1983; Kraus
et al
. 1986; Best 1990) owing to thevisual contrast and sharp delineation of callosity boundariescreated by a living blanket of
C. ovalis
.
C. gracilis
occupiespits and grooves between the elevated patches of callositytissue; adults of this species are smaller and thinner thanadult
C. ovalis
.
C. erraticus
occupies smooth skin in thegenital and mammary slits; it is highly mobile and oppor-tunistically colonizes wounds and other areas of reducedwater flow not occupied by the other two species; it also‘blooms’ on the heads of young calves, but these concen-trations disappear within a few months.
C. ovalis
and
C. gracilis
appear to be better than
C. erraticus
at clinging to
Fig. 1 Schematic drawing of a right whale and its cyamids,showing where the cyamid species commonly occur. Adult rightwhales are 12–16 m in length. Adult right whale cyamids are 5–12 mm (female Cyamus gracilis at the lower end of this range, maleCyamus erraticus at the higher end).

W H A L E – L O U S E P O P U L A T I O N S T R U C T U R E
3441
© 2005 Blackwell Publishing Ltd,
Molecular Ecology
, 14, 3439–3456
mature callosity tissue, which is dense and hard; thus
C. erraticus
may be forced to retreat to softer, more protectedsubstrates as the calf’s callosities develop (Rowntree 1996).
Every adult right whale carries populations of all threenominal cyamid species. On a typical adult, the callositiesprovide about 0.5 m
2
of substrate for
C. ovalis
which is byfar the most abundant of the three species with about 5000
adults per adult right whale, based on an estimated densityof roughly one adult cyamid per cm
2
(from photographicand defined-area census data, not shown; see Fig. 2). Thegenital and mammary slits provide a smaller substrate for
C. erraticus
, and the pits and grooves between callositiesappear to provide an even more limited substrate for
C. gracilis
. These two species are less abundant than
C. ovalis
,but their average population sizes cannot yet be estimatedas accurately. Based on their relative abundances in collec-tions (which derive mainly from opportunistic samplingon stranded whales),
C. erraticus
and
C. gracilis
wouldappear to have typical numbers on the order of 2000 and500 per whale, respectively, although
C. gracilis
is probablyunderrepresented in collections owing to its small size, itsrelatively concealed location in recesses, and the fact thatfew collectors realize they should look for two species ofcyamids on the whale’s head.
Sizes and structures of right whale populations
Right whales occur in all the major oceans of the world.North Atlantic right whales (
Eubalaena glacialis
) have beenhunted for about 1000 years and have long been effectivelyextinct in the eastern North Atlantic; the remnant westernNorth Atlantic population consists of roughly 300 indi-viduals and is growing slowly, if at all (Knowlton
et al
.1994; Caswell
et al
. 1999; Kraus
et al
. 2001). Southern rightwhales (
Eubalaena australis
) were exploited more recentlyand are recovering rapidly; in the late 1990s their populationwas estimated to number around 7500 and to be growingat a rate of roughly 7% per year (International WhalingCommission 2001). Pre-exploitation populations of
E. glacialis
and
E. australis
are thought to have been around40 000–150 000 (International Whaling Commission 2001;Baker & Clapham 2004). Right whales also occur in the NorthPacific, and phylogeographic analyses of mitochondrialcontrol region and nuclear gene sequences imply that thispopulation represents a third distinct species,
Eubalaenajaponica
(Rosenbaum
et al
. 2000; Gaines
et al
. 2005); theremnant population is small and poorly known (Brownell
et al
. 2001). If the three right whale species have had long-term average population sizes on the order of 4
!
10
4
, thenthe effective population sizes of right whale cyamidswould appear to be on the order of 2
!
10
7
for
C. gracilis
(500
!
4
!
10
4
) to 2
!
10
8
for
C. ovalis
(5000
!
4
!
10
4
).Southern right whales gather in coastal aggregations to
calve and nurse their young during the austral winter andspring ( June–December). The largest aggregations occurin three areas centred on the coastal waters of Argentina,South Africa and Australia. In spring the whales swimsouth (and perhaps in some cases north) to feeding groundsthat remain poorly defined (International Whaling Com-mission 2001). The wintering aggregations have long beenthought to represent subpopulations or ‘stocks’ between
Fig. 2 Right whale callosities whitened by dense populations ofcyamids. The upper panel shows the head of a southern rightwhale (Eubalaena australis) at Península Valdés, Argentina.Arrows point to callosities behind and in front of the blowholes,above the eye (under water), along the top edge of the lower lip,at the tip of the rostrum (‘bonnet’), and on the right side of the chin.Smaller round callosities also occur along the lower jaw betweenthe chin callosity and the eyes, and along the rostrum between thebonnet and the anterior blowhole callosity (‘coaming’). The largebonnet, chin and eyebrow callosities are typically around 50 cm indiameter. (Photo by Mariano Sironi.) The lower panel showsCyamus ovalis (and a few Cyamus gracilis) on a small portion ofthe bonnet of a different individual. The field of view is roughlytwice the width of the white arrows in the upper panel. (Photoby Iain Kerr.)

3442
Z . A . K A L I S Z E W S K A
E T A L .
© 2005 Blackwell Publishing Ltd,
Molecular Ecology
, 14, 3439–3456
which relatively little migration occurs, and recent analysesof mitochondrial control region sequences support thisview. The aggregations show substantial differentiation,with
FST values ranging from 0.15 to 0.5 (Portway 1998;Patenaude 2002; Patenaude et al. in review). On the assump-tion that these levels of differentiation represent equilibriabetween migration and drift, the long-term average numberof female migrants per generation can be estimated asNf m = (1 " FST)/2FST (Wright 1951; Takahata & Palumbi1985). For the three major aggregations, these estimatesrange from 1.8 to 2.8 females per right whale generation.Southern right whale females typically begin breeding at9 years of age (International Whaling Commission 2001).Average and maximum lifespans have not yet been deter-mined, but a female longevity greater than 60 years hasbeen documented, as have several reproductive spansapproaching 30 years (International Whaling Commission2001), so the average generation time seems likely toexceed 20 (and possibly 30) years, implying average migra-tion rates of one or fewer females per decade between themajor Southern Ocean aggregations.
Right whale cyamids as ‘replicated evolutionary experiments’
Because each right whale species supports three species ofcyamids, the cyamids’ population histories can be viewedas replicated ecological and evolutionary experiments oftwo kinds. The first and more obvious kind of replicationderives from the speciation of right whales. The NorthAtlantic, North Pacific, and Southern Ocean populationsof each nominal cyamid species form sibling-species triosthat are still very similar in all obvious respects; this patterndemonstrates that the three nominal cyamid species hadestablished their current ways of life before their hostsstopped crossing the equator several million years ago.The three right whale species also have changed very littlesince separation; no nonmolecular character differenceshave been found that reliably distinguish them, and somesystematists have argued, even recently, that all rightwhales should be classified as members of the same species(Rice 1998). Thus the environments of the North Atlantic,North Pacific and Southern Ocean populations representingeach of the three nominal cyamid species seem likely to bevery similar, and their independent histories since the timewhen right whales stopped crossing the equator can beinterpreted as replicates of substantially the same scenario,beginning from the same initial genetic conditions.
The second kind of replication derives from the moreancient separation of the three lineages that define thenominal cyamid species. Within each ocean, all three nom-inal species occur on the same whales, in predictable butvery different numbers. They should be affected similarlyby any environmental changes in their ocean, including
changes in the size or structure of the right whale populationon which they live. Their responses might differ quantitat-ively, however, owing to their different population sizes.
We used sequence variation in the mitochondrial geneencoding cytochrome c oxidase subunit 1 (COI, cox1) to askthree questions. First, do the nominal cyamid species showpatterns of differentiation among subpopulations thatappear to reflect patterns of association among right whaleindividuals and subpopulations within oceans? Second,do patterns of molecular divergence among Northern andSouthern Hemisphere cyamids of the same nominalspecies support the view that North Atlantic, North Pacificand Southern Ocean right whales are reproductively isolated,and if so, do levels of divergence between Northernand Southern Hemisphere cyamid sibling species suggestplausible times of separation for the three right whalespecies? Third, do patterns of coalescence in cyamid genetrees suggest histories of cyamid population-size changethat imply corresponding changes in the populations oftheir hosts?
Materials and methods
DNA extraction, PCR, and sequencing
Cyamids were collected from stranded (beach-cast) whalesand stored in 70–95% ethanol. Collection information issummarized in Table 1. Individual cyamids were dried at50 °C, frozen on dry ice, and ground in 1.5 mL centrifugetubes using disposable pestles. Following digestion inproteinase K and SDS at 50 °C for 12–24 h with continualmixing, and extraction with chloroform, DNA was adsorbedto diatomaceous silica (Carter & Milton 1993), washed, andeluted into 10 mm Tris buffer. Alternatively, some digestswere extracted with phenol, phenol–chloroform andchloroform, followed by ethanol precipitation of nucleicacids (Sambrook et al. 1989).
Partial sequences of COI, COII and the interveningleucine tRNA gene were determined for an individual ofNorth Atlantic Cyamus ovalis from PCR products amplifiedwith the ‘universal’ arthropod primers Jerry (C1-J-2183),Pat (L2-N-3014), Marilyn (C2-N-3389) and Barbara (C2-N-3661) (reviewed by Simon et al. 1994). Partial ND2 sequences,the 5# end of COI, and the intervening tryptophan andglycine tRNAs were determined for an individual of NorthAtlantic Cyamus gracilis from PCR products amplified witha forward primer designed by us from an alignment ofpublicly available crustacean ND2 sequences (Ind2cy: 5#-TAGGGGGTTTACCTCCTTTTACGGG-3#; subsequentprimer sequences are also written 5# to 3#) and a reverseprimer designed from our initial partial COI sequences forseveral cyamid species (C1L1: CTGTCCCTACTCCTCTT-TCTAC). From the resulting sequences flanking COI wedesigned a forward primer in the glycine tRNA gene

W H A L E – L O U S E P O P U L A T I O N S T R U C T U R E 3443
© 2005 Blackwell Publishing Ltd, Molecular Ecology, 14, 3439–3456
immediately 5# to COI (tGcy: AGGCTTGAAAAAAGT-TAATCTTAGG) and a reverse primer, derived from Pat,in the leucine tRNA gene immediately 3# to COI (Patcy:ACTAGCACATTTATCTGTCACATTA). These primershave worked well in all cyamids tested to date.
The full-length (1.5 kb) COI sequences described herewere determined from PCR products amplified with tGcyand Patcy, and the half-length (0.8 kb) sequences weregenerated with a cyamid-optimized version of Jerry ( Jercy:TACCAACATTTATTCTGRTTTTTYGG) and Patcy. Typical20-µL polymerase chain reactions contained 0.5 unit ofJumpstart Taq DNA polymerase (Sigma), 2 µL 10! buffer,2 mm MgCl2, 0.03% BSA, 200 µm each dNTP, 200 nm eachprimer, and approximately 1 ng genomic DNA. Typicalreaction conditions were 2 min at 93 °C followed by 36cycles of 20 s at 94 °C, 30 s at 50 °C, and 60 s at 70 °C. Blank(no template) controls were included in every experiment.
Following cleanup with exonuclease I and shrimp alka-line phosphatase, PCR products were directly sequencedon ABI instruments using dye terminator chemistry at theUniversity of Utah Health Sciences DNA Sequencing CoreFacility. PCR products were sequenced on both strands,and outward-pointing reverse (CIA: AAAATAAAGGG-TACCGATATCTTTRTG; and K5cy: CCTACTGTAAATA-TATGGTGBGCTCA) and forward (C1RF2: CAYGACAC-TTACTATGRAGTYGCTCA) primers were used as neededto obtain unambiguous reads at positions near the endsof PCR products. Sequences were assembled and editedusing sequencher 3.0–4.1 (Gene Codes Corporation)and aligned with clustal_x 1.81 (Thompson et al. 1997)to produce in-frame 1536- or 819-bp alignments. After allsequencing was completed, the nonsynonymous and
singleton polymorphisms were carefully checked foraccuracy.
Complete mitochondrial genome sequences for a southernC. ovalis individual and a Cyamus nr. ceti individual froma bowhead whale (Balaena mysticetus) were subsequentlydetermined by primer-walking on long PCR productsspanning the intervals between COI and 16S (lrRNA) inboth directions. These sequences will be described else-where. Primers developed in the course of this project wereused to extend one or a few of the COI sequences from eachright whale cyamid species through the COII, ATP8, ATP6,COIII, and intervening tRNA genes, and 306 bp into the 5#end of ND3. These multigene arcs include 4.1 kb of codingsequence, which was used to estimate divergences of theNorthern and Southern Hemisphere members of each siblingspecies pair; the concatenated 6-gene coding sequenceswere also included in the alignment used to infer thespecies tree shown in Fig. 3. The cyamid mitochondrialsequences have been deposited in GenBank under Acces-sion numbers DQ094899–DQ095150.
Full-length COI and cyt b sequences were determinedfor two southern right whales (Ea123 and Ea604) andfor one northern right whale (Eg#1014, ‘Staccato’), usingprimers designed from publicly available mitochondrialgenome sequences for whales and other cetartiodactyls.COI was amplified with L5749 (CTCAACCTCTGTCTT-TAGATTTAC) and H7357 (GGTTATGATATTGGCTTGA-AACC), which sit in flanking tRNA genes; PCR productswere sequenced in addition with internal primers CO1X(GGCGTATCCTCTATCCTYGGRGC), CO1Y (TGGTATT-GGGTTATGGCYGGRGG), and CO1Z (TGATCTCCT-GCCCTAATRTGRGC). Cyt b was amplified with Pal1m
Table 1 Collection information
Stranding location Lat., Long. Date Collector Whale
Nova Scotia (Freeport) 44.3°N, 66.4°W 20 August 1997 A. Knowlton akMassachusetts (Wellfleet) 41.9°N, 70.0°W 21 June 1999 K. Marshall-Tilas kmBay of Fundy 44.5°N, 66.5°W 13 September 1999 M. Brown mbMaryland (Ocean City) 38.4°N, 74.6°W 22 August 2002 T. Litwiler tlVirginia (Virginia Beach) 36.8°N, 75.8°W 11 February 2004 S. Barco sbArgentina (Península Valdés) 42.5°S, 64.3°W 5 May 1995 M. Rivarola mrArgentina (Pta. Tehuelche, GSJ) 42.4°S, 64.3°W 17 November 1995 R. Benegas rbArgentina (Pto. Pirámides, G. Nuevo) 42.5°S, 64.3°W 3 November 1999 M. Sironi msArgentina (Fracaso, Golfo San Jose) 42.4°S, 64.1°W 15 October 2000 A. Carribero acSouth Africa (Cape Province) 34.5°S, 19.3°E 16 September 1999 P. Best 1bSouth Africa (Dwarskersbos) 32.6°S, 18.3°E 18 September 2000 P. Best 2bSouth Africa (Elands Bay) 32.3°S, 18.3°E 29 July 2000 P. Best 3bSouth Africa (Cape Pt. Nat. Res.) 34.3°S, 18.4°E 13 October 2000 P. Best 4bSouth Africa (Soetwater, Cape Pen.) 34.2°S, 18.3°E 28 June 2001 P. Best 5bAustralia (Cape Jervis) 35.3°S, 137.3°E 21 July 2001 R. Harcourt rhJapan (Hitachi City) 36.6°N, 140.8°E 3 April 2004 S. Nishida ty
Identities of whales: ak, Eg#2450; km, Eg#1014 ‘Staccato’; mb, Eg#2030; sb, Eg#1004 ‘Stumpy’; 1b, 99/05; 2b, 00/12; 3b, 00/10; 4b, 00/14; 5b, 01/04.

3444 Z . A . K A L I S Z E W S K A E T A L .
© 2005 Blackwell Publishing Ltd, Molecular Ecology, 14, 3439–3456
(TGACATGAAACATCATCGTTG) and Thr1 (GGTATTT-TATTATACTACAAAGAC), which also sit in flanking tRNAgenes; both are modified versions of primers described byLeDuc et al. (1999). Cyt b PCR products were sequenced in
addition with CB1 (CB-J-10933) and CB2-H (CB-N-10920),as described by Simon et al. (1994). The right whale COIand cyt b sequences have been deposited in GenBankunder Accession numbers DQ095151–DQ095156.
Fig. 3 Multispecies mitochondrial gene tree for right whale cyamids. Nine species are represented (all right whale cyamids except NorthPacific Cyamus gracilis, plus Cyamus boopis which is closely related to Cyamus erraticus but regularly occurs only on the humpback whale,Megaptera novaeangliae). Sequences are full-length COI or 4.1-kb-multigene arcs, except that North Pacific Cyamus ovalis is represented by amixture of full and half-length COI sequences; each species other than North Pacific C. ovalis is represented by at least one multigene arc.Sequence names refer to individual cyamids and are constructed to denote (in order) the nominal species, the ocean, the collecting locality,the whale (see Table 1), and the specimen’s ID number in the series on that whale. The tree is a maximum-likelihood estimate inferred byphyml from all coding sites under a GTR + G model with six rate categories. Bootstrap values (out of 100 replicates) are shown next to criticalinternal branches. Large filled dots mark the speciation events that appear to have been caused by the separation of North Atlantic andSouthern Ocean right whales; these nodes correspond to synonymous divergences on the order of 0.5 (Table 6) and to a time around 6 Ma(as discussed in the text), implying that the two deepest nodes representing the separations of the three nominal species correspond tosynonymous divergences much greater than 1.0 and times greater than 20 Ma. The surprisingly deep divergence of North Pacific C. erraticusmight be explained by a period of occasional genetic exchange with the population ancestral to modern C. boopis, early in the history of theirseparation into species highly specialized for life on right whales (ancestral C. erraticus) and on humpback whales (ancestral C. boopis).Subsequently, the C. erraticus populations in all three ocean systems appear to have become fully isolated from each other and from C. boopis.

W H A L E – L O U S E P O P U L A T I O N S T R U C T U R E 3445
© 2005 Blackwell Publishing Ltd, Molecular Ecology, 14, 3439–3456
Polymorphism within and differentiation among populations
Standard polymorphism statistics including $S (the neutralmutation parameter 2Nfµ estimated from numbers ofsegregating sites) and % (the average nucleotide hetero-zygosity, which is also an estimate of the neutral parameter)were calculated by dnasp 4.00.5 (Rozas et al. 2003), arlequin2.0 (Schneider et al. 2000), and popaln (written by J. S. andavailable upon request). Upper and lower confidencelimits for $S were estimated by the method of Kreitman &Hudson (1991), which involves directly calculating theexpected distribution of the number of segregating sites (S)for a given sample size and $ under the infinite-sitesstandard neutral model (Watterson 1975; Hudson 1990).Synonymous and nonsynonymous substitutions betweenspecies were estimated by the maximum-likelihood algorithmimplemented in codeml (Yang 1997, 2002) under the F3 ! 4substitution model and the arthropod mitochondrial code.Inclusive amino acid translations (profiles) were generated
for all population samples by tranaln ( J. S.). HierarchicalF-statistics for intraspecific population subdivisionswere estimated by analysis of molecular variance (amova)(Weir & Cockerham 1984; Excoffier et al. 1992; Weir 1996)as implemented in arlequin 2.0, using pairwise synony-mous divergences estimated by codeml under the F3 ! 4model.
Gene tree estimates
The relationships of haplotypes were estimated by maximumlikelihood under a variety of substitution models usingdnaml and dnamlk from phylip 3.6 (Felsenstein 2002),paup* 4.0b10 (Swofford 1998), and phyml 2.3 (Guindon &Gascuel 2003). Duplicate haplotypes were removed fromthe alignments used to estimate gene trees. The multispeciestree shown here (Fig. 3) is a bootstrapped maximum-likelihood estimate under the GTR + G model, usingfull-length COI and longer multigene sequences. The single-species trees (Fig. 4) are maximum-likelihood estimates
Fig. 4 Single-species COI gene trees for right whale cyamids. Seven species are represented, with North Pacific Cyamus ovalis insidesouthern C. ovalis. The trees are ML estimates inferred by paup* from the synonymous data partition, under the molecular clock and varioussubstitution models as recommended by modeltest; the recommended model is fully parameterized (GTR + G) for the large southernC. ovalis data set, but less so for the others, roughly in proportion to sample sizes. The clade marked ‘A’ on the southern C. ovalis tree appearsto have expanded rapidly around 400 000 years ago, as discussed in the text. The tree-shape statistics and statistical significance symbolsare taken from Table 7. In all of these trees the deeper branches tend to be proportionally shorter than expected for neutral coalescents atequilibrium in populations of constant size; for example, the last coalescent interval (where two lines of descent lead to the root) is expectedto account for roughly half of the tree’s total depth, on average, and the last four intervals together (five and fewer lines of descent) areexpected to account for roughly 80% of the total depth (Hudson 1990). The positive DT for North Atlantic Cyamus gracilis reflects the factthat only eight distinct haplotypes occur in the sample of 30 sequences (Table 3), as discussed in the text. Dots below the tips of terminalbranches represent duplicate haplotypes (Tables 2–4 give sample sizes, haplotype numbers, and other statistics).

3446 Z . A . K A L I S Z E W S K A E T A L .
© 2005 Blackwell Publishing Ltd, Molecular Ecology, 14, 3439–3456
under the molecular clock assumption and varioussubstitution models as recommended by modeltest 3.5(Posada & Crandall 1998), using half-length (819 bp) COIsequences.
Especially within species, almost all substitutions occurin third codon positions and in the first positions of leucinecodons. The nucleotide compositions of these sites differfrom those of second and typical first positions, so we estim-ated the single-species trees from alignments of synonym-ous positions, augmented by the few first and/or secondposition sites with nonsynonymous substitutions, so as touse all available phylogenetic information. The equilibriumnucleotide frequencies and substitution rate parametersestimated from synonymous sites more accurately modelthe evolution of those sites than do parameters estimatedfrom all sites. This procedure does not select only thosesites that are observed to vary (which would seriously biasthe resulting parameter estimates); instead, it selects afunctionally defined data partition within which almost allof the variation occurs, although most of those sites arefixed even in the largest samples. Adding other variablesites violates this principle only slightly, because there arefew such sites. An additional advantage of using the syn-onymous data partition is that relatively simple models ofnucleotide substitution (e.g. ones without invariant sites)work well and are preferred over more parameter-richmodels by likelihood-ratio criteria such as the one imple-mented in modeltest.
Tests of equilibrium under neutrality and constant population size
Pairwise difference and site-frequency distributions werecalculated by popaln. Tajima’s (1989a) D statistic and Fu’s(1997) FS statistic were calculated by arlequin 2.0 andtheir significance was estimated by coalescent simulations.Fu & Li’s (1993) D statistic was calculated from numbersof substitutions inferred by macclade 4.0 (Maddison &Maddison 2000) under the program’s default assumptions,on maximum-likelihood gene trees estimated by paup* (seeFig. 4). macclade’s ‘Tree Length’ statistic was used asthe total number of substitutions on a given tree (&); thenumber of substitutions on external branches (&e) was thencounted by hand from graphic displays resulting fromapplication of the ‘trace all (unambiguous) changes’command. Branches leading to duplicate haplotypes werenot counted as external, even though they appear as suchon the trees.
Results and discussion
Consistently high levels of synonymous polymorphism
Most haplotypes are unique (even in southern Cyamus ovaliswith a sample size of over 100), and levels of nucleotidepolymorphism are also high (Tables 2–4). Almost all poly-morphisms are synonymous, and there are few amino acid
Table 2 Polymorphism summary for Cyamus ovalis
Sample (subsample) n h S $S (SD) ' % (SD)
North Atlantic 33 30 71 0.021 (0.0068) 10.0 0.012 (0.0057)(whale ak) 20 18 48 0.017 (0.0060) 10.1 0.012 (0.0059)(whale km) 1 1 — — — — — —(whale sb) 12 12 41 0.017 (0.0068) 10.0 0.012 (0.0060)
North Pacific 12 10 33 0.013 (0.0055) 7.3 0.009 (0.0045)(whale ty) 12 10 33 0.013 (0.0055) 7.3 0.009 (0.0045)
Southern Ocean 104 81 129 0.030 (0.0076) 12.4 0.015 (0.0069)(Argentina) 42 31 79 0.022 (0.0068) 13.7 0.017 (0.0077)
(whale ac) 13 12 52 0.021 (0.0081) 13.7 0.017 (0.0080)(whale mr) 8 5 22 0.010 (0.0049) 8.7 0.011 (0.0055)(whale ms) 16 12 52 0.019 (0.0072) 13.9 0.017 (0.0081)(whale rb) 5 5 41 0.024 (0.0124) 18.7 0.023 (0.0123)
(South Africa) 42 36 88 0.025 (0.0075) 10.8 0.013 (0.0061)(whale 1b) 12 11 50 0.020 (0.0082) 14.1 0.017 (0.0083)(whale 2b) 21 18 53 0.018 (0.0064) 9.8 0.012 (0.0057)(whale 3b) 7 7 19 0.010 (0.0047) 7.0 0.009 (0.0045)(whale 4b) 1 1 — — — — — —(whale 5b) 1 1 — — — — — —
(Australia) 20 17 59 0.020 (0.0072) 12.0 0.015 (0.0069)(whale rh) 20 17 59 0.020 (0.0072) 12.0 0.015 (0.0069)
n, number of sequences in sample (or subsample); h, number of distinct haplotypes; S, number of segregating (polymorphic) sites; $S, population mutation rate per site, estimated from S (Watterson’s $/L); ', mean number of pairwise differences (per sequence); %, mean number of pairwise differences (per site); SD, standard deviation (sampling and stochastic variation).

W H A L E – L O U S E P O P U L A T I O N S T R U C T U R E 3447
© 2005 Blackwell Publishing Ltd, Molecular Ecology, 14, 3439–3456
differences even among the three nominal species, despitesynonymous divergences (dS) well above 1.0 (see Fig. 3).Neutral mutation parameters ($ = 2Nfµ) estimated fromnumbers of segregating sites ($S) range from 0.007 (in NorthAtlantic Cyamus gracilis) to 0.030 (in southern C. ovalis);mean heterozygosities per site (%) range from 0.007 to0.015; and mean synonymous divergences (dS) range from0.027 to 0.067. These levels of mitochondrial synonymouspolymorphism are high relative to those seen in othermetazoan populations without apparent geographicalstructure (Avise 2000). Assuming two generations per yearand typical arthropod mitochondrial mutation rates (3–5! 10"8/year, from the snapping-shrimp calibration discussedbelow), these diversities imply effective population sizes inthe millions. Human exploitation of right whale populationshas reduced whale and cyamid populations simultaneously,but these changes are too recent to have had a large effecton levels of nucleotide variation in cyamid populations,which are hundreds to thousands of times larger thanthose of the whales.
North Atlantic right whales are themselves less genetic-ally variable than southern right whales, both for mito-chondrial and nuclear markers (Malik et al. 2000; Waldick
et al. 2002). Right whale cyamids show this pattern onlyweakly, if at all (Tables 2–4). Averaging over the threenominal species, $S = 0.014 in the North Atlantic and 0.018in the Southern Ocean; the average value of % is 0.011 inboth hemispheres. If levels of nuclear variation in cyamidsalso turn out to be similar in the Northern and SouthernHemispheres (as suggested by preliminary data for onenuclear locus, EF-1(, discussed briefly below), then theclose relationship between cyamid and right whale popu-lation histories will imply that genetic diversity in NorthAtlantic right whales was reduced in their recent evolu-tionary history, and that in the more distant past northernand southern right whales had similar average populationsizes.
Levels of variation differ among the three nominal cyamidspecies in a pattern of the kind expected, given their verydifferent population sizes: C. ovalis is most variable, C. gracilisis least variable, and Cyamus erraticus is intermediate(Tables 2–4). This pattern holds without exception, bothwithin and between ocean systems, for $S. However, $S isestimated on the assumption that the number of polymor-phic sites is the same as the number of mutations in thegene tree (i.e. no site has mutated more than once). This
Table 3 Polymorphism summary for Cyamus gracilis
Sample (subsample) n h S $S (SD) ' % (SD)
North Atlantic 30 8 22 0.007 (0.0025) 5.6 0.007 (0.0034)(whale ak) 2 2 5 0.006 (0.0047) 5.0 0.006 (0.0047)(whale km) 1 1 — — — — — —(whale sb) 27 6 18 0.006 (0.0022) 5.3 0.007 (0.0032)
Southern Ocean 28 19 33 0.010 (0.0036) 6.3 0.008 (0.0038)(whale 1b) 3 3 11 0.009 (0.0058) 7.3 0.009 (0.0058)(whale 4b) 6 5 9 0.005 (0.0027) 4.5 0.006 (0.0032)(whale 5b) 19 13 27 0.009 (0.0036) 6.5 0.008 (0.0039)
Column headings as in Table 2.
Table 4 Polymorphism summary for Cyamus erraticus
Sample (subsample) n h S $S (SD) ' % (SD)
North Atlantic 22 15 39 0.013 (0.0047) 10.3 0.013 (0.0060)(whale km) 10 9 33 0.014 (0.0062) 11.2 0.014 (0.0068)(whale mb) 1 1 — — — — — —(whale tl) 11 7 25 0.010 (0.0045) 10.0 0.012 (0.0061)
Southern Ocean 21 16 38 0.013 (0.0047) 7.1 0.009 (0.0042)(Argentina) 10 10 25 0.011 (0.0048) 7.2 0.009 (0.0045)
(whale ms) 5 5 15 0.009 (0.0048) 7.4 0.009 (0.0051)(whale rb) 5 5 16 0.009 (0.0051) 6.6 0.008 (0.0046)
(South Africa) 11 8 26 0.011 (0.0047) 7.0 0.009 (0.0043)(whale 1b) 6 6 22 0.012 (0.0059) 8.6 0.011 (0.0057)(whale 2b) 5 4 10 0.006 (0.0033) 5.0 0.006 (0.0036)
Column headings as in Table 2.

3448 Z . A . K A L I S Z E W S K A E T A L .
© 2005 Blackwell Publishing Ltd, Molecular Ecology, 14, 3439–3456
assumption is violated in every sample, most severely forsouthern C. ovalis where the number of polymorphic sites(S = 129) is less than half the phylogenetically estimatednumber of mutations (& = 272) (Table 7). For this reason,and because confidence intervals for $S can be stronglyasymmetric, we used the method of Kreitman & Hudson(1991) to estimate 95% confidence intervals around estim-ates of $S derived from phylogenetically estimated num-bers of mutations rather than from numbers of segregatingsites. The resulting lower bound for southern C. ovalis($L = 0.039) exceeds the upper bounds for North Atlanticand Southern Ocean C. gracilis and C. erraticus ($U = 0.015–0.033); similarly, the lower bound for North Atlantic C. ovalis($L = 0.015) equals the upper bound for North AtlanticC. gracilis ($U = 0.015). All other comparisons result inoverlapping confidence intervals and thus (by this criterion)nonsignificant differences between estimates of $S. Estimatesof % show a qualitatively similar pattern among the species,except that North Atlantic C. erraticus (% = 0.012) is equalto North Atlantic C. ovalis and higher than North PacificC. ovalis (% = 0.009). However, none of the pairwise differ-ences in % approach formal significance, owing to the largestochastic variance of % (Tables 2–4).
Interestingly, the relative magnitudes of the differencesamong the species (in $S as well as in %) are consistentlysmaller than expected from the apparently large differ-ences among their census population sizes, and all of theobserved levels of variation are absolutely much lowerthan expected on the basis of conservative direct estimatesof the species’ long-term effective population sizes, asdiscussed below.
Almost no population structure within oceans
The hierarchical analyses of molecular variance (amova)summarized in Table 5 estimate differentiation amongthe cyamid populations on individual whales within localbreeding aggregations and, for the Southern Hemisphere,differentiation among the geographically defined aggrega-
tions. For southern C. ovalis, we assigned the eight samplesfrom individual whales to three groups representing themajor aggregations (four whales in Argentina, three inSouth Africa, and one in Australia). For southern C. gracilisthere are two samples in one group (two whales in SouthAfrica), and for southern C. erraticus there are four samplesin two groups (two whales in Argentina and two in SouthAfrica). For all three North Atlantic species there are twowhales in one group (though not always the same twowhales).
In five of the six cases, almost all of the variation (95–100%) is estimated to occur on individual whales withingroups, and in the two cases with more than one group,none of the variation is estimated to occur among groups(i.e. FST = 0 among the Southern Ocean breeding aggrega-tions). In southern C. ovalis, slightly less than 5% of the vari-ation is estimated to occur among whales within groups(FWS = 0.048), and this is significantly greater than zero(P < 0.05). Southern C. gracilis shows a similar level of dif-ferentiation among whales within groups (FWS = 0.052, notsignificant). Even these modest levels of genetic differenti-ation among conspecific cyamid populations on differentwhales within breeding aggregations may be overestim-ates, because most of our samples come from calves andjuveniles whose cyamid populations may represent only aportion of the diversity present on their mothers, withrelatively little horizontal input (so early in their lives) fromunrelated whales. But even if our estimates of FWS accur-ately represent the values typical of cyamids on adultright whales, they imply that several to many female cya-mids transfer onto a typical whale per cyamid generation.
There is a striking lack of haplotypic diversity in thesample of North Atlantic C. gracilis, with just eight distincthaplotypes among 30 sequences (h/n = 8/30 = 0.27 haplo-types/sequence; see Table 3). By contrast, southern C. gracilisshows 19 haplotypes in a sample of 28 sequences (h/n = 0.68), and the other species show h/n ratios of 0.68(North Atlantic C. erraticus) to 0.91 (North Atlantic C. ovalis).Most of the North Atlantic C. gracilis sample comes from
Table 5 Fixation indices estimated by amova
Species
No. of whales sampled in subpopulation
FWS FSTNA AR SA AU
C. ovalis N. Atlantic 2 "0.005S. Ocean 4 3 1 0.048* "0.0004
C. gracilis N. Atlantic (2)† (0.214)†S. Ocean 2 0.052
C. erraticus N. Atlantic 2 "0.040S. Ocean 2 2 0.016 "0.009
NA, North Atlantic subpopulation (stock, calving aggregation); AR, Argentina; SA, South Africa; AU, Australia; FWS, variation among whales within subpopulations (stocks); FST, subpopulations within the total (Southern Hemisphere); *P < 0.05; ()† 2 individuals from whale ak, 27 from whale sb, P ) 0.06.

W H A L E – L O U S E P O P U L A T I O N S T R U C T U R E 3449
© 2005 Blackwell Publishing Ltd, Molecular Ecology, 14, 3439–3456
one whale (Eg#1004, ‘Stumpy’, referred to as whale ‘sb’ inthe tables), and these 27 sequences represent just six haplo-types (h/n = 0.22) (see Table 3). The other three NorthAtlantic C. gracilis sequences come from two whales, andall three are different from each other (h/n = 1.0). Despiteits low haplotypic diversity, the North Atlantic C. gracilissample shows levels of nucleotide diversity (% and $S)nearly equal to those of southern C. gracilis (Table 3). Takentogether, these patterns imply that the C. gracilis popula-tion on Stumpy is atypical and that, as a consequence, littlemeaning should be attached to the high estimate of FWS(0.214) for North Atlantic C. gracilis.
We do not see any obvious explanation for the low haplo-typic diversity of the C. gracilis sample from Stumpy; shewas a mature female, and her C. ovalis population is highlydiverse (h/n = 12/12 = 1.0; see Table 2). However, werecently detected the intracellular parasitic bacteriumWolbachia in several C. gracilis individuals from Stumpy.In many other arthropods, Wolbachia infections cause cyto-plasmic incompatibility and other reproductive anomaliesthat may transiently and locally boost the frequencies ofassociated mitochondrial haplotypes (Hoffmann & Turelli1997; Charlat et al. 2001). We are currently surveying allof our right whale cyamid DNAs for the possible presenceof Wolbachia and functionally analogous microsporidia(Terry et al. 2004); these investigations will be reportedelsewhere.
Cyamid migration rates among the Southern Hemispherebreeding aggregations cannot be estimated accuratelybecause the estimates of FST cannot be distinguished fromzero. If the true values of FST were as high as 0.01, then theminimum number of migrating female cyamids would beon the order of 100 per cyamid generation. Cyamid genera-tion times are not known but seem likely to be less than ayear and more than 2 months. If the effective generationtime were around 6 months, then roughly 200 cyamidfemales would need to migrate each year between themajor Southern Ocean populations. At least for C. ovalis,with populations on the order of 103 to 104 per whale, suchmigration rates might easily be achieved by moving justone female right whale between aggregations every whalegeneration (20–30 years), consistent with the whales’ sub-stantial levels of mitochondrial differentiation amongaggregations (as reviewed in the Introduction). But cya-mids travel on male right whales as well as females, so ifmales migrate at rates as high or higher than females, asseems likely, then even C. gracilis, with populations onthe order of 102 to 103 per whale, could remain effectivelyundifferentiated throughout the Southern Hemisphere.Cyamid migration rates might be further increased bycasual contacts between whales from different subpopu-lations on Antarctic summer feeding grounds, or by peri-patetic males that briefly visit other breeding aggregationsbut then return to their natal aggregation.
Reciprocal monophyly of North Atlantic and Southern Ocean cyamids, but not of North Pacific and Southern Ocean C. ovalis
Nominally conspecific cyamids of all three species fromthe North Atlantic and the Southern Ocean form reciprocallymonophyletic clades with high bootstrap support (Fig. 3).This pattern implies that North Atlantic right whales(Eubalaena glacialis) have long been isolated from otherright whales.
North Pacific right whale cyamids are seldom collected,and to date we have obtained only one small sampleconsisting almost entirely of C. ovalis. The one C. erraticusindividual in this sample carries a mitochondrial haplotypethat appears to be at least as distant from North Atlanticand Southern Ocean C. erraticus as they are from each other(Fig. 3).
By contrast, 12 individuals (10 haplotypes) from NorthPacific C. ovalis form a clade nested within the southernC. ovalis gene tree (Figs 3 and 4). This pattern cannot beexplained without some movement of right whales acrossthe equator in the Pacific much more recently than in theAtlantic. The simplest model would be one in which asingle southern right whale migrated to the North Pacificcarrying a C. ovalis mitochondrial genome that subse-quently swept through the North Pacific C. ovalis population,whereas all of its C. erraticus mitochondrial genomes failedto introgress into the North Pacific C. erraticus population.Ballard & Whitlock (2004) review evidence of such intro-gression in other animal taxa. Alternatively, the migratingwhale’s C. ovalis population might simply have replacedthe existing North Pacific C. ovalis species, without inter-breeding. These alternative models can be distinguishedby analysing patterns of differentiation at nuclear loci, andwork to this end is in progress; initial results for EF-1(show similar levels of differentiation among C. ovalispopulations in all three ocean systems, consistent withmitochondrial introgression from the Southern Ocean, butnot with a recent complete replacement (W.A.S. & J.S.,unpublished).
Consistent divergence times of sibling species pairs
To estimate the divergence times of North Atlantic andSouthern Ocean cyamids we used a COI molecular clockcalibration for another group of small marine crustaceans.Many shallow-water species were separated into Carribeanand Pacific sibling species pairs by the rise of the Isthmusof Panama, a gradual process that culminated 3 Ma withthe emergence of a continuous land bridge. Knowlton &Weigt (1998) sequenced 564 bp of the COI gene from 15sibling species pairs of snapping shrimp (Crustacea;Decapoda: Alpheus). The two most similar pairs (23 and 33substitutions) occupy extreme inshore (mangrove) habitats.

3450 Z . A . K A L I S Z E W S K A E T A L .
© 2005 Blackwell Publishing Ltd, Molecular Ecology, 14, 3439–3456
The authors argue that the pair with the smaller differenceprobably diverged most recently (at 3 Ma), while the pairwith the larger difference diverged earlier (as did manydeeper-water Alpheus which show even more substitutionsin COI). However, large sampling and stochastic errors areassociated with such small numbers of substitutions, so itseems more prudent to view them as suggesting a rangewithin which typical substitution rates are likely to fall.In any case, these two pairs of Alpheus sequences havediverged at overall rates similar to estimates for the COIgenes of insects and other Crustacea (1.5–2.0% per Myr)(reviewed by Brower 1994 and Quek et al. 2004).
We used codeml from paml 3.13a (Yang 1997, 2002) toestimate synonymous and nonsynonymous substitutionsbetween the sibling species pairs of mangrove-inhabitingAlpheus, and between North Atlantic and Southern Oceanpairs of right whale Cyamus. The estimated numbers ofsynonymous substitutions per synonymous site (dS) for thetwo sibling species pairs of snapping shrimp are 0.20 and0.33. The half-length (0.8 kb) COI sequences of NorthAtlantic and southern C. ovalis and C. gracilis are separated
by identical mean pairwise synonymous divergences (dS =0.51), but the COI sequences of northern and southernC. erraticus are nearly twice as diverged (dS = 0.98) (Table 6).
The longer (4.1 kb) 6-gene arcs extending from COIthrough ND3 show a somewhat different pattern: thedivergence of northern and southern C. ovalis declines to0.40, C. erraticus declines to 0.64, and C. gracilis increases to0.66 (Table 6). These differences suggest that synonymoussubstitution rates have varied among genes and species ina complicated way, for reasons that seem likely to remainobscure until the patterns can be interpreted in the contextof an independent phylogeny derived from multiplenuclear genes. If all three sibling species pairs becamereproductively isolated at the same time, then C. ovaliswould appear to have a lower mitochondrial substitutionrate than the other two pairs. Alternatively, C. gracilis andC. erraticus could have become resistant to mitochondrialintrogression before C. ovalis did (i.e. earlier in the speciationof North Atlantic and southern right whales), as suggestedby the seemingly large difference in times of separation forC. erraticus and C. ovalis in the North Pacific (Fig. 3).
Table 6 Divergences of North Atlantic and Southern Ocean Cyamus and Eubalaena species
Species Gene(s) NA SO L D P dN dS (SE)
C. ovalis COI 30 81 819 64.0 0.078 0.004 0.506 (0.085)COI-ND3 2 3 4131 273.3 0.066 0.010 0.396 (0.030)
C. gracilis COI 8 19 819 64.8 0.079 0.003 0.506 (0.084)COI-ND3 1 2 4131 381.0 0.092 0.011 0.662 (0.050)
C. erraticus COI 15 16 819 100.3 0.122 0.004 0.976 (0.163)COI-ND3 1 1 4131 438.0 0.106 0.021 0.643 (0.043)
E. glacialis, E. australis COI + cytb 1 2 2676 26.0 0.010 0.000 0.040 (0.005)
NA, numbers of unique sequences in North Atlantic samples; SO, numbers of unique sequences in Southern Ocean samples; L, length of in-frame coding sequence (no stops or partial codons); D, mean number of nucleotide differences between NA and SO sequences; P, uncorrected mean proportion of differences (D/L); dN, estimated mean nonsynonymous substitutions per nonsynonymous site (NA–SO); dS, estimated mean synonymous substitutions per synonymous site (NA–SO); SE, mean pairwise standard error of the estimate of dS.
Table 7 Tests of equilibrium under neutrality
Species n h S ' *W & &e DT DFL FS
C. ovalis NA 33 30 71 10.0 17.5 91 58 "1.6* "3.6** "18.9**C. ovalis NP 12 10 33 7.3 10.9 35 28 "1.5*** "2.8** "2.3C. ovalis SO 104 81 129 12.4 24.7 272 158 "1.7* "6.0** "24.2**
clade A 80 63 88 8.0 17.8 149 100 "1.8* "6.3** "24.8**not clade A 24 18 81 17.7 21.7 118 59 "0.7 "1.9*** "1.5
C. gracilis NA 30 8 22 5.6 5.6 23 6 0.1 "0.1 2.5C. gracilis SO 28 19 33 6.3 8.5 42 20 "1.0 "1.8 "7.0**C. erraticus NA 22 15 39 10.3 10.7 45 21 "0.1 "1.4 "1.9C. erraticus SO 21 16 38 7.1 10.6 44 21 "1.3 "1.5 "5.3*
n, number of sequences in sample; h, number of unique haplotypes; S, number of segregating sites; ', mean number of pairwise differences (per sequence); *W, population mutation rate per sequence, estimated from S (Watterson’s *); &, number of mutations in sample, estimated phylogenetically; &e, number of mutations on external branches, estimated phylogenetically; DT, Tajima’s (1989a) D statistic; DFL, Fu & Li’s (1993) D statistic; FS, Fu’s (1997) FS statistic; ***P < 0.06; *P < 0.05; **P < 0.01.

W H A L E – L O U S E P O P U L A T I O N S T R U C T U R E 3451
© 2005 Blackwell Publishing Ltd, Molecular Ecology, 14, 3439–3456
The average 6-gene (4.1 kb) synonymous divergence forall three species of North Atlantic and Southern Oceancyamids is 0.57, and the average partial COI synonymousdivergence for the two mangrove-inhabiting Alpheus is0.27. On the assumption that Alpheus and Cyamus mito-chondrial clocks run at the same average rates, and on theassumption that the Alpheus pairs speciated 3 Ma, then theright whale cyamids are estimated to have speciated (3)(0.57/0.27) = 6.3 Ma. This falls within the range (3–12 Ma)estimated from North Atlantic and southern right whalecontrol region sequences by Malik et al. (2000) using acalibration from other cetaceans (Hoelzel et al. 1991). Themost extreme estimates implied by the 6-gene divergencesin Table 6 and the two Alpheus calibrations also fall withinthis range; the smallest is 3.6 Ma [= (3)(0.40/0.33), forC. ovalis and the faster pair of Alpheus species], and thelargest is 9.9 Ma [= (3)(0.66/0.20), for C. gracilis and theslower Alpheus].
More accurate estimates of the cyamid divergences wouldaccount for coalescence within the populations ancestral tomodern Alpheus and Cyamus sibling species pairs, but welack (i) population samples that are needed to estimate co-alescence times for Alpheus species and (ii) long sequencesthat are needed to reduce the variances of the estimates oftheir average divergences. In addition, decapod (Alpheus)and amphipod (Cyamus) Crustacea are distantly related. Amore direct calibration of cyamid molecular clocks couldbe made using trans-isthmian sibling species pairs withintheir sister family, the Caprellidae.
North Atlantic and Southern Ocean right whales(Eubalaena glacialis and Eubalaena australis) show mitochon-drial synonymous divergences one-tenth as large as thesmallest seen in their cyamids: dS = 0.04 for COI and cyt bin right whales, while dS = 0.40 for COI and five other genesin C. ovalis (Table 6). If synonymous substitutions in rightwhale mitochondria are effectively neutral, and if NorthAtlantic and southern right whales diverged around 6 Ma,then the mitochondrial mutation rate in right whales isroughly 0.040 subs/site/12 ! 106 year = 3.3 ! 10"9 subs/site/ year, about one-tenth as large as typical rates estim-ated for other mammals (Brown et al. 1982; Parsons et al.1997) and two-thirds to one-sixth as large as rates estim-ated for the hypervariable segment of the control regionin cetaceans (5–20 ! 10"9 subs/site/ year) (Hoelzel et al.1991; Pesole et al. 1999; Rooney et al. 2001).
A phylogenetic analysis of baleen whale mitochondrialgenome sequences was recently published by Sasaki et al.(2005). These authors estimated the ages of internal nodesin their tree using the ‘relaxed clock’ model of Thorne et al.(1998) and Kishino et al. (2001), with calibration providedby two fossil dates. This procedure gives a date of 4.4 ± 2.5Ma for the divergence of North Pacific and southern rightwhales. Sasaki et al. (2005) did not include the North Atlanticright whale in their study, but other analyses of mitochondrial
control region and nuclear gene sequences suggest thatNorth Pacific and southern right whales became isolatedfrom each other shortly after separation from the NorthAtlantic population (Rosenbaum et al. 2000; Gaines et al.2005). Thus the date estimated by Sasaki et al. (2005)appears to be fully consistent with our estimates derivedfrom cyamid and snapping shrimp divergences.
Nonequilibrium levels and configurations of sequence variation
The levels of variation reported here are comparativelyhigh but far lower than expected under neutral-theoryassumptions. For a haploid population of size Nf at mutation–drift equilibrium, the expected nucleotide diversity atneutral sites is % ) $ = 2Nfµ, where µ is the neutral mutationrate per generation. If we assume, to be very conservative,that the long-term average number of right whales inan ocean is 20 000 and the effective number of breedingfemale C. ovalis per right whale is 1000, then Nf = 2 ! 107.A conservative estimate of µ is 1 ! 10"8 (from the clockcalibrations derived above, assuming speciation 5 Maand four generations per year, or speciation 10 Ma andtwo generations per year). Combining these conservativeassumptions, we expect a synonymous-site nucleotidediversity of at least % = (2)(2 ! 107)(1 ! 10"8) = 0.4 (aftercorrecting for multiple hits). The highest actual synonymouspolymorphism (mean pairwise dS) is 0.067, for southernC. ovalis. Thus the largest of seven estimates falls nearly anorder of magnitude below an unrealistically low expectation;the actual shortfall seems likely to approach two orders ofmagnitude, at least for C. ovalis. For example, if there are50 000 whales and 2000 female cyamids per whale, and ifµ ) 2 ! 10"8, then $ ) 4 and every synonymous site shouldbe highly polymorphic. This striking lack of agreementbetween theory and observation implies that one or moreof the assumptions used to derive the expectations must befalse. The question is, which one(s)?
For example, effective female population sizes couldbe far less than census sizes if only small fractions of theadults on a given whale ever succeed in reproducing.Competition for space on the whale’s callosities is obvi-ously severe (Fig. 2), and females can produce more than100 offspring in a single brood, so conditions permittinghigh levels of female reproductive skew are clearly present.‘Recruitment sweepstakes’ syndromes have been proposedto explain why other marine invertebrates also showmuch lower levels of genetic polymorphism than would beexpected under neutral-theory assumptions, given theirapparently huge population sizes (Hedgecock 1994;Flowers et al. 2002; Árnason 2004). But unlike the species forwhich sweepstakes models have been proposed, cyamidsdo not have planktonic larvae that drift through unpredict-able environments; instead, cyamids remain firmly attached

3452 Z . A . K A L I S Z E W S K A E T A L .
© 2005 Blackwell Publishing Ltd, Molecular Ecology, 14, 3439–3456
to very stable, predictable, and firmly bounded environ-ments, so some important aspects of the sweepstakesscenario are missing. In addition, our data contradict aprediction of the sweepstakes model: if only a few femalesreproduce on a given whale at a given time, then theirmitochondrial haplotypes should be very common at leastamong the juvenile cohorts, and there should be consider-able genetic differentiation (FWS) among the cyamid sub-populations on whales within local breeding aggregations.Instead, we find that most mitochondrial haplotypes arerare, even on a given whale (Tables 2–4), and that thereis very little differentiation among the subpopulations onwhales within aggregations (Table 5). The only way torescue the reproductive-skew hypothesis (given high haplo-type diversity and low differentiation) is to assume whatwould appear to be implausibly high rates of adult cyamidmigration between whales.
Alternatively, right whale populations might have beenmuch smaller in the past than they were when whalingbegan. In that case the gene trees of right whales and theircyamids should all show the signatures of simultaneousand substantial population expansion. Sudden expansionfrom a prolonged bottleneck creates star- or comb-shapedgene trees, strongly ‘humped’ (unimodal) distributions ofpairwise differences, excessive numbers of rare polymor-phisms and (as a consequence) negative values of tree-shapestatistics such as Tajima’s (1989a) D, which compares themean pairwise difference to the number of polymorphicsites (Tajima 1989b; Slatkin & Hudson 1991; Rogers &Harpending 1992; Fu 1997). The observed tree-shapestatistics are indeed mostly negative — often significantly so(Table 7 and Fig. 4). There is also one seemingly dramatic(but partial) case of a comb-shaped gene tree (clade ‘A’ insouthern C. ovalis; Fig. 4), and it gives rise to a strongly andsmoothly humped pairwise-difference distribution (notshown). However, these findings do not make a strong casefor recent population expansion, because such an eventshould leave correlated signals in the gene trees of all threecyamid species associated with the right whale specieswhose population expanded. Instead, the pattern appearsto be one in which the deep branches in all seven gene treestend to be shorter than expected under neutrality, regard-less of the absolute time depth.
The mitochondrial control region sequences of southernright whales also imply large long-term effective popula-tion sizes for the whales, and they show no obvious signalof population growth. The E. australis mitochondrial genetree is very deep, with a root that appears to be at leasthalf the age of the species (Portway 1998; Baker et al. 1999;Rosenbaum et al. 2000), and levels of control region poly-morphism are comparable to those in humpback whaleswhich have a large, globally distributed population (Bakeret al. 1993, 1994, 1998). Patenaude (2002) and Patenaudeet al. (in review) analyse 136 E. australis control region
sequences representing all of the major Southern Oceanbreeding aggregations. There are 39 polymorphic sites inan alignment of 275 bp, giving $S = 0.026, which is nearlyidentical to the mean pairwise difference, % = 0.027. Tajima’sD = 0.14, which is statistically indistinguishable from zero.Thus the depth and shape of the E. australis gene tree doesnot suggest that the species passed through a significantbottleneck in its recent evolutionary history, prior to humanexploitation.
The E. australis population size implied by its own mito-chondrial polymorphism is large. If the mean female gen-eration time is 25 years and µ = 1–2 ! 10"8 subs/site/year(Pesole et al. 1999; Rooney et al. 2001), then the per-generationmutation rate is 2.5–5 ! 10"7, implying long-term femaleeffective population sizes of 30 000–60 000, consistent withor larger than estimates based on historic catch records(Baker & Clapham 2004). Population-size estimates derivedfrom genetic polymorphisms are subject to many potentialsources of error (Roman & Palumbi 2003; Baker & Clapham2004), especially when the data consist entirely of shortmitochondrial sequences, so this crude estimate of theE. australis population size should be viewed with caution.(Among other problems, it does not take account of themitochondrial differentiation shown by E. australis sub-populations.) We suggest only that the data available forsouthern right whales do not support an explanation of thecyamid ‘variation shortfall’ based on evolutionarily recentexpansion of right whale populations. Credible estimatesof long-term right whale and cyamid population historieswill require multilocus nuclear data sets and coalescent-based analyses.
Selection provides another possible explanation forthe low levels of nucleotide diversity seen in cyamidmitochondria, and for the consistently negative values ofTajima’s D and other tree-shape statistics. Neutral vari-ation is temporarily ‘swept away’ when the chromosomelinked to an adaptive mutation ‘hitches a ride’ to fixation(Maynard Smith & Haigh 1974). Neutral polymorphismthen slowly recovers, and during this recovery processgene trees in the genetic neighbourhood of the adaptivesubstitution tend to be comb-shaped, just as if the popu-lation had expanded following a bottleneck (Kaplan et al.1989; Braverman et al. 1995). Likewise, selection againstunconditionally deleterious mutations (‘background’ selec-tion) can reduce the genetic effective population size bycreating a large class of ‘loaded’ chromosomes that rarelycontribute descendants to the distant future (Charlesworthet al. 1993, 1995).
Mitochondrial genomes have high mutation rates, norecombination, and gene products vital to fitness, so bothadaptive hitch-hiking and background selection could affecttheir levels and patterns of neutral variation, especially invery large populations where selection can discriminatebetween tiny fitness differences (Gillespie 2001). We have

W H A L E – L O U S E P O P U L A T I O N S T R U C T U R E 3453
© 2005 Blackwell Publishing Ltd, Molecular Ecology, 14, 3439–3456
studied a model, similar to that of Tachida (2000), whichcombines elements of both processes and easily reproducesthe qualitative features of right whale cyamid mitochondrialvariation including (i) chronically but weakly comb-shapedgene trees and (ii) large reductions in neutral variation thatare relatively greater in species with larger populationsizes, thereby giving rise to compressed ranges of $S and %among species. This model will be described elsewhere.Such reductions of variation (and skews in the distributionof variation) are expected to be more pronounced for themitochondrion than for nuclear loci, especially those withhigh local rates of recombination; by contrast, populationhistory affects all loci in similar ways. Work is in progressto test the alternative hypotheses (selection vs. populationhistory) by comparing patterns of nuclear and mitochon-drial variation in all of the sampled populations and speciesof right whale cyamids.
Conclusions
Cyamid subpopulations on individual right whales exhibithigh levels of haplotype diversity and low levels of geneticdifferentiation, contrary to our initial expectation. Thispattern indicates that cyamids of all three nominal speciestransfer between unrelated whales so often that it would bedifficult or impossible to infer differential rates of behaviouralinteraction from patterns of genetic similarity and differenceamong the cyamid subpopulations on individual whales.
There is no detectable differentiation of cyamids on rightwhales from the major Southern Ocean breeding aggrega-tions that calve off South America, southern Africa, andAustralia. At this hemispheric scale, each of the threesouthern cyamid species appears to form a single effect-ively panmictic population in which, for example, twomitochondria sampled off Argentina are as different fromeach other, on average, as each is from mitochondria sam-pled off South Africa or Australia. This finding could havebeen predicted, because drift should be extremely slowwithin the enormous cyamid populations that occur at thescale of right-whale breeding aggregations; low rates ofinteraggregation migration (consistent with the observeddifferentiation of female southern right whales) wouldthen be enough to prevent detectable differentiation ofright whale cyamids. Actual rates of migration could behigher than this minimum, of course, but our present datalack power to estimate these rates with any precision;larger multilocus data sets may do better.
By contrast, cyamid populations on opposite sides of theequator appear to have been fully (or almost fully) isolatedfor several million years. This finding strongly supportsthe view that North Atlantic, North Pacific, and southernright whales also have been isolated for several millionyears and therefore should be considered distinct species(Rosenbaum et al. 2000; Gaines et al. 2005). At least one
right whale has crossed the equator in the Pacific duringthis time, but such exchanges appear to be rare. Multilocusnuclear sequence data for cyamids (calibrated by trans-isthmian caprellids) should allow the times of separationbetween northern and southern populations to be estimatedwith some precision.
Cyamid mitochondria consistently show relatively toomany low-frequency mutations and absolutely lessnucleotide diversity than expected under neutral-theoryassumptions for populations at equilibrium. These patternsdo not appear to have been caused by dramatic, long-lastingchanges in the population sizes of right whales, at least notduring the last few hundred thousand years. Long-lastingbottlenecks would have left strong, correlated signaturesin the gene trees of all three cyamids associated with agiven species of right whale (reflecting the threefold‘replication’ of the parasite–host relationship). No suchpatterns are apparent at time depths where all of thespecies still have many surviving mitochondrial lineages.However, all of the mitochondrial gene trees except that ofsouthern C. ovalis appear to coalesce fully within the lasthalf million years, so multilocus nuclear sequence data willbe needed to estimate the population histories of rightwhale cyamids and their hosts farther into the past, andwith better resolution. Work to this end is in progress, andwe hypothesize that it will support a model in which levelsof mitochondrial synonymous polymorphism in rightwhale cyamids have been greatly depressed by back-ground selection, owing to the very large effective popula-tion sizes of these species.
AcknowledgementsMany people have generously helped us in various ways duringthe course of this study, and we thank them all. A partial (memory-limited) list includes Fred Adler, John Avise, Scott Baker, JohnBannister, Peter Beerli, Aron Branscomb, Thure Cerling, JoshCherry, Dale Clayton, Patrice Corneli, Jerry Coyne, Joe Felsenstein,Chris Gabriele, Dave Gard, Craig George, Ted Gurney, ToddHaney, Henry Harpending, Ashley Haun, Glenn Herrick, KevinJohnson, Iain Kerr, Bob Minckley, Larry Okun, Roger Payne, SweePeck Quek, David Reed, Alan Rogers, Howie Spero, LucianoValenzuela, David Wolstenholme, Steve Wooding, and four anonym-ous reviewers. We thank the Maryland Marine Mammal andSea Turtle Stranding Program at the Cooperative Oxford Labor-atory (Maryland Department of Natural Resources) for the sampleof C. erraticus from whale ‘tl’. The sampling of whale ‘ty’ was madepossible by the Ibaraki Stranding Network (a program of Aqua-world Oarai, the Ibaraki Nature Museum, and the Ibaraki Pre-fectural Government), and was supported also by the Institute ofCetacean Research, Kyushu University, and the National ScienceMusuem, Tokyo. The University of Utah Health Sciences DNA/Peptide Core Facility (Bob Schackmann, director) and the DNASequencing Core Facility (Heather Lin and Helaman Escobar,directors) made the primers and the sequences with awesomeskill and efficiency. Z.A.K. was supported by the ACCESSprogram (College of Science), the Biology Undergraduate Research

3454 Z . A . K A L I S Z E W S K A E T A L .
© 2005 Blackwell Publishing Ltd, Molecular Ecology, 14, 3439–3456
Program (Department of Biology), and the UndergraduateResearch Opportunities Program (University of Utah).
ReferencesÁrnason E (2004) Mitochondrial cytochrome b DNA variation in
the high-fecundity Atlantic cod: trans-Atlantic clines andshallow gene genealogy. Genetics, 166, 1871–1885.
Avise J (2000) Phylogeography: The History and Formation of Species.Harvard University Press, Cambridge, Massachusetts.
Baker CS, Clapham PJ (2004) Modelling the past and future ofwhales and whaling. Trends in Ecology & Evolution, 19, 365–371.
Baker CS, Perry A, Bannister JL et al. (1993) Abundant mitochon-drial DNA variation and world-wide population structure inhumpback whales. Proceedings of the National Academy of Sciences,USA, 90, 8239–8243.
Baker CS, Slade RW, Bannister JL et al. (1994) Hierarchicalstructure of mitochondrial DNA gene flow among humpbackwhales Megaptera novaeangliae, world-wide. Molecular Ecology, 3,313–327.
Baker CS, Medrando-Gonzalez L, Calambokidis J et al. (1998)Population structure of nuclear and mitochondrial DNA varia-tion among humpback whales in the North Pacific. MolecularEcology, 7, 695–707.
Baker CS, Patenaude NJ, Bannister JL, Robins J, Kato H (1999)Distribution and diversity of mtDNA lineages among southernright whales (Eubalaena australis) from Australia and New Zealand.Marine Biology, 134, 1–7.
Ballard JWO, Whitlock MC (2004) The incomplete natural historyof mitochondria. Molecular Ecology, 13, 729–744.
Best P (1990) Natural markings and their use in determiningcalving intervals in right whales off South Africa. South AfricanJournal of Zoology, 25, 114–123.
Braverman JM, Hudson RR, Kaplan NL, Langley CH, Stephan W(1995) The hitchhiking effect on the site frequency spectrum ofDNA polymorphisms. Genetics, 140, 783–796.
Brower AVZ (1994) Rapid morphological radiation and converg-ence among races of the butterfly Heliconius erato inferred frompatterns of mitochondrial DNA evolution. Proceedings of theNational Academy of Sciences, USA, 91, 6491–6495.
Brown WM, Prager EM, Wang A, Wilson AC (1982) Mitochondrialsequences of primates: tempo and mode of evolution. Journal ofMolecular Evolution, 18, 225–239.
Brownell RL, Clapham PJ, Miyashita T, Kasuya T (2001) Conser-vation status of North Pacific right whales. Journal of CetaceanResearch and Management (Special Issue), 2, 269–286.
Carter MJ, Milton ID (1993) An inexpensive and simple methodfor DNA purification on silica particles. Nucleic Acids Research,21, 1044.
Caswell H, Fujiwara M, Brault S (1999) Declining survival proba-bility threatens the North Atlantic right whale. Proceedings of theNational Academy of Sciences, USA, 96, 3308–3313.
Charlat S, Bourtzis K, Merçot H (2001) Wolbachia induced cytoplasmicincompatibility. In: Symbiosis: Mechanisms and Model Systems(ed. Seckbach J), pp. 623–642. Kluwer Academic Publishers,Dordrecht, The Netherlands.
Charlesworth B, Morgan MT, Charlesworth D (1993) The effect ofdeleterious mutations on neutral molecular variation. Genetics,134, 1289–1303.
Charlesworth D, Charlesworth B, Morgan MT (1995) The patternof neutral molecular variation under the background selectionmodel. Genetics, 141, 1619–1632.
Excoffier L, Smouse P, Quattro J (1992) Analysis of molecular vari-ance inferred from metric distances among DNA haplotypes:application to human mitochondrial DNA restriction data.Genetics, 131, 479–491.
Felsenstein J (2002) PHYLIP (Phylogeny Inference Package) version 3.6a3,Distributed by the author. Department of Genome Sciences,University of Washington. (http://evolution.genetics.washington.edu/phylip.html).
Flowers JM, Schroeter SC, Burton RS (2002) The recruitmentsweepstakes has many winners: genetic evidence from the seaurchin Strongylocentrotus purpuratus. Evolution, 56, 1445–1453.
Fu YX (1997) Statistical tests of neutrality of mutations againstpopulation growth, hitchhiking and background selection.Genetics, 147, 915–925.
Fu YX, Li W-H (1993) Statistical tests of neutrality of mutations.Genetics, 133, 693–709.
Gaines CA, Hare MP, Beck SE, Rosenbaum HC (2005) Nuclearmarkers confirm taxonomic status and relationships amonghighly endangered and closely related right whale species. Pro-ceedings of the Royal Society of London. Series B, Biological Sciences,272, 533–542.
Gillespie JH (2001) Is the population size of a species relevant to itsevolution? Evolution, 55, 2161–2169.
Guindon S, Gascuel O (2003) A simple, fast, and accurate algo-rithm to estimate large phylogenies by maximum likelihood.Systematic Biology, 52, 696–704. (http://atgc.lirmm.fr/phyml/).
Hedgecock D (1994) Does variance in reproductive success limiteffective population sizes of marine organisms?. In: Genetics andEvolution of Aquatic Organisms (ed. Beaumont A), pp. 122–134.Chapman & Hall, London.
Hoelzel AR, Hancock JM, Dover GA (1991) Evolution of thecetacean mitochondrial D-loop region. Molecular Biology andEvolution, 8, 475–493.
Hoffmann AA, Turelli M (1997) Cytoplasmic incompatibility ininsects. In: Influential Passengers: Inherited Microorganisms andArthropod Reproduction (eds O’Neill SL, Werren JH, HoffmannAA), pp. 42–80. Oxford University Press, Oxford.
Hudson RR (1990) Gene genealogies and the coalescent process.In: Oxford Surveys in Evolutionary Biology, Vol. 7 (eds Futuyma D,Antonovics J), pp. 1–44. Oxford University Press, Oxford.
International Whaling Commission (2001) Report of the workshopon the comprehensive assessment of right whales: a worldwidecomparison, Cape Town, 19–25 March 1998. Journal of CetaceanResearch and Management (Special Issue), 2, 1–60.
Kaplan N, Hudson RR, Langley CH (1989) The ‘hitchhiking effect’revisited. Genetics, 123, 887–899.
Kishino H, Thorne JL, Bruno WJ (2001) Performance of a divergencetime estimation method under a probabilistic model of rateevolution. Molecular Biology and Evolution, 18, 352–361.
Knowlton N, Weigt LA (1998) New dates and new rates fordivergence across the Isthmus of Panama. Proceedings of theRoyal Society of London. Series B, Biological Sciences, 265, 2257–2263.
Knowlton AR, Kraus SD, Kenney RD (1994) Reproduction inNorth Atlantic right whales (Eubalaena glacialis). Canadian Jour-nal of Zoology, 72, 1297–1305.
Kraus SD, Moore KE, Price CA et al. (1986) The use of photographsto identify individual North Atlantic right whales (Eubalaenaglacialis). In: Right Whales: Past and Present Status (eds BrownellRL Jr, Best PB, Prescott JH), Reports of the International WhalingCommission (Special Issue 10), pp. 145–151. International WhalingCommission, Cambridge.

W H A L E – L O U S E P O P U L A T I O N S T R U C T U R E 3455
© 2005 Blackwell Publishing Ltd, Molecular Ecology, 14, 3439–3456
Kraus SD, Hamilton PK, Kenney RD, Knowlton AR, Slay CK(2001) Reproductive parameters of the North Atlantic rightwhale. Journal of Cetacean Research and Management (SpecialIssue), 2, 231–236.
Kreitman M, Hudson RR (1991) Inferring the evolutionary his-tories of the Adh and Adh-dup loci in Drosophila melanogaster frompatterns of polymorphism and divergence. Genetics, 127, 565–582.
LeDuc RG, Perrin WF, Dizon AE (1999) Phylogenetic relationshipsamong the delphinid cetaceans based on full cytochrome bsequences. Marine Mammal Science, 15, 619–648.
Leung Y-M (1967) An illustrated key to the species of whale-lice(Amphipoda, Cyamidae), ectoparasites of Cetacea, with a guideto the literature. Crustaceana, 12, 279–291.
Maddison D, Maddison W (2000) MACCLADE 4: Analysis of Phylogenyand Character Evolution. Sinauer Associates, Sunderland,Massachusetts.
Malik S, Brown MW, Kraus SD, White BN (2000) Analysis ofmitochondrial DNA diversity within and between Northand South Atlantic right whales. Marine Mammal Science, 16,545–558.
Maynard Smith J, Haigh J (1974) The hitch-hiking effect of afavourable gene. Genetical Research, 23, 23–35.
Parsons TJ, Muniec DS, Sullivan K et al. (1997) A high observedsubstitution rate in the human mitochondrial DNA control region.Nature Genetics, 15, 363–368.
Patenaude NJ (2002) Demographic and genetic status of southernright whales at the Auckland Islands, New Zealand. PhD Thesis,Biological Sciences, University of Auckland, New Zealand.
Patenaude NJ, Portway VA, Schaeff CM et al. (in review) Geneticdifferentiation and population structure among southern rightwhales.
Payne R, Brazier O, Dorsey EM, Perkins JS, Rowntree VJ,Titus A (1983) External features in southern right whales(Eubalaena australis) and their use in identifying individuals.In: Communication and Behavior of Whales (ed. Payne R), pp. 371–445. AAAS Selected Symposium 76. Westview Press, Boulder,Colorado.
Pesole G, Gissi C, De Chirico A, Saccone C (1999) Nucleotidesubstitution rate of mammalian mitochondrial genes. Journal ofMolecular Evolution, 48, 427–438.
Portway VA (1998) Genetic population structure of South Atlanticright whales (Eubalaena australis). MSc Thesis, AmericanUniversity, Washington, D.C.
Posada D, Crandall KA (1998) modeltest: testing the model of DNAsubstitution. Bioinformatics, 14, 817–818. (http://darwin.uvigo.es/software/modeltest.html).
Quek S-P, Davies SJ, Itino T, Pierce NE (2004) Codiversification inan ant–plant mutualism: stem texture and the evolution of hostuse in Crematogaster (Formicidae: Myrmicinae) inhabitants ofMacaranga (Euphorbiaceae). Evolution, 58, 554–570.
Rice DW (1998) Marine Mammals of the World: Systematics andDistribution. Society for Marine Mammalogy Special PublicationNumber 4. Allen Press, Lawrence, Kansas.
Rogers AR, Harpending HC (1992) Population growth makeswaves in the distribution of pairwise genetic differences.Molecular Biology and Evolution, 9, 552–569.
Roman J, Palumbi SR (2003) Whales before whaling in the NorthAtlantic. Science, 301, 508–510.
Rooney AP, Honeycutt RL, Derr JN (2001) Historical populationsize change of bowhead whales inferred from DNA sequencepolymorphism data. Evolution, 55, 1678–1685.
Rosenbaum HC, Brownell RL Jr, Brown MW et al. (2000)World-wide genetic differentiation of Eubalaena: questioningthe number of right whale species. Molecular Ecology, 9,1793–1802.
Roussel de Vauzème M (1834) Mémoire sur le Cyamus ceti (Latr.)de la classe des Crustacés. Annales des Sciences Naturelles, Zoologie,2e Série, 1, 239–265.
Rowntree VJ (1983) Cyamids: the louse that moored. Whalewatcher:Journal of the American Cetacean Society, 17, 14–17.
Rowntree VJ (1996) Feeding, distribution, and reproductive behaviorof cyamids (Crustacea: Amphipoda) living on humpback andright whales. Canadian Journal of Zoology, 74, 103–109.
Rozas J, Sánchez-DelBarrio JC, Messeguer X, Rozas R (2003)dnasp, DNA polymorphism analyses by the coalescent andother methods. Bioinformatics, 19, 2496–2497. (http://www.ub.es/dnasp).
Sambrook J, Fritsch EF, Maniatis T (1989) Molecular Cloning: ALaboratory Manual, 2nd edn. Cold Spring Harbor LaboratoryPress, Plainview, New York.
Sasaki T, Nikaido M, Hamilton H et al. (2005) Mitochondrial phy-logenetics and evolution of mysticete whales. Systematic Biology,54, 77–90.
Schneider S, Roessli D, Excoffier L (2000) ARLEQUIN version 2.000:A Software for Population Genetics Data Analysis. Genetics andBiometry Laboratory, Department of Anthropology and Ecology,University of Geneva, Switzerland. (http://anthro.unige.ch/arlequin).
Simon C, Frati F, Beckenbach A, Crespi B, Liu H, Flook P (1994)Evolution, weighting, and phylogenetic utility of mitochondrialgene sequences and a compilation of conserved polymerasechain reaction primers. Annals of the Entomological Society ofAmerica, 87, 651–701.
Slatkin M, Hudson RR (1991) Pairwise comparisons of mitochon-drial DNA sequences in stable and exponentially growingpopulations. Genetics, 129, 555–562.
Swofford DL (1998) PAUP*. Phylogenetic Analysis Using Parsimony(*and Other Methods), Version 4. Sinauer Associates, Sunderland,Massachusetts.
Tachida H (2000) Molecular evolution in a multisite nearlyneutral mutation model. Journal of Molecular Evolution, 50, 69–81.
Tajima F (1989a) Statistical method for testing the neutralmutation hypothesis by DNA polymorphism. Genetics, 123,585–595.
Tajima F (1989b) The effect of change in population size on DNApolymorphism. Genetics, 123, 597–601.
Takahata N, Palumbi SR (1985) Extranuclear differentiationand gene flow in the finite island model. Genetics, 109, 441–457.
Terry RS, Smith JE, Sharpe RG et al. (2004) Widespread verticaltransmission and associated host sex-ratio distortion within theeukaryotic phylum Microspora. Proceedings of the Royal Society ofLondon. Series B, Biological Sciences, 271, 1783–1789.
Thompson JD, Gibson TJ, Plewniak F, Jeanmougin F, Higgins DG(1997) The clustal_x Windows interface: flexible strategies formultiple sequence alignment aided by quality analysis tools.Nucleic Acids Research, 24, 4876–4882.
Thorne JL, Kishino H, Painter IS (1998) Estimating the rate ofevolution of the rate of molecular evolution. Molecular Biologyand Evolution, 15, 1647–1657.
Waldick RC, Kraus SD, Brown M, White BN (2002) Evaluatingthe effects of historic bottleneck events: an assessment of
3456 Z . A . K A L I S Z E W S K A E T A L .
© 2005 Blackwell Publishing Ltd, Molecular Ecology, 14, 3439–3456
microsatellite variability in the endangered, North Atlantic rightwhale. Molecular Ecology, 11, 2241–2249.
Watterson GA (1975) On the number of segregating sites in geneticalmodels without recombination. Theoretical Population Biology, 7,256–276.
Weir BS (1996) Genetic Data Analysis II: Methods for Discrete Popula-tion Genetic Data. Sinauer Associates, Sunderland, Massachusetts.
Weir BS, Cockerham CC (1984) Estimating F-statistics forthe analysis of population structure. Evolution, 38, 1358–1370.
Wright S (1951) The genetical structure of populations. Annals ofEugenics, 15, 323–354.
Yang Z (1997) paml: a program package for phylogenetic analysisby maximum likelihood. CABIOS, 13, 555–556.
Yang Z (2002) Phylogenetic Analysis by Maximum Likelihood (PAML),Version 3.13a, September 2002. Distributed by the author.(http://abacus.gene.ucl.ac.uk/software/paml).
Ada Kaliszewska is a graduate student in the Department ofOrganismal and Evolutionary Biology at Harvard University,where she plans to work on the evolution of species interactions ina system to be determined. This paper is an extended version ofher undergraduate honors thesis at the University of Utah. JonSeger is an evolutionary biologist with interests in the process ofadaptation and its limits. He hopes to use the unusual propertiesof cyamid populations to address some basic questions in populationgenetics. Vicky Rowntree directs a long-term study of the rightwhales that calve at Península Valdés, Argentina; the project wasbegun by Roger Payne in 1971 and was the first to use repeatedphoto-identification of known individuals to estimate demographicand population parameters for a large whale species. Vickybecame interested in cyamids when she realized that theirbehaviour and population growth can alter the appearance of thecallosity patterns used to identify right whales. The other authorscollectively study cetacean biology in all the world’s oceans.