Population estimates of three vulture species in Kruger National Park, South Africa
10
This article was downloaded by: [Campbell Murn] On: 12 May 2014, At: 05:05 Publisher: Taylor & Francis Informa Ltd Registered in England and Wales Registered Number: 1072954 Registered office: Mortimer House, 37-41 Mortimer Street, London W1T 3JH, UK Ostrich: Journal of African Ornithology Publication details, including instructions for authors and subscription information: http://www.tandfonline.com/loi/tost20 Population estimates of three vulture species in Kruger National Park, South Africa Campbell Murn a d , Leigh Combrink b , G Scott Ronaldson b , Charles Thompson c & André Botha b a Hawk Conservancy Trust , Sarson Lane, Weyhill, Andover, Hampshire , SP11 8DY , UK b Endangered Wildlife Trust , Private Bag X11, Modderfontein , 1645 , South Africa c South African National Parks , Private Bag X402, Skukuza , 1350 , South Africa d School of Biological Sciences , University of Reading , Whiteknights, Reading , Berkshire , RG6 6AS , UK Published online: 25 Jan 2013. To cite this article: Campbell Murn , Leigh Combrink , G Scott Ronaldson , Charles Thompson & André Botha (2013) Population estimates of three vulture species in Kruger National Park, South Africa, Ostrich: Journal of African Ornithology, 84:1, 1-9, DOI: 10.2989/00306525.2012.757253 To link to this article: http://dx.doi.org/10.2989/00306525.2012.757253 PLEASE SCROLL DOWN FOR ARTICLE Taylor & Francis makes every effort to ensure the accuracy of all the information (the “Content”) contained in the publications on our platform. However, Taylor & Francis, our agents, and our licensors make no representations or warranties whatsoever as to the accuracy, completeness, or suitability for any purpose of the Content. Any opinions and views expressed in this publication are the opinions and views of the authors, and are not the views of or endorsed by Taylor & Francis. The accuracy of the Content should not be relied upon and should be independently verified with primary sources of information. Taylor and Francis shall not be liable for any losses, actions, claims, proceedings, demands, costs, expenses, damages, and other liabilities whatsoever or howsoever caused arising directly or indirectly in connection with, in relation to or arising out of the use of the Content. This article may be used for research, teaching, and private study purposes. Any substantial or systematic reproduction, redistribution, reselling, loan, sub-licensing, systematic supply, or distribution in any form to anyone is expressly forbidden. Terms & Conditions of access and use can be found at http:// www.tandfonline.com/page/terms-and-conditions
-
Upload
independent -
Category
Documents
-
view
4 -
download
0
Transcript of Population estimates of three vulture species in Kruger National Park, South Africa
This article was downloaded by: [Campbell Murn]On: 12 May 2014, At: 05:05Publisher: Taylor & FrancisInforma Ltd Registered in England and Wales Registered Number: 1072954 Registered office: MortimerHouse, 37-41 Mortimer Street, London W1T 3JH, UK
Ostrich: Journal of African OrnithologyPublication details, including instructions for authors and subscription information:http://www.tandfonline.com/loi/tost20
Population estimates of three vulture species inKruger National Park, South AfricaCampbell Murn a d , Leigh Combrink b , G Scott Ronaldson b , Charles Thompson c &André Botha ba Hawk Conservancy Trust , Sarson Lane, Weyhill, Andover, Hampshire , SP11 8DY , UKb Endangered Wildlife Trust , Private Bag X11, Modderfontein , 1645 , South Africac South African National Parks , Private Bag X402, Skukuza , 1350 , South Africad School of Biological Sciences , University of Reading , Whiteknights, Reading ,Berkshire , RG6 6AS , UKPublished online: 25 Jan 2013.
To cite this article: Campbell Murn , Leigh Combrink , G Scott Ronaldson , Charles Thompson & André Botha (2013)Population estimates of three vulture species in Kruger National Park, South Africa, Ostrich: Journal of AfricanOrnithology, 84:1, 1-9, DOI: 10.2989/00306525.2012.757253
To link to this article: http://dx.doi.org/10.2989/00306525.2012.757253
PLEASE SCROLL DOWN FOR ARTICLE
Taylor & Francis makes every effort to ensure the accuracy of all the information (the “Content”) containedin the publications on our platform. However, Taylor & Francis, our agents, and our licensors make norepresentations or warranties whatsoever as to the accuracy, completeness, or suitability for any purposeof the Content. Any opinions and views expressed in this publication are the opinions and views of theauthors, and are not the views of or endorsed by Taylor & Francis. The accuracy of the Content should notbe relied upon and should be independently verified with primary sources of information. Taylor and Francisshall not be liable for any losses, actions, claims, proceedings, demands, costs, expenses, damages, andother liabilities whatsoever or howsoever caused arising directly or indirectly in connection with, in relationto or arising out of the use of the Content.
This article may be used for research, teaching, and private study purposes. Any substantial or systematicreproduction, redistribution, reselling, loan, sub-licensing, systematic supply, or distribution in anyform to anyone is expressly forbidden. Terms & Conditions of access and use can be found at http://www.tandfonline.com/page/terms-and-conditions
OSTRICH 2013, 84(1): 1–9Printed in South Africa — All rights reserved
Copyright © NISC (Pty) LtdO S T R I C H
ISSN 0030–6525 EISSN 1727-947Xhttp://dx.doi.org/10.2989/00306525.2012.757253
Ostrich is co-published by NISC (Pty) Ltd and Taylor & Francis
Population estimates of three vulture species in Kruger National Park, South Africa§
Campbell Murn1,4*, Leigh Combrink2, G Scott Ronaldson2, Charles Thompson3 and André Botha2
1 Hawk Conservancy Trust, Sarson Lane, Weyhill, Andover, Hampshire, SP11 8DY, UK2 Endangered Wildlife Trust, Private Bag X11, Modderfontein 1645, South Africa3 South African National Parks, Private Bag X402, Skukuza 1350, South Africa4 School of Biological Sciences, University of Reading, Whiteknights, Reading, Berkshire, RG6 6AS, UK* Corresponding author, e-mail: [email protected]
Vultures are globally threatened, yet reliable population data on these birds are few, thus measuring their response to change is difficult. Kruger National Park (KNP) in South Africa is an important stronghold for many avian species, particularly vultures. In this study we generate population estimates for three vulture species in KNP using two plotless density estimators (PDE): a distance estimator based on nearest-neighbour distance and T-square sampling. We flew aerial censuses over large (c. 3 500 km2) sample areas in two ecogeographically separate parts of KNP and counted vulture nests visible within predetermined transects. In total 416 White-backed Vulture Gyps africanus, 22 Lappet-faced Vulture Torgos tracheliotos and 24 White-headed Vulture Trigonoceps occipitalis nests were recorded. The nearest-neighbour distance PDE performed poorly, and we used a T-square PDE calibrated with aerial survey counts to extrapolate across KNP and estimate breeding population sizes. There are an estimated 904 (95% CI 162) pairs of African White-backed Vultures, 78 (95% CI 18) pairs of Lappet-faced Vultures and 60 (95% CI 13) pairs of White-headed Vultures in KNP. These results provide a basis for investigating how large vultures respond to ecosystem change and understanding their resilience within a broader environmental change scenario.
Keywords: aerial survey, density estimator, population estimate, Kruger National Park, vulture
Vultures are threatened across large parts of Africa (Rondeau and Thiollay 2004, Thiollay 2007, Virani et al. 2011) and in many other parts of the world (Ogada et al. 2012). In southern Africa, vulture species are monitored at varying degrees of intensity, with the cliff-nesting endemic Cape Griffon Gyps coprotheres and the Bearded Vulture Gypaetus barbatus being monitored most closely (Brown 1997, Borello and Borello 2002, Krüger and van Zyl 2004, Boshoff and Anderson 2008, Boshoff et al. 2009, Whittington-Jones et al. 2011). Of the three larger tree-nesting vultures in southern Africa, only the African White-backed Vulture Gyps africanus (AWbV) has been monitored to any significant exten t (Murn et al. 2002, Monadjem and Garcelon 2005, Herholdt and Anderson 2006), whilst the Lappet-faced Vulture Torgos tracheliotos (LfV) and the White-headed Vulture Trigonoceps occipi-talis (WhV) are comparatively poorly monitor ed (Bridgeford and Bridgeford 2003, Monadjem 2004). All three of these tree-nesting species have an unfavourable conserva-tion status: AWbV Endangered, LfV and WhV Vulnerable (BirdLife International 2012). In this paper we focus on these three species that breed in Kruger National Park, located in northeast South Africa (Figure 1).
Kruger National Park (KNP) is the largest protected area in South Africa and one of the largest (c. 20 000 km2) national parks in Africa. Knowledge about the population of vultures in KNP and how they change over time is important because the park is a national and regional stronghold for several vulture populations (Kemp 1980), particularly the three large tree-nesting species, and has been for many years (Kemp 1969). Furthermore, given the size of KNP, the generally unfavourable conservation status of vultures in Africa, and the fact that vultures are often more common in protected areas (Herremans and Herremans-Tonnoeyr 2000), it is an internationally important site.
However, there are no recent or reliable data on vulture populations for KNP. Although population estimates have been made (Kemp et al. 2001), and some sections of the park studied intensively (Kemp and Kemp 1975), breeding populations of vultures have never been surveyed system-atically across KNP. The most recent estimates involving actual counts are approximately 20 years old and were opportunistic counts done at the same time as aerial large herbivore censuses (Deacon 2004).
Estimating vulture populations and the densities at which they occur across large areas such as KNP can be
Introduction
§ This paper was presented at the 13th Pan-African Ornithological Congress, Arusha, Tanzania, 14–21 October 2012
Dow
nloa
ded
by [
Cam
pbel
l Mur
n] a
t 05:
05 1
2 M
ay 2
014
Murn, Combrink, Ronaldson, Thompson and Botha2
problematic, given that vultures can travel vast distances each day in response to the high degree of spatial and temporal variation in their food resources. Timed species counts and counts at feeding events (i.e. carcass counts) are potentially useful ways of estimating numbers, but because of the mobile behaviour of vultures, these methods are likely to yield inaccurate results unless they are coordinated across a large area to account for vulture movements (Pomeroy et al. 2012). Overall, spatiotemporal variability in food supply and resultant variation in vulture occurrence means that counting vulture nests is a preferred method of estimating population sizes and their rates of change over time.
Counting large tree-nesting vultures by helicopter is practical because they build conspicuous nests on the top of trees. However, estimating the densities at which nests of the different species occur is problematic because of the large areas involved and the differing spatial charac-teristics of nests between the species. AWbV generally breed in groups, sometimes called ‘loose colonies’ (Mundy et al. 1992), which are often found at high densities along rivers and drainage lines (Monadjem 2003a), but also at lower densities in savanna areas (Murn and Anderson 2008). Lappet-faced Vultures and WhV are solitary-nesting species that are, in KNP at least, found inopen savanna areas.
Estimating the density of stationary and sparsely distrib-uted points across large areas (such as vulture nests) using quadrat or plot-based sampling is time-consuming and often not feasible because the quadrats must be large, and high in number, to account for the size of the area being surveyed. Plotless density estimators (PDEs) are distance-based methods of density estimation that were developed as an effective way to overcome the limitations imposed by sparse populations on plot-based sampling methods (Engeman et al. 1994). PDEs are thus likely to be suitable for estimating densities of vulture nests occurring over large areas.
In this paper we report the results of aerial surveys in two large parts of KNP that were conducted specifically to provide census counts of large tree-nesting raptors, and particularly vultures. These census counts are used to assess the accuracy of density estimates derived using two types of PDE: a distance estimator based on nearest-neighbour distance (NND) and T-square sampling. Using the resultant calibrated density calculations, we extrapo-late across the entire KNP to provide breeding population estimates for the three species of large tree-nesting vultures.
Methods
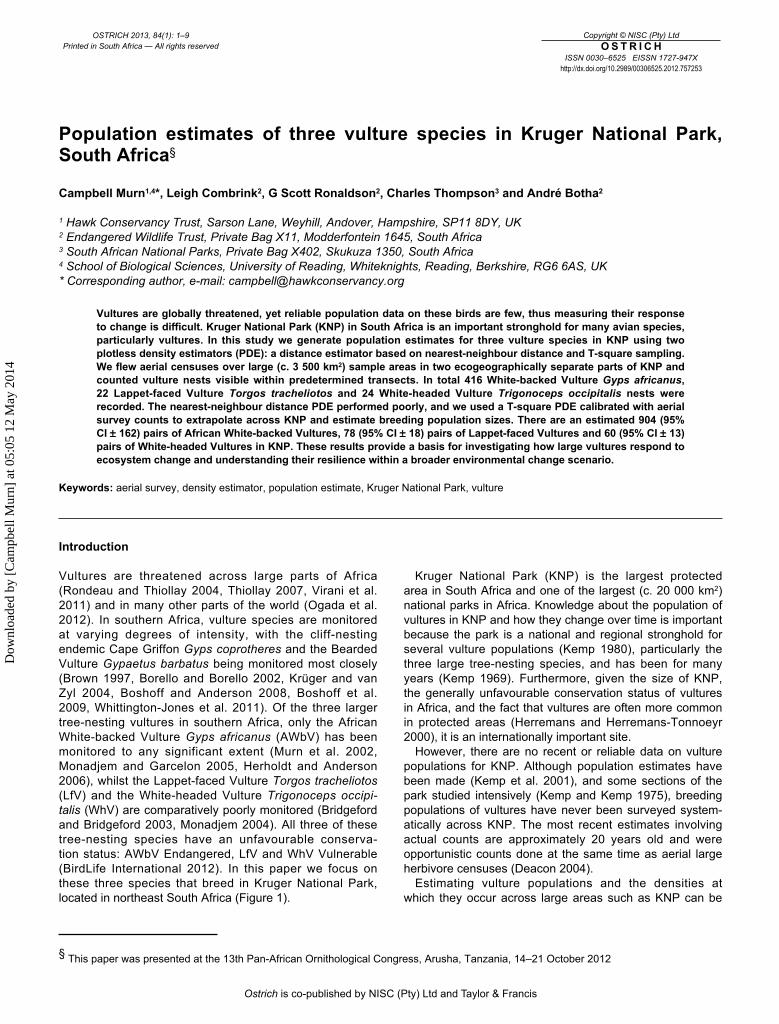
Aerial surveysBetween 2007 and 2011, the occurrence and distribution of vultures and their nests over large parts of KNP have been monitored by road, foot and helicopter (CM unpublished data). From this monitoring, two areas of KNP with notice-ably different vulture nesting densities were selected for census surveys: a higher-density (HD) southern area of c. 3 350 km2 and a lower-density (LD) northern area of c. 3 600 km2 (Figure 1). The census survey areas are approximately 85 km apart.
These two areas were surveyed completely by helicopter in September 2011. Weather in KNP during September is usually dry and clear and survey flights were only conducted in these conditions. A maximum of two flights per day were flown with a survey team consisting of a pilot and three observers. Nine survey flights that varied in length between approximately 250 km and 850 km followed predetermined routes at a ground speed of c. 140 km h−1 and an altitude of c. 300 m above ground level. Flight routes were spaced to maintain an effective viewing distance of 1 200 m. The survey flight parame-ters of travelling speed, altitude and effective viewing distance were all determined by a series of trial and error flights using known nest positions and the same helicopter and survey team in 2010. The survey routes were straight, with small deviations occurring only to check or georefer-ence accurately nests that were more than c. 200 m from the helicopter, or where aggregations of nests occurred. All nest positions and flight routes were logged with a hand-held GPS using waypoint and track log functions, and a PDA/Smartphone running CyberTracker software(http://cybertracker.org). Distinguishing between nests of the three species is readily achieved from the air using a
Figure 1: Location of aerial survey areas in Kruger National Park, South Africa. Lines show direction of survey flight routes
50 km
AFRICA
SouthAfrica
SOUTHAFRICA
SOUTH AFRICA MOZAMBIQUE
KRUGERNATIONAL
PARK
31°30 E 32° E
24° S
23° S
24°30 S
23°30 S
25° S
25°30 S
KRUGER
NATIONAL
PARK
Skukuza
Shingwedzi
Northernlow-densitysurvey area
Southernhigh-densitysurvey area
Dow
nloa
ded
by [
Cam
pbel
l Mur
n] a
t 05:
05 1
2 M
ay 2
014
Ostrich 2013, 84(1): 1–9 3
combination of nest shape, size, cup size, construction material and tree position, and a nest was recorded as active for the year if it contained an adult sat in an incubating posture, a chick, an egg or egg remains. Tenanted nests (i.e. one or more adults perched at the nest with no visible sign of an egg or chick) were noted and their positions recorded but these were not included in the analyses.
Testing spatial randomness of nestsPrior to the calculation of density and population estimates, the nest positions of each of the three species recorded during the aerial survey were tested for randomness of spatial pattern. Complete spatial randomness cannot be assumed automatically for nests and, similar to other ar eas (Murn et al. 2002, Monadjem 2003b), information obtained from field work between 2007 and 2011 suggested that AWbV in KNP show evidence of clumping, particularly in riparian zones.
A number of tests are available for assessing random-ness in spatial point patterns, and because some are sensitive to either large or small inter-point distances we compared three: (1) mean of the squared NNDs (large values associated with regular spacing); (2) squared coeffi-cient of variation of the squared NND (low values are associated with regular spacing); and (3) the ratio of the geometric mean to the arithmetic mean of the squared NND (the maximum value for this statistic is unity, which occurs where all NNDs are equal, therefore large values indicate regular spacing) (Brown and Rothery 1993).
For each species we took the number of nests recorded during the census and used this figure as the sample size to generate 200 Monte Carlo repetitions of the same number of random points within the boundaries of the survey areas. Two hundred repetitions were considered sufficient to generate mean test statistics that would offer a meaningful comparison to the observed values from the nests. The mean values of the test statistics for the 200 random samples were compared to the observed values obtained from the census data.
Density and population estimatesTwo PDE techniques were used. Prior to the density and population estimate calculations, each census area was reduced to create a smaller subarea approximately 60% of the original size (north 2 209 km2, south 2 130 km2). This was done to take account of the possibility that the nearest neighbour of any nest may have been immediately outside the census area (Greenwood and Robinson 2006).
The first PDE was a basic distance estimator using NND between random points and nests, and between nests. However, for clumped or clustered populations, using NNDs can result in spurious density estimates; point to nest estimates will underestimate density, whilst minimum inter-nest distances will overestimate density. To compensate for this, we used a compound nearest-neighbour density estimator using the following equations:
and
where m is the sample size, C is the distance from each random point to the nearest nest and d is the distance from each nest to its nearest neighbour. The compound nearest-neighbour density (CNND) is calculated as the average of the two estimators: distance to closest individual (DCI) and distance to nearest neighbour (DNN) (Cottam and Curtis 1956).
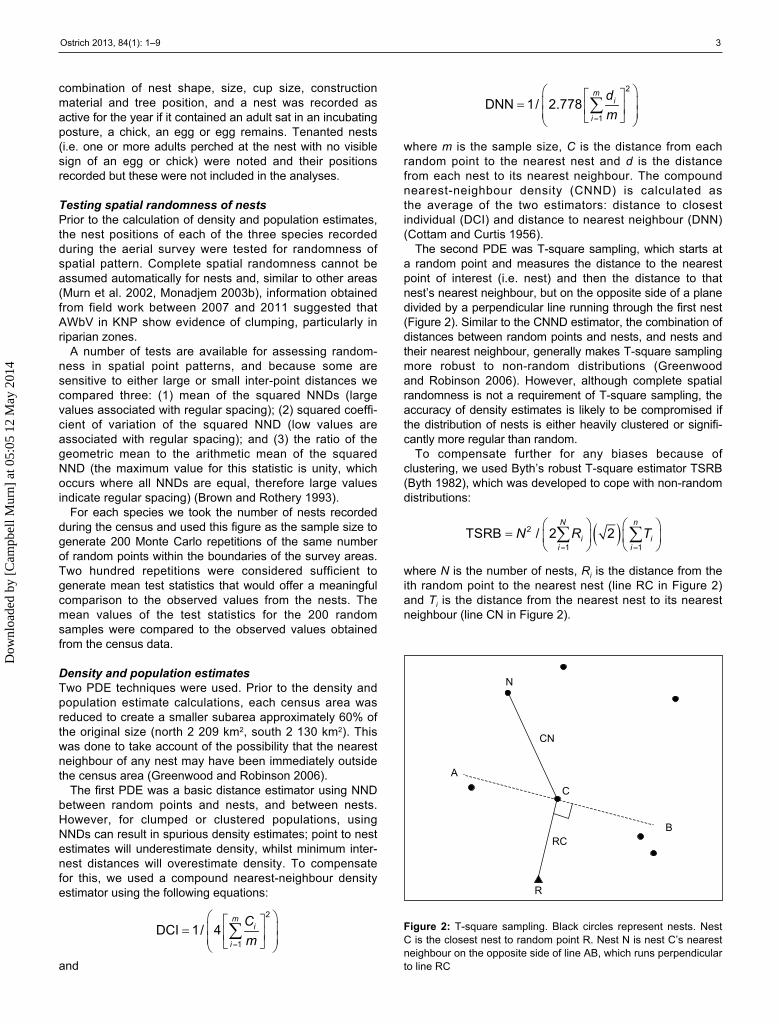
The second PDE was T-square sampling, which starts at a random point and measures the distance to the nearest point of interest (i.e. nest) and then the distance to that nest’s nearest neighbour, but on the opposite side of a plane divided by a perpendicular line running through the first nest (Figure 2). Similar to the CNND estimator, the combination of distances between random points and nests, and nests and their nearest neighbour, generally makes T-square sampling more robust to non-random distributions (Greenwood and Robinson 2006). However, although complete spatial randomness is not a requirement of T-square sampling, the accuracy of density estimates is likely to be compromised if the distribution of nests is either heavily clustered or signifi-cantly more regular than random.
To compensate further for any biases because of clustering, we used Byth’s robust T-square estimator TSRB (Byth 1982), which was developed to cope with non-random distributions:
where N is the number of nests, Ri is the distance from the ith random point to the nearest nest (line RC in Figure 2) and Ti is the distance from the nearest nest to its nearest neighbour (line CN in Figure 2).
2
1DNN 1/ 2.778
mi
i
dm
2
1DCI 1/ 4
mi
i
Cm
Figure 2: T-square sampling. Black circles represent nests. Nest C is the closest nest to random point R. Nest N is nest C’s nearest neighbour on the opposite side of line AB, which runs perpendicular to line RC
N
CN
C
A
R
RCB
2
1 1TSRB / 2 2
N n
i ii i
N R T
Dow
nloa
ded
by [
Cam
pbel
l Mur
n] a
t 05:
05 1
2 M
ay 2
014
Murn, Combrink, Ronaldson, Thompson and Botha4
To generate breeding population estimates (pairs) across the whole of KNP we selected the PDE (CNND or T-square) that generated results most closely matched to the census counts. Using the selected PDE, nest densities were calculated for the southern high-density (HD) and the northern low-density (LD) areas that were surveyed. A correction factor was applied to these calculated densities, which represented the amount by which the PDE figure differed from the census counts to create an estimated density for the high-density area and the low-density area. Within KNP overall, the total size of the high-density area and the low-density area were calculated using a GIS (DIVA-GIS) and data based on landscape-level information about KNP (Gertenbach 1983). Using this information, the high-density area was calculated to be approximately 10 500 km2 and the low-density area approximately 7 200 km2. Known gaps in vulture breeding distribution, such as mountainous areas where these vultures do not breed (e.g. the Lebombo Mountains in the east of KNP) were excluded. The population estimate for each area was the product of the estimated density and the size of the area. The estimates from each area were added together to generate population estimates (pairs) for each species forthe whole of KNP.
Results
In total, 40 h of survey flights were completed across the two survey areas, covering a distance of approximately 4 200 km. Across both survey areas there were 416 active AWbV nests, 22 active LfV nests and 24 active WhVnests recorded.
Spatial randomness of nestsTests for spatial randomness of nests for each species indicated that AWbV nests show a non-random distribu-tion compared to mean values generated by the 200 sets of random points. Clustering of nests is a feature of this species, particularly in the southern survey area (Table 1).
The spatial arrangement of LfV and WhV nests was generally widely spread and comparable to a random distribution in terms of variability in NND and extent of clustering. Variability in NND between WhV nests in the southern area was high and ranged from 1.5 to 19 km, compared with LfV, which ranged from 1.4 to 7.9 km. Variability in NND of AWbV nests was very high (0.04–9 km southern area; 0.16–11 km northern area). The general spatial characteristics of the nests for each species derived from the tests in Table 1 are shown in Table 2.
Density and population estimatesThe CNND estimator performed poorly and, compared with the aerial census figures, overestimated densities for all three species in the southern area. The largest discrepancy was the CNND estimate of 2 153 pairs of AWbV in the southern area versus 216 pairs recorded in the census. Conversely, CNND densities of LfV and WhV in the northern area were underestimated compared to aerial census figures. The accuracy of the CNND estimator was reduced with non-random distributions and underestimated the density of nests of species with a high mean NND (LfV and WhV) and overestimated the density of nests of species with a low mean NND (AWbV). The CNND estimator was excluded from subsequent analyses and not used to generate population estimates. The T-square estimator was less affected by variation in
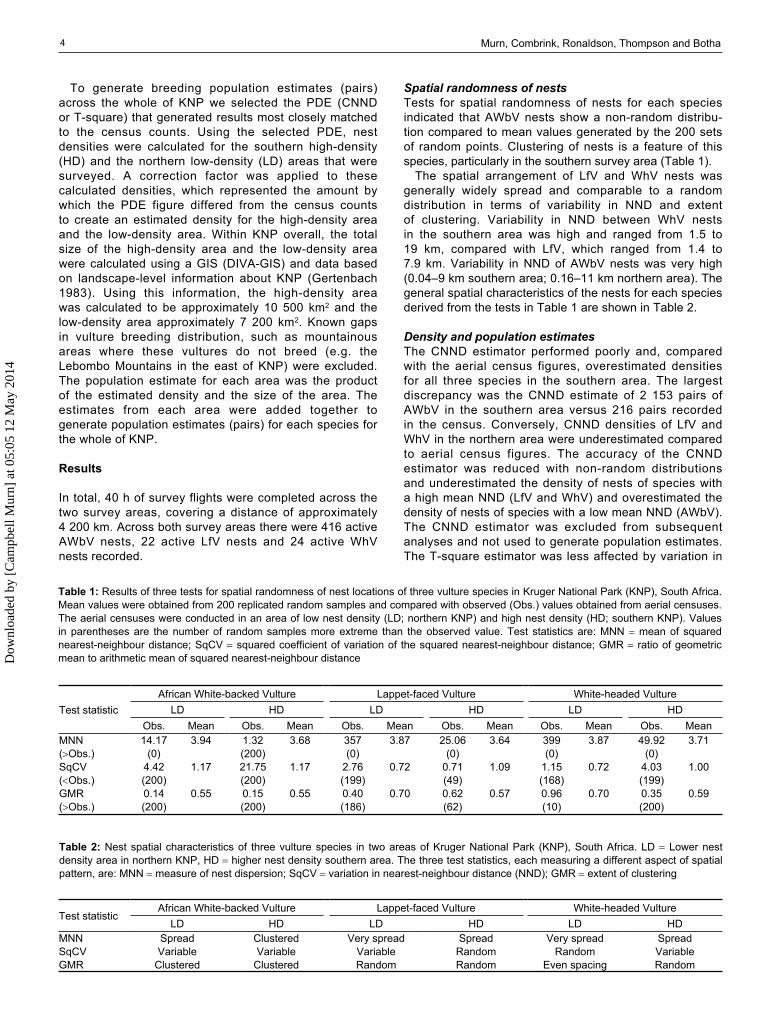
Table 1: Results of three tests for spatial randomness of nest locations of three vulture species in Kruger National Park (KNP), South Africa. Mean values were obtained from 200 replicated random samples and compared with observed (Obs.) values obtained from aerial censuses. The aerial censuses were conducted in an area of low nest density (LD; northern KNP) and high nest density (HD; southern KNP). Values in parentheses are the number of random samples more extreme than the observed value. Test statistics are: MNN mean of squared nearest-neighbour distance; SqCV squared coefficient of variation of the squared nearest-neighbour distance; GMR ratio of geometric mean to arithmetic mean of squared nearest-neighbour distance
Test statisticAfrican White-backed Vulture Lappet-faced Vulture White-headed Vulture
LD HD LD HD LD HDObs. Mean Obs. Mean Obs. Mean Obs. Mean Obs. Mean Obs. Mean
MNN 14.17 3.94 1.32 3.68 357 3.87 25.06 3.64 399 3.87 49.92 3.71(Obs.) (0) (200) (0) (0) (0) (0)SqCV 4.42 1.17 21.75 1.17 2.76 0.72 0.71 1.09 1.15 0.72 4.03 1.00(Obs.) (200) (200) (199) (49) (168) (199)GMR 0.14 0.55 0.15 0.55 0.40 0.70 0.62 0.57 0.96 0.70 0.35 0.59(Obs.) (200) (200) (186) (62) (10) (200)
Table 2: Nest spatial characteristics of three vulture species in two areas of Kruger National Park (KNP), South Africa. LD Lower nest density area in northern KNP, HD higher nest density southern area. The three test statistics, each measuring a different aspect of spatial pattern, are: MNN measure of nest dispersion; SqCV variation in nearest-neighbour distance (NND); GMR extent of clustering
Test statisticAfrican White-backed Vulture Lappet-faced Vulture White-headed Vulture
LD HD LD HD LD HDMNN Spread Clustered Very spread Spread Very spread SpreadSqCV Variable Variable Variable Random Random VariableGMR Clustered Clustered Random Random Even spacing Random
Dow
nloa
ded
by [
Cam
pbel
l Mur
n] a
t 05:
05 1
2 M
ay 2
014

Ostrich 2013, 84(1): 1–9 5
mean NND than the CNND estimator, and, compared with census counts, underestimated density, on averageby 35% (Figure 3).
Compared to census counts, the performance of the T-square estimator varied between species. This is very likely because of the different spatial arrangement of nests for each species. It performed best for the southern popula-tion of WhV, estimating a total of 10.5 nests compared with a census total of 12. Similar to the CNND estimator, T-square sampling performed least well for AWbV, again most likely because of the clumped nature of AWbV nests (Table 2). However, the T-square estimator was much more robust to the non-random distribution of AWbV nests compared to the CNND estimator.
Using the T-square method, the projected breeding populations (95% confidence interval) of the three species were 904 pairs (162) of AWbV, 78 pairs (18) of LfV and 60 pairs (13) of WhV (Table 3).
Discussion
Overall the results from this study are important because they provide the first systematic data for numbers of
tree-nesting vultures across large areas of KNP. The aerial survey results and the density estimates based upon them are repeatable and provide a baseline for investigating variation in vulture populations over time.
Population estimatesAlthough vultures have not been surveyed systemati-cally across the entire KNP, various population estimates for these three species have been made for the park (Table 4). The most cited figures are likely to be those provided by Tarboton and Allan (1984), who made popula-tion estimates for KNP within a broader assessment of what was then South Africa’s Transvaal province in the north-east of the country. Other population estimates for KNP have been made by Benson (1997), Kemp et al (2001), Herholdt (1997) and Deacon (2004). The last two estimates are based on the same counts of vulture nests obtained during the annual herbivore census in KNP, which was done using fixed-wing aircraft between 1982 and 1994. Until the current study, the aerial count data from the herbivore censuses were the only systematically obtained informa-tion available on the status of vultures in KNP and those results were inaccurate. Deacon (2004) notes that counting vulture nests was a secondary activity during these surveys and that a large percentage of nests would have been overlooked. Herholdt (1997) also notes that nests would have been overlooked during the herbivore censuses, and cites misidentification as a contributing factor to counts that may have underestimated by as much as 50%. The estimates provided by Herholdt (1997) accounted for this and suggested KNP populations of 600–1 000 pairs of AWbV, 100 pairs of LfV and 92 pairs of WhV.
For WhV, the earlier estimates of 92 pairs are the same for Tarboton and Allan (1984) and Herholdt (1997). Our results are more conservative, and suggest that 92 pairs is likely to be high, and our lower confidence limit (47 pairs) falls within the ‘less than 50 pairs’ concluded by Benson (1997).
Densities of LfV have been considered to be higher in the northern third of KNP (Kemp 1974, Herholdt 1997), although there are no published data to support this. However, results presented here and our other aerial survey results from 2010 (unpublished) demonstrate that higher numbers of LfV exist in the southern third of the park. This was contrary to the expectations of our survey team and is discussed in the next section. Tarboton and Allan (1984) concluded there to be
Figure 3: Variation in estimates of density using different plotless density estimators where nearest-neighbour distance varies. CNND Compound nearest-neighbour distance, T-square T-square sampling (see Figure 2 and text for explanation of method)
CNNDT-square
VAR
IATI
ON
IN D
EN
SIT
YE
STI
MAT
E (%
)
200100
300400500600700800900
0.7 2.47 4.52 5.39 15.58 19.78MEAN NEAREST-NEIGHBOUR DISTANCE (km)
OverestimateUnderestimate
Table 3: Aerial survey counts, density estimates (obtained using a T-square estimator) and population projections for three species of vulture in Kruger National Park (KNP), South Africa. Listed census counts are from census subareas, as opposed to the two study areas in KNP that were surveyed completely: LD northern low-density area in KNP (total size approximately 10 500 km2), HD southern high-density area in KNP (total size approximately 7 200 km2), NND nearest-neighbour distance
ParameterAfrican White-backed Vulture Lappet-faced Vulture White-headed Vulture
LD HD LD HD LD HDCensus count 36 216 4 17 4 12Mean NND 2.47 0.70 15.58 4.52 19.78 5.39Density estimate 0.01191 0.03711 0.00109 0.00528 0.00146 0.00491Correction factor 0.73 0.36 0.60 0.65 0.81 0.87Estimated density (nests km−2) 0.0163 0.1014 0.0018 0.0081 0.0018 0.0056Projected KNP breeding
population (pairs)904 78 60
(95% CI 162) (95% CI 18) (95% CI 13)
Dow
nloa
ded
by [
Cam
pbel
l Mur
n] a
t 05:
05 1
2 M
ay 2
014
Murn, Combrink, Ronaldson, Thompson and Botha6
less than 40 pairs of LfV in the KNP area, whilst Herholdt (1997), again compensating for undercounting and misiden-tification, suggests 100 pairs. Our calculated estimate is between the two (78 pairs) and, although no population estimates are given for LfV, Benson (1997) highlights that LfV outnumbers WhV in KNP; the latter are concluded to number fewer than 50 pairs. Thus it is likely that the 1984 estimate of LfV is low.
The breeding distribution of AWbV is variable in KNP. Nests can occur in large numbers along some rivers and drainage lines, in addition to high densities in some savanna areas. As they are generally ubiquitous and an order of magnitude more abundant than the other two species, estimating the population of AWbV in KNP is challenging. Despite this, our calculated estimate of 904 162 pairs is within the estimated range of 600–1 000 pairs provided by Herholdt (1997), and is remarkably similar to the estimate of 2 048 birds made by Kemp et al (2001). Assuming an additional 0.3 immature and non-breeding birds per pair (Mundy et al. 1992), our estimate is 2 078 birds. This suggests that the population status of AWbV in KNP may not have changed dramatically since the mid-1990s. However, the earlier estimate by Tarboton and Allan (1984) of 1 400 pairs for KNP is higher, and poisoning incidents may have impacted these numbers (van Jaarsveld 1987, Herholdt 1997). It seems likely that, compared to the present, numbers of breeding AWbV in KNP have declined significantly since the early 1980s, perhaps byas much as 50%.
Population densitiesCompared to other areas (Table 5), the densities of LfV recorded in this study and others for the KNP area are low. This suggests that LfV may breed at a lower density in the lowveld of southern Africa, but densities in the virtually adjacent Gonarezhou National Park in Zimbabwe are likely to be the highest recorded for the species (Mundy 1982, Mundy et al. 1992), although these data are old and could now be lower. Similarly, LfV population and density data reported by Hitchins (1980) for Hluhluwe/Umfolozi in South Africa (15 nests at 0.016 nests km−2) are approxi-mately double those reported more recently by Bamford et al. (2009) (7/8 nests at 0.008 nests km−2) and highlight declines in that area. However for KNP, such declines are not apparent. As noted above, breeding densities for LfV are lower than expected for the northern areas of KNP, but prior to this study there are no published data that specifi-cally compare the density of nesting vultures between the
northern and southern areas of KNP. Although a latitudinal shift in density of breeding LfV could explain a lower nesting density in the northern area, we have no access to any comparative values and can only conclude at present that the overall population and density of LfV in KNP appears not to have changed significantly in recent times. This highlights the importance of the park as a stronghold for the species, situated as it is within a surrounding environ-ment that is generally unfavourable for LfV and many other vulture species (Anderson 2000).
Of all three species, density for WhV is the most consistent across all areas. By averaging the values in Table 5, it is concluded that a mean density of 0.006 nests km−2 in protected areas, to where the species is primarily con fined (Herremans and Herremans-Tonnoeyr 2000, Thiollay 2006), is likely to be accurate.
Similar to the LfV, AWbV breed at lower densities in KNP compared to other places. This, and other, low density estimates for KNP could be a function of the size of the park. In smaller protected areas breeding birds can be ‘crammed’, particularly if the surrounding habitat matrix is unfavour-able for breeding. This is a possible reason why breeding densities are higher in smaller protected areas. In general, breeding densities tend to increase with decreasing size of the area surveyed. The AWbV density reported for Kenya (Virani et al. 2010) is possibly an overestimate, as this figure was determined using a nearest-neighbour PDE for a relatively small sample of nests with a short mean NND (0.51 km). We therefore consider the Swaziland density (Monadjem and Garcelon 2005) as the highest yet recorded anywhere for this species, as it is based on aerial surveys and across a relatively small area.
What is density for?We recommend the adoption of nests per square kilometre (nests km−2) as the measure of breeding density, or number of nests per unit area. This is because densities by other measures either infer spacing and/or territo-rial behaviour (e.g. km2 nest−1 or area pair−1) or do not necessarily reflect the situation on the ground. For example, the highest reported nesting density for AWbV of 266 nests per 100 km2 (Monadjem and Garcelon 2005) is slightly misleading because 266 nests were not recorded in an area of 100 km2, but rather 109 nests over 41 km2 (2.66 nests km−2). Whilst this density is still very high, the clumped nature of AWbV nests means that finding other (smaller) patches with nest densities equiva-lent to this is not unlikely. The density measure of nests per 100 km2 does not account for the spatial arrange-ment of AWbV nests, which is characterised best as dispersed clumps, usually over areas of less than 100 km2. Conversely, 12 WhV nests found in a hypothetical area of 7 500 km2 does not mean that the territory size or area per pair is 625 km2. In this example, a reported density of 0.0016 nests km−2 describes the situation in the area that was surveyed, without making any inference about the ecological or behavioural traits of the birds. Density estimates are thus best used to describe the number of birds per unit area across the entire area of interest, rather than as an indicator of spacing or clustering, for which other methods of investigation should be used.
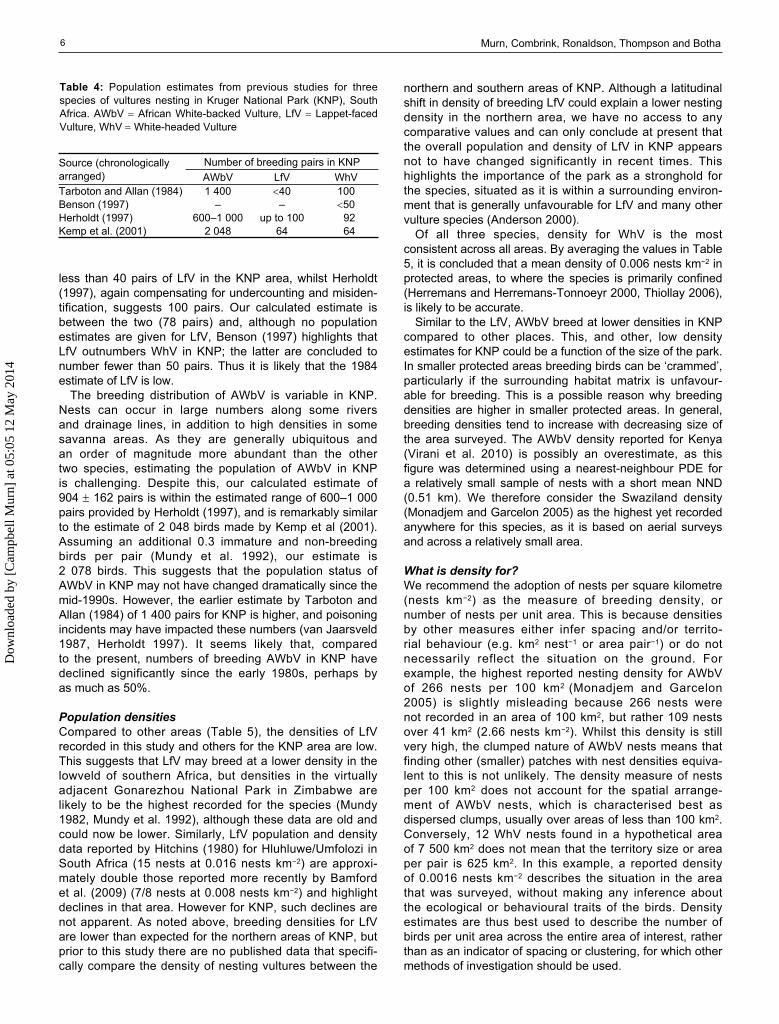
Table 4: Population estimates from previous studies for three species of vultures nesting in Kruger National Park (KNP), South Africa. AWbV African White-backed Vulture, LfV Lappet-faced Vulture, WhV White-headed Vulture
Source (chronologicallyarranged)
Number of breeding pairs in KNPAWbV LfV WhV
Tarboton and Allan (1984) 1 400 40 100Benson (1997) – – 50Herholdt (1997) 600–1 000 up to 100 92Kemp et al. (2001) 2 048 64 64
Dow
nloa
ded
by [
Cam
pbel
l Mur
n] a
t 05:
05 1
2 M
ay 2
014
Ostrich 2013, 84(1): 1–9 7
Review of the methods and assessing population changeFor large conservation areas that cannot be compre-hensively surveyed, we recommend a survey schedule and sample density estimation process similar to that described here. This process should incorporate prelimi-nary monitoring because helicopter surveys can be costly and should preferentially be used to census large areas of different density where they have been identified. The census densities we obtained were not used to estimate population sizes because the two aerial survey areas were samples of high- and low-density areas, which had been identified by preliminary monitoring. In other words, densities vary across KNP and the two survey areas sampled this variation to provide a combined estimate for the park. In small protected areas able to be surveyed completely, the total number of nests will be recorded, and whilst total density for the area can be calculated, this will ultimately be of less importance for conserva-tion monitoring than the total number of nests (on which density is based).
Based on the data and analyses in Tables 1 and 2, the distribution of AWbV nests in KNP clearly creates difficul-ties in the detection of spatial patterns and is the most likely reason for the poor performance of the compound NND estimator. Another possible explanation is the scale of investigation; AWbV nests are clearly clumped at local scales, but may quite possibly show a random distribution on a much larger scale. The use of accurate census data demonstrated that density estimates made using NNDs inflate dramatically population estimates for clustered breeding distributions. We conclude that estimating densities using any basic NND estimator (point to nest, nest to nest, and/or compound estimators) and extrapo-lating to larger areas is unreliable and should not be used. Our results show that the T-square density estimator was adequately robust to non-random distributions of nests and consistently underestimated densities, on average by 35%. As a result, we conclude that the T-square
method can be employed to estimate effectively popula-tion densities of dispersed nests (or groups of nests) occurring over large areas that cannot easily (logistically or financially) be surveyed completely. Smaller areas (e.g. 2 000 km2) should be surveyed exhaustively and numbers of nests counted, rather than extrapolating fromsample density estimates.
The tests of spatial randomness (Table 1) proved valuable in terms of quantifying the spatial variation exhibited by the nests of the three species. The combina-tion of the three statistics described well the patterns of the nests that were apparent from a visual inspection of the points. It is likely that the spatial arrangement of nests might vary over time (e.g. AWbV becoming less clustered and more dispersed) in response to changes in environmental or management scenarios. Future tests of spatial pattern and randomness can detect such variation and, in combination with robust density estima-tion, will highlight the resilience of populations of these species to changes over time, and the extent of theirresponse to change.
It is clear from the population estimates provided here that KNP holds internationally significant populations of these three species. In a world where the threats outside (and inside some) protected areas are increasing all the time, continued monitoring will be essential to determine how the density and pattern of vulture nests change over time in response to these threats and a broader environ-mental change scenario.
Acknowledgements — We thank pilot Grant Knight and the SANParks aerial services team. The manuscript benefitted from comments by G Holloway, A Monadjem, L Roxburgh and two anonymous reviewers.
References
Anderson MD. 2000. Lappetfaced Vulture. In: Barnes KN (ed.), The Eskom red data book of birds of South Africa, Lesotho and Swaziland. Johannesburg: BirdLife South Africa. pp 77–79.
Table 5: Comparative breeding densities for three species of tree-nesting vultures in various sites across Africa. Highest reported densities for each species are underlined. AWbV African White-backed Vulture, LfV Lappet-faced Vulture, WhV White-headed Vulture
LocationNest density (nests km−2)
SourceAWbV LfV WhV
Kruger National Park, South Africa 0.02–0.10 0.002–0.008 0.002–0.005 This studyKruger National Park, South Africa – 0.0010–0.0014 – Benson (1997)Kruger National Park, South Africa 0.05 0.0006 0.002 Kemp (1969)Kruger National Park, South Africa 0.045 – – Kemp and Kemp (1975)North-east South Africa 0.098 0.0012–0.0021 0.0048 Tarboton and Allan (1984)Masai Mara, Kenya 0.36–1.43 – – Virani et al. (2010)Swaziland 0.19–1.03 0.009 0.014 Monadjem and Garcelon (2005)Kimberley, South Africa 0.32–0.61 – – Murn et al. (2002)Various (southern Africa) 0.016–0.27 0.003–0.021 – Bamford et al. (2009)Hluhluwe/Umfolozi, South Africa 0.11 0.016 0.009 Hitchins (1980)Namibia – 0.013–0.07 – Bridgeford and Bridgeford (2003)Zimbabwe (various) 0.11–0.13 0.026–0.151 0.02 Mundy (1982)Hwange National Park, Zimbabwe – – 0.004 Hustler and Howells (1988)Hwange, Zimbabwe 0.037a 0.0006–0.003 0.001–0.004 Howells and Hustler (1984)Serengeti, Tanzania – 0.023 0.002 Pennycuick (1976)a Estimated from number of pairs divided by the size of the national park
Dow
nloa
ded
by [
Cam
pbel
l Mur
n] a
t 05:
05 1
2 M
ay 2
014
Murn, Combrink, Ronaldson, Thompson and Botha8
Bamford AJ, Monadjem A, Anderson MD, Anthony A, Borello WD, Bridgeford M, Bridgeford P, Hancock P, Howells WW, Wakelin J, Hardy ICW. 2009. Trade-offs between specificity and regional generality in habitat association models: a case study of two species of African vulture. Journal of Applied Ecology 46: 852–860.
Benson PC. 1997. Status of vultures in the Northern Province, South Africa. In: Boshoff AF, Anderson MD, Borello WD (eds), Vultures in the 21st century. Johannesburg: Vulture Study Group. pp 21–29.
BirdLife International. 2012. BirdLife International (2012) IUCN Red List for Birds. Available at http://www.birdlife.org [accessed June 2012].
Borello WD, Borello RM. 2002. The breeding status and colony dynamics of Cape Vulture Gyps coprotheres in Botswana. Bird Conservation International 12: 79–97.
Boshoff AF, Anderson MD. 2008. Towards a conservation plan for the Cape Griffon Gyps coprotheres: identifying priorities for research and conservation. Bulletin of the African Bird Club 15: 9–10.
Boshoff AF, Piper SE, Michael MD. 2009. On the distribution and breeding status of the Cape Griffon Gyps coprotheres in the Eastern Cape province, South Africa. Ostrich 80: 85–92.
Bridgeford P, Bridgeford M. 2003. Ten years of monitoring breeding Lappet-faced Vultures Torgos tracheliotos in Namib-Naukluft Park, Namibia. Vulture News 48: 3–11.
Brown CJ. 1997. Population dynamics of the Bearded Vulture Gypaetus barbatus in southern Africa. African Journal of Ecology 35: 53–63.
Brown D, Rothery P. 1993. Models in biology: mathematics, statistics and computing. Chichester: John Wiley and Sons.
Byth K. 1982. On robust distance-based intensity estimators. Biometrics 38: 127–135.
Cottam G, Curtis JT. 1956. The use of distance measures in phyto-sociological sampling. Ecology 37: 451–460.
Deacon A. 2004. The status and conservation of vultures in the Kruger National Park. In: Monadjem A, Anderson MD, Piper SE, Boshoff AF (eds), The vultures of southern Africa – quo vadis? Proceedings of a workshop on vulture research and conservation in southern Africa. Johannesburg: Birds of Prey Working Group. pp 125–128.
Engeman RM, Sugihara RT, Pank LF, Dusenberry WE. 1994. A comparison of plotless density estimators using Monte Carlo simulation. Ecology 75: 1769–1779.
Gertenbach WPD. 1983. Landscapes of the Kruger National Park. Koedoe 26: 9–121.
Greenwood JJD, Robinson RA. 2006. General census methods. In: Sutherland WJ (ed.), Ecological census techniques: a handbook. Cambridge: Cambridge University Press. pp 87–185.
Herholdt JJ. 1997. The status and conservation of vultures in the Mpumalanga province, South Africa. In: Boshoff AF, Anderson MD, Borello WD (eds), Vultures in the 21st century. Johannesburg: Vulture Study Group. pp 13–20.
Herholdt JJ, Anderson MD. 2006. Observations on the population and breeding status of the African White-backed Vulture, the Black-chested Snake Eagle, and the Secretarybird in the Kgalagadi Transfrontier Park. Ostrich 77: 127–135.
Herremans M, Herremans-Tonnoeyr D. 2000. Land use and the conservation status of raptors in Botswana. Biological Conservation 94: 31–41.
Hitchins PM. 1980. Breeding populations of vultures in the Hluhluwe-Umfolozi game reserve complex. Lammergeyer 30: 26–31.
Howells WW, Hustler K, 1984. The status and breeding success of eagles and vultures in the Hwange National Park, Zimbabwe. In: Mendelsohn JM, Sapsford CW (eds), Proceedings of the Second Symposium on African Predatory Birds. Durban: Natal Bird Club. pp 99–107.
Hustler K, Howells WW. 1988. Breeding biology of the Whiteheaded Vulture in Hwange National Park, Zimbabwe. Ostrich 59: 21–24.
Kemp AC. 1969. Vultures of the Kruger National Park. Bokmakierie 21: 59–60.
Kemp AC. 1974. The distribution and status of the birds of the Kruger National Park. Koedoe 2: 1–32.
Kemp AC. 1980. The importance of the Kruger National Park for bird conservation in the Republic of South Africa. Koedoe 23: 99–122.
Kemp AC, Herholdt JJ, Whyte IJ, Harrison JA. 2001. Birds of the two largest national parks in South Africa: a method to generate estimates of population size for all species and assess their conservation ecology. South African Journal of Science 97: 393–403.
Kemp AC, Kemp MI. 1975. Observations on the White-backed Vulture Gyps africanus in the Kruger National Park, with notes on other avian scavengers. Koedoe 18: 51–68.
Krüger S, van Zyl D, 2004. Bearded Vulture Gypaetus barbatus. In: Monadjem A, Anderson MD, Piper SE, Boshoff AF (eds), The vultures of southern Africa – quo vadis? Proceedings of a workshop on vulture research and conservation in southern Africa. Johannesburg: Birds of Prey Working Group. pp 51–58.
Monadjem A. 2003a. Nest site selection by African White-backed Vultures Gyps africanus in Swaziland. Vulture News 48: 24–26.
Monadjem A. 2003b. Nesting distribution of and status of vultures in Swaziland. Vulture News 48: 12–19.
Monadjem A. 2004. White-headed Vulture Trigonoceps occipitalis. In: Monadjem A, Anderson MD, Piper SE, Boshoff AF (eds), The vultures of southern Africa – quo vadis? Proceedings of a workshop on vulture research and conservation in southern Africa. Johannesburg: Birds of Prey Working Group. pp 34–39.
Monadjem A, Garcelon DK. 2005. Nesting distribution of vultures in relation to land use in Swaziland. Biodiversity and Conservation 14: 2079–2093.
Mundy PJ. 1982. The comparative biology of southern African vultures. Johannesburg: Vulture Study Group.
Mundy PJ, Butchart D, Ledger JA, Piper SE. 1992. The vultures of Africa. London: Academic Press.
Murn C, Anderson MD. 2008. Activity patterns of African White-backed Vultures Gyps africanus in relation to different land-use practices and food availability. Ostrich 79: 191–198.
Murn C, Anderson MD, Anthony A. 2002. Aerial survey of African white-backed vulture colonies around Kimberley, Northern Cape and Free State provinces, South Africa. South African Journal of Wildlife Research 32: 145–152.
Ogada DL, Keesing F, Virani MZ. 2012. Dropping dead: causes and consequences of vulture population declines worldwide. Annals of the New York Academy of Sciences 1249: 57–71.
Pennycuick CJ. 1976. Breeding of the lappet-faced and white-headed vultures (Torgos tracheliotus Forster and Trigonoceps occipitalis Burchell) on the Serengeti Plains, Tanzania. East African Wildlife Journal 14: 67–84.
Pomeroy D, Kaphu G, Nalwanga D, Ssemmanda R, Lotuk B, Opeto A, Matsiko M. 2012. Counting vultures at provisioned carcasses in Uganda. Vulture News 62: 25–32.
Rondeau G, Thiollay JM. 2004. West African vulture decline. Vulture News 51: 13–31.
Tarboton WR, Allan DG. 1984. The status and conservation of birds of prey in the Transvaal. Transvaal Museum Monograph 3: 1–115.
Thiollay JM. 2006. The decline of raptors in West Africa: long-term assessment and the role of protected areas. Ibis 148: 240–254.
Thiollay JM. 2007. Raptor population decline in West Africa. Ostrich 78: 405–413.
van Jaarsveld J. 1987. Increasing numbers of vultures poisoned in the Kruger National Park. Vulture News 18: 18–21.
Dow
nloa
ded
by [
Cam
pbel
l Mur
n] a
t 05:
05 1
2 M
ay 2
014
Ostrich 2013, 84(1): 1–9 9
Virani MZ, Kendall C, Njoroge P, Thomsett S. 2011. Major declines in the abundance of vultures and other scavenging raptors in and around the Masai Mara ecosystem, Kenya. Biological Conservation 144: 746–752.
Virani MZ, Kirui P, Monadjem A, Thomsett S, Githiru M. 2010. Nesting status of African White-backed Vultures Gyps africanus
in the Masai Mara National Reserve, Kenya. Ostrich 81: 205–209.
Whittington-Jones C, Wolter K, West S. 2011. Monitoring of Cape Vulture (Gyps coprotheres) breeding colonies in the Magaliesberg, South Africa: 2007–2009. Vulture News 60: 6–12.
Received June 2012, accepted December 2012Editor: L Roxburgh
Dow
nloa
ded
by [
Cam
pbel
l Mur
n] a
t 05:
05 1
2 M
ay 2
014

![[Horst Keller, Sascha Kruger] Objects Introdu](https://static.fdokumen.com/doc/165x107/63213d0b0c12e1161503b2ca/horst-keller-sascha-kruger-objects-introdu.jpg)