Picking up the pieces: a biosphere reserve framework for a fragmented landscape – The Coastal...
26
Picking up the pieces: a biosphere reserve framework for a fragmented landscape – The Coastal Lowlands of the Western Cape, South Africa C.E. HEIJNIS 1; , A.T. LOMBARD 2 , R.M. COWLING 2 and P.G. DESMET 2 1 Percy FitzPatrick Institute for African Ornithology, Zoology Department, University of Cape Town, Rondebosch 7701, South Africa; 2 Institute for Plant Conservation, Botany Department, University of Cape Town, Rondebosch 7701, South Africa; Present address: Institute for Plant Conservation, Botany Department, University of Cape Town, Rondebosch 7701, South Africa Received 21 April 1998; accepted in revised form 8 July 1998 Abstract. The coastal lowlands of the Western Cape (CLWC) form part of the fynbos biome, an area renowned for its high levels of plant diversity and endemism. The vegetation of the CLWC has been severely reduced and fragmented, and is currently impacted on by agricultural, pastoral, coastal resort and urban development, as well as alien plant spread. Furthermore, most of the vegetation communities are under-represented within existing protected areas. In response to this urgent need for increased conservation eorts, an initiative to establish a UNESCO-MAB bio- sphere reserve in the area has been launched. The aim of this project was to use biological criteria to identify areas that could potentially contain the core areas and buer zones of a biosphere reserve. A reserve selection algorithm was chosen which provides a flexible tool for selecting representative areas for protection. The algorithm is a step-wise heuristic, which has rules for including mandatory polygons, forcing adjacency, including desirable (e.g. Red Data Book plant species) and excluding undesirable features (e.g. bisection by major roads). Farm boundaries (cadastral units) were used as selection units, resulting in a total of 1 717 parcels. The selection process was conducted three times with target areas set at 10% , 25% and 50% of the original extent of each vegetation type within the study area. Areas of 62 834 ha, 121 199 ha and 242 397 ha, respectively, or 36% , 49% and 76% of the available land in the study area being selected. It is recommended that the area identified as the 50% target area be considered the future site of core areas and buer zones for the proposed biosphere reserve. The algorithm successfully maintained a high degree of connectivity between selected areas. This is important considering the high levels of plant beta diversity associated with edaphic gradients. Rather than presenting a definitive reserve system, this study provides a tool allowing biological criteria to be included explicitly within the negotiation process. As the biosphere reserve is assembled, priorities can be re-assessed. Key words: conservation planning, fragmented landscape, fynbos, South Africa Introduction The coastal lowlands of the Western Cape (CLWC) form part of the Cape Floristic Region (CFR) (Bond and Goldblatt 1984). The CFR has one of the highest plant species densities and levels of endemism for any temperate or tropical continental region (Linder 1985; Major 1988; Cowling et al. 1989; Biodiversity and Conservation 8: 471–496, 1999. Ó 1999 Kluwer Academic Publishers. Printed in the Netherlands.
-
Upload
independent -
Category
Documents
-
view
0 -
download
0
Transcript of Picking up the pieces: a biosphere reserve framework for a fragmented landscape – The Coastal...

Picking up the pieces: a biosphere reserve frameworkfor a fragmented landscape ± The Coastal Lowlandsof the Western Cape, South Africa
C.E. HEIJNIS1;�, A.T. LOMBARD2, R.M. COWLING2 and P.G. DESMET2
1Percy FitzPatrick Institute for African Ornithology, Zoology Department, University of Cape Town,
Rondebosch 7701, South Africa; 2Institute for Plant Conservation, Botany Department, University of
Cape Town, Rondebosch 7701, South Africa; � Present address: Institute for Plant Conservation,
Botany Department, University of Cape Town, Rondebosch 7701, South Africa
Received 21 April 1998; accepted in revised form 8 July 1998
Abstract. The coastal lowlands of the Western Cape (CLWC) form part of the fynbos biome, an
area renowned for its high levels of plant diversity and endemism. The vegetation of the CLWC has
been severely reduced and fragmented, and is currently impacted on by agricultural, pastoral,
coastal resort and urban development, as well as alien plant spread. Furthermore, most of the
vegetation communities are under-represented within existing protected areas. In response to this
urgent need for increased conservation e�orts, an initiative to establish a UNESCO-MAB bio-
sphere reserve in the area has been launched. The aim of this project was to use biological criteria to
identify areas that could potentially contain the core areas and bu�er zones of a biosphere reserve.
A reserve selection algorithm was chosen which provides a ¯exible tool for selecting representative
areas for protection. The algorithm is a step-wise heuristic, which has rules for including mandatory
polygons, forcing adjacency, including desirable (e.g. Red Data Book plant species) and excluding
undesirable features (e.g. bisection by major roads). Farm boundaries (cadastral units) were used as
selection units, resulting in a total of 1 717 parcels. The selection process was conducted three times
with target areas set at 10% , 25% and 50% of the original extent of each vegetation type within the
study area. Areas of 62 834ha, 121 199ha and 242 397ha, respectively, or 36% , 49% and 76% of
the available land in the study area being selected. It is recommended that the area identi®ed as the
50% target area be considered the future site of core areas and bu�er zones for the proposed
biosphere reserve. The algorithm successfully maintained a high degree of connectivity between
selected areas. This is important considering the high levels of plant beta diversity associated with
edaphic gradients. Rather than presenting a de®nitive reserve system, this study provides a tool
allowing biological criteria to be included explicitly within the negotiation process. As the biosphere
reserve is assembled, priorities can be re-assessed.
Key words: conservation planning, fragmented landscape, fynbos, South Africa
Introduction
The coastal lowlands of the Western Cape (CLWC) form part of the Cape
Floristic Region (CFR) (Bond and Goldblatt 1984). The CFR has one of the
highest plant species densities and levels of endemism for any temperate or
tropical continental region (Linder 1985; Major 1988; Cowling et al. 1989;
Biodiversity and Conservation 8: 471±496, 1999.Ó 1999 Kluwer Academic Publishers. Printed in the Netherlands.
Cowling and Holmes 1992). It is recognised as one of the world's hottest `hot-
spots' of plant diversity and endemism (Myers 1990). Agricultural, pastoral,
coastal resort and urban development, as well as the rapid spread of alien plant
species constitute the major threats to biodiversity in the CLWC (McDonald
1988; Azorin 1992; Deacon et al. 1992; Rebelo 1992; Richardson et al. 1992).
These factors have already caused extensive fragmentation of the natural
vegetation, and consequently, much of the remaining natural vegetation exists
in the form of habitat remnants (Boucher 1981; Cowling et al. 1986; Rebelo
1996a). The CLWC have high potential for the generation of income from
ecotourism, but this requires that the area is managed properly and that a
representative protected area system is established (Siegfried 1989).
The urgent need for timely conservation action in the CLWC has been
acknowledged by landowners, conservation bodies, local and provincial
administrative bodies and other stakeholders alike. In 1996, Cape Nature
Conservation, the statutory body responsible for environmental management
and conservation in the Western Cape Province, made a policy decision to
adopt the biosphere reserve approach to in situ conservation advocated by the
UNESCO Man and the Biosphere (MAB) Programme. This approach incor-
porates ecosystem management and human development into a regional con-
text. It advocates the establishment of a multiple use network of areas,
including one or more strictly delineated and protected core areas, surrounded
by less strictly protected bu�er zones, both enveloped within a series of
transitions zones (see UNESCO 1984; 1995; Batisse 1986; Vernhes 1987;
Wells and Brandon 1993; McNeely 1994; Rojas and McNeely 1995). Cape
Nature Conservation is attempting to establish one such reserve in a portion of
the CLWC.
The key question that arises is the siting of the biosphere reserve within
the CLWC, and more speci®cally, the position and relative sizes of the zones
that comprise a biosphere reserve. Thus, the objectives of this study were
twofold. First, to develop a set of databases and a unifying methodology which
could be used by nature conservationists and planners for negotiations,
planning and establishment of the biosphere reserve, and its future manage-
ment. Then to use these tools to identify a system of areas which could form
the bu�er zones and core areas of the proposed biosphere reserve on biological
grounds, which would: (i) adequately conserve the major habitats (vegetation
types); (ii) maintain contiguity between and within vegetation types;
(iii) preclude tracts of land invaded by high density alien plant species, trans-
formed land and small isolated reserves where possible; (iv) conserve as many
rare and endemic plant species as possible, and (v) provide ¯exibility for
the development of new conservation priorities as the biosphere reserve
develops.
472

Methods
Study area
The study area comprises 4 854 km2 or some 40% of the coastal lowlands of the
Western Cape (Figure 1). The physiography of the area is relatively simple
consisting of a low-lying (<200m), gently undulating coastal plain broken in
the south-east by a series of low granitic hills (<700m). Soils found at the
coast are recent, calcareous and coarse-grained sands derived from recent
marine sediments, grading to older, more acidic, ®ne-grained sands inland
(Lambrechts 1981; Rebelo 1996a). Ancient (pre-Cape) meta-sedimentary shales
of the Malmesbury group underlie most of the eastern (inland) part of the
study area. Soils derived from these rocks are duplex (sandy loams over clay),
base-saturated and clayey (Lambrechts 1981; Rebelo 1996b). The area has a
mediterranean-type climate with mild (ca. 12 �C) wet winters and warm (ca.
24 �C) dry summers (Nieman 1981). Rainfall ranges between 150mm á y)1 in
the north to 400mm á y)1 in the south (Nieman 1981). As a result of this
relatively steep moisture gradient (ca. 2.5mm á kmÿ1) and the high diversity of
soil types, the area supports a high diversity of vegetation types and plant
species (Jarman 1986; Boucher 1987). Further details on the geology, geo-
morphology, hydrology and soils of the coastal lowlands of the Western Cape
are given in Rogers (1981), Deacon et al. (1983), Lambrechts et al. (1986),
Boucher (1987) and King (1988).
Three main vegetation types occur in the study area: Dune Thicket, Sand
Plain Fynbos (West Coast), and West Coast Renosterveld. Dune Thicket in the
study area occurs in a coastal strip on recent calcareous dune sands, calcretes
and Tertiary limestones, while Sand Plain Fynbos, a sclerophyllous, ®re-prone
shrubland, is found predominantly on old (early Pleistocene to Tertiary), ®ne-
grained acidic soils. West Coast Renosterveld is con®ned largely to the ®ne-
textured soils derived from the Malmesbury Group Shales, Cape Granite Suite
and Klipheuwel Formation Shales (Tansley 1982; Rebelo 1996a). Only 6% of
Renosterveld and 14% of fynbos in the CLWC were untransformed in 1981
(Boucher 1981). Renosterveld is currently the most poorly protected with
<10% of extant vegetation or <5% of its original extent in both the west and
south-western Cape being conserved (Rebelo 1992). The conservation status of
Dune Thicket in the Western Cape is slightly better, with 14% falling within
current protected areas. Only 1% of Sand Plain Fynbos in the Western Cape
falls within existing protected areas (Rebelo 1996a). These main vegetation
types comprise eight sub-categories in the study area (Figure 2). These sub-
categories, delineated on the basis of an unpublished map prepared by
C. Boucher (University of Stellenbosch) ca. 1970, di�erentiate between plant
communities occurring on di�erent substrata, at di�erent altitudes and along
473
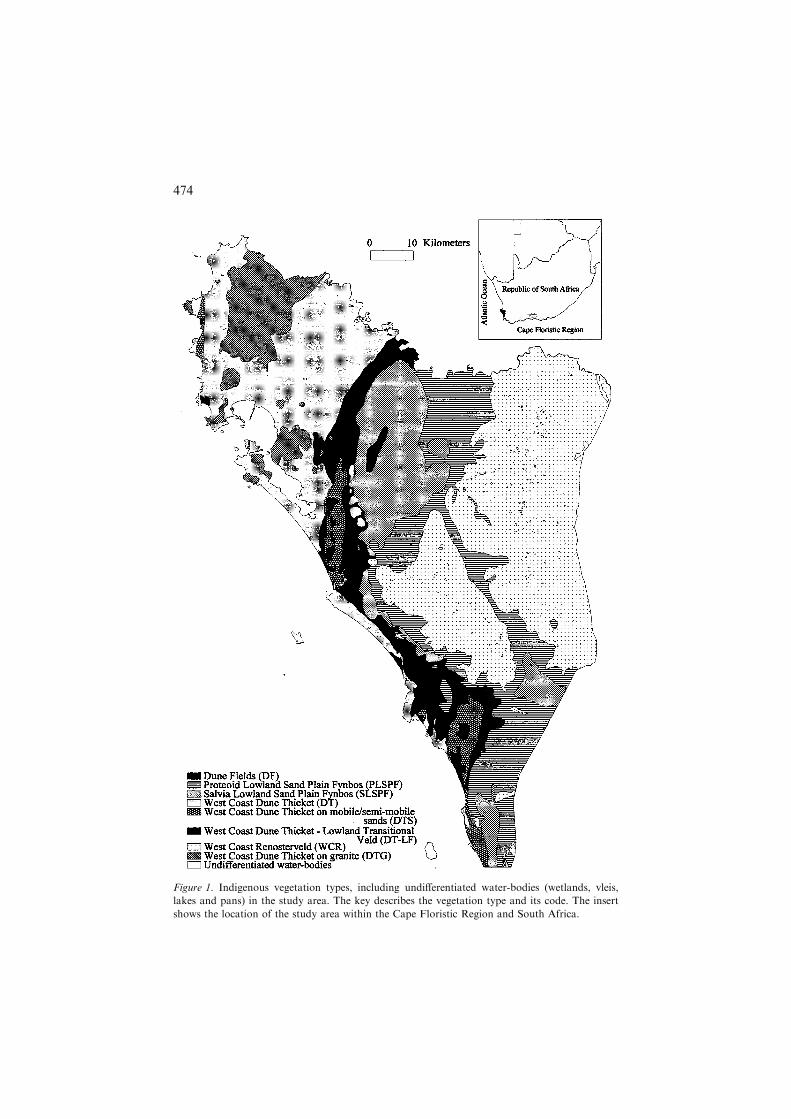
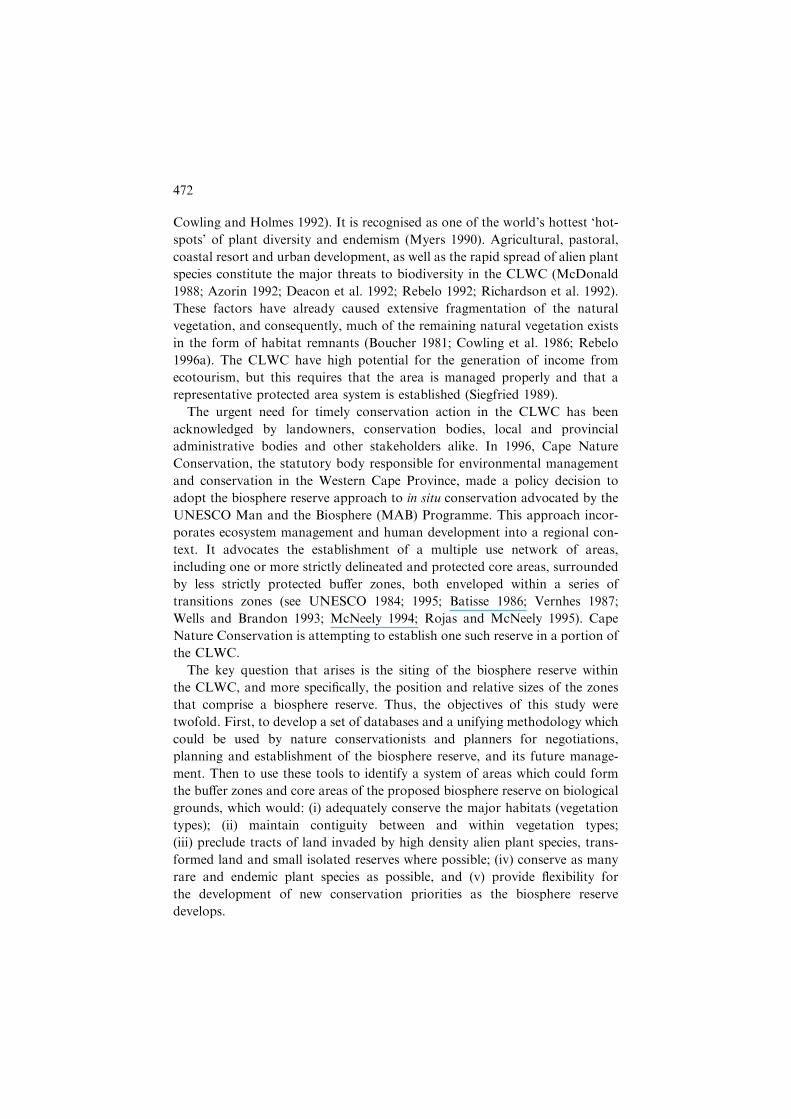
Figure 1. Indigenous vegetation types, including undi�erentiated water-bodies (wetlands, vleis,
lakes and pans) in the study area. The key describes the vegetation type and its code. The insert
shows the location of the study area within the Cape Floristic Region and South Africa.
474

Figure 2. Land use and alien plant density in the study area.
475

di�erent points of hydrological gradients (Boucher 1987, 1997 and R.M.
Cowling pers. com.). As such, these sub-categories are more representative of
plant biodiversity in the area than using the three undi�erentiated vegetation
types, and provide an adequate surrogate for ¯oristic variation. These vege-
tation categories are detailed in Appendix 1 and will henceforth be referred to
as vegetation types.
Data
Thirteen themes of spatial data were used in the study: the nine vegetation
types and undi�erentiated waterbodies (i.e. dams, ¯ood-plain-areas, pans and
vleis) (Figure 1); alien vegetation and land use (Figure 2); endemic Proteaceae
and Red Data plant species, current farm parcels (cadastral units), protected
areas and state-owned land (Figure 3); magisterial districts; railways and
roads. The data comprising the vegetation types theme were digitised from a
1 : 100 000 map prepared by C. Boucher ca. 1970, ground-truthed by one of us
(PGD) in 1997. The alien vegetation and land use were delineated on 1 : 50 000
topographic maps (Chief Directorate: Surveys and Land Information) and
digitised into a geographic information system (GIS: ARC/INFO versions
3.4D+ and 6.1.1). The boundaries of these themes were identi®ed using
photographs taken from a light aircraft during the course of this study. Where
cover of the area was not absolute, older aerial and orthophotographs were
also used. These photographs were used at two scales, 1 : 50 000 and 1 : 10 000.
The degree of alien plant infestation was rated as either low (scattered), me-
dium or high (closed canopy). Cape Nature Conservation supplied digital in-
formation detailing the location and extent of all municipal, provincial and
national reserves in the area. The extent and location of all private reserves in
the area augmented this data set. The latter data were obtained separately from
Cape Provincial Administration and delineated on 1 : 50 000 topographical
maps and digitised as detailed above. The main portion of the themes com-
prising water-bodies, railways and roadways, state-owned land and magisterial
districts were purchased in digital format at a scale of 1 : 50 000 from the Chief
Directorate: Surveys and Land Information, but were also augmented by
digitising relevant features from the topographical maps listed above. Addi-
tional information concerning state-owned land was obtained from the Cape
Town City Council, delineated on 1 : 50 000 maps and digitised. Records of the
distribution of Red Data plant species in the study area were provided by Cape
Nature Conservation. The place names of these records were transposed onto
1 : 50 000 topographical maps as point localities and digitised into the GIS.
Additional information regarding species distributions was obtained from
R.M. Cowling, J. Manning and P. Goldblatt. Records of Proteiod species were
obtained from the Protea Atlas Project at the University of Cape Town,
476

Figure 3. Cadastral units (farm boundaries), endemic Red Data and Proteaceae plant species,
protected areas and state-land in the study area.
477

through A.G. Rebelo of the National Botanical Institute. Henceforth, both
data sets will be referred to collectively as the plant species theme. The ca-
dastral units theme was purchased in digital format at a scale of 1 : 50 000 from
the Chief Directorate: Surveys and Land Information, but was augmented with
data obtained from the south-western Cape ENPAT (Environmental Potential
Atlas) digital database prepared by the Department of Environmental A�airs
and Tourism (1996).
Cadastral units (current farm parcels) were chosen as selection units for area
prioritisation. Where no cadastral data were available, in the south, part of the
Greater Cape Town Metropolitan area, a 2:5� 3 km grid was generated and
inserted (this size corresponded to the mean size of farms in the area). The
study area comprised a total of 1 717 cells with a mean size of 2.8 km2. Five
cadastral unit themes (alien vegetation, land use, protected areas, state land,
vegetation types and water bodies) were used to classify each cadastral unit,
according to the features they represent. Thus, each cadastral unit was desig-
nated a value for alien plant density, land-use type, protected area status, state-
land status and vegetation type corresponding to the identity of the majority of
each feature within the unit. The magisterial districts, railways, rivers, roads,
water bodies and the plant species themes were contained in four separate
digital maps as lines, a separate polygon-form and point-form digital map,
respectively. A Gause Conformal Conic projection centred on 18� longitude
was used for all analyses which were performed using either Arc View V3, or
Arc/INFO versions 3.4D+ and 6.1.1. (Environmental Systems Research
Institute, Redlands, California).
Core area and bu�er zone selection
The total extent of the study area was 485 410 ha. All cultivated or developed
land was considered unavailable for conservation. However, cultivated land in
protected areas or state-owned land was considered restorable and therefore
available for consideration. All land under low or medium density alien plants
was also considered restorable (Azorin 1992; Holmes and Cowling 1997). Land
under high density alien plants was considered non-restorable since these areas
were most likely to have the longest history of invasion (cf. Holmes and
Cowling 1997). Again, land invaded by high density alien plants within pro-
tected areas or state-owned land was considered available for conservation as
these are usually priorities in clearing programmes (D.M. Richardson pers.
comm.). All areas considered unsuitable for conservation, and thus unavailable
according to these criteria, were excluded from the database (the remaining set
formed the base from which speci®c core areas and bu�er zones were selected).
The available set comprised 170 361 ha or 35% of the study area, after it was
`split' into cadastral units and 177 546 ha or 37% of the study area when no
478

cadastral units were considered (Figures 4a and b, respectively). Unless oth-
erwise indicated, results were obtained considering the area in terms of ca-
dastral units. Cultivated land accounted for 56% of the excluded area, while
developed areas and high density aliens accounted for 2% and 7%, respec-
tively. For each vegetation type Figure 5 details the proportions of available,
cultivated, developed land; land invaded by high density alien plants; and land
currently owned by the state or included in protected areas. Salvia Lowland
Sand Plain Fynbos (LPSPF) had the highest proportion of available land (88%
of total area), while West Coast Renosterveld (WCR) had the lowest (3% of
total area). Proteoid Lowland Sand Plain Fynbos (PLSPF) had the highest
proportion of high density alien plant species (15%), closely followed by Dune
Thicket±Lowland Fynbos Transitional Veld (DT-LF) (14%) and Dune
Thicket on mobile to semi-mobile sand (DTS) (13%).
To expedite the process of establishing reserve systems, setting explicit tar-
gets for conservation requires negotiation and compromise between all stake-
holders (Pressey in press). Historically, particularly in South Africa, decisions
have been either the providence of the political or the conservation lobbies,
resulting in dissatisfaction whatever the outcome. This project is one of the ®rst
in the country that is attempting to unite the two often mutually exclusive
demands into a compromise acceptable to both. Consequently, three targets of
10%, 25% and 50%, of the original extent of each vegetation type in the study
area were decided upon (Table 1). While these may seem excessively high, it is
imperative to remember that the study area comprises only some 40% of the
CLWC. Thus 40% of this area actually only amounts to some 20±30% of the
original extent of the total lowlands. This complies with the minimum of 10%
suggested by Myers (1979) and subsequently endorsed by Rebelo (1997).
To achieve the targets for each vegetation class, speci®c areas (polygons
made up of cadastral units) were prioritised. Area prioritisation was conducted
using a simple heuristic algorithm based on iterative selection algorithms
commonly found in the literature (Vane-Wright et al. 1991; Bedward et al.
1992; Rebelo and Siegfried 1992; Margules and Meyers 1993, Nicholls and
Margules 1993; Pressey et al. 1995; Willis et al. 1996). The algorithm was a
stepwise heuristic comprising a series of rules designed to represent the nom-
inated target area for each vegetation class in the smallest possible area of
contiguous cadastral units. Areas were selected according to the following
objectives (after Lombard et al. 1997): (i) that the total area prioritised within
each vegetation class was the smallest possible (within the constraints of the set
targets); (ii) that it included as many contiguous vegetation types as possible
(thereby maximising regional-scale plant species diversity ± see Cowling 1990);
(iii) that as few undesirable (e.g. roads, towns) and as many desirable features
(e.g. rivers, wetlands) as possible were included; and (iv) that as many known
recorded populations of endemic plant species were included. To simplify the
479

Figure 4. Land available for conservation in the study area both (a) with and (b) without `splitting'
the area into cadastral units. `Available' land is the area remaining in the study area after the
exclusion of areas infested with high density alien plants and all developed land not in protected
areas nor state-land.
480
heuristic procedure and maintain ecosystem integrity within each of the veg-
etation types, the selection procedure was performed separately for each veg-
etation type.
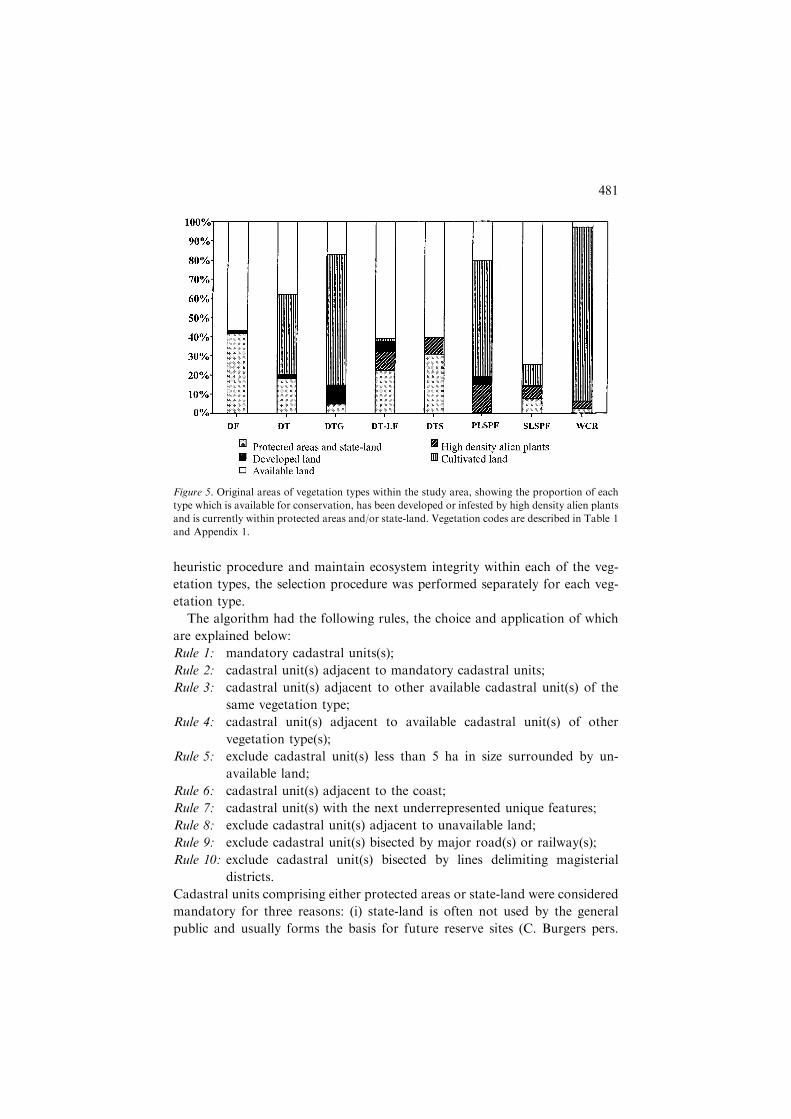
The algorithm had the following rules, the choice and application of which
are explained below:
Rule 1: mandatory cadastral units(s);
Rule 2: cadastral unit(s) adjacent to mandatory cadastral units;
Rule 3: cadastral unit(s) adjacent to other available cadastral unit(s) of the
same vegetation type;
Rule 4: cadastral unit(s) adjacent to available cadastral unit(s) of other
vegetation type(s);
Rule 5: exclude cadastral unit(s) less than 5 ha in size surrounded by un-
available land;
Rule 6: cadastral unit(s) adjacent to the coast;
Rule 7: cadastral unit(s) with the next underrepresented unique features;
Rule 8: exclude cadastral unit(s) adjacent to unavailable land;
Rule 9: exclude cadastral unit(s) bisected by major road(s) or railway(s);
Rule 10: exclude cadastral unit(s) bisected by lines delimiting magisterial
districts.
Cadastral units comprising either protected areas or state-land were considered
mandatory for three reasons: (i) state-land is often not used by the general
public and usually forms the basis for future reserve sites (C. Burgers pers.
Figure 5. Original areas of vegetation types within the study area, showing the proportion of each
type which is available for conservation, has been developed or infested by high density alien plants
and is currently within protected areas and/or state-land. Vegetation codes are described in Table 1
and Appendix 1.
481

Table
1.Areaselectiontargetsfortheeightvegetationtypes
inthecoastallowlandsoftheWestern
Cape.Target
areasare
given
aspercentages
oftheoriginal
extentofthevegetationtypes
within
thestudyarea.Bold
target
areasindicate
vegetationtypes
wheretheselectionalgorithm
could
beapplied.Italicised®gures
indicate
wherethetarget
areafellwithin
existingprotected
areasorstate-land.Allareasare
reported
inhaandapply
tothestudyarea`split'into
cadastral
units.
Vegetationtype
Vegetation
code
Totalareain
thestudyarea
Totalareaavailable
forconservation
Areain
state-land
and/orprotected
areas
10%
Target
area
25%
Target
area
50%
Target
area
DuneFields(M
obilesands)
DF
4834
2347
1719
483
1208
2417
WestCoast
DuneThicket
(Strandveld)
DT
88999
42193
19295
8899
22249
44499
WestCoast
DuneThicket
(Strandveld)
DTG
32095
5642
1400
3209
8023
16047
WestCoast
DuneThicket
(Strandveld)±Lowland
FynbosTransitionalVeld
DT-LF
42970
37367
13556
4296
10742
21484
WestCoast
DuneThicket
(Strandveld)onmobileto
semi-mobilesandorSouth
Coast
DuneStrandveld
DTS
15884
12026
6175
1588
3971
7942
ProteiodLowlandSandPlain
Fynbos
PLSPF
79871
15996
155
7987
19967
39935
Salvia
LowlandSandPlain
Fynbos
SLSPF
56191
49794
4627
5619
14047
28095
WestCoast
Renosterveld
WCR
164566
4995
4005
16457
41142
82283
Totals
485410
170361
50934
48538
121349
242702
482

comm.); (ii) it is essential to incorporate existing protected areas within the
selected set; and (iii) the status or quality of the vegetation contained within
protected areas or state-land is often far superior to that outside. These
mandatory cadastral units provided the starting point for the algorithm. All
subsequent rules were applied in sequence, with rules lower in the list being
used only as needed, either to resolve ties or to obtain selected areas within 2%
of target limits.
In order to maximise the contiguity of the resulting protected area system and
to minimise the number of isolated cadastral units selected, adjacency was one
of the primary underlying tenets of the algorithm. To facilitate application of the
adjacency rules (rules 2±4, 6 and 8), each cadastral unit in the available set was
coded on the basis of the features of the cadastral units adjacent to it. Features
used were: coast; protected areas, other vegetation types; same vegetation type;
state-land; and, unavailable land (cultivated and developed areas, and those
infested with high density alien plants). Rules 2±4 acted as ®lters, narrowing the
action of subsequent rules to adjacent cadastral units wherever possible. Rule 5
ensured that very small (<5 ha) or isolated cadastral units were excluded from
the ®nal selection. Rule 6 was used only where applicable, i.e. where vegetation
types abutted the coast. Rule 7 served to select cadastral units with unique
features, including the presence of endemic plant species, and the presence of
rivers, vleis, or wetlands from the group chosen by rules 1±5. These features were
used in a stepwise fashion. Three additional exclusion rules ± rules 8, 9 and 10
were used a posteriori to modify the design of the resultant set of cadastral units.
As conservation of small reserves in South Africa usually becomes the respon-
sibility of the local authorities, rule 10 serves to minimise the number of po-
tential administering bodies. Once chosen, a site was considered nominally
conserved as were its features and was removed from the subsequent analyses
along with its attributes, so that selected areas complemented each other.
The size of the area available for consideration precluded the use of sensi-
tivity analyses usually conducted as part of reserve selection procedures (e.g.
Bedward et al. 1992; Pressey et al. 1994; Willis et al. 1996; Lombard et al.
1997). The algorithm devised was speci®cally designed to prioritise areas in a
highly fragmented landscape for inclusion within a contiguous protected area
system. Consequently, the number of outcomes of the selection procedure was
restricted as was its ¯exibility (Pressey et al. 1993). Although it is often in-
structive to compare selection procedures run with and without including ex-
isting reserve systems as mandatory cells or cadastral units (e.g. Pressey and
Nicholls 1989, 1991; Nicholls and Margules 1993), such an exercise would have
been of little value here owing to the paucity of land available for conservation
in the study area.
483

Results
The area systems identi®ed with the 10%, 25% and 50% targets are given in
Figures 6a, b and c, respectively. With a 10% target, areas selected comprised
a total of 62 834 ha (248 cadastral units), encompassing 36% of the available
land in the study area (Figure 6a, Tables 2 and 3). DT formed the bulk of the
selected area (19 295 ha or 31%), while DF contributed the smallest proportion
(1 720 ha or 3%). The selected system contained 60 of the 83 Red Data Book
plant species and 661 of the 1 791 Red Data Book plant species' occurrences.
SLSPF (Salvia Lowland Sand Plain Fynbos) had the highest density of species
and species' occurrences per unit area (30 and 364, respectively), while DF had
the lowest (1 and 3, respectively). The areas identi®ed for the 25% and 50%
targets comprised 121 199 ha (419 cadastral units) and 242 397 ha (610 cadas-
tral units), respectively (Figures 6b and c, Table 2). That is 49% and 76% of
the available land in the study area. Again, DT formed the bulk of these areas,
comprising 27% and 33% of the area selected with the 25% and 50% targets
respectively. Similarly, DF had the least area selected in both target area sce-
narios, with 1 720 ha and 2 347 ha, or 1% and 2% identi®ed, respectively. With
a target of 25% of the original extent of the vegetation types in the study area,
66 species and 808 species occurrences are included. With targets set at 50% of
the original extent of the vegetation types in the study area, this increased to 75
and 977, respectively. The 50% target exclusively included greater than 50% of
the total species occurrences, while representing 90% of actual species. In both
cases, SLSPF had the largest proportion of species and species occurrences,
and DF the lowest.
The 10% target area fell within protected areas and/or state-land for ®ve of
the vegetation types (DT, DF, DTS and DT-LF). With the 25% target, three of
the vegetation types fell within existing protected areas and/or state-land (DF,
DTS, and DT-LF). No attempt was made to select cadastral units for vege-
tation types where existing protected areas or state-land exceeded the target
areas. The 10% target area was larger than the available land for one of the
vegetation types, WCR. This increased to three (DTG, PLSPF and WCR) for
the 25% target area and ®ve (DT, DTG, DF, PLSPF and WCR) for the 50%
target area. For each of the three target scenarios where the selection procedure
was applied, areas selected within each vegetation type fell within 5% of the
target area speci®ed (Table 2). The e�ciency of the selection procedure and the
use of cadastral units as selection units are summarised in Table 3. Generally,
e�ciency of the selection procedure tended to increase with an increase in
target percent and to decrease when the area selected was considered as a
proportion of the total available land in the study area (without cadastral
units). This holds particularly for those vegetation types which existed mainly
as habitat fragments, such as WCR (Figure 4b, Table 3). This becomes
484
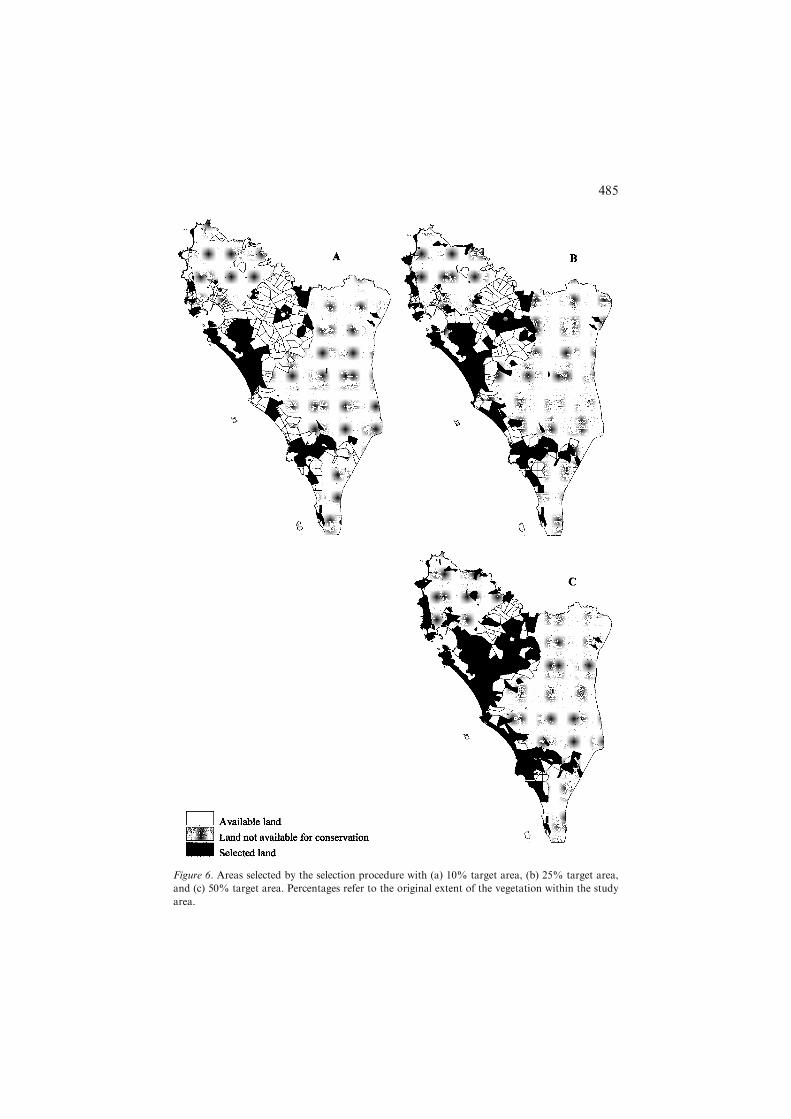
Figure 6. Areas selected by the selection procedure with (a) 10% target area, (b) 25% target area,
and (c) 50% target area. Percentages refer to the original extent of the vegetation within the study
area.
485

Table
2.Resultsoftheareaselectionprocess
usingthreetargetpercentages
forthecoastallowlandsoftheWestern
Cape.Bold
®guresindicate
vegetationtypes
wheretheselectionalgorithm
could
beapplied.Italicised®guresindicate
wheretarget
areasfellwithin
existingprotected
areasorstate-land.Allareasare
reported
inha.No.speciesrefers
toplantspecies.Negativenumbersindicate
under-representationandpositivenumbersover-representation.Vegetationcodes
areaare
explained
inTable
1andAppendix
1.
Target
Vegetation
code
Area
selected
Areaover/under
representation
%Total
areaselected
Algorithm
rules
applied
No.
polygonsselected
Meansize
of
selected
polygons
No.ofspecies
No.species
occurrences
10%
DF
1720
1236
36
±4
429
13
DT
19295
10395
22
±11
137
141
18
DTG
3185
)25
10
1±7
9353
34
DT-LF
13556
9259
32
±26
521
16
78
DTS
6175
4587
39
±22
280
33
PLSPF
8247
)260
10
1±8
18
458
25
106
SLSPF
5661
)42
10
1±9
10
566
30
364
WCR
4995
11462
3±
18
227
26
85
Totals
62834
13
248
60
661
25%
DF
1720
511
36
±4
429
13
DT
22393
)143
25
1±5
183
122
17
41
DTG
5642
)2382
18
±108
52
57
DT-LF
13556
2814
32
±26
521
16
76
DTS
6175
2204
39
±22
280
33
PLSPF
15996
)397k
20
±35
457
45
221
SLSPF
13615
)433
24
1±3
23
591
33
372
WCR
4995
36147
3±
18
277
26
85
Totals
121199
17
419
66
808
50%
DF
2347
)70
49
±9
260
13
DT
42194
)2306
47
±336
125
28
74
DTG
5642
)1046
18
±108
52
57
DT-LF
22313
)829
52
1±8
41
544
19
92
DTS
8179
)236
51
1±8
20
408
48
PLSPF
15996
)23940
20
±35
457
45
221
SLSPF
28488
)392
51
1±8
43
662
49
490
WCR
4995
)77288
3±
18
277
26
85
Totals
242397
27
610
75
977
486

Table
3.Areasselected
foreach
vegetationtypeunder
threetarget
scenarios(10,25and50%
)asafunctionoftheavailable
landin
thestudyareaboth
with
andwithoutcadastralunits.
Italicised®guresindicate
wherethetarget
areafellwithin
existingprotected
areasorstate-land.Allareasare
reported
inha.
Vegetationcodes
are
explained
inTable
1.
Target
Vegetationcode
Areaselected
Available
landwith
cadastralunits
Areaselected
as%
ofavailable
land
withcadastralunits
Totalavailable
land
instudyarea
Areaselected
as%
ofthetotalavailable
landin
thestudyarea
10%
DF
1720
2347
73
4325
40
DT
19295
42194
46
43344
45
DTG
3185
5642
56
9646
33
DT-LF
13556
37367
36
35457
38
DTS
6175
12026
51
13526
46
PLSF
8247
15996
52
16381
50
SLSPF
5661
49794
11
45067
13
WCR
4995
4995
100
9790
51
Totals
62834
170361
37
177546
35
25%
DF
1720
2347
73
4325
40
DT
22393
42194
53
43344
52
DTG
5642
5642
100
9646
58
DT-LF
13556
37367
36
35457
38
DTS
6175
12026
51
13526
46
PLSF
15996
15996
100
16381
98
SLSPF
13615
49794
27
45067
30
WCR
4995
4995
100
9790
41
Totals
84092
170361
49
177546
47
50%
DF
2347
2347
100
4325
54
DT
42194
42194
100
43344
97
DTG
5642
5642
100
9646
58
DT-LF
22313
37367
60
35457
63
DTS
8179
12026
68
13526
60
PLSF
15996
15996
100
16381
98
SLSPF
28488
49794
57
45067
52
WCR
4995
4995
100
9790
41
Totals
130153
170361
76
177546
73
487

particularly relevant for this vegetation type as the use of cadastral units de-
creases the proportion of fragments included within the available land set.
Discussion
This study combines both coarse- and ®ne-®lter approaches (Noss 1987;
Hunter et al. 1988). It has identi®ed an appropriate area from which core areas
and bu�er zones should be selected for inclusion within a biosphere reserve. In
addition, it has attempted to outline a speci®c system of priority areas, which
should comprise these core areas and bu�er zones. The e�ciency of the pro-
cedure in sampling the range of remaining natural diversity and therefore the
representativeness of the resulting prioritised areas, its explicitness, its use of
the principle of complementarity and its requirements for clear goals o�er
signi®cant advantages over the ad hoc approaches to reserve selection usually
applied in southern Africa.
Adequacy of areas selected
The heuristic algorithm used in this study was designed to accommodate the
high degree of fragmentation of the Western Cape coastal lowlands by using a
core of adjacency rules and precluding cadastral units containing land mostly
transformed by agriculture, pastoral or urban development, or containing high
densities of alien plant species. The selected areas under the three target sce-
narios (Figures 6a, b and c) included large tracts of Sand Plain Fynbos, which
harbours a rich and unusual neoendemic ¯ora that is inadequately conserved
outside the study area (Cowling and Holmes 1992; Rebelo and Siegfried 1992).
They include between 36% and 76% of the remaining West Coast Renoster-
veld that has long been recognised as a conservation priority (Cowling et al.
1986; Jarman 1986; Rebelo 1992; Rebelo and Tansley 1993). They also in-
corporate between 40% and 80% of West Coast Dune Thicket in South Africa
and large tracts of riparian vegetation along the lower reaches of the Berg
River. This latter vegetation type is highly productive, structurally diverse and
supports a particularly rich avifauna (MacDowell 1993; Hockey 1993).
The classi®cation and methodology used here for the assessment of con-
servation status and area selection are based solely on plant data. This is
because what little information is available on faunal distributions in the area is
mostly at the quarter-degree scale and hence too coarse for inclusion (Rebelo
1992). While the fauna per se is not considered, it is hoped that adequate
protection of habitats will also conserve animal species. Similar assumptions
have been made by numerous authors working within the CFR (e.g. Rebelo
488

and Siegfried 1992; Lombard et al. 1997). Each of the three vegetation types
found in the study area support a distinct avifauna and a rich invertebrate
fauna with high levels of endemism (Siegfried 1981; Tansley 1982). The pro-
posed system also includes many habitats suitable for the conservation of the
coastal lowland fauna. The inclusion of Langebaan Lagoon, a proclaimed
RAMSAR site, and the lower reaches of the Berg River, protects an area with a
high diversity of aquatic bird species (Hockey 1993; Shaw et al. 1996). Other
important sites are the Darling Hills and other granitic outcrops which also
support rich bird species assemblages (Siegfried 1989). Several endemic species
of amphibians are also found in many of the vleis in the selected area system
(Greig 1981). In a national-wide study, Lombard (1995) identi®ed ®ve quarter-
degree squares within the study area as representing hotspots for frogs, birds,
tortoises, snakes and mammals.
Fragmentation
The algorithm used was successful in maintaining a high degree of connectivity
between selected polygons. The degree of connectivity increased as the target
area percent increased. With a target of 10% the degree of connectivity both
within and between vegetation types was much less than with a target of 50%.
Inclusion of contiguous vegetation types accommodated for the high beta di-
versity of many of the vegetation types associated with habitat change in the
lowlands of the CFR (Cowling 1990; Cowling and Holmes 1992). The selected
areas included steep edaphic gradients, particularly in the Hope®eld, Darling
and Atlantis areas, which ensured that much of the region's plant diversity was
captured (see also Lombard et al. 1997). For example, the majority of the
selected area for SLSPF lies in an east-west, rather than a north-south orien-
tation, which captures a major edaphic gradient associated with increasing
sediment age. However, some of the edaphic gradients have not been included
because of the paucity of available land in the study area. The greater the target
area percent, the more edaphic gradients are captured. Edaphically heteroge-
neous sites conserve diverse species-rich assemblages of plants and provide
environmental gradients for future migration and speciation especially in the
event of climatic change (Graham 1988; Cowling et al. 1992; Peters and
Lovejoy 1992; Lombard et al. 1997). Edaphic speciation is regarded as an
important mode of diversi®cation in the lowlands of the CFR (Cowling et al.
1992; Willis et al. 1996).
Implementation and ¯exibility
No speci®c di�erentiation has been made between core areas and bu�er zones
in this study. The demarcation of core areas vs. bu�er zones requires a detailed
489

knowledge of all aspects of the area under consideration. While biological
considerations constitute a large portion of these, it is imperative that socio-
economic factors are also taken into account, e.g. landownership, access rights,
future development frameworks, public goodwill and co-operation and, most
importantly, the exact amount of funding available immediately and in the
foreseeable future. From a biological point of view, the principle of irre-
placeability (Pressey et al. 1993) becomes vitally important when identifying
actual reserve areas within the broad-scale area identi®ed in this study. The
high proportion of local endemics within each vegetation type (Rebelo 1992)
indicates that a single reserve within each of the identi®ed vegetation types
would not adequately conserve endangered or vulnerable plant species. Core
areas within the areas identi®ed should not only be carefully selected with
regard to location, number and connectivity, but also with particular consid-
eration for the total area and adjacent habitats. Inclusion of adjacent undis-
turbed habitats and diverse soil types will enhance the overall species richness
of the resultant reserve system owing to the exceptionally high soil-related beta
diversity in lowland fynbos regions (Cowling 1990). The extreme fragmentation
of some of the vegetation types e.g. WCR (Figures 4a and b) would require
some form of o�-core management and protection to maintain these remnants
in a matrix of agricultural land and so increase the overall level of protection.
Kemper et al. (submitted) suggest that for South Coast Renosterveld (200 km
to the south of the study area) these fragments are instrumental in conserving
the biodiversity of this vegetation type and should be conserved by some form
of contractual agreement with landowners if it is not possible to conserve each
remnant formally. The high degree of fragmentation will also have implications
as to the eventual management of the resulting biosphere reserve. It is
imperative that fragments of natural vegetation not represented by available
cadastral units (compare Figures 4a and b) are investigated and the option of
including them as very small core areas within either the transition zone or
bu�er area is considered.
It is recommended that the area identi®ed under the auspices of the 50%
target area be considered the future site of core areas and bu�er zones for the
proposed biosphere reserve. This is the last possible and practical site for the
conservation of the vegetation types inherent to the CLWC and the 50% target
area was set with regard to the study area alone (only some 40% of the
CLWC). Prioritisation of areas should consider both the indispensability and
the vulnerability of vegetation types (Pressey 1997): Indispensability of a site is
indicative of the extent to which options for achieving conservation goal(s) are
lost if the area is lost, while vulnerability refers to the susceptibility of an area
to destruction or alteration in the future. Figure 7 shows a scatter-plot of
indices of vulnerability vs. indispensability, a proxy measure for indispens-
490

ability, for each vegetation type at the 50% target. The indispensability index
(ind) for each vegetation type was calculated as a function of the percentage of
available land needed to achieve the 50% target. The vulnerability index (vul)
is a composite of three threats: alien infestation, development or cultivation
and loss of biodiversity due to fragmentation, ameliorated by the percentage of
the vegetation type currently in protected areas. The threat components of
vulnerability were calculated as a function of the extent to which the vegetation
types have already been reduced and fragmented as a result of each of these
threats. In order to give equal weighting to each of the three factors, values
were reduced to a scale of between 1 and 10, summed and then reduced by the
proportion of area currently in protected areas to give a total vulnerability
index. The marked di�erence between WCR and the other vegetation types in
terms of indispensability highlights the extreme reduction and fragmentation of
the vegetation type. This factor also di�erentiates it from the equally vulner-
able vegetation type, PLSPF. WCR was the vegetation type with the highest
combination of indispensability and vulnerability (irr 20, vul 1647), while
SLSPF had the lowest (irr 5, vul 56). This suggests that WCR is the vegetation
type with the highest priority and SLSPF the lowest. Those vegetation types
falling within the top right-hand corner of the scatter-plot have higher priority
than those in the bottom left.
Figure 7. Scatter plot of indispensability vs. vulnerability indices for each vegetation type in the
study area. The vulnerability index is a composite of three threats: alien infestation, development
and loss of fragmentation, the e�ects of which are modi®ed by the proportion of area already in
protected areas. The indispensability index for each vegetation type was the percent of available
land needed to achieve a 50% of the remnant extent of each of the vegetation types. Vegetation
codes are described in Table 1 and Appendix 1.
491

Where possible, existing protected areas should form the starting points for
core areas and attempts should be made to provide links or corridors between
these. It is recommended that core areas and bu�er zones be identi®ed in an
atmosphere of negotiation between all stakeholders. The establishment of a
biosphere reserve is a process that requires that all interested parties be con-
sidered. Rather than presenting a de®nitive reserve system, this study provides
a tool that allows for biological criteria to be included explicitly within that
negotiation process. As the biosphere reserve is assembled, priorities can be re-
assessed in an iterative manner.
Acknowledgements
We are grateful to A. Plos for technical assistance and to Dr B.M. Clark for
useful discussion and comments on drafts of this report. Special thanks go to
D. Gerneke without whose expertise in light aircraft aviation, the collection of
additional data may not have been possible. We would like to express our
gratitude to C. Burgers, R. Poole, A. le Roux and B. de Wet of Cape Nature
Conservation for data contributed and useful discussion. Similarly, Dr A.G.
Rebelo and the Protea Atlas Project, Dr J. Manning, Dr P. Goldblatt and Dr
A.B. Low are thanked for their contributions. Thanks are also due to Dennis
Moss & Associates, Cape Town City Council, The Darling Wild Flower As-
sociation, The West Coast Biosphere Reserve Committee and The West Coast
Regional Services Council. This project would not have been possible without
the funding supplied by WWF-SA, The Ubuntu Trust and the Institute for
Plant Conservation, which are all gratefully acknowledged.
Appendix 1. Nine sub-categories of vegetation types occurring in the study area (after Boucher
1987).
Vegetation
name Abbreviation
Phytosociological
nomenclature Description
Dune ®elds
(Mobile sand)
DF ± ±
West Coast Dune
Thicket (Strandveld)
DT Euclea racemosa ±
Zygophyllum
morgsana Alliance
Short closed to tall open
shrubland and tall closed
restioland on stable lime-rich
sands.
West Coast Dune
Thicket (Strandveld)
on dry granite
DTG Euclea racemosa ±
Zygophyllum
morgsana Alliance
Hillside closed dwarf and dense
shrubland on granite
outcrops. Dominant plant
communities incl. Galenia
crystallina ± Senecio ¯oribunda
hillside-closed dwarf
shrubland; and Eharta erecta ±
Maurocenia frangularia
hillside dense shrub-land.
492

References
Anon (1995) The Establishment of a Biosphere Reserve in the Coastal Zone, Saldanha to Koeberg.
Unpubl report, 61 pp
Azorin JAE (1992) The Potential of Alien Acacias as Woodfuel Resource in the South Western
Cape. Unpubl. report, National Energy Council, Cape Town
Batisse M (1986) Developing and focusing the biosphere reserve concept. Nature & Resources 22:
2±11
Bedward M, Pressey RL and Keith DA (1992) A new approach for selecting fully representative
reserve networks: addressing e�ciency, reserve design and land suitability with iterative analyses.
Biological Conservation 62: 115±125
Belbin L (1993) Environmental representativeness: regional partitioning and reserve selection.
Biological Conservation 66: 223±230
Bond P and Goldblatt P (1984) Plants of the Cape Flora: a descriptive catalogue. Journal of South
African Botany 13 (Suppl.): 1±455
Boucher C (1981) Floristic and structural features of the coastal foreland vegetation south of the
Berg River, Western Cape Province, South Africa. In: Moll E (ed) Proceedings of a Sympo-
sium on Coastal Lowlands of the Western Cape, pp 2±26. University of the Western Cape,
Bellville
Boucher C (1987) A phytosociological study of transects through the Western Cape coastal
foreland, South Africa. Unpubl. PhD thesis, University of Stellenbosch, Stellenbosch
Boucher C and Jarman ML (1977) The vegetation of the Langebaan area, South Africa. Trans-
actions of the Royal Society of South Africa 42: 241±272
Cowling RM (1990) Diversity components in a species-rich area of the Cape Floristic Region.
Journal of Vegetation Science 1: 699±710
Appendix 1. (Continued)
Vegetation
name Abbreviation
Phytosociological
nomenclature Description
West Coast Dune
Thicket (Strandveld)
on mobile to
semi-mobile sand or
South Coast Dune
Strandveld
DTS Euclea racemosa ±
Ischyrolepis
eleocharis Alliance
Low to mid-high, very sparse
to open shrubland on mobile
to semi-mobile lime-rich sands.
West Coast Dune
Thicket (Strandevld) ±
Lowland Fynbos
Transitional Veld
DT-LF Euclea racemosa ±
Willdenowia
invurvata Alliance
Tall open to sparse restioid
shrubland on Quaternary to
Tertiary white to reddish sand
with loam and occasional
limestone.
Proteoid Lowland
Sand Plain Fynbos
PLSPF Phylica cephalantha ±
Leucospermum
tomentosum Alliance
Low mid-dense restiod
shrubland on Quaternary to
Tertiary acid sands.
Salvia Lowland
Sand Plain Fynbos
SLSPF Phylica cephalantha ±
Salvia africana ±
lutea Alliance
Tall closed shrubland on
Quaternary to Tertiary acid
sands and alluvium
West Coast
Renosterveld
WCR Ehrharta calycina ±
Elytropappus
rhinocerotis Order
Short closed shrubland to low
closed woodland on Cape
granites or shales (Malmesbury
Group and Klipheuwel
formation derived soils).
493

Cowling RM and Bond WJ (1991) How small can reserves be? An empirical approach in Cape
Fynbos, South Africa. Biological Conservation 58: 243±256
Cowling RM and Holmes PM (1992) Flora and vegetation. In: Cowling RM (ed) The Ecology of
Fynbos: Nutrients, Fire and Diversity, pp 23±61. Oxford University Press, Oxford, UK
Cowling RM, Pierce SM and Moll EJ (1986) Conservation and utilisation of South Coast
Renosterveld, an endangered South African vegetation type. Biological Conservation 37:
363±377
Cowling RM, Russel G, Ho�man MT and Hilton-Taylor C (1989) Patterns of plant species di-
versity in southern Africa. In: Huntley BJ (ed) Biotic Diversity in Southern Africa: Concepts and
Conservation, pp 19±50. Oxford University Press, Oxford, UK
Deacon HJ, Hendley QB and Lambrechts JJN (eds) (1983) Fynbos palaeoecology: A preliminary
synthesis. South African Nat. Sci. Prog. Rep 75: 215 pp
Deacon HJ, Jury MR and Ellis F (1992) Selective regime and time. In: (Cowling RM (ed) The
Ecology of Fynbos ± Nutrients, Fire and Diversity, pp 206±225. Oxford University Press,
Oxford, UK
Dennis Moss Partnership (1995) The Establishment of a Biosphere Reserve in the Coastal Zone
Saldanha Bay to Koeberg: Pilot Study. Unpubl report, 69 pp
Fuggle RF and Rabie MA (eds) (1992) Protected area. In: Environmental Management in South
Africa, pp 670±712. Juta & Co, Kenwyn
Graham RW (1988) The role of climate change in the design of biological reserves: the paleo-
ecological perspective for conservation biology. Conservation Biology 2: 391±394
Greig JC (1981) The reptiles, amphibians and ®sh of the coastal lowlands of the Western Cape. In:
Moll E (ed) Proceedings of a Symposium on Coastal Lowlands of the Western Cape, pp 27±29.
University of the Western Cape, Belville
Hockey PAR (1993) Potential impacts of water abstraction on the birds of the lower Berg River
wetlands. In: Shaw K (ed) Berg River Estuary and Associated Wetlands. RAMSAR Rep.,
pp 114±152. Cape Nature Conservation, Cape Town
Holmes PM and Cowling RM (1997) The e�ects of invasion by Accacia saligna on the guild
structure and regeneration capabilities of South African fynbos shrubland. Journal of Applied
Ecology 34: 317±332
Hunter ML, Jacobsen GL and Webb T (1988) Paleoecology and the coarse-®lter approach to
maintaining biological diversity. Conservation Biology 2: 375±385
JarmanML (ed) (1986) Conservation priorities in lowland regions of the fynbos biome. S. Afr. Nat.
Sci. Prog. Rep. 87: pp 55
Kemper J, Cowling RM, Richardson DM, Forsyth GC and McKelly DH (submitted) Landscape
patterns and their correlates in a fragmented ecosystem: South Coast Rensoterveld, South Africa
King JM (1988) Hydrology and hydrobiology in the fynbos biome. Ecosys. Prog. Occ. Rep. 26:
pp 59
Lambrechts JJN (1981) Soils of the coastal lowlands of the western Cape. In: Moll E (ed) Pro-
ceedings of a Symposium on Coastal Lowlands of the Western Cape, pp 9. University of the
Western Cape, Belville
Lambrechts JJN, Theron AA and Fry M (1986) Detail characterisation of soils under di�erent
fynbos-climate-geology combinations in the south and south-western Cape. Ecosystem Pro-
grammes, Project Report Series. University of Cape Town, Cape Town
Linder HP (1985) Gene ¯ow, speciation and species diversity patterns in a species-rich area: the
Cape Flora. In: Vrba ES (ed) Species and Speciation. Transvaal Museum, Pretoria
Lombard AT (1995) The problems with multi-species conservation: do hotspots, ideal reserves and
existing reserves coincide? South African Journal of Zoology 30: 145±168
Lombard AT, Cowling RM, Pressey RL and Mustart PJ (1997) Reserve design on the Agulhus
Plain, South Africa: a ¯exible tool for conservation in a species-rich fragmented landscape.
Conservation Biology 11: 1101±1116
MacDowell CR (1993) Vegetation assessment of the Berg River estuary and ¯oodplain with
evaluation of likely impacts arising from proposed upstream water impoundments. In: Shaw K
494

(ed) Berg River Estuary and Associated Wetlands, RAMSAR Rep., pp 26±83. Cape Nature
Conservation, Cape Town
Major J (1988) Endemism: a botanical perspective. In: Myers AA and Giller PS (eds) Analytical
Biogeography. An Integrated Approach to the Study of Animal and Plant Distribution, pp 117±
146. Chapman & Hall, New York
Margules CR and Myers JA (1993) The location and management of natural areas in the forestry
context: an Australian perspective. In: Everard (ed) The Relevance of Island Biogeographical
Theory in Commercial Forestry, pp 3±26. FRD, Pretoria
McDonald DJ (1988) A synopsis of the plant communities of Swartboschkloof Jonkershoek, Cape
Province. Bothalia 18: 233±260
McNeely JA (1994) Protected areas for the 21st century: working to provide bene®ts to society.
Biodiversity and Conservation 3: 390±405
Myers N (1979) The Sinking Ark ± A New Look at the Problem of Disappearing Species. Per-
gammon Press, Oxford
Myers N (1990) The biodiversity challenge: expanded hot-spots analyses. Environment 10: 243±255
Myers N (1993) Biodiversity and the precautionary principle. Ambio 22: 74±79
Nicholls AO and Margules CR (1993) An upgraded reserve selection algorithm. Biological Con-
servation 64: 165±169
Nieman WA (1981) Climate of the coastal lowlands of the western Cape. In: Moll E (ed) Pro-
ceedings of a Symposium on Coastal Lowlands of the Western Cape, pp 11±15. University of the
Western Cape, Belville
Noss RF (1987) Protecting natural areas in fragmented landscapes. Natural Areas Journal 7: 2±13
Peters RL and Lovejoy TE (eds) (1992) Global Warming and Biological Diversity. Yale University
Press, New Haven, CT, USA
Pienkowski MW, Bignal EM, Galbraith CA, McCracken DI, Stillman RA, Boobyer MG and
Curtis DJ (1996) A simpli®ed classi®cation of land-type zones to assist the integration of bio-
diversity objectives in land-use policies. Biological Conservation 75: 11±25
Pressey RL (in press) Algorithms, politics and timber: an example of the role of science in a public,
political negotiation process over new conservation areas in production forests. In: Wills RT,
Hobbs RJ and Fox MD (eds) Ecology for Everyone: Communicating Ecology to Scientists, the
Public and the Politicians, 26 pp. Surrey Beatty and Sons, Sydney
Pressey RL and Nicholls AO (1989) Application of a numerical algorithm to the selection of
reserves in semi-arid New South Wales. Biological Conservation 50: 263±278
Pressey RL and Nicholls AO (1991) Reserve selection in the Western Division of New South Wales:
development of a new procedure based on land system mapping. In: Margules CR and Austin
MP (eds) Nature Conservation: Cost E�ective Biological Surveys and Data Analyses, pp 98±105.
CSIRO, Australia
Pressey RL, Humphries CJ, Margules CR, Vane-Wright RI and Williams PH (1993) Beyond
opportunitism: key principles for systematic reserve selection. TREE 8: 124±128
Pressey RL, Bedward M and Keith DA (1994) New procedures for reserve selection in New South
Wales: maximising the chances of achieving a representative network. In: Forey PL, Humphries
CJ and Vane-Wright RI (eds) Systematices and Conservation evaluation, pp 351±373. Clarendon
Press, Oxford, UK
Pressey RL, Ferrier S, Hutchinson CD, Sivertsen DP and Manion G (1995) Planning for negoti-
ation: using an iterative geographic information system to explore alternative protected area
networks. In: Saunders DA, Craig JL and Mattiske EM (eds) Nature Conservation: The Role of
Networks, pp 23±33. Surrey Beatty, Sydney
Rebelo AG (1992) Red data book species in the Cape Floristic region: threats, priorities and target
species. Transactions of the Royal Society of South Africa 48: 55±85
Rebelo AG (1996a) West Coast Renosterbos. In: Low AB and Rebelo AG (eds) Vegetation of
South Africa, Lesotho and Swaziland, pp 66. Dept. Environmental A�airs, Pretoria
Rebelo AG (1996b) Sand Plain Fynbos. In: Low AB and Rebelo AG (eds) Vegetation of South
Africa, Lesotho and Swaziland, pp 74. Dept. Environmental A�airs, Pretoria
495

Rebelo AG (1997) Conservation. In: Cowling RM, Richardson DM and Pierce SM (eds) Vege-
tation of Southern Africa, pp 571±590. Cambridge University Press, Cambridge, UK
Rebelo AG and Siegfried WR (1992) Where should nature reserves be located in the Cape Floristic
Region, South Africa? Models for the spatial con®guration of a reserve network aimed at
maximising the protection of ¯oral diversity. Conservation Biology 6: 243±252
Rebelo AG and Tansley SA (1993) Using rare plant species to identify priority conservation areas
in the Cape Floristic region: the need to standardise for total species richness. South African
Journal of Science 89: 156±161
Richards MB, Cowling RM and Stock WD (1995) Fynbos plant communities and vegetation-
environment relationships in the Soetanysberg hills, Western Cape. South African Journal of
Botany 61: 298±305
Richardson DM, Macdonald IAW, Holmes PM and Cowling RM (1992) Plant and animal in-
vasions. In: Cowling RM (ed) The Ecology of Fynbos ± Nutrients, Fire and Diversity, pp 271±
308. Oxford University Press, Oxford, UK
Rogers J (1981) Geological history of the western Cape's coastal lowlands. In: Moll E (ed) Pro-
ceedings of a Symposium on Coastal Lowlands of the Western Cape, pp 7±8. University of the
Western Cape, Belville
Rojas M and McNeely JA (1995) The Convention on Biological Diversity: New Roles and
Opportunities for Biosphere Reserves. International Conference on Biosphere Reserves, Seville,
20±25 March
Shaw K, de Witt B, du Preez D, Palmer G andWessels NG (1996) Berg river estuary and associated
wetlands. RAMSAR Rep., Cape Nature Conservation, Cape Town
Siegfried WR (1981) Trophic structure of some communities of fynbos birds. In: Moll E (ed)
Proceedings of a Symposium on Coastal Lowlands of the Western Cape, pp 31±51. University of
the Western Cape, Belville
Siegfried WR (1989) Preservation of species on southern African nature reserves. In: Huntley BJ
(ed) Biotic Diversity in Southern Africa: Concepts and Conservation, pp 186±201. Oxford
University Press, Oxford, UK
Tansley S (1982) Koppie Conservation Project. Unpubl. Report, Botanical Society, Cape Town
UNESCO (1984) Action plan for biosphere reserves. Nature and Resources 2: 1±12
UNESCO (1995) The Seville strategy for biosphere reserves. Biosphere Reserves: The First Twenty
Years. General Conference, Twenty-eighth Session, Seville
Vane-Wright RI, Humphries CJ and Williams PH (1991) What to protect? ± Systematics and the
agony of choice. Biological Conservation 55: 235±254
Vernhes JR (1987) Biosphere Reserves: The Beginnings, the Present and the Future Challenges.
Fourth World Congress, Colorado, 11±18 Sep
Wells MP and Brandon KE (1993) The principles and practices of bu�er zones and local partici-
pation in biodiversity conservation. Ambio 22: 157±162
Willis CK, Cowling RM and Lombard AT (1996) Patterns of endemism in the limestone ¯ora of
the South African lowland fynbos. Biodiversity and Conservation 5: 55±73
Zonneveld IS (1989) The land unit ± A fundamental concept in landscape ecology, and its appli-
cations. Landscape Ecology 3: 67±86
496