Performance Modeling and Evaluation of Peer-to-Peer Live Streaming Systems under Flash Crowds
15
IEEE/ACM TRANSACTIONS ON NETWORKING, VOL. XX, NO. XX, XXX 2013 1 Performance Modeling and Evaluation of Peer-to-Peer Live Streaming Systems under Flash Crowds Yishuai Chen, Baoxian Zhang, Senior Member, IEEE, Changjia Chen, Senior Member, IEEE, and Dah Ming Chiu, Fellow, IEEE Abstract—A Peer-to-Peer (P2P) live streaming system faces a big challenge under flash crowds. When a flash crowd occurs, the sudden arrival of numerous peers may starve the upload capacity of the system, hurt its quality of service, and even cause system collapse. This paper provides a comprehensive study on the performance of P2P live streaming systems under flash crowds. By modeling the systems using fluid model, we study the system capacity, peer startup latency, and system recovery time of systems with and without admission control for flash crowds, respectively. Our study demonstrates that, without admission control, a P2P live streaming system has limited capacity to handle flash crowds. We quantify this capacity by the largest flash crowd (measured in shock level) that the system can handle, and further find this capacity is independent of system initial state while decreases as departure rate of stable peer increases, in a power law relationship. We also establish the mathematical relationship of flash crowd size to the worst-case peer startup latency and system recovery time. For a system with admission control, we prove that it can recover stability under flash crowds of any sizes. Moreover, its worst-case peer startup latency and system recovery time increase logarithmically with the flash crowd size. Based on the analytical results, we present detailed flash crowd handling strategies, which can be used to achieve satisfying peer startup performance while keeping system stability in the presence of flash crowds under different circumstances. Index Terms—Modeling, Flash crowd, Streaming media, Videos, Peer-to-Peer. I. I NTRODUCTION A S Peer-to-Peer (P2P) live streaming systems become popular over the Internet [1], study on the performance of such systems under flash crowds is becoming critical. A flash Manuscript received March 15, 2005; revised October 26, 2012 and Febuary 4, 2013; accepted June 3, 2013; approved by IEEE/ACM TRANSACTIONS ON NETWORKING Editor T. Bonald. Date of publication xx xx, 2013; date of current version xx xx, xxxx. This work was supported by NSF of China under Grants 61271199, 61173158, 61101133, HK RGC Grant 411508, National Key Special Program of China under Grant No.2010ZX03006-001-02, and Fundamental Research Funds in Beijing Jiaotong University under Grant W11JB00630. Y. Chen and C. Chen are with the School of Electrical and Information Engineering, Beijing Jiaotong University, Beijing, 100044, China (e-mail: [email protected], [email protected]). B. Zhang is with the Research Center of Ubiquitous Sensor Networks, University of Chinese Academy of Sciences, Beijing, 100049, China (e-mail: [email protected]). D. M. Chiu is with the Department of Information Engineering, The Chinese University of Hong Kong, Hong Kong (e-mail: [email protected]). Color versions of one or more of the figures in this paper are available online at http://ieeexplore.ieee.org. Digital Object Identifier xx.xxxx/TNET.xxxx.xxxxxxx crowd is a sudden arrival of numerous peers at a system. It is typically triggered by popular programs that cause a surge of users to join the system at scheduled time [2]. Existing measurement results on commercial P2P live streaming sys- tems (e.g., UUSee [3], CoolStreaming [4]) indicate that the performance of such systems is in general acceptable under small-sized flash crowds [3], but degrades seriously under large-sized flash crowds [4]. In the latter case, a lot of users are congested and cannot watch the program normally. In this paper, we focus on studying a fundamental issue about the performance of a P2P live streaming system under flash crowds: How and to which degree it scales well to the size of flash crowd? Although earlier studies [5]–[7] have obtained some preliminary understandings of behavior of P2P live streaming system under flash crowds by measurements and analysis, a concise characterization of the maximal size of flash crowd that such a system can handle is still missing. In this paper, we answer these questions using mathematical analysis. The major contributions are as follows. • We build fluid-based models for P2P live streaming systems with and without admission control, respectively. These models establish the relationship between peer parameters (including number of startup peers, number of stable peers, and peer startup latency) and system parameters (including peer arriving rate, peer departure rate, and system upload bandwidth), and characterize the generic startup process of peers and the system stabilization process under flash crowds of various sizes. • For a system without admission control, we find that its capacity for handling flash crowds is limited and can be quantified by the maximum shock level of flash crowd that a system can sustain. The shock level of a flash crowd is defined to equal to the new peer arriving rate after the flash crowd occurs divided by the original peer arriving rate before the flash crowd occurs [8]. Beyond the capacity, the system collapses. Further, we find that this system capacity is independent of the system’s initial state (i.e., number of already online peers before the flash crowd), while power-law decreases with the departure rate of stable peer. We also establish the relation of flash crowd size to the worst-case peer startup latency and system recovery time. Accordingly, given the maximum allowable peer startup latency, we can find the maximum shock level of flash crowd that a system can support.
Transcript of Performance Modeling and Evaluation of Peer-to-Peer Live Streaming Systems under Flash Crowds
IEEE/ACM TRANSACTIONS ON NETWORKING, VOL. XX, NO. XX, XXX 2013 1
Performance Modeling and Evaluation ofPeer-to-Peer Live Streaming Systems under Flash
CrowdsYishuai Chen, Baoxian Zhang, Senior Member, IEEE, Changjia Chen, Senior Member, IEEE,
and Dah Ming Chiu, Fellow, IEEE
Abstract—A Peer-to-Peer (P2P) live streaming system faces abig challenge under flash crowds. When a flash crowd occurs,the sudden arrival of numerous peers may starve the uploadcapacity of the system, hurt its quality of service, and evencause system collapse. This paper provides a comprehensive studyon the performance of P2P live streaming systems under flashcrowds. By modeling the systems using fluid model, we study thesystem capacity, peer startup latency, and system recovery timeof systems with and without admission control for flash crowds,respectively. Our study demonstrates that, without admissioncontrol, a P2P live streaming system has limited capacity tohandle flash crowds. We quantify this capacity by the largestflash crowd (measured in shock level) that the system canhandle, and further find this capacity is independent of systeminitial state while decreases as departure rate of stable peerincreases, in a power law relationship. We also establish themathematical relationship of flash crowd size to the worst-casepeer startup latency and system recovery time. For a systemwith admission control, we prove that it can recover stabilityunder flash crowds of any sizes. Moreover, its worst-case peerstartup latency and system recovery time increase logarithmicallywith the flash crowd size. Based on the analytical results, wepresent detailed flash crowd handling strategies, which can beused to achieve satisfying peer startup performance while keepingsystem stability in the presence of flash crowds under differentcircumstances.
Index Terms—Modeling, Flash crowd, Streaming media,Videos, Peer-to-Peer.
I. INTRODUCTION
AS Peer-to-Peer (P2P) live streaming systems becomepopular over the Internet [1], study on the performance of
such systems under flash crowds is becoming critical. A flash
Manuscript received March 15, 2005; revised October 26, 2012 and Febuary4, 2013; accepted June 3, 2013; approved by IEEE/ACM TRANSACTIONSON NETWORKING Editor T. Bonald. Date of publication xx xx, 2013; date ofcurrent version xx xx, xxxx. This work was supported by NSF of China underGrants 61271199, 61173158, 61101133, HK RGC Grant 411508, NationalKey Special Program of China under Grant No.2010ZX03006-001-02, andFundamental Research Funds in Beijing Jiaotong University under GrantW11JB00630.
Y. Chen and C. Chen are with the School of Electrical and InformationEngineering, Beijing Jiaotong University, Beijing, 100044, China (e-mail:[email protected], [email protected]).
B. Zhang is with the Research Center of Ubiquitous Sensor Networks,University of Chinese Academy of Sciences, Beijing, 100049, China (e-mail:[email protected]).
D. M. Chiu is with the Department of Information Engineering, The ChineseUniversity of Hong Kong, Hong Kong (e-mail: [email protected]).
Color versions of one or more of the figures in this paper are availableonline at http://ieeexplore.ieee.org.
Digital Object Identifier xx.xxxx/TNET.xxxx.xxxxxxx
crowd is a sudden arrival of numerous peers at a system. Itis typically triggered by popular programs that cause a surgeof users to join the system at scheduled time [2]. Existingmeasurement results on commercial P2P live streaming sys-tems (e.g., UUSee [3], CoolStreaming [4]) indicate that theperformance of such systems is in general acceptable undersmall-sized flash crowds [3], but degrades seriously underlarge-sized flash crowds [4]. In the latter case, a lot of usersare congested and cannot watch the program normally.
In this paper, we focus on studying a fundamental issueabout the performance of a P2P live streaming system underflash crowds: How and to which degree it scales well to thesize of flash crowd? Although earlier studies [5]–[7] haveobtained some preliminary understandings of behavior of P2Plive streaming system under flash crowds by measurementsand analysis, a concise characterization of the maximal sizeof flash crowd that such a system can handle is still missing.In this paper, we answer these questions using mathematicalanalysis. The major contributions are as follows.
• We build fluid-based models for P2P live streamingsystems with and without admission control, respectively.These models establish the relationship between peerparameters (including number of startup peers, numberof stable peers, and peer startup latency) and systemparameters (including peer arriving rate, peer departurerate, and system upload bandwidth), and characterizethe generic startup process of peers and the systemstabilization process under flash crowds of various sizes.
• For a system without admission control, we find that itscapacity for handling flash crowds is limited and can bequantified by the maximum shock level of flash crowdthat a system can sustain. The shock level of a flashcrowd is defined to equal to the new peer arriving rateafter the flash crowd occurs divided by the original peerarriving rate before the flash crowd occurs [8]. Beyondthe capacity, the system collapses. Further, we find thatthis system capacity is independent of the system’s initialstate (i.e., number of already online peers before the flashcrowd), while power-law decreases with the departurerate of stable peer. We also establish the relation of flashcrowd size to the worst-case peer startup latency andsystem recovery time. Accordingly, given the maximumallowable peer startup latency, we can find the maximumshock level of flash crowd that a system can support.
2 IEEE/ACM TRANSACTIONS ON NETWORKING, VOL. XX, NO. XX, XXX 2013
• For a system with admission control, we prove that itcan recover stability under flash crowds of any sizes, andthe worst-case peer startup latency and system recoverytime increase logarithmically with the size of flash crowd,which shows the superiority of admission control to helpa system sustain large flash crowds.
• We conduct simulations to validate the analytical results.Based on these analytical results, we further discuss somemajor considerations in designing flash crowd handlingstrategies and present detailed flash crowd handling algo-rithms for various situations.
The rest of this paper is organized as follows. SectionII reviews related work. Section III introduces the problemscaused by flash crowds. Sections IV and V build fluid-based models to characterize peers’s startup process underflash crowds in P2P live streaming systems without andwith admission control, respectively, and study the systemperformance with the models. Section VI conducts simulationsto validate the derived models. Section VII presents severalflash crowd handling strategies based on the derived analysisresults. Section VIII concludes the paper.
II. RELATED WORKS
Although much work has been done regarding how tohandle flash crowds in web services [8]–[10] and P2P filesharing applications [11], how a P2P live streaming systemperforms under flash crowds has not received enough attention.The limited existing work left certain fundamental questionsunanswered. In the following, we will respectively reviewexisting work for handling flash crowds in the fields of P2Pfile sharing, website accessing, and P2P live streaming, andcompare our work with existing work.
P2P file sharing applications such as BitTorrent were provento be remarkably robust and scalable under flash crowds [11]–[13]. Inspired by these results, some recent work proposed touse P2P networking to help web sites to handle flash crowds.For instance, the Backslash system [14] is a collaborativeweb mirroring system to protect web sites participating inthe system from significant performance degradation in thepresence of flash crowds. Rubenstein et al. proposed to useP2P-based caching systems for the same purpose [15], [16].In a P2P live streaming system, however, this extraordinarysystem scalability under flash crowds is not a matter of fact dueto the stringent real-time requirement in terms of peer startuplatency. We will elaborate these reasons in Section III.B.
Content Distribution Network (CDN) is an approach com-monly used for shortening the accessing time of websites [17].CDN replicates a web server’s contents at various locations inthe Internet and redirects users to local replicas. Similarly,some commercial P2P live streaming systems have also usedCDN to help content distribution [4]. However, it is noteconomical to deploy so much redundant system resource toa level high enough to handle the peak demand that appearsonly under flash crowds, which lasts for a short time. Hence,this paper focuses on studying a P2P live streaming system’sinherent ability to handle flash crowds.
For P2P live streaming applications, Leighton claimed that aP2P live streaming system may abruptly degrade under a flash
crowd as the suddenly-increased join requests may outstripthe uploading capacity of already online peers in the system[17]. However, Leighton did not provide theoretical proof orexperimental evidences to support this claim. In this paper,we prove that the capacity of a P2P live streaming system tohandle flash crowds is limited via theoretical analysis.
P2P live streaming systems can be categorized into twotypes [18]: tree-based and mesh-based, according to theirunderlying overlay networking architectures. In a tree-basedsystem, streaming data are disseminated on single or multipledissimilar trees. In a mesh-based system, however, data aredisseminated in a less structured manner. Seibert et al. [5]found that mesh-based systems are more adaptive than tree-based systems under flash crowds as the topologies of mesh-based systems are more flexible. In this paper, we consider thesystem residual uploading bandwidth allocation problem facedby a P2P live streaming system when a flash crowd occurs,assuming the system can resolve the topology managementproblem properly. Thus, our analytical results are applicablefor both tree-based systems and mesh-based systems.
P2P streaming systems can also be categorized as eitherchunk-based or substream-based, based on how media con-tents are divided. In a chunk-based system [1], [19], mediacontents are broken down into chunks, and each chunk istransferred in the network independently, like what is done bythe swarming data transfer technology in BitTorrent [20]. In asubstream-based system, however, media contents are split intosubstreams and each substream is propagated independentlyin the Internet [21], [22]. Previous work [6], [7] studyingthe performance of systems under flash crowds focused onsubstream-based systems. In reality, however, many popularP2P live streaming systems are chunk-based, such as PPLive[20] and PPStream [23]. For this reason, this paper focuses onstudying chunk-based systems and fills this gap up.
Fluid model is an important modeling approach to analyzethe performance of P2P systems. Qiu et al. [24] introducedthis method in their seminal work to analyze P2P file sharingapplications. Inspired by [24], in this paper, we use fluid modelto investigate the performance of P2P live streaming systemsunder flash crowds. Specifically, we study the case in whichnewly-arrived peers do not serve other peers temporarily untilthey obtain a certain amount of content. This case has notbeen extensively studied in [24] because it is not a realisticcase in P2P file sharing. In P2P live streaming, however, it isrealistic. We will further elaborate the reasons in Section III.B.To the best of our knowledge, this is the first study of P2Plive streaming systems under flash crowds using fluid model.
Admission control is a commonly used method for prevent-ing websites or streaming systems from being overloaded.There are in general two major strategies for performingadmission control [25]: reject excessive incoming requestsimmediately or hold them temporarily until vacant systemresources appear and then admit them to join. The formerstrategy is not friendly to users. Thus, we focus on studying thelatter strategy. We will evaluate an admission control methodas follows: The system does not reject newly-arrived peers butadmits them in a way such that the sum of the downlink ratesof those newly-admitted (while not stable yet) peers always

CHEN et al.: PERFORMANCE MODELING AND EVALUATION OF PEER-TO-PEER LIVE STREAMING SYSTEMS UNDER FLASH CROWDS 3
equals to the system’s residual upload bandwidth, until nopeer is waiting for admission. This admission control methodis different from the slot-based admission control methodused for substream-based P2P live streaming systems [6],[7] and BitTorrent-like P2P Video-on-Demand (VoD) systems[26]. In the slot-based method in the above work, newly-arrived peers are admitted on a per-slot basis. In each slot,the system (usually, the tracker server) admits n newly-arrivedpeers, where n equals to the system’s residual upload capacitydivided by the streaming rate. Then, these n peers get theirwanted video contents and finish their startup in this slot.Refs. [6], [7], [26] then model and analyze how many slotsare needed to admit all the newly-arrived peers of a flashcrowd. One big issue associated with the slot-based model isthe difficulty for the tracker server (or something with similarfunction in the system) to accurately estimate the optimal slotlength, which can be affected by the (worst-case) end-to-enddelay among peers, which, however, is usually unknown tothe tracker server. Such an estimation, however, is criticalsince longer slots mean larger startup latency while shorterslots may make the system unstable. Moreover, Refs. [6],[7], [26] only analyzed systems with admission control anddid not study systems without admission control. In practice,however, as shown by existing measurement results [3], [4],most commercial live streaming systems have not deployedadmission control algorithms. Thus, the study of systemswithout admission control and their inherent ability to handleflash crowds is highly desirable. To the best of our knowledge,this is the first study on P2P live streaming systems withoutadmission control under flash crowds.
III. PRELIMINARIES
In this section, we first introduce preliminary knowledgeregarding P2P live streaming systems and flash crowds, andthen discuss the problems caused by flash crowds. Symbolsand notations used in this paper are summarized in Table I.
A. System-related Background
In this paper, we study chunk-based P2P live streamingsystems due to their high popularity in the Internet. In suchsystems, media contents are broken down into a large numberof small chunks. A peer saves received chunks in a smalllocal buffer. The buffer only stores the latest 10s-100s’ mediacontents, as in a live streaming system a media chunk quicklybecomes outdated and hence can be purged from the system. Insuch a small buffer, received chunks are reordered, assembled,and sent to media player program. Each peer maintains theinformation about chunks available for sharing, referred to aswindow of chunk availability. These chunks are propagatedin the network in a swarming pattern, i.e., peers receiving achunk serve as proxies that forward it to other peers.
B. Flash Crowds
We model a flash crowd as a phenomenon that the rate atwhich peers arrives at a system suddenly jumps to a higherrate and keeps at this rate for a certain long period of time
TABLE ISYMBOL LIST
Symbols Definitionsc A stable peer’s residual upload bandwidth for it to serve startup
peers, measured in the number of chunks per seconds(t) A startup peer’s downloading ratets System recovery timeT Peer startup latency for a system working in the residual-
bandwidth-abundant (RBA) state. It is a constant.λ(t) Peer arriving rate at time t
λ0 Peer arriving rate before a flash crowdλ1 Peer arriving rate after a flash crowdv Shock level of a flash crowd, which is equal to λ1/λ0
V RBAm The maximum shock level of flash crowd under which a system
can keep working in RBA state after a flash crowdVm The maximum shock level of flash crowd under which a system
can recover stability from RBIA state, which reflects a system’scapacity for handling large flash crowds
w(t) Number of waiting peers, which have arrived but not beenadmitted to join a system yet at time t
w0 Number of waiting peers in a system when a flash crowd occursx(t) Number of startup peers in a system at time t
x0 Number of startup peers in a system when a flash crowd occursx1 Number of startup peers in a system when it reaches a new
steady state after a flash crowdy(t) Number of stable peers in a system at time t
y0 Number of stable peers in a system when a flash crowd occursy1 Number of stable peers in a system when it reaches its new
steady state after a flash crowd occursη0 Number of chunks a startup peer must fetch to become a stable
peerµ Departure rate of a stable peerτ(t) Arrival time of a peer that finishes its startup at time t
φ(t) Peer startup rate, at which startup peers become stable peers attime t
(e.g., a few minutes). This model has also been used in [7]to evaluate the performance of P2P live streaming systemsunder flash crowds. To characterize the size of a flash crowd,we use two metrics: 1) The new peer arriving rate after theflash crowd occurs, denoted by λ1; 2) The shock level of theflash crowd (denoted by v), which equals to λ1 divided bythe original peer arriving rate before the flash crowd (denotedby λ0). We have v = λ1/λ0. Thus, v describes the differencebetween the peer arrival rates before and after a flash crowd,while λ1 describes the actual peer arrival rate associated witha flash crowd. In this paper, whether a flash crowd can besaid “large” is relative and evaluated based on its shock levelv instead of its actual peer arrival rate λ1. When λ0 is notspecified, a large flash crowd means a high shock level; Whenλ0 is given, a large flash crowd means not only a high shocklevel but also a λ1 significantly larger than λ0.
P2P live streaming has some unique requirements differentfrom other P2P applications (e.g., file sharing and video-on-demand), which make the design of such systems to handleflash crowds challenging. The problems are listed as follows.
First, P2P live streaming systems have stringent requirementin terms of peer startup latency. This requirement is difficultto be met under flash crowds. Specifically, unlike a user offile sharing applications who can spend hours or even days to
4 IEEE/ACM TRANSACTIONS ON NETWORKING, VOL. XX, NO. XX, XXX 2013
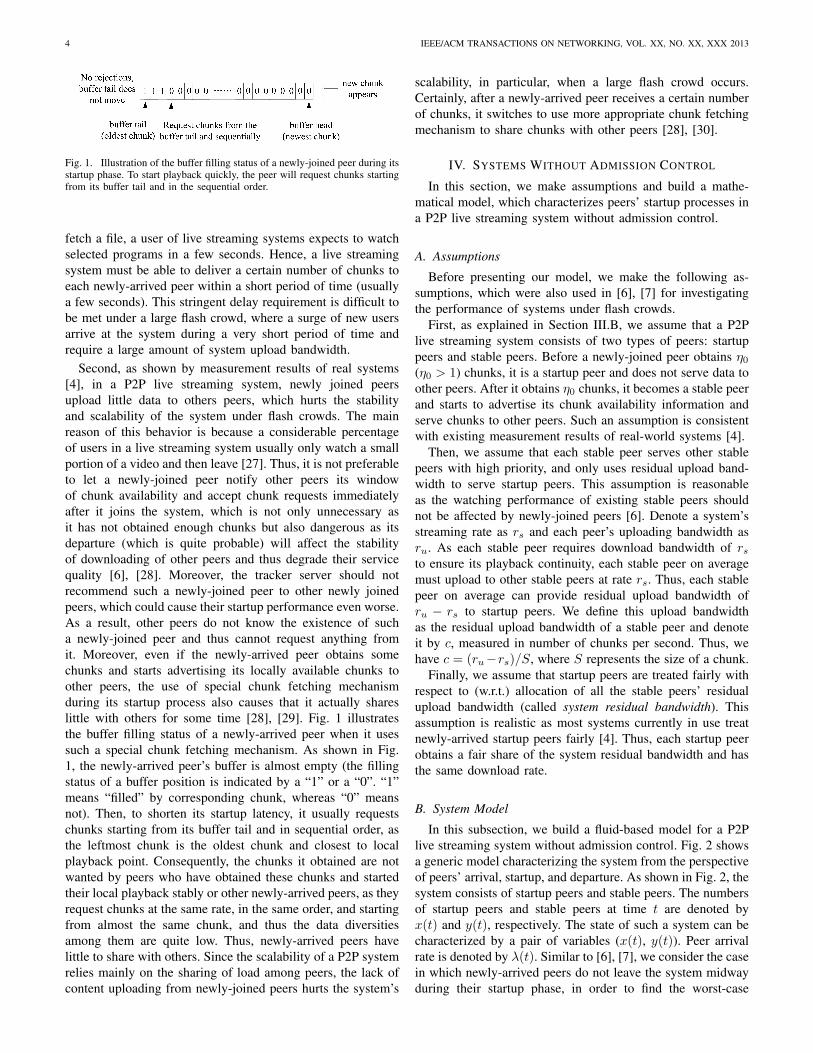
Fig. 1. Illustration of the buffer filling status of a newly-joined peer during itsstartup phase. To start playback quickly, the peer will request chunks startingfrom its buffer tail and in the sequential order.
fetch a file, a user of live streaming systems expects to watchselected programs in a few seconds. Hence, a live streamingsystem must be able to deliver a certain number of chunks toeach newly-arrived peer within a short period of time (usuallya few seconds). This stringent delay requirement is difficult tobe met under a large flash crowd, where a surge of new usersarrive at the system during a very short period of time andrequire a large amount of system upload bandwidth.
Second, as shown by measurement results of real systems[4], in a P2P live streaming system, newly joined peersupload little data to others peers, which hurts the stabilityand scalability of the system under flash crowds. The mainreason of this behavior is because a considerable percentageof users in a live streaming system usually only watch a smallportion of a video and then leave [27]. Thus, it is not preferableto let a newly-joined peer notify other peers its windowof chunk availability and accept chunk requests immediatelyafter it joins the system, which is not only unnecessary asit has not obtained enough chunks but also dangerous as itsdeparture (which is quite probable) will affect the stabilityof downloading of other peers and thus degrade their servicequality [6], [28]. Moreover, the tracker server should notrecommend such a newly-joined peer to other newly joinedpeers, which could cause their startup performance even worse.As a result, other peers do not know the existence of sucha newly-joined peer and thus cannot request anything fromit. Moreover, even if the newly-arrived peer obtains somechunks and starts advertising its locally available chunks toother peers, the use of special chunk fetching mechanismduring its startup process also causes that it actually shareslittle with others for some time [28], [29]. Fig. 1 illustratesthe buffer filling status of a newly-arrived peer when it usessuch a special chunk fetching mechanism. As shown in Fig.1, the newly-arrived peer’s buffer is almost empty (the fillingstatus of a buffer position is indicated by a “1” or a “0”. “1”means “filled” by corresponding chunk, whereas “0” meansnot). Then, to shorten its startup latency, it usually requestschunks starting from its buffer tail and in sequential order, asthe leftmost chunk is the oldest chunk and closest to localplayback point. Consequently, the chunks it obtained are notwanted by peers who have obtained these chunks and startedtheir local playback stably or other newly-arrived peers, as theyrequest chunks at the same rate, in the same order, and startingfrom almost the same chunk, and thus the data diversitiesamong them are quite low. Thus, newly-arrived peers havelittle to share with others. Since the scalability of a P2P systemrelies mainly on the sharing of load among peers, the lack ofcontent uploading from newly-joined peers hurts the system’s
scalability, in particular, when a large flash crowd occurs.Certainly, after a newly-arrived peer receives a certain numberof chunks, it switches to use more appropriate chunk fetchingmechanism to share chunks with other peers [28], [30].
IV. SYSTEMS WITHOUT ADMISSION CONTROL
In this section, we make assumptions and build a mathe-matical model, which characterizes peers’ startup processes ina P2P live streaming system without admission control.
A. Assumptions
Before presenting our model, we make the following as-sumptions, which were also used in [6], [7] for investigatingthe performance of systems under flash crowds.
First, as explained in Section III.B, we assume that a P2Plive streaming system consists of two types of peers: startuppeers and stable peers. Before a newly-joined peer obtains η0(η0 > 1) chunks, it is a startup peer and does not serve data toother peers. After it obtains η0 chunks, it becomes a stable peerand starts to advertise its chunk availability information andserve chunks to other peers. Such an assumption is consistentwith existing measurement results of real-world systems [4].
Then, we assume that each stable peer serves other stablepeers with high priority, and only uses residual upload band-width to serve startup peers. This assumption is reasonableas the watching performance of existing stable peers shouldnot be affected by newly-joined peers [6]. Denote a system’sstreaming rate as rs and each peer’s uploading bandwidth asru. As each stable peer requires download bandwidth of rsto ensure its playback continuity, each stable peer on averagemust upload to other stable peers at rate rs. Thus, each stablepeer on average can provide residual upload bandwidth ofru − rs to startup peers. We define this upload bandwidthas the residual upload bandwidth of a stable peer and denoteit by c, measured in number of chunks per second. Thus, wehave c = (ru−rs)/S, where S represents the size of a chunk.
Finally, we assume that startup peers are treated fairly withrespect to (w.r.t.) allocation of all the stable peers’ residualupload bandwidth (called system residual bandwidth). Thisassumption is realistic as most systems currently in use treatnewly-arrived startup peers fairly [4]. Thus, each startup peerobtains a fair share of the system residual bandwidth and hasthe same download rate.
B. System Model
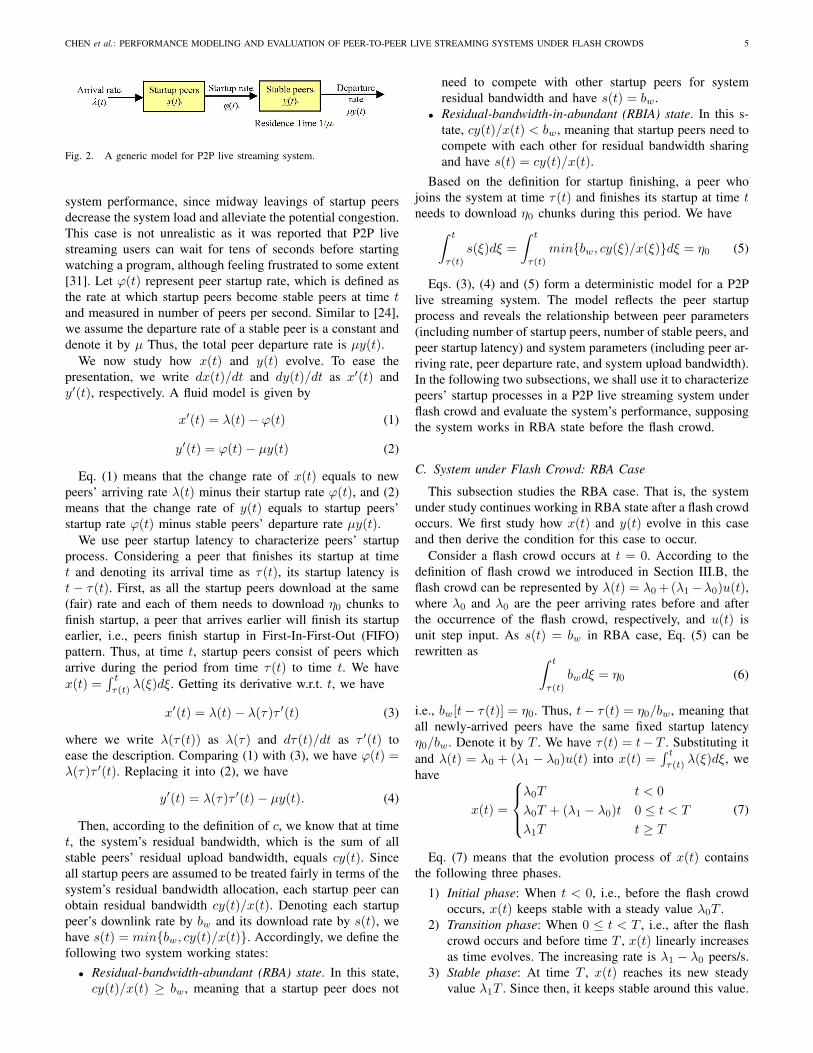
In this subsection, we build a fluid-based model for a P2Plive streaming system without admission control. Fig. 2 showsa generic model characterizing the system from the perspectiveof peers’ arrival, startup, and departure. As shown in Fig. 2, thesystem consists of startup peers and stable peers. The numbersof startup peers and stable peers at time t are denoted byx(t) and y(t), respectively. The state of such a system can becharacterized by a pair of variables (x(t), y(t)). Peer arrivalrate is denoted by λ(t). Similar to [6], [7], we consider the casein which newly-arrived peers do not leave the system midwayduring their startup phase, in order to find the worst-case
CHEN et al.: PERFORMANCE MODELING AND EVALUATION OF PEER-TO-PEER LIVE STREAMING SYSTEMS UNDER FLASH CROWDS 5
Fig. 2. A generic model for P2P live streaming system.
system performance, since midway leavings of startup peersdecrease the system load and alleviate the potential congestion.This case is not unrealistic as it was reported that P2P livestreaming users can wait for tens of seconds before startingwatching a program, although feeling frustrated to some extent[31]. Let φ(t) represent peer startup rate, which is defined asthe rate at which startup peers become stable peers at time tand measured in number of peers per second. Similar to [24],we assume the departure rate of a stable peer is a constant anddenote it by µ Thus, the total peer departure rate is µy(t).
We now study how x(t) and y(t) evolve. To ease thepresentation, we write dx(t)/dt and dy(t)/dt as x′(t) andy′(t), respectively. A fluid model is given by
x′(t) = λ(t)− φ(t) (1)
y′(t) = φ(t)− µy(t) (2)
Eq. (1) means that the change rate of x(t) equals to newpeers’ arriving rate λ(t) minus their startup rate φ(t), and (2)means that the change rate of y(t) equals to startup peers’startup rate φ(t) minus stable peers’ departure rate µy(t).
We use peer startup latency to characterize peers’ startupprocess. Considering a peer that finishes its startup at timet and denoting its arrival time as τ(t), its startup latency ist − τ(t). First, as all the startup peers download at the same(fair) rate and each of them needs to download η0 chunks tofinish startup, a peer that arrives earlier will finish its startupearlier, i.e., peers finish startup in First-In-First-Out (FIFO)pattern. Thus, at time t, startup peers consist of peers whicharrive during the period from time τ(t) to time t. We havex(t) =
∫ t
τ(t)λ(ξ)dξ. Getting its derivative w.r.t. t, we have
x′(t) = λ(t)− λ(τ)τ ′(t) (3)
where we write λ(τ(t)) as λ(τ) and dτ(t)/dt as τ ′(t) toease the description. Comparing (1) with (3), we have φ(t) =λ(τ)τ ′(t). Replacing it into (2), we have
y′(t) = λ(τ)τ ′(t)− µy(t). (4)
Then, according to the definition of c, we know that at timet, the system’s residual bandwidth, which is the sum of allstable peers’ residual upload bandwidth, equals cy(t). Sinceall startup peers are assumed to be treated fairly in terms of thesystem’s residual bandwidth allocation, each startup peer canobtain residual bandwidth cy(t)/x(t). Denoting each startuppeer’s downlink rate by bw and its download rate by s(t), wehave s(t) = min{bw, cy(t)/x(t)}. Accordingly, we define thefollowing two system working states:
• Residual-bandwidth-abundant (RBA) state. In this state,cy(t)/x(t) ≥ bw, meaning that a startup peer does not
need to compete with other startup peers for systemresidual bandwidth and have s(t) = bw.
• Residual-bandwidth-in-abundant (RBIA) state. In this s-tate, cy(t)/x(t) < bw, meaning that startup peers need tocompete with each other for residual bandwidth sharingand have s(t) = cy(t)/x(t).
Based on the definition for startup finishing, a peer whojoins the system at time τ(t) and finishes its startup at time tneeds to download η0 chunks during this period. We have∫ t
τ(t)
s(ξ)dξ =
∫ t
τ(t)
min{bw, cy(ξ)/x(ξ)}dξ = η0 (5)
Eqs. (3), (4) and (5) form a deterministic model for a P2Plive streaming system. The model reflects the peer startupprocess and reveals the relationship between peer parameters(including number of startup peers, number of stable peers, andpeer startup latency) and system parameters (including peer ar-riving rate, peer departure rate, and system upload bandwidth).In the following two subsections, we shall use it to characterizepeers’ startup processes in a P2P live streaming system underflash crowd and evaluate the system’s performance, supposingthe system works in RBA state before the flash crowd.
C. System under Flash Crowd: RBA Case
This subsection studies the RBA case. That is, the systemunder study continues working in RBA state after a flash crowdoccurs. We first study how x(t) and y(t) evolve in this caseand then derive the condition for this case to occur.
Consider a flash crowd occurs at t = 0. According to thedefinition of flash crowd we introduced in Section III.B, theflash crowd can be represented by λ(t) = λ0+(λ1−λ0)u(t),where λ0 and λ0 are the peer arriving rates before and afterthe occurrence of the flash crowd, respectively, and u(t) isunit step input. As s(t) = bw in RBA case, Eq. (5) can berewritten as ∫ t
τ(t)
bwdξ = η0 (6)
i.e., bw[t− τ(t)] = η0. Thus, t− τ(t) = η0/bw, meaning thatall newly-arrived peers have the same fixed startup latencyη0/bw. Denote it by T . We have τ(t) = t− T . Substituting itand λ(t) = λ0 + (λ1 − λ0)u(t) into x(t) =
∫ t
τ(t)λ(ξ)dξ, we
have
x(t) =
λ0T t < 0
λ0T + (λ1 − λ0)t 0 ≤ t < T
λ1T t ≥ T
(7)
Eq. (7) means that the evolution process of x(t) containsthe following three phases.
1) Initial phase: When t < 0, i.e., before the flash crowdoccurs, x(t) keeps stable with a steady value λ0T .
2) Transition phase: When 0 ≤ t < T , i.e., after the flashcrowd occurs and before time T , x(t) linearly increasesas time evolves. The increasing rate is λ1 − λ0 peers/s.
3) Stable phase: At time T , x(t) reaches its new steadyvalue λ1T . Since then, it keeps stable around this value.
6 IEEE/ACM TRANSACTIONS ON NETWORKING, VOL. XX, NO. XX, XXX 2013
Replacing τ(t) = t − T into φ(t) = λ(τ)τ ′(t), we haveφ(t) = λ(t− T ). Substituting it into (2), we have
y′(t) =
{λ0 − µy(t) t < T
λ1 − µy(t) t ≥ T(8)
Eq. (8) means that the dynamic process of y(t) can becharacterized by the following two phases.
1) Stable phase: When t < T , the equilibrium value ofy(t) is λ0/µ (by setting y′(t) = λ0 − µy(t) = 0, wehave y(t) = λ0/µ). As real-world measurement resultsshow that a system can work in steady state in normalsituation [1], we approximately set y(t) = λ0/µ, t < T .
2) Transition phase: When t ≥ T , the solution of y′(t) =λ1 − µy(t) is y(t) = e−µt(
∫λ1e
µtdt + C) = λ1/µ +Ce−µt, where C is a constant and is determined bythe initial value of y(t). Recalling y(T ) = λ0/µ, wehave C = (λ0 − λ1)e
µT /µ. Thus, y(t) = λ1/µ −(λ1 − λ0)e
−µ(t−T )/µ. Since limt→∞e−µ(t−T ) = 0,we have limt→∞y(t) = λ1/µ, meaning y(t) graduallyapproaches its new steady value λ1/µ.
In summary, we have
y(t) =
{λ0/µ t < T
λ1/µ− (λ1 − λ0)e−µ(t−T )/µ t ≥ T
(9)
We then derive the maximum size of flash crowd underwhich a system can keep working in RBA state, denotedby V RBA
m . As shown in (7) and (9), in [0, T ], x(t) linearlyincreases and y(t) keeps stable. Then, since T , x(t) keepsstable and y(t) keeps increasing. Thus, at time t = T ,cy(t)/x(t) has the minimal value. Thus, the condition that thesystem can keep working in RBA state under a flash crowdis that cy(T )/x(T ) ≥ bw. Replacing y(T ) = λ0/µ, x(T ) =λ1T, T = η0/bw into it, after simple mathematical transfor-mation, we have
λ1/λ0 ≤ c/(µη0) ⇒ V RBAm = c/(µη0) (10)
meaning that V RBAm is independent of λ0. Denote the initial
numbers of startup peers and stable peers when the flash crowdoccurs by x0 and y0, respectively. The system initial stateis (x0, y0). As shown in (7) and (9), x0 and y0 are decidedby λ0. Thus, Eq. (10) means that V RBA
m is independent ofthe system initial state (x0, y0). Further, as shown in (10),V RBAm is inversely proportional to stable peer’s departure rate
µ, meaning that a system can keep stability under larger flashcrowds if stable peers stay longer. We attribute this to the factthat stable peers staying longer contribute more.
We then use the models in (7) and (9) to study a P2P livestreaming system’s stabilization process in RBA case with realsystem parameter settings. For this purpose, we consider asystem with the following parameters, which are typical for areal-world P2P live streaming system.
• Peer departure rate µ = 0.05, which results in a meanstaying time of 20 seconds. This choice is made basedon observations from real system deployments wherein alarge majority of sessions are short sessions [14], [27].In the later studies in this paper, we will also use longerstaying time (e.g., µ = 0.005).
0 50 1000
50
100
150
200
Time (s)
Num
ber
of P
eers
Stable Peer: Simulation
Stable Peer: Modeling
Startup Peer: Simulation
Startup Peer: Modeling
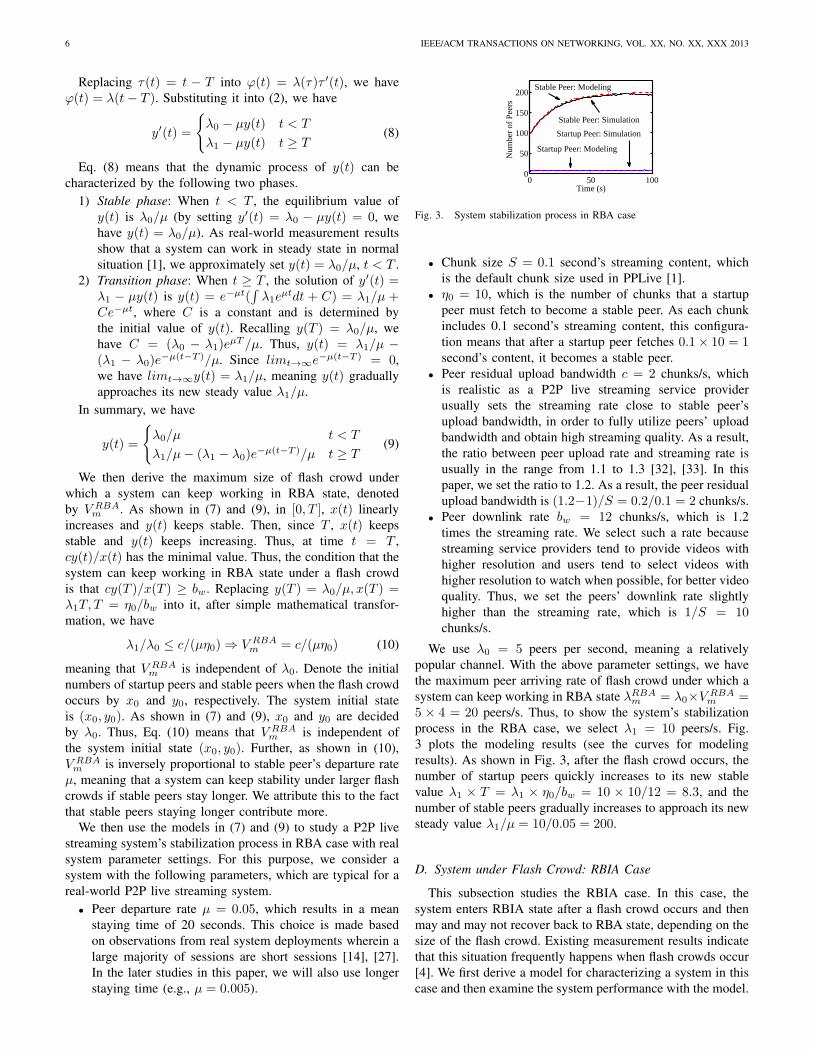
Fig. 3. System stabilization process in RBA case
• Chunk size S = 0.1 second’s streaming content, whichis the default chunk size used in PPLive [1].
• η0 = 10, which is the number of chunks that a startuppeer must fetch to become a stable peer. As each chunkincludes 0.1 second’s streaming content, this configura-tion means that after a startup peer fetches 0.1× 10 = 1second’s content, it becomes a stable peer.
• Peer residual upload bandwidth c = 2 chunks/s, whichis realistic as a P2P live streaming service providerusually sets the streaming rate close to stable peer’supload bandwidth, in order to fully utilize peers’ uploadbandwidth and obtain high streaming quality. As a result,the ratio between peer upload rate and streaming rate isusually in the range from 1.1 to 1.3 [32], [33]. In thispaper, we set the ratio to 1.2. As a result, the peer residualupload bandwidth is (1.2−1)/S = 0.2/0.1 = 2 chunks/s.
• Peer downlink rate bw = 12 chunks/s, which is 1.2times the streaming rate. We select such a rate becausestreaming service providers tend to provide videos withhigher resolution and users tend to select videos withhigher resolution to watch when possible, for better videoquality. Thus, we set the peers’ downlink rate slightlyhigher than the streaming rate, which is 1/S = 10chunks/s.
We use λ0 = 5 peers per second, meaning a relativelypopular channel. With the above parameter settings, we havethe maximum peer arriving rate of flash crowd under which asystem can keep working in RBA state λRBA
m = λ0×V RBAm =
5 × 4 = 20 peers/s. Thus, to show the system’s stabilizationprocess in the RBA case, we select λ1 = 10 peers/s. Fig.3 plots the modeling results (see the curves for modelingresults). As shown in Fig. 3, after the flash crowd occurs, thenumber of startup peers quickly increases to its new stablevalue λ1 × T = λ1 × η0/bw = 10 × 10/12 = 8.3, and thenumber of stable peers gradually increases to approach its newsteady value λ1/µ = 10/0.05 = 200.
D. System under Flash Crowd: RBIA Case
This subsection studies the RBIA case. In this case, thesystem enters RBIA state after a flash crowd occurs and thenmay and may not recover back to RBA state, depending on thesize of the flash crowd. Existing measurement results indicatethat this situation frequently happens when flash crowds occur[4]. We first derive a model for characterizing a system in thiscase and then examine the system performance with the model.
CHEN et al.: PERFORMANCE MODELING AND EVALUATION OF PEER-TO-PEER LIVE STREAMING SYSTEMS UNDER FLASH CROWDS 7
Consider a flash crowd occurs at time t = 0. As the systemworks in RBA state when the flash crowd occurs, we havecy(t)/x(t) ≥ bw when t = 0. We next analyze the system’sevolution process by the following five phases.
Phase 1: RBA phase. After the flash crowd occurs, x(t)increases as x(t) = λ0T + (λ1 − λ0)t (see (7) and y(t)keeps no change as y(t) = λ0/µ (see (9)). Thus, cy(t)/x(t)keeps decreasing. If cy(t)/x(t) drops below bw before timeT , the system enters RBIA state. Denoting the time whency(t)/x(t) drops to equal bw by T1, we have T1 < T andcy(T1)/x(T1) = bw. Replacing x(T1) = λ0T + (λ1 − λ0)T1
and y(T1) = λ0/µ into it, after simple mathematical transfor-mation, we have T1 = λ0(c − µη0)/[bwµ(λ1 − λ0)]. As thesystem works in RBA state when t ≤ T1, the startup latencyof a startup peer which finishes startup before time T1 is stillT . Thus, Phase 1 tells the startup process of peers arrivingbefore T1 − T .
Phase 2: Startup process of peers arriving during (T1−T , 0].As the peer arriving at time T1−T finishes its startup at timeT1 and peers finish startups in FIFO pattern, if a peer arrivingafter T1−T can finish startup, its startup finishing time t mustbe later than T1. Thus, such a peer’s downloading processconsists of the following two stages: 1) During (τ(t), T1], thesystem works in RBA state and the peer downloads with ratebw. 2) During (T1, t], the system works in RBIA state and thepeer has to download with rate cy(t)/x(t). Thus, Eq. (5) canbe rewritten as∫ t
τ(t)
s(ξ)dξ =
∫ T1
τ(t)
bwdξ +
∫ t
T1
cy(ξ)/x(ξ)dξ
= bw[T1 − τ(t)] +
∫ t
T1
cy(ξ)/x(ξ)dξ = η0.
Getting its derivative w.r.t. t, we have −bwτ′(t) +
cy(t)/x(t) = 0, i.e.,
τ ′(t) = cy(t)/[x(t)bw]. (11)
As we are studying peers arriving during (T1 − T, 0], wehave λ(τ) = λ0. Replacing it and (11) into (3) and (4), wehave
x′(t) = λ1 − λ0cy(t)/[x(t)bw] (12)
y′(t) = λ0cy(t)/[x(t)bw]− µy(t). (13)
Eqs. (11), (12), and (13) are a system of ordinary differentialequations (ODE), which represent the system evolution pro-cess for peers arriving during (T1−T, 0] to finish their startups(if possible). While the equations have irregular forms so thatwe cannot obtain close-form solutions of x(t), y(t), and τ(t)from them, we can resolve them by numerical method.
We next prove that, according to (12) and (13), x(t) keepsincreasing and y(t) keeps decreasing in Phase 2. Accordingly,the system keeps working in RBIA state in this Phase. For thispurpose, we first discuss the initial varying trends of x(t) andy(t) at t = T1. For x(t), as cy(T1)/x(T1) = bw, accordingto (12), we have x′(T1) = λ1 − λ0 > 0, meaning x(t) isincreasing when t = T1. Thus, we have x(T1 +∆t) > x(T1),∆t → 0. For y(t), we rewrite (13) as follows.
y′(t) = {λ0c/[x(t)bw]− µ}y(t) (14)
Since y(T1) = λ0/µ, replacing it into cy(T1)/x(T1) = bw,we have c(λ0/µ)/x(T1) = bw. After simple mathematicaltransformation, we have λ0c/[x(T1)bw] = µ. Replacing it into(14), we have y′(T1) = 0, meaning that y(t) does not changewhen t = T1. Thus, y(T1 + ∆t) = y(T1) = λ0/µ. As aresult, cy(T1 + ∆t)/x(T1 + ∆t) < cy(T1)/x(T1) = bw, i.e.,the system enters RBIA state since T1.
We then prove that x(t) is increasing while y(t) is decreas-ing when t = T1+∆t. For x(t), as the system is in RBIA stateat t = T1+∆t, i.e., cy(T1+∆t)/x(T1+∆t) < bw, accordingto (12), we have x′(T1 + ∆t) > λ1 − λ0 > 0, meaningx(t) is still increasing when t = T1 + ∆t. Thus, we havex(T1+2∆t) > x(T1+∆t) > x(T1). For y(t), as x(T1+∆t) >x(T1), we have λ0c/[x(T1 + ∆t)bw] < λ0c/[x(T1)bw] = µ.Thus, according to (14), we have y′(T1 +∆t) < 0, meaningy(t) is decreasing at T1 +∆t. Thus, we have y(T1 + 2∆t) <y(T1+∆t). As a result, we have cy(T1+2∆t)/x(T1+2∆t) <cy(T1 + ∆t)/x(T1 + ∆t) < cy(T1)/x(T1) = bw, i.e., thesystem is still in RBIA state at T1+2∆t. Following the abovederiving strategy, it can be proven that x(t) keeps increasingand y(t) keeps decreasing at t = T1 + 2∆t, T1 + 3∆t, . . .and the system keeps working in RBIA state, until the end ofPhase 2. The proof is now complete.
Thus, the system’s evolution process in Phase 2 has thefollowing two possibilities: 1) The size of flash crowd isextremely large so that the system collapses, i.e., the numberof stable peers drops to zero and remaining startup peers willnever finish their startups, meaning that the size of arrivingflash crowd has exceeded the system’s capacity for handlingflash crowds. 2) The number of stable peers, although keepsdecreasing, does not drop to zero at the end of Phase 2. Wenext focus on studying the second case to explore the largestflash crowd under which a system can recover to RBA state.Accordingly, the system enters the following Phase 3.
Phase 3: Startup process of peers arriving during (0,T1].As the system enters RBIA state at time T1, similar to thepeers arriving during (T1 − T ,0] which we studied in Phase2, peers arriving during (0,T1] also first download with ratebw when t < T1 and then download with rate cy(t)/x(t) afterT1. Thus, Eq. (11) is still applicable for these peers. Besides,as these peers arrive after t = 0, we have τ(t) > 0. Thus,λ(τ) = λ1. Replacing it and (11) into (3) and (4), we havex′(t) = λ1−λ1cy(t)/[x(t)bw] and y′(t) = λ1cy(t)/[x(t)bw]−µy(t). Similar to Phase 2, we can resolve them by numericalmethod.
After extensive experiments, we find that the system’s statehas the following three possibilities when Phase 3 terminates:1) One extreme case is that the shock level of flash crowdis extremely high so that y(t) drops to zero and the systemcollapses. 2) Another extreme case is that the flash crowd’sshock level v is just slightly higher than V RBA
m and the systemre-enters RBA state. 3) The flash crowd’s size is moderatelylarge such that the system is still working in RBIA state whenall the peers arriving during (0,T1] finish their startups. Next,instead of focusing on extremely large flash crowds (for thefirst case) or too moderate flash crowds (for the second case),we will study the third case to explore the largest flash crowdunder which a system can handle. Accordingly, the system

8 IEEE/ACM TRANSACTIONS ON NETWORKING, VOL. XX, NO. XX, XXX 2013
enters the following Phase 4.Phase 4: Startup process of peers arriving after T1 –
system still in RBIA state. For peers which arrive afterT1 and finish startup in this phase, they always down-load with rate cy(t)/x(t). Thus, Eq. (5) can be rewrittenas
∫ t
τ(t)cy(ξ)/x(ξ)dξ = η0. Getting its derivative w.r.t. t,
we have y(t)/x(t) − y(τ)τ ′(t)/x(τ) = 0, i.e., τ ′(t) =y(t)x(τ)/[x(t)y(τ)]. Replacing it and λ(τ) = λ1 (as τ(t) > 0)into (3) and (4), we have x′(t) = λ1 −λ1y(t)x(τ)/[x(t)y(τ)]and y′(t) = λ1y(t)x(τ)/[x(t)y(τ)] − µy(t). These equationsare not ODEs, as an ODE should not include x(τ) and y(τ).Fortunately, in our problem, τ(t) is always smaller than t.Thus, we can resolve them by numerical method to obtainx(t), y(t), and τ(t). After extensive experiments, we findthe system’s evolution process have two possibilities: 1) thesystem collapses; 2) The system returns back to RBA state.In the latter case, the system enters the following Phase 5.
Phase 5: Startup process of peers arriving after T1 – systemin RBA state again. Denote the time when the system re-entersthe RBA state by T2. We have cy(T2)/x(T2) = bw. Thus, forpeers arriving during (τ(T2), T2), they first download with ratecy(t)/x(t) during (τ(t), T2] and then download with rate bwduring [T2, t]. Thus, Eq. (5) can be rewritten as∫ t
τ(t)
s(ξ)dξ =
∫ T2
τ(t)
cy(ξ)/x(ξ)dξ +
∫ t
T2
bwdξ
=
∫ T2
τ(t)
cy(ξ)/x(ξ)dξ + bw[t− T2] = η0.
Getting its derivative w.r.t. t, we have bw −cy(τ)τ ′(t)/x(τ) = 0, i.e., τ ′(t) = x(τ)bw/[cy(τ)].Replacing it and λ(τ) = λ1 (as τ(t) > 0) into (3)and (4), we have x′(t) = λ1 − λ1x(τ)bw/[cy(τ)] andy′(t) = λ1x(τ)bw/[cy(τ)] − µy(t). Similar to Phase 4, wecan resolve them by numerical method.
For peers arriving after T2, as they always download withrate bw, Eq. (6) is applicable again. Thus, we have t− τ(t) =η0/bw, meaning that they have fixed startup latency T again.Accordingly, we have τ ′(t) = 1. Replacing it and λ(τ) = λ1
(as τ(t) > 0) into (3) and (4), we have x′(t) = 0, meaningthat x(t) enters its new steady state since then, and y′(t) =λ1 − µy(t), whose solution is y(t) = e−µt(
∫λ1e
µtdt+C) =λ1/µ + Ce−µt, where C is decided by the system state attime T2, meaning that the number of stable peers graduallyincreases to approach its new steady values λ1/µ.
We finally present the modeling results of the evolutionprocess for the system described in Section IV.C when it worksin the RBIA case. As λRBA
m = 20 peers/s, we select λ1 = 40peers/s and 80 peers/s, respectively, for study. We first presentthe modeling results for λ1 = 40 peers/s. The system evolutionprocess includes the following five phases:
1) Phase 1: t ≤ T1 = 0.36s. The system works in RBAstate. In this phase, x(t) keeps increasing and y(t) keepsconstant. Note that T1 < T = η0/bw = 10/12 = 0.83s.
2) Phase 2: During (0.36s, 1.2s], the system works in RBIAstate. x(t) keeps increasing and y(t) keeps decreasing.When t = 1.2s, the peer arriving at time t = 0 finishesits startup. At this time, x(t) = 48.11, y(t) = 98.18.
3) Phase 3: During (1.2s, 2.58s], the system still worksin RBIA state, but both x(t) and y(t) keep increasing.When t = 2.58s, the peer arriving at time T1 = 0.36sfinishes its startup. At this time, x(t) = 89.13 andy(t) = 105.38.
4) Phase 4: During (2.58s, 20.26s], the system still worksin RBIA state. During this process, x(t) first keepsincreasing during (2.58s, 15.5s]. At 15.5s, x(t) reachesits maximal value 380. Then, x(t) starts decreasing. Atthe same time, y(t) keeps increasing. When t = T2 =20.26s, x(t) = 102.81 and y(t) = 617.06, meaning thatcy(t)/x(t) = 2× 617.06/102.81 = 12 = bw.
5) Phase 5: After 20.26s, the system works in RBA s-tate. x(t) keeps decreasing during (20.26s, 21.09s]. At21.09s, the peer arriving at time T2 = 20.26s finishesits startup, and x(t) reaches its new steady value x1 =λ1T = λ1η0/bw = 40 × 10/12 = 33.33. At the sametime, y(t) keeps increasing and gradually approaches itsnew steady value y1 = λ1/µ = 40/0.05 = 800.
Fig. 4a plots the system evolution process for λ1 = 40peers/s (see the curves for the modeling results). As shownin Fig. 4a, after the flash crowd occurs, the number ofstartup peers keeps increasing until it reaches its maximalvalue 380 at 15.5s, indicating that a large number of newly-arrived peers are congested. This modeling result is consistentwith the measurement results reported in [4]. Fortunately, thenumber of stable peers also keeps increasing, meaning thatthe system’s residual upload bandwidth keeps increasing. As aresult, at 15.5s, the number of startup peers starts decreasing.Eventually, at 21.09s, all previously congested startup peersare drained out and the number of startup peers reaches itsnew steady value. This result shows that a P2P live streamingsystem has inherent capacity to recover stability under flashcrowds, even in RBIA case.
We then present the modeling results for λ1 = 80 peers/s.As shown in Fig. 4b, when the flash crowd occurs, the numberof startup peers keeps increasing and the number of stablepeers keeps decreasing until it drops to zero, i.e., the systemcollapses. Specifically, when t < T1 = (c−µη0)λ0/[bwµ(λ1−λ0)] = 0.17s, the system works in RBA state. After 0.17s,x(t) keeps increasing and y(t) keeps decreasing. When Phase2 ends at 5.72s, x(t) = 458.21 and y(t) = 78.44. When Phase3 ends at 18.66s, x(t) = 1479.76 and y(t) = 50.09. Then, y(t)drops to zero in Phase 4. This result shows that the capacityof the system to recover stability from flash crowds in RBIAcase is limited.
E. System Capacity to Handle Flash Crowds
Based on the models derived in the above subsection, thissubsection analyzes the capacity of a system to handle flashcrowds (i.e., without causing collapsing) and its relation tosystem initial state (i.e., the initial numbers of startup peersand stable peers) and stable peer’s departure rate. Again, weconsider the system described in Section IV.C. To find thecapacity of this system, we vary λ0 from 2 to 100 peers persecond. Then, for each λ0, we gradually increase λ1 withstep size of 0.1 peers/s, for observing the system’s evolution

CHEN et al.: PERFORMANCE MODELING AND EVALUATION OF PEER-TO-PEER LIVE STREAMING SYSTEMS UNDER FLASH CROWDS 9
0 20 40 60 80 1000
2
4
6
8
Time (s)
Num
ber
of P
eers
(×1
02 )
Stable Peer: Simulation
Stable Peer: Modeling
Startup Peer: Simulation
Startup Peer: Modeling
(a) λ1 = 40 peers/s
0 20 40 60 80 1000
2
4
6
8
Time (s)
Num
ber
of P
eers
(×1
03 )
Startup Peer: Modeling
Startup Peer: Simulation
Stable Peer: Simulation
Stable Peer: Modeling
(b) λ1 = 80 peers/s
Fig. 4. System evolution process in RBIA case.
process under flash crowds with different λ1. We also changethe value of µ to find the relation between the capacity andµ. We have the following three findings:
Finding 1: For a system with given λ0 and µ, it collapseswhen λ1 is larger than a certain value. When λ1 is lower thanthe value, however, the system can avoid collapse and recoverstability. We call this threshold of λ1 as the system’s maximumsupportable peer arrival rate and denote it as λm.
Finding 2: For a system with given µ, the maximum shocklevel of flash crowd under which a system can avoid collapseand recover stability is a constant and is independent of λ0.Denote it by Vm. As the system initial state (x0, y0) is decidedby λ0 (i.e., x0 = λ0T = λ0η0/bw and y0 = λ0/µ), Finding2 can be understood as that Vm is independent of the systeminitial state. Based on these considerations, it is natural for usto use Vm to quantify (represent) a system’s capacity to handleflash crowds.
According to Finding 2, we can answer the question raisedbut left open in [4] regarding the relationship between theinitial number of stable peers and the maximum supportablepeer arriving rate λm. Specifically, as λm = Vmλ0, Finding2 means that λm is proportional to λ0. Thus, Finding 2also means that λm is proportional to the initial system state(x0, y0), as the system initial state (x0, y0) is decided by λ0.Thus, a system with more initial startup and stable peerscan sustain flash crowds with higher λ1. Besides, Finding2 also enables us to estimate the performance of serverassisted method to handle flash crowds, according to whichextra assisting servers are utilized to serve newly-arrivedpeers to alleviate the effect of flash crowds. Specifically,the introduction of extra assisting servers is equivalent toincreasing the number of stable peers from the perspective ofincreasing system residual bandwidth. For example, supposethe uploading bandwidth of an assisting server is 1.2Mbpswhile the residual uploading bandwidth of a stable peer is80kbps. In this case, the introduction of an extra server canbe approximately seen as adding 1200/80 = 15 extra always-on-line stable peers into the system. This will be very helpfulfor system stabilization in the presence of a flash crowd whichcauses shortage of uploading resources. Note that the serverdoes not consume any uploading resources from stable peersin the system.
Finding 3: Vm decreases with the departure rate of stablepeer, and the relationship is power law. Table II shows the
TABLE IIVm FOR THE SYSTEM DESCRIBED IN SECTION IV.C WITH CHANGING µ.
µ Vm µ Vm µ Vm
0.05 10.09 0.025 26.94 0.009 102.450.04 14.01 0.02 35.94 0.00625 161.500.03 21.02 0.0125 67.45 0.0045 241.5
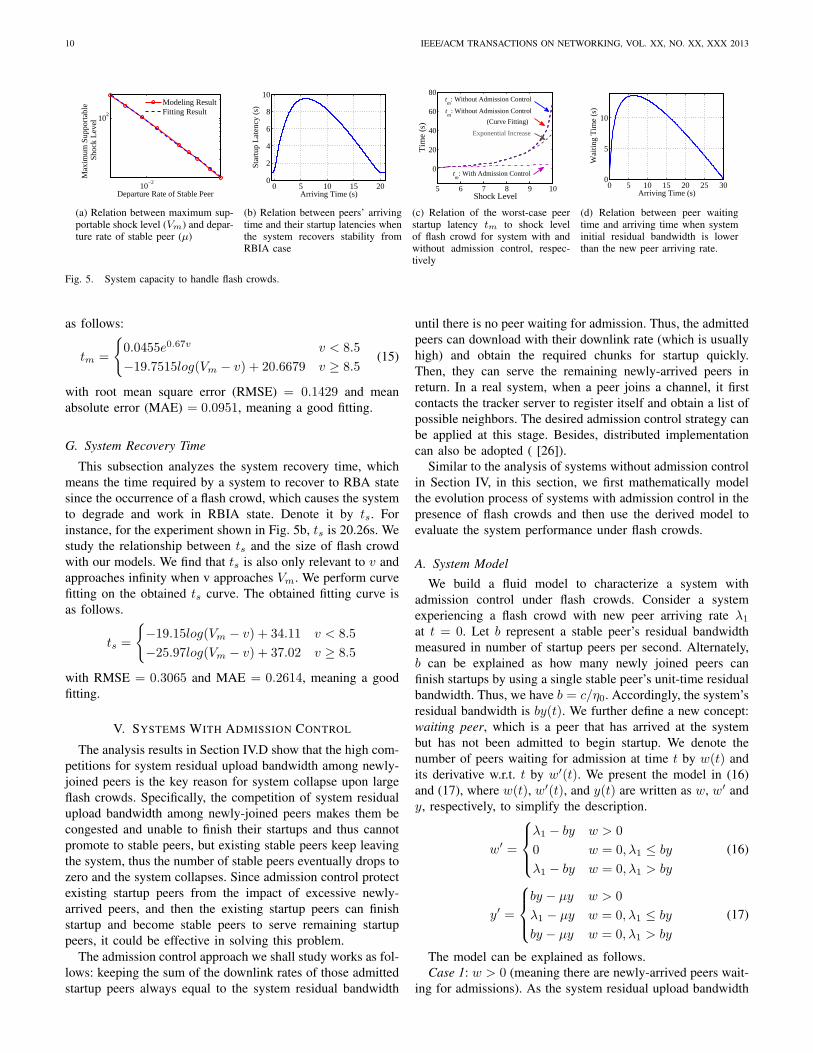
values of Vm for the system described in Section IV.C withdifferent µ. Fig. 5a plots the relation between Vm and µ aslisted in Table II on a log-log scale and shows a very straightline, which means that the relation between Vm and µ is powerlaw. We conduct linear regression on the modeling result andobtain a fitting curve Vm = 0.026µ−1.3 with R2 of 0.9994,meaning a perfect fit. This result means that a system canhandle larger flash crowds if its stable peers stay longer. Weattribute this to the fact that stable peers staying longer cancontribute more to newly joined peers.
F. Peer Startup Latency
This subsection studies the peer startup latency of a P2P livestreaming system under flash crowds. As explained in SectionIII.B, P2P live streaming systems have stringent real-timerequirement in terms of peer startup latency. Thus, if peersexperience too long startup latency when a flash crowd occurs,the system’s performance is also unacceptable. According toour models, we can resolve the equations and obtain τ(t)by numerical method. As τ(t) is the arriving time of thepeer who finishes its startup at time t, the peer’s startuplatency is t − τ(t). Fig. 5b plots the peer startup latencyt− τ(t) as a function of peer arrival time τ(t) for the systemdescribed in Fig. 4a. As shown in Fig. 5b, after the flashcrowd occurs, peers arriving after the occurrence of the flashcrowd experience longer startup latency, meaning that peers’startups are slowing down. Then, peers arriving after 5.97shave reduced startup latency, meaning that peers’ startups areaccelerated as the number of stable peers increases. Eventually,peers arriving after 20.26s (i.e., T2) can finish startup inconstant latency T = 0.83s again. Such results are consistentwith the system stabilization process shown in Fig. 4a.
We then evaluate the relationship between the size of flashcrowd and the worst-case peer startup latency, which reflectsthe longest time that newly-arrived peers take to finish startupafter a flash crowd occurs. Denote it by tm. As shown inFig. 5b, we have tm = 9.51s for the experiment and sucha latency is experienced by the peer which arrives at timeτ(t) = 5.97s. We find that tm is only relevant to the flashcrowd’s shock level v. Fig. 5c plots tm as a function of vfor the system described in Section IV.C. As shown in Fig.5c, without admission control, tm first increases exponentiallywith shock level v when v < 8.5. When v further increases, tmincreases more quickly than exponential increase. Further, asv approaches Vm (which is 10.09 for the system under study),the system approaches collapse (i.e., tm → ∞). We do curvefitting to the modeled tm curve. The obtained fitting curve is
10 IEEE/ACM TRANSACTIONS ON NETWORKING, VOL. XX, NO. XX, XXX 2013
10−2
102
Departure Rate of Stable Peer
Max
imum
Sup
port
able
S
hock
Lev
el
Modeling ResultFitting Result
(a) Relation between maximum sup-portable shock level (Vm) and depar-ture rate of stable peer (µ)
0 5 10 15 200
2
4
6
8
10
Arriving Time (s)
Star
tup
Lat
ency
(s)
(b) Relation between peers’ arrivingtime and their startup latencies whenthe system recovers stability fromRBIA case
5 6 7 8 9 10
0
20
40
60
80
Shock Level
Tim
e (s
)
tm
: With Admission Control
Exponential Increase
tm
: Without Admission Control
(Curve Fitting)
tm
: Without Admission Control
(c) Relation of the worst-case peerstartup latency tm to shock levelof flash crowd for system with andwithout admission control, respec-tively
0 5 10 15 20 25 300
5
10
Arriving Time (s)
Wai
ting
Tim
e (s
)
(d) Relation between peer waitingtime and arriving time when systeminitial residual bandwidth is lowerthan the new peer arriving rate.
Fig. 5. System capacity to handle flash crowds.
as follows:
tm =
{0.0455e0.67v v < 8.5
−19.7515log(Vm − v) + 20.6679 v ≥ 8.5(15)
with root mean square error (RMSE) = 0.1429 and meanabsolute error (MAE) = 0.0951, meaning a good fitting.
G. System Recovery Time
This subsection analyzes the system recovery time, whichmeans the time required by a system to recover to RBA statesince the occurrence of a flash crowd, which causes the systemto degrade and work in RBIA state. Denote it by ts. Forinstance, for the experiment shown in Fig. 5b, ts is 20.26s. Westudy the relationship between ts and the size of flash crowdwith our models. We find that ts is also only relevant to v andapproaches infinity when v approaches Vm. We perform curvefitting on the obtained ts curve. The obtained fitting curve isas follows.
ts =
{−19.15log(Vm − v) + 34.11 v < 8.5
−25.97log(Vm − v) + 37.02 v ≥ 8.5
with RMSE = 0.3065 and MAE = 0.2614, meaning a goodfitting.
V. SYSTEMS WITH ADMISSION CONTROL
The analysis results in Section IV.D show that the high com-petitions for system residual upload bandwidth among newly-joined peers is the key reason for system collapse upon largeflash crowds. Specifically, the competition of system residualupload bandwidth among newly-joined peers makes them becongested and unable to finish their startups and thus cannotpromote to stable peers, but existing stable peers keep leavingthe system, thus the number of stable peers eventually drops tozero and the system collapses. Since admission control protectexisting startup peers from the impact of excessive newly-arrived peers, and then the existing startup peers can finishstartup and become stable peers to serve remaining startuppeers, it could be effective in solving this problem.
The admission control approach we shall study works as fol-lows: keeping the sum of the downlink rates of those admittedstartup peers always equal to the system residual bandwidth
until there is no peer waiting for admission. Thus, the admittedpeers can download with their downlink rate (which is usuallyhigh) and obtain the required chunks for startup quickly.Then, they can serve the remaining newly-arrived peers inreturn. In a real system, when a peer joins a channel, it firstcontacts the tracker server to register itself and obtain a list ofpossible neighbors. The desired admission control strategy canbe applied at this stage. Besides, distributed implementationcan also be adopted ( [26]).
Similar to the analysis of systems without admission controlin Section IV, in this section, we first mathematically modelthe evolution process of systems with admission control in thepresence of flash crowds and then use the derived model toevaluate the system performance under flash crowds.
A. System Model
We build a fluid model to characterize a system withadmission control under flash crowds. Consider a systemexperiencing a flash crowd with new peer arriving rate λ1
at t = 0. Let b represent a stable peer’s residual bandwidthmeasured in number of startup peers per second. Alternately,b can be explained as how many newly joined peers canfinish startups by using a single stable peer’s unit-time residualbandwidth. Thus, we have b = c/η0. Accordingly, the system’sresidual bandwidth is by(t). We further define a new concept:waiting peer, which is a peer that has arrived at the systembut has not been admitted to begin startup. We denote thenumber of peers waiting for admission at time t by w(t) andits derivative w.r.t. t by w′(t). We present the model in (16)and (17), where w(t), w′(t), and y(t) are written as w, w′ andy, respectively, to simplify the description.
w′ =
λ1 − by w > 0
0 w = 0, λ1 ≤ by
λ1 − by w = 0, λ1 > by
(16)
y′ =
by − µy w > 0
λ1 − µy w = 0, λ1 ≤ by
by − µy w = 0, λ1 > by
(17)
The model can be explained as follows.Case 1: w > 0 (meaning there are newly-arrived peers wait-
ing for admissions). As the system residual upload bandwidth
CHEN et al.: PERFORMANCE MODELING AND EVALUATION OF PEER-TO-PEER LIVE STREAMING SYSTEMS UNDER FLASH CROWDS 11
has been fully utilized (otherwise there should be no peerswaiting for admission) and those admitted peers downloadwith their downlink rates, the peer startup rate φ(t) equalsto the system residual bandwidth by. Thus, the rate at whichw changes is w′ = λ1−φ(t) = λ1− by, and the rate at whichy changes is y′ = φ(t)− µy = by − µy.
Case 2: w = 0 (meaning there is no newly-arrived peerwaiting for admission) and λ1 ≤ by (meaning the system’sresidual bandwidth by is abundant such that it is not lower thanthe peer arriving rate λ1). Based on the definition of b, by isthe number of newly admitted peers which can become stablein unit time using the system’s residual bandwidth. Thus, λ1 ≤by means that the λ1 newly-arrived peers that arrive in unittime can become stable in unit time. Therefore, there is nopeer waiting for admission and w is always zero and w′ = 0,and the peer startup rate is equal to the peer arriving rate λ1.We have y′ = λ1 − µy.
Case 3: w = 0 and λ1 > by (meaning the system’s residualbandwidth by is not so abundant such that peer arriving rate λ1
exceeds it). Based on the definition of b, λ1 > by means that,among the λ1 newly-arrived peers arrive in unit time, only bypeers can finish startup and become stable and the remainingλ1−by peers have to wait for admission. Thus, the peer startuprate φ(t) is equal to the system residual bandwidth by. As aresult, w′ = λ1 − by and y′ = by − µy.
B. Performance Analysis
Based on the above model, we analyze the system perfor-mance under flash crowds.
1) System capacity to handle flash crowds: We first studyan admission-control-enabled system’s capacity to handle flashcrowds. The state of the system can be characterized by a pairof variables (w(t), y(t)). We have the following theorem.
Theorem 1: When b > µ, a P2P live streaming system withadmission control has superior scalability under flash crowds:It can drain out all waiting peers and recover to a new steadystate under flash crowds of any sizes, and the new systemsteady state is w = 0 and y = λ1/µ.
Proof: Consider a flash crowd occurring at t = 0and there have been some newly-arrived peers waiting foradmission at t = 0 (this is the worst case). Denoting theinitial value of the number of waiting peers by w0, we havew0 > 0. Since w0 > 0, according to (16) and (17), we havew′ = λ1 − by and y′ = by − µy. Since b > µ, we havey′ = by − µy > 0 and thus y = Ce(b−µ)t, where C is aconstant and determined by the initial value of y at t = 0.Thus, the number of stable peers y increases exponentially, andthe system’s residual bandwidth by increases exponentially aswell. As the initial value of stable peer number is y0, the initialsystem residual bandwidth is by0. We have the following twocases.
Case 1: λ1 ≤ by0, i.e., system initial residual bandwidthis higher than or equals to the new peer arriving. In thiscase, as y keeps increasing with time, we have y0 < y.Thus, λ1 ≤ by0 < by. Therefore, w′ = λ1 − by < 0,meaning that w keeps decreasing with time. Let ys representthe number of stable peers when w drops to 0 and call this
time as a transition time. When w drops to 0, as w = 0 andλ1 < bys, according to (17), we have y′ = λ1−µy. By simpleintegral calculation, we have y = λ1/µ + Ce−µt, where Cis a constant and determined by the initial value of y at thetransition time (i.e., ys). Thus, y → λ1/µ as t → ∞. Wenow proceed to prove that the peer arriving rate λ1 is alwayssmaller than the residual bandwidth by during this process:First, if ys > λ1/µ, y will monotonically decrease from ystowards λ1/µ and thus y > λ1/µ during this process. Asb > µ (see the precondition claimed in Theorem 1), we haveby > bλ1/µ > λ1. Second, if ys < λ1/µ, y will monotonicallyincrease from ys towards λ1/µ and thus y > ys during thisprocess. As λ1 < bys, we have λ1 < bys < by. Thus, wealways have w′ = 0 and y′ = λ1−µy after the transition time.Accordingly, the evolution of y(t) can always be representedby y = λ1/µ + Ce−µt, which means y → λ1/µ as t → ∞.Thus, Case 1 is established.
Case 2: λ1 > by0, i.e., system initial residual bandwidth islower than the new peer arriving rate. In this case, as λ1 > by0,we have w′ = λ1 − by0 > 0, meaning w keeps increasing.Simultaneously, as y′ = by − µy and b > µ, y increasesexponentially. When y eventually exceeds λ1/b, we have w′ =λ1 − by < λ1 − bλ1/b = 0, meaning that w starts decreasing.Since this time, the system dynamics will be similar to thatdescribed in Case 1. Thus, Case 2 is also established.
2) System stabilization process under flash crowds: In thissubsection, we obtain closed-form expressions of w(t) andy(t) when a flash crowd occurs, in order to characterize asystem’s stabilization process under a flash crowd. Assumethat a P2P live streaming system with admission control worksin the steady state w0 = 0 and y0 = λ0/µ when a flash crowdoccurs at time t = 0. This assumption is reasonable as provenin Theorem 1. We have the following two cases:
Case 1: λ1 ≤ by0. In the proof of Theorem 1 (see Case 1),we have shown that when the initial condition is w = 0 andλ1 ≤ bys (after the transition time), the evolution of systemstate is given by y = λ1/µ + Ce−µt and w = 0. In thecurrent case, we have similar initial condition (i.e., w0 = 0and λ1 ≤ by0) and thus have similar results, i.e., w = 0, andwith y0 = λ0/µ, we have C = λ0−λ1 and y = λ1/µ− (λ1−λ0)e
−µt/µ.Case 2: λ1 > by0. In the proof of Theorem 1 (see Case
2), we have known that there are two phases for this case.In the first phase, we have w′ = λ1 − by and y′ = by −µy. Resolving it with the initial condition w0 = 0 and y0 =λ0/µ, we have w(t) = λ1t−λ0e
(b−µ)t/µ+λ0/µ and y(t) =λ0e
(b−µ)t/µ. When w(t) drops to 0, the process enters thesecond phase. In the second phase, we have w(t) ≡ 0 andy′ = λ1−µy. Denote the phase conversion time by t∗. We canobtain it by solving w(t∗) = λ1t
∗ − λ0e(b−µ)t∗/µ+ λ0/µ =
0. With y(t∗) = λ0e(b−µ)t∗/µ as initial condition, we have
y = λ1/µ+ (λ0ebt∗ − λ1e
µt∗)e−µt/µ.Fig. 6 demonstrates the system stabilization processes of the
above two cases according to the modeling results, respectively(see the curves for the modeling results). Again, we use thesystem described in Section IV.C. When flash crowd occurs,w0 = 0, b = 0.2, and µ = 0.05. The difference is as follows.In Fig. 6a, λ0 = 0.25 and thus y0 = λ0/µ = 5; and λ1 = 1.

12 IEEE/ACM TRANSACTIONS ON NETWORKING, VOL. XX, NO. XX, XXX 2013
0 20 40 60 800
5
10
15
20
Time (s)
Num
ber
of P
eers
Stable Peer: Simulation
Stable Peer: Modeling
Waiting Peer: Simulation
Waiting Peer: Modeling
(a) λ1 ≤ by0
0 20 40 60 800
1
2
3
4
5
6
7
Time (s)
Num
ber
of P
eers
(×1
03 )
Stable Peer: Simulation
Stable Peer: Modeling
Waiting Peer: Simulation
Waiting Peer: Modeling
(b) λ1 > by0
Fig. 6. System dynamic in the presence of a flash crowd.
Since by0 = 1, we have λ1 = by0 and it is an example ofCase 1 (i.e., λ1 ≤ by0). In contrast, in Fig. 6b, λ0 = 5 andthus y0 = λ0/µ = 100; and λ1 = 300. Thus, λ1 > by0 = 20and this is an example of Case 2 (i.e., λ1 > by0).
3) Peer startup latency: In this subsection, we analyzepeers’ startup latency in a P2P live streaming system withadmission control under flash crowds. We consider a commonimplementation method: newly-arrived peers are placed in aFirst-In-First-Out (FIFO) queue to get admissions. In such asystem, a peer’s startup latency consists of two parts: waitingtime and downloading time. The waiting time is defined asthe time from the instant when a peer arrives at a systemto the instant when the peer is admitted to join the system.The downloading time is the time taken by the peer to finishstartup after it is admitted to join. With admission control,an admitted startup peer can download at its downlink rate.Thus, its downloading time T is equal to the ratio betweenη0 and its downlink rate bw and is a constant. Thus, we focuson analyzing the waiting time. Regarding this, we have thefollowing theorem.
Theorem 2: When a P2P live streaming system with aFIFO-like admission control mechanism experiences a flashcrowd, a newly-arrived peer’s waiting time increases with theshock level of flash crowd logarithmically, in the worst case.
Proof: Consider a flash crowd occurs at time t = 0.Denote the waiting time of a peer that arrives at time t byTw(t). We have the following two cases to get Tw(t).
Case 1: λ1 ≤ by0. In Section V.B.2, we have derived that inthis case, w(t) always equals to zero, meaning that there is nopeer waiting for admission and every newly-arrived peer canbegin startup immediately once it arrives. Thus, Tw(t) ≡ 0.
Case 2: λ1 > by0. In Section V.B.2, we have derived thatin this case, w(t) is larger than zero and keeps increasing (forsome time). As peers are admitted to join in a FIFO pattern,the peer arriving at time t has to wait until all the w(t) peersin front of it finish their startup. Since the peer startup rate isby(t), and these w(t) peers will finish startup at t + Tw(t),we have w(t) =
∫ t+Tw(t)
tby(ξ)dξ. Replacing w(t) = λ1t −
λ0e(b−µ)t/µ+λ0/µ and y(t) = λ0e
(b−µ)t/µ (see the solutionsof w(t) and y(t), which we have derived in Section V.B.2 forthis case) into it, we have Tw(t) = ln(µvt + 1)/(b − µ) − t.This result indicates that peer waiting time Tw(t) increaseslogarithmically with the flash crowd’s shock level v.
Fig. 5d plots the peer waiting time as a function of peerarrival time when a flash crowd occurs at t = 0 when λ1 > by0
for the system considered in Fig. 6b. The shock level of flashcrowd v = λ1/λ0 = 300/5 = 60. The results shown in Fig. 5dare consistent with the system stabilization process shown inFig. 6b, i.e., peers’ waiting time first increases, meaning thatmore and more peers are congested. It then decreases, meaningthe congested peers are drained out (admitted) gradually. Inparticular, after t = 30 seconds, the waiting time of newly-arrived peers drops to zero, meaning that every newly-arrivedpeer can begin startup immediately once it arrives.
We then examine the worst-case peer waiting time whena flash crowd occurs. Denote it by twx. Getting derivativeof Tw(t) w.r.t. t, and letting it be equal to 0, we have t =1/(b− µ)− 1/(vµ). Replacing it into Tw(t), we have
twx =1
b− µ
(ln
vµ
b− µ− 1
)+
1
vµ. (18)
Based on (18), Fig. 5c plots how the worst-case peer startuplatency tm changes with v for the system with admissioncontrol (see the curve “tm: With Admission Control”). Thesystem parameter settings are same to those described inSection IV.C. For a system with admission control, its worst-case peer startup latency tm = twx + T , i.e., the worst-case peer waiting time twx plus the fixed peer downloadingtime T . As shown in Fig. 5c, when v is smaller than 6.0,with or without admission control, the worst-case peer start-up latencies are similar. This is because, when v is small,congestions in the system without admission control are notsevere such that newly arrived peers can still finish startupquickly. As v increases, however, tm for the system withoutadmission control increases first exponentially and then evenfaster when v > 8.5. For comparison, for the system withadmission control, tm always increases logarithmically withv. As a result, the improvement brought by admission controlin terms of tm quickly increases as v increases. This resultdemonstrates the superiority of admission control to handlelarge flash crowds from the perspective of reducing the worst-case peer startup latency.
4) System recovery time: In this subsection, we analyzesystem recovery time ts, which means the time required forthe system to recover back to the state in which newly-arrivedpeers do not need to wait for admission and can begin theirstartup immediately, since the occurrence of a flash crowd. Wehave the following theorem.
Theorem 3: For a P2P live streaming system with admis-sion control, its system recovery time ts increases logarithmi-cally with the shock level of flash crowd, in the worst case.
Proof: Consider a flash crowd occurring at time t = 0.We have the following two cases to obtain ts.
Case 1: λ1 ≤ by0. In Section V.B.2, we have derived thatin this case, the number of waiting peers w(t) always equalsto zero, meaning there is no peer waiting for admission andeach newly-arrived peer can begin startup immediately after itarrives. Thus, ts ≡ 0.
Case 2: λ1 > by0. In this case, system recovery time tsis the time when w(t) = 0. Thus, we have w(ts) = λ1ts −λ0e
(b−µ)ts/µ+ λ0/µ = 0. Rewrite it as
vts − e(b−µ)ts/µ+ 1/µ = 0. (19)

CHEN et al.: PERFORMANCE MODELING AND EVALUATION OF PEER-TO-PEER LIVE STREAMING SYSTEMS UNDER FLASH CROWDS 13
Getting its derivative w.r.t. v, we have
dtsdv
= − tsv − (b− µ)e(b−µ)ts/µ
. (20)
According to (19), we have e(b−µ)ts/µ = vts+1/µ. Substi-tuting it into (20), we have dts/dv = µts/{vµ[(b−µ)ts−1]+(b−µ)}. When flash crowd size v is large and consequently thesystem recovery time ts is also large, it can be approximatedas dts/dv ≈ µts/[vµ(b − µ)ts] = 1/[(b − µ)v]. Thus, wehave ts ≈ (ln v)/(b−µ) +Cts, where Cts is a constant. Thisresult indicates that the system recovery time ts approximatelyincreases with shock level v logarithmically.
VI. SIMULATION RESULTS WITH PRACTICALCONSIDERATIONS
In this section, we conduct simulations to validate the de-rived models while considering implementation details relatedto real systems, such as fluctuations in peer arrivals, data areexchanged chunk by chunk (instead of as a continuous fluidlike in the analytical models), and network transmission delay.
A. Simulator Description
We perform event-driven discrete-time simulations, whichsimulate peers’ startup processes as follows. Startup peersrequest chunks to fill up their buffers starting from buffertail and in sequential order. After a startup peer issues arequest, if there are idle stable peers available, a randomly-selected idle stable peer will serve this request. The requestarrives at the stable peer after a network propagation delaywhich is chosen randomly and uniformly distributed in (0, 100]milliseconds. When the idle stable peer receives the request,it changes its state from “idle” to “busy” and sends the chunkback to the startup peer. Since the startup peer’s downlink rateis larger than a stable peer’s residual upload bandwidth (i.e.,c chunks/s), the transmission of a chunk takes 1/c seconds.After that time, the startup peer obtains the chunk and thestable peer changes its state back to “idle”. In contrast, ifthere exists no idle stable peer, the startup peer’s request isrejected and the requesting peer retries after a delay whichis chosen randomly and uniformly distributed in (0, 100]milliseconds as well. When the startup peer obtains η0 chunks,it becomes a stable peer and starts uploading for remainingstartup peers. With the above configuration, we simulate thecompetition of residual bandwidths among startup peers andtheir transitions to stable peers. We do not consider howpeer neighbors are discovered and maintained since existingmeasurement results indicate that the system bottleneck whena flash crowd occurs is the shortage of upload bandwidth,rather than neighbor discovery [4]. We also simulated to useother delay distributions, e.g., uniform distribution in (0, 200]milliseconds or (0, 50] milliseconds, and obtained similarresults. To simulate admission control, we implemented theadmission control approach with following options for chunkfetching: After a stable peer starts serving a startup peer, itdoes not accept any other startup peers’ requests until theserved startup peer finishes its startup, to ensure the servicequality of chunk uploading. We begin each simulation with a
warm-up period, allowing the system to reach steady state atan initial peer arrival rate λ0. We then simulate a flash crowdby abruptly increasing the arrival rate to λ1. We model peers’arriving behavior using a Poisson process and the staying timeof stable peers using an exponential distribution. For instance,to simulate a peer arriving rate λ, we randomly choose peerinter-arrival time t according to an exponential distributionwith mean 1/λ. This choice is motivated by observationsof real user arrival behavior [2]. We wrote our simulationcode based on SimPy, which is an open-source discrete-eventsimulation framework based on standard Python [34].
B. Simulation Results
Figs. 3, 4a, 4b, 6a, and 6b show the simulation results (seethe curves marked with “Simulation”. The parameters usedare the same to those used for deriving the modeling resultsin each figure. For each experiment, we repeated ten runswith different seeds, average the results, and plot them intocorresponding figures. As shown in these figures, simulationresults and modeling results are consistent, indicating thatthe implementation details have no obvious impact on systemstabilization process in the presence of flash crowd. The smalldifferences between them can be explained as follows:
• Peers arrive randomly. Thus, the short-term peer arrivingrate may temporarily exceed the system’s residual band-width and thus some peers need to wait for admissions(see Fig. 6a).
• The transmission and retry delay of peers’ requests slowsdown the peer startup process, and thus a little more peersneed to wait (see Figs. 6a and 6b);
• Startup of peers in simulations happens at a series ofdiscrete times, which slows down the peer startup processas well (see Figs. 4a and 6b). To understand this, considerthe following example. When y0 = 1 (i.e., at time t = 0,there is one stable peer online), b = 1 (i.e., a stable peercan help one startup peer finish startup in unit time), andµ = 0 (i.e., stable peers never leave), in the analyticalmodel, we have y′ = y and the number of stable peersevolves as y(t) = et. In the simulations, however, thenumber of stable peers y(t) increases as y(t) = 2⌊t⌋,since peers start up in a series of discrete steps. As 2⌊t⌋ <et, the peer startup rate in simulations is slower than thatin the analytical model.
• According to the model derived for systems (withoutadmission control) which can keep working in RBA stateunder flash crowds, peer startup time is T = η0/bw =10/12 = 0.8333s. In simulations, however, as c = 2and bw = 12, a startup peer can only simultaneouslydownload from 12/2 = 6 stable peers. As each chunk’sdownloading takes 1/c = 1/2 = 0.5s, it takes a startuppeer 0.5s to obtain the first 6 chunks and another 0.5sto obtain the remaining 10 − 6 = 4 chunks. Thus, thepeer startup latency is 0.5 × 2 = 1s, which is slightlylonger than the modeling result 0.8333s. Accordingly, thenumber of startup peers is x1 = λ1T = 40 × 1 = 40,which is larger than the modeling results x1 = λ1T =40× 0.8333 = 33.33 (see Fig. 4a).

14 IEEE/ACM TRANSACTIONS ON NETWORKING, VOL. XX, NO. XX, XXX 2013
We further run simulations of system with admission controlunder larger flash crowds (e.g., v = 1000) and the systemstabilization process is similar to that shown in Fig. 6b asboth of them are for Case 2 in Theorem 1, while its systemrecovery time is longer. These simulation results validate thesuperior scalability of an admission-control-enabled P2P livestreaming system under very large flash crowds.
VII. FLASH CROWD HANDLING STRATEGIES
In this section, based on the modeling results in precedingsections, we present several flash crowd handling strategiesfor different circumstances. We first define some notations.Given the maximal allowable startup latency (denoted by L),for systems without and with admission control, we can obtainthe maximum shock levels of flash crowds under which allnewly-arrived peers have startup latency below L by using(15) and (18), respectively (see Fig. 5c for illustration). Wedenote them by VNAC and VAC , respectively. They representthe capacity of a system to meet the maximal startup latencybound L under flash crowds, when the system works withoutand with admission control, respectively.
We next discuss some major considerations in designingflash crowd handling strategies based on different criterias.
• Admission control can bring significant gain in terms ofimproving the system capacity to meet the maximal start-up latency bound L under flash crowds when L is large(see Fig. 5c). However, caution should be taken whenintroducing admission control in a system (especially acommercial large-scale system already in use), since itrequires extra signaling process between joining peersand tracker server and collection of accurate peer stateinformation, which increase system complexity and thusmay cause performance degradation [26].
• Assisting servers have been widely deployed as defaultbackup resources to improve system quality in most P2Pstreaming systems [4]. While their deployment increasessystem cost, assisting servers can be shared among dif-ferent channels, provided that these channels suffer flashcrowds at different times. Thus, the number of assistingservers does not need to reach a level high enough forhandling simultaneous flash crowds on all channels.
• Based on these considerations, a service provider canmake a choice between using assisting servers or admis-sion control based on its system infrastructure, servicerequirements, and development and maintenance cost.Generally, when VNAC ≈ VAC , i.e., admission controlbrings no obvious gain, it is not suggested to use/deployadmission control; When VNAC ≪ VAC , use of admis-sion control could be a good choice.
After deciding whether to use admission control or not, wepresent the following flash crowd handling strategies:
• For a system without admission control, if v ≤ VNAC ,the system itself can handle the flash crowd smoothly;otherwise, the system (usually the tracker server) shoulddivert the excessive 100× (λ1−VNACλ0)/λ1 percent ofnewly-arrived peers to extra assisting servers to ensurethat these peers’ startup latencies are still below L.
• For a system with admission control, we focus on study-ing the case VNAC ≪ VAC (otherwise admission controlshould not have been used). If v ≤ VNAC , the systemitself can handle the flash crowd smoothly and we neednot enable admission control since it increases systemcomplexity and may cause performance degradation; elseif VNAC < v ≤ VAC , the system can handle the flashcrowd by enabling the admission control function; else ifv > VAC , besides admission control, the system shoulddivert the excessive 100 × (λ1 − VACλ0)/λ1 percent ofnewly-arrived peers to extra assisting servers.
With the above strategies, a service provider can greatlysimplify its service logic and fully utilize its system resourcesto achieve satisfying peer startup performance while keepingsystem stability in the presence of large flash crowds.
VIII. CONCLUSION
In this paper, we have conducted a comprehensive studyon the performance of P2P live streaming systems under flashcrowds. By modeling the systems using fluid model, we studythe system capacity, peer startup latency, and system recoverytime of systems with and without admission control for flashcrowds. For systems without admission control, we use thelargest flash crowd under which a system can avoid collapseto quantify the system’s capacity to handle flash crowds,and found it is independent of system’s initial state whiledecreases as stable peer’s departure rate increases, in a powerlaw relationship. In comparison, for a system with admissioncontrol, we prove that it can recover stability from flash crowdsof any sizes and its worst-case peer startup latency and systemrecovery time scale logarithmically with the flash crowd size.Based on the analysis results, we present flash crowd handlingstrategies for providing satisfying peer startup performancewhile keeping system stability in the presence of large flashcrowds under different circumstances.
ACKNOWLEDGMENT
An abridged version of this paper was presented at IEEE In-ternational Conference on Communications - Next GenerationNetworking and Internet Symposium, Tokyo, Japan, June 5-9,2011. The authors are grateful to the constructive commentsfrom anonymous reviewers, which help improve the quality ofthis paper a lot.
REFERENCES
[1] Y. Huang, T. Z. J. Fu, D. Chiu, J. C. S. Lui, and C. Huang, “Challenges,design and analysis of a large-scale P2P-VoD system,” in Proc. ACMSIGCOMM’08, New York, USA, May 2008, pp. 375–388.
[2] K. Sripanidkulchai, B. Maggs, and H. Zhang, “An analysis of livestreaming workloads on the internet,” in Proc. ACM IMC’04, Taormina,Italy, Feb. 2004, pp. 41–54.
[3] C. Wu, B. Li, and S. Zhao, “Magellan: charting large-scale peer-to-peertopologies,” in Proc. IEEE ICDCS’07, Toronto, Canada, Jun. 2007, pp.62–69.
[4] B. Li, G. Y. Keung, S. Xie, F. Liu, Y. Sun, and H. Yin, “An empiricalstudy of flash crowd dynamics in a P2P-based live video streamingsystem,” in Proc. IEEE GLOBECOM’08, New Orleans, USA, Nov. 2008,pp. 1–5.
[5] J. Seibert, D. Zage, S. Fahmy, and C. Nita-Rotaru, “Experimental com-parison of peer-to-peer streaming overlays: an application perspective,”in Proc. IEEE LCN’08, Montreal, Canada, Feb. 2008, pp. 20–27.

CHEN et al.: PERFORMANCE MODELING AND EVALUATION OF PEER-TO-PEER LIVE STREAMING SYSTEMS UNDER FLASH CROWDS 15
[6] F. Liu, B. Li, L. Zhong, B. Li, and D. Niu, “Flash crowd in P2P livestreaming systems: fundamental characteristics and design implications,”IEEE Trans. Parallel Distrib. Syst., vol. 23, no. 7, pp. 1227–1239, Jul.2012.
[7] Z. Chen, B. Li, G. Keung, H. Yin, C. Lin, and Y. Wang, “How scalablecould P2P live media streaming system be with the stringent timeconstraint,” in Proc. IEEE ICC’09, Dresden, Germany, Jun. 2009, pp.1–5.
[8] I. Ari, B. Hong, E. Miller, S. Brandt, and D. Long, “Managing flashcrowds on the internet,” in Proc. IEEE MASCOTS’03, Orlando, FL,USA, Oct. 2003, pp. 246–249.
[9] J. Jung, B. Krishnamurthy, and M. Rabinovich, “Flash crowds and denialof service attacks: Characterization and implications for cdns and websites,” in Proc. WWW’02, Honolulu, HI, USA, May 2002, pp. 252–262.
[10] J. A. Patel, C. M. Yang, and I. Gupta, “Turning flash crowds intosmart mobs with real-time stochastic detection and adaptive cooperativecaching,” in Proc. ACM SOSP’05, Brighton, UK, Oct. 2005, pp. 1–7.
[11] R. Bharambe, C. Herley, and V. N. Padmanabhan, “Analyzing andimproving a BitTorrent networks performance mechanisms,” in Proc.IEEE INFOCOM’08, Barcelona, Spain, Apr. 2006, pp. 1–12.
[12] A. Legout, G. Urvoy-Keller, and P. Michiardi, “Rarest first and chokealgorithms are enough,” in Proc. ACM IMC’06, New York, NY, USA,Oct. 2006, pp. 203–216.
[13] D. Stutzbach, D. Zappala, and R. Rejaie, “The scalability of swarmingpeer-to-peer content delivery,” in Proc. IFIP Networking’05, Waterloo,ON, Canada, May 2005, pp. 15–26.
[14] T. Stading, P. Maniatis, and M. Baker, “Peer-to-peer caching schemes toaddress flash crowds,” in Proc. IPTPS’01, Cambridge, MA, USA, Mar.2002, pp. 203–213.
[15] A. Stavrou, D. Rubenstein, and S. Sahu, “A lightweight robust P2Psystem to handle flash crowds,” IEEE J. Sel. Areas Commun., vol. 22,no. 1, pp. 6–17, Jan. 2004.
[16] D. Rubenstein and S. Sahu, “Can unstructured P2P protocols surviveflash crowds?” IEEE/ACM Trans. Netw., vol. 13, no. 3, pp. 501–512,Jun. 2005.
[17] T. Leighton, “Improving performance on the internet,” ACM Commun.,vol. 52, no. 2, pp. 44–51, Feb. 2009.
[18] N. Magharei, R. R, and Y. Guo, “Mesh or multiple-tree: a comparativestudy of live P2P streaming approaches,” in Proc. IEEE INFOCOM’07,Anchorage, AK, May 2007, pp. 1424–1432.
[19] X. Zhang, J. Liu, B. Li, and T. P. Yum, “Coolstreaming/donet: a data-driven overlay network for peer-to-peer live streaming,” in Proc. IEEEINFOCOM’05, Miami, USA, Mar. 2005, pp. 2102–2111.
[20] B. Cohen. (2003) Incentives build robustness in BitTorrent. [Online].Available: http://citeseerx.ist.psu.edu/viewdoc/summary?doi=10.1.1.14.1911
[21] H. Chang, S. Jamin, and W. Wang, “Live streaming performance of thezattoo network,” in Proc. ACM IMC’09, Chicago, Illinois, USA, Nov.2009, pp. 417–429.
[22] B. Li, S. Xie, Y. Qu, G. Y. Keung, and et al., “Inside the newcoolstreaming: principles, measurements and performance implications,”in Proc. IEEE INFOCOM’08, Phoenix, Arizona, USA, Apr. 2008, pp.1031–1039.
[23] J. K. Jia, C. Li, and C. J. Chen, “Characterizing ppstream acrossinternet,” in Proc. NPC workshop’07, Redwood City, USA, Sep. 2007,pp. 413–418.
[24] D. Qiu and R. Srikant, “Modeling and performance analysis ofBitTorrent-like peer-to-peer networks,” in Proc. ACM SIGCOMM’04,Portland, OR, USA, Aug. 2004, pp. 367–378.
[25] L. Xie, P. Smith, D. Hutchison, M. Banfield, H. Leopold, A. Jabbar,and J. Sterbenz, “From detection to remediation: a self-organized systemfor addressing flash crowd problems,” in Proc. IEEE ICC’08, Beijing,China, May 2008, pp. 5809–5814.
[26] L. Acunto, T. Vink, and H. Sips, “Bandwidth allocation in BitTorrent-like vod systems under flash crowds,” in Proc. IEEE P2P’11, Kyoto,Japan, Aug. 2011, pp. 192–201.
[27] K. C. Almeroth and M. H. Ammar, “Collecting and modeling thejoin/leave behavior of multicast group members in the MBone,” in Proc.IEEE HPDC’96, New York, NY, USA, Aug. 1996, pp. 209–216.
[28] C. Li and C. Chen. (2010) Fetching strategy in the startup stage of P2Plive streaming. [Online]. Available: HTTP://arxiv.org/abs/0810.2134
[29] A. Vlavianos, M. Iliofotou, and M. Faloutsos, “BiToS: enhancingBitTorrent for supporting streaming applications,” in Proc. IEEE IN-FOCOM’06, Barcelona, Spain, May 2006, pp. 1–6.
[30] B. Zhao, J. Lui, and D. Chiu, “Exploring the optimal chunk selectionpolicy for data-driven P2P streaming systems,” in Proc. IEEE P2P’00,Washington, USA, Sep. 2000, pp. 271–280.
[31] Q. Ying, Y. Guo, Y. Chen, X. Tan, and W. Zhu, “Understanding users’access failure and patience in large-scale P2P VoD systems,” in Proc.IEEE ICWMMN’11, Beijing, China, Nov. 2011, pp. 283–287.
[32] C. Liang, Y. Guo, and Y. Liu, “Is random scheduling sufficient in P2Pvideo streaming,” in Proc. IEEE ICDCS’08, Beijing, China, Jun. 2008,pp. 53–60.
[33] M. Zhang, Q. Zhang, L. Sun, and S. Yang, “Understanding the powerof pull-based streaming protocol: can we do better?” IEEE J. Sel. AreasCommun., vol. 25, no. 9, pp. 1678–1694, Sep. 2007.
[34] N. Matloff. (2008) Introduction to discrete-event simulation andthe simpy language. [Online]. Available: http://heather.cs.ucdavis.edu/∼matloff/156/PLN/DESimIntro.pdf
Yishuai Chen received his B.S., M.S., and Ph.D.degree from School of Electronics and InformationEngineering at the Beijing Jiaotong University, in1998, 2001, and 2010, respectively. He is currentlya lecturer at the School of Electrical and InformationEngineering of the Beijing Jiaotong University. From2010 to 2012, he was a Postdoctoral Fellow withthe Research Center of Ubiquitous Sensor Networksat the University of Chinese Academy of Sciences,Beijing, China. From 2001 to 2007, he workedat Lucent Bell-labs (China) on intelligent network
systems as a Technical Staff. His research interests include peer to peer com-puting, streaming media, web and internet services, and consumer behavior.He has served as TPC members for IEEE GLOBECOM.
Baoxian Zhang [M’02-SM’12] received his PhDdegree from Beijing Jiaotong University, China, in2000. He is currently a Professor with Research Cen-ter of Ubiquitous Sensor Networks at University ofChinese Academy of Sciences (UCAS), Beijing. Pri-or joining UCAS, he was a Research Scientist withSchool of Information Technology and Engineering,University of Ottawa, Canada. His research inter-ests cover network protocol and algorithm design,wireless ad hoc and sensor networks. He has servedas Guest Editors of special issues for IEEE Journal
on Selected Areas in Communications, Mobile Networks and Applications,Elsevier Ad Hoc Networks, and Wireless Communications and Mobile Com-puting. He has served as TPC members for many international conferencesand symposia such as IEEE GLOBECOM, ICC, WCNC, and PIMRC. Hehas coauthored a book in Wireless Sensor Networks and published over 100refereed technical papers in archival journals and conference proceedings.
Changjia Chen received his Ph.D degree in electri-cal engineering from University of Hawaii in 1986.He is currently a Professor with Beijing JiaotongUniversity, China. His research interests includecommunication networks and communication proto-cols, measurement and modeling of P2P networks.He has published over 100 refereed technical papersin archival journals and conference proceedings. Heis a Fellow of China Institute of Communications(CIC) and Chinese Institute of Electronics (CIE).
Dah Ming Chiu [SM’02-F’08] received the B.Sc.degree in electrical engineering from Imperial Col-lege London, London, U.K., in 1975, and the Ph.D.degree in applied mathematics from Harvard Univer-sity, Cambridge, MA, in 1980. He is currently theDepartment Chairman of Information Engineeringwith the Chinese University of Hong Kong (CUHK),Hong Kong. Prior to joining CUHK, he has workedfor Sun Labs, DEC, and AT&T Bell Labs. Hiscurrent research interests include P2P networks,network measurement, architecture and engineering,
network economics, and social networks. Prof. Chiu is an IEEE Fellow forhis contribution to the resource allocation algorithms for the Internet.