Optimized microwave-assisted extraction of phenolic acids from citrus mandarin peels and evaluation...
8
Separation and Purification Technology 70 (2009) 63–70 Contents lists available at ScienceDirect Separation and Purification Technology journal homepage: www.elsevier.com/locate/seppur Optimized microwave-assisted extraction of phenolic acids from citrus mandarin peels and evaluation of antioxidant activity in vitro Khizar Hayat a , Sarfraz Hussain b , Shabbar Abbas a , Umar Farooq a , Baomiao Ding a , Shuqin Xia a , Chengsheng Jia a , Xiaoming Zhang a,∗ , Wenshui Xia a a State Key Laboratory of Food Science and Technology, School of Food Science and Technology, Jiangnan University, 1800 Lihu Road, Wuxi 214122, Jiangsu, China b Department of Food Science and Technology, University of Sargodha, Pakistan article info Article history: Received 17 July 2009 Received in revised form 21 August 2009 Accepted 22 August 2009 Keywords: Microwave-assisted extraction Response surface methodology Phenolic acid content Kinnow Antioxidant activity abstract An efficient microwave-assisted extraction (MAE) technique was developed to extract phenolic acids from citrus mandarin peels. The operating parameters were optimized using central composite design combined with response surface methodology. The optimum extraction conditions were as follows: microwave power, 152 W; extraction time, 49 s; liquid to solid ratio, 16; and methanol concentration, 66%. After method development, the extraction yield of phenolic acids (divided into four fractions: free, ester-bound, glycoside-bound and insoluble-bound) and the antioxidant activity of the extract were com- pared with those of the extracts obtained from the conventional methods including ultrasonic extraction (USE) and rotary extraction (RE). MAE showed obvious advantages in terms of high extraction efficiency and antioxidant activity of extract within shortest extraction time. The results demonstrated that MAE could be a fast and reliable method for quantitative analysis of phenolic compounds in citrus mandarin peels. © 2009 Published by Elsevier B.V. 1. Introduction Antioxidants are both natural and synthetic compounds able to scavenge free radicals and to inhibit oxidation processes. Polyphe- nolic compounds comprising flavonoids and phenolic acids are widely distributed in foods of plant origin and count to the most abundant antioxidants in our diet [1,2]. Phenolic acids form approximately one-third of the phenolic compounds in plant foods. They comprise hydroxycinnamic and hydroxybenzoic acid derivatives and are presented in free and bound forms. It is assumed that many antioxidative phenolic compounds in plants are usually presented in covalently bound forms [3]. Therefore, reliable and practical methods for separation, identification and quantitative analysis of phenolic compounds are of considerable interest. Recent years has seen an increasing demand for new extrac- tion techniques enabling automation, shortening extraction times and reduction of organic solvent consumption. Among these more efficient extraction techniques are microwave-assisted extraction (MAE), ultrasonic extraction (USE), supercritical fluid extraction and accelerated solvent extraction [4]. Microwave-assisted extrac- ∗ Corresponding author. Tel.: +86 510 85919106; fax: +86 510 85884496. E-mail addresses: [email protected] (K. Hayat), [email protected] (X. Zhang). tion (MAE) is the process by which microwave energy is used to heat solvents in contact with solid samples and to partition com- pounds of interest from the sample into the solvent. Recently, MAE has received a great attention as a potential alternative to conven- tional extraction methods, mainly due to considerable savings in processing time, solvent consumption and energy [5]. Citrus peel is the main waste fraction of citrus fruits, which had been widely studied because it contains numerous biolog- ically active compounds including natural antioxidants such as phenolic acids and flavonoids [6]. Techniques reported for the extraction of phenolic acids from citrus peels include reflux [7–9], shaking [10], blending [11], stirring [12] and ultrasonic extrac- tion [3,13–15]. To our knowledge no MAE application, for the extraction of phenolic acids from citrus peels have been found in bibliography. Therefore, in this study the applicability of microwave-assisted extraction (MAE) for the phenolic acids in citrus mandarin peels was investigated and the operational parameters were optimized using central composite rotatable design combined with response surface methodology. Kinnow (Citrus reticulata Blanco cv Kinnow) fruit peels were chosen for this study, hence it is one of the main citrus mandarin species in Pakistan, besides being common in the whole South Asian region. The extraction efficiency of MAE was compared with conventional extraction techniques. Moreover, different antioxidant assays were performed to determine the suit- ability of the MAE. The aim of this work was to propose a suitable 1383-5866/$ – see front matter © 2009 Published by Elsevier B.V. doi:10.1016/j.seppur.2009.08.012
-
Upload
independent -
Category
Documents
-
view
6 -
download
0
Transcript of Optimized microwave-assisted extraction of phenolic acids from citrus mandarin peels and evaluation...

Op
KCa
b
a
ARRA
KMRPKA
1
snwmafdaarqi
tae(a
x
1d
Separation and Purification Technology 70 (2009) 63–70
Contents lists available at ScienceDirect
Separation and Purification Technology
journa l homepage: www.e lsev ier .com/ locate /seppur
ptimized microwave-assisted extraction of phenolic acids from citrus mandarineels and evaluation of antioxidant activity in vitro
hizar Hayata, Sarfraz Hussainb, Shabbar Abbasa, Umar Farooqa, Baomiao Dinga, Shuqin Xiaa,hengsheng Jiaa, Xiaoming Zhanga,∗, Wenshui Xiaa
State Key Laboratory of Food Science and Technology, School of Food Science and Technology, Jiangnan University, 1800 Lihu Road, Wuxi 214122, Jiangsu, ChinaDepartment of Food Science and Technology, University of Sargodha, Pakistan
r t i c l e i n f o
rticle history:eceived 17 July 2009eceived in revised form 21 August 2009ccepted 22 August 2009
a b s t r a c t
An efficient microwave-assisted extraction (MAE) technique was developed to extract phenolic acidsfrom citrus mandarin peels. The operating parameters were optimized using central composite designcombined with response surface methodology. The optimum extraction conditions were as follows:microwave power, 152 W; extraction time, 49 s; liquid to solid ratio, 16; and methanol concentration,
eywords:icrowave-assisted extraction
esponse surface methodologyhenolic acid contentinnowntioxidant activity
66%. After method development, the extraction yield of phenolic acids (divided into four fractions: free,ester-bound, glycoside-bound and insoluble-bound) and the antioxidant activity of the extract were com-pared with those of the extracts obtained from the conventional methods including ultrasonic extraction(USE) and rotary extraction (RE). MAE showed obvious advantages in terms of high extraction efficiencyand antioxidant activity of extract within shortest extraction time. The results demonstrated that MAEcould be a fast and reliable method for quantitative analysis of phenolic compounds in citrus mandarin
peels.. Introduction
Antioxidants are both natural and synthetic compounds able tocavenge free radicals and to inhibit oxidation processes. Polyphe-olic compounds comprising flavonoids and phenolic acids areidely distributed in foods of plant origin and count to theost abundant antioxidants in our diet [1,2]. Phenolic acids form
pproximately one-third of the phenolic compounds in plantoods. They comprise hydroxycinnamic and hydroxybenzoic aciderivatives and are presented in free and bound forms. It isssumed that many antioxidative phenolic compounds in plantsre usually presented in covalently bound forms [3]. Therefore,eliable and practical methods for separation, identification anduantitative analysis of phenolic compounds are of considerable
nterest.Recent years has seen an increasing demand for new extrac-
ion techniques enabling automation, shortening extraction times
nd reduction of organic solvent consumption. Among these morefficient extraction techniques are microwave-assisted extractionMAE), ultrasonic extraction (USE), supercritical fluid extractionnd accelerated solvent extraction [4]. Microwave-assisted extrac-∗ Corresponding author. Tel.: +86 510 85919106; fax: +86 510 85884496.E-mail addresses: [email protected] (K. Hayat),
[email protected] (X. Zhang).
383-5866/$ – see front matter © 2009 Published by Elsevier B.V.oi:10.1016/j.seppur.2009.08.012
© 2009 Published by Elsevier B.V.
tion (MAE) is the process by which microwave energy is used toheat solvents in contact with solid samples and to partition com-pounds of interest from the sample into the solvent. Recently, MAEhas received a great attention as a potential alternative to conven-tional extraction methods, mainly due to considerable savings inprocessing time, solvent consumption and energy [5].
Citrus peel is the main waste fraction of citrus fruits, whichhad been widely studied because it contains numerous biolog-ically active compounds including natural antioxidants such asphenolic acids and flavonoids [6]. Techniques reported for theextraction of phenolic acids from citrus peels include reflux [7–9],shaking [10], blending [11], stirring [12] and ultrasonic extrac-tion [3,13–15]. To our knowledge no MAE application, for theextraction of phenolic acids from citrus peels have been found inbibliography.
Therefore, in this study the applicability of microwave-assistedextraction (MAE) for the phenolic acids in citrus mandarin peelswas investigated and the operational parameters were optimizedusing central composite rotatable design combined with responsesurface methodology. Kinnow (Citrus reticulata Blanco cv Kinnow)fruit peels were chosen for this study, hence it is one of the main
citrus mandarin species in Pakistan, besides being common inthe whole South Asian region. The extraction efficiency of MAEwas compared with conventional extraction techniques. Moreover,different antioxidant assays were performed to determine the suit-ability of the MAE. The aim of this work was to propose a suitable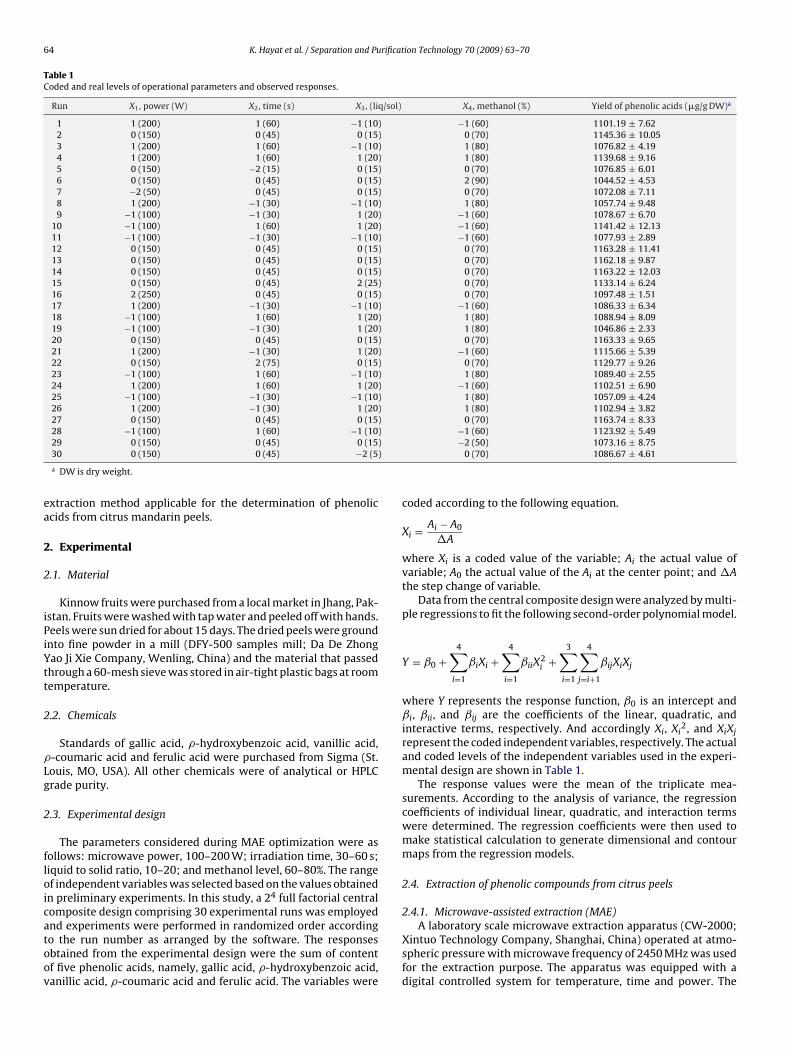
64 K. Hayat et al. / Separation and Purification Technology 70 (2009) 63–70
Table 1Coded and real levels of operational parameters and observed responses.
Run X1, power (W) X2, time (s) X3, (liq/sol) X4, methanol (%) Yield of phenolic acids (�g/g DW)a
1 1 (200) 1 (60) −1 (10) −1 (60) 1101.19 ± 7.622 0 (150) 0 (45) 0 (15) 0 (70) 1145.36 ± 10.053 1 (200) 1 (60) −1 (10) 1 (80) 1076.82 ± 4.194 1 (200) 1 (60) 1 (20) 1 (80) 1139.68 ± 9.165 0 (150) −2 (15) 0 (15) 0 (70) 1076.85 ± 6.016 0 (150) 0 (45) 0 (15) 2 (90) 1044.52 ± 4.537 −2 (50) 0 (45) 0 (15) 0 (70) 1072.08 ± 7.118 1 (200) −1 (30) −1 (10) 1 (80) 1057.74 ± 9.489 −1 (100) −1 (30) 1 (20) −1 (60) 1078.67 ± 6.70
10 −1 (100) 1 (60) 1 (20) −1 (60) 1141.42 ± 12.1311 −1 (100) −1 (30) −1 (10) −1 (60) 1077.93 ± 2.8912 0 (150) 0 (45) 0 (15) 0 (70) 1163.28 ± 11.4113 0 (150) 0 (45) 0 (15) 0 (70) 1162.18 ± 9.8714 0 (150) 0 (45) 0 (15) 0 (70) 1163.22 ± 12.0315 0 (150) 0 (45) 2 (25) 0 (70) 1133.14 ± 6.2416 2 (250) 0 (45) 0 (15) 0 (70) 1097.48 ± 1.5117 1 (200) −1 (30) −1 (10) −1 (60) 1086.33 ± 6.3418 −1 (100) 1 (60) 1 (20) 1 (80) 1088.94 ± 8.0919 −1 (100) −1 (30) 1 (20) 1 (80) 1046.86 ± 2.3320 0 (150) 0 (45) 0 (15) 0 (70) 1163.33 ± 9.6521 1 (200) −1 (30) 1 (20) −1 (60) 1115.66 ± 5.3922 0 (150) 2 (75) 0 (15) 0 (70) 1129.77 ± 9.2623 −1 (100) 1 (60) −1 (10) 1 (80) 1089.40 ± 2.5524 1 (200) 1 (60) 1 (20) −1 (60) 1102.51 ± 6.9025 −1 (100) −1 (30) −1 (10) 1 (80) 1057.09 ± 4.2426 1 (200) −1 (30) 1 (20) 1 (80) 1102.94 ± 3.8227 0 (150) 0 (45) 0 (15) 0 (70) 1163.74 ± 8.3328 −1 (100) 1 (60) −1 (10) −1 (60) 1123.92 ± 5.49
))
ea
2
2
iPiYtt
2
�Lg
2
floicatoov
29 0 (150) 0 (45) 0 (1530 0 (150) 0 (45) −2 (5
a DW is dry weight.
xtraction method applicable for the determination of phenoliccids from citrus mandarin peels.
. Experimental
.1. Material
Kinnow fruits were purchased from a local market in Jhang, Pak-stan. Fruits were washed with tap water and peeled off with hands.eels were sun dried for about 15 days. The dried peels were groundnto fine powder in a mill (DFY-500 samples mill; Da De Zhongao Ji Xie Company, Wenling, China) and the material that passedhrough a 60-mesh sieve was stored in air-tight plastic bags at roomemperature.
.2. Chemicals
Standards of gallic acid, �-hydroxybenzoic acid, vanillic acid,-coumaric acid and ferulic acid were purchased from Sigma (St.ouis, MO, USA). All other chemicals were of analytical or HPLCrade purity.
.3. Experimental design
The parameters considered during MAE optimization were asollows: microwave power, 100–200 W; irradiation time, 30–60 s;iquid to solid ratio, 10–20; and methanol level, 60–80%. The rangef independent variables was selected based on the values obtainedn preliminary experiments. In this study, a 24 full factorial centralomposite design comprising 30 experimental runs was employed
nd experiments were performed in randomized order accordingo the run number as arranged by the software. The responsesbtained from the experimental design were the sum of contentf five phenolic acids, namely, gallic acid, �-hydroxybenzoic acid,anillic acid, �-coumaric acid and ferulic acid. The variables were−2 (50) 1073.16 ± 8.750 (70) 1086.67 ± 4.61
coded according to the following equation.
Xi = Ai − A0
�A
where Xi is a coded value of the variable; Ai the actual value ofvariable; A0 the actual value of the Ai at the center point; and �Athe step change of variable.
Data from the central composite design were analyzed by multi-ple regressions to fit the following second-order polynomial model.
Y = ˇ0 +4∑
i=1
ˇiXi +4∑
i=1
ˇiiX2i +
3∑
i=1
4∑
j=i+1
ˇijXiXj
where Y represents the response function, ˇ0 is an intercept andˇi, ˇii, and ˇij are the coefficients of the linear, quadratic, andinteractive terms, respectively. And accordingly Xi, Xi
2, and XiXjrepresent the coded independent variables, respectively. The actualand coded levels of the independent variables used in the experi-mental design are shown in Table 1.
The response values were the mean of the triplicate mea-surements. According to the analysis of variance, the regressioncoefficients of individual linear, quadratic, and interaction termswere determined. The regression coefficients were then used tomake statistical calculation to generate dimensional and contourmaps from the regression models.
2.4. Extraction of phenolic compounds from citrus peels
2.4.1. Microwave-assisted extraction (MAE)
A laboratory scale microwave extraction apparatus (CW-2000;Xintuo Technology Company, Shanghai, China) operated at atmo-spheric pressure with microwave frequency of 2450 MHz was usedfor the extraction purpose. The apparatus was equipped with adigital controlled system for temperature, time and power. The
rificat
mtwdmotc
dotTpsvv
2
oohrda
2
bdtt
2
otc
t2wamww2tticpwa
wbeTuma
sample solution without adding deoxyribose as sample blank. Thepercentage of hydroxyl radical scavenging activity was calculated
K. Hayat et al. / Separation and Pu
icrowave power was linearly adjustable from 10 to 800 W, theemperature limit of the apparatus was 1–120 ◦C and time rangeas adjustable from 1 to 999 s. The experimental domain wasefined taking into account the operative limits of the instru-ent and the preliminary experiments. Extraction was carried
ut according to experimental design. The extracts were filteredhrough 0.45 �m nylon filter and analyzed for free phenolic acidontent by HPLC.
After method optimization, the extraction of Kinnow peel pow-er was done under optimized operational conditions. Five gramsf peel powder were extracted with 80 mL of 66% methanol andhen the mixture was filtered through Whatman filter paper No. 4.he residue was reserved for the determination of insoluble-boundhenolic acids and the filtrate was evaporated under reduced pres-ure at 30 ◦C until its volume was about 20 mL. Then the finalolume of the extract was made to 25 mL with the extraction sol-ent and was used for further analysis.
.4.2. Ultrasonic extraction (USE)The extraction was performed according to a modified method
f Xu et al. [13]. The dried powder (4 g) was extracted with 80 mLf 80% methanol in an ultrasonic device (200 W, 59 kHz; Shang-ai Kudos Sonication Machine Company Ltd., China) for 60 min atoom temperature. After filtration, the mixture was worked up asescribed above and analyzed for the quantification of phenoliccids and antioxidant activity.
.4.3. Rotary extraction (RE)The dried powder (4 g) was transferred into a 500 mL round-
ottom flask and 80 mL of 80% methanol was added. Extraction wasone using a rotary shaker for 60 min at room temperature. Thenhe mixture was worked up as described above and analyzed forhe quantification of phenolic acids and antioxidant activity.
.5. Isolation and analysis of phenolic acids
Extracts by above mentioned extraction methods were filteredff through a 0.45 �m nylon filter. Then they were taken out forhe analysis of free phenolic acids and evaluation of antioxidantapacity.
Phenolic acids were isolated from the extracts according tohe method as described by Xu et al. [13], with modifications. A0 mL aliquot of the extract was used for sequential hydrolysisith base followed by an acid for the determination of ester-bound
nd glycoside-bound phenolic acid content, respectively. Twentyilliliters of 4 M NaOH was added to the extract and the mixtureas stirred for 1 h at ambient temperature. The reaction mixtureas adjusted to pH 2 using 6 M HCl and extracted three times with
5, 20 and 20 mL of diethyl ether–ethyl acetate (DE/EA, 1:1) at roomemperature. The DE/EA extracts were combined and evaporatedo dryness under vacuum at 30 ◦C. The dry residue was dissolvedn 5 mL of methanol and analyzed for ester-bound phenolic acidontent. Afterward, 10 mL of 6 M HCl was added to the aqueoushase and the mixture was hydrolyzed at 85 ◦C for 30 min. Then itas cooled to room temperature and the glycoside-bound phenolic
cids were extracted with DE/EA as described above.The residues from 80% methanol extraction were hydrolyzed
ith 40 mL of 4 M NaOH under the same conditions as the ester-ound phenolic acids. After acidification to pH 2, the mixtures werextracted with diethyl ether–ethyl acetate as described previously.he DE/EA extracts were combined and evaporated to drynessnder vacuum at 30 ◦C. The dry residue was dissolved in 5 mL ofethanol and analyzed for methanol–insoluble-bound phenolic
cid content. Each sample was done in duplicate.
ion Technology 70 (2009) 63–70 65
2.6. HPLC analysis
The chromatographic system consisted of a Waters 1525binary pump and a Waters 2996 photodiode array (PDA) detec-tor (Waters, Milford, MA, USA). C18 column (SunFireTM 5 �m,4.6 mm × 150 mm; Waters, USA) was used for separation. The col-umn thermostat was set at 30 ◦C. Solvent A consisted of 0.1% formicacid, and solvent B consisted of 100% methanol. Sample injectionvolume was 15 �L and the flow rate was 1 mL/min. The solventgradient in volume ratios was as follows: 0–13 min, 15–33% B;13–21 min, 33–39% B; 21–23 min, 39–45% B; 23–25 min, 45% B;25–27 min, 45–15% B; 27–33 min, 15% B. The PDA detector wasoperated between 220 and 350 nm with resolution of 1.2 nm. Phe-nolic acids were identified by the retention time and the UV–visspectra of standards. Phenolic acids were quantified from peak areaat 270 nm.
All of the identified phenolic acids were quantified by externalstandard method using calibration curves, and their concentrationswere expressed as microgram per gram of dry weight (�g/g DW).The standard response curve was a linear regression fitted to val-ues obtained at each concentration within the range of 1–16 �g/mLwith correlation coefficients (R2) > 0.9992 for all phenolic acids.
2.7. DPPH radical scavenging activity
The effect of extracts on DPPH free radical was estimatedaccording to the procedure described by Yi et al. [16], with somemodifications. An aliquot of 1.5 mL of sample solution (2 mg/mL)was mixed with 1.5 mL of methanolic solution of DPPH (0.2 mM).The reaction mixture was incubated for 30 min in the darkness atroom temperature. The absorbance of the resulting solution wasmeasured at 517 nm with spectrophotometer. Methanol instead ofsample solution was used as a control. DPPH scavenging capacity ofthe tested samples was measured as a decrease in the absorbanceand was calculated using the following equation:
scavenging activity (%) = Ac − As
Ac× 100
where Ac and As are the absorbances at 517 nm of the control andsample, respectively.
2.8. Hydroxyl radical (OH) scavenging activity
Hydroxyl radical scavenging activity of extracts was determinedaccording to the modified method of Halliwell et al. [17]. The reac-tion mixture containing 0.1 mL of extract (2 mg/mL) dissolved inphosphate buffer (50 mM, pH 7.4), 0.1 mL of 60 mM 2-deoxy-d-ribose in phosphate buffer, 0.2 mL of a premixed 100 mM FeCl3and 1.04 mM EDTA (1:1, v/v) solution, 0.1 mL of 10 mM H2O2 and0.1 mL of 2 mM ascorbic acid, was incubated at 37 ◦C for 1 h. Afterincubation, 1 mL of 20% trichloroacetic acid (TCA) and 1 mL of 0.8%thiobarbituric acid (TBA) were added. The reaction mixture washeated in a boiling water bath for 20 min. The absorbance of the pinkcolor developed was measured at 532 nm using a spectrophotome-ter. Distilled water in place of extracts was used as blank and the
as:
scavenging activity (%) = Ab − (As − Asb)Ab
× 100
where Ab, As and Asb are the absorbances at 532 nm of the blank,extract, and sample blank, respectively.
66 K. Hayat et al. / Separation and Purification Technology 70 (2009) 63–70
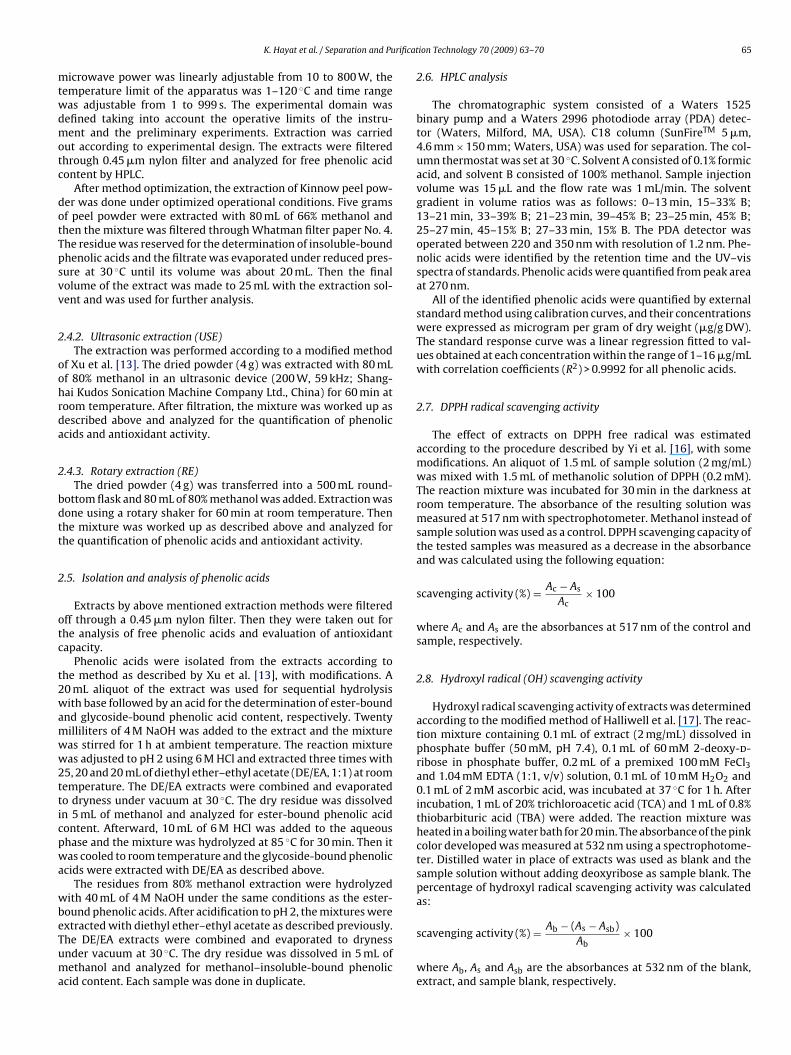
Table 2Analysis of variance (ANOVA) for the experimental results.
Source Sum of squares dfa Mean square F-value P-value Prob > F
Model 38875.05 14 2776.789 20.74102 <0.0001 SignificantX1 698.1131 1 698.1131 5.214503 0.0374X2 5002.594 1 5002.594 37.3665 <0.0001X3 2384.027 1 2384.027 17.80731 0.0007X4 2117.633 1 2117.633 15.8175 0.0012X1X2 985.96 1 985.96 7.364554 0.0160X1X3 1075.184 1 1075.184 8.031007 0.0126X1X4 772.0062 1 772.0062 5.766443 0.0297X2X3 16.36203 1 16.36203 0.122215 0.7315X2X4 24.4036 1 24.4036 0.182281 0.6755X3X4 146.8944 1 146.8944 1.097217 0.3115X2
1 9114.167 1 9114.167 68.07759 <0.0001X2
2 5070.391 1 5070.391 37.87291 <0.0001X2
3 3915.23 1 3915.23 29.24452 <0.0001X2
4 16752.53 1 16752.53 125.1318 <0.0001Residual 2008.187 15 133.8791Lack of fit 1743.107 10 174.3107 3.287889 0.1005 Not significantPure error 265.08 5 53.01599Cor total 40883.23 29R2 0.9509
2
tm1aa1wct
2
sDSd
3
3
Mspssto
gytwTri
CV % 1.05
a Degrees of freedom.
.9. Determination of reducing power
The reducing power of the extracts was measured according tohe method of Oyaizu [18]. One milliliter of sample (20 mg/mL) was
ixed with 2.5 mL of phosphate buffer (0.2 M, pH 6.6) and 2.5 mL of% potassium ferricyanide. The mixture was incubated for 20 mint 50 ◦C. After incubation, 2.5 mL of 10% trichloroacetic acid weredded to the mixture, followed by centrifugation at 3000 × g for0 min at room temperature. Aliquots of 2.5 mL of the supernatantere mixed with 2.5 mL of distilled water and 0.5 mL of 0.1% ferric
hloride. The absorbance was measured at 700 nm against the blankhat contained all the reagents except the sample extract.
.10. Statistical analysis
The data were subjected to analysis of variance (ANOVA) and theignificance of the difference between means was determined byuncan’s multiple range test (P < 0.05) using SAS (Version 8.1, 2000;AS Inst., Cary, NC, USA). Values expressed are means ± standardeviation.
. Results and discussion
.1. Optimization of MAE procedure
There are many factors which affect extraction efficiency ofAE. Some of these are microwave power, extraction time, type of
olvent, composition of solvent, solvent to solid ratio, soaking time,article size of sample and extraction cycles. This study evaluatesome of these factors with central composite design. We used theame solvent for all extraction methods because our purpose waso compare the MAE with established protocols for the extractionf phenolic acids.
The experimental data obtained from the 30-run-experimentiven in Table 1 were analyzed using Design-Expert 7.1.3. The anal-sis of variance (ANOVA) of phenolic acids extraction yield showed
hat experimental data had correlation coefficient (R2) of 0.9509ith the calculated model with no significant lack of fit at P > 0.05.hat means the calculated model was able to explain 95.09% of theesults in the case of phenolic acids extraction yield. The resultsndicated that the model used to fit the response variable was
significant (P < 0.01) and adequate to represent the relationshipbetween the response and the independent variables.
For the linear effects of each independent variable withinthe experimental range, it can be seen in Table 2 that phe-nolic acids extraction yield was affected most significantly bytime (X2) (P = 0.0001), followed by liquid to solid ratio (X3)(P = 0.0007), methanol concentration (X4) (P = 0.0012) and power(X1) (P = 0.0374). It was evident that all the linear and quadraticparameters and three interaction parameters (X1X2, X1X3, X1X4)were significant at the level of P < 0.05 or P < 0.01, whereas the otherinteraction parameters were insignificant (P > 0.1). Neglecting thenon-significant parameters, the final predictive equation obtainedwas given as below:
Y = 1160.19 + 5.39X1 + 14.44X2 + 9.97X3 − 9.39X4 − 7.85X1X2
+ 8.20X1X3 + 6.95X1X4 − 18.23X21 − 13.60X2
2 − 11.95X23
− 24.71X24
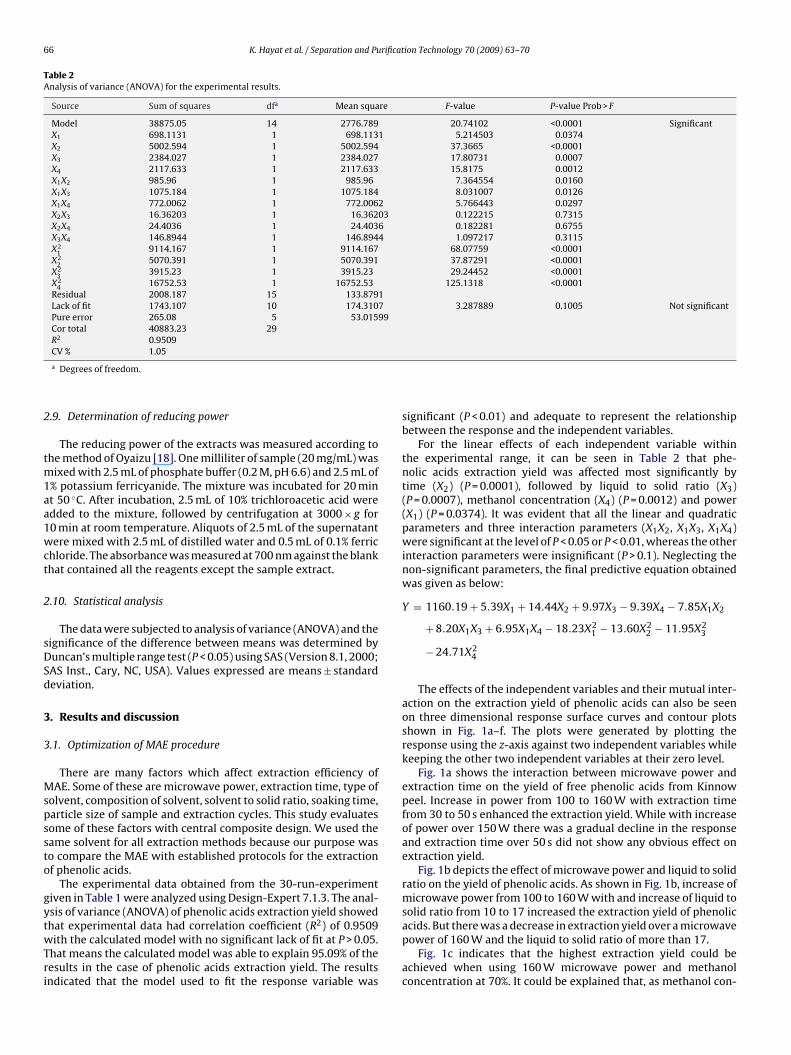
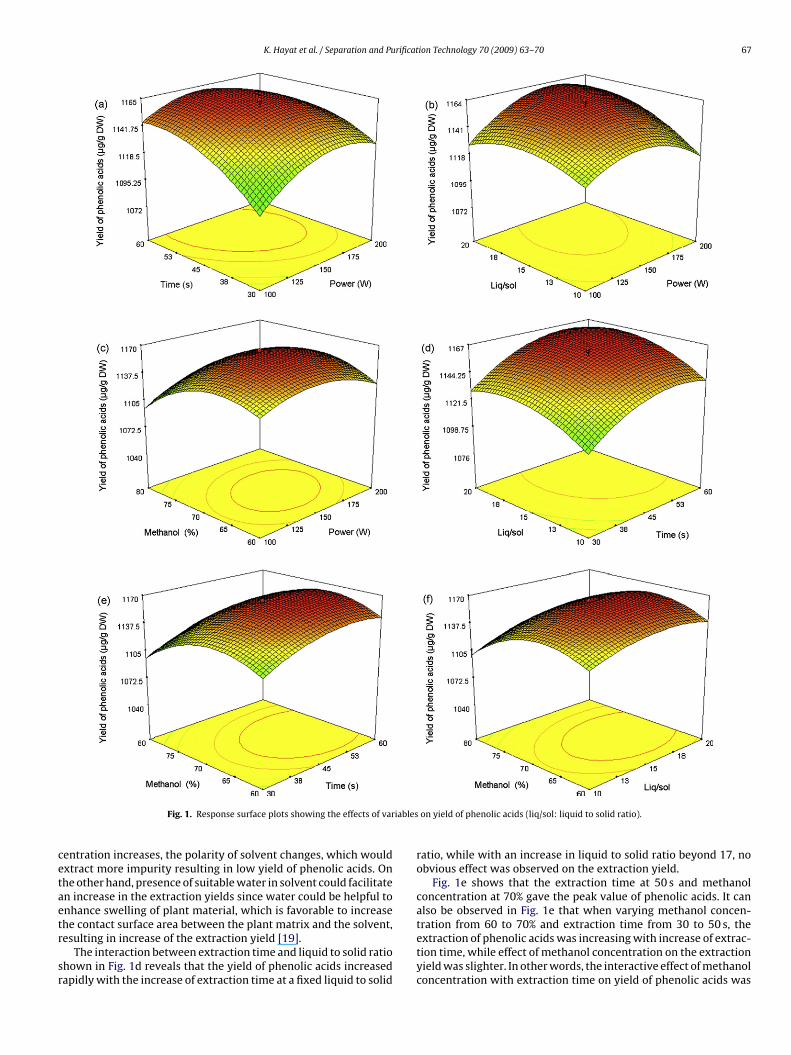
The effects of the independent variables and their mutual inter-action on the extraction yield of phenolic acids can also be seenon three dimensional response surface curves and contour plotsshown in Fig. 1a–f. The plots were generated by plotting theresponse using the z-axis against two independent variables whilekeeping the other two independent variables at their zero level.
Fig. 1a shows the interaction between microwave power andextraction time on the yield of free phenolic acids from Kinnowpeel. Increase in power from 100 to 160 W with extraction timefrom 30 to 50 s enhanced the extraction yield. While with increaseof power over 150 W there was a gradual decline in the responseand extraction time over 50 s did not show any obvious effect onextraction yield.
Fig. 1b depicts the effect of microwave power and liquid to solidratio on the yield of phenolic acids. As shown in Fig. 1b, increase ofmicrowave power from 100 to 160 W with and increase of liquid tosolid ratio from 10 to 17 increased the extraction yield of phenolic
acids. But there was a decrease in extraction yield over a microwavepower of 160 W and the liquid to solid ratio of more than 17.Fig. 1c indicates that the highest extraction yield could beachieved when using 160 W microwave power and methanolconcentration at 70%. It could be explained that, as methanol con-
K. Hayat et al. / Separation and Purification Technology 70 (2009) 63–70 67
iables
cetaetr
sr
Fig. 1. Response surface plots showing the effects of var
entration increases, the polarity of solvent changes, which wouldxtract more impurity resulting in low yield of phenolic acids. Onhe other hand, presence of suitable water in solvent could facilitaten increase in the extraction yields since water could be helpful tonhance swelling of plant material, which is favorable to increase
he contact surface area between the plant matrix and the solvent,esulting in increase of the extraction yield [19].The interaction between extraction time and liquid to solid ratiohown in Fig. 1d reveals that the yield of phenolic acids increasedapidly with the increase of extraction time at a fixed liquid to solid
on yield of phenolic acids (liq/sol: liquid to solid ratio).
ratio, while with an increase in liquid to solid ratio beyond 17, noobvious effect was observed on the extraction yield.
Fig. 1e shows that the extraction time at 50 s and methanolconcentration at 70% gave the peak value of phenolic acids. It canalso be observed in Fig. 1e that when varying methanol concen-
tration from 60 to 70% and extraction time from 30 to 50 s, theextraction of phenolic acids was increasing with increase of extrac-tion time, while effect of methanol concentration on the extractionyield was slighter. In other words, the interactive effect of methanolconcentration with extraction time on yield of phenolic acids was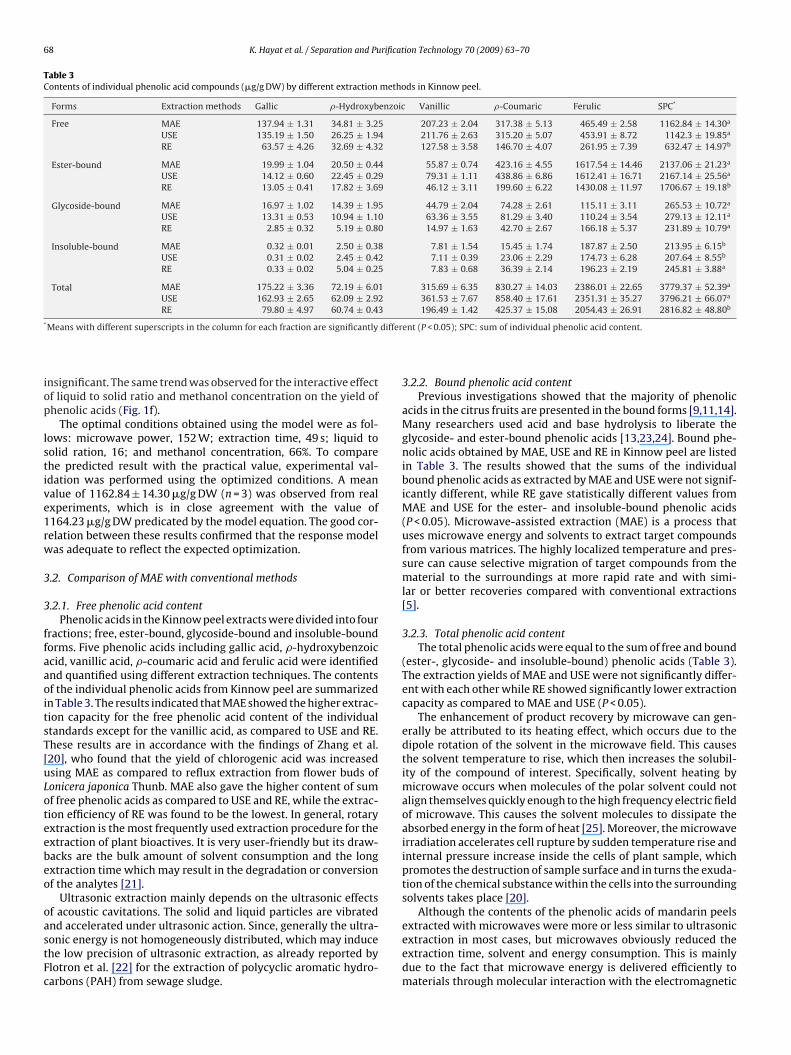
68 K. Hayat et al. / Separation and Purification Technology 70 (2009) 63–70
Table 3Contents of individual phenolic acid compounds (�g/g DW) by different extraction methods in Kinnow peel.
Forms Extraction methods Gallic �-Hydroxybenzoic Vanillic �-Coumaric Ferulic SPC*
Free MAE 137.94 ± 1.31 34.81 ± 3.25 207.23 ± 2.04 317.38 ± 5.13 465.49 ± 2.58 1162.84 ± 14.30a
USE 135.19 ± 1.50 26.25 ± 1.94 211.76 ± 2.63 315.20 ± 5.07 453.91 ± 8.72 1142.3 ± 19.85a
RE 63.57 ± 4.26 32.69 ± 4.32 127.58 ± 3.58 146.70 ± 4.07 261.95 ± 7.39 632.47 ± 14.97b
Ester-bound MAE 19.99 ± 1.04 20.50 ± 0.44 55.87 ± 0.74 423.16 ± 4.55 1617.54 ± 14.46 2137.06 ± 21.23a
USE 14.12 ± 0.60 22.45 ± 0.29 79.31 ± 1.11 438.86 ± 6.86 1612.41 ± 16.71 2167.14 ± 25.56a
RE 13.05 ± 0.41 17.82 ± 3.69 46.12 ± 3.11 199.60 ± 6.22 1430.08 ± 11.97 1706.67 ± 19.18b
Glycoside-bound MAE 16.97 ± 1.02 14.39 ± 1.95 44.79 ± 2.04 74.28 ± 2.61 115.11 ± 3.11 265.53 ± 10.72a
USE 13.31 ± 0.53 10.94 ± 1.10 63.36 ± 3.55 81.29 ± 3.40 110.24 ± 3.54 279.13 ± 12.11a
RE 2.85 ± 0.32 5.19 ± 0.80 14.97 ± 1.63 42.70 ± 2.67 166.18 ± 5.37 231.89 ± 10.79a
Insoluble-bound MAE 0.32 ± 0.01 2.50 ± 0.38 7.81 ± 1.54 15.45 ± 1.74 187.87 ± 2.50 213.95 ± 6.15b
USE 0.31 ± 0.02 2.45 ± 0.42 7.11 ± 0.39 23.06 ± 2.29 174.73 ± 6.28 207.64 ± 8.55b
RE 0.33 ± 0.02 5.04 ± 0.25 7.83 ± 0.68 36.39 ± 2.14 196.23 ± 2.19 245.81 ± 3.88a
Total MAE 175.22 ± 3.36 72.19 ± 6.01 315.69 ± 6.35 830.27 ± 14.03 2386.01 ± 22.65 3779.37 ± 52.39a
USE 162.93 ± 2.65 62.09 ± 2.92 361.53 ± 7.67 858.40 ± 17.61 2351.31 ± 35.27 3796.21 ± 66.07a
RE 79.80 ± 4.97 60.74 ± 0.43 196.49 ± 1.42 425.37 ± 15.08 2054.43 ± 26.91 2816.82 ± 48.80b
* differ
iop
lstive1rw
3
3
ffaaoitsT[uLoteebeo
oastFc
Means with different superscripts in the column for each fraction are significantly
nsignificant. The same trend was observed for the interactive effectf liquid to solid ratio and methanol concentration on the yield ofhenolic acids (Fig. 1f).
The optimal conditions obtained using the model were as fol-ows: microwave power, 152 W; extraction time, 49 s; liquid toolid ration, 16; and methanol concentration, 66%. To comparehe predicted result with the practical value, experimental val-dation was performed using the optimized conditions. A meanalue of 1162.84 ± 14.30 �g/g DW (n = 3) was observed from realxperiments, which is in close agreement with the value of164.23 �g/g DW predicated by the model equation. The good cor-elation between these results confirmed that the response modelas adequate to reflect the expected optimization.
.2. Comparison of MAE with conventional methods
.2.1. Free phenolic acid contentPhenolic acids in the Kinnow peel extracts were divided into four
ractions; free, ester-bound, glycoside-bound and insoluble-boundorms. Five phenolic acids including gallic acid, �-hydroxybenzoiccid, vanillic acid, �-coumaric acid and ferulic acid were identifiednd quantified using different extraction techniques. The contentsf the individual phenolic acids from Kinnow peel are summarizedn Table 3. The results indicated that MAE showed the higher extrac-ion capacity for the free phenolic acid content of the individualtandards except for the vanillic acid, as compared to USE and RE.hese results are in accordance with the findings of Zhang et al.20], who found that the yield of chlorogenic acid was increasedsing MAE as compared to reflux extraction from flower buds ofonicera japonica Thunb. MAE also gave the higher content of sumf free phenolic acids as compared to USE and RE, while the extrac-ion efficiency of RE was found to be the lowest. In general, rotaryxtraction is the most frequently used extraction procedure for thextraction of plant bioactives. It is very user-friendly but its draw-acks are the bulk amount of solvent consumption and the longxtraction time which may result in the degradation or conversionf the analytes [21].
Ultrasonic extraction mainly depends on the ultrasonic effectsf acoustic cavitations. The solid and liquid particles are vibrated
nd accelerated under ultrasonic action. Since, generally the ultra-onic energy is not homogeneously distributed, which may inducehe low precision of ultrasonic extraction, as already reported bylotron et al. [22] for the extraction of polycyclic aromatic hydro-arbons (PAH) from sewage sludge.ent (P < 0.05); SPC: sum of individual phenolic acid content.
3.2.2. Bound phenolic acid contentPrevious investigations showed that the majority of phenolic
acids in the citrus fruits are presented in the bound forms [9,11,14].Many researchers used acid and base hydrolysis to liberate theglycoside- and ester-bound phenolic acids [13,23,24]. Bound phe-nolic acids obtained by MAE, USE and RE in Kinnow peel are listedin Table 3. The results showed that the sums of the individualbound phenolic acids as extracted by MAE and USE were not signif-icantly different, while RE gave statistically different values fromMAE and USE for the ester- and insoluble-bound phenolic acids(P < 0.05). Microwave-assisted extraction (MAE) is a process thatuses microwave energy and solvents to extract target compoundsfrom various matrices. The highly localized temperature and pres-sure can cause selective migration of target compounds from thematerial to the surroundings at more rapid rate and with simi-lar or better recoveries compared with conventional extractions[5].
3.2.3. Total phenolic acid contentThe total phenolic acids were equal to the sum of free and bound
(ester-, glycoside- and insoluble-bound) phenolic acids (Table 3).The extraction yields of MAE and USE were not significantly differ-ent with each other while RE showed significantly lower extractioncapacity as compared to MAE and USE (P < 0.05).
The enhancement of product recovery by microwave can gen-erally be attributed to its heating effect, which occurs due to thedipole rotation of the solvent in the microwave field. This causesthe solvent temperature to rise, which then increases the solubil-ity of the compound of interest. Specifically, solvent heating bymicrowave occurs when molecules of the polar solvent could notalign themselves quickly enough to the high frequency electric fieldof microwave. This causes the solvent molecules to dissipate theabsorbed energy in the form of heat [25]. Moreover, the microwaveirradiation accelerates cell rupture by sudden temperature rise andinternal pressure increase inside the cells of plant sample, whichpromotes the destruction of sample surface and in turns the exuda-tion of the chemical substance within the cells into the surroundingsolvents takes place [20].
Although the contents of the phenolic acids of mandarin peels
extracted with microwaves were more or less similar to ultrasonicextraction in most cases, but microwaves obviously reduced theextraction time, solvent and energy consumption. This is mainlydue to the fact that microwave energy is delivered efficiently tomaterials through molecular interaction with the electromagnetic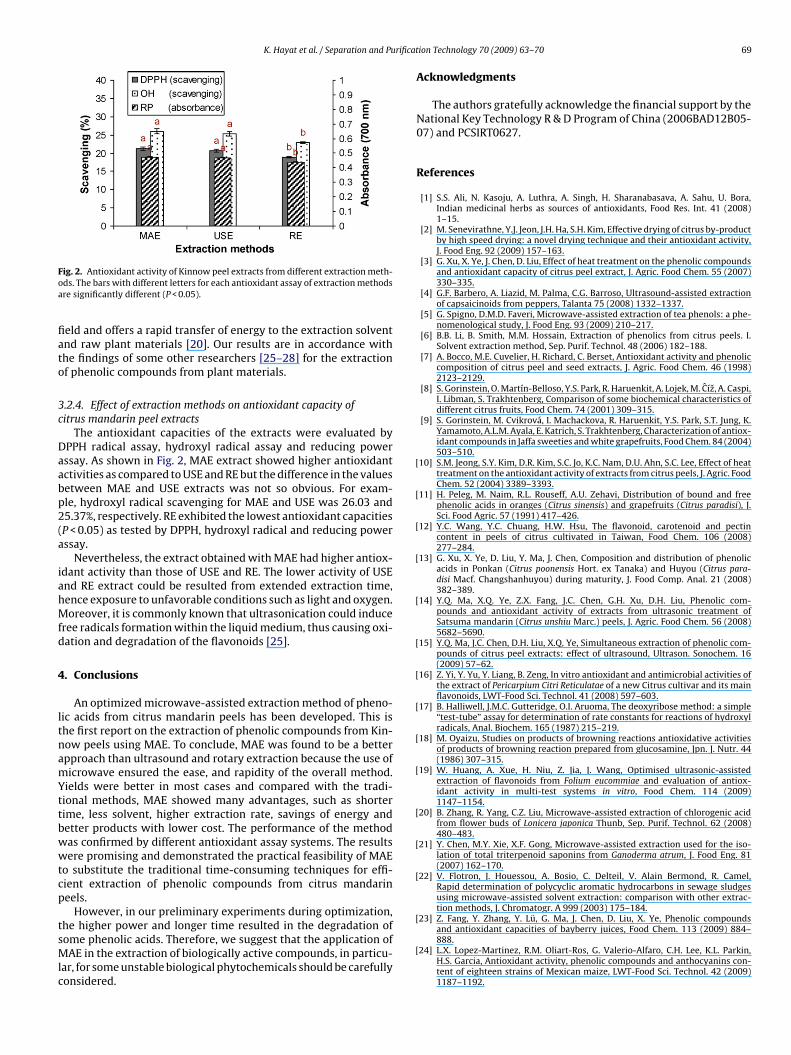
K. Hayat et al. / Separation and Purificat
Foa
fiato
3c
Daabp2(a
iahMfd
4
ltnamYttbwwtcp
tsMlc
[
[
[
[
[
[
[
[
[
[
[
[
[
[
ig. 2. Antioxidant activity of Kinnow peel extracts from different extraction meth-ds. The bars with different letters for each antioxidant assay of extraction methodsre significantly different (P < 0.05).
eld and offers a rapid transfer of energy to the extraction solventnd raw plant materials [20]. Our results are in accordance withhe findings of some other researchers [25–28] for the extractionf phenolic compounds from plant materials.
.2.4. Effect of extraction methods on antioxidant capacity ofitrus mandarin peel extracts
The antioxidant capacities of the extracts were evaluated byPPH radical assay, hydroxyl radical assay and reducing powerssay. As shown in Fig. 2, MAE extract showed higher antioxidantctivities as compared to USE and RE but the difference in the valuesetween MAE and USE extracts was not so obvious. For exam-le, hydroxyl radical scavenging for MAE and USE was 26.03 and5.37%, respectively. RE exhibited the lowest antioxidant capacitiesP < 0.05) as tested by DPPH, hydroxyl radical and reducing powerssay.
Nevertheless, the extract obtained with MAE had higher antiox-dant activity than those of USE and RE. The lower activity of USEnd RE extract could be resulted from extended extraction time,ence exposure to unfavorable conditions such as light and oxygen.oreover, it is commonly known that ultrasonication could induce
ree radicals formation within the liquid medium, thus causing oxi-ation and degradation of the flavonoids [25].
. Conclusions
An optimized microwave-assisted extraction method of pheno-ic acids from citrus mandarin peels has been developed. This ishe first report on the extraction of phenolic compounds from Kin-ow peels using MAE. To conclude, MAE was found to be a betterpproach than ultrasound and rotary extraction because the use oficrowave ensured the ease, and rapidity of the overall method.
ields were better in most cases and compared with the tradi-ional methods, MAE showed many advantages, such as shorterime, less solvent, higher extraction rate, savings of energy andetter products with lower cost. The performance of the methodas confirmed by different antioxidant assay systems. The resultsere promising and demonstrated the practical feasibility of MAE
o substitute the traditional time-consuming techniques for effi-ient extraction of phenolic compounds from citrus mandarineels.
However, in our preliminary experiments during optimization,he higher power and longer time resulted in the degradation of
ome phenolic acids. Therefore, we suggest that the application ofAE in the extraction of biologically active compounds, in particu-ar, for some unstable biological phytochemicals should be carefullyonsidered.
[
ion Technology 70 (2009) 63–70 69
Acknowledgments
The authors gratefully acknowledge the financial support by theNational Key Technology R & D Program of China (2006BAD12B05-07) and PCSIRT0627.
References
[1] S.S. Ali, N. Kasoju, A. Luthra, A. Singh, H. Sharanabasava, A. Sahu, U. Bora,Indian medicinal herbs as sources of antioxidants, Food Res. Int. 41 (2008)1–15.
[2] M. Senevirathne, Y.J. Jeon, J.H. Ha, S.H. Kim, Effective drying of citrus by-productby high speed drying: a novel drying technique and their antioxidant activity,J. Food Eng. 92 (2009) 157–163.
[3] G. Xu, X. Ye, J. Chen, D. Liu, Effect of heat treatment on the phenolic compoundsand antioxidant capacity of citrus peel extract, J. Agric. Food Chem. 55 (2007)330–335.
[4] G.F. Barbero, A. Liazid, M. Palma, C.G. Barroso, Ultrasound-assisted extractionof capsaicinoids from peppers, Talanta 75 (2008) 1332–1337.
[5] G. Spigno, D.M.D. Faveri, Microwave-assisted extraction of tea phenols: a phe-nomenological study, J. Food Eng. 93 (2009) 210–217.
[6] B.B. Li, B. Smith, M.M. Hossain, Extraction of phenolics from citrus peels. I.Solvent extraction method, Sep. Purif. Technol. 48 (2006) 182–188.
[7] A. Bocco, M.E. Cuvelier, H. Richard, C. Berset, Antioxidant activity and phenoliccomposition of citrus peel and seed extracts, J. Agric. Food Chem. 46 (1998)2123–2129.
[8] S. Gorinstein, O. Martín-Belloso, Y.S. Park, R. Haruenkit, A. Lojek, M. Cíz, A. Caspi,I. Libman, S. Trakhtenberg, Comparison of some biochemical characteristics ofdifferent citrus fruits, Food Chem. 74 (2001) 309–315.
[9] S. Gorinstein, M. Cvikrová, I. Machackova, R. Haruenkit, Y.S. Park, S.T. Jung, K.Yamamoto, A.L.M. Ayala, E. Katrich, S. Trakhtenberg, Characterization of antiox-idant compounds in Jaffa sweeties and white grapefruits, Food Chem. 84 (2004)503–510.
10] S.M. Jeong, S.Y. Kim, D.R. Kim, S.C. Jo, K.C. Nam, D.U. Ahn, S.C. Lee, Effect of heattreatment on the antioxidant activity of extracts from citrus peels, J. Agric. FoodChem. 52 (2004) 3389–3393.
11] H. Peleg, M. Naim, R.L. Rouseff, A.U. Zehavi, Distribution of bound and freephenolic acids in oranges (Citrus sinensis) and grapefruits (Citrus paradisi), J.Sci. Food Agric. 57 (1991) 417–426.
12] Y.C. Wang, Y.C. Chuang, H.W. Hsu, The flavonoid, carotenoid and pectincontent in peels of citrus cultivated in Taiwan, Food Chem. 106 (2008)277–284.
13] G. Xu, X. Ye, D. Liu, Y. Ma, J. Chen, Composition and distribution of phenolicacids in Ponkan (Citrus poonensis Hort. ex Tanaka) and Huyou (Citrus para-disi Macf. Changshanhuyou) during maturity, J. Food Comp. Anal. 21 (2008)382–389.
14] Y.Q. Ma, X.Q. Ye, Z.X. Fang, J.C. Chen, G.H. Xu, D.H. Liu, Phenolic com-pounds and antioxidant activity of extracts from ultrasonic treatment ofSatsuma mandarin (Citrus unshiu Marc.) peels, J. Agric. Food Chem. 56 (2008)5682–5690.
15] Y.Q. Ma, J.C. Chen, D.H. Liu, X.Q. Ye, Simultaneous extraction of phenolic com-pounds of citrus peel extracts: effect of ultrasound, Ultrason. Sonochem. 16(2009) 57–62.
16] Z. Yi, Y. Yu, Y. Liang, B. Zeng, In vitro antioxidant and antimicrobial activities ofthe extract of Pericarpium Citri Reticulatae of a new Citrus cultivar and its mainflavonoids, LWT-Food Sci. Technol. 41 (2008) 597–603.
17] B. Halliwell, J.M.C. Gutteridge, O.I. Aruoma, The deoxyribose method: a simple“test-tube” assay for determination of rate constants for reactions of hydroxylradicals, Anal. Biochem. 165 (1987) 215–219.
18] M. Oyaizu, Studies on products of browning reactions antioxidative activitiesof products of browning reaction prepared from glucosamine, Jpn. J. Nutr. 44(1986) 307–315.
19] W. Huang, A. Xue, H. Niu, Z. Jia, J. Wang, Optimised ultrasonic-assistedextraction of flavonoids from Folium eucommiae and evaluation of antiox-idant activity in multi-test systems in vitro, Food Chem. 114 (2009)1147–1154.
20] B. Zhang, R. Yang, C.Z. Liu, Microwave-assisted extraction of chlorogenic acidfrom flower buds of Lonicera japonica Thunb, Sep. Purif. Technol. 62 (2008)480–483.
21] Y. Chen, M.Y. Xie, X.F. Gong, Microwave-assisted extraction used for the iso-lation of total triterpenoid saponins from Ganoderma atrum, J. Food Eng. 81(2007) 162–170.
22] V. Flotron, J. Houessou, A. Bosio, C. Delteil, V. Alain Bermond, R. Camel,Rapid determination of polycyclic aromatic hydrocarbons in sewage sludgesusing microwave-assisted solvent extraction: comparison with other extrac-tion methods, J. Chromatogr. A 999 (2003) 175–184.
23] Z. Fang, Y. Zhang, Y. Lü, G. Ma, J. Chen, D. Liu, X. Ye, Phenolic compounds
and antioxidant capacities of bayberry juices, Food Chem. 113 (2009) 884–888.24] L.X. Lopez-Martinez, R.M. Oliart-Ros, G. Valerio-Alfaro, C.H. Lee, K.L. Parkin,H.S. Garcia, Antioxidant activity, phenolic compounds and anthocyanins con-tent of eighteen strains of Mexican maize, LWT-Food Sci. Technol. 42 (2009)1187–1192.

7 rificat
[
[
0 K. Hayat et al. / Separation and Pu
25] S. Hemwimon, P. Pavasant, A. Shotipruk, Microwave-assisted extraction ofantioxidative anthraquinones from roots of Morinda citrifolia, Sep. Purif. Tech-nol. 54 (2007) 44–50.
26] C. Proestos, M. Komaitis, Application of microwave-assisted extraction to thefast extraction of plant phenolic compounds, LWT-Food Sci. Technol. 41 (2008)652–659.
[
[
ion Technology 70 (2009) 63–70
27] J.H. Kwon, J.M.R. Bélanger, J.R.J. Paré, V.A. Yaylayan, Application of themicrowave-assisted process (MAPTM) to the fast extraction of ginseng saponins,Food Res. Int. 36 (2003) 491–498.
28] W. Xiao, L. Han, B. Shib, Microwave-assisted extraction of flavonoids from RadixAstragali, Sep. Purif. Technol. 62 (2008) 614–618.