Optimization of lipase-catalyzed synthesis of citronellyl acetate in solvent-free medium
8
Optimization of lipase-catalyzed synthesis of diglycerol monooleate by response surface methodology Noureddin El-Boulifi, Jose Aracil, Mercedes Martı´nez* Chemical Engineering Department, Chemistry Faculty, Complutense University, 28040 Madrid, Spain article info Article history: Received 23 May 2013 Received in revised form 10 December 2013 Accepted 15 December 2013 Available online 17 January 2014 Keywords: Diglycerol Diglycerol monooleate Novozym 435 Response surface methodology Surfactant abstract The optimization of the lipase-catalyzed esterification of pure diglycerol (3-(2,3- dihydroxypropoxy)propane-1,2-diol) with pure oleic acid to produce pure diglycerol mon- ooleate (E475) which is a non-ionic surfactants, was performed. Six immobilized lipases were tested and the best oleic acid conversion was attained with Novozym 435 from Candida antarctica which was selected to optimize the reaction conditions by response surface methodology (RSM). Well-fitting quadratic polynomial regression model for acid conversion was established with regard to temperature (65 Ce75 C) and catalyst con- centration (mass fraction of 1e5%). The two factors investigated positively affected acid conversion, with catalyst concentration having the greatest effect. The regression equation obtained by central composite design of RSM predicted optimal reaction conditions of 77 C and 5.8%. Under these optimal conditions the model obtained in this work has been tested in scale-up experiment, and the resulting acid conversion was 93.9% with an accuracy of 97.4%. Within the experimental range studied the results model give good agreement with the experimental data. ª 2013 Elsevier Ltd. All rights reserved. 1. Introduction Polyglycerol esters of fatty acids (PGE, E475) are non-ionic surfactants that have been used during the last years as emulsifiers in food and personal care products [1,2]. More recently, new industrial applications based on PGE have been developed, includes their utilization as antifogging and anti- static additives, lubricants and plasticizers [1,3]. The PGE are an amphipathic molecules with hydrophilic moiety (hy- droxyl groups) attached to a hydrophobic backbone (alkyl chain). These two parts provide a compound with interfacial activity and give rise to a wide range of surface chemistry functions. Glycerol is the main by-product of biodiesel production. As the biodiesel production is increasing exponentially, the crude glycerol generated from the transesterification of oils has also been generated in a large quantity. The valorization of glycerol as by-product increases the economic sustainability of the biodiesel industry. Within this context, among the wide application of glycerol in food, the use of glycerol for the production of non-ionic surfactants like glycerol esters of fatty acids, can be a good way forward to development of surfac- tants products entirely derived from renewable resource [4,5]. However, glycerol itself is not a good primary constituent of the hydrophilic part of the surfactant and polyglycerols are needed to increase the hydrophilicity and to adjust the hydrophilic-hydrophobic balance of the products. Since the * Corresponding author. Tel./fax: þ34 91 394 4167. E-mail address: [email protected] (M.Martı´nez). Available online at www.sciencedirect.com ScienceDirect http://www.elsevier.com/locate/biombioe biomass and bioenergy 61 (2014) 179 e186 0961-9534/$ e see front matter ª 2013 Elsevier Ltd. All rights reserved. http://dx.doi.org/10.1016/j.biombioe.2013.12.009
-
Upload
independent -
Category
Documents
-
view
4 -
download
0
Transcript of Optimization of lipase-catalyzed synthesis of citronellyl acetate in solvent-free medium

ww.sciencedirect.com
b i om a s s a n d b i o e n e r g y 6 1 ( 2 0 1 4 ) 1 7 9e1 8 6
Available online at w
ScienceDirect
http: / /www.elsevier .com/locate/biombioe
Optimization of lipase-catalyzed synthesis ofdiglycerol monooleate by response surfacemethodology
Noureddin El-Boulifi, Jose Aracil, Mercedes Martınez*
Chemical Engineering Department, Chemistry Faculty, Complutense University, 28040 Madrid, Spain
a r t i c l e i n f o
Article history:
Received 23 May 2013
Received in revised form
10 December 2013
Accepted 15 December 2013
Available online 17 January 2014
Keywords:
Diglycerol
Diglycerol monooleate
Novozym 435
Response surface methodology
Surfactant
* Corresponding author. Tel./fax: þ34 91 394E-mail address: [email protected] (M.
0961-9534/$ e see front matter ª 2013 Elsevhttp://dx.doi.org/10.1016/j.biombioe.2013.12.
a b s t r a c t
The optimization of the lipase-catalyzed esterification of pure diglycerol (3-(2,3-
dihydroxypropoxy)propane-1,2-diol) with pure oleic acid to produce pure diglycerol mon-
ooleate (E475) which is a non-ionic surfactants, was performed. Six immobilized lipases
were tested and the best oleic acid conversion was attained with Novozym 435 from
Candida antarctica which was selected to optimize the reaction conditions by response
surface methodology (RSM). Well-fitting quadratic polynomial regression model for acid
conversion was established with regard to temperature (65 �Ce75 �C) and catalyst con-
centration (mass fraction of 1e5%). The two factors investigated positively affected acid
conversion, with catalyst concentration having the greatest effect. The regression equation
obtained by central composite design of RSM predicted optimal reaction conditions of 77 �C
and 5.8%. Under these optimal conditions the model obtained in this work has been tested
in scale-up experiment, and the resulting acid conversion was 93.9% with an accuracy of
97.4%. Within the experimental range studied the results model give good agreement with
the experimental data.
ª 2013 Elsevier Ltd. All rights reserved.
1. Introduction
Polyglycerol esters of fatty acids (PGE, E475) are non-ionic
surfactants that have been used during the last years as
emulsifiers in food and personal care products [1,2]. More
recently, new industrial applications based on PGE have been
developed, includes their utilization as antifogging and anti-
static additives, lubricants and plasticizers [1,3]. The PGE
are an amphipathic molecules with hydrophilic moiety (hy-
droxyl groups) attached to a hydrophobic backbone (alkyl
chain). These two parts provide a compound with interfacial
activity and give rise to a wide range of surface chemistry
functions.
4167.Martınez).ier Ltd. All rights reserved009
Glycerol is the main by-product of biodiesel production. As
the biodiesel production is increasing exponentially, the crude
glycerol generated from the transesterification of oils has also
been generated in a large quantity. The valorization of glycerol
as by-product increases the economic sustainability of the
biodiesel industry. Within this context, among the wide
application of glycerol in food, the use of glycerol for the
production of non-ionic surfactants like glycerol esters of fatty
acids, can be a good way forward to development of surfac-
tants products entirely derived from renewable resource [4,5].
However, glycerol itself is not a good primary constituent of
the hydrophilic part of the surfactant and polyglycerols are
needed to increase the hydrophilicity and to adjust the
hydrophilic-hydrophobic balance of the products. Since the
.

Scheme 1 e .TIF. Diglycerol monooleate ester synthesis.
b i om a s s a n d b i o e n e r g y 6 1 ( 2 0 1 4 ) 1 7 9e1 8 6180
phase behavior of diglycerol and glycerol esters of fatty acid,
shown that the presence of strong intramolecular H-bonds
within the diglycerol headgroup increases the polar part vol-
ume and thus causes a swelling of the lamellar phase [6]. PGE
have an unexpectedly low solubility in water; they are of in-
terest as stable carriers for drugs, cosmetics, or specific food
ingredients. Among the commercial mixtures of PGE, the
main component is diglycerol ester [7] and pure diglycerol
esters have been shown to be efficient surfactants [8], thereby
creating a demand for more specific synthesis procedures of
PGE.
Current processes for production of fatty acid esters of
polyglycerols are based on direct esterification of the poly-
glycerol with fatty acids [9], transesterification of the poly-
glycerol with a triglyceride or a fatty acid methyl ester [10] or
addition polymerization of glycidol to a fatty acid or to a fatty
acid monoglyceride [11]. Esterification method is the best
suited for the production of designer polyglycerol ester
because the desired free fatty acid and polyglycerol can easily
be selected prior to polyglycerol ester formation.
Conventional production of polyglycerol esters by esterifi-
cation commonly involves the use either alkali [9,12] or acid
catalysts [10]. But, besides the environmental problem, these
catalysts favor side-reactions from the degradation of the
fatty acid (oxidation and dimerization) or from the poly-
glycerol (dehydration into acrolein and oxidation) [13].
A few decades ago, the employment of lipases as bio-
catalysts for esterification reactions has emerged as a poten-
tial route to replace the conventional chemical process [14,15].
The main reason is that they are employed as active and se-
lective catalysts in a variety of reactions, with fewer envi-
ronmental problems, and in the case of immobilized lipases,
they can be reused.
So far, to our knowledge, the use of pure diglycerol to
produce diglycerol fatty acid mono-esters has received little
Table 1 e Properties of immobilized lipases used in diglycerol
Microorganisms Lipase Support
Rhizomucor miehei Lipozyme IM-20 Anion exchange res
Lipozyme IM Anion exchange res
Lipozyme IM-50 Anion exchange res
Candida antarctica Novozym 435 Acrylic resin
Novozym SP 435-A Acrylic resin
Novozym SP 435-L Acrylic resin
attention. The objective of our study was to model the
lipase-catalyzed esterification of pure diglycerol with oleic
acid to produce pure diglycerol monooleate ester (Scheme 1)
in a solvent-free system. Six different commercially avail-
able lipases were evaluated for their catalytic activity in the
reaction. For selected lipase (Novozym 435), the modeling
and optimization of the reaction by RSM was performed
with respect to temperature and catalyst concentration as
independent variables and acid conversion as a response
variable, and then the optimal reaction conditions were
proposed.
2. Materials and methods
2.1. Materials
Diglycerol (purity > 98%) was supplied by Solvay Quımica S.L.
(Spain) and oleic acid (purity > 98%) was supplied by Henkel
Iberica. The six immobilized thermostable lipases were pro-
vided by Novozymes A/S (Bagsvœrd, Denmark). Table 1 sum-
marizes some of the properties of reported lipases. All
solvents used for the chromatographic analysis were of high-
performance liquid chromatography (HPLC) grade, supplied
by SigmaeAldrich.
2.2. Equipment
Reactions were performed in a solvent-free system using a
batch stirred reactor of 500 cm3 volume, under fixed condi-
tions of pressure and temperature. Pressure, stirring speed
and temperature controllers were provided. The propeller
used was marine-type and the speed was set at 62.8 rad s�1.
The desired working pressure (7.998 kPa) was maintained by a
vacuum pump. This permitted ready elimination of water
from the system in range of temperature studied, without
significant variations of viscosity of the liquid phase or reac-
tion volume. The reaction temperature was achieved
immersing the reactor into a thermostatic bath with an elec-
trical device connected to a PID controller which allows a
temperature control of �0.1 �C.
2.3. Lipase-catalyzed esterification
Oleic acid (45 g, 160 mmol) and diglycerol (72 g, 433 mmol) were
added to the reactor and the stirring was started. When the
desired temperature was reached, the catalyst was added and
the vacuum pump was turned on in order to drive the equi-
librium towards the diglycerol monooleate ester synthesis.
monooleate production.
Surface area (dam2 kg�1) Pore diameter (nm)
in 3.6 14.1
in 6.0 17.6
in 6.2 24.3
2.9 29.2
6.7 21.0
9.5 17.9
40
50
6070
80
90
vers
ion(
%)
b i om a s s a n d b i o e n e r g y 6 1 ( 2 0 1 4 ) 1 7 9e1 8 6 181
The reaction was stirred during 240 min. Samples were taken
at regular intervals (at 30, 60, 120 and 240 min) and analyzed
by gas chromatography-mass spectrometry (GC-MS). During
the experiments, the acid:alcohol molar ratio (1:1), pressure
(7.998 kPa) and agitation speed (62.8 rad s�1) were maintained
constant.
0
10
2030
(A) (B) (C) (D) (E) (F)Lipases
wac
id c
on
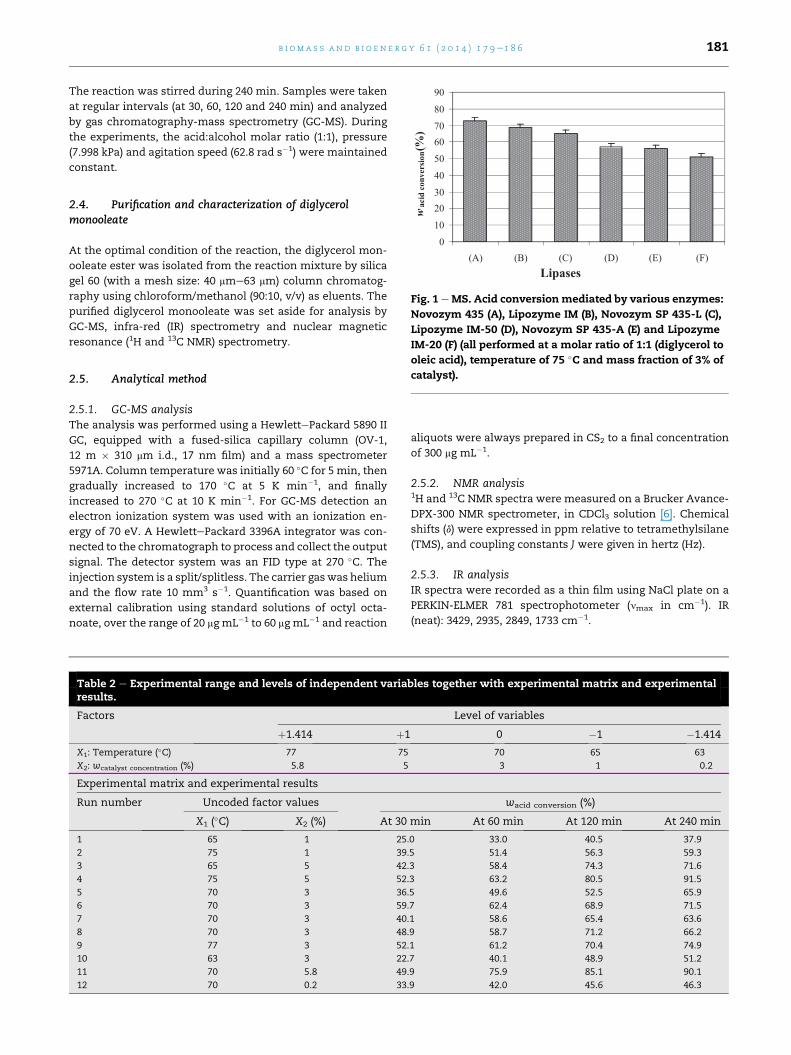
Fig. 1 eMS. Acid conversionmediated by various enzymes:
Novozym 435 (A), Lipozyme IM (B), Novozym SP 435-L (C),
Lipozyme IM-50 (D), Novozym SP 435-A (E) and Lipozyme
IM-20 (F) (all performed at a molar ratio of 1:1 (diglycerol to
2.4. Purification and characterization of diglycerolmonooleate
At the optimal condition of the reaction, the diglycerol mon-
ooleate ester was isolated from the reaction mixture by silica
gel 60 (with a mesh size: 40 mme63 mm) column chromatog-
raphy using chloroform/methanol (90:10, v/v) as eluents. The
purified diglycerol monooleate was set aside for analysis by
GC-MS, infra-red (IR) spectrometry and nuclear magnetic
resonance (1H and 13C NMR) spectrometry.
oleic acid), temperature of 75 �C and mass fraction of 3% of
catalyst).
2.5. Analytical method2.5.1. GC-MS analysisThe analysis was performed using a HewlettePackard 5890 II
GC, equipped with a fused-silica capillary column (OV-1,
12 m � 310 mm i.d., 17 nm film) and a mass spectrometer
5971A. Column temperature was initially 60 �C for 5 min, then
gradually increased to 170 �C at 5 K min�1, and finally
increased to 270 �C at 10 K min�1. For GC-MS detection an
electron ionization system was used with an ionization en-
ergy of 70 eV. A HewlettePackard 3396A integrator was con-
nected to the chromatograph to process and collect the output
signal. The detector system was an FID type at 270 �C. Theinjection system is a split/splitless. The carrier gaswas helium
and the flow rate 10 mm3 s�1. Quantification was based on
external calibration using standard solutions of octyl octa-
noate, over the range of 20 mg mL�1 to 60 mg mL�1 and reaction
Table 2 e Experimental range and levels of independent variaresults.
Factors
þ1.414 þ1
X1: Temperature (�C) 77 75
X2: wcatalyst concentration (%) 5.8 5
Experimental matrix and experimental results
Run number Uncoded factor values
X1 (�C) X2 (%) At 30
1 65 1 25.
2 75 1 39.
3 65 5 42.
4 75 5 52.
5 70 3 36.
6 70 3 59.
7 70 3 40.
8 70 3 48.
9 77 3 52.
10 63 3 22.
11 70 5.8 49.
12 70 0.2 33.
aliquots were always prepared in CS2 to a final concentration
of 300 mg mL�1.
2.5.2. NMR analysis1H and 13C NMR spectra were measured on a Brucker Avance-
DPX-300 NMR spectrometer, in CDCl3 solution [6]. Chemical
shifts (d) were expressed in ppm relative to tetramethylsilane
(TMS), and coupling constants J were given in hertz (Hz).
2.5.3. IR analysisIR spectra were recorded as a thin film using NaCl plate on a
PERKIN-ELMER 781 spectrophotometer (nmax in cm�1). IR
(neat): 3429, 2935, 2849, 1733 cm�1.
bles together with experimental matrix and experimental
Level of variables
0 �1 �1.414
70 65 63
3 1 0.2
wacid conversion (%)
min At 60 min At 120 min At 240 min
0 33.0 40.5 37.9
5 51.4 56.3 59.3
3 58.4 74.3 71.6
3 63.2 80.5 91.5
5 49.6 52.5 65.9
7 62.4 68.9 71.5
1 58.6 65.4 63.6
9 58.7 71.2 66.2
1 61.2 70.4 74.9
7 40.1 48.9 51.2
9 75.9 85.1 90.1
9 42.0 45.6 46.3

Table 3 e Statistical analysisemain effects andinteraction observed as a result of the 22 experimentaldesign (experiments 1e8 in Table 1).
Response: w acid conversion (%)
Main effects and interactions:
At 30 min At 60 min At 120 min At 240 min
IC ¼ 15.1 IC ¼ 18.6 IC ¼ 29.0 IC ¼ 33.0
IT ¼ 12.3 IT ¼ 11.6 IT ¼ 13.6 IT ¼ 20.7
ITC ¼ �2.3 ITC ¼ �6.8 ITC ¼ �4.8 ITC ¼ �0.8
Significance test (Confidence level: 95%)
Mean responses
Y ¼ 26:7 Y ¼ 51:5 Y ¼ 62:9 Y ¼ 65:1
t ¼ 3.182
s ¼ 10.30
t ¼ 3.182 s ¼ 5.45 t ¼ 3.182
s ¼ 8.33
t ¼ 3.182
s ¼ 3.34
Confidence interval:
�16.34 �8.61 �13.3 �5.30
Significant variables
e T, C T, C T, C
Curvature
C ¼ 6.54 C ¼ 5.84 C ¼ 1.62 C ¼ 1.71
T, temperature; C, catalyst concentration; I, main effect or inter-
action; s, standard deviation; t, Student’s t-test.
b i om a s s a n d b i o e n e r g y 6 1 ( 2 0 1 4 ) 1 7 9e1 8 6182
2.6. Statistical experimental design
The synthesis of diglycerol monooleate ester using immobi-
lized lipase as catalyst was carried out using a factorial design
of experiments. The experimental design applied to this study
was a full 22 factorial design (two factors each at two levels)
with four central points were added, to evaluate the experi-
ments errors. The factorial design was performed to study the
effect of the variables on the process and the interaction be-
tween them. The RSM was applied to optimize the process.
The response selected was the previously defined, acid con-
version. It is relative to the initial amount of oleic acid. The
two factors considered to model and optimize the lipase-
catalyzed esterification were temperature (65 �Ce75 �C) andcatalyst concentration (mass fraction of 1e5%). The ranges of
these two parameters were chosen based on results obtained
in our laboratory in preliminary kinetic study of diglycerol
monooleate synthesis [16] and are given in Table 2. The
impeller speed was set to 62.8 rad s�1, working pressure was
hold at 7.998 kPa and the molar ratio of substrates (diglycerol
to oleic acid) was fixed at 1:1 to avoid any excess of the re-
actants and improve the purification process.
3. Results and discussion
3.1. Enzyme screening for optimization
The effects of six immobilized lipases on esterification of pure
diglycerol with oleic acid were investigated, and the results
Table 4 e The predictive response equations relating the a
At 30 min Y ¼ 46.30 þ 8.26X1 þ 6.59X2 � 4.4
At 60 min Y ¼ 57.32 þ 6.63X1 þ 10.64X2 � 4
At 120 min Y ¼ 64.5 þ 6.55X1 þ 14.23X2 � 2.3
At 240 min Y ¼ 66.80 þ 9.35X1 þ 15.98X2 � 2
are represented in Fig. 1. Novozym 435 from Candida antarctica
gave the highest acid conversion (73%). The acid conversion
for Lipozyme IM from Rhizomucor meihei and Novozym SP 435-
L from C. antarctica were 69% and 65%, respectively. However,
the rest of the other ones show little activity (less than 60% of
acid conversion) for the esterification of pure diglycerol with
oleic acid. Comparing the acid conversions (56%, 65% and 73%)
obtained with immobilized lipases Novozym SP 435-A
(2.9 dam2 kg�1), Novozym SP 435-L (6.7 dam2 kg�1) and Novo-
zym 435 (9.5 dam2 kg�1) respectively, it can be seen that with
increasing surface area of support, the acid conversion is
higher. The surface area of a support is of vital importance for
its performance. A large surface area has the positive effect of
spreading out the enzyme and thereby making the active site
accessible [17]. However, although Lipozyme IM and Lipozyme
IM-50 have similar surface area of support (6 dam2 kg�1 and
6.1 dam2 kg�1), the acid conversion using Lipozyme IM is
higher than when Lipozyme IM-50 is used. This would indi-
cate that the acid conversionmaybe is affected by other factor
like, pore diameter. Since using Lipozyme IM-50 with a pore
diameter of 24.3 nm, the acid conversion is 57.6%, lower than
when Lipozyme IM (pore diameter 17.6 nm) is used. This result
shows that the acid conversion increases as the pore diameter
decreases. Similar conclusion is drawn from the analysis of
results for lipases from C. antarctica. The highest acid con-
version (73%) is obtained with Novozym 435 with the smallest
pore diameter. This means to an increase in acid conversion
as the pore diameter decreases. Consequently, Novozym 435
was selected as the more suitable lipase to optimize the re-
action conditions for the production of pure diglycerol mon-
ooleate ester by esterification of diglycerol with oleic acid.
3.2. Optimization by 2-level factorial design
The first step in the process of seeking optimum conditions
was to identify the input variables that have the greatest in-
fluence on the acid conversion. The standard experimental
matrix for the factorial design is shown in Table 2 (Experi-
ments 1e8). Columns 2 and 3 represent the factor levels on
nature scale and columns 4, 5, 6 and 7 represent the acid
conversion, at 30, 60, 120 and 240 min, respectively. The
analysis of main effects and their interactions on acid con-
version, together with the test of statistical significance, a
two-sided t-test with a confidence level of 95% are given in
Table 3. Statistical analysis shows that the two factors, tem-
perature and catalyst concentration has a significant effect,
since the main effect values were higher than the corre-
sponding confidence interval Table 3. The catalyst concen-
tration (mass fraction of 1e5%) is the most important factor
throughout the esterification process for the experimental
range studied. This factor has a positive influence on acid
conversion. It can be observed the low influence of catalyst
cid conversion to process parameters.
7X21 � 1.12X1X2 � 2.17X2
2 (r ¼ 0.860) (2)
.16X21 � 3.40X1X2 � 0.012X2
2 (r ¼ 0.957) (3)
2X21 � 2.40X1X2 þ 0.52X2
2 (r ¼ 0.950) (4)
.01X21 � 0.37X1X2 þ 0.56X2
2 (r ¼ 0.987) (5)

Fig. 2 e TIF. Response surface plot and contour plots of acid conversion as a function of temperature and catalyst
concentration: at 30 min (a), at 60 min (b), at 120 min (c) and at 240 min (d).
b i om a s s a n d b i o e n e r g y 6 1 ( 2 0 1 4 ) 1 7 9e1 8 6 183

Table 5 e The analysis of variance (ANOVA) for responsesurface quadratic polynomial model at 240 min.
Source SS df MS F-value P-value
Regression 2742.66 2 1371.33 161.7 <0.0001
Catalyst
concentration (X2)
2042.96 1 2042.96 182.95 0.0009
Temperature (X1) 699.69 1 699.69 62.66 0.0042
X22 2.025 1 2.025 0.18 0.6989
X21 25.921 1 25.921 2.32 0.225
X1X2 0.5625 1 0.5625 0.05 0.8368
Residual 76.3262 9 8.48
Lack-of-fit 10.1345 3 3.378 0.3 0.8238
SS, sum of squares; df, degrEES OF FREEDom; MS, mean square.
b i om a s s a n d b i o e n e r g y 6 1 ( 2 0 1 4 ) 1 7 9e1 8 6184
concentration at low reaction times. However, this influence
gets more significance at large reaction time. At 240 min of
reaction time, the variation of acid conversion with catalyst
concentration was found not to be uniform in the whole
catalyst concentration range. The high acid conversion in-
crease observed for higher catalyst concentration can prob-
ably be due to formation of diester [18]. Temperature also have
a significant and positive effect on the acid conversion in the
experimental range studied (65 �Ce75 �C) (Table 3). The tem-
perature effect diminishes progressively with the reaction
time from 30 min to 180 min, perhaps due to the decrease in
reaction rate produced by decrease in reactant concentrations
[5]. However, there was no significant interactive effect be-
tween catalyst concentration and temperature in all reaction
times. At 30min of reaction time, neither of the two individual
variable has significant effect on acid conversion.
The results obtained in this first set of experiments were
adjusted by linear regression because the number of different
combinations in the 22 factorial design (experiments 1e8 in
Table 3) was insufficient to carry out a more complex model.
However, there was no evidence that a linear model could be
use to describe the strong relationship that existed between
the process variables. To evaluate if this factorial design was
sufficient to accurately describe the diglycerol monooleate
production process, the statistical significance of the curva-
ture was studied (Table 3). The curvature effect was found
statistically significant and it was necessary to consider a
different design. Consequently, it is necessary to consider a
more complex design to fit the data to a second-ordermodel in
two variables.
r = 0.985
37
47
57
67
77
87
97
37 47 57 67 77 87 97Predicted values
Obv
erve
d va
lues
Fig. 3 e MS. Parity plot showing relationships between
observed and predicted values by the regression model for
the acid conversion at 240 min.
3.3. Optimization by response surface methodology
To better predict the effect of reaction variables, a second-
order model is required, because of the significant curvature
effect found in linear stage. Additional experiments called star
points and coded �a (where a, the distance from the origin to
the star point, is given by a ¼ 2n/4. In this design a ¼ 1.414)
must be incorporated into the 22 factorial design (experiments
9e12 in Table 2) [19]. The corresponding model is a central
composite design. The adjustment of the response variable to
the quadratic model resulted in the following equation (1).
Y ¼ a0 þX2
k¼1
akXk þX2
k¼1
akkX2k þ
X2
ks1
akjXkXj (1)
where Y is the response; Xk and Xj are the uncoded indepen-
dent variables and a0, ak, akk and akj are intercept, linear,
quadratic and interaction constant coefficients, respectively.
The fit of themodel was evaluated by coefficient of correlation
(r) and analysis of variance (ANOVA). This fit showed that the
esterification of pure diglycerol with oleic acid was most
suitably described with a quadratic polynomial model. The
equation of the model based on the coded values Eq. (1) be-
comes Eqs. (2)e(5) (Table 4).
The relationships between reaction parameters and re-
sponses can be better understood by studying response sur-
face plots and the planned series of contour plots generated
from the predicted model. Fig. 2 represents the effect of
varying temperature and catalyst concentration on the acid
conversion as response surface and contour plots, at 30, 60,
120 and 240 min.
Analysis of variance (ANOVA) of this newmodel at 240min
of reaction time (Table 5) showed that its statistical signifi-
cance and predictability (p < 0.0001) was much greater than
that of the linear model developed above. The goodness of fit
of the regressionmodel was evaluated by a test for lack of fit at
95% level of significance. Parity plot between observed values
and values predicted by the model for the acid conversion,
and the coefficients of correlation r, are show in Fig. 3. The plot
showed a satisfactory linear correlation between observed
and predicted values (r ¼ 0.985). This implies that 98.5% of the
variation could be explained by fittedmodel. Joglekar andMay
[20] suggested that for a good fit of amodel, r should be at least
0.80. According to the value of adjusted r (0.983) which is a
modification of r that adjust for the number of variables in a
model, 98.3% of the variance can be explained by the model.
Therefore, these results suggest that well-fitting of the re-
lationships between the reaction parameters investigated and
acid conversion was successfully established.
3.3.1. Influence of operating variables on acid conversion at240 minThe analysis of variance, estimated effect and interactions on
acid conversion at 240 min were listed with statistical signif-
icance in Table 5. The two reaction parameters investigated

Table 6 e Observed values and values predicted byregression model for acid conversion in six additionalexperiments.
Reaction parameters Responses
X1 (�C) X2 (%) wacid conversion (%) Accuracy(%)Observed Predicted
65a 3a 76.1a 75.0 98.50
70a 1a 55.0a 55.4 99.20
75a 3a 51.9a 51.4 99.00
70a 5a 81.4a 83.6 97.30
77a 5.8a 94.1a 96.4 97.80
77b 5.8b 93.9b 96.4 97.40
a Small scale.b Using a 5 dm3 batch reactor.
b i om a s s a n d b i o e n e r g y 6 1 ( 2 0 1 4 ) 1 7 9e1 8 6 185
positively affected the levels of acid conversion, with catalyst
concentration having the greatest effect. In this case, the two
effects have p-values less than 0.05, indicating that they are
significantly different from zero at the 95% confidence level.
Whereas quadratic terms of catalyst concentration and tem-
perature and their interaction had not significant effect
(p > 0.05) on the acid conversion. These results are in agree-
ment with the results shown in the prediction plots for the
acid conversion level by the effect of individual reaction pa-
rameters obtained by our research group in a previous work
[16].
3.4. Optimum conditions and model validation
According to the model, the optimal conditions are likely to
provide the best process response, leading to the highest acid
conversion and process efficiency. Using RSM the two reaction
parameters, temperature and catalyst concentration should
be kept at the highest level (77 �C) and (5.8%), respectively,
within their given ranges to obtain the highest acid
conversion.
To examine the adequacy of the model established, an
experiment at the predicted optimal conditions was carried
out, together with five additional experimental sets selected
from the given ranges of reaction parameters (Table 6). The
regression model was also verified with an experiment at the
predicted optimal conditions, using a 5� 10-3 m3 batch reactor
for the scale up of the process (Table 6). Using this reactor, the
acid conversion reached 93.9%, with an accuracy of 97.4%; the
result was close to that obtained on the smaller scale. There
was considerable agreement between the experimental and
the predicted acid conversion values and this confirmed that
the quadratic model was suitable to predict the course of this
reaction.
4. Conclusion
Novozym 435 was the most effective biocatalyst for the
esterification of pure diglycerol with oleic acid to produce pure
diglycerol monooleate ester, among six commercially avail-
able lipases tested in the present study. The modeling and
optimization of Novozym 435-catalyzed synthesis of
diglycerol monooleate ester was successfully performed by
central composite design and response surface methodology.
The influence of twomain reaction parameters were elucidate
within the experimental range considered and optimal reac-
tion condition were obtained using the established model.
Under these optimal conditions the acid conversion was
93.9%. The coefficient of correlation r (0.985) and analysis of
variance implied that themodel satisfactorily represented the
real relationship of the main reaction parameters and the
response, and have been found to be valid for the scale up the
process.
Acknowledgments
The authors gratefully acknowledge financial support of this
work by the PRI-PIBAR-2011-1375 and “Ministerio de Economıa
y Competitividad” (CTQ-2009-09-088).
r e f e r e n c e s
[1] Benvegnu T, Plusquellec D, Lemiegre L. Surfactants fromrenewable sources: synthesis and applications. In: Naceur M,Gandini A, editors. Monomers, polymers and compositesfrom renewable sources. Amsterdam: Elsevier Limited; 2008.pp. 153e78.
[2] Zhu Q, Li T, Wang Y, Yang B, Ma Y. A two-stage enzymaticprocess for synthesis of extremely pure high oleic glycerolmonooleate. Enzym Microb Tech 2010;48(2):143e7.
[3] Sakamoto M, Ohba A, Kuriyama J, Maruo K, Ueno S, Sato K.Influences of fatty acid moiety and esterification ofpolyglycerol fatty acid esters on the crystallization of palmmid fraction in oil-in-water emulsion. Colloids Surf B2004;37(1e2):27e33.
[4] Kjellin M, Johansson I. Surfactants from renewableresources. 1st ed. Chichester: John Wiley & Sons Inc; 2010.
[5] Sanchez N, Martinez M, Aracil J. Selective esterification ofglycerine to 1-glycerol monooleate. 2. Optimization studies.Ind Eng Chem Res 1997;36(5):1529e32.
[6] Pitzalis P, Monduzzi M, Krog N, Larsson H, Ljusberg-Wahren H, Nylander T. Characterization of the liquid-crystalline phases in the glycerol monooleate/diglycerolmonooleate/water system. Langmuir 2000;16(15):6358e65.
[7] Kato T, Nakamura T, Yamashita M, Kawaguchi M, Kato T,Itoh T. Surfactant properties of purified polyglycerolmonolaurates. J Surfactants Deterg 2003;6(4):331e7.
[8] Alvarez JM, Rodrıguez JM. Interfacial properties of diglycerolesters and caseinate mixed films at the air-water interface.J Phys Chem C 2007;111(12):4790e9.
[9] Nakamura T, Yamashita M, inventors; Taiyo Kagaku Co.,Ltd., assignee. Polyether-polyol compound. United Statespatent US 20020035238; 2002 Mar 21.
[10] Marquez-Alvarez C, Sastre E, Perez-Pariente J. Solid catalystsfor the synthesis of fatty esters of glycerol, polyglycerols andsorbitol from renewable resources. Top Catal2004;27(1e4):105e17.
[11] Endo T, Maruo K, inventors; Taiyo Kagaku Co., Ltd., assignee.Production of polyglycerol mono-fatty acid ester. Japanpatent JP 2000143794; 2000 May 26.
[12] Lemke DW, inventor; Lonza Inc., assignee. Processes forpreparing linear polyglycerols and polyglycerol esters. WorldIntellectual Property Organization patent WO 2002036534;2002 May 10.

b i om a s s a n d b i o e n e r g y 6 1 ( 2 0 1 4 ) 1 7 9e1 8 6186
[13] Corma A, Iborra S, Velty A. Chemical routes for thetransformation of biomass into chemicals. Chem Rev2007;107(6):2411e502.
[14] Treichel H, Oliveira D, Mazutti MA, Di Luccio M, Oliveira JV. Areview on microbial lipases production. Food BioprocessTech 2010;3(2):182e96.
[15] Aehle W. Enzymes in industry: production and applications.3th ed. Weinheim: Wiley-VCH; 2007.
[16] Martinez M, Oliveros R, Aracil J. Synthesis of biosurfactants:enzymatic esterification of diglycerol and oleic acid. 1.Kinetic modelling. Ind Eng Chem Res 2011;50(11):6609e14.
[17] Pollard D, Kosjek B. Industrial-scale applications of enzymesin non-aqueous solvents. In: Carrea G, Riva S, editors.
Organic synthesis with enzymes in non-aqueous media.Weinheim: Wiley-VCH Verlag GmbH & Co. KGaA; 2008.pp. 169e88.
[18] El-Boulifi N, Aracil J, Martınez M. Lipase-catalyzed synthesisof isosorbide monoricinoleate: process optimization byresponse surface methodology. Bioresour Technol2010;101(22):8520e5.
[19] Barros Neto B, Scarminio IS, Bruns RE. Como FazerExperimentos: Pesquisa e desenvolvimento na ciencia e naindustria. 2nd ed. Campinas: Unicamp; 2003.
[20] Joglekar AM, May AT. Product excellence through design ofexperiments. Cereal Foods World 1987;32(12):857e68.