«Pownall on Smith on colonies», Storia del Pensiero Economico, 23, 1992, pp. 3-10.
Upload
independentCategory
view
1download
0
Ecological Entomology (2010), 35, 424–435 DOI: 10.1111/j.1365-2311.2010.01198.x
Ontogeny of worker body size distribution in bumblebee (Bombus impatiens) colonies
M A R G A R E T J . C O U V I L L O N,1,2∗ J E N N I F E R M . J A N D T ,1∗ N H ID U O N G 3 and A N N A D O R N H A U S1 1Department of Ecology and Evolutionary Biology, University of
Arizona, Tucson, Arizona, U.S.A., 2Laboratory of Apiculture and Social Insects, Department of Biological and Environmental
Science, University of Sussex, Falmer, Brighton, U.K. and 3Center for Insect Science, University of Arizona, Tucson,
Arizona, U.S.A.
Abstract. 1. Bumble bees exhibit worker size polymorphisms; highly related workerswithin a colony may vary up to 10-fold in body mass. As size variation is an importantlife history feature in bumble bees, the distribution of body sizes within the colonyand how it fluctuates over the colony cycle were analysed.
2. Ten commercially purchased colonies of Bombus impatiens (Cresson) were rearedin ad libitum conditions. The size of all workers present and newly emerging workers(callows) was recorded each week.
3. The average size of bumble bee workers did not change with colony age, butvariation in body size tended to decrease over time. The average size of callows didnot change with population size, but did tend to decrease with colony age. In allmeasures, there was considerable variation among colonies.
4. Colonies of B. impatiens usually produced workers with normally distributedbody sizes throughout the colony life cycle. Unlike most polymorphic ants, there wasno increase in worker body size with colony age or colony size. This provides thefirst, quantitative data on the ontogeny of bumble bee worker size distribution. Thepotential adaptive significance of this size variation is discussed.
Key words. Bombus impatiens, bumble bees, polymorphism, size distribution, socialinsects.
Introduction
In complex biological systems, individual components ofteninteract to ensure the survival and the reproduction of thegroup (Maynard Smith & Szathmary, 1995). These individualcomponents may be genetically identical, such as the cells thatcomprise a multi-cellular organism, or genetically dissimilar,as in the symbiotic relationship between eukaryotes andtheir mitochondria (Maynard Smith & Szathmary, 1995).In complex systems, the whole may be greater than the sum ofthe parts, as different properties emerge from the interactionsthat would not be present at the individual level (Page &Mitchell, 1998; Sendova-Franks & Franks, 1999; Camazineet al., 2001). Social insect colonies are considered complex
Correspondence: Jennifer Jandt, Department of Ecology & Evolu-tionary Biology, University of Arizona, P.O. Box 210088, Tucson, AZ85721, U.S.A. E-mail: [email protected]
∗These authors contributed equally to this work.
biological systems (Bonabeau et al., 1999; Fewell, 2003).Their within-colony genetic relatedness varies because coloniesmay be headed by either singly-mated or multiply-matedqueens, which results in highly related or slightly relatedworkers, respectively. The components that make up thissystem (i.e. members of a colony) may be broadly dividedinto the reproductive (queen/males) and non-reproductive(worker) castes (Holldobler & Wilson, 2008), analogous tothe reproductive and somatic cells within a multi-cellularorganism.
Within the non-reproductive worker caste, there sometimesalso exists further differentiation, analogous to the differenti-ated somatic cells of different tissue types. This differentia-tion within the non-reproductive worker caste may happen inseveral ways. In some insects, such as the honey bee (Apismellifera), workers are similar in size and shape but differ inphysiological attributes, like brain organisation, hormone levelsand gene expression levels related to age (Robinson, 1987; Far-ris et al., 2001; Ben-Shahar et al., 2002; Whitfield et al., 2003),
© 2010 The Authors424 Journal compilation © 2010 The Royal Entomological Society

Ontogeny of bumble bee size distribution 425
all of which contribute to different behaviors (Lindauer, 1953;Seeley, 1982; Robinson et al., 1994; Fjerdingstad & Crozier,2006). In other insects, like some ants (Family: Formicidae),workers differ in more obvious morphological ways (Noirot& Pasteels, 1987; Holldobler & Wilson, 1990; Stern & Fos-ter, 1997), such as the dome-shaped head of some workersof the ant Cephalotes (Baroni Urbani, 1998; Powell, 2008)or the differently-sized workers within a colony of leaf cutterants (Holldobler & Wilson, 1990). All of the differentiationsabove contribute to variation in behaviours, which ultimatelylead to division of labour (Beshers & Fewell, 2001) and to thefunctioning of the colony as a complex system. Morphologicaldifferences within the worker caste are especially interestingbecause they are produced by nutritional differences in thelarval stage and fixed at eclosion, as most social insects areholometabolous (Couvillon & Dornhaus, 2009). Therefore, inorder to examine morphological variation, it is imperative tostudy it at the colony level.
Bumble bee (Bombus spp.) workers, unlike other eusocialbees, exhibit a high degree of intra-colony morphological dif-ferentiation. That is, offspring of a singly-mated queen (in spiteof a relatedness of 0.75) might differ by as much as 10-fold intheir mass (Cumber, 1949; Plowright & Jay, 1968; Goulson,2003). This size polymorphism is linked to bumble bee divisionof labour: smaller workers tend to feed and incubate brood andlarger workers tend to forage, guard, and fan (Richards, 1946;Goulson et al., 2002; Jandt & Dornhaus, 2009). Previous workhas reported the distribution of bumble bee worker sizes forthe species Bombus terrestris (Goulson et al., 2002; Goulson,2003). However, these descriptions were either derived fromthe distribution of all of the workers produced across the year,measured at the end of the colony cycle, or were collected onmanipulated colonies at the end of the colony cycle (Couvil-lon & Dornhaus, 2010). Consequently, it is unknown whetherdifferent-sized workers are actually present at the same time inthe colony. Nor does this end-of-cycle measurement describewhether different-sized workers are produced as a cohort atthe same time or merely accrue over time as a consequence ofchanges in nutrition across the colony cycle. In other words,does the worker body size distribution within a bumble beecolony change over time? Previous authors have suggested thatworker body size does increase over time in some bumble beespecies (B. auricomus, B. griseocollis, B. fervidus, and B. per-plexus) (Sladen, 1912; Frison, 1927; Knee & Medler, 1965;Plowright & Jay, 1968); however, these data were anecdotalin nature and sometimes included examples to the contrary (B.terricola and B. ternarius) (Goulson, 2003). Clearly a detailedanalysis of the size distribution over time is needed.
Here, the size distribution of workers of the bumble beespecies Bombus impatiens was analysed. Between-colony vari-ation, the effect of colony size, and the shape of the distributionwere quantified. Importantly, these features were tracked overtime and as population size (number of workers in the colony)changed. If the production of large workers is limited by theresources available to the colony, then under ad libitum feed-ing conditions, all workers produced should have a large bodysize, and body size may also increase as the population ofworkers increases.
Materials and methods
Study organism
Between September 2005 and August 2006, 10 queenrightcolonies of B. impatiens (Koppert Biological Systems, Romu-lus, Michigan) were obtained, and each was placed inside awooden nest box with a Plexiglas cover to provide constantviewing of in-nest behaviour (see Jandt & Dornhaus, 2009for details). Colonies were kept at room temperature and ona light:dark 8:16 h cycle. Although foraging behaviour hasstrong diurnal rhythms, brood care has weak or no diurnalrhythms (Yerushalmi et al., 2006). Thus, larval feeding is per-formed around the clock and the effects of our laboratory lightregime should neither have strongly influenced larval feedingbehaviour in the nest nor our observations of the worker bodysize variation throughout colony development.
At the start of the experiment, colonies had 68 ± 27 work-ers. As the colonies used in our study were of commercialorigin, the initial set of workers may have been comprisedof mixed genetic ancestry. However, data collection began2 weeks after colony set-up, a period after which bees thatemerge are those raised by workers present. Bees had accessto a foraging arena at all times, where they were providedwith a sugary solution (‘Bee-Happy’, Koppert Biological Sys-tems) and pollen ad libitum. When the colonies first arrived,all individuals were marked by gluing a numbered plastictag (‘Opalithplattchen’) to the thorax. Afterwards, all newlyemerging bees were marked and recorded on the date of eclo-sion. Thorax widths of workers, a standard measurement ofbody size in bumble bees (Goulson, 2003), were obtained postmortem using digital calipers to the nearest 0.01 mm. Any beethat died during the experiment was stored and measured aswell. Rarely, we were unable to account for a bee, in whichcase it could not be included in the analysis; however, thiswas recorded and taken into account when estimating weeklypopulation size. Large workers were readily distinguished fromnewly emerging gynes (i.e. virgin queens) as there tends to belittle overlap between the size of workers and gynes in thistype of bumble bee (i.e. pollen-storers) (Goulson, 2003).
At week 1 of data collection, the queen’s age was unknown;as such, data collection may have begun at slightly differenttimes in the life-cycle for each colony. A bumble bee colonylife-cycle includes a ‘growth phase’, when worker populationsize increases, and a ‘senescent phase’, when population sizedecreases (Cameron, 1989). Most colonies were early in theircycle, as all but three subsequently experienced a populationsize increase (Fig. 1).
These colonies were also used for other non-manipulative,observational studies. Therefore, the duration of time thatdata were collected on body size distribution varied betweencolonies. However, throughout these analyses reported here,no live worker bees were removed from the colonies. In somecases, the queen was removed once the colony began produc-ing new reproductives, a signal that the colony was nearingthe end of its annual cycle and entering into the senescentphase (Cameron, 1989). The point at which the colony becamequeenless is denoted in the figures.
© 2010 The AuthorsJournal compilation © 2010 The Royal Entomological Society, Ecological Entomology, 35, 424–435

426 Margaret J. Couvillon et al.
F.05.01
Pop
ulat
ion
Siz
e
0
20
40
60
80
F.05.02
0
20
40
60
80
100
F.05.03
0
40
80
120
S.06.01
0
20
40
60
80
S.06.02
Colony Age (weeks)
1 2 3 4 5 6 7 8 9 10 11 120
20
40
60
80
S.06.03
0
20
40
60
F.06.01
0
20
40
60
80
100
F.06.02
0
20
40
60
80
100
F.06.03
0
40
80
120
F.06.04
1 2 3 4 5 6 7 8 9 10 11 120
40
80
120
160
3.0
3.5
4.0
4.5
5.0
3.0
3.5
4.0
4.5
5.0
3.0
3.5
4.0
4.5
5.0
3.0
3.5
4.0
4.5
5.0
3.0
3.5
4.0
4.5
5.0
3.0
3.5
4.0
4.5
5.0
3.0
3.5
4.0
4.5
5.0
Average T
horax Width (±
SE
)
3.0
3.5
4.0
4.5
5.0
3.0
3.5
4.0
4.5
5.0
3.0
3.5
4.0
4.5
5.0
Fig. 1. Average worker body size did not significantly change with colony age in Bombus impatiens, but larger colonies had on average smallerworkers. Black filled circles represent the population size of workers in the colony; open circles represent the peak in colony population size; greycircles represent the average (±SE) body size of all workers present in the colony each week. Regression lines are present when the relationshipbetween average worker size and colony age was significant (Bonferroni’s corrected α = 0.005 was used). Vertical lines represent the point atwhich the queen was no longer present in the colony.
© 2010 The AuthorsJournal compilation © 2010 The Royal Entomological Society, Ecological Entomology, 35, 424–435

Ontogeny of bumble bee size distribution 427
Analyses
Statistics were done using Minitab (Student Version 14) andJMP (Version 7). Unless otherwise stated, averages are reportedas mean ± standard error (X ± SE). When analysing all 10colonies separately, we used a Bonferroni corrected α = 0.005(P = 0.05, k = 10, P/k = 0.005) as our significance criterion.As each bee was individually marked and recorded daily,we knew which bees were alive and present in the colonyeach week. The degree to which the distribution of all adultworker body sizes per week was normal was analysed using aShapiro–Wilk test.
Multiple linear regressions (MLR), with a block for colony-level effects, were used to determine whether average workerbody size changed across colony age and/or different popula-tion sizes. The size of newly emerged bees (callows) per weekwas analysed separately. To understand within-colony patterns,linear regressions were calculated for each colony to deter-mine whether average size of workers present in the colonyand the size of newly emerging bees increased or decreasedacross colony age and/or different population sizes. To deter-mine whether average size of all workers across colony agewas better explained with a curvilinear fit, results from a sec-ond order regression were compared with those from the linearanalyses. Furthermore, to determine whether there was a dif-ference of worker body sizes present during the growth orsenescent phase, we used linear regression to compare bodysize over time for each phase separately.
Finally, the standard deviation, degree of skewness, anddegree of kurtosis were calculated to better understand theshape of the size distribution per week for each colony. Thedegree of skewness determines the presence and direction ofa distribution’s tail, while kurtosis determines how steeply thedistribution curve is peaked. Multiple linear regressions, with ablock for colony-level effects, were used to determine whetherthe shape of the distribution (standard deviation, skewness, andkurtosis) changed across colony age and/or different populationsizes. Where there were significant interactions between colony
level effects and age or population size, separate linear regres-sions were calculated for each colony to identify within-colonypatterns.
Results
Analyses of all bees in the colony
There were significant differences between colonies inaverage size of workers in the colony (F9,892 = 12.80, P <
0.001). Eight out of 10 colonies produced a normal workerbody size distribution, as measured across the entire colonycycle (Table 1). This normality was maintained in 7 of the 10colonies when worker sizes were examined weekly (Table 1).Colony populations were not manipulated, although steepdeclines in population size during the senescence phase ofsome colonies resulted in an overall significant populationsize decrease with colony age (see Fig. 1, black circles;MLR: r2 = 0.82; colony differences: F1,9 = 19.67; P <
0.001; colony age: F1,1 = 53.02; P < 0.001; colony × age:F1,9 = 8.34; P < 0.001). As a result of the strong differencesbetween colonies, the effects of population size were analysedseparately from colony age.
Average body size of the workers present in the colonydid not consistently increase or decrease with colony age(Fig. 1, grey circles; MLR: r2 = 0.11; colony differences:F1,9 = 45.75; P < 0.001; colony age: F1,1 = 1.96; P = 0.16;colony × age: F1,9 = 3.40; P < 0.001), yet different trendswere observed across colonies. One colony showed an increasein body size (F.06.03: r2 = 0.02, F1,736 = 15.92, P < 0.001)and one showed a decrease in body size over time (F.05.02:r2 = 0.04, F1,344 = 15.17, P < 0.001). There was no changein average worker body size over time in the other eightcolonies (P ≥ 0.05 for all other linear regressions). As therewas no obvious monotonic trend, we repeated these analyses todetermine if the data were more likely to follow a curvilinearfit (using quadratic regressions). In this case, there was againno significant relationship of worker body size with colonyage in most (6 out of 10) colonies (F.05.02: r2 = 0.04, P =
Table 1. P -value results from Shapiro–Wilk tests of the null hypothesis that colonies produce a normal distribution of worker body sizes in thecolony overall (‘All’), and maintain a normal distribution of worker body sizes within the colony each week.
Colony All Wk 1 Wk 2 Wk 3 Wk 4 Wk 5 Wk 6 Wk 7 Wk 8 Wk 9 Wk 10
F.05.01 0.251 0.183 0.247 0.260 0.221 0.321 0.405 0.511 0.548 1.00 1.00F.05.02 0.827 0.152 0.210 0.339 0.365 0.696 0.968 0.871 0.989 0.920 0.920F.05.03 0.049 0.698 0.231 0.110 0.209 0.454 0.488 0.462 0.028 0.062 0.885S.06.01 0.043 0.575 0.324 0.169 0.029 0.026 0.012 0.121 0.168 0.333 0.305S.06.02 0.0028 0.076 0.136 0.162 0.162 0.0004 0.006 0.004 0.006 0.013 0.013S.06.03 0.0026 0.012 0.002 0.001 0.002 0.949 0.987 0.977 n/a n/a n/aF.06.01 0.926 0.886 0.893 0.888 0.753 0.965 0.659 n/a n/a n/a n/aF.06.02 0.0003 0.703 0.096 0.0006 0.0001 0.0001 0.0003 0.0005 0.009 0.061 n/aF.06.03 0.463 0.259 0.640 0.507 0.657 0.634 0.675 0.423 0.384 0.706 n/aF.06.04 0.807 0.647 0.691 0.573 0.899 0.899 0.857 0.698 0.773 0.168 0.438
P -values represent the probability that the distribution of worker body sizes was not normal. All 10 colonies were analysed separately; therefore,Bonferroni’s corrected α = 0.005 was used as the significance criterion. Significant P -values are in bold. Seven of the 10 colonies demonstratedan overall normal body size distribution and maintained such a distribution through the colony cycle. ‘N/A’ represents weeks after colony deathuntil week 10 for four colonies.
© 2010 The AuthorsJournal compilation © 2010 The Royal Entomological Society, Ecological Entomology, 35, 424–435

428 Margaret J. Couvillon et al.
Table 2. Regression results for the relationship between worker body size and colony age (Tage) for each colony during their growth and senescencephases. Growth phase was defined as the time from week 1 until the peak in population size (represented in Fig. 1) and the senescence phase asthe time that followed the peak in population size.
Growth phase Senescence phase
Colony N Wks Tage R2 P N Wks Tage R2 P
F.05.01 3 −1.05 3.2% 0.300 8 0.96 2% 0.345F.05.02 4 −0.91 0.6% 0.364 7 −2.39 2.9% 0.018F.05.03 4 −0.10 0.0% 0.919 7 −3.01 5.2% 0.003S.06.01 7 −3.61 6.0% <0.001 4 2.07 7.3% 0.043S.06.02 9 −0.92 0.3% 0.356 3 −0.00 0.0% 1.00S.06.03 2 −0.61 0.4% 0.545 5 1.04 1.1% 0.301F.06.01 2 −0.23 0.0% 0.822 4 0.12 0.0% 0.902F.06.02 5 −4.09 3.8% <0.001 4 2.33 1.7% 0.020F.06.03 2 −0.38 0.1% 0.703 7 3.41 2.1% 0.001F.06.04 3 −1.44 0.6% 0.151 8 −0.07 0.0% 0.945
N Wks represents the number of weeks included in the analyses. All 10 colonies were analysed separately; therefore, Bonferroni’s correctedα = 0.005 was used as the significance criterion. Significant regression results are in bold.
0.001; S.06.01: r2 = 0.10, P < 0.001; F.06.02: r2 = 0.03,P < 0.001; F.06.03: r2 = 0.02, P < 0.001; P > 0.03 forall other colonies; see Fig. 1). In those colonies where thecurvilinear fit was significant, the trend showed that body sizetended to be lowest in the middle. As the curvilinear fit was nobetter at describing the data than the linear, we will focus on thelinear regression in our discussion, as it is easier to interpret.
Changes in worker body size with colony age were alsoanalysed separately during the growth and senescent phases ofthe colony cycle for each colony. The growth phase includedthe weeks until the peak in the population size (Fig. 1) and thesenescent phase included the weeks after the peak in popula-tion size. There were no consistent trends across colonies withregards to the average body size during either phase (Table 2).In two colonies (S.06.01 and F.06.02), there was a decreasein average body size during the growth phase. In one colony,there was an increase in body size during the senescent phase(F.06.03), whereas in another there was a decrease (F.05.03).There were no significant trends in either phase in the othersix colonies (Table 2).
Overall, average worker body size was lower with higherpopulation size (Fig. 2; r2 = 0.89; colony differences: F1,9 =45.41; P < 0.001; population size: F1,1 = 19.48; P < 0.001;colony × population size: F1,9 = 16.98; P < 0.001). How-ever, when colonies were analysed individually, this wasnot consistent across colonies. There was a negative rela-tionship between population size and average body sizein three colonies (S.06.01: r2 = 0.92, F1,9 = 104.44, P <
0.001; S.06.02: r2 = 0.69, F1,10 = 22.54, P = 0.001; F.06.03:r2 = 0.97, F1,7 = 225.9, P < 0.001), a positive relationshipin one colony (F.05.03: r2 = 0.76, F1,9 = 28.65, P < 0.001),and no relationship in the remaining six colonies (F.05.01:r2 = 0.11, F1,10 = 1.22, P = 0.30; F.05.02: r2 = 0.13, F1,9 =1.38, P = 0.27; S.06.03: r2 = 0.38, F1,5 = 3.02, P = 0.14;F.06.01: r2 = 0.25, F1,4 = 1.36, P = 0.31; F.06.02: r2 =0.68, F1,7 = 14.63, P = 0.006; F.06.04: r2 = 0.20, F1,9 =2.25, P = 0.17).
Analyses of newly emerging bees (callows)
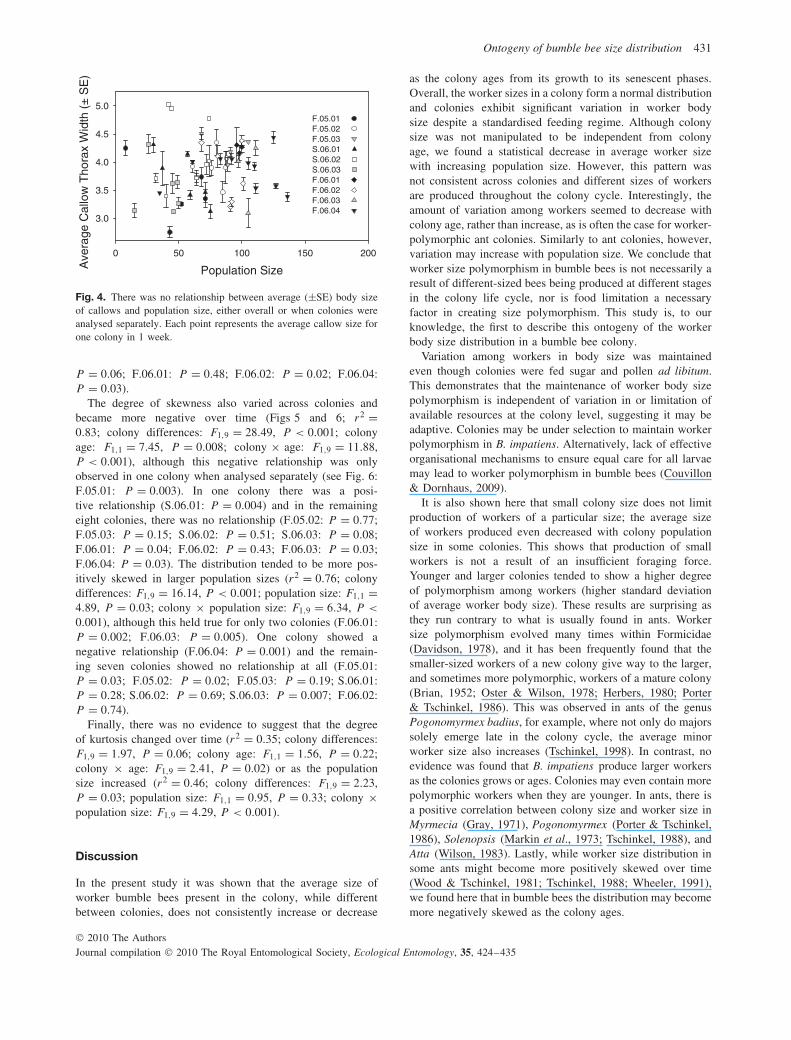
Overall, the size of callows produced within a colonydecreased over time, although this pattern was not consistentacross colonies (Fig. 3; MLR: r2 = 0.20; colony differences:F1,9 = 5.05, P < 0.001; colony age: F1,1 = 4.62, P = 0.03;colony × age: F1,9 = 2.14, P = 0.03). There was a significantdecrease in the average size of callows with colony agein only one colony when colonies were analysed separately(Fig. 3; S.06.01: r2 = 0.22, F1,41 = 9.34, P = 0.004), but nosignificant change in callow size in the other eight colonies(P > 0.02 for all remaining colonies). Additionally, there wasno evidence that population size affected the average callowsize (Fig. 4; r2 = 0.35; colony differences: F1,9 = 1.30; P =0.27; population size: F1,1 = 0.10; P = 0.75; colony × age:F1,9 = 0.43; P = 0.91).
The shape of the worker size distribution
The degree of worker size polymorphism, measured hereas the standard deviation of thorax sizes, varied acrosscolonies and showed a general decrease with colony age(Fig. 5; MLR: r2 = 0.61, colony differences: F1,9 = 10.14,P < 0.001; colony age: F1,1 = 4.13, P = 0.05; colony × age:F1,9 = 0.91, P = 0.52); however, this decrease was only sig-nificant in 4 out of the 10 colonies (F.05.02: P = 0.006;F.05.03: P = 0.03; S.06.02: P < 0.001; F.06.03: P < 0.001;for all other colonies: P > 0.25). On the other hand, thestandard deviation increased with population size (Fig. 5;r2 = 0.72; colony differences: F1,9 = 14.96, P < 0.001; pop-ulation size: F1,1 = 7.44, P = 0.008; colony × populationsize: F1,9 = 3.46, P = 0.001). Again, however, when colonieswere analysed separately, this positive relationship was onlyobserved in two colonies (S.06.01: P = 0.001; F.06.03: P =0.003); one colony exhibited a negative relationship (S.06.02:P = 0.001) and the other seven colonies showed no rela-tionship using the Bonferroni-corrected α = 0.005 (F.05.01:P = 0.88; F.05.02: P = 0.04; F.05.03: P = 0.006; S.06.03:
© 2010 The AuthorsJournal compilation © 2010 The Royal Entomological Society, Ecological Entomology, 35, 424–435

Ontogeny of bumble bee size distribution 429
0 40 80 120 160
3.0
3.5
4.0
4.5
5.0
3.0
3.5
4.0
4.5
5.0
3.0
3.5
4.0
4.5
5.0
3.0
3.5
4.0
4.5
5.0
3.0
3.5
4.0
4.5
5.0
0 40 80 120 160
3.0
3.5
4.0
4.5
5.0
3.0
3.5
4.0
4.5
5.0
3.0
3.5
4.0
4.5
5.0
3.0
3.5
4.0
4.5
5.0
3.0
3.5
4.0
4.5
5.0F.05.01
F.05.02
F.05.03
S.06.01
S.06.02
S.06.03
F.06.01
F.06.02
F.06.03
F.06.04
Ave
rage
Tho
rax
Wid
th (
± S
E)
Population SizeFig. 2. Average worker body size was overall negatively correlated with population size. However, this pattern was not particularly strong: differenttrends occurred across colonies. Regression lines are present when the relationship between average worker size and population size was significantfor that colony (Bonferroni’s corrected α = 0.005 was used).
© 2010 The AuthorsJournal compilation © 2010 The Royal Entomological Society, Ecological Entomology, 35, 424–435

430 Margaret J. Couvillon et al.
F.05.01
Pop
ulat
ion
Siz
e
0
20
40
60
80
F.05.02
0
20
40
60
80
100
F.05.03
0
40
80
120
S.06.01
0
20
40
60
80
S.06.02
Colony Age (weeks)
1 2 3 4 5 6 7 8 9 10 11 120
20
40
60
80
S.06.03
0
20
40
60
F.06.01
0
20
40
60
80
100
F.06.02
0
20
40
60
80
100
F.06.03
0
40
80
120
F.06.04
1 2 3 4 5 6 7 8 9 10 11 120
40
80
120
160
3.0
3.5
4.0
4.5
5.0
3.0
3.5
4.0
4.5
5.0
3.0
3.5
4.0
4.5
5.0
3.0
3.5
4.0
4.5
5.0
3.0
3.5
4.0
4.5
5.0
3.0
3.5
4.0
4.5
5.0
3.0
3.5
4.0
4.5
5.0
Average C
allow T
horax Width (±
SE
)
3.0
3.5
4.0
4.5
5.0
3.0
3.5
4.0
4.5
5.0
3.0
3.5
4.0
4.5
5.0
Fig. 3. Average body size of callows (newly emerging workers) decreased overall with colony age in Bombus impatiens. Black circles representthe population of all workers in the colony; grey circles represent the average (±SE) callow body size each week. Regression lines are presentwhen the relationship between average callow size and colony age was significant for that colony (Bonferroni’s corrected α = 0.005 was used).Vertical lines represent the point at which the queen was no longer present in the colony.
© 2010 The AuthorsJournal compilation © 2010 The Royal Entomological Society, Ecological Entomology, 35, 424–435
Ontogeny of bumble bee size distribution 431
Population Size
0 50 100 150 200
Ave
rage
Cal
low
Tho
rax
Wid
th (
± S
E)
3.0
3.5
4.0
4.5
5.0F.05.01F.05.02F.05.03S.06.01S.06.02S.06.03F.06.01F.06.02F.06.03F.06.04
Fig. 4. There was no relationship between average (±SE) body sizeof callows and population size, either overall or when colonies wereanalysed separately. Each point represents the average callow size forone colony in 1 week.
P = 0.06; F.06.01: P = 0.48; F.06.02: P = 0.02; F.06.04:P = 0.03).
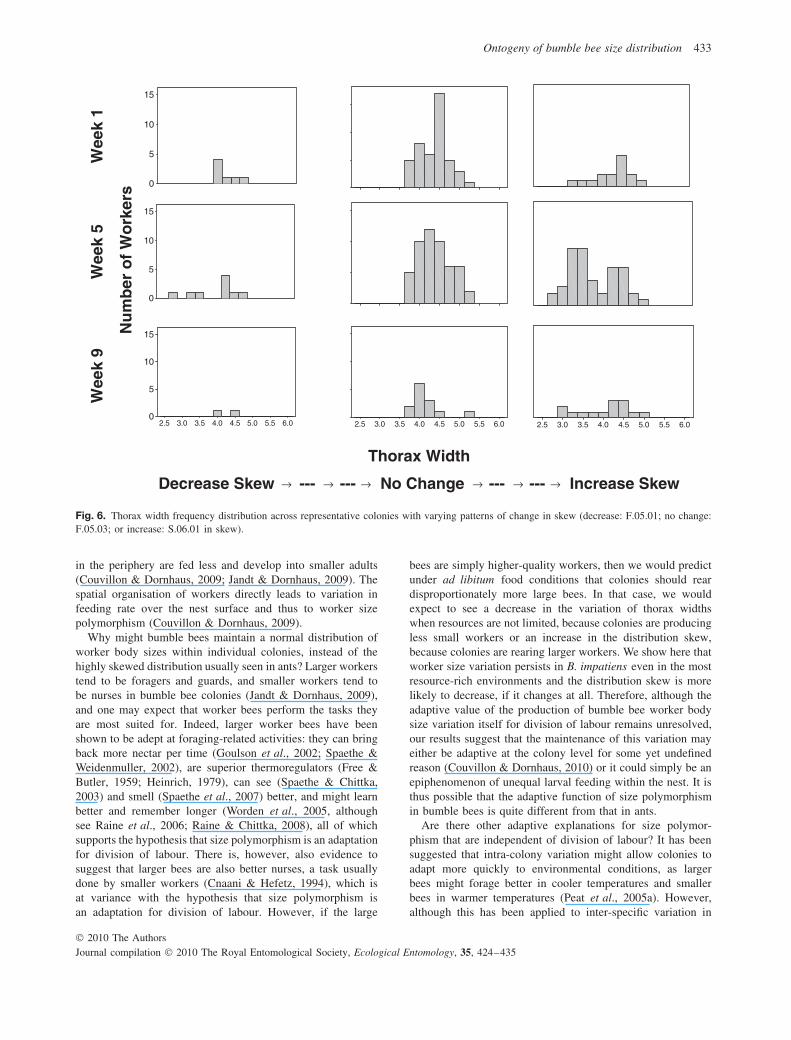
The degree of skewness also varied across colonies andbecame more negative over time (Figs 5 and 6; r2 =0.83; colony differences: F1,9 = 28.49, P < 0.001; colonyage: F1,1 = 7.45, P = 0.008; colony × age: F1,9 = 11.88,P < 0.001), although this negative relationship was onlyobserved in one colony when analysed separately (see Fig. 6:F.05.01: P = 0.003). In one colony there was a posi-tive relationship (S.06.01: P = 0.004) and in the remainingeight colonies, there was no relationship (F.05.02: P = 0.77;F.05.03: P = 0.15; S.06.02: P = 0.51; S.06.03: P = 0.08;F.06.01: P = 0.04; F.06.02: P = 0.43; F.06.03: P = 0.03;F.06.04: P = 0.03). The distribution tended to be more pos-itively skewed in larger population sizes (r2 = 0.76; colonydifferences: F1,9 = 16.14, P < 0.001; population size: F1,1 =4.89, P = 0.03; colony × population size: F1,9 = 6.34, P <
0.001), although this held true for only two colonies (F.06.01:P = 0.002; F.06.03: P = 0.005). One colony showed anegative relationship (F.06.04: P = 0.001) and the remain-ing seven colonies showed no relationship at all (F.05.01:P = 0.03; F.05.02: P = 0.02; F.05.03: P = 0.19; S.06.01:P = 0.28; S.06.02: P = 0.69; S.06.03: P = 0.007; F.06.02:P = 0.74).
Finally, there was no evidence to suggest that the degreeof kurtosis changed over time (r2 = 0.35; colony differences:F1,9 = 1.97, P = 0.06; colony age: F1,1 = 1.56, P = 0.22;colony × age: F1,9 = 2.41, P = 0.02) or as the populationsize increased (r2 = 0.46; colony differences: F1,9 = 2.23,P = 0.03; population size: F1,1 = 0.95, P = 0.33; colony ×population size: F1,9 = 4.29, P < 0.001).
Discussion
In the present study it was shown that the average size ofworker bumble bees present in the colony, while differentbetween colonies, does not consistently increase or decrease
as the colony ages from its growth to its senescent phases.Overall, the worker sizes in a colony form a normal distributionand colonies exhibit significant variation in worker bodysize despite a standardised feeding regime. Although colonysize was not manipulated to be independent from colonyage, we found a statistical decrease in average worker sizewith increasing population size. However, this pattern wasnot consistent across colonies and different sizes of workersare produced throughout the colony cycle. Interestingly, theamount of variation among workers seemed to decrease withcolony age, rather than increase, as is often the case for worker-polymorphic ant colonies. Similarly to ant colonies, however,variation may increase with population size. We conclude thatworker size polymorphism in bumble bees is not necessarily aresult of different-sized bees being produced at different stagesin the colony life cycle, nor is food limitation a necessaryfactor in creating size polymorphism. This study is, to ourknowledge, the first to describe this ontogeny of the workerbody size distribution in a bumble bee colony.
Variation among workers in body size was maintainedeven though colonies were fed sugar and pollen ad libitum.This demonstrates that the maintenance of worker body sizepolymorphism is independent of variation in or limitation ofavailable resources at the colony level, suggesting it may beadaptive. Colonies may be under selection to maintain workerpolymorphism in B. impatiens. Alternatively, lack of effectiveorganisational mechanisms to ensure equal care for all larvaemay lead to worker polymorphism in bumble bees (Couvillon& Dornhaus, 2009).
It is also shown here that small colony size does not limitproduction of workers of a particular size; the average sizeof workers produced even decreased with colony populationsize in some colonies. This shows that production of smallworkers is not a result of an insufficient foraging force.Younger and larger colonies tended to show a higher degreeof polymorphism among workers (higher standard deviationof average worker body size). These results are surprising asthey run contrary to what is usually found in ants. Workersize polymorphism evolved many times within Formicidae(Davidson, 1978), and it has been frequently found that thesmaller-sized workers of a new colony give way to the larger,and sometimes more polymorphic, workers of a mature colony(Brian, 1952; Oster & Wilson, 1978; Herbers, 1980; Porter& Tschinkel, 1986). This was observed in ants of the genusPogonomyrmex badius, for example, where not only do majorssolely emerge late in the colony cycle, the average minorworker size also increases (Tschinkel, 1998). In contrast, noevidence was found that B. impatiens produce larger workersas the colonies grows or ages. Colonies may even contain morepolymorphic workers when they are younger. In ants, there isa positive correlation between colony size and worker size inMyrmecia (Gray, 1971), Pogonomyrmex (Porter & Tschinkel,1986), Solenopsis (Markin et al., 1973; Tschinkel, 1988), andAtta (Wilson, 1983). Lastly, while worker size distribution insome ants might become more positively skewed over time(Wood & Tschinkel, 1981; Tschinkel, 1988; Wheeler, 1991),we found here that in bumble bees the distribution may becomemore negatively skewed as the colony ages.
© 2010 The AuthorsJournal compilation © 2010 The Royal Entomological Society, Ecological Entomology, 35, 424–435

432 Margaret J. Couvillon et al.
Population Size
0 25 50 75 100 125 150
SD
of T
hora
x W
idth
0.0
0.2
0.4
0.6
0.8
1.0
Ske
wne
ss
-2
-1
0
1
2
Colony Age (weeks)
1 2 3 4 5 6 7 8 9 10 11 12
Kur
tosi
s
-2
-1
0
1
2
3
4
5
Fig. 5. The shape of the worker size distribution (in terms of standard deviation, skewness, and kurtosis) with colony age (left column) and withpopulation (right column). Each symbol/colour combination represents a different colony.
Bumble bee colonies are annually founded by a queen thatis typically singly-mated (Schmid-Hempel & Schmid-Hempel,2000). The ultimate size that an adult worker reaches is notonly determined by genetic factors, but by how much foodis given to the developing larvae by adult nurses (Michener,1974; Alford, 1975; Couvillon & Dornhaus, 2009). A normalcolony cycle typically runs for several months, with the queeninitially performing all colony tasks (nursing, laying, andforaging) until a small cohort of workers emerges (Sladen,1912; Goulson, 2003). It is sometimes assumed that the firstworker cohorts are significantly smaller than the bees producedlater in the colony cycle, as resource abundance and population(i.e. available foragers) increase from spring to summer (Knee& Medler, 1965). Afterwards, the queen devotes herself tolaying and the colony experiences a population explosion,where worker numbers will go from a few to possibly severalhundred (Sladen, 1912; Cameron, 1989). Previous authorshave suggested that worker body size increases over time insome bumble bee species (B. auricomus, B. griseocollis, B.fervidus, and B. perplexus) (Sladen, 1912; Frison, 1927; Knee& Medler, 1965; Plowright & Jay, 1968); however, these data
were anecdotal in nature and sometimes included examples tothe contrary (B. terricola, and B. ternarius) (Goulson, 2003).
How might bumble bees maintain body size polymorphismwithin individual colonies? Worker size polymorphism inbumble bees has been described previously (Knee & Medler,1965; Plowright & Jay, 1968); however, most of this didnot quantify size distributions. More recently, others haveexamined the size variation within (Goulson, 2003; Peat et al.,2005b) and between (Peat et al., 2005a) species, but this wasless on the ontogeny of the distribution and more on the roleof size polymorphism in the division of labour. Previous workhas suggested that size variation in ants might be a resultof limited food availability (Herbers, 1980; Rissing, 1987),as colonies, when resources are not limited, produce overalllarger workers and fewer small ones. In contrast, we showhere that in bumble bees, worker size variation is still presentwith unlimited resources. It is likely that the in-nest spatialorganisation of bumble bee workers and larvae is the proximatemechanism maintaining variation in worker body size. This isbecause workers active as nurses tend to be found more in thecentre of the nest, and larvae developing there receive morefood, and thus develop into larger workers, whereas larvae
© 2010 The AuthorsJournal compilation © 2010 The Royal Entomological Society, Ecological Entomology, 35, 424–435
Ontogeny of bumble bee size distribution 433
Wee
k 1
15
10
5
0
Wee
k 5
15
10
5
0
Wee
k 9
Nu
mb
er o
f W
ork
ers
6.05.55.04.54.03.53.02.5
15
10
5
0 6.05.55.04.54.03.53.02.5 6.05.55.04.54.03.53.02.5
Thorax Width
Decrease Skew --- --- No Change --- --- Increase Skew ← ← ← ← ← ←
Fig. 6. Thorax width frequency distribution across representative colonies with varying patterns of change in skew (decrease: F.05.01; no change:F.05.03; or increase: S.06.01 in skew).
in the periphery are fed less and develop into smaller adults(Couvillon & Dornhaus, 2009; Jandt & Dornhaus, 2009). Thespatial organisation of workers directly leads to variation infeeding rate over the nest surface and thus to worker sizepolymorphism (Couvillon & Dornhaus, 2009).
Why might bumble bees maintain a normal distribution ofworker body sizes within individual colonies, instead of thehighly skewed distribution usually seen in ants? Larger workerstend to be foragers and guards, and smaller workers tend tobe nurses in bumble bee colonies (Jandt & Dornhaus, 2009),and one may expect that worker bees perform the tasks theyare most suited for. Indeed, larger worker bees have beenshown to be adept at foraging-related activities: they can bringback more nectar per time (Goulson et al., 2002; Spaethe &Weidenmuller, 2002), are superior thermoregulators (Free &Butler, 1959; Heinrich, 1979), can see (Spaethe & Chittka,2003) and smell (Spaethe et al., 2007) better, and might learnbetter and remember longer (Worden et al., 2005, althoughsee Raine et al., 2006; Raine & Chittka, 2008), all of whichsupports the hypothesis that size polymorphism is an adaptationfor division of labour. There is, however, also evidence tosuggest that larger bees are also better nurses, a task usuallydone by smaller workers (Cnaani & Hefetz, 1994), which isat variance with the hypothesis that size polymorphism isan adaptation for division of labour. However, if the large
bees are simply higher-quality workers, then we would predictunder ad libitum food conditions that colonies should reardisproportionately more large bees. In that case, we wouldexpect to see a decrease in the variation of thorax widthswhen resources are not limited, because colonies are producingless small workers or an increase in the distribution skew,because colonies are rearing larger workers. We show here thatworker size variation persists in B. impatiens even in the mostresource-rich environments and the distribution skew is morelikely to decrease, if it changes at all. Therefore, although theadaptive value of the production of bumble bee worker bodysize variation itself for division of labour remains unresolved,our results suggest that the maintenance of this variation mayeither be adaptive at the colony level for some yet undefinedreason (Couvillon & Dornhaus, 2010) or it could simply be anepiphenomenon of unequal larval feeding within the nest. It isthus possible that the adaptive function of size polymorphismin bumble bees is quite different from that in ants.
Are there other adaptive explanations for size polymor-phism that are independent of division of labour? It has beensuggested that intra-colony variation might allow colonies toadapt more quickly to environmental conditions, as largerbees might forage better in cooler temperatures and smallerbees in warmer temperatures (Peat et al., 2005a). However,although this has been applied to inter-specific variation in
© 2010 The AuthorsJournal compilation © 2010 The Royal Entomological Society, Ecological Entomology, 35, 424–435

434 Margaret J. Couvillon et al.
other organisms (Bergmann, 1847; Stillwell et al., 2007), itremains unsupported in bumble bees (Couvillon et al., 2010;Peat et al., 2005a). Rather, perhaps size polymorphism inbumble bees might result from the trade-off of cheap, lower-quality workers and expensive, higher-quality workers. Futurework should focus on cost-benefit ratio of different sizedbees. Perhaps colonies with smaller bees actually consumeless energy overall, although they are less efficient at col-lecting and processing that energy. Finally, workers actu-ally perform a variety of tasks inside the nest in additionto feeding and warming the brood; however, these tasks aretraditionally not included in division of labour analysis. Itwould be interesting to investigate the efficiency of smallerworkers performing these other tasks to give a better under-standing of how and why bumble bees produce polymorphicworkers.
References
Alford, D.V. (1975) Bumblebees. Davis-Poynter, London, U.K.Baroni Urbani, C. (1998) The number of castes in ants, where major
is smaller than minor and queens wear the shield of the soldiers.Insectes Sociaux, 45, 315–333.
Ben-Shahar, Y., Robichon, A., Sokolowski, M.B. & Robinson, G.E.(2002) Influence of gene action across different time scales onbehavior. Science, 296, 741–744.
Bergmann, C. (1847) Ueber die verhaltnisse der warmeokonomie derthiere zu ihrer grosse. Gottinger Studien, 3, 595–708.
Beshers, S.N. & Fewell, J.H. (2001) Models of division of labor insocial insects. Annual Review of Entomology, 46, 413–440.
Bonabeau, E., Doringo, M. & Theraulaz, G. (1999) Swarm Intelli-gence: From Natural to Artificial Systems. Oxford University Press,New York, New York.
Brian, A.D. (1952) Division of labour and foraging in Bombus-agrorum Fabricius. Journal of Animal Ecology, 21, 223–240.
Camazine, S., Deneubourg, J.-L., Franks, N., Sneyd, J., Theraulaz, G.& Bonabeau, E. (2001) Self-Organization in Biological Systems.Princeton University Press, Princeton, New Jersey.
Cameron, S.A. (1989) Temporal patterns of division of labor amongworkers in the primitively eusocial bumble bee, Bombus griseocollis(Hymenoptera: Apidae). Ethology, 80, 137–151.
Cnaani, J. & Hefetz, A. (1994) The Effect of workers size frequency-distribution on colony development in Bombus-terrestris. InsectesSociaux, 41, 301–307.
Couvillon, M.J. & Dornhaus, A. (2009) Location, location, location:larvae position inside the nest is correlated with adult body size inworker bumble bees (Bombus impatiens). Proceedings of the RoyalSociety B, 276, 2411–2418.
Couvillon, M.J. & Dornhaus, A. (2010) Small worker bumble bees(Bombus impatiens) are hardier against starvation than their largersisters. Insectes Sociaux, 57, 193–197.
Couvillon, M.J., Fitzpatrick, G. & Dornhaus, A. (2010) Ambient airtemperature does not predict body size of foragers in bumble bees(Bombus impatiens). Psyche, doi:10.1155/2010/536430
Cumber, R.A. (1949) The biology of humble-bees, with specialreference to the production of the worker caste. Transactions ofthe Royal Entomological Society of London, 100, 1–45.
Davidson, D.W. (1978) Size variability in the worker caste of a socialinsect (Veromessor pergandei Mayr) as a function of the competitiveenvironment. The American Naturalist, 112, 523–532.
Farris, S.M., Robinson, G.E. & Fahrbach, S.E. (2001) Experience-and age-related outgrowth of intrinsic neurons in the mushroom
bodies of the adult worker honeybee. Journal of Neuroscience, 21,6395–6404.
Fewell, J.H. (2003) Social insect networks. Science, 301, 1867–1870.Fjerdingstad, E.J. & Crozier, R.H. (2006) The Evolution of worker
caste diversity in social insects. The American Naturalist, 167,390–400.
Free, J.B. & Butler, C.G. (1959) Bumblebees. Collins, London, U.K.Frison, T.H. (1927) The development of the castes of bumblebees
(Bremidae: Hym.). Annals of the Entomological Society of America,20, 156–178.
Goulson, D. (2003) Bumblebees – Behaviour and Ecology. OxfordUniversity Press, Oxford, U.K.
Goulson, D., Peat, J., Stout, J.C., Tucker, J., Darvill, B., Derwent, L.C.et al. (2002) Can alloethism in workers of the bumblebee, Bom-bus terrestris, be explained in terms of foraging efficiency? AnimalBehaviour, 64, 123–130.
Gray, B. (1971) A morphometric study of the ant species, Myrmeciadispar. Insectes Sociaux, 18, 95–110.
Heinrich, B. (1979) Bumblebee Economics. Harvard University Press,Cambridge, Massachusetts.
Herbers, J.M. (1980) On caste ratios in ant colonies: populationresponses to changing environments. Evolution, 34, 575–585.
Holldobler, B. & Wilson, E.O. (1990) The Ants. Belknap Press,Cambridge, Massachusetts.
Holldobler, B. & Wilson, E.O. (2008) The Superorganism: The Beauty,Elegance, and Strangeness of Insect Societies. W.W. Norton & Co.,New York, New York.
Jandt, J. & Dornhaus, A. (2009) Spatial organization and division oflabor in the bumble bee, Bombus impatiens. Animal Behaviour, 77,641–651.
Knee, W.J. & Medler, J.T. (1965) Seasonal size increase of bumblebeeworkers (Hymenoptera – Bombus). Canadian Entomologist, 97,1149–1155.
Lindauer, M. (1953) Division of labour in the honeybee colony. BeeWorld, 34, 63–90.
Markin, G.P., Dillier, J.H. & Collins, H.L. (1973) Growth and devel-opment of colonies of the red imported fire ant, Solenopsis invicta.Annals of the Entomological Society of America, 66, 803–808.
Maynard Smith, J. & Szathmary, E. (1995) The Major Transitions inEvolution. Oxford University Press, Oxford, U.K.
Michener, C.D. (1974) The Social Behaviour of the Bees. HarvardUniversity Press, Cambridge, Massachusetts.
Noirot, C. & Pasteels, J.M. (1987) Ontogenetic development andevolution of the worker caste in termites. Cellular and MolecularLife Sciences, 43, 851–952.
Oster, G.F. & Wilson, E.O. (1978) Caste and Ecology in the SocialInsects. Princeton University Press, Princeton, New Jersey.
Page, R.E. & Mitchell, S.D. (1998) Self-organization and the evolutionof division of labor. Apidologie, 29, 171–190.
Peat, J., Darvill, B., Ellis, J. & Goulson, D. (2005a) Effects of climateon intra- and interspecific size variation in bumble-bees. FunctionalEcology, 19, 145–151.
Peat, J., Tucker, J. & Goulson, D. (2005b) Does intraspecific sizevariation in bumblebees allow colonies to efficiently exploit differentflowers? Ecological Entomology, 30, 176–181.
Plowright, R.C. & Jay, S.C. (1968) Caste differentiation in bumblebees(Bombus Latr - Hym). 1. Determination of female size. InsectesSociaux, 15, 171–192.
Porter, S.D. & Tschinkel, W.R. (1986) Adaptive value of nanitic work-ers in newly founded red imported fire ant colonies (Hymenoptera:Formicidae). Annals of the Entomological Society of America, 79,723–726.
© 2010 The AuthorsJournal compilation © 2010 The Royal Entomological Society, Ecological Entomology, 35, 424–435

Ontogeny of bumble bee size distribution 435
Powell, S. (2008) Ecological specialization and the evolution ofa specialized caste in Cephalotes ants. Functional Ecology, 22,902–911.
Raine, N.E. & Chittka, L. (2008) The correlation of learning speed andnatural foraging success in bumble-bees. Proceedings of the RoyalSociety B, 275, 803–808.
Raine, N.E., Ings, T.C., Ramos-Rodriguez, O. & Chittka, L. (2006)Intercolony variation in learning performance of a wild Britishbumble bee population (Hymenoptera: Apidae: Bombus terrestrisaudax). Entomologia Generalis, 28, 241–256.
Richards, O.W. (1946) Observations on Bombus agrorum (Fabricius)(Hymen., Bombindae). Proceedings of the Royal EntomologicalSociety of London, 21, 66–71.
Rissing, S.W. (1987) Annual cycles in worker size of the seed-harvester ant Veromessor pergandei (Hymenoptera: Formicidae).Behavioral Ecology and Sociobiology, 20, 117–124.
Robinson, G.E. (1987) Regulation of honey bee age polyethismby juvenile hormone. Behavioral Ecology and Sociobiology, 20,329–338.
Robinson, G.E., Page, R.E. & Huang, Z.Y. (1994) Temporal poly-ethism in social insects is a developmental process. AnimalBehaviour, 48, 467–469.
Schmid-Hempel, R. & Schmid-Hempel, P. (2000) Female matingfrequencies in Bombus spp. from central Europe. Insectes Sociaux,47, 36–41.
Seeley, T.D. (1982) Adaptive significance of the age polyethism sched-ule in honeybee colonies. Behavioural Ecology and Sociobiology,11, 287–293.
Sendova-Franks, A.B. & Franks, N.R. (1999) Self-assembly, self-organization and division of labour. Philosophical Transactions ofthe Royal Society B: Biological Sciences, 354, 1395–1405.
Sladen, F.W.L. (1912) The Humble-Bee. Macmillan and Co., London,U.K.
Spaethe, J. & Chittka, L. (2003) Interindividual variation of eye opticsand single object resolution in bumblebees. Journal of ExperimentalBiology, 206, 3447–3453.
Spaethe, J. & Weidenmuller, A. (2002) Size variation and foragingrate in bumblebees (Bombus terrestris). Insectes Sociaux, 49,142–146.
Spaethe, J., Brockmann, A., Halbig, C. & Tautz, J. (2007) Sizedetermines antennal sensitivity and behavioral threshold to odorsin bumblebee workers. Naturwissenschaften, 94, 733–739.
Stern, D.L. & Foster, W.A. (1997) The evolution of sociality in aphids:a clone’s-eye view. Social Behavior in Insects and Arachnids (ed. byJ. C. Choe and B. J. Crespi), pp. 150–165. Cambridge UniversityPress, Cambridge, U.K.
Stillwell, R.A.C., Morse, G.A.E. & Fox, C.A. (2007) Geographicvariation in body size and sexual size dimorphism of a seed-feedingbeetle. The American Naturalist, 170, 358–369.
Tschinkel, W.R. (1988) Colony growth and the ontogeny of workerpolymorphism in the fire ant, Solenopsis invicta. BehaviouralEcology and Sociobiology, 22, 103–115.
Tschinkel, W.R. (1998) Sociometry and sociogenesis of colonies ofthe harvester ant, Pogonomyrmex badius : worker characteristicsin relation to colony size and season. Insectes Sociaux, 45,385–410.
Wheeler, D.E. (1991) The developmental basis of worker castepolymorphism in ants. The American Naturalist, 138, 1218–1238.
Whitfield, C.W., Cziko, A.-M. & Robinson, G.E. (2003) Gene expres-sion profiles in the brain predict behavior in individual honey bees.Science, 302, 296–299.
Wilson, E.O. (1983) Caste and division of labor in leaf-cutter ants(Hymenoptera: Formicidae: Atta): III. Ergonomic resiliency inforaging by A. cephalotes. Behavioral Ecology and Sociobiology,14, 47–54.
Wood, L. & Tschinkel, W. (1981) Quantification and modification ofworker size variation in the fire ant, Solenopsis invicta. InsectesSociaux, 28, 117–128.
Worden, B.D., Skemp, A.K. & Papaj, D.R. (2005) Learning in twocontexts: the effects of interference and body size in bumblebees.Journal of Experimental Biology, 208, 2045–2053.
Yerushalmi, S., Bodenhaimer, S. & Bloch, G. (2006) Developmentallydetermined attenuation in circadian rhythms links chronobiology tosocial organization in bees. Journal of Experimental Biology, 209,1044–1051.
Accepted 22 February 2010First published online 26 April 2010
© 2010 The AuthorsJournal compilation © 2010 The Royal Entomological Society, Ecological Entomology, 35, 424–435

Copyright of Ecological Entomology is the property of Wiley-Blackwell and its content may not be copied or
emailed to multiple sites or posted to a listserv without the copyright holder's express written permission.
However, users may print, download, or email articles for individual use.
Copyright © 2022 FDOKUMEN