Analysing and Classifying COVID-19 Fake News in Brazilian ...
Upload
khangminh22Category
view
0download
0
Cover pageInside cover with acknowledgment of partners and partner lo-gos1-page executive summary with highlights from statistics.3 main sections – each of these will have all of the graphs from the list of 16 that pertain to each respective section:EventsVictimsFraudstersThe format for each of these sections will more or less like a prettier version of the ITAP Template document I sent you. Ba-sically each page will have 3+ graphs depending on design lay-out (however many fit) and then 2 text sections copy for:“Explanations”: A 1-2 sentence description of the graph“Insights” a 1-paragraph exposition on what the statistic indi-cates.
On Sentiment of Online Fake
News
Razieh Nokhbeh Zaeem Chengjing LiK. Suzanne Barber
UTCID Report #20-13
June 2020

Copyright 2021. The Center for Identity. All rights reserved.
On Sentiment of Online Fake News
Abstract The presence of disinformation and fake news on the Internet and especially social media has become a major concern. Prime examples of such fake news surged in the 2016 U.S. presidential election cycle and the COVID-19 pandemic. We quantify sentiment differences between true and fake news on social media using a diverse body of datasets from the literature that contains about 100K previously labeled true and fake news. We also experiment with a variety of sentiment analysis tools. We model the association between sentiment and veracity as conditional probability and also leverage statistical hypothesis testing to uncover the relationship between sentiment and veracity. With a significance level of 99.999%, we observe a statistically significant relationship between negative sentiment and fake news and between positive sentiment and true news. The degree of association, as measured by Goodman and Kruskal’s gamma, ranges between .037 to .475. Finally, we make our data and code publicly available to support reproducibility. Our results assist in the development of automatic fake news detectors. Index Terms—disinformation, misinformation, fake news, sentiment analysis, social networks, veracity Key Takeaways
• The presence of disinformation and fake news on the Internet and especially social media has become a major concern.
• This report quantifies sentiment (i.e.., positive, negative, neutral tone) differences between true and fake news on social media using a diverse body of datasets from the literature, which contains about 100K previously labeled true and fake news.
• With a significance level of 99.999%, we observe a statistically significant relationship between negative sentiment and fake news and between positive sentiment and true news.
• The degree of association ranges between 3.7% to 47.5%. • The results of the project assist in the development of automatic fake news detectors.

On Sentiment of Online Fake News1st Razieh Nokhbeh Zaeem
The Center for IdentityThe University of Texas at Austin
2nd Chengjing LiThe Center for Identity
The University of Texas at [email protected]
3rd K. Suzanne BarberThe Center for Identity
The University of Texas at [email protected]
Abstract—The presence of disinformation and fake news onthe Internet and especially social media has become a majorconcern. Prime examples of such fake news surged in the 2016U.S. presidential election cycle and the COVID-19 pandemic.We quantify sentiment differences between true and fake newson social media using a diverse body of datasets from theliterature that contains about 100K previously labeled true andfake news. We also experiment with a variety of sentimentanalysis tools. We model the association between sentiment andveracity as conditional probability and also leverage statisticalhypothesis testing to uncover the relationship between sentimentand veracity. With a significance level of 99.999%, we observea statistically significant relationship between negative sentimentand fake news and between positive sentiment and true news. Thedegree of association, as measured by Goodman and Kruskal’sgamma, ranges between .037 to .475. Finally, we make our dataand code publicly available to support reproducibility. Our resultsassist in the development of automatic fake news detectors.
Index Terms—disinformation, misinformation, fake news, sen-timent analysis, social networks, veracity
I. INTRODUCTION
The presence of fake news and disinformation has risento one of the paramount issues on social media. Fake newsincludes news articles that are intentionally false and decep-tive [1]–[3]. Numerous examples exist that demonstrate howfake news creates tangible threats to the society, let alonethe political and social discourse [1], [4]. For instance, inthe 2016 U.S. presidential election, disinformation and socialmedia campaigns caused great social discord and were thesubjects of a Special Counsel investigation. With the 2020elections looming, similar fake news campaigns are feared inthe U.S. As another example, amid the COVID-19 pandemic,we observed a surge of fake and unreliable news on a widerange of related topics: from what caused this new coronavirusoutbreak (e.g., 5G mobile networks are to blame) to howto prevent it (e.g., eating garlic prevents infection with thenew coronavirus). World Health Organization (WHO)1 andprominent news outlets2 have dedicated efforts to activelydebunk such fake news. This is how WHO director-generalphrased the fast spread of COVID-19 fake news in February2020: “Fake news spreads faster and more easily than thisvirus and is just as dangerous.”3
1https://www.who.int/emergencies/diseases/novel-coronavirus-2019/advice-for-public/myth-busters
2https://www.bbc.com/news/reality check3https://www.who.int/dg/speeches/detail/munich-security-conference
Over the past decade, many researchers have sought to studyfake news on social media. They consider features of the newscontent (e.g., the headline) or the social context (e.g., the socialmedia profile of the posting user) that may signal the presenceof fake news. (For surveys of such features, see [2], [3].) Thesefeatures not only help with automatic detection of fake news(e.g., [5]–[7]), but also with educating social media users:studies suggest that human beings are surprisingly weak atdetecting lies, as low as 4% better than chance [8].
In this paper, we aim to quantitatively measure the correla-tion between the sentiment of a social media post—whether itis a positive, negative, or neutral statement—and its veracity(i.e., whether it is fake news). While many have investigatedthe relationship between sentiment and veracity in socialmedia, we were not able to find a study that quantifies thisrelationship with a large and diverse body of data.
Psychological research on linguistic traits of lies suggest [9],[10] that liars use more negative emotion terms, often at-tributed to nonverbal leakage cues [11]. Most research onsocial media agrees that the same holds true for fake news.For instance, Kwon et al. [12] demonstrated that rumors weresignificantly less likely to have a positive sentiment. Rubin etal. [13] found more negative sentiment in fake news in theiranalysis of satire/fake and real news articles. Finally, Horneet al. [14] concluded that fake news on Facebook has morenegative sentiment.
Yet, other researchers discover different traits in online fakenews. For example, Hu et al. [15] sought to find out whethersentiment differences exist between spammers and other Twit-ter users. They reported that spammers tend to have morepositive sentiment compared to normal users. Furthermore,Castillo et al., in their widely cited work [16], showed thatfake and non-credible news tend to exhibit more sentiment,both positive and negative, but particularly more positivesentiment. Even though there are minute differences, e.g.,between veracity and credibility [16] or between fake newsand spam [15], the above findings in related work demonstratethat the relationship between sentiment and fake news is a hardand important research question.
In this work, we dedicate our attention to quantifying whatsentiment differences exist between true and fake news onsocial media. We seek to address multiple threats that mightarise to the validity of this study, so that the results arereproducible, general, and universally applicable. We make thefollowing contributions:

On Sentiment of Online Fake News Zaeem, Li, and Barber
1) We obtained seven annotated corpora of social me-dia/Internet posts from the literature. These corpora in-clude real news, fake news, and satire—totaling 95,638posts from platforms such as Facebook, Twitter, TheOnion, various news agencies, etc. Some of these cor-pora were annotated by human experts (at different pro-fessional fact-checking organizations such as PolitiFact)to add the veracity of posts. Others had articles labeledwith the trustworthiness of their publishers. We presentthe first work that investigates fake news sentiment withsuch a diverse and large body of corpora.
2) We experiment with both commercial and open sourcesentiment analysis tools. We consider a wide range ofsentiment analysis tools, from dictionary- to machine-learning-based to obtain conclusions that are indepen-dent of the sentiment analysis tools.
3) We are the first to formalize the relationship betweensentiment and truth as conditional probability, a re-search question that has been asked [12]–[15], but hasnot been formalized, before.
4) We combine statistical hypothesis testing and a varietyof datasets and sentiment analysis tools to demonstratethat sentiment has a statistically significant correlationwith fake news in our datasets. In particular, we leverageGoodman and Kruskal’s gamma, a symmetric measureof association between two ordinal variables of senti-ment and veracity. Gamma is a measure of associationthat ranges between -1 (perfect inversion) to 1 (perfectagreement), where 0 indicates no association. We makeour data and code available to support reproducibility.
Using the seven annotated corpora and three sentimentanalysis tools (MeaningCloud, TextBlob, and AFINN) weconclude that negative news are more likely to be false andnews with positive sentiment are more likely to be true, with asignificance level of 0.99999. In all of the experiments wherestatistical significance is achieved, we observe a positiveassociation between veracity and sentiment, with gammaranging from .037 to .475.
The rest of this paper is organized as follows. Sections II andIII explain the datasets and sentiment analysis tools. Section IVdetails the experiments including the formalization of theproblem as conditional probability and statistical hypothesistesting. Section V addresses potential threats to the validityof this study and our strategies to address them. Section VIcovers related work and Section VII concludes the paper.
II. DATASETS
Through an extensive review of related work, we selectedthe following datasets for fake news analysis:
• Liar [17]• Two datasets from Fakenewsnet (FNN) [18], namely
FNN-Gossip Cop (FNN-G) and FNN-PolitiFact (FNN-P)• Two datasets from the paper “This Just In” (TJI) [14],
namely TJI-Buzzfeed (TJI-B) and TJI-Random (TJI-R)
• Two datasets from the paper “Truth of Varying Shades”(TVS) [19], namely TVS-PolitiFact (TVS-P) and TVS-Unreliable (TVS-U)
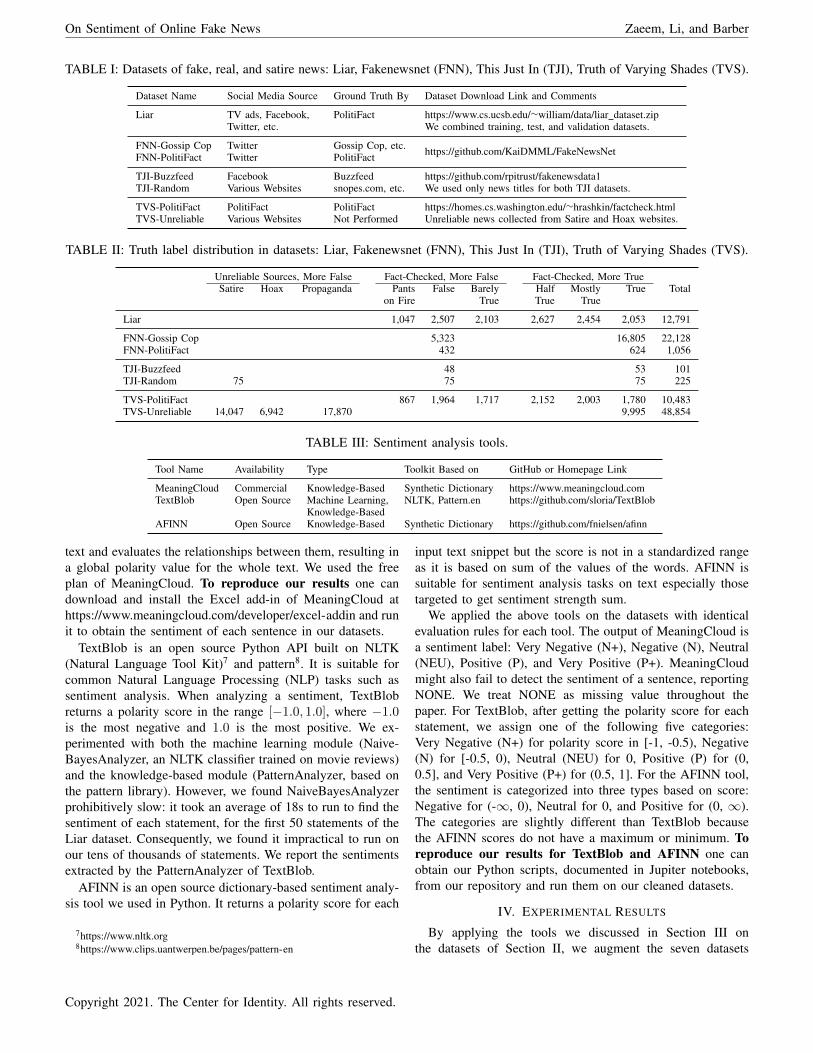
Tables I and II show these datasets and some detailsabout each. In Table I, the second column lists the sourceof the datasets as reported by their authors. In order toassign truth labels, each dataset was fact-checked by humanexperts (column 3) before it was released by dataset authors.The fact-checkers are professional journalists, e.g., PolitiFact(https://www.politifact.com), or other experts in the corre-sponding filed of the dataset, e.g., Gossip Cop (https://www.gossipcop.com). The Unreliable News dataset of TVS wasnot fact-checked, but it was directly collected from unreliablenews sources. In order to reproduce our study, one candownload the datasets directly from their authors, throughthe links given in the last column of Table I. Alternatively,one can download a cleaned version from our repository athttps://github.com/UTCID/SentimentOfFakeNewsData.
Table II reports the size and distribution of truth labels inthe datasets. Some of the datasets (Liar and TVS-PolitiFact)leverage the six-level truth labeling system of PolitiFact,ranging from True to Pant on Fire (totally false). Even thoughPolitiFact always fact-checks news on a six-grade scale, somedataset authors have combined all fake news into one label ofFalse/Fake and all partially true stories into one label of True.Consequently, some datasets fact-checked by PolitiFact, suchas FNN-PolitiFact, have only two truth labels in them. Table IIalso displays the distribution of the number of Satire, Hoax,Propaganda, and True news for the TVS-Unreliable dataset.The seven datasets combined have 95,638 labeled news storiesfrom a variety of social media (e.g., Facebook and Twitter),news agencies, unreliable web pages (e.g., The Natural Newsand American News), and satire (The Onion, The BorowitzReport, and Clickhole).
III. SENTIMENT ANALYSIS TOOLS
This section explains the commercial and open sourcesentiment analysis tools that we used to research the datasetsgathered in Section II. The idea is to investigate the resultsgenerated from different tools to make conclusions indepen-dent of the sentiment analysis tools leveraged.
We employ the following sentiment analysis tools:1) MeaningCloud4
2) TextBlob5
3) AFINN6
Table III reports these tools and some information abouteach. We selected a combination of open source and commer-cial tools, aiming to cover both types of sentiment analysistechniques: knowledge-based and machine learning.
MeaningCloud is a commercial, knowledge-based sentimentanalysis tool. It leverages a dictionary to identify the localpolarity of different sentences or grammatical structures in the
4https://www.meaningcloud.com/developer/sentiment-analysis/doc/2.15https://textblob.readthedocs.io/en/dev/index.html6https://github.com/fnielsen/afinn
Copyright 2021. The Center for Identity. All rights reserved.
On Sentiment of Online Fake News Zaeem, Li, and Barber
TABLE I: Datasets of fake, real, and satire news: Liar, Fakenewsnet (FNN), This Just In (TJI), Truth of Varying Shades (TVS).
Dataset Name Social Media Source Ground Truth By Dataset Download Link and Comments
Liar TV ads, Facebook, PolitiFact https://www.cs.ucsb.edu/∼william/data/liar dataset.zipTwitter, etc. We combined training, test, and validation datasets.
FNN-Gossip Cop Twitter Gossip Cop, etc. https://github.com/KaiDMML/FakeNewsNetFNN-PolitiFact Twitter PolitiFact
TJI-Buzzfeed Facebook Buzzfeed https://github.com/rpitrust/fakenewsdata1TJI-Random Various Websites snopes.com, etc. We used only news titles for both TJI datasets.
TVS-PolitiFact PolitiFact PolitiFact https://homes.cs.washington.edu/∼hrashkin/factcheck.htmlTVS-Unreliable Various Websites Not Performed Unreliable news collected from Satire and Hoax websites.
TABLE II: Truth label distribution in datasets: Liar, Fakenewsnet (FNN), This Just In (TJI), Truth of Varying Shades (TVS).
Unreliable Sources, More False Fact-Checked, More False Fact-Checked, More TrueSatire Hoax Propaganda Pants False Barely Half Mostly True Total
on Fire True True True
Liar 1,047 2,507 2,103 2,627 2,454 2,053 12,791
FNN-Gossip Cop 5,323 16,805 22,128FNN-PolitiFact 432 624 1,056
TJI-Buzzfeed 48 53 101TJI-Random 75 75 75 225
TVS-PolitiFact 867 1,964 1,717 2,152 2,003 1,780 10,483TVS-Unreliable 14,047 6,942 17,870 9,995 48,854
TABLE III: Sentiment analysis tools.
Tool Name Availability Type Toolkit Based on GitHub or Homepage Link
MeaningCloud Commercial Knowledge-Based Synthetic Dictionary https://www.meaningcloud.comTextBlob Open Source Machine Learning, NLTK, Pattern.en https://github.com/sloria/TextBlob
Knowledge-BasedAFINN Open Source Knowledge-Based Synthetic Dictionary https://github.com/fnielsen/afinn
text and evaluates the relationships between them, resulting ina global polarity value for the whole text. We used the freeplan of MeaningCloud. To reproduce our results one candownload and install the Excel add-in of MeaningCloud athttps://www.meaningcloud.com/developer/excel-addin and runit to obtain the sentiment of each sentence in our datasets.
TextBlob is an open source Python API built on NLTK(Natural Language Tool Kit)7 and pattern8. It is suitable forcommon Natural Language Processing (NLP) tasks such assentiment analysis. When analyzing a sentiment, TextBlobreturns a polarity score in the range [−1.0, 1.0], where −1.0is the most negative and 1.0 is the most positive. We ex-perimented with both the machine learning module (Naive-BayesAnalyzer, an NLTK classifier trained on movie reviews)and the knowledge-based module (PatternAnalyzer, based onthe pattern library). However, we found NaiveBayesAnalyzerprohibitively slow: it took an average of 18s to run to find thesentiment of each statement, for the first 50 statements of theLiar dataset. Consequently, we found it impractical to run onour tens of thousands of statements. We report the sentimentsextracted by the PatternAnalyzer of TextBlob.
AFINN is an open source dictionary-based sentiment analy-sis tool we used in Python. It returns a polarity score for each
7https://www.nltk.org8https://www.clips.uantwerpen.be/pages/pattern-en
input text snippet but the score is not in a standardized rangeas it is based on sum of the values of the words. AFINN issuitable for sentiment analysis tasks on text especially thosetargeted to get sentiment strength sum.
We applied the above tools on the datasets with identicalevaluation rules for each tool. The output of MeaningCloud isa sentiment label: Very Negative (N+), Negative (N), Neutral(NEU), Positive (P), and Very Positive (P+). MeaningCloudmight also fail to detect the sentiment of a sentence, reportingNONE. We treat NONE as missing value throughout thepaper. For TextBlob, after getting the polarity score for eachstatement, we assign one of the following five categories:Very Negative (N+) for polarity score in [-1, -0.5), Negative(N) for [-0.5, 0), Neutral (NEU) for 0, Positive (P) for (0,0.5], and Very Positive (P+) for (0.5, 1]. For the AFINN tool,the sentiment is categorized into three types based on score:Negative for (-∞, 0), Neutral for 0, and Positive for (0, ∞).The categories are slightly different than TextBlob becausethe AFINN scores do not have a maximum or minimum. Toreproduce our results for TextBlob and AFINN one canobtain our Python scripts, documented in Jupiter notebooks,from our repository and run them on our cleaned datasets.
IV. EXPERIMENTAL RESULTS
By applying the tools we discussed in Section III onthe datasets of Section II, we augment the seven datasets
Copyright 2021. The Center for Identity. All rights reserved.
On Sentiment of Online Fake News Zaeem, Li, and Barber
of about 100K statements, marking each statement with itsautomatically assigned sentiment. Each tool might produce aslightly different sentiment for a given statement. Also, recallthat each statement already has its truth label. In this sectionwe measure the association between sentiment and veracity.
A. First Research Question (RQ)
If S is the sentiment and T is the truth label of a statement:RQ1: What is P (T |S)—i.e., given a sentiment (e.g., Very Pos-itive) what is the probability of a truth label (e.g., Barely True),for example P (T = “BarelyTrue”|S = “V eryPositive”)?
We are the first to formalize this question with conditionalprobability, even though multiple previous work [12]–[15] hasasked this research question. Answering this research questionreveals any possible statistical relationship between sentimentand veracity, and also it can benefit the design of new toolsfor automatic detection of fake news [2], [5]–[7], [20].
We calculate and chart P (T |S) for the combination offour datasets and three tools. The datasets we report in theseexperiments are Liar, FNN-G, FNN-P, and TVS-U. Through-out this paper, to determine statistical significance, we setα = 0.00001. For the TJI-B and TJI-R datasets, statisticalsignificance was not achieved when leveraging any of thesentiment analysis tools (even with α = 0.01), because of theirsmall dataset sizes of 101 and 205 statements, respectively.As a result, we do not report our experiments with TJI-B andTJI-R. Finally, upon further manual investigation, we realizedthat the TVS-P dataset is in fact a subset of the Liar dataset,with differences in punctuation. Therefore, we do not reportseparate results for TVS-P as they are largely the same as Liar.
B. Results: FNN-G
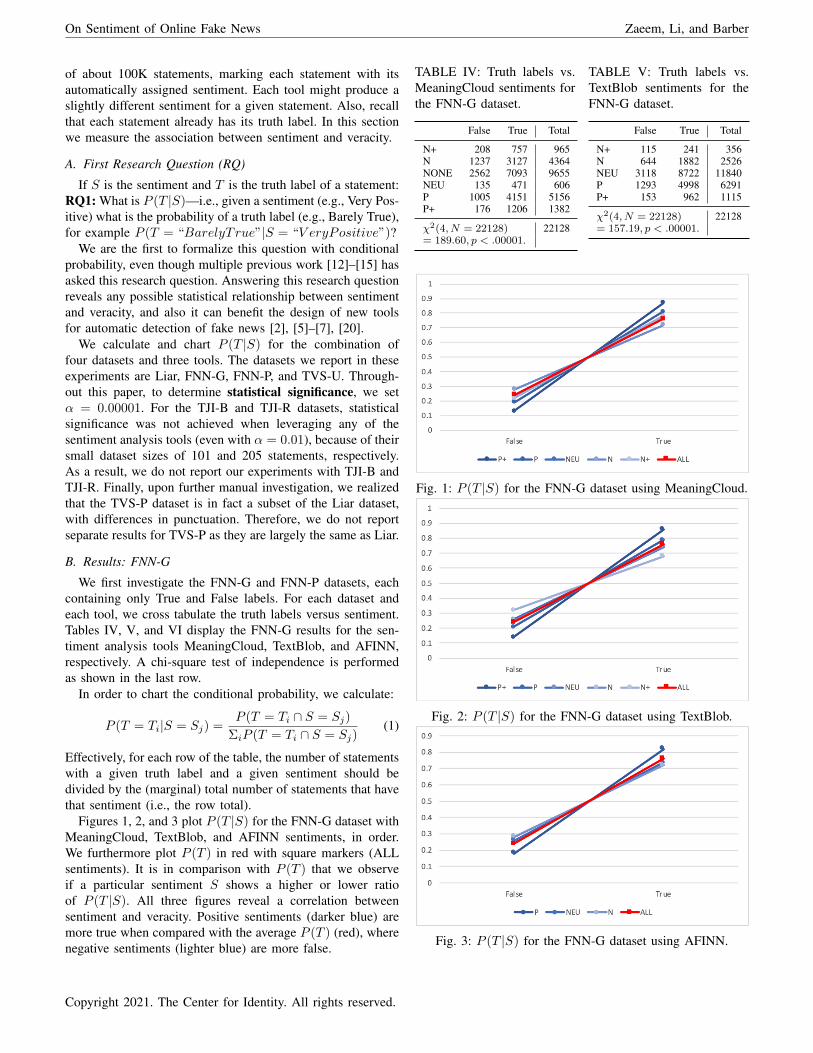
We first investigate the FNN-G and FNN-P datasets, eachcontaining only True and False labels. For each dataset andeach tool, we cross tabulate the truth labels versus sentiment.Tables IV, V, and VI display the FNN-G results for the sen-timent analysis tools MeaningCloud, TextBlob, and AFINN,respectively. A chi-square test of independence is performedas shown in the last row.
In order to chart the conditional probability, we calculate:
P (T = Ti|S = Sj) =P (T = Ti ∩ S = Sj)
ΣiP (T = Ti ∩ S = Sj)(1)
Effectively, for each row of the table, the number of statementswith a given truth label and a given sentiment should bedivided by the (marginal) total number of statements that havethat sentiment (i.e., the row total).
Figures 1, 2, and 3 plot P (T |S) for the FNN-G dataset withMeaningCloud, TextBlob, and AFINN sentiments, in order.We furthermore plot P (T ) in red with square markers (ALLsentiments). It is in comparison with P (T ) that we observeif a particular sentiment S shows a higher or lower ratioof P (T |S). All three figures reveal a correlation betweensentiment and veracity. Positive sentiments (darker blue) aremore true when compared with the average P (T ) (red), wherenegative sentiments (lighter blue) are more false.
TABLE IV: Truth labels vs.MeaningCloud sentiments forthe FNN-G dataset.
False True Total
N+ 208 757 965N 1237 3127 4364NONE 2562 7093 9655NEU 135 471 606P 1005 4151 5156P+ 176 1206 1382
χ2(4, N = 22128) 22128= 189.60, p < .00001.
TABLE V: Truth labels vs.TextBlob sentiments for theFNN-G dataset.
False True Total
N+ 115 241 356N 644 1882 2526NEU 3118 8722 11840P 1293 4998 6291P+ 153 962 1115
χ2(4, N = 22128) 22128= 157.19, p < .00001.
Fig. 1: P (T |S) for the FNN-G dataset using MeaningCloud.
Fig. 2: P (T |S) for the FNN-G dataset using TextBlob.
Fig. 3: P (T |S) for the FNN-G dataset using AFINN.
Copyright 2021. The Center for Identity. All rights reserved.

On Sentiment of Online Fake News Zaeem, Li, and Barber
TABLE VI: Truth labels vs.AFINN sentiments for theFNN-G dataset.
False True Total
N 1405 3609 5014NEU 2689 7604 10293P 1229 5592 6821
χ2(2, N = 22128) 22128= 203.39, p < .00001.
TABLE VII: Truth labels vs.MeaningCloud sentiments forthe FNN-P dataset.
False True Total
N+ 47 14 61N 171 87 258NONE 127 428 555NEU 20 8 28P 60 75 135P+ 7 12 19
χ2(4, N = 1056) 1056= 31.08, p < .00001.
TABLE VIII: Truth labels vs.TextBlob sentiments for theFNN-P dataset.
False True Total
N+ 10 2 12N 86 41 127NEU 240 462 702P 89 111 200P+ 7 8 15
χ2(4, N = 1056) 1056= 61.08, p < .00001.
TABLE IX: Truth labels vs.AFINN sentiments for theFNN-P dataset.
False True Total
N 211 96 307NEU 165 431 596P 56 97 153
χ2(2, N = 1056) 1056= 142.59, p < .00001.
C. Results: FNN-P
Tables VII, VIII, and IX include the results for FNN-P an-alyzed with MeaningCloud, TextBlob, and AFINN. Figures 4,5, and 6 are the corresponding figures. These figures suggest aclearer association between positive sentiment and true newsas well as between negative sentiment and fake news. In otherwords, in this dataset, knowing the sentiment of a statement(e.g., negative) dramatically increases the probability of thecorresponding truth label (e.g., false). Consider Figure 5: thesentiments extracted by TextBlob for FNN-P. If the sentimentof a statement is very negative (N+), it is three times lesslikely, when compared to the average, to be True (P (T |S =N+) ≈ 0.2 vs. P (T ) ≈ 0.6). The same association betweennegative sentiment and False labels as well as between positivesentiment and True labels holds for N, P, and P+ sentiments.
D. Results: Liar
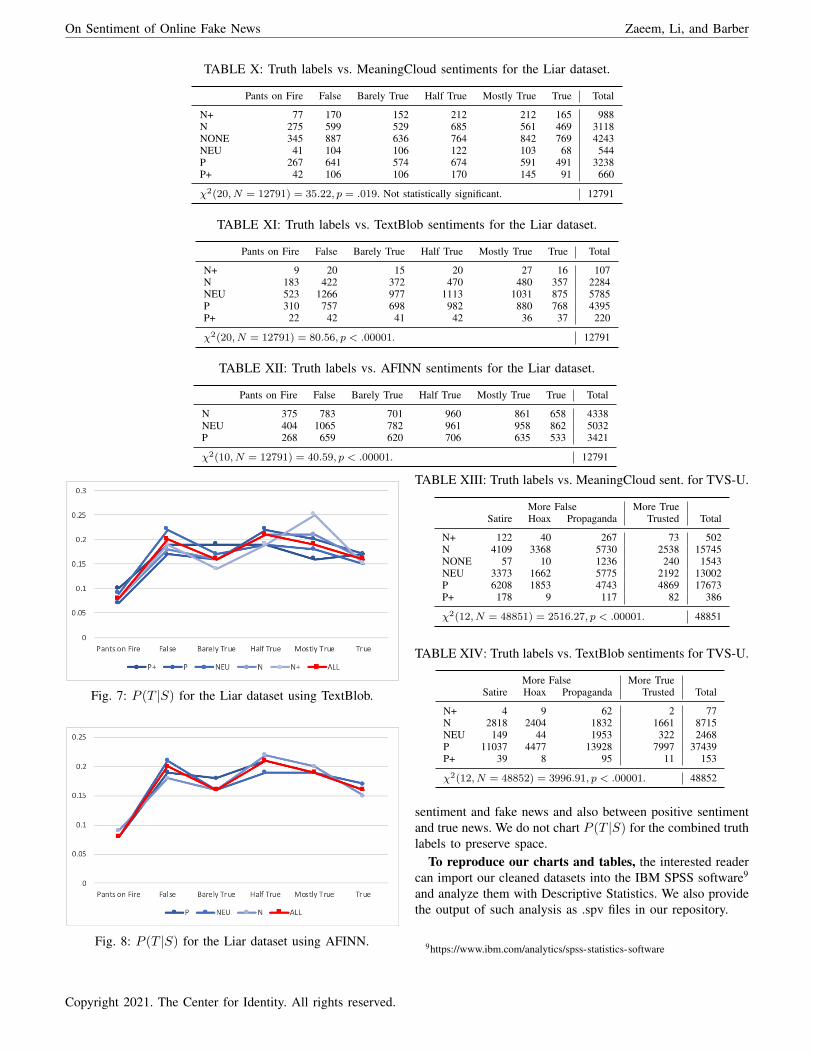
Tables X, XI and XII cross-tabulate the truth labels vs.MeaningCloud, TextBlob and AFINN sentiments for the Liardataset, respectively.
Figure 7 plots P (T |S) for Liar and TextBlob. Figure 8displays the same for Liar and AFINN. Sentiment has ordinalvalues (i.e., there is a natural order between sentiments goingfrom N+ to P+). The application of MeaningCloud on Liardid not produce statistically significant results (even with thelower value of α = 0.01).
We observe, in Figures 7 and 8, that even though thesentiment analysis tool used does have an effect on the P (T |S)distribution, the trend is generally the same in these twofigures. Both of these figures reflect the underlining truthdistribution of the Liar dataset (shown with square markersin red). The relationship between sentiment and truth level is
Fig. 4: P (T |S) for the FNN-P dataset using MeaningCloud.
Fig. 5: P (T |S) for the FNN-P dataset using TextBlob.
Fig. 6: P (T |S) for the FNN-P dataset using AFINN.
more nuance and requires a more specific statistical analysisas explained in Section IV-F.
E. Results: TVS-U
Finally, Tables XIII, XIV, and XV are the results of ana-lyzing the TVS-U dataset with MeaningCloud, TextBlob, andAFINN, respectively. Since there is not, necessarily, an orderbetween Satire, Hoax, and Propaganda in terms of veracity, wecannot chart P (T |S) at the granularity of these veracity labels.In Section IV-F we combine Satire, Hoax, and Propagandaas fake news and perform further analysis. P (T |S) for suchcombined truth labels shows association between negative
Copyright 2021. The Center for Identity. All rights reserved.
On Sentiment of Online Fake News Zaeem, Li, and Barber
TABLE X: Truth labels vs. MeaningCloud sentiments for the Liar dataset.
Pants on Fire False Barely True Half True Mostly True True Total
N+ 77 170 152 212 212 165 988N 275 599 529 685 561 469 3118NONE 345 887 636 764 842 769 4243NEU 41 104 106 122 103 68 544P 267 641 574 674 591 491 3238P+ 42 106 106 170 145 91 660
χ2(20, N = 12791) = 35.22, p = .019. Not statistically significant. 12791
TABLE XI: Truth labels vs. TextBlob sentiments for the Liar dataset.
Pants on Fire False Barely True Half True Mostly True True Total
N+ 9 20 15 20 27 16 107N 183 422 372 470 480 357 2284NEU 523 1266 977 1113 1031 875 5785P 310 757 698 982 880 768 4395P+ 22 42 41 42 36 37 220
χ2(20, N = 12791) = 80.56, p < .00001. 12791
TABLE XII: Truth labels vs. AFINN sentiments for the Liar dataset.
Pants on Fire False Barely True Half True Mostly True True Total
N 375 783 701 960 861 658 4338NEU 404 1065 782 961 958 862 5032P 268 659 620 706 635 533 3421
χ2(10, N = 12791) = 40.59, p < .00001. 12791
Fig. 7: P (T |S) for the Liar dataset using TextBlob.
Fig. 8: P (T |S) for the Liar dataset using AFINN.
TABLE XIII: Truth labels vs. MeaningCloud sent. for TVS-U.
More False More TrueSatire Hoax Propaganda Trusted Total
N+ 122 40 267 73 502N 4109 3368 5730 2538 15745NONE 57 10 1236 240 1543NEU 3373 1662 5775 2192 13002P 6208 1853 4743 4869 17673P+ 178 9 117 82 386
χ2(12, N = 48851) = 2516.27, p < .00001. 48851
TABLE XIV: Truth labels vs. TextBlob sentiments for TVS-U.
More False More TrueSatire Hoax Propaganda Trusted Total
N+ 4 9 62 2 77N 2818 2404 1832 1661 8715NEU 149 44 1953 322 2468P 11037 4477 13928 7997 37439P+ 39 8 95 11 153
χ2(12, N = 48852) = 3996.91, p < .00001. 48852
sentiment and fake news and also between positive sentimentand true news. We do not chart P (T |S) for the combined truthlabels to preserve space.
To reproduce our charts and tables, the interested readercan import our cleaned datasets into the IBM SPSS software9
and analyze them with Descriptive Statistics. We also providethe output of such analysis as .spv files in our repository.
9https://www.ibm.com/analytics/spss-statistics-software
Copyright 2021. The Center for Identity. All rights reserved.

On Sentiment of Online Fake News Zaeem, Li, and Barber
TABLE XV: Truth labels vs. AFINN sentiments for TVS-U.
More False More TrueSatire Hoax Propaganda Trusted Total
N 5828 4538 11073 4152 25591NEU 584 226 1621 481 2912P 7635 2178 5176 5360 20349
χ2(6, N = 48852) = 3307.99, p < .00001. 48852
F. Second Research Question
Inspired by our observation of P (T |S), we form RQ2: Howmuch is the correlation between sentiment and veracity?
Before we answer the second research question, in order toaddress the concern about the lack of an order between Satire,Hoax, and Propaganda in the TVS-U dataset, we put thesethree labels together to form the group of False statements.In Tables XIII to XV, the two new labels True and Falseare separated with lines. Note that in the data reported fromMeaningCloud, we still ignore the NONE sentiments and treatthem as missing values.
Recall chi-square tests of independence that were displayedin the last row of each table. We find that there is a statisticallysignificant relationship between truth level and sentiment ineleven out of twelve combinations of datasets and sentimentanalysis tools. In all but one combination (Liar with Meaning-Cloud) the results are statistically significant.
To quantify the relationship between sentiment and truthlevel, we recognize that they are two ordinal variables. Weutilize Goodman and Kruskal’s gamma, a symmetric measureof association between two ordinal variables. Gamma rangesbetween -1 and 1, with -1 showing perfect inversion and 1meaning perfect agreement. The 0 value indicates no relation-ship. We pick gamma because it does not penalize for ties,but do report other measures such as tau-b and tau-c for theinterested reader in our SPSS output files in our repository.
As Table XVI shows, gamma is always positive, exceptfor the two cases where not statistically significant (Liarwith MeaningCloud and Liar with AFINN). The positivevalue of gamma means positive association between beingreal news and having a positive sentiment. It also revealspositive association between fake news and negative sentiment.Gamma is between .037 and .475 for different dataset/toolcombinations, with an average value of .220 and standarddeviation of 0.130. To reproduce these results, the readercan utilize IBM SPSS and our datasets, or view the SPSSoutputs reported in our repository.
V. THREATS TO VALIDITY
The most important threat to the internal validity of thisstudy is the applicability of the statistical measures and con-ditional probability. To address this threat, we carefully pickedthe most proper mathematical formulations we could find, e.g.,gamma. In addition, we report other statistical measures in ourpublicly available repository. The major threat to the externalvalidity of this study is whether the datasets and tools selectedare representative of the entire body of social media/Internetposts and sentiment analysis tools. To mitigate this threat, we
performed a wide study of all the available datasets in theliterature we could find and selected seven diverse datasetswith a total of about 100K statements. We further consideredand experimented with various types of sentiment analysistools, both commercial and open source.
VI. RELATED WORK
Most of the literature on sentiment of social media fakenews (e.g., [9]–[11]) agrees that there is a correlation be-tween negative sentiment and fake news, and so does thepsychological research on linguistic traits of lies. From thisfirst group is the work of Kwon et al. [12] who experimentedwith a dictionary-based sentiment analysis tool applied on aset of about 2K tweets and demonstrated that rumors weresignificantly less likely to have a positive sentiment. Anotherexample is from Rubin et al. [13] who found more negativesentiment in fake news in their analysis of 360 satire/fakeand real news articles. Finally, Horne et al. [14] leverageddictionary-based and academic tools for sentiment analysis.They concluded that fake news has more negative sentiment.This particular conclusion, however, was based on only one oftheir datasets with about 70 fake and real news Facebook posts.Our results are in line with this group. However, we utilize abigger more diverse body of corpora and we quantitativelymeasure the correlation.
There is a second group, however, that comes to a differentconclusion. For example, Castillo et al. [16] showed thatfake and non-credible news tend to exhibit more sentiment,both positive and negative, but particularly more positivesentiment. They do not report the exact number of tweetsin their dataset which was evaluated for credibility, or thesentiment analysis algorithm they use, as they cover a hostof other features too. It is important to note that, credibility,as the perceived veracity value, is not the same as the actualveracity. Hu et al. [15] sought to find out whether sentimentdifferences exist between spammers and other social mediausers. Based on two Twitter datasets of 42K and 20K Twitterusers, they reported that spammers tend to have more positivesentiment compared to normal users. They used a supervisedmethod (linear regression) for sentiment analysis. Their workis close to ours, but they utilize sentiment for effective socialspammer detection: according to later publications form thesame authors [3], spammer detection most closely resemblesfinding social bots—non-human users that circulate fake news.
Besides analyzing the sentiment of fake news, other re-searchers have studied the sentiment of comments posted onfake news stories [6], [18], [21]–[23]. Our focus, however, ison the news content.
A. Datasets
We obtained seven datasets from the literature as explainedin Section II. In addition, we downloaded the Credbank [24]dataset. This dataset, however, did not include the news textbut rather links to the news. In an effort to download thenews text, we realized that out of 2,282 links provided in thisdataset, 291 were links to videos, 207 were links to photos,
Copyright 2021. The Center for Identity. All rights reserved.

On Sentiment of Online Fake News Zaeem, Li, and Barber
TABLE XVI: Ordinal by ordinal symmetric measure, gamma. Asymptotic Standard Error calculated not assuming the nullhypothesis. Approximate T calculated using the asymptotic standard error assuming the null hypothesis.
Dataset Sentiment Analysis Gamma Asymptotic Standard Error Approximate T Approximate Significance
LiarMeaningCloud -.006 .012 -.491 .623TextBlob .037 .010 3.695 .000AFINN -.007 .010 -.741 .459
FNN-GMeaningCloud .200 .016 12.095 .000TextBlob .146 .013 11.177 .000AFINN .177 .013 13.724 .000
FNN-PMeaningCloud .380 .067 5.308 .000TextBlob .177 .059 2.981 .003AFINN .475 .047 9.314 .000
TVS-UMeaningCloud .241 .009 25.994 .000TextBlob .097 .013 7.577 .000AFINN .270 .010 25.979 .000
and 601 were broken links. As a result, about half of the linksin this dataset were not useful to our study. Consequently, wedid not use the Credbank dataset.
VII. CONCLUSION
We collected a diverse corpora of seven labeled true/fakenews datasets, containing about 100K statements. Using var-ious sentiment analysis tools, we studied the relationshipbetween sentiment and truth labels (i.e., veracity), two ordinalvariables. Leveraging conditional probability and statisticalhypothesis testing, we found a statistically signification rela-tionship between negative sentiment and fake news as well asbetween positive sentiment and true news, with α = 0.00001.The degree of association, as measured by Goodman andKruskal’s gamma, ranges between .037 to .475, with anaverage value of .220. We make our code, datasets, and resultspublicly available, so that other researchers can fully reproducethis study. Our work paves the way for the design of betterautomatic fake news detectors as well as enlightens socialmedia users on the characteristics of fake news.
REFERENCES
[1] H. Allcott and M. Gentzkow, “Social media and fake news in the 2016election,” Journal of economic perspectives, vol. 31, no. 2, pp. 211–36,2017.
[2] N. J. Conroy, V. L. Rubin, and Y. Chen, “Automatic deception detection:Methods for finding fake news,” Proceedings of the Association forInformation Science and Technology, vol. 52, no. 1, pp. 1–4, 2015.
[3] K. Shu, A. Sliva, S. Wang, J. Tang, and H. Liu, “Fake news detection onsocial media: A data mining perspective,” ACM SIGKDD ExplorationsNewsletter, vol. 19, no. 1, pp. 22–36, 2017.
[4] E. C. Tandoc Jr, Z. W. Lim, and R. Ling, “Defining “fake news” atypology of scholarly definitions,” Digital journalism, vol. 6, no. 2, pp.137–153, 2018.
[5] N. Hassan, F. Arslan, C. Li, and M. Tremayne, “Toward automatedfact-checking: Detecting check-worthy factual claims by claimbuster,”in Proceedings of the 23rd ACM SIGKDD International Conference onKnowledge Discovery and Data Mining, 2017, pp. 1803–1812.
[6] M. D. Vicario, W. Quattrociocchi, A. Scala, and F. Zollo, “Polarizationand fake news: Early warning of potential misinformation targets,” ACMTransactions on the Web (TWEB), vol. 13, no. 2, pp. 1–22, 2019.
[7] M. Hardalov, I. Koychev, and P. Nakov, “In search of credible news,”in International Conference on Artificial Intelligence: Methodology,Systems, and Applications. Springer, 2016, pp. 172–180.
[8] C. F. Bond Jr and B. M. DePaulo, “Accuracy of deception judgments,”Personality and social psychology Review, vol. 10, no. 3, pp. 214–234,2006.
[9] M. L. Newman, J. W. Pennebaker, D. S. Berry, and J. M. Richards,“Lying words: Predicting deception from linguistic styles,” Personalityand social psychology bulletin, vol. 29, no. 5, pp. 665–675, 2003.
[10] M. Ott, C. Cardie, and J. T. Hancock, “Negative deceptive opinionspam,” in Proceedings of the 2013 conference of the north americanchapter of the association for computational linguistics: human lan-guage technologies, 2013, pp. 497–501.
[11] P. Ekman and W. V. Friesen, “Nonverbal leakage and clues to deception,”Psychiatry, vol. 32, no. 1, pp. 88–106, 1969.
[12] S. Kwon, M. Cha, K. Jung, W. Chen, and Y. Wang, “Prominent featuresof rumor propagation in online social media,” in 2013 IEEE 13thInternational Conference on Data Mining. IEEE, 2013, pp. 1103–1108.
[13] V. L. Rubin, N. Conroy, Y. Chen, and S. Cornwell, “Fake news ortruth? using satirical cues to detect potentially misleading news,” inProceedings of the second workshop on computational approaches todeception detection, 2016, pp. 7–17.
[14] B. D. Horne and S. Adali, “This just in: fake news packs a lot intitle, uses simpler, repetitive content in text body, more similar to satirethan real news,” in Eleventh International AAAI Conference on Web andSocial Media, 2017.
[15] X. Hu, J. Tang, H. Gao, and H. Liu, “Social spammer detection withsentiment information,” in 2014 IEEE International Conference on DataMining. IEEE, 2014, pp. 180–189.
[16] C. Castillo, M. Mendoza, and B. Poblete, “Information credibility onTwitter,” in Proceedings of the 20th international conference on worldwide web, 2011, pp. 675–684.
[17] W. Y. Wang, “liar, liar pants on fire: A new benchmark dataset forfake news detection,” in the 55th Annual Meeting of the Association forComputational Linguistics (Volume 2: Short Papers), 2017, pp. 422–426.
[18] K. Shu, D. Mahudeswaran, S. Wang, D. Lee, and H. Liu, “Fakenewsnet:A data repository with news content, social context, and spatiotemporalinformation for studying fake news on social media,” Big Data, pp.171–188, 2020.
[19] H. Rashkin, E. Choi, J. Y. Jang, S. Volkova, and Y. Choi, “Truth ofvarying shades: Analyzing language in fake news and political fact-checking,” in Proceedings of the 2017 Conference on Empirical Methodsin Natural Language Processing, 2017, pp. 2931–2937.
[20] T.-C. Huang, R. N. Zaeem, and K. S. Barber, “It is an equal failing totrust everybody and to trust nobody: Stock price prediction using trustfilters and enhanced user sentiment on Twitter,” ACM Transactions onInternet Technology (TOIT), vol. 19, no. 4, pp. 1–20, 2019.
[21] F. Zollo, P. K. Novak, M. Del Vicario, A. Bessi, I. Mozetic, A. Scala,G. Caldarelli, and W. Quattrociocchi, “Emotional dynamics in the ageof misinformation,” PloS one, vol. 10, no. 9, 2015.
[22] L. Cui, S. Wang, and D. Lee, “Same: sentiment-aware multi-modal em-bedding for detecting fake news,” in Proceedings of the 2019 IEEE/ACMInternational Conference on Advances in Social Networks Analysis andMining, 2019, pp. 41–48.
[23] S. Vosoughi, M. Mohsenvand, and D. Roy, “Rumor gauge: Predictingthe veracity of rumors on Twitter,” ACM transactions on knowledgediscovery from data (TKDD), vol. 11, no. 4, pp. 1–36, 2017.
[24] T. Mitra and E. Gilbert, “Credbank: A large-scale social media corpuswith associated credibility annotations,” in Ninth International AAAIConference on Web and Social Media, 2015.
Copyright 2021. The Center for Identity. All rights reserved.

W W W.IDENTIT Y.UTEX AS.EDU
Copyright ©2020 The University of Texas Confidential and Proprietary, All Rights Reserved.
Copyright © 2022 FDOKUMEN