
Ogunkah_Ibuchim_thesis.pdf - WestminsterResearch
455
WestminsterResearch http://www.westminster.ac.uk/research/westminsterresearch Rethinking low-cost green building material selection process in the design of low-impact green housing developments Ibuchim Ogunkah Faculty of Architecture and the Built Environment This is an electronic version of a PhD thesis awarded by the University of Westminster. © The Author, 2015. This is an exact reproduction of the paper copy held by the University of Westminster library. The WestminsterResearch online digital archive at the University of Westminster aims to make the research output of the University available to a wider audience. Copyright and Moral Rights remain with the authors and/or copyright owners. Users are permitted to download and/or print one copy for non-commercial private study or research. Further distribution and any use of material from within this archive for profit-making enterprises or for commercial gain is strictly forbidden. Whilst further distribution of specific materials from within this archive is forbidden, you may freely distribute the URL of WestminsterResearch: (http://westminsterresearch.wmin.ac.uk/). In case of abuse or copyright appearing without permission e-mail [email protected]
-
Upload
khangminh22 -
Category
Documents
-
view
0 -
download
0
Transcript of Ogunkah_Ibuchim_thesis.pdf - WestminsterResearch

WestminsterResearch http://www.westminster.ac.uk/research/westminsterresearch
Rethinking low-cost green building material selection process in the design of low-impact green housing developments Ibuchim Ogunkah Faculty of Architecture and the Built Environment
This is an electronic version of a PhD thesis awarded by the University of Westminster. © The Author, 2015. This is an exact reproduction of the paper copy held by the University of Westminster library.
The WestminsterResearch online digital archive at the University of Westminster aims to make the research output of the University available to a wider audience. Copyright and Moral Rights remain with the authors and/or copyright owners. Users are permitted to download and/or print one copy for non-commercial private study or research. Further distribution and any use of material from within this archive for profit-making enterprises or for commercial gain is strictly forbidden.
Whilst further distribution of specific materials from within this archive is forbidden, you may freely distribute the URL of WestminsterResearch: (http://westminsterresearch.wmin.ac.uk/).
In case of abuse or copyright appearing without permission e-mail [email protected]

RETHINKING LOW-COST GREEN BUILDING MATERIAL SELECTION PROCESS IN THE DESIGN OF LOW-IMPACT GREEN HOUSING
DEVELOPMENTS
I.B. OGUNKAH
PhD
2015

RETHINKING LOW-COST GREEN BUILDING MATERIAL SELECTION PROCESS IN THE DESIGN OF LOW-IMPACT GREEN HOUSING
DEVELOPMENTS
IBUCHIM BOBO CYRIL OGUNKAH
A thesis submitted in partial fulfillment of the requirements of the University of Westminster
for the degree of Doctor of Philosophy
October 2015

I
RETHINKING LOW-‐COST GREEN BUILDING MATERIAL SELECTION PROCESS IN THE DESIGN OF LOW-‐IMPACT GREEN HOUSING
DEVELOPMENTS
IBUCHIM BOBO CYRIL OGUNKAH
A thesis submitted in partial fulfillment of the requirements of the University of Westminster for the degree of
Doctor of Philosophy
OCTOBER 2015

II
DECLARATION
This work has not previously been presented in any form to the University or
to any other body of knowledge except otherwise where portions of the work
were specifically excerpted for the sole purposes of peer-review assessment
and publication. Save for any express acknowledgment references and/or
bibliographies cited in the work, I confirm that the intellectual contents of the
work are the result of my own efforts and no other persons’.
The right of Ibuchim Cyril Bobo Ogunkah to be identified as author of this
work is asserted in accordance with ss.77 and 78 of the Copyright, Design
and Patents Act 1988 and §3 section 14 in the regulations for the Award of
the Degrees of Master of Philosophy and Doctor of Philosophy of the
University of Westminster. At this date copyright is owned by the author.
Signature: Ibuchim B. Cyril Ogunkah… …...
Date: October 2015………………………………………….………….…..…
Temporary requisition FORM 5 Ad Hoc Payments - Non Teaching
2
REQUISITION FORM 5 – AD HOC NON TEACHING 5A. PERSONAL DETAILS (Sections 5A, B & C must be completed by the ad hoc provider) Are current details already on file for this person?
Yes / No If Yes, the following boxes may be left blank, however the declaration at 5C must be signed.
Date of Birth: (dd/mm/yy)
07/11/1979 NI Number SL305124A
Home Address (In Full)
6A ROSS PARADE,
WALLINGTON, LONDON BOROUGH OF SUTTON, SURREY
Post Code:
SM6 8QG Telephone No.
07538800736 Email:
[email protected] Name of Bank/Building Society:
BARCLAYS Account Name:
IBUCHIM OGUNKAH
Branch Title:
WALLINGTON BRNCH Account No.:
93996476 Building Society Roll No.:
Sort Code:
20-74-09 5B. PERSONAL DETAILS – INFORMATION FOR TAX PURPOSES Please tick one of the following:
This is my first job since last 6 April & I have not been receiving Jobseeker's Allowance or taxable Incapacity Benefit or a state or occupational pension.
This is now my only job but since last 6 April I have had another job or have received taxable Job-seeker's Allowance or Incapacity Benefit. I do not receive a state or occupational pension.
I have another job or receive a state or occupational pension.
!
!
! 5C. SIGNATURE I declare that I have undertaken the work as detailed & the information provided is true & accurate 20/05/2013
Signature and Date
6. AUTHORISATION ORIGINATOR Signature Print Name Date Tel Ext Line Manager
AUTHORISATION Signature Print Name Date Tel Ext CS Manager/Head of Department
N.B In authorising and counter signing this form you are stating that you have checked the details provided and that the information is complete and complies with University procedures. Failure to do so could result in disciplinary action. Incomplete forms will be returned AUTHORISATION Signature Print Name Date Tel Ext Finance Manager
If the payment is for more than £500 or is to a contracted member of staff a Director/Dean must authorise this payment. Director/Dean
!
MW
?-
WWW
4W^ MMWk
I

III
ABSTRACT Since 1950, the world population has increased by more than double. The
sprawling demographic shift due to continuous migration from rural to urban
areas in developing countries imposes socio-economic and environmental
pressures to the urban areas. Apparently, the high demand for housing and the
unsustainable construction practices underlying its production in recent times
constitute issues that merit the attention of low-impact green housing
developments. The feasibility of such developments also lies in the effective
use of low-cost green building materials and components (LCGBMCs),
primarily because of their potential to conserve energy use, reduce life-cycle
cost, lessen ecological footprints, and revive lost cultural traditions.
Until recently however, only very few of these products have been widely
established in mainstream, on account that most designers are constrained by
their vaguely informed knowledge as to their sustainability impacts during the
early stages of the design decision-making process, when most of the
important decisions relating to sustainability are made. With the scale of
complexity on how to incorporate sustainability principles in the early stages
of the material selection decision-making process, and quest to stimulate the
motivation for their use in a wider industry context, a clear gap is identified.
Drawing on the concept of sustainability, this research aims to narrow the
underlying gap by exploring and evaluating the significance of an integrated
modular-oriented mode of assessment that is able to assist designers in
developing an improved capability to make early-informed choices, when
formulating decisions to select LCGBMCs at the early conceptual stages of
the design process. With results derived from the relevant literature, industry-
wide surveys, and through empirical evidence gathered from interviews with
a cross-section of house build stakeholders in Nigeria, key sustainability
principle indicators impacting the selection of building materials are
identified, analysed, grouped and ranked according to the relative importance
that each decision factor holds, using a suite of statistical analytical methods.

IV
The information gathered from the analysis with inputs elicited from
experienced professionals are used to develop a Multi-Criteria Material
Selection Decision Support System (MSDSS), and later refined with
feedbacks obtained from selected builder and developer companies. The
above integration is enhanced using Macro-in-Excel Database Management
System (DBMS), while the Analytical Hierarchy Process (AHP) model is
adopted as the ideal assessment methodology, given its ability to transform
objective and subjective variables into weighted scores. Expert surveys are
then used to demonstrate the usefulness of the suggested decision support
system. The applicability and validity of this model are further illustrated
using an ongoing housing project in Nigeria. By comparing the outputs from
the model to monitored data from the case study, it would emerge that
LCGBMCs, when properly assessed with consideration of the key
sustainability principle indicators (influential factors) at the early stages of the
design decision-making process, could reduce the potential life-cycle carbon
embodied energy of a typical residential housing project by nearly 40% and
yield energy savings of roughly 30-50% per year, when compared to their
conventional carbon-embodied equivalents.
This study concludes that by addressing integration of sustainability
principles into the material selection decision making processes at the early
stages of the design, better support will be provided to key decision makers
with the expectation of improved understanding and better informed choices,
hence stimulate the motivation for more use of LCGBMCs in a wider
industry context. The limitations of the study are highlighted and future
research directions to better exploit the model capabilities are proposed.

V
ACKNOWLEDGEMENTS
I owe a great many thanks to a great many people who have helped in the
process of organising this thesis during the course of this research, without
which this work would not have been as fruitful.
First and foremost, I am especially indebted to my Director of Studies, Dr.
Jun Li Yang, who convincingly conveyed a spirit of adventure and whose
works have consistently demonstrated to me that concern for global and
human affairs supported by an engagement in “sustainability” and
“technology” should always transcend academia and provide a quest for our
time and future generations; and to my Supervisor, Mr. Brian Jones, for his
seemingly endless patience throughout this study. Their encouragements,
dedication, commitment, insightful and constructive contributions to this
study will always be appreciated and remembered. Professor Marion Roberts
also provided support from start of the study and went far beyond the call of
duty to provide significant technical and moral support during and after the
writing process, and I am particularly grateful for her contributions.
The full fruition of this desired finality, I also owe to The Director of Post
Graduate Studies at Loughborough University, Professor Andrew Price, for
his novel inputs; and the Head of the Departments of Property and
Construction at the University of Westminster, Professor Stephen Gruneberg,
who helped to put in order the deluge of my straying line(s) of thought(s)
throughout the entire process. Also to Mr. Mike Fisher for his unfeigned
support from the ongoing to the end of this study. My greatest debt of
gratitude goes to the Rivers State Sustainable Development Agency (RSSDA)
for providing the funding that made this research possible. Also, to Mr. Bolaji
Ogunseye and Pastor Edith Chinda-Paul who undoubtedly initiated the
thought of pursuing a doctorate in this field of study. Many thanks to: Mr.
Noble Pepple, Dr. Godwin Poi, Dr. Napoleon Ono Imaah, and Arc. Gift
Akanwa, and also the helpful people at RSSDA for their unreserved support.

VI
I avail this opportunity to express my admiration for the noble assistance of
my family. My mum, Dame Gloria Ogunkah, of whom I am captivated by,
for the tenacity and mental wit with which she has handled pertinacious
matters. My aunts: Pastor Edith Chinda-Paul, of whom I feel truly honoured
to be a recipient and beneficiary of her intellectual rationale; and Mrs.
Comfort Ebireri, for her generous prayers and time during the first year of my
study. My siblings: Adele, Pamela, Zeru, Sharon, Pearl, Prudence, Honour
and Holly, for their moral tips during this long, tedious, strenuous,
excruciatingly boring yet exciting journey; and finally and most importantly
in the loving and profound memory of my late father- Mr. Cyril Kemnjika
Ogunkah, who although had inspired my drive in desperate straits but sadly,
never lived long enough to see me carry through to the end of this journey.
Thank you all! No words can say enough.

VII
DEDICATION
This research is dedicated to God Supreme- the One whose inevitable divine
grace knows no bound.

VIII
TABLE OF CONTENTS
DECLARATION……………………………………………………….......II
ABSTRACT……………………………………………………………......III
ACKNOWLEDGEMENT…………………………………...………..……V
DEDICATION…………………………………………………………….VII
TABLE OF CONTENTS……………………………………………..…VIII
LIST OF TABLES…………………………………………………….....XIV
LIST OF FIGURES………………………………………………….…...XV
LIST OF APPENDICES…………………………………………….....XVII
LIST OF ABBREVIATIONS ............................................................... XVIII
CHAPTER 1: GENERAL INTRODUCTION ............................................ 1
1.1 Introduction .............................................................................................. 1
1.2 Statement of Research Problem .............................................................. 3 1.2.1 Material Selection and Management Issues ..................................................................... 5 1.2.2 Technology in Material Selection and Management ........................................................ 6 1.2.3 Summary .......................................................................................................................... 8
1.3 Findings From Preliminary Research Study: Need for Further Study .......................................................................................................................... 9
1.4 Key Research Question .......................................................................... 10
1.5 Research Aim and Objectives ............................................................... 11
1.6 Research Methodology in Brief ............................................................ 12
1.7 Definitions ............................................................................................... 14
1.8 Rationale and Motivation for the Research ......................................... 15
1.9 Scope of the Research ............................................................................ 16
1.10 Significance of the Study ..................................................................... 16
1.11 Structure of the Thesis ......................................................................... 17 1.11.1 Chapter 1: General Introduction ................................................................................... 17 1.11.2 Chapter 2: The Housing Construction Industry ........................................................... 17 1.11.3 Chapter 3: Technology in Material Selection and Management .................................. 17 1.11.4 Chapter 4: Research Methodology ............................................................................... 18 1.11.5 Chapter 5: Development and Testing of the MSDSS Model ....................................... 18 1.11.6 Chapter 6: Validation of the MSDSS Model ................................................................ 18 1.11.7 Chapter 7: Summary, Conclusions and Recommendations ......................................... 18

IX
CHAPTER 2: THE HOUSING CONSTRUCTION INDUSTRY ........... 20
2.1 Introduction ............................................................................................ 20
2.2 The Role of the Housing Construction Industry: The Global Market Trend Analysis and Statistics ...................................................................... 21
2.3 Resultant Effects of Current Practices in the Housing Construction Industry ......................................................................................................... 24 2.3.1 Climate Change .............................................................................................................. 24 2.3.2 Loss of Biodiversity ....................................................................................................... 26 2.3.3 Material Waste generation .............................................................................................. 26 2.3.3 Social Change: Population Growth and Urbanisation .................................................... 27
2.4 Seeking an Alternative Approach to Housing Development .............. 29 2.4.1 Sustainable Development Principles in Housing ........................................................... 29 2.4.2 Low-Impact Green Housing Development in Developed Countries: An Alternative Approach to Sustainable Housing ........................................................................................... 34 2.4.2.1 Definition and concept of low-impact green housing developments ............................................................... 35 2.4.2.2 Rationale for low-impact green housing in developed countries ..................................................................... 38 2.4.2.3 Barriers affecting the implementation of low-impact green housing in developed countries .......................... 40
2.5 Low-Impact Green Housing in Developing Country .......................... 42 2.5.1 Key Barriers that Impact on the Implementation of Low-Impact Green Housing in Developing Countries .............................................................................................................. 42 2.5.2 Factors that Drive the Implementation of Low-Impact Green Housing in Developing Countries ................................................................................................................................. 44
2.6 The Nigerian Housing Construction Industry .................................... 47 2.6.1 Background and Context ................................................................................................ 47 2.6.2 A Profile of Nigeria: Geographic Location and Setting ................................................. 48 2.6.2.1 Location and size .............................................................................................................................................. 48 2.6.2.2 Topography and climate ................................................................................................................................... 49 2.6.2.3 Natural resources .............................................................................................................................................. 50 2.6.3 Population Growth and Urban Projections in Nigeria .................................................... 50 2.6.4 Urban Growth: Opportunities and Challenges in Nigeria .............................................. 51 2.6.4.1 Emerging trend ................................................................................................................................................. 51 2.6.4.2 Opportunities and benefits of urban growth ..................................................................................................... 52 2.6.4.3 Threats and challenges of urban growth ........................................................................................................... 53 2.6.5 Nigerian Housing Construction Industry: Size and Forecast ......................................... 54 2.6.5.1 Number of housing construction firms ............................................................................................................. 54 2.6.5.2 Housing construction output: current market trend, size and forecast ............................................................. 55 2.6.5.3 Employment generation .................................................................................................................................... 56 2.6.6 Housing Development in Nigeria: Current Trend .......................................................... 57 2.6.7 Low-Impact Green Housing Development: An Alternative Approach to Sustainable Housing in Nigeria .................................................................................................................. 61 2.6.7.1 Factors driving low-Impact green housing in Nigeria ...................................................................................... 61 2.6.7.2 Barriers impacting Low-Impact Green Housing in Nigeria ............................................................................. 64 2.6.8 Alternative Materials and Technologies: Drivers and Barriers Impacting the use of Low-Cost Green Building Materials in Nigeria ...................................................................... 66 2.6.9 Current Approach to Material Selection in the Nigerian Housing Industry ................... 70 2.7 Moving Towards Sustainable Material Selection ............................... 74
2.8 Summary ................................................................................................. 79

X
CHAPTER 3: TECHNOLOGY IN MATERIAL SELECTION ............. 80
3.1 Introduction ............................................................................................ 80
3.2 A Review of Existing Assessment Tools ............................................... 81 3.2.1 Decision Support Tools in Developed Countries ........................................................... 82 3.2.2 Decision Support Tools in Developing Countries .......................................................... 91 3.2.3 Building Assessment Methods-Knowledge-Based Tools .............................................. 96 3.2.4 Limitations of the Reviewed Assessment Tools .......................................................... 102 3.2.5 Strategies Derived From the Reviewed Assessment Tools .......................................... 105 3.3 Existing Techniques in Material Selection ........................................ 108 3.3.1 Environmental Valuation Techniques .......................................................................... 108 3.3.2 Life Cycle-Cost Analysis (LCCA) Technique ............................................................. 110 3.3.3 Life-Cycle Assessment (LCA) Technique ................................................................... 111 3.3.4 Single or Multiple Dimensional Evaluation Technique? ............................................. 114 3.4 Adopted Technique: Multi-Dimensional Approach ......................... 116 3.4.1 Defining Problems ........................................................................................................ 117 3.4.2 Identifying Alternatives ................................................................................................ 117 3.4.3 Identifying Criteria ....................................................................................................... 117 3.4.4 Assessing Impacts ........................................................................................................ 117 3.4.5 Estimating Weights ...................................................................................................... 118 3.4.6 Reaching Conclusions .................................................................................................. 118 3.5 Summary ............................................................................................... 119
CHAPTER 4: RESEARCH METHODOLOGY .................................... 120
4.1 Introduction .......................................................................................... 120
4.2 Ethical Considerations ......................................................................... 121
4.3 Research Paradigm .............................................................................. 122
4.4 Adopted Research Design Approach and Rationale for Choice ...... 123
4.5 Data Collection Techniques ................................................................ 126 4.5.1 Phase 1 [Review]: Crossed Referenced Analysis ......................................................... 126 4.5.2 Phase 2 [Synthesis]: Collection of Primary Data ......................................................... 128 4.5.2.1 Questionnaire survey ...................................................................................................................................... 129 4.5.2.1.1 Survey 1 ....................................................................................................................................................... 130 4.5.2.1.2 Survey 2 ....................................................................................................................................................... 131 4.5.2.1.3 Questionnaire design format ........................................................................................................................ 132 4.5.2.2 Response format ............................................................................................................................................. 133 4.5.2.3 Pre-testing the questionnaire .......................................................................................................................... 134 4.5.2.4 Revision of the questionnaire ......................................................................................................................... 135 4.5.2.5 Reliability of the instrument ........................................................................................................................... 136 4.5.2.6 Sampling issues .............................................................................................................................................. 136 4.5.2.7 Sampling strategy ........................................................................................................................................... 137 4.5.2.8 Sampling frame .............................................................................................................................................. 138 4.5.2.9 Sampling method ............................................................................................................................................ 139 4.5.2.10 Sample size ................................................................................................................................................... 140 4.5.2.11 Questionnaire administration for the main survey ....................................................................................... 142 4.5.2.12 Interviews ..................................................................................................................................................... 143 4.5.2.13 Observation ................................................................................................................................................... 144

XI
4.6 Data Analysis and Application Techniques ....................................... 147 4.6.1 Phase 3 [Analysis]: Analysis of Primary Data ............................................................. 147 4.6.1.1 Data analysis strategy ..................................................................................................................................... 147 4.6.1.2 Rationale for data analysis technique ............................................................................................................. 150 4.6.1.3 Descriptive statistics analysis ......................................................................................................................... 153 4.6.1.4 Relative index analysis ................................................................................................................................... 153 4.6.1.5 Kendall coefficient of concordance and chi-square tests ............................................................................... 153 4.6.1.6 Factor analysis ................................................................................................................................................ 155 4.6.2 Phase 4 [Application]: Assembling, Developing, Testing and Validating the Proposed MSDSS Model ...................................................................................................................... 156 4.6.2.1 Assembling data for the MSDSS model ......................................................................................................... 156 4.6.2.2 Developing the MSDSS model ...................................................................................................................... 156 4.6.2.3 Testing and evaluating the MSDSS model ..................................................................................................... 157 4.6.2.4 Validating the MSDSS model ........................................................................................................................ 158
4.7 Summary ............................................................................................... 160
CHAPTER 5: DEVELOPMENT AND TESTING OF THE MSDSS MODEL ...................................................................................................... 161
5.1 Introduction .......................................................................................... 161
5.2 Outline of the Framework for the Key Factors ................................. 162
5.3 Analysis of the Material Selection Factors ........................................ 163 5.3.1 Factor 1: General/Site (GS) Suitability ........................................................................ 163 5.3.2 Factor 2: Environmental/Health (EH) Impact .............................................................. 163 5.3.3 Factor 3: Economic/Cost (EC) Efficiency .................................................................... 164 5.3.4 Factor 4: Socio-Cultural (SC) Benefits ........................................................................ 165 5.3.5 Factor 5: Technical (T) Performance ........................................................................... 165 5.3.6 Factor 5: Technical (T) Performance ........................................................................... 166 5.4 Multi-Criteria Decision Models for Material Selection .................... 167 5.4.1 Scoring Multi-Attribute Analysis (SMAA) .................................................................. 167 5.4.2 Multi-Attribute Utility Theory (MAUT) ...................................................................... 168 5.4.3 Multiple Regression (MR) ............................................................................................ 169 5.4.4 Multivariate Discriminant Analysis (MDA) ................................................................ 169 5.4.5 Weighted Sum Method (WSM) ................................................................................... 170 5.4.6 Technique for Order Preference by Similarity to Ideal Solution (TOPSIS) ................ 171 5.4.7 Analytical Hierarchy Process (AHP) ........................................................................... 171 5.5 The Multi-Criteria Assessment Technique Adopted ........................ 173 5.5.1 Rationale for Selecting Analytical Hierarchy Process (AHP) ...................................... 173 5.6 System Design and Development: Physical Data Modeling of the MSDSS Model ............................................................................................ 175 5.6.1 Introduction .................................................................................................................. 175 5.6.2 Database Management Software for Modeling the MSDSS ........................................ 176 5.6.2.1 Microsoft Excel .............................................................................................................................................. 176 5.6.2.2 Microsoft Word .............................................................................................................................................. 177 5.6.2.3 Programming Language (1): Visual Basic for Applications 6.0 .................................................................... 177 5.6.2.4 Programming Language (2): Macro-in-Excel Visual Basic for Applications 6.0 (MEVBA) ........................ 178 5.6.2.4 The Rationale for programming language adopted for developing the MSDSS Model ................................ 180 5.6.3 Database Management Hardware for Modeling the MSDSS ...................................... 181 5.6.4 System Architecture of the MSDSS Model ................................................................. 182 5.6.5 Selection Methodology of the MSDSS Model ............................................................. 184 5.6.6 Working Procedure of the MSDSS Model ................................................................... 186

XII
5.7 Prototype of MSDSS User Interface Menu ........................................ 188
5.8 System Testing: Physical Assessment of the MSDSS Model ............ 203 5.8.1 Testing of the MSDSS Model ...................................................................................... 203 5.8.2 Black Box Testing Approach and Rationale for Choice .............................................. 205 5.8.2.1 Functional and system testing ........................................................................................................................ 206 5.8.2.2 Regression testing ........................................................................................................................................... 210
5.9 Summary ............................................................................................... 212
CHAPTER 6: VALIDATION OF THE MSDSS MODEL .................... 213
6.1 Introduction .......................................................................................... 213
6.2 Techniques Adopted for Validating the MSDSS Model ................... 214 6.2.1 Research Design Approach Adopted for the Exercise ................................................. 214 6.3 Demographic Analysis of the Sample Population ............................. 215 6.3.1 Instrumentation and Data Collection Procedures ......................................................... 216 6.4 Analyses and Results of the Validation Output ................................ 217 6.4.1 Selection of the Case Study Project ............................................................................. 217 6.4.2 Site Visitation ............................................................................................................... 217 6.4.3 Collection of Relevant Data ......................................................................................... 217 6.4.4 Material Identification .................................................................................................. 219 6.4.5 Factors/Criteria Selection ............................................................................................. 220 6.4.6 Assignment of Weights to Factors/Criteria .................................................................. 224 6.4.7 Comparative Analysis and Interpretations of Results .................................................. 225 6.5 Discussion of Findings ......................................................................... 228
6.6 Summary ............................................................................................... 229
CHAPTER 7: SUMMARY, CONCLUSIONS AND RECOMMENDATIONS ........................................................................... 230
7.1 Introduction .......................................................................................... 230
7.2 Review of Research Aim and Objectives ........................................... 230
7.3 Reflective Summary ............................................................................. 234
7.4 General Conclusions ............................................................................ 236
7.5 Contributions to Knowledge ............................................................... 237
7.6 Dissemination of Research .................................................................. 239
7.7 Research De-limitations and Constraints .......................................... 240 7.7.1 Delimitations of the MSDSS Model ............................................................................ 240 7.7.2 Delimitations of the Study ............................................................................................ 241 7.7.3 Research Constraints .................................................................................................... 242 7.8 Recommendations for Future Research ............................................ 243

XIII
7.8.1 Recommendations for Software Developers ................................................................ 243 7.8.2 Recommendations for Industry and Practice ................................................................ 244 7.8.3 Recommendations for Research Communities ............................................................ 245 7.8.4 Recommendations for Policy Makers .......................................................................... 247 REFERENCES ........................................................................................... 249

XIV
LIST OF TABLES TABLE 2.1. ANNUAL AVERAGE GROWTH RATES OF SOME NATIONS ......................................... 22 TABLE 4.1. RESEARCH DESIGN MODEL (ROBSON, 2002: 81) ................................................. 121 TABLE 4.2. QUESTIONNAIRE SCOPING STUDY MODEL ............................................................ 129 TABLE 4.3. INTERVIEW SCOPING STUDY MODEL .................................................................... 143 TABLE 4.4. OBSERVATORY SCOPING STUDY MODEL .............................................................. 145 TABLE 4.5. NUMBER OF CASE-SAMPLES HELD FOR CALIBRATION AND VALIDATION ............. 150 TABLE 4.6. TESTS OF NORMALITY RESULTS FOR SAMPLING DISTRIBUTION ........................... 152 TABLE 4.7. SUMMARY OF THE ADOPTED RESEARCH DESIGN ROAD MAP ................................ 159 TABLE 5.1. A COMPARATIVE ANALYSIS OF THE CHARACTERISTICS OF MCA TECHNIQUES (HOLT, 1998) ......................................................................................................................... 172 TABLE 5.2. INDIVIDUAL FUNCTIONS OF THE VARIOUS FEATURES/COMPONENTS OF THE CONCEPTUAL FRAMEWORK .................................................................................................... 182 TABLE 5.3. STEP-BY STEP APPROACH OF EACH OBJECTIVE AND TASK OF THE MATERIAL SELECTION METHODOLOGY .................................................................................................... 185 TABLE 5.4. TEST CASE PLANNING TEMPLATE ........................................................................ 206 TABLE 5.5. TEST CASE TEMPLATE SHOWING THE RESULT ANALYSIS OF THE MODEL AFTER A TEST-RUN BY AN INDEPENDENT ASSESSOR ............................................................................. 208 TABLE 6.1. PROFILE OF PARTICIPANTS FOR THE VALIDATION EXERCISE ............................... 216 TABLE 6.2. CASE STUDY PROFILE .......................................................................................... 218 FIGURE 6.1. DESIGN LAYOUT OF THE PROPOSED CASE STUDY PROJECT ................................ 219 TABLE 6.3. PARTICIPANTS’ PREFERRED CHOICE OF MATERIALS/COMPONENTS ..................... 220 TABLE 6.4. CRITERIA FOR MATERIAL SELECTION ................................................................. 221 TABLE 6.5. COMPARISON OF THE SELECTED MATERIALS ATTRIBUTES .................................. 221

XV
LIST OF FIGURES
FIGURE 2.1. WORLD GREENHOUSE GAS EMISSIONS BY REGION: A PROJECTION OF FUTURE GREENHOUSE GAS EMISSIONS OF DEVELOPED AND DEVELOPING COUNTRIES ........................... 25 FIGURE 2.2. WORLD POPULATION GROWTH, ACTUAL AND PROJECTED, 1950-2050 ................ 28 FIGURE 2.3. MAP SHOWING NIGERIA AND ITS GEOGRAPHIC LOCATION ON THE CONTINENT OF AFRICA ..................................................................................................................................... 49 FIGURE 2.4. NIGERIA’S GLOBAL POPULATION RANKING (IN MILLIONS) .................................. 51 FIGURE 2.5. URBAN POPULATION FROM 2002-2010 (% OF TOTAL) IN NIGERIA ...................... 52 FIGURE 2.6. NIGERIA’S GDP GROWTH RATE ........................................................................... 55 FIGURE 3.1. SAMPLE OF BEES MODEL .................................................................................... 83 FIGURE 3.2. SAMPLE OF ATHENA REPORTING DOCUMENTATION .......................................... 84 FIGURE 3.3. RELATIVE RANKING OF WALL AND CEILING FRAME SYSTEMS IN THE EPM METHOD ................................................................................................................................... 85 (SOURCE: ANINK, ET AL., 2008) ............................................................................................... 85 FIGURE 3.4. SAMPLE REPORTING AND CERTIFICATION FOR BREEAM ................................... 86 FIGURE 3.5. SCREEN SHOT FROM THE ACTUAL ASSESSMENT TOOL ......................................... 88 FIGURE 3.6. SAMPLE REPORTING AND CERTIFICATION FOR LEED .......................................... 89 FIGURE 3.7. SAMPLE REPORTING AND CERTIFICATION FOR GBTOOL ...................................... 90 FIGURE 3.8. SAMPLE OF CASBEE REPORTING ASSESSMENT RESULT AND DOCUMENTATION SHEET ....................................................................................................................................... 92 FIGURE 3.9. SAMPLE OF CEPAS REPORTING DOCUMENTATION .............................................. 93 FIGURE 3.10. SAMPLE OF SBAT REPORTING DOCUMENTATION .............................................. 94 FIGURE 3.11. MULTIPLE DIMENSIONAL DECISION MODEL OF BUILDING MATERIAL EVALUATION AND SELECTION ...................................................................................................................... 116 FIGURE 4.1. RESEARCH METHODS IN PHASES ........................................................................ 125 FIGURE 4.2. SURVEY 1: (MID MARCH 2011- MID MAY 2011 ................................................. 130 FIGURE 4.3. SURVEY 2: (MID NOVEMBER 2012- MID JANUARY 2013) .................................. 131 FIGURE 4.4. A STEP-BY-STEP FLOWCHART OF THE DATA ANALYTICAL TECHNIQUE .............. 151 FIGURE 5.1. CONCEPTUAL FRAMEWORK OF THE ANALYSED DECISION FACTORS FOR MEASURING THE SUSTAINABILITY IMPACTS OF LCGBMCS ................................................... 162 FIGURE 5.2. MODIFIED CONCEPTUAL MODEL OF THE MATERIAL SELECTION DECISION SUPPORT SYSTEM (MSDSS) .................................................................................................. 182 FIGURE 5.3. MATERIALS SELECTION METHODOLOGY OF THE MSDSS MODEL ...................... 184 FIGURE 5.4. ILLUSTRATION OF THE WORKFLOW SHOWING THE MATERIAL SELECTION DECISION-MAKING PROCESS WITH THE HELP OF THE MSDSS EXPERTS’ KNOWLEDGE TOOL .. 188 FIGURE 5.5. USER INTERFACE OF THE PROTOTYPE MSDSS ANALYTICAL SYSTEM MAIN MENU ............................................................................................................................................... 189 FIGURE 5.6. SHOWS SAMPLE OF THE INTRODUCTION TABLE ................................................. 189 FIGURE 5.7. SAMPLE OF THE COPYRIGHT INSTRUCTIONS ...................................................... 190 FIGURE 5.8. SAMPLE OF THE DESIGN ELEMENT USER INTERFACE MENU ................................ 190 FIGURE 5.9. MENU FOR THE KNOWLEDGE BASE .................................................................... 192 FIGURE 5.10. SAMPLE OF THE VALUE EXTRACTOR USER INTERFACE MENU FOR THE PROPERTY CATEGORY WEIGHTINGS ......................................................................................................... 192 FIGURE 5.11. VALUE EXTRACTOR USER INTERFACE MENU FOR THE SUB-MATERIAL PROPERTY WEIGHTINGS ........................................................................................................................... 193 FIGURE 5.12. AMALGAMATOR GENERATING MATRIX RESULTS BASED ON THE CALCULATIONS PERFORMED ............................................................................................................................ 194 FIGURE 5.13. SYSTEM SHOWING TRADE-OFF VALUES OF EACH FACTOR CATEGORY AGAINST

XVI
OTHERS ................................................................................................................................... 195 FIGURE 5.14. SYSTEM SHOWING SCORES OF THE COMPARISON MATRICES ............................ 196 FIGURE 5.15. SYSTEM DISPLAYING THE NORMALISED SCORES OF THE COMPARISON MATRICES ............................................................................................................................................... 196 FIGURE 5.16. SYSTEM DISPLAYING THE PAIRWISE COMPARISON SCORES FOR THE SELECTED MATERIALS ............................................................................................................................. 197 FIGURE 5.17. NORMALISED SCORE OF THE COMPARISON MATRICES FOR THE SELECTED MATERIALS ............................................................................................................................. 197 FIGURE 5.18. SYSTEM DISPLAYING THE CALCULATED MEAN VALUE OF EACH ROW .............. 198 FIGURE 5.19. SYSTEM DISPLAYING THE CALCULATED MEAN VALUE OF EACH ROW .............. 198 FIGURE 5.20. CALCULATED GLOBAL WEIGHTING RESULTS FROM THE PRODUCTS OF THE FACTORS ................................................................................................................................. 199 FIGURE 5.21. CALCULATED GLOBAL WEIGHTING RESULTS FROM THE PRODUCTS OF THE FACTORS ................................................................................................................................. 199 FIGURE 5.22. SAMPLE MENU FROM WHICH THE RESULTS ARE GENERATED AND HOW THEY ARE DISPLAYED ............................................................................................................................. 200 FIGURE 5.23. SAMPLE OF THE MSDSS ANALYTICAL SYSTEM REPORT OF USER’S PREFERRED CHOICE ................................................................................................................................... 201 FIGURE 5.24. GENERATED REPORTS OF THE MATERIAL PROPERTIES FROM THE MSDSS REPORTS MENU ....................................................................................................................... 201 FIGURE 5.25. GENERATED PRINTOUT DETAILS OF THE SELECTED MATERIALS ...................... 202 FIGURE 5.26. SAMPLE PRINTOUT PREVIEW IN PDF FORMAT ................................................. 202 FIGURE 5.27. DEBUGGING TEMPLATE ................................................................................... 204 FIGURE 5.28. TEST RESULT OF THE DEBUGGING PROCESS ..................................................... 204 FIGURE 5.29. TEMPLATE SHOWING A LIST OF DETECTED ERRORS AFTER INITIAL TEST RUNS OF THE INTERNAL LINKS .............................................................................................................. 204 FIGURE 6.1. DESIGN LAYOUT OF THE PROPOSED CASE STUDY PROJECT ................................ 219 FIGURE 6.2. ILLUSTRATION OF THE UTILITY INDICES FOR THE PROPOSED FLOOR MATERIALS ............................................................................................................................................... 225 FIGURE 6.3. ILLUSTRATION OF THE UTILITY INDICES FOR THE PROPOSED WALL MATERIALS 226 FIGURE 6.4. ILLUSTRATION OF THE UTILITY INDICES FOR THE DOOR/WINDOW MATERIALS . 226 FIGURE 6.5. ILLUSTRATION OF THE UTILITY INDICES FOR THE PROPOSED CEILING MATERIALS ............................................................................................................................................... 227

XVII
LIST OF APPENDICES
APPENDIX A. DEFINITIONS .................................................................................................... 261 APPENDIX B. RESEARCH ETHICS APPLICATION FORM .......................................................... 261 APPENDIX C. RESULTS OF THE PRELIMINARY STUDY .......................................................... 264 APPENDIX D. SURVEY QUESTIONNAIRE ................................................................................ 268 APPENDIX E. INTERVIEW QUESTIONNAIRE ........................................................................... 277 APPENDIX F. RESULTS OF FACTOR ANALYSIS ...................................................................... 279 APPENDIX G. DATA ANALYSIS OF MAIN STUDY .................................................................. 307 APPENDIX H. PROPOSED MATERIAL COMPUTATIONAL ASSESSMENT METHOD ................... 355 APPENDIX I. QUESTIONNAIRE FOR PAIR-WISE COMPARISON ............................................... 369 APPENDIX J. EVALUATION QUESTIONNAIRE SURVEY ........................................................... 375 APPENDIX K. SYSTEM APPLICATION AND EVALUATION OF THE MSDSS MODEL ................. 378 APPENDIX L. CASE STUDY .................................................................................................... 414 APPENDIX M. RELEVANT PUBLICATIONS OF THE RSEARCH ................................................. 418 APPENDIX N. TIMELINE FOR COMPLETION OF THE PHD STUDY ........................................... 418 APPENDIX O. COMPARATIVE ANALYSIS OF ASSESSMENT TOOLS ........................................ 419 APPENDIX P. MEMORY STICK OF FULL THESIS ........................................................... 420

XVIII
LIST OF ABBREVIATIONS
AHP Analytical Hierarchy Process ARCON Architects Registration Council of Nigeria ASHRAE American Society of Heating, Refrigerating and Air-
conditioning Engineers ATHENA Advanced Technologies for Interoperability of
Heterogeneous Enterprise Networks and Their Applications
BEPAC Building Environmental Performance Assessment Criteria
BEES Building for Environmental and Economic Sustainability
BIM Building Information Modeling BREEAM Building Research Establishment Environmental
Assessment Method CASBEE Comprehensive Assessment System for Building
Environmental Efficiency CEPAS Comprehensive Environmental Performance
Assessment Scheme for Buildings CIB International Council for Building DCLG Department for Communities and Local Government EATT Environmental Assessment Trade-Off Tool EPM Environmental Preference Method ERG Environmental Resource Guide FHA Federal Housing Authority FMBN Federal Mortgage Bank of Nigeria GDP Gross Domestic Product IEA International Energy Agency KMO Kaiser-Meyer-Olkin LCA Life Cycle Analysis LCCA Life Cycle Cost Analysis LEED Leadership in Energy and Environmental Design MCDM Multiple Criteria Decision Making NBS National Bureau of Statistics NIA Nigerian Institute of Architects NIB Nigerian Institute of Builders NIESV Nigeria Institute of Estate Surveyors and Valuers NIQS Nigeria Institute of Quantity Surveyors NITP Nigerian Institute of Town Planners

XIX
NSE Nigerian Society of Engineers, OECD Organisation for Economic Cooperation and
Development SBAT Sustainable Building Assessment Tool TOPSIS Technique of ranking Preferences by Similarity to the
Ideal Solution UKGBC United Kingdom Green Building Council UNDESPD United Nations, Department of Economic and Social
Affairs, Population Division UNDP United Nations Development Plan UNEP United Nations Environment Programme UNHR United Nations Habitat Research USDOE United States Department of Energy USGBC United States Green Building Council W Kendall’s coefficient of concordance WCED World Commission on Environment and Development SPeAR Security Protocol Engineering and Analysis Resource SCIAN Society of Construction Industry Arbitrators of Nigeria

Chapter I
General introduction and background

1
CHAPTER 1: GENERAL INTRODUCTION
1.1 Introduction The number of housing completions in sub-Saharan Africa has been on a
downward trend since the 1950s (World Bank, 2012). However, the number
of households has been forecast to increase by 300 million over the next 25
years, equivalent to around 12,000,000 each year (Giddings, 2007). Recent
statistics even show that on top of the previous estimate there will be
additional 100,000 new households each year (National Bureau of Statistics,
2013). The under-supply of housing underlines the need to build more homes
to meet the increasing housing demand (Nubi and Omirin, 2010). This,
combined with the urgent need to address current environmental crises have
driven the house build industry to review its current approach to housing
development, and to seek alternative approaches to delivering high quality
affordable low-impact green housing projects in a more sustainable manner,
by using low-cost green building materials and components due to their lower
embodied energy requirements and potential to boost sustainability credibility.
Today however, the use of LCGBMCs is not widespread and limited to some
applications in mainstream architecture (Oruwari et al., 2002; Kibert, 2008;
Oyekanmi and Abisuga, 2014). The decision of selecting such products for
housing projects is for the most part ignored due to the apparent lack of
knowledge and long acquaintance with their conventional higher carbon-
embodied equivalents (Seyfang, 2009a). A direct effect of this is that design
professionals have to rely on their past experience and individual knowledge
for decision-making at the early stages of the design, as they lack
understanding of the complex nuances associated with their sustainability
impacts. In the absence of rationalised informed data, many decision-makers
tend to make choices based solely on intuition, which often lead to decision-
making failures during planning and design stages of housing projects.

2
Advances in Information Technology and specific attention to DSS research
in housing construction is rising- having been shaped largely by the pursuit
for sustainable built environments. Yet, existing body of knowledge shows
little evidence to justify the assumption that there are tools of demonstrable
reliability that most specifically deal with the assessment of LCGBMCs for
LIGHDs. In this event, decision-making failures during planning and design
stage(s) hinder their use in terms of their industrial capacity utilisation.
There is thus, a need to improve the decision-making process and
understanding of the sustainability impacts of each material in hopes of
mitigating potential risks of decision-making failures during the crucial stages
of the design. This research contributes to knowledge by introducing an
integrated modular-oriented approach that can integrate the relevant data,
structure the decision-making process, improve the quality of the information
on which the decision is based, hence exemplify the nature of the problems
better. This is in order to assist designers in developing an improved
capability to understand the sustainability impacts of individual materials so
as to make early-informed choices, when formulating decisions to select
LCGBMCs at the early conceptual stages of the design.
This chapter articulates the research problem in section 1.2. It examines
current issues associated with material selection and management, and
discusses the challenges and potential benefits of current technology in the
material selection decision-making process in sections 1.2.1 and 1.2.2,
respectively. It summarises the important findings and issues emerging from
the preliminary research activities in section 1.3, formulates the key research
question in section 1.4, and presents the aim and objectives of the study in
section 1.5. The proposed research methodology is discussed briefly in
sections 1.6. Section 1.7 presents the core definitions relevant to this study;
section 1.8 discusses the rationale for the study; section 1.9 defines the scope
of the study while section 1.10 highlights the significance of the study. A
summary of the project work plan and structure is set out in section 1.11.

3
1.2 Statement of Research Problem
Housing in Nigeria, just as in many developing countries, has been described
as the most unsolvable problem- making itself most conspicuous in slums,
where the vast majority of urban poor live (Jiboye, 2009). Nigeria’s housing
deficit of an estimated 17 million units is well documented (Nubi, 2008;
FMLHUD-2012). This equates to an investment need of nearly $600 billion
when based on an average house price of a modest N5 million (approximately
$27,500) (Global Construction, 2009). Nigeria can boast as Africa’s largest
housing construction market as well as being the economy’s second fastest
growing sector– second only to telecoms (National Bureau of Statistics,
2013). The booming housing industry, however, serves the upper end of the
market well, while there is very little investment at the bottom end where the
need for housing is greatest (Oluwakiyesi, 2011). A report by the United
Nations Statistics (2013) estimates that 68% of Nigerians are below the
international poverty line of $1.25 per day, and records that the vast majority
is excluded from the formal housing market altogether (UN, 2012).
Although social housing has been supported through direct government
interventions in the form of huge investments and increased funding, the
housing crisis for the vulnerable poor is still one of rising challenges in
Nigeria. Evidence (Oluwakiyesi, 2011) holds true that Nigeria’s
underdeveloped housing and uncompetitive manufacturing sector leaves the
door open to imported materials, as 50% of construction materials, which
make up some 60% of the cost of construction and roughly 25% of CO2
emissions, are imported (Jiboye 2009). The recent spate of global warming
resulting from the use of highly carbon-intensive imported building materials
and their insidious effects on both the economy, and the environment make
the need for low-cost green building materials pronounced, due to their
inherently lower cost/energy/carbon intensity in production, and relatively
low through-life maintenance attributes and requirements (Seyfang, 2010).

4
Unfortunately, the influence of their value and benefits on volume house
build to date has been minimal, as there appears to be a lack of knowledge
and understanding amongst designers of their sustainability impacts and best
practices in mainstream. This situation is worsened by the fact that
information on the different materials available is normally limited or lacking
at the conceptual design stage. This is significant given that designers-
although experienced, are constrained by their vaguely informed knowledge
of best practices, and lack of better informed data on the available materials,
and so feel difficult to provide direct and well-informed judgments, even
though there are currently a wide range of low-cost green building material
alternatives, being supplied by some manufacturers and suppliers in Nigeria.
Moreover, the large number of criteria and material options are simply
overwhelming for decision-makers to make informed-selections. It is thus
very unlikely for any single decision maker to meaningfully combine all of
these bits of information and make informed decisions. Designers are now
concerned with how to incorporate sustainability principles into the design-
decision-making process to avoid wrong early decisions. Under such
circumstances, more scientifically integrated modular-oriented methods have
to be used to facilitate handling complex decision-making process.
Hence, finding an alternative means with which to view the management of
the early stages of the material selection decision making process, may
provide a greater understanding and appreciation of the scope and scale of
complexity in formulating decisions when selecting LCGBMCs, and may
therefore assist designers in developing an improved capability to make early-
informed decisions, hence identify an “early warning” for the decision-
making success or failure of the potential housing project.

5
1.2.1 Material Selection and Management Issues The choice of materials has been identified as an important design variable
that can significantly affect the overall life-cycle energy cost in housing
projects, and influence the building’s life cycle impact on the environment
(Nassar et al, 2003). The consequences of a decision according to Gluch and
Baumann (2004) are often observable long after decisions are made at the
onset of the design. Thus, making informed decisions at the early stages of
the design offer a greater chance of reducing life-cycle cost, and enhancing
the eventual technical, socio-cultural, environmental and economic success of
a product, than when considered at the construction or occupancy stage
(Ding, 2008).
Hence, it is important that designers are better enabled to incorporate
sustainability principles and understand which material decisions most
significantly determine a building’s life cycle impact at the earliest stage of
the design, when the design problem is typically not well defined, and the
potential to reduce environmental impacts is greatest. As such, conventional
material assessment methodology employs life cycle cost analysis (LCCA)
technique to aid this process (Van Pelt 1994).
Although the benefits of LCCA have been reiterated in various studies, there
are growing concerns that this approach often undermines environmental and
socio-cultural issues, leading to overuse and depletion of environmental
assets and neglect of societal needs (Ding 2008). Literature on LCCA and
environmental protection have indicated that using a single objective in the
evaluation process is insufficient when taking environmental and socio-
cultural issues into account (Ding, 2008). Consequently, multi-criteria
analysis, which uses a weighted score approach to evaluate economic
environmental and social issues has gained significant attention in operational
research (Hobbs and Meier, 2000; Ding, 2008).
6
With the growing interest to reduce the overall environmental, and socio-
economic impact of a building using the multi-criteria approach, information
systems are increasingly recognised as a key-supporting tool in the material-
selection decision-making process (Trusty, 2003). While there is evidence of
the usefulness of Information and Communications Technology (ICT) in the
assessment of conventional building materials, questions and doubts of their
appropriateness in the assessment of LCGBMCs for LIGHDs, remain. Little
attention is paid to material assessment systems that embrace significant
sustainability criteria where LCGBMCs are assessed using an appropriate
assessment method that best suits their nature (Kibert, 2008; Seyfang 2010).
Therefore, there is a need for a multi-criteria approach that incorporates the
principal determinants of sustainable development principles into the
decision-making process when selecting LCGBMCs.
1.2.2 Technology in Material Selection and Management As the house build industry now faces the prospect of increasing energy
efficiency in buildings and improving occupants health, material selection
decision-making has become more complex. Support provided to decision
makers by traditional approach has evolved from simple predefined reports to
complex and intelligent-based analysis and judgments (Ding, 2008). This is
because modern support systems have been expanded and upgraded through
integration of new technologies, and processes into decision support
paradigm to aid better-informed decision-making.
New data management technologies have been widely employed in various
developed economies to handle data and information integration from
multiple sources, in order to provide material knowledge to users. While
many integration frameworks have been effective in improving the
performance of multi-unit residential developments in many developed
countries (Ellis, 2009), there is little in the current literature to demonstrate
such efforts in developing countries (Malanca, 2010).

7
This is so because of the recognition that decision support systems
established in industrialised nations are not always desirable, and most often
unsuccessful in developing regions due to their geographical and cultural
differences (Norton, 1999).
Giorgetti and Lovell (2010) for example contrast the credibility of existing
decision support systems with what they describe as “overly comprehensive’,
noting that additional documentation to existing guidelines in developed
economies could increase the perceived burden on housing in LDCs, since
some of the materials commonly used in the developed regions may not be
affordable, available or even suitable in developing countries. They noted that
many existing support systems designed by countries with more developed
economies such as the UK-where the scale of social issues and lack of access
to resources are simply not as critical as observed in the LDCs, do not, by
design, address designated priorities relevant to developing nations.
Although the roles and benefits of Technology Transfer (TT) have been
demonstrated in most literature (Ofori, 2006), such benefits remains relatively
under-explored and are yet to be realised in LDCs. Reciprocating such
potentials in developing regions will require universal evenness in economic,
social, geographical and cultural character, which is very unlikely to occur.
Therefore, the technology to be adopted in this study must thus, correspond to
local conditions, economy, culture, existing pattern of knowledge, rules,
regulations, consensual expectations, assumptions, or thinking shared by the
actors of that region, and work in conjunction with the materials and
architecture of the region. Hence, for a technology to be successfully
diffused, such system must have to be designed to fit the prevailing
circumstances and the current technological regime of that region.
8
1.2.3 Summary In summary, this brief review has developed a theme that has identified the
need for sustainable low-impact green housing to meet and cater to the
inevitably changing needs of the growing number of households, and
highlighted the significance of low-cost green building materials in achieving
this objective. It has also noted the lack of knowledge and experience
amongst building professionals and designers, and their reticence in the
informed selection of LCGBMCs. It has been noted that a variety of
researchers have identified the role of information technology in aiding
decision making in this respect with the proviso that they are designed or
tailored for the specific markets in which they are to be used. The above
background study and the preceding reviewed literature therefore,
underscored the need for improving understanding of relevant data associated
with LCGBMCs, hence acknowledged the potential of a support system to
positively influence the attitudes of stakeholders involved in the production of
the built environment in Nigeria, in order to stimulate the motivation for more
use of LCGBMCs in a wider industry context.
Recognising the limitations of the reviewed literature in terms of examining
current research thinking in respect of material selection support systems for
LCGBMCs, a preliminary research study was carried out with targeted
building professionals from various regions of both the developed and
developing countries (see Appendix C for results). The following section
summarises important findings and issues emerging from the preliminary
research activities.

9
1.3 Findings From Preliminary Research Study: Need for Further Study
To build upon knowledge gained from the literature review, it was decided
that a preliminary study would be required as opposed to purely relying on the
research of others, since this research aims to produce new perspectives on
current issues associated with the informed selection of LCGBMCs on
which previous empirical studies seemed rather limited. The following are
highlights of the findings and conclusions from the preliminary study. • From an overview of the preliminary study, it was found that certain
assessment parameters of existing tools in the developed countries do not
complement product categories in developing countries, due to the
differences in their environmental, socio-cultural and economic needs.
• Another finding was that within similar levels of economic
performance, countries exhibit significant variation(s) in their levels of
economic, social, environmental sustainability;
• Monitoring and evaluation mechanisms that focus on material selection
were found to be inconsistent in their methodologies since they assume
values and priorities of the developer, thus make little or no impact when
applied to a different scenario;
• Most building professionals still consider cost and environmental factors
as conventional project priorities when selecting building materials;
• There were clear indications that the resulting and consequent lack of
requisite knowledge by designers about the implications of each product
choice was the prime source of the decision making failures associated
with the mainstream use of LCGBMCs rather than poor housing policy
implementation reform schemes, as have been hypothesised by previously
reviewed studies.

10
• There was no demonstrable and compelling evidence of technical
research on available resources that could better enable the integration of
sustainability principles at the early stage(s) of the design decision-making
process, when formulating decisions to select LCGBMCs for LIGHDs.
As may be interpreted from the above findings and the reviewed literature, it
can be deduced that quite a number of design and building professionals still
do not have a clear idea of the issues, requirements, constraints and
opportunities specific to the use of LCGBMCs. The analysis of the
preliminary study thus reaffirms the identification of the knowledge gap in
the reviewed literature, which brings this study to the key research question.
1.4 Key Research Question
The identification of the research need and knowledge gap in the introductory
and background sections of the study, therefore necessitates the qualitative
and quantitative elements to answer the key research question:
— How can designers be better enabled to incorporate sustainability
principles into the material selection decision-making process with the
expectation of improving their understanding of the impacts of LCGBMCs
-when formulating decisions during the early design stages of LIGHDs, so
as to aid better-informed material choice decisions in hopes of stimulating
the motivation for their use in a wider industry context?

11
1.5 Research Aim and Objectives
To answer the key research question posed in section 1.4, this research aims
to explore and evaluate the significance of an integrated modular-oriented
mode of assessment that is able to assist designers in developing an improved
capability to make early-informed choices, when formulating decisions to
select LCGBMCs at the early conceptual stages of the design process.
To achieve this aim, the following research objectives are to:
I. Elicit current views and background information on themes related to
the economic, environmental and social impacts of housing
construction activities in the Global and Nigerian contexts, with
emphasis on the role of material selection decision-making in
sustainable housing;
II. Compare and contrast various technologies currently used at national
and international levels for modelling decision-making in the selection
of building materials and components; to highlight their strengths and
weaknesses;
III. Identify the key sustainability principle indicators (influential factors)
that affect the selection of building materials;
IV. Establish and specify the impact weight of each key influential factor;
V. Develop a Multi-Criteria Decision Support System for aggregating the
weighted factors needed for the assessment of LCGBMCs
VI. Test and validate the developed system.
The next section briefly sets out the methodology adopted to carry out this
research.

12
1.6 Research Methodology in Brief
The research adopted multi-dimensional design strategy that involves a
variety of quantitative and qualitative approaches, which include fieldwork
approach (pilot study, survey), questionnaire, interviews – semi-structured,
and critical approach. Data collection and analysis was divided into four
phases.
The first phase was based on interaction between archival ethnographic
approach and preliminary interviews. A literature search using a range of
information collection tools such as books and peer-reviewed journals from
libraries and internet-based sources helped to examine the relative impacts of
decision-making on housing, as well as current and previous research in the
area of material evaluation and assessment. It also explored background
issues relating to low-impact green housing developments in both developed
and developing regions.
Following the identification of the key issues disclosed in the literature, a
preliminary research study conducted with leading researchers who influence
the selection of building materials in the field of housing helped to explore
the topic further, and observe how well their views relate to the themes
identified in the literature review. To determine the initial set of sustainability
principle indicators that would inform the selection of LCGBMCs for
LIGHDs, an analysis was carried out on factors that impact on material
choices. Further review examined material assessment systems that are
considered by far the most comprehensive and methodological tools
developed. The review focused on the strength and weaknesses, and the
elements of success of implementation of these tools, which helped the study
to identify practical ways of enhancing the proposed system.
13
In the second phase, a primary research was conducted with targeted building
professionals who influence the selection of construction materials from
throughout the construction value chain in Nigeria, to gather information that
had not been previously collected or found in the literature base. This
required the use of both questionnaire surveys for obtaining large samples,
and interviews for obtaining as much useful qualitative data to elaborate on
less detailed responses received on the questionnaires. The research assumed
the semi-structured approach in the questionnaires and interviews–to identify
the categories, indicators, parameters and the main features that should be
included in the proposed assessment system. The target group involved a
variety of stakeholders such as architects, designers, builders, civil engineers,
contractors, decision makers, and members of various housing associations. A
subsequent study observed the available expert systems most commonly used
in building firms in the UK. This involved interviewing experts, with years of
experience in the industry, who had implemented such systems, by directly
observing how they were constructed and how effective they were during
operation. The information generated in the literature and preliminary studies
informed the conversational guide and interview process.
For the third phase, data analysis was carried out using a suite of
nonparametric techniques given that the data drew on the interests of
respondents with conflicting views, which suggested the likelihood of a
skewed sample distribution. The Descriptive statistics was used at the
preliminary stages to provide useful insights, with more detailed analysis
done using Relative index analysis, Kendall coefficient of Concordance, Chi-
square tests, Factor analysis, and other statistical tests of significance. The
Statistical Package for the Social Sciences (SPSS v20) was employed to aid
analysis. This phase helped to define weighs for each of the key sustainability
principle indicator (influential factors).

14
In the fourth phase, a suitable database management system was used to
assemble the key components needed to develop the proposed integrated
modular-oriented material selection system. Given that the database consisted
of a cluster of complex information, macro-in-excel VBA was identified as
the ideal spreadsheet application due to its speed, accuracy, and ability to
manage large and complex data. A subsequent part of this phase was
inputting relevant data to test the internal links and know what needed to be
measured within the system. Expert survey was conducted using feedback
questionnaires to obtain respondents’ judgments about the system
functionality based on the Analytic Hierarchy Process (AHP). The final part
of this phase validated the effectiveness and robustness of the system using an
on-going case study building project in Nigeria to review the potential
savings of the new materials proposed by the model. Chapter 4 details the
research methods, design and their methodological consequences.
1.7 Definitions
For the purposes of this study, definitions may be found in Appendix A.
However two key definitions are included here, and are defined as follows:
Low-cost green building materials and components (LCGBMCs)- which
consist mainly of locally-sourced and recycled building materials, may be
defined as materials, which by virtue of their location, availability, sense of
place, recyclability, lower cost and reduced carbon-embodied energy, meet
the environmental, socio-cultural, technical, sensorial and economic
requirements across their life cycle when compared to competing products
that serve the same purpose.
Low-Impact Green Housing Development (LIGHD) would be defined as
"any development-which through its effective and harmonious use of
LCGBMCs, yields a low negative carbon-embodied life-cycle energy impact
that either enhances or does not significantly diminish the economic, socio-
cultural and environmental quality of the user or region it intends to serve”.

15
1.8 Rationale and Motivation for the Research
The housing construction industry is facing increasing pressure to deliver
adequate and affordable low-energy/low-impact green housing projects.
Designers, especially architects, have been identified as central to the delivery
of low-energy/low-impact green housing projects since their decisions at the
conceptual stage of the design have significant impacts on the overall
performance of the building, as well as play crucial role in achieving the low
impact green targets for homes in Nigeria (Abisuga and Oyekanmi, 2014).
As an architect with special interest in sustainable low-energy/low-impact
green architecture, and having worked on numerous housing projects, there
arise the need for alternative building materials and systems to address the
housing backlogs within the sub-urban and urban dwellings resulting from
high costs and scarcity of imported building materials. However, architects
have not adopted existing systems widely; because they do not fit in with the
way architects make design decision(s) at various stages of the design process
when selecting low-cost green building materials. The struggle to find
information with which to assess LCGBMCs, whilst working on a series of
low-impact green housing projects peaked the curiosity that motivated the
search for an alternative approach that provides information base available to
undertake effective material evaluation and selection at the critical stages of
the design process, since current policies, and decision tools, although so
many, seem not to be sufficient towards this realisation.
Hence, adequate decision-support tools to support designers to achieve low
impact housing was seen as critical in achieving more environmentally
efficient buildings. Consequently, it was deemed important for architects to
have appropriate tools that are in tune with design decisions at the various
stages of the design process, and developed in a format that can be easily
understood and interpreted by non-specialist designers when selecting
LCGBMCs, hence arose the need for further research to address this problem.

16
1.9 Scope of the Research
The research carried out in this study is significant to design and building
stakeholders, and the findings from the study are centered on evaluating the
selection of LCGBMCs for low-impact green housing projects. The research
results may only be valid for the characteristics and culture of design and
building professionals in Nigeria. The scope of the study is further discussed
in chapter 7.
1.10 Significance of the Study
This study will be a significant endeavor in promoting best practice guide in
low-cost green building material assessment, and will attempt to stimulate
motivation of its use in a wider industry context. The establishments of such
precedents would spark and facilitate a considerable shift in awareness as to
the potential role of low-cost green building materials and components in
achieving sustainably built environments and in effect might be a declaration
by government that alternative approaches to their selection process in
housing may be actively explored or even encouraged. This would improve
the generalisability of the tool as previous models have been developed on a
more limited scale. It will also serve as a future reference for researchers on
the subject of material support and management systems, and in turn act as a
primary locus for further innovations and technological progress in housing.
The results of the study will also be beneficial in enriching knowledge on the
sustainability impacts of each material, and in enabling the refinement of the
tool to suit user requirements in a broader domain. By understanding the
impacts of each product and consequences of their decisions, decision-makers
will be assured of more competitive and sustainable choice of materials.

17
1.11 Structure of the Thesis
The research structure is presented in Figure 1.1. The contents of each
chapter are summarised as follows:
1.11.1 Chapter 1: General Introduction This chapter provides the background information for the study and nature of
the problem investigated. It identifies the research gap, which the present
study focuses on. The research problem, aim, objectives, research method and
significance of the study are also highlighted.
1.11.2 Chapter 2: The Housing Construction Industry This chapter describes the nature of the housing construction industry, and
examines the relative impacts of housing activities on the environment. It
emphasises on the need for sustainable housing, and highlights the benefits of
low-impact green housing in sustainable construction. The priorities of low-
cost green building materials are discussed, and the importance of
incorporating sustainability principles into the material selection decision-
making process is also established. It investigates the core factors used in
developing the multi criteria decision model for material selection. The
argument established provides a platform for further investigating the
literature concerning material selection support systems.
1.11.3 Chapter 3: Technology in Material Selection and Management Chapter 3 presents the theoretical review of existing decision support
frameworks currently used at both national and international levels for
managing, and monitoring data associated with building materials. The
argument provided establishes the need for a more robust framework to
assess the decision-making process when selecting LCGBMCs. A multi-
criteria approach for material evaluation is reviewed and contrasted to the
conventional market-based approach.

18
1.11.4 Chapter 4: Research Methodology Following the review of literature in chapters 2 and 3, this chapter provides
an elaborate discussion on the research methodology adopted for undertaking
this research. It establishes the epistemology framework on which the
research was conducted. Arguments are presented justifying the choice of a
conciliatory approach and the specific methods applied to collect and analyse
data. The data collection and analytical processes are also detailed in this
chapter.
1.11.5 Chapter 5: Development and Testing of the MSDSS Model Chapter 5 is devoted exclusively to the design, development, and testing of
the multi-factor based material selection decision support system. It specifies
the factors needed to be incorporated in the model and aggregates the factors
into a composite index for material selection. The MSDSS model is the final
output in this chapter.
1.11.6 Chapter 6: Validation of the MSDSS Model Chapter 6 presents the results of the semi- structured interviews carried out to
refine and validate the MSDSS model using a case study of a proposed
building project in Nigeria. This chapter explores and elaborates on the
implications and inferences drawn from the exercise.
1.11.7 Chapter 7: Summary, Conclusions and Recommendations Chapter 7 is the concluding chapter of the thesis, which presents the key
research findings. It summarises the overall research process adopted and
presents the conclusions derived from the overall research findings,
recommendations and suggestions for further research. Limitations of the
research and the possibilities of further research are made at the end of this
chapter.

19
Figure 1.1. Research Structure
!!
!!!!!!!!
!!
Chapter 1 Define the problem. Develop research aims and objectives, research questions and the method
adopted
Chapter 2 Review the structure and impacts of the housing construction industry in relation to specific
issues that concerns the provision of housing in the global and local context.
Examine the potential socio-economic and environmental challenges and benefits associated with the provision of
reduced/ low cost green housing in Nigeria
Review and identify factors limiting wider use of low-cost green building materials and components in the
Nigerian housing industry.
Chapter 3 Review existing building material assessment methods used at both national and international levels, and discuss the conceptual framework for a multiple criteria approach to material selection
Chapter 4 Discuss details of the Research Methodology
Analyse and discuss data gleaned from surveyed questionnaires and interviews.
Identify and examine relationship between key variables
Chapter 5 Design, develop and test the MSDSS model
Chapter 6 Validate the model’s applicability using a series of existing case study
projects.
Chapter 7 Present summary, conclusion and recommendations for further research
Examine the proposed data collection and analytical methods.

Chapter II:
Exploring the role of the housing construction industry, current trends and challenges with focus on low-‐impact green housing development as a
model for sustainable architecture and design

20
CHAPTER 2: THE HOUSING CONSTRUCTION INDUSTRY
2.1 Introduction Chapter 1 defined the requisites and rationales that surround the background
and theoretical framework of this study, by appraising existing research
efforts through published and unpublished academic work, and documentary
studies of relevant reports to fulfill the first part of objective 1.
The first part of this chapter serves to demonstrate the role and characteristics
of the Housing Construction Industry (HCI) from the global perspective. It
exemplifies the resultant effects of decision-making as it pertains to housing
construction activities in section 2.3, seeks to identify the most appropriate
decision-making approach to housing development in section 2.4, and throws
more light in section 2.4.1 on the principles and impacts of the sustainable
development (SD) concept in the built environment. The priorities of, as well
as barriers to low-impact green housing- as a model of sustainable housing in
both developed and developing countries, are further discussed in sections
2.4.2 and 2.5 based on a critical review of extant literature.
The second part of this chapter provides in section 2.6, a quantified
illustration of the current structure of the Nigerian housing construction
industry. It reviews the socio-economic, health and environmental impacts of
the housing construction industry, in relation to population growth and
urbanisation. The need for sustainable practices in housing construction is
emphasised. Section 2.6.7 further examines low impact green housing
developments (LIGHDs) as one way of approaching the ideals of sustainable
housing development in Nigeria. Section 2.6.8 seeks to discover how
LIGHDs could be incorporated as useful models in future housing
developments, through optimal use of low-cost green building materials and
components (LCGBMCs).

21
Section 2.6.9 looks at the modern realities of housing problems, draws
specific attention to current decision-making approaches to material selection
in the Nigerian housing industry, and identifies drivers and barriers to the
implementation of LCGBMCs. Section 2.7 examines the importance of
sustainable building material selection approach and attempts to identify the
key influential factors that determine sustainable material selection. Section
2.8 concludes the chapter. Chapter 2 fulfills Objective 1 of this research and
also provides a basis for achieving the remaining objectives of the study.
2.2 The Role of the Housing Construction Industry: The Global Market Trend Analysis and Statistics The Housing Construction Industry (HCI) has been identified as one of the
main engines responsible for driving wealth creation, stimulating
employment, and engineering socio-economic growth in any economy (Du
Plessis, 2002). Various writers and international bodies (Adetunji et al; 2003;
Ofori, 2006; Du Plessis, 2007; Ogunbiyi, 2014) many of whom have focused
on developed (DCs) and less developed countries (LDCs), have addressed
extensively, the characteristics, activities and the role of the housing
construction industry in socio-economic development from their respective
points of view(s). The HCI according to Druker and White (1996) comprises
new housing construction work, general construction and demolition work,
the construction and repair of buildings, the installation of fixtures and
fittings, and building completion work. In a broad context, it is concerned
with the planning, regulation, design, material selection, manufacture,
construction, repair and maintenance- extension and conversions renovations
and refurbishment of buildings (Burtonshaw-Gunn, 2009). Murdoch and
Hughes (2008) stated that there is no clear definition as to what the HCI
entails, as the issues that pertain to housing construction are broad. As a result
of this, there are now many descriptions of the roles and characteristics of the
housing construction sector, drawn from different specialist disciplines.

22
While there are many interpretations given to housing construction in the
literature, it will be considered in the context of this study as encompassing
the broader process of human settlement creation, everything related to the
business of housing, and a comprehensive project cycle (Du Plessis, 2007).
Ofori (2004) notes that the HCI contributes to economic development by
satisfying some of the basic objectives of housing development including
output generation, employment creation and income generation and
redistribution (Ofori, 2004). A Global Insight Report (2012) revealed that the
global housing construction market is worth over US$ 5.7 trillion per annum
according to estimates for the year 2012, enjoying a compounded growth rate
of 48% since 1998 where the world housing construction output was
estimated at over US$ 3.2 trillion. The analysis in table 2.1 shows the
Compound Annual Growth Rate (CAGR) percentage value of the housing
construction industry of various DCs and LDCs.
Table 2.1. Annual average growth rates of some nations
Top 10 Market Size Country Top 10 Annual Growth Country Country Market Size
(100mil.USD) GDP Housing
CAGR GDP (%)
Country Market Size (100mil.USD)
GDP Housing CAGR GDP (%)
U.S.A 8815 2.4 20.5 Vietnam 115 6.0 38.5 Japan 7698 -0.1 26.2 Romania 82 1.8 26.2 China 4182 7.4 42.6 UAE 4016 3.6 59.0 UK 2634 2.6 19.8 Venezuela 262 -4.0 49.3 France 1783 0.2 19.4 Panama 18 6.2 22.1 Germany 1692 1.6 30.7 Columbia 132 4.6 38.2 Spain 1553 1.4 23.1 India 1130 7.4 30.1 Italy 1417 -0.4 23.4 Peru 80 2.4 36.8 South Korea 1247 3.3 38.2 Ukraine 56 -6.8 25.4 Canada 1185 2.9 18.5 Russia 414 0.6 36.3 South Africa 300 1.5 29.5 Nigeria 700 6.3 20.7
Source: Adapted from Global Insight (2015) and Word Bank National Accounts Data (2015)
Giang & Pheng (2011) revealed that an expansion of the HCI could stimulate
the expansion of supply industries such as the Building Materials Industry
(BMI). The impact of such an expansion on the BMI, they add, could be
significantly large as much of the building materials (BMs) could be provided
by unskilled labor-intensive domestic recourses. They note that the value
added by HCI through BMs account for a considerable proportion (roughly
50% to 80% of its total value) of the global GDP.

23
BMs are the largest with an annual turnover in excess of $60 billion,
accounting for approximately 40% of total global construction output and
20% of the UK‘s manufacturing output (USDOE, 2010).
In emerging economies such as in the continent of Africa for instance, BMs
are estimated to account for 5-8% of the total value of the annual GDP
(World Bank, 2012). Although the BMIs in LDCs account for an
overwhelming majority of national economic growth, they have also been
underperforming relative to BMIs in advanced economies (Adedeji, 2010).
As economies within such regions experience population growth, housing
infrastructure projects are most likely to evolve to match the level of income
and demand. However, due to the implicitly apparent weak economic status
of most HCIs and BMIs in LDCs, it is difficult to meet these demands,
therefore imposing huge constraints on economic and housing development
(Oluwakiyesi 2011). While BMs, which account for 50% - 80% of the total
value of construction (USDOE, 2010) forms a key factor in the housing
construction sector's response to the needs of human settlement, the impact of
appropriate building material choice discourse in academia is resurgent
despite numerous studies. As such there has been a revived growing debate
on the need for energy efficient building materials as the demand for quality
housing is now more critical in main urban centers (Abisuga and Oyekanmi,
2014). Following the high increase in demand for adequately sustainable and
affordable BMs, various studies (Kibert, 2008; Seyfang, 2009a) have
emphasised the appropriateness of locally- produced and recycled materials
in meeting the growing demand for adequate housing. Despite this
abundance, very little is known of their impacts on housing development
when compared to their conventional imported carbon-embodied equivalents.
As a result, the HCI is now replete with GHGs and unsustainable construction
practices, which is often associated with the use of materials such as steel and
cement (Malanca, 2010). Nevertheless, the global impacts of current housing
decision-making practices are assumed to be severe (USDOE, 2010).

24
2.3 Resultant Effects of Poor Decision-Making Practices in the Housing Construction Industry Since the beginning of the Industrial Revolution, the housing construction
industry has engaged in a pattern based upon material goods, in which
unlimited development, mass production, and ever-increasing consumption
have been the order of the day (Ofori, 2004). Accordingly, industrialized and
emerging nations throughout the world have implemented comprehensive
policies to promote accelerated economic growth and manufacturers have
responded by shifting their focus from quality to quantity as they continually
strive for increased production and profits (Kyounghoon et al., 2008).
Housing industrial activities are now known to be the principal cause of recent
environmental and health crises through exploitation and pollution, and yet its
activities rely heavily on a healthy environment for its sustenance and
productivity. The following section provides an overview of the decision-
making consequences resulting from housing construction activities.
2.3.1 Climate Change
Climate change has been known to be the greatest environmental challenge
facing the world today (USDOE, 2010). Modern society is releasing
unprecedented amounts of carbon into the atmosphere through the burning of
fossil fuels (IEA, 2008). A subsequent report, published in 2001, confirmed
that there is a climate change-induced effect, greenhouse effect and the
increased atmospheric concentration of carbon dioxide caused by housing
construction activities some of which include air pollution, allergen exposures
linked to climate change, increased cardio-respiratory disease, and global
warming (Meadows and Hoffman, 2003). The U.S. Environmental Protection
Agency (USEPA, 2004) argues that total emissions from the developing world
due to housing activities are expected to exceed those from the developed
world by 2015 (as shown in figure 2.1).

25
These activities, it adds, will cause the global temperature to rise as increasing
global temperature warms and expands the oceans, melts polar ice caps and,
in turn, raises sea levels. To meet the housing demands of householders
wishing greater self- sufficiency from expensive and potentially unreliable
energy supplies, governments across the world are beginning to recognise the
calamity of this situation and are currently working towards alternative
environment friendly decision-making approaches (Copenhagen, December
2009). The imperative of climate change signifies that current housing
activities and technologies need to develop in order to meet the demands of
climate change predictions, while simultaneously reducing the contribution
they make to CO2 emissions. The concept of limiting greenhouse-gas
emissions through responsible decision-making approach and housing
practices is now widely accepted and embraced by governments as an
increasingly important issue.
Figure 2.1. World greenhouse gas emissions by region: A projection of future greenhouse gas emissions
of developed and developing countries
Source: United States Environmental Protection Agency (EPA).
!"#
!"#$%&'( !)%*+'( ,-.!!/( 01*2#3$'4( &)#5( 0"%#$( #*( 67889( :)'( 5;<5'=;'*&( 3'>13&?(
>;<"#5)'4( #*(677@?(01*2#3$'4( &)%&( &)'3'( #5(%(+3''*)1;5'('22'0&(%*4( &)'( #*03'%5'4(
%&$15>)'3#0( 01*0'*&3%*( 12( 0%3<1*( 4#1A#4'(B%5( 0%;5'4( <C( );$%*( %0&#D#&#'59( E(
5'01*4( -.!!( 21""1B'4( #*( 677F( %*4( %( &)#34( #*( G@@6( <1&)( 'A>3'55'4( #*03'%5#*+(
01*2#4'*0'( &)%&( +3''*)1;5'( +%5'5( B#""( 0%;5'( 4%*+'31;5( 2;&;3'( 0"#$%&'( 0)%*+'(
,H%"%?( 6778I( J#*#*$1*&)?( G@@KI( L'%41B5( %*4( M122$%*?( G@@K/9( N#+;3'( G96(
>31D#4'5( %( >31O'0*( 12( 2;&;3'( +3''*)1;5'( +%5( '$#55#1*5( 12( 4'D'"1>'4( %*4(
4'D'"1>#*+(01;*&3#'59(:1&%"( '$#55#1*5( 231$(&)'(4'D'"1>#*+(B13"4(%3'('A>'0&'4( &1(
'A0''4(&)15'(231$(&)'(4'D'"1>'4(B13"4(<C(G@6F9(
(
!"#$%&'()*'P13"4(Q3''*)1;5'(Q%5(R$#55#1*5(<C(3'+#1*(
+,$%-&.'S*#&'4(T&%&'5(R*D#31*$'*&%"(.31&'0*(E+'*0C(,R.E/9((
E>%3&( 231$( &)'( #*03'%5'4( %&$15>)'3#0( 01*0'*&3%*( 12( 0%3<1*( 4#1A#4'?(
%&$15>)'3#0( 01*0'*&3%*5( 12( 1&)'3( +3''*)1;5'( +%5'5( 5;0)( %5($'&)%*'?( *#&31;5(
1A#4'(%*4(0)"1312";1310%3<1*5(%3'(%"51( #*03'%5#*+(%5(%( 3'5;"&(12();$%*(%0&#D#&#'5(
,U1%#0#+%?( G@@K/9( E00134#*+( &1( &)'( &)#34( -.!!( #*( G@@6?( &)'( R%3&)V5( 5;32%0'(

26
2.3.2 Loss of Biodiversity
While further promotion of economic growth and housing activities
worldwide are seen as the way to lift most developing countries out of
poverty, they are also responsible for promoting resource depletion and
reduction of biodiversity. Biodiversity refers to the variety of life of Earth
(Kibert, 2008). A report by Kibert (2008) revealed that housing construction
activities are destroying natural habitats and reducing it. The rate, at which
species are disappearing due to these activities, he notes, is about 1,000 to
10,000 times the normal rate, adding that more than 25 percent of all species
could disappear within the next two decades (Glasby, 2002). He noted that the
extinction of one specie may eventually lead to the loss of many others
dependent upon it, if no proactive step is taken to discontinue or alter current
decision-making practices within the housing sector, and that it may
eventually result in an accelerated loss of important genetic information.
2.3.3 Material Waste generation
The HCI has a major impact on the environment, both in terms of the
resources it consumes and the waste it produces. The housing construction
industry is responsible for producing a whole variety of different wastes, the
amount and type of which depends on factors such as the stage of
construction, type of construction work and practices on site (Du Plessis,
2002). One of the main barriers lies in the increasing amounts of material
waste generated from housing construction activities and dumped in landfills.
Although solid waste is generated by different economic activities, the HCI
has always been considered as one of the major producers of waste (Du
Plessis, 2007). The U.S. Environmental Protection Agency (USEPA, 2004)
reported that 170 million tonnes have been generated in the US in 2003 and
that 1900 Construction and Demolition (C&D) landfills are operating in the
US to receive disposed material waste.

27
According to Eurostat report, 2 billion tonnes of waste is generated every year
in European Union (EU-15) and the share of housing construction waste is
31% (DEFRA, 2007). Many factors such as poor decisions in the material
choice, design, and handling of materials at the crucial stages of the design
have been identified as primary contributors. This thus suggests an urgent
need for an optimal decision-making approach to minimise or completely
stave-off material waste when selecting building materials at the earliest
stages of the design or undertaking construction activities in the HCI.
2.3.3 Social Change: Population Growth and Urbanisation
Population growth and urbanisation are clearly major threats to the
environment (World bank 2012) and there is no doubt that the human
population has been putting increasing pressure on the ecosystem through
housing activities (Ofori 2006; USDOE, 2010). As a result, there have been
constant increases in pressure on renewable and non-renewable resources,
reducing the amount of capital and productivity per worker, and increasing the
inequality of income. The United Nations (UN, 2012) report estimates the
global population is to increase to eight billion in 2025 and nine billion in
2050 and approximately eight out of nine people will live in poor developing
countries, hence creating more demand for housing within the urban centres
due to social change in the life-style of persons within rural areas. In order to
maintain housing production, professionals are enjoined to use highly-energy
intensive building materials. Houses which are dependent on such materials,
tend to affect the environment during production, transportation and use
which, in turn, will require more of such materials in succeeding years to meet
the rising demand for housing. This increased use of such products has
increased the rate and effects of global warming, hence the need for
alternative materials and housing models to harness a new approach to
thinking about housing development so as to facilitate a renewed drive for
greater performance improvement.

28
Figure 2.2. World population growth, actual and projected, 1950-2050
Source: WRI and Population Reference Bureau (2006) revision
With the identification of the underlying issues, it is thus evident that the HCI
besides its economic benefits plays a major role in the current environmental
and health crises. In pursuing the mission for change, many countries are now
working towards maintaining a balance between developing the built
environment and protecting the natural environment. Both scenarios point to
the urgent need for new, more sustainable decision-making approaches to
urban housing development. While housing strategies must be tailored to local
conditions, they should be crafted with today’s changing environmental,
socio-cultural, and economic realities in mind. This therefore suggests that
changes must be made in the manner that the HCI undertakes its activities, in
order to create a balance between economic growth and environmental/health
protection. The reviewed factors in the foregoing section, it is believed may
have provided justification for the use of an alternative theory of housing
construction, and as such, this study critically examines the case for a new
form of housing construction and development practice.
“We shall therefore require a substantially sustainable new manner of
thinking if mankind is to survive.” – Albert Einstein
!!"
!"#$%&'(")* ()+,-&.-.* &'* &)* -/#")-)'(&%* ,&'-0* #%&+()1* 2",-* 3-2&)3* ")* 4""3*
#,"3$+'(")* 56"$)10* 78889* :;-<0* =>>7?@* A"<-B-,0* &.* A"#4-)C-,1* &)3* !(2-)'&%*
5=>>7?* .'&'-0* ';-* <",%3* ;$2&)* * * 4""3* &B&(%&C(%('D* +")'()$-.* '"* 1,"<0* C$'* .%"<-,*
';&)*';-*#"#$%&'(")*,&'-@*E;-**.;",'&1-*C-+&2-*2",-*-B(3-)'*&4'-,*';-*<",%3*4""3*
.$22('* * ()* 788F* <;-,-* #%&).* <-,-* * #,-#&,-3* '"* ,-3$+-* ';-* )$2C-,* "4* $)3-,G
)"$,(.;-30*-.'(2&'-3*&.*8=>*2(%%(")0*'"*;&%4*';(.*%-B-%*CD*=>7H*56"$)10*7888?@*
!
!
!
!
!
!
!
!
!
!!!!!!!!!!!"#$%&'!()*!I",%3*!"#$%&'(")*J,"<';0*&+'$&%*&)3*#,"K-+'-30*78H>G=>H>!!
!!!!!!!!!!+,%&-'.!ILM*&)3*!"#$%&'(")*L-4-,-)+-*N$,-&$*=>>F*,-B(.(")!
!"#$%&'(")*1,"<';*2&D*&%."*C-*&.."+(&'-3*<(';*';-*<",%3*#"B-,'D*%-B-%@*!"#$%&'(")*
1,"<';*2&D* * * C-* &* +&$.-* "4* #"B-,'D0* #&,'(+$%&,%D* ()* ';-* 3-B-%"#()1* +"$)',(-.@* M)*
&++",3&)+-* '"* ';-*I",%3*O-B-%"#2-)'*L-#",'*=>>>P=>>70*=@Q*C(%%(")*#-"#%-*&,-*
-&,)()1* %-..* ';&)*RST=*#-,*3&D* 5J%&.CD0* =>>=?* &)3* ';-* 788Q* *RU* * ,-#",'* .'&'-.*
';&'*&C"$'*=H* *#-,+-)'*"4* ';-*<",%3V.*#"#$%&'(")* %(B-* ()*&C."%$'-*#"B-,'D* 56"$)10*
7888?@*ND*';-*-)3*"4*';(.*+-)'$,D0*&##,"/(2&'-%D*-(1;'*"$'*"4*)()-*#-"#%-*<(%%*%(B-*()*
#"",* 3-B-%"#()1* +"$)',(-.* +"2#&,-3*<(';* &##,"/(2&'-%D* ")-* "$'* "4* '<"* ()* 78H>*
5!%&)'*!"#$%&'*=>>>?@*!

29
2.4 Seeking an Alternative Decision-Making Approach to Housing Development There is no denying that the HCI is responsible for the amount of pollutants
dumped onto land, climate change, generation of hazardous waste, pollution,
resource depletion and loss of biodiversity, which are the main causes of
biologically and ecologically destructive phenomena (Kibert, 2008).
Considering these issues, there is now a widespread directive that the housing
industry finds an approach to balance population and economic growth with
the protection of the environment to deliver a more responsibly conscious
pattern of development. Due to the relative adverse effects of housing
activities, the concept of sustainable development has now become a key
theme in housing development (Ding, 2008), hence a review of its principles.
2.4.1 Sustainable Development Principles in Housing
Sustainable Development (SD) has become pre-eminent in the discussions on
the relationship between humankind and nature. It has also evolved as a
mainstream research focus and much attention has been devoted to the SD
agenda from researchers of various backgrounds (Brundtland, 1987; Price et
al., 2003; Du Plessis, 2007). As a result, there has been a proliferation of
sustainable development policies, innovative technological, scientific and
educational initiatives, and new legislative regimes and institutions.
However, the understanding of what constitutes the principles of “sustainable
development” is now fairly well developed, and in some countries several
definitions have been adopted based on specific criteria related to the use of
materials, design, water, energy, and comfort (Trusty, 2003; Ding, 2008). Not
surprisingly however, most countries lack such systems, as there is no
universal consent as to which principle indicators constitute SD.

30
Cole (1999) argued that such a global definition would probably be quite
meaningless because of the widely different conditions in different countries
(particularly where the climate, the entire structure, need for heating/cooling,
access to materials, culture and economic considerations are very different).
As a result, a wide variety of institutional bodies, particularly within the
housing sector have adopted the concept and given it their own particular
interpretations. Nonetheless, there is a clear need (as would be demonstrated
in this section) to quantify thematically, what factors constitute SD principles.
Popularly defined as “a development that meets the needs of the present
generation without compromising the ability of future generations to meet
their own needs” (Brundtland, 1987), numerous organisations-such as the
housing construction industry, have proposed sustainable development as an
alternative model for global economic development as a result of worldwide
recognition of the negative effects of current and potential environmental
degradation on social development. However, the broad recognition that the
environmental principles matter, according to Brundtland’s (1987) definition,
often extends only as far as a belief that we can pursue economic growth
without compromising the environment through a ‘reorientation’ of free-
market capitalism.
Another definition of SD is the idea by Pinchot in the USA (Dryzek, 1997),
which recognises that humans do need natural resources and that these
resources should be managed, rather than rapidly exploited, in order to ensure
maximum long-term use. This was seen as the key to humanity’s well being
and, through growth, poverty would be overcome: as everyone floated higher
those at the bottom would be raised out of poverty. This principle of SD is
usually due to associating development with economic growth. It can be
argued that development and economic growth are mutually exclusive. For
example, development could mean a general improvement in the quality of
life, the surrounding environment or greater social stability. Hence,
development is a qualitative change whilst growth is a quantitative change.
31
Postle (1998) however goes further suggesting that the principles of SD, as a
concept, has a far wider reach than economic growth, encompassing a whole
range of social, environmental and cultural factors such as employment, social
welfare, culture, and infrastructure. He notes that SD achieves these outcomes
by focusing on them from its conception and first stages of design,
implementing them throughout construction, and by continually monitoring
and measuring its performance in operation. Postle’s linking of environmental
and social concerns is however, based on a moral sympathetic outlook rather
than seeing the two as materially and socially related and inseparable. Cole
(1999) suggests that the principles of SD, as environmental, social and
economic dimensions, embrace all facets of human activities (industry,
transportation, food production among others), and spans local actions
through to redressing the major inequities that exist between developed and
developing nations. Given the political and economic interdependencies,
where the actions of one nation profoundly affect others, the notion of `SD’
from Cole’s (1999) is meaningful only when applied on a global scale.
Priemus (2005) went on to criticise the global orientation of SD by Cole
(1999) as being inadequate, in the sense that sustainable development takes
place on different scales, and, as such, the quality and availability of say
water, noise nuisance etc., all play various roles at different local and regional
levels. Simply put SD principles are widely different depending on how the
concept is developed in various countries.
Fiskel (2006) suggested that SD in the face of ever-increasing global
complexity and volatility, will require resilience at many levels, including
human communities and economic enterprises, and that it must move beyond
a simplistic steady state model of the concept. He noted that policies and
strategies must enable societal and industrial institutions to cope with
unexpected challenges, balancing their need to flourish and grow with long-
term concerns about human and ecological well-being.

32
Banfill and Peacock (2007) however think that the principles of SD deal with
a lot more aspects than what Fiskel (2006) presumes, as it includes the use of
energy and its effect; resources and materials; water and its disposal;
pollution; waste; health; well-being, and the effects of human actions on the
biosphere and habitats.
Sodager and Fieldson (2008) argue that tackling strictly environmental
sustainability alone- as Banfill and Peacock (2007) seem to suggest, is not
enough, as there is need for an integrated approach to address all three
principles of sustainable development. The integrated approach according to
Sodager and Fieldson (2008) must rely on the collaboration of all stakeholders
in the building industry to quantify and interpret emissions throughout the
building lifecycle. Their concept centered on three main issues: the relevance
of sustainable housing, the constituent of a sustainable housing, and the
process of obtaining such practice.
Pickerill and Maxey (2009) argue that the concept of SD by Sodager and
Fieldson (2008) is a very weak interpretation of SD, in that the principles of
sustainability is broad in terms of scope and context as well as practices, as it
is simultaneously able to broadly encompass all aspects of life (social,
economic, political, etc.) They note that the environmental benefits are
improved air and water quality, reduced energy and water consumption, and
reduced waste disposal. They added that the economic benefits are reduced
operating cost, maintenance cost, and increased sales price and rent while
enhanced health and occupants comfort, and reduced liability are the health
and community benefit.
Construction Industry Environmental Forum (CIEF, 2009) suggests that SD is
a solution for significant cost savings, to bring innovations and to enhance
competitiveness for the long-term survival of any industry. Sustainable
construction practices however, do not only provide increased market share
and profitability but also bring many other intangible benefits such as quality
in construction, and improved shareholder relations.

33
Sebake (2009) and Gibbered (2003) observed that SD in the context of the
developed countries only addresses the conflict between protecting the
environment and natural resources, and answering to the development needs
of the society. They noted that SD particularly in the context of the
developing countries would not be possible without tackling the problems of
poverty and social equity both between people and nations. They contend that
various definitions of SD are often hypothesized to be consistently and
universally similar, therefore can always be readily adopted by any nation,
suggesting that the economic emergencies of developed nations are typical of
the less developed nations, thus ignoring national circumstances, value
systems or current priorities. They suggest that the first step to achieving SD
in LDCs is by raising standards of living through the identification of not only
environmental issues but also the socio-cultural and economic challenges.
In summarising the discussions above, it is reasonable to state that SD is
rarely a ‘fixed’ objective through time, therefore entails more than just eco-
friendly measures in determining a successful outcome. The variety of
definitions associated with SD therefore shows that the attractiveness (and the
dangers) of sustainable development may lie precisely in the varied ways in
which it can be interpreted and used to support a whole range of interests or
causes. Although these themes provided many useful sustainability principle
indicators in general, it is not sufficient to consider only the economic, and
environmental dimensions of the concept, as there are numerous contexts-
internal and external- that shape the process. A more comprehensive list of the
sustainable principle indicators that should be addressed is therefore needed.
However, in rapid housing development activity, low-impact green housing
development concept has become a major housing strategic model and
demonstrated considerable success when applied to new housing development
for mass housing (Fairlie, 2008). Thus, the suggestion that the low-impact
green housing concept displays a greater degree of sustainability than
conventional house build approach merits further consideration and review.

34
2.4.2 Low-Impact Green Housing Development in Developed Countries: An Alternative Approach to Sustainable Housing
The increasing concerns about the sustainability of modern consumer
lifestyles in the housing industry have led a number of professionals to seek
for themselves different models of sustainable developments that are less
demanding of resources. The complexity of providing sustainable affordable
housing in sub-urban and urban dwellings is now evident from various
research literatures (Fairlie, 2008; Maxey, 2009). For some (Kibert 2008;
Seyfang, 2010), this has meant living in a dwelling, deriving energy from
renewable resources, locally-sourced products, recycling waste materials (in
accordance with the proximity principle), and/or avoiding pollutants. Tied to
the concern of population growth, material waste, climate change and loss of
biodiversity with sustainable development is a consideration of Low-Impact
Green Housing Developments (LIGHDs). Research into LIGHDs has
consistently found that it meets the criteria of economic, social and
environmental sustainability (University of West England and Land Use
Consultants 2002). The evidence to date suggests that LIGHDs have a better
chance of achieving these aspirations than even the eco-towns in terms of
location, materials used, scale and traffic generation (Fairlie 2009). LIGHDs
have demonstrated sustainable solutions including low/zero carbon housing
design, renewable energy generation, and waste minimisation (Maxey, 2009).
Pickerill and Maxey (2009) argue that the aspirations of SD are firmly
embedded within LIGHD, which is a social as much as a physical model,
reflecting current environmental, social, technical, cultural, emotional,
political, ethical and economic concerns and aspirations of the growing
population. They note that LIGHDs are a good vehicle through which to
explore radical and innovative forms of SD and to critically assess their
potential as a response to current environmental, social, economic and health
issues.

35
It is therefore hard to avoid the conclusion that the housing industry has yet to
fully grasp sustainable development as the strong sustainability performance
of LIGHD is overlooked in planning decisions for housing design projects. An
outline of what LIGHD is and what it offers in terms of its SD impact on
housing development is presented below. By defining its purpose and concept
as an evolving approach that offers practical housing solutions to the vast
majority of the population, it explores its rationale, barriers, and its role as an
alternative approach to sustainable development in the housing industry.
2.4.2.1 Definition and concept of low-impact green housing developments
Low Impact Green Housing Development (LIGHD) is a recent innovation
pioneered in the UK (Fairlie, 1996). It has been characterised as an
intrinsically sustainable form of development as it employs approaches that
dramatically reduce humans’ impact upon the environment, demonstrating
that human settlements and livelihoods, when done appropriately, can
enhance, rather than diminish ecological diversity (Pickerill, 2009). It is
described in housing as a development that employs natural, reclaimed and/or
local materials, and renewable technologies (Seyfang, 2010).
Fairlie (1996) describes it as: “a development which, by virtue of its low or
benign environmental impact, may be allowed in locations where
conventional development is not so often permitted". A revised version
further exemplifies it as a development that, through its low negative
environmental impact, either enhances or does not significantly diminish
environmental quality. While this seems to be a broader definition than the
former, it can be argued that Fairlie’s (1996) concept of LIGHD is still mainly
concerned with the environmental impacts of subsistence-based development
in rural locations where residents draw many of their daily needs such as
energy from the site.

36
Moyse (1999) provides a slightly different approach as; “settlements where
the acreage is minimised, or, at the very least, brought below the national
average by reducing the consumption of goods and materials and the
production of waste" (p90), essentially reflecting the desire to minimise
environmental impact through reducing the environmental footprint of
development. Moyse’s (1999) definition seems slightly restrictive to
environmental concerns, and fails to acknowledge that LIGHD also directly
responds to social needs for housing, an anti-capitalist strategy forging
alternative economic possibilities, and a holistic approach to living that pays
attention to not only personal issues but also political needs.
Steen (2000) notes that LIGHD integrates nature into its design, transgressing
the nature/culture divide and blending with its surroundings, ensuring a low
visual impact. His concept of LIGHD is closely associated with types of rural
settlement typified by modest dwellings whose occupation is closely linked to
the management of the land on which they stand.
Wrench (2001) notes that LIGHD often also increases ecological diversity,
challenging dominant understandings of an inevitably antagonistic
relationship between ‘humans’ and ‘nature’. Vale (2001) goes a little farther
to state that LIGHDs, in addition to its ecological impact, are designed to
support sustainable livelihoods and lifestyles by minimising vehicle use,
reducing costs (and, hence, the need to travel to earn money) and reducing
consumption.
Maxey (2009) further expands on it by describing it as a “multi featured and
intrinsically integrated form of development,” and goes on to develop a
detailed themed definition with detailed criteria such as: locally adapted,
diverse and unique; based on renewable resources; of an appropriate scale;
visually unobtrusive; enhances biodiversity; increases public access to open
space; generates little traffic; linked to sustainable livelihoods; and
coordinated by a management plan.

37
He adds that LIGHDs are buildings constructed from materials with low
embodied energy and environmental impact, and preferably from locally
sourced materials, unless environmental considerations or the use of
reclaimed materials determine otherwise. He adds that LIGHDs must be such
that it should be allowed in a wider range of settings.
From the analysis it can be deduced that the key strength of LIGHDs is one of
an evolving nature that must be designed to innovate and adapt to changing
environmental, technical, social, ethical, political, cultural and economic
conditions. Therefore, a simple definition cannot capture the vast constituents
of LIGHD. In other words, definitions and interpretations of LIGHDs need to
be flexible to respond to its dynamic nature, not only where it employs
natural, reclaimed and/or recycled products, locally sourced materials,
renewable technologies, but also where the majority of the criteria are met.
Thus the definition adopted for this study does not distinguish locations
where LIGHD should or should not take place. Rather, through the effective
use of LCGBMCs -considering all the essential criteria, it recognises that
development can take a variety of forms in different locations, and still fulfill
the requirements of LIGHD. Following the feedback from empirical studies
Low-Impact Green Housing Development (LIGHD) for the purposes of this
study would be defined as:
"Any development- which through its effective and harmonious use of
LCGBMCs, yields a low negative carbon-embodied life-cycle energy impact
that either enhances or does not significantly diminish the economic, socio-
cultural and environmental quality of the user or region it intends to serve”.
The following sections exemplify the rationale, drivers, and barriers impacting
LIGHDs and their implications for today’s housing in developed regions.

38
2.4.2.2 Rationale for low-impact green housing in developed countries
Low Impact Green Housing Development (LIGHD) is a recent innovation
pioneered in the UK (Fairlie, 1996). It has been characterised as an
intrinsically sustainable form of housing that plays a significant part in the
reduction of CO2 emissions (CLG, 2007b). The Department for Environment,
Food and Rural Affairs (DEFRA, 2005) further confirm how housing is
responsible for over a quarter (28 per cent equivalent to around 150 million
tonnes of carbon a year) of the UK's CO2 emissions. Although varying across
countries, there is a general need for more cost and energy efficient housing.
Housing markets have become increasingly competitive, as middle class
housing choices have shifted to properties in the sub-urban dwellings,
combined with the desire for energy efficient structures. There is now a need
to intelligently and intensively manage our surrounding environment in order
to maximise return (in the forms of energy, water, food, shelter and products)
and minimise waste (through recycling, composting and energy efficient
systems). Thus providers of housing have increasingly had to turn to various
mechanisms, such as housing policies (Shelter, 2004). In a bid to restore the
balance between humanity and the environment, there have been planning
campaigns that inspire a structured response to the situation, hence
recognising the potential role of low-impact green housing developments in
the transition to a sustainable built environment (Fairlie, 1996).
With the increasing numbers of people aspiring to live low-impact lifestyles,
the need for the movement to express itself is growing. Low-impact green
housing development is now being considered as having the potential to
simultaneously address a whole range of issues including sustainability,
affordable housing and rural-urban regeneration. A study by Shelter (2004)
revealed that the shortage of affordable housing in rural and sub urban areas
has been exacerbated by competing demands on the market from retired
households and second home purchasers (Shelter, 2004).

39
Maxey (2009) pointed out that the lack of affordable housing for people who
live and work in rural and sub-urban communities has been a serious problem
for many years. This trend he adds, is likely to be one of the reasons why
there is now an interest for alternative low-impact models of housing. Smith
and Baird (2007) found that ‘the need for reduced energy costs’ is one of the
primary drivers for low-impact green housing developments in developed
nations. Miller, Spivey, and Florance (2008) estimate the productivity
benefits from low-impact green housing designs to be as much as 10 times
the energy savings from green efforts. Hence, understanding what main
drivers affect the implementation of LIGHDs would be pertinent to the theme
of this research.
Drivers for low-impact green housing, other than financial performance, are
outlined, for example, by Yudelson (2010), and include: utility cost savings
for energy, maintenance cost reductions, increased occupier productivity,
improved health of occupants, and demonstration of commitment to
sustainability and environmental stewardship. Fairlie (1996) acknowledges
that most buildings will not meet all these requirements (referring to LIGHD
as a rather ideal model being small-scale; unobtrusive; a building made from
predominantly local materials; able to enhance biodiversity; a building that
consumes low levels of non-renewable resources; a building used for
sustainable purposes; linked to a recognised positive environmental benefit
and a building with relatively low ecological footprint’’), and argues that any
truly low- impact green housing development (as opposed to conventional
energy intensive housing developments) will conform to many of the
aforementioned criteria.
In their current pursuit for sustainable development, Reddy and Mani (2007)
argue that LIGHD structures hold enormous relevance and potential in
providing solutions for environment-friendly buildings that are affordable,
energy efficient, comfortable and recyclable.

40
Although there have been extensive literature as to the benefits of low-impact
sustainable green housing in the last few years (Shelter, 2004; SOCR’ 2007),
and a number of quantitative studies on the drivers that impact on LIGHDs in
developed countries (Boyle 2007; Smith and Baird, 2007; Fairlie, 2008),
certain barriers still prevail.
2.4.2.3 Barriers affecting the implementation of low-impact green housing in developed countries
While a substantial amount of studies (Fairlie, 1996; Maxey, 2009; Seyfang,
2010) have discussed the SD benefits of LIGHDs over the last 10–20 years,
many of their innovations have not been widely diffused in the developed
regions (Seyfang, 2010). Evidence (Lovell, 2004; Smith 2007) has suggested
that this may in part be due to the co-existence of fundamentally different
discourses, practices and governance of sustainability between the
mainstream system of housing provision and green researchers. Consequently
the barriers to the transfer of such practices encompass ideological, cultural,
social, political and ethical factors, as well as economic and technical ones
(Smith, 2007; Shove, 1998; Lovell, 2004).
Smith (2007) states that LIGHDs have little compatibility with the
mainstream system of housing provision, and as a result have little linking
potential and growth prospects across all the socio-technical dimensions
including guiding principles, technologies and infrastructure, industrial
structure, user relations and markets, policy and regulations, knowledge base
and cultural meanings (Smith, 2007, p. 429). In their study, Van Vliet et al.
(2005) found that LIGHDs were limited by current regulatory frameworks
designed for public housing provision, since such policies are infused with
certain notions of what constitutes safe and efficient housing (Van Vliet et al.,
2005, p. 93). Compounding this limitation are the facts that mainstream
framings of sustainable housing continues to focus predominantly upon
technical and environmental aspects, whilst overlooking the socio-cultural
benefits and guiding principles underpinning LIGHDs (Smith, 2007, p. 437).

41
Another biggest barrier affecting the wide scale implementation of LIGHDs
is the perception that they are the interest of a minority of people, and for the
most part are temporary. Fairlie (1996) pointed out that LIGHD is most often
mistakenly viewed as a niche or marginal area, and that the idea of it being
small, muddy, temporary shelters/ shacks has consistently reinforced this
notion. He further noted that current incentives are not yet strong enough to
change the long-held perception of LIGHD by most professionals, and that its
benefits are only evident over the longer period. Many articles on policy
measures have also been discussed. Other barriers, either to illustrate the need
for policy measures (Moyse, 1999: Vale, 200; Maxey et al., 2006) or to
explain why LIGHD are not as successful as expected (Wrench 2001, Lovell,
2004; Seyfang, 2010). Barriers such as: economic/financial barriers, market
failures, behavioral and organisational constraints, political and structural
barriers and information barriers were recognised in Seyfang (2009a). Other
specific circumstances that give rise to these problems as identified by Lovell
(2004) relates to geography, climate, personality, economics, culture, politics
and values.
Given the current need to develop low-impact sustainable housing in
developed regions, it can be seen that a tension exists in mainstream housing
provision, and therefore a supportive policy agenda could go a long way to
help capitalise on the learning and experience of LIGHD, in answering that
need. Thus, increasing regulatory pressure to improve building standards for
low-impact green developments may help to reinforce or even force
mainstream professionals to implement LIGHD models. In order to draw a
comparative analysis, the drivers and barriers to LIGHDs are further
addressed with regards to SD in the developing regions. Aspects of
affordability, design decision-making, material selection, appropriate
technology use, and cultural awareness are examined in details.

42
2.5 Low-Impact Green Housing in Developing Country
Current demand for housing worldwide has reached unprecedented levels due
to factors such as human population growth, natural disasters and conflict
(World Bank, 2012). This is felt no more so than in developing countries,
which have experienced disproportionate levels of demand due to their innate
vulnerability (UN, 2012). Many current approaches to housing delivery in
developing countries continue to utilise inappropriate housing models that are
often problematic and unsustainable. As such, affordability and sustainability
are now vital considerations in the international development debate for
housing the most disadvantaged population in developing countries in order
to meet the long-term sustainable development goals and needs of housing
inhabitants.
Low-impact green housing developments (LIGHDs) also meet more than
human’s immediate needs and has the potential to contribute significantly to a
wider socio-cultural, environmental and economic context and to a better
quality of life and personal fulfillment for its inhabitants through aspects such
as employment generation, knowledge transfer and training, value and
cultural continuity and improved health conditions (Erguden, 2001). Just like
in the developed regions, there are also barriers and drivers that impact on the
implementation of LIGHDs in developing countries
2.5.1 Key Barriers that Impact on the Implementation of Low-Impact Green Housing in Developing Countries
Despite the benefits of LIGHDs, the struggles for adequate and sustainable
housing in many developing countries are considerable and still continue to
rise. Low-impact green housing shortages within the context of the LDCs can
often be traced back to three main sources as follows:

43
• Lack of government or political backing of low-impact green housing
developments
While there have been efforts to implement low Impact green housing
developments in DCs, current literature (Adedeji, 2012; Abisuga and
Oyekanmi, 2014) assert that LIGHDs are yet to receive the same attention
from the industries in LDCs (UNCHS, 2007). This means that the housing
industry is not as involved in the participatory exercise of incorporating
LIGHDs into mainstream housing as to the level that they should be to ensure
that long term settlement needs are satisfied in an appropriate manner.
Erguden (2001) highlights that policies and models for housing in developing
countries have evolved over the past number of decades, with little or no
interest in LIGHDs. Although the enablement-based approach has generally
been considered to be the most appropriate, he argues that many approaches
and models currently fall well short of the desired aspirations in relation to
affordability and sustainability.
• Lack of training and education in sustainable design and construction
of LIGHDs leading to lack of necessary design and building skills
available;
Reffat (2004) states that the concept of LIGHD as a SD niche has only
recently been introduced into the construction industries of the developing
nations and that even sustainable construction is as yet not an essential part of
the decision-making process. He noted that traditionally, affordability and
sustainability in mainstream housing markets within the LDCs is associated
with economic and social sustainability with little emphasis on environmental
sustainability. He added that perceived higher costs and underlying socio-
cultural factors also contribute to the lower levels of social acceptability of
low-impact green housing construction in the mainstream affordable housing
market.

44
• Psychological and sociological perceptions ascribed to the associated
building materials and their limited acceptability by people;
A large number of studies (Zami, 2010; Abisuga and Oyekanmi, 2014) have
stressed that local and recycled building materials serve as good alternative in
low-impact green housing construction and that the use of them go along way
in ameliorating the shortage of housing in LDCs, thereby reducing
importation and cutting down the excessive cost and energy, which is often
associated with conventional products. Yet, there have been uncertainties
about the use of such materials in housing projects when compared with their
imported counterparts. The reasons being that some professionals argue along
the line that the status of such materials is deemed only for the poor hence are
ill informed about their sustainability impacts and reticent towards their use.
2.5.2 Factors that Drive the Implementation of Low-Impact Green Housing in Developing Countries
While the analyses conducted in section 2.5.1 revealed the three main forces
inhibiting the implementation of LIGHDs in developing regions, there are
three main broad areas that offer the potential to significantly contribute to
the provision of affordable and sustainable LIGHDs in developing countries.
These areas are discussed as follows:
• Need for Appropriate Design and Building Materials
The UN Habitat (2011) suggests that efforts to address immediate housing
needs should simultaneously address the long-term needs and sustainability
of the communities that they intend to serve in terms of social, economic and
environmental sustainability. The increasing demand for sustainable housing
has resulted in an urgent need for crucial research into new design approaches
and use of appropriate building materials in housing delivery (Malanca,
2010). Selecting locally-sourced and recycled building materials over
conventional products have been recognized by many (Adeyemi, 2002;

45
Abisuga and Oyekanmi, 2014) as one of the main contributors to the
provision of affordable and sustainable low-impact green housing, as BMs
contribute up to 70% of the total direct costs of housing construction (UN
Habitat, 2011). Sebake (2009) suggests that increasing the quality of life in
developing countries requires optimum use of locally sourced and recycled
materials over imported materials, so as to increase the potential for greater
affordability. Adeyemi (2002) also noted that the use of localized materials is
a key driving force for LIGHDs since it has the potential to dramatically
reduce the cost of housing compared to imported materials, while
simultaneously contributing to sustainable housing solutions.
• Participation, Knowledge Transfer and Use of Appropriate Innovative Technology Specific to Developing World Contexts
Evidence (UN Habitat, 2011; Adeyemi, 2002) has shown that sustainable
development approaches and technologies established in the west are not
always desirable and that if not implemented correctly, these approaches will
prove unsuccessful. As such, the need for new approaches for the vastly
different contexts within developing countries and local conditions have been
emphasised; whilst given full recognition to knowledge and culture.
However, participation by relevant stakeholders particularly from their
developed counterparts in all stages of the design and delivery process has
been recognized as an appropriate approach to housing provision in
developing country contexts (Kibert, 2008). Knowledge creation, exchanging
and sharing of skills, knowledge and experiences between the relevant
stakeholders are now being recognized as effective approaches in ensuring
that technical, cultural, economic and environmental aspects of low-impact
green housing design and delivery are addressed in an appropriate manner.
Ofori (2000) pointed out that the use of appropriate technology should work
in conjunction with the available materials and should correspond to local
conditions and culture and be durable, reliable, require a minimum of
maintenance and be fit for modern living.

46
• Informed Decision Making Assistance and Assessment Tools
Decision-making in housing construction plays an important role in
supporting sustainable development in developing countries, and as such is a
significant issue that must be prioritised. However, it is recognised that
decision-making is a complex one and that an assessment framework and
structured approach are effective methods to integrate sustainability into the
decision-making process of buildings in developing countries (Du Plessis,
2002). Reffat (2004) suggest that the problem with many responses to
LIGHDs in the developing regions is that decisions are made with limited
knowledge and information, adding that sustainable assessment tools to date
have mainly focused on a developed world context. Aside from established
assessment tools from developed nations, Nwokoro and Onukwube (2011)
argue that there is little in the current literature that demonstrate the existence
of any main assessment tool specifically directed to sustainable low-impact
green housing in developing countries. However, the need to develop context
specific assessment tools for developing countries that cater to the needs of a
wider group of stakeholders has been recognised, given that existing
developed country tools are deemed inappropriate to deal with issues that
pertain to developing countries (Reffat, 2004; Sneddon et al., 2006).
It thus can be summarised from the analyses that many individual countries-
within the developed and developing countries, will have region specific
factors that will require more in-depth study by designers operating within
that context. This is to fully establish issues associated with low-impact green
housing in sufficient specific detail, and to ensure appropriate design
responses for that specific region. As a case in point of the housing situation
in developing countries, this study aims to investigate the current approaches
to housing in Nigeria with focus on low-impact green housing developments.
Amongst other issues, the barriers and drivers that impact on the
implementation of low-cost green building materials are discussed, and
factors that influence sustainable material selection are also examined.

47
2.6 The Nigerian Housing Construction Industry
2.6.1 Background and Context
The United Nations Fund for Population Activities (UNFPA, 2007) stipulates
that 40% of urban growth between 2030 and 2050 is expected to occur mostly
in Africa, and as a result, will increase from 13 to 27 million per annum
(United Nations, 2006a). Current projection holds it that over 50% of the
population in Africa is expected to live in urban areas by 2020 and most of
this transition will occur in Nigeria (UN, 2010). It is argued that Nigeria's
economic growth owes much to the sheer size of its population (UNDF,
2011). Despite their benefits, population growth and urbanisation have had
their own share of socio-economic and environmental woes ranging from
degradation of the physical urban environment— which exists in the nature of
loss of biodiversity and green-house warming, waste of material resources,
high energy consumption to housing congestion (Jiboye, 2009). These
challenges are further complicated by changes in household composition and
housing needs, and diversity of the population.
With a median age of 19 years and approximately 55% in working age
bracket (15 – 64 years), Nigeria’s population distribution portends strong
potential for continuing growth in housing demand (Oluwakiyesi, 2011). As
part of research and innovative development projects, the Nigerian housing
industry, along with several housing institutions such as the State Housing
Corporations, the Federal Mortgage Bank of Nigeria (FMBN), and other
privately owned institutions have developed multi-sector housing reforms and
policies to guide sustainable housing delivery processes. Despite a rise in the
number of Public-Private Partnerships over the last 20 years, recent estimate
puts the housing-price-to-income multiple for Nigeria at 20.45, six times the
accepted affordability benchmark of 3.2, and considerably higher than even
the benchmark in Hong Kong (FHA, 2012). Given the geographic, economic
and cultural diversity, the Nigerian housing industry faces very different
sustainable development challenges.

48
These challenges include disparities in social and economic welfare
especially between urban centres and the rural countryside; social and
environmental pressures from industrilisation and rapid urbanisation; and
general degradation of the environment. And although every developing
country faces serious housing affordability problems, variations in housing
conditions and demographic trends in Nigeria create stark differences, calling
for unique, locally crafted responses. Hence, ensuring sustainable housing
delivery towards progressive urbanisation constitutes a critical challenge to
the Nigerian housing industry. This section presents a general view of the
Nigerian construction industry as in the context of a typical developing
country. It provides insight into housing-related themes as a basis for
understanding their impact on population and urbanisation. It examines the
trends, challenges, and extent of the industry’s role in climate change, and in
attaining sustainable development in the built environment.
2.6.2 A Profile of Nigeria: Geographic Location and Setting
2.6.2.1 Location and size
Nigeria is situated in the west of Sub-Saharan Africa, north of the equator on
the Gulf of Guinea, and lies between latitudes 4° and 14° to the North, and
longitudes 3° and 14° East of Greenwich mean time (GMT) as shown in
figure 2.3. The total area of the country is about 923,769.00 square
kilometers, and about 13,878 square kilometers of water (National Bureau of
Statistics, NBS-2010). Its distance from the Northern to the Southern regions
covers about 1400 kilometers, and 1100 kilometers from the Eastern to the
Western regions. Nigeria extends about 1690 kilometers from the Federal
Republic of Cameroun on the East, bounded by the Republic of Benin on the
West at about 773 kilometers, a distance coverage area of 87 and 90
kilometers to the Republics of Chad and Niger on the North, and bathed by
the coastline of the Atlantic Ocean on the South. It lies along the southern
coastline to the Atlantic Ocean stretching out at about 700 kilometers. Its
eastern coastline stretches for 853 kilometers along the Gulf of Guinea.

49
Figure 2.3. Map showing Nigeria and its geographic location on the continent of Africa
Source: United Nations Fund for Population Activities (UNFPA).
2.6.2.2 Topography and climate
Nigeria has five major geographic regions: a low coastal zone along the Gulf
of Guinea; hills and low plateaus north of the coastal zone; the Niger-Benue
river valley; a broad stepped plateau stretching to the northern border that has
elevations exceeding 1,200 meters; and a mountainous zone along the eastern
border, which includes the country’s highest point, Chappal Waddi (2,419
meters). Nigeria has two principal river systems: the Niger-Benue and the
Chad. The Niger River, the largest in West Africa, flows 4,000 kilometers
from Guinea through Mali, Niger, Benin, and Nigeria before emptying into
the Gulf of Guinea. The Benue, the Niger’s largest tributary, flows 1,400
kilometers from Cameroon into Nigeria, where it empties into the Niger
River. Nigeria’s climate is arid in the north, tropical in the center, and
equatorial in the south. Variations are governed by the interaction of moist
southwest monsoon and dry northeast winds. Mean maximum temperatures
are 30º C–32º C in the south and 33º C–35º C in the north.
Kajama
Dosso
Kandi
Parakou
Cotonou
Zinder
Daura
Goure
Diffa
Bosso
Bol
KauraNamoda
Nguru Magaria
Gumel
Damasak
Potiskum
Biu
Bajoga
Biliri
Kari
Kontagora
BidaBadeggi
Kanfanchan
Baro
Owo AuchiOndo
Ore
OyoIseyin
IwoWukari
Bali
Ganye
TungoIbi
Kisi
Kamba
Dan Gulbi
Sabon Benin Gwari
Funtua
Buea
WarriSapele
Banyo
Ndali
Oron
Wawa
Illela
Wurno
Koko
Gummi
Maradi
Mokolo
Mora
Guider
Bamenda
Ngaoundéré
Nkambe
Foumban
Léré Pala
Bama
Dikwa
Damboa
Baga
Gombi Mubi
NumanLauPankshin Amper
Kwolla
OturkpoAnkpa Takum Abong
Ogoja
Gembu
Gboko
Ikom
Yoko
Kontcha
Ilaro
Bohicon
Hadejia
WudilAzare
Birni Nkonni
Gaya
Shaki
Sokoto
Katsina
Dutse Damaturu
Birnin Kebbi
Bauchi
Jalingo
Minna
Ilorin
AkureAdo-Ekiti
Lokaja
Enugu
Awka
Makurdi
Abeokuta
PortHarcourt
Benin CityAsaba
Ikeja
Jos
Owerri
YenagoaCalabar
Yola
Umuahia
Uyo
Gombe
Gusau
Lafia
Abakaliki
Douala
Bafoussam
Kumba
Nikongsamba
Garoua
Maroua
Aba
Lagos
Ogbomosho
Ife
Onitsha
Kano Maiduguri
OshogboIbadan
Zaria
Kaduna
N'Djamena
Abuja
Porto-Novo
N'Djamena
KainjReservoir
Niger
Niger
Benue
Bénoué
Komadugu
Komadugu G
ana
Yedsera
m
Sanaga
Mbam
Kaduna
Gon
gola
Hadejia
Sokoto
Zamfara
Gulbin Ka
Sokoto
Gul f of Guinea
Bight of Benin
Bight of Biafra
Lake Chad
Nig
er
Ni ge r D
e l t a
Quémé
Lake Bamendjing
SOKOTO
ZAMFARA
KATSINA
KANO
JIGAWA Y O B EB O R N O
K E B B I
KADUNA B A U C H I
ADAMAWA
KWARA
K O G I
O Y O
P L AT E AU
NASSARAWA
T A R A B A
B E N U E
N I G E R
ABUJA CAPITAL TERRITORY
OSUN
O G U NONDO
E D O
GOMBE
DELTA
ENUGU
EBONY
IMO
RIVERS
BAYELSA
ABIACROSS RIVERS
AKWA IBOM
LAGOS
EKITI
AN
AM
BR
A
N I G E RC H A D
CHAD
C A M E RO O N
B E N I N
C.A
.R.
0 50 100 150 200 km
0 50 100 mi
National capitalState capitalTown, villageMajor airportInternational boundaryState boundaryHighwayMain roadSecondary roadRailroad
NIGERIA
The boundaries and names shown and the designations used on this map do not imply official endorsement or acceptance by the United Nations.
NIGERIA

50
High humidity is characteristic from February to November in the south and
from June to September in the north. Low humidity coincides with the dry
season. Annual rainfall decreases northward; rainfall ranges from about 2,000
millimeters in the coastal zone (averaging more than 3,550 millimeters in the
Niger Delta) to 500–750 millimeters in the north (UNHR, 2010).
2.6.2.3 Natural resources
Nigeria’s primary natural resources consist of natural gas, petroleum, tin, iron
ore, coal, limestone, niobium, lead, and zinc. Nigeria has proven oil reserves
of 35.9 billion barrels, the tenth largest reserves in the world (Oluwakiyesi,
2011). Proven natural gas reserves are estimated at 185 trillion cubic feet, the
seventh largest reserves in the world and the largest in Africa. Estimates for
oil and natural gas reserves are as of January 2006 (World Bank, 2010). The
country also has an abundance of arable land, and coasts.
2.6.3 Population Growth and Urban Projections in Nigeria
With just over 160 million people representing 2.46% of the world’s
population, Nigeria remains Africa's most populous country (UNHR, 2010).
According to a World Bank report published in 2014, Nigeria makes up about
15% of the entire population in Africa. Population in Nigeria increased to
162.47 Million in December of 2011 from 158.42 Million in December of
2010, to over 178. 52 million in 2014, and as illustrated in Figure 2.4 is
expected to double by the year 2050 (UN 2012). The population of Nigeria
represents 2.35 percent of the world´s total population, which arguably means
that one person in every 42 people on the planet is Nigerian (World Bank,
2012). The United Nations, Department of Economic and Social Affairs,
Population Division (2011) notes that Nigeria has one of the highest
population and urban growth rates in the world, with its cities ranking
amongst the fastest growing in the world. A UN Report on Nigeria indicates
that the annual urban population growth rate is 5.8 percent, while the national
population growth rate is 2.8 percent (UNHR, 2010).

51
Figure 2.4. Nigeria’s global population ranking (in Millions)
Source: National Bureau of Statistics
2.6.4 Urban Growth: Opportunities and Challenges in Nigeria
2.6.4.1 Emerging trend
One major challenge of contemporary and future urbanization derives from
the fact that practically all urban population growth will take place in less
developed countries, and that a large proportion of the future growth of the
urban population will live in conditions of poverty (UNHR, 2010). The
World Bank Report (2010) estimates that most of the urban growth will take
place in developing countries, where the urban population is expected to
double, from 2.6 billion in 2010 to 5.2 billion in 2050, signaling a massive
decline of the world’s rural population by about 0.6 billion (UNHR, 2010).
By United Nation’s projection, it is expected that 5.8 % of Nigeria’s
population will be urban by 2030 and over half the population in Nigeria will
be urban by 2020 (UN, 2010). A recent report from UN-Habitat (2010)
revealed that close to 50% of Nigeria’s population now live in urban areas,
compared to only 20% in 1980, 16% in 1970 and 13% in 1960 (Figure 2.5).

52
Figure 2.5. Urban population from 2002-2010 (% of total) in Nigeria
Source: National Bureau of Statistics
2.6.4.2 Opportunities and benefits of urban growth
Despite the commonly held negative views of population growth and
urbanisation in Nigeria, several studies (Jiboye, 2009; Oluwakiyesi, 2011)
have identified some of their important roles in economic and social
development. This phenomenon is explained mostly by the presence of
business opportunities, impressive economic growth, and expansion of
infrastructural improvements within major commercial and administrative
cities. Oluwakiyesi (2011) in his remarks on the Nigerian construction
industry disclosed that urbanisation has fostered economies of scale in
production and distribution networks, and favoured large facilities in more
developed or economically buoyant states like Lagos, Abuja and Rivers State.
He mentions that investors in cities generally appreciate accumulated
advantages of urbanisation, ranging from urban amenities, to thriving
economies. He describes urban cities as focal points of economic growth,
innovation and paid employment, of which on average, urban residents tend
to have better access to education and health care as well as other basic
services such as clean water, sanitation and transportation than rural
populations. Jiboye (2009) further notes that urban growth has done more to
reduce rural poverty, and that the growth of domestic urban markets appears
to be key to rural development. He mentions that migrants from rural areas
gain access to better opportunities in cities and families left behind benefit
from their remittances.

53
The advantages of large urban cities over smaller towns and cities in total
factor productivity have been well demonstrated in the literature: World Bank
(2000, p. 37). Urbanisation and population as important as they seem, also
constitute major socio-economic and environmental threats to society.
2.6.4.3 Threats and challenges of urban growth
With increasing population and massive rural-urban migration accompanying
the urbanisation process in Nigeria, there have been notable problems
associated with the uncontrolled population and urban growth pattern. In
conducting a detailed study of Nigeria’s housing problems, Oluwakiyesi
(2011) identified scarcity of productive land, congestion, proliferation of
slums in the cities, increase in demand for urban services like housing,
education, public health, and a generally indecent living environment as some
of the issues associated with urbanisation. He notes that urban settlements in
coastal areas such as Rivers and Cross Rivers States cause the destruction of
natural habitats and consequently biodiversity loss, while also altering
regional hydrology. He points out that the invasion of mangroves, coral reefs,
sea grass beds and sand dunes destabilizes the coastline, leading to erosion or
siltation, damaging infrastructure and increasing the vulnerability of local and
regional populations to natural disasters while reducing resiliency to climate
change and rising sea levels. Rapid population growth, high rural-urban
migration, an expanding middle class and sustained macroeconomic
expansion have resulted in a housing shortfall estimated at about 17million
units (Adebayo, 2002, Oxford Business Group, 2011). A similar shortfall is
equally replicated in public and commercial buildings as well as
infrastructure (Jiboye, 2009). As a rapid response solution to chronic housing
shortage and climate change due to population growth and urbanisation, the
Nigerian housing industry is seeking ways to balance economic growth with
environmental considerations in the decision-making process.

54
2.6.5 Nigerian Housing Construction Industry: Size and Forecast
Oluwakiyesi (2011) notes that a vigorous and buoyant housing sector is an
indication of a strong programme of national investment and is indeed the
foundation of and the first step to future economic growth and social
development. He further indicated that the gross housing delivery is a major
factor in the nation’s gross domestic product (GDP) and indeed, a reflection
of the state of economy of the Nation. In Nigeria, the housing construction
industry is crucial to development as it accounts for millions of jobs while
providing the infrastructure required for economic growth. It is renowned for
its complex and dynamic building environment. The sector has posted
impressive growth rates of over ten per cent in the last few years (Federal
Republic of Nigeria, 2010, Central Bank of Nigeria, 2011). Each of the
indicators examined below reveals part of the story that is relevant to the
understanding of the current state and impacts of the Nigerian housing
construction industry. These areas of discussion are a reflection and
testimony of the future potential that the Nigerian construction possesses.
2.6.5.1 Number of housing construction firms
The Nigerian housing construction industry has in excess of 350 firms in
total, of which over 190 are contractors (FHA, 2004). Statistics published by
the Office of Nigerian Housing Authority (FHA, 2004) for the housing
construction industry also give 3rd Quarter figures of approximately 192
private property development firms in Nigeria for the year 2007. In addition,
the number of Licensed Primary Housing Mortgage Finance Institutions
(LPHMFI) and other medium-size (based on scale of operation) housing
constructions firms in Nigeria rose from 251 in 1993 to 276 in 1994
(Ajanlekoko, 2001; Nub1, 2008).

55
2.6.5.2 Housing construction output: current market trend, size and forecast
Another useful indicator of the economic significance of the Nigerian housing
construction industry is its contribution to Nigeria’s Gross Domestic Product
(GDP). The World Bank Report (2010) estimates that Nigeria’s housing
construction sector accounts for 1.4% of its GDP. According to the United
Nations’ Human Development Index (2011), Nigeria has the second highest
GDP in Africa (US$166.78 billion in 2007) after South Africa. While the
Nigerian economy appears to be dominated by the petroleum sector, which
generates about 70% of current account receipts and around 72% of
government revenue, the Nigerian Economic Data Report (2011) has it that
the petroleum sector’s contribution to real GDP growth is relatively and
surprisingly smallest compared to industries such as telecommunications,
agriculture, manufacturing, and construction (Oluwakiyesi, 2011).
Confirming the report released by the Nigerian Economic Data Report
(2011), another study conducted by Oluwakiyesi (2011) revealed similar
findings. The findings of his study revealed that the housing sector accounts
for roughly 5.8% of Nigeria’s GDP, making Nigeria’s total GDP to rise to
approximately 495 times its size, in the last three decades (see Figure 2.6).
Figure 2.6. Nigeria’s GDP growth rate
Source: World Bank Africa Development Indicators Database
!
!!!"#$%"&'()*'+,%-.,"*'(/'0-+,%12!"!#$%&'!()!*++(,-.'/-/&0!!!!!!!!!!!!!!!!!"((((((((((((3&1(4566!!!!!!!!!!!!!!!!!!!!!!!!"!!!!!!!!!!!!!!!!!!!!!!!!!!!!!!!!!!!!!!!!!!!!!!!!!4!
!
!"#$%"&(((((((I( ((((78-","$+( ((I( )*'+,%-.,"*'(
!!
!
!
!
!
!
!
!
!
!
!
!
!
!
!
!
!
!
!
!
!
!
!
!
!
!
!
!
!
!
!
((
(+$.,*%( (9(0"++$.,"'#(:**;((!
!0&1-(,!$11(.'-0!)(,!2345!()!/-0!678! 39!:(,&!/;+(,-$'-<!/0!-=&!)$1-!-=$-!>&0+/-&!-=&!?,(@-=!0&&'!/'!-=&!1('0-,.1-/('!0&1-(,!(.-+.-<!AB!C&$,!D"6E!()!FG5<!!""#$%&'("#)!H&I(@9<!/-0!1('-,/H.-/('!-(!-(-$I!678!=$0!,&;$/'&>!$-!$HC0;$IIC!I(@!I&%&I03!J'!2KL2<!-=&!1('0-,.1-/('!0&1-(,!$11(.'-&>!)(,!G3L5!()! !678!$'>!/'!-=&!I$0-!-=,&&!>&1$>&0 4KG!-/;&0!/-0!0/M&3!*'!-=&! 1('-,$,C<! 1('0-,.1-/('! 0&1-(,! 678! =$0! ('IC! ?,(@'! -(! 2NG! -/;&0! /-0! 0/M&! /'! 2KL23!O(-$HIC<! -=&! >,/%&,0! ()! &>! -=&!0$;&! !"?,/1.I-.,&!A1,(+!+,(>.1-/('9<!D,.>&!(/I!+,(>.1-/('!$'>!P=(I&0$I&!Q!E&-$/I!-,$>&3!!!
R=&! 1('0-,.1-/('! 0&1-(,! /0! C&-! -(! ,&$I/0&! /-0!+(-&'-/$I0! >&+0/-&!O/?&,/$ 0! =.?&! >&)/1/-! /'!/'),$0-,.1-.,&3! *%&,! -=&! I$0-! -=,&&! >&1$>&0! ,&%/&@&><! 1,(+! +,(>.1-/('<! 1,.>&! (/I!+,(>.1-/('!$'>!@=(I&0$I&!Q! ,&-$/I! -,$>&!=$%&! ,&1(,>&>!$! NB!C&$,!D"6E!()!NL5<!NK5!$'>!NS5!,&0+&1-/%&IC<!@=/I&!-=&!1('0-,.1-/('!0&1-(,!678!?,&@!$-!$!D"6E!N25!(%&,!-=&!0$;&!+&,/(>3! J-! /0!&%/>&'-! -=&,&)(,&! -=$-!O/?&,/$! /0!@$C!H&I(@!,&$I/0/'?! /-0!+(-&'-/$I! /'!-=&!1('0-,.1-/('!/'>.0-,C3!!!
(((((((((((((((<%&":"'#(=&>*%(*":(?%*0-.$%+@(*/I!@&$I-=!=$0!H&&'!T&C!-(!1('0-,.1-/('!0&1-(,!H((;!/'!;$U(,!(/I!+,(>.1/'?!&1('(;/&03!J'!-=/0! ,&?$,><! 0/;/I$,! I&00! >/%&,0/)/&>! (/I! +,(>.1&,0! I/T&! -=&! V'/-&>! ",$H! W;/,$-&0<! X$.>/!",$H/$<! $'>! ;(,&! >/%&,0/)/&>! (/I! +,(>.1&,0! I/T&! E.00/$<! ! 0$@! 1('0/>&,$HI&! H((;! /'!1('0-,.1-/('! $-! %$,/(.0! +&$T0! ()! (/I! H((;0! /'! -=&! I$0-! -=,&&! >&1$>&03! R=&! 1,.>&! (/I! +,/1&!H((;! ()! -=&! 2KBY0! )(,! /'0-$'1&<! ,3!7&0+/-&!I(@!1,.>&!(/I!+,/1&0!/'!-=&!LY0<!T&C!;/>>I&!&$0-!&1('(;/&0<!+$,-/1.I$,IC!X$.>/!",$H/$!$'>!V"W!;$'$?&>!-(!0.0-$/'!/-0!/'),$0-,.1-.,$I!>&%&I(+;&'-3!!
!!!
G325
Y3Y5
23Y5
N3Y5
F3Y5
43Y5
G3Y5
S3Y5
Y
2YY<YYY
NYY<YYY
FYY<YYY
4YY<YYY
2KLN
2KLF
2KL4
2KLG
2KLS
2KLB
2KLL
2KLK
2KKY
2KK2
2KKN
2KKF
2KK4
2KKG
2KKB
2KKL
2KKK
NYYY
NYY2
NYYN
NYYF
NYY4
NYYG
NYYS
NYYK
NY2Y
Z./I>/'?!Q!D('0-,.1-/('!0&1-(,!678 D('-,/H.-/('!-(!-(-$I!678
A"#-%$(62(B-":0"'#(C()*'+,%-.,"*'(DEF(&'0(.*',%"G-,"*'(,*(,*,&:(DEF(
!!!!!!!!!!!!!!!!!!!!!!!!!!!!!!!!!!!!!!!!!!!!!!!!!!!!!!!!!!!!!!!!!!!!!! !!!!!!!!!!!!!"#$%&*#+,-%./,0#122.'/-!3#4"-%5,#6"!",(27#
B[C,!D"6E\!FG5!
8(.!!# 9.:"!-%2# ;(.<'2-# =89;>3#$(.:#?@AB#%/#)CA)#
D./!-('2-%./#.'-E'-#7,!#0,&&"<#D(.E# ;(.<'2-%./3# D('<"# F%0#;(.<'2-%./#,/<#G7.0"#H#6"-,%0#I(,<"# # -7"# J# K%&&"!-# <(%5"(!#
#
F%0# G",0-7# 7,!# K""/# ,#:,L.(# <(%5"(# .$#2./!-('2-%./# K..:# $.(# .%0#E(.<'2%/&# "2./.:%"!# .5"(#-7"#0,!-#J#<"2,<"!#

56
2.6.5.3 Employment generation
The World Bank report on the wealth of nations (2010), notes that the output
of any nation depends on its human resources –– i.e. “the skill, dexterity, and
judgment of its labour” (World Bank, 2010). Current estimates show that that
between 0.4 – 2.5 million people are employed in the Nigerian housing
construction industry (FHA, 2004; NBS, 2010). Nubi (2008) estimated that as
at 2001, contractor employment within the housing sector was of the order of
1.8 million, accounting for about 6.2% of total employment in Nigeria. The
Nigerian Housing Authority (FHA, 2009) also provides more current
estimates of 2.6 million employees, representing over 8.5% of all jobs in
Nigeria from highly skilled professionals through to lower skilled workers.
According to Construction Skills Network (2009), lower skilled workers
(trades and operatives) represent approximately 43% of the Nigerian housing
construction workforce.
Though the Nigerian housing construction industry undoubtedly shares the
responsibility of employment generation, creating investment opportunities,
and improving the economy, the challenge of meeting the quantitative and
qualitative demand for housing, especially for low-income earners who
incidentally constitute the majority of the population, is still one of a major
concern. The findings derived from the study ascribed the fundamental cause
of this failure to the current issues associated with housing development in
Nigeria housing industry.

57
2.6.6 Housing Development in Nigeria: Current Trend
The provision of housing lies silently beneath the rise and fall of the housing
industry as well as its decision-making practices primarily because of its
potential to create wealth, employment opportunities and industrilisation.
Similarly, the design, development and use of housing are an evident medium
to demonstrate the feasibility of sustainable concepts. Interestingly, housing
development features as one of the objectives of sustainable development.
However, for many Nigerians, the desirability of owning or living in decent
homes is as strong as the reality of its elusiveness. The inability to afford this
prime asset is largely a root cause of the deficient housing situation. Common
issues surrounding housing development in Nigeria are discussed as follows:
• Health and Safety in Construction
Occurrences of fatalities from construction injuries are far more common in
developing countries like Nigeria than in the developed world and have
remained high over the years (Ofori, 2004). Pesticide poisonings and
provisions of clean water and air remain the major challenges within its
regions due to the population concentration in urban cities.
Although the Nigerian housing industry has enacted regulations and
established government agencies aimed at improving workplace safety and
preventing occupational diseases and injuries, fatalities are still high
(Oluwakiyesi, 2011). Resources focused on these goals are increasing
significantly, but still fall far short of needs.

58
• Waste Production
The Nigerian Rural Urban Linkages (2004) reported that over 70 million
tonnes have been generated in Nigeria in 2003 and that 900 housing
construction and demolition (C&D) landfills are operating in Nigeria to
receive disposed material waste. Although solid waste is generated by
different economic activities, the Nigerian housing construction industry has
always been considered as one of the major producers of waste (NRUL,
2004). This is clearly reflected in statistical and environmental reports by the
Nigerian Rural-Urban Linkages (NRUL, 2004). According to a report by the
United Nations Environment Programme (UNEP, 2005), almost 162 million
tonnes of waste is generated every year in the continent of Africa, 62 million
tonnes in sub-Saharan Africa, and the share of housing construction waste is
roughly 21% (DEFRA, 2007). In Nigeria, over 1000 tonne per day of
material waste is disposed of at landfills representing roughly 10% of total
solid waste from housing (UNEP, 2005). Nigeria is no exception and it is
considered as one of the biggest producers of waste, 45% of which is from
housing construction waste (Oladipo and Oni, 2012) and it is ranked top in
waste share per capita among the countries in Africa (Afon, 2007).
• Depletion of non-renewable Resources
The Nigerian housing construction industry is a major consumer of natural
non-renewable resources such as metals, fossil fuel and non-renewable
energy resources (Abisuga and Oyekanmi, 2014). It accounts for a large
quota of material and energy consumption, biodiversity loss, and pollution.
The need for alternative material and energy sources in line with statutory
regulations has now become a vital option for the housing sector as it aims to
either ensure the removal of any cost in material production energy or reduce
any potential cost to an acceptable level.

59
• Politics
While tougher building regulations have been introduced, compliance with
certain housing construction policies is weak, and actions to undertake such
policies are slow and unresponsive to changing needs and demands (Nubi,
2008). In analysing the unchanged state of the Nigerian housing sector from a
political perspective, Oluwakiyesi (2011) demonstrated how the dominant
actors in the sector effectively withstand major changes in building
regulations. He observed that the current practice in the housing sector
favours more or less incremental change over radical change, and that
technical decisions in the planning process are highly politicised. He
reiterated on how the differences in the opinions of the parties involved in the
housing chain are hardly reconcilable, as these tend to hinder sustainable
innovative ideas.
• Building Materials Shortage
The local production of building materials in Nigeria is not sufficient to meet
the demand for the housing sector (Oruwari et al., 2002). Being a country that
relies heavily on cement, there are severe bottlenecks in the supply of
materials due to fluctuations in demand and lack of capital for the build-up of
supplies, or inputs. Here, cement is often regarded as a local product even
when 60 % of the production cost results from imported energy. According to
Oluwakiyesi (2011), the biggest factor influencing climate change is concrete
and steel. Although cement makes up only 12-14 % of the final concrete mix,
he argues that further embodied energy comes from the transportation and
production of aggregates and in the case of reinforced concrete the
manufacturing of steel. Shortage of other locally produced building materials
such as; bricks, strawbale and earth are also experienced. In a country where
there is a monopoly in supply, shortages have been deliberately created to
force up the price, causing a scarcity of building materials, which invariably
affects and alters the sustainable development plans in the housing sector.
This steep rise of building materials has effectively removed decent housing
from the reach of low and medium income groups in the region.

60
• Construction Design Systems and Technologies
Nigeria like many other developing countries had systems or frameworks
inherited from its colonial administrators and have found that some of these
systems are inappropriate for their own current needs (Nubi, 2008).
Conventional designs of these types suffer from various limitations for
example, lack of thermal comfort and poor ventilation. Thus attention is now
more focused to include building features appropriate to tropical and local
conditions. Locally produced materials, systems and technologies have now
been given more consideration in search of sustainable solutions. As such,
many building design professionals are now beginning to get involved in
“sustainable design” in response to expressed interest from their clients.
It can be argued from the above analyses that the emphasis on housing
problems and needs in Nigeria differ considerably and so are the technologies
and methods adapted in the housing industry. Analysis from the study
suggests that it is of importance that sustainable practices be considered and
integrated at various levels of housing development. Given the extreme
supply-demand imbalance; the abundance of demand at the bottom end of the
market; the high cost of conventional construction techniques and materials;
and the reluctance of financiers to invest in alternative housing, it is therefore
imperative that innovative building technologies and housing design models
that drive down costs be explored if social housing and more affordable and
energy efficient and low-impact housing in general – is to become a realistic
possibility in Nigeria. Low-impact green housing has been described as an
important model of sustainable development because of its contribution to the
economy and the relatively significant environmental and social-cultural
impacts (Fairlie, 2008; Maxey, 2009; Seyfang, 2010). Against this
background, this study aims to examine LIGHDs as potential models for
sustainable housing in Nigeria.

61
2.6.7 Low-Impact Green Housing Development: An Alternative Approach to Sustainable Housing in Nigeria
The quest for far reaching changes in the way housing construction should be
carried out has been emphasised (Malanca 2010). As Nigeria pursues
improvements in infrastructure and buildings, there are concerns over the
manner in which these developments would occur especially considering the
weak institutional forces at play. Nigeria’s intense development pressure, the
resulting rapid urbanisation and generally carbon intensive mediums of
energy generation leaves the Nigerian housing industry and built environment
under particular pressure to thoroughly embrace the sustainability imperative.
As a result, there is now need for new models of sustainable housing, to
ensure the protection of the region's environment, the sustainability of its
natural resources, and the high quality of life of its people (Malanca, 2010).
While various literature (Fairlie, 1996; Seyfang. 2010) have stressed the
economic, environmental and socio-cultural benefits of low-impact green
housing, and identified several strategies and action plans in the pursuit of
this concept in the broader context, there is a dearth of literature relating to
the concept in Nigeria (Adegboye. 2009; Adeyemi, 2012; Anosike and
Oyebade, 2012). The benefits of LIGHDs have been highlighted in various
studies (Fairlie, 2008; Maxey, 2009). It therefore remains to be demonstrated
what current drivers influence- or barriers hinder- the direction and
capabilities of LIGHDs in the Nigerian context.
2.6.7.1 Factors driving low-Impact green housing in Nigeria
The drivers of LIGHD can be categorised into: environmental, industry,
economic issues and legislation. From these broad categories, the following
can be considered as the key drivers:

62
• Climate change mitigation/environmental concerns/energy
efficiency: Since the adoption of the Unitary Development Plan (UDP) in
2005, climate change has become the single most important global priority
(USDOE, 2010). The effects of global warming are already having severe
effects on people and planet. As such, the Nigerian housing industry is
beginning to adopt planning systems and strategies that will actively facilitate
reductions in energy requirements, to address this global threat both from the
perspective of adaptation to effects and impacts which it is already
experiencing and those that the present and future generations will
experience. Adeyemi (2012) reiterated the urgency with which climate
change needs are to be addressed and planned. In response to this threat, he
noted that a whole series of planning policy revisions and changes have been
issued by the Federal Ministry of Lands, Housing and Urban Development
(FMLHUD-2012) over the last 2 years. The requirements of the emerging
local planning policy are designed to track best practices and sustainable low-
impact housing models.
• Government policies (Legislation/regulations): Peer pressure
within the industry and increased realisation of the importance of
LIGHDs construction image. The reluctance to implement low-impact
green housing developments has incited many governments to decree laws
and policies guiding such ideas (Seyfang, 1996). Several policies have been
designed to proactively and prescriptively promote LIGHDs, across its scope,
in line with the priorities of Nigeria’s sustainable development strategy
(Nwokoro and Onukwube, 2011). Adeyemi (2012) said that strong legislation
and clear regulations are vital in ensuring the success of the low-impact green
housing agenda. He suggested that improving and tightening up regulations is
one of the best ways of guaranteeing significant actions. He added that
introducing policies that encourage low impact green developments in
Nigeria could help to grow the region’s economy in a sustainable way and
produce a greater degree of social housing.

63
• Biodiversity conservation: The natural environment and landscape
quality of Nigeria are precious assets, which should be preserved and
enhanced for the benefits of both the current and future generations. The
natural environment contains important and valuable habitats, biodiversity
resources in an urban setting, as well as distinctive landscape in sub-urban
zones. Recent legislative changes by the government now impose a duty on
housing authorities to conserve biodiversity-one that aims to ensure that:
construction, planning, development and regeneration have minimal adverse
impacts on biodiversity and enhance it where possible.
• Financial benefits/cost savings/operational efficiency: Innovative
housing models can be of considerable help in lowering the cost of
construction (Ofori, 2004). Low-impact green housing concept has been
addressed as one of the most frequently used alternative technique for rural
and sub-urban dwellers worldwide due to its relatively low-cost approach
(Fairlie, 1996). Several studies (Fairlie, 2008; Maxey 2009) have proven
through case studies that the life-cycle cost of conventional housing is twice
more than the cost for LIGHDs.
The identified drivers give some consideration to the notion that the LIGHD
model displays a number of significant differentiators that distinguishes it
from other conventional housing models. As yet, this study has failed to find
any compelling evidence to confirm that the house build industry in Nigeria
does indeed display a sufficient level of understanding and technical know-
how to undertake such concept. Despite the country’s demand for sustainable
low-impact options in housing, the increased commitment in sustainability
and environmental stewardship, certain barriers still undermine its benefits.
The main issues underlying this setback are examined below

64
2.6.7.2 Barriers impacting Low-Impact Green Housing in Nigeria
Research conducted by a number of studies (Nwafor 2006; Nwokoro and
Onukwube, 2011) suggests that although there is interest in the LIGHD
concept, its frequency of application in Nigeria is poor. Three main barriers
that hinder the implementation of LIGHDs are identified as follows:
• Education and experience: Generally, failure in low-impact green
housing construction and the general unpopularity of the concept amongst
professionals in the Nigerian housing industry are due to lack of knowledge
of their sustainability impacts and inexperience in sustainable low-impact
designs. A major theme evident in Nwafor (2006) and Sebake (2009) is the
fact that there is still not enough clients or projects that could allow designers
to gain much needed experience in low-impact green designs. Seyfang (2010)
posited that a thorough understanding of the concept could ensure quality and
proper performance of the building.
• The client-perception factor: Although clients often express interest in
low-impact green design solutions, and are to some extent aware of the need
for sustainable housing, it is rarely insisted on, due to clients’ preference of
choice. Abisuga and Oyekanmi (2014) explained that clients often find it hard
to adhere to low-impact green designs partly due to a limited range of
environmentally acceptable or responsible materials available to embark on
such designs. They emphasised that the majority of clients object to LIGHDs
for the sole reason that the materials used for such developments cannot
satisfy the new needs of building forms and functions and, that it is
impossible to provide enough of such materials to satisfy the level of housing
demand. This is in agreement with the assertion of Nwafor (2006) who
argued that the overall effect of the technical deficiencies of locally produced
building materials creates acceptability barriers of LIGHD.

65
• Poor selection approach in the use of Local and recycled building
materials (LCGBMCs): The development and selection of LCGBMCs
remains frequently among the challenges of implementing low-impact green
housing design. Nigeria is known to be rich with natural material resources
required for the production of many LCGBMCs, but their exploitation has
been severely hindered by numerous factors one of them being the selection
approach. Generally, the selection of LCGBMCs in Nigeria is determined by
their initial prices rather than considering the running costs attributed to those
materials and their impacts on the environment throughout the entire life
cycle of buildings. Abisuga and Oyekanmi (2014) also explained that
suppliers ranges are often limited and do not accommodate LCGBMCs. This,
they noted, is due to a number of factors, a few being research and
development funding, the fact that these products are not mass-produced like
their unsustainable counterparts. They maintained that there is as yet not a
whole databank of LCGBMCs from which to choose from, hence creating a
lack for professionals seeking to specify environmentally sustainable products
for LIGHD projects.
While there are multiple benefits of LIGHDs, it is evident that barriers
preventing clients and designers from committing to low-impact green design
approach in Nigeria are presently surplus. Some of these include; lack of
legislation, Ineffective information technology, lack of assessment tools, lack
of education and knowledge in LIGHD design, higher risks based on
unfamiliar techniques, and a lack of the associated material performance
information. The lack of informed knowledge amongst building professionals
thus suggests that there is need for data on such materials within which to
view the management of the selection process, particularly in the early stages
of the design when there are a greater number of unknown variables to
consider. It thus can be argued that by utilising locally –sourced and recycled
products, it is anticipated that clients would be more likely to consider a low-
impact green housing solution.

66
2.6.8 Alternative Materials and Technologies: Drivers and Barriers Impacting the use of Low-Cost Green Building Materials in Nigeria
The erosion of earth’s ability to sustain life has brought the issue of
sustainable development practice into dominance in every aspect of human
activities (Seyfang, 2010). The international community, through its different
organisations, has devoted considerable efforts to assure that every human
activity fulfills the requirements of this development (Fairlie, 1996;
Wimbush, 2001). With increasing public and client awareness of the impacts
of buildings and their associated materials, addressing environmental issues
have become a normal part of the design and construction processes (Nwafor,
2006). Given the high level of public environmental awareness, “
sustainable”, which is a term commonly used to distinguish consumer
building materials or products that are claimed to be in some way better for
the environment than conventional products like cement and steel (Trusty,
2003), has become a catch phrase in the housing construction sector, as the
cachet of being seen as a ‘sustainable or green product’ can have considerable
market advantages (Nwafor, 2006).
Sebake (2009) noted that sustainable and green building material selection
practices suggest a way to portray the housing construction industry’s
responsibility towards protecting the environment, which he claims urges the
industry to pursue a balance among economic, social, and environmental
performance when undertaking housing projects. Low-cost green building
materials and components have been described as having considerable
environmental, economic and socio-cultural advantage over their
conventional counterparts (Fairlie 2008; Seyfang, 2009a; Adegboye 2009;
Zami, 2010), given their relatively lower cost and energy requirements in
their extraction, production, and transportation processes.

67
Anosike and Oyebade (2012) noted that LCGBMCs have the objective of
doing less harm in their production, use, construction and operation by
reducing local and global resource depletion and environmental degradation.
They maintained that LIGHDs strive to reduce the negative environmental
effects of materials by using more LCGBMCs (McDonough & Braungart,
2002; Reed, 2007). Nwafor (2006) claims that LCGBMCs respect the
limitations of non-renewable resources, work with the pattern of nature’s
cycles, and inter- relate with the ecosystem. Kibert (2008) adds that they are
non-toxic, energy and water efficient, made from local, recycled and
recyclable materials. He noted that they exhibit certain characteristics
including absence of environmental contamination during their life cycle.
Owolabi et al. (2014), while examining the effectiveness of gypsum board
over conventional sandcrete block, revealed the benefits of using LCGBMCs
in terms of time, ease of construction and handling. They added that using
regionally extracted and manufactured LCGBMCs-unlike materials like steel
and cement, which have relatively high-polluting processes, could help lessen
the environmental impact of a building, by reducing environmental impacts
of transport. Adegboye (2009) mentioned that LCGBMCs are minimally
processed (e.g., uncut stone, earth materials, wood, bamboo), hence often
pose fewer ecological impacts, have relatively low embodied energy,
conserve energy use and potentially harmful emissions and waste, as well as
protect the functional integrity, diversity and cultural identity of the place.
Jagadish (2007) writes, in addition to its political, economic, social and
ecological advantages, that LCGBMCs have great cultural and architectural
importance. He argues that the development of contemporary mass
construction using LCGBMCs has the potential to revive lost cultural
traditions, while contributing to the development of a progressive sustainable
housing construction industry in both sub-urban and urban dwellings.

68
He adds that the emphasis on using LCGBMCs (such as mud, straw and
recycled timber) for construction is a significant localisation impact of this
type of building approach, quite distinct from mainstream building
techniques. Although various studies (Kibert, 2009; Zami, 2010; Norton,
2004) have highlighted the benefits of using LCGBMCs in housing projects,
certain barriers still limit their wider use in mainstream housing. Ofori (2004)
notes that several factors account for this, including the efforts of professional
institutions to enhance the awareness of their use through publications of
policy documents and best practice guides in their selection process.
Abisuga and Oyekanmi (2014) noted that clients often refrain from low-
impact green housing designs since designers often choose from a limited
range of products that are sustainable, especially when there are so many
other unsustainable options out there. They argue that this lack often results
in clients relying heavily on imported materials. This, Anosike and Oyebade
(2012) claim, is in part due to the fact that very few of these products are
commonplace in the housing industry or have been widely established. They
confirm that designers often expressed caution, with doubts that unaccredited
products are inferior. This point is further established in Adegboye (2009),
which explained not only how difficult it is to source LCGBMCs, but also
how almost impossible it is to establish which products are authentically
sustainable, intricately linking the problem to designers reticence in using
such materials.
Nwokoro and Onukwube (2004) maintain that forward-thinking designers
sometimes have trouble using LCGBMCs during the design process because
of its failure to meet certain requirements, hence making them resort to
unsustainable material selection practices. They further noted that although
consideration is being given to the use of LCGBMCs, there is as yet no
appropriate data guide from which designers could derive valuable
information to conduct an effective decision-making process. They note that
with sustainable low-cost green building products being relatively new,

69
lacking regulatory building codes, and often manufactured by new small
businesses, the majority of designers express wariness when specifying them.
Reddy and Mani (2007) identified lack of standardised local-based materials,
rapid urbanisation, changing lifestyles and increased adoption of energy-
intensive modern construction materials as some of the issues that have lead
to a steep decline in adoption of LCGBMCs. They argue that most
developing nations, under pressure for modernisation, have so far neglected
the promotion of local construction methods and materials.
A similar study by Zami (2010) identified several barriers to the adoption of
LCGBMCs, including the need for new legislation, technical training, public
awareness of sustainability, and knowledge sharing. His study emphasised the
lack of knowledge amongst the majority of construction professionals of their
relative impacts on design-decisions as a key factor despite their enormous
potentials. He added that LCGBMCs are perceived as ‘second class’, while
modern construction methods and materials are seen as ‘civilised’ or
‘symbols of affluence’. His findings were that the inhibitors influencing the
adoption of LCGBMCs depended on the context and situation of particular
countries. Studies also identified clients’ resistance (Aye, 2003), knowledge
of materials, limited materials and authenticity of suppliers (Mate, 2006),
along with understanding of the impact of the materials (Kang & Guerin,
2009), accurate and accessible information and appropriate tools (Aye, 2003).
Other barriers identified include client demands (Hes, 2005), designer and
client poor knowledge (Davis, 2001), inaccurate and inaccessible information
(Hes, 2005; Davis, 2001) and inappropriate tools (Hes, 2005), peoples
mistaken perceptions and cultural problems (Morton, 2007, p377), lack of
knowledge, skills, and understanding amongst professionals, government,
donors, and users (Jagadish, 2007, p26), lack of technologies and resources
(Jagadish, 2007, p26-27), lack of building codes, policies to adopt LCGBMCs
(Morton, 2007), and difficulties in obtaining insurance (Morton, 2007).

70
Undoubtedly, the use of LCGBMCs in construction presents some benefits as
well as challenges that undermine their use. While marginal progress is being
made in the area of advancing the use of LCGBMCs in mainstream housing,
selection of such products remains a challenging, confusing, and sometimes
even contentious issue as majority of design and building professionals within
the Nigerian housing sector are still locked in to old traditional practices of
material selection. It is thus evident that existing approaches presented for
material selection in the Nigerian housing sector may not be sufficient to aid
Sustainable Material Selection (SMS).
2.6.9 Current Approach to Material Selection in the Nigerian Housing Industry
Historically, conventional literature about the Nigerian housing industry has
largely remained peripheral to discussions on material selection within design
practice (Nwafor, 2006; Abisuga and Oyekanmi, 2014). Despite an evolving
culture of sustainability in the housing industry, there are limited methods or
processes to support the management and synthesis of material knowledge to
stimulate sustainable material selection during the design process (Nwokoro
and Onukwube, 2011). As environmental decision-making requires
consideration of sustainability principles in housing, understanding material
selection from this perspective has become important. There is now discourse
on how material decision-making methods could support designers in the
sustainability aspects of material selection. Such aspects include the
understanding of how material selection influences a design considering
embedded design team knowledge, and stakeholder influences, which are key
to supporting environmental decision-making around materials.
While crucial studies have been undertaken to improve the material selection
process in industrialised as well as emerging economies, there is currently
less understanding around the process of material selection amongst designers
in the Nigerian housing sector (Nwafor, 2006; Nubi, 2008).
71
Presently, material selection in Nigeria is poorly understood and fraught with
burden shifting, as current approaches are incapable of adaptation to meet
new situational requirements. This is partly because material selection is
mostly done after designs are finalised (Nwafor, 2006). This is problematic as
extra costs and time are incurred when changing a building’s component
during the later stages of its development (Gluch and Baumann, 2004).
Oluwakiyesi (2011) further explains that the basic problem associated with
the material selection process owes much to whether or not designers are very
knowledgeable about such products. He observed that the knowledge of most
professionals who are responsible for making key decisions in the Nigerian
housing industry are sometimes negligible, as their decisions are based on the
information of other colleagues or what they recommend. He stated that
material choices for some designers often means them sifting through
catalogues of competing suppliers and manufacturers. Nwokoro and
Onukwube (2011) also see the lack of information as a potential cause, giving
examples of resources such as handbooks, and advisory services from
material suppliers as the readily available sources. They found, through
interviews with designers, that material selection tends to originate primarily
from experience. They suggest that the industry set up a system for
information so product information is readily available, to ensure that design
and building professionals develop a clearer understanding of the nature and
characteristics of the materials and products they specify.
In Abanda et al’s (2014) case, finding information, which is relevant and up-
to-date to enable material selection, was identified as the most common
problem in the housing industry. They maintained that the format suppliers
provide information with is usually not in line with the information designers
require. The research found that although most designers were aware of
issues of sustainability, it was rarely a factor when selecting materials, as they
were rarely asked by clients to factor it in, with some having never been
asked.

72
They note that designers are most concerned with the aesthetics and so find it
very challenging to understand everything. They suggested that technical
experts work in tandem with designers to help them understand sustainability
and to ensure feasibility. They emphasised the importance of a wide range of
material-selection decision factors with comparable information of material
properties that could enable designers to see the benefits and drawbacks of
the available materials. Adedeji (2010) went on further to state that material
selection in Nigeria till this day still faces a fundamental problem of how to
assess the suitability of a product. He notes that designers within the housing
sector find it difficult to delineate material choices because of the amount of
contradictory information being portrayed. He claims that in practice, it is
also nearly impossible, or at least impractical to make a list of sustainable
products, as there is an overall lack of knowledge and understanding in terms
of sustainable materials due to the dearth of information.
Adobo and Kolo (2009) provides a slightly different view as to the
sustainability of the current material selection approach. Another factor they
claim was often personal and related to the individual’s awareness of the
issues and desire to factor them in when selecting materials. They noticed that
many designers express a desire to know more about sustainability and the
desire to try new materials but that designers often stick to a few materials
that they are familiar with. Tied into this belief by some is that appropriate
material selection systems are not fully in place and so material choice makes
little or no impact at the end of life. They noted that many designers perceive
the idea of pushing sustainable materials or alternative selection approach as
a way to lose clients and, in some cases, have been turned down for proposing
such ideas. They add that there is a general consensus that clients are not
interested, thus sustainability in the material selection approach is often not a
consideration. It was suggested in their study that designers and engineers be
supported by applications that provide material information, guidance and
help during the design process

73
Although emerging material resources to support design practitioners such as
material libraries, databases and material selection software have been
developed as resources to supplement designers choice of materials at the
design stage, Abiola (2002) found strong evidence that such support systems
are not currently available to designers within the Nigerian housing industry.
He confirmed that there has to date been no adequate support system to assess
the contribution of LCGBMCs to sustainable housing development, despite a
growing need, adding that designers’ material selection processes are very
often based upon experience either personal, colleagues or experts opinions.
He maintains that most designers occasionally use experts in the form of
moulders, suppliers and manufacturers whom they contact for advice. He
suggested that a new qualitative evaluation framework, which is designed to
incorporate the information associated with LCGBMCs and other key
elements be provided to aid informed decision-making at the earliest stage of
the design. He adds that designers require a multi-level approach to material
information as their information needs vary through the design process.
From the analysis, it therefore can be argued that the current problem with
material selection for the design of housing projects in Nigeria is a problem
of decision-making, which in most cases is determined by either clients’
preference or unquantified professional judgment (Oruwari, et al., 2002). This
in addition has put pressure on the outcome of the design as the cultural,
technical, environmental issues are left out at the outset of the material
assessment process. A number of studies have attempted to assess material
choice by using various network generators (Adedeji, 2010; Adegboye 2013).
Others (Abanda et al, 2014) have explored personal approaches by using a
checklist approach that requires the designer to keep a personal log of all
previous products for future reference. A major drawback however, in all
these methods are that they lack appropriate multi-criteria assessment
techniques, and thus cannot be so efficiently utilised.

74
Ofori (2004) states that the success of material selection management at the
early design stages is primarily determined by the level of awareness of the
benefits of assessing multiple key influential factors in the decision-making
process. He adds that the inclusion of such criteria in the adoption of
appropriate materials ensures the fulfillment of sustainability principles in
housing construction. It therefore suggests that material selection
management models should comprise a measure of the sustainability, wherein
materials are selected based on a wider range of decision factors.
2.7 Moving Towards Sustainable Material Selection
Material selection is a complex problem often tackled by designers in a
number of ways, and in most cases not similar to those used by other
practitioners. It involves a complex number of considerations, which can be
conflicting upon each other. Many studies (Karana et al. 2008; Ding 2008;
Castro-Lacouture et al. 2009; Spiegel and Meadows, 2010) have identified
materials selection as a key factor in the sustainability of any housing project,
and yet considerations for sustainability attributes have only recently been
introduced in the material selection decision-making process (Ashby and
Johnson, 2006). The selection of a material for a specific design necessitates
that many criteria are satisfied at the same time (Chick and Micklethwaite,
2011; Zarandi et al., 2011; Quinones, 2011). This can be a lengthy and
expensive process, and often the final selection is based on compromise
between advantages and disadvantages of candidate materials. Kibert (2008)
argue that it is often difficult for designers to cut through the hype and
determine just how sustainable low-cost green building materials are, let
alone when compared with numerous alternatives, as evaluating multiple
products for a given housing project can be a complex process. Although
there is no clearly adopted definition as to what sustainable building materials
entail, several studies (Ashby (2009a; Florez 2010; Bayer et al. 2010) have
characterized various qualities that describe them.

75
In selecting sustainable building materials for instance, one product may pose
global warming impacts while another may involve a known human
carcinogen; a third product may require large amounts of fossil fuel, but may
be more durable with the potential to last twice as long as the first two
alternatives. Florez et al (2010) have stated that the appropriate materials for
sustainable low-impact green housing design vary by impact priorities,
regional issues, project budgets, and performance requirements. Some
designers, they note, emphasize materials that conserve resources by being
reused without remanufacturing, by being extremely durable, or by closing
material loops with high-recycled content as being sustainable.
Others (Castro-Lacouture et al. 2009; Quinones 2011) place great emphasis
on low toxicity of products and emissions throughout their life cycle when
selecting materials, while others (Florez 2010; Bayer et al. 2010) regard low
ecological impacts or conservation of water as the highest priority.
Castro-Lacouture et al. (2009) tell us that Portland cement concrete for
instance may appear to be a “green or sustainable” material for those with
durability or regionally produced materials as a priority, whereas it might be
rejected by those who are concerned about the global warming impacts of
material manufacture or high embodied energy materials. Composite lumber
(a mix of recycled plastic and wood fibers) on the other hand may seem like a
good alternative to wood lumber for those concerned with the ecological
impacts of clear- cutting forestry practices, but noted that it may be rejected
for its mixed material composition by those concerned with the closed-loop
recyclability of materials. In addition to varying priorities and goals in
sustainable building material selection, Quinones (2011) also expressed that
the ideal sustainable or green building material might be a natural, renewable,
local and indigenous, nontoxic, low embodied energy material, which she
notes are very familiar attributes of LCGBMCs, but however argued that
these materials may not be feasible in all situations pending on a number of
factors.

76
She noted that LCGBMCs- despite their varied potential benefits, may for
instance not be able to perform to current construction standards, or may not
be appropriate for the scale of construction or performance requirements.
With a wide variety of priorities that determine what sustainable materials
entail comes an even wider issue of what sustainable material selection is.
Asif et al. (2007) maintain that what drives sustainable material selection is
influenced by a number of factors. They note that material selection before
the advent of sustainable development was determined mostly by cost,
appearance, availability and ease of use, but that sustainability concept has
now broadened the factors for SMS in recent times. Likewise, Bayer et al.
(2010) argue that SMS is not only dependent on the qualities of that product
but also the influencing factors that determine its choice as the most
appropriate option, hence the overall performance of that material. SMS,
according to Nwokoro and Onukwube (2011), entails accounting for all
inputs and outputs through a product’s life cycle. They argue that SMS
considers all aspects of materials entire life cycle. Ashby (2009a) and Chick
and Micklethwaite (2011) cite extensive research literature as to what factors
constitute SMS. A number of studies have looked at what factors influence
and necessitate SMS for designers aside from technical properties some of
which are; values (Trimingham, 2007; Pedgley, 1999), intangible aspects
(Karana et al., 2008), meanings (Ljungberg and Edwards, 2003; Karana,
2009; Ashby and Johnson, 2006), sensory vocabulary (Allione et al., 2012)
and perceptions (Ashby and Johnson, 2006). Other factors that influence SMS
include life span, reliability, recyclability, and resistance to damage or decay
(Trusty, 2003).
Nwokoro and Onukwube (2011) further asserted that materials selection
could play a key role in achieving ecological sustainability if it is done in
such a way as to minimise adverse impacts on natural environmental systems
as a result of using the materials.

77
They added that by using LCGBMCs, transportation costs is reduced, and at
the same time the local economy is sustained. Their argument was that
availability of regionally manufactured materials depended on the project
location, and that Ideally, heavy materials whether aggregate, concrete, or
brick should be procured within 100 miles, medium-weight materials within
500 miles and lightweight materials within 1000 miles of the project site.
They mentioned that distances between raw material extraction locations and
manufacturing/processing facilities also determine SMS. They argued that
using available regional materials and products could save time on future
projects within the same location.
Some other factors mentioned for when selecting materials include amount of
pollution generated over the life of the material as a result of its use and
availability of environmentally sound disposal options (Nwafor, 2006).
Bonnema (2006) argue that SMS will mean designers taking more notice of
the ingredients which make up a material as there are numerous potential
negative effects, such as: Toxic to human and ecological health, Cancer-
causing potential, Reproductive system disruption, Endocrine system
disruption, Sensitizer, and Mutagenicity (damage to DNA).
Kibert (2008) writes that housing projects are made more economically
sustainable through minimising the total life cycle cost of projects by
selecting material components with the lowest life cycle costs. The principal
factors identified as key to SMS in Kibert (2008) are a material’s life cycle
costs, including costs of manufacture, transport, assembly, maintenance, and
disposal or recycling. Attributes associated with SMS according to Trusty
(2003) include degree to which using the material represents depletion of
natural resources, cultural background or integrity of place, reusability of the
material, and substitutability of the material with respect to nonrenewable
resources.

78
Trusty (2003) listed some factors such as availability of materials, budget,
design brief, health and safety, design for disassembly and disposability, land
longevity. Similarly, Lewis et al. (2001) give four key factors which the
designer should aim to achieve SMS namely; abundant and non-toxic, natural
rather than synthetic, minimise materials, process and service, and maximise
use of recyclates. Ashby (2009a) give strategies for the sustainable-selection
of materials by focusing on energy and carbon breakdowns, identifying the
life phases and adopting simple metrics of environmental stress. Ashby
(2011) states that SMS means conserving material stock and enabling its
reuse. More recently, there is an evolving body of literature on intangible
aspects of materials such as material form or meaning and emotional
associations. Wastiels and Wouters (2009) provide a comprehensive list of
the key factors a designer must consider when selecting materials into seven
categories namely: (1) physical aspects, (2) appearance, (3) subjective, (4)
cultural context, (5) physical context, (6) time, and (7) money.
While there is no universally acceptable definition as to what constitutes
SMS, it is safe to say that SMS is contextual, and is influenced by numerous
factors. Therefore, the sustainability impact of LCGBMCs is determined by
what key influential factors are at play when selecting such materials. With
the complexity and confusion associated with sustainable material selection,
it is to be expected that designers require support to aid informed choices. It
therefore extends the argument by advocating the use of LCGBMCs, with
emphasis on the necessity of establishing performance assessment
mechanisms and indicators for LCGBMCs if their improved performance is
to be targeted for wider use in housing construction.

79
2.8 Summary
This chapter has demonstrated the relationship between housing construction
activities and economic growth. It was revealed that the nature of the
causality relationship between economic activities in the housing sector and
their adverse effects on the environment differ among countries due to the
differences in their geographic contexts, socio-technical settings and value
systems. Drawing extensively on the theoretical foundations of SD in the
literature studied, this paper has critically examined the importance, level of
knowledge of SD and the potential challenges of implementing SD principles
in the Nigerian housing industry. It showed that the Nigerian housing
construction industry has been rising up to the challenge of sustainability as
they are under increasing legal and commercial pressure to become more
sustainable, since past failure of professionals to adhere to the principles of
SD has resulted in the construction of housing projects of questionable
quality. A subsequent review further highlighted the need for LIGHD as a
strategic niche with the potential for wider transformation of mainstream
housing in Nigeria, with emphasis on the impacts of LCGBMCs.
Further study was conducted to gain insights into the understanding of
sustainable material selection, and to explore if and how sustainable materials
are determined, and identify what key sustainability principle indicators
(factors) influence the selection of LCGBMCs in the design of LIGHDs. It
was revealed that a wide range of factors largely influence sustainable
material selection, even though a large amount of literature still adhere to
environmental matters. One key barrier was that the data sources available for
LCGBMCs were quite limited in the adequacy of the information provided,
possibly more useful for inspirational purposes than for engaging in an
effective trade-off exercise. It was revealed that the assessment of
sustainability principles had different conflicting criteria, which suggested the
need for multi-criteria decision assessment tools.

Chapter III
Investigating current technology available for assessing building material performance in industrialised and emerging economies

80
CHAPTER 3: TECHNOLOGY IN MATERIAL SELECTION
3.1 Introduction Proven and commercialized technologies have been developed within the last
ten years to promote environmental awareness amongst built environment
professionals (Cole, 1999; Cooper, 1999; Ding, 2008), and encourage the
sustainable use of building materials in the housing construction industry.
Since then, various studies on building material selection support systems
have developed in size and specification (Trusty, 2003; Seyfang, 2009a).
Yates (2001) notes that the application of building material assessment tools
has been widely accepted as an effective and useful way of promoting
sustainable housing construction in the house build industry (Cole, 1999;
Ding, 2008). While various research institutions have developed assessment
tools that attempt to quantify and qualify the potential environmental impacts
and performance of various conventional building materials, there have been
little systematic efforts to examine the general validity and applicability of
these tools to LCGBMCs in the design of LIGHDs.
Chapter two highlighted the environmental impacts of housing construction
activities with focus on the theoretical principles for understanding the
impacts of LCGBMCs on low-impact green housing developments. The
existing practices impacting their use in housing construction, as well as their
socio-cultural, economic, environmental, ethical, and technical importance in
achieving a sustainable built environment were also discussed. Conclusions
drawn from the literature review indicated that the main bar to the use of
LCGBMCs was a lack of relevant information presented in a style familiar
and explicit to designers. Following a further review, there were requests of
how designers within the Nigerian house build industry could be supported to
integrate sustainability into the material selection decision-making process.

81
This chapter investigates the current technology used in both developed and
developing countries to assess the performance of building materials
beginning from section 3.2. The objectives of this section are to identify ways
to improve the methodology used in the Nigerian house build industry for
selecting low-cost green building materials, and examine the quantifiable and
comparable features of some selected decision-support systems so as to
identify appropriate strategies that are needed to develop the proposed
integrated modular-oriented system for the evaluation of LCGBMCs. Section
3.3 further examines the benefits and limitations of current models in
ascertaining material sustainability. Section 3.4 demonstrates the concept of
multi-dimensional approach in the assessment of material sustainability, and
thereafter discusses a conceptual framework for building material evaluation
based on a multi-dimensional approach. Section 3.5 concludes the chapter.
This chapter fulfills Objective 3 of the research study
3.2 A Review of Existing Assessment Tools With the advent of sustainable material selection and sustainable housing,
numerous resources and tools have been created to aid informed decisions
(Cole, 2003; Ding, 2008; USDOE, 2010). This section explores what
information designers require to make sustainable material selection decisions
when formulating decisions regarding the selection of low-cost green
building materials and components at the crucial stages of the design process,
and analyses what support resources exist to enable this. In this section, some
of the very few but popular assessment methods and expert tools used in both
developed and developing economies are examined in details.

82
3.2.1 Decision Support Tools in Developed Countries
ENVEST - Envest is the first UK software for estimating the life-cycle
environmental impacts of a building from the early design stage. It enables
architects and designers to evaluate the environmental impacts of different
design option for a chosen building, and considers the environmental impacts
of materials used during construction and maintenance. Envest has been
created principally to help designers compare different material options in
terms of environmental performance from the early design stages. Using
minimal data entered through simple input screens, Envest allows designers
to quickly identify those aspects of the building that have the greatest
influence on the overall impact. All impacts are assessed using Eco points, a
measure of total environmental performance, which allows the designer to
compare different designs and specifications directly. Although Envest covers
the whole phase of a building’s life cycle, it is limited to the assessment of
materials for office buildings and has more limited groups of users.
Unspecified input data and non-credible input data are the other issues
identified with Envest and its lack of flexibility in alternatives or
categorisation of materials.
BEES - (Building for Environmental and Economic Sustainability), is a
computerised tool for choosing environmentally preferable building materials
(Lippiatt and Ahmad, 2004). The BEES environmental performance
assessment is based on the LCA standards, including categorising in impact
categories, normalising by dividing by the U.S. emission per year per capita,
and weighing by relative importance. The overall evaluation involves the
environmental score and the economic score being weighted together to
achieve the most appropriate balance between environmental and economic
performance using relative importance decided by the decision maker’s
values. BEES Online, aimed at designers, builders, and product
manufacturers, includes actual environmental and economic performance data
for 230 building products (see model in Figure 3.1).

83
The BEES system however, is not capable of providing data for a full LCA of
a complete building, as it only produces data for a limited amount of building
products (Lippiatt 2007, Bayer et al. 2010). From those products, it only
considers materials that are significant in weight, energy or cost. It
categorizes a minimal set of impact categories, hence limits the flexibility,
accuracy and performance of any building product in terms of maximising its
full potentials. BEES 4.0
Figure 3.1. Sample of BEES model
Source: Adapted from The National Institute of Standards and Technology (NIST, 2011)
ATHENA - ATHENA is an LCA tool developed at the ATHENA
Sustainable Materials Institute in Ontario, Canada (Clements-Croome, 2004).
The ultimate goal of this system is to encourage the selection of material
mixes of over 1200 building materials and assembly combinations (Trusty et
al., 1998). ATHENA Impact Estimator for buildings is the only software tool
that evaluates whole buildings and assemblies based on internationally
recognized life cycle assessment (LCA) methodology. The model breaks
down the selected assemblies comprising a design into their respective
products for the purpose of applying the model's life cycle inventory (LCI)
databases that contain estimates of the environmental effects per unit of each
building product (see Figure 3.2).

84
A limitation of this tool is that it only allows the evaluation of assembly
options given that they also come with fixed dimensions (Bayer et al. 2010).
Another Major drawbacks to this tool are the cost and required skills to use it,
and the limited options of designing high-performance assemblies.
Figure 3.2. Sample of ATHENA reporting documentation
Source: Adapted from HK Buildings Department, 2005
EPM- Environmental Preference Method (EPM) was developed by Wood
/Energy, in the Netherlands in 1991, within the program on Sustainable living
at the Dutch Steering Committee on Experiments in Housing (Anderson et
al., 2009). The main goal of the model is to construct a ranking of building
materials according to their environmental impacts by positively labeling or
blacklisting a product using the matrices approach (Anderson et al., 2009).
The principle of this method takes into account different factors, such as
various damages of eco system, consumption/exhaustion of resources, energy
consumption (in all phases of production, including transport), environmental
pollution with different waste and hazardous materials, waste disposal
problems, hazardous emissions into the atmosphere, global warming, impact
on human beings, re-use and recycling possibilities, etc.

85
The result is a list of preferable materials and products, made on the basis of
evaluation of the environmental impacts of each of them, and adjusted to
typical positions within a building (Anink et al, 1996). The matrices in EPM
are however not published, and no detailed description is given of how a
specific product is assessed. This model includes environmental aspects, but
the second and third elements of sustainable materials (social and economic
considerations) are not included (as shown Figure 3.3).
Figure 3.3. Relative ranking of wall and ceiling frame systems in the EPM method
(Source: Anink, et al., 2008)
BREEAM—BREEAM (Building Research Establishment’s Environmental
Assessment Method) was developed in the United Kingdom in 1990 and is
the building environmental assessment method with the longest track record
(Peter & Somervell, 2004). BREEAM covers a range of building types
including: offices, homes, industrial units, retail units, and schools. Material
selection is based on awarding points for each criterion and the points are
added for a total score calculated based on the credits available, number of
credits achieved for each category and weighting factor. The overall building
performance is categorised as Unclassified (<30%), Pass (30%), Good (45%),
!"#$
!
!
!
!
!
!
!
!
!
!
!"#$%&'()*!"#$%&'(#!)%*+'*,!-.!/%$$!%*0!1#'$'*,!.)%2#!343!'*!&5#!678!2#&5-0!
9:-;)1#<!=*'*+>!"#!$%&'!?@@AB!
!:'*1#! &5'3! 2#&5-0! &%+#3! '*&-! %11-;*&! %$$! &5#! )#$#(%*&! %3C#1&3>! '&! 1-;$0! D#!
1-*3'0#)#0!%3!%!3C#1'.'1!1-2D'*%&'-*!-.!,$-D%$!%*0!C)-D$#2!%*%$43'3>!/5'15!#%3'$4!
%0%C&3!&-!&5#!*##03!-.!C)%1&'1%$!'2C$#2#*&%&'-*E!F5#!.'*%$!C)-0;1&!-.!678!2#&5-0!
'3! %! 2%*;%$! &5%&! 1-*&%'*3! $'3&! -.! C)#.#)%D$#! 2%&#)'%$3! %*0! C)-0;1&3>! 3-)�!
%11-)0'*,!&-!&5#')!C-3'&'-*!'*!0'..#)#*&!1-2C-*#*&3!-.!%!D;'$0'*,!%*0!'&!/%3!%$)#%04!
;3#0! %3! %! &--$! .-)! #*(')-*2#*&%$! #(%$;%&'-*! '*! 3-2#! 6;)-C#%*! C)-G#1&3!
9"%0'(-G#('1!%*0!H#0'1>!?@@ABE!
!
+,-'I!F5#!6*(')-*2#*&%$!"#3-;)1#!J;'0#!96"JB!/%3!0#3',*#0!D4!&5#!=2#)'1%*!
K*3&'&;&#! -.! =)15'&3! 9=K=B! /'&5! 1-I-C#)%&'(#! .;*0'*,! .)-2! &5#! LE:E!
6*(')-*2#*&%$! 7)-&'-*! =,#*14! 9=2#)'1%*! K*3&'&;&#! -.! =)15'&3>! MNNOBE! F5#!
6"J! '3! %! C)'*�! ,;'0#>! C)'2%)'$4! %'2#0! %&! %)15'&3! %*0! 0#3',*#)3E! F5#! ,;'0#!
1-*3'3&3!-.! %CC$'1%&'-*! )#C-)&3! .-)! &5#!0'..#)#*&!C)-0;1&3!,)-;C3E! K*!%00'&'-*>! &5#!
;3#)!'3!C)#3#*�!/'&5!%!3;22%)4!&%D$#!/'&5!&5#!2%'*!)#%3-*3!.-)!&5#!31-)'*,E!K*!

86
Very Good (55%), Excellent (70%) and Outstanding (_85%). Figure 3.4
shows sample reporting and certification pages for a BREEAM. The results
of the investigation are fed into the design development stage of buildings
and changes can be made accordingly to satisfy pre-designed criteria
(Crawley and Aho, 1999; Kibert, 2008).
Although there is no disputing that the BREEAM rating tool aid corporates
and developers improve a project’s sustainability status and enjoy
sustainability credentials, it requires capital expenditure to invest in this
costly tool. Another draw back is that the energy performance assessment
adopts the U.K Building Regulation as a benchmark to rate the level of
performance improvement, which may not necessarily apply to other regions
with an entirely different assessment structure.
Figure 3.4. Sample reporting and certification for BREEAM
(Source: Peter & Somervell, 2004)
11
CASBEE CASBEE (Comprehensive Assessment System for Building Environmental Efficiency) was developed in Japan, beginning in 2001. The family of assessment tools is based on the building’s life cycle: pre-design, new construction, existing buildings, and renovation. CASBEE presents a new concept for assessment that distinguishes environmental load from quality of building performance. By relating these two factors, CASBEE results are presented as a measure of eco-efficiency or BEE (Building Environmental Efficiency). Results are plotted on a graph, with environmental load on one axis and quality on the other – the best buildings will fall in the section representing lowest environmental load and highest quality. Each criterion is scored from level 1 to level 5, with level 1 defined as meeting minimum requirements, level 3

87
GREEN-STAR—Green Star is the most followed voluntary building
environmental assessment scheme developed in Australia to accommodate
the need of buildings in hot climates where cooling systems and solar shading
are of major importance (Cole, 1999). It is similar to BREEAM in that it
evaluates the environmental merits of building products using the credit
rating system based on a number of points allocated to the credits in order to
determine the total scoring and hence the level of certification (Crawley and
Aho, 1999; Kibert, 2008). It has a set of environmental criteria related to
management, indoor environmental quality, energy, transport, water,
materials, land use & ecology, emissions, and innovation. The building
certification is expressed as a number of stars: 1-3 Stars (10-44 points; not
eligible for formal certification), 4 Stars (45-59 points; Best Practice), 5 Stars
(60-74 points; Australian Excellence) and 6 Stars (_75 points; World
Leadership).
The disadvantage with this tool is that its use is limited to the evaluation of
lettable areas within office buildings, hence excludes areas that are not offices
or supporting the office. Moreover, the assessment structure is delineated in
Australian standards and perhaps may not apply to other regions with
different socio-technical background-given the differing views on impact
assessment. Figure 3.5, below, is a screen shot from the actual assessment
tool.

88
Figure 3.5. Screen shot from the actual assessment tool
LEED— Leadership in Energy and Environmental Design (LEED) Building
Assessment System is a performance-based tool for determining the
environmental impact of building products and facilities from the whole-
building perspective (Kibert, 2008). LEED was developed and piloted in the
U.S. in 1998 as a consensus-based building rating system based on the use of
existing building technology (Crawley and Aho, 1999; Kibert, 2008).

89
It is a green building rating system for commercial, institutional and high-rise
residential new construction and major renovation in five areas of
sustainability: sustainable sites, water efficiency, energy and atmosphere,
innovation and design process, materials and resources, and indoor
environmental quality (Zhou et al., 2010). The four levels of certification are:
Certified (26-32 points), Silver (33-38 points), Gold (39-51 points) and
Platinum (52-69 points). Figure 3.6 shows an example of LEED® Version
2.0.
Without a doubt the greatest concern regarding the LEED model is the
apparent overemphasis on environmental benefit without an equal concern for
the durability of the products employed to achieve this environmental benefit.
Unfortunately, the current LEED model makes little or no attempt to
reconcile the need to meet new and emerging environmental needs. Given the
increasing popularity of the LEED concept and the rating system’s disjointed
approach, the potential for confusion may be significant, especially for a
building owner or designer wanting to apply the LEED concept to the billions
of square feet of say roofing projects.
Figure 3.6. Sample reporting and certification for LEED
(Source: USDOE, 2009)

90
GBTool- The International Framework Committee for the Green Building
Challenge in Canada developed the GBTool in 1998 (Todd, et al, 2001). It is
designed to reflect regional conditions and context (Crawley and Aho, 1999;
Kibert, 2008). It includes criteria in categories such as Site Selection, Project
Planning and Development; Environmental Loadings; Energy and Resource
Consumption; Indoor Environmental Quality; Functionality; Long-Term
Performance; and Social and Economic Aspects. Criteria are assessed using
scales that are based on local benchmarks of “typical” practice; buildings can
score -1 if below typical practice or from +1 to +5, representing good to very
high performance. The tool itself comprises two spreadsheets, one for data
entry (to be completed by the project team) and one for establishing weights
and benchmarks and completing the assessment (to be completed by third
party sponsors or assessors).
However, since GBTool is not integrated with the life-cycle process of a
project, it is difficult for the construction professionals to use the assessment
indicators at the planning, design and construction stages of the building
process, since it is limited to use in post-construction assessment. (Figure 3.7
shows an example of CASBEE reporting documentation)
Figure 3.7. Sample reporting and certification for GBTool
(Source: Todd, et al, 2001)
14
GBTool major categories of criteria include the following: Energy consumption is assessed through total use of non-renewable energy
(embodied and operational), electrical peak demand for operations, use of renewable energy, and commissioning.
Resource consumption is assessed through materials use (salvaged, recycled, bio-based and sustainably harvested, locally produced, designed for disassembly, re-use, or recycling) and water use for irrigation, building systems, and occupant use.
Environmental loadings include greenhouse gas emissions, other atmospheric emissions, solid wastes, stormwater, wastewater, site impacts, and other local and regional impacts.
Indoor environmental quality is assessed through indoor air quality, ventilation, temperature and relative humidity, daylight and illumination, and noise and acoustics.
Other criteria include selection of appropriate site (in terms of land use, brownfields, access to transportation and amenities), project planning, urban design (density, mixed uses, compatibility, native plantings, and wildlife corridors), building controls, flexibility and adaptability, maintenance of operating performance, and a few social and economic measures.
Below is an example of GBTool documentation. References consulted for this review of GBTool included: PC GBTool, 2006; GBTool 1998, 2000, 2002, 2005; Todd, et al, 2001; GBC 1998; and SB, 2000, 2002, 2005.

91
3.2.2 Decision Support Tools in Developing Countries
Since the variance in the problems of natural resource depletion and global
environmental degradation has become evident, the interest for the cross-
cultural transferability of assessment methods is now of particular importance
to those in developing countries (Cole, 1999, Kibert, 2007). Several recent
assessment tools within the developing regions moreover, show structural
features that differentiate them from the first generation of tools in the
developed regions (Gibberd, 2002).
Gibberd (2003) mentions that since developing countries are confronted with
pressing social and economic concerns, their domestic constraints on
environmental progress have been found to be qualitatively different from
those in developed countries (Cooper, 1999). Hence, the following tools
suggest a transition towards a generation of tools that may enable assessment
of the extent to which buildings can contribute to supporting an entirely
different sustainable pattern of living in developing regions.
CASBEE- CASBEE (Comprehensive Assessment System for Building
Environmental Efficiency) was developed in Japan, beginning in 2001. This
family of assessment tools is based on the building’s life cycle: pre-design,
new construction, existing buildings, and renovation. It is a relatively new
system developed for the Japanese market that is available in English, but has
not been tested in the U.S.
Results are plotted on a graph, with environmental load on one axis and
quality on the other – the best buildings will fall in the section representing
lowest environmental load and highest quality. Each criterion is scored from
level 1 to level 5, with level 1 defined as meeting minimum requirements,
level 3 defined as meeting typical technical and social levels at the time of the
assessment, and level 5 representing a high level of achievement as shown in
Figure 3.8.

92
This system unfortunately requires documentation of quantifiable sustainable
design achievements, which are assessed by only trained, first-class
architects, which have passed the CASBEE assessor examination.
Figure 3.8. Sample of CASBEE reporting assessment result and documentation sheet
Source: Adopted from HK Buildings Department, 2005.

93
CEPAS- The Comprehensive Environmental Performance Assessment
Scheme for Buildings (CEPAS) is a holistic assessment tool for various
building types with clear demarcation of the entire building life cycle that
covers the pre-design, design, construction, demolition and operation stages.
It employs an additive/weighting approach, which introduces and organizes
performance criteria that make a clear distinction between “human” and
“physical” performance issues as well as “building” and their “surroundings
(Crawley & Aho, 1999). This manifests as eight performance categories:
Resource Use; Loadings; Site Impacts; Neighbourhood Impacts; Indoor
Environmental Quality; Building Amenities; Site Amenities and
Neighbourhood Amenities (Cole, 1999).
However, for the CEPAS assessment model, only single-ownership buildings
are eligible for assessment. Figure 3.9 shows an example of CEPAS Version
Figure 3.9. Sample of CEPAS reporting documentation
Source: Adopted from Cole, 1999.

94
SBAT- The Sustainable Building Assessment Tool (SBAT) was created in
South Africa by the CSIR (Council of Scientific and Industrial Research) in
2001 (Gibbered, 2002). SBAT provides an indication of the performance of a
building or the design of a building in terms of sustainability, and explicitly
introduces performance criteria that acknowledge social and economic issues
(Gibbered, 2003). A total of 15 performance areas are identified – equally
divided within the overarching sustainability framework of environmental,
social and economic as shown in Figure 3.10. These performance areas are
each described through 5 performance criteria in three steps namely: 1)
Setting the Project Up, 2) Entering Measurements, and 3) Reading the Report.
It also considers to a nine-stage process based on the typical life cycle of a
building: Briefing, Site Analysis, Target Setting, Design, Design
development, Construction, Handover, Operation, Reuse/recycle, is explicitly
defined in this context.
The current tool however mainly assesses building performance with little
recourse to material indicators. Since the tool is based on the overall
performance of the building, any differences in the materials used do not
affect the decisions with the result that the scheme is almost entirely unable to
differentiate between choices of materials except for indirect consequences.
Figure 3.10. Sample of SBAT reporting documentation
Source: Adopted from Gibbered, 2001.
PROJECT ASSESSMENTProject title: Date:Location: Undertaken by: Building type (specify): Residential/Community/Commercial Company / organisation: Internal area (m2): Telephone: Fax: Number of users: Email:Building life cycle stage (specify): Design/Construction/Operation
Social 1.0 Economic 1.4 Environmental 1.2
Overall 1.2
SUSTAINABLE BUILDING ASSESSMENT TOOL (SBAT- P) V1
0.00.51.01.52.02.5
Occupant Comfort
Inclusive Environments
Access to Facilities
Participation & Control
Education, Health & Safety
Local Economy
Efficiency
AdaptabilityOngoing Costs
Capital Costs
Water
Energy
Waste
Site
Materials & Components

95
Although the reviewed tools in both developed and emerging economies have
an extended use in the built environment, various authors (Ding 2008; Zhou
et al., 2008) have established a strong credibility amongst expert/knowledge-
based tools and emphasised their need in dealing with material selection
problems using different assessment techniques. The following section
examines some examples of existing expert/knowledge-based tools.
Appendix O presents a comparative analytical summary of the reviewed
building assessment tools. It offers comparative details on each of the rating
systems based on a range of criteria

96
3.2.3 Building Assessment Methods: Knowledge-Based Tools
In recent years, expert/knowledge-based tools have dominated research in
computerised housing construction management in a bid to supplement first
and second generation decision support models.
Some examples like Mahmoud et al’s (1996) work is accredited as being one
of the pioneers of DSS applied to materials selection problems. They
developed a multi-criteria knowledge decision model for quantitative cost
analysis. This system was designed for the selection of finishing materials
such as floors, walls and ceilings with the objective to operate at the least
cost. What this study does not provide are links, information or tools to aid
the designer with material decision-making. Although it gives a very brief
introduction to floor, wall and ceiling materials, some of the common
material types are listed but with little information. No specific information
methodology was given for evaluating such materials but strategies are
explained as to how to improve materials selection choices.
Other influencing reviews within the scope of this study include Mohamed
and Celik (1998) who proposed a computerised framework that is responsible
for evaluating alternative design options, and cost estimation of materials for
residential buildings. The program’s data utility enables users to intuitively
choose their most preferred option from list of materials. No mention was
however made as to the MCDM technique used for evaluating the list of
materials selected. It was also found that the existing framework is limited to
the cost considerations of material choice and fails to include values such as
aesthetics, and cultural aspects.

97
Lam et al. (1999) took Mohamed and Celik’s (1998) work a stage further and
suggested that materials management systems should be integrated into
appropriate computer systems, which could assist in the design of the project.
It was suggested that the decision-making process in the choice of materials
could be quantified, measured and improved by using a software package.
The Methodology structure employed was proposed to be the most
appropriate method to develop an efficient and effective materials selection
system. It was emphasised that because simulation tools emulate human
decision making skills, the recommended outcomes of the system more
accurately reflect real life solutions. What Lam et al.’s (1999) study fail to
acknowledge is the huge and long-term impact of professional judgment on
overall building performance, as limiting the choice of materials to just the
specification of systems would impede the discovery of design opportunities
inherent in designers judgment.
Perera and Fernando (2002) reinforced Lam et al.’s (1999) proposal by
developing a computer-based cost modeling material management system for
roofing material selection. This software was claimed to include 35 to 50
percent of decision-makers input, over and above normal computerised
materials management systems. Evidently, this work indicates that
supplementing designers’ decision using DSS can reduce management time
and subsequently decrease associated materials selection management
problems at the crucial stage of the design. Although the model acknowledges
the input of the designer in the selection of materials it does not encourage the
integration of a broader range of factors into the material selection process.
Further results however, demonstrated large inconsistencies in the evaluation
process, as no particular reference was made as to the MCDM selection
methodology employed.

98
Ashby and Johnson (2002) proposed a knowledge- based system for assessing
aesthetic attributes such as transparency, warmth, and softness in the material
properties list for product designers. Within the discipline of architecture,
however, the intangible qualities of materials are not described and mapped
within the current design models. No selection framework was provided to
support the implementation of the system. Although it gives a little
information on each of the material types outlined, it however does not
demonstrate how to source these materials.
Keysar & Pearce (2007) demonstrated in their study how material selection
tools could facilitate the innovation diffusion process and radical decision-
making transformation. They developed a Decision Support Tool (DST) for
green building to facilitate selection of material selection tools among new
adopters on public sector project for architects and engineers selecting
materials for designs. Their research seem to imply that designers choice of
an appropriate DSS determines informed decision in material choice, hence
do not choose for materials but rather for material systems. The system does
not provide assistance for material comparisons, advice on material properties
or recommendations for tools to assist in the evaluation of sustainable
materials.
Zhou et al. (2008) developed a decision support multi-objective optimization
model for sustainable material selection. The material selection tools and
material data sheets provide extensive information that include factors such as
cost, mechanical properties, process performance and environmental impact
throughout the life cycle. The tool however, lacked the considerations or
descriptions to evaluate the intangible aspects of building materials, which
are also important to architects. Although the tool tended to be defined to
include both technical and non-technical aspects, generally the former was
covered more

99
Wastiels and Wouters (2008) proposed a qualitative and quantitative
framework to support informed decisions based on ‘physical’ and ‘sensorial’
aspects of building materials, but without the tools integration and
computerisation. In the presented framework, no pronouncement is made
upon how sustainable considerations from these different categories could
influence each other, and what MCDM approach could possibly be used if
developed.
Ashby and Johnson (2006) further developed a creative framework to aid
industrial designers select materials which should enable material and process
information to be captured, presented creatively, allowing browsing and
searching along with the ability to identify technical and perceived material,
process and product attributes. Although the technical dimension of the
material selection process was discussed, it was surprising to find more focus
given to technical considerations. Designers are required to consider many
factors as determining the choice of materials using the single-criterion
approach would mean depriving designers of the use of diverse materials
available.
Gehin et al. (2008) created and developed a tool designed to assist designers
to optimise end of life considerations of materials, providing information
tailored towards remanufacturing. It is designed to enable designers to
evaluate the environmental impact of the products and its components. Its
presentation style lacks graphics and would appeal more to engineers than
designers or architects, as the majority of the products appear to suit an
engineering application.
More recent concepts introduced and utilised in the materials evaluation
domain include the combination of a Decision Support System (DSS) with
knowledge-based MCDM techniques, The research by Rahman et al. (2009)
developed an integrated knowledge-based cost model for optimizing the
selection of roofing materials and technology for residential housing designs.

100
It was hypothesised that using Technique of ranking Preferences by
Similarity to the Ideal Solution (TOPSIS) could deal better with uncertainty
that is naturally present in decision-making processes when selecting roofing
materials at the early stages of the design. The framework presented is only
designed as an evaluation tool to assess the cost sustainability of roofing
materials once they have been selected. Very little precise information is
given about the technical, socio-cultural and environmental issues.
A process framework for building design was further proposed in Loh et al.,
(2010). They developed an ICT system to support multi-stakeholder decision-
making which facilitates inclusion of energy issues when selecting building
products at the early design phase of buildings based on users preferred
weightings. Preliminary results would suggest that the AHP approach used
could make a significant impact upon the choice of materials. The model
proposed by Loh et al. (2010) rank-orders a set of preselected, technically
feasible materials using different decision factors with and without tangible
values, such as a clients favour over a particular building design, publicity
potential of the building design, life cycle cost, capital cost and energy
performance of different materials and building layouts. Issues of
sustainability are covered by a number of criteria but what is lacking is the
information on how to select sustainable materials.
A similar study by Ding (2010) developed a comprehensive assessment
decision support system that measures the life-cycle environmental
characteristics of a building product using a common and verifiable set of
criteria and targets for building owners and designers, to achieve
higher environmental standards. Upon analysis it was found that her study
appears to only direct sustainable material selection towards environmental
issues.

101
Hornbuckle (2010) presents a visualisation designed to map the links between
designers, other actors involved in secondary material supply, secondary
material types and the material cycle. The framework gives methods to source
secondary materials, on a scale from quite easy (ask distributor) to
particularly challenging (investigate and experiment with problem secondary
material and close the loop) /the methods are each linked to the necessary
supplier; such as distributors, manufacturers, and factories. The secondary
material is presented hierarchically depending on the quality, with high
quality closed loop at the top and problematic contaminated at the bottom.
The understanding of material sustainability amongst designers was found to
be limited to the material production and end-of-life phases.
The Building Information Modeling System (BIM, 2013) was developed as
the most common denomination for a new way of approaching the design,
construction and maintenance of buildings. It is designed to aid decision-
makers in the planning and design phase of the project, extending throughout
the building life cycle, supporting processes including cost management,
construction management, project management and facility operation. The
most benefits of applying BIM in design phase are cost reduction and control
and time saving by improving productivity, better coordination and reduced
error, and rework (Bryde et al 2013). Although the potential of using BIM
models for energy simulation is well known, a systematic approach that can
be used to share the necessary information is still lacking (Young, et al 2009).
From the above analyses it is clear that the starting points and expectations of
the reviewed expert/knowledge-based assessment methods are qualitatively
and quantitatively different from those of the first and second generation of
tools used in industrialised and emerging economies. By highlighting the
different sustainable building material assessment tools, it can be deduced
that there was very little consistency in the methodologies used from one tool
to another.

102
Although reference is made to sustainability criteria and issues in each of the
reviewed tools, the fundamental underpinnings regarding relative and
separate scoring of the individual criteria are different from those currently
deployed in assessing sustainable performance in developing countries. While
few may still query the proliferation of assessment tools in the housing
construction industry, it can be noted that each of the individual tool reviewed
is dispersed and founded on individual initiatives without a unified consensus
based framework. The following section highlights some of the problems
common to the reviewed tools.
3.2.4 Limitations of the Reviewed Assessment Tools
In relation to the existing tools, this research presented an extensive review of
the characteristics for a number of material evaluation tools used in both
developed and developing countries. It also identified the different material
selection indicators used in each tool. From the analysis the following issues
were identified as part of the problems associated with existing DSS.
• Regional Variation: One of the weaknesses identified with the reviewed
tools is that most of them were developed for local use and so, do not allow
for international, national or regional variations. Potential DSS models often
have to be adjusted according to the background of the intended region, since
the variance of climate, natural resources and economic situation in different
regions do not permit a universal or standard approved material assessment
system. However, the proposed integrated modular-oriented model is to be
developed for flexible use so that users who intend to apply such model to a
different environment are able to do so with minimal adjustments.

103
• Complexity: Most of the reviewed assessment tools required large
quantities of detailed information to be assembled and analysed, which can be
very confusing to use and hard to understand due to the complexity of the
information displayed and calculated. Having too many information to deal
with as in the case of the BEPAC and GBTool could jeopardise their
usefulness in balancing between completeness in the coverage and simplicity
of use. The databases of the proposed model would be split into modular units
or compartments to allow for ease during the evaluation process.
• Life cycle approach: Some of the reviewed tools from the literature are
only applied at a specific point in time, as most tools fail to take a life cycle
approach, and target conditions only during the final design or operation
stage. The envisaged model will be designed to accommodate issues relevant
to the decision-making process from the earliest stages of the design, since
decisions made at the initial stages of the design have greater impacts on the
performance of the building than when considered at the final design stage
• Financial and Socio-Cultural issues: Most building material assessment
tools such as; BREEAM, BEPAC and LEED focus on the evaluation of
building products against a set of environmental criteria but do not include
cost and socio-cultural considerations in the evaluation framework. This often
contradicts the ultimate principle of building projects, as minimizing the cost
of materials is fundamental to all building projects. Attention will be given to
both the economic and socio-cultural dimensions of the SD principles, since a
project that may be environmentally sound could be very much expensive to
build and most often not compatible with the life-style of its users.
• Evaluation of quantitative and qualitative data: Quantitative criteria
such as energy and water consumption can be readily evaluated based on the
total consumption level and points awarded accordingly. In using models
such as BREEAM, and LEED, qualitative criteria such as aesthetics, health
and safety, are difficult to evaluate.

104
In most existing tools, quantitative and qualitative data are normally
evaluated on a `feature- specific' basis where points are awarded for the
presence or absence of desirable features, which largely undermines the
importance of qualitative criteria within the decision-making process. This
study is to examine various assessment techniques and adopt the most
appropriate material assessment technique that can adequately deal with both
quantitative and qualitative elements of the material selection process.
• Weighting alteration: Generally, most existing building material
selection frameworks provide a default weighting system, which encourages
users to change the weights based on regional differences. Individual country
teams often establish scoring weights subjectively when evaluating building
products, which is often a problem when applied to other regions. Since the
default weighting system can be altered, there is likelihood that users may
manipulate the results to improve the overall scores in order to satisfy a
specific purpose. The weighting of the criteria would thus be derived on a
project-by-project basis and reflect the objective of the potential users and
relevant stakeholders.
• Clarity of intentions: The notion of “material assessment” implies
uncompromised accuracy, objectivity and transparency in defining the
performance indicators and matched by an equally rigorous process of
evaluation. However, the need for clarification and distinction between the
role of a tool as an assessment model measuring performance and progress
from their role as encouraging market transformation is symptomatic of a
wide range of existing support systems. This suggests the need for greater
clarification of the overall goals and objectives when developing the
envisaged resource for LCGBMCs.

105
While there may seem to be claims that existing building assessment tools
provide limited pre-processed rules of thumb (Selkowitz et al. 2009), there
are great advantages to their application in the housing construction industry.
The points in the following section primarily relate to the lessons learnt from
the reviewed tools and their potential role in facilitating the development of
the envisaged model.
3.2.5 Strategies Derived from the Reviewed Assessment Tools
The following have been identified as potential strategies that will be
implemented during the development of the envisaged model
• Holistic/ Integrated modular-oriented approach: The review of the
tools in the contexts of both the developed and developing countries in
sections 3.3.1-3.3.3 suggests that interventions to support sustainable
development in developing countries must address environmental, social, and
economic issues as a holistic priority. It is thus suggested that the resource to
be developed for the evaluation of LCGBMCs in the design of LIGHDs must
ensure maximum beneficial environmental, technical, socio-cultural,
sensorial and economic impacts in the decision-making process, rather than
concentrating on the more conventional approach of minimising either
environmental or economic impact.
• Participation: From the reviewed literature it was observed that some of
the stakeholders had little to contribute in how development of existing
assessment tools may have occurred. In order to ensure that the proposed
assessment support tool and invariably, the development reflect the needs and
priorities of the target groups it will benefit, this study is to ensure that they
are appropriately involved in the development process through interviews and
surveys.

106
• Indigenous systems: The study revealed that developing countries have
highly evolved indigenous systems that are sustainable and relevant to the
development of any system. These include technological, organisational,
cultural and knowledge systems. These can provide highly valuable models
for sustainable development as they would provide working models that can
be drawn on during the development process. Developing of the system
therefore would not be created in isolation to potential users and local
communities hence would be designed to be responsive to local needs,
knowledge and opportunities.
• Sustainability principle indicators (Key decision/influential factors):
Sustainability Principle Indicators are used to measure progress towards
achieving the sustainability objectives. One of the overarching goals from the
reviewed studies is that design and building professionals must ensure that
the decisions made at the crucial stages of the design process are able to
support sustainable development through the identification of multiple key
decision factors. A range of indicators has been identified from the literature
and professional practice, which would be used to measure the sustainability
of LCGBMCs in the design of LIGHDs. A representative list of potential
indicators is to be compiled in chapter 5. In the sustainability index,
stakeholders will have the opportunity of identifying the criteria and sub-
criteria that concern them most in the evaluation framework. Additionally,
stakeholders will also participate in deriving weights and ranking factors
through questionnaire surveys to reflect the level of importance of criteria and
sub-criteria during the feasibility stage of the system. A separate set of
contextual considerations would also be developed as a heuristics base to
facilitate specific feasibility and appropriateness testing of each material
choice. Algorithms would be made available in the literature to determine the
authenticity of each heuristic.

107
• Weightings: Users weightings will be employed to supplement their
decision-making process but not to supplant human judgment so as to
determine the importance of each sustainability attribute or factor.
Weightings are included to authenticate the final material choices. It remains
the ultimate material selection criteria, as no laws or process currently exist
that determines sustainable material selection and design. By incorporating
user weightings into the selection process, the methodology would gain
greater acceptability to the user who supplies the weightings, so that a
customisation of the sustainability of the final design product can occur.
• Modular concept: The assessment framework aims to ensure that the
right sustainable development objectives are set in terms of the state of
knowledge and technology, the context, project, and stakeholders. This study
aims to make sustainable material selection directly relevant to buildings and
construction by breaking the components down into easily implementable
steps and processes, which in turn would be integrated into a holistic model
of low-cost green building materials and components. Since the components
of the framework would consist of distinct information and features, each
database may be developed independently into modular bits, so that data may
be added as they are acquired to supplement the knowledge and databases.
This is to ensure that each component of the framework is accurately and
independently updated without disruption or interference of other units.
The foregoing section has identified some of the strategies and features that
will be implemented in the development of the envisaged evaluation decision
support model for LCGBMCs. The following section elaborates on different
existing evaluation techniques in material selection and management.
108
3.3 Existing Techniques in Material Selection Godfaurd et al. (2005) has stressed that the use of a proper material
assessment or evaluation technique can be a powerful resource for builders
and designers in sustaining the decision process and supporting an assertive
choice. As a result, numerous material selection and assessment techniques
have been developed to support the decision- making process. Some of the
pros and cons of various evaluation techniques in use are examined below in
order to identify the most appropriate option for this study.
3.3.1 Environmental Valuation Techniques
Van Pelt (1994) has noted that valuing environmental resources means using
market forces to determine resource allocation and ensure less wasteful
consumption. He explained that putting value on environmental assets limits
environmental degradation and promotes its protection. One of such methods
used to assess the selection of materials as the environmental costs and issues
are considered during the decision-making process is the environmental
valuation technique. In this process a monetary value is put on the
environmental effects of economic decisions, to provide a framework for
comparing the environmental loss with economic gains (van Pelt, 1994;
Boyd, 2007). The various techniques of assigning monetary values to
environmental benefits include:
• Market valuation of the physical effects method: Here, the market
valuation of physical effects observes environmental changes in physical
terms and the differences are estimated accordingly.
• Stated Preference: This method is used to obtain values of
environmental assets by asking people directly to place monetary values
on environmental issues such as the value of preserving a forest.

109
It is often a questionnaire-based social survey used to obtain individuals'
willingness to pay for an environmental gain or to accept compensation for
a loss (Turner et al., 1994).
• The revealed preference method: This method involves the
examination of people's behaviour to the environment. It is based on
surrogate markets, which act as a proxy for the missing environmental
goods and services in the market. Some of the advantages of the
environmental valuation technique are as follows:
• Can help to stimulate environmental awareness, justify a decision, and
evaluate regulation so as to indicate relevance to macroeconomic
objectives and to determine compensation.
• This approach helps to place an upper limit on resource usage and
allows a trade-off process to establish market prices by which resources
are allocated.
• It allows the decision-maker and general public to realise the potential
damage and, in the process, highlights the importance of environmental
conservation and its incorporation into the decision- making process.
Despite their advantages, several issues still plague the environmental
valuation technique. Below are some of the weaknesses of the
environmental valuation techniques:
• The usefulness and accuracy of environmental valuation techniques is
highly controversial. Environmental effects have no natural units of
measurement, as it is difficult to translate them into economic valuations
and bring them into national account calculations

110
• Environmental damages are multidimensional and too complex to be
evaluated using these techniques. In other words the benefit of the
environment to society is too complex to be captured by a single dollar
value and any attempt to do so may underestimate the importance of the
environment
• Most environmental valuation techniques are single-dimensional,
therefore unsuitable for evaluating multifaceted ecological impacts. For a
technique to be useful and adequately address environmental issues, such
technique needs to be more diverse to embrace and address the complex
nature and issues of the environment.
• Since the techniques rely heavily on an individual's view rather than
actual market behaviour, there is likelihood that such approach may result
in biased assessment
• Most valuation methods require extensive data collection, which is
lengthy, costly and time-consuming
3.3.2 Life Cycle-Cost Analysis (LCCA) Technique
Life Cycle Costing (LCC) according to Boyd (2007) is an economic
evaluation technique used when quantifying the cost related to a product
during its life cycle. The concept covers the total cost performance of an asset
or product over time, including the acquisition, operating, maintenance and
disposal cost (van Pelt, 1994). The development of LCC has its origin in the
normative neoclassical economic theory which states that firms seek to
maximise profits by always operating with full knowledge (cited in Gluch
and Baumann, 2004). This theory seeks consistent preferences from decision
makers and reminds them of the need to know the long-term economic effects
of their preferences (Caroll and Johnson, 1990). Following are some of the
advantages of environmental valuation techniques:

111
• LCC aims at translating all impacts (including environmental impacts)
into a single unit of measure -monetary unit.
• LCC covers the total cost performance of an product over time
There is however some problems associated with the LCA method of
analysis. The identified weaknesses are that:
• Life cycle cost analysis, as a single dimensional tool is insufficient to
consider environmental effects, as it is limited to dealing with quantitative
data for discrete choice problems.
• LCC in its present form is too limited for efficient use and the input
data is not sufficient for a complex assessment approach with the wide-
range of available materials on the market
• The money value attached to LCCA results in bias and loss of
important details which in turn limits the decision maker’s possibility to
obtain a comprehensive view of environmental problems
• It over-simplifies multi-dimensional environmental problems since it
assumes that everything can be expressed as a one-dimensional unit, such
as monetary figures.
3.3.3 Life-Cycle Assessment (LCA) Technique Life-cycle assessment, or LCA, is a methodology that evaluates the
sustainability of products by identifying and quantifying energy and materials
used and wastes released over its entire life-cycle (Trusty 2003). In building
construction, an LCA is generally conducted over the full building life cycle,
including materials manufacturing, construction, operation, and
decommissioning. LCA is generally accepted as a functional tool that
quantifies environmental impacts and performance of systems (Trusty 2003,
Ljungberg 2007, Abeysundara et al 2009, Bayer et al. 2010, and Florez 2010).

112
Although LCA is relatively new to the building sector, it has been used
extensively since its conception in the 1960s.The International Organization
for Standardization (ISO) 14040 series describes four general steps to be
performed in any LCA: goal and scope definition, inventory analysis, impact
assessment and interpretation. The goal and scope definition phase defines the
process or product to be assessed, and identifies the level of detail of the
analysis to be performed, and the impact categories to be evaluated (Bayer et
al. 2010, BDC 2005).
The inventory analysis step quantifies and categorizes the inputs and outputs
of a system, that is, energy and materials used and the emissions to air, water,
and land. This phase is also known as the life-cycle inventory (LCI) phase
(Bayer et al. 2010, BDC 2005). The impact assessment portion of the LCA
process translates LCI information into specific environmental indicators or
impact categories, such as global warming, eutrophication, and smog
formation. Impact assessments differ from one LCA tool to another since it is
based on the judgment and value of impacts.
One important advantage is that LCA is highly advocated because it is
transparent and multi-dimensional in demonstrating the trade-offs required to
properly select product, components, systems, and assemblies of a project
(BDC 2005). As it follows, there are certain disadvantages of LCA
• At its current stage of development, there are not enough economic
incentives for the building community to accept it as a selection
support system, as it generally consumes more time and resources
than it saves for building projects;
• Databases can be inaccurate, incomplete or too generalized, requiring
the decision-maker to use multiple sources while drawing more
assumptions to the analysis;

113
• In addition, many LCA experts debate the impact assessment methods
and the practice of weighing them. Since the methods used to translate
and quantify inventories into impacts vary by the complexity of the
impact category, information can be interpreted with inconsistency;
• More than 75% of users are identified to be lacking experience in bid
estimating. This can heavily influence the reliability of results as the
learning curve for the majority of the students is at its origin
• Finally, the lack of benchmarks limits data available, resulting in
unnecessary repetition of complex work;
An extensive study of the LCA method of analysis, its benefits, consequences
and limitations can be found in Quinones (2011)
Consequent of the need to incorporate both quantitative and qualitative issues
into the material selection decision-making process, applying market prices to
determine the suitability of a product has become more and more
questionable. Ding (2008) has noted that much advantage lies in the rigour of
a technique that is able to evaluate different scenarios (whether quantitative,
qualitative or both) using a range of variables that are significant to the
analysis. Given the limitations of the previously reviewed techniques, the
following section draws a comparison between the two most commonly used
assessment techniques in order to identify and choose the more appropriate
and effective material assessment methodology relevant to this study.

114
3.3.4 Single or Multiple Dimensional Evaluation Technique?
Single criterion evaluation techniques have dominated project appraisal since
World War II and were mainly concerned with economic efficiency (Nijkamp
et al., 1990; van Pelt, 1994). Cost benefit analysis (CBA) has been described
as one of the leading models in this respect and a well respected appraisal
technique widely used in both private and public development to aid
decision-making, since its decision-making process is based on finding the
alternative with the highest net monetary value. This approach has however
been criticised by many scholars (Van Pelt, 1994; Hobbs and Meier, 2000)
who consider it inappropriate, since it regards financial return as the only
concern in project development, knowing that the project or product that
exhibits the best financial return does not necessarily mean the best option for
the environment. Van Pelt (1994) noted that using only one assessment
criterion should not be regarded as a correct approach, as decision-making in
reality is rarely based on a single dimension. He argued that since there are
many environmental and social considerations underlying sustainable
development, it is impossible to quantify such elements in monetary values.
Due to a strong tendency towards incorporating multiple criteria and
objectives in product appraisal, there is now a need for more appropriate
analytical tools for analysing conflicts between objectives. Multi-Criteria
Analysis (MCA) has become one of the most powerful methodologies in
optimisation analysis (Papadopoulos and Karagiannidis, 2008). Unlike the
single-criterion approach, MCA techniques offer the possibility of accounting
for non- efficiency criteria as well as non-monetary building impacts, and can
address subjective views of various parties in society (Van Pelt, 1994; Hobbs
and Meier, 2000). It is particularly useful for those environmental impacts
that cannot easily be quantified in terms of normal market transactions.

115
MCA, according to Van Pelt (1994), transfers the focus from measuring
criteria with prices, to applying weights and scores to those impacts in order
to determine a preferred outcome thus, avoiding the ethical debates
surrounding the issues of monetary valuation, as environmental matters are
largely priceless and unique. It is a more flexible methodological approach as
it can deal with quantitative, qualitative or mixed data for both discrete and
continuous choice problems and does not impose any limitation on the
number and nature of criteria. MCA as a utility approach has been structured
in such a way that public participation can be readily included to review the
results and identify areas of agreement and disagreement in terms of criteria
selection, alternative evaluation and weighting assignments through
questionnaires. Undoubtedly, the use of single dimensional approach in
determining the choice or performance impacts of a material presents some
challenges that undermine its use.
Since this study intends to deal with multiple-dimensional arrays of data,
where externalities and intangibles would be common, and given that the
engagement of conventional single dimensional evaluation techniques such as
LCC and credit award systems are insufficient in assisting decision-makers
evaluate the complex nature of sustainability in the material selection
decision-making process, the Multi criteria analysis (MCA) approach would
be adopted for use in this study, as a more realistic and ideal assessment
methodology in dealing with the increasingly complex nature of the material
selection problems. The Principles and concept of MCA are discussed
hereafter.

116
3.4 Adopted Technique: Multi-Dimensional Approach
A multiple dimensional model comprises a set of techniques dedicated to the
examination of relationships amongst multiple variables, which are random
but interrelated so that their different effects can be meaningfully interpreted
(Singh et al., 2007). Ding (2008) notes that most of the differences between
the various multi-criteria evaluation methods arise from the arithmetic
procedures used as a means to aggregate information into a single indicator of
relative performance. She added that the use of such mathematical models to
predict impact on each of the attributes lies at the heart of the MCA process.
Figure 3.11 shows the conceptual framework of a multiple dimensional
decision model of building material evaluation and selection process.
Figure 3.11. Multiple dimensional decision model of building material evaluation and selection
Source: Adopted from (Nijkamp et al., 1990)
The diagram above gives a step-by-step description of a multiple dimensional
approach of material selection. In the MCA process, each stage supplies
additional information and participate in the feedback loop to provide further
information for a more precise consideration for the forthcoming stage(s).
Each of these stages is described as follows.
!"!#
!"#$%&'&(!"()*'(+%+),!",-!$!).(!"&'/(,0'(-,+'&(1"(,"(,-+1$%)'(,++'++2'")(,3301,#*(
,"&( ,0'( #12-!"'&( !")1( ,( #1231+!)'( !"&'/( )1( 0,"4(2,)'0!,$( 13)!1"+( 510( -%!$&!"6(
3017'#)+( ,)( )*'( &'+!6"( +),6'8( 9*'( 3%031+'( 15( )*!+( 0'+',0#*( !+( )1( &':'$13( ,(
2,)*'2,)!#,$(21&'$( .!'$&!"6( ,( +!"6$'( !"&'/( ,$$1;!"6(2,)'0!,$( ,$)'0",)!:'+( )1( -'(
0,"4'&8(<'),!$(15()*'(2,)*'2,)!#,$(21&'$(!+(&'+#0!-'&(!"(#*,3)'0(+':'"8(
(='"'0,$$.>( 2,)'0!,$( ':,$%,)!1"( 61'+( )*01%6*( +':'0,$( &!+)!"#)!:'>( !")'0?0'$,)'&(
+),6'+8(9*'($!)'0,)%0'(&'+#0!-'+(2,".(21&'$+(510()*!+(301#'++(-%)(21+)(15()*'2(%+'(
+!2!$,0(,"&>(,+(&!+#%++'&>(5$,;'&>(,3301,#*'+(@A!74,23(!"#$%&'(BCCD>(E,"++'">(BCCFG(
:,"(H'$)>(BCCIG(J1--+(,"&(K'!'0>(FDDDG(LMNO>(FDDBP8(Q!6%0'(R8I(+*1;+()*'(21&'$(
,&13)'&(!"()*!+(0'+',0#*8(9*'(':,$%,)!1"(301#'++(510(,(-%!$&!"6(2,)'0!,$(;!$$("1)(-'(
+''"(,+(,(+!23$'( $!"',0(301#'++(-%)( 51$$1;+(,(#.#$!#(",)%0'( @A!74,23(!"#$%&'( BCCD>(
E,"++'">( BCCFG( S'")!:'6",( !"# $%&'( FDDFG( <!"6>( FDDTP8( U,#*( +),6'( #,"( +%33$.(
,&&!)!1",$( !"5102,)!1"( 3,0)!#!3,)'( !"( )*'( 5''&-,#4( $113( )1( 301:!&'( 5%0)*'0(
!"5102,)!1"( 510(,(210'(30'#!+'(#1"+!&'0,)!1"( 510( )*'( 510)*#12!"6(+),6'(10( +),6'+(
@A!74,23(!"#$%&'(BCCDG(<!"6>(FDDTP8(
(
((
(
(
(
(
(
(
(
!"#$%&'()*(K%$)!3$'(&!2'"+!1",$(&'#!+!1"(21&'$(15(-%!$&!"6(2,)'0!,$(':,$%,)!1"(,"&(+'$'#)!1"(O1%0#'V(W&13)'&(5012(@A!74,23(!"#$%&'(BCCDP(
<'5!"!"6(301-$'2+'
Q102%$,)!"6(,))0!-%)'+>(61,$+(,"&(1-7'#)!:'+(
M&'")!5.!"6(,$)'0",)!:'+(
M&'")!5.!"6(#0!)'0!,(
W++'++!"6(!23,#)(
U+)!2,)!"6(;'!6*)(
<')'02!"!"6(+#10'(
L',#*!"6(,(#1"#$%+!1"(
Q''&-,#4(

117
3.4.1 Defining Problems
Building material evaluation usually starts by defining a problem then
formulating material attributes, objectives and goals (van Pelt, 1993; RICS,
2001). At this stage, the problem is structured to provide adequate
specification of objectives, so that attributes can be identified. Nijkamp et al.
(1990) and Ding (2008) note that early identification of material constraints is
critical to developing a more precise set of alternatives in order to optimise
the best solutions.
3.4.2 Identifying Alternatives
The next step of the MCA process is to identify alternatives, based on the
identified problem. At this stage, the list of feasible alternatives is identified.
Alternatives may include design alternatives, location options, material
options and technology.
3.4.3 Identifying Criteria
Next, the evaluation criteria are defined following the identification of
material alternatives. The decision model eliminates those that are less
important based on their weighting scores. The criteria are used as guidelines
to analyse impacts from each material alternative (Nijkamp et al., 1990; Ding,
2008).
3.4.4 Assessing Impacts
At this stage, each criterion is measured using the most appropriate method
for its nature to reflect its relative importance against each alternative (Saaty,
2001). It involves expressing impacts in numeric terms and information may
be presented in an evaluation matrix with alternatives set against criteria in a
spreadsheet (Saaty, 1994).

118
3.4.5 Estimating Weights
In material evaluation, choosing an option from a list of alternatives means
that priorities must be set and weights assigned to each criterion, reflecting
each criterion's priority. Nijkamp et al (1990) and Saaty (2008) suggest that
various methods of estimating criteria weighting include direct estimation-
which involves the expression of relative importance of the objectives or
criteria in a direct way through questionnaire surveys, or the indirect
approach where Weights are obtained through estimating actual previous
behaviour derived from ranking alternatives or through an interactive
procedure of obtaining weights by questioning the decision-maker and other
involved parties.
3.4.6 Reaching Conclusions
Finally, decisions are made according to the score of each alternative. This
stage provides further information to select the most appropriate of all ranked
alternatives that satisfies or meets the ultimate objective(s) (Ding, 2008).
Given the previous discussions on the trend towards multiple criteria in
material appraisal, it is therefore necessary that this study identify a Multi-
Criteria Assessment technique (MCA) that facilitates multiple dimensional
assessments of criteria to aid informed decision-making when selecting
LCGBMCs for LIGHDs. In order to avoid inconsistencies across jurisdictions
regarding what MCA techniques may be properly applied to a particular
problem, and identify the technique that most applies to this study, detail
description of various MCA methods available is provided in chapter six. The
rationale for choice of the MCA method is also discussed in the same chapter.

119
3.5 Summary
This chapter has fulfilled the second objective of this research. It reviewed
some selected collection of publications to establish the key integration
perspectives that current material DSS have embraced, and to establish an
initial view on how integration has improved decision support performance
and sustainable thinking in the building development processes, not only in
the sense of what support DSS can provide, but also in the way how the
decisions are made in a sustainable manner. While the primary purpose of
existing DSSs is to improve the performance of individual decision maker,
the study demonstrated its advantages in providing consistent, coordinated,
active and global support for multiple users to fast respond to varied decision
requirements resulting from dynamic situations in various contexts. It also
established the ambiguity and limitation of traditional approach to material
selection, along with a critique on the existing assessment tools.
A further study examined the emergence of valuing material choice using a
non-monetary approach in lieu of the conventional market-based approach.
The inherent weaknesses in the conventional market-based approach
suggested that the MCA approach was an ideal model for this study since it
allows information from heterogeneous qualitative sources as opposed to the
single assessment approach. The reviewed studies however, revealed little
literature that exists on how designers could apply MCA techniques when
selecting LCGBMCs for LIGHD projects. The identified lack showed that
there were requirements for greater communication between members of the
various design teams, since most of the tools reviewed had no direct
indicators that were specifically relevant to the impacts of LCGBMCs. This
indicated the need for an alternative resource that will provide designers with
a range of appropriate informed data with which to aggregate the
sustainability impacts of considered options with regard to the key factors, so
as to resolve complex materials selection problems. The next chapter thus
elaborates on the research methodology adopted to fulfill this objective.

Chapter IV
Research design, methods and strategies

120
CHAPTER 4: RESEARCH METHODOLOGY
4.1 Introduction A broad, but focused literature review was carried out in chapters 2 and 3,
with the aim of gaining new knowledge and generating new directions to
further the study. One of the established critiques was that most existing tools
are established on the case- based reasoning of the developer and the country
in question. It was also found that current knowledge within the context of
this study is limited and purely theoretical. Unfortunately there were many
research questions that could not be answered by the literature review alone.
Following this lack, it was decided that it will be useful to engage with
relevant stakeholder groups within the housing industry to explore in more
detail what other key pieces of information were required to address the
research question posed in chapter 1, and how this could be achieved.
This chapter outlines the research design and methods applied throughout the
research, including the participants’ information and data analysis techniques
applied. It discusses the philosophical assumptions and the design strategies
underpinning this study. The chapter discusses the ethical considerations in
section 4.2; examines the research paradigm in section 4.3; and highlights the
research design and rationale for the selected approach in section 4.4. The
research methodology discussions in this chapter are presented in two parts.
The first part in section 4.5 focuses on the sampling procedure, measurement
scales, data processing procedures and the data collection methods employed
in the study, while the second part in section 4.6 describes the methods of
data analysis employed for the study. Section 4.7 concludes the chapter.
Table 4.1 gives five key areas to be considered to develop a framework for
the research design. The framework enabled the study to structure each
research stage.

121
Table 4.1. Research design model (Robson, 2002: 81)
Purpose • What is the study trying to achieve? • Why is it being done? • Are you seeking to describe, explain or understand something? • Are you trying to assess the effectiveness of something? • Is it in response to some problem or issue for which solutions are sought? • Is it hoped to change something as a result of the study?
Theory • What theory will guide or inform your study? • How will you understand the findings? • What conceptual framework links the phenomena you are studying?
Research Questions
• To what questions is the research geared to providing answers? • What do you need to know to achieve the purpose(s) of the study? • What is it that is feasible to ask given the time and resources available?
Methods • What specific techniques (e.g. semi-structured interviews, participant observation) will you use to collect data?
• How will the data be analysed? • How do you show that the data are trustworthy?
Sampling Strategy
• From whom will you seek data? • Where and when? • How do you balance the need
4.2 Ethical Considerations Gibson and Brown (2009) suggest that a checklist of ethical considerations
outlining the necessary actions needed to undertake any study should be
provided to avoid any potential harm to the participants, whether directly or
indirectly involved, so as not to violate accepted research practice or
community standards in conducting research. They stressed that the research
ethics committee should assess all the survey instruments before deployment,
to ensure validity and reliability of the information, and to build the
researchers confidence in the questionnaire the researcher administers.
To avoid any harm to potential respondents who consented to participating in
the study, a duly signed application form containing a checklist of actions to
be strictly adhered to in the process of gathering data was sent to the
University of Westminster’s Research Ethics sub-Committee (refer to
Appendix B).

122
The following actions were undertaken to ensure that this research complied
with the accepted ethical guidelines contained in the University of
Westminster’s Ethic document.
• Contacted the University of Westminster’s Ethics Committee to receive
approval to conduct both the initial exploratory and main survey involving
human subjects;
• Listed out detailed instructions in the instruments used to confirm the
processes in place, so as to ensure participants confidentiality and
anonymity;
• Deployed cover headed letters to subjects emphasising discretional
measures in the field exercise. All conduct details were given in the
covering letter accompanying the questionnaire (refer to Appendix B);
• Obtained written consents from the subjects involved in the survey.
With all these in place, there was an approval from the Ethics Committee to
carry on with the main study.
4.3 Research Paradigm
The research paradigm is a strategy of enquiry, which moves from the
underlying assumptions to the research design, and finally to the data
collection and analytical methods (Myers, 2009). Creswell (2003) states that
all research are based on some underlying philosophical assumptions about
what constitutes a ‘valid’ research, and which research method(s) is or are
appropriate for the development of knowledge in a given study (Yin, 2003;
Creswell, 2003). Yin (2003) suggests that to conduct and evaluate any
research, it is important that the researcher knows what the assumptions are
and what they entail, before they embark on any research.

123
Robson (2002) has also argued that the way in which research is conducted
may be conceived of, in terms of the research pattern subscribed to, the
research strategy employed and so the research instruments utilised (and
perhaps developed) in the pursuit of a goal or an objective. He noted that
research methodologies can either assume a quantitative approach, which is
usually concerned with theory verification using figures and statistics or
qualitative approach, which lends itself to understanding and providing richly
descriptive reports of the individuals’ perception, attitudes, beliefs, views and
interpretations given to a problem. However, the strength in combining both
qualitative and quantitative research methods to improve the quality of the
research have been widely acknowledged (Yin, 2009), hence the rationale for
choice of the research design approach adopted for this study.
4.4 Adopted Research Design Approach and Rationale for Choice
Research design, according to Yin (2003), is a basic step-by-step plan that
guides the data collection and analysis phases of the research project. It
provides a framework that specifies the type of information to be collected, its
sources, the collection procedure and justification for the procedure used
(Creswell, 2003). Making successful predictions of building materials and
components is a complex process that requires objective and logical
reasoning, as well as rigorous evaluation of a wide-range of possible
alternatives (Ding, 2008). Similarly, sorting of alternatives into classes
arranged into a priority order, ranking of alternatives from best to worst, and
selecting the most desirable alternative, can only be achieved if proper and
adequate information are made available (Yates, 2001). Therefore, providing
adequate data on the material properties, and selection parameters that will
inform the decision-making process in the selection of LCGBMCs, entails
eliciting information from various sources by using suitable varieties of data
collection methods, and sometimes-good intuition in the choice of the
collection methods (Myers, 2009).

124
Hofstede and Neuijen (1990) however suggest that every research should be
designed to start with a qualitative orientation and then followed up with a
quantitative verification. This approach, they note, helps the researcher to
determine which dimensions can be used to measure them, and to know how
the dimensions relate to what is known about the subject from existing
theories and/or research. They argued that the reverse order forces the
researcher to impose a theoretical structure on the data before it is examined-
a structure that could leave out some important variables or include some
non-essential ones.
Hence, the broad nature, complexity of the research problem, variability of
the information needed to develop the proposed material selection decision
support system, and the perceived deficit of each research method in
addressing the different aspects of the research question, informed the use of
multiple data collection methods, which suggests the combining of qualitative
orientation methods with quantitative verification techniques. The preference
for the mixed-method approach was to obtain as much information as
possible from a variety of sources. The method helped to achieve the
objectivity, rigour, and logical reasoning required to address the different
aspects of the research question, and eliminate any likely sources of bias,
given the variability of the research question and diversity in the types and
sources of data required for answering the key research question posed in
section 1.4 of chapter 1.
The 4-phase research design adopted for this study is illustrated in Figure
4.1, which exemplifies each of the stages and the tasks each undertakes
within the research study.

125
Figure 4.1. Research methods in phases
!!!!!
!!
!
Phase 1: Review !
Phase 2: Data Collection and Synthesis !
Interview !
Questionnaire
Survey !
Phase 3: Analysis !
Design and Development of the MSDSS Model !
Phase 4: Application Evaluating and Validating the MSDSS Model
!
Research Findings and Recommendations !
Observational
Study !

126
4.5 Data Collection Techniques
This section discusses the overall research methods used for the study and the
justification of the reasons for using them. The four stages of the research
methodology are broadly discussed as follows:
4.5.1 Phase 1 [Review]: Crossed Referenced Analysis
Providing a clear theoretical framework for a relatively new area of study is
the basis, upon which the desired study could be developed (Yin, 2009).
Hofstede and Neuijen (1990) note that exploratory review enables the
researcher to better understand the theme understudy, assess the feasibility of
the study, suggest hypothesis and mechanisms that can serve as the basis for
quantitative research, and even determine the best data collection and
analytical methods appropriate for the main study.
• To address the fundamental issues associated with the first, second
and third objectives outlined in section 1.5 of chapter 1, the following
steps where undertaken:
Step 1
Explored and examined relevant literature through synthesis and analysis of
recently published data, using a range of information collection tools such as;
books, peer-reviewed journals, articles, and dissemination notes, from
libraries and internet-based sources.
This task helped to confirm initial observations, and develop preliminary
ideas on issues specific to the research theme relating to the impacts of
decision-making on the selection of LCGBMCs for LIGHDs, and their role in
sustainable housing. It also provided insights into knowledge deficits of
various decision support systems (DSSs) currently available for assessing
building material performance, which helped the study to identify appropriate
strategies needed for the development of the proposed integrated modular-
oriented Material Selection Decision Support System.

127
Step 2
Conducted a preliminary study to further examine views and current thinking
from leading researchers and practicing practitioners of relevant building
professional groups who influence material choice decisions, and possess
enough industry and product knowledge relating to LCGBMCs, using a semi-
structured questionnaire.
The need to include industry views arose due to a lack of academic references
and an acknowledgement that the industry often provides more current and
insightful information. The respondents who included mainly building
professionals from targeted regions such as the UK, USA, Canada, South
Africa, and China where selected because of their long-standing experience,
and versatility in the use of building material assessment tools, and on the
grounds that knowledge on materials sustainability was however, found to
vary significantly between participants when compared- due to different
geographies, areas of interest and variations in the technical nature of
participant’s roles. The choice of an online semi-structured questionnaire at
this stage was informed by the constraints of distance, time, budget, and
sample size. The inclusion of both closed-ended and open-ended questions
provided an opportunity to validate prior assumptions in the background
section, and elicit more information from respondents willing to express and
elaborate on their views. This method allowed for a large number of other
potential material selection decision-making factors and relevant information
not found in the literature base to be further explored.

128
4.5.2 Phase 2 [Synthesis]: Collection of Primary Data
Creswell (2008) stated that primary research is particularly useful when you
want to learn more about a problem that does not have a wealth of published
information, and serves as an efficient means of looking at a far greater
number of variables than is possible with literature review. Considering the
different facets of the underlying research problem in chapter 1, and that the
broad nature of the information needed for the study would not have been
possible with just one research method, the study took the form of an initial
questionnaire survey, followed by a range of interviews and observations
with key personnel in the Nigerian housing industry to address specific areas
of the study.
• To further elaborate and expand on the first, second and third
objective outlined in section 1.5, the following tasks were undertaken:
Step 3
Conducted primary research with building professionals who possess a wide
range of research experience and industry knowledge in the use of
LCGBMCs, given the limited sources available for the Nigerian component
of the research.
This helped the study to identify other missing variables not found in the
literature and preliminary studies and ascertain whether the choice of
variables derived from both the literature review and preliminary study could
be justified as input variables in the proposed decision support system. It also
examined the level of consistency of information gathered from the primary
study with that of respondents’ views from the literature and preliminary
studies on issues relating to the use of LCGBMCs, current material
assessment resources and the influence of sustainability in material selection.
The following sections exemplify each data collection method and process
used in this stage starting with questionnaire survey

129
4.5.2.1 Questionnaire survey
Yin (2009) has expressed that questionnaire surveys are one of the most cost
effective ways to involve a large number of people in the process if one is to
achieve generalisable results. He however, stressed that the accuracy and
success of questionnaire surveys largely depend on the careful design of its
content, structure and the response format. In order to gain an overall insight
to the topic area that fits with applying questionnaires, and to explore as many
variables as there could be, the questionnaire approach was considered ideal
for this purpose. The choice of questionnaires sent and returned by emails
over interviews at this stage was due to time, budget, distance and resource
constraints, as well as its efficiency and effectiveness in sampling a large
audience of the respondents who were widely dispersed all over the country.
Moreover, for a single researcher, such as in this case, it would have been
impossible to interview the large number of building practices in Nigeria to
cover a wide geographical area. Table 4.2 shows the framework used for the
design of the questionnaire based on the five components given earlier by
Robson (2002) in Table 4.1. Table 4.2. Questionnaire scoping study model
Purpose Study how low-cost green building materials are assessed and identify the resources currently used. Also understand what type of resource is required to encourage the wider use of low-cost green building materials in house build projects
Theory To carry out this study a wide level of background knowledge is required to understand how LCGBMCs are considered in the material selection process along with knowledge pertaining to low-impact green housing design, material selection tools and resources.
Research Questions
• What resources currently exist for information on LCGBMCs? • What information do designers need when making sustainable material selection
choices? • How do designers make decisions about LCGBMCs? • What are the drivers and barriers for using LCGBMCs? • How can individuals be supported to integrate sustainability principles into the
material selection process? • Do design and building professionals in Nigeria need, or want, a resource to
support the selection of LCGBMCs for LIGHDs? Methods Questionnaire designed with a predominantly flexible approach giving quantitative
and qualitative responses. Study shall focus data collection on semi structured approach with respondents
Sampling Strategy
Data will be collected for the questionnaire from databases of several building professional institutions in Nigeria and posted to contacts. Purposeful and random sampling techniques were used to identify participants who had experience of working with sustainable materials. Participants were also asked to suggest relevant colleagues, following a snowball strategy.

130
To avoid inconsistent and bias responses the Delphi technique was used
intermittently when and where appropriate, and other precautionary measures
were also taken into consideration when designing the questionnaires for both
surveys 1 and 2. Details of the survey instrument are given in the following
sections and a copy of the questionnaire is attached as Appendix D.
4.5.2.1.1 Survey 1
The first survey was hosted at SyncForce.SurveyWorld.com and was
launched via email between mid March 2011 and mid May 2011 including 22
questions (see Figure 4.2). An invitation letter was attached to the email with
a link to the survey web page (see Appendix D). The first survey attracted
over 150 interested visitors with 50 eligible respondents. The questionnaire’s
home page clearly stated the questionnaire’s purpose, target group and
approximate survey duration (see Figure 4.3). An open-ended question
followed every part of the questionnaire in order to allow respondents to
share their thoughts and comments. As an incentive to increase response rate
(Malhotra et al., 2002), the respondents were assured to receive the summary
report of the final survey.
Figure 4.2. Survey 1: (mid March 2011- mid May 2011
Source: Adopted from the survey tool

131
4.5.2.1.2 Survey 2
The second survey was launched between November 2012 and January 2013.
It was closed after three months to ensure a balanced participation. The
automatic report filtering generated only 210 eligible respondents, out of 480
participants. Both the first and second surveys were structured to include the
same introduction entailing 22 and 20 questions respectively.
Figure 4.3. Survey 2: (mid November 2012- Mid January 2013)
Source: Adopted from the survey tool
The first stage of the process was to determine the research objectives that
would influence the structure of the questionnaire. The literature review
explored the area from which sets of research questions were developed.
Having identified the key variables that would be included in the
questionnaire, the next step was to design a questionnaire. The respondents,
who were mainly building and construction professionals in the housing
construction industry, were the source of information chosen on the basis of
their expertise in the area of study.

132
The second stage of the questionnaire design involved determining the
question content, type and distribution process. Despite the cultural and
ethnic differences in Nigeria, the major advantage of the respondents was the
relative homogeneity given that all were experienced building professionals.
Optimum consideration was given to the design of the questionnaire and the
type of questions to minimise any potential bias or errors in responses arising
from cultural, language, ethnic and other differences among respondents.
4.5.2.1.3 Questionnaire design format
The format of the questionnaire was an adaptation based on Likert’s (1932)
scale: a psychometric response scale primarily used in questionnaires to
obtain participant’s preferences. Respondents were asked to indicate their
level of agreement with a given statement by way of an ordinal scale of 1 to 5
(where 5 depicted a stronger opinion, and 1 a lesser opinion). The reasons for
the likert scale were due to its ability to produce attitude measures that could
reasonably be interpreted as measurements on a proper metric scale, its
simplicity in design, its likelihood to produce a highly reliable scale and its
ease to read and complete by participants giving that respondents are more
likely to reply to a more convenient, and less-time consuming data collection
format (Yin, 2009; Creswell, 2008). The questionnaire was divided into three
main sections for easy analysis and reporting as follows:
• General information concerning the demographic study and related
actions:
The first part of the questionnaire contained 10 questions aimed at obtaining
responses with regard to respondents’ general knowledge and views
concerning the use of LCGBMCs in the Nigerian housing construction
industry. The responses were based on desired ideal expectations of choice
followed by the list of options to choose from, since the desired expectations
are considered to have better explanatory power than the predictive
expectations (Spreng et al., 1996).

133
• Development of material selection criteria:
The second part of the questionnaire comprised 8 questions seeking
respondents comments on the “most important” and “least important” factors
or variables under the view and expectations of the informed selection of
LCGBMCs. Some parts of the questions were open-ended and the objective
of this part of the questionnaire was to provide an opportunity for respondents
to elaborate on any issue that was of concern to them. Very simple wordings
were used in these statements to get the actual content of the information-
avoiding misinterpretation of the wordings (Yin, 2009).
• Application of the proposed material selection decision support system:
The third and final part of the questionnaire contained 2 questions. This
section of the questionnaire was used to gather other relevant information. It
investigated commitments to sustainable design practices, as well as drivers
and barriers impacting on the use of LCGBMCs.
4.5.2.2 Response format
The questions were direct and responses were expected on a likert scale,
which has been well validated by a number of studies (Likert, 1932; Creswell,
2008; Yin, 2009). Given the strong arguments for the validity of the likert
scale, along with the scale’s acceptance and use by many researchers, an
adaptation of the refined LIKERT scale was considered appropriate for this
study.
The scale was based on 5 point bipolar scales labeled “ 1= strongly disagree
to 5 = strongly agree”. The respondents were expected to indicate their choice
by checking a number along the scale. If the respondents considered that the
factor was not relevant to the selection of LCGBMCs at the design stage, they
were requested to check the not applicable (n/a) box. The choice of the 5-
point scale was in view of its ability to minimise skewed responses.

134
4.5.2.3 Pre-testing the questionnaire
Munn and Drever (1990) argue that carrying out a test run on a questionnaire
survey before embarking on the main study is a very crucial step that is
necessary to demonstrate the methodological rigour of a survey. In order to
assess the clarity and comprehensiveness of the questionnaire, and the
feasibility of the survey, the questionnaire was pretested on a randomly
selected sample of researchers (precisely 75 in number) who were broadly
representative of the type of respondents targeted by the main survey.
A total of 75 research institutions and practicing small to medium scale
organisations were sent questionnaires to complete the survey, taking into
consideration the number of low-impact green housing projects executed,
their role in the construction industry, their experience in low-impact designs,
and age of organization. Of the 75 pilot questionnaires sent out to the selected
sample, 35 were returned representing a response rate of 46.7%. This
compares favourably with the 20% response rate achieved in the pilot survey
reported in Xiao (2002). Although the results of the pilot study were not used
as part of the data required for the development of the proposed model, pre-
testing the survey enabled the study to:
• Test whether the questions were clear and understandable;
• Test the wording, sequence, form, and layout, question difficulty,
question and survey instructions;
• Identify any flaws in the design, which were corrected prior to its
administration to a much more larger sample of the Nigerian population;
• Test the comprehensibility of the list of proposed decision selection
factors/variables;

135
• Ensure that the wordings of the questionnaire could be reliably
interpreted. This provided an opportunity for checking and correcting
potential errors on time, so that the data obtained during the main survey
fully addressed all aspects of the issues raised, and were internally
consistent and coherent for analysis;
• Identify additional variables that broadened the range of decision
selection factors;
Following the feedbacks from the respondents of the pilot study, there was
evidence on the need to revise the questionnaire and vary item wording to suit
different service settings for the main study, hence informed the use of the
Delphi technique.
4.5.2.4 Revision of the questionnaire
Given the feedback from the respondents of the pretested questionnaire, a
number of possible amendments were identified towards improving the
format, content, and appearances of the questionnaire. While the respondents
did not have a problem with a 5 point scale format, they suggested that the
introduction of the “not applicable” (n/a) and “please tell us what you think”
options were necessary for every question, given that low-impact green
housing construction was an area that attracted so much interest, and required
expert suggestions that would likely inform the development of the proposed
model. This was rectified and incorporated into the revised questionnaire for
the main study. This suggestion of incentives was taken into consideration as
respondents were provided with the result consoles at the close of every
survey for their individual studies.

136
4.5.2.5 Reliability of the instrument
Several suggestions were strictly followed to ensure the reliability of the
instrument for the main survey, following the feedback from the respondents
of the pretested questionnaire. Having satisfied the requirement to pre-test the
questionnaire and having completed the revision of the questionnaire, it was
ready for deployment for the main survey.
4.5.2.6 Sampling issues
As mentioned above in section 4.5.2.1.1, the questionnaire was administered
via email survey, given the impossibility in reaching all the respondents in
person, and the distance of their respective locations. There were issues of
going through multiple databases of several building institutions, and in
ensuring a sample size that was statistically adequate to achieve maximum
response rate. Amongst the major obstacles were the difficulties in obtaining
permission from the Universities in Nigeria and private construction firms to
retrieve email contacts, and convincing them to participate in the study.
An official request signed by the research ethics department was sent to all
the institutions involved, seeking their consent to participate in the study.
Although this process took several weeks, some interested members of
various Universities and construction firms consented to the request, which
boosted the number of respondents in the survey. For those who did not want
their identity to be made known, an anonymous link was sent to such
individuals.

137
4.5.2.7 Sampling strategy
The target population for the study was defined as registered and experienced
building design and construction professionals from various housing
construction firms and top accredited Universities such as Ahmadu Bello
University, Covenant University, University of Lagos, Federal University of
Technology Minna, as well as registered/licensed private construction firms
in Nigeria. Apart from having a sample representative of the population in
Nigeria, the main objective of the sampling strategy was to achieve sampling
equivalence between the researchers and professionals of the various building
professions both in higher institutions and practicing building design and
construction firms.
Hair et al. (1995) warned that it is important to consider not only the
statistical significance, but also the quality and practical significance of the
results for managerial applications, when analysing data. They argue that
uneven sample sizes amongst different professional groups could also
influence the results. They add that the equality of variance could be achieved
with groups of approximately equal size (if the size of largest group divided
by the size of smallest group is less than a ratio of 1.5).
Given that this study involved various building professional groups, the
purposive, stratified random, and snowball sampling research methods were
adopted where applicable to avoid biased results. The underlying reasons for
adopting these sampling methods are discussed in section 4.5.2.9.

138
4.5.2.8 Sampling frame
Yin (2009) described sampling frame as a list of sampling units or a pool of
all eligible members of a population from which a sample of interest is
drawn. To validate the sample frame corresponding emails where sent to
potential participants to verify their email addresses with the help of a
confirmatory consent letter.
A total of 480 respondents of different institutions and organisations in
Nigeria were sent questionnaires to complete the survey, taking into
consideration the size, project type, annual turnover and age of institution and
organisation. The sampling frame that was adopted for the selection of the
sample- informed by Xiao (2002) was a list from the Building Professionals
Registration Council Board Register of Nigeria, the directory of the Building
Design and Construction Consultants, and the directory of various
universities. The sampling frame used in this survey was drawn from
databases of several building professional institutions as listed below.
• The Nigerian Institute of Architects (NIA),
• Nigeria Institute of Estate Surveyors & Valuers,
• Nigeria Institute of Quantity Surveyors,
• Nigerian Institute of Town Planners,
• Nigerian Society of Engineers,
• Nigerian Institute of Builders,
• Nigeria Institute of Civil Engineers,
• Society of Construction Industry Arbitrators of Nigeria,
• Nigerian Institution of Surveyors, and
• Several top ranking Universities in Nigeria offering building and
construction related courses.

139
4.5.2.9 Sampling method
Creswell (2003) notes that ultimate responsibility for producing reliable
analytical results lies within the sampling technique, and the characteristics of
the subjects. Therefore, to ensure uniformity, quality and validity of data, this
study assumed the purposive, stratified random and snowball-sampling
techniques where appropriate, to select subjects based on their level of
expertise, experience, academic and professional qualifications in the field of
housing construction. The sampling methods adopted for this study involved
three techniques at different stages as highlighted in section 4.5.2.7. The
expert sampling within the purposive or judgmental sampling method- in the
form of a consent letter, was used to determine the initial selection process
which suggests that only experienced respondents who had first-hand
knowledge in the area of study where legible to participate, to ensure the
reliability and validity of the data (Creswell, 1997, Yin, 2009).
The stratified random selection method was used to ensure that the specific
sample groups of various design and building professionals were evenly
represented, which created balance of group sizes amongst multiple groups
that were selected. This method ensured homogeneity, and improved quality
of the data gathered. Stratified random sampling, by Creswell’s (2008)
definition, is where each member of a population has a known and non- zero
probability of being included in the sample. It was utilised because of its
advantage in achieving sampling equivalence amongst different groups. On
exceptional occasions where the need arose to facilitate response rate and
achieve reasonable sample size, the snowball sampling method was also
adopted, as the approached respondents were asked to distribute the
questionnaire to their colleagues and partners with similar background.

140
4.5.2.10 Sample size
According to Creswell (2007), determining the sample size of a study area is
a complex process that involves several qualitative and quantitative
considerations which include: the nature of the research, the number of
variables, nature of analysis, incidence rates, completion rates and resource
constraints. Given the paucity of literature in the area understudied, and
considering that a large number of variables were to be analysed, a
reasonably large sample was required. The main strategy used to select the
sample was to request the administrative offices of the respective Universities
and housing construction firms to extract all registered and qualified members
belonging to the targeted groups from their staff databases, which was done
as instructed. In order to determine a suitable size for the sample, the
following formula from Czaja and Blair (1996) and Creative Research
Systems (2003) was applied.
ss = z2 ´ p(1- p)
c2
Where: ss = sample size, z = standardized variable, p = percentage picking a
choice, expressed as a decimal, c = confidence interval, expressed as a
decimal.
As has been suggested by other researchers, a confidence level of 95% was
assumed (Munn and Drever, 1990). For 95% confidence level (i.e.
significance level of α = 0.05), z = 1.96. Based on the need to find a balance
between the level of precision, resources available and usefulness of the
findings, a confidence interval (c) of ±10% was also assumed for this
research (Czaja and Blair, 1996).
According to Czaja and Blair (1996), when determining the sample size for a
given level of accuracy, the worst-case percentage picking a choice (p) should
be assumed. This is given as 50% or 0.5. Based on these assumptions, the
sample size was computed as follows:

141
ss = 1.96 (1.96) X 0.5(1-0.5)
0.1 X 0.1
ss = 96.04
Therefore the required sample size for the questionnaire survey is 96
respondents. However, the figure requires a further correction for finite
populations. The formula for this is given in Czaja and Blair (1996) as:
new ss = ss
1+ ss -1
pop
Where: pop = population
new ss = 96.04
1 + 96.04 - 1
176000
new ss = 95.99
The Nigerian housing construction industry and Building professionals in
higher institutions because of their very busy schedule are known for their
poor response rate to questionnaire surveys. Based on this, it was necessary to
adjust the sample size to account for non-response. By assuming a
conservative response rate of 20%, the appropriate sample size that was to be
surveyed was calculated as:
survey ss = new ss
response rate
survey ss = 96 = 480 design and building professionals
0.20
Thus, each respondent of each professional group within the targeted
populations had an equal probability of being selected.

142
Step 4
4.5.2.11 Questionnaire administration for the main survey
Following the agreement with the University of Westminster’s Research and
Ethics Committee, a total of 480 online questionnaires attached with cover
letters were deployed to participants of various institutions as listed in section
4.5.2.8 (See Appendix D for questionnaire). The selection of respondents
followed the sampling methods discussed in section 4.5.2.9. The idea of an
online approach was due to the fact that the subjects would be widely
dispersed around the country, the possibility of a larger sample size, and that
they were more likely to reply to a more convenient, and less-time consuming
data collection method, since the majority of them were practicing
professionals. A duly signed attached letter, and a statement of the
objective(s) of the study to guide the respondents on the potential
contribution they could make to good practice in terms of LCGBMCs,
accompanied the questionnaire. To ensure a good response rate, three steps
were followed in administering the survey: • The first step involved a mail-out of an advance-notice letter to all the
members of the sample population, notifying them of the questionnaire
they were to be receiving shortly and encouraging their participation by
suggesting incentives.
• The second step was deploying the actual questionnaire with an
accompanying personalised, signed cover letter (Babbie, 1990). This was
undertaken on November 14, 2012, roughly one week after the advance-
notice letter as recommended in Creswell (2003).
• The final step involved re-sending another set of questionnaires to all
pending respondents with an accompanying personalised attached signed
cover letter, three weeks after the initial deployment.
The returned questionnaires were progressively recorded through the
SyncForce.SurveyWorld.com site, and data entered into the SPSS v.20 file.

143
Step 5
4.5.2.12 Interviews
Creswell (2003) suggests that it can be helpful to consult knowledgeable
researchers in the field to ask for more details, when sometimes the
information reported in the questionnaire is insufficient to verify or clarify
specific issues. To deepen understanding in the areas of interest and obtain as
much useful qualitative data as needed from small numbers of people who
agreed to elaborate on less detailed responses received on the questionnaires,
this study conducted in-person interviews with building professionals who
influence material choice decisions in the housing construction industry.
Before starting each interview the interviewer gave a briefing, introduced the
project, explained how the data would be used and asked if the interviewee
was willing to be recorded. The questions were divided into sub topics to
ensure that all points were covered. Table 4.3. Interview scoping study model
Purpose Study whether LCGBMCs are considered during material selection by practicing designers. Understand designers’ attitude, and identify drivers and barriers towards the use of such materials. Seek to understand what could lead to the wider use of LCGBMCs in mainstream housing and what could be involved in getting such products into mass use.
Theory This study is guided by the findings from the questionnaire study, preliminary study and literature reviews.
Research Questions
• What information do designers need when making sustainable material selection choices?
• What information is needed to enable sustainable material selection during the design of LIGHDs?
• What are the drivers and barriers for using LCGBMCs? • What resources exist to support sustainable material selection? • How do designers make decisions about LCGBMCs? • How can individuals be supported to integrate sustainability principles into the material
selection process? • Do design and building professionals in Nigeria need, or want, a resource to support the
selection of LCGBMCs for LIGHDs? Methods Semi-structured interviews shall be conducted by the researcher and recorded for later
transcription. Transcriptions shall be analysed using Nvivo software via coding and clustering and also thematic analysis.
Sampling Strategy
Purposeful and convenience sampling were used to identify design consultancies with varying awareness of sustainable design by searching their websites for any mention of sustainable design or material selection. Participants were identified either from having previously completed the questionnaire study, and stating they would be willing to participate in future research, or via internet searches. The design directory website was used to identify a number of design consultancies and agencies

144
Since this study did not have the resources and time to interview larger
groups of respondents, a total of 10 in-depth in-person interviews were
conducted after the questionnaire survey. The non-probability cross sectional
convenience sampling method was used to select subjects thus ensuring a
diversity of views on matters concerning the use of LCGBMCs in the
Nigerian housing sector. A convenience sample is a study of subjects taken
from a group that is conveniently accessible, and known to a researcher given
their level of expertise (Creswell, 2007). One advantage of this sampling
method is that it was easy to access respondents, and it required little effort
and time (Yin, 2009). The choice of a semi-structured approach of interview
was that it allowed for a flow of conversation whilst also retaining the
structure enabling research questions to be answered.
Each interview lasted between 45 minutes and an hour (see full analysis of
the interviews in Appendix G). Online telephone interviews were mostly
carried out using Skype Voip software due to time, resource, privacy and
budget constraints, particularly for respondents who had access to Internet
services at their respective work places and declined the idea of face-to-face
interview. Information gathering involved the use of digital Dictaphone audio
recorders, and in most cases transcripts to avoid alteration of information, and
to re-contact the respondent should there be need to confirm certain issues
about the study.
Step 6
4.5.2.13 Observation
Observation consists of physically observing or inspecting a subject, an
object, system or group of tools, by taking closer note of their behaviour,
characteristics or functionality (Yin, 2004). In order to understand how the
framework could be developed further into a tool, an observatory workshop
was designed in order to observe individual and team participation with
existing tools. The need for an “observatory workshop” was to understand the
interactions of designers with the inner workings of existing tools.

145
Table 4.4. Observatory scoping study model
Purpose To evaluate the use of the tool in a real-life material selection team scenario. To probe designers participation in the material selection process, how building materials are considered and if, or how, they utilise current tools and resources.
Theory This study is carried out to observe whether and how the tool increases the individuals understanding and confidence of selection sustainable materials
Research Questions
• Does the tool improve the individuals understanding of sustainable material selection?
• What factors influence the selection of materials? • Are the factors that determine sustainable material selection clear to understand • What information do designers need when making sustainable material selection
choices? • How easy do the designers find the tool to use?
Methods Participants will take part in a workshop observatory interview session with a Semi-structured survey given for feedback and any additional comments. During the workshop the researcher shall make notes of observations and these will later be clarified using the audio recordings where applicable.
Sampling Strategy
Purposeful and convenience sampling to identify design consultancies with varying experience with material selection tools.
Observational studies at 2 green building firms in the UK helped to inform
the development of the proposed Material Selection Decision Support System
(MSDSS). The firms were first contacted and informed about the objectives
of the study and their roles as participants. Each company was researched,
prior to the first visit and throughout the study, to gain an understanding of
the company ethos, specialties, and products. Participants had to be based in
the UK knowing that they have had long-standing experience of working with
assessment tools and given the resource and time constraints. The process
involved interviewing experts, who had between 10 to 35 years of experience
in the industry, qualified in their respective fields, and who had implemented
or used such systems by directly observing and inspecting how they were
developed and how effective they were against some criteria such as
comprehensibility and flexibility when in operation. The study adopted the
purposive and convenience-sampling method, being familiar with the
organisation’s interest and role in material evaluation. In attempts to obtain
their informed consent and enhance trustworthiness of the study, a duly
signed covering letter with the University of Westminster’s letterhead was
used to support the observational study, thus ensuring credibility of the study.
Each observational study was condensed significantly to fit within two hours.

146
To provide essential triangulation of data gathered through reviews,
questionnaires survey and interviews, and to get first-hand knowledge of how
existing tools work(ed), an observational study was conducted on
Environmental Assessment Trade-off Tool (EATT) -an expert system used to
select the final material-building design combination, and whose trade-off
criteria are based on BRE Green Guide to Specification- known to be one of
the most commonly and widely used systems in the UK. The second study
was with participants with the National Green Specification and GreenSpec
firm. Unlike the one-on-one interview, where information gathering involved
the use of audio recorders, information gathering in this case was based on
written records and notes since some of the respondents did not welcome the
idea an audio recorder-for reasons of anonymity (Yin, 2009).
An architectural technician and a designer from each firm, with over 20 years
of experience, tested the interface of the existing model. The initial interviews
conducted took the form of a face-to-face interview while subsequent ones
were conducted over the telephone via Skype to clarify certain issues. One of
the users (designer from the GreenSpec) spent time at the architectural
practice explaining the way in which work was conducted during the early
design of buildings, mainly to test the ‘user friendliness’ of the interface.
The architectural technician (using the EATT) gave a short presentation about
the functionality and material input procedure of the EATT model, and
performed a test on the tool. The test began with the selection of material
alternatives from the model database. During this process, the technician only
considered the performance and structural qualities of the materials. He said
this was because an architectural technician usually focuses on structural
suitability when selecting a material. Where possible, the researcher
completed the transcriptions and observations as soon after the interviews as
possible to improve accuracy and to be closer to the data collected.

147
4.6 Data Analysis and Application Techniques
4.6.1 Phase 3 [Analysis]: Analysis of Primary Data
This section outlines the methods employed by the researcher to analyse the
data collected from the literature, surveys, and interviews, and discusses the
various application methods required for assembling the analysed data for the
development of the Material Selection Decision Support System (MSDSS).
4.6.1.1 Data analysis strategy
Prior to undertaking the quantitative analysis, a five-stage process was
followed to prepare the data for analysis, which included (a) checking the
response rate, (b) editing of completed questionnaire, (c) coding of responses,
(d) screening of data and checking margin of error(s), (e) sampling splitting
(a) Checking the response rate
Chinyio et al. (1999), Akintoye (2000), Dulami et al. (2003) and Takim et al.
(2004) acknowledged that the ideal and acceptable response rate required for
further analysis must fall within the range of 20% and above. They reported
that the normal response rate in the housing construction industry for postal
or email questionnaires fall within the range of 20-30%, given the low-
response rate that is common within the housing construction industry.
Similarly, Black et al. (2000) reported that a response rate of 26.7% is ideal
for a questionnaire survey conducted within the housing construction
industry, stating that low response rates in most building construction
industry surveys are not unusual. For example, studies conducted by Ofori
and Chan (2001) received a response rate of about 26%, Vidogah and
Ndekugri (1998) received a response rate of 27%, and Shash (1993) received
a response rate of 28.3%. Given that 210 questionnaires were returned out of
the 480 dispatched copies from the selected sample in this study, a response
rate of 43.75% was achieved, which was in line with and well above the
required standard.

148
(b) Editing of completed questionnaires
According to LoPresti (1999), analysis of missing data is required to improve
the validity of the study. Therefore, to end up with a more reliable data set
and to be able to use all the data collected in the analysis (since the responses
received from participants contained some missing data), some time was
spent investigating and resolving the missing data problem. Checks were
done to ensure that the data received through returned questionnaires were
complete, and free of inconsistencies. In situations where partly completed
questionnaires were found, The SPSS v.20 Missing Values Analysis option
was used to analyse the patterns of missing data, and organise it in a format
suitable for analysis.
(c) Coding responses
The questions in the questionnaire and interviews where pre-coded prior to
administration for easy analysis. To facilitate the analysis of this data, the
responses were categorised under different constructs generated from the
factor analysis.
(d) Screening data and checking for margin of error(s)
Sutrisna (2004) has stressed that a large sample of the target population must
be considered for inferential statistical analysis to be properly undertaken.
Munn & Drever (1990) note that as a rule of thumb, any sample with size
greater than the threshold of 30 (n > 30) should be considered as a large
sample. Therefore the sample size of 210 obtained in this survey was
considered adequate for the purpose of inferential statistical analysis, given
the low-response rates common with housing construction surveys (Ankrah,
2007). Using the SPSS v.20, the frequencies procedure was run for every
variable to check for errors in data entry. With this method, every error
detected was rectified. To ensure accuracy of the data, the questionnaire was
randomly checked for any impossible correct entries using the formula below.

149
E= zα/2 (σ/√n) OR MoE = 0.98√(1/n)….…………………………………..4.0
When the margin of error was computed using Equation 4.0, an estimate of
6.76% margin of error due to sampling was obtained at 95% confidence level.
This interpretation is that 95% of the results obtained from this survey fell
within ± 6.76% range. This means that we could be 95% sure that a repeat
survey would yield results that only differ by about 6.76% in either direction.
(e) Sample splitting
Good & Hardin (2003) note that sample splitting is a process that involves
halving of a sample, to estimate the model parameters, and verify that the
data gathered for developing the model is valid. Since there were
anticipations that the model would be evaluated towards the latter phase of
the study, a proportion of the data collected was selected and held back. This
approach has been described as an effective method of evaluation when it is
not practical to collect new sample to test the model (Snee, 1977). The
recommendation in Picard and Berk (1990) suggest that an ideal range that
should be set aside for evaluation purposes should fall between a quarter (1/4)
and a third (1/3) of the overall sample size. However, in terms of how much
was set-aside for this study; the differences in the variations and evidence
from previous studies suggests that there is no standardized percentage
required for sample splitting. Whilst Xiao (2002) set aside 12.20%, Omoregie
(2006) set aside 9.03%. This appears to suggest that there is no fixed number
or percentage required for validation, as the number required for data splitting
depends on the number of responses (Good & Harding, 2003). Going by
Good & Harding’s (2003) analogy, 10% of the sample was therefore
randomly selected in SPSS and excluded from the main analysis. The 10%
was equivalent to roughly 20 cases (refer to Table 4.5). The approach
adopted further helped to eliminate uneven sample sizes amongst different
professional groups, given that a sample of 210 could achieve a ratio
equivalence of 1.48, which is very much in range with Hair’s et al. (1995)
limit of 1.5.

150
Table 4.5. Number of case-samples held for calibration and validation
Overall Questionnaire Received Percentage of Samples (%) Analysed Sample 210 90 Sample Held Back for Calibration and Evaluation
20 10
Total 230 100 Source: Results of the study
4.6.1.2 Rationale for data analysis technique
Several studies (Siegel & Castellan, 1998; Orme & Buehler, 2001) have
suggested that researchers check the underlying assumptions that apply to the
data gathered before proceeding with any relevant statistical procedure.
Orme & Buehler (2001) noted that making any conclusion about the
normality of the data as to whether or not a particular data follows a normal
distribution (i.e., requires parametric statistical procedures) or non-normal
distribution (i.e., requires non-parametric procedures) is a decision that must
be considered to avoid violating the normality of the assumption. They noted
that understanding the type of data gathered is very important in letting the
analyst or researcher know the appropriate method for analysing the data
collected, as failure to do so may result in conclusions that are likely to be
invalid.
In selecting the appropriate data analytical technique for this study the
various steps highlighted in the flowchart (shown in Figure 4.4) were taken
in to consideration to avoid false positive results or “type one error”, often
associated with applying a parametric test to nonparametric data (Siegel &
Castellan, 1998).

151
Figure 4.4. A step-by-step flowchart of the data analytical technique
Source: Adopted from (Baranoski et al., 2001)
Given that the data would draw on views of experts with different
perspectives, and that the information gathered would contain both
quantitative and qualitative data, there was likelihood that the sample
distribution may be skewed (Yin, 2003).
In order to address this uncertainty, check that any of the ‘assumptions’
incurred on individual tests were not violated, and provide conclusive
evidence that the underlying assumption holds, a normality test (following the
principles of the Kolmogorov-Smirnov and Shapiro-Wilk) was undertaken to
assess whether or not the sample came from a population with a normal
distribution. The Kolmogorov-Smirnov test, and Shapiro-Wilk test were
adopted because of their simplicity, and to compensate for their individual
weaknesses. The performances of the tests were evaluated under various
spectrums of the sample distribution and size as shown in Table 4.6.
!
8
Area Before Ice". The ideal way to analyse these data using an inferential technique would be to used a mixed model ANOVA on the before and after values, but this is a little
complex for now. We can get SPSS to calculate the differences for each subject, then we can look at the change in balance between the exercise and non-exercise group. The data we analyse are no longer paired at this stage. We are looking for a difference between the groups. To get SPSS to do the calculation you can use the "Compute" command, it is under the Transform menu – it works just like a calculator – save and backup work before playing! (See appendix 1 for details.) The structure we then get is similar to the two independent groups of data example we considered earlier, we can ignore the two middle columns. We can now look to see if the "difference in sway area" is the same in both groups. Three or more groups or conditions. Things look more complex when you have three or more groups or conditions but don't worry, it is essentially the same. When you have three or more groups the grouping
variable will simply have extra values, e.g. if there were four groups it would take the values 1,2,3 or 4. These would then be labelled as we did in the two independent groups of data example and analysed with descriptive statistics then with a one way ANOVA or the nonparametric equivalent. If you have three or more conditions for the same set of subjects then the data will be paired (using the loosest definition of a pair). The structure will be similar to the within subjects experiment structure (simple paired data) above except that it will have more columns (variables), one more for each extra condition. These data could then be analysed with descriptive statistics then with a repeated measures ANOVA or the nonparametric equivalent. What is the order you should tackle your data in?
group
Sway area before
Sway area after
Difference in sway area
1 55 46 9
1 343 161 182
1 134 74 60
1 55 124 -69
1 52 52 0
1 117 48 69
2 84 80 4
2 93 88 5
2 46 52 -6
2 233 242 -9
2 51 53 -2
2 123 121 2
2 165 165 0
Gather and code data for analysis
Conduct descriptive analysis, boxplots or
other graphs
Check data for normality if needed
Are the data normally
distributed?
If No apply nonparametric
analysis
If Yes apply parametric methods
What is the p-value? is the effect significant? Draw conclusions
The flowchart gives a rough indication of the steps to take from data gathering to drawing conclusions from the data, before you can analyse the data they must of course be stored in an appropriate format/structure if this structure is wrong it can prevent you analysing the data correctly.
Draw conclusions!

152
Table 4.6. Tests of normality results for sampling distribution
Tests of Normality Job Affiliation Kolmogorov-Smirnova Shapiro-Wilk Statistic df Sig. Statistic df Sig.
Level of
Experience
Architect .198 43 .000 .914 43 .003
Builder .221 47 .000 .872 47 .000
Engineer .326 33 .000 .824 33 .000
Quantity Surveyor .271 46 .000 .878 46 .000
Urban Designer .232 27 .001 .797 27 .000
Other .214 14 .083 .895 14 .096
a. Lilliefors Significance Correction Source: analysis of surveyed data, 2013
The above table presents the results from two well-known tests of normality,
namely the Kolmogorov-Smirnov Test and the Shapiro-Wilk Test. Orme &
Buehler (2001) have argued that the Shapiro-Wilk Test is one of the most
sensitive and appropriate tests for determining the assumptions of normality
given that it can handle small sample sizes (< 50 samples), and sample sizes
as large as 2000.
For this reason, the Shapiro-Wilk test was considered the most relevant
numerical means of assessing normality for the sample distribution. Given
that the result analysis of the P or Significant values for a confidence interval
of 95% for both tests were < 0.05 as shown in the Table 4.6, there was
enough evidence to reject the claims that the sampled population was of a
normal distribution.
Step 7:
• To help address the fourth objective outlined in chapter 1, the study
applied several techniques associated with nonparametric method of data
analysis following the normality test results in section 4.6.1.2.

153
4.6.1.3 Descriptive statistics analysis
Descriptive statistics are used to describe the main features of a collection of
data in quantitative terms (Chinyio et al., 1998; Omoregie, 2006). This
technique was employed for analysing data related to the characteristics of
the respondents, their affiliations, and open-ended questions/comments.
Graphical techniques utilised for presenting the results from these analyses
included pie chart, bar chart and tables.
4.6.1.4 Relative index analysis
This technique was used to further analyse and aggregate the scores of the
variables rated on an ordinal scale. The SPSS was first used to determine the
valid frequencies (in percentage terms) of the variables rated, which were
then fed into Equation (4.1) to calculate the variables’ respective rank
indices (RIs).
RI = ∑ w AxN……………………......................................................................4.1
Where w, is the weighting as assigned by each respondent on a scale of 1 to 5
[with 1 implying the least and 5 the highest]. A is the highest weight (i.e 5 in
the case of this study) and N is the total number of the sample. Based on the
ranking (R) of relative indices (RI), the weighted average for the six groups
of factors were determined.
4.6.1.5 Kendall coefficient of concordance and chi-square tests
Kendall’s coefficient of concordance (W) was used to determine the degree
of agreement among the respondents in their rankings. This coefficient
provides a measure of agreement between respondents within a survey on a
scale of zero to one, with ‘0’ indicating no agreement and ‘1’ indicating
perfect agreement or concordance. Using the rankings by each respondent, W
was computed using Equation (4.2) (Siegel and Castellan, 1988).

154
...........................................................................4.2
Where∑Ri2 is the sum of the squared sums of ranks for each of the N objects
being ranked; k is the number of sets of rankings i.e. the number of
respondents; and gj is the number of groups of ties in the jth set of ranks, and
Tj is the correction factor required for the jth set of ranks for tied observations
given by:
Where ti is the number of tied ranks in the jth grouping of ii Gj ties, and gj is
the number of groups of ties in the jth set of ranks
To verify that the degree of agreement did not occur by chance, the
significance of W was tested, the null hypothesis being perfect disagreement.
The Chi-square (x2) approximation of the sampling distribution given by
Equation (4.3) with (N-1) degrees of freedom is used for testing this
hypothesis at a given level, for N>7 (Siegel and Castellan, 1988). Calculated
x2 value greater than its counterpart table value implied that the W was
significant at the given level of significance and as such the null hypothesis
was not supported hence, rejected.
x2 = k(N -1)W ...............................................................................................4.3
!"#$
!"#$%&'()$*+#,-#./(#0$1(.$2#+/#.!&3#$!#+405$6*$!"#$%&+(&7'#0$+&!#)8$9"(/"$9#+#$!"#.$
*##)$(.!6$:,-&!(6.$1;<=5$!6$/&'/-'&!#$!"#$%&+(&7'#0>$+#02#/!(%#$+&.?$(.)(/#0$1@A05<$
$$AxNwRI BBBBBBBBBBBBBBBBBBBBBBB<;<=$
$
9"#+#$!"#(0$!"#$9#(3"!(.3$&0$&00(3.#)$7C$#&/"$+#026.)#.!$6.$&$0/&'#$6*$6.#$!6$*(%#$
9(!"$6.#$(42'C(.3$!"#$'#&0!$&.)$*(%#$!"#$"(3"#0!<$$$(0$!"#$"(3"#0!$9#(3"!$1(<#$;$(.$6-+$
/&0#5$&.)$%$(0$!"#$!6!&'$.-47#+$6*$!"#$0&42'#<$D&0#)$6.$!"#$+&.?(.3$1&5$6*$+#'&!(%#$
(.)(/#0$ 1@A58$ !"#$ 9#(3"!#)$ &%#+&3#$ *6+$ !"#$ !96$ 3+6-20$ 9(''$ 7#$ )#!#+4(.#)<$ E"#$
+&.?(.3$(.)#F$(0$'&7#''#)$)(**#+#.!'C$)#2#.)(.3$-26.$!"#$/6.!#F!8$#<3<8$G(426+!&./#$
(.)#FH8$G&9&+#.#00$(.)#FH8$G*+#,-#./C$(.)#FH$#!/<$
!"#"#$!%&'()**!+,&--./.&'0!,-!+,'/,1()'/&!)'(!+2.3456)1&!0&404!!E6$)#!#+4(.#$ !"#$)#3+##$6*$&3+##4#.!$&46.3$ !"#$ +#026.)#.!0$ (.$ !"#(+$ +&.?(.308$
I#.)&''>0$ /6#**(/(#.!$ 6*$ /6./6+)&./#$ 1J5$ 9&0$ -0#)<$ E"(0$ /6#**(/(#.!$ 2+6%()#0$ &$
4#&0-+#$6*$&3+##4#.!$7#!9##.$+#026.)#.!0$9(!"(.$&$0-+%#C$6.$&$0/&'#$6*$K#+6$!6$
6.#8$ 9(!"$ LM>$ (.)(/&!(.3$ .6$ &3+##4#.!$ &.)$ L=>$ (.)(/&!(.3$ 2#+*#/!$ &3+##4#.!$ 6+$
/6./6+)&./#<$ N0(.3$ !"#$ +&.?(.30$ 7C$ #&/"$ +#026.)#.!8$ J$ 9&0$ /642-!#)$ -0(.3$
:,-&!(6.$1;<O5$7#'69$1P(#3#'$&.)$Q&0!#''&.8$=RSS5<$
#
j
i
TkNNkNNkR
W%!&
%!&#!' ''
'''
'''''''''''''((<;<O#
#
#
)*+,+ 'iR # (0$ !"#$ 0-4$ 6*$ !"#$ 0,-&+#)$ 0-40$ 6*$ +&.?0$ *6+$ #&/"$ 6*$ !"#$%# 67T#/!0$
7#(.3$+&.?#)U$?$(0$!"#$.-47#+$6*$0#!0$6*$+&.?(.30$(<#<$!"#$.-47#+$6*$+#026.)#.!0U$
&.)$-.#(0$!"#$/6++#/!(6.$*&/!6+$+#,-(+#)$*6+$!"#$.!"$0#!$6*$+&.?0$*6+$!(#)$670#+%&!(6.0$
!"#$
!"#$%&'( %&!
'i
gj
iij ttT )&*+$,$&!"#"-&.+$&%/0'$,&12&."$3&,4%5-&"%&.+$&".+&!,1/6"%!&12&
."$-)&4%3&$%&"-&.+$&%/0'$,&12&!,1/6-&12&."$-&"%&.+$&%.+&-$.&12&,4%5-7&
&
81&#$,"2(&.+4.&.+$&3$!,$$&12&4!,$$0$%.&3"3&%1.&199/,&'(&9+4%9$)&.+$&-"!%"2"94%9$&12&
:&*4-&.$-.$3)&.+$&%/;;&+(61.+$-"-&'$"%!&6$,2$9.&3"-4!,$$0$%.7&&8+$&<+"=->/4,$&?&@AB&
466,1@"04."1%& 12& .+$& -406;"%!& 3"-.,"'/."1%& !"#$%& '(& C>/4."1%& ?D7EB& *".+& ?F=GB&
3$!,$$-& 12& 2,$$310& "-& /-$3& 21,& .$-."%!& .+"-& +(61.+$-"-& 4.& 4& !"#$%& ;$#$;)& 21,& FHI&
?J"$!$;&4%3&<4-.$;;4%)&GKLLB7&<4;9/;4.$3&&A/$&!,$4.$,&.+4%&".-&91/%.$,64,.&.4';$&
#4;/$& "06;"$-& .+4.& .+$&:&*4-& -"!%"2"94%.& 4.& .+$&!"#$%& ;$#$;& 12& -"!%"2"94%9$&4%3&4-&
-/9+&.+$&%/;;&+(61.+$-"-&"-&%1.&-/661,.$3&4%3&.+/-&+4-&.1&'$&,$M$9.$37&
WNkx %!&( NNNNNNNNNNNNNNNNNNNNNN7D7E&&
!"#"#$!%&'()*!&+&,-./.!&O49.1,&4%4;(-"-&"-&4&0/;."#4,"4.$&-.4."-."94;&.$9+%">/$&21,&$@40"%"%!&.+$&/%3$,;("%!&
-.,/9./,$& 1,& .+$& -.,/9./,$& 12& "%.$,,$;4."1%-+"6-& ?1,& 91,,$;4."1%-B& 401%!& 4& ;4,!$&
%/0'$,& 12& #4,"4';$-& ?P4",& '!# ()*)& GKKLB7& 8+"-& 4%4;(-"-& ("$;3-& 4& -$.& 12& 249.1,-& 1,&
/%3$,;("%!&3"0$%-"1%-&*+"9+)&*+$%&"%.$,6,$.$3&4%3&/%3$,-.113)&3$-9,"'$&.+$&34.4&
"%& 4& 64,-"01%"1/-& '/.& 01,$& 0$4%"%!2/;& %/0'$,& 12& 91%9$6.-& .+4%& .+$& 1,"!"%4;&
"%3"#"3/4;,"4';$-&?Q;(%%&'!#()*+&ARRKB7&8+"-&466,149+&*4-&/.";"-$3&"%&.+$&*1,5&12&
O4+(& ?ARRAB& 1%& -/-.4"%4'";".(7& S%& .+$& 4'-$%9$& 12& 4%(& -.4%34,3& ;"-.-& 12& T4.$,"4;&
-$;$9."1%& 9,".$,"4)& .+$,$& *4-& 4& 91%-"3$,4';$& ,"-5& 12& .+$& 4%4;(-"-& 12& .+$& ,$-61%-$-&
("$;3"%!&3"#$,-$&,$-/;.-7&8+/-)&"%&$-.4';"-+"%!&.+$&;"-.&12&9,".$,"4)&".&*4-&91%-"3$,$3&
"061,.4%.& .1& $%-/,$& .+4.& .+$& 9,".$,"4& 4,$& 12& 43$>/4.$& ,$;$#4%9$& 4%3& *$,$& 4;-1&
"%3$6$%3$%.7&
$

155
4.6.1.6 Factor analysis
Factor analysis is a data reduction methodology that serves to define the
underlying structure of interrelationships (or correlations) among a large
number of variables (Hair et al., 1998). This technique was used to reduce
large number of variables to a smaller set of underlying factors that
summarise the essential information contained in the variables.
Hair et al. (1995) argue that a sample size of 100 is adequate to calculate the
correlation between variables. Since the total number of subjects in this study
was 210, it therefore conformed to the required ratio of subjects as noted by
Hair et al. (1995). This analysis was performed with the assistance of SPSS
Statistics v20. Kaiser– Meyer–Olkin (KMO) measure and Bartlett's Test of
Sphericity were conducted to examine the sampling adequacy, ensuring that
factor analysis was going to be appropriate for the research. Bartlett's Test of
Sphericity states that if the variables are perfectly correlated, only one factor
is sufficient. If they are orthogonal, we need as many factors as variables. If
the correlation matrix is the same then they are an identity matrix. A simple
strategy was to visualize the correlation matrix.
If the values outside the main diagonal are often high (in absolute value),
some variables are correlated; if most these values are near to zero, then PCA
is not really useful. Maximum likelihood approach was then employed to
extract six groups of factors with eigenvalues greater than 1, however,
suppressing all other factors with eigenvalues less than 0.3 based on Kaiser’s
criterion (Kim and Mueller, 1994; Field, 2000). To interpret the relationship
between the observed variables and the latent factors more easily, direct
oblimin rotation was selected as the most ideal rotation method (see
Appendix G for more details).

156
4.6.2 Phase 4 [Application]: Assembling, Developing, Testing and Validating the Proposed MSDSS Model
This stage involved the physical data modelling that formed the final step of
the research methodology where the internal storage structure and file
organisations were carried out. The physical data model describes how data
items are put into storage locations so that they could be retrieved (Miles et
al, 2000). This phase dealt with system configuration: hardware devices
(storage, display and peripherals), file structures, access methods and location
of data.
• To help address the fifth objective outlined in section 1.5 of chapter 1,
the following tasks were undertaken:
Step 8
4.6.2.1 Assembling data for the MSDSS model
The researcher employed relevant Database Management Systems (DBMS)
to assemble the key components and data gleaned from the results of the
surveyed questionnaire and interviews, as part of the initial design and
development process. Macro-in-Excel Visual Basic for Applications and
Microsoft Excel 2012 were selected as ideal spreadsheets for developing the
algorithms of the DSS model and storing the data used for developing the
algorithms, given the large amount of information.
Step 9
4.6.2.2 Developing the MSDSS model
Once the basic design was established, the individual components of the
system were then built. Macro-in-Excel VBA was used as the ideal
programming language, and MS Excel was used to develop the database for
the main structure workflow of the proposed system. For satisfactory
operation, the software requirements of the system included the following
specifications: Intel Celeron processor; 2 GB of RAM; approximately 120
GB of hard disk space required for storing large files and a 15 inch monitor

157
Step 10
4.6.2.3 Testing and evaluating the MSDSS model
Miles et al. (2000) consider performance evaluations involving potential end-
users as the best way to establish the usefulness of a given system. Obonyo et
al (2005) state that evaluation is a process of determining the overall value of
the software system, to ensure that the prototype model satisfies the
performance criteria defined in the functional specification including its
usability and limitations.
• To help address the first part of the sixth objective, the following steps
were undertaken:
The researcher tested the internal links to know what was to be measured
within the system, by inputting relevant data into the system using the black-
box test run control approach, which included functional and regression tests.
The objective of these methods were to check and verify whether or not the
outputs of the results against easily calculated values tallied, and were
consistent with random input variables after modifications.
Since the aim of this study was to validate the model for industry-wide
application in the Nigerian housing construction industry, expert opinion
evaluation was also used to assess the feasibility of the model in terms of its
adequacy and clarity, and to ensure that the model was reasonably robust and
acceptable to users (see full illustration in chapter 5 and Appendix K). To
achieve this goal, feedback questionnaires were developed and deployed to a
select few who partook in the previous study via email contacts to seek their
expert views concerning the accuracy, completeness, comprehensibility and
cost effectiveness of the model. The use of the previous survey respondent’s
list as a sample frame had two main advantages:

158
• First, most of the practitioners in this list were individuals in senior
positions from building and design firms with relevant expertise and
experience in material assessment and selection.
• Second, their prior involvement in the earlier survey made them
familiar with this research, which ensured good response rate.
To further build a modified prototype version of the system, necessary
changes were made afterwards based on the feedbacks from the survey. Some
of the changes included categorizing the material types, and modularizing the
various aspects of the model.
Step 11
4.6.2.4 Validating the MSDSS model
Validation of a system is a process of applying formal methods to ensure that
the system design is achieving its intended functions correctly within pre-
established conditions in order to increase confidence in the model (Heesom,
2004; Kennedy, et al, 2005). However, validation based on a case study
allows an empirical inquiry into the real-life context of a research work, and
differs to other qualitative research studies in the sense that the focus of
attention is on individual cases as opposed to the whole population of cases.
In view of the complex nature of this research, the case study approach was
deemed to be the preferable method to generate the essential data for analysis
and assess the robustness of the model.
• To address the final part of the sixth objective, the following steps were
undertaken:
The model was applied to a case study building project in Nigeria, to check
and confirm the effectiveness and robustness of the system. Here, the outputs
from the algorithms of the system were compared to monitored data from the
completed case study building, to review the potential savings of the new
materials proposed. Further descriptions of the validation exercise are
covered fully in chapter 6.

159
Table 4.7. Summary of the adopted research design road map
AIM
To explore and evaluate the significance of an integrated modular-oriented mode of assessment that is able to assist designers in developing an improved capability to make early-informed choices, when formulating decisions to select LCGBMCs at the early conceptual stages of the design.
STAGE
OBJECTIVES
TASKS
METHOD
1. Elicit current views and background information on themes related to the economic, environmental and social impacts of housing construction activities, with emphasis on the role of material selection decision-making in sustainable housing
Step 1. Examined relevant literature through synthesis and analysis of recently published data, using a range of information collection tools such as; books, peer-reviewed journals, articles and dissemination notes from libraries and internet base sources
AA,
2. Compare and contrast various technologies currently used at national and international levels for modeling decision-making in the selection of building materials and components to highlight their strengths and weaknesses
Step 2. Reviewed relevant literature and subsequently, conducted preliminary study with leading researchers and practicing professionals who influence material choice decisions in the housing industry.
AA, QS,
INT
3.Identify the key influential factors that affect the selection of building materials
Step 3. Conducted a pilot study, by deploying a test-questionnaire to a small sample of researchers in Nigeria who possess relevant knowledge on issues specific to the use of low cost green materials via email
AA, QS,
INT, OBS
Step 4. Conducted the first part of the main study by administering the revised questionnaire to targeted and interested registered building professional groups, who influence the selection of construction materials from throughout the construction value chain in Nigeria. Step 5. Subsequently, conducted in person interviews with interested building professionals who influence material choice decision in housing construction using audio recording systems and writing tools to avoid misinformation Step 6. Finally, carried out inspection on most commonly used tools in the UK by directly observing how they function when in operation and interviewing professionals who had implemented such systems
4. Establish and specify the impact weight of each key influential factor
Step 7. Analysed the data gathered from the surveyed exercise(s) using a suite of statistical analytical techniques
AA
5. Develop a Multi-Criteria Decision Support System for aggregating the weighted factors needed for the assessment of LCGBMCs
Step 8. Assembled the key components and data gleaned from the analysis of the surveyed questionnaires and interviews
AA, QS, M Step 9. Developed the conceptual framework of the proposed system into a
refined model using relevant Database Management System (DBMS)
6. Test and validate the developed system
Step 10. Inputted relevant data to test the output of the system against easily calculated values using the black-box control approach. This was followed by an expert-survey with participants who had participated in the study, using feedback questionnaires to get their judgments about the system. Made necessary adjustments based on the feedback from the survey.
M, QS, AA
Step 11. Validated the modified decision support system using a case study in Nigeria by comparing the outputs from the algorithms of the model to monitored data from the ongoing building project
M, CS
KEYS: AA (Archival analysis) QS (Questionnaire Survey) INT (Interview) OBS (Observation) CS (Case study) M (Modeling)
1: RE
VIE
W
4: AP
PL
ICA
TIO
N
2: SYN
TH
ESIS
3: AN
AL
YSIS

160
4.7 Summary
This chapter has presented an outline of the research methodology adopted
for carrying out this research. A four-phase research method was adopted to
provide rich insights and enable triangulation of the data in order to fulfill the
research aim and objectives as summarised in the Research Road Map in
Table 4.7. This involved first, a comprehensive literature review followed by
a pilot survey for fine-tuning the questionnaires for a subsequent nation-wide
survey, and then interviews with key stakeholders in Nigeria, to confirm
initial observations and to investigate current knowledge of design and
building professionals regarding the concept of the sustainability principle-
particularly, as it affects the selection and implementation of low-cost green
building materials in the design of LIGHDs, and associated barriers towards
implementing it.
The data collected were analysed with the aid of SPSS v.20 and Excel, using
various forms of non-parametric techniques given the nature of the sample
distribution. Information gathered from literature review, the survey and
subsequent interviews were used to draw deductions and conclusions in
respect of the research objectives, which formed the basis for developing a
multi-criteria decision support model that met the requirements of the
participants. Appendix G outlines the research work undertaken and outcome
using the adopted research methods.
The next chapter is dedicated to making the most substantial contribution to
the study by addressing the key research question posed in section 1.4 of
chapter 1.

Chapter V
Developing the conceptual framework and testing the usefulness of the proposed MSDSS model for the evaluation and selection of low-‐cost green
building materials and components

161
CHAPTER 5: DEVELOPMENT AND TESTING OF THE MSDSS MODEL
5.1 Introduction
The quest for adequate information presented in a format that gives designers
a more informed view of the impacts of LCGBMCs was highlighted in
chapters 1, 2 and 3. Following this request, the study engaged key
stakeholders within the Nigerian housing industry to provide vital industry
and practice-based information, using the relevant research methods adopted
for the study in chapter 4. Throughout the analyses of the empirical studies (in
Appendix G) there were further demands by participants for a new resource
that would ensure the provision of up-to-date informed data relating to
LCGBMCs, in order to support designers in the early stages of the design.
This chapter draws together the findings from both the literature review and
the empirical studies to address the key research question posed in section 1.4
of chapter 1. As a response to participants’ request, it seeks to develop a
model, designed to aid and facilitate better-informed decision in the selection
of LCGBMCs. Section 5.2 outlines the framework of factors required for
sustainable material selection, section 5.3 examines the key factors of each
group that make up the framework of the sustainability principle, while
section 5.4 examines the adopted analytical model for the proposed MSDSS
system. The concepts of the Analytical Hierarchy Process (AHP) and its
advantages over other traditional material selection techniques are discussed
in section 5.5, while section 5.6 illustrates the design and development of the
prototype version of the MSDSS model. The full details of the steps involved
in the workings of the MSDSS model are presented in section 5.7. Finally, the
testing of the prototype MSDSS for selecting LCGBMCs is demonstrated in
section 5.8, while a summary of the entire chapter is presented in section 5.9.
Overall, Chapter 5 fulfills Objective 5 of the research.

162
5.2 Outline of the Framework for the Key Factors
The main study provided relevant industry and practice-based information,
which was the predominant source of information for the framework structure
of the key factors that make up the sustainability principle index. Reviews
conducted on existing tools (in chapter 3) identified a number of sustainable
material selection factors. The factors, strategies, drivers and barriers towards
sustainable material selection identified from the literature review in chapters
2 were used as a starting point to sketch out ideas and work out which factors
were key for inclusion.
Figure 5.1 presents a visual map of the key factors (the sustainability
principle indices) that influence designers’ decisions when selecting
LCGBMCs for LIGHDs (see Appendix G for full analysis of factors). The
framework has been sub-divided into six (6) key areas. Each box represents a
group of factors that the participants had identified as key attributes that they
consider when selecting building materials.
Figure 5.1. Conceptual framework of the analysed decision factors for measuring the sustainability
impacts of LCGBMCs
!!!!
(GS) General/Site Factor
GS2-Material Availability GS1-Geographic Location of Site GS10-Building and Space Usage GS9-Knowledge Base in Construction GS6- Withstand Natural Disasters GS7-The Type of Building Material(s) GS4-Building Certification for Use GS5-Design Concept GS12-Spatial Scale: Building Size and Mass GS8-Project Site Geometry/Setting/Condition GS3-Distance GS11-Building Orientation!
(EH) Environmental/Health Factor!EH3-Safety and Health of End-users EH6-The Climatic Condition of the Region EH7-Material Environmental Impact EH2-Level of Carbon Emissions and Toxicity EH4-Habitat Disruption: Ozone Depletion Potential EH1-Environmental Statutory Compliance EH5-The Amount of Pesticide Treatment Required
(EH) Economic/Cost Factor!C4-Maintenance or Replacement Cost C5-Labour or Installation Cost C1-Total Life Cycle Cost C3-Capital/Initial Cost C2-Material Embodied Energy Cost
(SC) Socio-Cultural Factor!SC5-Knowledge of the Custom SC1-Material Compatibility with Traditions SC6- Compatibility with Client’s Preference SC2-Material Compatibility with Regional Settings SC3-Cultural Restriction(s) on Usury SC4-Family Structure: Type & Size of Family Unit
(SN) Sensorial Factor!SN4-Temperature SN6-Odour SN10-Lighting Effect SN5-Acoustics SN1-Aesthetics or Visual density SN2-Texture SN3-Colour SN7-Thickness/Thinness SN9-Hardness SN8-Glossiness/Fineness SN11-Structure SN12-Translucence
(T) Technical Factor!T15-Life Expectancy T7-Resistance to Fire T9-Resistance to Moisture T11-Resistance to Weather T5-Availability of the Technical Skills T8-Resistance to Heat T13-Resistance to Decay T3-Level of Maintenance Requirement T6-Ease and Speed of Method fixing T4- Expansion-Contraction Tolerance T1-Recyclability and Reusability T12-Resistance to Chemicals T2-Ease to Remove/Re-Affix/Replace T14-Weight & Mass of material T10- Resistance to Scratch T-16-Renewability T17- Compatibility with other Materials T18-UV Resistance
Material Alternatives
Preferred Material
Choice Analytical Hierarchy Process

163
5.3 Analysis of the Material Selection Factors
The analysis of the interviews and surveyed questionnaires identified 55 key
sustainability principle indicators (influential factors) as important
components of the material selection process (see Appendix G for full
analysis). As part of an exercise to maintain consistency in the material
selection decision-making process during crucial stages of the design, and to
clarify the similarities and differences in properties and functions between
various factors, the 55 factors were further compressed into six categories as
follows:
5.3.1 Factor 1: General/Site (GS) Suitability One of the fundamental aspects of housing design is the characteristic of the
building site. Zhou et al. (2008) pointed out that factor such as soil
characteristics, location and topography for instance, can influence design and
material selection decisions. They argue that consideration of the site context
of use is essential in determining the suitability of a building product in any
housing project, since even projects located on neighboring sites differ in
their characteristics. This group of factors includes: location, distance, site
layout, and geographic information of the region.
5.3.2 Factor 2: Environmental/Health (EH) Impact In addition to the easily quantifiable issues in the decision-making process,
the long-term ecological footprint and health impacts of a material are equally
important in the selection of LCCGBMCs, hence in achieving a sustainable
low-impact green structure (Behm, 2005). Bubshait & Almohawis (1994)
defined health and safety as the degree to which the general conditions
promote the completion of a project without major accidents of injuries to
users.

164
To reduce or eliminate any form of environmental hazards resulting from the
production and transportation of building products, and to improve safety
performance during occupancy, designers must address environmental and
health issues when selecting materials at the early stages of the design. This
group of factors includes; environmental statutory compliance, toxicity,
ozone depletion potential, embodied carbon emission, fossil fuel/habitat
depletion, pollution and air quality.
5.3.3 Factor 3: Economic/Cost (EC) Efficiency Goh and Yang (2009) argue that the financial constraint is still one of the
prime concerns to many building clients because of the huge capital
requirement for housing construction. Historically, material selection
decision-making has been based largely on the first-cost mentality approach
(Goh and Yang, 2009). With increasing pressure to provide affordable
housing, design and building professionals are focusing on the early
identification of the long-term financial impact of housing projects when
selecting building materials at the initial stages of the design (Cole, 1999).
Since the cost of operating a building is consequent of the choice of materials
at the early stages of the design, decisions based solely on initial cost often
undermines the log-term impacts of the products. This means that designers
must consider a long-term economic assessment approach that is able to
predict the costs of a building from its inception, operation, maintenance, and
replacement until the end of its lifetime to ensure that the green development
objectives are achieved. The group of factors that fall under this category
include: material embodied energy cost, capital cost, labour cost, material
replacement cost, material maintenance cost, and total life-cycle cost.

165
5.3.4 Factor 4: Socio-Cultural (SC) Benefits Socio-cultural variables are much difficult to quantify and as such have not
received as much attention in the architecture literature as other groups of
factors (San-Jose et al, 2007). San-Jose et al. (2007) argue that the socio-
cultural variable forms an implicit part of the design decision-making
process, as it helps to define the architecture of the region, as well as promote
the image of the community. Likewise material choice also must be
compatible with specific regional and local cultural and aesthetic conditions.
For example, the Southwestern adobe and flat roof residential construction
would not export well to New England, where the widespread use of wood
framing, clapboard siding, and pitched roofs is climatically appropriate, as
well as culturally embraced. Hence, considerations must be given to socio-
cultural factors during the early stages of the design to conserve the cultural
asset. Factors within this group include: material compatibility with
traditions, and cultural restriction on usury.
5.3.5 Factor 5: Technical (T) Performance Wong and Li. (2008) note that one vital aspects of housing design is to find
trade-offs that satisfy a multitude of technical objectives, since they provide a
rational framework for building design and construction that is flexible and
amenable for accommodating innovations and change. The technical concept
enables the execution of buildings that are highly suitable for the functions
and activities of their occupants. Therefore, failure to recognize the
significance of technical criteria during material selection at the early stages
of the design, may lead to building system incompatibility, malfunctioning,
and risk of obsolescence (Wong and Li., 2008). In other words failure to
match the technical criteria with occupants and clients’ expectations at the
crucial stages of the design may eventually lead to malfunctioning of the
building systems, which could result in loss of confidence in the building
structure, hence, affect the business operations of occupants in the long run.

166
Factors such as; fire resistance, resistance to decay, life expectancy of
material (durability), ease of construction and maintainability must be
considered at the initial stages of the design when selecting LCGBMCs, in
order to attain the desired service life of the building product without
excessively increasing its life-cycle cost.
5.3.6 Factor 6: Sensorial (SN) Performance Factor 6 focuses on sensorial impact such as visual density, texture, colour,
temperature, acoustics and hardness. This group of factors expresses the quality of
the actual material used in a specific building element in relation to human senses
or feelings. Ashby & Johnson (2002) note that choosing materials for an
architecture project is not only about meeting technical requirements, but also the
material’s appearance and sensory behaviour.
Wastiels and Wouters (2009) argue that limiting the assembly of buildings to
environmental, economic, or technical aspects impede the discovery of design
opportunities inherent in materials themselves. They note that sustainability in a
material can also be related to the material quality itself, appearance, texture,
acoustics, thermal capacity and odour.
The following section is to review some of the well-known multi-criteria decision
techniques that are commonly used to assess sustainable principle indicators in the
building industry, in order to identify the most ideal model that will apply
favourably to the context of this study.

167
5.4 Multi-Criteria Decision Support Models for Material Selection
Numerous techniques for multi-criteria decision-making have emerged
(Trusty, 2003). According to Singh et al. (2007; 2009), the sole reliance on
univariate or bivariate analyses has been found to be inadequate.
Consequently, the use of the multivariate analysis has become more
acceptable in deciding the choice of materials due to its ability to address
both objective and subjective variables. As the name implies, multivariate
analysis comprises a set of techniques dedicated to the assessment of
relationships between more than two variables, which are random but
interrelated so that their different effects are meaningfully and uniformly
interpreted (Singh et al., 2007). However, the question remains as to which of
the existing MCA techniques is most suitable for the articulation of
composite indices when evaluating competing material options.
In the following sections a range of available MCA analytical techniques are
examined, in hopes of identifying the MCDA approach most applicable to
this study. The rationales for the most preferred technique are also discussed.
5.4.1 Scoring Multi-Attribute Analysis (SMAA)
This technique is used for evaluating multi-criteria decision problems to
identify the best decision alternative from several well-defined alternatives.
Anderson et al. (2005) spelt out the analysis involved in this technique in
clear steps as follows:
Step1. Develop a list of the criteria to be considered. The criteria are the
factors that the decision maker (DM) considers relevant for evaluating each
decision alternative.
Step 2. Assign a weight to each criterion that describes the criterion’s relative
importance. Let wi = the weight of criterion i.

168
Step3. Assign a rating for each criterion that shows how well each decision
alternative satisfies the criterion. Let rij = the rating for criterion i and
decision alternative j.
Step 4. Compute the score for each decision alternative as follows:
where Sj is the score for decision alternative j………..….....5.1
Step 5. Order the decision alternatives from the highest score to the lowest
score to provide the scoring model’s ranking of the decision alternatives. The
decision alternative with the highest score is the recommended alternative.
The simplest form of SMAA is expressed as (i.e. without any
weightings (Wi) and is termed simple scoring MAA. Anderson et al. (2005)
however, note that this method has major weakness, as rij is often a very
subjective measure.
5.4.2 Multi-Attribute Utility Theory (MAUT)
This technique is similar to SMAA except that it uses “utility” to quantify the
subjective components of the attributes. The term “utility” is used to refer to
the measure of desirability or satisfaction of an attribute of the alternative
under consideration. It gives an abstract equivalent of the attribute being
considered from natural units such as years, or £ into a series of
commensurable units (utiles) on an interval scale of zero to 1 (Holt, 1998). As
in SMAA, utility values can be used in conjunction with weightings, Wi, to
give a more reliable aggregate score for the various alternatives. MAUT is
expressed mathematically as:
…………….………….…………………………………..5.2
Where Ui represents the abstract equivalent expressed in utiles for the ith
attribute of the jth alternative and n is the attributes considered by the
decision maker.
!!! "#$!!
Scoring Multi-Attribute Analysis (SMAA)
!"#$% #$%&% '()"*#+,(%-./%(0&1,&'#*2%3,1'#4)/#'(/#&%5()#$#.*%6/.71(3$%'.% #5(*'#-8% '"(%
7($'% 5()#$#.*% &1'(/*&'#0(% -/.3% $(0(/&1% 9(1145(-#*(5% &1'(/*&'#0($% :;#*1&8<% =>>?@A%
B*5(/$.*% !"%#$%& :CDDE@% "&0(% $6(1'% .,'% '"(% &*&18$#$% #*0.10(5% #*% '"#$% '()"*#+,(% #*%
)1(&/%$'(6$%&$%-.11.9$F%
G'(6=A%H(0(1.6% &% 1#$'% .-% '"(% )/#'(/#&% '.% 7(% ).*$#5(/(5A%!"(% )/#'(/#&% &/(% '"(% -&)'./$%
'"&'% '"(% 5()#$#.*% 3&I(/% :HJ@% ).*$#5(/$% /(1(0&*'% -./% (0&1,&'#*2% (&)"% 5()#$#.*%
&1'(/*&'#0(A%
G'(6% CA% B$$#2*% &% 9(#2"'% '.% (&)"% )/#'(/#&% '"&'% 5($)/#7($% '"(% )/#'(/#.*K$% /(1&'#0(%
#36./'&*)(A%L('%'(&M%'"(%9(#2"'%.-%)/#'(/#.*%(A%
G'(6NA% B$$#2*% &% /&'#*2% -./% (&)"% )/#'(/#.*% '"&'% $".9$% ".9% 9(11% (&)"% 5()#$#.*%
&1'(/*&'#0(% $&'#$-#($% '"(% )/#'(/#.*A% L('% )(*&M% '"(% /&'#*2% -./% )/#'(/#.*% (& &*5% 5()#$#.*%
&1'(/*&'#0(%*%%
G'(6%?A%O.36,'(%'"(%$)./(%-./%(&)"%5()#$#.*%&1'(/*&'#0(%&$%-.11.9$F%%
%ijij rwS %%9"(/(%+*&#$&'"(%$)./(%-./%5()#$#.*%&1'(/*&'#0(%PQQQQQQAARA=%
G'(6%EA%S/5(/%'"(%5()#$#.*%&1'(/*&'#0($%-/.3%'"(%"#2"($'%$)./(%'.%'"(%1.9($'%$)./(%'.%
6/.0#5(% '"(% $)./#*2% 3.5(1K$% /&*I#*2% .-% '"(% 5()#$#.*% &1'(/*&'#0($A% !"(% 5()#$#.*%
&1'(/*&'#0($%9#'"%'"(%"#2"($'%$)./(%#$%'"(%/().33(*5(5%5()#$#.*%&1'(/*&'#0(A%
%!"(%$#361($'%-./3%.-%GJBB%#$%(T6/($$(5%&$% ijj rS %&:#A(A%9#'".,'%&*8%9(#2"'#*2$%
:,(@@%&*5%#$%'(/3(5%$#361(%$)./#*2%JBB%:U.1'<%=>>V@A%!"#$%"&$%3&P./%9(&I*($$%&$%
)(*% #$% .-'(*% &% 0(/8% $,7P()'#0(%3(&$,/(A%!"(%6,/6.$(% .-% '"(%9(#2"'#*2% #*5#)($% #$% '.%
"(#2"'(*% '"(% &22/(2&'(5% $)./($% .-% '"(% 0&/#.,$% &1'(/*&'#0($% #*% ).33(*$,/&'#.*% .-%
'"(#/% $&'#$-&)'#.*% #*% /(1&'#.*% '.% '"(% 0&/#.,$% )/#'(/#&A%!"(%,(&3&8%7(% &% -,*)'#.*%.-%
:U.1'<% =>>V@F% $.1(% 6/&)'#'#.*(/% (T6(/#(*)(W6/(5#1()'#.*X% 2/.,6% ).*$(*$,$% .6#*#.*%
!!! "##!!
!"#$%&'()*$!"#$!"!+*%,%$-.$#!/!0$.'-1$!$%!12+)$2)'/,")"/$/-$/3)$%)+)4/,-"$%)//,"5$,"$
63,43$/3)$1-#)+$6,++$7)$!22+,)#8$
!Multi-attribute utility theory (MAUT) $93,%$ /)43",:&)$ ,%$ %,1,+!'$ /-$ ;<==$ )>4)2/$ /3!/$ ,/$ &%)%$ ?&/,+,/*@$ /-$ :&!"/,.*$ /3)$
%&7A)4/,()$4-12-")"/%$-.$ /3)$!//',7&/)%8$93)$ /)'1$?&/,+,/*@$ ,%$&%)#$ /-$ ').)'$ /-$ /3)$
1)!%&')$ -.$ #)%,'!7,+,/*$ -'$ %!/,%.!4/,-"$ -.$ !"$ !//',7&/)$ -.$ /3)$ !+/)'"!/,()$ &"#)'$
4-"%,#)'!/,-"8$ B/$ 5,()%$ !"$ !7%/'!4/$ ):&,(!+)"/$ -.$ /3)$ !//',7&/)$ 7),"5$ 4-"%,#)')#$
.'-1$"!/&'!+$&",/%$%&43$!%$*)!'%0$-'$C$,"/-$!$%)',)%$-.$4-11)"%&'!7+)$&",/%$D&/,+)%E$
-"$!"$,"/)'(!+$%4!+)$-.$F)'-$/-$G$DH-+/0$GIIJE8$=%$,"$;<==0$&/,+,/*$(!+&)%$4!"$7)$&%)#$
,"$4-"A&"4/,-"$6,/3$6),53/,"5%0$!"0$/-$5,()$!$1-')$')+,!7+)$!55')5!/)$%4-')$.-'$/3)$
(!',-&%$!+/)'"!/,()%8$<=K9$,%$)>2')%%)#$1!/3)1!/,4!++*$!%L$
$%
ij
n
iij UWS MMMMMMMMMMMMMMMMMMM88N8O$
!P3)')$K,$')2')%)"/%$/3)$!7%/'!4/$):&,(!+)"/$)>2')%%)#$,"$&/,+)%$.-'$/3)$"/3$!//',7&/)$
-.$/3)$#/3$!+/)'"!/,()$!"#$"$,%$/3)$!//',7&/)%$4-"%,#)')#$7*$/3)$#)4,%,-"$1!Q)'8$
$Multiple Regression (MR)
93,%$,%$!$%/!/,%/,4!+$/)43",:&)$&%)#$/-$#)()+-2$!$1-#)+$.-'$-7%)'(,"5$!"#$2')#,4/,"5$
/3)$ )..)4/$ -.$ !$ "&17)'$ -.$ ,"#)2)"#)"/$ (!',!7+)%$ &2-"$ !$ #)2)"#)"/$ (!',!7+)8$ B"$
5)")'!+0$ !$ <R$ 1-#)+$ .-'$ 2')#,4/,"5$ !"$ -&/4-1)$ $0$ !$ .&"4/,-"$ -.$ ,"#)2)"#)"/$
(!',!7+)%0$%&'$%(')**%+,,%$5,()"$7*$):&!/,-"$-.$/3)$.-'1L$
,$,-,.,/,0&1%&2,/,0(1%(2,/,***,/,0+1%+2)))))))))))))N8S,$P3)')$., ,%$ /3)$ 4-"%/!"/$ ')2')%)"/,"5$ /3)$ *T!>,%$ ,"/)'4)2/$ -.$ /3)$ ')5')%%,-"$ +,")U$
0&'0(')**0+, !')$ /3)$ 2!'/,!+$ ')5')%%,-"$ 4-)..,4,)"/%$ ')2')%)"/,"5$ /3)$ !1-&"/$ /3)$
#)2)"#)"/, (!',!7+)$ $, 43!"5)%$ 63)"$ /3)$ 4-'')%2-"#,"5$ ,"#)2)"#)"/$ (!',!7+)$
43!"5)%$G$&",/$!"#$+,,%$/3)$"&17)'$-.$,"#)2)"#)"/$(!',!7+)%8,B"$!22+*,"5$<R$!%$!$

169
5.4.3 Multiple Regression (MR)
This is a statistical technique used to develop a model for observing and
predicting the effect of a number of independent variables upon a dependent
variable. In general, a MR model for predicting an outcome Y, a function of
independent variables, X1, X2,…..Xn is given by equation of the form:
Y = a + b1(X1) + b2(X2) + ... + bn(Xn) ………...………...……………….…5.3
Where a is the constant representing the y-axis intercept of the regression
line; b1,b2,…..bn are the partial regression coefficients representing the
amount the dependent variable Y changes when the corresponding
independent variable changes 1 unit and n is the number of independent
variables.
In applying MR as a decision-making technique, the various attributes or
criteria will be represented as independent variables and the dependent
variable will represent the total score obtained by each alternative. Associated
with multiple regression is R2, coefficient of determination, representing the
percent of variance in the dependent variable explained collectively by all of
the independent variables. The higher it is, then the more accurate the model
is able to predict.
5.4.4 Multivariate Discriminant Analysis (MDA)
MDA is also a statistical analysis technique concerned with separating
distinct set of objects (or observations) based upon their observed
independent variables (Anada & Herath, 2009). The technique begins by
finding the most discriminating variable, which is then combined with each of
the other variables in turn until the next variable is found which contributes
most to any further discrimination between the groups. The process continues
in a similar manner until such time as very little discrimination is gained by
inclusion of any further variable (Holt, 1998).

170
The criteria which best discriminate between groups and which are most
similar is confirmed by computing the ratio of between-group variation to
within-group variation, simultaneously for all the independent variables. The
discriminate factors are then used to develop a linear discriminate function of
the form:
Z= C0 +C1 V1+ C2 V2+ ........Cn Vn……………….……..........................….5.4
Where Z is the score of the discrimant function; Vn is the nth discriminating
variable; Cn is coefficient of Vn and C0 is a constant.
5.4.5 Weighted Sum Method (WSM)
The Weighted sum method often called the decision matrix approach is
perhaps the earliest and the most commonly used approach, especially in
single dimensional problems. This evaluates each alternative with respect to
each criterion and then multiples that evaluation by the importance of the
criterion. This product is summed over all the criteria for the particular
alternative to generate the rank of the alternative. Mathematically it is
represented as:
…………………..…………………………………………..5.5
where Ri is the rank of the ith alternative, aij is the actual value of the ith
alternative in terms of the jth criterion, and wj is the weight or importance of
the jth criterion. Difficulty with this method emerges when it is applied to
multi-dimensional decision-making problems. In combining different
dimensions, and consequently different units, the additive utility assumption
is violated
!!! "#$!!
!"#$%&"'%()* +,'-)$#&.* /0"&* $1()2(3$&* $(40* ()3$,%(3"1$* 5"30* ,$&+$43* 3'* $(40*
4,"3$,"'%* (%!* 30$%*#2)3"+)$&* 30(3* $1()2(3"'%* -6* 30$* "#+',3(%4$* '7* 30$* 4,"3$,"'%.*
/0"&* +,'!243* "&* &2##$!* '1$,* ())* 30$* 4,"3$,"(* 7',* 30$* +(,3"42)(,* ()3$,%(3"1$* 3'*
8$%$,(3$*30$*,(%9*'7*30$*()3$,%(3"1$.*:(30$#(3"4())6*;<02&0(%*(%!*=(">*?@@AB>*
j
N
jiji waR
%CCCCCCCCCCCCCCCCC.D.E*
50$,$*=!""&*30$*,(%9*'7*30$*!30*()3$,%(3"1$>*(!#*"&*30$*(432()*1()2$*'7*30$*!30*()3$,%(3"1$*
"%*3$,#&*'7*30$*#30*4,"3$,"'%>*(%!*5#*"&*30$*5$"803*',*"#+',3(%4$*'7*30$*#30*4,"3$,"'%.*
F"77"42)36* 5"30* 30"&* #$30'!* $#$,8$&* 50$%* "3* "&* (++)"$!* 3'* #2)3"G!"#$%&"'%()*
!$4"&"'%G#(9"%8*+,'-)$#&.*H%*4'#-"%"%8*!"77$,$%3*!"#$%&"'%&>*(%!*4'%&$I2$%3)6*
!"77$,$%3*2%"3&>* 30$*(!!"3"1$*23")"36*(&&2#+3"'%*"&*1"')(3$!*;J')%$&>*?@@KL*M'0$9(,*
(%!*=(#(40(%!,(%>*?@@AB.*
Analytical hierarchy process (AHP)!
N%()63"4()* O"$,(,406* M,'4$&&* ;NOMB* "&* +$,0(+&* 30$* #'&3* 4'##'%)6* 2&$!* 7',*
+,"',"3"P(3"'%*'7*!$4"&"'%*()3$,%(3"1$&.* *F$1$)'+$!*-6*J((36*;QRS@B>* 30$*$&&$%4$*'7*
30$* +,'4$&&* "&* !$4'#+'&"3"'%* '7* (* 4'#+)$T* +,'-)$#* "%3'* (* 0"$,(,406* 5"30* 8'()*
;'-U$43"1$B*(3* 30$* 3'+*'7* 30$*0"$,(,406>* 4,"3$,"'%&*(%!*&2-G4,"3$,"'%&*(3* )$1$)&*(%!*
&2-G)$1$)&* '7* 30$* 0"$,(,406>* (%!* !$4"&"'%* ()3$,%(3"1$&* (3* 30$* -'33'#* '7* 30$*
0"$,(,406.*V)$#$%3&*(3*8"1$%*0"$,(,406*)$1$)*(,$*4'#+(,$!*"%*+(",&*3'*(&&$&&*30$",*
,$)(3"1$* +,$7$,$%4$*5"30* ,$&+$43* 3'* $(40* '7* 30$* $)$#$%3&* (3* 30$*%$T3* 0"80$,* )$1$).*
=(3"'* &4()$* (%!* 30$* 2&$* '7* 1$,-()* 4'#+(,"&'%&* (,$* 2&$!* 7',* 5$"803"%8* '7*
I2(%3"7"(-)$*(%!*%'%GI2(%3"7"(-)$*$)$#$%3&.*/0$*#$30'!*4'#+23$&*(%!*(88,$8(3$&*
30$",* $"8$%1$43',&* 2%3")* 30$* 4'#+'&"3$* 7"%()* 1$43',* '7* 5$"803* 4'$77"4"$%3&* 7',*
()3$,%(3"1$&* "&* '-3("%$!.*/0$* $%3,"$&*'7* 7"%()*5$"803* 4'$77"4"$%3&* 1$43',* ,$7)$43* 30$*
,$)(3"1$*"#+',3(%4$*;1()2$B*'7*$(40*()3$,%(3"1$*5"30*,$&+$43*3'*30$*8'()*&3(3$!*(3*30$*

171
5.4.6 Technique for Order Preference by Similarity to Ideal Solution (TOPSIS)
TOPSIS is widely acceptable technique among practitioners and it is easily
conceivable method and its calculations can easily be performed (Schinas,
2007). It can easily incorporate fuzzy approach. It may use any weight scale
selected by decision maker and it can use the same decision matrix. It can
also handle a larger number of alternatives that is considered in this research.
TOPSIS is based on the idea that the chosen alternative should have the
shortest distance from the positive ideal solution and farthest from the
negative ideal solution (Hwang and Yoon 1981; Schinas, 2007). The
assumption of the utility of each attribute tends to increase (or decrease)
monotonically. Then it is easy to locate the ideal solution, which is defined as
the sum of all best attribute values attainable, and the negative-ideal solutions
composed of all worst attribute values attainable.
5.4.7 Analytical Hierarchy Process (AHP)
The Analytical Hierarchy Process (AHP) is perhaps the most commonly used
for prioritization of decision alternatives. Developed by Saaty (1980), the
essence of the process is decomposition of a complex problem into a
hierarchy with goal (objective) at the top of the hierarchy, criterions and sub-
criterions at levels and sub-levels of the hierarchy, and decision alternatives at
the bottom of the hierarchy. Elements at given hierarchy level are compared
in pairs to assess their relative preference with respect to each of the elements
at the next higher level. Ratio scale and the use of verbal comparisons are
used for weighting of quantifiable and non-quantifiable elements. The method
computes and aggregates their eigenvectors until the composite final vector of
weight coefficients for alternatives is obtained. The entries of final weight
coefficients vector reflect the relative importance (value) of each alternative
with respect to the goal stated at the top of hierarchy. A decision maker may
use this vector due to his particular needs and interests, to calculate the
consistency index which must be lower than 0.10.

172
When all criteria are combined, an indexing algorithm termed the
‘sustainability or green utility index’ is created to rank options of competing
material choices on their contribution to sustainability. Each criterion is then
measured and combined using AHP technique to give an overall index score.
The higher the index, the more sustainable is the outcome. Table 5.1 gives a
summary of the various tools based on the levels of information on the
decision-making environment and the nature of output results as described by
Holt (1998).
Table 5.1. A comparative analysis of the characteristics of MCA techniques (Holt, 1998)
Technique Nature of input data Nature of output Scoring Multi-attribute analysis
Interval and ordinal but Subjective
Numeric score and ranks and hence rank amongst alternatives
Multi-attribute utility theory
Raw data is often qualitative, utility achieves interval data
Numeric score and ranks and hence rank amongst alternatives
Multiple regression
Interval predictive Numeric; further value
Linear programming
Value judgment on the importance of an over-all objective
Maximisation of objective function
Multivariate discriminant analysis
Multivariate Group membership/group characteristics
Weighted sum method
Interval and ordinal but Subjective
Numeric score and ranks and hence rank amongst alternatives
TOPSIS Raw data is often quantitative Numeric score and ranks Alternatives from the positive ideal solution
Analytical hierarchy process
Raw data is often qualitative and quantitative, utility achieves interval data
Numeric score and ranks and hence rank amongst alternatives

173
5.5 The Multi-Criteria Assessment Technique Adopted
Nijkamp et al. (1990) note that selecting an ideal MCDA for a particular
study means that the selected method must allow for the weighted
aggregation of quantitative individual factors, which requires that the method
is utility or value based, quantitative in format and provides a cardinal
measurement of the weighted differences amongst factors and not merely
ordinal difference. They add that the method must be such that it is
transparent so that the method of construction can be disseminated for
robustness, and formalises explicitly the logical thought processes that are
implicitly carried out by the designer when faced with a material selection
problem. Given the complex range of considerations associated with the
selection of LCGBMCs and having full knowledge of all possible
consequences of all potential material alternatives, the AHP model of
decision-making was adopted to demonstrate the concept of the selection
methodology for the proposed MSDSS model. The following section explains
the rationales for selecting the AHP model of decision-making.
5.5.1 Rationale for Selecting Analytical Hierarchy Process (AHP)
The following are the various contexts for which AHP was selected as the
ideal selection/assessment methodology for the proposed MSDSS model over
other available techniques.
• Most multiple objective programming techniques face the problem of
dealing with a large (if not infinite) number of alternatives (Singh et al.,
2007). Since the proposed MSDSS model would require significant
amount of quantitative and qualitative data input including: numeric,
descriptive, and categorical data, using AHP model would ensure the
resolution of conflicts between tangible and intangible factors as decision
making in reality engages with solid, verbal, objective and subjective
elements;

174
• There were anticipations that choosing an ideal product from a range
of competing alternatives in the MSDSS model might involve multiple
step analytical method of judgment. With the AHP technique, potential
users are able to break down complex unstructured problems into
component parts, and arrange these parts into a hierarchy of a much
simpler and more logical judgments by simply assigning numerical values
to represent each of their preferred choice of materials and variables;
• The components of the MSDSS framework are modular, and as such
each may be developed independently or require future modifications.
Since data may be added subsequently to supplement the knowledge and
databases, the AHP model- given its flexible nature of accommodating
inordinate number of considerations, would be capable of handling extra
attributes as they are acquired.
• Unlike other MCDA models, the AHP model can be easily
implemented using any simple and very familiar spread sheet or software
application such as the MS Excel, MS Access and MSWord;
• It was anticipated that comparing LCGBMCs will involve the use of
numerical logics and will include attributes that are measured on a number
of different numerical scales or user-specified weightings. AHP was
selected to enable the formulation of the mathematical models required for
computing the Green Utility Index (GUI), since numerical calculations and
algorithmic procedures are an essential requirement for the proposed
MSDSS model.
The computational assessment procedure associated with the Analytical
Hierarchy Process (AHP) is fully discussed in Appendix H. The following
section describes how the MSDSS model for LCGBMCs is developed and
how the internal storage structure and file organisation are specified including
the system configuration procedures.

175
5.6 System Design and Development: Physical Data Modeling of the MSDSS Model
5.6.1 Introduction
The overarching aim of this research has been to explore how designers can
be better enabled at the earliest stages of the design to incorporate
sustainability principles into the material selection decision-making process
when formulating decisions to select LCGBMCs for their mainstream use.
This section describes the development process of the MSDSS model, and
examines the various functions and types of database management
software/hardware applications relevant to this study.
Section 5.6.2 establishes the primary function and underlying rationale for
choice of each software and hardware along with their relative advantages
and disadvantages. Section 5.6.3 discusses the steps followed in the design
and development of the MSDSS analytical system including data modeling
development techniques, which include the conceptual, logical, and physical
data modeling process.
First, it details the system architecture of the MSDSS analytical system user
interface, and establishes where each database module is going to be located,
and what function each module is to perform in section 5.6.4. Section 5.6.5
demonstrates the selection methodology adopted for LCGBMCs. It describes
the operation of the system to give an overall understanding of the workings
and application of the system; showing the logic, functions, and relationships
between the various data organized in different modules, and compatibility
between the various sources of information collected in section 5.6.6.

176
5.6.2 Database Management Software for Modeling the MSDSS
The choice of the specific database management applications for the design
and development phases was one of a strategic nature. Several database
management software choices were considered to build the MSDSS databases
such as Java script, MS Excel, and MS Access. In the MSDSS analytical
system, the main software packages considered include Microsoft Excel 2013
version, Microsoft Access, Microsoft Word, and Macro-in-Excel Visual
Basic for Applications. MS Excel 2013 was selected as the core storage
software as it provides capabilities in information processing, managing
complex/multiple databases, spatial analysis, graphic user interfacing, and
mainly because of the presence of several enhanced plugs and extensions
capable of improving functionality of the system. The following sections
discuss the underlying rationale for choice of each database management
application along with their relative advantages/disadvantages.
5.6.2.1 Microsoft Excel
The Monitoring database of the MSDSS model was initially organised by
using Microsoft Excel 2013, which is the most basic of the current versions of
Microsoft Excel software (Microsoft, 2013). The software was chosen
because of its capabilities to retrieve, store and query non-spatial/attributes
information efficiently and ability to handle the relatively large data. This
software allows enforcing key constraints and referential integrity constraints
thus, guarding against errors in the database. In the designed database, the
properties of the desired data for each modular unit are specified and in other
cases automatically rejected by the DBMS, if data with wrong properties are
entered. Excel also allows integration of different data formats e.g. Excel
Data base file can be converted to other formats like Access and word files.
In addition, Microsoft Excel possesses a powerful macro language that is
essential since a menu driven interface had to be developed. MS Excel has the
ability to upgrade itself as current versions of the software are released.

177
5.6.2.2 Microsoft Word
The MSWord 2013 version was selected as the ideal data-editing tool for
inputting material data from various sources. Microsoft Word was used in
most data integration steps because of its user-friendliness and ease in
creating intermediate text based data formats.
5.6.2.3 Programming Language (1): Visual Basic for Applications 6.0
Chapra (2007) describes Visual Basic for applications (VBA) 6.0 as an
example of a graphical-based language and Microsoft Widows programming
language used to create the graphical user interface (GUI). Visual Basic 6
programs according to Halberg et al. (1997) are created in an Integrated
Development Environmental (IDE), which allows the programmer to create,
run and debug Visual Basic programs conveniently, and create working
programs in a fraction of the time that it would normally take to code
programs without using IDEs. The following are some of the advantages and
disadvantages of the VBA 6.0 program.
Advantages of Visual Basic for Applications 6.0
• Easy to install
• Faster compiler
• Allows database integration with wide variety of applications
• Additional internet capabilities
• Easy to Back up and restore
Disadvantages of Visual Basic for Applications 6.0
• Poor visual appeal –most models based on the application are visually
unattractive
• Only works in a Local Area Network, therefore requires installation
on every computer to launch model

178
• Much more difficult to upgrade if updates are needed, as user has to
manually upgrade the software.
• Applications built using the 32-bit version of Visual Basic 6.0 only
runs with Windows 95 or Windows NT (Version 3.5.1 or higher), but not
compatible with Macintosh operating systems
• System is too complex to run
• May not be able to handle complex problems as much as VB.Net or
Macro-in-Excel, since the proposed model involves large amount of logic
5.6.2.4 Programming Language (2): Macro-in-Excel Visual Basic for Applications 6.0 (MEVBA)
Macro-in-Excel VBA has a wide array of unique and useful features that are
the best and only reason for using VB in programming. Compared to other
programming language such as C++, or Java, Macro-in-Excel VBA is an
object-oriented programming language that is considered a step up from older
versions of Microsoft Visual Basic Applications (VBA).
Advantages of Macro-in-excel Visual Basic for Applications
The following outlines the advantages of Macro-in-Excel VBA (MEVBA).
• A powerful object-oriented programming language: Macro-in-Excel
Visual Basic for Applications has many language features that allows
users to easily create multi-threaded, scalable applications using explicit-
multi threading. This aspect enabled more detailed consideration of a
larger number of factors and material alternatives in the MSDSS model.
• Makes application easier to maintain: Since the MSDSS was designed
to contain large number of macros that would respond to events on reports,
there was a likelihood of potential difficulties in maintaining the system.
With MEVBA, codes were easily built into form, causing the system to
handle and manage the large volume of data typically associated with
LCGBMCs.

179
• Enables the developer to improvise functions: The MSDSS contains a
series of mathematical model and computational algorithmic procedures
that provides a basis for improvising new functions or logic. With
MEVBA, it was easy to transform data by performing arithmetic and
logical operation, and formulate the mathematical model for computing
the green utility index (GUI). This enabled the MSDSS model create
unique functions to either perform calculations that exceed the capability
of an expression or replace complex expressions written in the model
application.
• Mask error messages: Applications used by a variety of people almost
always require some code for handling errors. Using MEVBA helped to
automatically detect error during tests run without having to create its
unique code systems for detecting and handling errors.
• Skilfully create or manoeuvre objects: The MEVBA application
enables the developer to skilfully create and modify objects using unique
codes. This facilitated the manoeuvering of all the objects within the
database of the MSDSS model.
• Flexible coding: Coding an argument simply means supplying the
additional information that some actions require. With Macro-in-Excel
VBA, it was easy to pass arguments to the code at the time it ran, allowing
a great deal of flexibility on how the codes were run.
• The primary strengths of the MSDSS framework are its modularity
and expandability. Since the components of the framework were modular,
Macro-in-Excel VBA enabled the splitting of the databases into modular
units, which allowed for each unit to be developed independently without
having interfering with the entire system.
• It has the ability to write scripts and automatically convert raw
material data to an appropriate and usable condensed graphic data format

180
• Macro-in-Excel VBA is able to encapsulate much of the basic
functionality that used to have to be built using other programming
languages such as VBA 6.0. The Macro-in-Excel VBA Framework has the
code that makes Windows Forms work, so any language can use the built-
in code in order to create and use standard Windows forms;
• Macro-in-Excel VBA applications could be run on any operating
system hosting the VBA Framework. In other words, the user could
achieve true cross-platform capabilities simply by creating Macro-in-Excel
VBA applications, provided the VBA Framework is available for other
platforms;
Disadvantages of Macro-in-Excel Visual Basic for Applications
• The one thing not suitable to make programs in Macro-in-Excel VBA
is that it uses lots of processing time (CPUs).
• More memory space is usually required to install and work in Macro-
in-Excel VBA, since it contains Graphical components that need more
space. To address this problem, the system was made to run on higher
specifications of 2 to 4 GB of RAM, and approximately 80-500 GB of
hard disk space.
5.6.2.4 The Rationale for programming language adopted for developing the MSDSS Model
Copeland (2004) noted that although each programming language has its own
strengths and weaknesses, the reason for choosing a particular language
might ultimately be based on a range of factors (IEEE, 1990). Beizer (1995)
noted that the appropriate program to use for developing a DSS model mainly
depends on the contextual components of the system. In order to identify a
more reliable program for developing the proposed MSDSS model, certain
factors were considered.

181
Some of the factors considered during the review include; the availability of
potential users familiar with the program, how well the language fits in with
the model, life-cycle costs of development and use, portability, safety and
reliability, ability to handle complex logic and numeric expressions,
flexibility, ease of coding and reading, ease to compile and identify bugs, and
tendency to run codes on any windows platform. Recent studies, including
several by Walkenbach (1999) and others by Halberg, et al. (1997), and
Chapra (2007) cover Macro-in-excel VBA extensively. Since it was
envisaged that the development process would involve constant modification
and subsequent expansion of the database to accommodate more information,
consideration of the factors suggested “Macro-in-Excel VBA” as the ideal
program for developing the proposed model, given that its advantages (listed
in section 5.6.2.4), outweighs those of other reviewed programs.
5.6.3 Database Management Hardware for Modeling the MSDSS
Database management hardware is any physical device used as part of a
computer system to enhance a program or software (IEE, 1999; Bertolino,
2001). Generally, the main hardware components include the processing unit
and the peripheral unit. Given the advantages of Macro-in-Excel VBA, the
MSDSS model was designed to run under all forms of Disk Operating
Systems (DOS) including Windows 95/98/NT/2000, Microsoft Windows 8,
7, Vista, XP; Windows Server 2012, 2008, 2003; Windows Embedded
Standard 7; Windows Embedded Standard 2009 Operating Systems, and
Macintosh. For satisfactory operation, the software requirements of the
system include the following specifications: Intel Celeron processor or
compatible or higher specification; 2 GB of RAM; approximately a minimum
of 80 GB of hard disk space in addition to space required for storing large
files in the system folder and a 15 inch monitor to present information in a
highly visual manner. Below is a schema illustrating the interrelationship of
the various features/components of the automated material selection decision
support system for assessing LCGBMCs selection process.

182
5.6.4 System Architecture of the MSDSS Model
Figure 5.2 shows the overall schema or architecture of the MSDSS analytical
system, which consists of an extensive modeling of the interactions between
the various components of the system as described in section 5.6.6. The
system consists of a number of interconnected modules/features that are also
described in Table 5.2.
Figure 5.2. Modified conceptual model of the Material Selection Decision Support System (MSDSS)
Table 5.2. Individual functions of the various features/components of the conceptual framework
FEATURES OF THE MSDSS
MODEL
FUNCTIONS OF THE VARIOUS FEATURES/COMPONENTS
1. Design Elements and Parameters Module
This unit consists of a range of building design elements, their respective attributes, parameters, description, dimensions (including size, colour shades, form, and thickness) and other performance requirements specific to all candidate materials and components. The elements include: External Wall, Internal Wall, Beam, Column, Floor & Slab, Pavement, Skirting, Door &Window, Stair, Ceiling, and Roof.
It also responsible for generating the initial set of all potential competing material alternatives specific to the elected design element. Here, the decision-maker is able to input the relevant dimensional values of various building materials for each design element.
!!!!!!!
Material Knowledge/Rule
Base !
Design Elements and
Parameters
Green Utility Index Evaluator for Selected Materials
!
User Weightings
Weighting Extractor !
Material Choice Generator
List of Potential/Feasible
Materials !
Amalgamator
!• Multiplies and sums user weightings
with normalised values for each potential material
• Creates an index of subjective utility
for each material alternative
Results ! OUTPUT
INPUT

183
2. Material Selection Decision Rules/Heuristics Module
This unit consists of a collection of set-rules used in current practice(s) for measuring the project-specific minimum requirements during material selection. It is used to define the boundaries, and the consideration of the context of use, and describes the Material Selection Rules to test the suitability of each material selected by the user.
It involves listing of context-specific materials of an elected design element, by gradually srcutinising and eliminating candidate materials based on their inability to meet stated material selection heuristics/rules.
3. Material Choice Generator Module
This unit consists of all eligible material alternatives that are available for the intended task.
4. Users’ Weightings Module
This unit enables the user to sort out preferred weighting value(s) for specific factors.
5. Weighting Extractor Module
This feature enables the user to assign different weighting values to each factor, according to the subjective importance, which that factor/variable holds for the user against a set of competing materials eligible for the intended task.
6. Green Utility Index Evaluator Module
-The Green Utility Index Module is responsible for performing logical queries by sorting out input values for each factor against corresponding values of competing materials using the AHP model of decision-making.
7. Amalgamator Module
-The amalgamator module is responsible for calculating the weights (usually numeric figures given to each material by the user).
Here both the weighting value for the material and the value for the factors are multiplied and summed to create a list of preference for the material alternative(s) selected by the user.
-Finally it ranks each material by sorting the alternatives according to the utility value of the calculations for all the materials that were compared.
8. Results Module - This feature views the MSDSS APP data, and generates reports. It allows the MSDSSAPP User Interface to communicate with the user, and also connects all the reports and queries that are generated in the Monitoring databases to the corresponding project files. -This unit is responsible for generating results in form of graphs, quantitative and descriptive reports, showing variance of materials suitability in relation to the relevant factors inputted by the user

184
5.6.5 Selection Methodology of the MSDSS Model
The diagram shown below (in Figure 5.3) demonstrates the conceptual
framework of the selection methodology for the decision support system.
Table 5.3 describes a step-by-step procedure of the selection methodology
for the material selection decision support system.
Figure 5.3. Materials selection methodology of the MSDSS model
!!!!!!!!!
[1] Define or state the overall objective or goal
[6] Select one alternative based on ranking
[3] Prune all infeasible alternatives from set
[4] Evaluate remaining alternatives:
• Weight attributes • Calculate values for attributes • Amalgamate weighted attributes • Develop ranking
[5] Review ranking of alternatives
[7] Proceed to next Design
Element
[2] Identify set of all possible material alternatives

185
Table 5.3. Step-by step approach of each objective and task of the material selection methodology
OBJECTIVE TASK
1. Define or state overall objective/goal
The first step of the methodology is to define the main goal of the intended task.
2. Identify Sets of all Potential Material Alternatives
After defining the main goal of the task, the next step is to generate a set of all possible alternatives. In the material selection process, this comprehensive set of alternatives includes all the construction materials and components currently in the database, or manufacturer’s webpage.
3. Prune all infeasible alternatives from set
The third step is to reduce the complete set of alternatives by eliminating/pruning those alternatives, which are clearly infeasible/unsuitable for the intended application according to the Construction Standards Institute (CSI) Divisions. For example, if the element under consideration is a structural beam, materials such as roofing sheet and glass are automatically pruned from the set of possible alternatives under consideration, since none of these materials fall under the CSI structural divisions. This should result in a subset of alternatives specific to the elected design element under consideration, all of which would be feasible choices for the intended application. The “pruning” approach is used rather than allowing the user to select feasible materials from the whole set since users tend to overlook alternatives which might be unfamiliar to them but are feasible.
4. Evaluate Remaining Alternatives
• Weight Attributes
(Decision Factors)
• Calculate Values for Attributes
• Amalgamate
Weighted Attributes
• Develop Ranking
The fourth step in the methodology is to evaluate the feasible alternatives using the AHP model such that a ranking can be developed according to the relative importance of the material in relation to the key factors.
• First, the decision maker weights each factor according to the relative importance that the decision factor or variable holds for the decision maker, in order to supplement, not replace, his judgment.
• Second, values for each of the factors are determined for each material based on the AHP model of decision-making and then, a normalized value between zero and one is calculated for each factor value.
• Afterwards, the weights and normalized values are multiplied and summed to create an index of preference for the set of alternative(s).
• Then, a list of alternatives ranked according to the relative importance of the factors is presented.
5. Review Ranking of Alternatives
When the indices of factors have been calculated for all eligible alternatives, a ranking is developed sorting the alternatives according to each utility value. The alternative with the highest utility value is recommended from the ranked list of potential materials for each design/building element.
6. Select Alternative Based on Ranking
The decision maker may then either elect/decide to select the highest ranked alternative, or choose another alternative from the set based on his/her professional judgment.
7. Proceed to Next Design Elements
The decision maker then proceeds to the next design/building element.

186
5.6.6 Working Procedure of the MSDSS Model
The modified system architecture of the conceptual model presented in
Figure 5.5 of section 5.6.4 illustrates the workflow and interactions between
various components of the MSDSS model. The following steps further
explain how the MSDSS model operates. To use the system as illustrated in
Figure 5.5 the following steps are undertaken:
I. The load manager first launches the MSDSS application and instructs
the user to enable macros, which then activates the operational process;
II. The system automatically provides user with a list of design elements
from the “List of Design Elements” module, and then queries/prompts
the user to select his desired building design element for the intended
task;
III. The User then selects the particular design element needed for the
intended task from a list of conceptual design elements (broken down by
Construction Standard Institute Division); and then prompted by the
system to provide dimensional values for the selected design element;
IV. User enters dimensional values to answer prompts about areas and
dimensions of the elected design element;
V. The system validates the dimensional values entered by the user, and
then generates the set of all relational building material alternatives that
are available for selection within the ‘materials’ database;
VI. The system with the help of a set of material selection heuristics/rules
along with the details provided by the user- generates a list of feasible
materials relevant to the elected design element. Here, the system
automatically narrows down the list of available materials to a few
eligible candidate materials that fulfill a set of user-defined
queries/requirements;

187
VII. After the set of feasible material alternatives has been generated, the
user is then prompted to assign factor weightings according to the
relative importance that each factor or variable holds, and a normalized
value between zero and one is calculated for each factor in relation to the
set material alternatives;
VIII. Then, the normalised value of each factor is amalgamated (multiplied
and summed) with the normalised values for each potential material
alternative, which then results in a relative ranking of the feasible
materials for the elected design element, hence creating an index of
subjective utility for each material alternative;
IX. When the indices of utility have been calculated for all feasible
material alternatives, the system displays in a descending order of
ranking, a list material alternatives according to their utility values;
X. The system prepares the output graphical results and a layout, leaving
the user with the option of either selecting the highest ranked alternative
recommended by the system, or another alternative from the set based on
his professional judgment;
XI. The user may elect to generate a printout report of the list of selected
materials;
XII. The user then proceeds to the next design element.
Figure 5.4 below shows an illustration of the workflow system architecture
of the Material Selection Decision Support System (MSDSS). The full details
of the steps involved in the workings of the actual prototype MSDSS model
are presented in section 5.7.

188
Figure 5.4. Illustration of the workflow showing the material selection decision-making process with the
help of the MSDSS experts’ knowledge tool
5.7 Prototype of MSDSS User Interface Menu
This section of the chapter illustrates the various working procedures of the
actual prototype model. It describes how the various components of the
MSDSS are managed during the material evaluation and selection process.
STEP 1
In the MSDSS main menu the user has the option of whether to proceed or
discontinue with the task.
-To discontinue, the user clicks on the < Exit> button.
-To proceed, the user double clicks the <MSDSS ICON> to launch the
MSDSS application
!"#$%&"'()*#("+"&'",'$(-*%(.$'$/#$0($'$1$)#(#23$(
!"#$%&"'(-"''.(
(
!"#$%&"'(-"&'.(
(
4")5(,2(6.$%(/%&#$%&"(
4")5(,2(7%$$)(&)0$8(
4$3*%#(96#36#(
!"#$%&"'(:"#"(;)36#(
<.$%(.$'$/#.($'$1$)#(#23$(
<.$%($)#$%.(0$.&7)(3"%"1$#$%.(
(
<.$%("..&7).(=$&7>#&)7.(#*(/%&#$%&"(
?33'2(?@A('*7&/(

189
Figure 5.5. User interface of the prototype MSDSS analytical system main menu
-The user then clicks on the <BEGIN> tab/button to initialize a project
task (Figure 5.5).
-To activate the instruction manual, the user is prompted to click the
<USER INSTRUCTIONS ON/OFF> tab. This guides the user as (s) he
progresses through the set task.
Figure 5.6. Shows sample of the introduction table
-The <INTRODUCTION> tab/button introduces the main functions and ultimate goals of the MSDSS model (Figure 5.6).

190
Figure 5.7. Sample of the copyright instructions
-The <ABOUT> tab/button provides the copyrights instructions about the
model version (Figure 5.7).
-To proceed to the next window, the user clicks on the <USER
INSTRUCTIONS ON/OFF> button to activate the instruction guide and
then the <BEGIN> button to commence the task.
STEP 2
Figure 5.8. Sample of the design element user interface menu

191
-This phase displays the dimensional scales for the available DESIGN
ELEMENTS (Figure 5.8).
-Here, the user is provided with a list of design elements and a range of
dimensional values.
-User is prompted to select the particular design element required for the
intended task (broken down by Construction Standard Institute Division);
and assign dimensional values (Figure 5.8).
-User enters dimensional values using the dropdown list of the
<SELECT DIMENSION> tab, to answer prompts about areas and
dimensions of the elected design element
- After system validates the dimensional values for the elected design
element, the user then proceeds to the next task by clicking on the
<NEXT> button.
STEP 3
- This phase displays the <MATERIAL HEURISTICS>, which consists
of a collection of set-rules used to define the minimum requirements or
threshold of each material or component (Figure 5.9).
-User is prompted to assign threshold values under each category of the
<MATERIAL HEURISTICS>.
-User assigns values to a range of thresholds associated with the material
properties using the scroll down tab/button, prompting the system to
generate and display the set of all eligible building material alternatives
associated with the elected design element.
- After the set of feasible material alternatives has been generated, the user
then proceeds to the next task by clicking on the <NEXT> button.

192
Figure 5.9. Menu for the knowledge base
STEP 4
Figure 5.10. Sample of the value extractor user interface menu for the property category weightings
-This phase displays the <VALUE EXTRACTOR>, which consists of a
set of property category weightings on the left column.
-This option enables the user to access the dynamic weighting values
from 1-9 and calculate the relative importance of each main factor such
that Consistency Ratio (CR) is less than 0.10 (Figure 5.10)

193
-The user is given the option of either using the <TEST DRIVE> to
engage in a quick comparison between pairs of materials as to determine
the relative worth of one against another, OR
-The user is prompted to assign weightings to the parent factors
according to their subjective importance, as to determine their relative
importance.
-In cases where the CR of each parent factor exceeds 0.10, the user is
either prompted to readjust the weightings OR reassign the weightings
using the <RESET> button to netralise all weightings.
STEP 5
- This phase displays the <MATERIAL HEURISTICS>, which consists
of a collection of set-rules used to define the minimum requirements or
threshold
Figure 5.11. Value extractor user interface menu for the sub-material property weightings
-This phase also displays the <VALUE EXTRACTOR>, which consists
of a set of material property weightings. This option enables the user to
access the dynamic weighting values from 1-9 (Figure 5.11)

194
- User is prompted to assign factor weightings according to the relative
importance that each sub-factor holds,
-User assigns weightings to a set of sub -factors, and a normalized value
between zero and one is calculated for each category of the sub-factors in
relation to the set material alternatives using the ORANGE fields on the
right column. After pairwise comparison of each sub-categorical factors,
the user then proceeds to the next task by clicking on the <NEXT> tab
STEP 6
-This phase displays the <AMALGAMATOR>, responsible for
calculating the overall final/global weightings (Figure 5.12).
-System amalgamates (multiplies and sums) the normalised value of each
factor and sub-factors with the normalised values for each potential
material alternative,
Figure 5.12. Amalgamator generating matrix results based on the calculations performed

195
Figure 5.13. System showing trade-off values of each factor category against others 1
STEP 7
-The system logic TRADES-OFF the values of each criteria category
against the others (see Figure 5.13).
-System performs the pair-wise comparison for the elected factors to
create the scores of the COMPARISON MATRIX (see Figure 5.14)
-System NORMALISES the comparison matrix so that all values in the
columns totals 1 (see Figure 5.15).

196
Figure 5.14. System showing scores of the comparison matrices
Figure 5.15. System displaying the normalised scores of the comparison matrices

197
STEP 8
-System performs PAIR-WISE COMPARISON for the selected
materials as shown in Figure 5.16.
-The system generates the normalised scores of the pair-wise comparison
for the selected materials (Figure 5.17).
Figure 5.16. System displaying the pairwise comparison scores for the selected materials
Figure 5.17. Normalised score of the comparison matrices for the selected materials

198
STEP 9
-System calculates the MEAN VALUE of each row (Figure 5.18)
-System carries over the column of AVERAGES to create the SCORES
MATRIX (Figure 5.18).
-System displays the score data for each material alternative (Fig. 5.19).
Figure 5.18. System displaying the calculated mean value of each row
Figure 5.19. System displaying the calculated mean value of each row

199
STEP 10
-System generates The GLOBAL WEIGHTINGS and creates an index of
SUBJECTIVE UTILITY for each material alternative
- After creating the subjective utility for each material alternative, the
user then proceeds to the FINAL task by clicking on the <NEXT> button
Figure 5.20. Calculated global weighting results from the products of the factors
Figure 5.21. Calculated global weighting results from the products of the factors

200
FINAL STEP
-This phase displays the <RESULTS> of the overall tasks undertaken
-System displays a GRAPHICAL LAYOUT of the material alternatives
with their relative utility values in a descending order of ranking (Figure
5.22).
-User either selects material with the highest UTILITY VALUE as
recommended by the system, OR, User decides on an alternative product
using his professional judgment (Figure 5.23)
-User is prompted to the click on the <SHOW FULL DATA FOR
SELECTED MATERIALS> button to view the various properties of the
selected building material/component (Figure 5.24)
-User may elect to either preview the electronic copy of the REPORT on
the screen, print, or send it to a Word or Excel file for further analysis
and formatting (Figure 5.25).
-Finally, user may proceed to printing, to retrieve a hardcopy of the
report (Figure 5.26)
Figure 5.22. Sample menu from which the results are generated and how they are displayed

201
Figure 5.23. Sample of the MSDSS analytical system report of user’s preferred choice
Figure 5.24. Generated reports of the material properties from the MSDSS reports menu

202
Figure 5.25. Generated printout details of the selected materials
Figure 5.26. Sample printout preview in PDF format

203
5.8 System Testing: Physical Assessment of the MSDSS Model
This section describes the various testing methods adopted for this research. It
focuses on testing the specific components and operations of the MSDSS
model to identify potential errors, in order to fix notable faults detected in the
cause of development. The following section describes the testing processes
of the MSDSS model, the various types of testing procedures used in this
study and the rationale for their choice.
5.8.1 Testing of the MSDSS Model
Copeland (2004) defined software-testing ss the process of analysing a
software item to detect the differences between existing and required
conditions (otherwise known as debugging) in order to evaluate the features
of the software item. According to Bertolino (2001), software testing is an
activity that should be done throughout the whole development process
(IEEE, 1990: Bertolino, 2001).
To assess the quality of the prototype MSDSS model and determine whether
the model satisfied the conditions proposed at the start of the development
phase, an initial test run was conducted to check the internal mechanism of
the links and source codes for any bugs or unidentified errors. The initial test
run undoubtedly detected some errors and bugs (as shown in Figures 5.27;
5.28; and 5.29), which were later corrected to improve the system usability.
To further check the consistency of the result outputs of the model against
easily calculated values of some random input variables, the black box
method was also employed as ideal test method during and after the
development processes of the model.
Section 5.8.2 presents the details of the black box methods of testing as
applied to this research, and rationale for adopting the approach.

204
Figure 5.27. Debugging template
Figure 5.28. Test result of the debugging process
Figure 5.29. Template showing a list of detected errors after initial test runs of the internal links

205
5.8.2 Black Box Testing Approach and Rationale for Choice
Beizer (1995) defined black box testing as a testing system that ignores the
internal mechanism of a system, but focuses solely on the outputs generated
in response to selected inputs, variables and execution conditions. He argues
that the users do not have access to the source code, since they are privy only
to the input and output data. The following are reasons for which the black
box test run method of assessment was adopted.
• Easier and less time consuming method of comparing and checking
the consistency of the outputs of the developer with the random input
variables of independent testers since it does not permit assessing the
internal mechanisms of the model;
• Well suited to handle large code segments since the MSDSS
contained several source codes;
• Less expensive method of testing compared to white box, given the
limited resources of this research and that it does not necessarily require
software experts to perform the tests;
• Easier to detect misinterpretation of requirements and unpredictable
behaviour;
Given the nature of the model, two types of black box test run approaches:
the functional and regression test-run methods were employed. An
extensive study of the black box and white box method of analysis can be
seen in Beizer (1995).

206
5.8.2.1 Functional and system testing
To ensure that the functionality of the MSDSS model specified in the
requirement specification- at the start of the model development- complied
with the envisaged standards, the functional/system testing method was
applied due to its human-computer ability to interpret and display results
through the Graphical User Interface (GUI).
Stage of Application: The test was conducted during the various phases of
the development process using a test case planning document (see sample in
Table 5.4). This was extended through further cycles of evaluation and
refinement, where the prototype model was tested with various versions and
types of operating systems and/or applications.
Assessors: This test was undertaken by a handful of independent testers in
the UK and USA, all of whom had no knowledge of the internal structure and
workings of the programs.
Table 5.4. Test case planning template
Software Engineering – Dr Ghazy Assassa Page 2 of 5
Test Case Template (Doc:T_01)
Test Case #: Test Case Name: Page: 1 of ..
System: Subsystem:
Designed by: Design Date:
Executed by: Execution Date:
Short Description:
Pre-conditions
Step Action Expected System Response Pass/Fail
Comment
1 2
Post-conditions

207
Requirements and Tasks: To avoid bias and validate the result outputs, test
runs were undertaken by five (5) neutral testers from the UK and USA-
(particularly those who had participated in the preliminary study and were
verse in the AHP concept), using the test case-planning template shown in
Table 5.4. This enabled the study to easily compare the results of the
independent testers with the test results of the programmer/developer to
correct any noticeable error before they were sent to design and building
practitioners in Nigeria. The template provided the necessary instructional
guide on use, in terms of the time required, speed, and extent to which a user
can learn to operate, prepare inputs for, and interpret outputs of the MSDSS
model. The model was assessed based on the following requirements:
• Incorrect or missing functionality;
• Interface errors;
• Errors in data structures used by interfaces;
• Behaviour or performance errors; and
• Initialization and termination errors.
Findings: The outcome of the results of independent testers showed
seemingly similar outputs but slight differences regarding incorrect
functionality from the results of the programmer, which proved that the
components of the model were in a fairly stable condition, given that the
model did not exhibit most of the underlying errors listed above (see Table
5.5). Following the identification of some minor errors, changes were made,
which culminated in an operationally stable system, to meet the requirements
for low-cost green building material information analysis.

208
Table 5.5. Test case template showing the result analysis of the model after a test-run by an independent assessor
Test Case #: 2.0 Test Case Name: Material Selection
System: MSDSS MODEL Subsystem: Select Ideal Materials
Designed by: Researcher Design Date: 15/03/2013
Executed by: Anonymous Independent Assessor Execution Date: 28/05/2013
Short Description: Test the Selection Methodology and Performance of the MSDSS Model Page: 1 of 2
Pre-conditions The user has a system installed with Windows XP, Windows 7, Vista, or Macintosh; Intel Celeron processor or higher specification; 2 GB of RAM; approximately a minimum of 80 GB of hard disk space, a minimum of 13.3” monitor The user has a valid and current version of Macro-in-Excel VBA or Microsoft Excel 2010 or higher version installed on his system The user has accessed the MSDSS model by clicking on the “Enable Macros” button to activate macros
The system displays the main menu Step Action/Instruction Expected System Response Actual System Response
as Identified by the assessor
Pass/ Fail
Independent Assessor’s Comment
1 Click the 'USER INSTRUCTION’ button
The system responds to the command by highlighting the button
The system did respond to the command by highlighting the button
P The system responded to the command in time
2 Click the 'BEGIN’ button
The system displays a message of successful operation requesting that the user: 1] Selects a category of the design element, 2] Enters dimension values
The system displayed a message of successful operation and requested that I: 1] Select a category of the design element, 2] Enter dimension values
P Successful operation
3 Click 'OK' button The system asks the user to select the desired attribute threshold from each drop-down list
The system instructed that I select my desired attribute threshold from each drop-down list
P Successful operation
4 Check post-condition 1
The system displays a message of successful operation
√ √ OK
5A Click 'PROPERTY' button Click 'OK' button for Demo Operation Click 'CANCEL' button to Exit Demo Operation
The system asks the user to perform a demo operation.
The system asked if I wanted to perform a demo operation. I clicked the ‘OK’ button and a demo was performed showing the value elicitation steps.
P OK
5B Select 'VALUES 1-9' from the dropdown list button
After the demo operation, the system displays a message asking the user to enter values for each parent factor on a scale of 1-9
At the end of the demo, the system displayed a message asking that I enter values at my discretion for each parent factor on a scale of 1-9
P OK
6 Click 'OK' button The system displays a message of successful operation if the Consistency
The system displayed a message of unsuccessful operation and then
F Failed operation Error

209
Ratio (CR) < 0.10 instructed that I re-confirm the Consistency Ratio (CR)
identified CR > 0.10
7 Repeat steps 5A, 5B and 6 by adjusting weighting values and Click 'OK' button to continue
The system displays a message of successful operation
The system displayed a message of successful operation after readjusting the values.
P Consistency achieved CR< 0.10
8 Click 'MATERIALPROPERTY' button
The system asks the user to enter values for a specified set of sub-factors on a scale of 1-9
The system instructed that I enter values for a specified set of sub-factors on a scale of 1-9
P Successful operation
9 Click 'OK' button to continue.
The system displays a message of successful operation if Consistency Ratio (CR) < 0.10
The system displayed a message of unsuccessful operation and instructed that I re-confirm the Consistency Ratio (CR)
F Failed operation Error identified CR > 0.10
10 Repeat steps 8, and 9 by adjusting weighting values and Click 'OK' button
The system displayed a message of successful operation
The system displayed a message of successful operation after readjusting the weighting scale
P Consistency achieved CR<0.10
11 Check post-condition 2
The system displayed a message of successful operation
√ √ OK
12 Click 'NEXT' button The system performs an ‘AMALGAMATION’ of the values entered in steps 5A, 5B, 6, 7, 8, and 9, and finally displayed the results
The system displayed a message of unsuccessful operation and instructed that I re-confirm the Consistency Ratio (CR) and total score of Utility Green Index (UGI)
F Error identified Sum of values > 1.0000
13 Repeat steps 5A, 5B, 6, 7, 8, 9, 10 11, and 12 by re-adjusting weighting values and Click 'OK' button
The system displays a message of successful operation
The system displayed a message of successful operation
P Sum of GUI value = 1.0000
14 Click 'NEXT' button The system displays a range of shortlisted materials in a ranking order
The system displayed a range of shortlisted materials in a ranking order. I saved the results in the database and exited after a successful printout.
P Successful operation
15 Check post-condition 3
The system displayed a message of successful operation
√ √ OK
Post-conditions 1 The system displayed a list of selected low-cost green building materials based on user’s preference for the intended
task 2 The system confirmed the Consistency Ratio (CR) of all assigned values 3 The system displayed the a range of shortlisted materials in a ranked order

210
Benefits of Functional Testing: Below are the rationales for adopting and
running functional tests.
• The black box functional test run approach allowed a mock test of the
MSDSS model to be undertaken even before the actual databases were
fully designed and created. This helped improve the operational quality of
the model before building experts in Nigeria carried out further testing.
• It is less expensive compared to the white box test run approach;
• It also enabled the assessment of the non-functional properties of the
MSDSS model such as the appearance and format of the result output
A regression test-run was further conducted to verify whether or not the
functionality of the MSDSS model complied with its original specified
requirements after several modifications.
5.8.2.2 Regression testing
Knowing that the MSDSS model had undergone several changes during the
development stages, regression tests were carried out to check the overall
functions of the various components. The Institute of Electrical and
Electronics Engineers (IEEE, 1990) defines regression testing as selective re-
testing of a system or component to verify that modifications have not caused
unintended effects and that the system or component still complies with its
specified requirements (IEEE, 1990).
Stage of Application: The regression test was run throughout the testing
cycles, as this ensured the consistency of the system’s functionality. To
demonstrate stability of the system, a re-run test of the various features of the
entire system was undertaken whenever changes were made, which ensured
that every component of the MSDSS model was in stable condition and that
all major functionalities were present and worked under “normal” conditions.

211
Assessors: This test was undertaken by the developer/researcher.
Requirements and Tasks: The following tasks were undertaken during the
regression test-run of the system:
i. Evaluated the Open Database Link between MS Excel and VBA
database.
ii. Accessed Query attributes extraction in relation to Macro-in-Excel
VBA central database.
iii. Corrected processing within the central database in terms of schemas
and logic relationships.
iv. Corrected numerical calculations where necessary.
v. Performed Database Queries – Macro-in-Excel and VBA.
vi. Assessed final Reports of Proposed Analytical Procedures.
vii. Assessed the Overall system integration
viii. Checked the stability and consistency level of the User Interface
configurations and reports,
Findings: The cumulative results of this evaluation process showed that the
MSDSS model was in a stable condition following consistent test-runs.
Appendix K discusses in details the application procedure used for assessing
the prototype MSDSS model. It demonstrates the applicability of the
proposed system to material selection problems- in accordance with the
impact of any assumption, simplification and method used during the
assessment exercise. The second phase of the evaluation process was
however, undertaken at the later stage of development. It involved eliciting
feedbacks from respondents (both academics and housing industry
practitioners) that previously participated in the study given their familiarity
with the system development process.
212
5.9 Summary
The findings in chapters 2, 3 and 4 emphasised the inefficiency of
conventional single-dimension evaluation models. It implied that the
assessment of building products using evaluation monetary techniques are
inadequate for addressing wider sustainability issues associated with the use
of LCGBMCs. This reinforced the significance of a model capable of taking
into consideration a multi-attribute approach. Based on the observed need, a
Multi-Criteria Material Selection Decision Support System (MSDSS) was
developed and discussed in this chapter, to fulfill objective five of this study.
This chapter has described the process undertaken to develop a prototype
model that helps designers predict which decisions most critically determine
the selection of LCGBMCs. Variables within the model were further
discussed within six dimensions which are: site suitability,
environmental/health impacts, cost effectiveness, socio-cultural benefits,
technical performance and sensorial impact. Illustrations of the MSDSS
physical data modelling processes and working procedures were also
demonstrated. The MSDSS was built using data from several sources of the
case-based documents analysis, and additional information from number of
experienced building professionals in Nigeria, and builder/developer
companies in the UK. A further test was undertaken to ensure the usefulness
and reliability of the model. The test exercise started off with a trial run of the
internal links and was followed by an independent verification approach
consisting of third party users. The iterative feedbacks culled from
independent assessors were used to compare and check the accuracy of the
simulation results, which informed subsequent readjustments (see Appendix
K for full analysis of expert evaluation exercise).
The next chapter discusses the procedures adopted for validating the
prototype MSDSS model using an on-going case study project.

Chapter VI
A case study reference for validating a prototype of the MSDSS model

213
CHAPTER 6: VALIDATION OF THE MSDSS MODEL
6.1 Introduction
The key research objective posed in chapter 1 includes developing a Multi-
Criteria Decision Support System for aggregating the weighted factors
needed for the assessment of LCGBMCs. This was covered in detail in
chapter 5. Therefore, the aims of this chapter are to demonstrate this in
practical application to material selection problem, establish the
computational correctness of the software, and evaluate the reliability of the
decisions made by the system when formulating decisions regarding the
selection of low-cost green building materials and components at the crucial
stages of the design.
This chapter first begins in section 6.2 by briefly surveying techniques
developed in building construction and engineering to identify the most
suitable technique(s) that can be utilised to validate the model. It then
provides the characteristics of the participants in section 6.3; subsequently,
discusses the background to the selected case study and then describes the
input data collection procedures for the sustainability model in section 6.4. In
view of the complex nature of the research, a case study is further presented
in order to show how designers can understand which building component
decisions consistently contribute the largest to a building’s impact. Case
study was chosen as the best means to validate the model and show how
incorporating the sustainability principle indices (i.e. weighted decision
factors) works to rank building materials. The result analysis and findings of
the validation exercise are discussed in section 6.5, and conclusions presented
in section 6.6. This chapter fulfills Objective 6 of the research.

214
6.2 Techniques Adopted for Validating the MSDSS Model
Various validation techniques have been devised to optimise advanced
system models in relation to different classes of materials, as well as material
tailoring for specific designs (Macal, 2005), each of which has been used
either subjectively or objectively, the latter referring to the use of some type
of statistical or mathematical procedures. Gass (1983) and Qureshi et al.
(1999) cite extensive research literature and practical evidence on various
types of validation techniques. Although a number of different approaches to
validating Decision Support Systems (DSS) have been reported (Macal,
2005), Winter and Johnson (2000) argue that “validation” is not a single,
fixed or universal concept, but rather a contingent construct, inevitably
grounded in the process and intentions of particular research projects and
methodologies. Therefore, analysis and reflection of the various techniques in
Gass (1983), Qureshi et al. (1999) and Winter and Johnson (2000), and the
contextual component that is being analysed in this research—in terms of
assessing the credibility of the MSDSS model based on a list of proposed
variables, suggested “expert” and “criteria” validity as the most appropriate
techniques for this study.
6.2.1 Research Design Approach Adopted for the Exercise
Suitable clusters of research approaches such as focus group discussions, and
knowledge-mining interviews with domain experts were considered as the
main data-gathering instruments for this exercise. The validation exercise was
done using potential end-users perceptions, since the study needed
participants to record accurately, live observations about the model whilst
comparing their results to monitored data from the case study project.

215
6.3 Demographic Analysis of the Sample Population
Since the assignment of weights in this research required logical and
analytical thinking, and knowing that a larger sample may subsequently affect
the viability of the data (Reza et al., 2010; Wong and Li, 2008), only a small
sample of the relevant building professionals (at the stakeholders’ meeting)
were highly valuable to this empirical inquiry, and deemed capable of
providing deeper insights.
To validate the model decision-making capabilities, 25 willing stakeholders
with design and construction background, and well versed in the technical
aspects of their respective domains were invited. Ten (10) out of the Twenty-
five (25) stakeholders were randomly selected and assembled into different
focus groups for role-play— most of whom hold senior positions in the
building construction firms with relevant experience in material assessment
and selection. To avoid incurring unnecessary costs, and eliminate any likely
sources of bias, the study assumed the convenient and random sampling
techniques for the group selection of the target population, hence, giving each
member of the various housing units a fair chance of being included in the
exercise.
Although most of the participants were those who had participated in the
initial surveys, and had full knowledge of the study, the contents of each
activity were clearly explained to the group members. Each of their profiles is
assigned as follows in Table 6.1.

216
Table 6.1. Profile of Participants for the validation exercise
S/ NO
Position /Designation Type of Organisation
Area of Expertise Years of experience
No. of housing projects undertaken
1. Material Specifier and Program Designer
Building and construction firm
Material analyst and Programmer
15 > 10
2 Researcher and Senior Building Construction Consultant
Research and urban development firm
Research and Development
27 > 20
3 Building Engineer Housing construction firm
General practice 7 >10
4 Material Specifier Architectural and construction firm
Material analyst 23 >25
5 Project Architect and engineer
Housing development and urban design firm
General practice 30 >12
6 Senior Architect and Chief designer
Architectural and sustainable design firm
Full architectural service
26 > 45
7 Senior Quantity Surveyor
Quantity surveying outfit
Material advice 35 >30
8 Architect and Builder
Lands and Housing Firm
General practice 17 >13
9 Building Sustainability Consultant
Building Research and development firm
General practice consultant
25 > 40
10 Material Software Developer
Material Specification firm
Research, ICT and development
15 25
6.3.1 Instrumentation and Data Collection Procedures
Primary data was used as the main source of the research instrument for this
exercise. The main sources of primary data were the data elicited from the
focus group discussants and monitored data from the proposed on-going case
study project. Documents that explained the overall aim and objectives of the
study were first issued out to the participants. In order to generate sufficient
and valid information from the participants, a PowerPoint demo was used to
illustrate a practical exercise of the AHP method of analysis using the
MSDSS prototype model. This process enabled the participants to get a
general overview of the model before the main exercise. At the end of the
session, participants where clarified on areas that proved to be difficult during
the exercise, to avoid arbitrary results in the main exercise. The analyses and
results of the actual exercise are discussed in the following sections

217
6.4 Analyses and Results of the Validation Output
The following tasks were undertaken to validate the MSDSS model:
• Selection of the case study project • Site visitation, • Collection of relevant data for the validation exercise • Material identification, • Factors/criteria selection, • Assignment of weights to factors/variables/criteria • Comparative analysis of selected materials/components
6.4.1 Selection of the Case Study Project
The first stage of the validation exercise was to select an appropriate case
study. The case study was an on-going 3-bedroom residential housing project
situated in the sub-urban area of Rivers State in Nigeria (see Figure 6.1)
6.4.2 Site Visitation
The next phase was to visit the site to identify what materials were selected
and what means were used to determine the choice of materials for each
design element. The observations were carried out right from the onset of the
design up to the construction stage.
6.4.3 Collection of Relevant Data
After site visitation, relevant pieces of information needed to support the
exercise were obtained. The information consisted of the full set of working
drawings, bill of quantities, specifications (material finish scheduling
information) and portraits of the project in stages of development (refer to
Appendix L). The exercise was conducted on an on-going 3-bedroom housing
project managed by Kanex Engineering. This case study was chosen since it
was at the time of the study, still at the earliest stage of possibly incorporating
sustainability principles. AutoCAD and ArchiCAD were selected to support
visualisation. Table 6.2 gives a full profile of the case study project.

218
Table 6.2. Case study profile
Project Name A 3-Bedroom Private Residential Housing Project Applied Material Technology
Graded Sand Mix with Cement, Aluminium and steel
Project General Information Region Southern Nigeria
Location Port Harcourt Province in Rivers State, Nigeria Project Budget/Cost $28,565 [N4997445.95] Finance Provider Privately Financed Number of Units 1
Consultant/Project Designer
AK & Associates
Contractor Kanex Engineering and Housing Construction Company Project Description The project is a privately owned 3-bedroom residential housing unit, located within Port Harcourt metropolis in the Southern part of Rivers State in Nigeria. The housing unit is composed of the mini sitting lounge, a main family sitting/living lounge, three bedrooms all en suite, an open-air carport, a back garden, an open porch, a security post and a generator house with a total built area of 215.325m2. Project Technical information Project Type Private Housing Project Unit Area (m2) 215.325 m2 Actual Start Date of Project
July 2014
Scheduled Date of Completion
Scheduled to be fully completed in March 2015
Technology Specific Information Type and Description of Materials and Technology Introduced
The materials used for external walls and fences was a mix of fine or sharp sand which is available in most parts of the country in addition to other imported additive materials like cement, steel, and aluminium. The project benefited from the availability of suitable sand mix adjacent to the site where a seasonal stream passes by. The simple 600mm wide strip foundation was selected as the ideal alternative for the foundation due to the plain topography, although additional reinforcement bars were laid horizontally at 1-metre intervals in areas that required certain amount of permissible load such as the open-air carport. The 20mm plaster cement block dimensions were (W=150mm x H=225mm x L=450mm) and the weight of each block was 10kg. The mix ratio for the concrete floor slab was 1:3: 6 consisting of 1 part cement, 3 parts fine aggregate, and 6 parts coarse aggregate. 12mm Steel bars were used as lintels for doors and windows openings.
Source of Materials (Local or Imported)
Local (sand, stones, fine and coarse aggregates) + Imported (cement, steel, aluminium, corrugated iron sheets, door & window units, machineries and equipment)
Building Technology Enabler
Individual Architect-Private Company (AK & Associates Consults)
Technology Enabler Sector
Kanex Engineering and Housing Construction Company
Knowledge and Technology Transfer
The workers had knowledge of the project through years of practice.
Total Number of Workers
15 workers, excluding the project architect, contractor and foreman

219
Figure 6.1. Design layout of the proposed case study project
6.4.4 Material Identification
At this stage, the groups of stakeholders were instructed to select material(s)
for each design element according to the relative importance for which the
material(s) held. Three sets of materials were selected for every design
element from the material‘s data table of the MSDSS guide specification
manual, which consisted of flooring, external wall, window, ceiling and
roofing as shown in Table 6.3. It should be noted that every material enlisted
by Group ‘C’ was the exact prototype that was used for the proposed case
study. Final selection choice of each stakeholder’s group was based on
compromise between advantages and disadvantages of candidate materials.

220
Table 6.3. Participants’ preferred choice of materials/components
Design Element(s)
Group A (1, 2, 4, 10) Group B (6, 7, 9) Group C (3 5, 8)
Stakeholder’s Generated Materials
Flooring 50mm x 600mm, Reclaimed/Recycled laminated Wood Flooring and Paneling
230mm x 150mm, Bamboo XL
laminated Split Paneled Flooring
900mm x 900mm Fly Ash Cement concrete Floor slab
Wall (External)
150mm x 225mm, Recycled Crushed Concrete Block
75mm x 125mm, Compressed Stabilised Rammed-Earth Block
225mm x 225mm Aircrete Hollow Block
Door/Window 900mm x 2100mm, Recycled Timber-Clad Aluminium Framed Door/Window Unit
900mm x 2400mm, Stainless Steel Door
900mm x 2100mm, Four-Panel Harwood Door Finished with Alpilignum
Ceiling 900mm x 900mm, Reprocessed Particle Wood Chipboard
1200mm x 1200mm, Tongue & Grooved Wooddeco Multiline Ceiling Tiles
600mm x 600mm, Plaster Board on 70mm Steel Studs
Roofing 420mm x 330mm, Structurally insulated Natural Slates
420mm x 330mm, concrete interlocking
tiles
420mm x 330mm, Long-Span Corrugated Aluminium Roofing Tiles
6.4.5 Factors/Criteria Selection
The next stage of the exercise was to identify a set of decision factors that
would determine the choice of the elected building material(s). Each category
of the parent factors consisted of a range of decision sub-factors, hence were
grouped as follows: GS-General/Site Suitability, EH-Environmental/Health
Impact, EC-Economic/Cost Efficiency, SC- Socio-Cultural Benefits, T-
Technical performance, and SN-Sensorial Effects/Impacts. The participants
of Group ‘B’ were more concerned about factors such as: life cycle cost,
capital cost, maintenance cost, and restriction on usury.

221
The participants of Group ‘A’ were more particular about factors consisting
of: the level of CO2 emissions, ecological toxicity, ozone depletion and the
recyclability potential of the product, while the participants of Group ‘C’
concentrated more on the level of tolerance to external impacts from natural
occurrences, and acoustic performance. All these factors were taken into
account during the analysis. Table 6.4 shows the alternative
factors/variables/criteria generated in the stakeholders‘ focus group meeting.
Table 6.4. Criteria for Material Selection
Participants’ Group Stakeholders’ choice of Factors/Variables/Criteria Design Elements
A 1, 2, 4, 10 EH2-Level of CO2 emissions/Eco-toxicity, EH4-ozone depletion, T1-Recyclability
Flooring, Wall (External), Door/Window, Ceiling, Roofing
B 6, 7, 9 C1-Life cycle cost, C3-Capital cost, C4-Maintenance cost, SC3-Cultural Restriction on usury.
C 3 5, 8 GS5-Tolerance to impacts of natural occurrences, SN5-Acoustic performance
Table 6.5 shows a comparison of the selected material alternatives based on
both the proposed decision criteria/factors/variables listed in Table 6.4 and
the information contained in the MSDSS guide specification manual.
Table 6.5. Comparison of the selected materials attributes
Material Data Origin MSDSS Model Specification Manual Case Study Project Participants’ Group A
B
C
Floor Material Choice 50mm x 600mm, Reclaimed/Recycled
laminated Wood Flooring and
Paneling
230mm x 150mm, Bamboo XL
laminated Split Paneled Flooring
900mm x 900mm Fly Ash Cement
concrete Floor slab
Proposed decision Factors GS5-Level of tolerance or resistance
to impacts from Natural Disaster (earth tremor)
Moderately Prone Highly Prone Moderately Prone
EH2: Rate of CO2 Emissions (KgCO2/m2)
0.07 KgCO2/m2 0.023KgCO2/m2 0.2KgCO2/m2
C1: Life-Cycle Cost ($) (N) $30, 000 @ 60 yrs. $353, 367 @ 60 yrs.
$316, 702 @ 60 yrs.
C3- Material Capital Cost ($) (N) $8.50/sqft $15.36/sqft $17.89/sqft C4- Maintenance Cost ($) (N) $2, 925 @ 30 yrs. $10, 350 @ 20 $30, 925 @ 20 yrs.

222
yrs. SC3: Cultural Restriction on Usury Very Low
Restriction Very Low
Restriction High Restriction
T1-Recyclability Level Highly Recyclable Highly Recyclable
Highly Recyclable
SN5-Acoustics Moderate Good Very Strong Participants’ Group A
B
C
Wall Material Choice 150mm x 225mm, Recycled Crushed
Concrete Block
75mm x 125mm, Compressed
Stabilised Rammed-Earth
Block
225mm x 225mm Aircrete Hollow
Block
Proposed decision Factors GS5-Level of tolerance or resistance
to impacts from Natural Disaster (earth tremor)
Moderately Prone Moderately Prone Moderately Prone
EH2: Rate of CO2 Emissions (KgCO2/m2)
0.073 KgCO2/m2 0.02 KgCO2/m2 0.3KgCO2/m2
C1: Life-Cycle Cost ($) (N) $316, 702 @ 60 yrs. $150, 367 @ 60 yrs.
$481, 619 @ 60 yrs.
C3-Material Capital Cost ($) (N) $17.90/sqft $5.04/sqft $28.60/sqft C4- Maintenance Cost ($) (N) $14, 398 @ 30 yrs. $4, 400 @ 25 yrs. $30, 925 @ 30 yrs. SC3: Cultural Restriction on Usury Low Restriction Very Low
Restriction Low Restriction
T1-Recyclability Level Highly Recyclable Highly Recyclable
Highly Recyclable
SN5-Acoustic Performance Strong Poor Good Participants’ Group A
B
C
Door/Window Material Choice 900mm x 2100mm, Recycled Timber-Clad Aluminium
Framed Door/Window Unit
900mm x 2400mm, Stainless
Steel Door
900mm x 2100mm, Four-Panel Harwood Door Finished with
Alpilignum
Proposed decision Factors GS5-Level of tolerance or resistance
to impacts from Natural Disaster (earth tremor)
Highly Prone Moderately Prone Fairly Prone
EH2: Rate of CO2 Emissions (KgCO2/m2)
0.7KgCO2/m2 For making new steel door-6.15KgCO2/m2
0.87KgCO2/m2
C1: Life-Cycle Cost ($) (N) $650/unit @ 20 yrs. $795/unit @ 20 yrs.
$565/unit @ 20 yrs.
C3- Material Capital Cost (£) (N) $325/unit $975/unit $275/unit C4- Maintenance Cost ($) (N) $425/unit @ 30 yrs. $350/unit @ 25
yrs. $249/unit @ 30 yrs.
SC3: Restriction on Usury Low Restriction Highly Restricted Low Restriction T16-Recyclability Level Highly Recyclable Highly
Recyclable Highly Recyclable
SN5-Acoustic Performance Fair Poor Good Participants’ Group A
B
C
Ceiling Material Choice 900mm x 900mm, Reprocessed Particle
Wood Chipboard
1200mm x 1200mm, Tongue
& Grooved
600mm x 600mm, Plaster Board on
70mm Steel Studs

223
Wooddeco Multiline Ceiling
Tiles Proposed decision Factors GS5-Level of tolerance or resistance
to impacts from Natural Disaster (earth tremor)
Fairly Prone Highly Prone Fairly Prone
EH2: Rate of CO2 Emissions (KgCO2/m2)
0.12KgCO2/m2 0.0238KgCO2/m2 0.38KgCO2/m2
C1: Life-Cycle Cost ($) (N) $300/unit @ 20 yrs. $59/unit @ 20 yrs.
$160/unit @ 20 yrs.
C3- Material Capital Cost ($) (N) $11.7/unit $15.3/unit $94.0/unit C4- Maintenance Cost ($) (N) $65/unit @ 30 yrs. $35/unit @ 30
yrs. $265/unit @ 30 yrs.
SC3: Restriction on Usury Very Low Restriction
Very Low Restriction
Low Restriction
T1-Recyclability Highly Recyclable Highly Recyclable
Highly Recyclable
SN5-Acoustic Performance Moderate Moderate Moderate Participant A
B
C
Roof Covering Material Choice 420mm x 330mm, Structurally
insulated Natural Slates with Timber trussed rafters and
joists with insulation, and
roofing underlay
420mm x 330mm, Timber trussed
rafters and joists with insulation,
roofing underlay, counter battens,
battens and concrete
interlocking tiles
420mm x 330mm, Structurally insulated timber panel system with plywood and roofing underlay,
Long Span Corrugated
Aluminium Roofing Tiles
Proposed decision Factors GS5-Level of tolerance or resistance
to impacts from Natural Disaster (earth tremor)
Fairly Prone Highly Prone Fairly Prone
EH2: Rate of CO2 Emissions (KgCO2/m2)
0.0235KgCO2/m2 0.5KgCO2/m2 8.24KgCO2/m2
C1: Life-Cycle Cost ($) (N) $350/sqft @ 20 yrs. $316/sqft @ 20 yrs.
$475/sqft @ 20 yrs.
C3- Material Capital Cost ($) (N) $7.5/unit $17.80/unit $15.10/unit C4- Maintenance Cost ($) (N) $15000/sqft@ 30
yrs. $30,425/sqft @
30 yrs. $45,425/sqft @ 30
yrs. SC3: Restriction on Usury Low Restriction Low Restriction Highly Restricted T1-Recyclability Highly Recyclable Highly
Recyclable Fairly Recyclable
SN5-Acoustic Performance Poor Good Poor
N/B: Please note that the cost of the materials presented in Table 6.5 was the
approximate value of the materials as at the time and stage of the project
development therefore, might not necessarily hold as the current cost or
naira/dollar value for the building materials.

224
6.4.6 Assignment of Weights to Factors/Criteria
After materials were selected, the stakeholders were instructed to set the
standard criteria priority based on their aprioristic knowledge and individual
weighting preference(s) -as each member within the groups was able to
present his/her judgment independently. Each group assigned weightings
based on the mean relative importance that the factors held using the verbal
scale of 1-9 as proposed by Saaty (2007), and calculated the consistency ratio
not exceeding 1.0 (0.1≤x≤1.0). This enabled individual groups to obtain the
comparative prediction of the utility indices for each elected building material
based on the proposed factors.
To obtain the corresponding consensus/overall pair-wise comparison
matrices, the results of the pair-wise comparison matrices obtained from each
group of stakeholders were combined using the geometric mean approach.
The data from the pairwise comparison stage were then entered into the
MSDSS software to simulate the performance of the different material
combinations in relation to the corresponding priority vector for each factor.
The data entered were then automatically translated into the corresponding
largest eigenvalue problem, generating a normalised and unique priority
weights for each factor against each material- attached to the dominance of
each alternative, relative to other alternatives under that sub-factor
(assessment logic was based on the AHP model of decision-making). As a
result of the material trade-offs, the best, second and third best material
combinations — consisting of material preference(s) from the three groups of
stakeholders, were generated. As there was multi-stakeholder involvement,
the best material combination was the accumulated result from
stakeholders— evidenced by the relative utility scores of each material. The
results of the analyses are displayed, illustrated and analysed in the following
sections

225
6.4.7 Comparative Analysis and Interpretations of Results
Using the results generated from the analyses in Figures 6.2 and 6.3, the
materials proposed by Group ‘B’ (Bamboo XL laminated Split Paneled
Flooring and Compressed Stabilised Rammed-Earth Block [CSEB]) for the
design elements “FLOOR” and “WALL”, had higher utility scores of 49.1%
and 40.8% respectively, when compared with the results of the materials
suggested by Group ‘C’ for the case study project (Fly Ash Cement concrete
Floor slab and Aircrete Hollow Block), with lower scores of 32.3% and
29.8% respectively. This meant that the materials proposed by Group ‘B’—
given their higher utility scores, performed better than the materials proposed
by Group ‘C’ on CO2 emissions, global warming, ecological toxicity, ozone
depletion, cultural restriction on usury, rate of recyclability, human health and
user safety. However, based on the same analyses in Figures 6.2 and 6.3 as
derived from the MSDSS guide specification manual, it was observed that the
materials suggested by Group ‘A’ (Reclaimed/Recycled Laminated Wooden
Floor and Recycled Crushed Concrete Block) for the design elements
“FLOOR” and “WALL” performed far less - with utility scores of 18.7% and
29.4% respectively, than the materials proposed by Group ‘C’. This means
that over their life cycle, the materials suggested by group ‘B’ – since they
emit less toxicity with an average of 0.0215KgCO2/m2 would on a ratio scale
of 3:1, cost far less in the long-term and do far less damage to the
environment compared to materials suggested by Group ‘C’ with an average
emission rate of 0.25KgCO2/m2.
Figure 6.2. Illustration of the utility indices for the proposed floor materials

226
Figure 6.3. Illustration of the utility indices for the proposed wall materials
For the design element “DOOR/WINDOW”, the material suggested by Group
‘B’ (Recycled Scrap Stainless Steel Door with bolted sections) —having
arrived at a utility index of 46.4%, performed better than the materials
suggested by Group ‘A’ (Recycled Timber-Clad Aluminium Framed
Door/Window Unit) and Group ‘C’ (Four-Panel Harwood Door Finished with
Alpilignum) on habitat alteration, durability, recyclability, life-cycle cost,
maintenance cost, cultural restriction on usury, acoustic performance, thermal
resistance, and water resistance with their utility scores arriving at 29.3% and
24.2% respectively. This means that “Recycled Stainless Steel Door with
bolted sections”, considering all the proposed factors and the utility indices in
Figure 6.4, would on a ratio scale of 2:1 be more energy and cost efficient in
the long-term than “Recycled Timber-Clad Aluminium Framed
Door/Window Unit “ and the material used for the case study project—
“Four-Panel Harwood Door Finished with Alpilignum”, since the material
proposed by Group “B” requires less energy and cost for recycling and
perhaps has a longer-life expectancy.
Figure 6.4. Illustration of the utility indices for the door/window Materials

227
Using the results in Figure 6.5 for the design element “CEILING”, the
material suggested by Group ‘A’ (Reprocessed Particle Wood Chipboard)
with a utility index of 45.4% performed better than the material proposed by
Group ‘B’ (Tongue & Grooved Wooddeco Multiline Ceiling Tiles) and that
of Group “C” (Plaster Board on 70mm Steel Studs) on habitat alteration,
recyclability, life-cycle cost, maintenance cost, cultural restriction on usury,
acoustic performance, thermal resistance, and water resistance, having arrived
at the scores 33.1% and 21.5% respectively. This means that “Reprocessed
Particle Wood Chipboard” and “Tongue & Grooved Wooddeco Multiline
Ceiling Tiles”, would on a ratio scale of 2:1 perform better than “Plaster
Board on 70mm Steel Studs”, considering the proposed factors.
Figure 6.5. Illustration of the utility indices for the proposed ceiling materials
Similarly, using the results in Figure 6.6 and applying the same parameters to
the design element “ROOF” resulted in a higher utility score of 57.2% for the
material proposed by Group ‘B’ (Timber trussed rafters and joists with
insulation, roofing underlay, counter battens, battens and concrete
interlocking tiles) hence, showed better performance than the material
proposed by Group ‘A’ (Structurally insulated Natural Slates with Timber
trussed rafters and joists with insulation, and roofing underlay), with a score
of 25.5%, and the material proposed by Group ‘C’ (Structurally insulated
timber panel system with plywood (temperate EN 636-2) and roofing
underlay, Long Span Corrugated Aluminium Roofing Tiles) with a score of
17.3%. This means that the material proposed for the project “Structurally
insulated timber panel system with plywood (temperate EN 636-2) and
roofing underlay, Long Span Corrugated Aluminium Roofing Tiles” would
on a ratio of 1:3, perform worse than “Structurally insulated Natural Slates
with Timber trussed rafters and joists with insulation, and roofing underlay”

228
and far less than “Timber trussed rafters and joists with insulation, roofing
underlay, counter battens, battens and concrete interlocking tile” on habitat
alteration, CO2 emissions, recyclability, life-cycle cost, maintenance cost,
cultural restriction on usury, acoustic performance, thermal resistance, and
water resistance
6.5 Discussion of Findings
Given the overall analysis, it is evident that the materials suggested by the
stakeholders in Group “B” —on the average, performed better than the
materials suggested by the stakeholders in Group “A”, as well as the
materials suggested by the stakeholders in Group “C”, since a higher utility
score in the MSDSS model suggests lower energy, environmental, and cost
impacts. In relating the total amount of each material’s impact contribution to
the total amount of greenhouse gases released every year, per metre square,
—according to the participants’ panel importance weights, the materials
suggested by Group ‘B’ proved to be more environmentally, economically,
sensorially, technically and socio-culturally sustainable than the materials
proposed by the stakeholders in Groups ‘A’ and ‘C’. Furthermore, it can be
deduced from the analysis that the materials suggested by the stakeholders’ in
Group ‘C’ for the case study project had the cheapest capital cost when
compared to other materials. However, the materials proposed by
stakeholders of the Group “B” was better in life cycle cost assessment when
compared to the materials suggested by stakeholders in Groups ‘A’ and “C”.
This means that by investing extra capital cost on the materials from the
MSDSS guide specification manual, the building would yield less energy and
environmental impacts by at least 25%, and generate more cost savings of
roughly 30%-50% per year in the long-term. The results therefore,
demonstrate that based on equal importance weights, the materials proposed
by stakeholders of Group “B” would perform better than others in economic,
technical, sensorial, environmental and socio-cultural value.

229
6.6 Summary
Designing, developing, and implementing Decision Support Systems (DSS)
to aid informed choices requires analysing the knowledge base and decision
making capabilities of the system (Quinones, 2011). Consequently, for
models to work properly in practice, the components and algorithms must
also be assessed correctly (Florez et al., 2010).
This chapter has presented a method for testing the correctness and the
decision-making capabilities of a Multi-Criteria Material Selection Decision
Support System. The outcome of the MSDSS model was validated for its
efficiency in suggesting informed choices of LCGBMCs to potential users,
using an on-going case study project located in Port Harcourt, Nigeria. The
resulting inferences were based on the sample data of the stakeholders
measured against the monitored data of the proposed case study in relation to
the set of sustainability principle indicators (decision factors) proposed by the
stakeholders. The results show how the range of embodied impacts is steadily
reduced as decisions are made in order- from those achieving the greatest
embodied impact reductions to those achieving the least reductions. The
results of the comparative analysis revealed that the life cycle cost, sensorial,
socio-cultural and environmental impacts of the materials proposed for the
case study was less evident in value than that of the materials generated by
the MSDSS model. This study has therefore proposed a prototype model that
could be used by designers as a basis from which to perform informed trade-
off analysis that reflects all the key characteristics of LCGBMCs.

Chapter VII
Summary, conclusions, and recommendations

230
CHAPTER 7: SUMMARY, CONCLUSIONS AND RECOMMENDATIONS
7.1 Introduction
This chapter presents the general summary of the research. It discusses the
findings from chapters two to six, and draws conclusions to cover
achievement of the original objectives used to address the research question
posed in chapter 1. A reflection of the major works undertaken in the study is
summarised and conclusions are drawn to finalise the study. It further
highlights contributions of the study to knowledge, and identifies the research
limitations. In the final section, it provides recommendations to software
developers, practice, research communities, and policy makers, and suggests
other avenues for further research. The remainder of this chapter has been
divided into sections to discuss the research findings as follows:
• 7.2. Review of Research Aim and Objectives; • 7.3. Reflective Summary; • 7.4. Conclusions; • 7.5. Contributions to Knowledge; • 7.6. Dissemination of Research; • 7.7. Research De-limitations and Challenges; and, • 7.8. Recommendations for Future Research
7.2 Review of Research Aim and Objectives
The aim of this study has been to address the research question set out in
chapter 1. It has identified six categories of the sustainable development
principle indicators (factors) applicable to this study, and developed a Multi-
Criteria Material Selection Decision Support System (MSDSS) that enables
designers to assess the applicability and potential impacts of LCGBMCs for
their promotion and adoption in mainstream housing. The objectives are
restated in this section and the extent to which they have been met are
summarised along with the research methods used to achieve them.

231
Objective 1: Elicit current views and background information on themes related to the economic, environmental and social impacts of housing construction activities in the Global and Nigerian contexts, with emphasis on the role of material selection decision-making in sustainable housing;
This aspect of the literature review generated a number of important insights
that explained the socio-economic significance of the decision-making
process on housing and its reverse effects on the environment, from the
global perspective and in the Nigerian context. There were clear indications
that rising costs and demands for housing, and their resultant impacts could
be addressed through careful designs of LIGHDs and sustainable use of
LCGBMCs. A further study identified some drivers that informed the need
for LCGBMCs and factors that limit their mass use in mainstream, one of
which was the lack of informed knowledge. Findings from the study revealed
that current material information systems lacked the capacity to adequately
assess the impacts of different LCGBMCs in a sustainable manner, taking
into account a range of key sustainable principle indices/indicators (factors),
hence identified the need for a more appropriate resource, which in turn
fulfilled objective 1 of the research.
Objective 2: Compare and contrast various technologies currently used at national and international levels for modeling decision-making in the selection of building materials and components: to highlight their strengths and weaknesses
In understanding the problems associated with the mass use of LCGBMCs in
housing, it was envisaged that improving knowledge sharing about current
best practices could be realised through Technology Transfer (TT). The
literature review highlighted the viability of technology in fulfilling
sustainable development principles and requirements in the material selection
decision-making process. In this exercise, existing material assessment tools
used in both developed and developing countries were examined and found
wanting.

232
The findings were premised on the fact that most existing tools are culturally
implicit, as such treat the sustainability impacts [of the] wider built
environment as simply a matter of energy and mass flows with little or no
consideration to other dimensions of the concept. This was met through a
comprehensive review of both academic and industry references to
sustainable material selection. This was then further explored through a
preliminary survey, of which the majority of the respondents emerged with a
relatively strong degree of commitment in terms of the need for more current
and up-to-date information. This exercise also formed significant basis upon
which the model was conceptualised, hence fulfilling objective 2.
Objective 3: Identify the key influential factors that affect the selection of building materials
Following the need for more current and relevant information, suitable
clusters of data collection methods were used to elicit valuable information
from both academics and practicing professionals who influence material
choice decisions in the Nigerian housing industry. In achieving this, the study
identified shortcomings in the current practice, and provided a means of
understanding the practitioner’s view of conventional systems and their
expectations for a new model. The outcome of this exercise led to subsequent
re-evaluation of the proposed sustainability principle indices/indicators
(decision factors) and further modifications of the conceptual DSS model to
meet practitioners’ requirements, which in turn fulfilled objective 3.
Objective 4: Establish and specify the impact weight of each key influential factor
The fourth research objective was to establish the key influential factors
required for working out the relative impacts of the different choices of
materials.

233
A list of sustainable principle indictors (factors) was gleaned from the
analysis of the surveyed questionnaire and ranked according to their weighted
importance using a suite of statistical analytical methods. To ease the
decision-making process and avoid mixing up the vast array of factors, the
factors were narrowed down into six categories as follows:
• General/Site suitability (GS) • Environmental/Health impact (EH) • Economic/Cost efficiency (EC) • Socio-Cultural benefits (SC) • Technical performance (T) • Sensorial impact (SN)
By identifying and ranking the factors in their order of importance using the
factor analysis approach, this section thus, fulfilled objective 4 of the
research.
Objective 5: Develop a Multi-Criteria Decision Support System for aggregating the weighted factors needed for the assessment of LCGBMCs
The fifth objective was to further develop the proposed conceptual framework
into a scalable prototype Material Selection Decision Support System
(MSDSS) using the data gleaned from the analysis. This phase provided an
overview of the hardware devices (storage, display, etc.), and database
management systems used including the system configuration techniques, its
mechanisms, file structures, access methods and data location procedures. It
provided the opportunity to assess the potential capabilities of the proposed
programming language needed to develop the conceptual model schema.
Following the development of the MSDSS model, preliminary test runs were
conducted during the various stages of the development process to regularly
check the internal mechanism of the links, and the consistency of the result
outputs. Therefore, the development of the model into a scalable and
functional prototype system enabled the fulfilment of objective 5.

234
Objective 6: Test and validate the developed system
The final objective of this research was to validate the applicability,
effectiveness and usefulness of the developed model, using a case study
project located in Port Harcourt, in which a comparative analysis was
performed to show how optimal choices could change with changing user
weightings and variables in real life practice. This was followed immediately
after the user evaluation exercise in Appendix K. This procedure was useful
in demonstrating the overall value and possible limitations of the software,
hence suggesting areas for further improvements. This exercise thus, enabled
the fulfilment of the research objective 6.
7.3 Reflective Summary
The purpose of this research has been to address current issues associated
with the provision of quality low-impact green housing developments in
Nigeria by employing sustainable practices in the selection of LCGBMCs.
The response to the research question posed in chapter 1 commenced with a
dual stage scoping study consisting of comprehensive reviews of both
academic and industry references, and preliminary studies with design and
building professionals currently engaging with building materials. Some
consensuses were identified from the reviews and surveys, which were then
used to cover the theoretical aspect of the research, hence fulfilling objective
1 towards realisation of objectives 2 and 3.
In chapter 2, the study discussed issues surrounding the housing construction
industry with emphasis on the impacts of sustainability principle indicators on
the material selection decision-making process. It highlighted drivers and
obstacles affecting the implementation of LCGBMCs in the design of
LIGHDs, and identified factors that are critical in determining their relative
impacts at the design stage.

235
Chapter 3 reviewed various material assessment tools in developed and
developing regions, to identify knowledge deficits and potential benefits
associated with their use. This exercise provided the foundation for the
development of the conceptual model, which formed the major part of this
research.
In chapter 4, the study explained the various data collection and analytical
methods used in this research. Subsequent survey exercises with leading
experts in the field helped to identify the principal sustainable principle
indicators/decision factors that were included in the MSDSS model.
The analysis of the surveyed questionnaire and responses from personal
interviews (in Appendix G) enabled the development and testing of the
prototype model in chapter 5.
The discussion of research findings from the evaluation exercise was
presented in Appendix K, while the validation exercise, used to determine the
adequacy of the MSDSS model was addressed in chapter 6.
Chapter 7 provided the study with the necessary data to make necessary
recommendations that will help to ensure more delivery of sustainable low-
impact green housing, through the wider use of LCGBMCs.

236
7.4 General Conclusions
Many developing cities around the world are facing the problems of
increasing urban density and energy demand. As housing represents a
significant source of growth in global energy demand, their energy use, and
associated environmental impacts also create great pressure to our planet. The
yardsticks for the measurement of housing development for rapidly growing
and urbanising nations is hinged upon not only the extent to which the
housing industry is able respond to either the socio-economic challenges or
environmental issues but how well it holistically engages with the economic,
socio-cultural, and environmental conditions of that region (Ofori, 1991).
Building materials have been identified as one of the principal components of
housing development, as they constitute the single largest input in
construction- often accounting for as much as 5.8% of a nation’s GDP (UN,
2010). Likewise, the deterioration of the physical environment due to housing
construction activities is traceable to the choice of building products at the
early design stages (Gluch & Baumann, 2004). As more consideration is
given to socio-economic and environmental concerns, interest in the use of
LGCBMCs is experiencing a renaissance (Seyfang, 2010).
With the objective to encourage the increased supply and use of energy
efficient and cost effective building materials, this study underscored the need
for improving understanding of relevant data associated with LCGBMCs,
being identified as partly responsible for their current lack of use in
mainstream housing. The information needs of designers were researched
within the literature review, followed by empirical studies to understand what
support system designers needed. Critical appraisal of the current approach to
selecting building materials showed that most of the existing studies and tools
reviewed had no direct indicators that were specifically relevant to the
impacts of LCGBMCs.

237
It emerged that there was a need to explore how designers could be supported
to facilitate the integration of sustainability principles in the decision-making
process to aid better-informed decisions when selecting LCGBMCs for
LIGHDs. The findings from the empirical studies and the literature review
were combined to develop the proposed conceptual model into a working
prototype Multi-Criteria Decision Support System (MSDSS) that is well
suited to perform effective trade-off analysis at the early stages of the design.
Consequently, the primary objectives of this research- to provide designers
with a model that aims to facilitate the selection of LCGBMCs appropriate to
the scale, lifecycle, location and context of a development project and to
integrate their outputs in a meaningful manner to augment their limited
capacity to deal with complex material selection problems, has been
achieved. Thus, the exploration that led to the development of the MSDSS
model has proven to be a worthy contribution to housing design and housing
construction management. It is clear that a need existed for a tool specifically
tailored to address the unique challenge of housing in Nigeria. It is therefore
hoped that the model- through a combination of local action and national
enabling policies, can help to narrow the gap identified in this study.
7.5 Contributions to Knowledge
Insights identified from addressing the research aim and objectives in section
1.5 represent part of the original contribution to knowledge made by this
study. The following are itemised as other key contributions of the study to
research and practice:
• Frameworks for sustainable material selection already exists (see
chapter 3) but these only focus on either one single aspect of sustainable
materials, or developed for specific conventional materials, or with many
presented in a format too detailed or with engineers in mind, or is designed
to be applied at the latter stage of the design process.

238
Applying a material assessment tool at this point in the process conflicts
with the literature, because it is widely acknowledged that sustainable
considerations need to occur before design decisions have been made in
order for the most significant improvement to be achieved. More so, there
was no compelling evidence that suggested any form of integration that
deals with the assessment of the sustainability impacts early in the design.
Throughout all the empirical studies a confusion and lack of understanding
regarding LCGBMCs was evident, due to the complex issues and
contradictory information. In order to encourage the use of such materials,
Seyfang (2010) came to a similar conclusion with the consideration of a
holistic framework that incorporates sustainability principles to improve
understanding of the relative impacts of each product to better inform
designers. This lack of a holistic presentation and a need for a quick visual
representation were the drivers for the holistic framework presented. There
is currently no documented study, so far, that performed similar analysis
on the capacity of a model to adequately capture, store, analyse and
present data that are accessible to designers in usable forms and formats to
better inform material choices in the design of LIGHDs, hence makes a
valuable contribution. The novelty of the framework thus lies in the visual
overview of sustainable material impacts and selection factors. The
framework is designed to visually present the impacts of sustainable
material considerations in order that trade-offs can be identified.
• The majority of literature and resources focused solely on either
environmental aspects of material selection (Zhou et al., 2008; Ding, 2010)
or technical considerations (Ashby and Johnson, 2006), or sensorial
aspects (Wastiels and Wouters, 2008), or the selection of materials based
on economic requirements (Rahman et al, 2009). There was, however, a
lack of reference to social-cultural implications in the reviewed studies,
which indicated the need for further study to incorporate not just the
social-cultural aspects of the sustainability principle but also the
aforementioned dimensions of the concept.

239
Within previous empirical studies there has been little mention of social-
cultural considerations as it has historically been left out of the
conventional sustainable development agenda. The inclusion of social-
cultural, and sensorial issues is often lacking, within both literature and
material selection resources. However, this framework was designed to
reflect this in order to enable mainstreaming of some of the cultural
dimensions such as pride of place, symbols, and sense of belonging.
• The research presents a detailed understanding of the drivers and
barriers, which influence the selection of LCGBMCs in the design of
LIGHDs, a topic that is lacking within current literature. Thus, this
research can help to inform building practitioners on low-energy building
material research and housing policy development dialogue, and it is
hoped will make a significant contribution to the on-going debate.
• Historically, conventional literature about the Nigerian housing
industry has largely remained peripheral to discussions on sustainable
material selection within design practice. Despite an evolving culture of
sustainability in the global housing industry, there are limited studies
within the context of Nigeria that discussed extensively the management
and synthesis of material knowledge to stimulate sustainable material
selection during the design process, hence enriches current body of
knowledge on the Nigerian component of the research.
7.6 Dissemination of Research
The key aim of dissemination of research is to reflect the multidisciplinary
nature of the study by publishing in the widest range of sources. Both
theoretical and empirical findings within the scope of this research have been
published in peer reviewed journals, and international conference(s) as the
research progressed (publications are attached in Appendix M). More
publications are also in preparation and under review.
240
7.7 Research De-limitations and Constraints
The research carried out in this study is significant to design and building
stakeholders, and the findings from the study are useful in terms of
incorporating sustainability principle in the assessment of LCGBMCs. This
research is however, subjected to the following de-limitations and constraints:
7.7.1 Delimitations of the MSDSS Model
The following are itemised as the delimitations of the MSDSS model.
• Even though the selection methodology of the MSDSS model
remains appropriate for any building type, the scope of this tool for now
is limited to selecting building components for residential housing for
which each material impact can be predicted at the early stages of the
design process.
• The model development is restricted to a scalable prototype, which
is only used for demonstration purposes of the selection procedures.
Therefore, most interfaces of the model are saddled with default
outputs.
• The model provides reports on some of the available LCGBMCs,
and so there is currently very little flexibility for a user to query reports,
as they would prefer.
• The hypothetical scenario of a case study was undertaken on 3-floor
materials used in a 3-bedroom residential building. The research results
of the case study may only be valid for the characteristics and culture of
design and building professionals in the Nigerian housing industry.
There are, of course, limitations to the case study as it is not possible to
generalise with such results given the cultural, social, economic, and
geographical diversity of other regions.

241
7.7.2 Delimitations of the Study
The following are identified as the delimitation of the overall study.
• It is important to express that the results provided by this study are
not necessarily exhaustive. What it provides is a solution that meets the
requirements of the stakeholders who participated in this study (i.e.
certain criteria were compromised, and decision making process largely
depended on the stakeholders‘ priority assigned to the sustainability
principle indicators/factors). Clearly the opinions presented in this study
are those of the individuals interviewed and cannot be taken to be
representative of other design and building professionals. It needs to be
recognised that the participants interviewed were chosen specifically
because they showed in-depth knowledge of the area of study and not
that this understanding and interest is not necessarily to be found among
all participants within Nigeria, the UK or elsewhere.
• For those interested in research in LCGBMCs, it should be noted
that the study is quite exceptional, in that the outcome of this study is
not likely to be the case with subsequent studies.
• It is important to also emphasise that this research is written from the
Nigerian perspective. There is no claim that the outcome presented will
completely address the underlying gap identified in the study. Neither is
it claimed that the findings of the study are exhaustive. The results are
not meant to suggest that making decisions in a certain sequence – from
those achieving the greatest impact reduction to those achieving the
least – can help designers arrive at a best or improved design in terms
of lowered embodied impact. Rather, the results are meant to help
designers visualize the potential reductions for each building material
so that they can understand how incorporating sustainability principles
into the material selection decision-making process at the early design
stage could contribute to minimising a building’s embodied impact.

242
7.7.3 Research Constraints
There were few setbacks that this research faced during the course of this
study. The following constraints are hereby listed for future consideration.
• The process of developing the overall research study was faced with
critical issues that led to several changes in the research topic,
methodology and its objectives in order to achieve the main aim of this
research. Submitting papers for peer-review in conferences/seminars and
publishing articles in journals helped to restructure and clarify the overall
research study.
• There were reservations regarding the currency and scope of the
research information, as there was no compelling evidence of prior
research that applied to the context of this study, therefore having to rely
on the most current reports, and data elicited from interviews with
experienced participants in this field. This brought about the need for
continuous checking, comparison and updating of the available
information, hence posed a serious challenge to this research.
• It remains true that sample sizes that are too small cannot adequately
support claims of having achieved valid conclusions, and the same is true
that sample sizes that are too large or uneven do not permit the deep,
naturalistic, and inductive analysis that defines qualitative inquiry
(Creswell, 2003). Getting an adequate sample size for each group of
professionals was demanding, hence posed a serious challenge. However,
the sampling methods specified in section 4.5.2.9 of chapter 4 made it
possible to achieve sampling equivalence amongst professionals of the
various building professions.
• Getting a list of the sample population for the study was very
discouraging, and having access to people and organisations also posed a
serious challenge due to their time differences and tight-schedules.

243
Constantly reminding the subjects using any available means including
contact e-mails, social media (LinkedIn, Facebook, Twitter) and phone
calls helped to minimise this problem.
• The fact that most of the participants had little or no exposure to AHP
quantitative-based decision-making concept was rather discouraging, as
they were not used to considering the choice of materials based on user-
specified weightings. Manuals sent to participants prior to evaluation
exercises helped to reduce the complexities associated with the MCDM
technique adopted.
• It is also acknowledged that there were time, personal, administrative
and financial constraints. However, the importance of the study remains,
for the limitations do not detract from them, but merely provide scope for
further research
7.8 Recommendations for Future Research
The outcome of this study has a number of significant implications for future
practice, and thus has identified areas for further research. The following
areas of study are therefore recommended for further investigation.
7.8.1 Recommendations for Software Developers
• Evidence from this research has shown that most studies see
Computer-Aided Design packages and Energy Simulation tools
differently. An interoperable standard, such as the gbXML (Green
Building eXtensible Mark-up Language) enables the movement of
models between various types of software. This take up has been slow
and incomplete, thus resulting in the loss of data. It is recommended that
software developers refine these schemas to allow seamless integration
between tools.

244
• Adding extra operating features and perhaps expanding the database
using interactive web-based applications are examples of the later
applications that would help to strengthen the functionalities of the
MSDSS Model. This should provide transparent access to distributed
geo-data, so that users are able to operate in a heterogeneous computing
environment.
• In addition, the factors identified in this research may be confined to
the time of the research, as subsequent researchers' perception of an ideal
range of sustainability principle indicators (factors) may change. The
model will thus require regular updates in all aspects of the database,
which is not unexpected.
7.8.2 Recommendations for Industry and Practice
• Setting up a website with online information that can be updated is
recommended to manage the large volume of data typically associated
with LCGBMCs. It is thus recommended that designating trained
industry personnels for the maintenance of applications and programs
could enhance the operations and features of the prototype MSDSS
model.
• Traditional materials (such as mud and red bricks) appear to be the
most appropriate alternatives in terms of thermal performance, and
energy reduction, yet some of these materials are not given the deserving
recognition. Therefore, improving the quality and method of production
of traditional materials in line with the housing industry could make such
products more durable and improve the quality of their appearance
hence, attain greater industry and social acceptance.

245
• The attitude of trying to economise fund beyond reasonable limits has
resulted in the design of housing projects that have instead served as poor
examples of LIGHDs. It is therefore recommended that a lot of diligence
and ingenuity be put into practice to come up with sample prototypes that
truly represent LIGHDs, and are able to convince the population from an
aesthetic, technical and economic points of view, since the population
(particularly of the LDCs) is not so familiar with the socio-economic and
ecological significance of these building types.
7.8.3 Recommendations for Research Communities
• The participants for this survey were derived from random sampling
of design and building professionals to form a composite sample. This
sampling method does not include other stakeholders, who in a way
influence material selection such as clients and policy makers. The
sample size may need to be extended to include more stakeholders
involved in material selection in order to further strengthen the quality
and validity of the data.
• The study also measured the relative indices of the factors limiting the
use of LCGBMCs in the housing industry, hence may not be exhaustive.
Thus, it forms a reference for further identification of other factors
inhibiting their wider use in mainstream housing. This could aid in the
formulation of more advanced system models, strategies and policies for
further expansion of LCGBMCs industries, to reinstitute its value in the
socio-economic development of the housing sector.
• This research was based on residential building; hence the relative
importance of the factors may vary according to the building type. Thus,
applying the green building index approach to other building types can
carry out further research. The nature, construction methods,
specifications and impacts on the environment will be different from

246
residential building and further research on studying the
sustainability/green index may provide new insights. This is particularly
important for capital projects which are usually large scale and more
likely to cause more environmental degradation.
• This area of research can, of course, be expanded to investigate other
countries besides Nigeria, with the opportunity to draw some interesting
international comparisons, and to consolidate the robustness of the
selection methodology.
• The validation exercise was undertaken on a single-case study project
in Nigeria involving a particular building type, size, location, and
geometry. What may thus be worth doing in future is to elaborate on the
model to comment more generally on the performance and robustness of
the proposed MSDSS decision model, by applying it to multiple case
studies and comparing it with other countries.
• From other studies, it appears that some studies view LIGHD, as the
interest of a minority of people hence, may currently be true that there
are not a large number of people interested in LIGHD, although that does
not mean that its scope is by any means marginal. There is little
knowledge about the extent of interest in LIGHD, thus, would be
worthwhile to conduct further research to foster interest in lower impact
options.
• The consequences of the planning system on LCGBMCs and LIGHDs
are not widely known or documented and yet, as has been discovered
from this research, the impact of the planning system within the context
of Nigeria is wide-ranging.

247
7.8.4 Recommendations for Policy Makers
• The cause for the failing market mechanism is the discrepancy
between the private costs a person faces and the social costs society faces
for emitting green house gases through the production and use of certain
building products (Ofori, 1991). Governments can address this anomaly
by either imposing taxes on conventional building products with higher
rates of CO2 emissions or regulating the emission of the gases using an
emission trading system. Other actions that are likely to hasten moves
towards sustainable use of LCGBMCs include:
— Regulation of what buildings materials can be used in housing
construction and how they are to be managed – typically,
promulgated through building codes. This will require building
owners to post energy or other environmental performance scores
of potential materials through the use of an energy-monitoring
model;
— A common and general methodology for calculating the
integrated energy performance of building materials for new and
existing buildings; and,
— Energy certificate for new and existing residential buildings.
Certificates must be less than five years old and must comply with
government’s policy of 50% – 70% use of LCGBMCs (most of
which would be indigenous and recycled building products).
• The government could assist in the development of the housing
industry’s activities by including matters pertaining to LCGBMCs as part
of the blue print in national development plans. Using indicators to
benchmark the performance of LCGBMCs could help to identify
deficiencies in their performance, hence proffer remedial actions.

248
• The lack of a proper certification system makes quicker adoption of
LCGBMCs difficult. Certification of such products can play a major role
in their transition to a more efficient product in the housing sector.
• Current market mechanisms alone do not seem very likely to
accomplish a sufficient degree of energy efficiency and resource savings
over the coming years as they often ignore the negative externalities
caused by CO2 emissions. Politicians can therefore seek strategies to
encourage greater energy efficiency and more use of LCGBMCs through
political measures such as subsidies and tax cuts.
• Unfortunately, at present, in a majority of cities in Nigeria, sustainable
housing planning and development practices seem to be divorced from
any long-term city vision, and pressures from various stakeholders
influence many major decisions. Thus, an open, transparent process that
integrates various kinds of house build stakeholders has more chances to
address entrenched problems of exclusion, proposing solutions that are
appropriate both culturally and politically to cater to the needs of the vast
majority of the disadvantaged population. In this sense, such inclusive
development of a vision and planning will in turn enhance the potential
for collective ownership, commitment that is made by city authorities
(who are the leaders, custodians and promoters of the vision) and the
other tiers of government and civil society (who are major stakeholders
in the process), as the proposed action plan would have been endorsed by
the broadest possible constituency.
• Mandating higher efficiency standards for new construction materials
is likely to make “low-impact green energy” homes mandatory by 2050.
Therefore, stricter government regulations are likely to be the main
reason for LIGHDs to become the de-facto standard for new and
renovated buildings in 20 years to come-particularly for the very
disadvantaged population.

References

249
REFERENCES
Abanda, F. H., Nkeng, G. E. , Tah, J. H. M., Ohanjah, E. N. F and Manjia, M. B., (2014) Embodied energy
and CO2 analysis of Mud-brick and Cement-block Houses. Aims Energy. 2 (1), 18–40. Abelson, P. W., (1996). Project appraisal and valuation of the environment: general principles and six case
studies in developing countries. MacMillan Publishers. Abidin, N. Z. (2010). Investigating the awareness and application of sustainable construction concept by
Malaysian developers. Habitat International. 34 (4), 421-426. Abiola, R. O., (2000). Management implications of trends in the construction costs in Nigeria from 1989–
1999. The Quantity Surveyor. 30, 35–40 Abisuga A.O and Oyekanmi O.O., (2014). Organizational Factors Affecting the Usage of Sustainable
Building Materials in the Nigerian Construction Industry. Journal of Emerging Trends in Economics and Management Sciences (JETEMS). 5 (2). 113-119
Abraham, D. M. and Dickinson, R. J., (1998). Disposal costs for environmentally regulated facilities: LCC approach. Journal of Construction Engineering and Management, ASCE. 124 (2), 146-1 54.
Adams, C., (2005). The realities of specifying environmental building materials. In L. Elizabeth & C. Adams (Eds.), Alternative construction: contemporary natural building methods. New York, USA: Wiley.
Adedeji, Y. M. D (2010). Technology and standardised composite cement fibres for housing in Nigeria. Nigerian Institution of Architects. 1, 19–24
Adegboye, K., (2013). “New Block Making Technology Debuts in Nigeria”, Vanguard, June 18, 2013 http://www.vanguardngr.com/2013/06/new-block-making-technology-debuts-in-nigeria/
Adeyemi, A.Y., (2002). Affordable housing production: The influence of traditional construction materials. In: 30th IAHS World Congress on Housing, Housing Construction: An Interdisciplinary Task, Dreams—Projectos Multimédia. 827-832.
Adogbo, K. J. and Kolo, B. A., (2009). The perceptions on the use of indigenous building materials by professionals by Professionals in the Nigerian Building Industry. Ahmadu Bello University, Zaria
Ajanlekoko, J. S., (2001). Sustainable Housing Development in Nigeria – The Financial and Infrastructural Implication. In: International Conference on Spatial Information for Sustainable Development. Nairobi, Kenya 2–5 October 2001.
Akinlusi, A., (2007). Mortgage Facilities: A Panacea for Mass Housing Development. In: Nigerian Institute of Building conference. University of Lagos, 12-13 November 2007. pp. 9-16.
Akintoye, A. (2000). Analysis of factors influencing project cost estimating practice. Construction Management and Economics. 18, 77-89
Alonso, J. A. and Lamata, M. T., (2006). Consistency in the Analytic Hierarchy Process: A New Approach. International Journal of Uncertainty, Fuzziness and Knowledge-Based Systems. 14 (4), 445−459. World Scientific Publishing Company.
Aluko, B.T., (2002). Urban housing for low – income earners in cities of Lagos state: The Land Question, Proceedings of a National Conference on The City in Nigeria, Faculty of Environmental Designs and Management, Obafemi Awolowo University, Ile – Ife, pp. 288 – 294
Anada, J. and Herath, G., (2009). A critical review of multi-criteria decision-making methods with special reference to forest management and planning. Ecologic Economics. 68, 2535-2548
Anderson, J., Shiers, D., and Steele, K., (2009). The Green Guide to Specification: An Environmental Profiling System for Building Materials and Components. BR 501. 4ed. UK: Building Research Establishment.
Anderson, D. R., Sweeney, D. J., and Williams, T. A., (2005). Quantitative methods for business. 9th Ed. Southern-Western, Ohio, USA.
Andrikopoulos, A. and Zacharias, E., (2008). General solutions for choice sets: The Generalized Optimal-Choice Axiom set. MPRA Paper 11645. University Library of Munich, Germany.
Anink, D., Boonstra, C. and Mak, J. (1996). Handbook of Sustainable Building: An Environmental Performance Method for Selection of Materials for Use in Construction and Refurbishmment. London: James and James Publishers
Ankrah, N.I., (2007). An investigation into the impact of culture on construction project Performance. PhD thesis, SEBE, University of Wolverhampton, Wolverhampton.
Anon (1996). Transport research-EURET-cost-benefit and multi-criteria analysis for new road construction. Office for Official Publications of the European Communities, Luxembourg
Anosike, M.N., and Oyebade, A.A., (2012). Sandcrete Blocks and Quality Management in Nigeria Building Industry. Journal of Engineering, Project, and Production Management. 2 (1), 37-46

250
Arnel, T. (2011). Tackling Global Climate Change: Meeting Local Priorities. A World Green Building Council Special Report, September 2010. Available from: http: / / www.worldgbc.org / site2 / resources/case-studies/gbc-reports/ [accessed October 15, 2014].
Aye, E. (2003). Taking the Pulse. Sustainability and the Interior Design Practice. Available from Green Building Services: http://www.greenbuildingservices.com/news/releases/2003_13__55_pulse.pdf [Accessed November 05, 2011]
Anthonio, J. B., (2002). Housing for all by the year 2015. Paper presented at the 2002 Building week
seminar. Obafemi Awolowo University, Ile-Ife, Nigeria. Arayela, O. and Falaye, T.A., (2000). Urban development challenges in the new Century: The recurring
problem of Inadequate housing supply in Nigeria. Journal of the AARCHES, Vol 1, No5, August, pp.42-47.
Ashby, M. F. and Johnson K., (2002). Materials and Design: The Art and Science of Material Selection in Product Design. Oxford; Boston: Butterworth-Heinemann.
Ashraf, K.K., (2007). This is not a building! Hand-making a school in a Bangladeshi village. Architectural Design. 77(6), 114-117
Augenbroe, G., (2002). Trends in building simulation. Building and Environment. 37 (1), 891 – 902. Augenbroe, G., (1992). Integrated Building Performance Evaluation in the Early Design Stages. Building and
Environment. 27 (2), 149-161. Baba, A., Mahdjoubi, L., and Ming, S., (2012b). Developing an Information Support for Low Carbon
Housing Delivery in the United Kingdom. International Conference on Construction and Real Estate Management (ICCREM), October 1st - 2nd . Kansas City, USA. 387-391
Babbie, E. R., (1990). Survey research methods. Belmont, California: Wadsworth Pub. Co. Baker Associates (2004). Low impact Development-Further Research, Final Report for Pembrokeshire Coast
National Park Authority, UK Baranoski, G. V. G., Rokne, J. G., Xu, G., (2001). Applying the exponential Chebyshev inequality to the
nondeterministic computation of form factors. J Quant Spect Radiative Transfer. 72 (2), 199-200 Barton, H., (2005). Sustainable Communities: The potential for Eco-neighbourhoods. Earthscan Publications,
London Basbagilla, J., Flagerb, F., Lepechc, M., and Fischerd, M., (2012). Application of life cycle assessment to
early stage building design for reduced embodied environmental impacts. Journal of Civil and Environmental Engineering.
Bayer, C., Gamble, M., Gentry, R., and Joshi, S., (2010). AIA Guide to Building Life-Cycle Assessment in Practice. The American Institutes of Architects.
Beizer, B., (1995). Black Box Testing. New York: John Wiley & Sons, Incorporated. Behm, M., (2005). Linking construction fatalities to the design for construction safety concept. Safety
Science. 43, 589-611. Bernold, L. E. and AbouRizk, S. M., (2010). Indicators of an Industry in Transition: Managing Performance
in Construction. Hoboken, New Jersey, USA: John Wiley & Sons, Incorporated Bevan, R, and Woolley, T., (2008). Hemp Lime Construction: a guide to building with hemp lime composites.
IHS BRE Press. Black, C., Akintoye, A. and Fitzgerald, E., (2000). An analysis of success factors and benefits of partnering in
construction. International Journal of Project Management. 18, 423-434. Borenstien, D., (1998). Towards a Practical Method to Validate Decision Support Systems. Decision Support
Systems. 23, 227-239 Bubshait, A.A. and Almohawis, S.A., (1994). Evaluating the general conditions of a construction contract.
International Journal of Project Management. 12 (3), 133-135.Berge, B. (2009). The Ecology of Building materials. Architectural Press
Bertolino, A., (2001). Chapter 5: Software Testing, in IEEE SWEBOK Trial Version1.00. May 2001 Bevan, R. and Woolley, T., (2008). Hemp Lime Construction: a guide to building with hemp lime composites.
IHS BRE Press The BIM Issue (2012). Build Smart Report. Singapore, SG, Building Construction Authority Boloix, G. and Robillard P. N., (1995). A Software System Evaluation Framework. IEE Computer. 12 (8),
17-26 Bond, S., (2010). Best of the Best in Green Design: Drivers and Barriers to Sustainable Development in
Australia. PRRES Conference, Sydney. Bonda, P., (2003). Why Green Design Matters. Available from
http://www.asid.org/NR/rdonlyres/4BEE1DB3-2E24-4714-84B1-759C60686CE1/0/ WhyGreenDesignMatters.pdf [Accessed June 03, 2014]
Boyle, G. P., (2007). As Sustainable Development is the core principle underpinning planning in England, should Planning Authorities adopt a specific policy for Low Impact Development? MSc thesis, CAT, Wales

251
Bragger, G. and Halloway, S., (1992). Assessing prospects for organizational change: The uses of force field analysis. In: Administration in Social Works. New York: 1992.16 (3,4), 15 -2
Bridges M, Chitonga M, Clarke A, Daniels I, Fenton A, Monks S, Ni Luanaigh A, Shorten J., (2006), The Extent and Impacts of Rural Housing Need. Appendix 5: Affordable Housing Literature Review, Prepared for DEFRA by Cambridge Centre for Housing and Planning Research and Land Use Consultants, UK
Brundtland, G. H. (1987). Our Common Future: The World Commission on Environment and Development,. Oxford.
Bryde, D., Broguetas, M., and Volm, J. M., _The project benefit of building information modeling (BIM). International Journal of Project Management. 31, 971-980
Castro-Lacouture, D. J. A., Sefair, L., Florez, L., Medaglia, A.L., (2009). Optimization model for the selection of materials using a LEED-based green building rating system in Colombia. Building and Environment. 44 (6), 1162-1170.
Chakrabarti, R., and Zhang, J., (2010). Unaffordable Housing and Local Employment Growth. Boston, MA: New England Public Policy Center at the Federal Reserve Bank of Boston. Working Paper No. 10-3.
Chambers, N., Simmons, C. and Wackernagel, M., (2000). Sharing nature's ecological footprints as an indicator of sustainability. London: Earthscan.
Chan, J. W .K., and Tong, T. K. L., (2007). Multi-criteria material selections and end-of-life product strategy: Grey relational analysis approach. Materials and Design. 28, 1539-1546
Chapra, S.C., (2003). Power Programming with VBA/Excel. Upper Saddle River, NJ: Pearson Education. Chatterton, P., Maxey, L., and Pickerill, J. (2007). Alternative home sweet home. Red Pepper 28 April. Chick, A. and Micklethwaite, P., (2011) Design for Sustainable Change: How Design and Designers Can
Drive the Sustainability Agenda. Bloomsbury Chen, J. L., Sun, S. H. and Hwang, W. C., (1995). An intelligent data base system for composite material
selection in structural design. Engineering Fracture Mechanics. 50(5/6), 935- 946. Chinyio, E.A., Olomolaiye, P.O., Kometa, S.T. and Harris, F.C., (1998). A needs-based methodology for
classifying construction clients and selecting contractors. Construction Management and Economics. 16 (1), 91-98.
Christini, G., Fetsko, M., and Hendrickson, C., (2004). Environmental management systems and ISO 14001 certification for construction firms. Journal of Construction Engineering and Management.130 (3), 330-336
Chua, D.K.H., Kog, Y.C., and Loh, P.K., (1999). Critical Success Factors for Different Project Objectives. Journal of Construction Engineering and Management, ASCE. 125 (3), 142-15
CIB/CSIRCIDB/ UNEP (2002). Agenda 21 for Sustainable Construction in Developing Countries. Pretoria. Clarke, S., (2002). Client Report: Final Report on the Construction of the Hemp Houses at Haverhill,
Suffolk. Suffolk Housing Society Ltd. Cole, R. J., (1999). Building environmental assessment methods: clarifying intentions. In: Building Research
and Information. 27 (4/5), 230-246. Cole, R. J., (2005). Building environmental assessment methods: redefining intentions and roles. Building
Research and Information. 35 (5), 455�–467. Cole, R.J., Lidnsey, G., and Todd, J.A., (2000). Assessing life cycles: Shifting from green to sustainable
design. Proceedings: International Conference Sustainable Building. Maastricht, Netherlands, pp. 22-24.
Cole, L., (2008). Keen to be green. Road Transport. Available from: www.roadtransport.com/Articles/2008/05/22/130767/keen-to-be-green.html. [Accessed December 15, 2014]
Cooper, I., (1999). Which focus for building assessment methods: environmental performance or sustainability? Building Research and Information. 27 (4/5), 321–331
Copeland, L., (2004). A Practitioner's Guide to Software Test Design. Boston: Artech House Publishers, 2004 Costello, A. B., and Osborne, J. W., (2005). Practical Assessment. Research and Evaluation. 10 (7). Crawley, D., and Aho, I., (1999). Building environmental assessment methods: application and development
trends. In Building Research and Information. 27 (4/5), 300-308. Creswell, J., (2008). Research Design: Qualitative, Quantitative, and Mixed Methods Approaches. 3rd ed.
Thousand Oaks, CA: Sage publications, 2008. Print. Creswell, J. W., (2007). Qualitative Inquiry and Research Design: Choosing Among the Five Approaches.
2nd ed. Thousand Oaks, CA.: Sage Publications. 2007. Print. Creswell, J. W., (2003). Research design: qualitative, quantitative, and mixed method approaches. Thousand
Oaks, California: Sage Publications. Crosthwaite, D., and Connaughton, J., (2007). World Construction 2007-2008. London: David Langdon. Czaja, R. and Blair, J., (1996). Designing surveys: a guide to decisions and procedures. Thousand Oaks,
California; London, Pine Forge Press.

252
Demir, S. T., Bryde, J. D., and Fearon, D. (2011). LeAgile PM - Time for change in construction project management. Built Environmnet and Sustainable Technologies Conference [BEAN]. Liverpool: John Moores University Liverpool.
Denzin, N. K. and Y. S. Lincoln (2000). Introduction: The discipline and practice of qualitative research. In
N. K. Denzin & Y. S. Lincoln (eds.), Handbook of qualitative research (2nd edn.). Thousand Oaks, CA: Sage, 1─28.
Department for Communities and Local Government (DCLG) (2007). Homes for the future: more affordable, more sustainable. Available from: http://www.communities.gov.uk/documents/housing/pdf/439986.pdf. [Accessed January, 11, 2012]
Department for Communities and Local Government, (DCLG, 2007a). Building a greener future: policy statement. The Stationery Office, London.
Department of the Environment, Transport and the Regions (1998). Rethinking construction: the report of the construction task force. London: DETR
Ding, G. K. C., (2008). Sustainable construction: The role of environmental assessment tools. Journal of Environmental Management. 86 (3), 451-64.
Ding, L., Roberto G., Quercia, W. L., and Janneke R., (2010). Risky Borrowers or Risky Mortgages: Disaggregating Effects Using Propensity Score Models. Working Paper. Durham, NC: Department of Urban Studies and Planning and the UNC Center for Community Capital. May 17.
Donn, M. et al., (2009). Simulation in the service of design: Asking the right questions. IBPSA. Glasgow, Scotland.
Druke, J. and White, G., (1996). Managing people in construction. London: Institute of Personnel and Development.
Dulami, M.F., Ling, F.Y.Y., and Bajracharya, A., (2003). Organisational motivation and inter-organisational interaction in construction innovation in Singapore. Construction Management and Economics. 21, 307-318.
Du Plessis, (2007). A Strategic framework for sustainable construction in developing countries. Construction Management and Economics. 25, 67–76
EBIE, S.P.O.F., (2004). Statutory component(s) on Housing Policy: Legislative and regulatory requirements of the new housing policy. Housing Today. 4 (8), 6-9.
Econsult Corporation, (2009). Potential Economic and Fiscal Impacts of a Pennsylvania Housing Trust Fund. Glenside, PA: The Housing Alliance of Pennsylvania. April 24.
Econsult Corporation, (2007). Assessing the Economic Benefits of Public Housing. Washington, DC: Council of Large Public Housing Authorities. A Concrete Foundation. December 2002. In: Tomorrow, 12 (6)
Edwards, B. and Turrent, D. (2005). Sustainable Housing Principles and Practice. Taylor and Franscis. Ellis, R., (2009). Who Pays for Green Buildings? The economics of sustainable buildings, CB Richard Ellis
and EMEA Research, 2009. Erguden, S. (2001). Low-cost housing: Policies and constraints in developing countries. In: International
Conference of Spatial Information for Sustainable Development, Nairobi, Kenya, Oct. 2-5, 2001. Esty, D.C., Levy, M.A., Srebotnjak, T., and De Sherbinin, A., (2005). Environmental Sustainability Index:
Benchmarking National Environmental Stewardship. Yale Center for Environmental Law and Policy, New Haven, Connecticut
Fairlie, S., (1996). Low impact development- Planning and People in a Sustainable Countryside. Jon Carpenter Publishing, Oxfordshire
Fairlie, (2009). Forward. In: Pickerill, J. and Maxey, L. (eds) Low impact development: the future in our hands. Available from: fhttp://lowimpactdevelopment.wordpress.com. [Accessed January,20, 2014]
Fairlie, S., (2010). Low-Impact Development: Planning and People in a Sustainable Countryside. Charlbury: Jon Carpenter Publishing
Federal Government of Nigeria, (2004). National housing Policy Draft. Abuja: Chebyshev Ventures Ltd. Draft 2004
Federal Ministry of Lands, Housing and Urban Development (2012). Unleashing the Potential in Housing Sector as a Key Contributor to Nigeria’s Economic Development. Background Materials, Presidential Stakeholders Retreat on Housing and Urban Development, Abuja, 12th November 2012, p. 6
Global Construction Perspectives and Oxford Economics (2009). Global Construction 2020, 2009 Federal Office of Statistics, (1983). Social Statistics in Nigeria, FOS, Lagos. Federal Republic of Nigeria, (2006). National Housing Policy. Chebyshev Ventures Ltd. Fernandez, J. E., (2006). Material Architecture: Emergent materials for innovative buildings and ecological
construction. Amsterdam, Boston: Architectural Publishers Fine, B., Leopold, E., (1993). The World of Consumption. London: Routledge. Gass, S. I. (1983). Decision-Aiding Models: Validation, Assessment, and Related Issues for Policy Analysis.
Operations Research. 31 (4), 603-631.
253
Gibberd, J., (2001). The Sustainable Building Assessment Tool – Assessing how buildings can support sustainability in Developing Countries. Continental Shift 2001- IFI International Conference, 11 – 14 September 2001, Johannesburg.
Gibberd, J. T. (2003). Developing a Sustainable Development Approach for Building and Construction Process. In J. Yang, & P. S. Brandon (Ed.), Proceedings of the CIB International Conference on "Smart and Sustainable Built Environment (SASBE2003)". 19–21 November, Brisbane, Australia.
Gibson, W. J. and Brown, A., (2009). Working with Qualitative Data. London: SAGE Publications. Giddings, S., (2007). Housing Challenges and opportunities in Sub-Saharan Africa. International Housing
Coalition Godfaurd, J., Clements-Croome, D. and Jeronimidis, G., (2005). Sustainable building solutions: a review of
lessons from the natural world. Building and Environment. 40 (3), 319-328. Giorgetti and Lovell (2010). Sustainable Building Practices for Low Cost Housing: Implications for climate
change mitigation and adaptation in developing countries. In: Giorgetti and Lovell, January 2010 draft
Global Insight (2012). Global construction outlook, Global Insight Inc., Boston (2012). Gluch, P. and Baumann, H., (2004). The life cycle costing (LCC) approach: a conceptual discussion of its
usefulness for environmental decision making. Building and Environment. 39, 571–580. Goh, K. C. and Yang, J., (2009). Developing a life-cycle costing analysis model for sustainability
enhancement in road infrastructure project. In: Rethinking Sustainable Development: Planning, Infrastructure Engineering, Design and Managing Urban Infrastructure. 26 March 2009, Queensland University of Technology, Brisbane, Queensland.
Golden, B. L., and Wang, Q., (1990). An alternative measure of consistency. In: Golden, B. L., Wasil, A. and Harker, P.T. (eds), Analytic Hierarchy Process: Applications and Studies. New-York: Springer Verlag, 1990, pp. 68-81.
Grace, M., (2000). BREEAM — A Practical Method for Assessing the Sustainability of Buildings for the New Millennium. In: proceedings of the Sustainable Building Conference 2000. Maastricht, the Netherlands.
Godfaurd, J., Clements-Croome, D., and Jeronimidis, G., (2005). Sustainable building solutions: a review of lessons from the natural world. Building and Environment. 40 (3), 319-328,
Hair J.F., Babin B., Money, A.H., Samuel, P., (2003). Essentials of Business Research Methods. Wiley Publishers
Hair, J. F., Anderson, R. E., Tatham, R. L. and Black, W. C., (1998). Multivariate data analysis, Upper Saddle River, N.J., Prentice Hall.].
Hair J. F., Anderson R. E, Tatham R. L, and Black W.C., (1995). Multivariate data analysis. 4th ed. NewJersey: Prentice-Hall Inc; 1995
Halberg, B., Kinkopf, S., Ray, B. et al., (1997). Special Edition - Using Microsoft Excel 97. Indianapolis: Que Corporation.
Halliday, S. (2008). Sustainable Construction. Oxford: Butterworth-Heinemann. IID (The South African Institute of the Interior Design Professions). [Sa]. Available From: The South African Institute of the Interior Design Professions: h t t p : / / w w w . i i d p r o fe s s i o n s . c o m. [Accessed May 05, 2011]
Hammond, B. G and Jones, C., (2006). Embodied CO² data obtained from Inventory of Carbon and Energy Version 1.5, University of Bath
Han, S.H., Kim, D.Y., Jang, H.S. and Choi, S., (2010). Strategies for contractors to sustain growth in the global construction market. Habitat International. 34 (1), 1–10.
Hanley, N., and Spash, C.L., (1993). Cost benefit analysis and the environment. Hants: Edward Elgar. Hassan, T., Mitrovic, D., Gayoso, A and Hunter, I (1998). The Future LSE Industry. European Construction
Institute, Loughborough. Work Package 2 of Report on the ELSEWISE Project. Heesom T. D. (2004). An Analytical System for Space Planning on Construction Sites. PhD Thesis, School of
Engineering and the Built Environment, University of Wolverhampton. Hes, D. (2005). Facilitating ‘green’ building: turning observation into practice. PHD dissertation, RMIT
University, Melbourne. Hoevenagel, R., (1994). A comparison of economic valuation methods. In: Valuing the environment:
methodological and measurement issues. R. Pethig, (Ed.). Boston: Kluwer Academic Publishers, pp. 251-270
Holt, G. D., (1998). Which contractor selection methodology? International Journal of Project Management. 16 (3), 153-164
Hulme, J., and Radford, N., (2010). Sustainable Supply Chains That Support Local Economic Development. Prince’s Foundation for the Built Environment. 1 (1).
Hwang, C-L. and Yoon, K., (1981). Multiple attribute decision making- methods and applications: a state-of-the-art survey. Berlin: Springer-Verlag.

254
IEEE (1990). IEEE Standards Collection: Glossary of Software Engineering Terminology. IEEE Standard 610.12-1990.
Ikpe, E., (2009). Development of cost benefit analysis model of accident prevention on construction projects. PhD thesis, SEBE, University of Wolverhampton, Wolverhampton.
Immergluck, D. (2008). From the Subprime to the Exotic: Excessive Mortgage Market Risk and Foreclosures. Journal of the American Planning Association. 74 (1), 59-76.
Immergluck, D., and Geoff S., (2006a). The Impact of Single-Family Mortgage Foreclosures on Neighborhood Crime. Housing Studies. 21(6), 851–866.
International Energy Agency, (IEA, 2008). Energy Efficiency Requirements in Building Codes, Energy Efficiency Policies for New Buildings. 2008 OECD/IEA. Paris.
Imbert, I. D. C., (2010). Human issues affecting construction in developing countries. Construction Management and Economics. London, E&FN Spon. 219-228.
Inayatullah, S., (1998). Deconstructing the Information Era. Futures. 30 (2/3), 235-238. Jones, B., (2009). Building with Straw Bales: A Practical Guide for the UK and Ireland. (2nd edition). Green
Books, Dartington. Jiboye, A. D., (2009). The challenges of sustainable housing and urban development in Nigeria. Journal of
Environmental Research and Policies. 4 (3), 23-27. Jones, L. (2008). Environmentally responsible design: green and sustainable design for interior designers,
edited by L Jones. New Jersey: John Wiley & Sons, Inc. Kang, M., & Guerin, D.A. (2009). The state of environmentally sustainable interior design practice. American
Journal of Environmental Sciences. 5(2),179-186. Kang, M., Kang, J.H and Barnes, B. 2008. Interior Design Characteristics Influencing Sustainable Energy
Awareness and Application. International Journal of Spatial Design & Research. 8 (10), 17-28. Kakabadse, Y. (2005). The Essence of Sustainable Construction in on the Road to Sustainability—A
Collection of Short Contributions from International Proponents of Sustainable Construction—Holcim awards Available from: http://www.holcimfoundation.org/T702/HolcimAwards.h m. [Accessed March 15, 2011).
Kapelan, Z., Savic, D.A., and Walters, G.A., (2005). Decision-support tools for sustainable urban development, Proceedings of the Institution of Civil Engineers. Engineering Sustainability. 158 (3), 135-142
Kaplan, D. H., and Sommers, G. G., (2009). An Analysis of the Relationship Between Housing Foreclosures, Lending Practices, and Neighborhood Ecology: Evidence from a Distressed County. The Professional Geographer. 61(1), 101–120.
Karana, E., Hekkert, P., & Kandachar, P., (2008). Material considerations in product design: A survey on crucial material aspects used by product designers. Materials & Design. 29 (6), 1081– 1089.
Kennedy, J. (2004) Building without Borders: Sustainable Construction for the Global Village. New Society Publishers
Kennedy, R. C., Xiang, X., Madey, G. R., and Cosimano, T. F. (2005). Verification and Validation of Scientific and Economic Models. Agent 2005 Conferences Proceedings, Chicago, IL.
Kibert, C., (2008). Sustainable Construction: Green Building Design and Delivery. New York, USA: John Wiley & Sons. Editors: Kibert, C., J. Sendzimir, and G. Guy.
Kibert, C.J. (2008). Sustainable construction: Green Building Design and Delivery. Second edition. New jersey, USA: John Wiley and Sons, Inc., Hoboken.
Kibert, C. J. (2005). Sustainable construction: green building design and delivery. Hoboken, New Jersey: John Wiley and Sons, Inc.
Kline, P. (2002). An easy guide to factor analysis. London: Routledge. Krotscheck, C. and Narodoslawsky, M., (1996). The sustainable process index: A new dimension in
ecological evaluation. In: Ecological Engineering. 6, 241-258. Kryish, S., (1994). Here comes the revolution again: Evaluating predictions for the information superhighway.
Media Information Australia. 74, 5‑14. Lam, K., Wong, N. et al., (1999). A study of the use of performance- based simulation tools for building
design and evaluation in Singapore. Langston, C. and Ding, G.K.C. (2001). Sustainable practices in the built environment. 2nd Edn., Oxford:
Butterworth Heinemann. Leavitt, F., (2004). Evaluating Scientific Research: Separating Fact from Fiction. Long Grove, IL: Waveland
Press, 2004. Print. Lee, J. S., and Hu.,Y., (2008). In K. Kondo-Brown & J. D. Brown (Eds.), Teaching Chinese, Japanese, and
Korean heritage language students. New York: Lawrence Erlbaum Associates. Lubell, J., and Maya B., (2007). Framing the Issues — The Positive Impacts of Affordable Housing on
Education. Washington, DC: Center for Housing Policy. Lenzen, M. and Treloar, G.J., (2002). Embodied energy in buildings: wood versus concrete-reply to
Börjesson and Gustavsson, Energy Policy. 30, 249–244.

255
Lerner, Daniel (1958). The Passing of Traditional Society: Modernizing the Middle East. Glencoe, Illinois: The Free Press.
Likert, R., (1932). A Technique for the Measurement of Attitudes. Archives of Psychology. 140,1‐55. Macal, C. M., (2005). Model Verification and Validation. Workshop on “Threat Anticipation: Social Science
Methods and Models. The University of Chicago and Argonne National Laboratory; April 7-9, 2005; Chicago, IL
Lovell, H., (2004). Framing sustainable housing as a solution to climate change. Journal of Environmental Policy and Planning. 6 (1), 35–55.
Mabogunje A., (2007). Beyond Housing Delivery: The Challenge of Infrastructural Provision and Orderly Urban Development in Nigeria. A paper presented at the Annual Lecture of S.O. Fadahunsi (Housing) Foundation. Lagos.
Macal, C. M., (2005). Model Verification and Validation. Workshop on Threat Anticipation: Social Science Methods and Models. The University of Chicago and Argonne National Laboratory, April 7-9; Chicago, Illinois.
Mahmoud, M. A. A., Aref, M., and Al-Hammad, A., (1996). An expert system for evaluation and selection of floor finishing materials. Expert Systems with Applications. 10 (2), 281- 303.
Malanca, M., (2010). Green Building Rating Tools in Africa. In: Conference on Promoting Green Building Rating in Africa.
Marcotullio, P., (2005). Time-space telescoping and urban environmental transitions in the Asia Pacific. United Nations University, Yokohama: UNUN-IAS Report.
Margolin, V., (2007). Design, the future and the human spirit. Design Issues. 23 (3). 4-15. Martine, G., (2006). Population/development/environment trends in a globalised context: Challenges for the
21st century. GENUS. 61 (3-4), 247-277. Martine, G., and Odelius, A., (2006). The compact city: a literature review. Research note prepared in
connection with the UNFPA’s 2007 State of the World Population. Mate, K.J., (2006). Champions, Conformists and Challengers: Attitudes of Interior Designers as Expressions
of Sustainability through Material Selection. Paper 0066. Paper presented at Design Research Society International Conference. Wonderground. 1-4 November, Lisbon.
Maxey, L., Pickerill, J., and Wimbush, P., (2006). New planning opportunities for low impact settlements. Permaculture Magazine. 50, 32.
Maxey, L. (2009). What is low impact development? In: Pickerill, J. and Maxey, L. (eds) Low impact development: the future in our hands. Available from: http:// lowimpactdevelopment.wordpress.com. [Accessed January 20, 2015]
Mehta, R., and Beidwell, L., (2005). Innovative construction technology for affordable mass housing in Tanzania, East Africa. Construction Management and Economics. 23, 69-79.
Miles, M. B., and Huberman, A. M., (1994). Qualitative Data Analysis. An Expanded Sourcebook. 2nd ed.,
Sage, Thousand Oaks, CA. Miles J. C., Moore C. J., Kotb A. S. M., and Jaberian-Hamedani, A., (2000). End User Evaluation of
Engineering Knowledge Based Systems. Civil Engineering and Environmental Systems. 17 (4), 293-318.
Mitchell, G., May, A., and MacDonald, A., (1995). PICABUE: A methodological framework for the development of indicators of sustainable development. In: International Journal of Sustainable Development and World Ecology. 2, 104-123.
Mohamed, A. and Celik, T., (1998). An integrated knowledge-based system for alternative design and materials selection and cost estimating. Expert Systems with Applications. 14 (3), 329-339.
Morton, T., (2007). Towards the development of contemporary Earth Construction in the UK: Drivers and benefits of Earth Masonry as a Sustainable Mainstream Construction Technique. In International Symposium on Earthen Structures, Indian Institute of Science, Bangalore, 22–24 August. India: Interline Publishing.
Miller, N., Spivey, J., and Florance, A., (2008). Does Green Pay Off. Journal of Real Estate Portfolio Management. 14 (4), 385–401.
Mubaiwa, A. (2002). Earth as an alternative building material for affordable and comfortable housing in Zimbabwe: Undergraduate Dissertation. Department of Architecture, National University of Science and Technology, Bulawayo, Zimbabwe.
Munn, P. and Drever, E., (1990). Using questionnaires in small-scale research: A teachers' guide. Edinburgh: SCRE.
Myers, M. D. (2009). Qualitative Research in Business & Management’. Sage, London Myers, M. D. and Newman, M., (2007). The Qualitative Interview in IS research: Examining the craft.
Information and Organization. 17 (1), 2-26. Nam, C. H., and Tatum, C. B., (1989). Toward understanding of product innovation process in construction.
Journal of Construction Engineering and Management. 115 (4), 517-534.

256
Nassar, K. W., Thabet, Y., and Beliveau, (2003). A procedure for multi-criteria selection of building assemblies. Automation in Construction. 12 (5), 543-560.
National Association of Home Builders, (2010). The Local Economic Impact of Typical Housing Tax Credit Developments. Washington, DC: Author.
National Association of Home Builders, (2009a). The Local Impact of Home Building in a Typical Metro Area: Income, Jobs, and Taxes Generated. Washington, DC: Author.
National Association of Home Builders, (2009b). The Local Impact of Home Building in a Typical Metro Area: Comparing Costs to Revenue for Local Governments. Washington, DC: Author.
National Bureau of Statistics (2013). Gross Domestic Product for Nigeria, Abuja, February 2013 National Bureau of Statistics (NBS, 2010). A Report on the Annual Abstracts of Statistics 2010. Federal
Republic of Nigeria National Research Council (2008). Building for tomorrow: global enterprise and the U.S. construction
industry. Committee on the International Construction Industry. National Academy Press, Washington, D.C. (2008).
Neumayer, E. (2001). The human development index and sustainability-a constructive proposal'. In: Ecological Economics, Volume. 39, pp. 101-114.
NIA (2012). The Nigerian Institute of Architects: Overview. Available from: http://www.niarchitects.org/index.php?r=site/index [Accessed 2 January 2012].
Nijkamp, P., Rietveld, P. and Voogd, H. (1990). Multicriteria evaluation in physical planning. North-Holland, New York.
Noble, E.E., and Sanchez, P.P., (1990). A note on the information content of a consistent pairwise comparison judgment matrix of an AHP decision maker. Theory and Decision. 34, 99-108.
Norton, J., (1999). Sustainable Architecture. Development Workshop. France June1999. Available from: http://www.dwf.org/ en/download/ Sustainable%20shelter%20article.pdf [Accessed 26 May 2011].
Nwafor, J.C. (2006). Environmental Impact Assessment for Sustainable Development. Enugu: Eldermark Publishers.
Nwokoro, I., and Onukwube, H., (2011). Sustainable or Green Construction in Lagos, Nigeria: Principles, Attributes and Framework. In: Journal of Sustainable Development. 4 (4), August 2011.
Nubi, T.G. and Omirin, M.M.,(2010). PAASO model: a tool kit for appraising mortgage finance effectiveness in Nigeria. The Lagos Journal of Environmental Studies,7(1),6-8
Nubi, O.T., (2008). Affordable Housing Delivery in Nigeria. The South African Foundation International conference and exhibition. Cape town, October, pp.1-18.
Nubi, O.T. (2000). Housing finance in Nigeria. Need for Re-engineering. Ideal Habitat Cooperative Housing Initiative.
Obonyo E, Anumba C., and Thorpe T.E, (2005). APRON: An Agent-Based Specification and Procurement, System for Construction Products. Engineering, Construction and Architectural Management. 12 (4), 329-350. Emerald Group Publishing Limited.
OECD, (2006). The Organisation of Economic Co-operation and Development Environmental Performance Review – UK’s Progress Report, Department for Environment, Food and Rural Affairs, Organisation of Economic Cooperation and Development, Paris, available at: www.defra.gov.uk/environment/internet/oecd/pdf/epr-ukreport2006.pdf. [Accessed March 2008].
Ofori, G. (2006). Revaluing Construction in Developing Countries: A Research Agenda. Journal of Construction in Developing Countries. 11 (1), 1-16.
Ofori, G. and Chan, G., (2001). ISO 9000 Certification of Singapore construction enterprises: its costs and benefits and its role in the development of the industry. Engineering, Construction and Architectural Management. 8 (2), 145-157.
Ofori, G., (2000). Greening the construction supply chain in Singapore. European Journal of Purchasing & Supply Management, 6 (3–4), 195–206.
Ofori, G., (1991). Programmes for improving the performance of contracting firms in developing countries: A review of approaches and appropriate options. Construction Management and Economics.11, 175-185.
Oladipo, F.O., and Oni, O. J., (2012). A Review of Selected Macroeconomic Factors Impacting Building Material Prices in Developing Countries – A Case of Nigeria. Ethiopian Journal of Environmental Studies and Management. 5 (2)
Oliver, P. (2003). Technology Transfer—A Vernacular View, in Buildings, Culture and Environment, Informing Local & Global Practice. Blackwell Publishing, Oxford.
Olotuah, A. O. and Bobadoye, S.A., (2009). Sustainable Housing Provision for the Urban Poor: A Review of Public Sector Intervention in Nigeria. The Built and Human Environment Review. 2, 51- 63.
Olson, E.A. (1996). Evidence-based practice – a new approach to teaching the integration of research and practice in gerontology’. Educational Gerontology. 22 (6), 523-37.
Oluwakiyesi, T., (2011). Construction Industry Report: A Haven of Opportunities Vitiva Research [online]. Available from [email protected] [Accessed 3rd January, 2012].

257
Oppenheim, A. N., (1992). Questionnaire design, interviewing, and attitude measurement. New York City: St. Martin's Press.
Organization for Economic Co-operation and Development (OECD, 2003). Environmentally Sustainable Buildings: Challenges and policies.
Orme, J.G. and Buehler, C., (2001). Introduction to Multiple Regressions for Categorical and Limited Dependent Variables. Social Work Research. 25, 49-68.
Oruwari, Y., Jev, M., and Owei, P. (2002). Acquisition of Technological Capability in Africa: A Case Study of Indigenous Building Materials Firms in Nigeria. ATPS Working Paper Series. 2 (33), 1-15.
Owolabi, J. D, Amusan, L. M., Ajala, O. T, Tunji-Olayeni, P., Peter, J., Omuh, I. O., and Joshua, O., (2014). Perspectives on effectiveness of gypsum board over sandcrete block as walling material. International Journal of General Engineering and Technology (IJGET). 3 (4),17-28
Papamichael, K. and J. Protzen (1993). The limits of Intelligence in Design. Informatics and Cybernetics. 4th International Symposium on System Research. Baden, Germany.
Pedgley, O., (2009). Influence of Stakeholders on Industrial Design Materials and Manufacturing Selection. International Journal of Design. 3(1), 1–15.
Pickerill, J and Maxey, L., (2009). Geographies of Sustainability: Low Impact Developments and Radical Spaces of Innovation. Journal Compilation © 2009 Blackwell Publishing Ltd. 1515–1539,
Pickerill, J., and Maxey, L. (2007). The Lammas low impact housing development. Sustainability. 1, 18–19. Pidcock, C. (2005). A sustainable design. Object. 46:15. Postle, M., (1998). Comprehensive project evaluation: testing the available methodologies. In: Proceedings of
ROOTS' 98, RICS Research Foundation, RICS, London. Priemus, H. (2005). How to make housing sustainable? The Dutch experience. Environment and Planning B:
Planning and Design, 32(1), 5 - 19. Price, A., Adetunji, I., Fleming, P., and Kemp, P. (2003). Sustainability and the UK construction industry—a
review. Proceedings of the ICE-Engineering Sustainability, 156 (4), 185-199 Reffat, R., (2004). Sustainable construction in developing countries. In: Proceedings of First Architectural
International Conference, Cairo University, Egypt, 2004. Raftery, J., Pasadilla, B., Chiang, Y. H., Hui, E. C. M., and Tang, B. S., (1998). Globalization and
construction industry development: implications of recent developments in the construction sector in Asia. Construction Management and Economic. 16, 729-737.
Raheem, A.A., Momoh, A.K., and Soyingbe, A.A., (2012). Comparative Analysis of Sandcrete Hollow Blocks and Laterite Interlocking Blocks as Walling Elements. International Journal of Sustainable Construction Engineering & Technology. 3, (1)
Raji, O., (2008). Public and private developers as agents in Urban Housing delivery in sub-Saharan Africa: The situation in Lagos state. Humanity of social sciences Journal. 3 (2), 143-150.
Raudonis, B.M. (1992). Ethical considerations in qualitative research with hospice patients. Qualitative Health Research. 2 (2), 238-249.
Reza, B., Sadiq, R. and Hewage, K. (2010). Sustainability assessment of flooring systems in the city of Tehran: An AHP-based life cycle analysis. Construction and Building Materials. 25 (4), 2053-2066.
Roaf, S., Crichton, D. and Nicol, F. (2004). Adapting Buildings and Cities for Climate Change. Architectural Press, Oxford.
Robinson, J., (2004). Squaring the Circle? Some thoughts on the idea of sustainable development. Ecological Economics. 48, 369-384.
Robson, C., (2002). Real World Research. Oxford: Blackwell Publishing. Saaty, T. L., (2008). Relative Measurement and Its Generalization in Decision Making Why Pairwise
Comparisons are Central in Mathematics for the Measurement of Intangible Factors. The Analytic Hierarchy/Network Process RACSAM. 102 (2), 251-318.
Saaty, T.L., (2007). Time dependent decision-making dynamic priorities in the AHP/ANP: Generalizing from points to functions and from real to complex variables. Mathematical and Computer Modelling. 46 (7-8), 860-891
Saaty, T.L., (2001). Decision Making for Leaders: The Analytic Hierarchy Process for Decisions in a Complex World. Pittsburgh: RWS Publications.
Saaty, T.L. (2000). Fundamentals of the Analytic Hierarchy Process. Pittsburgh: RWS Publications. Saaty, T.L. (1994). Fundamentals of decision-making and priority theory with the analytic hierarchy process.
Pittsburgh: RWS Publications. Saaty, T.L., (1986). Axiomatic foundation of the analytic hierarchy process. Management Science. 32 (7),
841–855 Saaty, T L (1980) The Analytic Hierarchy Process. New York, NY: McGraw-Hill. San-Jose, L. J.T. and Cuadrado, R. J. (2010b). Industrial building design stage based on a system approach to
their environmental sustainability. IConstruction and Building Materials. 24 (4), 438-447. San-Jose, J.T.L and Garrucho, A.I. (2010). A system approach to the environmental analysis of industrial
buildings. In: Building and Environment. 45 (3), 673-683.

258
San-Jose, J.T.L., and Cuadrado, R. J., (2010). Industrial building design stage based on a system approach to their environmental sustainability. Construction and Building Materials. 24 (4), 438-447.
San-Jose, J. T., Losada, R., Cuadrado, J. and Garrucho, I. (2007). Approach to the quantification of the sustainable value in industrial buildings. Building and Environment. 42, 916– 3923.
Sargent, R. G., (1998). Verification and Validation of Simulation Models. In: Proc.1998 Winter Simulation Conference, pp. 121-130, Medeiros, D. J., Watson, E. F., Carson, J. S. and Manivannan,eds: M. S.; Dec. 13-16, Washington, D.C, USA.
Schinas, O (2007). Examining the use and application of multi-criteria decision making technique in safety assessment. International Symposium on Maritime Safety, Security and Environmental Protection.
Sebake, S. (2009). An overview of green building rating tools. Green Building Handbook South Africa (1) p. 27-33.
Seyfang, G., (2009a). Community action for sustainable housing: building a low carbon future. Energy Policy doi:10.1016/j.enpol.2009.10.027.
Seyfang, G., and Smith, A. (2007). Grassroots innovations for sustainable development: towards a new research and policy agenda. Environmental Politics. 16 (4), 584–603.
Shash, A. A. (1993) Factors Considered in Tendering Decisions by top UK Contractors. Construction Management and Economics. 11, 111-118
Shuman, M., (2008). The Small-mart Revolution: How Local Businesses Are Beating the Global Competition.
Siegel, S. and Castellan, J. N., (1988). Nonparametric Statistics for the Behavioural Sciences. 2nd Ed. New York: McGraw-Hill.
Singh, A., (2007). Approximate estimating method for typical buildings. Cost Engineering. 49 (8), 28-31. Smith, A., (2007). Translating sustainabilities between green niches and socio- technical regimes. Technology
Analysis & Strategic Management. 19 (4), 427–450. Smith, J. and G. Baird. Implementation of a Building Sustainability Rating Tool: A Survey of the New
Zealand Building Industry. Proceedings of the SB07 New Zealand Conference, Auckland, November 14–16, 2007. Auckland, New Zealand: New Zealand Sustainable Building Conference.
Sneddon, C., Howarth, . R., and Norgaard, R., (2006). Sustainable development in post Brundtland world. Ecological Economics. 57, 53-268.
Snee, R. D., (1977). Validation of regression models: Methods and examples, Technometrics. 19 (4), 415-428.
Sommerlad, E., (1992). A Guide to Local Evaluation. London: Employment Department. Members of the Evaluation Development Research Unit, Tavistock Institute of Human Relations
Soebarto, V.I., and Williamson, T.J., (2001). Multi-criteria assessment of building performance: theory and implementation. In: Building and Environment. 36, 681-690.
Soronis, G. (1992) An approach to the selection of roofing materials for durability. Construction and Building Materials, 6(1), 9-14.
Solecki, W., Huan F., and Lizhong, W., (2005). Introduction. In: Huan Feng, Lizhong Yu and William Solecki, (eds.) Urban Dimensions of Environmental change. USA Inc., pp. 1- 7
Spiegel, R., and Meadows, D., (1999). Green Building Materials: A Guide to Product Selection and Specification. New York: John Wiley & Sons, Inc., 1999.
SPSS, (2011). SPSS for Windows, [Software], version 20.0.1, Chicago Steen, A., Steen, B., (2001). The Beauty of Straw Bale Homes. Chelsea Green, Totnes. Stephens, C. and Stair, P., (2007). Charting a new course for urban public health. State of the World 2007:
Our Urban Future. The Worldwatch Institute, W.W. Norton & Co., New York, pp. 134-147 Stieg, C., (2006). The sustainability gap. Journal of Interior Design. 32(1). 7-20. Survey of Factors that Influence Material-Selection in the Design Process: Conducted in March and April,
2011. Available from: http://www2.surveyworld.net/sw/surveys/part.asp S=10336&P=3263546&R=1&L=&H=F25F8AF7ED0A84DE32C33037F7010BDEFAFFBBCA, [Accessed 15 November 2012]
Sutrisna, M., (2004). Developing a knowledge-based system for the valuation of variations in civil engineering works. PhD thesis, University of Wolverhampton, Wolverhampton.
Tabachnick, B. G., & Fidell, L. S. (2007). Using multivariate statistics (5th ed.). Upper Saddle River, NJ: Pearson Allyn & Bacon.
Takim, R., Akintoye, A. and Kelly, J. (2004). Analysis of Performance Measurement in the Malaysian Construction Industry, In: Ogunlana, S. O., Chareonngam, C., Herabet, P. and Hadikusumo, B. H. W. (Eds.) Globalization and Construction, AIT Conference Centre, Bangkok, Thailand, 533–546.
Taylor, D.C., Mohamed, Z.A., Shamsudin, M.N., Mohayidin, M.G. and Chiew, E.F.C. (1993}. Creating a farmer sustainability index: a Malaysia case study. In: American Journal of Alternative Agriculture. 8 (4), 175-184.

259
Teedon, P (2009). contradictions and dillemas in the provision of low income housing: the case of Harare in Amis and Lloyd (1990).
Todd, J. A,, et al., (2001). Comparative Assessment of Environmental Performance Tools and the Role of Green Building Challenge. Building Research and Information. 29 (5), 324-335.
Trusty, W. B., (2003). Understanding the green building toolkit: Picking the right tool for the job. Proceedings of the USGBC Greenbuild Conference & Expo, Pittsburgh, PA. Available from: http://www.athenasmi.ca/publications/publications.html. [Accessed 2 July 2011]
Tunstall, S.M. and Coker, A. (1992). Survey-based valuation methods. In Valuing the environment: economics approaches to environmental evaluation, A. Coker, & C. Richards, (Eds.), West Sussex, John Wiley & Sons, pp. 104-126
Udechukwu C.E., and Johnson. O.O., (2008). The Impact of Green Buildings on Valuation Approaches. Lagos Journal of Environmental Studies. 6 (1), 3-13.
UN-Habitat, (2011). Low-Cost Sustainable Housing, Materials + Building Technology in Developing Countries—Shelter Initiative for Climate Change Mitigation, www.gltn.net/....low-cost-sustainable-housing-materials- building-technology-in-developing-countries...-/download.html (accessed Mar. 3, 2011).
UN-Habitat, (2010). Global Campaign on Urban Governance. [Online] York: Oxford University Press. Available from: http://www.unhabitat.org - email: [email protected] [Accessed 6 April 2011].
United Nations (2009). quoted in Oxfam, FROSI). United Nations Environment Programme [UNEP] (2003). Sustainable Building and Construction. Division of
Technology, Industry and Economics: Paris, France, 2003. United Nations, Department of Economic and Social Affairs, Population Division (2011). World Population
Prospects: The 2010 Revision. 1, Comprehensive Tables. ST/ESA/SER.A/313. United Nations Development Plan (UNDP, 2011). African Economic Outlook 2011: Africa and Its Emerging
Partners. African Development Bank, OECD, UNDP and UNECA, 2011. United States Department of Energy (1998). Emissions of Greenhouse Gases in the United States. Energy
Information Administration. U.S. Dept of Energy: Washington, DC. United States Department of Energy (2009). Emissions of Greenhouse Gases in the United States. Energy
Information Administration. U.S. Dept of Energy: Washington, DC. United States Department of Energy, (2010). About the Weatherization Assistance Program. Washington,
DC: Author. Available from: http://www1.eere.energy. gov/wip/wap.html [Accessed 20 August 2010] University of the West of England, Land Use Consultants (2002). Low impact development – planning policy
and practice. Final Report. Bristol, UK: UWE [online]. Available from: www.tlio.org.uk/chapter7/welsh%20low%20impact%20report.pdf. [Accessed August 11, 2011]
Urban Land Institute (2013). Lack of Affordable Housing Near Jobs: A Problem for Employers and Employees. US Newswire Press Release. Available from: www. housingcolorado.org/images/uploads/47ab69762a6aa.doc [Accessed August 13, 2010].
Urban Land Institute, (2007).. “Lack of Affordable Housing Near Jobs: A Problem for Employers and Employees.” Press Release., 2010 (www. housingcolorado.org/images/uploads/47ab69762a6aa.doc).
Van Kesteren, I. E. H., (2008). Product designers’ information needs in materials selection. Materials & Design. 29 (1), 133-145.
Van Pelt, M.J.F., (1994). Environment and project appraisal: lessons from two cases. The Annals of Regional Science. 28, (1), 55-76.
Vale, B. and Vale, R., (2002). The new autonomous house: Design and planning for sustainability. London, Thames and Hudson Ltd.
Velicer, W. F., and Fava, J. L., (1998). Effects of variable and subject sampling on factor pattern recovery. Psychological Methods. 3 (2), 231-251.
Velicer, W. F., & Jackson, D. N. (1990). Component Analysis Versus Common Factor-Analysis - Some Further Observations. Multivariate Behavioral Research. 25 (1), 97-114.
Vidogah, W. and Ndekugri, I., (1998). A review of the role of information technology in construction claims management. Computers in Industry. 35 (1)|, 77-85.
Wackernagel, M., & Rees, W. (1996). Our ecological footprint: reducing human impact on earth. Gabriola Island: New Society Publishers.
Wahab, A. B. and Alake, O., (2007). Effects of delay on construction projects in Nigeria. Building
Environmental Journal. 3 (1), 21-27. Walkenbach, J., (1999). Microsoft Excel 2000 Power Programming with VBA. Foster City, CA (1999): IDG
Books Worldwide, Inc. There are numerous other books on Excel by the same author, including 2003, 2007 and 2010 versions of this one.

260
Walker, C., (2010). Affordable Housing for Families and Neighborhoods: The Value of Low-Income Housing Tax Credits in New York City. Columbia, MD, and Washington, DC: Enterprise Community Partners, Inc., and Local Initiatives Support Corporation.
Wastiels L., Wouters I. and Lindekens J., (2007). Material knowledge for Design: The architect’s vocabulary. Emerging trends in Design Research. International Association of Societies of Design Research (IASDR) Conference, Hong Kong, Hong Kong, 2007
Wastiels L., and Wouters I., (2008). Material considerations in architectural design: A study of the aspects considered by architects for selecting materials, Undisciplined!, Design Research Society Conference, Sheffield, UK, 2008
WCED, (1987). Our Common Future. World Commission on Environment and Development. Oxford, New York.
Wells, J. (1985). The Role of Construction in Economic Growth and Development. Habitat International. 9 (1), 55-70.
Willetts, R., Burdon, R., Glass, J., and Frost, M., (2010). Environmental and Sustainability Impact Assessment of Infrastructure in the United Kingdom. Journal of the Transportation Research Board. 215 (8), 143-150.
Winpenny, J. (1991). Environmental values and their implications for development. In: Development Policy Review. 9 (4), 381-390.
Winch G., (2005). Construction as production by projects. In S. Kazi (ed.) Learning from Experience: New Challenges, Theories and Practices in Construction, Proc. CIB Joint Symposium: Combining Forces - Advancing Facilities Management and Construction through Innovation, Vol. 7, VTT, Helsinki, pp. 25-41.
Wrench, T., (2001). Building a Low-Impact Roundhouse. Permanent Publications, East Meon, Hampshire. Wong, J. K. W. and LI, H., (2008). Application of the analytic hierarchy process (AHP) in multi-criteria
analysis of the selection of intelligent building systems. Building and Environment. 43, 108-125. Woolley, T., (2006). Natural Building: A Guide to Materials and Techniques. Ramsbury, Marlborough,
Wiltshire, UK: The Crowood Press Ltd. World Bank. (2010). Nigeria: State Building, Sustaining Growth, and Reducing Poverty. A Country
Economic Report. Report 29551-NG, Poverty Reduction and Economic Management Sector Unit, West Africa Region, Washington, DC.
World Databank, (2012). World Development Indicators,. Available from: http://data.worldbank.org/indicator/NY.GNP.PCAP.PP.CD [Accessed October 15, 2014]
Xiao, H. (2002). A comparative study of contractor performance based on Japanese, UK and US construction practice. PhD thesis, SEBE, University of Wolverhampton, Wolverhampton.
Yates, A., (2001). Quantifying the Business Benefits of Sustainable Buildings: Summary of existing research finds (Extracts) (Draft for discussion). Centre for Sustainable Construction, BRE
Yates, R., and Baldwin, R., (1994). Assessing the environmental impact of buildings in the UK. In: Proceedings of the CIB Congress. Watford, UK.
Yin, R. K., (2009). Case study research: Design and methods (4th ed.). Los Angeles: Sage Publications. Yin, R.K., (2003). Case study research: Design and Methods. 3rd Ed., California: Sage Publications. Yin, K., (1989). Case Study Research: Design and Methods. Newbury Park, CA: Sage publishers. Zami, M. S. (2010). Understanding the factors that influence the adoption of stabilised earth by construction
professionals to address the Zimbabwe urban low cost housing crisis. PhD thesis submitted to University of Salford, United Kingdom.
Zarandi, M., Mansour, S., Hosseinijou, S. and Avazbeigi, M., (2011) A material selection methodology and expert system for sustainable product design. The International Journal of Advanced Manufacturing Technology. 57 (9), 885-903.
Zhou, P., Ang, B.W., and Zhou, D.Q., (2010). Weighting and Aggregation in Composite Indicator Construction: a Multiplicative Optimization Approach. Social Indicator Research. 96, (1), 169-181.
Zhou, C.C., Yin, G.F. and Hu, X.B. (2009). Multi-objective optimization of material selection for sustainable products: Artificial neural networks and genetic algorithm approach. Materials and Design. 30(4), 1209-1215.

Appendices

261
Appendix A: Definitions
For the purposes of this study and clarity, the following definitions have been adopted. Architects by definition, according to the Architects Registration Council of Nigeria’s (ARCON) standard are; “persons who will have completed a six-year course in the design, specification and erection of buildings, passed the professional practice examination which is the final stage of the training, and fully endorsed by the Architect’s Council’s Registration Board” (NIA, 2012).
Sustainability Principle is defined as a concept that integrates the fundamental indicators or factors of sustainable development such as environmental responsibility, socio-cultural awareness, technical performance, sensorial value, and economic profitability to society at large to address a design, material selection or construction problem. Sustainable development is defined as: A continuous improvement process of any development that does not only exhibit a minimum of negative environmental impact but also touches on the social, economic, legal, technical, emotional, and cultural dimensions, to effectively address a range of issues specific to the population it intends to serve during its life-cycle”.
Appendix B: Research Ethics Application Form
OFFICE USE: / / University of Westminster Research Ethics sub-Committee Application for Research Ethics Consideration COVER SHEET (To be completed by all applicants)
Section 1 – PROJECT AND APPLICANT DETAILS To be completed by all applicants
1.1 Project Title: Low-Cost Green Building Material Selection in the Design of Low-Impact Green Energy Housing Developments in Nigeria

262
1.1 Applicant Details
Name: IBUCHIM BOBO OGUNKAH
Email Address: [email protected]
Contact Address: 16 WOOD COTE ROAD, WALLINGTON, SUTTON, SURREY, UK
Telephone Number: +44(0) 75 3880 0736
Please check the relevant box: ¨ Undergraduate ¨ Postgraduate MPhil/PhD Student ¨ Staff
1.3 Supervisor/Dean of School/ School Research Director details Please note that all applicants with a supervisor(s) must ensure that the supervisor signs the declaration at the bottom of this page if completing Part A only or in Section 10.3 if completing Part B All staff must ensure that their Dean of School, or School Research Director (or nominee), as appropriate, signs the declaration at the bottom of this page if completing Part A only or in Section 10.3 if completing Part B
Name: Junli Yang (Phd/Director of Studies) Brian Jones (Second Supervisor)
Email Address: [email protected]
School/Centre/Unit:
Telephone Number:
2.5 Timescales Start Date (DD/MM/YY): 01/10/2009 Estimated duration of work: 36 Months
Section 3 RISK OF HARM
Yes No N/A
1 Is pain or more than mild discomfort likely to result from the study
2 Could the study induce psychological stress or anxiety or cause harm or negative consequences beyond the risks encountered in normal life?
3 Will the study involve prolonged or repetitive testing?

263
4 Will the study involve raising sensitive topics (e.g. sexual activity, drug use, revelation of medical history and/or illegal activities)
5 Does your work involve any material containing human cells (e.g. blood, urine, saliva, body tissues) from living or deceased persons? (Such work must take account of the Human Tissue Act).
6 Will DNA samples be taken from human participants? (Such work must take account of the Human Tissue Act).
7 Does your study raise any issues of personal safety for you or other researchers involved in the project? (Especially relevant if taking place outside working hours or off University premises)
8 Does your study involve deliberately misleading the participants (e.g. deception, covert observation)
9 Does your work involve administration of a non-food substance in abnormally large amounts or one that is known to cause allergic reaction(s) in some people?
PARTICIPANTS
Does your work involve any of the following:
Yes No N/A
10 Human participants in health settings (e.g. private patients in private clinics)
11 Human participants in health settings (e.g. NHS patients in NHS clinics/hospitals)
12 Human participants who are in the care of a social worker
13 Expectant or new mothers
14 Refugees
15 Minors (under the age of 18 years old)
16 Participants in custody (e.g. prisoners or arrestees)
17 Participants with impaired mental capacity (e.g. severe mental illness, brain damaged, sectioned under Mental Health Act, lowered or reduced sense of consciousness)
INFORMATION TO PARTICIPANTS
Yes No N/A
18 Will you provide participants with a Participant Information Sheet prior to obtaining consent which can be taken away by the participant?
19 Will you describe the procedures to participants in advance, so that they are informed about what to expect?
20 Will you obtain consent for participation? (normally written)
21 Will you tell participants that they may withdraw from the research at any time and for any reason?
22 With questionnaires, will you give participants the option of omitting questions they do not want to answer?
23 Will you tell participants that their data will be treated with full confidentiality and that, if published, it will not be identifiable as theirs?
24 Will you debrief participants at the end of their participation (e.g. give them a brief explanation of their study)?

264
Appendix C: Results of the Preliminary Study
Introduction
In order to address the specific issues identified in the literature review, a preliminary survey was conducted with leading experts in the field to: 1) get additional information regarding their views on the current information sources available to them for selecting LCGBMCs; 2) find out what they thought about the impacts of decision support systems on decision making; and 3) identify which factors they considered as most important for selecting building materials. The full report emerging from the preliminary study is discussed as follows. Choice of Research Methodology
For the preliminary research study, two different methods were first considered before settling on the final choice. The advantages and drawbacks of in-person interviews and questionnaires were considered to assess their suitability for the study. Given that the respondents were widely dispersed, the constraints of time, importance of wider coverage, and limited budget meant that interviews were finally discarded in favour of questionnaires conducted by email. It was thus, decided that a semi-structured questionnaire containing a mixture of open and closed-ended questions would be more appropriate. The inclusion of qualitative open-ended questions provided respondents a chance to express their views more freely. The Questionnaire
For the questionnaire survey, respondents were informed of the purpose for data collection and how the information provided will be used. This was done through a duly signed covering letter that clearly stated the rights of the respondents. The questionnaire was designed so that each question was worded in a clear and straightforward manner to minimise the risk of ambiguity, and to further increase the response rate. The questionnaire was divided into 3-sections. It consisted of 15 closed and 5 open-ended questions based on the findings of the reviewed literature. For easy analysis, quicker response, and to determine the weight of each factor, respondents were asked to select from a list of answers the extent to which they agreed with the factors influencing material choice using a five point likert scale from 1 (strongly disagree) to 5 (strongly agree) along with the ‘other’ option which gave them the chance to express their views.

265
Characteristics of the Respondents
The questionnaires were deployed to representatives of relevant professional groups from throughout the construction value chain, particularly from those who influence material choice decisions, have experience in green building rating schemes, and possess enough industry and product knowledge on issues associated with LCGBMCs. The selection of participants for the evaluation exercise was based on proposed sampling methods in section 4.5.2.9 of chapter 4. The target groups of respondents were taken from a directory of building professionals provided by the UK, China, Canada and US Green Building Councils (GBCs). The choice of theses countries was based on the fact that they had green building rating schemes in place. The data from the preliminary survey was an opportunity to elicit information from expertise from other countries with different socio-economic issues. Moreover, it was used to check the consistency of the information obtained in terms of whether they share similar problems with the area understudy. To receive a reasonably sized sample, 175 surveys were sent out by email, over a two-month period of March and April 2011). Out of the 175 randomly selected practices, one hundred and twenty-five opted out, and 50 were delivered successfully to achieve a response rate of 28.6 per cent. The response rate is in line with similar surveys in the construction industry such as Takim et al. (2004) who achieved a response rate of 20 percent. Presentation of Survey Results
The following presents some of the main questions and results of the study. Question 5 – Do you consider the use of low-cost green building materials in your housing projects?
Figure 1. Graph showing percentage usage level of low-cost green materials

266
Question7 – Are you aware of any information source(s) used by building professionals for selecting low-cost green building materials/components for their projects? (Please specify any if known)
Figure 2. Chart showing the level of awareness of existing support systems for low-cost green materials
Question 14 – Which of the following factors do you consider being important for deciding the choice of low-cost green building materials/components? (Please select all that apply)
Figure3. Graph showing the relative importance of various groups of material-selection factors/variables

267
Discussion of Results The analyses of the study revealed that over half of the respondents agreed to have used LCGBMCs in their designs (see fig. 1). These showed that the majority of the respondents are fairly knowledgeable about the topic, and so were able to offer some insightful views. In respect of existing tools, the Green Guide to Specification from BREAAM was the most commonly used reference source. This result was not surprising, knowing that the Green Guide is the standard assessment method and information source particularly designed to address issues specific to the UK. It was however, noticeable when analysing the results that some respondents displayed skepticism regarding the usefulness and reliability of existing DSS, in terms of their impacts on LCGBMCs. One respondent stated, “Greenspec Guide is too limited with its product range, and not comprehensive enough or designed to determine the impact assessment of such materials”. In another question, a list of possible categories of sustainable principle indicators/ decision factors derived from the reviewed literature provided respondents the chance to rank each group in terms of their degree of importance as applicable to their views. The result showed that even though a large number of factors influence material choice in construction, environmental factors remain the overarching priority in developed regions. In summary, none of the respondents made any comment that could imply they believed existing tools could be adopted, which further suggests that potential developers may have to consider a more localized system that can address the priorities of their respective markets. The aim to make the evaluation and selection process more systematic, formed the basis of their recommendations. With only 50 responses, it was difficult to make any generalisations based on the results, which suggested that further studies be undertaken to fulfill the research aim and objectives.

268
Appendix D: Survey Questionnaire
School of Architecture and the Built Environment,
University of Westminster, London, UK.
NW1 5LS Email: [email protected]
Contact Phone Number: +44 (0) 208 7900 5000 ext. 3271
Dear ( Participant's name ),
Research on the Impacts of Low-Cost Green Building Materials on Sustainable Low-Impact Green Energy Housing
The University of Westminster, in conjunction with The Rivers State Sustainable Development Agency (RSSDA) are undertaking a research aimed at investigating “The impacts of LOW-COST GREEN MATERIALS on LOW-IMPACT GREEN HOUSING”.
This study aims to; “Develop a Material-Selection Decision Support System (MSDSS), from which data/information appropriate to users’ needs can be generated. The research goal is an attempt to ensure greater use of LCGBMCs-materials normally considered as agricultural, post-consumer, or post-industrial waste in mainstream housing. Such materials include; compressed earth blocks, earth or sand bags, bamboo, bales of hay, scrap metals, old blocks, tyres, jean insulation and recycled steel. To achieve this aim, this questionnaire is a survey to ask your views as a key stakeholder and/or an experienced building practitioner concerning the most essential factors or variables that influence the choice of materials at the design stage. You or your organization’s participation is totally voluntary. You are guaranteed that responses in this survey will not be identified with you or your organisation, but shall be reported only in the overall analysis of this research.
Instruction: Please kindly indicate by ticking on the appropriate answer(s) or filling in the spaces provided in the questionnaire. Some of the questions require a simple YES/NO answer; some require RANKING/RATING and others are OPEN questions aimed at getting your views and suggestions. Kindly fill out these questions. It will only take a couple of minutes to complete this survey Thank You!
CONSENT LETTER
School of Architecture and the Built Environment,
University of Westminster, London, UK.
NW1 5LS Email: [email protected]
Contact Phone Number: +44 (0) 208 7900 5000 ext. 3271 Dear (Sir/Madam),
RE: CONSENT TO TAKE PART IN A SURVEY OF FACTORS INFLUENCING MATERIAL-SELECTION IN THE DESIGN OF LOW-COST GREEN HOUSING
You are being invited as an expert in the building and construction industry, to take part in the survey of an on-going research titled: “MATERIAL SELECTION IN THE DESIGN OF LOW-COST GREEN HOUSING”. Please take time to read the following information carefully and indicate whether or not you or your organisation wish to take part in the survey we are about to undertake, by ticking in the appropriate boxes below, or sending a return-email confirming your interest.
RESEARCH RATIONALE: Over half the world’s population living is now living in cities, and the reality of the population growth and mass urbanization is a dramatic shortfall in the amount and quality of available housing, particularly in many developing countries (UN, 2009; World Bank, 2010). Housing operations however, are estimated to be responsible for 25-40% of energy consumption (IEA, 2008). It is not merely a coincidence that there is a direct correlation between this energy consumption and climate change: as the International Energy Agency (2008) indicates that 40% of global carbon dioxide (CO2) emissions come from the built environment, while building materials account for approximately 15-25% of the energy used in residential buildings alone- including energy spent in manufacturing and transporting materials to site; energy consumption during building construction; and energy used for maintenance during the life span of the building (DCLG, 2007a). With constant dependence on highly polluting, cost and energy intensive imported materials, coupled with the additional strains on an already acute imbalance of the payments situation, their supply seems to have fallen far short of demand and production quality. As a way of making significant contribution towards minimizing CO2 emissions, while at the same time improving the quality of greatly needed housing stock-particularly in the developing countries, the pressure on the demand for low-cost green materials (i.e., materials, in this case locally-sourced and recycled building materials, with low cost, health, and environmental impacts across their life cycle, when compared to competing products that serve the same purpose) has significantly increased; as they possess the greatest features that can help to mitigate climate change with their lowest cost and energy requirements (Shuman, 2008; UN, 2009). Information relating to the impacts of these materials however, appear to be less available (Seyfang, 2009a; Jones, 2009), as yet, evidence indicates that a small proportion of building practitioners seem to have little knowledge of best practices relating to their performance attributes (Malanca, 2010). Given the emphasis on the ways in which decision making impact the material-selection process and invariably, the life cycle performance of the building, there is a real question as to the extent to which the understanding of the basic principles and best practices relevant to the attributes and capabilities of a range of low-cost green material options can enhance their optimization and selection process at the design stage, in order to encourage their wider scale use in the housing industry, thereby improve the process of delivering low cost green housing. As part of an effort to encourage the efficient and wider scale use of low-cost green materials in mainstream practice- for the benefits of housing the teeming population, The School of Architecture and The Built Environment (SABE) of the University of Westminster in conjunction with The Rivers State Sustainable Development Agency (RSSDA) are carrying out a research aimed at investigating “The use of LOW-COST GREEN MATERIALS (mainly, locally-sourced and recycled building materials or products) in the design of LOW-COST GREEN HOUSING”, with the aim to;
“Develop a MATERIAL-SELECTION TOOLKIT, from which data/information appropriate to users’ needs (including architects, designers, material specifiers-amongst others) can be extracted and analyzed, to generate information that can be used to support and assess their decision-making process in the selection of LOW-COST GREEN MATERIALS, at the design stage”. It seeks to create a system which will be compatible as possible with potential users, thus, exploiting the emerging potentials: new and different ideas relating to best practices of such materials, which are rarely used for buildings today such as; compressed earth blocks, earth or sand bags, bamboo, bales of hay, as well as scrap metals, old blocks, tyres, and recycled steel, normally considered as agricultural, post-consumer, or post-industrial waste.
KEY OBJECTIVE OF THE FIELD STUDY To achieve the research aim, the proposed survey is to ask your views as a key stakeholder and/or experienced building practitioner concerning the most essential factors or variables that influence material-selection at the design stage, and to know if you wish to participate in the field study we are about to undertake. Therefore, it includes designers, architects, builders, developers, engineers, manufacturers, material specifiers, clients, green proponents or advocates, students, NGOs, policy makers and etcetera.

269
The Research Centre-University of Westminster- UK: A Survey on Low-Cost Green Building Materials
A: GENERAL BACKGROUND The following questions are about your general knowledge on low-cost green building materials and low-impact green energy housing Question 1 How do you best describe your self? � An Architect � A Builder � An Engineer � A Quantity Surveyor � An Urban Designer � Other: ______________________________________ Question 2 Approximately, how many Low-Impact Green Energy Housing project(s) have you taken part in? � 0 (Not Experienced at all) � Less than 5 (Less Experienced) � 6-10 (Fairly Experienced) � 11-15 (Experienced-Some Experience) � More than 15 (Highly Experienced) � Other: ______________________________________ Question 3 What aspect of Low-Impact Green Energy Housing production do you play an active role? � Design � Construction � Materials Specification/Costing � All aspects � Other: ______________________________________ � N/A Question 4 As a practising professional in the housing industry, at what stage of building production do you consider the use of Low-Cost Green Building Materials? � Tendering/Planning/Decision-making � Design Development � Final Design � Construction � Operation � Maintenance � Other: ______________________________________ � N/A Comments-Please give reasons for your answer if any: ______________________________________

270
Question 5 How much (on a scale of 1-5) do you agree or disagree with the following factors, as obstacles that discourage you from using low-cost green materials in your housing projects? (where 1 = strongly disagree & 5 = strongly agree) Strongly
Agree Strongly
Disagree
Limited availability of materials in the market � � � � �
Maintenance concern � � � � �
Lack of familiarity with their construction techniques � � � � � Lack of access to current and relevant information
� � � � �
Building code restriction � � � � � Perception that local materials are of low status � � � � �
Aesthetically less pleasing � � � � �
Unwillingness to change from conventional materials � � � � �
Clients’ preference � � � � � Limited availability & reliability of suppliers � � � � �
Low flexibility for alternatives or substitutes � � � � � Uncertainty in the reliability of the project outcome � � � � � Nature of the design or building project � � � � �
Contractual agreement � � � � �
Comments: Please tell us what you think: ______________________________________
B:YOUR VIEWS ON EXISTING SYSTEMS FOR SELECTING LOW-COST GREEN MATERIALS The following questions are about your general knowledge on existing green building assessment support systems that aid the informed selection on low-cost green building materials Question 6 Are you aware of any existing or specific support system(s) available for building professionals that can aid informed decision-trade-offs at the design stage, when selecting low-cost green building materials & components for low-impact green energy housing projects? � Yes � No � Other: _________________________________________________________________________ � N/A Comments-Please tell us what you think: __________________________________________________ If ‘YES' to question 6 above, please answer to questions 7-10; if ‘NO' to question 6 tick n/a all through and go over to question 11 Question 7 Please kindly identify the name of the support system available for building professionals, if your response was “Yes” to question 6 ___________________________________________________________________________________ � N/A

271
Question 8 For which particular building professional group, is the support system you have identified in question 7 designed for? � Architects and Designers � Builders � Engineers � Quantity Surveyors � Urban Designers � Other: ______________________________________ � N/A Comments-Please tell us what you think: ______________________________________ Question 9 How effective is the support system you have identified in question 7? � Highly Effective � Effective � Somewhat Effective � Rarely Effective � Not Effective At All � N/A Question 10 Please kindly give reasons for your answer to question 9 ___________________________________________________________________________________ � N/A
C. YOUR VIEWS ON FACTORS THAT INFLUENCE MATERIAL-SELECTION The following questions are about your general knowledge on factors that influence the informed selection on low-cost green building materials and components Question 11 How often do you consider the most essential factors/variables when selecting Low-Cost Green Construction Materials for your design or housing projects? � I very often do consider all the essential factors when selecting materials � I often or occasionally do, but not very often do I consider all the factors, as previous experience from past projects tend to determine my choice of materials. � I less often do, although my method of selection still relies on subjective individual perceptions of values and priorities. � I rarely do, as considering the essential factors in my choice of materials may delay me from meeting set targets, knowing the increasingly stringent requirements of the design. � I never do, as my choice of materials depends on clients’ preferences � None of the above applies to my case � Other: _________________________________________________________________________ Comments-Please tell us what you think: _________________________________________________

272
Question 12 In the order of priorities, please rank the importance of each of the following groups of factors on a scale of 1 to 10, (where 1= Least Important & 10 = Most Important). 1 2 3 4 5 6 7 8 9 10 General/Site factors/variables (i.e., relating to site conditions)
Score � � � � � � � � � �
Importance � � � � � � � � � � Environmental & Health factors/variables (relating to the well-being of the occupants and surrounding environment)
Score � � � � � � � � � �
Importance � � � � � � � � � � Economic factors/variables (relating to cost and expenses)
Score � � � � � � � � � �
Importance � � � � � � � � � � Socio-Cultural factors/variables (i.e., relating to the associated customs, knowledge, lifestyle and geographical characteristics of a region)
Score � � � � � � � � � �
Importance � � � � � � � � � � Technical factors/variables (relating to the performance attributes, conditions or functional requirements of the material)
Score � � � � � � � � � �
Importance � � � � � � � � � � Sensorial factors/variables (i.e., relating to human senses/emotions such as touch, feel, and smell)
Score � � � � � � � � � �
Importance � � � � � � � � � �
Comments- Please kindly specify if “others’’ and tell us what you think generally: __________________________________________________________________________________
Please rate the importance of each of the following sub-factors on a scale of 1 to 5, (where 1 is Not Important at All, and 5 is Extremely Important)?
GENERAL AND SITE FACTORS/VARIABLES Question 13 How important are the following SITE FACTORS in your choice of materials? Extremely
Important Not
Important GS1:Geographic Location of Building Site � � � � � GS2: Material Availability � � � � � GS3: Distance to Market/Material Production Site � � � � � GS4: Building Regulation and Certification for Use � � � � � GS5:Design Criteria and Concept � � � � � GS6:The Type(s) of Natural Disasters Common to the Site � � � � � GS7: The Type of Building Material(s) � � � � � GS8: Project Site Geometry/Setting/Condition � � � � � GS9: Knowledge Base in Construction � � � � � GS10: Building and Space Usage � � � � � GS11: Building Orientation and Spatial Structure � � � � � GS12: Spatial Scale:Building Size and Mass � � � � �
Comments-Please list other important factors that ought to have been considered: ___________________________________________________________________________________

273
ENVIRONMENTAL AND HEALTH FACTORS/VARIABLES Question 14 How important are the following ENVIRONMENTAL/HEALTH FACTORS in your choice of materials? Extremely
Important Not
Important
EH1: Environmental Statutory Compliance � � � � � EH2: Level of Carbon Emissions/Toxicity � � � � �
EH3: Safety and Health of End-users � � � � � EH4: Habitat Disruption:Ozone Depletion Potential � � � � �
EH5: The Amount of Pesticide Treatment Required � � � � �
EH6: The Climatic Condition of the Region � � � � � EH7: Material Environmental Impact � � � � �
Comments-Please list other important factors that ought to have been considered: ______________
COST OR ECONOMIC FACTORS/VARIABLES Question 15 How important are the following COST/ECONOMIC FACTORS in your choice of materials? Extremely
Important Not
Important C1:Life Cycle Cost:Overall Cost Used During the Building Life Span (i.e., Investment, Operation, Maintenance, Demolition and disposal Cost)
� � � � �
C2:Material Embodied Energy:Cost of Energy Spent in Manufacturing and Transporting Materials to Site
� � � � �
C3: Economic Status of the Client: The Client’s Financial Budget
� � � � �
C4: Affordability Cost of the Material(s) � � � � � C5: Labour Cost for Installing Material(s) � � � � �
Comments-Please list other important factors that ought to have been considered: __________________
SOCIO-CULTURAL FACTORS/VARIABLES Question 16 How important are the following SOCIO-CULTURAL FACTOR in your choice of materials? Extremely
Important Not
Important
SC1: Material Compatibility with Cultural Traditions � � � � �
SC2: Material Compatibility with Regional Settings � � � � � SC3: Cultural Restriction(s) on Usury � � � � � SC4: Family Structure: Type & Size of Family Unit � � � � � SC5: Client’s Preference of Material Type � � � � �
SC6:Local Knowledge of the Custom & Lifestyle � � � � �
Comments-Please list other important factors that ought to have been considered: __________________

274
TECHNICAL FACTORS/VARIABLES
Question 17 How important are the following TECHNICAL FACTORS in your choice of materials? Extremely
Important Not
Important
T1: Recyclability and Reusability: Potential to Use Material After it’s Useful Life
� � � � �
T2: De-mountability: Ease to Remove and Reaffix Materials � � � � � T3: Level of Maintenance Requirement � � � � �
T4: Ability to Accommodate Movement/Vibration : Materials Ability to Tolerate Expansion and Contraction
� � � � �
T5: Availability of the Technical Skills � � � � � T6: Material Fixing: Ease and speed of Method fixing � � � � �
T 7 : Resistance to Fire � � � � � T 8 : Resistance to Heat � � � � �
T 9 : Resistance to Water/Moisture � � � � � T10: Resistance to Scratch � � � � �
T11: Resistance to Weather � � � � � T12: Resistance to Chemicals � � � � �
T13: Resistance to Decay � � � � � T14: Weight and Mass of the Material � � � � �
T15: Life to Replacement: Durability & Strength � � � � �
Comments-Please list other important factors that ought to have been considered: ________________________
SENSORIAL FACTOR/VARIABLE
Question 18 How important are the following SENSORIAL FACTORS in your choice of materials? Extremely
Important Not
Important
SN1: Aesthetics, Appearance Or Visual Density � � � � �
SN2: Texture of the Material � � � � �
SN3: Colour of the Material � � � � �
SN4: Temperature and Thermal Capacity � � � � �
SN5: Acoustic Property of the Material � � � � �
SN6: Odour and Level of off Gassing � � � � �
SN7: Thinness and Thickness � � � � �
SN8: Glossiness or Roughness of Material � � � � �
SN9: Fineness Quality of the Material � � � � �
SN10: Lighting Effect of the Material � � � � �
Comments-Please list other important factors that ought to have been considered: ___________________

275
D. GENERAL COMMENTS ON LOW-COST GREEN MATERIALS AND HOUSING The following questions are about your general knowledge on low-cost green materials, housing, and the proposed support system
Question 19 Most building practitioners have sought to explain the relatively low use of LCGBMCs by pointing out perceived obstacles. Please indicate on a scale of 1-10 (where 1 = Least Relevant & 10= Most Relevant), how relevant each of the following would be, in facilitating the wider-scale use of such materials in the housing industry?
1 2 3 4 5 6 7 8 9 10 Provision of readily available information specific to the informed selection of low-cost green materials- that can assist decision makers to know whether or not a material is sustainable.
Score � � � � � � � � � �
Relevance � � � � � � � � � � Subsidising low-cost green building materials and components
Score � � � � � � � � � �
Relevance � � � � � � � � � � Using highly mechanized and capital-intensive production facilities
Score � � � � � � � � � �
Relevance � � � � � � � � � � Stringent building regulation (standard specifications, codes & ordinances) for use of Materials
Score � � � � � � � � � �
Relevance � � � � � � � � � � Setting up workshops to spread awareness to building professionals & clients of their potential economic, environmental and health benefits
Score � � � � � � � � � �
Relevance � � � � � � � � � � Strong mainstreaming initiatives, and effective implementation of policies that encourage their wider scale use
Score � � � � � � � � � �
Relevance � � � � � � � � � � Stringent measures and penalties for corruption in the construction industries
Score � � � � � � � � � �
Relevance � � � � � � � � � � Diversification and decentralization of production technologies
Score � � � � � � � � � �
Relevance � � � � � � � � � � Import restriction of imported or foreign materials
Score � � � � � � � � � �
Relevance � � � � � � � � � � Government’s adequate funding of research to boost production and wide-scale use
Score � � � � � � � � � �
Relevance � � � � � � � � � �
Comments: Please tell us what you think: ___________________________________________________________

276
Question 20 Please rate the following conditions on a scale of 1-5 as they will likely affect your decision to use the proposed Material Selection Decision Support System. (1= least likely & 5 = most likely)
Most Likely Least Likely Provided the proposed support system will lead me to making more informed choices
� � � � �
Provided the system will aid minimal uncertainties and errors during the evaluation and selection process
� � � � �
Provided the system will ensure more sustainable consideration of a larger number of materials alternatives
� � � � �
Provided the system will quicken the selection process, and NOT necessarily replace my professional judgment(s)
� � � � �
Provided the information in the system databases are as adequate as not to lead me to source for information elsewhere
� � � � �
Provided the system is simple, clear and easy to understand and use with little or no practical difficulties
� � � � �
Provided the system can be adjusted to suit the priorities, context, and needs of different regions
� � � � �
Provided the system will encourage greater industry acceptance of low-cost green building materials and components
� � � � �
Provided the proposed system is amenable to create room for improvement and modifications
� � � � �
Provided the system will keep up-to-date on new information
� � � � �
Provided the system meets all the above conditions � � � � �
Comments- Please specify if “others’’ and tell us what you think generally: _____________________
Thank you for helping out with this study!

277
Appendix E: Interview Questionnaire
Introduction-This interview is to investigate the views of building professionals who are strongly identified with use of low-cost green building materials in Nigeria.
Aim- This research is aimed at developing a MCDM (Multi-Criteria Decision Support Model) that will facilitate the progress of design decision-making in the selection of low-cost green building materials and components.
Purpose- The purpose of the prototype model is to enable designers analyse and understand the impacts of the materials at the design stage before they are used for construction. By evaluating multiple alternatives simultaneously designers are able to make informed decisions.
Section A: General Information 1. How do you best describe your self?
An Architect
A Builder
An Engineer
A Quantity Surveyor
An Urban Designer
Other:
2. How much of experience would you say you possess in terms of Low Impact Green Housing (LIGHD) design or projects? a. Do you have any experience of Low Cost Green Housing (LCGHs) design using low-cost green materials? b. If Yes, how many years?
3. Which stage of the design process would you say needs more focus in terms of decision support for the selection of LCGBMCs in housing design projects?
Preparation Stage
Concept Design Stage
Design Development
Technical Design Stage
All Design Stages

278
Section B: Barriers and Measures 4. What do you think are the barriers to low-impact green housing design and delivery in Nigeria? a. (Interviewees to list the barriers) b. Some Common Barriers 5. What do you think would be the barriers that hinder greater use of low-cost green building materials in the housing industry? a. (Interviewees to list the barriers) b. Some Common Barriers 6. What do you think would be justifiable measures needed to promote greater use of LCGBM in mainstream housing? a. (Architects to list the barriers) b. Some Common Barriers 7. What decision support tools do you think designers would need for Low Impact Green Housing Design? (What have you been using for your design of LIGHDs?) a. Design and building professionals to List the known Support /Tools b. Some Proposed Support /Tools c. What type of tools do you use at the moment for your design of LCGHs? Section C: Design Information Requirements 8. What features of the DSS model would you say are essential to be included in the decision making process? 9. What type of information in the form of material selection information requirements should be incorporated in the Decision Support System (DSS) model? a. What type / categories of material and component information should be included in the DSS? 10. How would you want the information on material and components to be presented?
Please provide further matters of importance that ought to have been considered in the development of the tool and suggest areas that need further improvement.

279
Appendix F: Results of Factor Analysis for Sub-Categories of Material Selection Factors
Correlation Matrix for General/Site (GS) Factors Using “Varimax/Orthogonal” Rotation
GS1 GS2 GS3 GS4 GS5 GS6 GS7 GS8 GS9 GS10 GS1
1 GS12
Correlation
GS1 1.000 .622 .244 .292 .295 .372 .310 .409 .397 .372 .289 .321
GS2 .622 1.000 .446 .486 .449 .497 .537 .464 .487 .465 .282 .389
GS3 .244 .446 1.000 .523 .436 .325 .310 .399 .346 .299 .286 .312
GS4 .292 .486 .523 1.000 .714 .559 .559 .494 .488 .393 .435 .458
GS5 .295 .449 .436 .714 1.000 .578 .621 .608 .659 .420 .566 .527
GS6 .372 .497 .325 .559 .578 1.000 .641 .531 .586 .480 .529 .561
GS7 .310 .537 .310 .559 .621 .641 1.000 .549 .615 .581 .434 .529
GS8 .409 .464 .399 .494 .608 .531 .549 1.000 .579 .443 .605 .577
GS9 .397 .487 .346 .488 .659 .586 .615 .579 1.000 .604 .526 .535 GS10 .372 .465 .299 .393 .420 .480 .581 .443 .604 1.000 .501 .470
GS11 .289 .282 .286 .435 .566 .529 .434 .605 .526 .501 1.00
0 .786
GS12 .321 .389 .312 .458 .527 .561 .529 .577 .535 .470 .786 1.000
KMO and Bartlett's Test
Kaiser-Meyer-Olkin Measure of Sampling Adequacy. .883
Bartlett's Test of Sphericity
Approx. Chi-Square 1468.871 df 66
Sig. .000
Component Transformation Matrix Component 1 2 1 .812 .583 2 -.583 .812 Extraction Method: Principal Component Analysis. Rotation Method: Varimax with Kaiser Normalization.

280
Total Variance Explained
Component Initial Eigenvalues Extraction Sums of Squared Loadings
Rotation Sums of Squared Loadings
Total Variance %
Cumulative %
Total Variance %
Cumulative %
Total % of Variance
Cumulative %
1 6.308 52.571 52.571 6.308 52.571 52.571 4.543 37.857 37.857
2 1.114 9.284 61.854 1.114 9.284 61.854 2.880 23.997 61.854
3 .957 7.974 69.829
4 .753 6.274 76.103
5 .601 5.005 81.108
6 .492 4.104 85.212
7 .420 3.500 88.713
8 .378 3.147 91.860
9 .338 2.819 94.679 10 .259 2.159 96.838
11 .224 1.869 98.707
12 .155 1.293 100.000

281
Component Matrixa
Component
1 2
Design Concept .805
Knowledge Base in Construction .796
The Type of Building Material(s) .783 The Type(s) of Natural Disasters Common to the Site .777
Project Site Geometry/Setting/Condition .773 Spatial Scale: Building Size and Mass .754 -.381
Building Regulation and Certification for Use .741
Building Orientation .728 -.482 Building and Space Usage .695
Material Availability .694 .562 Distance .548 Geographic Location of Building Site .546 .545 Extraction Method: Principal Component Analysis. a. 2 components extracted.
Rotated Component Matrixa Component
1 2 Building Orientation .873 Spatial Scale: Building Size and Mass .835 Design Concept .724 .372 Project Site Geometry/Setting/Condition .686 .371 Knowledge Base in Construction .675 .426 The Type(s) of Natural Disasters Common to the Site .666 .405
The Type of Building Material(s) .644 .446 Building Regulation and Certification for Use .562 .489
Building and Space Usage .562 .410 Material Availability .861 Geographic Location of Building Site .761 Distance .561 Extraction Method: Principal Component Analysis. Rotation Method: Varimax with Kaiser Normalization. a. Rotation converged in 3 iterations.

282
Reproduced Correlations
GS1 GS2 GS3 GS4 GS5 GS6 GS7 GS8 GS9 GS10 GS11 GS12
Reproduced Correlation
GS1 .595a .685 .461 .442 .374 .392 .420 .368 .408 .382 .135 .203
GS2 .685 .797a .547 .553 .491 .506 .536 .481 .525 .485 .234 .308
GS3 .461 .547 .389a .427 .406 .409 .426 .395 .422 .383 .256 .300
GS4 .442 .553 .427 .554a .588 .572 .580 .567 .587 .516 .507 .532
GS5 .374 .491 .406 .588 .662a .633 .632 .634 .647 .559 .644 .652
GS6 .392 .506 .409 .572 .633 .608a .609 .607 .622 .540 .595 .608
GS7 .420 .536 .426 .580 .632 .609 .613a .607 .624 .544 .576 .595
GS8 .368 .481 .395 .567 .634 .607 .607 .608a .621 .537 .611 .621
GS9 .408 .525 .422 .587 .647 .622 .624 .621 .636a .553 .603 .618
GS10 .382 .485 .383 .516 .559 .540 .544 .537 .553 .483a .504 .522 GS11 .135 .234 .256 .507 .644 .595 .576 .611 .603 .504 .763a .733 GS12 .203 .308 .300 .532 .652 .608 .595 .621 .618 .522 .733 .714a
Residualb
GS1 -.062
-.217
-.150
-.079
-.020
-.110 .041 -
.011 -.010 .155 .118
GS2 -.062
-.101
-.067
-.042
-.009 .001 -
.017 -
.038 -.020 .048 .081
GS3 -.217
-.101
.096 .030 -.084
-.116 .004 -
.077 -.084 .029 .012
GS4 -.150
-.067 .096 .125 -
.013 -
.021 -
.073 -
.099 -.123 -.072 -.074
GS5 -.079
-.042 .030 .125 -
.054 -
.011 -
.027 .012 -.139 -.078 -.125
GS6 -.020
-.009
-.084
-.013
-.054
.032 -.076
-.036 -.060 -.066 -.048
GS7 -.110 .001 -
.116 -
.021 -
.011 .032 -.058
-.009 .036 -.143 -.066
GS8 .041 -.017 .004 -
.073 -
.027 -
.076 -
.058 -
.042 -.094 -.006 -.044
GS9 -.011
-.038
-.077
-.099 .012 -
.036 -
.009 -
.042 .051 -.077 -.084
GS10 -.010
-.020
-.084
-.123
-.139
-.060 .036 -
.094 .051 -.003 -.052
GS11 .155 .048 .029 -.072
-.078
-.066
-.143
-.006
-.077 -.003 .053
GS12 .118 .081 .012 -.074
-.125
-.048
-.066
-.044
-.084 -.052 .053
Extraction Method: Principal Component Analysis. a. Reproduced communalities b. Residuals are computed between observed and reproduced correlations. There are 37 (56.0%) non-redundant residuals with absolute values greater than 0.05.
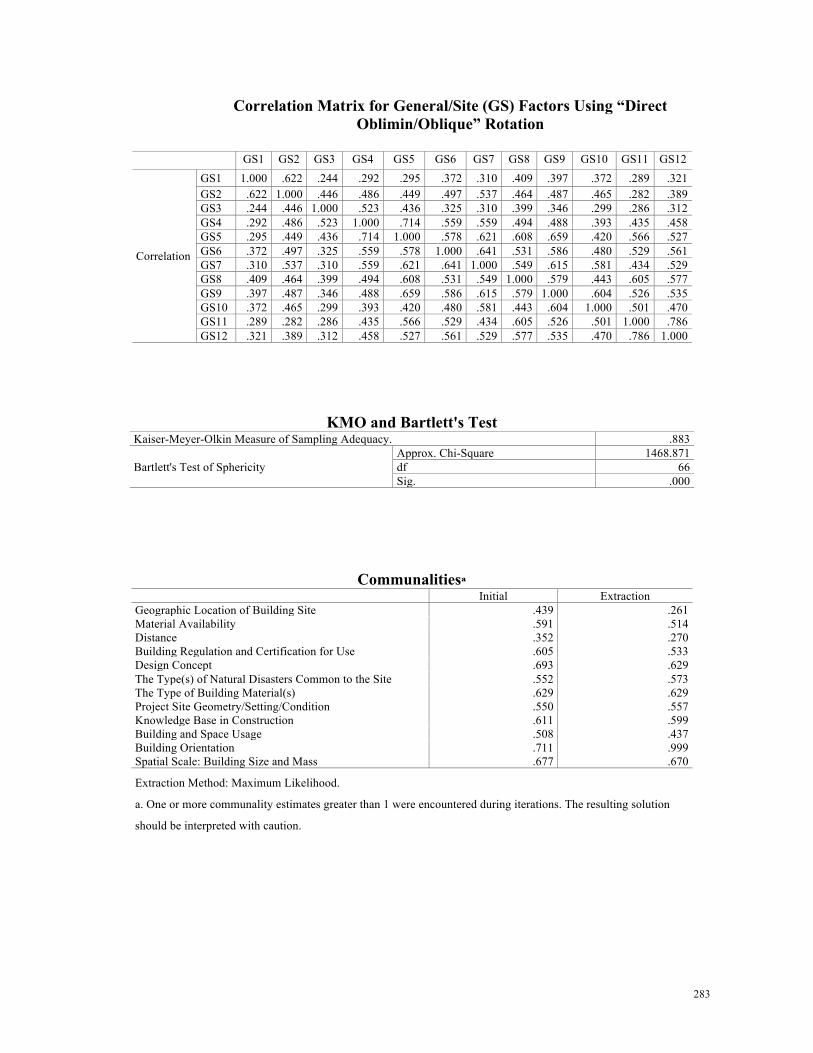
283
Correlation Matrix for General/Site (GS) Factors Using “Direct Oblimin/Oblique” Rotation
GS1 GS2 GS3 GS4 GS5 GS6 GS7 GS8 GS9 GS10 GS11 GS12
Correlation
GS1 1.000 .622 .244 .292 .295 .372 .310 .409 .397 .372 .289 .321 GS2 .622 1.000 .446 .486 .449 .497 .537 .464 .487 .465 .282 .389 GS3 .244 .446 1.000 .523 .436 .325 .310 .399 .346 .299 .286 .312 GS4 .292 .486 .523 1.000 .714 .559 .559 .494 .488 .393 .435 .458 GS5 .295 .449 .436 .714 1.000 .578 .621 .608 .659 .420 .566 .527 GS6 .372 .497 .325 .559 .578 1.000 .641 .531 .586 .480 .529 .561 GS7 .310 .537 .310 .559 .621 .641 1.000 .549 .615 .581 .434 .529 GS8 .409 .464 .399 .494 .608 .531 .549 1.000 .579 .443 .605 .577 GS9 .397 .487 .346 .488 .659 .586 .615 .579 1.000 .604 .526 .535 GS10 .372 .465 .299 .393 .420 .480 .581 .443 .604 1.000 .501 .470 GS11 .289 .282 .286 .435 .566 .529 .434 .605 .526 .501 1.000 .786 GS12 .321 .389 .312 .458 .527 .561 .529 .577 .535 .470 .786 1.000
KMO and Bartlett's Test Kaiser-Meyer-Olkin Measure of Sampling Adequacy. .883
Bartlett's Test of Sphericity Approx. Chi-Square 1468.871 df 66 Sig. .000
Communalitiesa Initial Extraction Geographic Location of Building Site .439 .261 Material Availability .591 .514 Distance .352 .270 Building Regulation and Certification for Use .605 .533 Design Concept .693 .629 The Type(s) of Natural Disasters Common to the Site .552 .573 The Type of Building Material(s) .629 .629 Project Site Geometry/Setting/Condition .550 .557 Knowledge Base in Construction .611 .599 Building and Space Usage .508 .437 Building Orientation .711 .999 Spatial Scale: Building Size and Mass .677 .670
Extraction Method: Maximum Likelihood.
a. One or more communality estimates greater than 1 were encountered during iterations. The resulting solution
should be interpreted with caution.

284
Total Variance Explained
Factor Initial Eigenvalues Extraction Sums of Squared Loadings Rotation Sums of Squared Loadingsa
Total % of Variance
Cumulative %
Total % of Variance
Cumulative %
Total
1 6.308 52.571 52.571 3.766 31.379 31.379 3.716
2 1.114 9.284 61.854 2.904 24.203 55.582 5.602
3 .957 7.974 69.829
4 .753 6.274 76.103
5 .601 5.005 81.108
6 .492 4.104 85.212
7 .420 3.500 88.713
8 .378 3.147 91.860
9 .338 2.819 94.679
10 .259 2.159 96.838 11 .224 1.869 98.707 12 .155 1.293 100.000 Extraction Method: Maximum Likelihood. a. When factors are correlated, sums of squared loadings cannot be added to obtain a total variance.
Factor Matrixa Factor
1 2 Building Orientation .999 -.006 Spatial Scale: Building Size and Mass .788 .222 Project Site Geometry/Setting/Condition .608 .433 Design Concept .570 .551 Building and Space Usage .504 .428 The Type of Building Material(s) .438 .662 Material Availability .286 .657 Building Regulation and Certification for Use .438 .584 Knowledge Base in Construction .529 .565 The Type(s) of Natural Disasters Common to the Site .532 .538 Distance .288 .432 Geographic Location of Building Site .292 .419 Extraction Method: Maximum Likelihood. a. 2 factors extracted. 6 iterations required.

285
Goodness-of-fit Test
Chi-Square df Sig. 183.634 43 .000

286
Reproduced Correlations
GS1 GS2 GS3 GS4 GS5 GS6 GS7 GS8 GS9 GS10 GS11 GS12
Reproduced Correlation
GS1 .261a .359 .265 .373 .397 .381 .405 .359 .391 .326 .289 .323 GS2 .359 .514a .366 .509 .525 .506 .560 .459 .523 .425 .282 .371 GS3 .265 .366 .270a .378 .402 .386 .412 .362 .396 .330 .286 .323 GS4 .373 .509 .378 .533a .572 .547 .578 .519 .562 .471 .435 .475 GS5 .397 .525 .402 .572 .629a .600 .614 .585 .613 .523 .566 .571 GS6 .381 .506 .386 .547 .600 .573a .589 .557 .585 .498 .529 .538 GS7 .405 .560 .412 .578 .614 .589 .629a .553 .605 .504 .434 .492 GS8 .359 .459 .362 .519 .585 .557 .553 .557a .566 .492 .605 .575 GS9 .391 .523 .396 .562 .613 .585 .605 .566 .599a .508 .526 .542 GS10 .326 .425 .330 .471 .523 .498 .504 .492 .508 .437a .501 .492 GS11 .289 .282 .286 .435 .566 .529 .434 .605 .526 .501 .999a .786 GS12 .323 .371 .323 .475 .571 .538 .492 .575 .542 .492 .786 .670a
Residualb
GS1 .263 -.021 -.080 -.103 -.009 -.095 .050 .006 .045 9.635E-005 -.002
GS2 .263 .080 -.023 -.077 -.009 -.023 .006 -.036 .040 1.646E-006 .018
GS3 -.021 .080 .144 .033 -.061 -.102 .037 -.050 -.031 4.138E-005 -.011
GS4 -.080 -.023 .144 .142 .012 -.020 -.026 -.073 -.077 2.034E-005 -.017
GS5 -.103 -.077 .033 .142 -.021 .007 .022 .046 -.103 6.279E-005 -.044
GS6 -.009 -.009 -.061 .012 -.021 .052 -.025 .000 -.018 -9.272E-006 .022
GS7 -.095 -.023 -.102 -.020 .007 .052 -.004 .010 .077 .000 .037
GS8 .050 .006 .037 -.026 .022 -.025 -.004 .012 -.048 1.287E-005 .001
GS9 .006 -.036 -.050 -.073 .046 .000 .010 .012 .096 -5.952E-005 -.008
GS10 .045 .040 -.031 -.077 -.103 -.018 .077 -.048 .096 .000 -.021
GS11 9.635
E-005
1.646E-
006
4.138E-
005
2.034E-
005
6.279E-
005
-9.272
E-006
.000 1.287
E-005
-5.952
E-005
.000
3.268E-005
GS12 -.002 .018 -.011 -.017 -.044 .022 .037 .001 -.008 -.021 3.268E-005
Extraction Method: Maximum Likelihood. a. Reproduced communalities b. Residuals are computed between observed and reproduced correlations. There are 17 (25.0%) non-redundant residuals with absolute values greater than 0.05.

287
Pattern Matrixa Factor
1 2 Building Orientation .997 Spatial Scale: Building Size and Mass .623 The Type of Building Material(s) .816 Material Availability .809 Building Regulation and Certification for Use .721 Knowledge Base in Construction .699 Design Concept .683 The Type(s) of Natural Disasters Common to the Site .666 Project Site Geometry/Setting/Condition .538 Distance .533 Building and Space Usage .530 Geographic Location of Building Site .518
Extraction Method: Maximum Likelihood. Rotation Method: Oblimin with Kaiser Normalization. a. Rotation converged in 6 iterations.
Factor Correlation Matrix Factor 1 2 1 1.000 .579 2 .579 1.000 Extraction Method: Maximum Likelihood. Rotation Method: Oblimin with Kaiser Normalization.
Goodness-of-fit Test Chi-Square df Sig.
165.133 14 .000
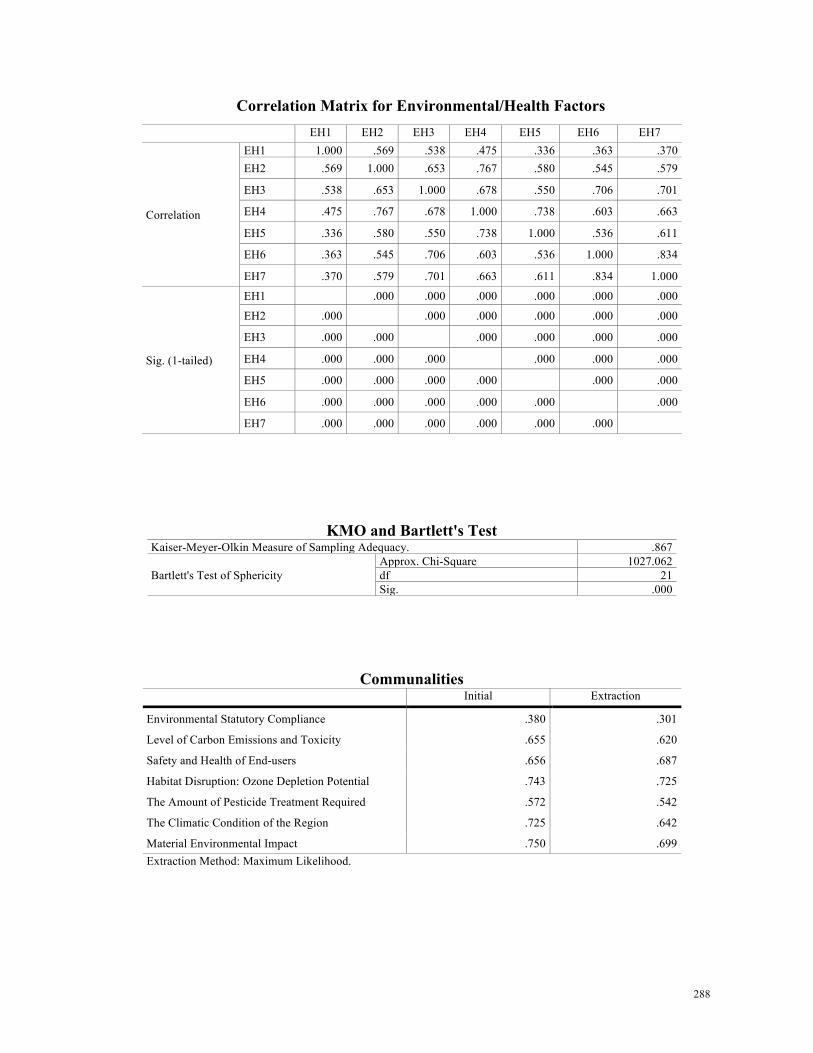
288
Correlation Matrix for Environmental/Health Factors EH1 EH2 EH3 EH4 EH5 EH6 EH7
Correlation
EH1 1.000 .569 .538 .475 .336 .363 .370 EH2 .569 1.000 .653 .767 .580 .545 .579
EH3 .538 .653 1.000 .678 .550 .706 .701
EH4 .475 .767 .678 1.000 .738 .603 .663
EH5 .336 .580 .550 .738 1.000 .536 .611
EH6 .363 .545 .706 .603 .536 1.000 .834
EH7 .370 .579 .701 .663 .611 .834 1.000
Sig. (1-tailed)
EH1 .000 .000 .000 .000 .000 .000
EH2 .000 .000 .000 .000 .000 .000
EH3 .000 .000 .000 .000 .000 .000
EH4 .000 .000 .000 .000 .000 .000
EH5 .000 .000 .000 .000 .000 .000
EH6 .000 .000 .000 .000 .000 .000
EH7 .000 .000 .000 .000 .000 .000
KMO and Bartlett's Test Kaiser-Meyer-Olkin Measure of Sampling Adequacy. .867
Bartlett's Test of Sphericity Approx. Chi-Square 1027.062 df 21 Sig. .000
Communalities Initial Extraction
Environmental Statutory Compliance .380 .301
Level of Carbon Emissions and Toxicity .655 .620
Safety and Health of End-users .656 .687
Habitat Disruption: Ozone Depletion Potential .743 .725
The Amount of Pesticide Treatment Required .572 .542
The Climatic Condition of the Region .725 .642
Material Environmental Impact .750 .699 Extraction Method: Maximum Likelihood.

289
Total Variance Explained Factor Initial Eigenvalues Extraction Sums of Squared Loadings
Total % of Variance Cumulative % Total % of Variance Cumulative %
1 4.582 65.458 65.458 4.215 60.217 60.217 2 .820 11.710 77.168 3 .630 8.995 86.163
4 .350 4.993 91.157
5 .278 3.970 95.126
6 .184 2.626 97.752
7 .157 2.248 100.000
Extraction Method: Maximum Likelihood.

290
Factor Matrixa Factor
1
Habitat Disruption: Ozone Depletion Potential .851
Material Environmental Impact .836
Safety and Health of End-users .829
The Climatic Condition of the Region .801
Level of Carbon Emissions and Toxicity .787
The Amount of Pesticide Treatment Required .736
Environmental Statutory Compliance .549 Extraction Method: Maximum Likelihood. a. 1 factors extracted. 4 iterations required.
Reproduced Correlations EH1 EH2 EH3 EH4 EH5 EH6 EH7
Reproduced Correlation
EH1 .301a .432 .455 .467 .404 .440 .459
EH2 .432 .620a .652 .670 .580 .631 .658
EH3 .455 .652 .687a .706 .610 .664 .693 EH4 .467 .670 .706 .725a .627 .682 .712 EH5 .404 .580 .610 .627 .542a .590 .615 EH6 .440 .631 .664 .682 .590 .642a .670 EH7 .459 .658 .693 .712 .615 .670 .699a
Residualb
EH1 .137 .083 .008 -.068 -.077 -.089 EH2 .137 .001 .097 .001 -.085 -.079 EH3 .083 .001 -.028 -.060 .042 .008 EH4 .008 .097 -.028 .111 -.079 -.048 EH5 -.068 .001 -.060 .111 -.054 -.005 EH6 -.077 -.085 .042 -.079 -.054 .165 EH7 -.089 -.079 .008 -.048 -.005 .165
Extraction Method: Maximum Likelihood. a. Reproduced communalities b. Residuals are computed between observed and reproduced correlations. There are 13 (61.0%) non-redundant residuals with absolute values greater than 0.05.

291
Correlation Matrix for Economic/Cost Factors C1 C2 C3 C4 C5
Correlation
C1 1.000 .629 .586 .647 .597 C2 .629 1.000 .381 .455 .523 C3 .586 .381 1.000 .763 .639 C4 .647 .455 .763 1.000 .817 C5 .597 .523 .639 .817 1.000
Sig. (1-tailed)
C1 .000 .000 .000 .000 C2 .000 .000 .000 .000 C3 .000 .000 .000 .000 C4 .000 .000 .000 .000 C5 .000 .000 .000 .000
KMO and Bartlett's Test Kaiser-Meyer-Olkin Measure of Sampling Adequacy. .794
Bartlett's Test of Sphericity Approx. Chi-Square 648.915 df 10 Sig. .000
Communalities Initial Extraction
Life Cycle Cost .575 .509
Material Embodied Energy Cost .440 .295
Capital Cost (Economic Status of the Client) .598 .628
Maintenance or Replacement Cost .778 .879
Labour or Installation Cost .697 .742
Extraction Method: Maximum Likelihood.

292
Total Variance Explained Factor Initial Eigenvalues Extraction Sums of Squared Loadings
Total % of Variance Cumulative % Total % of Variance Cumulative %
1 3.435 68.700 68.700 3.054 61.078 61.078 2 .733 14.664 83.364
3 .389 7.785 91.149
4 .296 5.920 97.070
5 .147 2.930 100.000
Extraction Method: Maximum Likelihood.

293
Factor Matrixa Factor
1 Maintenance or Replacement Cost .938 Labour or Installation Cost .861 Capital Cost (Economic Status of the Client) .793 Life Cycle Cost .714 Material Embodied Energy Cost .544 Extraction Method: Maximum Likelihood. a. 1 factors extracted. 5 iterations required.
Goodness-of-fit Test Chi-Square df Sig.
61.126 5 .000
Reproduced Correlations
C1 C2 C3 C4 C5
Reproduced Correlation
C1 .509a .388 .566 .669 .615
C2 .388 .295a .431 .510 .468
C3 .566 .431 .628a .743 .683
C4 .669 .510 .743 .879a .808
C5 .615 .468 .683 .808 .742a
Residualb
C1 .241 .021 -.022 -.017
C2 .241 -.050 -.055 .055
C3 .021 -.050 .020 -.044
C4 -.022 -.055 .020 .010
C5 -.017 .055 -.044 .010
Extraction Method: Maximum Likelihood.
a. Reproduced communalities
b. Residuals are computed between observed and reproduced correlations. There are 3 (30.0%) non-redundant
residuals with absolute values greater than 0.05.

294
Correlation Matrix for Socio-Cultural Factors
SC1 SC2 SC3 SC4 SC5 SC6
Correlation
SC1 1.000 .780 .675 .225 .369 .544 SC2 .780 1.000 .759 .286 .407 .632 SC3 .675 .759 1.000 .402 .457 .560 SC4 .225 .286 .402 1.000 .451 .360 SC5 .369 .407 .457 .451 1.000 .506 SC6 .544 .632 .560 .360 .506 1.000
Sig. (1-tailed)
SC1 .000 .000 .001 .000 .000
SC2 .000 .000 .000 .000 .000 SC3 .000 .000 .000 .000 .000 SC4 .001 .000 .000 .000 .000 SC5 .000 .000 .000 .000 .000 SC6 .000 .000 .000 .000 .000
KMO and Bartlett's Test Kaiser-Meyer-Olkin Measure of Sampling Adequacy. .831
Bartlett's Test of Sphericity Approx. Chi-Square 626.700 df 15 Sig. .000
Communalities Initial Extraction
Material Compatibility with Cultural Traditions .630 .682
Material Compatibility with Regional Settings .734 .834
Cultural Restriction(s) on Usury .638 .693
Family Structure: Type & Size of Family Unit .270 .143
Local Knowledge of the Custom & Lifestyle .360 .255
Material Compatibility with Cultural Traditions .486 .484
Extraction Method: Maximum Likelihood.

295
Total Variance Explained Factor Initial Eigenvalues Extraction Sums of Squared Loadings
Total % of Variance Cumulative % Total % of Variance Cumulative %
1 3.534 58.898 58.898 3.090 51.498 51.498 2 .985 16.421 75.320 3 .562 9.368 84.688
4 .436 7.266 91.954
5 .296 4.938 96.892
6 .186 3.108 100.000
Extraction Method: Maximum Likelihood.

296
Factor Matrixa Factor
1 Material Compatibility with Regional Settings .913 Cultural Restriction(s) on Usury .833 Material Compatibility with Cultural Traditions .826 Material Compatibility with Cultural Traditions .695 Local Knowledge of the Custom & Lifestyle .505
Family Structure: Type & Size of Family Unit .378 Extraction Method: Maximum Likelihood. a. 1 factors extracted. 5 iterations required.
Goodness-of-fit Test Chi-Square df Sig.
61.017 9 .000
Reproduced Correlations SC1 SC2 SC3 SC4 SC5 SC6
Reproduced Correlation
SC1 .682a .754 .687 .312 .417 .574 SC2 .754 .834a .760 .345 .461 .635 SC3 .687 .760 .693a .315 .420 .579 SC4 .312 .345 .315 .143a .191 .263 SC5 .417 .461 .420 .191 .255a .351 SC6 .574 .635 .579 .263 .351 .484a
Residualb
SC1 .027 -.013 -.087 -.048 -.030 SC2 .027 -.001 -.059 -.054 -.003 SC3 -.013 -.001 .088 .037 -.019 SC4 -.087 -.059 .088 .260 .097 SC5 -.048 -.054 .037 .260 .155 SC6 -.030 -.003 -.019 .097 .155
Extraction Method: Maximum Likelihood. a. Reproduced communalities
b. Residuals are computed between observed and reproduced correlations. There are 7 (46.0%) non-redundant residuals with absolute values greater than 0.05.

297
Correlation Matrix for Technical Factors
T1 T2 T3 T4 T5 T6 T7 T8 T9 T10 T11 T12 T13 T14 T15
Correlation
T1 1.000 .667 .475 .550 .343 .406 .470 .422 .413 .479 .482 .471 .416 .389 .062
T2 .667 1.000 .631 .622 .554 .627 .440 .418 .487 .522 .454 .563 .488 .599 .148
T3 .475 .631 1.000 .733 .760 .658 .631 .640 .779 .419 .746 .562 .629 .562 .174
T4 .550 .622 .733 1.000 .668 .637 .627 .635 .632 .527 .661 .588 .640 .541 .175
T5 .343 .554 .760 .668 1.000 .736 .631 .656 .746 .344 .683 .460 .586 .577 .183
T6 .406 .627 .658 .637 .736 1.000 .542 .608 .649 .570 .623 .603 .695 .583 .189
T7 .470 .440 .631 .627 .631 .542 1.000 .796 .830 .477 .790 .610 .597 .517 .110
T8 .422 .418 .640 .635 .656 .608 .796 1.000 .816 .573 .798 .644 .586 .555 .204
T9 .413 .487 .779 .632 .746 .649 .830 .816 1.000 .482 .859 .636 .731 .574 .208
T10 .479 .522 .419 .527 .344 .570 .477 .573 .482 1.000 .553 .757 .591 .602 .164
T11 .482 .454 .746 .661 .683 .623 .790 .798 .859 .553 1.000 .626 .684 .577 .217
T12 .471 .563 .562 .588 .460 .603 .610 .644 .636 .757 .626 1.000 .780 .737 .194
T13 .416 .488 .629 .640 .586 .695 .597 .586 .731 .591 .684 .780 1.000 .665 .199
T14 .389 .599 .562 .541 .577 .583 .517 .555 .574 .602 .577 .737 .665 1.000 .193
T15 .062 .148 .174 .175 .183 .189 .110 .204 .208 .164 .217 .194 .199 .193 1.000
Sig. (1-tailed)
T1 .000 .000 .000 .000 .000 .000 .000 .000 .000 .000 .000 .000 .000 .186
T2 .000 .000 .000 .000 .000 .000 .000 .000 .000 .000 .000 .000 .000 .016
T3 .000 .000 .000 .000 .000 .000 .000 .000 .000 .000 .000 .000 .000 .006
T4 .000 .000 .000 .000 .000 .000 .000 .000 .000 .000 .000 .000 .000 .006
T5 .000 .000 .000 .000 .000 .000 .000 .000 .000 .000 .000 .000 .000 .004
T6 .000 .000 .000 .000 .000 .000 .000 .000 .000 .000 .000 .000 .000 .003
T7 .000 .000 .000 .000 .000 .000 .000 .000 .000 .000 .000 .000 .000 .056
T8 .000 .000 .000 .000 .000 .000 .000 .000 .000 .000 .000 .000 .000 .002
T9 .000 .000 .000 .000 .000 .000 .000 .000 .000 .000 .000 .000 .000 .001
T10 .000 .000 .000 .000 .000 .000 .000 .000 .000 .000 .000 .000 .000 .009
T11 .000 .000 .000 .000 .000 .000 .000 .000 .000 .000 .000 .000 .000 .001
T12 .000 .000 .000 .000 .000 .000 .000 .000 .000 .000 .000 .000 .000 .002
T13 .000 .000 .000 .000 .000 .000 .000 .000 .000 .000 .000 .000 .000 .002
T14 .000 .000 .000 .000 .000 .000 .000 .000 .000 .000 .000 .000 .000 .003
T15 .186 .016 .006 .006 .004 .003 .056 .002 .001 .009 .001 .002 .002 .003

298
KMO and Bartlett's Test Kaiser-Meyer-Olkin Measure of Sampling Adequacy. .902
Bartlett's Test of Sphericity
Approx. Chi-Square 2848.547
df 105
Sig. .000
Communalities
Initial Extraction
Recyclability and Reusability .570 .400
Ease to Remove and Reaffix .729 .737
Level of Maintenance Requirement .778 .779
Ability to Tolerate Expansion and Contraction .698 .661
Availability of the Technical Skills .773 .752
Ease and Speed of Method fixing .722 .653
Resistance to Fire .775 .752
Resistance to Heat .793 .762
Resistance to Moisture .887 .909
Resistance to Scratch .672 .643
Resistance to Weather .817 .822
Resistance to Chemicals .808 .918
Resistance to Decay .791 .705
Weight and Mass of the Material .660 .631
Life Expectancy .090 .052
Extraction Method: Maximum Likelihood.
Goodness-of-fit Test Chi-Square df Sig.
295.235 63 .000

299
Total Variance Explained Factor Initial Eigenvalues Extraction Sums of Squared Loadings Rotation Sums
of Squared Loadingsa
Total % of Variance Cumulative %
Total % of Variance Cumulative % Total
1 8.884 59.227 59.227 8.561 57.073 57.073 7.528
2 1.168 7.786 67.013 .877 5.849 62.921 5.787
3 1.003 6.689 73.701 .737 4.916 67.837 5.471
4 .895 5.969 79.670
5 .723 4.822 84.492
6 .423 2.818 87.309
7 .399 2.662 89.971
8 .338 2.256 92.227
9 .272 1.815 94.042
10 .240 1.603 95.645
11 .181 1.207 96.852
12 .151 1.003 97.855
13 .137 .912 98.767
14 .114 .759 99.526 15 .071 .474 100.000
Extraction Method: Maximum Likelihood. a. When factors are correlated, sums of squared loadings cannot be added to obtain a total variance.
Factor Matrixa Factor
1 2 3 Resistance to Moisture .900 -.284 -.134 Resistance to Weather .870 -.221 -.124 Resistance to Heat .837 -.159 -.191 Resistance to Chemicals .832 .460 -.119 Resistance to Decay .823 .159 -.042 Resistance to Fire .821 -.209 -.187 Level of Maintenance Requirement .817 -.222 .248 Ability to Tolerate Expansion and Contraction .770 -.039 .258
Ease and Speed of Method fixing .767 .005 .254 Availability of the Technical Skills .766 -.319 .252 Weight and Mass of the Material .742 .265 .103 Resistance to Scratch .684 .417 -.034 Ease to Remove and Reaffix .658 .173 .523 Recyclability and Reusability .556 .126 .274 Life Expectancy .228 .013 .000 Extraction Method: Maximum Likelihood. a. 3 factors extracted. 7 iterations required.

300

301
Reproduced Correlations
T1 T2 T3 T4 T5 T6 T7 T8 T9 T10 T11 T12 T13 T14 T15
Reproduced Correlation
T1 .400a .531 .495 .494 .455 .497 .379 .393 .428 .424 .422 .488 .466 .474 .128 T2 .531 .737a .630 .635 .581 .638 .407 .424 .474 .505 .470 .566 .547 .588 .152 T3 .495 .630 .779a .702 .759 .689 .671 .672 .766 .458 .729 .549 .627 .573 .183 T4 .494 .635 .702 .661a .667 .656 .592 .601 .669 .502 .646 .593 .617 .588 .175 T5 .455 .581 .759 .667 .752a .650 .648 .643 .746 .383 .706 .461 .569 .510 .170 T6 .497 .638 .689 .656 .650 .653a .581 .593 .655 .518 .635 .611 .621 .597 .175
T7 .379 .407 .671 .592 .648 .581 .752a .756 .823 .481 .784 .609 .650 .534 .184
T8 .393 .424 .672 .601 .643 .593 .756 .762a .824 .513 .787 .646 .672 .559 .189 T9 .428 .474 .766 .669 .746 .655 .823 .824 .909a .502 .863 .634 .701 .579 .201 T10 .424 .505 .458 .502 .383 .518 .481 .513 .502 .643a .507 .765 .631 .614 .161
T11 .422 .470 .729 .646 .706 .635 .784 .787 .863 .507 .822a .637 .687 .574 .195
T12 .488 .566 .549 .593 .461 .611 .609 .646 .634 .765 .637 .918a .763 .727 .195 T13 .466 .547 .627 .617 .569 .621 .650 .672 .701 .631 .687 .763 .705a .648 .189 T14 .474 .588 .573 .588 .510 .597 .534 .559 .579 .614 .574 .727 .648 .631a .172 T15 .128 .152 .183 .175 .170 .175 .184 .189 .201 .161 .195 .195 .189 .172 .052a
Residualb
T1 .135 -.020 .056 -.111 -.091 .091 .029 -.015 .055 .060 -.017 -.051 -.085 -.066
T2 .135 .001 -.014 -.027 -.012 .033 -.006 .014 .017 -.016 -.002 -.059 .011 -.004
T3 -.020 .001 .031 .001 -.031 -.039 -.031 .014 -.039 .017 .013 .001 -.011 -.010
T4 .056 -.014 .031 .001 -.019 .035 .034 -.038 .025 .014 -.005 .023 -.047 9.894E-005
T5 -.111 -.027 .001 .001
.086 -.017 .013
-5.532E-
005 -.038 -
.023 -.001 .016 .067 .013
T6 -.091 -.012 -.031 -.019 .086 -.039 .015 -.006 .052 -
.012 -.008 .073 -.013 .014
T7 .091 .033 -.039 .035 -.017 -.039 .040 .007 -.003 .007 .001 -.053 -.018 -.074 T8 .029 -.006 -.031 .034 .013 .015 .040 -.008 .060 .010 -.002 -.086 -.004 .015
T9 -.015 .014 .014 -.038 -
5.532E-005
-.006 .007 -.008
-.020 -.004 .002 .029 -.005 .006
T10 .055 .017 -.039 .025 -.038 .052 -.003 .060 -.020 .045 -.009 -.040 -.012 .003
T11 .060 -.016 .017 .014 -.023 -.012 .007 .010 -.004 .045 -.012 -.002 .003 .022
T12 -.017 -.002 .013 -.005 -.001 -.008 .001 -.002 .002 -.009 -.012
.017 .010 -.001
T13 -.051 -.059 .001 .023 .016 .073 -.053 -.086 .029 -.040 -
.002 .017 .016 .010
T14 -.085 .011 -.011 -.047 .067 -.013 -.018 -.004 -.005 -.012 .003 .010 .016 .021
T15 -.066 -.004 -.010 9.894E-005 .013 .014 -
.074 .015 .006 .003 .022 -.001 .010 .021
Extraction Method: Maximum Likelihood. a. Reproduced communalities. b. Residuals are reproduced between observed and reproduced correlations. There are 19(18%) non-redundant residuals with absolute values greater than 0.05

302
Pattern Matrixa
Factor
1 2 3
Resistance to Moisture .946 .025 -.014
Resistance to Weather .856 .086 -.006
Resistance to Fire .851 .108 -.093
Resistance to Heat .812 .174 -.095
Availability of the Technical Skills .655 -.211 .446
Level of Maintenance Requirement .589 -.077 .453
Life Expectancy .530 .093 .041
Resistance to Chemicals .119 .875 .012
Resistance to Scratch .017 .741 .091
Weight and Mass of the Material .125 .528 .270
Resistance to Decay .379 .487 .099
Ease to Remove and Reaffix -.095 .228 .779
Ability to Tolerate Expansion and Contraction .362 .119 .462
Ease and Speed of Method fixing .318 .171 .456
Recyclability and Reusability .045 .234 .448
Extraction Method: Maximum Likelihood. Rotation Method: Oblimin with Kaiser Normalization.
a. Rotation converged in 15 iterations.
Factor Correlation Matrix Factor 1 2 3
1 1.000 .602 .584
2 .602 1.000 .507
3 .584 .507 1.000
Extraction Method: Maximum Likelihood.
Rotation Method: Oblimin with Kaiser Normalization.
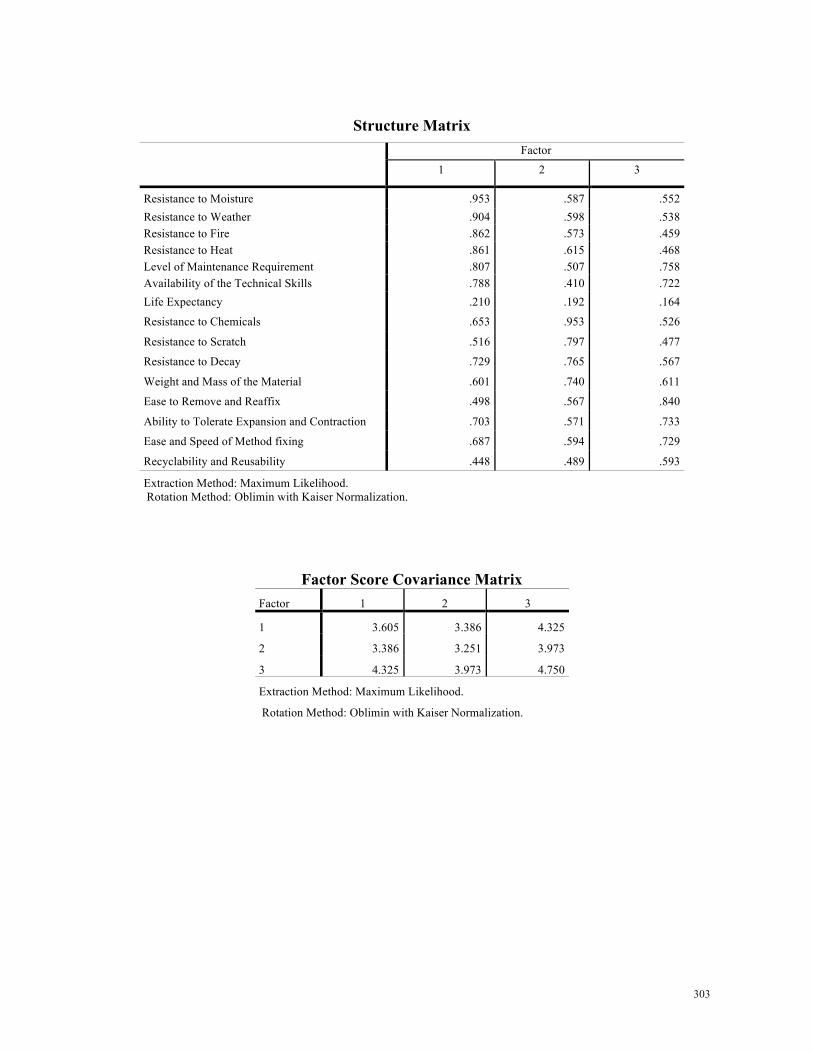
303
Structure Matrix
Factor
1 2 3
Resistance to Moisture .953 .587 .552 Resistance to Weather .904 .598 .538 Resistance to Fire .862 .573 .459 Resistance to Heat .861 .615 .468 Level of Maintenance Requirement .807 .507 .758 Availability of the Technical Skills .788 .410 .722 Life Expectancy .210 .192 .164
Resistance to Chemicals .653 .953 .526
Resistance to Scratch .516 .797 .477
Resistance to Decay .729 .765 .567
Weight and Mass of the Material .601 .740 .611
Ease to Remove and Reaffix .498 .567 .840
Ability to Tolerate Expansion and Contraction .703 .571 .733
Ease and Speed of Method fixing .687 .594 .729
Recyclability and Reusability .448 .489 .593
Extraction Method: Maximum Likelihood. Rotation Method: Oblimin with Kaiser Normalization.
Factor Score Covariance Matrix Factor 1 2 3
1 3.605 3.386 4.325
2 3.386 3.251 3.973
3 4.325 3.973 4.750
Extraction Method: Maximum Likelihood.
Rotation Method: Oblimin with Kaiser Normalization.

304
Correlation Matrix for Sensorial Factors
SN1 SN2 SN3 SN4 SN5 SN6 SN7 SN8 SN9 SN10
Correlation
SN1 1.000 .674 .653 .623 .570 .600 .595 .532 .582 .057
SN2 .674 1.000 .791 .668 .683 .588 .610 .557 .527 .137 SN3 .653 .791 1.000 .652 .670 .597 .624 .692 .628 .164 SN4 .623 .668 .652 1.000 .875 .766 .593 .550 .561 .138 SN5 .570 .683 .670 .875 1.000 .776 .538 .572 .520 .136 SN6 .600 .588 .597 .766 .776 1.000 .577 .569 .546 .130 SN7 .595 .610 .624 .593 .538 .577 1.000 .772 .781 .183 SN8 .532 .557 .692 .550 .572 .569 .772 1.000 .830 .205 SN9 .582 .527 .628 .561 .520 .546 .781 .830 1.000 .209 SN10 .057 .137 .164 .138 .136 .130 .183 .205 .209 1.000
Sig. (1-tailed)
SN1 .000 .000 .000 .000 .000 .000 .000 .000 .208 SN2 .000 .000 .000 .000 .000 .000 .000 .000 .024 SN3 .000 .000 .000 .000 .000 .000 .000 .000 .009 SN4 .000 .000 .000 .000 .000 .000 .000 .000 .023 SN5 .000 .000 .000 .000 .000 .000 .000 .000 .024 SN6 .000 .000 .000 .000 .000 .000 .000 .000 .030 SN7 .000 .000 .000 .000 .000 .000 .000 .000 .004 SN8 .000 .000 .000 .000 .000 .000 .000 .000 .001 SN9 .000 .000 .000 .000 .000 .000 .000 .000 .001 SN10 .208 .024 .009 .023 .024 .030 .004 .001 .001
KMO and Bartlett's Test Kaiser-Meyer-Olkin Measure of Sampling Adequacy. .891
Bartlett's Test of Sphericity Approx. Chi-Square 1705.393 df 45 Sig. .000
Goodness-of-fit Test Chi-Square df Sig.
134.916 26 .000

305
Communalities Initial Extraction Aesthetics or Visual density .584 .518 Texture .715 .597 Colour .734 .649 Temperature .810 .858 Acoustics .820 .881 Odour .668 .686 Thickness/Thinness .711 .743 Glossiness/Fineness .776 .815 Hardness .755 .823 Lighting Effect .062 .048
Extraction Method: Maximum Likelihood.
Total Variance Explained
Factor Initial Eigenvalues Extraction Sums of Squared Loadings
Rotation Sums of Squared Loadingsa
Total % of Variance
Cumulative %
Total % of Variance
Cumulative %
Total
1 6.143 61.429 61.429 5.834 58.336 58.336 5.241
2 1.056 10.558 71.987 .785 7.853 66.189 4.934
3 .870 8.703 80.690
4 .583 5.828 86.518
5 .409 4.087 90.605
6 .274 2.738 93.343
7 .246 2.456 95.798
8 .164 1.644 97.443
9 .154 1.545 98.987
10 .101 1.013 100.000
Extraction Method: Maximum Likelihood. a. When factors are correlated, sums of squared loadings cannot be added to obtain a total variance.

306
Factor Matrixa Factor
1 2
Temperature .872 -.311
Acoustics .869 -.355
Odour .806 -.193
Colour .803 .065
Glossiness/Fineness .802 .416
Thickness/Thinness .786 .354
Hardness .785 .454
Texture .770 -.068
Aesthetics or Visual density .719 .029
Lighting Effect .192 .107
Extraction Method: Maximum Likelihood. a. 2 factors extracted. 4 iterations required.

307
Reproduced Correlations SN1 SN2 SN3 SN4 SN5 SN6 SN7 SN8 SN9 SN10
Reproduced Correlation
SN1 .518a .551 .579 .618 .614 .574 .575 .588 .578 .141 SN2 .551 .597a .614 .693 .693 .633 .581 .589 .573 .140 SN3 .579 .614 .649a .681 .675 .635 .654 .671 .660 .161 SN4 .618 .693 .681 .858a .868 .763 .576 .570 .544 .134 SN5 .614 .693 .675 .868 .881a .769 .558 .549 .521 .129 SN6 .574 .633 .635 .763 .769 .686a .565 .565 .545 .134 SN7 .575 .581 .654 .576 .558 .565 .743a .777 .778 .189 SN8 .588 .589 .671 .570 .549 .565 .777 .815a .818 .198 SN9 .578 .573 .660 .544 .521 .545 .778 .818 .823a .199 SN10 .141 .140 .161 .134 .129 .134 .189 .198 .199 .048a
Residualb
SN1 .123 .073 .005 -.044 .026 .020 -.056 .005 -.084 SN2 .123 .178 -.024 -.010 -.045 .029 -.031 -.047 -.003 SN3 .073 .178 -.028 -.005 -.037 -.031 .022 -.032 .003 SN4 .005 -.024 -.028 .007 .003 .017 -.020 .017 .004 SN5 -.044 -.010 -.005 .007 .007 -.019 .023 -.002 .008 SN6 .026 -.045 -.037 .003 .007 .012 .004 .001 -.004 SN7 .020 .029 -.031 .017 -.019 .012 -.005 .003 -.005 SN8 -.056 -.031 .022 -.020 .023 .004 -.005 .011 .007 SN9 .005 -.047 -.032 .017 -.002 .001 .003 .011 .010 SN10 -.084 -.003 .003 .004 .008 -.004 -.005 .007 .010
Extraction Method: Maximum Likelihood. a. Reproduced communalities b. Residuals are computed between observed and reproduced correlations. There are 5 (11.0%) non-redundant residuals with absolute values greater than 0.05.

308
Pattern Matrixa Factor
1 2
Acoustics 1.000 -.117 Temperature .965 -.056
Odour .775 .074
Texture .596 .227
Colour .453 .420 Aesthetics or Visual density .442 .336 Hardness -.041 .935 Glossiness/Fineness .017 .891 Thickness/Thinness .084 .801 Lighting Effect -.005 .223
Extraction Method: Maximum Likelihood. Rotation Method: Oblimin with Kaiser Normalization. a. Rotation converged in 9 iterations.
Structure Matrix Factor
1 2 Acoustics .935 .598
Temperature .925 .622 Odour .827 .619 Texture .755 .646 Colour .748 .739 Aesthetics or Visual density .678 .647 Hardness .617 .907 Glossiness/Fineness .644 .903 Thickness/Thinness .647 .860 Lighting Effect .152 .220 Extraction Method: Maximum Likelihood. Rotation Method: Oblimin with Kaiser Normalization.

309
Appendix G: Data Analysis of Main Study
Introduction
This research set out to understand how designers could be better enabled to incorporate sustainability principles when formulating decisions to select LCGBMCs at the early stages of the design, for their use in a wider industry context. As the research progressed, it became evident that extending the research beyond the literature and preliminary studies and including a wide-range of professionals involved in the material selection process was required for a broader understanding of the study.
This chapter outlines the findings from both the surveyed questionnaire and interviews of participants who are actively engaged with sustainable material selection. A general description of the results and the demographic study is given in this section. As far as possible, data were tabulated and displayed through tables, charts, and graphs, with the aim of identifying and discerning any patterns that provided the best interpretation of the results of the study. The size of the response across available response categories is indicated in both percentage (%) and raw numeric terms. Presented also within this chapter are the conclusions of the analysis.
General Analysis of the Demographic Study
Relevant data relating to the informed selection of LCGBMCs were obtained from leading experts in the field of housing construction in Nigeria, following the closure of the main survey launched between November 2012 and January 2013. Participants’ responses and results summaries of the survey were automatically generated by the survey tool and stored in SPSS v.20. To provide insights to responsible material selection decision-making process, a combined research approach consisting of qualitative personal interviews supported by a quantitative online survey was adopted. Interviews were conducted with senior decision-makers across 10 organisations with a further 210 individuals participating in the online survey. The surveyed questionnaire attracted 480 interested participants with 210 eligible respondents representing various fields in housing, and who had relevant knowledge on issues specific to the use of LCGBMCs. The choice of respondents for the survey followed the sampling methods adopted in section 4.5.2.7 in chapter 4. The sampling methods adopted ensured sampling equivalence amongst various building professionals both in higher institutions and practicing building design and construction firms.

310
The reason for sampling equivalence was to ensure a sample size that would be statistically adequate to eliminate bias and obtain valid data (Hair et al., 2003). These activities were undertaken across the five areas of geographic interest due to different geographies, and variations in the technical nature of participants’ roles. This means the project evidence base was informed by feedback from over 200 individual participants leading to views of separate data items on various issues of interest. The survey was interested in how informed-decision making changes between conventional building material and LCGBMCs choices, and how designers’ choices influence life-cycle cost, energy use and performance of housing projects. The results of the survey are summarized below.
Designation of Respondents The question as to how best you describe your self, revealed the participants’ respective job affiliations. In order to detect disciplinary differences and conduct the inter-group comparison among professionals, all categories were binned into five main groups. Participants that did not fall into any of the 5 categories were grouped under the ‘other’ option. Remarkably, under the “Other” option, a number (7%) of other professionals within the housing sector also provided complete responses. The ‘Other’ category included sustainability consultants, academics, research consultants, program/software developers and other specialist consultants. The summary report showed that 20% of the sampled population were architects and accredited members of the Nigerian Institute of Architects (NIA) with surprisingly, almost the same proportion as the members of the Nigerian Institute of Builders (NIB) who had slightly more (22%) than expected. On the other hand, more than a quarter of engineers (16%) were Professional Engineers (PE) of the Nigerian Institute of Civil Engineers, with a higher representation from the Society of Construction Industry Arbitrators of Nigeria. 22% of the respondents were accredited professionals of the Nigerian Institute of Quantity Surveyors, and (13%) of the Nigerian Institute of Urban Designers. The encouraging finding here is that on average the size of each group was nearly as balanced as the others, and so allowed the study to reasonably compare views of respective professionals. Table 1 and Figure 1 show the number of respondents grouped under each professional category.

311
Table 1: Job Affiliation
Frequency Percent Valid
Percent
Cumulative
Percent
Valid
Architect 43 20.0 20.0 20.0
Builder 47 22.0 22.0 42.0
Engineer 33 16.0 16.0 58.0
Quantity Surveyor 46 22.0 22.0 80.0
Urban Designer 27 13.0 13.0 93.0
Other 14 7.0 7.0 100.0
Total 210 100.0 100.0
Figure 1: Illustration of the percentage of respondents’ designations, affiliations and certifications.
Source: Analysis of surveyed data, 2013
Experience of Respondents
The second question revealed the participants’ level of experience in the field of low-impact green housing construction. Zhou et al. (2008) and Ofori (1991) have argued that the knowledge and experience of building and design professionals is indispensable in the successful implementation of sustainable development principles in housing design and construction. From the survey results, 95% of the respondents had sufficient to excellent knowledge in low-impact green development concepts. The analysis of the study indicated that 15% of the respondents who participated in the study had between 1 and 5 years of experience, 26% had industry experience ranging between 6 and 10 years, 36% had at least 11-15 years of experience, while 18% had over 20 years experience working on low-impact green housing projects.

312
4% reported an insufficient knowledge and 1% undecided. An explanation for the 1% and 4% suggests that there is a possibility that the respondents who fell under those categories may not have handled housing projects in which sustainable development concepts were part of the project criteria. The encouraging finding is that in spite of their academic qualifications, the majority of respondents who participated in the survey also had reasonable experience in low-impact green housing construction, which further showed that more than half of the respondents were sufficiently experienced to provide data that were reliable and credible. Knowledge on materials sustainability was however, found to vary significantly between participants due to different geographies, areas of interest and variations in the technical nature of participant’s roles. The results of the survey on their knowledge and experience are shown below in Table 2 and Figure 2.
Table 2: Summary of respondents experience in green building projects
Frequency Percent Valid
Percent
Cumulative
Percent
Valid
0 [No Experience] 10 4.0 4.0 4.0
1-5 [Less Experienced] 32 15.0 15.0 19.0
6-10 [Fairly Experienced] 54 26.0 26.0 45.0
11-15 [Very Experienced] 75 36.0 36.0 81.0
15 and Above [Highly Experienced] 38 18.0 18.0 99.0
Other 1 1.0 1.0 100.0
Total 210 100.0 100.0
Figure 2.Summary of respondent’s level of experience in low-cost green developments
Source: Analysis of surveyed data, 2013

313
Areas of Project Interest
The question about their area of interest reported a higher rate of respondents concerned with the design aspects of low-impact green housing projects. Within the combined valid response (from Table 3 and Figure 4), “all aspects of housing design” (36%) was the leading area of specialty reported by respondents, with “design and build” (23%) making a significant proportion of the responses. 21% of the respondents agreed that the “material specification” aspects of the building project was their most important area of interest, 14% considered construction aspect of the building project as the most crucial aspect of the project, while 6% came in the “other” category of specialisation. The larger numbers of residential design respondents further reflect the intended focus of the research, which is on all aspects of housing design.
Table 3: Participants’ area of interest, shown by the frequency they influence material choice
Frequency Percent Valid Percent Cumulative Percent
Valid
Design 48 23.0 23.0 23.0
Construction 30 14.0 14.0 37.0
Material Specification 44 21.0 21.0 58.0
All Aspects 76 36.0 36.0 94.0
Other 12 6.0 6.0 100.0
Total 210 100.0 100.0
Figure 3. Illustration of the percentage of interest in the area of low-cost green housing construction
Source: Analysis of surveyed data, 2012

314
Views on Decisions Regarding the Phase of Material Choice
In the follow up question, respondents were asked to indicate the phase for which they thought best to make decisions in the choice of materials for housing projects. Analysis of the returned questionnaire (refer to Table 4 and Figure 4) showed that planning and decision-making requirements were found to be significant, as 60% of respondents considered the choice of materials at these phases. Of the other lots, 23% noted the design development phase, 11% of them went for construction, while as little as 1% and 3% went for operation and final design stages. 2% made up the “other” option. The views obtained from this survey tend to be more representative of respondents who are more particular about the cost, social and environmental implications of materials at the decision-making, planning and preliminary design stages of the project; as changes to the overall building performance, visual appearance or energy cost can be difficult after this point.
Table 4: Phase of Material Selection
Frequency Percent Valid Percent Cumulative Percent
Valid
Decision-Making 125 60.0 60.0 60.0
Design Development 49 23.0 23.0 83.0
Final Design 7 3.0 3.0 86.0
Construction 23 11.0 11.0 97.0
Operation 1 1.0 1.0 98.0
Other 5 2.0 2.0 100.0
Total 210 100.0 100.0
Figure 4. Illustration of the percentage of the phase of material selection Source: Analysis of surveyed data, 2013

315
Obstacles in the Use of Low-Cost Green Building Materials
An attempt was made to identify obstacles perceived by design and building professionals as they sought to use LCGBMCs in their design and building projects. Using the 5-point likert scale from “strongly disagree” (=1) to “strongly agree” (=5), respondents were asked to rank the extent to which they agreed on the following factors as obstacles that significantly deter them from using LCGBMCs in housing design projects. The Kendall's W was adopted for this study since it makes no assumptions regarding the nature of the probability distribution and can also handle as many numbers of distinct outcomes as possible (Kline, 2002). Kendall’s procedure states that if the test statistic W is 1, then all the survey respondents have been unanimous, and each respondent has assigned the same order to the list of concerns. If W is 0, then there is no overall trend of agreement among the respondents, and their responses may be regarded as essentially random. To check whether or not intermediate values obtained for W indicated a greater or lesser degree of unanimity among the various professional groups, and to verify that the degree of agreement or disagreement did not occur by chance, the significance of W was tested, resulting in the null hypothesis being in relatively perfect disagreement. The Kendall’s coefficient of concordance (W) value obtained was 0.226, which was significant at 95% confidence level. The analysis implied that the W was significant with Asymp.Significant value of 0.00 and as such the null hypothesis was not supported and thus, rejected. Test statistics was further applied to the rankings in order to test the significance of the findings (as shown in Table 5a). The result of the analysis showed a greater degree of agreement in opinions among the various responses, so that there was no relatively significant difference in agreement between the number of ‘k’ dependent variables and the population from which these samples were drawn. The analysis was interpreted to indicate a significant degree of agreement among various design and building professionals as to the ranking of the perceived obstacles.
Table 5a: Test statistics for perceived obstacles affecting the patronage of LCGBM
Kendall's Wa 0.226
Chi-Square 396.655
Difference of freedom (df) 13
Asymp. Sig. 0.000
a. Kendall's Coefficient of Concordance

316
The biggest concern of the ten potential obstacles listed in Table 5b and as illustrated in Figure 5, was client’s preference, with a relative index of (RI =0.795). This was closely followed by the contractual agreement with (RI = 0.775); lack of access to adequate and sustainable material information to compare material alternatives (RI= 0.772); nature of the building project (RI =0.699); Unwillingness to change from conventional materials (RI = 0.683); with limited availability of materials (RI=0.479) and maintenance concern (0.480) trailing in the last positions. The ranking of client’s preference as the most recognised obstacle is not surprising as clients greatest financial obligation for selecting ideal and cost effective building products is frequently their central concern, since costs must be monitored and controlled, whether from the point of view of the owner, or the designer. Remarkably, within the “Architects category”, “Aesthetically less pleasing” was clearly identified as the most critical factor inhibiting greater industry acceptance of LCGBMCs, which corroborates with Jiboye’s (2009) observation about their reluctance in using such materials in their design projects. Summary discussions of the top three obstacles are presented in the following sections.

317
Table 5b: Ranking indices of perceived obstacles inhibiting the wide-scale use of low-cost green materials in the
housing industry
Obstacles Architect [1] Builder [2]
Engineer [3]
Quantity Surveyor
[4]
Urban Designer [5]
Other [6]
Overall
RI Rank RI Rank
RI Rank
RI Rank
RI Rank
RI Rank
RI Rank
Clients’ Preference
0.600 9 0.786
2 0.986
1 0.852
1 0.956 1 0.943 1 0.795
1
Contractual Agreement
0.815 2 0.800
1 0.725
5 0.719
3 0.733 2 0.800 2 0.775
2
Limited Accessibility to
Relevant Information
0.755 3 0.779
3 0.863
2 0.778
2 0.689 3 0.743 3 0.772
3
Nature of the Project Design
0.730 4 0.676
5 0.625
7 0.711
4 0.733 2 0.700 4 0.699
4
Unwillingness to Change
0.680 6 0.683
4 0.825
3 0.644
6 0.533 8 0.700 4 0.683
5
Lack of Familiarity with
Techniques
0.700 5 0.593
7 0.788
4 0.659
5 0.622 5 0.514 9 0.655
6
Unreliability of Suppliers
0.605 8 0.634
6 0.700
6 0.615
7 0.444 10 0.743 3 0.628
7
Aesthetically Less Pleasing
0.950 1 0.538
12 0.525
11 0.437
13 0.378 11 0.486 10 0.622
8
Low Flexibility for Substitutes
0.595 10 0.572
8 0.588
9 0.600
8 0.511 9 0.614 6 0.587
9
Uncertainty in the Project Outcome
0.565 13 0.517
11 0.613
8 0.578
10 0.556 6 0.671 5 0.572
10
Building Code Restriction
0.580 11 0.531
10 0.563
10 0.593
9 0.555 7 0.586 8 0.569
11
Perception that Materials are of
Low Status
0.635 7 0.517
11 0.513
12 0.526
11 0.533 8 0.600 7 0.563
12
Limited Availability of
Materials
0.575
12 0.545
9 0.338
13 0.593
9 0.667
4 0.371
11 0.529
13
Maintenance Concern
0.560 14 0.386
13 0.525
11 0.504
12 0.511 9 0.329 12 0.480
14
Source: Analysis of surveyed data, 2013

318
Figure 5. Graph illustrating the “relative mean rank” of the perceived obstacles limiting greater use of low-cost green materials
0
0.6
0.815
0.755
0.73
0.68
0.7
0.605
0.95
0.595
0.565
0.58
0.635
0.575
0
0.786
0.8
0.779
0.676
0.683
0.593
0.634
0.538
0.572
0.517
0.531
0.517
0.545
0
0.986
0.725
0.863
0.625
0.825
0.788
0.7
0.525
0.588
0.613
0.563
0.513
0.338
0
0.852
0.719
0.778
0.711
0.644
0.659
0.615
0.437
0.6
0.5778
0.593
0.526
0.593
0
0.956
0.733
0.689
0.733
0.533
0.622
0.444
0.378
0.511
0.556
0.555
0.533
0.667
0
0.943
0.8
0.743
0.7
0.7
0.514
0.743
0.486
0.614
0.671
0.586
0.6
0.371
0
0.795
0.775
0.772
0.699
0.683
0.655
0.628
0.622
0.587
0.572
0.569
0.563
0.529
Clients Preference
Contractual Agreement
Limited Accessibility to Relevant Information
Nature of the Project Design
Unwillingness to Change
Lack of Familiarity with Techniques
Unreliability of Suppliers
Aesthetically Less Pleasing
Low Flexibility for Substitutes
Uncertainty in the Project Outcome
Building Code Restriction
Perception that Materials are of Low Status
Limited Availability of Materials
Relative Ranking Index of Obstacles Affecting Wider Use of LCGBMCs in Mainstream
Architect=1 Builder=2 Engineer=3 Qus. Surv=4
Urban.Designer=5 Other=6 Overall RI

319
Client’s preference In an attempt to identify the potential factors barring the use of LCGBMCs in housing projects, the feedbacks demonstrated that ‘client’s preference’ had the most significant influence on the decision of which materials to use, since clients and investors regularly have significant influence on material choices due to the terms they impose on a project through budget and brief. This is not entirely surprising as clients, who normally are anxious to minimise the running costs associated with housing solicit for cost effective products (Chan et al, 2009). Some participants noted that the degree to which they use building materials largely depends on clients’ perception, as they are led to believe that buildings designed with locally-sourced/traditional building products are not permanent and has to be re-worked, maintained or out rightly re-built more often than it is with buildings constructed with conventional building materials. The significance of this factor was well phrased by one respondent;
“The choice of building materials is governed by the economic power of the client, hence his preference of choice”.
He suggests that scientific research into best practices is likely to enhance their durability in construction, and thus greater use. He added that clients’ influence is understandable as they are legally responsible for the project, and carry the initial risks for the costs of the project. Contractual agreement
Contractual agreement was rated as the second most significant factor that affects the effective use of LCGBMCs in housing projects. The issue of the impacts of the contractual agreement on the choice of materials has been repeatedly highlighted in various literatures (Ofori, 1999; Augenbroe 2002). Ofori (1999) argues that despite the many strong advantages of standard form construction contracts, they are not flexible to fit all projects, material types and circumstances. He notes that the materials specified in the contract agreement are usually defined by codes and standards.
Perhaps the reason why most local building products are left out during the tendering stage of the contract is because nearly all of such products do not have ideal codes and standard of use, and so may be impossible to include them in the contract document, since contractors are less likely to determine the potential risks or benefits in using them.
320
Lack of access to adequate and up-to-date material information The identification of information scarcity was noted as the third biggest obstacle to specifying LCGBMCs in light of the current proliferation of documentary resources relating to the informed selection of such materials. The issue of accessing up-to-date information through different steps of the housing construction process, what the sources are and how they are obtained is one of the most discussed topics in the field of construction (Seyfang, 2009a). The respondents reported that many sustainability principles in the choice of materials and low-impact green housing development goals have fallen by the wayside due to the absence of readily available information.
Building Assessment Tools for Low-Cost Green Materials
This part of the survey included questions that explored the sources of information and assessment tools design and building professionals use when assessing LCGBMCs for low-impact green housing projects. Van Kesteren (2008) noted that selecting materials could be a problem-solving activity, given the high influx of new products of different qualities entering into the market. He added that this increases the workload and responsibilities of the specifiers who have to evaluate and select the building materials needed, as this demands a large and constant flow of adequate information. Participants were asked to indicate their familiarity with any source of information or tools for LCGBMCs. As shown in Table 6, approximately 6% of the respondents confirmed knowledge of likely information sources. A large proportion (93%) of the respondents noted otherwise since they had no knowledge of any existing tool. The decision-making approaches currently taken by the participatory house builders were identified within the context of build system for LCGBMCs. All of them relied upon heuristic decision-making, drawing on individual experience and intuition, and informal group discussion. Two companies (1%) of the sample had used some simple tools like best practice templates and estimate workbook. None had used any formal decision-making software. No company had applied any sophisticated decision theories such as: AHP, utility theory, linear programming, fuzzy sets or Bayesian analysis. However, all of the companies used, to a varied degree, external management consultants for decision support.

321
One of the respondents noted that data on LCGBMCs exists generally in paper form (e.g. brochures and catalogues). He added that paper-based information becomes quickly obsolete, as their updates do not keep pace with the speed with which new building materials appear on the market. The result of this question however, suggested the need for a system capable of evaluating decision trade-offs when selecting LCGBMCs. A summary of the result is presented in Figure 6 and Table 6
Figure 6. Illustration of the report on the available tools for evaluating low-cost green materials
Source: Analysis of surveyed data, 2013

322
Table 6: Awareness of Existing Material Selection Assessment Tools * Job Affiliation Cross tabulation
Job Affiliation Total
Architect Builder Engineer Quantity
Surveyor
Urban
Designer
Other
Awareness
of Existing
Material
Selection
Assessment
Tools
Other
Count 1a 2a 0a 0a 0a 0a 3
Expected
Count .6 .7 .5 .7 .4 .2 3.0
% within
Awareness of
Existing
Material
Selection
Assessment
Tools
33.3% 66.7% 0.0% 0.0% 0.0% 0.0% 100.0%
% within Job
Affiliation 2.3% 4.3% 0.0% 0.0% 0.0% 0.0% 1.4%
% of Total 0.5% 1.0% 0.0% 0.0% 0.0% 0.0% 1.4%
Std. Residual .5 1.6 -.7 -.8 -.6 -.4
No
Count 38a 43a 31a 44a 26a 13a 195
Expected
Count 39.9 43.6 30.6 42.7 25.1 13.0 195.0
% within
Awareness of
Existing
Material
Selection
Assessment
Tools
19.5% 22.1% 15.9% 22.6% 13.3% 6.7% 100.0%
% within Job
Affiliation 88.4% 91.5% 93.9% 95.7% 96.3%
92.9
% 92.9%
% of Total 18.1% 20.5% 14.8% 21.0% 12.4% 6.2% 92.9%
Std. Residual -.3 -.1 .1 .2 .2 .0
Yes
Count 4a 2a 2a 2a 1a 1a 12
Expected
Count 2.5 2.7 1.9 2.6 1.5 .8 12.0

323
% within
Awareness of
Existing
Material
Selection
Assessment
Tools
33.3% 16.7% 16.7% 16.7% 8.3% 8.3% 100.0%
% within Job
Affiliation 9.3% 4.3% 6.1% 4.3% 3.7% 7.1% 5.7%
% of Total 1.9% 1.0% 1.0% 1.0% 0.5% 0.5% 5.7%
Std. Residual 1.0 -.4 .1 -.4 -.4 .2
Total
Count 43 47 33 46 27 14 210
Expected
Count 43.0 47.0 33.0 46.0 27.0 14.0 210.0
% within
Awareness of
Existing
Material
Selection
Assessment
Tools
20.5% 22.4% 15.7% 21.9% 12.9% 6.7% 100.0%
% within Job
Affiliation 100.0% 100.0% 100.0% 100.0% 100.0%
100.0
% 100.0%
% of Total 20.5% 22.4% 15.7% 21.9% 12.9% 6.7% 100.0%
Each subscript letter denotes a subset of Job Affiliation categories whose column proportions do not differ
significantly from each other at the .05 level.
Source: Analysis of surveyed data, 2013

324
Decision Factors for Selecting Low-Cost Green Materials
One of the key objectives of this research was to identify and define the key decision selection factors that will influence design team members in the selection of LCGBMCs at the early design stages of LIGHDs. A wide scope literature review in chapters 2 and 3 including findings from the preliminary survey revealed that there was lack of a comprehensive list of assessment factors developed specifically for assessing LCGBMCs. Consequently, a further study consisting of a list of material-selection factors - (gleaned from the results of both the preliminary study and in-depth literature review in chapter 2) was undertaken to identify the key decision factors that would influence designers decisions in their choice of materials. Overall a total of 60 factors were identified and selected for LCGBMCs assessment, with 6 variables in socio-cultural criteria category, 18 variables in technical category, 10 variables in environmental category, 5 variables in economic/cost category, 12 variables in general/site category, and 12 variables in sensorial category (as shown in Table 7). Foxon et al. (2002) argue that the validity of a given list of decision factors or variables depends on how well it satisfies the following requirements:
(1) Comprehensiveness: In order to ensure that the choice of materials meets the SD objectives, Foxon et al. (2002) suggest that each factor must fall within a category to eliminate uncertainties during the selection process.
(2) Applicability: Another point noted is that the identified factors or variables chosen should be applicable across the range of options under consideration.
(3) Transparency: Thirdly, the factors should be chosen in a transparent way, to understand the criteria used, and be able to propose any other criterion for consideration.
(4) Practicability: Finally, the set of factors chosen must form a practicable set for the purposes of the decision to be assessed.
To ensure a better understanding of the list of factors and variables gleaned from the reviewed literature and preliminary study in chapter 2, the following requirements were applied before deploying the survey questionnaire. The definition of each factor or variable under their respective categories encouraged respondents to provide accurate, unbiased and complete information. The following section presents the results analysis of the surveyed factors.

325
Table 7: Pre-Analysed decision factors for evaluating trade-offs between low-cost green building material s
(GS) General /Site Factor
(EH) Environmental /Health Factor
(C) Economic/Cost Factor
(SC) Socio-Cultural Factor
(T) Technical Factor (SN) Sensorial Factor
GS1-Location GS2-Availability GS3-Distance GS4-Certification GS5-Disaster Prone GS6-Site Geometry GS7-Design Geometry GS8-Spatial Structure GS9-Spatial Activities GS10-Material Scale GS11-Bldg Orientation GS12-Spatial Scale
EH1- Env. Compliance EH2-CO2 Emissions EH3-Users’ Safety EH4-Ozone Depletion EH5-Pesticide Treatment EH6-Climate EH7-Env-Toxicity EH8-Fossil Depletion EH9-Nuclear Waste EH10-Waste Disposal
C1-Life-Ccycle Cost C2-Embodied Energy Cost C3-Capital Cost C4-Labour Cost C5- Maintenance Cost
SC1-Compatibility (Tradition) SC2-Compatibility (Region) SC3-Resistriction on Usury SC4-Clients’ Preference SC5-Custom Knowledge
T1-Recyclability T2-Ease to remove T3-maintenance Level T4-Contraction Tolerance T5-Skills Availability T6-Speed of Fixing T7-Fire Resistance T8-Thermal Resistance T9-Moisture Resistance T10-Scratch Resistance T11-Weather Resistance T12-Chemical Resistance T13-Resistance to Decay T14-Weight/Mass T15-Life Expectancy T16-Renewable T17-UV Resistance T18-Compatibility with other Materials
SN1-Aesthetics SN2-Texture SN3-Colour SN4-Temperature SN5-Acoustics SN6-Odour SN7-Thick/Thin SN8-Glosiness SN9-Hardness SN10-Lighting Effect SN11-Translucence SN12-Structure

326
Development of the Key Material Selection Factors or Variables
To identify the key influential factors needed for the MSDSS model, respondents were asked to rate the validity of a range of sub-factors under each category of the parent groups on the frequency for which they were relevant in the selection of LCGBMCs using a 5- point Likert scale (where “1= least important” to “5 =extremely important”) as shown in Appendix D. They were also asked to add and rate the relative importance of any other relevant factors not included in the list. The study results (in table 10) showed that a large number of factors influence the selection of LCGBMCs, with cost, technical and socio-cultural factors/variables remaining the overarching priorities. The analysis in Table 8 indicated that “Economic/Cost (RI=0.918)” and “Technical (RI=0.916)” factors were found to have the strongest influence on material choice(s). These were followed by “Socio-Cultural (RI=0.912)”, “Environmental (RI=0.890)”, “General/Site (RI=0.838)” and “Sensorial (RI=0.830)”. Within the “Economic/Cost” category, key factors such as maintenance cost (with RI=0.912) and “Labour/Installation cost” with (RI=0.898) were commonly found to have more influence in the project’s budget. Surprisingly, result analysis based on the views from the participants indicated that factors such as “Capital cost (RI=0.891)” and “Material embodied energy cost (RI=0.876)” were found to have the least impact on material choices.
Factors Importance Rating
To ensure that the rating scale (1–5) for measuring the factors yielded the same results, a reliability analysis test was first conducted. Cronbach's alpha was calculated to test the internal consistency reliability of the generated scale examined (see Table 9). The Cronbach’s rule states that the closer alpha value for each factor is to 1, the greater the internal consistency reliability of the factor in the scale. Cronbach’s formula is given as:
Here N is equal to the number of items, c-bar is the average inter-item covariance among the items and v-bar equals the average variance. (Note that a reliability coefficient of 0.70 or higher is considered "acceptable" in most social science research situations.)

327
Table 8: Item Statistics
Relative Index (RI) Rank Std. Deviation N
F3: Economic or Cost Factors (C) 0.918 1 1.340 210
F5: Technical Factors (T) 0.916 2 1.429 210
F4: Socio-Cultural Factors (SC) 0.912 3 1.385 210
F2: Environmental and Health Factors (EH) 0.890 4 1.331 210 F1: General and Site Factors (GS) 0.838 5 1.518 210 F6: Sensorial Factors (SN) 0.830 6 2.146 210
Table 9: Reliability Statistics
Cronbach's Alpha Cronbach's Alpha Based on Standardized Items
N of Items
0.781 0.789 6
The value for Cronbach’s alpha was estimated at 0.781, which was well above Cronbach’s specification of 0.7, and thus, provided evidence for composite reliability. Therefore, the results shown in Tables 8 and 9 proved that all the six group of factors presented adequate reliability scores. This indicates that the six group of factors (i.e. GS-Site variables; EH-Environmental; EC-Economic; SC-Socio-Cultural; T-Technical; and SN-Sensorial) extracted from the factor analysis could be used as a multidimensional measure for internal and external forces affecting designers’ decisions relating to material-selection practices. Cronbach's alpha values for sensorial, site, environmental, technical, economic, and socio-cultural criteria came up as 0.830, 0.838, 0.890, 0.916, 0.918, and 0.912, respectively. Given that the resultant alpha values for each factor category was greater than 0.7, there was strong evidence to show that all coefficients of all the factors were acceptable, and internally consistent. In order to identify the relative importance of the sub-categorical factors based on the surveyed data, ranking analysis was performed. The Relative index analysis was used to rank the sub-factors according to their relative importance as shown in table 10. Five important levels were transformed from Relative Index values: Highly Significant Level (H) (0.8≤RI≤1), High–Medium Level (H–M) (0.6≤RI<0.8), Medium Level (M) (0.4≤RI<0.6), Medium–Low Level (M–L) (0.2≤RI<0.4), and Low Level (L) (0≤RI<0.2).
Considering that the nature of the factors to be extracted was unknown, an exploratory factor analysis- was undertaken using the maximum likelihood approach as the factor analysis extraction method. Exploratory factor analysis is an effective statistical method used to describe variability among observed variables in terms of fewer unobserved variables (Hair et al., 1995).

328
In other words, it reduces variables with similar characteristics together into a smaller set of correlated or uncorrelated dimensional factors, which are capable of explaining the observed variance in the larger number of variables (Kline, 2002). Kaiser–Meyer–Olkin (KMO) measure and Bartlett's Test of Sphericity were conducted to examine the sampling adequacy, ensuring that factor analysis was going to be appropriate. Afterwards, the maximum likelihood factor analysis method was also used to derive the minimum number of factors, which helped to explain the maximum portion of variance in the original variable. It was chosen to extract the unobserved variables based on the criterion that the associated eigenvalue should be greater than 1(Hair et al., 1995).
However, Kline (2002) argued that with a sample size of at least 100 participants or above, loadings of 0.30 or higher could be considered significant (see discussion in Kline, 2002, pp. 52-53). This meant that variables with factor loadings of 0.30 or higher were considered highly significant, while variables that loaded near zero (0) were clearly considered as highly insignificant. However, given that a broad consensus of recent studies in the literature (Velicer & Jackson, 1990) confirmed that the Eigen value of 1 was among the least accurate methods for selecting the number of factors to retain, + 0.30 was classified as the minimum consideration level and statistically significant factor loading for the selected factors in this study, since attaining a value of 0.8 or greater was unlikely to occur in real data (Costello & Osborne, 2005). To interpret the relationship between the observed variables and to identify the unobserved variables more easily- given the sample size of 210, the most ideal and more robust rotation method, “direct oblimin rotation” was selected since oblique rotation produces results nearly identical to the orthogonal rotation when using the same extraction method, as evident in Appendix F (Tabachnick & Fidell, 2007). To ascertain whether or not “direct oblimin” was the ideal rotation method, or a more accurate, and perhaps more reproducible solution for simplifying and clarifying the data structure, factor analyses- using both “varimax” and “oblique” rotation methods were conducted (as shown in Appendix F). This also helped to check whether or not the correlation matrix produced results of values that were truly uncorrelated (+0.1≤X<+0.3) or significantly correlated (+0.3≤X≤1).
Kline (2002, p. 65) argued that the choice of rotation (whether orthogonal or oblique) could make much difference, particularly where the factors are markedly correlated (as demonstrated in Appendix F).

329
The results of the analysis (shown in Appendix F) indicated that the correlations for both varimax and oblique rotations exceeded +0.32, showing a 10% overlap in variance among factors, which was enough to warrant oblique rotation. Therefore, based on the result of the analysis, and given that oblique rotation will easily reproduce an orthogonal solution but not vice versa (Costello & Osborne, 2005), the oblique rotation was recommend as ideal for this research (Detailed results of the analysis is displayed in Appendix F). Table 10 shows the ranking results for each sub-factor under each factor category derived using the relative index analysis equation in chapter 4. The value of KMO is 0.862, which is well above Kaiser’s (1974) specification of 0.5. Therefore, the results shown in Table 10 proved that fifty-five (55) out of sixty factors were adequate to undertake any material selection problem. From the results of the analysis shown in table 10, forty factors were identified under the “Highly significant” level for evaluating LCGBMCs with an RI value ranging from 0.952 to 0.806, with “life expectancy (T15)” topping the list of this group and “Thickness of material” (SN7) occupying the least position. Fifteen factors where grouped under the “High-Medium” level. “Life Expectancy” was ranked as the first priority in the technical category with an RI value of 0.952, and it was also the highest among all factors and was highlighted at “High” importance level. “Resistance to fire” was also rated second in importance among the selection factors. “Maintenance Cost” was ranked third in importance. It was clear from this research that there is a perception of ambiguity surrounding the long-term maintenance of LCGBMCs. This is not entirely surprising given that maintenance free buildings are increasingly sought after by clients, anxious to minimise the running costs associated with buildings. “Life-cycle cost” has been, and continues to be major concerns for building designers. Among the top 20 ranking factors, it was observed that only one factor from the environmental category out of the list was ranked high among the selection factors. This again suggests that environmental issues within the context of the developing countries are not strongly considered despite the high environmental awareness exhibited by design and building professionals in developed regions. This finding also corroborates the initial observations of various studies (Ellis, 2009; Seyfang, 2009a; Malanca, 2010) repeatedly highlighted in the background and literature studies in chapters 1 and 2.

330
Table 10: Ranked decision factors for low-cost green building material selection
Material selection factors/variables
Valid percentage of score
(%)
Relative
Index
Scores
Ranking
by
Category
Overall
Ranking
Importance
Level
1 2 3 4 5
GENERAL/SITE FACTORS
GS2-Material Availability 1.6 2.9 17.9 50.5 27.0 0.795 1 35 H-M
GS1-Geographic Location of Building Site 2.1 2.6 19.3 51.2 24.3 0.773 2 38 H-M
GS10-Building and Space Usage 0.8 5.5 21.4 52.2 20.1 0.764 3 39 H-M
GS9-Knowledge Base in Construction 1.1 7.4 33.2 42.1 16.3 0.731 4 41 H-M
GS6- Natural Disasters Common to the Site 1.4 11.3 27.7 39.5 20.1 0.726 5 42 H-M
GS7-The Type of Building Material(s) 1.8 8.2 36.3 37.0 16.7 0.712 6 43 H-M
GS4-Building Regulation and Certification for
Use 2.7 10.8 33.5 36.1 16.9 0.709 7 44 H-M
GS5-Design Concept 0.8 15.
2
35.
5
13.
1
15.
4 0.702 8 45 H-M
GS12-Spatial Scale: Building Size and Mass 4.5 17.8 30.3 28.4 19.0 0.675 9 47 H-M
GS8-Project Site Geometry/Setting/Condition 1.4 17.5 38.1 33.3 9.7 0.663 10 46 H-M
GS3-Distance 5.6 17.9 32.1 31.3 13.1 0.653 11 47 H-M
GS11-Building Orientation 4.6 21.9 29.5 28.4 15.6 0.652 12 48 H-M
ENVIRONMENTAL/HEALTH FACTORS
EH3-Safety and Health of End-users 0.5 2.5 3.1 46.2 47.1 0.876 1 17 H
EH6-The Climatic Condition of the Region 0.3 2.0 5.3 49.2 42.6 0.860 2 23 H
EH7-Material Environmental Impact 0.7 2.6 6.0 49.0 41.1 0.850 3 27 H
EH2-Level of Carbon Emissions and Toxicity 0.3 4.9 5.6 49.2 39.5 0.849 4 28 H
EH4-Habitat Disruption: Ozone Depletion
Potential 1.6 1.8 9.6 52.0 34.4 0.830 5 30 H
EH1-Environmental Statutory Compliance 2.1 6.3 9.7 42.7 38.7 0.820 6 32 H
EH5-The Amount of Pesticide Treatment
Required 3.0 2.9 8.2 52.5 32.9 0.813 7 33 H
ECONOMIC/COST FACTORS
C4-Maintenance or Replacement Cost 0.5 1.8 5.9 20.2 71.6 0.912 1 3 H
C5-Labour or Installation Cost 0.5 2.0 5.2 27.3 64.9 0.898 2 8 H
C1-Life Cycle Cost 4.5 3.0 26.1 66.4 99.6 0.897 3 9 H
C3-Capital Cost (Economic Status of the Client) 0.8 3.6 7.1 22.0 66.5 0.891 4 10 H
C2-Material Embodied Energy Cost 0.5 5.6 4.0 25.4 64.5 0.876 5 17 H

331
SOCIO-CULTURAL FACTORS
SC5-Local Knowledge of the Custom 0.5 3.7 5.5 32.0 57.8 0.884 1 13 H
SC1-Material Compatibility with Cultural
Traditions 1.0 4.5 2.7 33.9 57.4 0.879 2 16 H
SC6-Material Compatibility with Cultural
Traditions 0.4 2.9 3.7 36.2 56.2 0.876 3 17 H
SC2-Material Compatibility with Regional
Settings 0.5 2.5 6.4 32.7 57.4 0.875 4 18 H
SC3-Cultural Restriction(s) on Usury 1.0 3.3 10.
8
31.
1
53.
3 0.851 5 26 H
SC4-Family Structure: Type & Size of Family
Unit 3.0 21.0 15.7 19.8 39.9 0.737 6 40 H-M
TECHNICAL FACTORS
T15-Life Expectancy 1.1 0.3 4.2 26.9 66.8 0.952 1 1 H
T7-Resistance to Fire 0.3 1.2 4.8 28.8 64.9 0.919 2 2 H
T9-Resistance to Moisture 0.5 1.5 3.6 24.7 69.7 0.911 3 4 H
T11-Resistance to Weather 0.3 1.0 4.8 25.0 69.0 0.911 3 4 H
T5-Availability of the Technical Skills 0.5 1.5 4.5 28.4 65.0 0.905 4 5 H
T8-Resistance to Heat 0.3 1.2 4.8 28.8 64.9 0.904 5 6 H
T13-Resistance to Decay 0.3 1.5 5.7 25.7 66.8 0.902 6 7 H
T3-Level of Maintenance Requirement 0.5 1.8 4.2 30.6 62.8 0.897 7 9 H
T6-Ease and Speed of Method fixing 0.5 2.2 7.5 29.4 60.4 0.883 8 14 H
T4-Ability to Tolerate Expansion and
Contraction 8.3 2.0 6.7 32.9 50.0 0.882 9 15 H
T1-Recyclability and Reusability 2.2 2.2 5.2 31.4 59.0 0.868 10 20 H
T12-Resistance to Chemicals 0.1 1.9 13.1 27.9 57.0 0.865 11 21 H
T2-Ease to Remove and Reaffix 0.7 2.2 6.8 36.5 53.8 0.864 12 22 H
T14-Weight and Mass of the Material 0.3 2.6 12.4 29.2 55.5 0.856 13 24 H
T10-Resistance to Scratch 1.1 3.1 11.6 27.0 57.1 0.852 14 25 H
SENSORIAL FACTORS
SN4-Temperature 0.4 0.4 3.1 44.8 51.0 0.887 1 11 H
SN6-Odour 0.4 1.2 5.6 37.7 54.8 0.886 2 12 H
SN10-Lighting Effect 1.4 8.9 17.5 33.5 37.8 0.886 2 12 H
SN5-Acoustics 0.7 0.5 5.6 42.2 50.7 0.876 3 17 H
SN1-Aesthetics or Visual density 0.3 1.4 6.0 46.0 46.0 0.870 4 19 H
SN2-Texture 3.1 10.0 45.2 41.4 0.3 0.839 5 29 H
SN3-Colour 0.3 3.0 12.2 46.0 38.2 0.823 6 31 H

332
SN7-Thickness/Thinness 1.5 8.9 13.3 35.5 40.6 0.806 7 34 H
SN9-Hardness 1.5 8.9 18.9 30.6 39.9 0.790 8 36 H-M
SN8-Glossiness/Fineness 2.6 9.2 18.7 33.1 36.2 0.774 9 37 H-M Source: Analysis of surveyed data, 2013
Table 11: Kaiser-Meyer-Olkin and Bartlett's Test
Kaiser-Meyer-Olkin Measure of Sampling Adequacy. 0.862
Bartlett's Test of Sphericity
Approx. Chi-Square 42121.213
df 1485
Sig. 0.000 Source: Analysis of surveyed data, 2013
333
From Table 10, a total of 15 factors, consisting of 12 site factors, 1 socio-cultural factor, and 2 sensorial factors, were recorded to have “High–Medium” importance levels. Although these 15 variables were in the same importance level category, the “building orientation” factor within the “general/site category” (average RI=0.652) was considered to be the least important variable compared to the factor “Glossiness” under the “sensorial category” (with an average RI=0.774), and “material availability” still under the “general/site category” (with an average RI=0.795). However, it should be noted that site factor account for 75% in the “High-Medium” importance level. The result is an example of evidence pointing to the trend that environmental and perhaps site issues are no longer considered as the most important factors in the choice of materials for housing projects, especially within the context of the emerging economies. Some factors in the three categories were ranked relatively higher in the “High– Medium” level. For example, “material availability (GS1)” was rated as first in the general/site subcategory, but ranked thirty-fifth in the overall ranking with an RI value of 0.795. An interesting observation from the results shown in Table 10 is that none of the criteria fell under the medium and other lower importance level. This clearly shows how important the factors are to building designers in evaluating LCGBMCs. All factors were rated with “High” or “High– Medium” importance levels. The findings of the analysis suggest that the criteria with low RI do not mean they are not important for selecting materials, but rather created an opportunity to highlight the relative importance of criteria from their vantage point.
Factor analysis for Sub-Categorical Factors
Given that the reliability test proved to be consistent in the measuring instrument as proven by the Cronbach’s alpha score of 0.781 (following the results in Table 9), a factor analysis was performed using SPSS v.20 to determine the optimal number of the factors that were retainable, and identify the unobserved variables within each category. According to Hutcheson & Sofroniou (1999, p.224-225), a KMO value is regarded as ideal if it falls within the range of 0.7 and above. They argued that values closer to 1 indicate that patterns of correlation are relatively compact and therefore, should yield reliable factors that are able to assess decisions in the selection of LCGBMCs.

334
They note that values between 0.5-0.7 are mediocre, values between 0.7- 0.8 are good, values between 0.8- 0.9 are excellent and values above 0.9 are superb. They further argued that for factor analysis to produce efficient results there must be strong and close relationships between variables, and the test analysis must exhibit a significant value of p<0.05. The following sections present the results of the factor analysis for the various categories of the material-selection factors.
General/Site Category
For the “General/Site” category, the analysis results showed a Kaiser– Meyer–Olkin’s (KMO) measure of sampling adequacy score of 0.883 falling within the range of 0.8-0.9. Therefore, the value of 0.883 suggests that the sample was excellent for factor analysis, as recommended by Hutcheson & Sofroniou (1999, p.224-225). The Bartlett Test of Sphericity was 1468.871 and the associated significance level of 0.000 (p<0.001), indicated that the test was highly significant and that the population correlation matrix was not an identity matrix. Both tests showed that the obtained data in the general/site category supported the use of factor analysis, which was grouped into smaller sets of underlying factors. Using maximum likelihood analysis, the factor analysis extracted two latent factors under general/site category, namely Factor GS11: building orientation; and Factor GS12: Spatial scale. The two variables accounted for 55.6% of the total variance. The rotated factor-loading matrix results based on the direct oblimin rotation for the two latent factors are shown in Table 12, and Appendix F.
Table 12: Factor loadings for general-site factors after direct oblimin rotation
Observed general/site variable Latent general/site factors 1 2
GS11: Building Orientation 0.997 GS12 Spatial Scale: Building Size and Mass 0.623 GS7: The Type of Building Material(s) 0.816 GS2: Material Availability 0.809 GS4: Building Regulation and Certification for Use 0.721 GS9: Knowledge Base in Construction 0.699 GS5: Design Concept 0.683 GS6: The Type(s) of Natural Disasters Common to the Site 0.666
GS8: Project Site Geometry/Setting/Condition 0.538 GS3: Distance 0.533 GS10: Building and Space Usage 0.530 GS1: Geographic Location of Building Site 0.518 Eigenvalues 3.766 2.904 Percentage of variance (%) 31.379 24.203
Cumulative of variance (%) 31.379 55.582

335
The pattern matrix shown in table 12 identifies the relationship between the observed variables and the latent factors. The higher the absolute value of the loading, the more the latent factor contributes to the observed variable. Small factor loadings with absolute values less than 0.3 were suppressed to help simplify Table 12. Further interpretation(s) thus conceptualised the two latent factors under the general/site category as: 1= “building spatial analysis” and 2= “site suitability” since they both, relate to the site dimension.
Environmental/Health Category
The analysis performed on the Environmental/Health category produced a KMO measure of sampling adequacy test score of (0.867) and Bartlett's Sphericity of (1027.062), with an associated significant score of (p=0.000). The results indicated that factor analysis was also appropriate for this category. However, only one factor under environmental/health category was extracted from the factor analysis using both the scree plot diagram and the total variance table in Appendix F. The percentage of variance attributable to each factor and the cumulative variance values are shown in Table 13 and Appendix F. From Table 13, it can be seen that only one factor -EH4 accounted for 60.2% of the total variance of the seven environmental criteria.
Table 13: Factor loadings for environmental/health factors after direct oblimin rotation
Observed environmental/health variable Latent environmental/health factors
1 2 EH4: Habitat Disruption: Ozone Depletion Potential 0.851 EH7: Material Environmental Impact 0.836 EH3: Safety and Health of End-users 0.829 EH6: The Climatic Condition of the Region 0.801 EH2: Level of Carbon Emissions and Toxicity 0.787 EH5: The Amount of Pesticide Treatment Required 0.736 EH1: Environmental Statutory Compliance 0.549 Eigenvalues 4.215 - Percentage of variance (%) 60.217 - Cumulative of variance (%) 60.217 -
Source: Analysis of surveyed data, 2013
Economic/Cost Category
In the economic/cost category, the results for the factor analysis showed that the KMO measure was 0.794 and the Bartlett's test (p=0.000), indicating that the factor analysis was also appropriate in identifying the underlying structure of the economic category.

336
This means that the test is highly significant and that the population correlation matrix was not an identity matrix. The results of the analysis are presented in Table 14. Just one factor named Factor C4: Maintenance and replacement cost was extracted, explaining 61.1% of the total variance.
Table 14: Factor loadings for economic/cost factors after direct oblimin
rotation
Observed economic/cost variable Latent economic/cost factors
1 2 C4: Maintenance or Replacement Cost 0.938 C5: Labour or Installation Cost 0.861
C3: Capital Cost 0.793
C1: Life Cycle Cost 0.714
C2: Material Embodied Energy Cost 0.544
Eigenvalues 3.054 - Percentage of variance (%) 61.078 - Cumulative of variance 61.078 -
Source: Analysis of surveyed data, 2013
Socio-Cultural Category
Similarly, the results for the exploratory or common factor analysis in the social category produced a KMO measure of 0.831 and a Bartlett's test of Sphericity value of 626.700, indicating that the test is highly significant and that the population correlation matrix was not an identity matrix. A significant value of (p=0.000) indicated that factor analysis was also suitable in identifying the underlying structure of the factors within the socio-cultural category. However, both the scree plot diagram and the total variance table in Appendix F, only one factor (factor SC2: material compatibility with regional settings) was extracted, explaining 51.5% of the total variance of the six socio-cultural criteria The results of the analysis are presented in Table 15 and an extension in Appendix F.
Table 15: Factor loadings for socio-cultural factors after direct oblimin rotation
Observed socio-cultural variable Latent socio-cultural factor
1 SC2: Material Compatibility with Regional Settings 0.913 SC3: Cultural Restriction(s) on Usury 0.833 SC1: Material Compatibility with Cultural Traditions 0.826 SC6: Material Compatibility with Cultural Traditions 0.695 SC5: Local Knowledge of the Custom & Lifestyle 0.505
SC4: Family Structure: Type & Size of Family Unit 0.378 Eigenvalues 3.090 Percentage of variance (%) 51.498 Cumulative of variance (%) 51.498
Source: Analysis of surveyed data, 2013

337
Technical Category
For the technical category, the results for the factor analysis showed a KMO measure of 0.902 and the Bartlett's test of Sphericity value of 2848.547, with significant p value=0.000, indicating that the test was highly significant and that the population correlation matrix was not an identity matrix. This indicated that the factor analysis was also appropriate in identifying the underlying structure of the technical category. Three factors under technical category, namely Factor T9: Resistance to moisture; Factor T11: Resistance to weather; and Factor T7: Resistance to fire were extracted from the factor analysis, explaining 67.8% of the total variance after rotation. The three groups of factors 1, 2 and 3 were conceptualised as “Performance”, “Efficiency”, and “Specialty” respectively. The results of the analysis are presented in Table 16, and in Appendix F.
Table 16: Factor loadings for technical factors after direct oblimin rotation
Observed technical variable Latent technical factor 1 2 3
T9: Resistance to Moisture 0.946 T11: Resistance to Weather 0.856 T7: Resistance to Fire 0.851 T8: Resistance to Heat 0.812 T5: Availability of the Technical Skills 0.655 T3: Level of Maintenance Requirement 0.589 T15: Life Expectancy 0.530 . T12: Resistance to Chemicals 0.875 T10: Resistance to Scratch 0.741 T14: Weight and Mass of the Material 0.528 T13: Resistance to Decay 0.487 T2: Ease to Remove and Reaffix 0.779 T4: Ability to Tolerate Expansion and Contraction 0.462 T6: Ease and Speed of Method fixing 0.456 T1: Recyclability and Reusability 0.448 Eigenvalues 8.561 0.877 0.737 Percentage of variance (%) 57.073 5.849 4.916 Cumulative of variance (%) 57.073 62.921 67.837
Source: Analysis of surveyed data, 2013
Sensorial Category
In the sensorial category, the results for the exploratory factor analysis showed a KMO measure of 0.891 and Bartlett's test of Sphericity score of 1705.393, with a significant value of (p=0.000), which revealed that the factors were appropriate. Two factors- Factor SN5: Acoustics and Factor SN4: Temperature were extracted, both accounting for 66.19% of the total variance. SN5, SN4, SN6, SN2, SN3, and SN1, constituted the first factor group. The study conceptualised this factor group as “Receptive/Emotive” and SN9, SN8, SN7, and SN10 constituted the second factor and this was conceptualized as “Intrinsic/Sensitivity qualities of a product”. Along with rotated factor-loading matrix, the percentage of variance attributable to each factor and the cumulative variance values are shown in Table 17, with an extended version in Appendix F.

338
Table 17: Factor loadings for sensorial factors after direct oblimin rotation
Observed sensorial variable Latent sensorial factor 1 2
SN5: Acoustics 1.000 SN4: Temperature 0.965 SN6: Odour 0.775 . SN2: Texture 0.596 SN3: Colour 0.453 . SN1: Aesthetics or Visual density 0.442 SN9: Hardness 0.935 SN8: Glossiness/Fineness 0.891 SN7: Thickness/Thinness 0.801 SN10: Lighting Effect 0.223 Eigenvalues 5.834 0.785 Percentage of variance (%) 58.336 7.853 Cumulative of variance (%) 58.336 66.189
Source: Analysis of surveyed data, 2013
In summary, a total of ten latent factors resulting from the overall analysis were extracted to present the underlying structure of the variables used for selecting LCGBMCs for building projects, at the design stage. Two factors were identified under the general/site category; one factor under the environmental/health category; one factor each for both the economic and socio-cultural categories; three factors for the Technical dimension, and two factors for the sensorial group. However, as Kline (2002) argued, factors with loadings of 0.30 or higher were considered significant, or at least salient in this study, so that the model constituted of all those variables that had factor loadings greater than or equal to 0.3 after rotation. Although the factor “Lighting Effect” was included as part of the decision selection factors, the value 0.223 showed that its impact on the material selection decision-making process is not as effective or salient as the other factors. The results of the analysis showed that the identified decision criteria,, and the sub-criteria could be used ideally as a checklist by house building organisations for the selection of LCGBMCs.
General View on Low-Cost Green Building Materials
The final set of questions bordered on issues associated with the integration of the proposed material selection decision support tool in design practice, aiming to give participants the opportunity to share or clarify their views regarding the proposed MSDSS model. The following sections present full analyses of respondents’ view(s) of the final set of questions.

339
Measures to Facilitate Mass use of LCGBMCs in Housing
The literature review conducted in chapter 2 identified some potential measures that could be undertaken to encourage greater industry acceptance of LCGBMCs. Respondents were asked to rank on a 10-point scale from (1) “least relevant” to (10) “extremely relevant”, the level of relevance of each measure as it will influence or facilitate greater use of LCGBMCs in mainstream housing. The importance accorded to “Provision of readily available information relating to LCGBMCs” was rated highest with a relative index of (RI=0.929). “Subsidising LCGBMCs” followed with a relative index score of (RI=0.888). “Government’s adequate funding of research to boost production and wide-scale use” ranked third with a relative index of (RI=0.874). “Setting up workshops to spread awareness to building professionals & clients of their potential economic, environmental and health benefits” placed fourth on the list (RI=0.857), while “Strong mainstreaming initiatives, and effective implementation of policies that encourage their wider scale use” trailing the fifth position with a relative index of (RI=0.839)- all making the top five of the potential measures as shown in Table 18. Figures 7 compares the different preferences of all measures. Summary of the top three potential measures are discussed in their order of importance in the following sections.
Table 18: Potential measures that could influence the wider-scale use of low-cost green materials
Measures Relative Index (RI)
Rank
M1: Provision of Adequate Information on Low-Cost Green Materials
0.929 1
M10: Adequate Research Funding 0.888 2
M2: Subsidising Low-Cost Green Building Materials
0.874 3
M5: Setting up Workshops to Sensitise Building Professionals & Clients
0.857 4
M6: Effective Implementation of Policies 0.839 5
M7: Stringent Measures for Corruption in the Construction Industry
0.787 6
M9: Import Restriction of Foreign Building Materials
0.751 7
M4: Stringent Building Regulation Standards 0.741 8
M8: Diversification of Production Technology 0.591 9
M3: Use of Highly Mechanised Production System
0.515 10
Source: Analysis of surveyed data, 2013

340
Figure 7. Potential measures that influence the wider-scale use of low-cost green materials
0.515 0.591
0.741 0.751 0.787
0.839 0.857 0.874 0.888
0.929
0
0.1
0.2
0.3
0.4
0.5
0.6
0.7
0.8
0.9
1
Use
of
Hig
hly
Mec
hani
zed
Prod
uctio
n Sy
stem
Div
ersi
ficat
ion
and
dece
ntra
lizat
ion
of p
rodu
ctio
n te
chno
logi
es
Strin
gent
Bui
ldin
g R
egul
atio
n
Impo
rt R
estri
ctio
n of
Impo
rted
or F
orei
gn M
ater
ials
Strin
gent
Mea
sure
s and
Pen
altie
s for
Cor
rupt
ion
in th
e C
onst
ruct
ion
Indu
stry
Effe
ctiv
e Im
plem
enta
tion
of P
olic
ies
Wor
ksho
ps to
Sen
sitis
e B
uild
ing
Prof
essi
onal
s and
Clie
nts o
n th
e B
enef
its o
f Low
-Cos
t Gre
en M
ater
ials
Subs
idis
ing
low
-cos
t gre
en b
uild
ing
mat
eria
ls
Ade
quat
e Fu
ndin
g of
Res
earc
h to
Boo
st P
rodu
ctio
n
Prov
isio
n of
Ade
quat
e In
form
atio
n on
Low
-Cos
t Gre
en M
ater
ials
M3 M8 M4 M9 M7 M6 M5 M2 M10 M1
Relative Ranking Index
Potential Measures
Measures in Facilitating Greater Use of Low-Cost Green Materials

341
Provision of well-informed information on low-cost green materials
In the question about the suggestive measures that could be undertaken to encourage greater use of LCGBMCs, a consensus of the respondents agreed that provision of readily available information was the most critical of the ten factors listed with a relative index of 0.929 (see Table 18). The survey revealed that the documentation and dissemination of information have high influence on the availability of information, hence, the adequacy of professional knowledge on best practices relating to their social, economic and environmental impacts. The results obtained from this analysis are consistent with previous empirical findings by Nwokoro and Onukwube (2011), who stated that regulatory pressures on the use of such materials are associated with both the availability of sustainable information, and firms’ decisions to implement sustainability principles.
Government’s adequate funding of research to encourage wider-scale use
The results of the analysis reported that the limited availability of reliable information was strongly influenced by the lack of investment in research and development (R&D), which ranked second with a relative index of 0.888. About half the respondents acknowledged the contribution of R&D to the transference of new information and technologies, as plenty of proven choice of alternative and massively abundant LCGBMCs are yet to be tapped. The majority of respondents note that currently the Nigerian housing sector does not have a physical development plan that supports longitudinal research on LCGBMCs. They suggest that appropriate building material and technology programmes mandated to enforce research schemes might help to educate the government on the viability and effectiveness of funding research on alternative cost and energy-efficient materials. They recommend that the Ministry of Housing could potentially explore a variety of LCGBMCs options that are yet to be tapped through this means. The findings of the survey supports Oluwakiyesi’s (2011) view, which acknowledged that the long delays in implementing research schemes have significantly affected housing developers looking to introduce new and cost effective building materials and technology. He noted that the research incentives introduced in by the government in 2007 to encourage their production capacity are still the only means by which the government could encourage progressive research on such products.

342
Subsidising low-cost green building materials and components
While the adequacy of informed data (0.929) and funding of research and development programmes (0.888) topped the list, quite a number of the respondents also emphasised the benefits of subsidising LCGBMCs, which ranked third with an RI of 0.874. The survey results indicate that social acceptability of alternative LCGBMCs particularly centres on the rate at which they are subsidised. Respondents suggested that full subsidies and credit guarantee programmes and the promotion of alternative construction materials could deliver cheaper housing. They stressed that subsidising LCGBMCs to private developers could be one of the government's ways of facilitating the provision of affordable housing, considering that the provision of housing is mostly undertaken by private sectors. They advise that government should grant subsidy to the industries manufacturing such local building materials until the society develops enough taste for such product to stimulate substantial demand. One respondent notes; “Subsidizing LCGBMCs would take into account the adequacy of household income, as low-income earners are able to pay for affordable materials”. Along with the agreement of respondents on the role of subsidies in LCGBMCs development, Nwafor (2006) also observed that clients and developers around the fast growing urban areas in Nigeria face a number of barriers that prevent them from being able to deliver affordable housing, some of which were the relatively high cost of building materials, and restrictive regulations that limit the use of alternative cheaper cost and energy efficient building materials. In their study, “Acquisition of Technological Capability in Africa”, Oruwari et al. (2002) suggest that subsidizing LCGBMCs could create an enabling environment, particularly for the low-income groups, through partnerships and participation by all key actors. They add that this initiative has been known to be responsible for reducing housing cost in other developing regions like South Africa (Aluko, 2002; Akinlusi, 2007).

343
Views on the Proposed MSDSS Model
The last question consisted of both closed and open-ended questions aimed at giving participants the opportunity to share their general views regarding the proposed MSDSS model. The final question which suggests for further improvement of the proposed system, showed contradictory priorities for each group of design and building professionals. Scoring a record high of 30% as respondents’ first preference is the confidence to create real low-impact green design that considers the social, economic and environmental implications of the various material alternatives with the information provided in the system. This choice is in line with Holms and Donn’s study in which they confirm that many design and building professionals doubt the ability of decision support systems to create real green designs based on the information in the database (Donn, 2001; p.128). The second priority (with a percentage score of 25%) was the ability of the system to provide accurate and reality like results followed by (15%) the ability to provide validated performance measures. The ability to calibrate the uncertainty (10%) and the high resolution of decision support model (5%) were the least important criteria. Another important criterion (15%) was the ability to provide validated performance measures to support effective design decision trade-offs in the choice of such materials at the early stages. In this context, accuracy of material assessment results was not as important to some respondents as much as understanding the relative effect on material performance due to changes in design decision of material alternatives. This finding also suggested that the accuracy of the decision support model should be adaptive and adjustable to the user type and design phases, to correspond to the different needs of the designer as well as other potential users.
Other participants concentrated more on the operability of the system, some of which include: • Allowing debugging; • Error-checking to ensure models are correct; • User friendliness; • Easy searchable material selection inputs database; • Ability to add/remove material selection features with ease;

344
• Ability to make custom reports; • Ability to easily navigate all components with ease; • Assisting decision making process through guidance • Comprehensive “HELP or USER INSTRUCTIONS” menu explaining what the tool is doing; • Being able to understand the material selection process through the lens of non experts; • Must be built on an underlying database to aid in benchmarking; • Ability to perform trade-off analysis to compare different material options; • Clarity on the algorithms used to perform the simulations and the limitations of those algorithms; and, • Having a huge amount of customizability in terms of output. This question also revealed another important finding, showing contradictory priorities for each group. Architects, designers, and Specifiers first preference was the confidence to create real low-cost green/sustainable design. They suggest developing software that corresponds to all design stages. There was on the other hand an agreement between engineers and software programmers. Engineers ranked the accuracy of tools and ability to simulate complex design elements in the first place. The second most important criterion was the friendliness of interface mainly on issues relating to usability and information management followed by the ability of the tool to integrate intelligent design knowledge-base to assist designers in decision making. There is no doubt that engineers and programmers require adaptive and friendly interfaces and are looking for tools that can assist the decision, taking whether for code compliance or optimization issues. They clearly identified the quality control of simulation input as another important feature. This is not surprising since the issue of attaining quality assurance of simulation input has been repeatedly highlighted in various literatures (such as Donn 2001; Augenbroe 2002 and Reinhart 2009).

345
Analysis of the Interviews
The purpose of the one-on-one interview was to achieve the qualitative part of objectives 1, 2 and 3 as listed in chapter one of the study. Ten interviews were conducted with construction sector policy makers who influence material choice decisions in the Nigerian housing construction industry from the period May 2013 to August 2013. The interviewees were drawn from a range of design firms, institutions and construction sector. The cross sectional convenience sampling method was adopted as the sampling technique, since this study did not have the resources and time to interview larger groups (see section 4.5.2.12 in chapter 4). The following sections summarise the scope of the interview findings.
Interview Procedures
The interviews were typically between one and two hours in length. Whenever possible the interviewees were recorded and fully transcribed to allow for subsequent analysis and the coding of emergent themes. The face-to-face interviews were recorded using a digital Dictaphone to ensure accuracy and no loss of understanding whilst the telephone interviews were carried out using Skype Voip software (Microsoft, 2013b), However, 8 of the 10 interviewees were uncomfortable with being recorded and in these cases the subsequent analysis relied on handwritten notes. The credibility of the summary analysis presented below has subsequently been validated by a series of focus groups involving industry practitioners. Transcription Techniques Ten interviews were conducted with construction sector policy makers who influence material choice decisions in the Nigerian housing construction industry from the period May 2013 to August 2013. The interviewees were drawn from a range of design firms, institutions and construction sector. Full transcriptions were created for both the interview scoping study and the company studies. It is important to ensure that the data is collected in a reliable manner, for example, when transcribing interviews the placement of grammar according to pauses can mean something different as sentences can have different interpretations. For easy identification and evaluation, the transcriptions were put into the Nvivo software (QSR International, 2012) as individual sources. The use of Nvivo enabled flexibility to amend the structure and clustering of codes whilst also allowing for fast retrieval of statements relating to codes. The researcher created a rule set for transcribing based on a similar list given by (Macnaghten and Myers, 2010):

346
-Repeated words were ignored -Pauses were indicated with -Emotional expressions were placed in brackets, e.g. (laughing) - Ensure transcriptions are readable Scope of the Interviews
The essence of conducting interviews was to:
• Investigate the extant of the problems associated with the limited use of LCGBMCs in the Nigerian housing industry;
• Identify proactive measures that could be undertaken to encourage greater industry acceptance of such materials in mainstream housing;
• Examine knowledge of the current trend in the use of design and decision
support tools; and
• Identify sustainable material selection information requirements of the practitioners towards the development of the proposed model that will suit their decision- making process.
The in-depth interviews were of the format recommended by Mason (2002), where questions were simplified into semi-formal questions (see Appendix E). There were a total of ten semi-formal questions towards achieving the goals listed above as well as to qualitatively address objectives 1, 2, and 3 of chapter one.
Profile of Interviewees
The interview sessions, which were held on different occasions, consisted of ten (10) interested building professionals in academia and practitioners with diverse qualifications and years of experience. The criterion for their selection was based on whether they had designed or supervised the development of sustainable low-impact housing projects using LCGBMCs in Nigeria. Details of their profiles and years of experience as derived from the interview questions are detailed as follows:

347
• Interviewee ‘A’ is a registered design and build project architect in practice with fifteen years of experience and a wide knowledge of different aspects associated with low-cost housing. • Interviewee ‘B’ is a designer in practice with twenty years of experience and a wide knowledge of different areas of low-cost housing issues in Nigeria. • Interviewee ‘C’ is a registered urban designer in academia with ten years of experience and vast knowledge in reduced cost housing projects. • Interviewee ‘D’ is a quantity surveyor eight years of experience in academia now in practice. • Interviewee ‘E’ is an accredited building engineer with over thirty years of experience in practice using low-cost green materials in housing construction. • Interviewee ‘F’ is a registered practicing architect with twenty- five years of experience in sustainable housing design. • Interviewee ‘G’ is an enthusiast in design and construction with strong ideas and innovation and information technology in housing construction that has five years of experience. • Interviewee ‘H’ is a builder with a record of past sustainable housing projects that has twelve years of experience. • Interviewee ‘I’ is a material analyst of ten years experience working on residential building projects. • Interviewee ‘J’ is a practicing developer and project consultant of fifteen years experience that have handled several residential housing projects.

348
Factors limiting the wider-use of low-cost green building materials
The question in relation to the theme above was directed to all the interviewees. Analysis was undertaken to identify the problems that significantly hinder the wider use of LCGBMCs in the housing industry. Lack of an informed system to assess current information associated with LCGBMCs; codes, and standards not supporting the appropriate use of LCGBMCs and Social perception and preference of clients and users, were all recognised by interviewees ‘A’, ‘B’, ‘C’, ‘E’ ‘F’, ‘G’, ‘H’, ‘I’ and ‘J’ as the three most critical factors that limit the use of LCGBMCs in the housing construction industry. Interviewee ‘A’ noted; “Primary data remain the only possible way for investigating the problems of wider use of LCGBMCs in the Nigerian housing sector”. I think the best option would be to develop a system that will help provide designers material information associated with LCGBMCs, to enable them analyse and understand the impacts and performance standard of the materials at the design stage before they are used for construction”. Interviewee ‘E’ ‘F’ and ‘G’ all agreed that lack of standard, codes, performance measures and development indicators for such products; clients’ notion about the commercial viability of the project outcome; and low technological development dominated the list of the problems related to the use of LCGBMCs in housing construction. Interviewee ‘E’ added; “one of the key barriers is perhaps understanding the data associated with their impacts”. This was followed by interviewees ‘C’, ‘H’, ‘I’, and ‘J’ who identified other factors including: domination of foreign or imported conventional building materials in the market; nature of the contractual documents; inadequate capacity and inefficiency in the Building Material Industry (BMI); Corruption; Bureaucracy and administrative red tape; Rigid adherence to inappropriate management techniques and practices; Absence, underdevelopment, and weakness of institutions (legal, administrative, planning, financial, and professional institutions); Scarcity and shortage in the supply of BMs; and Shortage of plants, machinery, equipment, and spares. Interviewee ‘C’ suggested; “‘More money should be spent on making the prototype housing models more appealing and technically sound, so that if clients are willing to pay for houses made from LCGBMCs, then it would be very easy to convince them’.

349
He identified availability of skills to install such materials; confidence and competence of the artisans; designers’ orientation, and unwillingness to change, as some of the factors he thinks are key obstacles to their wider use.
Interviewee ‘H’ also pointed out that Advocacy, planning Education, and public participation, all at inception give opportunity for active participation and to carry along all involved. He states; “It is mainly the issue of development, lack of awareness of the comparative advantage and the unwillingness on the part of government to provide policy on low-cost green technology”.
Interviewee ‘J’ who has been a property developer for over fifteen (15) years had a different view to this question. He noted; “Developers, owners and users are reluctant to expose themselves to the risk of applying new materials and technologies due to the poor sample models of existing prototypes”. He added; “Clients have veto power. The degree to which they use or accept to use such products largely depends on the factors I earlier mentioned and principally on clients self-perception”. Interviewees ‘A’, ‘B’, ‘C’, ‘D’ ‘G’, ‘H’, and ‘J’ admitted that most clients and even designers believe that local materials are associated with poverty and low socio-cultural status. One of the interviewees noted; “The problems of using LBMs are not attributed to the durability of those materials. They are, in the first place, attributed to other factors such as status, which impede the use of appropriate materials and technologies”. Interviewee ‘I’, who has once been a project manager, admitted that he has always been discouraged by the low quality of the local BMs and products in the market. He emphasised, “In the case of Nigeria and perhaps in some other African countries, the introduction of low-cost green building technologies has to come in as a substitute of the conventional materials, as the population is not very prepared to dare into the unknown. With the conventional systems, which are concrete based, the actual quality of the materials is much lower than the conventional products as per the norms, but the buildings somehow stand on their feet. With the earth brick technologies for example, diverting as much as 10-15% from the norms yields very poor results”. He added; “We need to change our attitude to this especially in Nigeria and Africa as a whole”.
All these obstacles agree favorably with the results of the surveyed questionnaire.

350
Measures to promote greater industry acceptance in mainstream housing
In a follow up question, interviewees were asked to identify proactive measures that would be most crucial in facilitating greater demand for LCGBMCs in the housing construction. All groups of interviewees identified “the provision of readily available information” as the most crucial of all initiatives needed to facilitate the sustainable use of LCGBMCs. A common knowledge that all groups considered “the provision of readily available data” as the most important issue perhaps indicates a huge gap between the production and implementation of such products, since designers do not posses sufficient knowledge to make informed choices during the design process.
Interviewee ‘B’ noted; “A better understanding of the impacts of these materials and their innate characteristics, will help designers to fully overcome their shortcomings and perhaps identify ways to use them with confidence. I think this could be achieved, by applying new knowledge and techniques”. An explanation to this might be that building practitioners are more involved with understanding the impacts of these materials and the ability to access quick energy analysis data of such products to support the decision-making process than the machineries needed for their production. This may be because design and building professionals are more particular about the early design phases and therefore, need guidance to answer “what if” scenarios that can assist them in the material selection and design optimisation processes. The next priority was “Government’s adequate funding of research to boost production capacity”. Most of the interviewees agreed that the underdevelopment of the research sectors within the socio-economic context in Nigeria is an important contributory factor to the problems of low patronage. They added that investment in training, education and research is crucial to the development of the LCGBMCs industry. Interviewees ‘A’, ‘B’, ‘H’, ‘I’ and ‘J’ suggested that research studies should be undertaken to assess the possibility of introducing innovative materials, improving conventional ones and substituting some of expensive and imported materials by available low cost indigenous materials. They added that formidable research and development (R&D) facilities and programs could encourage innovation and create knowledge dissemination channels in the Nigerian housing industry.

351
Interviewee ‘J’ note: “there is hardly any known scientific research into these materials to enhance durability, quality, and use hence, making them 'OBSOLETE'”. He notes that most clients want typical designs and products of the developed world replicated, stressing high level of ignorance as the root cause. Interviewees ‘C’ commented; “Most importantly, government agencies must be seen as encouraging research in their institutes through regular, adequate and prompt release of research grants”. Interviewees ‘A’, ‘B’, ‘C’, ‘D’, ‘E’ ‘F’, ‘G’, and ‘H’, emphasised the need for integrated and/or collaborative research between different universities, institutions and organizations to improve the dissemination of the results of researches on such materials no matter how good and valid or poor the results may be. They suggest that government need to have independent and profit-oriented research and production technology organizations that are solely responsible for producing proto-type simple spare parts from local raw materials for industrial use.
Followed closely was “setting up workshops to spread awareness to building professionals and clients of their potential economic, environmental and health benefits”. Interviewees all suggest that organising workshops and initiation of training programs could help both designers and clients to share knowledge about successful and appropriate technologies for the development of LCGBMCs, and popularize their use. Interviewees ‘A’, ‘B’, ‘C’, all agreed with interviewee ‘F’ that improving the efficiency of industry-wide quality assurance systems and/or thorough review of laws, legislations and regulatory instruments governing corrupt practices in the housing industry could help to eliminate such intentions. Among all measures listed to facilitate the wider use of LCGBMCs in housing development, the strongest positive correlation was observed between the lack of accurate informed data associated with the use of LCGBMCs and poor linkage between research and practice. The application of inappropriate conventional building materials and technologies was attributed to limited variety of local materials and inappropriateness and rigidity of regulations, codes, and standards. Lack of development and poor quality of locally produced materials was associated with lack of government strategies. Lack of government’s fund and policies was linked to lack of awareness, lack of technological infrastructure, lack of professional bodies for screening and diffusion of technologies, and incapability to innovate and benefit from IT. The ineffectiveness of technology diffusion networks was attributed to investment in training, education and research, and poor linkage between research and application/development.

352
Existing material selection methods In the questions related to the sources of information, most interviewees identified non-availability of readily sourced, reliable and accurate information as a potential cause of the low use in mainstream. Interviewee ‘G’ noted; “The available material selection methods in Nigeria is only erratic, and unsystematic and therefore a more competent and reliable system is required. An informed support system that is capable of checking for current and emerging information will be an advantage. By evaluating multiple alternatives simultaneously designers would be able to make informed and sustainable decisions”. Interviewee ‘C’, remarked; “I think a more realistic methodology is needed. Evolving such method would help ease the decision-making process. Such system could be made in form of either a check or decision matrix”. She further notes; “Choice of technology should follow pre-specified criteria to help determine the most appropriate system to transfer, adopt and apply”. Interviewee ‘B’ stated; “Most of the known or available systems are case based support systems, not really a full software. Designers tend to use information available through material manufacturers manual as guide at the design stage. I think that for some professionals and lay people developing such a kit could help them sort through various options of LCGBMCs and make better design choices”. Interviewee ‘F’ shared similar view noting; “To the best of my knowledge there are no assessment systems or guidelines in Nigeria and this is a major limiting factor to the selection of such materials. The idea to apply such materials is useful but there is not enough data to produce reliable prediction of materials. There is the need for in depth catalogue of these materials to be properly documented to serve as reference to material selection, so that designers are able to analyse and understand the impacts and performance standard of the materials at the design stage before they are tendered in the contract document”. The views of the interviewees were consistent with that of the respondents in the surveyed questionnaire.

353
Sustainable material selection data requirements for the proposed model In the question to suggest their views about the information needed in the MSDSS model to aid sustainable material selection, the following were acknowledged as matters of importance that ought to be considered:
• Minimal details to avoid complications in the evaluation process • Approximation and flexibility; • Low input to avoid hampering creativity and design thinking; • Quick output in a language understood by designers. • Precision in specification; • Higher level of accuracy of the output data; • Higher level of detail input required; • Ability to produce ‘Realistic’ outputs.
Interviewee ‘A’ ‘C’, ‘E’, ‘G’, ‘H’, ‘I’ and ‘J’ all stated that such tools should enable the designers using it to understand it much better, so that designers are able to understand the impacts of each material alternative. Interviewee ‘B’ stated; “Tools for decision support should be easily accessible to a variety of users and less complex”. Interviewee E noted; “ It will be good to have a tool that enables designers make more informed decisions about the performance requirements of commercially available LCGBMCs starting from when the client writes a brief to the management level, and then to the development stage”. The discussion with the interviewees suggested that the criteria model could help house building organisations mainly in the following aspects:
• Structure the thinking of selecting appropriate building product for specific projects.
• Clarify the value management importance of each product. • Provide a checklist of collecting „what‟ information from „where‟
and by „whom‟. • Present a framework for measuring the performance of offsite
technologies.
The interviewees also provided some extra factors for consideration and/or amendments to the hierarchy according to the practices of their companies. This enriches the practicality of the criteria model and expands further the coverage of the decision-making factors. Some of the extra factors provided are actually covered by other existing criteria in the model, but some supplement the original thinking and, thus, were taken on board for refining the model

354
Summary
This section of the study has evaluated the data collected on a wider scale to fulfill the quantitative and qualitative parts of objectives 1 and 2 as well as 3 and 4 in chapter 1. The questionnaire was aimed at eliciting information on current practices in low-impact green energy design and housing construction in the Nigerian housing industry, particularly as it relates to the informed selection of LCGBMCs. The interview sessions were used to deepen understanding in the areas where both the literature review and scoping studies were unable to establish a clear understanding.
The survey questionnaires were distributed to 480 building and design professionals across Nigeria, receiving an overall response rate of 44%, quite beyond the ideal response rate of 20 – 30%, which is believed to be the norm in construction surveys (Takim et al., 2004), due to the poor and conservative response rate common with housing construction industries. The interviews on the other hand, consisted of ten (10) interested building professionals in academia and practice. Almost 75 per cent of the subjects who represented the architectural practices have over 10 years of experience, with 18 percent having over 20 years. Thus, it is assumed that the wealth of architectural experience held by individuals in this study is such that the data they have provided can be recognised as credible. The analyses of both the surveyed questionnaire and interviews highlighted drivers and obstacles that limit the use of LCGBMCs in the Nigerian housing sector. It identified principal sustainability principle indicators (decision factors) for modeling the decision-making process. The results of the analyzed data revealed that the limited use of LCGBMCs is encapsulated in issues of availability, and appropriateness of a reliable information storehouse. It also revealed that current material assessment tools are undermined by usage issues such as lack of familiarity, absence of appropriate informed information relating to the use of LCGBMCs, incompatibility, context specificity, and lack of clear and simple assessment procedures. The results of statistical analysis suggested a favourable condition to develop a material selection decision support system aimed at improving the sharing of informed knowledge associated with the use of LCGBMCs (as shown in chapter 5), in order to assist design and building professionals during material selection at the various stages of the design process.

355
Appendix H: Proposed Analytical Technique for the MSDSS
The computational assessment procedure used in this study follows that of the AHP technique as mentioned in section 5.5 of chapter 5. Evaluating different material alternatives using the AHP numerical analysis involves three main steps. The process steps include: (i) Determining the relevant applicable criteria and alternative material options in the form of a hierarchy of objectives. The hierarchy is structured on different levels: from the top (i.e. the goal) through intermediate levels (criteria and sub-criteria on which subsequent levels depend) to the lowest level (i.e. the alternatives); (ii) Assigning numerical values (i.e., weights) to measure the relative importance of these criteria for a given material alternative. For this purpose, AHP uses simple pairwise comparisons to determine weights and ratings so that the analyst can concentrate on just two factors at one time and (iii) Processing the numerical values (i.e., computational analysis) to determine the ranking of material alternative options along the various main sustainability criteria. The following section describes the mathematical/decision model for sustainable material assessment and selection.
Mathematical Model Formulation This section formulates the mathematical model for computing the Green Housing Utility Index (GHUI or GUI) using the Analytical hierarchical process. The GHUI is defined as a crisp value that is an aggregated measure of material alternative along various dimensions (of socio-economic, environmental, technical variables). The GHUI utilises the multi-criteria evaluation methods based on discrete problems to investigate a number of choice possibilities in the light of conflicting priorities (Nijkamp et al., 1990). Detailed description of the main steps contained in the model formulation is described as follows.

356
Step 1: Establishment of a structural hierarchy
Constructing the hierarchical structure is the first and most important step in AHP, Saaty (2008) comments that the structure of the hierarchy depends upon the nature or type of design decision. In a typical hierarchy, the alternatives are at the bottom; the next higher level would consist of the factors for judging the material alternatives. The first step sets the problem as a hierarchy, where the top most nodes is the overall objective of the decision, while subsequent nodes at lower levels consists of the factors used in arriving at this decision. The AHP hierarchy for this study is composed of four levels, as illustrated in Figures 1 and 2.
• Level 1 reveals the strategic objective for selecting the most suitable LCGBMCs. • Level 2 consists of the main factors for which the most appropriate material selected depends on. • Level 3 contains the associated sub-factors that are used to measure various material decision choices • Level 4 or the bottom level consists of the alternative LCGBMCs.
Table 1: Legend of the sub-factor
(GS) General /Site Factor
(EH) Environmental /Health Factor
(C) Economic/Cost Factor
(SC) Socio-Cultural Factor
(T) Technical Factor (SN) Sensorial Factor
GS2-Availability GS1-Location GS10-Material Scale GS9-Knowledge Base GS6-Site Geometry GS7-Design Geometry GS4-Certification GS5-Disaster Prone GS12-Spatial Scale GS8-Site Structure GS3-Distance GS11-Building Orientation
EH3-Users’ Safety EH6-Climate EH7-Env-Toxicity EH2-CO2 Emissions EH4-Ozone Depletion EH1- Env. Compliance EH5-Pesticide Treatment EH8-Fossil Depletion EH10-Waste Disposal EH9-Nuclear Waste
C4- Maintenance/ Replacement Cost C5- Labour Cost C1-Life-Ccycle Cost C3-Capital Cost C2-Embodied Energy Cost
SC5-Custom Knowledge SC1-Compatibility (Tradition) SC6-Clients’ Preference Compatibility SC2-Compatibility (Region) SC3-Resistriction on Usury SC4- Family Structure
T15-Life Expectancy T7-Fire Resistance T9-Moisture Resistance T11-Weather Resistance T5-Skills Availability T8-Thermal Resistance T13-Resistance to Decay T3-maintenance Level T6-Speed of Fixing T4-Contraction Tolerance T1-Recyclability T12-Chemical Resistance T2-Ease to remove T14-Weight/Mass T10-Scratch Resistance T16-Renewable T17-UV Resistance T18-Compatibility with other Materials
SN4-Temperature SN6-Odour SN10-Lighting SN5-Acoustics SN1-Aesthetics SN2-Texture SN3-Colour SN7-Thick/Thin SN9-Hardness SN8-Gloss Effect SN11-Structure SN12-Translucence

357
Level 1: Goal Level 2: Factors Level 3: Sub-Factors Level 4: Alternatives
Figure 1. The decision hierarchy for selecting the most appropriate LCGBM
(C) Economic/Cost Factor
(EH) Environmental Factor
(SC) Socio-Cultural Factor
(T) Technical Factor
(SN) Sensorial Factor
(GS) General/Site Factor
GS1 GS2 GS3
GS4
GS5
GS8
GS10
GS7
GS9
GS6
EH1 EH2 EH3
EH4
EH5
EH8
EH10
EH7
EH9
EH6
C1 C2 C3
C4
C5
C6
SC1 SC2 SC3 SC4
SC5
T11
T12 T13
T14
T15
T18
T17
T16
T1 T2 T3
T4
T5
T8
T10
T7
T9
T6
SN1 SN2 SN3
SN4
SN5
SN6 SN7
SN8 SN9
SN10
SN11
SN12
Sel
ecti
ng
the
Mos
t A
pp
rop
riat
e L
ow-C
ost
Gre
en M
ater
ial
Alt
ern
ativ
e A
Alt
ern
ativ
e B
Alt
ern
ativ
e C

358
Step 2A: Pairwise comparisons and computation of the criteria weights
The second step requires pair-wise comparisons to be made between each pair of criteria (of the given level of the hierarchy). After arranging the problem in hierarchical terms, the next step is to determine the relative importance of each criteria and sub-criteria, using a pairwise comparison technique as suggested by Saaty (1986). Comparisons are performed between pairs of elements within each branch of each level of the hierarchy to determine the relative worth of one element as compared with another in relation to the element directly above, using the preference scale shown in Table 2.
Table 2: Comparison scale adapted from (Saaty, 1980)
The pairwise comparisons from each branch at each level of the hierarchy are entered into a matrix and used to determine a vector of priority weights. Only those elements that pertain to a common objective are compared against one another. The following notation applies: wi = weight for attribute i, i=1,..,n where n = number of attributes aij = wi / wj = the result of a pairwise comparison between attribute i as compared to attribute. A = matrix of pairwise comparison values, aij A set of pairwise comparisons can therefore be represented as:
………………………………………………...1.1
where w1/w2 is the importance of attribute 1 as compared to attribute 2. Since the direct result of a pairwise comparison is aij, where a12 is equal to w1/w2, matrix A becomes:
!!! "#"!!
!"#$%&'%()*+,*-#%./0$)+*-/1-%)12%./0$3")"*/1%/4%"5#%.+*"#+*)%,#*65"-%%%!"#$%&'%%'()*()& #+$&,%-./$0& *(&+*$%'%1+*1'/& #$%023& #+$&($4#& 2#$,& *2& #-&5$#$%0*($& #+$&
%$/'#*6$& *0,-%#'(1$& -"& $'1+& 1%*#$%*'& '(5& 27.81%*#$%*'3& 72*()& '& ,'*%9*2$& 1-0,'%*2-(&
#$1+(*:7$&'2&27))$2#$5&.;&<''#;&=>?@ABC&D-0,'%*2-(2&'%$&,$%"-%0$5&.$#9$$(&,'*%2&-"&
$/$0$(#2&9*#+*(&$'1+&.%'(1+&-"&$'1+& /$6$/&-"& #+$&+*$%'%1+;& #-&5$#$%0*($&#+$&%$/'#*6$&
9-%#+& -"& -($& $/$0$(#& '2& 1-0,'%$5&9*#+& '(-#+$%& *(& %$/'#*-(& #-& #+$& $/$0$(#& 5*%$1#/;&
'.-6$C&E-%&$4'0,/$3&'&:7$2#*-(&#+'#&0';&.$&'2F$5&-"&'&5$1*2*-(&0'F$%&*2&GH-9&071+&
0-%$& *0,-%#'(#& *2& *(*#*'/&1-2#& #+'(&5*2,-2'/&1-2#& *(&,%$5*1#*()&#+$& /*"$&1;1/$&1-2#&-"&'&
.7*/5*()& 0'#$%*'/IJ! K+$& 1-0,'%*2-(& *2& 5-($& .;& 7#*/*L*()& '& ,%$"$%$(1$& 21'/$& =<''#;3&
>?@MB&'2&2+-9(&*(&#'./$&NCOC!&
%
K'./$&NC&O&D-0,'%*2-(&21'/$&'5',#$5&"%-0&=<''#;3&>?@MB&P$)%$$&-"&*0,-%#'(1$& P$"*(*#*-(&>& Q:7'/&*0,-%#'(1$&-"&$/$0$(#2&R& S0,-%#'(1$&-"&-($&$/$0$(#&-6$%&'(-#+$%&T& <#%-()&*0,-%#'(1$&-"&-($&$/$0$(#&-6$%&'(-#+$%&N& P$0-(2#%'#$5&-%&6$%;&2#%-()&*0,-%#'(1$&-"&-($&$/$0$(#&
-6$%&'(-#+$%&?& !.2-/7#$&*0,-%#'(1$&-"&-($&$/$0$(#&-6$%&'(-#+$%&O3U3A3@& S(#$%0$5*'#$&6'/7$2&.$#9$$(	-&'5+'1$(#&5$)%$$2&-"&
*0,-%#'(1$&!&
K+$&,'*%9*2$&1-0,'%*2-(2&"%-0&$'1+&.%'(1+&'#&$'1+&/$6$/&-"&#+$&+*$%'%1+;&'%$&$(#$%$5&
*(#-&'&0'#%*4&'(5&72$5&#-&5$#$%0*($&'&6$1#-%&-"&,%*-%*#;&9$*)+#2C&V(/;&#+-2$&$/$0$(#2&
#+'#& ,$%#'*(& #-& '& 1-00-(& -.W$1#*6$& '%$& 1-0,'%$5& ')'*(2#& -($& '(-#+$%C& X%$'F*()& '&
1-0,/$4& 2;2#$0& *(#-& '& 2$#& -"& ,'*%9*2$& 1-0,'%*2-(2& *2& '& 0'W-%& "$'#7%$& -"& !HYC&
Z75)$0$(#2& '%$& -"#$(& $2#'./*2+$5& .;& '(& -,$(& )%-7,& ,%-1$22[& #+$%$"-%$3& 5;('0*1&
5*21722*-(&*2&72$5&"-%&2$##*()&,%*-%*#*$2&.;&07#7'/&')%$$0$(#&'(5&"-%&%$6*2*-(&-"&6*$92&
'0-()&)%-7,&0$0.$%2C&
!!! "#$!!
!"#$%"#&'"#()**)+,-.#-)&/&,)-0#
!"#1#+",.'&#()2#/&&2,3$&"#"4#"154664$#+'"2"#$#1#-$73"2#)(#/&&2,3$&"%#
%"#!"#'#!#&'"#2"%$*&#)(#/#8/,2+,%"#9)78/2,%)-#3"&+""-#/&&2,3$&"#"#/%#9)78/2":#&)#
/&&2,3$&"#&#
;#1#7/&2,<#)(#8/,2+,%"#9)78/2,%)-#=/*$"%4#%"&#
;#%"&#)(#8/,2+,%"#9)78/2,%)-%#9/-#&'"2"()2"#3"#2"82"%"-&":#/%0##
#
#
#
>>>>>>>>66?6@#
#
#
+'"2"#!('!)#,%#&'"#,78)2&/-9"#)(#/&&2,3$&"#(#/%#9)78/2":#&)#/&&2,3$&"#)6#A,-9"#&'"#
:,2"9"%$*&#)(#/#8/,2+,%"#9)78/2,%)-#,%#%"&4#+'"2"#%()#,%#"B$/*#&)#!('!)4#7/&2,<#;#
3"9)7"%0#
#
#
#
>>>>>>>>>>>6?6?#
#
C'"#.)/*#)(#;DE#,%#&)#$-9)="2#&'"#$-:"2*F,-.#%9/*"#)(#82,)2,&F#=/*$"%#!"6#G-#)&'"2#
+)2:%4#.,="-#%"&4#(,-:#&'"#H&2$"I#=/*$"%#)(#!"#/-:#!&6#
################C',%#;#7/&2,<#'/%#%)7"#%8"9,/*#82)8"2&,"%6#J,2%&4#;#,%#)(#2/-K#)-"6#G(#+"#*))K#
/&#"/9'#9)*$7-#)(#;4#+"#'/="0##
!!>>>>>>6?6L#
#
# !5M!5# !5M!N# !5M!-## !NM!5# !NM!N# !NM!-#*1# 6# 6# 6#
## 6# 6# 6#
# !-M!5# !-M!N# !-M!-#
# %((# %()# +# %($## %)(# %))# +# %)$#*1# >
#
>#
>#
>#
# %$(# %$)# +# %$$#
# +5#
#
# +5# # +5#
+5O5# +N# 4+N
O5# +N# 4>4+-
O5# +N#
# >#
# >#
# >#
#
#
;1#
# +-# # +-# # +-#

359
………………………………………………………...1.2 The goal of AHP is to uncover the underlying scale of priority values wi. In other words, given aij, find the “true” values of wi and wj. This A matrix has some special properties. First, A is of rank one. If we look at each column of A, we have:
………………………………...1.3 Each column of A differs only by a multiplicative constant, wi-1. If the A matrix is consistent only one column is required to determine the underlying scale (w1,…,wn). The same evaluation could be undertaken in a row-wise fashion with the same result. Second, if B is x times more important than C, then it follows that C is 1/x times as important as B. In other words, aji is the reciprocal of aij such that aij = 1/aji. This assumes the decision maker is consistent with respect to individual pairwise comparisons and is a fundamental assumption made by the AHP. With this assumption, matrix A is be reduced to:
…………………………………………...1.4
As seen in Equation 1.4, when a criterion is compared with itself each criterion has equal weight. This makes the diagonals equal to unity (i.e. w1/w1 = 1). The entries below the diagonal are reciprocal of those entries above the diagonal. The above reduction means that only n(n-1)/2 pairwise comparisons need to be solicited from decision makers as compared with total entries in the completed A matrix. If the assumption that the decision maker is consistent with respect to individual pairwise comparisons does not
hold, in other words if aij ␣ 1/aji, then; pairwise comparisons would be required.
!!! "#$!!
!"#$%"#&'"#()**)+,-.#-)&/&,)-0#
!"#1#+",.'&#()2#/&&2,3$&"#"4#"154664$#+'"2"#$#1#-$73"2#)(#/&&2,3$&"%#
%"#!"#'#!#&'"#2"%$*&#)(#/#8/,2+,%"#9)78/2,%)-#3"&+""-#/&&2,3$&"#"#/%#9)78/2":#&)#
/&&2,3$&"#&#
;#1#7/&2,<#)(#8/,2+,%"#9)78/2,%)-#=/*$"%4#%"&#
;#%"&#)(#8/,2+,%"#9)78/2,%)-%#9/-#&'"2"()2"#3"#2"82"%"-&":#/%0##
#
#
#
>>>>>>>>66?6@#
#
#
+'"2"#!('!)#,%#&'"#,78)2&/-9"#)(#/&&2,3$&"#(#/%#9)78/2":#&)#/&&2,3$&"#)6#A,-9"#&'"#
:,2"9"%$*&#)(#/#8/,2+,%"#9)78/2,%)-#,%#%"&4#+'"2"#%()#,%#"B$/*#&)#!('!)4#7/&2,<#;#
3"9)7"%0#
#
#
#
>>>>>>>>>>>6?6?#
#
C'"#.)/*#)(#;DE#,%#&)#$-9)="2#&'"#$-:"2*F,-.#%9/*"#)(#82,)2,&F#=/*$"%#!"6#G-#)&'"2#
+)2:%4#.,="-#%"&4#(,-:#&'"#H&2$"I#=/*$"%#)(#!"#/-:#!&6#
################C',%#;#7/&2,<#'/%#%)7"#%8"9,/*#82)8"2&,"%6#J,2%&4#;#,%#)(#2/-K#)-"6#G(#+"#*))K#
/&#"/9'#9)*$7-#)(#;4#+"#'/="0##
!!>>>>>>6?6L#
#
# !5M!5# !5M!N# !5M!-## !NM!5# !NM!N# !NM!-#*1# 6# 6# 6#
## 6# 6# 6#
# !-M!5# !-M!N# !-M!-#
# %((# %()# +# %($## %)(# %))# +# %)$#*1# >
#
>#
>#
>#
# %$(# %$)# +# %$$#
# +5#
#
# +5# # +5#
+5O5# +N# 4+N
O5# +N# 4>4+-
O5# +N#
# >#
# >#
# >#
#
#
;1#
# +-# # +-# # +-#
!!! "#$!!
!"#$% #&'()*% &+% ,% -.++/01% &*'2% 32% "%)('4.5'.#"4.6/% #&*14"*47%!"89:% ;+% 4$/% ,%)"40.<% .1%
#&*1.14/*4%&*'2%&*/%#&'()*%.1%0/=(.0/-%4&%-/4/0).*/%4$/%(*-/0'2.*>%1#"'/%?!#$%$!&@:%
A$/%1")/%/6"'("4.&*%#&('-%3/%(*-/04"B/*%.*%"%0&C8C.1/%+"1$.&*%C.4$%4$/%1")/%0/1('4:'
%D/#&*-7% .+%E% .1%<% 4.)/1%)&0/% .)5&04"*4% 4$"*%F7% 4$/*% .4% +&''&C1%4$"4%F% .1%9G<%4.)/1%"1%
.)5&04"*4% "1%E:% ;*% &4$/0%C&0-17%()"' .1% 4$/% 0/#.50&#"'% &+%(")' 1(#$% 4$"4%(")'H% #*()":% A$.1%
"11()/1% 4$/% -/#.1.&*% )"B/0% .1% #&*1.14/*4% C.4$% 0/15/#4% 4&% .*-.6.-("'% 5".0C.1/%
#&)5"0.1&*1% "*-% .1% "% +(*-")/*4"'% "11()54.&*% )"-/% 32% 4$/% ,IJ:% K.4$% 4$.1%
"11()54.&*7%)"40.<%,%.1%3/%0/-(#/-%4&L%%
%%%%MMMMMMN:O%
%%,1% 1//*% .*% !=("4.&*% N:O7% C$/*% "% #0.4/0.&*% .1% #&)5"0/-%C.4$% .41/'+% /"#$% #0.4/0."% $"1%
/=("'% C/.>$4:% A$.1%)"B/1% 4$/% -.">&*"'1% /=("'% 4&% (*.42% ?.:/:%!#*!#'H% 9@:% A$/% /*40./1%
3/'&C% 4$/% -.">&*"'% "0/% 0/#.50&#"'% &+% 4$&1/% /*40./1% "3&6/% 4$/% -.">&*"':% A$/% "3&6/%
0/-(#4.&*% )/"*1% 4$"4% &*'2%"%&'nn5".0C.1/% #&)5"0.1&*1% *//-% 4&% 3/% 1&'.#.4/-% +0&)%
-/#.1.&*%)"B/01%"1%#&)5"0/-%C.4$%&P% 4&4"'%/*40./1% .*%4$/%#&)5'/4/-%,%)"40.<:% ;+% 4$/%
"11()54.&*%4$"4%4$/%-/#.1.&*%)"B/0% .1%#&*1.14/*4%C.4$%0/15/#4%4&% .*-.6.-("'%5".0C.1/%
#&)5"0.1&*1% -&/1% *&4% $&'-7% .*% &4$/0% C&0-1% .+% (")' % #*()"7% 4$/*% ?&P% +' &@% 5".0C.1/%
#&)5"0.1&*1%C&('-%3/%0/=(.0/-:%
'
% 9% (#,% (#-' %' (#&%% 9*(#,% 9% (,-' %' (,&%,H% 9*(#-' #*(,-' 9% %' (-&'% M
%
M%
M%
M%
M%
% #*(#&% #*(,&% #*(-&' %' 9%

360
Step 2B: Deriving Weights
Once pairwise comparisons have been obtained from the decision maker, the next step is to use the matrix system to estimate the underlying scale of preferences. Weightings are included because no laws currently exist to enforce low-impact green housing designs, and thus any designer who wishes to have his designs implemented must first ensure that they are acceptable to the owner. Therefore, given the “random” error inherent in human judgment, it cannot be expected that the true values of wi and wj can be found. While several methods have been proposed to estimate weights from matrices of pairwise comparisons, the two most commonly used methods of deriving attribute weights are the eigenvector and the logarithmic least squares methods. Using the former attributes, weights are obtained by finding the eigenvector corresponding to the largest eigenvalue of the ‘A’ matrix. For instance Equation 1.4 showed a consistent matrix of pairwise comparisons, meaning that only one column or one row is necessary to derive the underling scale, wi, of weights. When inconsistency is introduced into pairwise comparisons, more than one row or column of ‘A’ is desired in order to derive a good estimate of the underlying scale of weights. The largest eigenvalue of ‘A’ max is used in consistency calculations (discussed below in Consistency) and its corresponding eigenvector, normalized such that its components sum to one represents the vector of attribute weights.
For example in a hierarchy of two branches with two and six sub-objectives, if the vector of weights were normalized such that the largest element is equal to one, the branch with six sub- objectives would be given more weight in total than the branch with only two sub- objectives. Likewise, a branch where there is little preference for one element over another would be given a higher total weight over a branch with the same number of elements but with larger differences in preferences between the individual elements. Following the definition of aij=wi/wj and aij=1/aji
…………………………………………1.5 If follows that in the consistent case:
!!! "#$!!
!"#$#%&'()*( &+#(#,-#%.#/&)0(10#(%)0$1",2#3(&)('4$(&)()%#(1'()55)'#3(&)('#&&,%-( &+#(
"10-#'&(#"#$#%&()*(&+#(#,-#%.#/&)0(#641"(&)()%#7(8+,'( ,'(0#64,0#3(,%()03#0(&)(-,.#(&+#(
5)&#%&,1"(*)0(#641"(9#,-+&,%-(:#&9##%(:01%/+#'()*(&+#(+,#010/+;(9+#0#(&+#(%4$:#0()*(
#"#$#%&'( :#,%-( /)$510#3($1;(:#(3,**#0#%&7( 8+,'( %)0$1",21&,)%( #%'40#'( &+#(9#,-+&'(
9,&+,%(#1/+(:01%/+()*(&+#(+,#010/+;('4$(&)()%#(%)($1&�(&+#(%4$:#0()*(#"#$#%&'()0(
&+#( 0#"1&,)%'+,5'( :#&9##%( &+#( #"#$#%&'( )*( 1( :01%/+7( <''4$#( 1( +,#010/+;( 9,&+( &9)(
:01%/+#'(9,&+( &9)(1%3(',=('4:>):?#/&,.#'@( 0#'5#/&,.#";7( A*( &+#(.#/&)0()*(9#,-+&'(9#0#(
%)0$1",2#3( '4/+( &+1&( &+#( "10-#'&( #"#$#%&( ,'( #641"( &)( )%#@( &+#( :01%/+(9,&+( ',=( '4:>
):?#/&,.#'(9)4"3( :#( -,.#%($)0#(9#,-+&( ,%( &)&1"( &+1%( &+#( :01%/+(9,&+( )%";( &9)( '4:>
):?#/&,.#'7( B,C#9,'#@( 1( :01%/+(9+#0#( &+#0#( ,'( ",&&"#( 50#*#0#%/#( *)0( )%#( #"#$#%&( ).#0(
1%)&+#0(9)4"3(:#(-,.#%(1(+,-+#0(&)&1"(9#,-+&().#0(1(:01%/+(9,&+(&+#('1$#(%4$:#0()*(
#"#$#%&'(:4&(9,&+("10-#0(3,**#0#%/#'(,%(50#*#0#%/#'(:#&9##%(&+#(,%3,.,341"(#"#$#%&'7(
!!!!!!!!!!!!!D)"")9,%-(&+#(3#*,%,&,)%()*(!"#$%"&%#(1%3(!"#$E&!#"'''''''''''''''''''''''''''''''''''''''''''''''''''''''''''
''''''''''''''''''''''''''''''''''''''''''''''''''''''' %%%
i
jij
j
iijijjiij w
wa
wwa
aijaaa FFFFFFFG7EH'
''''''''''''''''''''''''''''''''''''''''''''''''''''
'''''''''''''''''''''A*(*)"")9'(&+1&(,%(&+#(/)%','&#%&(/1'#I((
((((((((((((((((((((((((((((((((((((((((((((( nww
ai
jn
jij
%
(((((((((("JE(&)(())))))G7EE'
'(K0@('&1(1%)&+#0(91;@($4"&,5";,%-(#641&,)%(G7EE(&+0)4-+(:;(%"*''
(((((((((((((((((((((((((((((((((((((((((( ij
n
jij nwwa
%
''''''"JE(&)((FFFFFF7G7EL(
(8+#'#('&1&#$#%&'(10#(#64,.1"#%&(&)(&+#($1&0,=(%)&1&,)%(<%'J((%7(A*(&+#(-)1"(,'@(-,.#%(1(
5)',&,.#(0#/,50)/1"($1&0,=(<@(&)(*,%3(%@(&+#(50):"#$(:#/)$#'(M<(>((+N(%'J(H7(8+,'(,'(1(

361
…………….………………………..………1.6
Or, stated another way, multiplying equation 6.11 through by wi:
…………………………………………………1.7 These statements are equivalent to the matrix notation Aw = nw. If the goal is, given a positive reciprocal matrix A, to find w, the problem becomes (A - nI) w = 0. Step 2C: Measurement of consistency Deviations from both ordinal and cardinal consistency are considered, and to a certain extent allowed, within AHP. Ordinal consistency requires that if x is greater than y and y is greater than z, then x should be greater than z. Cardinal consistency is a stronger requirement stipulating that if x is 2 times more important than y and y is 3 times more important than z, then x must be 6 times more important than z. If A is cardinally consistent, then aijajk = aik. Using the previous definition of aij we can see that this is true:
…………………………………………………………….………………1.8 If the relationship aijajk = aik does not hold then A is said to be cardinally inconsistent. AHP has been designed to deal with inconsistent matrices (both cardinal and ordinal inconsistency), thus the problem becomes:
………………………………………………………………………………1.9 where ␣ij > 0 and represents some perturbation causing A to be inconsistent, producing an A matrix that looks like the following:
!!! "#$!!
!"#$#%&'()*( &+#(#,-#%.#/&)0(10#(%)0$1",2#3(&)('4$(&)()%#(1'()55)'#3(&)('#&&,%-( &+#(
"10-#'&(#"#$#%&()*(&+#(#,-#%.#/&)0(#641"(&)()%#7(8+,'( ,'(0#64,0#3(,%()03#0(&)(-,.#(&+#(
5)&#%&,1"(*)0(#641"(9#,-+&,%-(:#&9##%(:01%/+#'()*(&+#(+,#010/+;(9+#0#(&+#(%4$:#0()*(
#"#$#%&'( :#,%-( /)$510#3($1;(:#(3,**#0#%&7( 8+,'( %)0$1",21&,)%( #%'40#'( &+#(9#,-+&'(
9,&+,%(#1/+(:01%/+()*(&+#(+,#010/+;('4$(&)()%#(%)($1&�(&+#(%4$:#0()*(#"#$#%&'()0(
&+#( 0#"1&,)%'+,5'( :#&9##%( &+#( #"#$#%&'( )*( 1( :01%/+7( <''4$#( 1( +,#010/+;( 9,&+( &9)(
:01%/+#'(9,&+( &9)(1%3(',=('4:>):?#/&,.#'@( 0#'5#/&,.#";7( A*( &+#(.#/&)0()*(9#,-+&'(9#0#(
%)0$1",2#3( '4/+( &+1&( &+#( "10-#'&( #"#$#%&( ,'( #641"( &)( )%#@( &+#( :01%/+(9,&+( ',=( '4:>
):?#/&,.#'(9)4"3( :#( -,.#%($)0#(9#,-+&( ,%( &)&1"( &+1%( &+#( :01%/+(9,&+( )%";( &9)( '4:>
):?#/&,.#'7( B,C#9,'#@( 1( :01%/+(9+#0#( &+#0#( ,'( ",&&"#( 50#*#0#%/#( *)0( )%#( #"#$#%&( ).#0(
1%)&+#0(9)4"3(:#(-,.#%(1(+,-+#0(&)&1"(9#,-+&().#0(1(:01%/+(9,&+(&+#('1$#(%4$:#0()*(
#"#$#%&'(:4&(9,&+("10-#0(3,**#0#%/#'(,%(50#*#0#%/#'(:#&9##%(&+#(,%3,.,341"(#"#$#%&'7(
!!!!!!!!!!!!!D)"")9,%-(&+#(3#*,%,&,)%()*(!"#$%"&%#(1%3(!"#$E&!#"'''''''''''''''''''''''''''''''''''''''''''''''''''''''''''
''''''''''''''''''''''''''''''''''''''''''''''''''''''' %%%
i
jij
j
iijijjiij w
wa
wwa
aijaaa FFFFFFFG7EH'
''''''''''''''''''''''''''''''''''''''''''''''''''''
'''''''''''''''''''''A*(*)"")9'(&+1&(,%(&+#(/)%','&#%&(/1'#I((
((((((((((((((((((((((((((((((((((((((((((((( nww
ai
jn
jij
%
(((((((((("JE(&)(())))))G7EE'
'(K0@('&1(1%)&+#0(91;@($4"&,5";,%-(#641&,)%(G7EE(&+0)4-+(:;(%"*''
(((((((((((((((((((((((((((((((((((((((((( ij
n
jij nwwa
%
''''''"JE(&)((FFFFFF7G7EL(
(8+#'#('&1&#$#%&'(10#(#64,.1"#%&(&)(&+#($1&0,=(%)&1&,)%(<%'J((%7(A*(&+#(-)1"(,'@(-,.#%(1(
5)',&,.#(0#/,50)/1"($1&0,=(<@(&)(*,%3(%@(&+#(50):"#$(:#/)$#'(M<(>((+N(%'J(H7(8+,'(,'(1(
!!! "#$!!
!"#$$%!#"&'%(')*'!+,-&.-,/"'0&#)1&%$&),)2+-%*%#"&%3&#)1&,)"4&%3&!"%$&#)&'%(')*#"5'&,3&67&
89%$& 0'+9,1& 3,-& 1'-%*%)(& #& *'!+,-& ,3& :'%(9+$& 3-,0& #& .,$%+%*'& -'!%.-,!#"& 0#+-%;& ,3&
.#%-:%$'& !,0.#-%$,)$& 5$'$& +9'& "#-('$+& '%(')*'!+,-<& #"$,& +'-0'1& +9'& .-%)!%.#"& -%(9+&
'%(')*'!+,-<&#)1&%+$&!,--'$.,)1%)(&'%(')*#"5'7&
&
Measurement of consistency &='*%#+%,)$& 3-,0& /,+9& ,-1%)#"& #)1& !#-1%)#"& !,)$%$+')!4& #-'& !,)$%1'-'1<& #)1& +,& #&
!'-+#%)&';+')+&#"",:'1<&:%+9%)&6>?7&@-1%)#"& !,)$%$+')!4& -'A5%-'$& +9#+& %3&#" %$& (-'#+'-&
+9#)&$"#)1&$"%$&(-'#+'-&+9#)&%<&+9')&#"$9,5"1&/'&(-'#+'-&+9#)&%&"B#-1%)#"&!,)$%$+')!4&%$&
#&$+-,)('-&-'A5%-'0')+&$+%.5"#+%)(&+9#+&%3&#"%$&C&+%0'$&0,-'&%0.,-+#)+&+9#)&$"#)1&$"%$&
D&+%0'$&0,-'&%0.,-+#)+&+9#)&%<&+9')&#"05$+&/'&E&+%0'$&0,-'&%0.,-+#)+&+9#)&%7&F3&6&%$&
!#-1%)#""4&!,)$%$+')+<&+9')&'()')*"+"'(*7&G$%)(&+9'&.-'*%,5$&1'3%)%+%,)&,3&'()":'&!#)&$''&
+9#+&+9%$&%$&+-5'H&
!
!!!!!!!!!!!!!!!!k
i
k
j
j
ijkij w
www
wwaa IIIIIII7J7KD!
!F3&+9'&-'"#+%,)$9%.&'()')*"+"'(*"1,'$&),+&9,"1&+9#)&6&%$&$#%1&+,&/'&!#-1%)#""4&%)!,)$%$+')+7&
6>?&9#$&/'')&1'$%()'1&+,&1'#"&:%+9&%)!,)$%$+')+&0#+-%!'$&L/,+9&!#-1%)#"&#)1&,-1%)#"&
%)!,)$%$+')!4M<&+95$&+9'&.-,/"'0&/'!,0'$H&
&&&&&&&&&&&&&&&&&&&&&&&&&&&&&&& ikk
ijk
k
jij
j
i
ww
ww
ww
IIIIIII77J7KN&
:9'-'& %O&P&Q&#)1&-'.-'$')+$&$,0'&.'-+5-/#+%,)&!#5$%)(&6&+,&/'&%)!,)$%$+')+<&
.-,15!%)(&#)&6&0#+-%;&+9#+&",,R$&"%R'&+9'&3,"",:%)(H&
&

362
……………………….1.10
Various methods have been devised to deal with inconsistency. Saaty (1980) suggests using the following consistency index (CI):
………………………...…………………………………………………1.11 where ␣max is the largest eigenvalue of A and n is the number of elements within a branch being compared. If A is perfectly consistent (cardinally) than ␣max will be at a minimum and equal to n, producing a CI equal to zero. As inconsistency increases ␣max will become increasingly large, producing a larger value of CI. This consistency index can also be expressed as a consistency ratio:
……………………………………………………..………………………1.12 where RI is a known random consistency index obtained from a large number of simulation runs and varies depending upon the order of matrix. Tables 3 shows the value of the random consistency index (RI) for matrices of order 1 to 15 obtained by approximating random indices using a sample size of 500 (Saaty, 2000). However, various authors (Golden & Wang, 1990; Alonso & Lamata, 2006) have computed and obtained different RIs depending on the simulation method and the number of generated matrices involved in the process. These values were added to the corresponding matrix size of 15 making up a total of n=40 for the prototype model.
!!! "#$!!
!
!
!
"""#$#%&!
!
!
'()*+,-!./01+2-!1(3/!4//5!2/3*-/2!0+!2/(6!7*01!*58+5-*-0/589#!:((09!;%<$$=!-,>>/-0-!
,-*5>!01/!?+66+7*5>!8+5-*-0/589!*52/@!;AB=C!
!!!!!!!!!!!!!!!!!%&'%()*'
nnCI """"""""""""""#$#%D!
71/)/! !"#$ *-! 01/! 6()>/-0!/*>/53(6,/!+?!E!(52!%$ *-! 01/!5,.4/)!+?!/6/./50-!7*01*5!(!
4)(581!4/*5>!8+.F()/2#!B?!E!*-!F/)?/8069!8+5-*-0/50!;8()2*5(669=!01(5! !"#$7*66!4/!(0!(!
.*5*.,.! (52! /G,(6! 0+!%H! F)+2,8*5>! (! AB! /G,(6! 0+! I/)+#! E-! *58+5-*-0/589! *58)/(-/-!
!"#$7*66!4/8+./!*58)/(-*5>69!6()>/H!F)+2,8*5>!(!6()>/)!3(6,/!+?!AB#!J1*-!8+5-*-0/589!
*52/@!8(5!(6-+!4/!/@F)/--/2!(-!(!8+5-*-0/589!)(0*+C!
!
!!!!!!!!!!!RICICR """"""""""$#%$!
!71/)/! KB! *-! (! L5+75! )(52+.! 8+5-*-0/589! *52/@! +40(*5/2! ?)+.! (! 6()>/! 5,.4/)! +?!
-*.,6(0*+5!),5-!(52!3()*/-!2/F/52*5>!,F+5!01/!+)2/)!+?!.(0)*@#!J(46/-!$#M!-1+7-!01/!
3(6,/!+?!01/!)(52+.!8+5-*-0/589!*52/@!;KB=!?+)!.(0)*8/-!+?!+)2/)!%!0+!%N!+40(*5/2!49!
(FF)+@*.(0*5>!)(52+.!*52*8/-!,-*5>!(!-(.F6/!-*I/!+?!&NN!;:((09H!ONNN=#!!
!
!!!
!
!
!
!
! %! %O(%O! %M(%M! "! %5(%5!
! %P %O(%O! %! OM(OM! "! O5(O5!
E! %P %M(%M! %P OM(OM! %! "! M5(M5!
! "! "! "! "! "!
! %P %5(%5! %P O5(O5! %P M5(M5! "! %!

363
Table 3: Average random index for corresponding matrix size (Alonso & Lamata, 2006)
The acceptable CR range varies according to the size of matrix i.e. 0.05 for a 3 by 3 matrix, 0.08 for a 4 by 4 matrix and 0.1 for all larger matrices, n>= 5 (Saaty, 2000, Cheng and Li, 2001). If the value of CR is equal to, or less than that value, it implies that the evaluation within the matrix is acceptable or indicates a good level of consistency in the comparative judgments represented in that matrix. In contrast, if CR is more than the acceptable value, inconsistency of judgments within that matrix has occurred and the evaluation process should therefore be reviewed, reconsidered and improved. An acceptable consistency property helps to ensure decision-maker reliability in determining the priorities of a set of criteria. Step 3: Scaling Attributes After pairwise comparisons have been made and priority weights calculated for each element within the hierarchy, the input data for each alternative must be transformed to a usable value before alternatives can be compared. A major strength of AHP is its ability to incorporate attributes that are measured on a number of different scales, at different intensities, and can include both numeric, descriptive, and categorical data. This is achieved by converting all values to relative data. Relative values could be created by either comparing attribute values to other alternatives being compared or by comparing attributes to an “ideal” alternative. The choice of treatments will be dependent on the type of problem and available data. Several studies have however, criticised relative scaling for its inappropriateness for the sustainable index development or any other problem where more than a small number of alternatives are considered.
J. A. Alonso & M. T. Lamata 454
Table 4. Table of the max! and random index for dimensions greater than 15.
n 16 17 18 19 20 21 22 23
!!!!max 39.9676 42.7375 45.5074 48.2774 51.0473 53.8172 56.5872 59.3571
RI 1.5978 1.6086 1.6181 1.6265 1.6341 1.6409 1.6470 1.6526
24 25 26 27 28 29 30 31
62.1270 64.8969 67.6669 70.4368 73.2067 75.9767 78.7466 81.5165
1.6577 1.6624 1.6667 1.6706 1.6743 1.6777 1.6809 1.6839
32 33 34 35 36 37 38 39
84.2864 87.0564 89.8263 92.5962 95.3662 98.1361 100.9060 103.6759
1.6867 1.6893 1.6917 1.6940 1.6962 1.6982 1.7002 1.7020
These estimated RI values are plotted in Figure 7.
0 5 10 15 20 25 30 35 40 45 500.4
0.6
0.8
1
1.2
1.4
1.6
1.8
2
Fig 7. Plot of estimated RI(n) values.
3. An Adaptable and Simpler Criterion of Matrix Acceptance
In this paper, we present a new criterion for acceptance and a new index for representing consistency in pairwise reciprocal comparison matrices. This index and criterion allows the decision maker to study the consistency of each matrix in an adaptable way. Using the index and criterion that we present, the user can decide about the matrix consistency using not only the matrix entries but also the level of consistency that the decision maker needs in this particular case.
We will use the maximum right eigenvalue (!max) of each studied matrix as a consistency index, and this index is simpler than Saaty´s (CI). The main idea is that a matrix is consistent or not depending on the scope. In different situations, the decision maker might need different levels of consistency and he/she can represent these levels

364
Therefore an alterative method proposed to deal with alternatives is the absolute, or ideal, mode of AHP (Saaty, 1980). In the absolute mode, for a given factor or variable, each material alternative is compared with an “ideal” alternative to determine its weight, termed “scoring”. The score for each factor or variable of each material alternative ranges between zero and one. A common scoring technique involves dividing each factor or variable value by the maximum value for which that factor present among the alternatives. This assumes the decision maker’s preference for that attribute is linear. Non-linear preferences can also be accommodated within AHP. These functions may be the result of scientific study, expert judgment, or pairwise comparisons between categorical variables. Step 4: Synthesizing Priorities – calculating the green development index scores Once relative values have been calculated for each factor of each material alternative, these factor scores are combined with the factor weights from pairwise comparisons to determine the overall ranking of each material alternative. The normalized local priority weights of dimensions of green development indices are obtained and are combined together in order to obtain the global or final composite priority weights, termed the green index of all sustainability factors used in the third level of the AHP model. This is accomplished using a simple additive function. The products of each factor score and its associated factor weight are summed across each branch of the hierarchy. This sum becomes the factor value for the node directly above and the process is repeated at the next level of the hierarchy. Figure 2 shows the flowchart of the material computational analysis technique based on the concept of the Analytical Hierarchy Process model (Saaty, 1980)

365
Figure 2. Flow chart based on the AHP concept of decision-making
The Composite Green Housing Utility Index
Ding (2005) notes that the overall score for a given material alternative is irrelevant, except when compared with the overall scores for other alternatives does the score become meaningful. He adds that alternatives could be ranked by their importance in contributing to the goal of the analysis by simply sorting material alternatives based on their overall green utility index score. This overall green index score is termed the composite green index value of material alternatives. Those alternatives with the higher score would receive a higher overall ranking. The green utility index (GHUI) model of alternative i can based on the derived weight be calculated using the following formula adapted from the works of Ding (2005):
!!! "#$!!
!!
!
!
!
!
!
!
!
!
! !"#
! !
###############################################################################################################################$%&#
#################!"# ###
##############################
################################### ####!"#
######################################$%&############################################################!
####################################################################################### $%&#
###############################################################################################################################
###########################################################################################################################
############################################################################################################################
!
!
#
'()*+,#-./#'012#345+6#71+#64,#8,0,36(19#:1;,0#
!
"<,+500#1=>,36(<,#
?;,96(7@#506,+956(<,8#61#=,#+56,;!
A503*056,#3198(86,93@#+56(1#BACD#17#E5(+2(8,#31:E5+(819#:56+(F#
?;,96(7@#+,0,<596#3+(6,+(5#
G,<,01E#:56+(F#17#E5(+2(8,#31:E5+(819#17#3+(6,+(5#
G,<,01E#:56+(F#17#E5(+2(8,#31:E5+(819#17#506,+956(<,8#2(64!+,8E,36#61#,534!
A503*056,#64,#1<,+500#2,()46#17#,534#506,+956(<,!
A503*056,#91+:50(H,;#2,()468#17!3+(6,+(5!
"<,+500#(9;,F#17#:56,+(50!8*865(95=(0(6@!
?&#AC# I.JI#
K#
K#
A503*056,#64,#3198(86,93@#+56(1#17#E5(+2(8,#31:E5+(819#17!506,+956(<,8!
A503*056,#91+:50(H,;#2,()468#17#506,+956(<,8#2(64#+,8E,36#61#,534#3+(6,+(5!
?&#AC# I.JI#
L5<,#506,+956(<,8#=,,9#31:E5+,;#2(64#+,8E,36#61#500#
3+(6,+(5M#
A4118,#64,#9,F6#
A4118,#5#8*865(95=0,#1E6(19#

366
GI= (i=1,……..…..I) …………………………………………….1.13 eji = f(GS,EH,EC,SC,T,SN)…………………………………………………….1.14 The symbol GHUIi denotes the green housing utility index for an alternative I; Wj represents the weight of criterion j; and eji indicates value of alternative i for criterion j. The result will indicate that higher values for eji and Wj imply a better score, and that alternative i will be judged as better than alternative i' if the score of GHIi is greater than the score of GHIi'. The following is the generated formula for calculating the GHI for each factor. The GS is general site impact, EH denotes environmental/health impact, EC economic/cost efficiency, SC socio-cultural impact, SN sensorial and T technical performance capacity. The factors are obtained from the following formulae: GS=∑ Sji Wj ……………………………………………………………..1.15 Where: GS= General site impact i =alternatives j= sub-factor S=site impact EH= ∑ EIji Wj……………………………………………………………..1.16 Where: EH= Environmental/Health impact i =alternatives j= sub-factor EI=environmental impact EC= ∑ Cji Wj……………………………………………………………..1.17 Where: EC= Economic/Cost i =alternatives j= sub-factor C=Cost efficiency
!!! "#$!!
!"#"$%&'(%)*+,*-./(%-0-/1.213.4./5%.26(7%
!"#$ %&#'())$ *+%'#$ ,%'$ ($ -.&#/$ ()0#'/(0.&#$1#(/*$ /%0"./-$2"#/$ *0(/3./-$ ()%/#4$5/)6$
2"#/$ +%17('#3$ 2.0"$ 0"#$ %&#'())$ *+%'#*$ ,%'$ %0"#'$ ()0#'/(0.&#*$ 3%#*$ 0".*$ /819#'$
9#+%1#$1#(/./-,8)4$:0$0".*$7%./0;$()0#'/(0.&#*$+(/$9#$'(/<#3$96$0"#.'$ .17%'0(/+#$./$
+%/0'.980./-$0%$0"#$-%()$%,$ 0"#$(/()6*.*$96$*.17)6$*%'0./-$()0#'/(0.&#*$9(*#3$%/$0"#.'$
%&#'())$ *8*0(./(9.).06$ *+%'#4$ !".*$ %&#'())$ *8*0(./(9.).06$ *+%'#$ 2.))$ 9#$ 0#'1$ 0"#$
+%17%*.0#$*8*0(./(9.).06$./3#=$&()8#$%,$1(0#'.()$()0#'/(0.&#*4$$!"%*#$()0#'/(0.&#*$2.0"$
0"#$ ".-"#'$ *+%'#$ 2.))$ '#+#.&#$ ($ ".-"#'$ %&#'())$ '(/<./-4$ !"#$ *8*0(./(9.).06$ ./3#=$ >?@A$
1%3#)$ %,$ ()0#'/(0.&#! "$ +(/$ 9(*#3$ %/$ 0"#$ 3#'.$ 2#.-"0$ 9#$ +()+8)(0#3$ 8*./-$ 0"#$
,%))%2./-$,%'18)($(3(70#3$,'%1$0"#$2%'<*$%,$B./-$>CDDEAF$
j
J
jjii WeSI
%
$$$$$$>"GH;IIII44@AIIIIIIII4$II44J4HK$
$&'''''( MPWERESIEILCCfe ji IIIIIIIIIII4$J4HL$
$!"#$*619%)$?@.$3#/%0#*$0"#$*8*0(./(9.).06$./3#=$,%'$(/$()0#'/(0.&#$@M$NO$'#7'#*#/0*$0"#$
2#.-"0$%,$+'.0#'.%/$ OM$(/3$#O.$ ./3.+(0#*$&()8#$%,$()0#'/(0.&#$ .$ ,%'$+'.0#'.%/$ O4$!"#$'#*8)0$
2.))$./3.+(0#$0"(0$".-"#'$&()8#*$,%'$#O.$(/3$NO$.17)6$($9#00#'$*+%'#;$(/3$0"(0$()0#'/(0.&#$
.$2.))$9#$O83-#3$(*$9#00#'$0"(/$()0#'/(0.&#$.P$.,$0"#$*+%'#$%,$?@.$.*$-'#(0#'$0"(/$0"#$*+%'#$
%,[email protected]$!"#$QRR$.*$).,#$+6+)#$+%*0$2"#'#$S@$3#/%0#*$S/&.'%/1#/0()$.17(+0;$TS$'#*%8'+#$
#,,.+.#/+6;$NU$2(*0#$1./.1.V(0.%/;$?W$*%+.%$9#/#,.0$(/3$XW$7#',%'1(/+#$+(7(+.064$$$
$!"#6$('#$%90(./#3$,'%1$0"#$,%))%2./-$,%'18)(#F$
j
I
jjiWCLCC
%IIIIIIIIIIIIIIIIII44J4CD$
N"#'#F$QRRG$Q.,#$+6+)#$+%*0$$$$$$$$$$$$$$$"!G()0#'/(0.&#*$$$$$$$$$$$$$$$$#G$*89Y+'.0#'.($$$$$$$$$$$$$$$R$G+%*0$.17(+0$

367
SC= ∑ Sji Wj…………………………………………………………..1.18 Where: SC= Socio-Cultural i =alternatives j= sub-factor S=Social benefits T= ∑ Tji Wj……...………………………………………………………..1.19 Where: T= Technical i =alternatives j= sub-factor T=Technical performance SN=∑Sji Wj………………………………………………………………..1.20 Where: SN= Sensorial i =alternatives j= sub-factor S=Sensorial Impacts The sustainability/green index is calculated for each alternative by first multiplying each value by its appropriate weight followed by totaling the weighted scores for all factors. In the context of maximizing the appropriateness of a material alternative, the preferred material option would be the alternative that gives the highest corresponding value of the Green Housing Utility Index (GHUI). The amalgamation method yields a single index of alternative worth, which allows the options to be ranked. The higher the green index, the better the chosen alternative.
368
The Benefits of Green Index in Low-Impact Green Material Selection
The green utility index is a comprehensive methodology that includes the quantification of both objective and subjective measures that give a full life-cycle or performance analysis of low-cost green material alternatives, which will allow the impacts created by the buildings during their life cycle to be compared. The following exemplifies the benefits of the green utility index.
• The green housing utility index assists in decision-making for material selection from as early as the feasibility stage, which ensures the best material option that maximises cost and minimises detrimental effects to the environment. • The index helps to distinguish material with reduced economic, social, and environmental impacts, and to induce the designer to incorporate holistic socio-economic, technical and environmental performance requirements. • It can facilitate the designer's iterative approach, where initial understanding of the problems and means of addressing it are allowed to evolve even before the building project arrives at the design stage. • Cooper (1999), Cole (1999) and Todd et al. (2001), observed that existing material assessment methods such as BREEAM and BEPAC are inadequate for addressing wider green development issues. With the green index concept designers are able to embrace economic, sensorial, technical and socio-cultural concerns as well as environmental aspects of green development goals • It enhances the principle of futurity and equity in material assessment.
Section 5.6 of chapter 5 describes how the MSDSS analytical system for LCGBMCs selection is developed and how the internal storage structure and file organisation are specified using the proposed material selection mathematical computational method.

369
Appendix I: Questionnaire for Pairwise Comparison
School of Architecture and the Built Environment, University of Westminster,
London, UK. NW1 5LS
Email: [email protected] Contact Phone Number: +44 (0) 208 7900 5000 ext. 3721
Dear (Participant’s name),
RESEARCH ON THE IMPACTS OF LOW-COST GREEN BUILDING
MATERIALS IN HOUSING CONSTRUCTION This questionnaire is informed by the result analysis of the first questionnaire that identified sustainable material selection factors for low-cost green building materials. You are herby again asked to kindly evaluate the identified factors or variables by assigning weights to them through pairwise comparison. This is required in order to validate the decision support model developed to aid building designers in selecting low-cost green building products that are environmentally, socio-culturally, technically and economically balanced using the prototype Material Selection Decision Support [MSDSS] model. Detail description of the case project is described below. The research is to help toward improving sustainable material evaluation and selection process, which would be of benefit to the housing construction industry. All of data collected from you will be used only for academic purpose. Thank You! Ibuchim Cyril Ogunkah Doctoral Research Candidate School of Architecture and the Built Environment (SABE) University of Westminster 35 Marylebone Road, Westminster, NW1 5LS Tel: +44 (0) 208 7911 5000 ext. 3721 E-mail: [email protected]
CONSENT LETTER
School of Architecture and the Built Environment,
University of Westminster, London, UK.
NW1 5LS Email: [email protected]
Contact Phone Number: +44 (0) 208 7900 5000 ext. 3271 Dear (Sir/Madam),
RE: CONSENT TO TAKE PART IN A SURVEY OF FACTORS INFLUENCING MATERIAL-SELECTION IN THE DESIGN OF LOW-COST GREEN HOUSING
You are being invited as an expert in the building and construction industry, to take part in the survey of an on-going research titled: “MATERIAL SELECTION IN THE DESIGN OF LOW-COST GREEN HOUSING”. Please take time to read the following information carefully and indicate whether or not you or your organisation wish to take part in the survey we are about to undertake, by ticking in the appropriate boxes below, or sending a return-email confirming your interest.
RESEARCH RATIONALE: Over half the world’s population living is now living in cities, and the reality of the population growth and mass urbanization is a dramatic shortfall in the amount and quality of available housing, particularly in many developing countries (UN, 2009; World Bank, 2010). Housing operations however, are estimated to be responsible for 25-40% of energy consumption (IEA, 2008). It is not merely a coincidence that there is a direct correlation between this energy consumption and climate change: as the International Energy Agency (2008) indicates that 40% of global carbon dioxide (CO2) emissions come from the built environment, while building materials account for approximately 15-25% of the energy used in residential buildings alone- including energy spent in manufacturing and transporting materials to site; energy consumption during building construction; and energy used for maintenance during the life span of the building (DCLG, 2007a). With constant dependence on highly polluting, cost and energy intensive imported materials, coupled with the additional strains on an already acute imbalance of the payments situation, their supply seems to have fallen far short of demand and production quality. As a way of making significant contribution towards minimizing CO2 emissions, while at the same time improving the quality of greatly needed housing stock-particularly in the developing countries, the pressure on the demand for low-cost green materials (i.e., materials, in this case locally-sourced and recycled building materials, with low cost, health, and environmental impacts across their life cycle, when compared to competing products that serve the same purpose) has significantly increased; as they possess the greatest features that can help to mitigate climate change with their lowest cost and energy requirements (Shuman, 2008; UN, 2009). Information relating to the impacts of these materials however, appear to be less available (Seyfang, 2009a; Jones, 2009), as yet, evidence indicates that a small proportion of building practitioners seem to have little knowledge of best practices relating to their performance attributes (Malanca, 2010). Given the emphasis on the ways in which decision making impact the material-selection process and invariably, the life cycle performance of the building, there is a real question as to the extent to which the understanding of the basic principles and best practices relevant to the attributes and capabilities of a range of low-cost green material options can enhance their optimization and selection process at the design stage, in order to encourage their wider scale use in the housing industry, thereby improve the process of delivering low cost green housing. As part of an effort to encourage the efficient and wider scale use of low-cost green materials in mainstream practice- for the benefits of housing the teeming population, The School of Architecture and The Built Environment (SABE) of the University of Westminster in conjunction with The Rivers State Sustainable Development Agency (RSSDA) are carrying out a research aimed at investigating “The use of LOW-COST GREEN MATERIALS (mainly, locally-sourced and recycled building materials or products) in the design of LOW-COST GREEN HOUSING”, with the aim to;
“Develop a MATERIAL-SELECTION TOOLKIT, from which data/information appropriate to users’ needs (including architects, designers, material specifiers-amongst others) can be extracted and analyzed, to generate information that can be used to support and assess their decision-making process in the selection of LOW-COST GREEN MATERIALS, at the design stage”. It seeks to create a system which will be compatible as possible with potential users, thus, exploiting the emerging potentials: new and different ideas relating to best practices of such materials, which are rarely used for buildings today such as; compressed earth blocks, earth or sand bags, bamboo, bales of hay, as well as scrap metals, old blocks, tyres, and recycled steel, normally considered as agricultural, post-consumer, or post-industrial waste.
KEY OBJECTIVE OF THE FIELD STUDY To achieve the research aim, the proposed survey is to ask your views as a key stakeholder and/or experienced building practitioner concerning the most essential factors or variables that influence material-selection at the design stage, and to know if you wish to participate in the field study we are about to undertake. Therefore, it includes designers, architects, builders, developers, engineers, manufacturers, material specifiers, clients, green proponents or advocates, students, NGOs, policy makers and etcetera.

370
The Sample Case: A Hypothetical Study Case The case used intends to provide an indication and practical application of the MSDSS model to material selection problems, following the AHP multi- criteria decision-making technique. The proposed scenario taken as study case is a design of a 5-bedroom single-family home located in a sub-urban residential area of Port Harcourt in Rivers State, Nigeria. An architect is selecting a set of LCGBMCs for a proposed 5-bedroom housing project. The client tells the architect that he wants a building made from materials that are environmentally friendly and cost effective, but does not want the building’s functions to be compromised by the choice of materials. He has three material options (in this case floor materials) from which to decide. The architect is expected to weigh the selected factors and rank the selected material IDs using the MSDSS model, to decide the option that best suits the client’s needs. The table below summarizes the details for the three options of flooring materials for the proposed project. From the table, the description of the three options was based on the standard practices and construction details commonly used in Nigeria.
Summary of flooring options for the proposed residential building project Description Material A Material B Material C
Design Element type Panelled Flooring Laminated Flooring Concrete Flooring
Building type Residential Residential Residential Material Type Bamboo XL laminated
Split Panelled Flooring
Reclaimed/Recycled laminated Wood Flooring and Panelling
Fly Ash Cement concrete Floor slab
Size of materials 230mm x 150mm 50mm x 6000mm 900mm x
900mm
Instructions for filling and establishing relative importance - Each criterion will be rated according to its degree of relative importance to another criterion within the group in the bases of pair wise comparison. - Check for consistency of replies will be tested - If you do not achieve acceptable level of consistency kindly refill the questionnaire until you reach an acceptable level of consistency. - Use the scale below to find pair wise relative importance

371
The relative ratio scales are described as follows:
Ratio Scale Importance
Definition Explanation
1 Equal importance of both elements
Two elements contribute equally
3 Moderate importance of one element over another
Experience and judgment favour one element over another
5 Strong importance of one element over another
An element is strongly favoured
7 Very strong importance of one element over another
An element is very strongly dominant
9 Extreme importance of one element over another
An element is favoured by at least an order of magnitude
2, 4, 6, 8
Intermediate values Used to compromise between two judgments
Decision makers can determine the scale of any factor from 1 to 9 if they are equally or more important. If the factors are less important to the decision maker it takes the inverse of the scale. In the above table the score (1) is used to denote factors that have equal importance. This usually happens when the factor is compared to itself. When a factor falls within the “equally” to “moderately” important it takes the score (2) and the same applies to the other values as the users scale of preference changes. In the table, environmental/health impact is strongly favoured to waste minimization while the cost efficiency is extremely favoured over technical performance. This means that when technical performance is compared with cost efficiency then waste minimization is preferred by 1/9 of resource efficiency.
Main/Parent Factor Environmental/Health Impact
Economic/Cost Effect
Technical Performance
Environmental/Health Impact
1 1/2 5
Economic/Cost Effect
2 1 9
Technical Performance
1/5 1/9 1
Part I: Relative preference of criteria for roof covering selection Instruction 1.1: Select the degree of relative importance/preference of each main criterion compared to each other in the selection of floor covering material option using the ratio scale stated above.

372
Pairwise Matrix and Priorities for Parent/Main Factors
Main/Parent Factor
GS EH EC SC T SN
Site Impact 1 Env. Effect 1 Cost Efficiency 1 Socio-Cultural Impact
1
Technical Performance
1
Sensorial Impact
1
Instruction 1.2: Select the degree of relative importance/preference of each sub factor for Environmental impact compared to each other
Pair-wise matrix & priorities for General/Site Suitability Sub- Factor GS1 GS2
GS3 GS4 GS5 GS6 GS7 GS8 GS9 GS1
0 GS11
GS12
GS1- Location 1 GS2-Availability
1
GS3-Distance 1 GS4-Cert- Code
1
GS5-Disaster 1 GS6-Site Form 1 GS7-Design-Form
1
GS8-S-Structure
1
GS9-S-Activities
1
GS10-Mat-Scale
1
GS11Orientation
1
GS12-Spat-Scale
1
Pair-wise matrix & priorities for Environmental/Health impact Sub Factor EH1 EH2
EH3 EH4 EH5 EH6 EH7 EH8 EH9 EH1
0 EH1- Environment Compliance 1 EH2-CO2 Emissions 1 EH3-Users’ Safety 1 EH4-Ozone Depletion 1 EH5-Pesticide Treatment 1 EH6-Climate 1 EH7-Level of Environmental Toxicity
1
EH8-Fossil Fuel Depletion 1 EH9-Nuclear Waste 1 EH10-Waste Disposal 1

373
Pair-wise matrix & priorities for Economic/Cost efficiency Sub Factor C1 C2
C3 C4 C5
C1- Life-Cycle Cost 1 C2-Embodied Energy Cost 1 C3-Capital Cost 1 C4-Labour Cost 1 C5-Maintenance Cost 1
Pair-wise matrix & priorities for Socio-Cultural impact Sub Factor SC1 SC2
SC3 SC4 SC5
SC1- Compatibility with Tradition 1 SC2-Compatibility with Region 1 SC3-Restriction on Usury 1 SC4- Clients’ Preference 1 SC5-Custom Knowledge 1
Pair-wise matrix & priorities for Technical performance Sub Factor T1 T2
T3 T4 T5 T6 T7 T8 T9 T
10 T 11
T 12
T 13
T 14
T 15
T 16
T 17
T18
T1- Recyclability
1
T2-Ease to Remove
1
T3-Maintenance 1 T4-Stree Tolerance
1
T5-Skills Availability
1
T6-Speed of Fixing
1
T7-Fire Resistance
1
T8-S-Thermal Resistance
1
T9-S-Mosisture Resistance
1
T10-Scratch Resistance
1
T11-Weather Resistance
1
T12-Chemical Resistance
1
T13-Resistance to Decay
1
T14-Weight/Mass
1
T15-Life Expectancy
1
T16-Renewable 1 T17-UV Resistance
1
T18-Compatibility
1

374
Pair-wise matrix & priorities for Sensorial impact Sub Factor SN1 SN2
SN3 SN4 SN5 SN6 SN7 SN8 SN9 SN1
0 SN11
SN12 SN13
SN1- Aesthetics 1 SN2-Texture 1 SN3-Colour 1 SN4-Temperature 1 SN5-Acoustics 1 SN6-Odour 1 SN7-Thickness 1 SN8-Glossiness 1 SN9-Hardness 1 SN10-Light Effect 1 SN11-Transluscence 1 SN12-Structure 1
SN13- Thermal Cond.
1
Part II: Relative preference of floor covering alternatives for selection Instruction 1.3: Select the degree of relative preference of each floor alternative with respect to each sub-criterion
Pair-wise matrix & priorities for each floor alternative with respect to each selected sub factor
Location
Material Availability
Distance
Certification Code
A B C A B C A B C A B C A 1 A 1 A 1 A 1 B 1 B 1 B 1 B 1 C 1 C 1 C 1 C 1
Env. Compliance CO2 Emissions Users’ Safety Ozone Depletion
A B C A B C A B C A B C A 1 A 1 A 1 A 1 B 1 B 1 B 1 B 1 C 1 C 1 C 1 C 1
Life Cycle Cost Energy Cost Capital Cost Labour Cost
A B C A B C A B C A B C A A A A B B B B C C C C
Compatibility (Tradition)
Compatibility (Region)
Restriction on Usury Clients’ Preference
A B C A B C A B C A B C A A A A B B B B C C C C
Recyclability Ease to Remove Maintenance Level Stress tolerance
A B C A B C A B C A B C A A A A B B B B C C C C
Aesthetics Texture Colour Temperature
A B C A B C A B C A B C A A A A B B B B C C C C
Thank you very much for your time. NB: Confidentiality and anonymity are guaranteed.

375
Appendix J: Evaluation Questionnaire Survey
School of Architecture and The Built Environment, University of Westminster,
London, UK. NW1 5LS
Email: [email protected] Contact Phone Number: +44 (0) 208 7900 5000 ext. 3721
Dear Sir or Madam,
EXPERT EVALUATION OF THE MSDSS MODEL Given your expertise in green housing design and sustainable construction, the Research Centre of the University of Westminster, is writing to seek your consent as to whether you may be interested in evaluating a prototype MSDSS model developed for evaluating sustainable low-cost green building materials. Please kindly indicate your interest by replying to this email: [email protected] Aim/Objective: The aim of this questionnaire survey is to gather feedbacks and assess experts’ views as to the significance of the model: workability in practice and adequacy in addressing the decision problem confronting design and building professionals on Sustainable Building Material selection. This is meant for validating and further improving the proposed decision support model. The Questionnaire: The questionnaire, which contains just 12 key questions, is in three (3) parts. Section A seeks to collect information on your background; Sections B and C ask for your opinions or comments on specific and general aspects of the model, respectively. There are no correct or incorrect responses; only your much- needed views. Conditions for participating in the survey The MSDSS system has been designed to run under windows and Macintosh with MS Excel, based on the Analytical Hierarchy Process (AHP) model of decision-making. All of data collected from you will be used only for academic purpose. Thank you in advance for your valued and kind consideration. Cyril, I.B.O (Researcher, University of Westminster Research Centre, UK)
CONSENT LETTER
School of Architecture and the Built Environment,
University of Westminster, London, UK.
NW1 5LS Email: [email protected]
Contact Phone Number: +44 (0) 208 7900 5000 ext. 3271 Dear (Sir/Madam),
RE: CONSENT TO TAKE PART IN A SURVEY OF FACTORS INFLUENCING MATERIAL-SELECTION IN THE DESIGN OF LOW-COST GREEN HOUSING
You are being invited as an expert in the building and construction industry, to take part in the survey of an on-going research titled: “MATERIAL SELECTION IN THE DESIGN OF LOW-COST GREEN HOUSING”. Please take time to read the following information carefully and indicate whether or not you or your organisation wish to take part in the survey we are about to undertake, by ticking in the appropriate boxes below, or sending a return-email confirming your interest.
RESEARCH RATIONALE: Over half the world’s population living is now living in cities, and the reality of the population growth and mass urbanization is a dramatic shortfall in the amount and quality of available housing, particularly in many developing countries (UN, 2009; World Bank, 2010). Housing operations however, are estimated to be responsible for 25-40% of energy consumption (IEA, 2008). It is not merely a coincidence that there is a direct correlation between this energy consumption and climate change: as the International Energy Agency (2008) indicates that 40% of global carbon dioxide (CO2) emissions come from the built environment, while building materials account for approximately 15-25% of the energy used in residential buildings alone- including energy spent in manufacturing and transporting materials to site; energy consumption during building construction; and energy used for maintenance during the life span of the building (DCLG, 2007a). With constant dependence on highly polluting, cost and energy intensive imported materials, coupled with the additional strains on an already acute imbalance of the payments situation, their supply seems to have fallen far short of demand and production quality. As a way of making significant contribution towards minimizing CO2 emissions, while at the same time improving the quality of greatly needed housing stock-particularly in the developing countries, the pressure on the demand for low-cost green materials (i.e., materials, in this case locally-sourced and recycled building materials, with low cost, health, and environmental impacts across their life cycle, when compared to competing products that serve the same purpose) has significantly increased; as they possess the greatest features that can help to mitigate climate change with their lowest cost and energy requirements (Shuman, 2008; UN, 2009). Information relating to the impacts of these materials however, appear to be less available (Seyfang, 2009a; Jones, 2009), as yet, evidence indicates that a small proportion of building practitioners seem to have little knowledge of best practices relating to their performance attributes (Malanca, 2010). Given the emphasis on the ways in which decision making impact the material-selection process and invariably, the life cycle performance of the building, there is a real question as to the extent to which the understanding of the basic principles and best practices relevant to the attributes and capabilities of a range of low-cost green material options can enhance their optimization and selection process at the design stage, in order to encourage their wider scale use in the housing industry, thereby improve the process of delivering low cost green housing. As part of an effort to encourage the efficient and wider scale use of low-cost green materials in mainstream practice- for the benefits of housing the teeming population, The School of Architecture and The Built Environment (SABE) of the University of Westminster in conjunction with The Rivers State Sustainable Development Agency (RSSDA) are carrying out a research aimed at investigating “The use of LOW-COST GREEN MATERIALS (mainly, locally-sourced and recycled building materials or products) in the design of LOW-COST GREEN HOUSING”, with the aim to;
“Develop a MATERIAL-SELECTION TOOLKIT, from which data/information appropriate to users’ needs (including architects, designers, material specifiers-amongst others) can be extracted and analyzed, to generate information that can be used to support and assess their decision-making process in the selection of LOW-COST GREEN MATERIALS, at the design stage”. It seeks to create a system which will be compatible as possible with potential users, thus, exploiting the emerging potentials: new and different ideas relating to best practices of such materials, which are rarely used for buildings today such as; compressed earth blocks, earth or sand bags, bamboo, bales of hay, as well as scrap metals, old blocks, tyres, and recycled steel, normally considered as agricultural, post-consumer, or post-industrial waste.
KEY OBJECTIVE OF THE FIELD STUDY To achieve the research aim, the proposed survey is to ask your views as a key stakeholder and/or experienced building practitioner concerning the most essential factors or variables that influence material-selection at the design stage, and to know if you wish to participate in the field study we are about to undertake. Therefore, it includes designers, architects, builders, developers, engineers, manufacturers, material specifiers, clients, green proponents or advocates, students, NGOs, policy makers and etcetera.
Temporary requisition FORM 5 Ad Hoc Payments - Non Teaching
2
REQUISITION FORM 5 – AD HOC NON TEACHING 5A. PERSONAL DETAILS (Sections 5A, B & C must be completed by the ad hoc provider) Are current details already on file for this person?
Yes / No If Yes, the following boxes may be left blank, however the declaration at 5C must be signed.
Date of Birth: (dd/mm/yy)
07/11/1979 NI Number SL305124A
Home Address (In Full)
6A ROSS PARADE,
WALLINGTON, LONDON BOROUGH OF SUTTON, SURREY
Post Code:
SM6 8QG Telephone No.
07538800736 Email:
[email protected] Name of Bank/Building Society:
BARCLAYS Account Name:
IBUCHIM OGUNKAH
Branch Title:
WALLINGTON BRNCH Account No.:
93996476 Building Society Roll No.:
Sort Code:
20-74-09 5B. PERSONAL DETAILS – INFORMATION FOR TAX PURPOSES Please tick one of the following:
This is my first job since last 6 April & I have not been receiving Jobseeker's Allowance or taxable Incapacity Benefit or a state or occupational pension.
This is now my only job but since last 6 April I have had another job or have received taxable Job-seeker's Allowance or Incapacity Benefit. I do not receive a state or occupational pension.
I have another job or receive a state or occupational pension.
!
!
! 5C. SIGNATURE I declare that I have undertaken the work as detailed & the information provided is true & accurate 20/05/2013
Signature and Date
6. AUTHORISATION ORIGINATOR Signature Print Name Date Tel Ext Line Manager
AUTHORISATION Signature Print Name Date Tel Ext CS Manager/Head of Department
N.B In authorising and counter signing this form you are stating that you have checked the details provided and that the information is complete and complies with University procedures. Failure to do so could result in disciplinary action. Incomplete forms will be returned AUTHORISATION Signature Print Name Date Tel Ext Finance Manager
If the payment is for more than £500 or is to a contracted member of staff a Director/Dean must authorise this payment. Director/Dean
!
MW
?-
WWW
4W^ MMWk
I

376
SECTION A: BACKGROUND OF RESPONDENT (S)
Question 1 Please provide the name of your company/Organisation ___________________________________________________________________________ Question 2 Which of these best describes your current job designation? � Material Specification Analyst � Building Energy Expert � Green Building/Sustainability Consultant � Program/Software Designer � Research Consultant (Please specify area of interest) � Other: ______________________________________ Question 3 Please indicate your years of experience in the building construction industry ________ (Min. 0 - Max. 500)
SECTION B: GENERAL VIEW (S) ON THE MSDSS MODEL Question 4 How significant is the MSDSS model in addressing the problems associated with sustainable material evaluation and selection of low-cost green materials? � Highly significant � Significant � Not so significant, as it would make no difference � Not significant at all, as I am not sure of its impact in housing construction Comments (if any): ______________________________________ Question 5 How capable is the MSDSS model in aiding sustainable and well informed choice(s) of materials for low-impact green housing projects? � Highly capable � Capable � Not so capable � Not sure of its capabilities Comments (if any): ______________________________________ Question 6 What would be your view on the resources to be used if the model is to be applied in real life evaluation and selection exercise? � The significant benefits derived from using the proposed model justifies any resource requirements � Would not be too costly to operate at current resource levels � Not so sure of its potential benefits when applied in real life material evaluation and selection exercise(s) � Would be too costly to operate at current resource levels Comments-Please give reasons for your answer: ______________________________________

377
Question 7 What would be your view on the overall interface layout of the MSDSS model? � Comprehensive � Adequate � Inadequate � Poor Please specify in your view, further matters of importance or features that ought to have been disregarded or considered in the development of the model: _______________________._______
SECTION C: VIEWS ON THE MODEL’S INTEROPERABILITY ATTRIBUTES Question 8 Is the proposed model simple, user friendly, flexible, clear, easy to understand and use in conducting material database queries? � Yes, very simple, clear and easy to understand with no practical difficulties � Yes, quite simple, clear and easy to understand but with very little/minor difficulties � No, not as quite as simple, clear and easy to understand as expected � No, not sure of its simplicity, clarity and capability Question 9 Given your response to Q8, please comment on the specific aspects of the model that is in your view, likely to cause minor/major difficulties to its use. _________________________________________________________________________________ Question 10 How efficient is Saaty’s AHP concept and the “1-9” evaluation scale adopted for evaluating and ranking low-cost green building materials? � Highly Efficient � Efficient � Not sure of its efficiency � Not Efficient at all Please identify any other likely MCDM approach and give reasons as to why it would have been preferred to consider in rating the materials against selected factors: _________________________ Question 11 What is your view on the set of factors used for evaluating and rating low-cost green materials? � Highly Adequate � Adequate � Not adequate � Not sure of their adequacy Please list other factors/criteria that ought to have been considered: __________________________ Question 12 In what way(s) do you think the MSDSS model can be improved? Please provide any other general comments that you have on the model or suggestions for further improvement. __________________________________________________________________________________

378
Appendix K: Application and Evaluation of the MSDSS Model
The research objectives posed in chapter one includes developing and testing a sustainable material selection and assessment model for aggregating the key influential factors needed for evaluating the selection of LCGBMCs. This was covered in detail in Chapter five. Therefore, the objectives of this section are to demonstrate this in practical application to material selection problem, and evaluate the performance of the MSDSS model through the lens of the experienced professionals. Since it was anticipated that the initial participants would be willing to provide evidence on how successful the implemented system had achieved the key attributes specified in previous interviews and surveys, an evaluation exercise was carried out at the completion of the model. Consideration of the various evaluation techniques suggests face validity or expert opinion as the only appropriate techniques for evaluating the developed material selection model, since this study aims to validate the model for industry-wide application. Gass (1983) gives an extensive analysis of the various evaluation techniques. The objectives of expert opinion validation are to assess the feasibility of the model in terms of its adequacy and clarity, and to ensure that the model is reasonably robust and will be acceptable to users, much in the same spirit as member checking in qualitative research in real life material selection problems. Questionnaires sent and returned by emails were used to conduct the feedback sessions as specified in section 4.5.2.1 of chapter 4. The key objectives of the expert evaluation sessions were to:
• Allow industry practitioners (including design, building and construction stakeholders) to give expert feedback on the potential benefits and overall value (usability, workability, applicability and limitations) of the system for analysis of LCGBMCs information during the design process;
• Know whether or not the intended users would analyse data such as that which would be encountered in practice and real-life exercise; and,
• Identify areas of weaknesses in the operations provided and in the style of the interactions supported in the system so as to make necessary changes where applicable.

379
During the evaluation process, the following views of the evaluators were requested on: 1. The ease of accessibility to the system; 2. The ease of navigation within the system; 3. The underlying material selection information analytical procedures based on the Analytical Hierarchy Procedure (AHP) concept; 4.Other concepts implemented within the system and 5. Determining the overall value of the software system, including its usability and limitations. The following section describes the sample procedure of the practical application used by the decision model following the AHP decision-making technique.
System Application of the MSDSS Model: The AHP Survey
The worked example for explaining the application and implementation of the MSDSS model in practice involves the application of the model to a realistic but hypothetical scenario of a building material selection problem. The scenario assumed for the worked example is defined as follows: A hypothetical study case The case used intends to provide an indication and practical application of the MSDSS model to material selection problems, following the AHP multi- criteria decision-making technique. The proposed scenario taken as study case is a design of a 5-bedroom single-family home located in a sub-urban residential area of Port Harcourt in Rivers State, Nigeria. An architect is selecting a set of LCGBMCs for a proposed 5-bedroom housing project. The client tells the architect that he wants a building made from materials that are environmentally friendly and cost effective, but does not want the building’s functions to be compromised by the choice of materials. He has three material options (in this case floor materials) from which to decide. The architect is expected to weigh the selected factors and rank the selected material IDs using the MSDSS model, to decide the option that best suits the client’s needs.
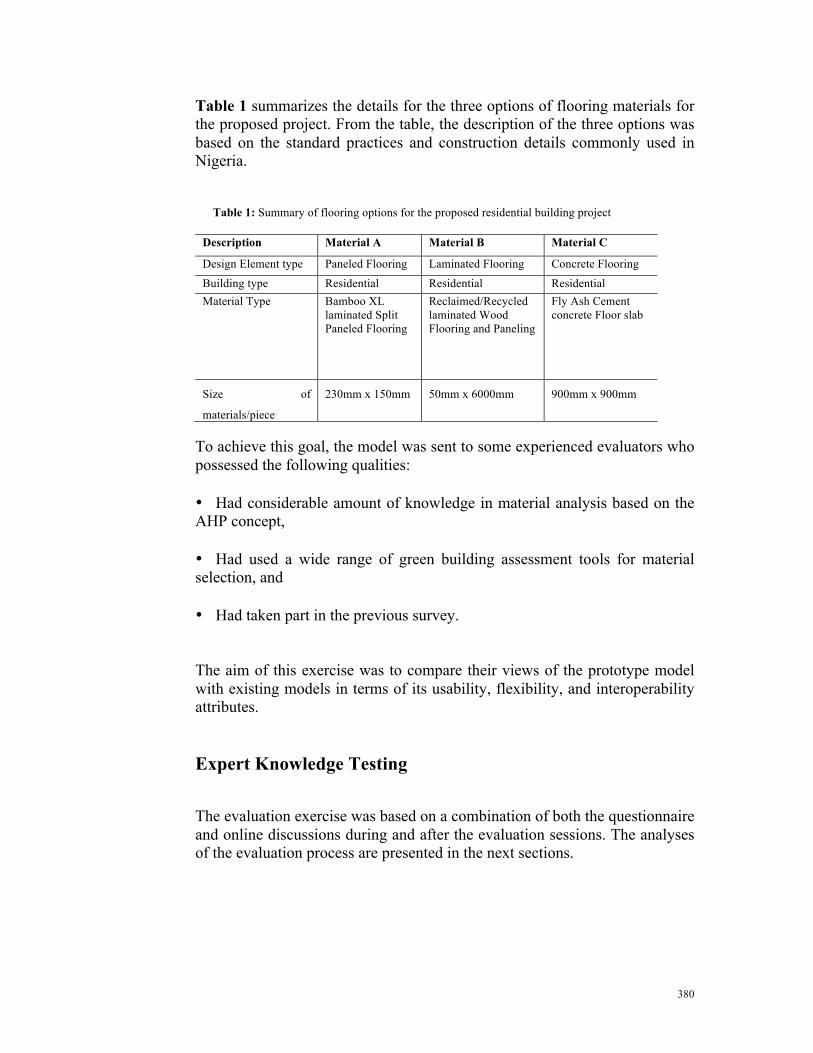
380
Table 1 summarizes the details for the three options of flooring materials for the proposed project. From the table, the description of the three options was based on the standard practices and construction details commonly used in Nigeria.
Table 1: Summary of flooring options for the proposed residential building project
Description Material A Material B Material C
Design Element type Paneled Flooring Laminated Flooring Concrete Flooring
Building type Residential Residential Residential Material Type Bamboo XL
laminated Split Paneled Flooring
Reclaimed/Recycled laminated Wood Flooring and Paneling
Fly Ash Cement concrete Floor slab
Size of
materials/piece
230mm x 150mm 50mm x 6000mm 900mm x 900mm
To achieve this goal, the model was sent to some experienced evaluators who possessed the following qualities: • Had considerable amount of knowledge in material analysis based on the AHP concept, • Had used a wide range of green building assessment tools for material selection, and • Had taken part in the previous survey. The aim of this exercise was to compare their views of the prototype model with existing models in terms of its usability, flexibility, and interoperability attributes. Expert Knowledge Testing
The evaluation exercise was based on a combination of both the questionnaire and online discussions during and after the evaluation sessions. The analyses of the evaluation process are presented in the next sections.

381
General Characteristics of Evaluators and Selection Procedure
Hair et al. (1995) have emphasised the importance of considering not only the statistical significance of a sample population during sampling, but also the quality and practical significance of the results. They note that uneven sample sizes amongst different professional groups may induce bias, hence affect the validity of the results. In order to gather valid and reliable data from potential evaluators, the study invited eligible participants following the proposed sampling methods in section 4.5.2.9 of chapter 4, hence, giving each member of the various housing units a fair chance of being included in the survey. A consent letter-describing the supposed task was sent to ten (10) willing building professionals of the initial survey exercise, requesting their views about the model’s applicability and validity performance in material selection problems. Of the 10 experienced building practitioners contacted, 5 professionals who had considerable knowledge in the application of AHP and represent different fields within the construction sector expressed interest, and were willing to give their views in the AHP survey exercise. The rate of response was an indication that only 5 out of the 10 selected respondents were familiar with the application of the AHP technique to material selection problems. The use of the previous survey respondent’s list as a sample frame had two main advantages: • Firstly, most of the practitioners in this list were individuals in senior positions from building construction firms with relevant expertise and experience in material assessment and selection; and, • Secondly, their prior participation in the earlier survey makes them familiar with this research, which ensured valid response(s).
A list of the experts and their positions in the corresponding companies is summarized in Table 2. The names of the participants and companies were undisclosed to respect their anonymity.
Table 2: List of experts for the AHP survey
Position Years of experience No. of housing projects undertaken
1. Building Sustainability Consultant 25 > 30
2. Senior Architect and Urban Designer 30 > 40 3. Material Specifier 15 25 4. Project Architect 12 10 5. Senior Associate in design and building 22 > 35

382
The Structure of the Questionnaire
The first research instrument used to get valid feedback from the respondents was a questionnaire that captured data about the pair- wise comparison for each of the hierarchy level of the AHP model (questionnaire can be found in Appendix I). Five eligible respondents were made to fill the pair-wise comparison matrices using the verbal scale proposed by Saaty (1980), and calculate the consistency ratio. The second questionnaire (see Appendix J) was designed to facilitate systematic data collection after the model evaluation exercise. The first section of the second questionnaire sought to obtain general information about the extent of evaluator’s knowledge of the underlying software packages, whether the evaluator conducted any form of material selection information analysis in their current work, and how often these analyses were conducted. The second part was synthesised with reference to an AHP matrix proposed by Saaty (2000), while the final part focused on areas that needed further improvements. According to Reza et al. (2010), AHP is a subjective MCDM method that does not necessarily involve a large sample. Wong & Li (2008) suggest that AHP surveys are useful for research focusing on a specific issue where large samples are not mandatory. Cheng and Li (2002) pointed out that AHP method might be impractical for a survey with a large sample size, as respondents may have tendencies to provide arbitrary and inconsistent answers. Previous studies have conducted AHP survey using a small sample size. For example, Cheng & Li (2002) invited 9 construction experts to undertake a survey to test comparability of critical success factors for construction partnering. Lam & Zhao (1998) also invited 8 experts for a quality-of-teaching survey. Both studies confirmed the usefulness of small sampling in AHP survey. Since the assignment of weights in this research required logical and analytical thinking, and that larger samples may affect the viability of the data, only a small sample of the relevant building experts who were capable of providing deeper insights were highly valuable to this empirical inquiry. This ensured the validity and quality of the data as 5 out of 10 participants who had prior knowledge of the AHP expressed willingness. The package included the model, evaluation questionnaire and a cover letter stating the purpose of the research, the evaluation process and what was expected of them. To achieve this objective, this research adopted Chua’s et al. (1999) approach based on a number of procedures followed during the exercise. The following procedures were undertaken:
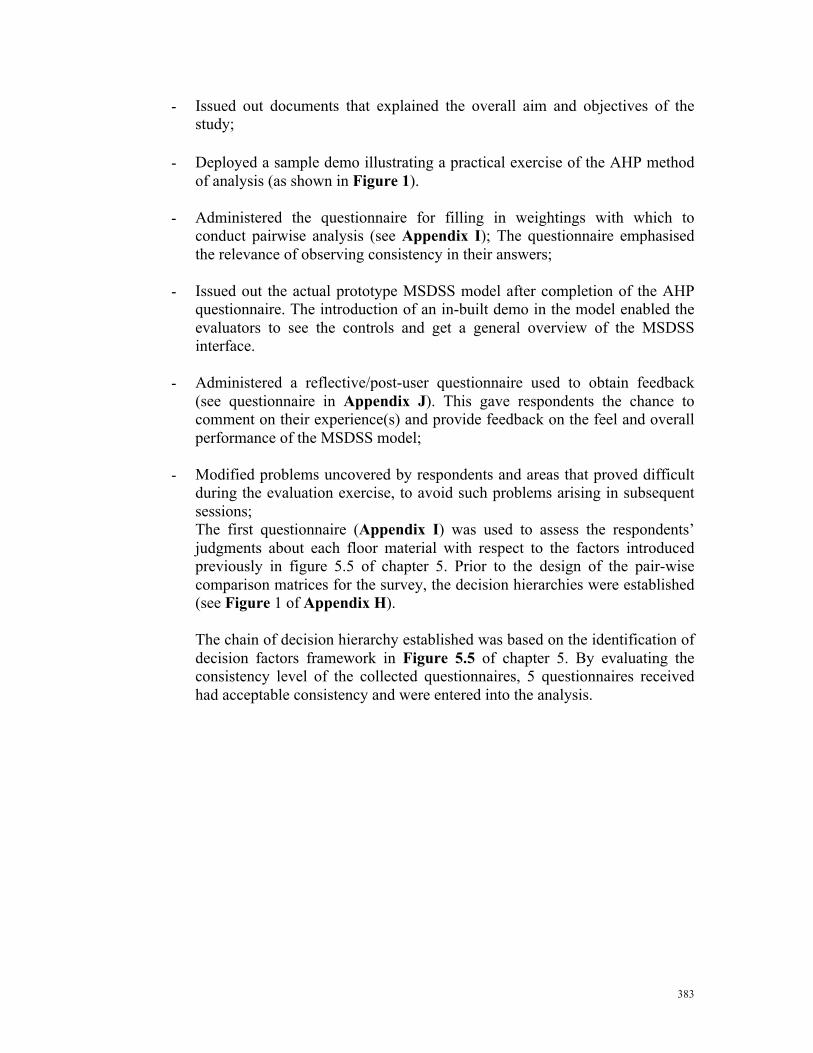
383
- Issued out documents that explained the overall aim and objectives of the study;
- Deployed a sample demo illustrating a practical exercise of the AHP method
of analysis (as shown in Figure 1).
- Administered the questionnaire for filling in weightings with which to conduct pairwise analysis (see Appendix I); The questionnaire emphasised the relevance of observing consistency in their answers;
- Issued out the actual prototype MSDSS model after completion of the AHP questionnaire. The introduction of an in-built demo in the model enabled the evaluators to see the controls and get a general overview of the MSDSS interface.
- Administered a reflective/post-user questionnaire used to obtain feedback (see questionnaire in Appendix J). This gave respondents the chance to comment on their experience(s) and provide feedback on the feel and overall performance of the MSDSS model;
- Modified problems uncovered by respondents and areas that proved difficult
during the evaluation exercise, to avoid such problems arising in subsequent sessions; The first questionnaire (Appendix I) was used to assess the respondents’ judgments about each floor material with respect to the factors introduced previously in figure 5.5 of chapter 5. Prior to the design of the pair-wise comparison matrices for the survey, the decision hierarchies were established (see Figure 1 of Appendix H). The chain of decision hierarchy established was based on the identification of decision factors framework in Figure 5.5 of chapter 5. By evaluating the consistency level of the collected questionnaires, 5 questionnaires received had acceptable consistency and were entered into the analysis.
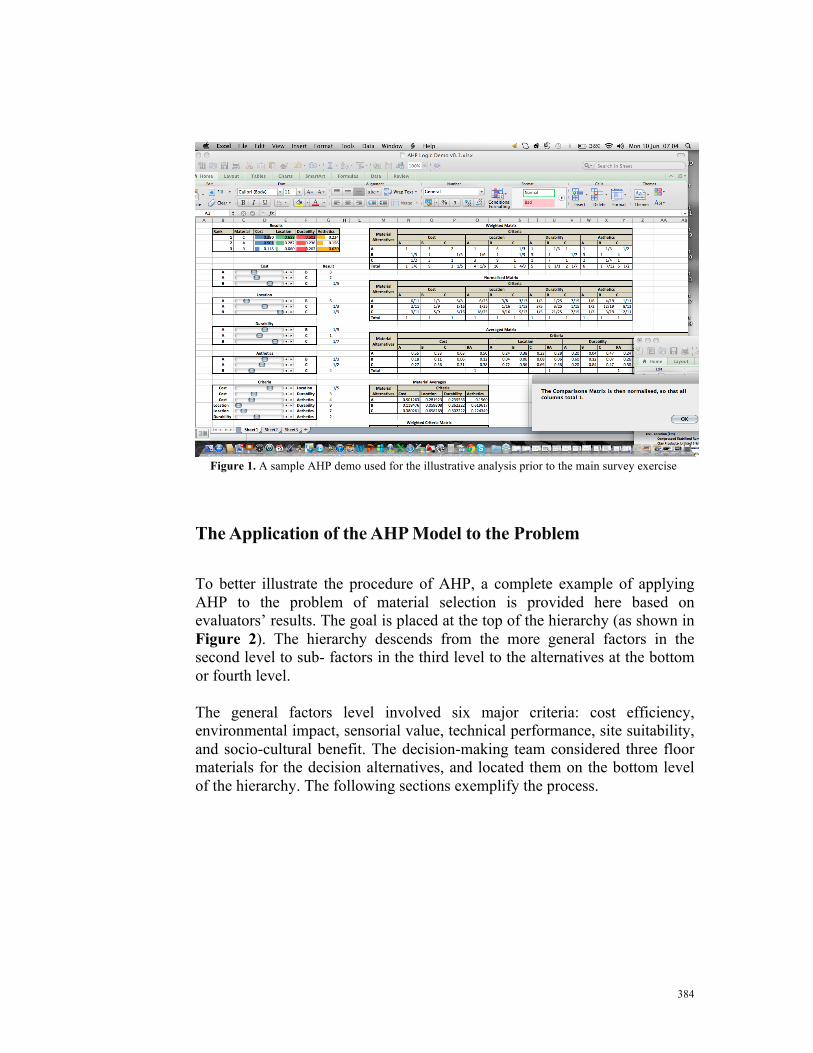
384
Figure 1. A sample AHP demo used for the illustrative analysis prior to the main survey exercise
The Application of the AHP Model to the Problem
To better illustrate the procedure of AHP, a complete example of applying AHP to the problem of material selection is provided here based on evaluators’ results. The goal is placed at the top of the hierarchy (as shown in Figure 2). The hierarchy descends from the more general factors in the second level to sub- factors in the third level to the alternatives at the bottom or fourth level. The general factors level involved six major criteria: cost efficiency, environmental impact, sensorial value, technical performance, site suitability, and socio-cultural benefit. The decision-making team considered three floor materials for the decision alternatives, and located them on the bottom level of the hierarchy. The following sections exemplify the process.

385
Figure 2. Shows the hierarchical representation of the floor material selection model
SELECTING APPROPRIATE LOW-COST GREEN BUILDING MATERIAL
GENERAL/SITE
FACTOR
ECONOMIC
FACTOR
ENVIRONMENTAL
FACTOR
SOCIO-CULTURAL
FACTOR
TECHNICAL
FACTOR
SENSORIAL
FACTOR
GS4-Building Certification
GS1-Location
GS2-Availability
GS3-Distance
GS5-Designers’ Experience
GS5-Disaster Prone
GS6-Site Geometry
GS8-Spatial Structure
GS9- Spatial Activities
GS10- Material Scale
EH1- Env. Compliance
EH2-CO2 Emissions
EH3-Users’ Safety
EH4-Ozone Depletion
EH5-Pesticide Treatment
EH6-Climate
EH7-Env-Toxicity
EH8-Fossil Depletion
EH9-Nuclear Waste
EH10-Waste Disposal
C1-Life-Ccycle Cost
C2-Embodied Energy Cost
C3-Capital Cost
C4-Labour Cost
C5-Replacement Cost
C6-Maint.enace Cost
SC1-Compatible (Tradition)
SC2-Compatle (Region)
SC3-Control on Usury
SC4-Clients’ Preference
SC5-Custom Knowledge
T1-Recyclability
T2-Removability
T3-Maintenance
T4-Stress Tolerance
T5-Available Skills
T6-Fixing Speed
T7-Fire Resistance
SN1-Aesthetics
SN2-Texture
SN3-Colour
SN4-Temperature
SN5-Acoustics
SN6-Odour
SN7-Thick/Thin
SN8-Glosiness
SN9-Hardness
SN10-Lighting Effect
Goal
Main Factors
Sub-Factors
Alternatives Alternative Choice A Alternative Choice B Alternative Choice C
T8-Thermal Resist
T9-Moisture Resist
T10-Scratch Resist
T11-Weather Resist
T12-Chemical Resist
T13-Resist Decay
T14- Weight
T15-Life Expectancy
T17-UV Resistance
T18-Compatibility
SN11-Translucence
SN12-Structure

386
Step 1: Decomposition of the Decision Problem
This stage of the evaluation process offered users the opportunity to define the problem (i.e., the selection of a suitable floor material). Define the Main Goal and Identify Feasible Material Alternatives
• The first step of the methodology was to define the main goal of the intended task, by identifying the design element needed for the analysis, and entering the relevant dimensional scales for the suggested design element (Figure 3).
Figure 3. An illustrative example of the dimensional scale for the elected design element
• Next was to generate the set of all possible alternatives that were available for the intended task. The system prompts the user to identify a set of feasible floor material alternatives based on a range of material selection heuristics/rules as shown in Figure 4.
Figure 4. An illustrative example of the selection heuristics for the elected design element

387
Step 2: Performing Pair-wise Comparisons of Parent Factors
• Thereafter was to perform pair-wise comparisons between the parent elements in the adjacent upper level. At this point, an acceptable Consistency Ratio (CR) ≤ 0.10 had been achieved before proceeding. In exceptional cases respondents had to re-evaluate the factor-weightings until consistency was achieved. The individual judgments were then aggregated, basing its analysis on the geometric mean technique as Saaty (2001) suggested. Pair-Wise Analysis of the main or parent factors • To determine the relative importance of each parent element in the adjacent upper level, the five (5) respondents had to fill out the weightings for each parent factor based on their aprioristic knowledge and individual weighting preference (see Figure 5 and 6). The results of the pair-wise comparison matrices obtained from the 5 respondents were combined using the geometric mean approach at each hierarchy level to obtain the corresponding consensus pair-wise comparison matrices, as shown in Table 3. • This was then automatically translated into the corresponding largest eigenvalue problem, to find the normalised and unique priority weights for each factor (as shown in Table 4).
Figure 5. Corresponding consensus pair-wise comparison matrices for main factors
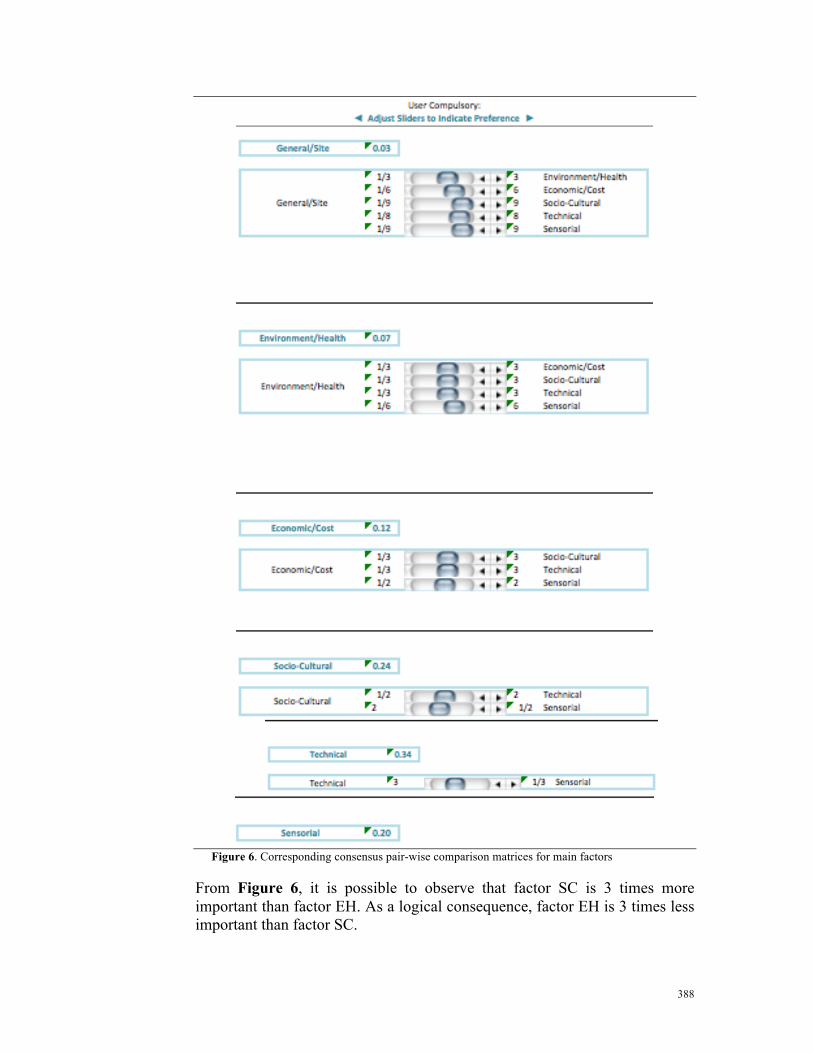
388
Figure 6. Corresponding consensus pair-wise comparison matrices for main factors
From Figure 6, it is possible to observe that factor SC is 3 times more important than factor EH. As a logical consequence, factor EH is 3 times less important than factor SC.

389
Table 3: Corresponding consensus pair-wise comparison matrices for main factors
Weighted Criteria Matrix
Gen
eral
/Site
Env
iron
men
t
Eco
nom
ic/C
ost
Soci
o-C
ultu
ral
Tec
hnic
al
Sens
oria
l
General/Site 1.00 0.33 0.17 0.11 0.13 0.11 Environment/Health 3.00 1.00 0.33 0.33 0.33 0.17 Economic/Cost 6.00 3.00 1.00 0.33 0.33 0.50 Socio-Cultural 9.00 3.00 3.00 1.00 0.50 2.00 Technical 8.00 3.00 3.00 2.00 1.00 3.00 Sensorial 9.00 6.00 2.00 0.50 0.33 1.00 Total 36.00 16.33 9.50 4.28 2.63 6.78
Table 3 represents the principal matrix of comparison of the main/parent factors in relation to the overall objective of the problem
• Subsequently, the system normalised the matrices of each parent factor (by dividing each cell value by the sum of each column) as shown in Table 3.
• This then generated a range of matrices for each parent factor on each column of the matrix, and then averaged across the rows to produce the local priority vector representing the relative importance of each parent factor. The resulting priority vectors were given in Table 4.
Table 4: Computing the relative priority scores of main/parent factors
Normalised Average Criteria Matrix
Gen
eral/Site
Environm
ent/H
ealth
Econ
omic/Cost
Socio-‐Cu
ltural
Technical
Sensorial
Av. λMAX General/Site 0.03 0.02 0.02 0.03 0.05 0.02 0.03 0.934297901 Environment/Health 0.08 0.06 0.04 0.08 0.13 0.02 0.07 1.113775203 Economic/Cost 0.17 0.18 0.11 0.08 0.13 0.07 0.12 1.162609985 Socio-‐Cultural 0.25 0.18 0.32 0.23 0.19 0.30 0.24 1.04719097 Technical 0.22 0.18 0.32 0.47 0.38 0.44 0.34 0.880596922 Sensorial 0.25 0.37 0.21 0.12 0.13 0.15 0.20 1.377336489 Total 1.00 1.00 1.00 1.00 1.00 1.00 1.00 6.52
Matrix
Size 6 RI 1.24
CI 0.103
CR 0.083064516

390
Table 4: Relative priority of criteria
Factor/Criterion Relative priority General/Site
0.030
Environmental/Health 0.070 Economic/Cost
0.120
Socio Cultural
0.240
Technical
0.340
Sensorial
0.200
• The CR was then calculated with the knowledge of the consistency index (CI= 0.103) and knowing that the relative index for matrix of the order of six (6) is (RI= 1.24).
• This was calculated as CR = CI/RI = 0.103/1.24= 0.08306. With a CR of 0.083 less than 0.10, the matrix was considered to be consistent.
Step 3: Pair-Wise Analysis of the Sub-Factors
• The next task was to perform pair-wise comparisons among factors of the sub-categorical level as shown from table 5 -16.
• The system automatically generated a range of matrices for each sub-factor on each column of the matrix based on the individual weighting preference of the respondents.
• The mean of the matrices across each row were then calculated to produce the local priority vector representing the relative importance of each sub-factor.
Table 5: Pair-wise matrix & priority scores for General/Site Factors
Score GS1 GS2 GS3 GS4 GS6 GS8 GS9 GS10 GS11 GS12
GS1- Location (Mph) 0.197 1.00 2.00 3.00 2.00 4.00 2.00 2.00 2.00 3.00 3.00
GS2- Material Availability 0.158 0.50 1.00 2.00 2.00 2.00 3.00 3.00 3.00 2.00 3.00
GS3-Distance to Market (km/h) 0.127 0.33 0.50 1.00 2.00 2.00 2.00 3.00 3.00 3.00 2.00
GS4-Building Certification code 0.115 0.50 0.50 0.50 1.00 2.00 2.00 3.00 2.00 4.00 2.00
GS6-Withstand site natural disaster 0.083 0.25 0.50 0.50 0.50 1.00 2.00 2.00 2.00 2.00 2.00
GS8-Conforms to site geometry 0.114 0.50 0.33 0.50 0.50 0.50 1.00 3.00 7.00 3.00 4.00
GS9-Conforms to spatial structure 0.069 0.50 0.33 0.33 0.33 0.50 0.33 1.00 3.00 3.00 2.00 GS10-Conforms to all spatial activities 0.053 0.50 0.33 0.33 0.50 0.50 0.14 0.33 1.00 2.00 2.00 GS11-Conforms to design geometry 0.044 0.33 0.50 0.33 0.25 0.50 0.33 0.33 0.50 1.00 2.00 GS12-Mat. Spatial scale/Size (sq./m) 0.040 0.33 0.33 0.50 0.50 0.50 0.25 0.50 0.50 0.50 1.00
CR 0.09

391
Table 6: Normalised matrices for General/Site Factors
Normalised Matrix λMAX λMAX 11
0.210 0.315 0.333 0.208 0.296 0.153 0.110 0.083 0.127 0.130 0.935 Matrix Size 10
0.105 0.157 0.222 0.208 0.148 0.229 0.165 0.125 0.085 0.130 0.999 CI 0.14
0.070 0.078 0.111 0.208 0.148 0.153 0.165 0.125 0.127 0.086 1.147 RI 1.49
0.105 0.078 0.055 0.104 0.148 0.153 0.165 0.083 0.170 0.086 1.103 CR 0.09
0.052 0.078 0.055 0.052 0.074 0.153 0.110 0.083 0.085 0.086 1.123
0.105 0.052 0.055 0.052 0.037 0.076 0.165 0.291 0.127 0.173 1.486
0.105 0.052 0.037 0.034 0.037 0.025 0.055 0.12 0.127 0.086 1.248
0.105 0.052 0.037 0.052 0.037 0.010 0.018 0.041 0.085 0.086 1.265
0.070 0.078 0.037 0.026 0.037 0.025 0.018 0.020 0.042 0.086 1.042
0.070 0.052 0.055 0.052 0.037 0.019 0.027 0.020 0.021 0.043 0.920 C.I. =0.14, R.I. =1.49, C.R. =0.09
Table 7: Pair-wise matrix & priority scores for Environmental/Health Factors
Score EH1 EH2 EH3 EH4 EH5 EH6 EH7 EH8 EH9 EH10
EH1 -Env. Statutory Compliance 0.202 1.00 4.00 3.00 2.00 2.00 3.00 3.00 2.00 2.00 2.00
EH2-Embodied C02 Emission (KgC02/m2) 0.124 0.25 1.00 2.00 3.00 2.00 2.00 2.00 2.00 3.00 0.50
EH3- Human Toxicity-Users Safety level 0.113 0.33 0.50 1.00 2.00 2.00 2.00 3.00 3.00 3.00 0.50
EH4- Ozone depletion rate 0.086 0.50 0.33 0.50 1.00 2.00 2.00 2.00 2.00 2.00 0.33
EH5- Amt. of Pesticide Treatment (l/m2) 0.078 0.50 0.50 0.50 0.50 1.00 2.00 3.00 2.00 0.33 0.50 EH6- Complies with the Climate of the region 0.067 0.33 0.50 0.50 0.50 0.50 1.00 2.00 2.00 2.00 0.50
EH7- Env. Toxicity (land, water, Animals) 0.053 0.33 0.50 0.33 0.50 0.33 0.50 1.00 2.00 2.00 0.33
EH8- Fossil fuel/Habitat depletion 0.058 0.50 0.50 0.33 0.50 0.50 0.50 0.50 1.00 4.00 0.25
EH9- Nuclear waste rate 0.057 0.50 0.33 0.33 0.50 3.00 0.50 0.50 0.25 1.00 0.33
EH10- Waste Disposal rate 0.162 0.50 2.00 2.00 3.00 2.00 2.00 3.00 4.00 3.00 1.00
CR 0.10
Table 8: Normalised matrices for Environmental/Health Factors
Normalised Matrix λMAX λMAX 11
0.210 0.393 0.285 0.148 0.130 0.193 0.15 0.098 0.089 0.32 0.960 Matrix Size 10
0.052 0.098 0.190 0.222 0.130 0.129 0.1 0.098 0.134 0.08 1.257 CI 0.15
0.070 0.049 0.095 0.148 0.130 0.129 0.15 0.148 0.134 0.08 1.191 RI 1.49
0.105 0.032 0.047 0.074 0.130 0.129 0.1 0.098 0.089 0.05 1.162 CR 0.10
0.105 0.049 0.047 0.037 0.065 0.129 0.15 0.098 0.014 0.08 1.191
0.070 0.049 0.047 0.037 0.032 0.064 0.1 0.098 0.089 0.08 1.038
0.070 0.049 0.031 0.037 0.020 0.032 0.05 0.098 0.089 0.05 1.068
0.105 0.049 0.031 0.037 0.032 0.032 0.025 0.049 0.179 0.04 1.178
0.105 0.032 0.031 0.037 0.195 0.032 0.025 0.012 0.044 0.05 1.273
0.105 0.196 0.190 0.222 0.130 0.129 0.15 0.197 0.134 0.16 1.010 C.I. =0.15, R.I. =1.49, C.R. =0.10

392
Table 9: Pair-wise matrix & priority scores for Economic/Cost Factors
Score C1 C2 C3 C4 C5 C6
C1- Total life-cycle cost ($) 0.347 1.00 2.00 2.00 3.00 5.00 9.00
C2- Material embodied energy cost ($) 0.247 0.50 1.00 2.00 4.00 4.00 3.00 C3- Material capital cost ($) 0.186 0.50 0.50 1.00 2.00 4.00 6.00 C4- Labour/Installation cost ($/sqft) 0.120 0.33 0.25 0.50 1.00 3.00 5.00
C5- Material replacement cost ($) 0.063 0.20 0.25 0.25 0.33 1.00 3.00
C6- Material Maintenance cost ($) 0.037 0.11 0.33 0.17 0.20 0.33 1.00 CR 0.07
Table 10: Normalised matrices for Economic/Cost Factors
Normalised Matrix λMAX λMAX 6
0.378 0.461 0.338 0.284 0.288 0.333 0.919 Matrix Size 6
0.18 0.230 0.338 0.379 0.230 0.111 1.069 CI 0.09 0.18 0.115 0.169 0.189 0.230 0.222 1.101 RI 1.24 0.12 0.057 0.084 0.094 0.173 0.185 1.267 CR 0.07
0.075 0.057 0.042 0.031 0.057 0.111 1.086
0.042 0.076 0.028 0.018 0.019 0.037 1.001
C.I. =0.09, R.I. =1.24, C.R. =0.07
Table 11: Pair-wise matrix & priority scores for Socio-Cultural Factors
Score SC1 SC2 SC3 SC4 SC5 SC1- Material compatibility with traditions 0.164 1.00 2.00 0.33 0.50 2.00
SC2- Material compatibility with region 0.102 0.50 1.00 0.50 0.50 0.33 SC3- Cultural restriction on usury 0.362 3.00 2.00 1.00 2.00 3.00
SC4- Client’s preference rating 0.227 2.00 2.00 0.50 1.00 2.00
SC5- Conforms to Knowledge of custom 0.146 0.50 3.00 0.33 0.50 1.00 CR 0.08
Table 12: Normalised matrices for Socio-Cultural Factors
Normalised Matrix λMAX λMAX 5
0.142 0.2 0.125 0.111 0.24 1.147 Matrix Size 5
0.071 0.1 0.187 0.111 0.04 1.020 CI 0.09
0.428 0.2 0.375 0.444 0.36 0.964 RI 1.12
0.285 0.2 0.1875 0.222 0.24 1.022 CR 0.08
0.071 0.3 0.125 0.111 0.12 1.213
C.I. =0.09, R.I. =1.12, C.R. =0.08

393
Table 13: Pair-wise matrix & priority scores for Technical Factors
Score T1 T2 T3 T4 T5 T6 T7 T8 T9 T10 T11 T12 T13 T14 T15 T16 T17 T17 T1-Recyclable 0.09 1.00 2.00 2.00 3.00 0.50 2.00 2.00 0.50 0.50 2.00 3.00 2.00 2.00 2.00 3.00 0.50 0.33 0.50 T2-Ease to remove 0.10 0.50 1.00 0.33 0.33 0.33 3.00 2.00 3.00 0.50 2.00 3.00 2.00 2.00 3.00 2.00 3.00 2.00 2.00 T3- Maintenance level 0.06 0.50 3.00 1.00 1.00 1.00 1.00 1.00 1.00 1.00 1.00 1.00 1.00 1.00 1.00 1.00 1.00 1.00 1.00 T4-Expansion Tolerance 0.06 0.33 3.00 1.00 1.00 1.00 1.00 1.00 1.00 1.00 1.00 1.00 1.00 1.00 1.00 1.00 1.00 1.00 1.00 T5- Conforms to skills 0.06 2.00 3.00 1.00 1.00 1.00 1.00 1.00 1.00 1.00 1.00 1.00 1.00 1.00 1.00 1.00 1.00 1.00 1.00
T6- Ease of fixing 0.05 0.50 0.33 1.00 1.00 1.00 1.00 1.00 1.00 1.00 1.00 1.00 1.00 1.00 1.00 1.00 1.00 1.00 1.00 T7- Fire resistance 0.04 0.50 0.50 1.00 1.00 1.00 1.00 1.00 1.00 1.00 1.00 1.00 1.00 0.11 1.00 0.14 1.00 1.00 1.00 T8- Thermal resistance 0.05 2.00 0.33 1.00 1.00 1.00 1.00 1.00 1.00 1.00 1.00 1.00 1.00 1.00 1.00 1.00 0.14 1.00 1.00 T9- Moisture resistance 0.06 2.00 2.00 1.00 1.00 1.00 1.00 1.00 1.00 1.00 1.00 1.00 1.00 1.00 1.00 1.00 1.00 1.00 1.00 T10- Scratch resistance 0.05 0.50 0.50 1.00 1.00 1.00 1.00 1.00 1.00 1.00 1.00 1.00 1.00 1.00 1.00 1.00 1.00 1.00 1.00 T11- Weather resistance 0.05 0.33 0.33 1.00 1.00 1.00 1.00 1.00 1.00 1.00 1.00 1.00 1.00 1.00 1.00 1.00 1.00 1.00 1.00 T12- Chemical resistance 0.05 0.50 0.50 1.00 1.00 1.00 1.00 1.00 1.00 1.00 1.00 1.00 1.00 1.00 1.00 1.00 1.00 1.00 1.00 T13- Resistance to decay 0.07 0.50 0.50 1.00 1.00 1.00 1.00 9.00 1.00 1.00 1.00 1.00 1.00 1.00 1.00 1.00 1.00 1.00 1.00
T14- Weight of material 0.05 0.50 0.33 1.00 1.00 1.00 1.00 1.00 1.00 1.00 1.00 1.00 1.00 1.00 1.00 1.00 1.00 1.00 1.00 T15- Life expectancy 0.07 0.33 0.50 1.00 1.00 1.00 1.00 7.00 1.00 1.00 1.00 1.00 1.00 1.00 1.00 1.00 0.25 1.00 1.00 T16- Biodegradable 0.08 2.00 0.33 1.00 1.00 1.00 1.00 1.00 7.00 1.00 1.00 1.00 1.00 1.00 1.00 4.00 1.00 1.00 1.00 T17-UV Resistance 0.06 3.00 0.50 1.00 1.00 1.00 1.00 1.00 1.00 1.00 1.00 1.00 1.00 1.00 1.00 1.00 1.00 1.00 1.00 T18-Compatibility 0.05 0.50 1.00 1.00 1.00 1.00 1.00 1.00 1.00 1.00 1.00 1.00 1.00 1.00 1.00 1.00 1.00 1.00 1.00
Table 14: Normalised matrices for Technical Factors
Normalised Matrix
λMAX λMAX 21 0.05 0.11 0.11 0.17 0.02 0.11 0.11 0.02 0.02 0.11 0.17 0.11 0.11 0.11 0.17 0.02 0.01 0.02 1.602 Size 18 0.02 0.05 0.01 0.01 0.01 0.17 0.11 0.17 0.02 0.11 0.17 0.11 0.11 0.17 0.11 0.17 0.11 0.11 1.778 CI 0.15 0.02 0.17 0.05 0.05 0.05 0.05 0.05 0.05 0.05 0.05 0.05 0.05 0.05 0.05 0.05 0.05 0.05 0.05 1.083 RI 1.69 0.01 0.17 0.05 0.05 0.05 0.05 0.05 0.05 0.05 0.05 0.05 0.05 0.05 0.05 0.05 0.05 0.05 0.05 1.074 CR 0.09
0.11 0.17 0.05 0.05 0.05 0.05 0.05 0.05 0.05 0.05 0.05 0.05 0.05 0.05 0.05 0.05 0.05 0.05 1.167 0.02 0.01 0.05 0.05 0.05 0.05 0.05 0.05 0.05 0.05 0.05 0.05 0.05 0.05 0.05 0.05 0.05 0.05 0.935 0.02 0.02 0.05 0.05 0.05 0.05 0.05 0.05 0.05 0.05 0.05 0.05 0.00 0.05 0.01 0.05 0.05 0.05 0.847 0.11 0.01 0.05 0.05 0.05 0.05 0.05 0.05 0.05 0.05 0.05 0.05 0.05 0.05 0.05 0.01 0.05 0.05 0.971 0.11 0.11 0.05 0.05 0.05 0.05 0.05 0.05 0.05 0.05 0.05 0.05 0.05 0.05 0.05 0.05 0.05 0.05 1.111 0.02 0.02 0.05 0.05 0.05 0.05 0.05 0.05 0.05 0.05 0.05 0.05 0.05 0.05 0.05 0.05 0.05 0.05 0.944 0.01 0.01 0.05 0.05 0.05 0.05 0.05 0.05 0.05 0.05 0.05 0.05 0.05 0.05 0.05 0.05 0.05 0.05 0.926 0.02 0.02 0.05 0.05 0.05 0.05 0.05 0.05 0.05 0.05 0.05 0.05 0.05 0.05 0.05 0.05 0.05 0.05 0.944 0.02 0.02 0.05 0.05 0.05 0.05 0.51 0.05 0.05 0.05 0.05 0.05 0.05 0.05 0.05 0.05 0.05 0.05 1.389 0.02 0.01 0.05 0.05 0.05 0.05 0.05 0.05 0.05 0.05 0.05 0.05 0.05 0.05 0.05 0.05 0.05 0.05 0.935 0.01 0.02 0.05 0.05 0.05 0.05 0.4 0.05 0.05 0.05 0.05 0.05 0.05 0.05 0.05 0.01 0.05 0.05 1.227 0.11 0.01 0.05 0.05 0.05 0.05 0.05 0.4 0.05 0.05 0.05 0.05 0.05 0.05 0.22 0.05 0.05 0.05 1.519 0.17 0.02 0.05 0.05 0.05 0.05 0.05 0.05 0.05 0.05 0.05 0.05 0.05 0.05 0.05 0.05 0.05 0.05 1.083 0.02 0.05 0.05 0.05 0.05 0.05 0.05 0.05 0.05 0.05 0.05 0.05 0.05 0.05 0.05 0.05 0.05 0.05 0.972

394
Table 15: Pair-wise matrix & priority scores for Sensorial Factors
Score SN1 SN2 SN3 SN4 SN5 SN6 SN7 SN8 SN9 SN10 SN11 SN12 SN13 SN1- Aesthetics 0.077 1.00 1 1 1 1 1 1 1 1 1 1 1 1 SN2- Texture 0.077 1.00 1.00 1 1 1 1 1 1 1 1 1 1 1 SN3- Colour 0.077 1.00 1.00 1.00 1 1 1 1 1 1 1 1 1 1 SN4- Temperature 0.077 1.00 1.00 1.00 1.00 1 1 1 1 1 1 1 1 1 SN5- Acoustics 0.106 1.00 1.00 1.00 1.00 1.00 2 0 4 0 2 0 2 2 SN6- Odour 0.087 1.00 1.00 1.00 1.00 0.50 1.00 2 1 0 2 1 2 2 SN7- Thickness/Thinness 0.107 1.00 1.00 1.00 1.00 3.00 0.50 1.00 2 2 2 3 0 0 SN8- Glossiness/fineness 0.075 1.00 1.00 1.00 1.00 0.25 2.00 0.50 1.00 1 1 1 1 1 SN9- Strength/Hardness 0.109 1.00 1.00 1.00 1.00 3.00 5.00 0.50 1.00 1.00 1 1 1 1 SN10- Lighting effect 0.068 1.00 1.00 1.00 1.00 0.50 0.50 0.50 1.00 1.00 1.00 1 1 1 SN11- Translucence 0.108 1.00 1.00 1.00 1.00 6.00 2.00 0.33 1.00 1.00 1.00 1.00 1 1 SN12- Structure 0.089 1.00 1.00 1.00 1.00 0.50 0.50 4.00 1.00 1.00 1.00 1.00 1.00 1 SN13- Thermal 0.083 1.00 1.00 1.00 1.00 0.50 0.50 3.00 1.00 1.00 1.00 1.00 1.00 1.00
CR 0.10
Table 16: Normalised matrices for Sensorial Factors
Normalised Matrix λMAX λMAX 15
0.076 0.076 0.076 0.076 0.076 0.076 0.076 0.076 0.076 0.076 0.076 0.076 0.076 1.000 Matrix
Size 13 0.076 0.076 0.076 0.076 0.076 0.076 0.076 0.076 0.076 0.076 0.076 0.076 0.076 1.000 CI 0.15 0.076 0.076 0.076 0.076 0.076 0.076 0.076 0.076 0.076 0.076 0.076 0.076 0.076 1.000 RI 1.5551 0.076 0.076 0.076 0.076 0.076 0.076 0.076 0.076 0.076 0.076 0.076 0.076 0.076 1.000 CR 0.10 0.076 0.076 0.076 0.076 0.076 0.153 0.025 0.307 0.025 0.153 0.012 0.153 0.153 1.372 0.076 0.076 0.076 0.076 0.038 0.076 0.153 0.038 0.015 0.153 0.038 0.153 0.153 1.131 0.076 0.076 0.076 0.076 0.230 0.038 0.076 0.153 0.153 0.153 0.230 0.019 0.025 1.391 0.076 0.076 0.076 0.076 0.019 0.153 0.038 0.076 0.076 0.076 0.076 0.076 0.076 0.981 0.076 0.076 0.076 0.076 0.230 0.384 0.038 0.076 0.076 0.076 0.076 0.076 0.076 1.423 0.076 0.076 0.076 0.076 0.038 0.038 0.038 0.076 0.076 0.076 0.076 0.076 0.076 0.885 0.076 0.076 0.076 0.076 0.461 0.153 0.025 0.076 0.076 0.076 0.076 0.076 0.076 1.410 0.076 0.076 0.076 0.076 0.038 0.038 0.307 0.076 0.076 0.076 0.076 0.076 0.076 1.154 0.076 0.076 0.076 0.076 0.038 0.038 0.230 0.076 0.076 0.076 0.076 0.076 0.076 1.077
C.I. =0.15, R.I. =1.5551, C.R. =0.10

395
• The criteria matrices of each sub-factor were then normalised (by dividing a cell value by the sum of each column) and then checked for consistency as shown in tables 6, 8, 10, 12, 14 and 16.
Step 4: Determining the Weighting Scores of the Factors
• The next stage of the assessment process was to find the final global weightings of both the parent and sub-factors that will be used subsequently with the normalized priority weights for each pair-wise comparison judgment matrices of each floor material alternative. • To determine the final or amalgamated weightings of factors, the priority vectors (1) of the parent factors were multiplied by the corresponding relative priority vectors of each sub-criterion weighting vectors (2) to obtain the (amalgamated/final) weighting (3) as shown in Table 17. The following steps describes the ways by which the various weighting vectors of each criterion are derived • Main factor weight 1 (or the main/parent factor) is derived from users’ judgement with respect to a single main criterion. The selected value serves as the priority vector of the main criteria needed for evaluating material choice. The selected value as shown in Table 17 include: GS=0.026, EH=0.068, C=0.122, SC=0.245, T=0.335 and SN=0.203 • Sub-Factorial weight 2 (or the sub-factor) is derived from user’s judgment with respect to each sub-factor. Some of the selected values that serve as the corresponding relative priority vectors include: Location=0.197; Env. Compliance=0.202; Life-Cycle Cost=0.347; Compatibility with Traditions=0.164; Recyclability=0.092; Aesthetics= 0.77. • Amalgamated/Final weighting (3) is derived from multiplying the selected value of the main factor-weighting vector by the selected value of the priority vector of the sub-factor. This entry is obtained for the general/site suitability group as follows: 0.026 x 0.197= 0.005122 After deriving the local priorities for each sub-factor against the alternatives through pair-wise comparisons, the priorities of the factors are synthesized to calculate the overall priorities for each material alternative in step 5

396
Table 17: Derived final global weightings scores of sub-factors used for the hypothetical case study
Parent/Main-Factor
Parent/Main Factor weight (1)
Sub-Factors Sub-Factor weight (2) Final weight (3) User
Value Value Used
CR User Value
Value Used
CR
General/Site Suitability Factor
0.03 0.026 0.08
GS1- Location GS2-Material Availability GS3-Distance GS4-Certification Code GS5-Disaster Prone GS6-Site Geometry GS7-Design Geometry GS8-Spatial Structure GS9-Spatial Activities GS10-Material Scale GS11-Bldg Orientation GS12-Spatial Scale
0.197 0.158 0.127 0.115 0.083 0.114 0.044 0.069 0.053 0.000 0.000 0.040
0.197 0.158 0.127 0.115 0.083 0.114 0.044 0.069 0.053 0.000 0.000 0.040
0.09
0.0051 0.0041 0.0033 0.0030 0.0022 0.0030 0.0012 0.0018 0.0014 0.0000 0.0000 0.0010
Env./Health Impact Factor
0.07 0.068 0.08
EH1- Env. Compliance EH2-CO2 Emissions EH3-Users’ Safety EH4-Ozone Depletion EH5-Pesticide Treatment EH6-Climate EH7-Env-Toxicity EH8-Fossil Depletion EH9-Nuclear Waste EH10-Waste Disposal
0.202 0.124 0.113 0.086 0.078 0.067 0.053 0.058 0.057 0.014
0.202 0.124 0.113 0.086 0.078 0.067 0.053 0.058 0.057 0.014
0.10
0.0138 0.0084 0.0077 0.0059 0.0053 0.0046 0.0036 0.0040 0.0039 0.0110
Economic/Cost Impact Factor
0.12 0.122 0.08
C1-Life-Ccycle Cost C2-Embodied Energy Cost C3-Capital Cost C4-Labour Cost C5- Maintenance Cost
0.347 0.247 0.186 0.120 0.037
0.347 0.247 0.186 0.120 0.037
0.07
0.0425 0.0302 0.0228 0.0147 0.0077
Socio-Cultural impact Factor
0.24 0.245 0.08
SC1-Compatibility (Tradition) SC2-Compatibility (Region) SC3-Resistriction on Usury SC4-Clients’ Preference SC5-Custom Knowledge
0.164 0.102 0.362 0.227 0.146
0.164 0.102 0.362 0.227 0.146
0.08
0.0401 0.0250 0.0885 0.0556 0.0356
Technical Performance Factor
0.34 0.335 0.08
T1-Recyclability T2-Ease to remove T3-maintenance Level T4-Contraction Tolerance T5-Skills Availability T6-Speed of Fixing T7-Fire Resistance T8-Thermal Resistance T9-Moisture Resistance T10-Scratch Resistance T11-Weather Resistance T12-Chemical Resistance T13-Resistance to Decay T14-Weight/Mass T15-Life Expectancy T16-Renewable T17-UV Resistance T18-Compatibility with other Materials
0.092 0.102 0.062 0.061 0.067 0.053 0.048 0.055 0.063 0.054 0.053 0.054 0.079 0.053 0.070 0.087 0.062 0.056
0.092 0.102 0.062 0.061 0.067 0.053 0.048 0.055 0.063 0.054 0.053 0.054 0.079 0.053 0.070 0.087 0.062 0.056
0.09
0.0307 0.0341 0.0208 0.0206 0.0224 0.0179 0.0162 0.0186 0.0213 0.0181 0.0177 0.0181 0.0266 0.0179 0.0235 0.0291 0.0208 0.0186
Sensorial impact Factor
0.20 0.203 0.08
SN1-Aesthetics SN2-Texture SN3-Colour SN4-Temperature SN5-Acoustics SN6-Odour SN7-Thick/Thin SN8-Glosiness SN9-Hardness SN10-Lighting Effect SN11-Translucence SN12-Structure SN13-Thermal Condition
0.077 0.077 0.077 0.077 0.106 0.087 0.107 0.075 0.109 0.068 0.108 0.089 0.083
0.077 0.077 0.077 0.077 0.106 0.087 0.107 0.075 0.109 0.068 0.108 0.089 0.083
0.0156 0.0156 0.0156 0.0156 0.0214 0.0177 0.0181 0.0177 0.0217 0.0153 0.0222 0.0138 0.0220 0.0180 0.0168
∑ 1.000 ∑ 1.000

397
Step 5: Performing Pair-Wise Comparison of the Selected Material Alternatives Against Each Sub-Factor
• The next phase of the exercise was to conduct pair-wise comparisons for the selected alternatives against each sub-factor based on the importance attached to the dominance of each alternative relative to other alternatives under that sub-factor. For each sub-factor (e.g., location), a separate factor matrix was developed to relatively compare the given candidate materials for that sub-factor. These matrices were also normalized and checked for consistency as shown in Tables 18-41.
Table 18: GS1- Pair-wise matrix & priority scores for Location
Table 19: GS1-Normilised matrices for Location

398
Table 20: GS2- Pair-wise matrix & priority scores for Material Availability
Table 21: GS2- Normalised matrices for Material Availability
Table 22: EH1- Pair-wise matrix & priority scores for Environmental Statutory Compliance

399
Table 23: EH1- Normalised matrices for Environmental Statutory Compliance
Table 24: EH2- Pair-wise matrix & priority scores for Embodied CO2 Emission
Table 25: EH2- Normalised matrices for Embodied CO2 Emission

400
Table 26: C1- Pair-wise matrix & priority scores for Total Life-Cycle Cost
Table 27: C1- Normalised matrices for Total Life-Cycle Cost
Table 28: C2- Pair-wise matrix & priority scores for Material Embodied Energy Cost

401
Table 29: C2- Normalised matrices for Material Embodied Energy Cost
Table 30: SC1- Pair-wise matrix & priority scores for Material Compatibility with Traditions
Table 31: SC1- Normalised matrices for Material Compatibility with Traditions

402
Table 32: Pair-wise matrix & priority scores for SC3-Cultural Restriction on Usury
Table 33: Normalised matrices for SC3-Cultural Restriction on Usury
Table 34: T1- Pair-wise matrix & priority scores for Recyclability/Reusability

403
Table 35: T1- Normalised matrices for Recyclability/Reusability
Table 36: T2- Pair-wise matrix & priority scores for Ease to Remove/Reaffix/Replace
Table 37: T2- Normalised matrices for Ease to Remove/Reaffix/Replace

404
Table 38: SN2- Pair-wise matrix & priority scores for Texture
Table 39: SN2- Normalised matrices for Texture
Table 40: SN5- Pair-wise matrix & priority scores for Acoustics Performance

405
Table 41: SN5- Normalised matrices for Acoustics Performance
Step 6: Amalgamating the Results
• The final phase, after deriving the local priorities of the various floor material alternatives relative to each sub-factor was to calculate the overall priorities for the floor material alternatives. • Once the normalised matrices of the floor material alternatives and various sub-factors were obtained, the values derived from the analysis were multiplied with the resultant value of the final weighting (3) in table 17. This means that the final weighting scores [3] (obtained from multiplying the local priorities vectors of the parent factor [1] with that of individual sub-factors [2] are multiplied by the priorities derived through pairwise comparisons of the material alternatives and each sub-factor. • Afterwards, the priorities derived from multiplying the final weightings [3] with the priorities derived through pairwise comparisons of the material alternatives and each sub-factor were then summed to obtain the overall global composite priority weights of the material alternatives in the fourth level of the AHP model as shown in Table 42. • This then yielded a single green utility index of alternative worth, which allowed the material options to be ranked according to their overall priorities, and the material with the highest score becoming the selected candidate material (see Figures 7).

406
Table 42: Green utility index scores of all selected material alternatives against the parent factors
Figure 7. Charts showing ranked floor material alternatives and corresponding indices
The green utility index as calculated for the three material alternatives summed up as M(C) =0.058, M(A)= 0.051 and M(B)= 0.041 for material options C-concrete flooring, A-paneled flooring and B- laminated flooring respectively.

407
Looking at Figures 7 and 8, Material option (A) turned out to be the most preferable material among the three materials, with an overall priority score of 0.058. The choice of Material (C) being the best option for the client was based on the concept of the higher the green utility index, the better the option.
Figure 8. Charts showing details of the best material option selected after the analysis
Conclusion: From the illustrated example it can be deduced that the MSDSS model is able to provide rankings in low-cost green building material assessment combining site, economic, technical, social-cultural, sensorial and environmental criteria into a composite index system based on the AHP technique. This model is therefore, based on the presumption that decision makers, given full knowledge of all possible consequences of all possible alternatives, will select the alternative with the highest-ranking score. The following section discusses the findings that emerged from the model evaluation exercise.
System Evaluation: Results from the Surveyed Questionnaire
After the evaluation of the MSDSS model, an online semi-structured survey questionnaire (which can be found in Appendix J) was deployed to receive final feedbacks from the practitioners who had engaged in the expert evaluation exercise. The final survey invited 10 knowledgeable participants to comment on what should be done to increase the integration of the MSDSS tool in housing design practice, and other matters of importance that ought to have been considered in the development of the tool for further studies. The following sections set out the analysis of the returned questionnaires, including a summary of the responses to the various questions in the questionnaire. The names of the participants were undisclosed to respect their anonymity.

408
Participants Profile
The online survey exercise was conducted by 10 leading design and building professionals, all of them holding specific positions in the housing industry, and having high to very high experience in the specification of building products for housing projects. The selection of participants for the evaluation exercise was based on the proposed sampling methods in section 4.5.2.9 of chapter 4. Eight (8) respondents including; two (2) architects, three (3) material analysts, two (2) building engineers and one (1) research consultant, out of a total of ten (10) experts contacted, responded to the survey questionnaires. Table 43 shows the profile of the participants.
Table 43. Profile of experts for the evaluation exercise
Position /Designation
Type of Organisation Area of Expertise Years of experience
No. of housing projects undertaken
1.Material Specifier and Program Designer
Building and construction firm
Material analyst 15 > 10
2. Researcher and Senior Building Construction Consultant
Building Research and development firm
Research and Development
27 > 20
3. Building Engineer
Housing construction firm
General practice 7 >10
4. Material Specifier
Architectural and construction firm
Material analyst on capital projects
23 >25
5. Project Architect and engineer
Housing construction firm
General practice 30 >12
6. Senior Architect and Chief designer
Architectural and sustainable design firms
Full architectural service
26 > 15
7. Senior Quantity Surveyor
Quantity surveying outfit
Material advice 35 >30
8. Architect and Builder
Lands and Housing Firm
General practice 17 >13
Structure of the Organisation
Analysis of the returned questionnaire showed that 90% of respondents work in residential housing and material specification firms. Of this lot, 10% work in the private sector while 80% work in public sector (e.g. government agency). Response from the public sector dominated the exercise as more design and building professionals are easily employed in the public sector than in the private sectors. Therefore, the views obtained through this survey tend to be more representative of respondents working in the public sector.

409
Result Analysis of Online Survey
In the first question, the participants were asked to express their views as to whether or not they see a potential of the MSDSS model in supporting informed decision making, to address the problems associated with sustainable material evaluation and selection of LCGBMCs. Some of the experts (50%) agreed that the MSDSS model has the capability of making a valuable contribution in the area of sustainable material selection and green building practices. One respondent noted; “The MSDSS model addresses what is missing in the housing industry such as the need for more accessible data needed for evaluating a range of LCGBMCs. A clear decision-making method, opportunities for a software that can produce customizable reports, and the need for a better understanding of attributes considering the lifecycle and interdependency of material selection with other building systems”. Another respondent stated; “The system relates to issues concerned with local knowledge, local and recycled materials data, and local climate know-how, which are hardly considered in other systems: I think it shows great promise and the mechanics are very well developed and user-friendly”. However, others (50%) were unable to comment on the impacts of the model on decision-making in terms of material selection, as they felt that more conventional and green products would need to be included before they could comment on the capability of the model. The justification for the suggestion is understandable even though it was mentioned prior to the survey that the purpose of this study was to develop a scalable prototype version to demonstrate the proposed selection methodology for assessing LCGBMCs, as opposed to developing fully equipped commercial software. The overall impression perhaps suggests that practitioners would regard the model as a very useful tool for sustainable material selection in the Nigerian housing industry, should it be commercialised.
Figure 9. Illustration of the percentage of the potential of the MSDSS model to support sustainable material
selection based on practitioners’ perception

410
In another question, the participants were asked what their views would be on the resources to be used if the model were to be applied in real life evaluation and selection exercises. Most experts felt that the model would not be too costly to implement at current resource level. One expert commented that its implementation would not consume great resources and time, and consequently its benefit would outweigh the costs. Another respondent remarked; “It depends on what resources you are referring to; if referring to the underlying database, those are considerable. If referring to the resource needs of the organisation that would use the model, not too costly to operate.” However, others made some critical suggestions about the MSDSS model. Another respondent noted; “In terms of its operation, interoperability, flexibility, usability and applicability, per se, it is very clear and straightforward; it's the underlying premise and data that needs some clarification in order for the user to fully appreciate its efficiency”. The percentage of the cost value of the MSDSS model is shown in Figure 10.
Figure 10. Illustration of the percentage of the cost value of the model based on practitioners’ feedback
In the question: Do you think that the interface layout of the MSDSS model in general provides the possibility to communicate input and output data to design and building team members? 50% of the participants strongly agreed that the MSDSS model is comprehensive and should provide the possibility to support easy communication. Another number (50%) somewhat agreed to its adequacy. The overall impression however, is that almost 90% of the users agreed on it being very adequate to integrate in material selection problems. The view about its adequacy in terms of communication is shown in Figure 11.

411
Figure 11. Illustration of the percentage of the reliability and appreciation of the model layout
In another question, participants were asked to express their views regarding the simplicity, user friendliness, flexibility, clarity, ease to understand and ease of use of the prototype model in conducting material database queries. The importance of the model in terms of its simplicity and flexibility varied significantly. In terms of comprehensibility, most experts found the model to be clear and simple to understand and implement. One expert noted; “it has covered a very complex aspect of LCGBMCs material assessment in a simple and logical manner, which I think would not be difficult to apply in practice”. However, other respondents thought otherwise. One respondent remarked; “The interface is very well-designed and easy to navigate. However, I personally think that there is a need for more explanatory material to allow the user to understand what s/he is actually doing, and how to operate some parts of the model appropriately”. It can also be noticed from Figure 12 that the feedback about the simplicity and ease of use of the model is relatively on the average, as 50% of the respondents agreed to have had minor issues with its clarity. Remarks given by the practitioners were perhaps due to their reluctance in following the work-through process provided by the system’s instruction demo. One expert mentions; “the pairwise judgments in AHP are ambiguous, and the weights so determined may be meaningless”. Another stated that the presented AHP selection methodology seems somehow complex and time consuming. He notes; “Pair-wise comparison is quite cumbersome and so takes a lot of time to maintain the consistency of the response, as this point to the efficiency of the system can lead to serious questions”. Perhaps the reason for this remark was that very few of the participants had sound knowledge of the AHP method of decision-making, as a result consideration for further research was acknowledged in the recommendation section to address the underlying limitations in the model.

412
Even though the AHP concept seems subjective in principle, it is reasonable to note that the weightings have sufficient objectivity, rigour and basis for generalisation since they were views expressed by practitioners with many years of experience on housing projects. While some of the respondents found the process a bit demanding, they were somewhat comfortable with the idea of assigning weightings to rank preferences. One respondent noted; “I think with a more elaborate guidance through the AHP methodology, the appreciation would be much higher”. This perhaps suggests the need for a more comprehensive guide manual on how to undertake intended tasks related to the AHP concept of decision-making.
Figure 12. Illustration of the percentage of the user-friendliness and clarity of the model
Finally, when asked to provide further matters of importance that ought to have been considered in the development of the MSDSS tool and suggest areas that might need further improvement, respondents suggested some other features and capabilities that were not included in the model. A critical suggestion was made regarding the currency of the database. A respondent noted; “To make the model more efficient and effective, I suggest that all the materials for the database are always to be kept up to date. In the proposed system, however, it does not seem to consider how to update the material database”. It is understandable that materials change in their innovation, composition, price and availability and most tools find it challenging to update information relating to products. In the MSDSS prototype model however, the materials and the corresponding performance of the selected products would be updated through links to suggested manufacturers web pages, where users should be able to access more information on a variety of other selected products if upgraded to a commercial-based tool.

413
Since the purpose of this research study was to develop a model to demonstrate the proposed step-by-step methodology for selecting LCGBMCs based on the impacts of the identified sustainability principle indicators, the issue of data currency –though very crucial in terms of information currency in model development, was thought to be one of a minor issue in this case as recommendation would be made in terms of further improvements for data update should it be developed into a commercial-based tool. Apart from the issue of updating the information in the database, no outcome of the MSDSS model was perceived as not having an added value for supporting the evaluation of LCGBMCs in the design of LIGHDs.
In summary, this section of the study has demonstrated the use of the model to rank material alternatives by applying it to a hypothetical case study. A total of thirteen (13) out of twenty (20) industrial practitioners in the housing construction industry, on separate cases of the evaluation exercises-five on the first survey exercise and eight on the second exercise, took part in the studies. The evaluation exercise was carried out in three (3) segments consisting of a presentation, a hands on’ user demo tutorial and a reflective questionnaire. The results of the user evaluation exercise were positive in aiding sustainable low-cost green building material selection. In order to examine the outcome of the model for its applicability and efficiency, chapter six demonstrates the detailed procedure of the validation exercise and the findings from the validation exercise based on participants’ views- using an on-going live project located in Port Harcourt, in Nigeria.

414
Appendix L: Case Study

415

416

417

418
Appendix M: Relevant Publications of the Research
A list of publications is listed below.
• Ogunkah. I, Yang, J & Jones, B., (2010): Design Toolkit for Green Vernacular Buildings. In 1st. International Graduate Research Symposium - October 15-16, 2010 - Ankara, Turkey. Peer reviewed and published. http://www.filefactory.com/file/cbe6abe/n/GRSproceedings.pdf
• Ogunkah, I.; Yang, J. Investigating Factors Affecting Material Selection: The Impacts on Green Vernacular Building Materials in the Design-Decision Making Process. Buildings 2012, 2, 1-32. Received: 8 December 2011; in revised form: 22 December 2011 / Accepted: 16 January 2012 / Published: 23 January 2012. Buildings 2012, 2(1), 1-32; doi:10.3390/buildings2010001
• Yang, J. and Ogunkah, I. (2013) A Multi-Criteria Decision Support System for the Selection of Low-Cost Green Building Materials and Components. Journal of Building Construction and Planning Research, 1, 89-130. Received September 18th, 2013; revised October 25th, 2013; accepted November 4th, 2013, Published Online December 2013 (http://www.scirp.org/journal/jbcpr) doi: 10.4236/jbcpr.2013.14013
• Ogunkah, I., and Yang, J., (2014). Validation of a Multi-Criteria Decision Support
System for Low-Cost Green Building Materials and Components. International Journal of ICT-aided Architecture and Civil Engineering Vol.1, No.2 (2014), pp.11-32 http://dx.doi.org/10.14257/ijiace.2014.1.2.02
Appendix N: Timeline for the PhD Study
Duration Task Name
2012 2013 2014 O N D J F M A M J J A S O N D J F M A M J J A S O N D
A FIELD STUDY B ANALYSIS AND SYSTEM
DEVELOPMENT
C TESTING AND
VALIDATION OF THE TOOLKIT
D WRITE UP AND
CONCLUSION
E FINALISE SUBMISSION F SUBMIT TO
SUPERVISORS AND AWAIT FEEDBACK
G FINAL REVIEW OF
DRAFT AND FORMAT FOR SUBMISSION
H PRINT, BIND AND
SUBMIT.
I PHD VIVA

419
Appendix O: Comparative Analysis of Existing Tools
LCA Tool IN DCs
Tool Type
Tool Developer
Collection
Assessment Criteria/Factors
Life-Cycle Phase
Software Application & Tech Support
Users
Positives/ Advantages
Negatives/Limitations/Dis-advantages
ENVEST Environmental LCA Tool for Building/ Building Products
UKGBC (BRE United Kingdom)
Energy/Resource consumption, Operational Energy, Water Use, Material Consumption, Water Extraction, Fossil Fuel/Minerals Depletion, Waste Disposal
Building design phase
None Designers Determines ecopoint/whole life cost ratings for each material, element component, Dynamic with new community, social and economic criteria
Not comprehensive, Uses the database for all impact information with alterable defaults for all element choices,
BEES Building Product Life-Cycle Assessment (LCA) Tool Building Product Life-Cycle Costing (LCC) Tool
NIST (USA)
230+ building products
Environmental and economic performance
Design phase, and End-of-life phases
Web-based Designers, Specifiers, Builders, Product Manufacturers, Purchasers, Researchers, and Policy Makers
Limited product options, Limited use for local/ regional impact analysis, Devaluating weighing process
ATHENA Whole Building Analysis Tool Building Assembly Analysis Tool
ATHENA® Institute
1,200+ building material and assembly combinations
Energy use global warming, solid waste emission, natural resource use
Conceptual design
Web-based Architects, Engineers, Designers, Environmental Consultants
Easy-to-understand descriptions of technologies that are relatively advanced, with contacts for further information.
Limited assembly options, Fixed assembly dimensions, North American bias in systems selection.
EPM Building Product Life-Cycle Assessment (LCA) Tool
Wood /Energy (Netherlands)
650+ building material and assembly combinations
Eco system, consumption/exhaustion of resources, energy consumption (in all phases of production, including transport), environmental pollution with different waste and hazardous materials, waste disposal problems, hazardous emissions into the atmosphere, global warming, impact on human beings,
Planning, Design, Operation and Maintenance
Package is published on CD and as booklet.
Designers, architects, regulatory groups, local authorities
Complete environmental assessment of material use in buildings, Clear sheets and easy to communicate. Easy to use and extensive database with the most common materials and products.
Very extensive method, LCA expertise and extensive knowledge of the product required, Time intensive procedure, Calculation does not result in an indication of environmental impact. Only takes energy use and losses into account. Only takes energy use and losses into account.

420
re-use and recycling possibilities
BREEAM Whole Building Analysis Tool . Building Product Life-Cycle Assessment (LCA) Tool
UKGBC (BRE United Kingdom)
Management; Health & Wellbeing Transport; Water- (consumption reduction, metering, leak detection); Materials-; Land Use; Ecology-; Pollution
Planning, Design, Operation and Maintenance, and End-of-life
Web-based application
Design / Management team/ assessor
Robust, Detailed, Well Known, Easy to Specify, Independent, Tailored to each building type. Encourages Teamwork, Creates, dialogue between various sectors in the building industry, Translates Data into Numeric, Estimator tools are available free of charge,
Complicated, Inflexible, Poorly Understood, Often Poorly Specified, Extra Cost, Guidance is currently only available to people who attend the training courses.
GREEN-STAR
Whole Building Analysis Tool
GBCA (Australia)
Nil Environmental efficiency, Greenhouse & Acid Gas, Ozone Depletion, Effluent Reduction, Waste, indoor environment quality, energy, transport, water land use, ecology and emissions
Design, operation and maintenance. New and existing buildings
Application language is Visual Basic
Design team, Architects, Construction industry professionals, educators researchers
Scoring system flexible,
Technical manual is available for £224 ($444), Operating energy not included. Doesn't do thermal modeling.
LEED Whole Building Analysis Tool
USGBC (United States)
Nil Site, energy, water, materials, indoor environmental quality
Planning, Design, Operation and Maintenance, and End-of-life
No software Application
Design / Management team / Accredited Professionals, Designers, Specifiers, Builders, Product Manufacturers, Purchasers, Researchers, and Policy Makers
Relies on a simple, consensus-based point system; a broad-based model for most environmental issues, The tools are available free of charge, Does not require the expertise of a trained assessor to operate, Ensure effective design strategies are accounted for without the overlay of operational management and user
Insufficient Emphasis on Durability; Limited Reach, limited to addressing environmental issues, Number of credits related to each issue is a de facto weighting, Technical guidance is available for £100 ($200), does not translates Data into Numeric, Users of LEED need to obtain accreditation through coursework and exams.

421
behaviour
GBTool Whole Building Analysis Tool
CGBC (Canada
Energy consumption, resource consumption (salvaged, recycled, bio-based and sustainably harvested, locally produced, designed for disassembly, re-use, or recycling) and water use for irrigation, building systems, and occupant use); environmental loadings- greenhouse gas emissions, other atmospheric emissions, solid wastes, storm water, wastewater, site impacts, and other local and regional impacts); and indoor environmental quality (indoor air quality, ventilation, temperature and relative humidity, daylight and illumination, and noise and acoustics), selection of appropriate site, building controls, compatibility flexibility and adaptability, maintenance of operating performance, and a few social and economic measures
Planning, Design, Operation and Maintenance, and End-of-life
Microsoft Excel-based
Designers and regulatory groups
Encompass the underlying Sustainability principles, translates Data into Numeric, Very adaptable to local conditions and assessments are therefore very meaningful within the region. Extremely comprehensive framework for evaluation.
Tend to require greater technical expertise to implement; Third party team establishes the qualitative and quantitative measures that are used to evaluate sustainable design achievements, Users are expected to use other software tools to simulate energy performance, Requires added initial input from local authorities to establish weights and benchmarks
LCA Tool IN LDCs
Tool Type
Tool Developer
Collection
Assessment Criteria/Factors
Life-Cycle Phase
Software Application & Tech Support
Users
Benefits Limitations

422
CASBEE Whole Building Analysis Tool
JSBC (Japan) Energy, Resource, Local environments, indoor air quality
Pre-design, Design, Operation and Renovation. Planning, Design, Operation and Maintenance, and End-of-life
Web-based Tool
Used by all Design/management team,
Able to convert raw data into scores,
Not applicable to all of the GSA project types, Requires only the expertise of licensed assessors, relatively unknown, Highly complex weighting system applied at every level, Highly complex weighting system applied at every level,
CEPAS Whole Building Analysis Tool
HK-BEAM Nil Indoor Environmental Quality, Building Amenities, Resources Use, Environmental loadings, Site Impacts, Neighbourhood Impacts, communal interactions, building economics, transportation, heritage conservation,
Pre-design, Design, Construction, Operation and demolition.
Web-based Tool
Used by all Design/management team,
An all-round and robust assessment method, Flexible in applications, Easy to understand indicators, Performance – based, Upgradeable assessment framework, The assessment tool and guidance is available free of charge in Japanese and English,
The use of subjective judgment is very limited, Ratings for most factors are not scalar. Comprehensiveness comes with high implementation costs.
SBAT Whole Building Analysis Tool
CSIR (Council of Scientific and Industrial Research) in 2001 (South Africa)
Nil SOCIAL • Occupant Comfort • Inclusive Environments • Access to Facilities • Participation & Control • Education, Health & Safety ECONOMIC • Local Economy • Efficiency of Use • Adaptability & Flexibility • Ongoing Costs • Capital Costs ENVIRONMENTAL • Water • Energy • Waste • Site, • Materials & Components
Briefing, Site Analysis, Target Setting, Design, Design development, Construction, Handover, Operation, Reuse/recycle, is explicitly defined in this context
Web-based Tool
Used by all Design/management team, clients, users and local communities
Performance criteria that acknowledge social and economic issues, divide15 performance areas into 5 performance criteria

423
LOW-IMPACT GREEN HOUSING DEVELOPMENTS

424