Office of Curriculum & Instruction
48
FREEHOLD BOROUGH SCHOOL DISTRICT 280 Park Avenue Freehold, NJ 07728 Monmouth County Office of Curriculum & Instruction Algebra I Grade: 8 Course Code: 8411 Board of Education Adoption Date: March 10, 2014
-
Upload
khangminh22 -
Category
Documents
-
view
5 -
download
0
Transcript of Office of Curriculum & Instruction

FREEHOLD BOROUGH SCHOOL DISTRICT 280 Park Avenue
Freehold, NJ 07728 Monmouth County
Office of Curriculum & Instruction
Algebra I Grade: 8 Course Code: 8411
Board of Education Adoption Date: March 10, 2014

Freehold Borough School District Algebra I – Grade 8
Freehold Borough Board of Education
Mrs. Annette Jordan, President Dr. Michael Lichardi, Vice President
Mr. Paul Ceppi
Mrs. Susan Greitz
Mr. James Keelan
Mrs. Maureen MacCutcheon
Mr. Bruce Patrick
Mrs. Margaret Rogers
Mrs. Michele Tennant
District Administration
Rocco Tomazic, Ed. D., Superintendent
James Strimple, Interim School Business Administrator
Rich Pepe, Director of Curriculum & Instruction
Jennifer O’Shea, Director of Special Programs
Jennifer Donnelly, Supervisor of Technology & Assessment / Supervisor of Instruction – Gifted & Talented
Cecilia Zimmer, Supervisor of Instruction – ESL, Bilingual, & World Languages
Ronnie Dougherty, Principal – Freehold Intermediate School
John Brovak, Assistant Principal – Freehold Intermediate School
Patrick Mulhern, Principal – Park Avenue Elementary School
Will Smith, Principal – Freehold Learning Center

Freehold Borough School District Algebra I – Grade 8
District Mission
We will inspire the creativity and imagination of all students and empower them as knowledgeable, skillful, and confident learners who flourish and contribute willingly in a changing world.
Core Beliefs We believe that:
All people have inherent worth.
Life-long learning is basic to the survival and advancement of society.
The primary influence on the individual's development is the family in all its forms.
Valuing diversity is essential to individual growth and the advancement of society.
All individuals have strengths and human potential has no known limits.
Democracy thrives when individuals accept responsibility for their choices.
Being trustworthy builds trust.
Creativity and imagination are essential for society to flourish.
A safe environment is essential for the well-being of the individual and for society to flourish

Freehold Borough School District Algebra I – Grade 8
Philosophy
The philosophy for our curriculum is developed with a democratic system of beliefs and values. Believing that our students deserve the best education, our curriculum is aligned to the most current New Jersey Core Curriculum Content Standards and current statewide assessments. Our scope and sequence is vertically and horizontally aligned. The progression of objectives embraces decades of rigorous research, conducted both independently and at the university level, and acknowledges that children develop differently and that learning experiences and strategies for performance are differentiated. Our borough is a diverse community, rich in tradition and spirit. Knowledge is a fusion balancing authentic experience and content, which language arts literacy skills are integrated with other content areas. Our curriculum contains common expectations that are rigorous and student centered, and teachers, who are most proximal to the children, will use this document as an instrument to ensure student success.
To ensure that our children are successful and receive the best education, this curriculum document, our staff will continuously collaborate on this living document. We will develop purposeful and effective formative and summative assessments which measure growth of our curriculum and inform our instruction. Finally, we will continuously seek to grow professionally through professional development, which is aligned to statewide regulations, but specifically geared to benefit our curriculum, school, and children.
General Curriculum & Instruction Objectives
Teachers will employ lessons that are aligned to our curriculum and framed utilizing current research-based methods and techniques that focus on student achievement
Our lessons will be structured according to statewide and district standards and our teachers will have flexibility to ensure that lessons meet the needs of all learners
Units and lessons will be differentiated
Curriculum is be student focused on success and balances developmental theory and psychometric standards
Democratically developed benchmarks and assessments will be utilized to gauge student and curricular growth. Assessment will be multidimensional and developed according to student need.

Algebra I - Introduction Introduction
Course Philosophy
Mathematics has its own language, and the acquisition of specialized vocabulary and language patterns is crucial to a student’s understanding and appreciation of the subject. Students will be taught to utilize this language properly. Additionally, problem solving is integrated throughout the different components of the curriculum. The development of problem‐solving skills is a major goal of Algebra I. Instruction in the process of problem solving will help students develop a wide range of skills and strategies for solving a variety of problem types.
Course Description
Through a comprehensive course of study, students will develop a solid understanding of a variety of concepts. The course provides a study of algebraic properties and related applications through the use of technology and traditional methods. The curriculum includes linear and quadratic equations and inequalities, analytic geometry, functions, exponents, systems of equations, polynomials, factoring, and rational expressions. Multiple techniques of problem solving will be encouraged throughout instruction to ensure success on the end of course exam and in future courses and standardized tests. The students will engage in a variety of activities including projects, unit tests, quizzes, and journals.

Course Map and Proficiencies/Pacing
Course Map
Relevant Standards
Enduring Understandings Essential Questions Assessments
Diagnostic Formative Summative
A‐SSE
Algebraic and numeric procedures are interconnected and build on each other to produce a coherent whole.
Why is it useful to represent real‐life situations algebraically? How can we use mathematical language and models to describe linear and non‐linear change?
Unit pre‐test
Do now assignments Question and answer during lesson Benchmark assessments Student journals Closure questions
Unit test with multiple choice and open‐ended questions Unit project Alternative assessment
F‐LE
Logical patterns exist and are a regular occurrence in mathematics and the world around us.
How can patterns, relations and functions be used to best describe and explain relationships between quantities and assist in modeling real life situations? What are some ways to represent, describe, and analyze patterns that occur in our world?
Unit pre‐test
Do now assignments Question and answer during lesson Benchmark assessments Student journals Closure questions
Unit test with multiple choice and open‐ended questions Unit project Alternative assessment
A‐CED
Functional relationships can be expressed in real contexts, graphs, algebraic equations, tables and words; each representation of a given function is simply a different way of expressing the same idea.
How can change be best represented mathematically? How can we determine the most appropriate method to model various situations (linear, non‐linear, quadratics, exponential)?
Unit pre‐test
Do now assignments Question and answer during lesson Benchmark assessments Student journals Closure questions
Unit test with multiple choice and open‐ended questions Unit project Alternative assessment

A‐REI
Rules of arithmetic and
algebra can be used
together with the concept
of equivalence to
transform equations and
inequalities so solutions
can be found to solve
problems.
What makes alternative algebraic
algorithms both effective and efficient? Unit pre‐test
Do now assignments
Question and answer during
lesson
Benchmark Assessments
Use algebra tiles to show
equivalence
Student journals
Closure questions
Unit test with multiple
choice and open‐ended
questions
Unit project
Alternative assessment
F‐IF
Functions, systems of
equations, and graphs can
be used to model and solve
real world situations.
When given a data set of information,
how can its display, manipulation, and
interpretation be effectively used and
translated?
Enhanced with technology, how can it
be applied to the concepts of
mathematics and problem solving?
Unit pre‐test
Do now assignments
Question and answer during
lesson
Benchmark assessments
Student journals
Closure questions
Unit test with multiple
choice and open‐ended
questions
Unit project
Alternative assessment
N‐Q
Graphs and equations are
alternative ways for
depicting and analyzing
patterns of linear and non‐
linear change.
How does degree change the behavior
of a function?
How is quadratics an example of non‐
linear change?
Unit pre‐test
Do now assignments
Question and answer during
lesson
Benchmark assessments
Student journals
Closure questions
Unit test with multiple
choice and open‐ended
questions
Unit project
Alternative assessment

A‐APR
Mathematical models can be used to describe physical relationships; these relationships are often non‐linear.
How can we model situations using quadratics, exponents, and polynomials?
Enhanced with the integration of technology, how can it be applied to the concepts of mathematics and problem solving?
Unit pre‐test
Do now assignments
Question and answer during lesson
Benchmark assessments
Student journals
Closure questions
Unit test with multiple choice and open‐ended questions Unit project Alternative assessment
F‐BF
Integration of various mathematical procedures builds a stronger foundation of finding solutions.
How can the concepts, logic, understanding and reasoning of mathematics be applied culturally to better the future?
When is one representation of a function more useful than another?
Unit pre‐test
Do now assignments
Question and answer during lesson
Benchmark assessments
Student journals
Closure questions
Unit test with multiple choice and open‐ended questions Unit project Alternative assessment
S‐CP S‐MD
Probability quantifies the likelihood that an event will occur and enables us to make predictions and informed decisions.
How can experimental and theoretical probability be used to make predictions or draw conclusions? How can we decide when to use an exact answer or when to use an estimate?
Unit pre‐test
Do now assignments
Question and answer during lesson
Benchmark assessments
Coin/dice/spinner experimental probability Graphing calculators to simulate probability Student journals
Closure questions
Unit test with multiple choice and open‐ended questions Unit project Alternative assessment

S‐ID S‐IC
The result of statistical investigation can be used to support or refute an argument.
How can the collection, organization, interpretation, and display of data be used to answer questions?
Unit pre‐test
Do now assignments
Question and answer during lesson
Benchmark assessments
Compare and contrast graphing activity Student journals
Closure questions
Unit test with multiple choice and open‐ended questions Unit project Alternative assessment
Proficiencies and Pacing
Unit Title Unit Understanding(s) and Goal(s) Recommended Duration
Unit 1: Connections to algebra/properties of real numbers
Algebraic and numeric procedures are interconnected and build on each other to produce a coherent whole. Probability quantifies the likelihood that an event will occur and enables us to make predictions and informed decisions. The result of statistical investigation can be used to support or refute an argument. Rules of arithmetic and algebra can be used together with the concept of equivalence to transform equations and inequalities so solutions can be found to solve problems. At the conclusion of this unit, students will be able to: 1. perform addition, subtraction, multiplication, and division following order of operations. 2. represent scenarios using variables, functions, and tables.
1 week

Unit 2: Linear equations and inequalities
Algebraic and numeric procedures are interconnected and build on each other to produce a coherent whole. Functional relationships can be expressed in real contexts, graphs, algebraic equations, tables and words; each representation of a given function is simply a different way of expressing the same idea. Rules of arithmetic and algebra can be used together with the concept of equivalence to transform equations and inequalities so solutions can be found to solve problems. At the conclusion of this unit, students will be able to: 1. solve linear equations using various methods. 2. Solve linear inequalities using various methods.
4 weeks
Unit 3: Graphing linear equations
Functions, systems of equations, and graphs can be used to model and solve real world situations. Graphs and equations are alternative ways for depicting and analyzing patterns of linear and non‐linear change. Integration of various mathematical procedures builds a strong foundation of finding solutions. At the conclusion of this unit, students will be able to: 1. graph linear equations in one or two variables. 2. graph linear inequalities in one or two variables.
3 weeks
Unit 4: Writing linear equations/sequences and series
Functions, systems of equations, and graphs can be used to model and solve real world situations. Integration of various mathematical procedures builds a strong foundation of finding solutions. Rules of arithmetic and algebra can be used together with the concept of equivalence to transform equations and inequalities so solutions can be found to solve problems. Logical patterns exist and are a regular occurrence in mathematics and the world around us. At the conclusion of this unit, students will be able to: 1. write linear equations in various forms. 2. use, write, and evaluate sequences and series.
4 weeks
Unit 5: Solving systems
Algebraic and numeric procedures are interconnected and build on each other to produce a coherent whole. Rules of arithmetic and algebra can be used together with the concept of equivalence to transform equations and inequalities so solutions can be found to solve problems. Functions, systems of equations, and graphs can be used to model and solve real world situations. Graphs and equations are alternative ways for depicting and analyzing patterns of linear and non‐linear change. At the conclusion of this unit, students will be able to: 1. solve linear systems using various methods. 2. solve systems of inequalities.
3 weeks
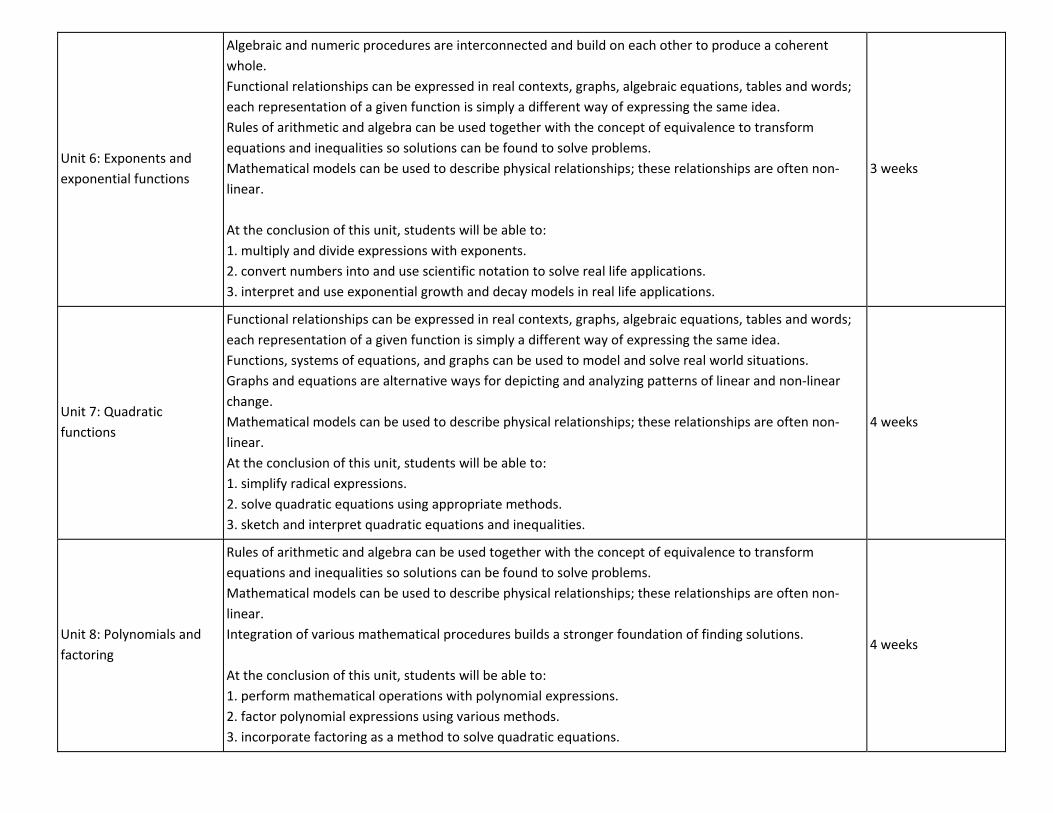
Unit 6: Exponents and exponential functions
Algebraic and numeric procedures are interconnected and build on each other to produce a coherent whole. Functional relationships can be expressed in real contexts, graphs, algebraic equations, tables and words; each representation of a given function is simply a different way of expressing the same idea. Rules of arithmetic and algebra can be used together with the concept of equivalence to transform equations and inequalities so solutions can be found to solve problems. Mathematical models can be used to describe physical relationships; these relationships are often non‐linear. At the conclusion of this unit, students will be able to: 1. multiply and divide expressions with exponents. 2. convert numbers into and use scientific notation to solve real life applications. 3. interpret and use exponential growth and decay models in real life applications.
3 weeks
Unit 7: Quadratic functions
Functional relationships can be expressed in real contexts, graphs, algebraic equations, tables and words; each representation of a given function is simply a different way of expressing the same idea. Functions, systems of equations, and graphs can be used to model and solve real world situations. Graphs and equations are alternative ways for depicting and analyzing patterns of linear and non‐linear change. Mathematical models can be used to describe physical relationships; these relationships are often non‐linear. At the conclusion of this unit, students will be able to: 1. simplify radical expressions. 2. solve quadratic equations using appropriate methods. 3. sketch and interpret quadratic equations and inequalities.
4 weeks
Unit 8: Polynomials and factoring
Rules of arithmetic and algebra can be used together with the concept of equivalence to transform equations and inequalities so solutions can be found to solve problems. Mathematical models can be used to describe physical relationships; these relationships are often non‐linear. Integration of various mathematical procedures builds a stronger foundation of finding solutions. At the conclusion of this unit, students will be able to: 1. perform mathematical operations with polynomial expressions. 2. factor polynomial expressions using various methods. 3. incorporate factoring as a method to solve quadratic equations.
4 weeks

Unit 9: Rational functions
Algebraic and numeric procedures are interconnected and build on each other to produce a coherent whole.Functional relationships can be expressed in real contexts, graphs, algebraic equations, tables and words; each representation of a given function is simply a different way of expressing the same idea. Rules of arithmetic and algebra can be used together with the concept of equivalence to transform equations and inequalities so solutions can be found to solve problems. Graphs and equations are alternative ways for depicting and analyzing patterns of linear and non‐linear change.Integration of various mathematical procedures builds a stronger foundation of finding solutions. Mathematical models can be used to describe physical relationships; these relationships are often non‐linear. At the conclusion of this unit, students will be able to: 1. solve rational equations using various methods. 2. perform mathematical operations with rational expressions. 3. graph and interpret rational functions.
4 weeks
Unit 10: Radicals & geometry
Logical patterns exist and are a regular occurrence in mathematics and the world around us. Functions, systems of equations, and graphs can be used to model and solve real world situations. Mathematical models can be used to describe physical relationships; these relationships are often non‐linear. Integration of various mathematical procedures builds a stronger foundation of finding solutions. At the conclusion of this unit, students will be able to: 1. solve radical equations. 2. apply the pythagorean theorem. 3. given two points on the coordinate plane, find the distance and midpoint between them.
2 weeks
Unit 11: Probability & statistics
Logical patterns exist and are a regular occurrence in mathematics and the world around us. Probability quantifies the likelihood that an event will occur and enables us to make predictions and informed decisions. The result of statistical investigation can be used to support or refute an argument. At the conclusion of this unit, students will be able to: 1. determine the likelihood of an event using probability. 2. count the number of ways an event can happen. 3. determine probability of an event from multiple events.
2 weeks

Unit 01 - Algebra I Unit Plan
Enduring Understandings: Algebraic and numeric procedures are interconnected and build on each other to produce a coherent whole. Probability quantifies the likelihood that an event will occur and enables us to make predictions and informed decisions. The result of statistical investigation can be used to support or refute an argument. Rules of arithmetic and algebra can be used together with the concept of equivalence to transform equations and inequalities so solutions can be found to solve problems. Essential Questions: Why is it useful to represent real‐life situations algebraically? How can we use mathematical language and models to describe linear and non‐linear change? What makes alternative algebraic algorithms both effective and efficient? How can exponential and theoretical probability be used to make predictions or draw conclusions? How can we decide when to use an exact answer or when to use an estimate? How can the collection, organization, interpretation, and display of data be used to answer questions? Unit Goals: At the conclusion of this unit, students will be able to:
1. perform addition, subtraction, multiplication, and division following order of operations. 2. represent scenarios using variables, functions, and tables.
Recommended Duration: 1 week

Guiding/Topical Questions
Content/Themes/Skills Resources and Materials Suggested Strategies Suggested Assessments
Can you use variables to create algebraic models?
Create expressions and equations using variables to represent real life scenarios.
Teacher driven worksheets Textbook ancillaries Interactive white board lessons
Utilize verbal models to prepare for using variables.
Sectional quizzes Notebook checks Unit test
What is the order of operations?
Evaluate expressions without grouping symbols by using order of operations. Evaluate expressions by using a calculator.
Teacher driven worksheets Textbook ancillaries
Use the device “Parenthesis, Exponents, Multiplication, Division, Addition, and Subtraction” also known as PEMDAS to enable students to recall order of operations.
Sectional quizzes Notebook checks Unit test
How do we organize data using tables, graphs, and matrices?
Organize data into specific rows and columns and label each component. Add or subtract the two matrices.
Teacher driven worksheets Textbook ancillaries Interactive white board lessons
Present the same data set in various forms (tables, graphs, matrices) to demonstrate how each is utilized.
Sectional quizzes Notebook checks Projects Unit test
Can you add, subtract, multiply and divide real numbers?
Add and subtract real numbers using properties and rules of addition. Multiply real numbers using properties of multiplication. Use division properties to simplify algebraic expressions.
Algebra 1 diagnostic pre‐test Teacher driven worksheets Textbook ancillaries
Use algebra tiles to model operations on numbers.
Algebra 1 diagnostic pre‐test Sectional quizzes Unit test
What is a function and how can they be displayed?
Identify functions and make input‐output tables. Write an equation for a real life function.
Teacher driven worksheets Textbook ancillaries Interactive white board lessons
Utilize real world examples so students grasp the input and output of a function.
Sectional quizzes Notebook checks Unit test Journal assignment

Can you graph and compare numbers using a number line?
Order and graph real numbers on a number line and compare them using <, >, and =.
Teacher driven worksheets Textbook ancillaries Interactive white board lessons
Stress the importance of lining up decimals vertically in order to compare numbers. Use an interactive white board to have students demonstrate graphing numbers on a number line.
Sectional quizzes Notebook checks Unit test Exit slips
MA.9‐12.A‐SSE Seeing Structure in Expressions MA.9‐12.A‐REI Reasoning with Equations and Inequalities MA.9‐12.S‐ID Interpreting Categorical and Quantitative Data MA.9‐12.S‐IC Making Inferences and Justifying Conclusions MA.9‐12.S‐CP Conditional Probability and the Rules of Probability MA.9‐12.S‐MD Using Probability to Make Decisions
Differentiation
Students can choose to complete a crossword puzzle to show knowledge of algebraic terminology or they can create “Flip Cards” to demonstrate understanding of operations with numbers.
Technology
Students may use the following websites to help review and relearn concepts covered in this unit. www.hotmath.com, www.catchupmath.com, www.classzone.com, www.khanacademy.org, www.brightstorm.com.
Streaming videos, graphing calculator activities and interactive white boards should be utilized to help students understand the nature of mathematics.
College and Workplace Readiness
Science‐related careers typically call for the ability to understand the nature of the math used in doing research in the given field. Medical doctors routinely take a variety of quantitative measurements to assess the condition of the patient, whether it is a human or an animal. Working with these quantitative measurements requires a full understanding of real numbers.

Unit 02 - Algebra I Unit Plan
Enduring Understandings: Algebraic and numeric procedures are interconnected and build on each other to produce a coherent whole.
Functional relationships can be expressed in real contexts, graphs, algebraic equations, tables and words; each representation of a given function is simply a different way of expressing the same idea.
Rules of arithmetic and algebra can be used together with the concept of equivalence to transform equations and inequalities so solutions can be found to solve problems. Essential Questions: Why is it useful to represent real‐life situations algebraically? How can we use mathematical language and models to describe linear and non‐linear change? How can change be best represented mathematically? How can we determine the most appropriate method to model various situations (linear, non‐linear, quadratics, exponential) What makes alternative algebraic algorithms both effective and efficient? Unit Goals: At the conclusion of this unit, students will be able to:
1. solve linear equations using various methods. 2. solve linear inequalities using various methods. 3. utilize rates, ratios, and percents.
Recommended Duration: 4 weeks

Guiding/Topical Questions Content/Themes/Skills Resources and Materials Suggested Strategies Suggested Assessments
Can you solve one‐step and multi‐step equations using addition, subtraction, multiplication, and division?
Solve linear equations using addition, subtraction, multiplication, and division. Write an equation for a real life function.
Teacher driven worksheets Textbook ancillaries Balancing scale
Stress the concept of balancing an equation by performing an operation on both sides. Have students complete an algorithm to solve word problems.
Sectional quizzes Notebook checks Unit tests
Can you solve one‐step and multi‐step inequalities using addition, subtraction, multiplication, and division?
Solve linear inequalities using addition, subtraction, multiplication and division.
Teacher driven worksheets Textbook ancillaries
Demonstrate by graphing how dividing or multiplying by a negative number changes the solution set of an inequality.
Sectional quizzes Journals Unit tests
Can you solve equations and inequalities with variables on both sides?
Solve linear equations using addition, subtraction, multiplication, and division.
Teacher driven worksheets Textbook ancillaries Balancing scale
Illustrate that variables can be combined on either side of the equation/inequality to solve it.
Sectional quizzes Question and answer session Unit tests
What is a compound inequality and how do we solve it?
Solve linear inequalities using addition, subtraction, multiplication and division.
Teacher driven worksheets Textbook ancillaries Interactive white board lessons
Demonstrate the difference between inequalities involving "and" versus "or" graphically on the interactive white board.
Sectional quizzes Exit slips Unit tests
How does absolute value change the solutions to our equations and inequalities?
Solve linear equations using addition, subtraction, multiplication, and division.
Solve linear inequalities using addition, subtraction, multiplication and division.
Teacher driven worksheets Textbook ancillaries Interactive white board lessons
Demonstrate graphically how absolute value inequalities differ depending on the inequality sign.
Sectional quizzes Journals Unit tests

How can we use our equation solving skills to work with common formulas?
Solve linear equations using addition, subtraction, multiplication, and division.
Rewrite an equation in function form.
Teacher driven worksheets Textbook ancillaries Science textbooks
Connect solving common formulas with science by utilizing formulas commonly used in science classes (Celsius to Fahrenheit)
Sectional quizzes Unit tests Interdisciplinary project
What is a unit rate and how can we use it in real life scenarios?
Use rates, ratios, and percents to model and solve real life problems.
Teacher driven worksheets Textbook ancillaries Grocery store circulars
Use unit rate as an opportunity to show students how to save money on groceries by calculating the unit rate for various products.
Sectional quizzes Projects Unit tests Exit slips
MA.9‐12.A‐SSE Seeing Structure in Expressions MA.9‐12.A‐CED Creating Equations MA.9‐12.A‐REI Reasoning with Equations and Inequalities
Differentiation
Students can work with algebra tiles to obtain a visual representation of equations and inverse operations. Students can complete the “Flying Acrobats” game from www.classzone.com to show understanding of solving linear equations.
Technology
Students should use websites for independent skill reinforcement. Some suggested sites are www.apangea.com, www.hotmath.com , www.catchupmath.com, or www.classzone.com
College and Workplace Readiness
Video game designers must be able to organize and create a logical sequence of instructions for a computer program. A flow diagram may be used to illustrate the procedures being written. Strong organizational skills, attention to detail, and logic are essential skills for any computer programmer.

Unit 03 - Algebra I Unit Plan
Enduring Understandings: Functions, systems of equations, and graphs can be used to model and solve real world situations. Graphs and equations are alternative ways for depicting and analyzing patterns of linear and non‐linear change. Integration of various mathematical procedures builds a strong foundation of finding solutions. Essential Questions: When given a data set of information how can its display, manipulation, and interpretation be effectively used and translated?
Enhanced with technology, how can it be applied to the concepts of mathematics and problem solving? How does the degree change the behavior of a function? How is quadratics an example of non‐linear change? How can the concepts, logic, understanding and reasoning of mathematics be applied culturally to better the future? When is one representation of a function more useful than another?
Unit Goals: At the conclusion of this unit, students will be able to:
1. graph linear equations in one or two variables. 2. calculate slope and utilize it with direct variation.
graph linear inequalities in one or two variables. Recommended Duration: 4 weeks

Guiding/Topical Questions
Content/Themes/Skills Resources and Materials Suggested Strategies Suggested Assessments
How can we use a scatter plot to organize and summarize data?
Plot points in a coordinate plane and make predictions.
Teacher driven worksheets Textbook ancillaries Dry erase boards Interactive white board lessons
Utilize data acquired from the class (height and arm span) to show how relationships can be identified with scatter plots.
Sectional quizzes Exit slips Unit tests Projects
What methods do we have for graphing equations?
Graph linear equations by making a table of values or finding intercepts.
Teacher driven worksheets Textbook ancillaries Dry erase boards Graphing calculators
Demonstrate that all methods for graphing will produce the same line.
Sectional quizzes Journals Notebook checks Unit tests
Can you use slope and direct variation to model real life scenarios?
Find the slope of a line using two of its points.
Interpret slope as a rate of change.
Write linear equations that represent direct variation.
Teacher driven worksheets Textbook ancillaries Dry erase boards
Stress that direct variation problems are simply linear equation problems.
Sectional quizzes Question and answer sessions Unit tests
What is slope intercept form and how do we use it to graph linear equations?
Graph and interpret equations in slope‐intercept form.
Teacher driven worksheets Textbook ancillaries Interactive white board lessons Graphing calculators
Point out to students the ease of graphing equations when they are in slope intercept form.
Sectional quizzes Exit slips Unit tests

How can we use a graph to solve linear equations?
Solve a linear equation graphically by finding x‐intercepts.
Teacher driven worksheets Textbook ancillaries Dry erase boards Graphing calculators
Demonstrate that solving by graphing or by using algebra will produce the same solutions for a linear equation.
Sectional quizzes Question and answer sessions Unit tests
How do functions relate to equations and how can we identify a function graphically?
Identify when a relation is a function.
Use function notation to represent real life situations.
Teacher driven worksheets Textbook ancillaries Interactive white board lessons
Insure that students are able to identify functions graphically. Utilize various word problems to demonstrate that functions occur in real life scenarios.
Sectional quizzes Notebook checks Projects Unit tests
How do we graph linear inequalities?
Graph linear inequalities.
Identify solutions to linear inequalities.
Teacher driven worksheets Textbook ancillaries Interactive white board lessons Dry erase boards
Have students identify more than one solution to a linear inequality so that they grasp that there are many solutions.
Sectional quizzes Question and answer sessions Unit tests
MA.9‐12.N‐Q Quantities MA.9‐12.F‐IF Interpreting Functions MA.9‐12.F‐BF Building Functions

Differentiation Students can create songs or mnemonic devices could help more creative learners recall the steps for graphing linear equations and inequalities. Students can complete the “Mummy Chase” activity found at www.classzone.com to show complete understanding of graphing linear equations. Students can make a stained glass window by graphing several lines as an alternative assessment.
Technology Students should be asked to use the Interactive white board to demonstrate graphing lines. Graphing calculator activities should be demonstrated by the teacher to enforce graphing lines using slope intercept form. Helpful websites for students are: www.hotmath.com, www.catchupmath.com, www.classzone.com, www.khanacademy.org, www.brightstorm.com
College and Workplace Readiness Nurses may need to use math when dealing with medication, taking vital signs, making assessments, and helping to make treatment plans. Clerical and administrative duties may also require math skills. These vital measurements can be displayed graphically and nurses are expected to fully understand them.

Unit 04 - Algebra I Unit Plan
Enduring Understandings: Functions, systems of equations, and graphs can be used to model and solve real world situations. Integration of various mathematical procedures builds a strong foundation of finding solutions. Rules of arithmetic and algebra can be used together with the concept of equivalence to transform equations and inequalities so solutions can be found to solve problems. Logical patterns exist and are a regular occurrence in mathematics and the world around us. Essential Questions: What makes alternative algebraic algorithms both effective and efficient? When given a data set of information how can its display, manipulation, and interpretation be effectively used and translated? Enhanced with technology, how can it be applied to the concepts of mathematics and problem solving? How can the concepts, logic, understanding and reasoning of mathematics be applied culturally to better the future? When is one representation of a function more useful than another? How can patterns, relations and functions be used to best describe and explain relationships between quantities and assist in modeling real life situations? What are some ways to represent, describe, and analyze patterns that occur in our world?
Unit Goals: At the conclusion of this unit, students will be able to:
1. write linear equations in various forms. 2. create a line of best fit. 3. use, write, and evaluate sequences and series.
Recommended Duration: 4 weeks

Guiding/Topical Questions
Content/Themes/Skills Resources and Materials Suggested Strategies Suggested Assessments
Can you write linear equations given information about the line?
Write a linear equation given a slope and a point or given two points.
Teacher driven worksheets Textbook ancillaries Interactive white board lessons
Insure that students fully grasp the necessary steps needed to write a linear equation based upon the information given. Make sure students are able to write equations for vertical and horizontal lines.
Sectional quizzes Exit slips Unit tests
Can you write linear equations in various forms?
Write the equation of a line in the following three forms: slope‐intercept form, point‐slope form, standard form
Teacher driven worksheets Textbook ancillaries Interactive white board lessons
Require students to practice transforming a linear equation in one form into the other two forms.
Sectional quizzes Notebook checks Unit tests
How do we determine which linear equation form is appropriate?
Utilize the three forms of linear equations (slope‐intercept form, point‐slope form, standard form) Transform an equation from one form into another form.
Teacher driven worksheets Textbook ancillaries Dry erase boards
Have students debate which linear equation form is most appropriate by listing the pros and cons of each one.
Sectional quizzes Journal Unit tests
What is a line of best fit and how can we create one and use it?
Find a linear equation that approximates a set of data points.
Teacher driven worksheets Textbook ancillaries Interactive white board lessons Graphing calculators
Demonstrate how useful lines of best fit can be by predicting real life scenarios (population, income, etc).
Sectional quizzes Notebook checks Projects Unit tests
How do we identify sequences and series?
Identify and write sequences and series. Evaluate a series.
Teacher driven worksheets Textbook ancillaries Interactive white board lessons
Make sure students are able to clearly explain the difference between a sequence and a series.
Sectional quizzes Exit slips Unit tests

MA.9‐12.A‐REI Reasoning with Equations and Inequalities MA.9‐12.F‐IF Interpreting Functions MA.9‐12.F‐BF Building Functions MA.9‐12.F‐LE Linear, Quadratic, and Exponential Models
Differentiation
Students can be paired with a partner to brainstorm ways to collect data to create a scatter plot to find the line of best fit and then plot the data to find the line of best fit.
Technology
Students can use the graphing calculator to help them visualize the line of best fit. Some excellent homework help sites are: www.hotmath.com, www.catchupmath.com, www.classzone.com, www.khanacademy.org, www.brightstorm.com.
College and Workplace Readiness
Anthropologists often work with large amounts of data. This requires an excellent understanding of statistical techniques. Anthropologists must also be able to piece together information in a logical and systematic way such that meaningful conclusions can be drawn. Many anthropologists are detail‐oriented and methodical in their approach to work. The ability to write linear equations to model the data measured is a crucial career skill.

Unit 05 - Algebra I Unit Plan
Enduring Understandings: Algebraic and numeric procedures are interconnected and build on each other to produce a coherent whole. Rules of arithmetic and algebra can be used together with the concept of equivalence to transform equations and inequalities so solutions can be found to solve problems. Functions, systems of equations, and graphs can be used to model and solve real world situations. Graphs and equations are alternative ways for depicting and analyzing patterns of linear and non‐linear change. Essential Questions: Why is it useful to represent real‐life situations algebraically? How can we use mathematical language and models to describe linear and non‐linear change? What makes alternative algebraic algorithms both effective and efficient? When given a data set of information how can its display, manipulation, and interpretation be effectively used and translated? Enhanced with technology, how can it be applied to the concepts of mathematics and problem solving? How does degree change the behavior of a function? How are quadratics an example of non‐linear change? Unit Goals: At the conclusion of this unit, students will be able to:
1. solve linear systems using various methods. 2. solve systems of inequalities.
Recommended Duration: 3 weeks

Guiding/Topical Questions
Content/Themes/Skills Resources and Materials
Suggested Strategies Suggested Assessments
How do we identify the solution of a system graphically?
Solve a system of linear equations by graphing.
Teacher driven worksheets Textbook ancillaries Graphing calculators
Review graphing linear equations.
Sectional quizzes Notebook checks Unit tests
Can you solve linear systems by substitution and linear combinations?
Use substitution to solve a linear system.
Use linear combinations to solve a system of linear equations.
Choose the best method to solve a system of linear equations.
Teacher driven worksheets Textbook ancillaries Interactive white board lessons
Demonstrate that both substitution and linear combinations will produce the same solutions. Make sure that students understand how to use these methods when the system has no solution or many solutions.
Sectional quizzes Notebook checks Exit slips Unit tests
What types of solutions can we have when solving a linear system?
Identify linear systems as having one solution, no solution, or infinitely many solutions.
Model real life problems using a linear system.
Teacher driven worksheets Textbook ancillaries Graphing calculators Dry erase boards
Show how applicable linear systems are to real life scenarios such as selecting phone companies, balancing income versus deductions, etc.
Sectional quizzes Projects Exit slips Unit tests
Can you solve systems of linear inequalities?
Solve a system of linear inequalities by graphing.
Use a system of linear inequalities to model a real life situation.
Teacher driven worksheets Textbook ancillaries Dry erase boards Colored pencils
Demonstrate the usefulness of using different colors to identify the solutions for each inequality before identifying the final solution set.
Sectional quizzes Notebook checks Unit tests

MA.9‐12.N‐Q Quantities MA.9‐12.A‐SSE Seeing Structure in Expressions MA.9‐12.A‐REI Reasoning with Equations and Inequalities MA.9‐12.F‐IF Interpreting Functions
Differentiation
Students could use dry erase boards to demonstrate their knowledge of solving systems of equations. Students could be placed into cooperative learning groups to decide which method is appropriate to solve a system.
Technology
Graphing calculator activities could be used to demonstrate finding solutions to systems of equations. Students could use www.Classzone.com to find extra practice problems to prepare for assessments.
College and Workplace Readiness
Chefs use mathematics on a regular basis, especially when a recipe needs to be adapted to serve more or less people. When this is the case, chefs may apply ratios and conversion factors to determine the amount of each ingredient needed. They may also utilize systems of equations to balance out cost of food production versus demand from the customers.

Unit 06 - Algebra I
Unit Plan
Enduring Understandings: Algebraic and numeric procedures are interconnected and build on each other to produce a coherent whole. Functional relationships can be expressed in real contexts, graphs, algebraic equations, tables and words; each representation of a given function is simply a different way of expressing the same idea. Rules of arithmetic and algebra can be used together with the concept of equivalence to transform equations and inequalities so solutions can be found to solve problems. Essential Questions: Why is it useful to represent real‐life situations algebraically? How can we use mathematical language and models to describe linear and non‐linear change? How can change be best represented mathematically? How can we determine the most appropriate method to model various situations (linear, non‐linear, quadratics, exponential)? What makes alternative algebraic algorithms both effective and efficient? Unit Goals: At the conclusion of this unit, students will be able to: 1. Apply properties of exponents to exponential expressions.
2. Use scientific notation to apply to real life situations. Recommended Duration: 3 weeks

Guiding/Topical Questions
Content/Themes/Skills Resources and Materials Suggested Strategies Suggested Assessments
What are the rules and properties of exponents that can be used to simplify and work with exponential expressions?
Use properties to multiple and divide exponential expressions. Apply the order of operations concepts when manipulating expressions.
Teacher driven worksheets Textbook ancillaries Interactive white board lessons Interactive websites
Use of calculators to evaluate powers in order to verify evaluations. Write out expressions listing all factors for visual interpretation of combining exponents.
Sectional quizzes Homework quizzes Notebook checks Exit cards Unit test
How do negative and zero exponents effect expressions?
Simplify negative and zero exponents.
Teacher driven worksheets Textbook ancillaries Interactive white board lessons Interactive websites
Relate zero and negative exponents to the division property. Show patterns of a base to incremental exponents to develop the zero and negative powers.
Sectional quizzes Homework quizzes Notebook checks Exit cards Unit test
What is the thought process used to categorize an exponential function as growth or decay?
Classify models as growth or decay. Graph and compare exponential models. Create and explain models and graphs from real life applications.
Teacher driven worksheets Textbook ancillaries Interactive white board lessons Interactive websites
Use graphing calculators to enter exponential functions, examine tables and view multiple functions at once. Use a real life application problem involving such concepts as inflation, interest, and depreciation.
Sectional quizzes Homework quizzes Notebook checks Exit cards Unit test

How can very large or very small numbers be expressed and manipulated in scientific notation? How are the signs of exponents related to the size of the number being expressed?
Apply the rules of exponents to operations performed with scientific expressions. Introduce the use of scientific notation to real life applications involving very large and small numbers.
Teacher driven worksheets Textbook ancillaries Interactive white board lessons Interactive websites
Demonstrate the advantage of using scientific notation in real life application problems from various resources. (text, resource books and Internet)
Sectional quizzes Homework quizzes Notebook checks Exit cards Unit test
MA.9‐12.A‐SSE.3.c Use the properties of exponents to transform expressions for exponential functions. MA.9‐12.A‐REI.11 Explain why the x‐coordinates of the points where the graphs of the equations y = f(x) and y = g(x) intersect are the solutions of the equation f(x) = g(x); find the solutions
approximately, e.g., using technology to graph the functions, make tables of values, or find successive approximations. Include cases where f(x) and/or g(x) are linear, polynomial, rational, absolute value, exponential, and logarithmic functions.
MA.9‐12.F‐IF.8.b Use the properties of exponents to interpret expressions for exponential functions. MA.9‐12. Construct and compare linear, quadratic, and exponential models and solve problems MA.9‐12.F‐LE.1.a Prove that linear functions grow by equal differences over equal intervals, and that exponential functions grow by equal factors over equal intervals. MA.9‐12.F‐LE.5 Interpret the parameters in a linear or exponential function in terms of a context.
Differentiation
Students can research where exponential growth and decay appear in the real world. Students can create a lesson to teach to the class that explains the many uses of scientific notation.
Technology
Students could use the interactive white board to demonstrate the graph of exponential growth and decay. Students could use www.hotmath.com to help them understand homework assignment in this unit.
College and Workplace Readiness
Pharmacists perform many calculations, especially as they relate to dosage requirements and concentration levels. These calculations often take into consideration such variables as a patient's gender, age, and weight. Since decisions usually affect a patient's health, pharmacists must be extremely detail‐oriented and precise. Pharmacists usually have strong scientific and mathematical aptitude. The way a dosage leaves the body can be modeled using exponential decay. In addition, the exponential growth of bacteria is a key topic in the medical field.

Unit 07 - Algebra I
Unit Plan
Enduring Understandings: Functional relationships can be expressed in real contexts, graphs, algebraic equations, tables and words; each representation of a given function is simply a different way of expressing the same idea. Functions, systems of equations, and graphs can be used to model and solve real world situations. Mathematical models can be used to describe physical relationships; these relationships are often non‐linear. Graphs and equations are alternative ways for depicting and analyzing patterns of linear and non‐linear change. Essential Questions: How can change be best represented mathematically? How can we determine the most appropriate method to model various situations (linear, non‐linear, quadratics, exponential)? When given a data set of information how can its display, manipulation, and interpretation be effectively used and translated? Enhanced with technology, how can it be applied to the concepts of mathematics and problem solving? How can we model situations using quadratics, exponents, and polynomials? Enhanced with the integration of technology, how can it be applied to the concepts of mathematics and problem solving?
How does degree change the behavior of a function? How are quadratics an example of non‐linear change? Unit Goals: At the conclusion of this unit, students will be able to:
1. Identify properties and graph quadratic functions and inequalities. 2. Solve quadratic equations by finding square roots or by using the quadratic formula. 3. Analyze the solutions of a quadratic equation by viewing the discriminant.
Recommended Duration: 4 weeks

Guiding/Topical Questions
Content/Themes/Skills Resources and Materials Suggested Strategies Suggested Assessments
What is the meaning of a square root and how are square root expressions manipulated?
Introduce the terms perfect square, radicand, rational number, irrational number and square root. Simplify square root expressions.
Teacher driven worksheets Textbook ancillaries Interactive white board lessons Interactive websites
Present chart of perfect squares to use for simplifying radicals. Define rational vs. irrational. Use graphing calculator to evaluate radical expressions.
Sectional quizzes Homework quizzes Notebook checks Exit cards Unit test
How does the graph of a quadratic differ from a linear model? What are its characteristics? What is meant by finding its solutions or roots?
Define or describe a parabola and the term symmetrical. Find the parabola’s axis of symmetry, vertex, and pattern of dispersion for its y‐values. Determine the relation between solutions, roots, and x‐intercepts.
Teacher driven worksheets
Textbook ancillaries Interactive white board lessons Interactive websites
Define terms; parabola, symmetry, vertex. Use graphing calculator to examine table of values, find pattern of change, use menu to find min/max and zeros.
Sectional quizzes Homework quizzes Notebook checks Exit cards Unit test
How do you decide when a quadratic can be solved by finding square roots as opposed to using the quadratic formula?
Analyze the quadratic function and emphasize that the square root can only be taken when the x‐term has a coefficient of zero. Use the quadratic formula if the quadratic equation contains a coefficient other than zero for the x‐term.
Teacher driven worksheets Textbook ancillaries Interactive white board lessons Interactive websites
Use graphing calculator to find zeros. Adjust table‐set as needed to view the x, y pairings.
Sectional quizzes Homework quizzes Notebook checks Exit cards Unit test
What is the meaning of the solutions of real life applications involving quadratic models?
Apply the concepts of a quadratic to a real life applications (such as projectile motion) to determine if the solutions are feasible. Determine if the events can actually occur.
Teacher driven worksheets Textbook ancillaries Interactive white board lessons Interactive websites
Use real life applications to examine the meaning of multiple solutions.
Sectional quizzes Homework quizzes Notebook checks Exit cards Unit test
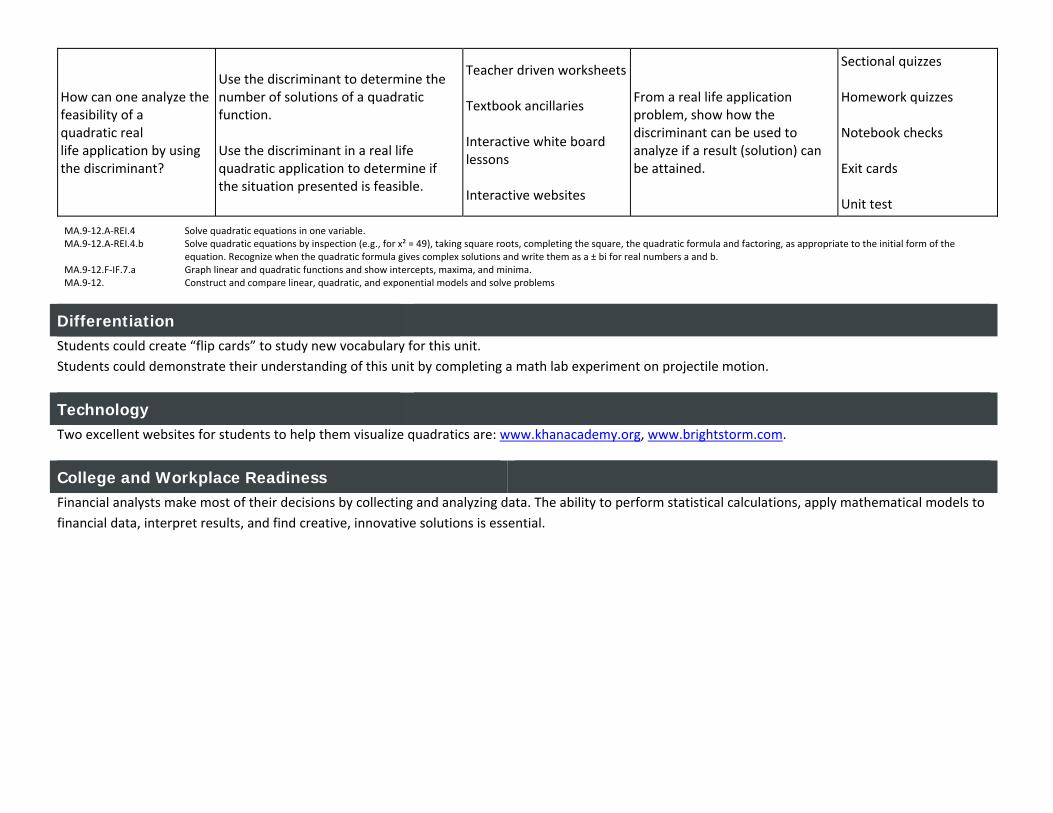
How can one analyze the feasibility of a quadratic real life application by using the discriminant?
Use the discriminant to determine the number of solutions of a quadratic function. Use the discriminant in a real life quadratic application to determine if the situation presented is feasible.
Teacher driven worksheets Textbook ancillaries Interactive white board lessons Interactive websites
From a real life application problem, show how the discriminant can be used to analyze if a result (solution) can be attained.
Sectional quizzes Homework quizzes Notebook checks Exit cards Unit test
MA.9‐12.A‐REI.4 Solve quadratic equations in one variable. MA.9‐12.A‐REI.4.b Solve quadratic equations by inspection (e.g., for x² = 49), taking square roots, completing the square, the quadratic formula and factoring, as appropriate to the initial form of the
equation. Recognize when the quadratic formula gives complex solutions and write them as a ± bi for real numbers a and b. MA.9‐12.F‐IF.7.a Graph linear and quadratic functions and show intercepts, maxima, and minima. MA.9‐12. Construct and compare linear, quadratic, and exponential models and solve problems
Differentiation
Students could create “flip cards” to study new vocabulary for this unit. Students could demonstrate their understanding of this unit by completing a math lab experiment on projectile motion.
Technology
Two excellent websites for students to help them visualize quadratics are: www.khanacademy.org, www.brightstorm.com.
College and Workplace Readiness
Financial analysts make most of their decisions by collecting and analyzing data. The ability to perform statistical calculations, apply mathematical models to financial data, interpret results, and find creative, innovative solutions is essential.

Unit 08 - Algebra I Unit Plan
Enduring Understandings: Rules of arithmetic and algebra can be used together with the concept of equivalence to transform equations and inequalities so solutions can be found to solve problems. Mathematical models can be used to describe physical relationships; these relationships are often non‐linear. Integration of various mathematical procedures builds a strong foundation of finding solutions. Essential Questions: What makes alternative algebraic algorithms both effective and efficient? How can we model situations using quadratics, exponents, and polynomials? Enhanced with the integration of technology, how can it be applied to the concepts of mathematics and problem solving? How can the concepts, logic, understanding and reasoning of mathematics be applied culturally to better the future? When is one representation of a function more useful than another?
Unit Goals: At the conclusion of this unit, students will be able to:
1. Perform the operations of addition, subtraction and multiplication on polynomial expressions. 2. Perform various methods of factoring on polynomial expressions. 3. Solve quadratic equations by factoring.
Recommended Duration: 4 weeks

Guiding/Topical Questions
Content/Themes/Skills Resources and Materials Suggested Strategies Suggested Assessments
How polynomials are classified?
Apply the concept of degree and number of terms in the expression.
Teacher driven worksheets Textbook ancillaries Interactive white board lessons Interactive websites
Define terms: degree, term, and coefficient. Compare types of polynomials through using a chart.
Sectional quizzes Homework quizzes Notebook checks Exit cards Unit test
How are polynomial expressions combined through the use of addition and subtraction?
Simplify expressions and combine the coefficients of like terms.
Teacher driven worksheets Textbook ancillaries Interactive white board lessons Interactive websites
Define like terms. Present worksheets to enforce +/‐ of coefficients of like terms.
Sectional quizzes Homework quizzes Notebook checks Exit cards Unit test
How are polynomial expressions multiplied?
Apply the distributive property to multiply binomial to binomial and trinomial.
Teacher driven worksheets Textbook ancillaries Interactive white board lessons Interactive websites
Demonstrate examples of the distributive property. Have students develop concept of first, outer, inner, last (FOIL).
Sectional quizzes Homework quizzes Notebook checks Exit cards Unit test
How are these operations applied to real world situations?
Apply in situations such as finding areas, distances, profit and population where key items are expressed as polynomial expressions.
Teacher driven worksheets Textbook ancillaries Interactive white board lessons Interactive websites
Use real life application problems from text, resource books and internet to show applications of polynomial expressions.
Sectional quizzes Homework quizzes Notebook checks Exit cards Unit test

How can factoring be used as an alternative method to solve a quadratic equation?
Use different factoring methods (Greatest Common Factor (GCF), difference of two squares, or trinomials) and the concept of the multiplication property of zero to simplify a polynomial expression to solve an equation.
Teacher driven worksheets
Textbook ancillaries
Interactive white board lessons Interactive websites
Demonstrate the combination of factoring along with the multiplication property of zero to solve the equation.
Sectional quizzes Homework quizzes Notebook checks Exit cards Unit test
MA.9‐12.A‐SSE.3.a Factor a quadratic expression to reveal the zeros of the function it defines. MA.9‐12.A‐APR Arithmetic with Polynomials and Rational Expressions MA.9‐12. Perform arithmetic operations on polynomials MA.9‐12. Understand the relationship between zeros and factors of polynomials MA.9‐12.A‐APR.3 Identify zeros of polynomials when suitable factorizations are available, and use the zeros to construct a rough graph of the function defined by the polynomial. MA.9‐12.F‐IF.8.a Use the process of factoring and completing the square in a quadratic function to show zeros, extreme values, and symmetry of the graph, and interpret these in terms of a
context.
Differentiation Students could be placed into several groups. Each group is given a specific problem that deals with a specific skill of factoring. Students could make a poster, a presentation using computer software, or create a hand‐out and present their problem for the whole class.
Technology Students will be able to use different software associated with Microsoft Office to demonstrate their knowledge and skills developed in this unit.
College and Workplace Readiness Landscape designers define the physical landscape at a job site by making a series of measurements. They also perform a wide variety of calculations related to the project design as well as day‐to‐day business operations. Strong visualization skills are helpful and familiarity with computer aided design (CAD) software is essential. Designers may be asked to plan a design that fits within a budget. An understanding of area and volume, often conveyed as polynomial functions, is also a necessary skill.

Unit 09 - Algebra I Unit Plan
Enduring Understandings: Algebraic and numeric procedures are interconnected and build on each other to produce a coherent whole. Functional relationships can be expressed in real contexts, graphs, algebraic equations, tables and words; each representation of a given function is simply a different way of expressing the same idea. Rules of arithmetic and algebra can be used together with the concept of equivalence to transform equations and inequalities so solutions can be found to solve problems. Graphs and equations are alternative ways for depicting and analyzing patterns of linear and non‐linear change. Mathematical models can be used to describe physical relationships; these relationships are often non‐linear. Essential Questions: Why is it useful to represent real‐life situations algebraically? How can we use mathematical language and models to describe linear and non‐linear change? How can change be best represented mathematically? How can we determine the most appropriate method to model various situations (linear, non‐linear, quadratics, exponential)? What makes alternative algebraic algorithms both effective and efficient? How does degree change the behavior of a function? How are quadratics an example of non‐linear change? How can we model situations using quadratics, exponents, and polynomials? Enhanced with the integration of technology, how can it be applied to the concepts of mathematics and problem solving? How can the concepts, logic, understanding and reasoning of mathematics be applied culturally to better the future? When is one representation of a function more useful than another? Unit Goals: At the conclusion of this unit, students will be able to:
1. apply different methods to solve rational equations. 2. graph functions involving direct and inverse variation. 3. perform mathematical operations to simplify ration expressions. 4. graph and understand the key concepts of rational functions.
Recommended Duration: 4 weeks

Guiding/Topical Questions
Content/Themes/Skills Resources and Materials
Suggested Strategies Suggested Assessments
How do you manipulate rational expressions to perform basic operations?
Apply factoring techniques to simplify rational expressions. Apply basic concepts of fraction manipulation as used in pre‐algebra to simplify rational expressions. Add, Subtract, multiply, and divide rational expressions.
Teacher driven worksheets Textbook ancillaries Interactive white board lessons Interactive websites
Reinforce concepts from basic fraction manipulations, such as finding common denominators.
Sectional quizzes Homework quizzes Notebook checks Exit cards Unit test
How can rational equations be solved?
Use concepts of cross multiplication to solve rational equations in the form of a proportion.
Multiple each fraction by the least common denominator (LCD) to simplify the denominators (if multiple terms exist on each side of the equal sign).
Combine rational expressions to create a proportion where cross multiplying can be used.
Teacher driven worksheets Textbook ancillaries Interactive white board lessons Interactive websites
Relate techniques of simplifying integral fractions to solve equations. Emphasize the necessity to factor expressions to find the least common denominator.
Sectional quizzes Homework quizzes Notebook checks Exit cards Unit test
How do you manipulate and graph simple rational functions?
Investigate a table of values for the function. Develop the concept of a hyperbola graph and asymptotes. Show the relation between the standard form values of a, h, and k and the characteristics of the graph.
Teacher driven worksheets
Textbook ancillaries Interactive white board lessons Interactive websites
Define hyperbola, asymptote, domain, and range. Use graphing calculators to help students visualize, use the table and zoom feature.
Sectional quizzes Homework quizzes Notebook checks Exit cards Unit test

How are the graphs of rational functions related to the graphs of inverse variation functions?
Find inverse functions. Use a table of values to graph and develop the characteristics of a hyperbola.
Teacher driven worksheets Textbook ancillaries Interactive white board lessons Interactive websites
Starting with the previously shown direct variation function, demonstrate the difference with an inverse variation function. Compare graphs of linear, inverse and rational functions.
Sectional quizzes Homework quizzes Notebook checks Exit cards Unit test
MA.9‐12.A‐APR.6 Rewrite simple rational expressions in different forms; write a(x)/b(x) in the form q(x) + r(x)/b(x), where a(x), b(x), q(x), and r(x) are polynomials with the degree of r(x) less than the degree of b(x), using inspection, long division, or, for the more complicated examples, a computer algebra system.
MA.9‐12.A‐APR.7 Understand that rational expressions form a system analogous to the rational numbers, closed under addition, subtraction, multiplication, and division by a nonzero rational expression; add, subtract, multiply, and divide rational expressions.
MA.9‐12.A‐REI.2 Solve simple rational and radical equations in one variable, and give examples showing how extraneous solutions may arise. MA.9‐12.F‐IF.7.d Graph rational functions, identifying zeros and asymptotes when suitable factorizations are available, and showing end behavior.
Differentiation Students could complete the “Stained Glass Window” project to demonstrate their knowledge of rational functions.
Technology Students could use www.brightstorm.com to reinforce materials learned in this chapter.
College and Workplace Readiness Depending on the particular service industry, skills in accounting, bookkeeping, and business administration may be used and will help in advancing within the industries. Childcare workers will need to keep records on individual children as well as bookkeeping and payment information. Chefs will need to be able to use proportions to calculate quantities in large recipes. Customer service representatives will need strong problem solving skills. A thorough understanding of solving complex equations pertaining to money and products is necessary.

Unit 10 - Algebra I Unit Plan
Enduring Understandings: Logical patterns exist and are a regular occurrence in mathematics and the world around us. Functions, systems of equations, and graphs can be used to model and solve real world situations. Mathematical models can be used to describe physical relationships; these relationships are often non‐linear. Integration of various mathematical procedures builds a strong foundation of finding solutions. Essential Questions: How can patterns, relations and functions are used to best describe and explain relationships between quantities and assist in modeling real life situations? What are some ways to represent, describe, and analyze patterns that occur in our world? When given a data set of information how can its display, manipulation, and interpretation be effectively used and translated? Enhanced with technology, how can it be applied to the concepts of mathematics and problem solving? How can we model situations using quadratics, exponents, and polynomials? Enhanced with the integration of technology, how can it be applied to the concepts of mathematics and problem solving? How can the concepts, logic, understanding and reasoning of mathematics be applied culturally to better the future? When is one representation of a function more useful than another? Unit Goals: At the conclusion of this unit, students will be able to:
1. combine simplifying radicals with performing mathematical operations with radical expressions. 2. solve radical equations by isolating the radical and then squaring both sides of the equation and solving for x. 3. use the Pythagorean theorem to solve for a missing side in a right triangle. 4. apply the concept of coordinate geometry to find the distance between given points and the coordinates of the midpoint between two points.
Recommended Duration: 2 weeks

Guiding/Topical Questions
Content/Themes/Skills Resources and Materials Suggested Strategies Suggested Assessments
Given a radical expression, how do you apply methods of simplifying each term to create “like radicals” to then combine using addition and subtraction?
Relate the concept of like radical to like terms used in polynomial manipulation. Show the similarity in combining coefficients.
Teacher driven worksheets Textbook ancillaries Interactive white board lessons Interactive websites
Review concept of rationalizing and the form of 1 needed. Relate like radicals to like terms used for polynomial operations.
Sectional quizzes Homework quizzes Notebook checks Exit cards Unit test
When multiplying radical expressions what is the best method to use in order to arrive at the solution in simplest form?
Multiply radical expressions. Simplify expressions throughout the multiplying process.
Teacher driven worksheets Textbook ancillaries Interactive white board lessons Interactive websites
Relate the similarity of multiplying radical expressions to multiplying polynomial expressions and using distributive property. Demonstrate use of simplifying at different stages of working a problem. Have students develop a technique.
Sectional quizzes Homework quizzes Notebook checks Exit cards Unit test
How do you rationalize an expression with a radical in the denominator?
Use the concept of the identity property of multiplication. Use the conjugate to rationalize a binomial denominator. Multiply the sum and difference of two terms.
Teacher driven worksheets Textbook ancillaries Interactive white board lessons Interactive websites
Define conjugate and relate to polynomial multiplication of the sum and difference of two terms. Through separate multiplication problems relate this process to multiplying the sum and difference of two terms.
Sectional quizzes Homework quizzes Notebook checks Exit cards Unit test
When solving a radical equation the radical is simplified by squaring both sides of the equation. What methods can now be used to solve for X and are the solutions feasible?
Utilize the basic ideas of solving an equation from previous units where the initial process is to isolate the radical. Check solutions for validity.
Teacher driven worksheets Textbook ancillaries Interactive white board lessons Interactive websites
Be sure to have students check for extraneous solutions. Emphasize squaring of both sides of the equation. Resulting equations can be linear or quadratic and must be appropriately solved.
Sectional quizzes Homework quizzes Notebook checks Exit cards Unit test

How can the Pythagorean theorem be used to solve for a missing side in a right triangle? How can this method be applied to real life geometric applications?
The three sides of any right triangle are related to each other through the Pythagorean theorem. In finding a missing side use previous methods of solving an equation. When applying to real life situations check validity of solutions. (Are negative solutions possible?)
Teacher driven worksheets Textbook ancillaries Interactive white board lessons Interactive websites
Use real life applications to show how physical therapy is used by many occupations. (resources and internet)
Sectional quizzes Homework quizzes Notebook checks Exit cards Unit test
On a coordinate plane how can you find the distance between two points which are not horizontally or vertically aligned?
Using a coordinate plane show how the distance between points aligned horizontally or vertically can easily be found using subtraction. When the points are aligned in a diagonal nature the distance formula must be used. Demonstrate how the distance formula is related to the Pythagorean theorem.
Teacher driven worksheets Textbook ancillaries Interactive white board lessons Interactive websites
Show through resources and internet how coordinates are used in various situations. (military, surveying etc)
Sectional quizzes Homework quizzes Notebook checks Exit cards Unit test
On a coordinate plane how can you find the midpoint between two points which are not horizontally or vertically aligned?
Relate the concept of the midpoint to being the average of the two given points.
Teacher driven worksheets Textbook ancillaries Interactive white board lessons Interactive websites
Show through resources and internet how coordinates are used in various situations. (military, surveying etc)
Sectional quizzes Homework quizzes Notebook checks Exit cards Unit test

MA.9‐12.N‐RN.1 Explain how the definition of the meaning of rational exponents follows from extending the properties of integer exponents to those values, allowing for a notation for radicals in terms of rational exponents.
MA.9‐12.A‐REI.2 Solve simple rational and radical equations in one variable, and give examples showing how extraneous solutions may arise.
Differentiation
Students could use dry‐erase boards to plot points and find the distance and midpoints between several points. Students could use graph paper to plot points to create a right triangle and find the lengths of the sides using the Pythagorean theorem.
Technology
Students could use www.hotmath.com to help them with homework. Students could use the graphing calculator to plot points and find lengths of sides of right triangles.
College and Workplace Readiness
Architects and general contractors use the Pythagorean theorem to calculate the lengths and dimensions necessary for construction.

Unit 11 - Algebra I Unit Plan
Enduring Understandings: Logical patterns exist and are a regular occurrence in mathematics and the world around us. Probability quantifies the likelihood that an event will occur and enables us to make predictions and informed decisions. The result of statistical investigation can be used to support or refute an argument. Essential Questions: How can patterns, relations and functions be used to best describe and explain relationships between quantities and assist in modeling real life situations? What are some ways to represent, describe, and analyze patterns that occur in our world? How can exponential and theoretical probability be used to make predictions or draw conclusions? How can we decide when to use an exact answer or when to use an estimate? How can the collection, organization, interpretation, and display of data be used to answer questions? Unit Goals: 1) Count the number of ways an event can happen. 2) Identify the basic differences between Experimental and Theoretical Probability. 3) Find the probability of a single event occurring. 4) Find the outcomes of compound events occurring. Recommended Duration: 2 weeks

Guiding/Topical Questions
Content/Themes/Skills Resources and Materials Suggested Strategies Suggested Assessments
When analyzing a set of data how can you use the mean, median and mode to represent central tendency?
Given a data set examine each measure of central tendency and determine which best represents the data.
Teacher driven worksheets
Textbook ancillaries
Interactive white board lessons
Use of items listed in Technology section
Demonstrate how the mean of a data set can be affected by outliers (ie ‐ salaries of employees and their boss).
Sectional quizzes Homework quizzes Notebook checks Exit Cards Unit test
When viewing a graph representation of a data set how can the information best be interpreted?
Given a box‐and‐whisker plot translate key points such as the quartiles. Given a stem‐and‐leaf plot interpret the data range and groupings. Extend analysis to various other graphing presentations.
Teacher driven worksheets
Textbook ancillaries
Interactive white board lessons
Use of items listed in Technology section
Using the term "SOCS" to remind students of how to properly describe distributions from graphs (Shape, Outliers, Spread, Center).
Sectional quizzes Homework quizzes Notebook checks Exit Cards Unit test
Given a situation where multiple events occur, how can you count the number of possible outcomes?
Apply the Fundamental Counting Principle to examine and tally a final outcome. Examine the differences in finding outcomes based on the order of the outcomes. (Permutations and Combinations).
Teacher driven worksheets
Textbook ancillaries
Interactive white board lessons
Use of items listed in Technology section
Use of menus to create a tree of choices. (also creation of license plates) Dressing for a party, what are your choices?
Sectional quizzes Homework quizzes Notebook checks Exit Cards Unit test

How can you examine an event to determine the likelihood of a particular outcome?
Define probable probably and likelihood. Relate meaning to random play on an IPOD.
Teacher driven worksheets
Textbook ancillaries
Interactive white board lessons
Use of items listed in Technology section
In class demos of students picking cards, picking objects out of a bag. Record outcomes to develop meaning of probability.
Sectional quizzes Homework quizzes Notebook checks Exit Cards Unit test
If multiple events occur do they share any outcomes or are they mutually exclusive?
Show daily choices made and how one event can affect another.
Teacher driven worksheets
Textbook ancillaries
Interactive white board lessons
Use of items listed in Technology section
In class demos where difference between dependent and independent events are shown.
Sectional quizzes Homework quizzes Notebook checks Exit Cards Unit test
What are the differences involved in finding the probabilities of these multiple events?
Examine each event on its own while you examine the probability of that event ‐ examine the relation, if any, between the events. Discuss the effect(s) that will occur with the final probability.
Teacher driven worksheets
Textbook ancillaries
Interactive white board lessons
Use of items listed in Technology section
Define unions and intersections of events and their effect on the outcome.
Sectional quizzes Homework quizzes Notebook checks Exit Cards Unit test

Differentiation The use of Interactive white boards, Cooperative Sessions and Alternative Assessment Projects to meet the needs of a diverse student population. Refer to textbook resource materials for Real Life and Interdisciplinary Applications.
Technology www.hotmath.com, www.catchupmath.com, www.classzone.com, www.khanacademy.org, www.brightstorm.com, You‐Tube Lesson Videos, Graphing Calculators
College and Workplace Readiness Reporters are called upon to present information that is accurate and reliable. This information may be statistical in nature. For example, reporters gather statistics related to sporting events, economic events, and public opinion. The accuracy of this information often relies upon mathematical calculations. Sports journalists in particular can be expected to master analysis of the statistics related to the sporting event they are covering. A full understanding of probability and odds is necessary for a reporter to fully understand the sports they are covering.
MA.9‐12.S‐ID.1 Represent data with plots on the real number line (dot plots, histograms, and box plots). MA.9‐12.S‐ID.2 Use statistics appropriate to the shape of the data distribution to compare center (median, mean) and spread (interquartile range, standard deviation) of two or more different data
sets. MA.9‐12.S‐ID.6.c Fit a linear function for a scatter plot that suggests a linear association. MA.9‐12.S‐CP Conditional Probability and the Rules of Probability MA.9‐12. Use probability to evaluate outcomes of decisions