Adaptive strategy of the invader Mnemiopsis leidyi and its predators Beroe spp. in the Eurasian seas
Upload
independentCategory
view
0download
0
BioInvasions Records (2012) Volume 1, Issue 3: 145–159 doi: http://dx.doi.org/10.3391/bir.2012.1.3.01 © 2012 The Author(s). Journal compilation © 2012 REABIC
Open Access
145
Research Article
Occurrence, inter-annual variability and zooplankton-predation impact of the invasive ctenophore Mnemiopsis leidyi and the native jellyfish Aurelia aurita in Limfjorden (Denmark) in 2010 and 2011
Hans Ulrik Riisgård1*, Cornelia Jaspers2, Sandrine Serre3 and Kim Lundgreen1 1 Marine Biological Research Centre (University of Southern Denmark), Hindsholmvej 11, DK-5300 Kerteminde, Denmark 2 National Institute of Aquatic Resources, Technical University of Denmark, Kavalergården 6, 2920 Charlottenlund, Denmark 3 Ingénieure Agronome, ÉcoOcéan Institut, 18 rue des Hospices, 34090 Montpellier, France
E-mail: [email protected] (HUR), [email protected] (CJ), [email protected] (SS), [email protected] (KL)
*Corresponding author
Received: 23 March 2012 / Accepted: 11 June 2012 / Published online: 18 June 2012
Abstract
In 2007, the invasive ctenophore Mnemiopsis leidyi was observed for the first time in Limfjorden (Denmark) where it exhibited mass occurrence in late summer while the indigenous and usually dominating common jellyfish, Aurelia aurita, was nearly absent. Both species were further studied in 2008 and 2009 and it was found that the additional predation pressure by M. leidyi caused the zooplankton stocks to be severely depressed. Here, we report on the population dynamics and predation impact of M. leidyi and A. aurita in Limfjorden in 2010 and 2011. In 2010, M. leidyi was observed in Limfjorden for the first time in August with the highest density and largest size in the central parts (Skive Fjord). The estimated half-life of zooplankton (copepods) was only important in Skive Fjord in mid August 2010 when the joint-predation impact of A. aurita and M. leidyi was 2.3 d. In 2011, no M. leidyi were observed on the first cruise (3 August), while during the second cruise (17 November) it was observed in large numbers. The western most location (Venø Bugt) was dominated by large sized (≤ 60 mm) M. leidyi, while the average size decreased towards the central parts of the fjord-system. The proportion of cydippid larvae increased from west to the central parts thus suggesting rapid reproduction and population-size expansion. The bio-volumes of ctenophores were highest in the central part with 85 ml m-3 in Løgstør Bredning, which may be compared to the greatest mean bio-volume of about 184 ml m-3 observed in the Black Sea in 1989 when the zooplankton and fish stocks collapsed. Analysis of available hydrographic data and model calculations indicates that re-invasion of M. leidyi from the North Sea seeded the autumn population in Limfjorden in mid-September.
Key words: competition; predation impact; zooplankton; hydrography; Pleurobrachia pileus, Beroe cucumis
Introduction
Species translocation and population expansion of invasive species of ctenophores gained large public and scientific attention especially after the introduction of the American comb jelly Mnemiopsis leidyi (A. Agassiz, 1865) in the Black Sea in the 1980’s (Kideys 2002). During the late summer of 2006, Mnemiopsis leidyi was observed along the coast of the Netherlands for the first time (Faasse and Bayha 2006), presumably introduced with ballast water. Soon after, the invasive ctenophore was also observed in neighboring waters such as the North Sea around Helgoland, the Kattegat, Danish Straits and the SW Baltic Sea (Hansson 2006; Javidpour et al. 2006; Boersma et al. 2007; Tendal et al. 2007). In 2007, M. leidyi was observed for the
first time in Limfjorden (Denmark) where it exhibited mass occurrence in late summer while the usually predominant common jellyfish, Aurelia aurita (Linnaeus, 1758), was nearly absent (Riisgård et al. 2007). A follow-up study conducted from autumn 2008 through summer 2009 monitored the invasive ctenophore and the indigenous A. aurita (Riisgård et al. 2012a). By December 2008, both A. aurita and M. leidyi populations had disappeared for the winter. In 2009, the first A. aurita ephyrae appeared in February and the medusae attained their maximum size by the end of June. Low densities of M. leidyi in early July increased to high densities by late August, and the estimated time to clear the central part of Limfjorden of zooplankton by the joint-predation impact of A. aurita and M. leidyi was between 0.5 and 2.9

H.U. Riisgård et al.
146
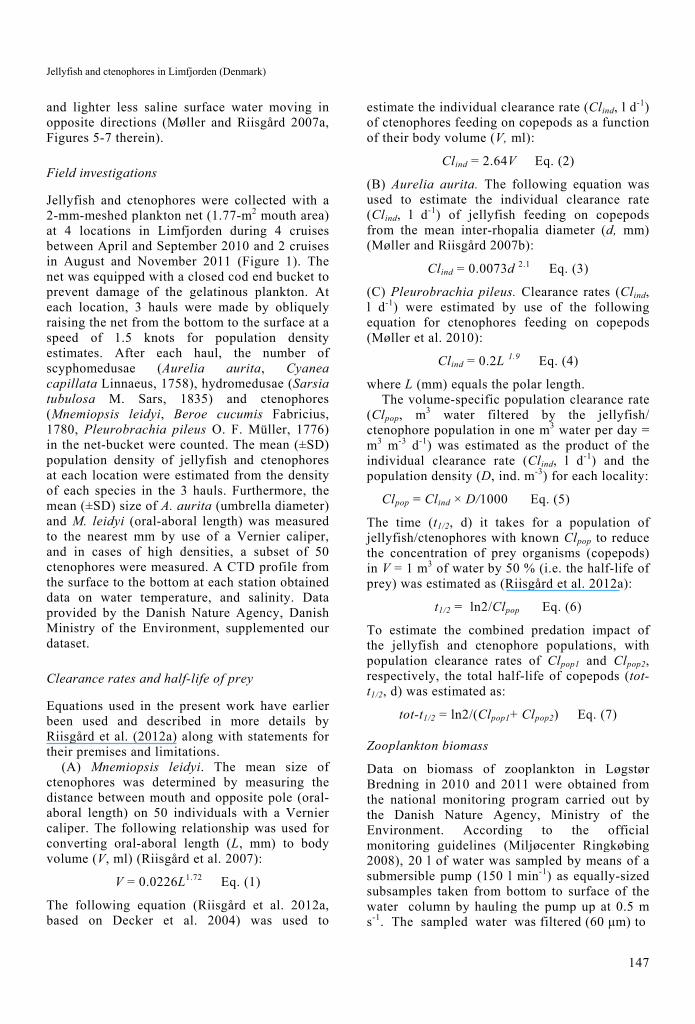
Figure 1. Location of sampling sites in Limfjorden (Denmark) where jellyfish and ctenophores were collected on 6 cruises in the period 13 April 2010 to 17 November 2011. The path of water exchange between the North Sea in the west and Kattegat in the east is indicated by a broken line. A = Nissum Bredning (56°36.05N, 08°24.89E), B = Venø Bugt (56°31.39N, 08°40.46E), C = Løgstør Bredning (56°57.15N, 09°03.46E), D = Skive Fjord (56°37.25N, 09°05.55E). Aa = Aalborg Airport.
d, and during that period zooplankton organisms (apart from ciliates) were virtually absent (Riisgård et al. 2012a).
In the present study the abundances of Mnemiopsis leidyi and Aurelia aurita were followed at 4 locations in Limfjorden during 4 cruises between April and September 2010, and during two cruises undertaken in August and November 2011. We report on the distribution, densities, and estimated zooplankton predation impacts of these gelatinous predators as well as the importance of hydrographic pattern for their population dynamics.
Material and methods
Study area
Limfjorden is a shallow water system that connects the North Sea in the west with the Kattegat in the east (Figure 1). The mean water depth is about 4.5 m, the tidal amplitude is 10 to 20 cm, and vertical mixing is mainly wind driven. Westerly wind causes inflow of North Sea water in the west whereas easterly wind results in inflow of Kattegat water in the east (Blanner 1982; Christiansen et al. 2006; Markager et al. 2006). Between the western and eastern boundaries, there is a permanent
horizontal salinity gradient having a salinity of 32 to 34 psu at the connection to the North Sea in the west and 19 to 25 psu at the connection to the Kattegat in the east. The vertical variations in salinity are generally caused by the interplay of low-density freshwater input from the catchment area and near-bottom inflow of high-density saline water from the North Sea. During summer, a concomitant thermocline further stabilizes the halocline leading to marked stratification, which can only be broken by strong winds (Jørgensen 1980; Møhlenberg 1999; Wiles et al. 2006; Hofmeister et al. 2009). In general, Limfjorden is eutrophic receiving nutrients from the catchment area whereas the western part is less eutrophicated and less stratified than the central-northern part which shows intermediate stratification and eutrophication. In contrast, the central-southern part is strongly stratified and highly eutrophicated which frequently results in oxygen depletion in near-bottom waters (Blanner 1982; Jørgensen 1980; Dolmer et al. 1999; Møhlenberg 1999; Møller and Riisgård 2007a,b; Maar et al. 2010; Riisgård et al. 2012b). Occasionally, persistent, strong westerly winds push high saline North Sea water into the fjord-system, which may cause large variations in the vertical salinity profiles and give rise to density-driven flows of high-density saline bottom water
Jellyfish and ctenophores in Limfjorden (Denmark)
147
and lighter less saline surface water moving in opposite directions (Møller and Riisgård 2007a, Figures 5-7 therein).
Field investigations
Jellyfish and ctenophores were collected with a 2-mm-meshed plankton net (1.77-m2 mouth area) at 4 locations in Limfjorden during 4 cruises between April and September 2010 and 2 cruises in August and November 2011 (Figure 1). The net was equipped with a closed cod end bucket to prevent damage of the gelatinous plankton. At each location, 3 hauls were made by obliquely raising the net from the bottom to the surface at a speed of 1.5 knots for population density estimates. After each haul, the number of scyphomedusae (Aurelia aurita, Cyanea capillata Linnaeus, 1758), hydromedusae (Sarsia tubulosa M. Sars, 1835) and ctenophores (Mnemiopsis leidyi, Beroe cucumis Fabricius, 1780, Pleurobrachia pileus O. F. Müller, 1776) in the net-bucket were counted. The mean (±SD) population density of jellyfish and ctenophores at each location were estimated from the density of each species in the 3 hauls. Furthermore, the mean (±SD) size of A. aurita (umbrella diameter) and M. leidyi (oral-aboral length) was measured to the nearest mm by use of a Vernier caliper, and in cases of high densities, a subset of 50 ctenophores were measured. A CTD profile from the surface to the bottom at each station obtained data on water temperature, and salinity. Data provided by the Danish Nature Agency, Danish Ministry of the Environment, supplemented our dataset.
Clearance rates and half-life of prey
Equations used in the present work have earlier been used and described in more details by Riisgård et al. (2012a) along with statements for their premises and limitations.
(A) Mnemiopsis leidyi. The mean size of ctenophores was determined by measuring the distance between mouth and opposite pole (oral-aboral length) on 50 individuals with a Vernier caliper. The following relationship was used for converting oral-aboral length (L, mm) to body volume (V, ml) (Riisgård et al. 2007):
V = 0.0226L1.72 Eq. (1)
The following equation (Riisgård et al. 2012a, based on Decker et al. 2004) was used to
estimate the individual clearance rate (Clind, l d-1) of ctenophores feeding on copepods as a function of their body volume (V, ml):
Clind = 2.64V Eq. (2)
(B) Aurelia aurita. The following equation was used to estimate the individual clearance rate (Clind, l d-1) of jellyfish feeding on copepods from the mean inter-rhopalia diameter (d, mm) (Møller and Riisgård 2007b):
Clind = 0.0073d 2.1 Eq. (3)
(C) Pleurobrachia pileus. Clearance rates (Clind, l d-1) were estimated by use of the following equation for ctenophores feeding on copepods (Møller et al. 2010):
Clind = 0.2L 1.9 Eq. (4)
where L (mm) equals the polar length. The volume-specific population clearance rate
(Clpop, m3 water filtered by the jellyfish/ ctenophore population in one m3 water per day = m3 m-3 d-1) was estimated as the product of the individual clearance rate (Clind, l d-1) and the population density (D, ind. m-3) for each locality:
Clpop = Clind × D/1000 Eq. (5)
The time (t1/2, d) it takes for a population of jellyfish/ctenophores with known Clpop to reduce the concentration of prey organisms (copepods) in V = 1 m3 of water by 50 % (i.e. the half-life of prey) was estimated as (Riisgård et al. 2012a):
t1/2 = ln2/Clpop Eq. (6)
To estimate the combined predation impact of the jellyfish and ctenophore populations, with population clearance rates of Clpop1 and Clpop2, respectively, the total half-life of copepods (tot-t1/2, d) was estimated as:
tot-t1/2 = ln2/(Clpop1+ Clpop2) Eq. (7)
Zooplankton biomass
Data on biomass of zooplankton in Løgstør Bredning in 2010 and 2011 were obtained from the national monitoring program carried out by the Danish Nature Agency, Ministry of the Environment. According to the official monitoring guidelines (Miljøcenter Ringkøbing 2008), 20 l of water was sampled by means of a submersible pump (150 l min-1) as equally-sized subsamples taken from bottom to surface of the water column by hauling the pump up at 0.5 m s-1. The sampled water was filtered (60 μm) to

H.U. Riisgård et al.
148
Oral-aboral length (mm)
0 10 20 30 40 50 600
5
10
15
20
0 10 20 30 40 50 600.00
0.05
0.10
0.15
0.20
0 10 20 30 40 50 60
Abu
ndan
ce (
ind.
m-3
)
0
10
20
30
40
50
60Location C (Løgstør Bredning)
Location B (Venø Bugt)
Location D (Skive Fjord)
A
B
C
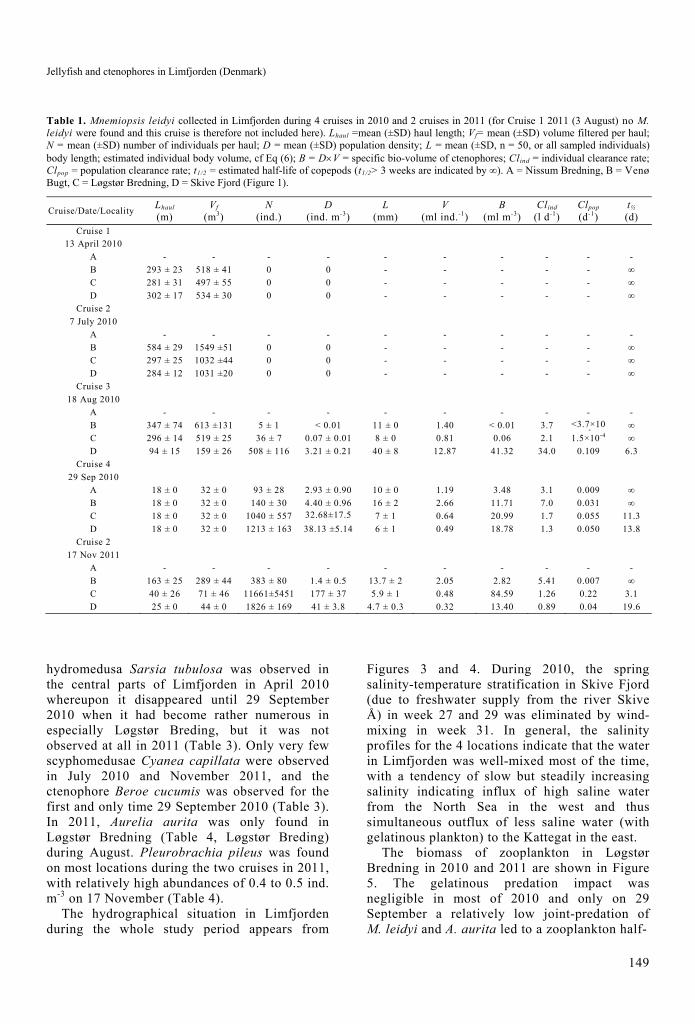
Figure 2. Mnemiopsis leidyi. Oral-aboral length distribution of ctenophores for the 3 studied locations in Limfjorden on 17 November 2011. Average sizes for each mm size category are displayed (± SD for the 3 replicate samples at each location), whereas Location A (Nissum Bredning) was not visited during this cruise.
obtain a representative sample of the zooplankton species composition. Samples were preserved in basic Lugol’s solution and examined in the laboratory by Orbicon A/S in order to estimate the concentration and biomass (µg C l-1) of the different taxonomic groups, divided in this study into: ciliates, copepods, cladocerans, barnacle nauplii, polychaete larvae, and bivalve veligers.
Results
In 2010 Mnemiopsis leidyi was observed in Limfjorden for the first time in mid-August with the highest density and largest size in the southern central part (Skive Fjord, Table 1). In late September, the density of M. leidyi in the central and southern parts (Løgstør Bredning and Skive Fjord) had considerably increased, from 0.07 ± 0.01 to 32.68 ± 17.53 ind. m-3 and from 3.21 ± 0.21 to 38.13 ± 5.14 ind. m-3, respecti-vely, while the mean size of ctenophores in Skive Fjord had decreased nearly seven times, from 40 ± 8 to 6 ± 1 mm. The reduction in average sizes due to a higher proportion of cydippid larvae indicates rapid reproduction during this period. In the same period, the density of Aurelia aurita in Skive Fjord was low, 0.40 ± 0.30 ind. m-3 18 August, decreasing to 0.08 ± 0.08 ind. m-3 29 September (Table 2). In 2010, the half-life of zooplankton (copepods) in Limfjorden was only able to be calculated in Skive Fjord 18 August 2010 when the joint-predation impact by A. aurita and M. leidyi was tot-t1/2 = 2.3 d (Table 2).
In 2011, the situation looked different from the previous year, with no Mnemiopsis leidyi in Limfjorden during August, but very high abundances of up to 177 ± 37 ind. m-3 during November 2011. The highest specific bio-volume of 85 ml m-3 with an estimated half-life of copepods of 3.1 days were recorded in Løgstør Bredning, indicating a rather sudden and pronounced predation impact of the invasive ctenophore in the central northern part of Limfjorden, but not in the western part (Table 1). During late autumn 2011 the western most location (Venø Bugt) showed the largest M. leidyi with an average oral-aboral length of 13.7 ± 2 mm (range 3 to 60 mm) (Table 2, Figure 2), and the average length decreased towards the eastern locations to 5.9 ± 1 (Løgstør Bredning) and 4.7 ± 0.3 mm (Skive Fjord) (Table 1). The proportion of small larvae (≤ 5 mm) increased from 0.13 ± 0.01 to 0.72 ± 0.06 and 0.89 ± 0.04 from the western most area (Venø Bugt) to the northern central (Løgstør Bredning) and southern central (Skive Fjord) parts of Limfjorden, respectively. Due to the use of a 2 mm meshed net, small size classes might have been undersampled.
Other gelatinous plankton species collected in Limfjorden during the 4 cruises in 2010 and 2 cruises in 2011 are shown in Tables 3 and 4. The
Jellyfish and ctenophores in Limfjorden (Denmark)
149
Table 1. Mnemiopsis leidyi collected in Limfjorden during 4 cruises in 2010 and 2 cruises in 2011 (for Cruise 1 2011 (3 August) no M. leidyi were found and this cruise is therefore not included here). Lhaul =mean (±SD) haul length; Vf= mean (±SD) volume filtered per haul; N = mean (±SD) number of individuals per haul; D = mean (±SD) population density; L = mean (±SD, n = 50, or all sampled individuals) body length; estimated individual body volume, cf Eq (6); B = DV = specific bio-volume of ctenophores; Clind = individual clearance rate; Clpop = population clearance rate; t1/2 = estimated half-life of copepods (t1/2> 3 weeks are indicated by ∞). A = Nissum Bredning, B = Venø Bugt, C = Løgstør Bredning, D = Skive Fjord (Figure 1).
Cruise/Date/Locality Lhaul (m)
Vf (m3)
N (ind.)
D (ind. m-3)
L (mm)
V (ml ind.-1)
B (ml m-3)
Clind (l d-1)
Clpop (d-1)
t½ (d)
Cruise 1 13 April 2010
A - - - - - - - - - -
B 293 ± 23 518 ± 41 0 0 - - - - - ∞
C 281 ± 31 497 ± 55 0 0 - - - - - ∞
D 302 ± 17 534 ± 30 0 0 - - - - - ∞
Cruise 2
7 July 2010
A - - - - - - - - - -
B 584 ± 29 1549 ±51 0 0 - - - - - ∞
C 297 ± 25 1032 ±44 0 0 - - - - - ∞
D 284 ± 12 1031 ±20 0 0 - - - - - ∞
Cruise 3
18 Aug 2010
A - - - - - - - - - -
B 347 ± 74 613 ±131 5 ± 1 < 0.01 11 ± 0 1.40 < 0.01 3.7 <3.7×10⁵
∞
C 296 ± 14 519 ± 25 36 ± 7 0.07 ± 0.01 8 ± 0 0.81 0.06 2.1 1.5×10⁻⁴ ∞
D 94 ± 15 159 ± 26 508 ± 116 3.21 ± 0.21 40 ± 8 12.87 41.32 34.0 0.109 6.3
Cruise 4
29 Sep 2010
A 18 ± 0 32 ± 0 93 ± 28 2.93 ± 0.90 10 ± 0 1.19 3.48 3.1 0.009 ∞
B 18 ± 0 32 ± 0 140 ± 30 4.40 ± 0.96 16 ± 2 2.66 11.71 7.0 0.031 ∞
C 18 ± 0 32 ± 0 1040 ± 557 32.68±17.53
7 ± 1 0.64 20.99 1.7 0.055 11.3
D 18 ± 0 32 ± 0 1213 ± 163 38.13 ±5.14 6 ± 1 0.49 18.78 1.3 0.050 13.8
Cruise 2
17 Nov 2011
A - - - - - - - - - -
B 163 ± 25 289 ± 44 383 ± 80 1.4 ± 0.5 13.7 ± 2 2.05 2.82 5.41 0.007 ∞
C 40 ± 26 71 ± 46 11661±5451 177 ± 37 5.9 ± 1 0.48 84.59 1.26 0.22 3.1
D 25 ± 0 44 ± 0 1826 ± 169 41 ± 3.8 4.7 ± 0.3 0.32 13.40 0.89 0.04 19.6
hydromedusa Sarsia tubulosa was observed in the central parts of Limfjorden in April 2010 whereupon it disappeared until 29 September 2010 when it had become rather numerous in especially Løgstør Breding, but it was not observed at all in 2011 (Table 3). Only very few scyphomedusae Cyanea capillata were observed in July 2010 and November 2011, and the ctenophore Beroe cucumis was observed for the first and only time 29 September 2010 (Table 3). In 2011, Aurelia aurita was only found in Løgstør Bredning (Table 4, Løgstør Breding) during August. Pleurobrachia pileus was found on most locations during the two cruises in 2011, with relatively high abundances of 0.4 to 0.5 ind. m-3 on 17 November (Table 4).
The hydrographical situation in Limfjorden during the whole study period appears from
Figures 3 and 4. During 2010, the spring salinity-temperature stratification in Skive Fjord (due to freshwater supply from the river Skive Å) in week 27 and 29 was eliminated by wind-mixing in week 31. In general, the salinity profiles for the 4 locations indicate that the water in Limfjorden was well-mixed most of the time, with a tendency of slow but steadily increasing salinity indicating influx of high saline water from the North Sea in the west and thus simultaneous outflux of less saline water (with gelatinous plankton) to the Kattegat in the east.
The biomass of zooplankton in Løgstør Bredning in 2010 and 2011 are shown in Figure 5. The gelatinous predation impact was negligible in most of 2010 and only on 29 September a relatively low joint-predation of M. leidyi and A. aurita led to a zooplankton half-

H.U. Riisgård et al.
150
Table 2. Aurelia aurita collected during 4 cruises in Limfjorden in 2010. Lhaul =mean (±SD) haul length; Vf = mean (±SD) volume filtered per haul; N = mean (±SD) number of individuals per haul; D = mean (±SD) population density; d = mean (±SD) umbrella diameter; Clind = individual clearance rate; Clpop = population clearance rate; t1/2 = estimated half-life of copepods (t1/2> 3 weeks are indicated by ∞). Estimated joint-predation impact by A. aurita and Mnemiopsis leidyi has been expressed as total half-life of copepods = tot-t1/2. A = Nissum Bredning, B = Venø Bugt, C = Løgstør Bredning, D = Skive Fjord (Figure 1).
Cruise/Date/Locality Lhaul
(m)
Vf
(m3)
N
(ind.)
D
(ind. m-3)
L
(mm)
Clind
(l d-1)
Clpop
(d-1)
t½
(d)
tot-t½
(d)
Cruise 1 13 April 2010
A - - - - - - - - -
B 293 ± 23 518 ± 41 259 ± 33 0.46 ± 0.10 8 ± 1 0.6 2.6×10⁻⁴ ∞ ∞
C 281 ± 31 497 ± 55 1043 ± 306 2.13 ± 0.67 7 ± 1 0.4 0.001 ∞ ∞
D 302 ± 17 534 ± 30 1815 ± 349 3.37 ± 1.45 7 ± 0 0.4 0.001 ∞ ∞
Cruise 2
7 July 2010
A - - - - - - -
B 584 ± 29 1549 ± 51 1 ± 0 <0.01 268 ± 93 917.1 < 0.009 ∞ ∞
C 297 ± 25 1032 ± 44 9 ± 14 0.01 ± 0.00 271 ± 35 938.8 0.009 ∞ ∞
D 284 ± 12 1031 ± 20 27 ± 17 0.02 ± 0.01 274 ± 59 960.7 0.019 ∞ ∞
Cruise 3
18 Aug 2010
A - - - - - - -
B 347 ± 74 613 ± 131 4 ± 3 0.01 ± 0.01 183 ± 36 411.6 0.004 ∞ ∞
C 296 ± 14 519 ± 25 5 ± 2 0.01 ± 0.01 177 ± 36 383.8 0.004 ∞ ∞
D 94 ± 15 159 ± 26 97 ± 34 0.40 ± 0.30 196 ± 31 475.4 0.190 3.5 2.3
Cruise 4
29 Sep 2010
A 18 ± 0 32 ± 0 0.3 ± 0.6 0.01 ± 0.02 140 ± 0 234.5 0.002 ∞ ∞
B 18 ± 0 32 ± 0 0.6 ± 0.6 0.02 ±.0.02 155 ± 42 290.4 0.006 ∞ ∞
C 18 ± 0 32 ± 0 1.3 ± 1.5 0.04 ±.0.05 194 ± 114 465.3 0.019 ∞ 11.3
D 18 ± 0 32 ± 0 2.6 ± 2.5 0.08 ±.0.08 123 ± 11 178.7 0.014 ∞ 13.8
Table 3. Other species collected during 4 cruises in Limfjorden in 2010. Lhaul = mean (±SD) haul length; Vf = mean (±SD) volume filtered per haul; N = total number of individuals caugh per station; D = mean (±SD) population density. A = Nissum Bredning, B = Venø Bugt, C = Løgstør Bredning, D = Skive Fjord (Figure 1).
Cruise/Date/ Locality
Lhaul (m)
Vf (m3)
Sarsia tubulosa Cyanea capillata* Beroe cucumis** N (ind.) D (ind. m-3) N (ind.) D (ind. m-3) N (ind.) D (ind. m-3)
Cruise 1 13 April 2010
A - - - - - - - -
B 293 ± 23 518 ± 41 2187 ± 2164 4.22 ± 4.18 0 0 0 0
C 281 ± 31 497 ± 55 1927 ± 302 3.88 ± 0.61 0 0 0 0
D 302 ± 17 534 ± 30 430 ± 238 0.81 ± 0.44 0 0 0 0
Cruise 2
7 July 2010
A - - - - - - - -
B 584 ± 29 1549 ± 51 0 0 1.0 ± 0.6 0.0010 ± 0.0017 0 0
C 297 ± 25 1032 ± 44 0 0 2.0 ± 0.6 0.0005 ± 1.1547 0 0
D 284 ± 12 1031 ± 20 0 0 0 0 0 0
Cruise 3
18 Aug 2010
A - - - - - - - -
B 347 ± 74 613 ± 131 0 0 0 0 0 0
C 296 ± 14 519 ± 25 0 0 0 0 0 0
D 94 ± 15 159 ± 26 0 0 0 0 0 0
Cruise 4
29 Sep 2010
A 18 ± 0 32 ± 0 6.0 ± 1.0 0.06 ± 0.03 0 0 1.0 ± 0.6 0.01 ± 0.01
B 18 ± 0 32 ± 0 1.0 ± 0.6 0.01 ± 0.01 0 0 3.0 ± 1.0 0.03 ± 0.03
C 18 ± 0 32 ± 0 1464.0 ± 448.0 15.34 ± 14.10 0 0 8.0 ± 4.0 0.08 ± 0.14
D 18 ± 0 32 ± 0 0 0 0 0 0 0
*umbrella diameter about 30 cm; ** body length 3 to 4 cm

Jellyfish and ctenophores in Limfjorden (Denmark)
151
Figure 3. Salinity and temperature profiles at the 4 studied locations (A, B, C, D) in Limfjorden (Figure 1), on 13 April (Week 15), 7 July (Week 27), Weeks 29 & 31 (no collection of jellyfish),18 August (Week 33), and 29 September (Week 39) 2010.

H.U. Riisgård et al.
152
Table 4. Ctenophores and jellyfish collected during 2 cruises in Limfjorden in 2011. Lhaul = mean (±SD) haul length; Vf = mean (±SD) volume filtered per haul; N = total number of individuals caugh per station; D = mean (±SD) population density, d = diameter. A = Nissum Bredning, B = Venø Bugt, C = Løgstør Bredning, D = Skive Fjord (Figure 1).
life impact of 11.3 d (Table 2). Only two cruises were made in 2011, on 3 August when no Mnemiopsis leidyi and only few Aurelia aurita were found (Table 1 and 4), and on 17 November when no A. aurita but a high number (177 ± 37 ind. m-3) of small (5.9± 1 mm) M. leidyi with an estimated predation impact of t1/2 = 3.1 d (Table 1) were found. In 2010, the biomass and composition of zooplankton was low and influenced by gelationous predation in 2010. Due to the lack of cruises before 3 August 2011 a comparison of possible gelatinous predation impact on the zooplankton biomass in Løgstør Bredning during spring and summer in the two years can not be made.
Discussion
Abundance and predation impact of gelatinous zooplankton
Compared to the preceding years 2007 to 2009, some striking differences in abundance of both, the invasive Mnemiopsis leidyi and the indigenous Aurelia aurita can be seen in 2010 and 2011. Thus in 2009, the A. aurita medusae attained their maximum density (14.8 ± 0.8 ind. m-3) and maximum size in Limfjorden (Skive Fjord) by the end of June (umbrella diameter = 92 ± 16 mm), when the estimated half-life of zooplankton was very short, only 0.5 d (Riisgård et al. 2012a, Table 2 therein). In 2010, the maximum medusae density and umbrella diameter of A. aurita was again observed in
Skive Fjord, but the population density was lower, while the mean umbrella diameter was lager. In comparison, the largest umbrella diameter was observed during July 2010 with 274 ± 59 mm. The maximum estimated joint-predation impact by A. aurita and M. leidyi in Skive Fjord was tot-t1/2 = 0.5 d in June 2009 (Riisgård et al. 2012a, Table 2 therein) whereas in 2010 the impact was negligible in June and July 2010, but increased to tot-t1/2= 2.3 d on 18 August (Table 2). Thus, the larger sized A. aurita in 2010 may be explained by a less pronounced predation impact compared to 2009 resulting in more zooplankton food for the relatively few jellyfish that occurred in Skive Fjord.
It is unknown if Mnemiopsis leidyi can survive the winter in Limfjorden, but from its native habitat investigations show that M. leidyi can overwinter in shallow, over frozen embayment’s e.g. Greenwich Cove, with temperatures < 1˚C throughout the water column (Costello et al. 2006). Further, M. leidyi has been observed to accumulate in dense layers above the seafloor which makes it difficult to assess their abundances from conventional net towings (Costello and Mianzan 2003). So far, the population dynamics of M. leidyi during winter in Limfjorden are unknown and the population may depend on seasonal recruitment from the North Sea as recently discussed by Riisgård et al. (2012a). Faasse and Bayha (2006) suggested that the southern North Sea may serve as a "reservoir" of M. leidyi acting as a yearly source of new ctenophores to colder waters, such as
Cruise/Date/
Locality
Lhaul
(m)
Vf
(m3)
Pleurobrachia pileus Aurelia aurita
N
(ind.)
D
(ind. m-3)
d
(mm)
Clind
(l d-1)
Clpop
(d-1)
t½
(d)
N
(ind.)
D
(ind. m-3)
d
(mm)
Clind
(l d-1)
Clpop
(d-1)
t½
(d)
Cruise 1
3 August 2011
A 86 ± 7 152 ± 13 41 ± 11 0.27 ± 0.05 9 ± 2 13 0.004 ∞ 0 0 0 0 0 -
B 95 ± 4 168 ± 6 11 ± 5 0.07 ± 0.03 7 ± 2 8 0.001 ∞ 0 0 0 0 0 -
C 213 ± 11 376 ± 19 0 0
0 - - -
22 ± 2 0.06 ± 0.01 121 ±
27 173 0.01 ∞
D 267 ± 58 472 ± 102 0 0 0 - - - 0 0 0 0 0 -
Cruise 2
17 Nov 2011
A - - - - - - - - - - - - -
B 163 ± 25 289 ± 44 145 ± 30 0.5 ± 0.2 10 ± 1.7 15.8 0.008 ∞ 0 0 0 0 0 -
C 40 ± 26 71 ± 46 22 ± 6.3 0.4 ± 0.3 8.4 ± 2.2 11.5 0.005 ∞ 0 0 0 0 0 -
D 25 ± 0 44 ± 0 18 ± 3.5 0.4 ± 0.1 8.3 ± 0.9 11 0.004 ∞ 0 0 0 0 0 -
Jellyfish and ctenophores in Limfjorden (Denmark)
153
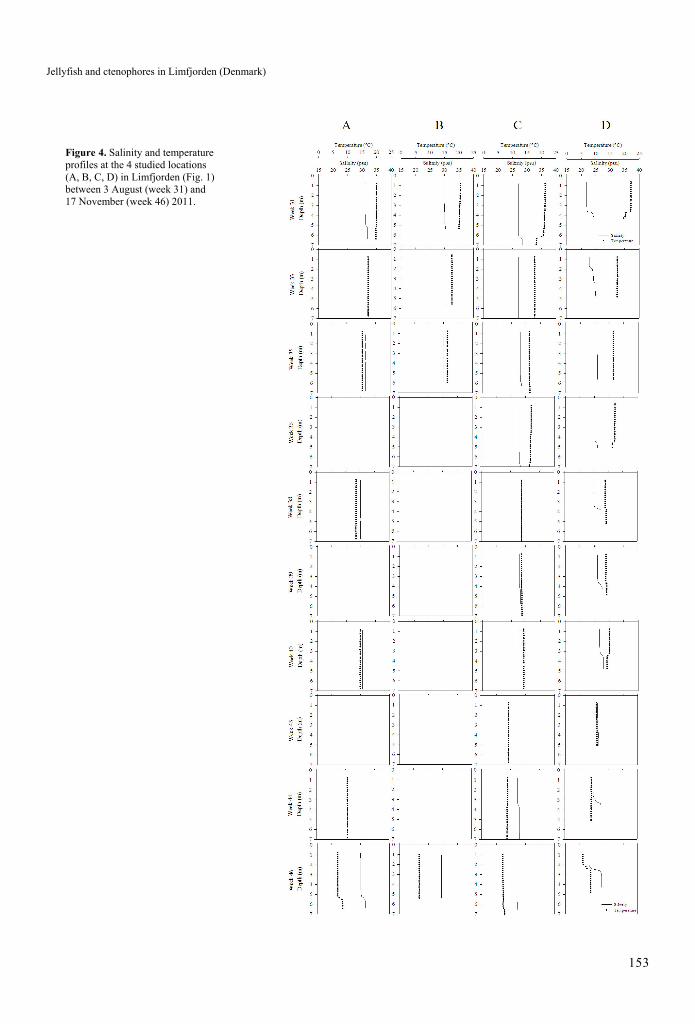
Figure 4. Salinity and temperature profiles at the 4 studied locations (A, B, C, D) in Limfjorden (Fig. 1) between 3 August (week 31) and 17 November (week 46) 2011.

H.U. Riisgård et al.
154
0
50
100
150
200
250
300
350
400
J F M A M J J A S O N D
Bio
mas
s (µ
g C
l-1)
ciliates
copepods (adult)
cladocerans
barnacle nauplii
polychaete larvae
bivalve veligers
2010
0
50
100
150
200
250
300
350
400
J F M A M J J A S O N D
Bio
mas
s (µ
g C
l-1)
ciliates
copepods (adult)
cladocerans
barnacle nauplii
polychaete larvae
bivalve veligers
2011
Figure 5. Biomass of zooplankton in Løgstør Bredning (Figure 1, Location C) in 2010 and 2011.
Limfjorden, and observation of adult individuals in the coldest winter months imply that the species can survive winters along the Belgian coastline (Ginderdeuren et al. 2012). High salinity promotes the egg reproduction of M. leidyi as observed both in the field and in laboratory experiments (Jaspers et al. 2011), and the combination of warmer winter temperatures and higher salinities in the south eastern North Sea may favor the survival of M. leidyi in this area compared to other areas i.e. Limfjorden. Infrequently occurring inflow events of North Sea water may thus serve as mechanism for re-introduction of the ctenophore into the shallow and well protected Limfjorden.
The ctenophore Beroe cucumis, which preys on other ctenophores such as Mnemiopsis leidyi, was only observed once in the central parts of Limfjorden (but not Skive Fjord, see Table 3) during late September 2010. This species is frequently observed in higher saline Danish waters such as the Kattegat and Danish Straits,
where it preys on lobate and cydippid ctenophores (Tendal et al. 2007; H.U. Riisgård own observation).
In 2011, two cruise were carried out in Limfjorden. In contrast to earlier years, no Mnemiopsis leidyi were observed in any of the 4 localities in Limfjorden during the late summer cruise (3 August), while very high abundances were reached during late autumn (17 November). During the summer cruise only small (121 ± 27 mm) Aurelia aurita were found in low densities in Løgstør Bredning, and no jellyfish were found in Skive Fjord, while during the autumn cruise large numbers of M. leidyi and Pleurobrachia pileus were observed at all visited locations. A. aurita were not found during the late autumn cruise, which may be expected as this jellyfish has a one year life cycle and disappears from the water column after spawning in early autumn (e.g. Hansson et al. 2005). The size distribution of M. leidyi showed that large animals were present in the western part while the average size drastically decreased towards the central parts of Limfjorden with an increased proportion of larvae and transitional animals indicating that active reproduction had recently been taking place (Figure 2). The predominance of small size classes in the central parts (Løgstør Bredning and Skive Fjord) indicates that the M. leidyi population in Limfjorden was either reproducing during autumn 2011 at relatively low water temperatures of 6.8 to 8.8˚C, or the ctenophores were reproducing during September and early October, and the small ctenophores sampled in November were the result of the earlier egg production combined with slow growth (the result of either low temperature or low food concentration or a combination of both). Reproduction has been documented for M. leidyi in the Kattegat and the central Baltic Sea in October 2009 at water temperatures around 12.5˚C (Jaspers et al. 2011) although its reproduction is usually regarded to be limited by low temperatures and to cease < 10˚C (Costello et al. 2006). However, the CTD profiles (Figure 4) indicate that the high saline North Sea water was previously warmer (Location D; bottom water 9˚C) but subsequently been totally mixed and cooled down at the western and northern central part of Limfjorden (Venø Bugten and Løgstør Bredning). It is notable that 72 to 89% of the population in the central parts consists of small (< 5 mm) individuals, indicating active reproduction, probably associated to the warmer

Jellyfish and ctenophores in Limfjorden (Denmark)
155
North Sea water, leading to a high population density of up to 177 ind. m-3 and subsequent pronounced predation impact (t1/2 = 3.1 d, Table 1). Even though Pleurobrachia pileus were abundant during autumn 2011 with up to 0.5 ind. m-3, their clarance rates were low (Table 4) and they did not constitute a significant grazing impact on the zooplankton community.
First appearance of Mnemiopsis leidyi in 2011
Strong westerly winds occasionally push large volumes of high-salinity North Sea water into Limfjorden through the Thyborøn Kanal (Figure 1), and such intrusions may radically change the hydrographic situation and thereby strongly influence the distribution and abundance of jellyfish and ctenophores in the fjord-system (Møller and Riisgård 2007b; Riisgård et al. 2012a,b). The infrequent intrusions of high saline seawater may cause large variations in the vertical salinity profiles in Limfjorden where the typical vertical variations in salinity are generally caused by the interplay between input of lighter freshwater from the catchment area and near-bottom inflow of high-density saline water from the North Sea (e.g. Møller and Riisgård 2007b, Figure 3 therein). Dramatic changes in the vertical salinity profiles and subsequent density-driven water exchange coincided with the disappearance of Aurelia aurita in early spring in both, 2004 and 2005 (Møller and Riisgård 2007b). Thus in 2007, the water exchange probably led to the expulsion of A. aurita medusae into the Kattegat together with the low-salinity water outflow and subsequent importation of Mnemiopsis leidyi with the high-salinity water from the North Sea (Riisgård 2007, Riisgård et al. 2012a,b). The same mechanism may explain the sudden appearance of M. leidyi in Limfjorden in 2011. Although only two cruises were carried out in 2011, namely on 3 August (when M. leidyi was absent) and on 17 November (when M. leidyi was numerous), respectively (Table 1), it is possible to narrow down the date of its first arrival in Limfjorden from additional observations. Similar to our observations from the first cruise conducted in August 2011, underwater environ-mental monitoring of the benthic vegetation was conducted by Svend Åge Bendtsen (Danish Nature Agency) who did not observe any M. leidyi during the extensive scuba diving investigation in Limfjorden between 8 and 25 August 2011. Later, on 20 September 2011, Erik
Hoffmann (National Institute of Aquatic Resources, Technical University of Denmark) informed us that he had observed large numbers of M. leidyi along with an unusually high number of the big (> 30 cm bell diameter) scyphozoan Rhizostoma octopus (L.) during a fisheries monitoring survey in the northern central part of Limfjorden (Løgstør Bredning). The latter jellyfish is common in the North Sea, and during autumn it is often observed in the western part of Limfjorden, brought in through the Thyborøn Kanal along with high-saline water pushed in by strong westerly winds. In this way, it may be suggested that M. leidyi was brought into Limfjorden from the North Sea between 25 of August and 20 September, when it was observed for the first time in Limfjorden in 2011. The hypothesis of M. leidyi being sourced from high saline North Sea waters is further substantiated in the next section.
Wind-induced intrusion of North Sea water and modeling
Prevailing westerlies blow from west to east in the temperate zone of the northern hemisphere. Thus, recurrent passage of low pressure from the North Sea across Denmark cause westerly winds to be dominating (Møller 1996), and this phenomenon controls the water exchange in Limfjorden. Here, the water exchange is mainly caused by 50 to 70 incidents per year where strong westerly-winds induce intrusions of North Sea water through Thyborøn Kanal into Limfjorden and subsequent backflow of water from Limfjorden into the North Sea during more calm weather situations (Figures 6 and 7). On a yearly basis, about 70 km3 of North Sea water enter into Limfjorden via Thyborøn Kanal, and approximately 65% of this water flows eastwards into the central parts (i.e. Løgstør Bredning). This central part additionally receives about 3 km3 freshwater every year (Rasmussen et al. 1999). Surplus water is discharged from Løgstør Bredning primarily via Sallingsund through Thyborøn Kanal to the North Sea. However, on a yearly basis about 8.7 km3 runs eastwards through Aggersund (Figure 1) to the Kattegat (Rasmussen et al. 1999).
Inflowing water to Limfjorden usually comes from the Jutland Coastal Current which flows northwards along the Danish west coast carrying mixed water masses from the English Channel and the southern North Sea (Richardson and Jacobsen 1990; Aure et al. 1998; Gyllencreutz et

H.U. Riisgård et al.
156
Figure 6. Daily water-exchange rates through Thyborøn Kanal and Aggersund during 2011. Months are indicated by dashed line. Easterly currents are indicated with positive values on the y-axis.
Figure 7. Daily water-exchange rates through Thyborøn Kanal during the period 1 August to 16 November 2011. Incidents of 3 intrusions of water from the North Sea between the end of August to the middle of September 2011 are indicated (number 1 to 3). Easterly currents are indicated with positive values on the y-axis.
al. 2006). In case of particularly strong wester-lies, the flow speed and the discharge of the Jutland Coastal Current increase, which means that water originating from the central North Sea will flow into Limfjorden through Thyborøn Kanal. The water exchange at Agger-sund can be calculated using a hydrodynamic channel model with water-level boundaries at Løgstør and Aalborg, and wind-data input from Aalborg Airport. By using a box model the water exchange through Thybrøn Kanal can be calculated on a daily basis (Rasmussen et al.
1999). Gross- and net-water exchange at the boundaries at Limfjorden and Løgstør Bredning can also be calculated with a channel model (Mike11, DHI software) covering the entire Limfjorden and supplied with water level data from Thyborøn (North Sea side of Limfjorden) and Hals (Kattegat side of Limfjorden), and wind data from Thyborøn and Aalborg Airport (Figure 1). The following outlines the situation in 2011 on the basis of the above mentioned calculations performed by Svend Åge Bendtsen, Danish Nature Agency, Ministry of the Environment.

Jellyfish and ctenophores in Limfjorden (Denmark)
157
Figure 6 shows the daily net flow through Thyborøn Kanal and Aggersund in 2011. In- and outflow through Thyborøn Kanal took place as in typical years, and likewise the eastward net flow through Aggersund to Kattegat was typical. Corresponding to the modeling for previous years, calculations on water exchange through Aggersund and Thyborøn Kanal were made for 2011. Figure 7 shows the water exchange via Thyborøn Kanal in the period from 1 August to 16 November 2011. It is seen that from late August to mid-September three powerful inflow situations took place (Figure 7), and it is calculated that 3.2 km³ of water came into Limfjorden. Assuming that 65% of this water later entered Løgstør Bredning, this means that 2.1 km3 North Sea water was pressed into this shallow area. Profile measurements (Figure 4, column C) from Løgstør Bredning from 3 to 16 August (weeks 31 and 32) show a salinity of about 27.1 psu. As the effect of the first of the above mentioned three inflow events (Figure 7), the salinity measured on 31 August (week 35) was approximately 28 psu in the surface layer and 28.6 psu at the sea floor. On 4 September (week 36) the salinity had decreased to 27.7 psu, but after the three intrusions of North Sea water (Figure 7) the salinity measured on 20 September (week 38) had increased to 28.8 psu in a fully mixed water column, and at that time Mnemiopsis leidyi was observed for the first time in Løgstør Bredning. Simultaneous measure-ments of the salinity profile in Skive Fjord (Figure 4, column D) show that water from Løgstør Bredning lies as a 2 m thick lower layer of almost 28 psu.
The hydrographic observations and model calculations support our hypothesis that Mnemiopsis leidyi was brought into Limfjorden during mid-September via Jutland Coastal Current water from the North Sea, carrying water masses from the English Channel and the southern North Sea where M. leidyi can be numerous (Faasse and Bayha 2006; Boersma et al. 2007; Ginderdeuren et al. 2012). This suggestion underlines along with previous studies (Riisgård et al. 2012a,b) that the abundance of both the newly invaded ctenophore M. leidyi and the indigenous jellyfish in Limfjorden are characterized by large inter-annual population-size fluctuations strongly influenced by the water exchange and hydrographic situation in the North Sea area. In the case of the invasive M. leidyi, special
hydrographic situations lead to a potential re-invasion of animals from higher saline, warmer offshore waters off the North Sea into Limfjorden. Thus in cold winters, the North Sea may serve as a refuge for M. lediyi in northern European waters and enter with Jutland Coastal Water via Thyborøn Kanal into Limfjorden which may function as an incubator for M. lediyi with the potential to further seed M. leidyi into the Kattegat and adjacent Danish waters.
Zooplankton biomass and predation impact
The data on zooplankton biomass recorded in Løgstør Bredning in 2010 and 2011 (Figure 5) may to some extent be interpreted on basis of the estimated half-live of zooplankton (copepods) although the data on jellyfish and ctenophores are sparse, especially for 2011. In 2010 the joint-predation impact of Aurelia aurita and Mnemiopsis leidyi was only noticeable in Skive Fjord in mid August when the estimated half-live of zooplankton was 2.3 d (Table 2). In 2011 only few A. aurita and no M. leidyi were observed on the first cruise (3 August), but according to the hydrographic observations and the above model calculations M. leidyi was brought into Limfjorden in mid-September to quickly bloom, and on the second cruise (17 November) the re-invaded ctenophore was quantified and the half-life estimated to be 3.1 d in Løgstør Bredning (Table 1). In agreement with this, the zooplankton biomass in Løgstør Bredning became low, dominated by ciliates in mid-September 2011 and during the remainder of the year. Thus, the zooplankton biomass varies with the occurrence and inter-annual variability of the new ctenophore and the native jellyfish.
Postscript
The first observation of Mnemiopsis leidyi in Danish waters in 2011 was made in Limfjorden 20 September. Later, in the period 15 December 2011 to 15 January 2012, M. leidyi was also observed in the Great Belt at the inlet to Kerteminde Fjord where it occurred together with the native ctenophores Bolinopsis infundibulum, Beroe cucumis, and Pleurobrachia pileus (H.U. Riisgård, own observation). In the same period M. leidyi was also observed in Øresund (C. Jaspers, own observation), but in the Skagerrak (Gullmar Fjord) only a few large individuals were observed during autumn/winter 2011/2012 despite intensive monitoring, and

H.U. Riisgård et al.
158
during a one week cruise in mid-October in Kattegat/Skagerrak no M. leidyi were found (Lene Friis Møller, personal communication). These observations are in agreement with the hypothesis that the North Sea in cold winters serves as a refuge from where M. leidyi re-invades Limfjorden which function as an incubator for the new ctenophore which subsequently disperses into the Kattegat and other inner Danish waters.
Acknowledgements
Thanks are due to the Danish Nature Agency, Ministry of the Environment, for excellent co-operation, especially with Gert Pedersen and Bent Jensen aboard 'Limgrim', and Svend Åge Bendtsen for providing hydrographical data and model calculations. Further, thanks are due to Birthe F. Larsen, and Susan G. G. Petersen for technical assistance during the cruises, and to Dr. Carsten Jürgensen, several anonymous reviewers and Dr. Patricia Kremer who declined anonymity, for constructive comments on the manuscript. The study was supported by a grant from FNU, the Danish Agency for Science Technology and Innovation (H.U. Riisgård, Grant No. 09-073291).
References
Aure J, Danielsen D, Svendsen E (1998) The origin of Skagerrak coastal water off Arendal in relation to variations in nutrient concentrations. ICES Journal of Marine Sciences 55: 610-619, http://dx.doi.org/10.1006/jmsc.1998.0395
Boersma M, Malzahn AM, Greve W, Javidpour J (2007) The first occurrence of the ctenophore Mnemiopsis leidyi in the North Sea. Helgoland Marine Research 61: 153-155, http://dx.doi.org/10.1007/s10152-006-0055-2
Blanner P (1982) Composition and seasonal variation of the zooplankton in the Limfjord (Denmark) during 1973-1974. Ophelia 21: 1-40, http://dx.doi.org/10.1080/00785236.1982. 10426574
Christiansen T, Christensen TJ, Markager S, Petersen JK, Mouritsen LT (2006) Limfjorden i 100 år. Klima, hydrografi, næringsstoftilførsel, bundfauna og fisk i Limfjorden fra 1897 til 2003. Danmarks Miljøundersøgelser. Faglig rapport fra DMU, nr. 578 (in Danish with English summary; http://faglige-rapporter.dmu.dk )
Costello JH, Sullivan BK, Gifford DJ, Van Keuren D, Sullivan LJ (2006) Seasonal refugia, shoreward thermal amplification, and metapopulation dynamics of the ctenophore Mnemiopsis leidyi in Narragansett Bay, Rhode Island. Limnology and Oceanography 51: 1819-1831, http://dx.doi.org/10.4319/lo. 2006.51.4.1819
Costello JH, Mianzan HW (2003) Sampling field distributions of Mnemiopsis leidyi (Ctenophora, Lobata): planktonic or benthic methods? Journal of Plankton Research 25: 455-459, http://dx.doi.org/10.1093/plankt/25.4.455
Decker MB, Breitburg DL, Purcell JE (2004) Effects of low dissolved oxygen on zooplankton predation by the ctenophore, Mnemiopsis leidyi. Marine Ecology Progress Series 280: 163-172, http://dx.doi.org/10.3354/meps280163
Dolmer P, Kristensen PS, Hoffmann E (1999) Dredging of blue mussels (Mytilus edulis L.) in a Danish sound: stock sizes and fishery-effects on mussel population dynamic. Fisheries Research 40: 73-80, http://dx.doi.org/10.1016/S0165-7836 (98)00218-5
Faasse MA, Bayha KM (2006) The ctenophore Mnemiopsis leidyi A. Agassiz 1865 in coastal waters of the Netherlands: an unrecognized invasion? Aquatic Invasions 1: 270-277, http://dx.doi.org/10.3391/ai.2006.1.4.9
Ginderdeuren KV, Hostens K, Hoffman S, Vansteenbrugge L, Soenen K, Blauwe HD, Robbens J, Vincx M (2012) Distribution of the invasive ctenophore Mnemiopsis leidyi in the Belgian part of the North Sea. Aquatic Invasions 7: 163-169, http://dx.doi.org/10.3391/ai.2012.7.2.002
Gyllencreutz R, Backman J, Jakobsson M, Kissel C, Arnold E (2006) Postglacial palaeoceanography in the Skagerrak. The Holocene 16: 973-983, http://dx.doi.org/10.1177/0959683606h l988rp
Hansson HG (2006) Ctenophores of the Baltic and adjacent Seas – the invader Mnemiopsis is here! Aquatic Invasions 1: 295-298, http://dx.doi.org/10.3391/ai.2006.1.4.16
Hansson LJ, Moeslund O, Kiørboe T, Riisgård HU (2005) Clearance rates of jellyfish and their potential predation impact on zooplankton and fish larvae in a neritic ecosystem (Limfjorden, Denmark). Marine Ecology Progress Series 304: 117-131, http://dx.doi.org/10.3354/meps304117
Hofmeister R, Buchard H, Bolding K (2009) A three-dimensional model study on processes of stratification and de-stratification in the Limfjord. Continental Shelf Research 29: 1515-1524, http://dx.doi.org/10.1016/j.csr.2009.04.004
Jaspers C, Møller LF, Kiørboe T (2011) Salinity gradient of the Baltic Sea limits the reproduction and population expansion of the newly invaded comb jelly Mnemiopsis leidyi. Plos One 6(8): e24065, http://dx.doi.org/10.1371/journal.pone. 0024065
Javidpour J, Sommer U, Shiganova T (2006) First record of Mnemiopsis leidyi A. Agassiz 1865 in the Baltic Sea. Aquatic Invasions 1: 299-302, http://dx.doi.org/10.3391/ai. 2006.1.4.17
Jørgensen BB (1980) Seasonal oxygen depletion in the bottom waters of a Danish fjord and its effect on the benthic community. Oikos 34: 68-76, http://dx.doi.org/10.2307/354 4551
Kideys AE (2002) Fall and rise of the Black Sea ecosystem. Science 297: 1482-1484, http://dx.doi.org/10.1126/science. 1073002
Maar M, Timmermann K, Petersen JK, Gustafsson KE, Storm LM (2010) A model study of the regulation of blue mussels by nutrient loadings and water column stability in a shallow estuary, the Limfjorden. Journal of Sea Research 64: 322-333, http://dx.doi.org/10.1016/j.seares.2010.04.007
Markager S, Storm LM, Stedmon CA (2006) Limfjordens miljøtilstand 1985 til 2003. Sammenhæng mellem næringsstoftilførsler, klima og hydrografi belyst ved hjælp af empiriske modeller. Danmarks Miljøundersøgelser. Faglig rapport fra DMU, nr. 577 (in Danish with English summary; http://faglige-rapporter.dmu.dk )
Miljøcenter Ringkøbing (2008) Plankton i Limfjorden - 2008. Environment Centre Ringkøbing, Danish Ministry of the Environment, Ringkøbing, Denmark (Report in Danish)
Møhlenberg F (1999) Effect of meteorology and nutrient load on oxygen depletion in a Danish micro-tidal estuary. Aquatic Ecology 33: 55-64, http://dx.doi.org/10.1023/A:10099562 10537
Møller JS (1996) Water masses, stratification and circulation. Coastal and Estuarine Studies 52: 51-66, http://dx.doi.org/10. 1029/CE052p0051
Møller LF, Riisgård HU (2007a) Impact of jellyfish and mussels on algal blooms caused by seasonal oxygen depletion and nutrient release from the sediment in a Danish fjord. Journal of Experimental Marine Biology and Ecology 351: 92-105, http://dx.doi.org/10.1016/j.jembe.2007.06.026

Jellyfish and ctenophores in Limfjorden (Denmark)
159
Møller LF, Riisgård HU (2007b) Population dynamics, growth and predation impact of the common jellyfish Aurelia aurita and two hydromedusae, Sarsia tubulosa and Aequorea vitrina in Limfjorden (Denmark). Marine Ecology Progress Series 346: 153-165, http://dx.doi.org/10.3354/meps06960
Møller LF, Canon JM, Tiselius P (2010) Bioenergetics and growth in the ctenophore Pleurobrachia pileus. Hydro-biologia 645: 167-178, http://dx.doi.org/10.1007/s10750-010-0219-6
Rasmussen L et al. (1999) Vandmiljø i Limfjorden 1998, Ringkøbing, Viborg og Nordjyllands Amt, maj 1999 (report in Danish)
Richardson K, Jacobsen T (1990) Jyllandsstrømmen. En transportmekanisme fra tyske bugt til Kattegat. NPO-forskning fra Miljøstyreslsen nr. C6 1990 (report in Danish)
Riisgård HU, Bøttiger L, Madsen CV, Purcell JE (2007) Invasive ctenophore Mnemiopsis leidyi in Limfjorden (Denmark) in late summer 2007 - assessment of abundance and predation effects. Aquatic Invasions 2: 395-401, http://dx.doi.org/10. 3391/ai.2007.2.4.8
Riisgård HU, Madsen CV, Barth-Jensen C, Purcell JE (2012a) Population dynamics and zooplankton-predation impact of the indigenous scyphozoan Aurelia aurita and the invasive ctenophore Mnemiopsis leidyi in Limfjorden (Denmark). Aquatic Invasions 7: 147-162, http://dx.doi.org/10.3391/ai. 2012.7.2.001
Riisgård HU, Andersen P, Hoffmann E (2012b) From fish to jellyfish in the eutrophicated Limfjorden (Denmark). Estuaries and Coasts 35: 701-713, http://dx.doi.org/10. 1007/s12237-012-9480-4
Tendal O, Jensen KR, Riisgård HU (2007) Invasive ctenophore Mnemiopsis leidyi widely distributed in Danish waters. Aquatic Invasions 2: 455-460, http://dx.doi.org/10.3391/ai. 2007.2.4.19
Wiles P, van Duren LA, Häse C, Larsen J, Simpson JH (2006) Stratification and mixing in the Limfjorden in relation to mussel culture. Journal of Marine Systems 60: 129-143, http://dx.doi.org/10.1016/j.jmarsys.2005.09.009
Copyright © 2022 FDOKUMEN