nse to a rec - California Bankers Association
188
In respo Protectio resource resident illustrati Overall, originati non‐ban the appr originati periodic loan orig regulato and mor We hope will cons Californi 2015 Ann Resident The July banks in lenders “ 365,045 by licens http://w ort%20R Office of OCC Mor 1303 J St r nse to a rec on Bureau ( es that prov tial mortgag ive of curren the data sub ions and mo nk entities. R ropriate deg ing and serv examinatio ginations an ry reforms rtgage servic e that you w sider our or ia Departme nual Report tial Mortgag 11, 2016, p n California i “originated …on the ser sees each m www.dbo.ca Release%20 the Comptr rtgage Metri reet, Suite 60 cent convers (CFPB), we a vides eviden ge loan origi nt trends an bstantiates ortgage serv Regulators m gree of regu vicing resid ons for such nd mortgage that stimula cing. will find the rganization ent of Busin t ‐ Operation ge Lending A press release increased su 537,757 m rvicing side, month increa .gov/Press/ 007‐11‐16.p roller of the ics Report – 0 · Sacrament sation with are sharing nce of the sh ination and nd should n our observa vicing by ba may wish to latory supp ential mortg h entities. Fu e servicing b ate bank re‐ following sa as a resourc ness Oversig n of Lenders Act e and relate ubstantially ortgages in , the aggreg ased 7.4 per /press_relea pdf e Currency Fourth Qua t o CA 95814- representat the followi hifting mark mortgage s ot be consid ation of the anks and an o become fam port offered gage loans a urther, given by banks, re ‐entry into r ampling of d ce. ght s and Service ed report in y in 2015.” S 2015, up 47 gate average rcent in 201 ases/2016/ arter 2016 2939 · t 916. tives from t ng informat ketplace dyn servicing. Th dered exhau decline in r increase in miliar with to the vario and the inte n the declin egulators m residential data inform ers Licensed dicate that Specifically, 7.3 percent e principal a 15.” /2015%20C . 438.4400 · f the Consum tion gathere namics relat he data offe ustive. residential m n those same this trend a ous license t ensity and s ne in residen may wish to c mortgage lo mative and h d under the C “mortgage l , residential from 2014’ amount of lo CRMLA%20 916.441.5756 mer Financia ed from var tive to ered is mortgage lo e activities b as they cons types cope of thei ntial mortga consider oan originat hope that yo California lending by n l mortgage ’s total of oans service Annual%20 6 · calbanker s al rious oan by sider ir age tion ou non‐ ed 0Rep s .com
-
Upload
khangminh22 -
Category
Documents
-
view
4 -
download
0
Transcript of nse to a rec - California Bankers Association
InrespoProtectioresourceresidentillustratiOverall,originatinon‐bantheapproriginatiperiodicloanorigregulatoandmorWehopewillcons
Californi2015AnnResidentTheJulybanksinlenders“365,045bylicenshttp://wort%20ROfficeofOCCMor1303 J Str
nsetoareconBureau(esthatprovtialmortgagiveofcurren
thedatasubionsandmonkentities.Rropriatedegingandservexaminatioginationsanryreformsrtgageservic
ethatyouwsiderouror
iaDepartmenualReporttialMortgag
11,2016,pnCaliforniai“originated…ontheserseeseachm
www.dbo.caRelease%20
f theComptrrtgageMetri
reet, Suite 60
centconvers(CFPB),weavidesevidengeloanoriginttrendsan
bstantiatesortgageservRegulatorsmgreeofreguvicingresidonsforsuchndmortgagethatstimulacing.
willfindtherganization
entofBusint‐OperationgeLendingA
pressreleaseincreasedsu537,757mrvicingside,monthincrea
.gov/Press/007‐11‐16.p
rolleroftheicsReport–
0 · Sacrament
sationwitharesharingnceoftheshinationandndshouldn
ourobservavicingbybamaywishtolatorysuppentialmortghentities.Fueservicingbatebankre‐
followingsaasaresourc
nessOversignofLendersAct
eandrelateubstantiallyortgagesin,theaggregased7.4per
/press_releapdf
eCurrencyFourthQua
to CA 95814-
representatthefollowihiftingmarkmortgagesotbeconsid
ationoftheanksandanobecomefamportofferedgageloansaurther,givenbybanks,re‐entryintor
amplingofdce.
ghtsandService
edreportinyin2015.”S2015,up47gateaveragercentin201
ases/2016/
arter2016
2939 · t 916.
tivesfromtnginformatketplacedynservicing.Thderedexhau
declineinrincreaseinmiliarwithtothevarioandtheintenthedeclinegulatorsmresidential
datainform
ersLicensed
dicatethatSpecifically,7.3percenteprincipala15.”
/2015%20C
.438.4400 · f
theConsumtiongatherenamicsrelathedataoffeustive.
residentialmnthosesamethistrendaouslicensetensityandsneinresidenmaywishtocmortgagelo
mativeandh
dundertheC
“mortgagel,residentialfrom2014’amountoflo
CRMLA%20
916.441.5756
merFinanciaedfromvartivetoeredis
mortgageloeactivitiesbastheyconstypescopeoftheintialmortgaconsideroanoriginat
hopethatyo
California
lendingbynlmortgage’stotalofoansservice
Annual%20
6 · calbankers
alrious
oanbysider
irage
tion
ou
non‐
ed
0Rep
s.com
2
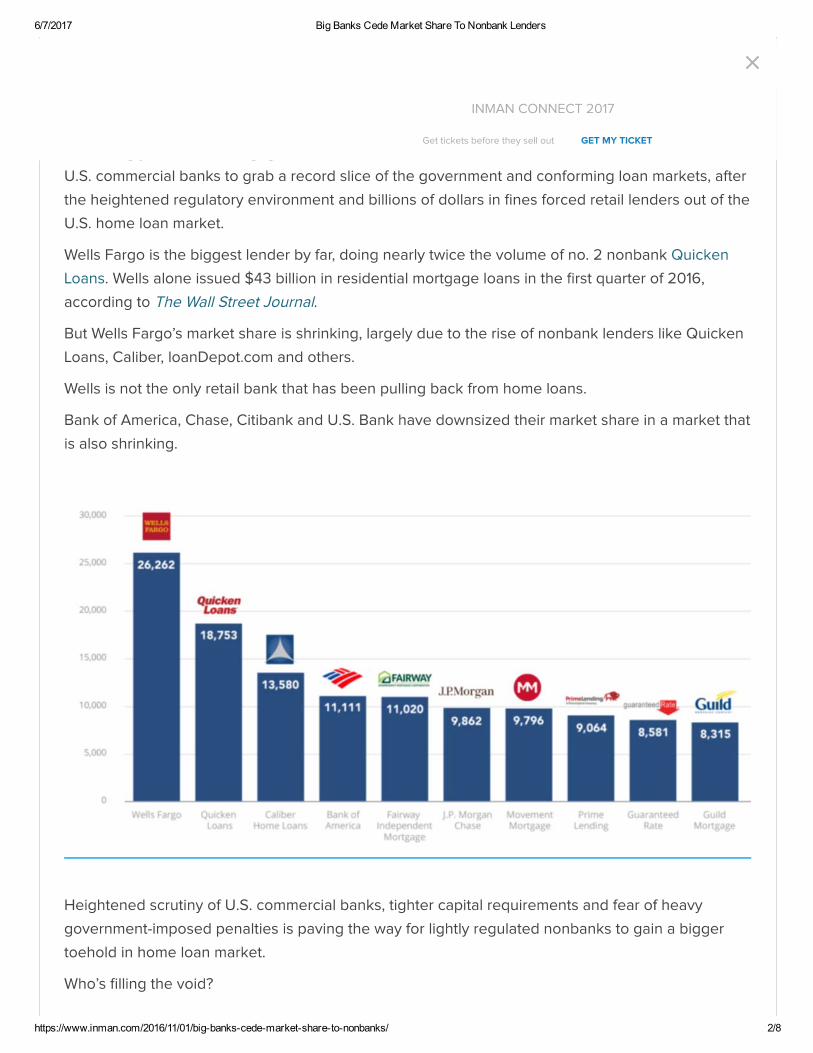
ReleasedinMarch2017,thisquarterlyreportcollectsandpresentsdataonfirst‐lienresidentialmortgageloansservicedbysevennationalbankswithlargemortgageservicingportfolioswhichintheaggregatetotal35percentofallresidentialmortgagedebtoutstandingintheUnitedStates.Twofigurespresentedonpage5ofthereportlinkedbelowdemonstratethedeclineinthetotalservicedmortgageportfoliobothintermsofoutstandingprincipalbalanceandnumberofloans.https://www.occ.gov/publications/publications‐by‐type/other‐publications‐reports/mortgage‐metrics/mortgage‐metrics‐q4‐2016.pdfNote:ThesevennationalbankscoveredareBankofAmerica,Citibank,HSBC,JPMorganChase,PNC,U.S.Bank,andWellsFargo.OCCMortgageMetricsReport–FourthQuarter2008Asapointofreference,thefollowinglinkbelowistotheOCCMortgageMetricsReportfromthefourthquarterof2008.Thatreportcollectedandpresenteddataonfirst‐lienmortgageloansservicedbyninenationalbanksandfourthriftsrepresentingalmost66percentofallresidentialmortgagedebtoutstandingintheUnitedStates.Asaconsequenceofmergersandacquisitions,the13depositoryinstitutionsarenowownedbynineholdingcompanies.https://www.occ.treas.gov/publications/publications‐by‐type/other‐publications‐reports/mortgage‐metrics/mortgage‐metrics‐q4‐2008‐pdf.pdfNote:TheninenationalbankscoveredareBankofAmerica,JPMorganChase,Citibank,FirstHorizon,HSBC,NationalCity,U.S.Bank,Wachovia,andWellsFargo.ThefourthriftscoveredareCountrywide,IndyMac,MerrillLynch,andWachoviaFSB.ThenineholdingcompaniesareBankofAmericaCorp.,JPMorganChase,Citigroup,FirstHorizon,HSBC,OneWest,PNC,U.S.Bancorp,andWellsFargoCorp.FederalReserveBoardReporttoCongressontheEffectofCapitalRulesonMortgageServicingAssetsThisJune2016report,whilefocusingontheeffectofcapitalrulesonmortgageservicingassets,identifiesinits“keyconclusions”thefactthat,“nonbankservicershavegainedsignificantmarketsharesince2011.Thegaininnonbankmarketshareofservicingappearslargelyattributabletolarge‐banksalesofcrisis‐eralegacyservicingportfoliosandanincreaseinmortgageoriginationactivityamongnonbanks.”(Page2).Thesectionwithinthisreport,“EvolutionoftheMortgageServicingMarketsince1998,”identifiesashiftinservicingmarketsharebetweenbanksandnonbanks.“Thedollarvolumeofmortgagesservicedbybankinginstitutionsroseuntil2008…asthestrainsofthefinancialcrisiseased,nonbankmortgageoriginatorsandservicersregainedandthenbuiltupontheirmarketshareinbothmortgageoriginationsandmortgageservicing…theshare
3
ofhome‐purchasemortgagesoriginatedbyindependentmortgagecompaniesrosefrom23percentin2007to47percentin2014…nonbanksalsoboostedtheirmortgageservicingmarketsharethroughbulkpurchasesofMSAs…by2015,roughlyone‐thirdofMSAswereheldbynonbanks,whereasbeforethefinancialcrisis,thenonbanksharewasaround15percent.”(Pages23‐24).ThereportanalyzesthereasonforMSAdecreaseamonglargebankinginstitutions,andamongotherfindings,indicates,“someofthecontractionalsoresultsfromlargebankinginstitutionsscalingbacksomewhattheirmortgageoriginationactivitymoregenerallyduringthepost‐crisisperiod.Forexample,datareportedbyInsideMortgageFinanceindicatethatthelargebankinginstitutionshareofmortgagesoriginatedtopurchasehomesfellfrom53percentin2008to28percentin2015.”(Page28).https://www.federalreserve.gov/publications/other‐reports/files/effect‐capital‐rules‐mortgage‐servicing‐assets‐201606.pdfAmericanBankersAssociationMortgageLendingRules–SensibleReformsforBanksandConsumersThisrecentAmericanBankersAssociation(ABA)report,releasedinMay2017,focusesonmortgage‐relatedreformsbeneficialtoconsumersandbanks.ABAnotesthattheir“banksdonotformallyreporttotheABAwhentheyexitmarketsegments,butwecanconfirmthatasignificantnumberofcommunitybankshaveceasedmortgageoperationsentirelyinresponsetotheheavyregulatoryburdensandincreaseinlegalrisks.Manymorehavediscontinuedspecificmortgageproductsasaresultofincreasedregulatoryburden,leavingconsumerswithfeweroptionsinthemarketplace.”(Page2).Respondingspecificallytomortgageservicingregulations,ABAindicatesthat“collectively,recentcomplicatedservicingrules,inappropriatelytargetedcapitalrequirements,andinconsistentregulatorypolicyarecreatinganenvironmentthatdiscouragesbanksfromservicingmortgageloans,whichprovideimportantandlong‐termrelationshipswithconsumers.”Thereportthenidentifiesseveral“recommendations[that]willfosterandenableincreasedmortgageservicingactivitiesinbanks.”(Page7).Withregardtoreforms,thepaperidentifiesaseriesofspecificrecommendations,includingrevisionstotheTILA‐RESPAintegrateddisclosures,changestounderwritingstandardsfoundintheAbility‐to‐RepayandQualifiedMortgagerules,reformsofvariousmortgageservicingrules(i.e.simplification,limitationsonlossmitigationrequests,capitaltreatmentofMSAs,etc.),andlimitationsonlegalliabilityand/orenhancementstoarighttocurepotentialviolations.Bywayofexample,ABArecommends,amongotherthings,thatTRID’sthree‐prongedtolerancepolicybereplacedwithasingletolerancestandardof10percentasameanstoeasecomplianceburdenswithouterodingconsumerprotectionsandthatthethreebusinessdaywaitingperiodbetweenfurnishingtheClosingDisclosureandsettlementbe

4
removed.Withregardtounderwriting,itisrecommendedthatloansinabank’sportfolioqualifyasaQMloantherebybenefitingfromsafeharbortreatmentandthatthe43percentdebt‐to‐incomestandardintheAbility‐to‐Repayrulebeeliminatedasitreducesflexibilityandresultsinrejectionofotherwisecreditworthyapplicants.Additionally,clarityisrequestedrelativetothelegalliabilityassociatedwithvariousRESPAandTILArequirementsalongwithenhancedopportunitiesacrossallmortgageregulationstocurepotentialviolationsinvolvingtechnicaloversightsandclericalmistakes.http://www.aba.com/Advocacy/Documents/Mortgage‐Reforms.PDF?utm_campaign=ABA‐Newsbytes‐052417‐HTML&utm_medium=email&utm_source=EloquaHarvardKennedySchoolWhat’sBehindtheNon‐BankMortgageBoom?ThisworkingpaperauthoredbyMarshallLuxandRobertGreenefromtheHarvardKennedySchoolincludesasectionon“RecentIndustryTrends,”andidentifiesthata“substantialscaling‐backofdepositoryinstitutionparticipationintheoriginationmarkethasaccompaniedasizableincreaseinnon‐bankoriginationvolume…amongstthetop40originators,wefindthatnon‐banksaccountedfor37.5percentoforiginationsin2014,upfrom15.9percentin2005…GoldmanSachsresearchfindsthatoverall,non‐banksshareoforiginationsjumpedfrom12to42percentduringthistime.”(Page13).WithregardtomortgagespurchasedbytheFederalHousingFinanceagency,thisreportalsocitesagrowingmarketshareofpurchasemortgageoriginationsbynon‐bankswherein“non‐banksaccountedfor26.3percentofagencypurchasemortgageloansoriginatedinDecember2012,byDecember2014,thatnumberhadgrownto48.37percent.”(Page16).Arelatedsectionon“MortgageServicingTrends,”indicatesthat“theupsurgeininnon‐bankmarketshareinmortgageservicingisapost‐crisis,Dodd‐Frankphenomenonnotdrivenbya‘shrinkingpie’…in2014,non‐banksheld28.2percentofoutstandingservicingobligationsamongstthetop40servicers;yetin2010,non‐banksheldjust7.9percentandin2005heldonly14.2percent.”(Page25).https://www.hks.harvard.edu/content/download/76449/1714947/version/1/file/Final_Nonbank_Boom_Lux_Greene.pdfSamplingofNewsArticlesAFebruary23,2017,articleintheWashingtonPost,Themortgagemarketisnowdominatedbynon‐banklenders,notesthat“thelandscapeofthelendingmarkethasshifteddramaticallyoverthepastfewyearsfromdominationbybigbankstoamarketwheremoreloansaremadebynon‐banks…”Thearticleidentifiesthatin“2011,50percentofallnewmortgagemoneywasloanedbythethreebiggestbanksintheUnitedStates:JPMorganChase,BankofAmericaandWellsFargo.ButbySeptember2016,theshareofloansbythesethreebigbanksdroppedto21percent.Atthesametime,sixofthetop10largest
5
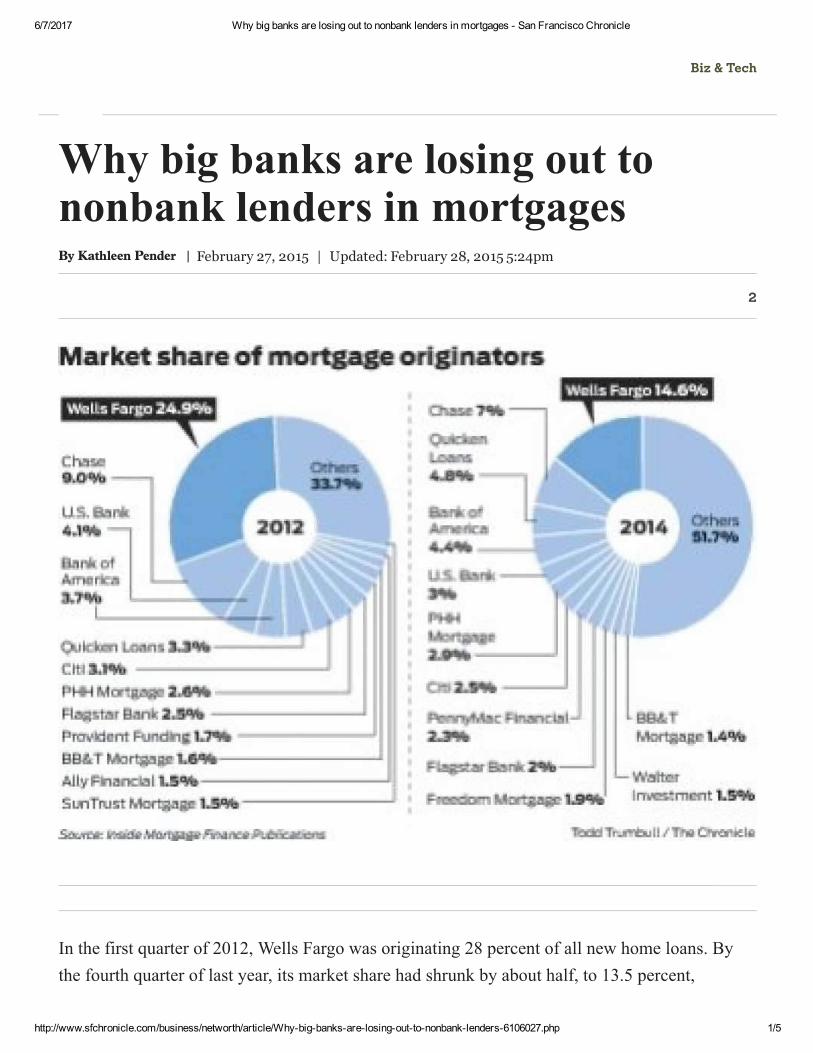
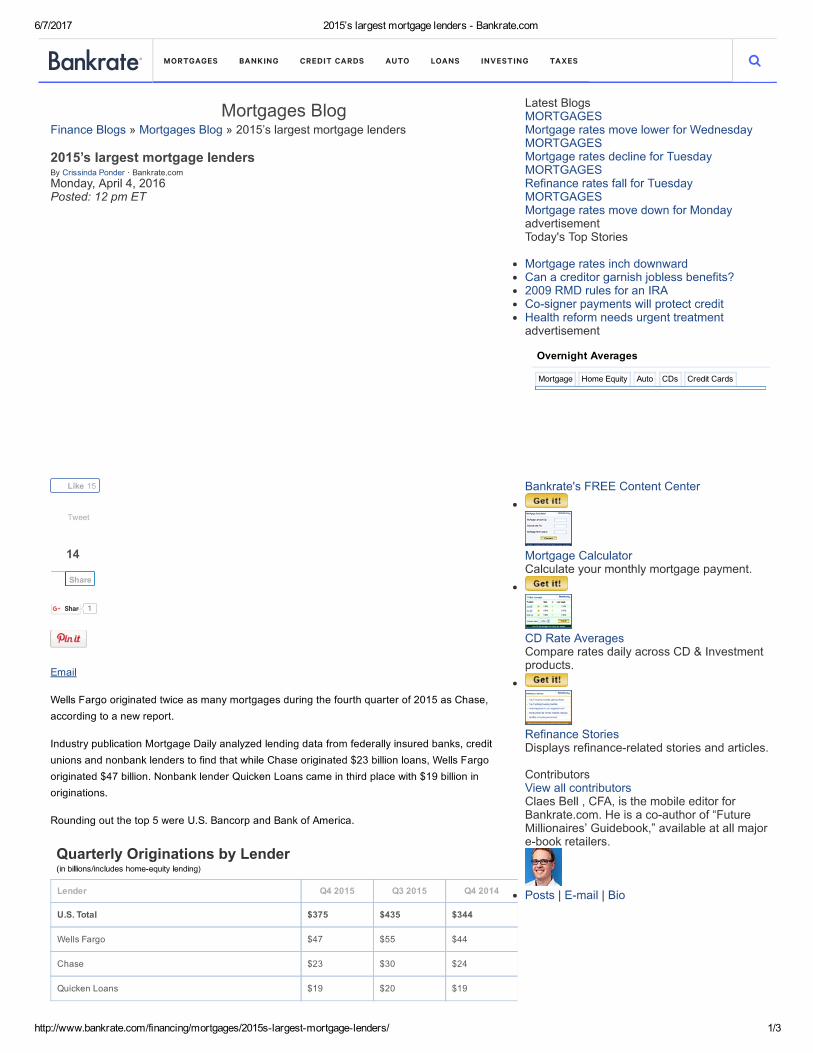
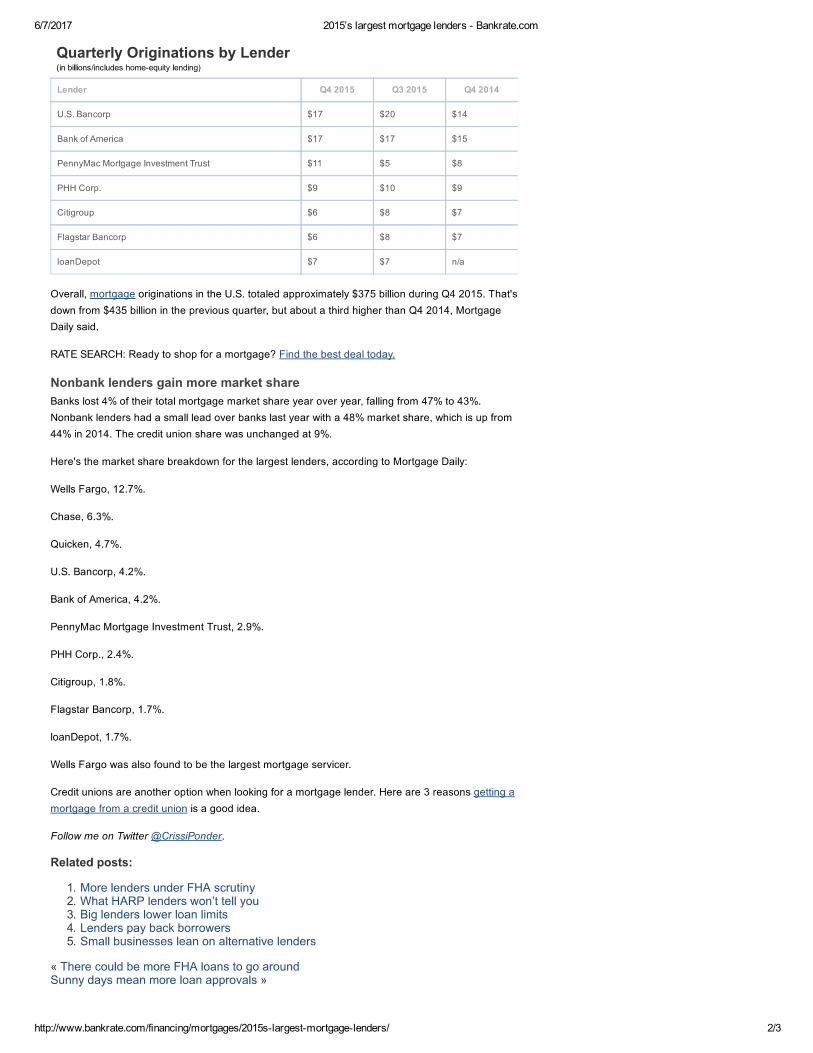
lendersbyvolumewerenon‐banks,suchasQuickenLoans,loanDepotandPHHMortgage,comparedwithjusttwoofthetop10in2011.”https://www.washingtonpost.com/realestate/the‐mortgage‐market‐is‐now‐dominated‐by‐nonbank‐lenders/2017/02/22/9c6bf5fc‐d1f5‐11e6‐a783‐cd3fa950f2fd_story.html?utm_term=.613d236a8210AnarticlepublishedonNovember1,2016,inInmantitled,Bigbankscedemarketsharetononbanks,arguesthat“sinceCongresspassedtheDodd‐FrankWallStreetReformandConsumerProtectionActin2010,bigU.S.bankshaveslowlywithdrawnfromthemortgagemarketastheyfacescoresofnewfederalrules,billionsoffinesformisconductandmoreregulation(theDodd‐FrankActis2,319pageslong).Increasingly,nonbankmortgagelenders—sometimescalled“shadowbanks”—haveovertakenU.S.commercialbankstograbarecordsliceofthegovernmentandconformingloanmarkets,aftertheheightenedregulatoryenvironmentandbillionsofdollarsinfinesforcedretaillendersoutoftheU.S.homeloanmarket.”Thearticlegoesontosaythat,“heightenedscrutinyofU.S.commercialbanks,tightercapitalrequirementsandfearofheavygovernment‐imposedpenaltiesispavingthewayforlightlyregulatednonbankstogainabiggertoeholdinhomeloanmarket.”http://www.inman.com/2016/11/01/big‐banks‐cede‐market‐share‐to‐nonbanks/Bankrate.compostedanarticleonApril4,2016,thatidentifiesthe2015’slargestmortgagelenders,andindicatesthat“bankslost4%oftheirtotalmortgagemarketshareyearoveryear,fallingfrom47%to43%.Nonbanklendershadasmallleadoverbankslastyearwitha48%marketshare,whichisupfrom44%in2014.”http://www.bankrate.com/financing/mortgages/2015s‐largest‐mortgage‐lenders/OnFebruary27,2015,aSanFranciscoChroniclearticle,Whybigbanksarelosingouttononbanklendersinmortgages,quotesGuyCecala,publisherofInsideMortgageFinancesayingthat“amongthetop40lenders,nonbanksaccountedfor37.5percentoforiginationsin2014,upfromonly7.5percentin2011…QuickenLoansandPennyMacarethetwo‐fastestgrowingoriginators.”Thearticleadditionallyreferencesthat“QuickenLoanswasthefifth‐largestloanoriginatorin2012;lastyearitwasthird.PennyMacleapedfrom15thtoeighth.Othernonbanksinthetop15includePHHMortgage,FreedomMortgage,WalterInvestment(a.k.a.GreenTreeServicing)andNationstarMortgage.”http://www.sfchronicle.com/business/networth/article/Why‐big‐banks‐are‐losing‐out‐to‐nonbank‐lenders‐6106027.php
STATE OF CALIFORNIA - BUSINESS, CONSUMER SERVICES AND HOUSING AGENCY EDMUND G. BROWN JR., Governor
DEPARTMENT OF BUSINESS OVERSIGHT Ensuring a Fair and Secure Financial Services Marketplace for all Californians
JAN LYNN OWEN Commissioner of Business Oversight
For Immediate Release Contact: Tom Dresslar July 11, 2016 (916) 322-5275
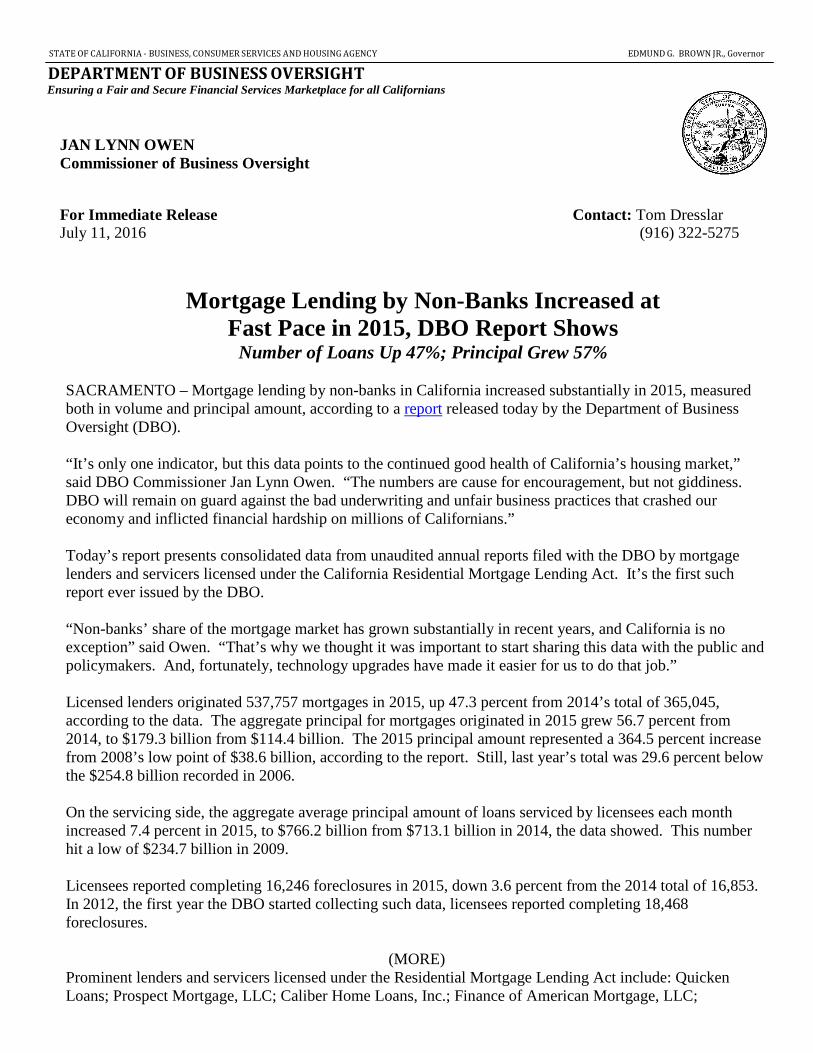
Mortgage Lending by Non-Banks Increased at
Fast Pace in 2015, DBO Report Shows Number of Loans Up 47%; Principal Grew 57%
SACRAMENTO – Mortgage lending by non-banks in California increased substantially in 2015, measured both in volume and principal amount, according to a report released today by the Department of Business Oversight (DBO). “It’s only one indicator, but this data points to the continued good health of California’s housing market,” said DBO Commissioner Jan Lynn Owen. “The numbers are cause for encouragement, but not giddiness. DBO will remain on guard against the bad underwriting and unfair business practices that crashed our economy and inflicted financial hardship on millions of Californians.” Today’s report presents consolidated data from unaudited annual reports filed with the DBO by mortgage lenders and servicers licensed under the California Residential Mortgage Lending Act. It’s the first such report ever issued by the DBO. “Non-banks’ share of the mortgage market has grown substantially in recent years, and California is no exception” said Owen. “That’s why we thought it was important to start sharing this data with the public and policymakers. And, fortunately, technology upgrades have made it easier for us to do that job.” Licensed lenders originated 537,757 mortgages in 2015, up 47.3 percent from 2014’s total of 365,045, according to the data. The aggregate principal for mortgages originated in 2015 grew 56.7 percent from 2014, to $179.3 billion from $114.4 billion. The 2015 principal amount represented a 364.5 percent increase from 2008’s low point of $38.6 billion, according to the report. Still, last year’s total was 29.6 percent below the $254.8 billion recorded in 2006. On the servicing side, the aggregate average principal amount of loans serviced by licensees each month increased 7.4 percent in 2015, to $766.2 billion from $713.1 billion in 2014, the data showed. This number hit a low of $234.7 billion in 2009. Licensees reported completing 16,246 foreclosures in 2015, down 3.6 percent from the 2014 total of 16,853. In 2012, the first year the DBO started collecting such data, licensees reported completing 18,468 foreclosures.
(MORE) Prominent lenders and servicers licensed under the Residential Mortgage Lending Act include: Quicken Loans; Prospect Mortgage, LLC; Caliber Home Loans, Inc.; Finance of American Mortgage, LLC;

Guaranteed Rate, Inc.; loanDepot, LLC; Nationstar Mortgage, LLC; Ocwen Loan Servicing, LLC; Pennymac Loan Services, LLC; Stearns Lending, Inc.; and Suntrust Mortgage, Inc. A report released by the DBO June 30 showed mortgage lending by non-banks licensed under a different law also increased substantially in 2015 compared to the prior year. Lenders licensed under the California Finance Lenders Law reported a 61.7 percent jump in the number of residential mortgage loans they made (to 78,073), and a 55.3 percent rise in the aggregate principal (to $24.6 billion). Combined in 2015, non-bank mortgage lenders licensed under both laws reported a 49 percent increase in the number of loans (to 615,830), and a 56.6 percent increase in aggregate principal (to $203.9 billion). The DBO licenses and regulates more than 360,000 individuals and entities that provide financial services in California. DBO’s regulatory jurisdiction extends over state-chartered banks and credit unions, money transmitters, securities broker-dealers, investment advisers, non-bank installment lenders and payday lenders, mortgage lenders, escrow companies, franchisors and more.
###


Report to the Congress onthe Effect of Capital Rules
on Mortgage Servicing Assets
Board of Governors of the Federal Reserve System
Federal Deposit Insurance Corporation
Office of the Comptroller of the Currency
National Credit Union Administration
W A S H I N G T O N , D . C . • J U N E 2 0 1 6

Report to the Congress onthe Effect of Capital Rules
on Mortgage Servicing Assets
Board of Governors of the Federal Reserve System
Federal Deposit Insurance Corporation
Office of the Comptroller of the Currency
National Credit Union Administration
W A S H I N G T O N , D . C . • J U N E 2 0 1 6

This and other Federal Reserve Board reports and publications are available online at
www.federalreserve.gov/publications/default.htm.
To order copies of Federal Reserve Board publications offered in print,
see the Board’s Publication Order Form (www.federalreserve.gov/pubs/orderform.pdf)
or contact:
Publications Fulfillment
Mail Stop N-127
Board of Governors of the Federal Reserve System
Washington, DC 20551
(ph) 202-452-3245
(fax) 202-728-5886
(e-mail) [email protected]

Preface
Section 634 of the Consolidated Appropriations Act,
2016 (the act), requires the Board of Governors of
the Federal Reserve System (Federal Reserve), Office
of the Comptroller of the Currency (OCC), and Fed-
eral Deposit Insurance Corporation (FDIC) (the fed-
eral banking agencies or agencies), and National
Credit Union Administration (NCUA) to jointly
conduct a study and issue a report on the appropriate
capital requirements for mortgage servicing assets
(MSAs) for banking institutions and federally
insured credit unions.1
As required by the act, the study includes2
• the risk to banking institutions of holding MSAs;
• the history of the market for MSAs, including in
particular the market for those assets in the period
of the financial crisis;
• the ability of banking institutions to establish a
value for MSAs of the institution through periodic
sales or other means;
• regulatory approaches to MSAs and capital
requirements that may be used to address concerns
about the value of and ability to sell MSAs;
• the impact of imposing the Basel III capital
requirements and the NCUA capital requirements
on banking institutions on the ability of those
institutions—
—to compete in the mortgage servicing business,
including the need for economies of scale to
compete in that business, and
—to provide service to consumers to whom the
institutions have made mortgage loans;
• an analysis of what the mortgage servicing market-
place would look like if the Basel III capital
requirements and the NCUA capital requirements
on MSAs—
—were fully implemented, and
—applied to both banking institutions and nonde-
pository residential mortgage loan servicers;
• the significance of problems with MSAs, if any, in
banking institution failures and problem banking
institutions, including specifically identifying failed
banking institutions where MSAs contributed to
the failure; and
• an analysis of the relevance of the Basel III capital
requirements and the NCUA capital requirements
on MSAs to the banking systems of other signifi-
cantly developed countries.
1 “Banking institutions,” as used in this report, generally refers to insured depository institutions, bank holding companies, and savings and loan holding companies, but does not include feder-ally insured credit unions, unless otherwise noted.
2 Consolidated Appropriations Act, 2016, Pub. L. No. 114-113, 129 Stat. 2242 (2015).
iii


Executive Summary ................................................................................................................. 1 Key Conclusions of the Study ...................................................................................................... 2
Background ................................................................................................................................ 5
Risks to Firms Holding Mortgage Servicing Assets .................................................... 7
Valuation Risks ........................................................................................................................... 7
Business Risks ......................................................................................................................... 11
Role of Mortgage Servicing Assets in Bank Failures ................................................. 13
Financial Data Reported by Failed Insured Depository Institutions ............................................... 13
Material Loss Review Reports .................................................................................................... 14
FDIC’s Experience with MSAs in Its Capacity as the Receiver of Failed Banks .............................. 15
Regulatory Approaches for Mortgage Servicing Assets ............................................ 17
Evolution of the Mortgage Servicing Market since 1998 ......................................... 19
Factors Determining Fluctuations of MSA Values Held by Banks ................................................. 20
Trends in Banks’ MSA Values Relative to Assets and to Capital ................................................... 25
Potential Impact of the Revised Capital Rule on the Mortgage Servicing Business .................................................................................................................. 33
Cost of Loan Servicing and Economies of Scale ......................................................................... 33
Serve Consumers ..................................................................................................................... 35
Potential Impact of the Revised Capital Rule on Nonbanks ................................... 37
Mortgage Servicing Assets Outside of the United States ......................................... 41
Analyses on Impact of the Revised Capital Rule ........................................................ 43
Recommendations for Legislative or Regulatory Actions ........................................ 45
Appendix ................................................................................................................................... 47
v
Contents

Executive Summary
This report includes the results of the study con-
ducted by the federal banking agencies and NCUA
and incorporates analysis on MSAs that was under-
taken by the federal banking agencies before the issu-
ance in 2013 of the federal banking agencies’ revised
capital rule (revised capital rule) and by NCUA
before the issuance in 2015 of the NCUA capital
requirements.
While servicing is inherent in all mortgage loans, a
mortgage servicing right (MSR) is created only when
the act of servicing is contractually separated from
the underlying loan. A firm, for example, that origi-
nates a mortgage, sells it to a third party, and retains
the servicing would report an MSA on its balance
sheet, if certain conditions are met.3 That MSA
therefore would be subject to a capital requirement.
Conversely, a firm would not report an MSA if the
firm originates a mortgage, holds the mortgage on its
balance sheet, and performs the servicing.
This study examines the evolution of the mortgage
servicing market during the past 20 years and con-
cludes that the market has been shaped by a variety
of factors. These factors include
• changes in interest rates;
• sharp fluctuations in housing prices, and the corre-
sponding changes in mortgage debt and surge in
nonperforming loans;
• shifts in the desirability of securitizing mortgages
versus holding them in portfolio; and
• regulatory, tax, and accounting changes related to
mortgage servicing.
The report describes this historical evolution of
mortgage servicing by examining the effects of these
factors on the MSA holdings of banking institutions
and federally insured credit unions. Further, the
study analyzes historical changes in the ratio of
MSAs to capital, and how changes in this ratio have
varied across different types of banking institutions
and federally insured credit unions.
In evaluating the characteristics of MSAs, the study
identifies two key risks to a firm’s mortgage servicing
activities: business risk and valuation risk. Business
risk refers to idiosyncratic risks related to a firm’s
mortgage servicing activities and can include legal,
compliance, and reputational risk. Valuation risk
refers to risks inherent in a firm’s ability to accurately
estimate a value for its MSAs and is driven mainly by
interest rate risk but is also affected by default risk.
The study also finds that MSA valuations are subject
to forecast uncertainty that can be exacerbated under
adverse financial conditions and result in liquidity
strains.
Determining the fair value of an MSA can be diffi-
cult because MSAs do not trade in an active, open
market with readily available and observable prices.
This valuation difficulty is also in part because MSAs
tend not to be homogenous assets, as they differ by
loan size, interest rates, servicing fees, maturity, credit
quality, and the entity, if any, that provides a credit
guarantee on the underlying loan, among other char-
acteristics. Thus, a firm is generally not able to value
its MSAs based on sales alone, as those sales are
unlikely to be sufficiently comparable to the MSAs
being valued. As shown by the report, to estimate the
value of MSAs, banking institutions use financial
models, which estimate the present value of net
3 An MSR refers to a firm’s contractual right to service a mort-gage loan. An MSA, however, refers to an MSR in which the benefits of the servicing are more than adequate to compensate a servicer for performing the servicing. Conversely, if the ben-efits are not expected to adequately compensate a servicer for performing the servicing, the contractual right results in a ser-vicing liability. Accounting Standards Codification (ASC) 860-50-30.
1

future cash flows associated with servicing activities,
and compare and benchmark their estimate with sev-
eral market-based sources.
Key Conclusions of the Study
• MSA valuations are inherently subjective and sub-
ject to uncertainty, as they rely on assessments of
future economic variables. This reliance can lead to
variance in MSA valuations across firms. More-
over, adverse financial conditions may cause liquid-
ity strains for firms seeking to sell or transfer their
MSAs.
• Between 2007 and 2015, Material Loss Reviews
(MLRs) identified MSAs as a factor contributing
to the failure of four insured depository institu-
tions; there is evidence that other failed institutions
experienced some degree of problems with their
MSAs.
• Excluding MSAs transferred by the FDIC as
receiver pursuant to a whole bank purchase and
assumption transaction, since 2007 there were 36
failed banks that held MSAs and the MSAs at 31
of those failed banks had no net value in a sale
transaction.
• The federal banking agencies have long limited the
inclusion of MSAs and other intangible assets in
regulatory capital because of the high level of
uncertainty regarding the ability of banking insti-
tutions to realize value from these assets, especially
under adverse financial conditions.4
• MSAs represent a small share of both the aggre-
gate amount of total bank assets and the aggregate
amount of common equity tier 1 (CET1) capital.5
From 1998 to 2015, the highest levels that MSAs
ever reached as a percentage of assets and MSAs as
a percentage of CET1 capital were 0.7 percent and
9 percent, respectively.6 By the fourth quarter of
2015, these levels were lower, at 0.25 percent as
a percentage of assets and 2.8 percent as a percent-
age of CET1 capital.7
• Most banks in the United States—around 83 per-
cent—do not hold any MSAs.8
• Nonbank servicers have gained significant market
share since 2011. The gain in nonbank market
share of servicing appears largely attributable to
large-bank sales of crisis-era legacy servicing port-
folios and an increase in mortgage origination
activity among nonbanks.
• Banking institutions continue to service most resi-
dential mortgage loans that they sell to Fannie Mae
and Freddie Mac (government-sponsored enter-
prises, or GSEs).
• The mortgage servicing market remains quite com-
petitive as it is not highly concentrated, as gauged
by standard measures of market concentration.
• Although MSAs have become a smaller share of
banking sector assets in the aggregate, the number
of banks that held MSAs increased during the
1998 to 2015 period.9 The increase stems almost
entirely from small banks (total assets less than
$10 billion), which, for example, held less than
2 percent of total MSAs in 2009 as compared to
8 percent in 2015. Most banks with MSAs have
small holdings and would not exceed the threshold
that would trigger a capital deduction under the
revised capital rule.
• Assuming fully phased-in implementation of the
revised capital rule, the vast majority of banking
institutions would be able to satisfy minimum risk-
based capital requirements without any change to
their mortgage servicing activities or portfolios.
• A pullback of aggregator banking institutions (i.e.,
banking institutions that purchase mortgage loans
and servicing rights from other firms) from the
MSA market could have effects on MSA pricing
and liquidity; conversely, the effects of stronger
bank capital requirements and mortgage reforms
may make the residential mortgage market and its
bank lenders more resilient and a recurrence of
crisis-era problems less likely.
• The capital requirements that apply to banking
institutions would not necessarily be appropriate
for nonbank servicers. If the capital requirements
applicable to banking institutions were hypotheti-
cally applied to nonbanks, the impact on the non-
bank servicing institutions would vary according to
4 Since NCUA adopted a system of Prompt Corrective Action in 2000, for NCUA-supervised credit unions, no MSAs have been deducted from capital measures but instead have been assigned a risk weight.
5 “Banks,” as used in this report, generally refers to all insured depository institutions, excluding saving associations.
6 Since NCUA began collecting MSA data in 2004, the highest level of MSAs to assets and MSAs to net worth were 0.2 per-cent and 1.96 percent, respectively.
7 As of December 31, 2015, federally insured credit unions held MSAs equivalent to 0.19 percent of assets and to 1.77 percent of net worth.
8 Ninety-two percent of federally insured credit unions do not hold MSAs.
9 The number of federally insured credit unions that held MSAs increased from 240 in 2004 to 509 in 2015.
2 Report to the Congress on the Effect of Capital Rules on Mortgage Servicing Assets

their business model. Real estate investment trust
(REIT)-type servicers, which represent a small
share of the nonbank servicing market, would be
minimally affected because they hold significant
portfolios of assets other than MSAs. Nonbank
mortgage servicers with significant holdings of
MSAs relative to their capital and with limited or
no business diversification would likely not be able
to satisfy minimum capital requirements on a
stand-alone basis unless they took remedial actions
(e.g., changed their business models, increased their
capital ratios).
The past several years have demonstrated that the
mortgage servicing market continues to evolve. While
the federal banking agencies and NCUA do not rec-
ommend any additional statutory or regulatory
actions at this time, the federal banking agencies and
NCUA will continue to monitor developments in
mortgage servicing industry standards and practices,
and will exercise their regulatory and supervisory
authorities, as appropriate, to pursue their respective
statutory mandates, including ensuring the safety and
soundness of depository institutions and the stability
of the U.S. financial system.
June 2016 3

Background
A mortgage servicer provides the ongoing manage-
ment and upkeep of a mortgage loan. The servicer’s
tasks include collecting principal and interest pay-
ments from the borrower and sending these amounts
to the investors, collecting and distributing escrow
payments for insurance and property taxes, advanc-
ing payment to investors on behalf of delinquent
borrowers, working with borrowers to modify mort-
gage terms, and, in the case of borrower default, pur-
suing liquidation options, including foreclosure or
short sale.
Servicing is performed by banking institutions, credit
unions, and nonbanks. Nonbanks refer to financial
institutions that do not have a depository institution
within their overall operating structure.
While servicing is inherent in all mortgage loans, an
MSR is created only when the act of servicing is con-
tractually separated from the underlying loan. An
MSA therefore is created when a firm retains the
right to service a loan that it sells to a third-party,
such as an issuer of mortgage-backed securities
(MBS), and certain other conditions are met.10 From
that point forward, the MSA is considered a separate
asset from the underlying mortgage loan, and the ser-
vicing rights can be retained by the loan originator or
transferred to another firm (subject to the consent of
the owner of the underlying mortgages).11 An MSA
is not created when a firm services a loan that the
firm originates and holds for long-term investment.
There are several reasons why a firm may choose to
sell a mortgage loan while retaining the servicing
rights. The primary reasons to sell a mortgage loan
include generating capital that the firm can use to
make additional investments, including new mortgage
loans, and managing interest rate risk. By retaining
the servicing rights, the firm maintains its relation-
ship with the borrower, thereby allowing the firm to
cross-sell products to the borrower and to earn a ser-
vicing fee.
A servicer’s primary source of revenue for this activ-
ity is the servicing fee. The servicing fee is generally a
fixed percentage of the unpaid principal balance
(UPB) of the underlying mortgage loan. The servicer
may also receive ancillary fees (e.g., late fees and loan
modification fees) and interest (or “float”) earned on
principal and interest and taxes and insurance col-
lected and held by the servicer before distribution.
The servicing fees, ancillary fees, and float typically
exceed the cost of servicing the loans, resulting in a
profit for the servicer.
Servicers may incur a variety of expenses in the pro-
cess of servicing loans. These expenses include the
basic costs to operate a business, including employee
salaries and benefits, premises costs, and technology
costs. Nonperforming loans contribute significantly
to a servicer’s costs and can reduce profitability. For
a mortgage that is delinquent or has defaulted, a ser-
vicer will need to employ additional staff to perform
collection activities, loss mitigation activities, or to
manage the foreclosure process. A servicer also may
be required to advance payments to the investors,
insurers, and taxing authorities, and may be required
to pay third-party fees related to foreclosure proceed-
ings. In addition, a servicer will incur costs related to
unreimbursed foreclosure costs and real-estate owned
losses.12
The majority of mortgage loans originated in the
United States ultimately are sold in the secondary
market and packaged into securities guaranteed by
the GSEs or by Ginnie Mae.13 The GSEs may also
hold in their portfolios the loans that they have pur-
10 Conversely, a firm could retain the loans it originates and sell the servicing rights, but this practice is not common.
11 ASC 860-50-25-1.
12 Laurie Goodman, “Servicing Is an Underappreciated Con-straint on Credit Access,” Urban Institute, December 2014, 2, www.urban.org/sites/default/files/alfresco/publication-pdfs/2000049-Servicing-Is-an-Underappreciated-Constraint-on-Credit-Access.pdf.
13 Laurie Goodman et al., “Housing Finance at a Glance: A Monthly Chartbook, April 2016,” Urban Institute, 6, www
5

chased. The remaining loans are either held for
investment by the originating firm or sold to the sec-
ondary market and packaged into private-label MBS.
The GSEs and Ginnie Mae do not service mortgages
directly. This fact creates a need for a robust third-
party servicing industry.
Various federal and state rules and regulations
address regulatory capital requirements for firms
holding MSAs and mortgage servicing standards
generally. In addition, the GSEs and Ginnie Mae
require servicers to comply with guidelines to service
loans guaranteed by these entities, while separate
contractual provisions govern the servicing of loans
in private-label MBS or for other firms..urban.org/research/publication/housing-finance-glance-monthly-chartbook-april-2016/view/full_report.
6 Report to the Congress on the Effect of Capital Rules on Mortgage Servicing Assets
Risks to Firms Holding Mortgage Servicing Assets
MSAs pose two key risks to a firm: valuation risk
and business risk. Valuation risk refers to risks inher-
ent in a firm’s ability to estimate accurately a value
for its MSAs and is driven mainly by interest rate risk
and default risk.14 MSA valuations are inherently
subjective and subject to uncertainty, as they rely on
assessments of future economic variables. This reli-
ance can lead to variance in MSA valuations across
firms. Moreover, adverse financial conditions may
cause liquidity strains for firms seeking to sell or
transfer their MSAs. Business risk refers to idiosyn-
cratic risks related to a firm’s actual mortgage servic-
ing activities and can include legal, compliance, and
reputational risk.
Valuation Risks
The fair value of an MSA is defined as the price that
would be received to sell the MSA in an orderly
transaction between market participants as of the
measurement date.15 MSAs, however, do not trade in
an active, open market with readily available and
observable prices. Because the significant inputs and
assumptions used to determine fair value are unob-
servable, the MSA fair values are Level 3 under U.S.
generally accepted accounting principles (GAAP).16
The valuation difficulty is in part because a firm’s
MSA portfolio tends not to consist of homogenous
assets, as each portfolio is typically associated with
mortgages that differ by loan size, interest rates, ser-
vicing fees, maturity, credit quality, and the entity, if
any, that provides a credit guarantee on the underly-
ing loan, among other characteristics. Accordingly, a
firm generally will not be able to value its MSAs
based on comparable sales alone.
To compensate, a firm may use financial modelling to
determine the fair value of its MSAs. To do so, a firm
will estimate the present value of net future servicing
cash flows and compare and benchmark its estimate
with several market-based sources.17 The primary
determinant of future cash flows is the prepayment
rate on the associated mortgage loans, which is
driven largely by expectations about the interest rate
environment. Another key assumption is default risk,
which is the risk that a borrower will default on the
mortgage loan. Default risk is influenced by geo-
graphic and macroeconomic conditions, and by the
credit quality of the underlying loans.
The valuation of MSAs is best performed at the loan
level of the mortgages that underlie the MSA portfo-
lio. This approach allows the risk characteristics of
each loan to be captured in the MSA valuation. To
reduce processing time, servicers may aggregate loan
level data into groups with similar risk characteristics
(e.g., by interest rate and geography). However, ser-
vicer decisions about how to aggregate are subjective,
and higher levels of aggregation can lead to the loss
of important risk characteristics and, consequently,
reduced valuation precision.
Most importantly, because MSA valuations must rely
on assessments of future economic variables, they are
inherently subjective and subject to uncertainty. This
reliance can lead to variance in MSA valuations
across firms and could result in valuation or impair-
ment charges as assumptions change.18 For example,
some nonbank servicers recorded significant write
14 This study does not separate the total mortgage servicing mar-ket into GSE and non-GSE MSAs. Available data generally do not distinguish between GSE and non-GSE MSAs. We note, however, that non-GSE MSAs are structurally different than GSE MSAs, and are more susceptible to credit risk. Credit risk factors that do not exist in GSE servicing can affect non-GSE MSAs’ ancillary income, cost structure, and hence valuations. Because non-GSE MSAs can rapidly transition to problem loan servicing, non-GSE MSAs cost structure can rapidly increase, limiting the number of investors interested in such assets, and thus requiring higher rates of return. As a result, non-GSE MSA valuation changes are not linear across the spectrum of valuation assumptions.
15 ASC 820, Fair Value Measurement.16 See ASC 820-10-35.
17 Sources include trust interest-only securities, broker appraisals, bulk sales of MSAs, and peer group surveys.
18 Federal Housing Finance Agency, Alternative Mortgage Servic-ing Compensation Discussion Paper (Washington, DC: 2011), 9, www.fhfa.gov/PolicyProgramsResearch/Research/
7
downs related to the valuation of their MSAs in the
first quarter of 2016, raising concerns about the valu-
ation methods used by these firms.19 Consequently,
MSA values may be difficult to realize or may not be
realizable at all.
Generally, larger firms with more resources will build
and maintain proprietary MSA valuation models, use
complex modelling techniques, and actively hedge
their MSAs. In contrast, smaller firms rely more
heavily on third-party vendors for valuation services,
are more likely to use less complex models, and do
not actively hedge their MSAs.
Prepayment Risk
Prepayment rates on mortgage loans are driven
largely by interest rate changes. Declining interest
rates incentivize borrowers to refinance their mort-
gages, the act of which extinguishes the servicer’s
income stream associated with those loans. If interest
rates decline more than expected, MSAs are likely to
lose value because the loans associated with those
MSAs are more likely to be paid off sooner. Con-
versely, in an increasing interest rate environment,
borrowers are less likely to prepay their mortgages,
thus extending the duration of the loan and in turn
the servicer’s income stream. In such an environ-
ment, MSA values are likely to rise.
Historically, the relationship between MSA values
and interest rate changes is not uniform but rather
exhibits negative convexity. That is, MSA values
decrease at a faster rate in a declining interest rate
environment but do not rise as quickly in an increas-
ing interest rate environment. The impact of interest
rate changes on MSA values therefore depends on
both the direction and severity of interest rate
movements.
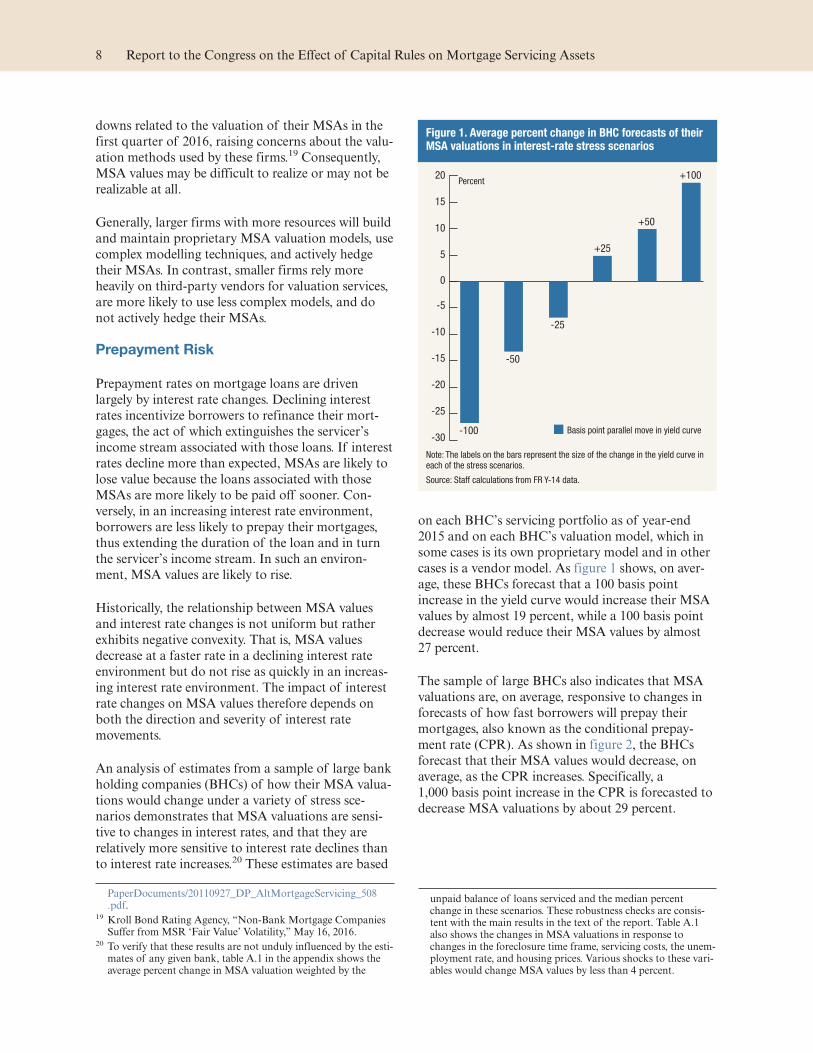
An analysis of estimates from a sample of large bank
holding companies (BHCs) of how their MSA valua-
tions would change under a variety of stress sce-
narios demonstrates that MSA valuations are sensi-
tive to changes in interest rates, and that they are
relatively more sensitive to interest rate declines than
to interest rate increases.20 These estimates are based
on each BHC’s servicing portfolio as of year-end
2015 and on each BHC’s valuation model, which in
some cases is its own proprietary model and in other
cases is a vendor model. As figure 1 shows, on aver-
age, these BHCs forecast that a 100 basis point
increase in the yield curve would increase their MSA
values by almost 19 percent, while a 100 basis point
decrease would reduce their MSA values by almost
27 percent.
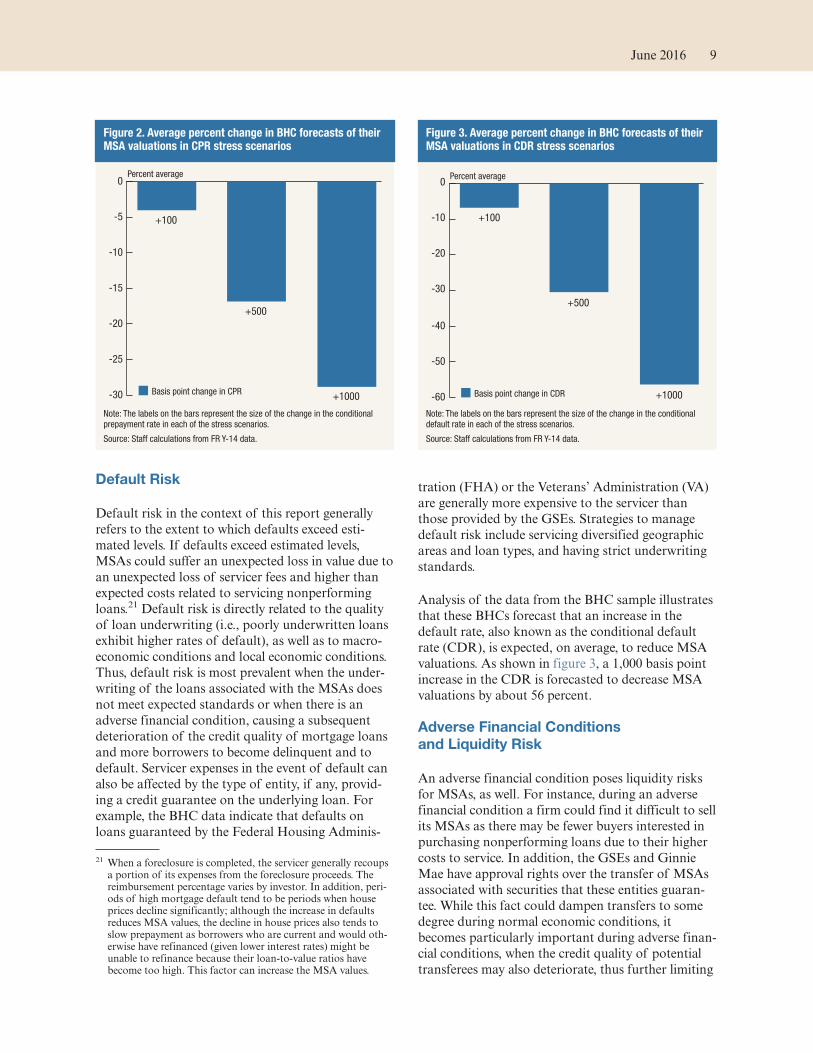
The sample of large BHCs also indicates that MSA
valuations are, on average, responsive to changes in
forecasts of how fast borrowers will prepay their
mortgages, also known as the conditional prepay-
ment rate (CPR). As shown in figure 2, the BHCs
forecast that their MSA values would decrease, on
average, as the CPR increases. Specifically, a
1,000 basis point increase in the CPR is forecasted to
decrease MSA valuations by about 29 percent.
PaperDocuments/20110927_DP_AltMortgageServicing_508.pdf.
19 Kroll Bond Rating Agency, “Non-Bank Mortgage Companies Suffer from MSR ‘Fair Value’ Volatility,” May 16, 2016.
20 To verify that these results are not unduly influenced by the esti-mates of any given bank, table A.1 in the appendix shows the average percent change in MSA valuation weighted by the
unpaid balance of loans serviced and the median percent change in these scenarios. These robustness checks are consis-tent with the main results in the text of the report. Table A.1 also shows the changes in MSA valuations in response to changes in the foreclosure time frame, servicing costs, the unem-ployment rate, and housing prices. Various shocks to these vari-ables would change MSA values by less than 4 percent.
Figure 1. Average percent change in BHC forecasts of their MSA valuations in interest-rate stress scenarios
-30
-25
-20
-15
-10
-5
0
5
10
15
20Percent
+100
+50
+25
-25
-50
-100 Basis point parallel move in yield curve
Note: The labels on the bars represent the size of the change in the yield curve in each of the stress scenarios.
Source: Staff calculations from FR Y-14 data.
8 Report to the Congress on the Effect of Capital Rules on Mortgage Servicing Assets
Default Risk
Default risk in the context of this report generally
refers to the extent to which defaults exceed esti-
mated levels. If defaults exceed estimated levels,
MSAs could suffer an unexpected loss in value due to
an unexpected loss of servicer fees and higher than
expected costs related to servicing nonperforming
loans.21 Default risk is directly related to the quality
of loan underwriting (i.e., poorly underwritten loans
exhibit higher rates of default), as well as to macro-
economic conditions and local economic conditions.
Thus, default risk is most prevalent when the under-
writing of the loans associated with the MSAs does
not meet expected standards or when there is an
adverse financial condition, causing a subsequent
deterioration of the credit quality of mortgage loans
and more borrowers to become delinquent and to
default. Servicer expenses in the event of default can
also be affected by the type of entity, if any, provid-
ing a credit guarantee on the underlying loan. For
example, the BHC data indicate that defaults on
loans guaranteed by the Federal Housing Adminis-
tration (FHA) or the Veterans’ Administration (VA)
are generally more expensive to the servicer than
those provided by the GSEs. Strategies to manage
default risk include servicing diversified geographic
areas and loan types, and having strict underwriting
standards.
Analysis of the data from the BHC sample illustrates
that these BHCs forecast that an increase in the
default rate, also known as the conditional default
rate (CDR), is expected, on average, to reduce MSA
valuations. As shown in figure 3, a 1,000 basis point
increase in the CDR is forecasted to decrease MSA
valuations by about 56 percent.
Adverse Financial Conditions
and Liquidity Risk
An adverse financial condition poses liquidity risks
for MSAs, as well. For instance, during an adverse
financial condition a firm could find it difficult to sell
its MSAs as there may be fewer buyers interested in
purchasing nonperforming loans due to their higher
costs to service. In addition, the GSEs and Ginnie
Mae have approval rights over the transfer of MSAs
associated with securities that these entities guaran-
tee. While this fact could dampen transfers to some
degree during normal economic conditions, it
becomes particularly important during adverse finan-
cial conditions, when the credit quality of potential
transferees may also deteriorate, thus further limiting
21 When a foreclosure is completed, the servicer generally recoups a portion of its expenses from the foreclosure proceeds. The reimbursement percentage varies by investor. In addition, peri-ods of high mortgage default tend to be periods when house prices decline significantly; although the increase in defaults reduces MSA values, the decline in house prices also tends to slow prepayment as borrowers who are current and would oth-erwise have refinanced (given lower interest rates) might be unable to refinance because their loan-to-value ratios have become too high. This factor can increase the MSA values.
Figure 2. Average percent change in BHC forecasts of their MSA valuations in CPR stress scenarios
-30
-25
-20
-15
-10
-5
0
+1000
+500
+100
Percent average
Basis point change in CPR
Note: The labels on the bars represent the size of the change in the conditional prepayment rate in each of the stress scenarios.
Source: Staff calculations from FR Y-14 data.
Figure 3. Average percent change in BHC forecasts of their MSA valuations in CDR stress scenarios
-60
-50
-40
-30
-20
-10
0
+1000
+500
+100
Percent average
Basis point change in CDR
Note: The labels on the bars represent the size of the change in the conditional default rate in each of the stress scenarios.
Source: Staff calculations from FR Y-14 data.
June 2016 9
the number of firms that the GSEs and Ginnie Mae
would approve to service. Moreover, investors have
consent rights to servicing sales and transfers. As a
condition to providing the consent, investors have
historically required that the buyer of the MSAs
assume direct recourse liability for origination and
servicing defects, regardless of whether that buyer, as
the new servicer, originated the loan or caused the
servicing defect. This fact could further erode MSA
values, particularly if the firm did not adequately
consider the contingent recourse liability when ini-
tially valuing its MSAs. Consequently, during an
adverse financial condition a servicer’s ability to real-
ize value from its MSAs may deteriorate at a time
when the need to raise liquidity and capital and
reduce risk is most acute.
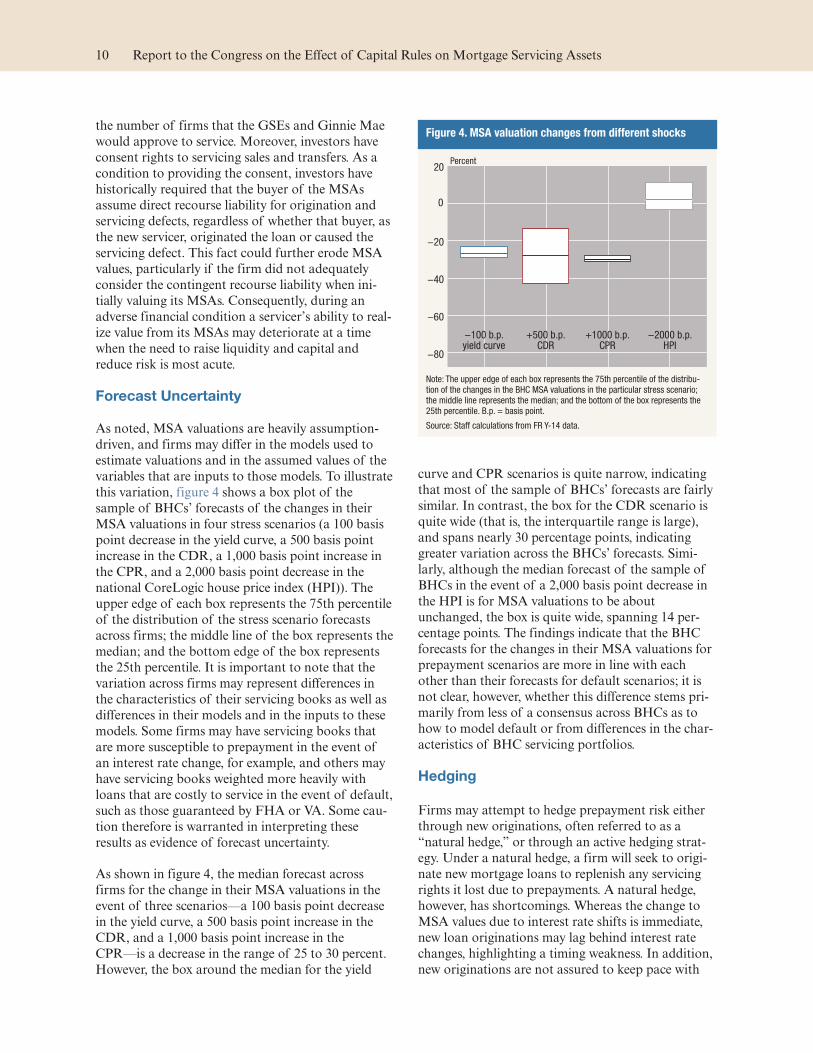
Forecast Uncertainty
As noted, MSA valuations are heavily assumption-
driven, and firms may differ in the models used to
estimate valuations and in the assumed values of the
variables that are inputs to those models. To illustrate
this variation, figure 4 shows a box plot of the
sample of BHCs’ forecasts of the changes in their
MSA valuations in four stress scenarios (a 100 basis
point decrease in the yield curve, a 500 basis point
increase in the CDR, a 1,000 basis point increase in
the CPR, and a 2,000 basis point decrease in the
national CoreLogic house price index (HPI)). The
upper edge of each box represents the 75th percentile
of the distribution of the stress scenario forecasts
across firms; the middle line of the box represents the
median; and the bottom edge of the box represents
the 25th percentile. It is important to note that the
variation across firms may represent differences in
the characteristics of their servicing books as well as
differences in their models and in the inputs to these
models. Some firms may have servicing books that
are more susceptible to prepayment in the event of
an interest rate change, for example, and others may
have servicing books weighted more heavily with
loans that are costly to service in the event of default,
such as those guaranteed by FHA or VA. Some cau-
tion therefore is warranted in interpreting these
results as evidence of forecast uncertainty.
As shown in figure 4, the median forecast across
firms for the change in their MSA valuations in the
event of three scenarios—a 100 basis point decrease
in the yield curve, a 500 basis point increase in the
CDR, and a 1,000 basis point increase in the
CPR—is a decrease in the range of 25 to 30 percent.
However, the box around the median for the yield
curve and CPR scenarios is quite narrow, indicating
that most of the sample of BHCs’ forecasts are fairly
similar. In contrast, the box for the CDR scenario is
quite wide (that is, the interquartile range is large),
and spans nearly 30 percentage points, indicating
greater variation across the BHCs’ forecasts. Simi-
larly, although the median forecast of the sample of
BHCs in the event of a 2,000 basis point decrease in
the HPI is for MSA valuations to be about
unchanged, the box is quite wide, spanning 14 per-
centage points. The findings indicate that the BHC
forecasts for the changes in their MSA valuations for
prepayment scenarios are more in line with each
other than their forecasts for default scenarios; it is
not clear, however, whether this difference stems pri-
marily from less of a consensus across BHCs as to
how to model default or from differences in the char-
acteristics of BHC servicing portfolios.
Hedging
Firms may attempt to hedge prepayment risk either
through new originations, often referred to as a
“natural hedge,” or through an active hedging strat-
egy. Under a natural hedge, a firm will seek to origi-
nate new mortgage loans to replenish any servicing
rights it lost due to prepayments. A natural hedge,
however, has shortcomings. Whereas the change to
MSA values due to interest rate shifts is immediate,
new loan originations may lag behind interest rate
changes, highlighting a timing weakness. In addition,
new originations are not assured to keep pace with
Figure 4. MSA valuation changes from different shocks
−80
−60
−40
−20
20
0
−100 b.p.yield curve
+500 b.p.CDR
+1000 b.p.CPR
−2000 b.p.HPI
Percent
Note: The upper edge of each box represents the 75th percentile of the distribu-tion of the changes in the BHC MSA valuations in the particular stress scenario; the middle line represents the median; and the bottom of the box represents the 25th percentile. B.p. = basis point.
Source: Staff calculations from FR Y-14 data.
10 Report to the Congress on the Effect of Capital Rules on Mortgage Servicing Assets
prepayments, as competitors may vie for the same
business.
A firm may also choose to actively hedge its MSA
portfolio against prepayment risk to protect against
adverse changes in market values and to minimize
earnings volatility. Active hedging strategies vary
depending on the sophistication of the servicer but
typically include the use of derivative instruments
(e.g., mortgage “to-be-announced” securities, swap-
tions, and futures), though no financial instrument
acts as a perfect hedge to changes in MSA values.
Moreover, an active hedging strategy has its own set
of challenges. It requires a specialized skill set, ana-
lytical tools, and regulatory and economic capital to
use certain hedging instruments,22 the latter of which
could become more expensive during a market freeze
or when liquidity is not available.23 An active hedging
strategy can be difficult to implement successfully,
given that MSAs are not traded in an observable
market.24 Moreover, an active hedging strategy is
economically viable only within a certain interest rate
range, and substantial interest rate movements could
result in a net loss for the firm.25
Some firms choose not to hedge their MSAs.26 Not
actively hedging MSAs can, however, introduce sig-
nificant volatility to earnings, potentially causing
substantial losses.27
Business Risks
Mortgage servicing is governed by regulations and
contracts that can pose significant legal and compli-
ance risks. Various federal and state agencies’ rules
and regulations address mortgage servicing stan-
dards, including consumer protections. In addition,
the GSEs and Ginnie Mae require servicers to com-
ply with guidelines to service loans guaranteed by
those entities, while separate contractual provisions
govern the servicing of loans in private-label MBS.
Mistakes or omissions by servicers can lead to law-
suits, fines, and loss of income. Use of subservicers
or other contractors can compound this risk.28 In
addition, when a servicer does not comply with the
standards established by the GSEs or Ginnie Mae,
these entities can confiscate the servicing, forcing the
servicer to charge off the value of the MSA.
Moreover, negative publicity can lead to reputational
harm, which can have adverse effects on other lines
of business and on a firm’s MSA portfolio itself.
Potential borrowers may be less likely to originate a
loan with a firm that has had servicing issues, and in
some instances reputational harm may have led some
banking institutions to leave or divest from their
mortgage servicing activities.29
22 Alternative Mortgage Servicing, 10.23 Karan Kaul and Laurie Goodman, “Nonbank Servicer Regula-
tion: New Capital and Liquidity Requirements Don’t Offer Enough Loss Protection,” Urban Institute, February 2016, 6, www.urban.org/sites/default/files/alfresco/publication-pdfs/2000633-Nonbank-Servicer-Regulation-New-Capital-and-Liquidity-Requirements-Don't-Offer-Enough-Loss-Protection.pdf.
24 Mortgage Bankers Association and PricewaterhouseCoopers, “The Changing Dynamics of the Mortgage Servicing Land-scape,” June 2015, 7, www.mba.org/Documents/Policy/MBA_PWC_Servicing_White_Paper.pdf.
25 Kaul and Goodman, Nonbank Servicer Regulation, 4-5.26 Kroll, Non-Bank Mortgage Companies Suffer, 3.
27 Ibid.28 Office of the Comptroller of the Currency, “Third-Party Rela-
tionships: Risk Management Guidance,” October 30, 2013, www.occ.gov/news-issuances/bulletins/2013/bulletin-2013-29.html.
29 Pamela Lee, “Nonbank Specialty Servicers: What’s the Big Deal?” Urban Institute, August 4, 2014, 3, www.urban.org/sites/default/files/alfresco/publication-pdfs/413198-Nonbank-Specialty-Servicers-What-s-the-Big-Deal-.PDF.
June 2016 11


Role of Mortgage Servicing Assets in Bank Failures
Of the 518 banking institutions that failed between
2007 and year-end 2015, 66 had MSAs on their
books at the date of failure.30 In statutorily man-
dated MLRs of failures of insured depository insti-
tutions, problems with MSAs were described as a sig-
nificant factor leading to the failure of one institu-
tion and as contributing to the failures of three
others. A broader review of financial data reported
by failed banks, and indirect evidence from FDIC
receiverships, suggests that problems with MSAs
were likely among the issues that other failed institu-
tions were facing.
Financial Data Reported by Failed Insured Depository Institutions
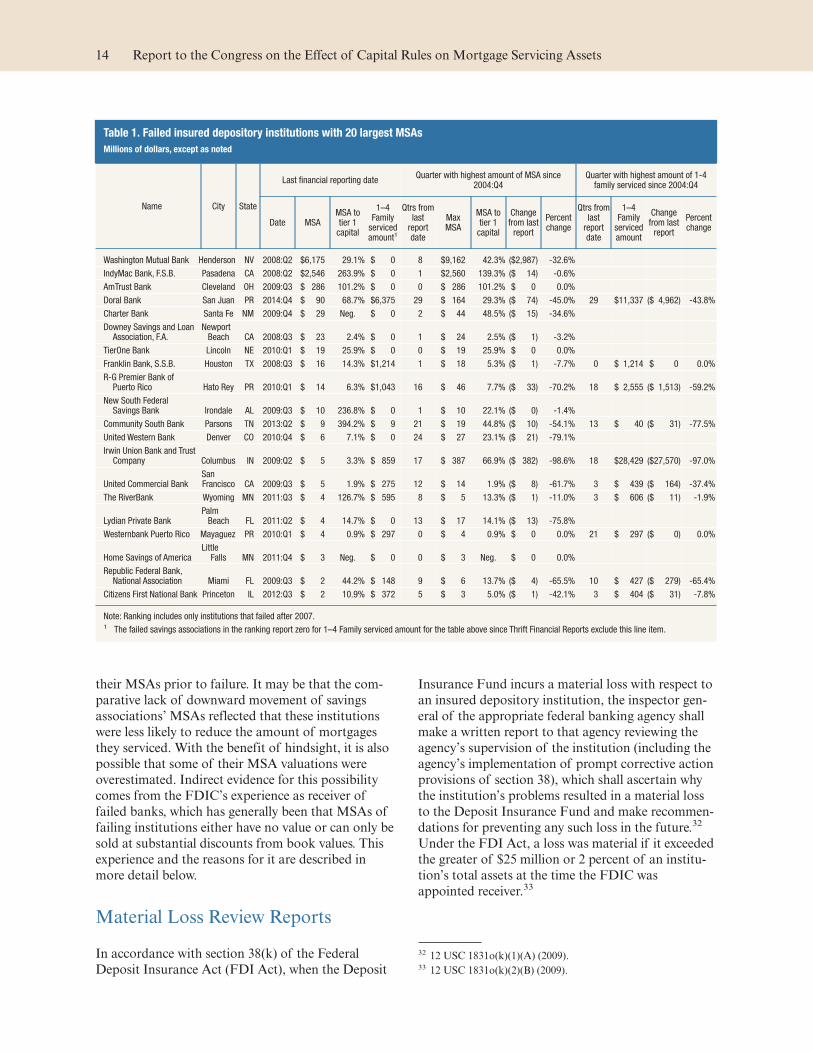
Information about the 20 failed insured depository
institutions that had the largest MSA holdings as of
the date of their last financial statement is presented
in table 1. A number of these institutions reported
significant reductions in the values of their MSAs
during the quarters (in some cases years) leading up
to their failure. As a percentage of peak MSA values
recorded after 2004 but before failure, there were sub-
sequent material reductions in the value of MSAs
ranging from 33 to 99 percent in 11 of the 20 failed
institutions.
A difficulty in evaluating the reasons for these trends
is that while banks reported the amount of one- to
four-family mortgages serviced for others, compa-
rable and comprehensive data for savings associa-
tions are not readily available. Accordingly, table 1
shows this information for the banks and leaves it
omitted for the savings associations. Six of the 10
banks materially reduced the volume of mortgages
they serviced for others in the period before they
failed. Reductions in MSA values for the banks were
mostly commensurate with reductions in the volume
of serviced mortgages in the years and quarters
before failure, although for a few banks the MSA
value reductions were proportionally more than the
reductions in the volume of serviced mortgages.
Significant reduction in MSA values, volume of ser-
viced mortgages, or both, during the time period
leading to an institution's failure is a strong indicator,
although not a conclusive one, that the institution
experienced losses on its servicing activities. Some of
the failing banks listed in table 1 had relatively high
concentrations of MSAs to regulatory capital. Such
institutions may have attempted to sell their MSA
portfolios to meet a capital or liquidity shortfall.
Data on whether such MSA sales occurred or their
financial impact on the selling institutions is not
readily available. An assessment of the financial
impact of any sales of servicing by these institutions
would require knowledge of the proceeds they
received in comparison to the amount of the MSA
value that was extinguished as a result of the sale, as
well as the nature of any negotiated concessions or
indemnifications that may have been needed to com-
plete sales. Because such negotiated concessions and
indemnifications are often agreed to in connection
with sales of servicing rights, especially when there
are issues or concerns with the underlying mortgages
or about the ongoing creditworthiness of the selling
institution, it may have been difficult for some of the
troubled institutions listed in table 1 to have realized
full value in sales of MSAs. The reasons sellers may
need to make such concessions are described below,
in the section on the FDIC’s receivership experience.
Data on the volume of serviced mortgages for sav-
ings associations were not readily obtainable,31 so it
is not possible to isolate the effects of any MSA valu-
ation changes compared to changes in the volume of
serviced mortgages. That said, savings associations in
table 1 are disproportionally represented among the
institutions that reported little or no deterioration in
30 NCUA had no recent failures with material amounts of MSAs at the time of failure.
31 The 10 savings associations in table 1 can be identified by the blanks occurring in columns specifying the highest amounts of mortgages serviced for a given quarter.
13
their MSAs prior to failure. It may be that the com-
parative lack of downward movement of savings
associations’ MSAs reflected that these institutions
were less likely to reduce the amount of mortgages
they serviced. With the benefit of hindsight, it is also
possible that some of their MSA valuations were
overestimated. Indirect evidence for this possibility
comes from the FDIC’s experience as receiver of
failed banks, which has generally been that MSAs of
failing institutions either have no value or can only be
sold at substantial discounts from book values. This
experience and the reasons for it are described in
more detail below.
Material Loss Review Reports
In accordance with section 38(k) of the Federal
Deposit Insurance Act (FDI Act), when the Deposit
Insurance Fund incurs a material loss with respect to
an insured depository institution, the inspector gen-
eral of the appropriate federal banking agency shall
make a written report to that agency reviewing the
agency’s supervision of the institution (including the
agency’s implementation of prompt corrective action
provisions of section 38), which shall ascertain why
the institution’s problems resulted in a material loss
to the Deposit Insurance Fund and make recommen-
dations for preventing any such loss in the future.32
Under the FDI Act, a loss was material if it exceeded
the greater of $25 million or 2 percent of an institu-
tion’s total assets at the time the FDIC was
appointed receiver.33
32 12 USC 1831o(k)(1)(A) (2009).33 12 USC 1831o(k)(2)(B) (2009).
Table 1. Failed insured depository institutions with 20 largest MSAs
Millions of dollars, except as noted
Name City State
Last financial reporting date Quarter with highest amount of MSA since
2004:Q4 Quarter with highest amount of 1-4
family serviced since 2004:Q4
Date MSA MSA to tier 1
capital
1–4 Family
serviced amount1
Qtrs from last
reportdate
MaxMSA
MSA to tier 1
capital
Change from last
report
Percent change
Qtrs from last
reportdate
1–4 Family
serviced amount
Change from last
report
Percent change
Washington Mutual Bank Henderson NV 2008:Q2 $6,175 29.1% $ 0 8 $9,162 42.3% ($2,987) -32.6%
IndyMac Bank, F.S.B. Pasadena CA 2008:Q2 $2,546 263.9% $ 0 1 $2,560 139.3% ($ 14) -0.6%
AmTrust Bank Cleveland OH 2009:Q3 $ 286 101.2% $ 0 0 $ 286 101.2% $ 0 0.0%
Doral Bank San Juan PR 2014:Q4 $ 90 68.7% $6,375 29 $ 164 29.3% ($ 74) -45.0% 29 $11,337 ($ 4,962) -43.8%
Charter Bank Santa Fe NM 2009:Q4 $ 29 Neg. $ 0 2 $ 44 48.5% ($ 15) -34.6%
Downey Savings and Loan Association, F.A.
Newport Beach CA 2008:Q3 $ 23 2.4% $ 0 1 $ 24 2.5% ($ 1) -3.2%
TierOne Bank Lincoln NE 2010:Q1 $ 19 25.9% $ 0 0 $ 19 25.9% $ 0 0.0%
Franklin Bank, S.S.B. Houston TX 2008:Q3 $ 16 14.3% $1,214 1 $ 18 5.3% ($ 1) -7.7% 0 $ 1,214 $ 0 0.0%
R-G Premier Bank of Puerto Rico Hato Rey PR 2010:Q1 $ 14 6.3% $1,043 16 $ 46 7.7% ($ 33) -70.2% 18 $ 2,555 ($ 1,513) -59.2%
New South Federal Savings Bank Irondale AL 2009:Q3 $ 10 236.8% $ 0 1 $ 10 22.1% ($ 0) -1.4%
Community South Bank Parsons TN 2013:Q2 $ 9 394.2% $ 9 21 $ 19 44.8% ($ 10) -54.1% 13 $ 40 ($ 31) -77.5%
United Western Bank Denver CO 2010:Q4 $ 6 7.1% $ 0 24 $ 27 23.1% ($ 21) -79.1%
Irwin Union Bank and Trust Company Columbus IN 2009:Q2 $ 5 3.3% $ 859 17 $ 387 66.9% ($ 382) -98.6% 18 $28,429 ($27,570) -97.0%
United Commercial BankSan Francisco CA 2009:Q3 $ 5 1.9% $ 275 12 $ 14 1.9% ($ 8) -61.7% 3 $ 439 ($ 164) -37.4%
The RiverBank Wyoming MN 2011:Q3 $ 4 126.7% $ 595 8 $ 5 13.3% ($ 1) -11.0% 3 $ 606 ($ 11) -1.9%
Lydian Private BankPalm
Beach FL 2011:Q2 $ 4 14.7% $ 0 13 $ 17 14.1% ($ 13) -75.8%
Westernbank Puerto Rico Mayaguez PR 2010:Q1 $ 4 0.9% $ 297 0 $ 4 0.9% $ 0 0.0% 21 $ 297 ($ 0) 0.0%
Home Savings of AmericaLittle
Falls MN 2011:Q4 $ 3 Neg. $ 0 0 $ 3 Neg. $ 0 0.0%
Republic Federal Bank, National Association Miami FL 2009:Q3 $ 2 44.2% $ 148 9 $ 6 13.7% ($ 4) -65.5% 10 $ 427 ($ 279) -65.4%
Citizens First National Bank Princeton IL 2012:Q3 $ 2 10.9% $ 372 5 $ 3 5.0% ($ 1) -42.1% 3 $ 404 ($ 31) -7.8%
Note: Ranking includes only institutions that failed after 2007.1 The failed savings associations in the ranking report zero for 1–4 Family serviced amount for the table above since Thrift Financial Reports exclude this line item.
14 Report to the Congress on the Effect of Capital Rules on Mortgage Servicing Assets

The Dodd-Frank Wall Street Reform and Consumer
Protection Act (Dodd-Frank Act) amended sec-
tion 38(k) of the FDI Act by increasing the MLR
threshold from $25 million to $200 million for losses
that occur for the period January 1, 2010, through
December 31, 2011, to $150 million from January 1,
2012, through December 31, 2013, and to $50 million
for losses on or after January 1, 2014.34
A review of the MLRs found several instances in
which a bank’s mortgage servicing activities were a
contributing factor in the bank’s failure:
• The bank failed, in part, because of its aggressive
growth strategy in MSAs and insufficient capital
relative to the risk level of its servicing portfolio, as
well as inadequate controls to develop and execute
MSA hedging strategies. The deterioration of the
bank’s servicing portfolio resulted in significant
losses, which diminished earnings and capital and,
ultimately, led to the bank’s failure.35
• The bank’s servicing activities contributed to vola-
tility in earnings and capital levels. The bank ulti-
mately recorded an impairment charge related to
its MSAs, as the asset’s fair value was lower than
its amortized cost.36
• The bank did not follow supervisory recommenda-
tions to implement controls for its servicing activi-
ties, including developing an understanding of the
MSA market and MSA hedging. The bank ulti-
mately incurred net losses in its servicing activities
and subsequently sold its MSAs to reduce future
earnings volatility.37
• The bank did not hedge effectively the market risk
associated with its MSAs, which decreased the
bank’s net income. The bank ultimately sold its
MSA portfolio, resulting in net losses.38
FDIC’s Experience with MSAs in Its Capacity as the Receiver of Failed Banks
The FDIC’s process of disposing of MSAs from
failed or failing institutions can be complicated by
various factors that erode the value of MSAs. Spe-
cifically, a buyer’s uncertainties about exposure to
contingent recourse liability for a selling bank’s origi-
nation and servicing defects can materially impair the
marketability of MSAs, making it difficult for a
receiver to sell MSAs at a price that is consistent with
its book value.
As noted, investors (i.e., the owners of the mortgage
loans) have consent rights to servicing sales and
transfers. As a condition to providing the consent,
investors have historically required that the buyer of
the MSAs assume direct recourse liability for origina-
tion and servicing defects, regardless of whether that
buyer, as the new servicer, originated the loan or
caused the servicing defect. The buyer is typically
protected from incurring losses as a result of its
assumption of the seller’s recourse liability by an
indemnification provided by the seller. This structure,
however, creates counterparty risk as the value of the
MSAs is, in part, dependent on the value of the
indemnification that the seller provides to the buyer
and on the perceived quality of the seller’s underwrit-
ing, origination, and servicing. As a result, a failing
bank could have difficulty in realizing the value of its
MSAs in a market sale if a buyer views the failing
bank as not creditworthy or questions the quality of
the origination, underwriting, or servicing of the
failed bank.
In connection with the resolution of failed banks, the
FDIC’s recovery of value from MSAs has been nega-
tively affected by two main factors. First, the contin-
gent recourse liability impairs the value of MSAs.
Second, most of the failed banks had very small
MSA portfolios and the relatively fixed transaction
costs associated with a sale frequently exceeded the
value of these MSAs.
The FDIC determines and executes the resolution
strategy that maximizes the value of each pool of
MSAs at a failed bank. Prior to August 2010, most
MSA pool acquisitions were done through whole-
bank purchase and assumption transactions. In such
transactions, the acquiring bank submits a single bid
34 Pub. L. No. 111-203, 124 Stat. 1376 (2010); 12 USC 1831o(k)(2)(B).
35 U.S. Department of the Treasury, Failed Bank Review of Ameri-can National Bank, OIG-11-016 (Washington, DC: 2010), www.treasury.gov/about/organizational-structure/ig/Documents/OIG11016%20(Failed%20Bank%20LR%20-%20American%20National%20Bank).pdf.
36 U.S. Department of the Treasury, Material Loss Review of Charter Bank, OIG-11-072 (Washington, DC: 2011) www.treasury.gov/about/organizational-structure/ig/Documents/OIG11072(Charter%20MLR).pdf.
37 U.S. Department of the Treasury, Material Loss Review of Downey Savings and Loan, FA, OIG-09-039 (Washington, DC, 2009), www.treasury.gov/about/organizational-structure/ig/Documents/OIG09039.pdf.
38 Board of Governors of the Federal Reserve System, Material Loss Review of Irwin Union Bank and Trust (Washington, DC:
2010), http://oig.federalreserve.gov/reports/Irwin_UBT_final_report_4_29_10.pdf.
June 2016 15
to the FDIC for all the assets of the failed bank. As a
result, asset-level purchase prices are not provided by
the acquiring bank in a whole-bank purchase and
assumption transaction. During this time, MSAs
from four failed banks were sold outside the pur-
chase and assumption transaction, and it became
clear that the purchase and assumption bidders were
increasingly disinterested in acquiring the MSAs
along with the failed bank’s recourse liabilities.
As a result, in August 2010, the FDIC changed its
practice and began marketing the assets and liabili-
ties of a failed bank without the MSAs. Since that
time, MSAs have been evaluated to determine
whether the FDIC can recover value from a separate
sale of the MSAs. In doing so, the FDIC considers
both the transaction costs and either (1) the amount
charged by the investor for a release of the FDIC and
the buyer from all of the recourse liability related to
the failed bank’s actions, or (2) the amount the
FDIC would expect to spend if it provided an indem-
nification for all losses incurred by the buyer result-
ing from its assumption of the failed bank’s recourse
liability.
If the FDIC determines that an MSA pool likely has
no net value in a market sale transaction, it will sur-
render the MSAs to the investor.39 Of the 32 banks
that had MSAs and failed after August 2010, only
one bank had MSA pools with net value to the FDIC
in an MSA sale.
If the FDIC determines that it can likely recover
value from a pool of MSAs, it pursues a competitive
market sale transaction. Since 2008, the FDIC has
sold one or more MSA pools from each of five failed
banks. Data on these sales are available on the
FDIC’s website.40 These data reflect that the aggre-
gate gross proceeds from these sales was 29 percent of
the book value of the MSAs (as reported by the
failed bank prior to failure). The size of this discount
is indirect evidence that the value of some MSA
pools was overestimated by some banks. Even this
substantial discount from book value overstates the
value recovered by the FDIC. The FDIC’s gross pro-
ceeds were reduced by transaction costs and either
the cost to obtain a release from the failed bank’s
recourse liabilities or the out-of-pocket amounts paid
by the FDIC in accordance with its indemnification
obligations to the buyer. As noted, open banks
attempting to sell MSAs, especially open banks in a
troubled condition, may face similar issues of need-
ing to indemnify or otherwise compensate MSA buy-
ers or investors for recourse liabilities, and this may
detract from their ability to realize the full book value
when selling MSAs.
39 In many of those cases, the mortgage loan sale and servicing agreements were repudiated. However, if the investor was a secured creditor holding collateral to secure the recourse liabili-ties or owed the FDIC reimbursement of advances and had a contractual right to offset such amounts against the failed
bank’s recourse liability, the FDIC typically negotiated a settle-ment with the investor in order to maximize the recovery of the collateral or the advance receivables.
40 FDIC MSA sales can be located at www.fdic.gov/buying/historical/mortgage_servicing_assets.html.
16 Report to the Congress on the Effect of Capital Rules on Mortgage Servicing Assets
Regulatory Approaches for Mortgage Servicing Assets
The federal banking agencies have established mini-
mum regulatory capital requirements to ensure that
banking institutions have a capital base that allows
them to operate in a safe and sound manner as credit
intermediaries in the economy. Well-capitalized bank-
ing institutions contribute to the stability of the
financial system by operating as credit intermediaries
even during adverse financial conditions.
In 2013, the federal banking agencies issued a revised
capital rule for banking institutions that, among
other things, strengthened the eligibility criteria for
regulatory capital to ensure it is able to absorb
losses.41 In addition, the regulatory capital frame-
work has long limited the inclusion in capital of cer-
tain assets (e.g., intangible assets and certain deferred
tax assets) that have values that may be difficult to
realize or may not be realizable at all under adverse
financial conditions.
Mortgage loan servicing can be an appropriate activ-
ity for banking institutions when conducted in a safe
and sound manner with appropriate operational con-
trols and risk-management processes. As described
earlier in this report, however, MSAs pose certain
risks. Accordingly, the federal banking agencies have
limited the inclusion of MSAs in regulatory capital
for many years to address the high level of uncer-
tainty regarding the ability of banking institutions to
realize value from MSAs, especially under adverse
financial conditions. Other precedent exists for a cau-
tious approach to the financial statement recognition
of MSAs. Prior to 1996, GAAP did not allow firms
that originated and sold mortgages, while retaining
the servicing, to recognize an MSA for those serviced
mortgages. Limiting the amount of MSAs in regula-
tory capital mitigates the risk that market value fluc-
tuations of these assets will adversely affect banking
institutions’ regulatory capital bases and undermine
their safety and soundness. Moreover, the FDIC, as
receiver of failed institutions, has found MSAs of
troubled or failed institutions to be generally unmar-
ketable at book value during periods of market
volatility.
The federal banking agencies use two primary
approaches in their capital framework to address the
risks of MSAs: (1) requiring deduction from regula-
tory capital of amounts of MSAs above certain
thresholds, and (2) applying risk weights to MSAs
that are not deducted from regulatory capital.
Under the federal banking agencies’ previous regula-
tory capital framework, MSAs (combined with non-
MSAs and purchased credit card relationships) were
limited to 100 percent of tier 1 capital (net of good-
will, other intangibles, and other disallowed assets),
and the amount of an MSA that a banking institu-
tion was able to include in regulatory capital was the
lesser of 90 percent of the MSA’s fair value or
100 percent of the MSA’s carrying amount.42
Amounts not deducted from tier 1 capital received a
100 percent risk weight.43
The limitation of MSAs to 90 percent of their fair
value under the previous regulatory capital frame-
work could result in an effective risk weight of up to
215 percent for MSAs to the extent that a banking
institution either (1) used the fair value measurement
method to determine the carrying amount of the
MSAs or (2) used the amortization method and took
an impairment on the MSAs to bring the carrying
amount down to fair value.44 This effective risk
41 NCUA issued a revised regulatory capital framework in 2015 that will apply in 2019.
42 See, for example, 12 CFR part 225, appendix A, section II.B.1 (Federal Reserve) and 12 CFR 325.5(f) (FDIC).
43 See, for example, 12 CFR part 225, appendix A, section III.C.4 (Federal Reserve) and 12 CFR part 325, appendix A, section III.C.4 (FDIC).
44 A banking institution will initially record the amount of the MSA at fair value and then subsequently measure the MSA under either the amortization method or the fair value measure-ment method. Under the amortization method, the MSA is to be amortized in proportion to, and over the period of, estimated net servicing income for assets (servicing revenues in excess of servicing costs). The MSA is to be assessed for impairment or increased obligation based on fair value at each quarter-end report date. Under the fair value measurement method, MSAs
17

weight is because a deduction or haircut approach
(e.g., the 90 percent fair value haircut under the pre-
vious regulatory capital framework) is broadly
equivalent to a 1,250 percent risk weight, assuming
an 8 percent regulatory capital level. Specifically, for
$100 of MSAs, applying a 1,250 percent risk weight
to $10 (i.e., $125 in risk-weighted assets) and a
100 percent risk weight to the remaining $90 (i.e., $90
in risk-weighted assets) could result in an effective
risk weight for the $100 of MSAs of 215 percent (i.e.,
$215 in risk-weighted assets).
After considering certain lessons learned during the
2008 financial crisis, the revised capital rule estab-
lished standards to improve the quality and increase
the quantity of regulatory capital. For instance, the
treatment of MSAs became stricter under the revised
capital rule reflecting the high level of uncertainty
regarding the ability of firms to realize value from
these assets.
In developing the current regulatory approach to
MSAs, the federal banking agencies considered
diverse perspectives on MSAs, and took steps to
ensure that the approach was adequately informed in
all significant respects. In this regard, the federal
banking agencies took into consideration MSA-
related statutory requirements, conducted impact and
regulatory burden analyses for the revised capital
rule, and considered issues raised through the public
comment process prior to finalizing the current regu-
latory approach to MSAs. In particular, the federal
banking agencies evaluated a range of appropriate
treatments during the rulemaking process, including
fully deducting MSAs from regulatory capital,
deducting MSAs above a certain threshold (or
thresholds) and risk weighting the amount not
deducted at 250 percent, and risk weighting all MSAs
at a level substantially higher than 100 percent (for
example, 250 percent). The agencies ultimately
decided on and continue to support the approach of
deducting MSAs in excess of certain thresholds and
risk weighting the MSAs that are not deducted. In
contrast, the revised capital rule requires a full deduc-
tion from capital of all other intangible assets.
Specifically, under the revised capital rule any
amount of MSAs above 10 percent of a firm’s CET1
capital must be deducted from CET1 capital.45 In
addition, any amount of MSAs, certain deferred tax
assets arising from temporary differences, and signifi-
cant investments in the capital of unconsolidated
financial institutions in the form of common stock
(collectively, “threshold items”) above 15 percent of a
firm’s CET1 capital must also be deducted from
CET1 capital.46 Starting January 1, 2018, any
amount of the threshold items that is not deducted
from CET1 capital will be risk weighted at
250 percent.47
NCUA’s previous capital requirements applied a
100 percent risk weight to MSAs. Under NCUA’s
revised capital framework (issued in 2015), MSAs
will receive a 250 percent risk weight, starting Janu-
ary 1, 2019.48 Federally insured credit unions are not
required to deduct any amount of MSAs from regu-
latory capital. Since 1998, federally insured credit
unions have been prohibited from purchasing
MSAs.49
are measured at fair value at each reporting date and changes are reported in fair value in earnings in the period in which the changes occurred. A banking institution can elect to use either measurement method for different classes of MSAs within the banking institution’s portfolio, but the same measurement method must apply to each MSA in a class of MSAs.
45 12 CFR 3.22(d)(1) (OCC), 12 CFR 217.22(d)(1) (Federal Reserve), 12 CFR 324.22(d)(1) (FDIC).
46 12 CFR 3.22(d)(2) (OCC), 12 CFR 217.22(d)(2) (Federal Reserve), 12 CFR 324.22(d)(2) (FDIC).
47 Ibid. As discussed elsewhere in this report, the federal banking agencies determined that, based on the conservative treatment of MSAs under the revised capital rule, statutory factors were consistent with a determination that the 90 percent of fair value limitation could be removed.
48 In establishing the MSA capital requirements for credit unions that goes into effect in 2019, NCUA relied upon the analysis published by the federal banking agencies, conducted its own impact analysis, and considered issues raised during the com-ment period prior to finalizing the regulation.
49 NCUA instituted the prohibition on the purchase of MSAs in 1998 after the National Credit Union Share Insurance Fund was exposed to significant losses related to purchased mortgage servicing operations obtained by a federally insured credit union. 12 CFR 703.16(a).
18 Report to the Congress on the Effect of Capital Rules on Mortgage Servicing Assets
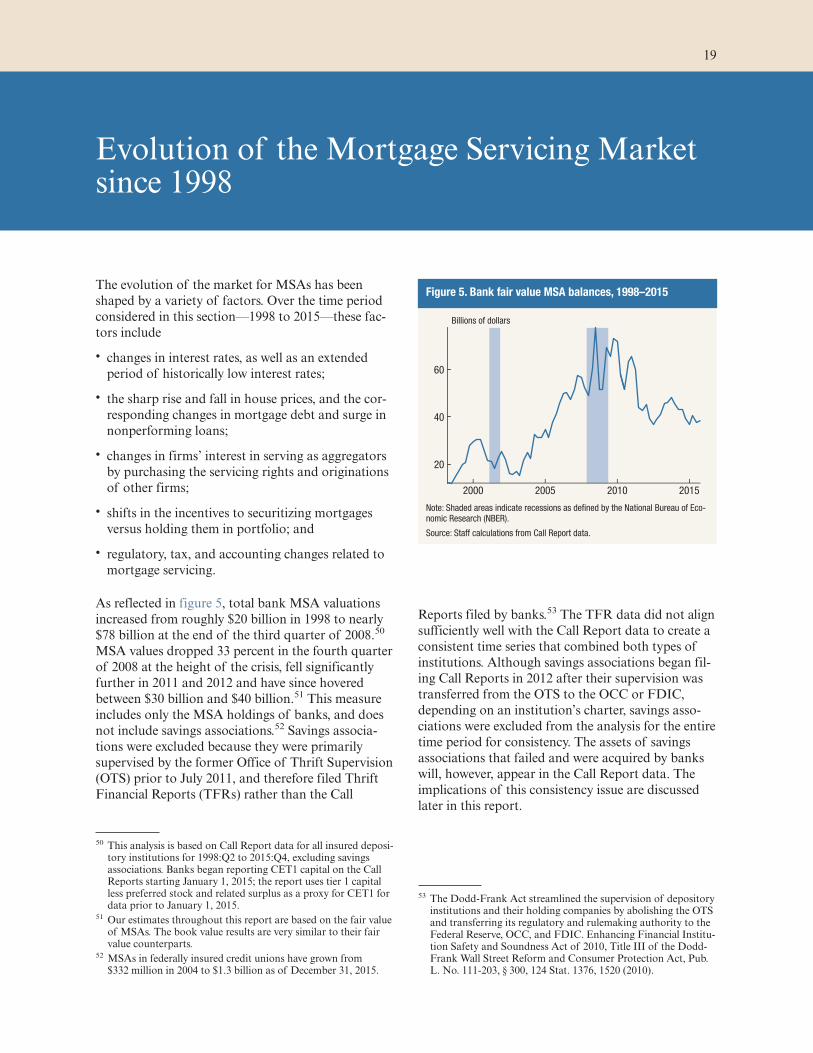
Evolution of the Mortgage Servicing Market since 1998
The evolution of the market for MSAs has been
shaped by a variety of factors. Over the time period
considered in this section—1998 to 2015—these fac-
tors include
• changes in interest rates, as well as an extended
period of historically low interest rates;
• the sharp rise and fall in house prices, and the cor-
responding changes in mortgage debt and surge in
nonperforming loans;
• changes in firms’ interest in serving as aggregators
by purchasing the servicing rights and originations
of other firms;
• shifts in the incentives to securitizing mortgages
versus holding them in portfolio; and
• regulatory, tax, and accounting changes related to
mortgage servicing.
As reflected in figure 5, total bank MSA valuations
increased from roughly $20 billion in 1998 to nearly
$78 billion at the end of the third quarter of 2008.50
MSA values dropped 33 percent in the fourth quarter
of 2008 at the height of the crisis, fell significantly
further in 2011 and 2012 and have since hovered
between $30 billion and $40 billion.51 This measure
includes only the MSA holdings of banks, and does
not include savings associations.52 Savings associa-
tions were excluded because they were primarily
supervised by the former Office of Thrift Supervision
(OTS) prior to July 2011, and therefore filed Thrift
Financial Reports (TFRs) rather than the Call
Reports filed by banks.53 The TFR data did not align
sufficiently well with the Call Report data to create a
consistent time series that combined both types of
institutions. Although savings associations began fil-
ing Call Reports in 2012 after their supervision was
transferred from the OTS to the OCC or FDIC,
depending on an institution’s charter, savings asso-
ciations were excluded from the analysis for the entire
time period for consistency. The assets of savings
associations that failed and were acquired by banks
will, however, appear in the Call Report data. The
implications of this consistency issue are discussed
later in this report.
50 This analysis is based on Call Report data for all insured deposi-tory institutions for 1998:Q2 to 2015:Q4, excluding savings associations. Banks began reporting CET1 capital on the Call Reports starting January 1, 2015; the report uses tier 1 capital less preferred stock and related surplus as a proxy for CET1 for data prior to January 1, 2015.
51 Our estimates throughout this report are based on the fair value of MSAs. The book value results are very similar to their fair value counterparts.
52 MSAs in federally insured credit unions have grown from $332 million in 2004 to $1.3 billion as of December 31, 2015.
53 The Dodd-Frank Act streamlined the supervision of depository institutions and their holding companies by abolishing the OTS and transferring its regulatory and rulemaking authority to the Federal Reserve, OCC, and FDIC. Enhancing Financial Institu-tion Safety and Soundness Act of 2010, Title III of the Dodd-Frank Wall Street Reform and Consumer Protection Act, Pub. L. No. 111-203, § 300, 124 Stat. 1376, 1520 (2010).
Figure 5. Bank fair value MSA balances, 1998–2015
2000 2005 2010 2015
20
40
60
Billions of dollars
Note: Shaded areas indicate recessions as defined by the National Bureau of Eco-nomic Research (NBER).
Source: Staff calculations from Call Report data.
19
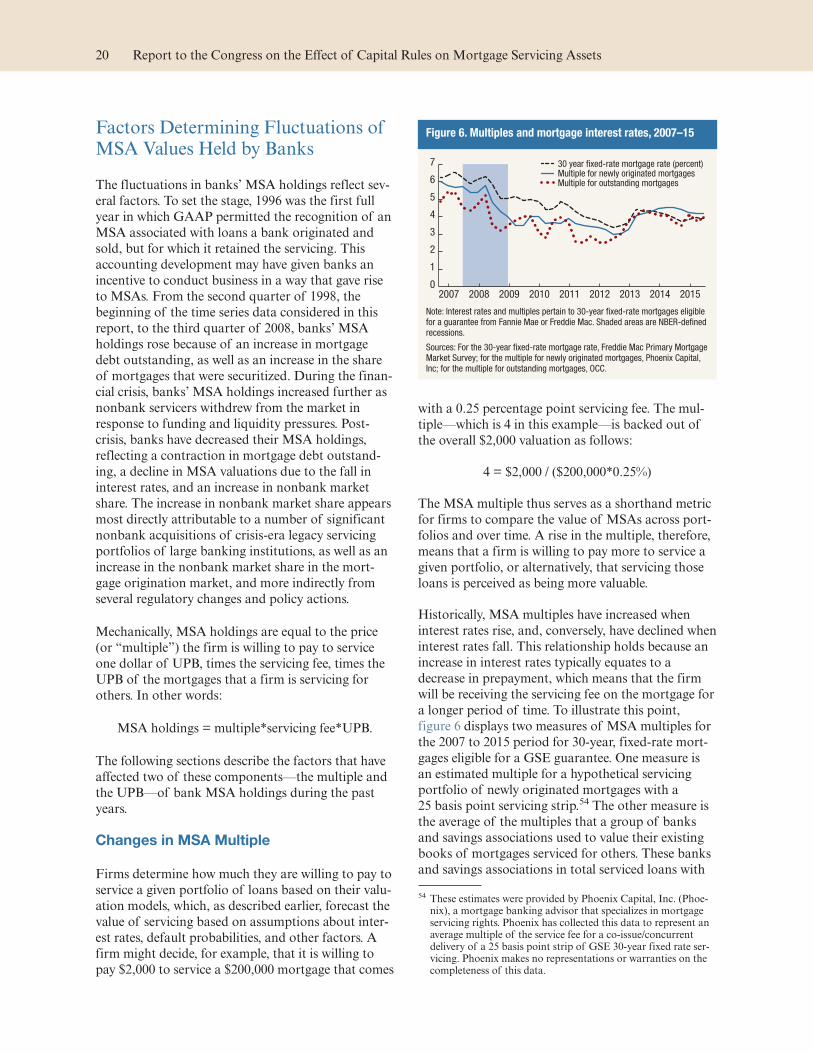
Factors Determining Fluctuations of MSA Values Held by Banks
The fluctuations in banks’ MSA holdings reflect sev-
eral factors. To set the stage, 1996 was the first full
year in which GAAP permitted the recognition of an
MSA associated with loans a bank originated and
sold, but for which it retained the servicing. This
accounting development may have given banks an
incentive to conduct business in a way that gave rise
to MSAs. From the second quarter of 1998, the
beginning of the time series data considered in this
report, to the third quarter of 2008, banks’ MSA
holdings rose because of an increase in mortgage
debt outstanding, as well as an increase in the share
of mortgages that were securitized. During the finan-
cial crisis, banks’ MSA holdings increased further as
nonbank servicers withdrew from the market in
response to funding and liquidity pressures. Post-
crisis, banks have decreased their MSA holdings,
reflecting a contraction in mortgage debt outstand-
ing, a decline in MSA valuations due to the fall in
interest rates, and an increase in nonbank market
share. The increase in nonbank market share appears
most directly attributable to a number of significant
nonbank acquisitions of crisis-era legacy servicing
portfolios of large banking institutions, as well as an
increase in the nonbank market share in the mort-
gage origination market, and more indirectly from
several regulatory changes and policy actions.
Mechanically, MSA holdings are equal to the price
(or “multiple”) the firm is willing to pay to service
one dollar of UPB, times the servicing fee, times the
UPB of the mortgages that a firm is servicing for
others. In other words:
MSA holdings = multiple*servicing fee*UPB.
The following sections describe the factors that have
affected two of these components—the multiple and
the UPB—of bank MSA holdings during the past
years.
Changes in MSA Multiple
Firms determine how much they are willing to pay to
service a given portfolio of loans based on their valu-
ation models, which, as described earlier, forecast the
value of servicing based on assumptions about inter-
est rates, default probabilities, and other factors. A
firm might decide, for example, that it is willing to
pay $2,000 to service a $200,000 mortgage that comes
with a 0.25 percentage point servicing fee. The mul-
tiple—which is 4 in this example—is backed out of
the overall $2,000 valuation as follows:
4 = $2,000 / ($200,000*0.25%)
The MSA multiple thus serves as a shorthand metric
for firms to compare the value of MSAs across port-
folios and over time. A rise in the multiple, therefore,
means that a firm is willing to pay more to service a
given portfolio, or alternatively, that servicing those
loans is perceived as being more valuable.
Historically, MSA multiples have increased when
interest rates rise, and, conversely, have declined when
interest rates fall. This relationship holds because an
increase in interest rates typically equates to a
decrease in prepayment, which means that the firm
will be receiving the servicing fee on the mortgage for
a longer period of time. To illustrate this point,
figure 6 displays two measures of MSA multiples for
the 2007 to 2015 period for 30-year, fixed-rate mort-
gages eligible for a GSE guarantee. One measure is
an estimated multiple for a hypothetical servicing
portfolio of newly originated mortgages with a
25 basis point servicing strip.54 The other measure is
the average of the multiples that a group of banks
and savings associations used to value their existing
books of mortgages serviced for others. These banks
and savings associations in total serviced loans with
54 These estimates were provided by Phoenix Capital, Inc. (Phoe-nix), a mortgage banking advisor that specializes in mortgage servicing rights. Phoenix has collected this data to represent an average multiple of the service fee for a co-issue/concurrent delivery of a 25 basis point strip of GSE 30-year fixed rate ser-vicing. Phoenix makes no representations or warranties on the completeness of this data.
Figure 6. Multiples and mortgage interest rates, 2007–15
30 year �xed-rate mortgage rate (percent)Multiple for newly originated mortgagesMultiple for outstanding mortgages
0
1
2
3
4
5
6
7
2007 2008 2009 2010 2011 2012 2013 2014 2015
Note: Interest rates and multiples pertain to 30-year fixed-rate mortgages eligible for a guarantee from Fannie Mae or Freddie Mac. Shaded areas are NBER-defined recessions.
Sources: For the 30-year fixed-rate mortgage rate, Freddie Mac Primary Mortgage Market Survey; for the multiple for newly originated mortgages, Phoenix Capital, Inc; for the multiple for outstanding mortgages, OCC.
20 Report to the Congress on the Effect of Capital Rules on Mortgage Servicing Assets
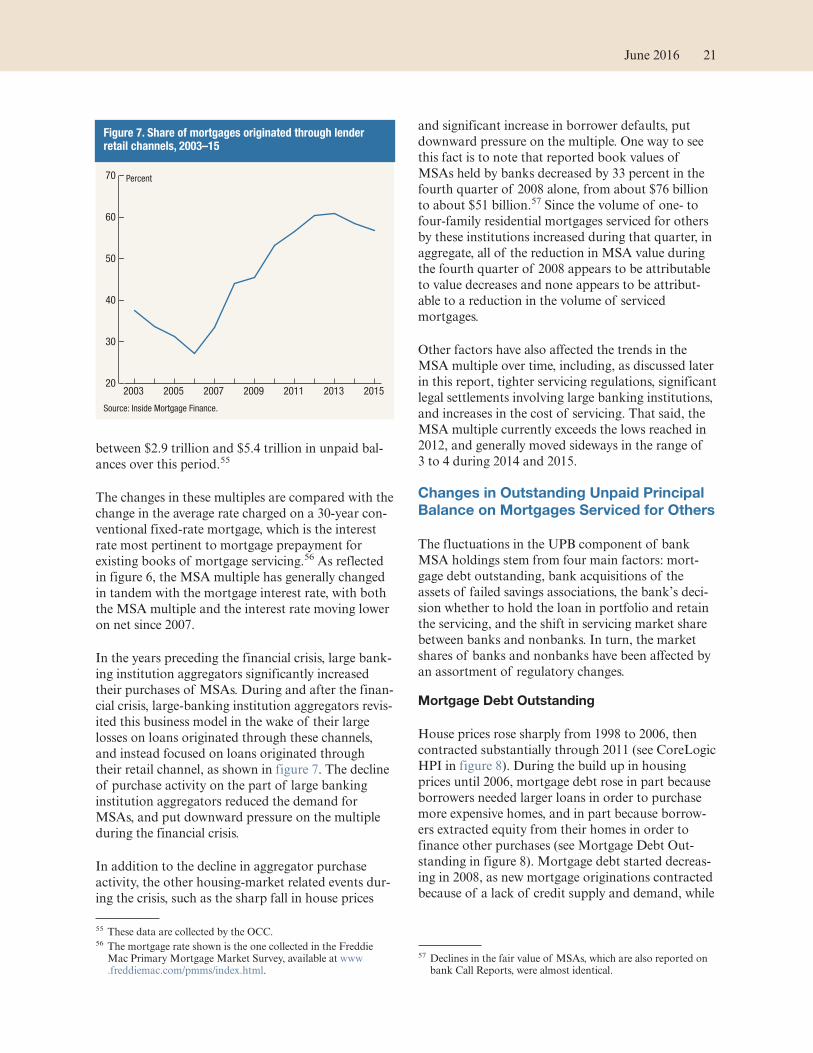
between $2.9 trillion and $5.4 trillion in unpaid bal-
ances over this period.55
The changes in these multiples are compared with the
change in the average rate charged on a 30-year con-
ventional fixed-rate mortgage, which is the interest
rate most pertinent to mortgage prepayment for
existing books of mortgage servicing.56 As reflected
in figure 6, the MSA multiple has generally changed
in tandem with the mortgage interest rate, with both
the MSA multiple and the interest rate moving lower
on net since 2007.
In the years preceding the financial crisis, large bank-
ing institution aggregators significantly increased
their purchases of MSAs. During and after the finan-
cial crisis, large-banking institution aggregators revis-
ited this business model in the wake of their large
losses on loans originated through these channels,
and instead focused on loans originated through
their retail channel, as shown in figure 7. The decline
of purchase activity on the part of large banking
institution aggregators reduced the demand for
MSAs, and put downward pressure on the multiple
during the financial crisis.
In addition to the decline in aggregator purchase
activity, the other housing-market related events dur-
ing the crisis, such as the sharp fall in house prices
and significant increase in borrower defaults, put
downward pressure on the multiple. One way to see
this fact is to note that reported book values of
MSAs held by banks decreased by 33 percent in the
fourth quarter of 2008 alone, from about $76 billion
to about $51 billion.57 Since the volume of one- to
four-family residential mortgages serviced for others
by these institutions increased during that quarter, in
aggregate, all of the reduction in MSA value during
the fourth quarter of 2008 appears to be attributable
to value decreases and none appears to be attribut-
able to a reduction in the volume of serviced
mortgages.
Other factors have also affected the trends in the
MSA multiple over time, including, as discussed later
in this report, tighter servicing regulations, significant
legal settlements involving large banking institutions,
and increases in the cost of servicing. That said, the
MSA multiple currently exceeds the lows reached in
2012, and generally moved sideways in the range of
3 to 4 during 2014 and 2015.
Changes in Outstanding Unpaid Principal
Balance on Mortgages Serviced for Others
The fluctuations in the UPB component of bank
MSA holdings stem from four main factors: mort-
gage debt outstanding, bank acquisitions of the
assets of failed savings associations, the bank’s deci-
sion whether to hold the loan in portfolio and retain
the servicing, and the shift in servicing market share
between banks and nonbanks. In turn, the market
shares of banks and nonbanks have been affected by
an assortment of regulatory changes.
Mortgage Debt Outstanding
House prices rose sharply from 1998 to 2006, then
contracted substantially through 2011 (see CoreLogic
HPI in figure 8). During the build up in housing
prices until 2006, mortgage debt rose in part because
borrowers needed larger loans in order to purchase
more expensive homes, and in part because borrow-
ers extracted equity from their homes in order to
finance other purchases (see Mortgage Debt Out-
standing in figure 8). Mortgage debt started decreas-
ing in 2008, as new mortgage originations contracted
because of a lack of credit supply and demand, while
55 These data are collected by the OCC.56 The mortgage rate shown is the one collected in the Freddie
Mac Primary Mortgage Market Survey, available at www.freddiemac.com/pmms/index.html.
57 Declines in the fair value of MSAs, which are also reported on bank Call Reports, were almost identical.
Figure 7. Share of mortgages originated through lender retail channels, 2003–15
20
30
40
50
60
70
2015201320112009200720052003
Percent
Source: Inside Mortgage Finance.
June 2016 21
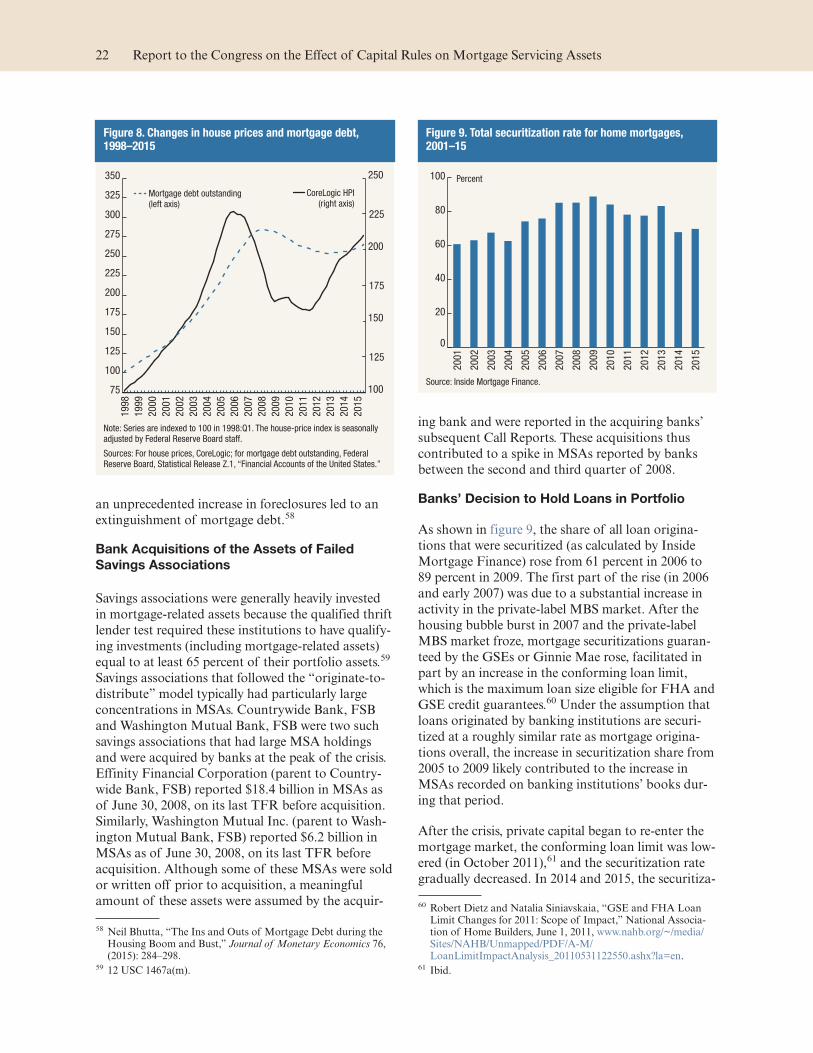
an unprecedented increase in foreclosures led to an
extinguishment of mortgage debt.58
Bank Acquisitions of the Assets of Failed
Savings Associations
Savings associations were generally heavily invested
in mortgage-related assets because the qualified thrift
lender test required these institutions to have qualify-
ing investments (including mortgage-related assets)
equal to at least 65 percent of their portfolio assets.59
Savings associations that followed the “originate-to-
distribute” model typically had particularly large
concentrations in MSAs. Countrywide Bank, FSB
and Washington Mutual Bank, FSB were two such
savings associations that had large MSA holdings
and were acquired by banks at the peak of the crisis.
Effinity Financial Corporation (parent to Country-
wide Bank, FSB) reported $18.4 billion in MSAs as
of June 30, 2008, on its last TFR before acquisition.
Similarly, Washington Mutual Inc. (parent to Wash-
ington Mutual Bank, FSB) reported $6.2 billion in
MSAs as of June 30, 2008, on its last TFR before
acquisition. Although some of these MSAs were sold
or written off prior to acquisition, a meaningful
amount of these assets were assumed by the acquir-
ing bank and were reported in the acquiring banks’
subsequent Call Reports. These acquisitions thus
contributed to a spike in MSAs reported by banks
between the second and third quarter of 2008.
Banks’ Decision to Hold Loans in Portfolio
As shown in figure 9, the share of all loan origina-
tions that were securitized (as calculated by Inside
Mortgage Finance) rose from 61 percent in 2006 to
89 percent in 2009. The first part of the rise (in 2006
and early 2007) was due to a substantial increase in
activity in the private-label MBS market. After the
housing bubble burst in 2007 and the private-label
MBS market froze, mortgage securitizations guaran-
teed by the GSEs or Ginnie Mae rose, facilitated in
part by an increase in the conforming loan limit,
which is the maximum loan size eligible for FHA and
GSE credit guarantees.60 Under the assumption that
loans originated by banking institutions are securi-
tized at a roughly similar rate as mortgage origina-
tions overall, the increase in securitization share from
2005 to 2009 likely contributed to the increase in
MSAs recorded on banking institutions’ books dur-
ing that period.
After the crisis, private capital began to re-enter the
mortgage market, the conforming loan limit was low-
ered (in October 2011),61 and the securitization rate
gradually decreased. In 2014 and 2015, the securitiza-
58 Neil Bhutta, “The Ins and Outs of Mortgage Debt during the Housing Boom and Bust,” Journal of Monetary Economics 76, (2015): 284–298.
59 12 USC 1467a(m).
60 Robert Dietz and Natalia Siniavskaia, “GSE and FHA Loan Limit Changes for 2011: Scope of Impact,” National Associa-tion of Home Builders, June 1, 2011, www.nahb.org/~/media/Sites/NAHB/Unmapped/PDF/A-M/LoanLimitImpactAnalysis_20110531122550.ashx?la=en.
61 Ibid.
Figure 8. Changes in house prices and mortgage debt, 1998–2015
100
125
150
175
200
225
250
CoreLogic HPI(right axis)
2015
2014
2013
2012
2011
2010
2009
2008
2007
2006
2005
2004
2003
2002
2001
2000
1999
1998
75
100
125
150
175
200
225
250
275
300
325
350
Mortgage debt outstanding(left axis)
Note: Series are indexed to 100 in 1998:Q1. The house-price index is seasonally adjusted by Federal Reserve Board staff.
Sources: For house prices, CoreLogic; for mortgage debt outstanding, Federal Reserve Board, Statistical Release Z.1, “Financial Accounts of the United States.”
Figure 9. Total securitization rate for home mortgages, 2001–15
0
20
40
60
80
100
20
15
20
14
20
13
20
12
20
11
20
10
20
09
20
08
20
07
20
06
20
05
20
04
20
03
20
02
20
01
Percent
Source: Inside Mortgage Finance.
22 Report to the Congress on the Effect of Capital Rules on Mortgage Servicing Assets
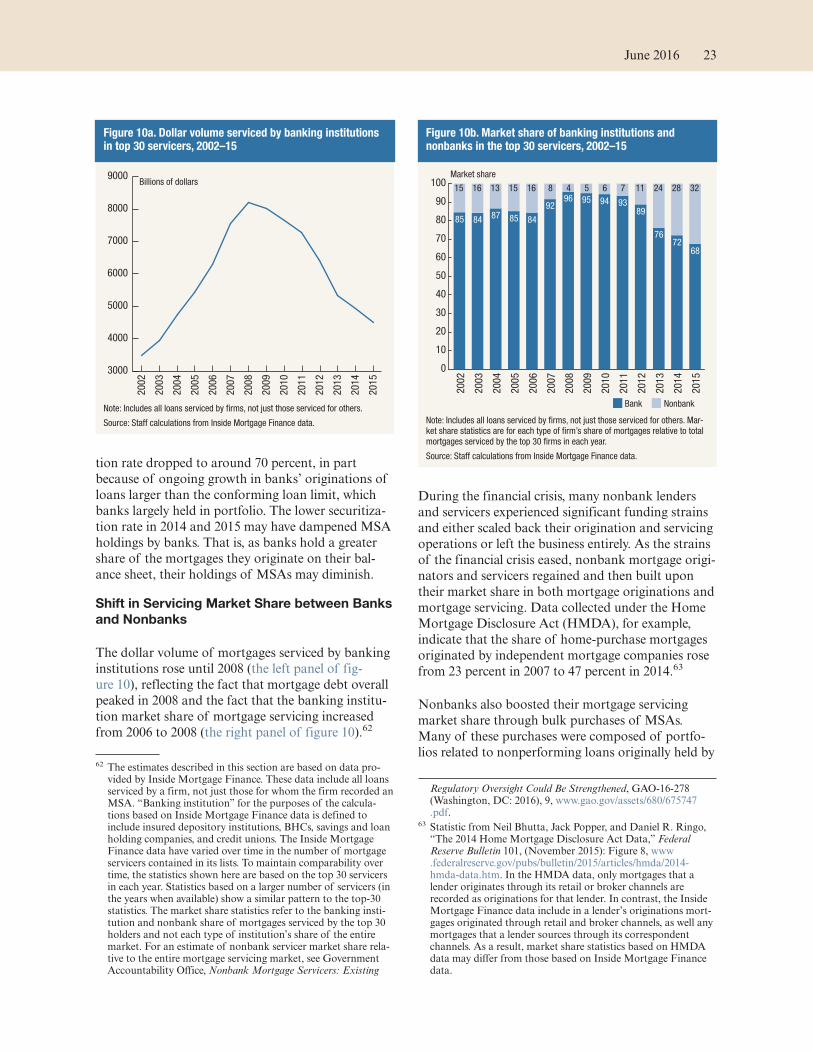
tion rate dropped to around 70 percent, in part
because of ongoing growth in banks’ originations of
loans larger than the conforming loan limit, which
banks largely held in portfolio. The lower securitiza-
tion rate in 2014 and 2015 may have dampened MSA
holdings by banks. That is, as banks hold a greater
share of the mortgages they originate on their bal-
ance sheet, their holdings of MSAs may diminish.
Shift in Servicing Market Share between Banks
and Nonbanks
The dollar volume of mortgages serviced by banking
institutions rose until 2008 (the left panel of fig-
ure 10), reflecting the fact that mortgage debt overall
peaked in 2008 and the fact that the banking institu-
tion market share of mortgage servicing increased
from 2006 to 2008 (the right panel of figure 10).62
During the financial crisis, many nonbank lenders
and servicers experienced significant funding strains
and either scaled back their origination and servicing
operations or left the business entirely. As the strains
of the financial crisis eased, nonbank mortgage origi-
nators and servicers regained and then built upon
their market share in both mortgage originations and
mortgage servicing. Data collected under the Home
Mortgage Disclosure Act (HMDA), for example,
indicate that the share of home-purchase mortgages
originated by independent mortgage companies rose
from 23 percent in 2007 to 47 percent in 2014.63
Nonbanks also boosted their mortgage servicing
market share through bulk purchases of MSAs.
Many of these purchases were composed of portfo-
lios related to nonperforming loans originally held by 62 The estimates described in this section are based on data pro-
vided by Inside Mortgage Finance. These data include all loans serviced by a firm, not just those for whom the firm recorded an MSA. “Banking institution” for the purposes of the calcula-tions based on Inside Mortgage Finance data is defined to include insured depository institutions, BHCs, savings and loan holding companies, and credit unions. The Inside Mortgage Finance data have varied over time in the number of mortgage servicers contained in its lists. To maintain comparability over time, the statistics shown here are based on the top 30 servicers in each year. Statistics based on a larger number of servicers (in the years when available) show a similar pattern to the top-30 statistics. The market share statistics refer to the banking insti-tution and nonbank share of mortgages serviced by the top 30 holders and not each type of institution’s share of the entire market. For an estimate of nonbank servicer market share rela-tive to the entire mortgage servicing market, see Government Accountability Office, Nonbank Mortgage Servicers: Existing
Regulatory Oversight Could Be Strengthened, GAO-16-278 (Washington, DC: 2016), 9, www.gao.gov/assets/680/675747.pdf.
63 Statistic from Neil Bhutta, Jack Popper, and Daniel R. Ringo, “The 2014 Home Mortgage Disclosure Act Data,” Federal Reserve Bulletin 101, (November 2015): Figure 8, www.federalreserve.gov/pubs/bulletin/2015/articles/hmda/2014-hmda-data.htm. In the HMDA data, only mortgages that a lender originates through its retail or broker channels are recorded as originations for that lender. In contrast, the Inside Mortgage Finance data include in a lender’s originations mort-gages originated through retail and broker channels, as well any mortgages that a lender sources through its correspondent channels. As a result, market share statistics based on HMDA data may differ from those based on Inside Mortgage Finance data.
Figure 10a. Dollar volume serviced by banking institutions in top 30 servicers, 2002–15
3000
4000
5000
6000
7000
8000
9000Billions of dollars
2015
2014
2013
2012
2011
2010
2009
2008
2007
2006
2005
2004
2003
2002
Note: Includes all loans serviced by firms, not just those serviced for others.
Source: Staff calculations from Inside Mortgage Finance data.
Figure 10b. Market share of banking institutions and nonbanks in the top 30 servicers, 2002–15
85
15
84
16
87
13
85
15
84
16
92
8964
95
5
94
6
93
7
89
11
76
24
72
28
68
32
0
10
20
30
40
50
60
70
80
90
100
Bank Nonbank
2015
2014
2013
2012
2011
2010
2009
2008
2007
2006
2005
2004
2003
2002
Market share
Note: Includes all loans serviced by firms, not just those serviced for others. Mar-ket share statistics are for each type of firm’s share of mortgages relative to total mortgages serviced by the top 30 firms in each year.
Source: Staff calculations from Inside Mortgage Finance data.
June 2016 23

banking institutions,64 most notably in 2013, when
nonbank servicers purchased from banks in bulk
sales the MSAs corresponding to more than $500 bil-
lion in mortgages.65 These sales included a $215 bil-
lion sale from Bank of America Corporation to
Nationstar Mortgage LLC (Nationstar), a $93 billion
sale from Bank of America Corporation to Walter
Investment Management Corp. (Walter), an $87 bil-
lion sale from Ally Financial Inc. to Ocwen Financial
Corp. (Ocwen), a $78 billion sale from OneWest
Bank to Ocwen, a $40 billion sale from Flagstar
Bank to Two Harbors Investment Corp., and a
$9 billion sale from EverBank Financial Corp. to
Walter.66 By 2015, roughly one-third of MSAs were
held by nonbanks, whereas before the financial crisis,
the nonbank share was around 15 percent.
Role that the challenges of servicing nonperforming
loans had on the shift. As suggested by these bulk
sales, banks’ difficulties managing their portfolios of
nonperforming loans appear to have played a key
role in the growth of the nonbank servicer sector.
Before the financial crisis, the mortgage servicing
business was generally dominated by banking institu-
tions and their affiliates, and was oriented toward
handling large volumes of performing loans.67 This
model began to show its weaknesses as the housing
market deteriorated and the number of delinquent
loans rose. Through the supervisory process and
other means, the federal banking agencies had begun
to identify widespread problems throughout the
mortgage servicing market, such as accounts of poor
communication with borrowers, lost information,
improper or no documentation, and inadequate staff-
ing. The increase in mortgage delinquencies and fore-
closures that occurred during the financial crisis fur-
ther highlighted servicing deficiencies. These weak-
nesses resulted in findings of unsafe and unsound
practices, violations of applicable federal and state
law and requirements, and widespread consequences
for the national housing market and borrowers.68
In 2011, the Federal Reserve and OCC mandated
improvements to servicing practices through enforce-
ment actions against 10 banks.69 In 2012, further
improvements were mandated through a legal settle-
ment among the U.S. Department of Justice (DOJ),
the U.S. Department of Housing and Urban Devel-
opment, 49 state attorneys general, and 5 large bank
mortgage servicers (DOJ settlement).70 These actions
and settlements involved large civil penalties, includ-
ing more than $25 billion in penalties and consumer
relief under the terms of the DOJ settlement.
Banks’ difficulties in servicing their nonperforming
loans, in conjunction with these enforcement actions
and settlements, appear to have motivated banks to
sell MSAs to nonbanks. Nonbank servicers were will-
ing to pick up much of this servicing, in part because
of their cost advantage relative to bank servicers in
handling nonperforming loans. That cost advantage
stemmed from both their specialization in this type of
servicing71 and from their ability to harness techno-
logical innovations in order to reduce costs.72 The
specialty servicers also got a boost from Fannie
Mae’s “High Touch Servicing Program,” which was
designed to facilitate the transfer of nonperforming
loans from banks to specialty servicers.73
In January 2014, new servicing standards and
requirements mandated by the Consumer Financial
64 “Nonbanks Continue Expanding Their Share of Mortgage Ser-vicing Market at Evolutionary Pace,” Inside Mortgage Finance, November 7, 2014, 3. “Some of the decline reflects the slow evaporation of the supply of mortgage debt outstanding, but it mostly is the result of handing off distressed servicing to firms designed to handle such assets and the Basel III restrictions on MSR that are on the horizon.”
65 Kroll Bond Rating Agency, “Update – Residential Loan Origi-nation and Mortgage Servicing Sector,” April 9, 2015.
66 Ibid.67 Lee, Nonbank Specialty Servicers, 2–3.68 Board of Governors of the Federal Reserve System, Office of
the Comptroller of the Currency, and Office of Thrift Supervi-sion, “Interagency Review of Foreclosure Policies and Prac-
tices,” April 2011, www.federalreserve.gov/boarddocs/rptcongress/interagency_review_foreclosures_20110413.pdf.
69 Office of the Comptroller of the Currency, “OCC Takes Enforcement Action Against Eight Servicers for Unsafe and Unsound Foreclosure Practices,” news release, April 13, 2011, www.occ.gov/news-issuances/news-releases/2011/nr-occ-2011-47.html; Board of Governors of the Federal Reserve System, news release, April 13, 2011, www.federalreserve.gov/newsevents/press/enforcement/20110413a.htm.
70 U.S. Department of Justice, “Federal Government and State Attorneys General Reach $25 Billion Agreement with Five Largest Mortgage Servicers to Address Mortgage Loan Servic-ing and Foreclosure Abuses,” news release, February 9, 2012, www.justice.gov/opa/pr/federal-government-and-state-attorneys-general-reach-25-billion-agreement-five-largest.
71 Kaul and Goodman, Nonbank Servicer Regulation, 1–3. “Banks, having encountered very low delinquencies historically, didn’t have much experience servicing large volumes of delin-quent loans and were therefore ill-prepared for this task. Non-banks…were better situated to respond to the changing landscape.”
72 Marshall Lux and Robert Greene, “What’s Behind the Non-Bank Mortgage Boom?” Harvard Kennedy School, M-RCBG Associate Working Paper Series no. 42: 25–31 (June 2015), www.hks.harvard.edu/centers/mrcbg/publications/awp/awp42.
73 Lee, Nonbank Specialty Servicers, 2; and Federal Housing Finance Agency, Evaluation of FHFA’s Oversight of Fannie Mae’s Transfer of Mortgage Servicing Rights From Bank of America to High Touch Servicers, EVL-2012-008 (Washington, DC: 2012), www.fhfaoig.gov/Content/Files/EVL-2012-008.pdf.
24 Report to the Congress on the Effect of Capital Rules on Mortgage Servicing Assets

Protection Bureau (CFPB) became effective.74 These
requirements applied to both banking institution and
nonbank servicers, as the Dodd-Frank Act provided
the CFPB with the authority to supervise banking
institutions with assets over $10 billion and nonbank
mortgage servicers, and to issue rules that addressed
consumer protection issues in mortgage servicing.75
Under its authority under the Truth in Lending Act,
as implemented by Regulation Z, and the Real Estate
Settlement Procedures Act, as implemented by Regu-
lation X, the CFPB issued rules that require changes
in the notices and statements provided to borrowers,
the way in which payments are credited, and servicer
recordkeeping. The new rules also establish minimum
standards that servicers must follow when handling
delinquent mortgages or engaging in loss mitigation.
Although servicing conducted by banking institu-
tions was the primary focus of regulatory scrutiny
between 2011 and 2013, more recently servicing pro-
vided by nonbank servicers has been the subject of
review by the CFPB, the Federal Trade Commission,
and state regulators.76 The Financial Stability Over-
sight Council (FSOC), the Government Accountabil-
ity Office, and Federal Housing Finance Agency’s
(FHFA) inspector general have also highlighted pos-
sible risks posed by nonbank servicers.77
Role of changes in the REIT tax treatment of excess
MSAs. In 2013, the Internal Revenue Service (IRS)
issued a private letter ruling (PLR) that provides an
incentive for REITs78 to invest in certain cash flows
associated with MSAs.79 Servicers have the option of
splitting their servicing revenue into two pieces: the
“base servicing,” representing the servicer’s compen-
sation for carrying out its servicing duties, and the
“excess servicing,” representing the revenue beyond
the servicer’s costs. The PLR established that the
excess servicing spread portion of an MSA is a quali-
fying asset for a REIT and that the excess servicing
strip is more similar to an interest-only mortgage
strip than compensation for performing servicing.80
This clarification in tax treatment appears to corre-
spond to an increased appetite on the part of REITs
for investing in MSAs.
Trends in Banks’ MSA Values Relative to Assets and to Capital
MSAs represent a very small share in the aggregate
of total bank assets and CET1 capital. As illustrated
in figure 11, the amount of MSAs relative to total
assets during the 1998 to 2015 period ranged from
nearly zero to 0.7 percent, and stood at 0.25 percent
in 2015. Meanwhile, the amount of MSAs in relation
to CET1 capital (or tier 1 capital less preferred stock
and related surplus, prior to January 1, 2015) ranged
from 2 percent to 9 percent during the 1998 to 2015
period, and was 2.8 percent in 2015.81
The time-series pattern of MSAs relative to total
assets and to CET1 capital shown in figure 11 shares
74 Mortgage Servicing Rules Under the Real Estate Settlement Procedures Act (Regulation X), 78 Fed. Reg. 10,695 (Febru-ary 14, 2013), www.federalregister.gov/articles/2013/02/14/2013-01248/mortgage-servicing-rules-under-the-real-estate-settlement-procedures-act-regulation-x, as amended by 78 Fed. Reg. 44,685 (July 24, 2013), 78 Fed. Reg. 60,381 (Oct. 1, 2013), and 78 Fed. Reg. 62,993 (Oct. 23, 2013). Mortgage Servicing Rules Under the Truth in Lending Act (Regulation Z), 78 Fed. Reg. 10,901 (February 14, 2013), www.federalregister.gov/articles/2013/02/14/2013-01241/mortgage-servicing-rules-under-the-truth-in-lending-act-regulation-z, as amended by 78 Fed. Reg. 44,685 (July 24, 2013), 78 Fed. Reg. 60,381 (Oct. 1, 2013), and 78 Fed. Reg. 62,993 (Oct. 23, 2013).
75 The specific authorities exercised by the CFPB stemmed from the Truth in Lending Act, as implemented by Regulation Z, and the Real Estate Settlement Procedures Act, as implemented by Regulation X.
76 For example, see Federal Trade Commission, “National Mort-gage Servicing Company Will Pay $63 Million to Settle FTC, CFPB Charges,” news release, April 21, 2015, www.ftc.gov/news-events/press-releases/2015/04/national-mortgage-servicing-company-will-pay-63-million-settle.
77 Financial Stability Oversight Council, 2014 Annual Report (Washington, DC: 2014), 10, www.treasury.gov/initiatives/fsoc/Documents/FSOC%202014%20Annual%20Report.pdf; Non-bank Mortgage Servicers; and Federal Housing Finance Agency, FHFA Actions to Manage Enterprise Risks from Nonbank Ser-vicers Specializing in Troubled Mortgages, AUD-2014-014 (Washington, DC: 2014), 4–5, http://fhfaoig.gov/Content/Files/AUD-2014-014.pdf.
78 A REIT is a company that is required to hold passive invest-ments in real estate and real estate-related assets and make cer-tain distributions in order to maintain a tax-advantaged status. The tax advantage associated with REITs is that the income is taxed only at the level of the investor, and not subject to an additional level of taxation at the trust level.
79 Internal Revenue Service, Ltr. Rul. 105442-12 (May 24, 2012), www.irs.gov/pub/irs-wd/1234006.pdf.
80 In most circumstances the interest-only strip that results from the excess servicing is not treated as a separate asset for regula-tory capital purposes. In certain discrete instances, however, an interest-only strip may be recognized apart from the related MSA. This recognition can occur, for example, when the parties to the contract associated with the MSA renegotiate to lower the servicing fee, thus separating the original MSA into two components. The agencies understand that this practice is not common. Moreover, while an interest-only strip and an MSA are both subject to similar risks, such as prepayment risk and default risk, an interest-only strip and an MSA differ in impor-tant ways. Primarily, an interest-only strip is a passively owned financial asset, whereas the holder of an MSA must perform specific activities and obligations related to the servicing.
81 Since NCUA started collecting MSA data in 2004, the highest levels of the MSAs to assets ratio and the MSAs to net worth ratio were 0.2 percent and 1.96 percent, respectively.
June 2016 25
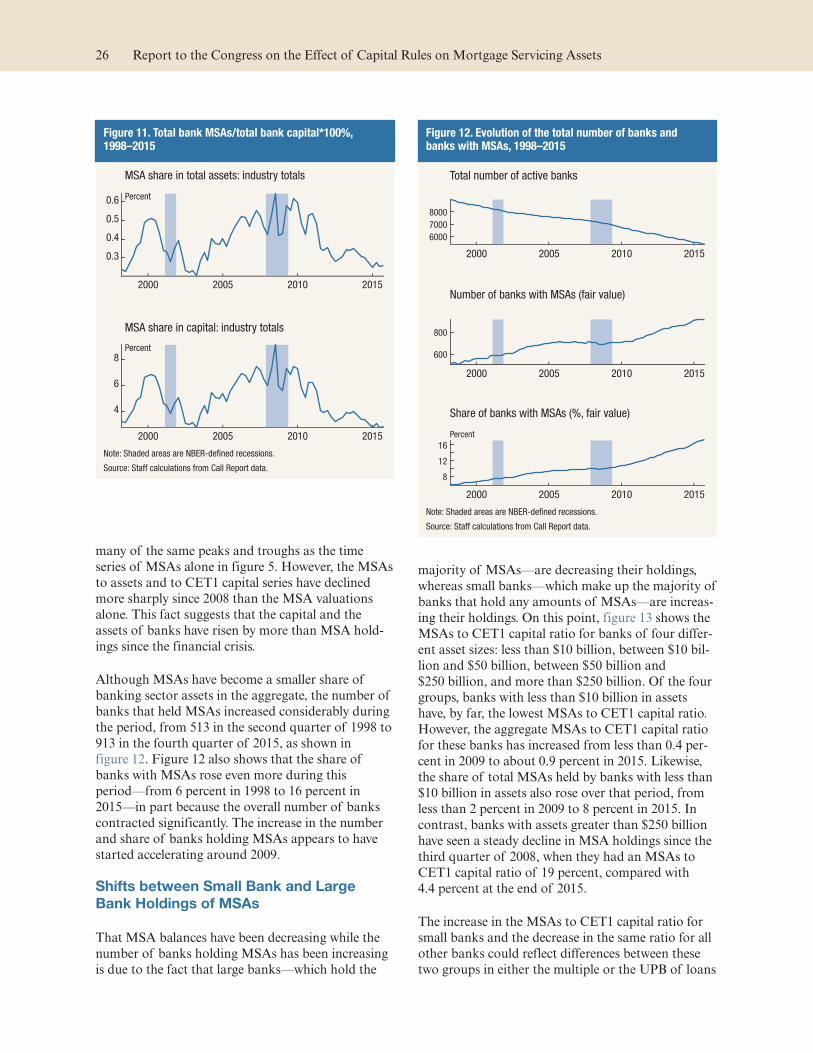
many of the same peaks and troughs as the time
series of MSAs alone in figure 5. However, the MSAs
to assets and to CET1 capital series have declined
more sharply since 2008 than the MSA valuations
alone. This fact suggests that the capital and the
assets of banks have risen by more than MSA hold-
ings since the financial crisis.
Although MSAs have become a smaller share of
banking sector assets in the aggregate, the number of
banks that held MSAs increased considerably during
the period, from 513 in the second quarter of 1998 to
913 in the fourth quarter of 2015, as shown in
figure 12. Figure 12 also shows that the share of
banks with MSAs rose even more during this
period—from 6 percent in 1998 to 16 percent in
2015—in part because the overall number of banks
contracted significantly. The increase in the number
and share of banks holding MSAs appears to have
started accelerating around 2009.
Shifts between Small Bank and Large
Bank Holdings of MSAs
That MSA balances have been decreasing while the
number of banks holding MSAs has been increasing
is due to the fact that large banks—which hold the
majority of MSAs—are decreasing their holdings,
whereas small banks—which make up the majority of
banks that hold any amounts of MSAs—are increas-
ing their holdings. On this point, figure 13 shows the
MSAs to CET1 capital ratio for banks of four differ-
ent asset sizes: less than $10 billion, between $10 bil-
lion and $50 billion, between $50 billion and
$250 billion, and more than $250 billion. Of the four
groups, banks with less than $10 billion in assets
have, by far, the lowest MSAs to CET1 capital ratio.
However, the aggregate MSAs to CET1 capital ratio
for these banks has increased from less than 0.4 per-
cent in 2009 to about 0.9 percent in 2015. Likewise,
the share of total MSAs held by banks with less than
$10 billion in assets also rose over that period, from
less than 2 percent in 2009 to 8 percent in 2015. In
contrast, banks with assets greater than $250 billion
have seen a steady decline in MSA holdings since the
third quarter of 2008, when they had an MSAs to
CET1 capital ratio of 19 percent, compared with
4.4 percent at the end of 2015.
The increase in the MSAs to CET1 capital ratio for
small banks and the decrease in the same ratio for all
other banks could reflect differences between these
two groups in either the multiple or the UPB of loans
Figure 11. Total bank MSAs/total bank capital*100%, 1998–2015
2000 2005 2010 2015
0.3
0.4
0.5
0.6
MSA share in total assets: industry totals
2000 2005 2010 2015
4
6
8
MSA share in capital: industry totals
Percent
Percent
Note: Shaded areas are NBER-defined recessions.
Source: Staff calculations from Call Report data.
Figure 12. Evolution of the total number of banks and banks with MSAs, 1998–2015
2000 2005 2010 2015
6000
7000
8000
Total number of active banks
2000 2005 2010 2015
600
800
Number of banks with MSAs (fair value)
2000 2005 2010 2015
8
12
16
Share of banks with MSAs (%, fair value)
Percent
Note: Shaded areas are NBER-defined recessions.
Source: Staff calculations from Call Report data.
26 Report to the Congress on the Effect of Capital Rules on Mortgage Servicing Assets
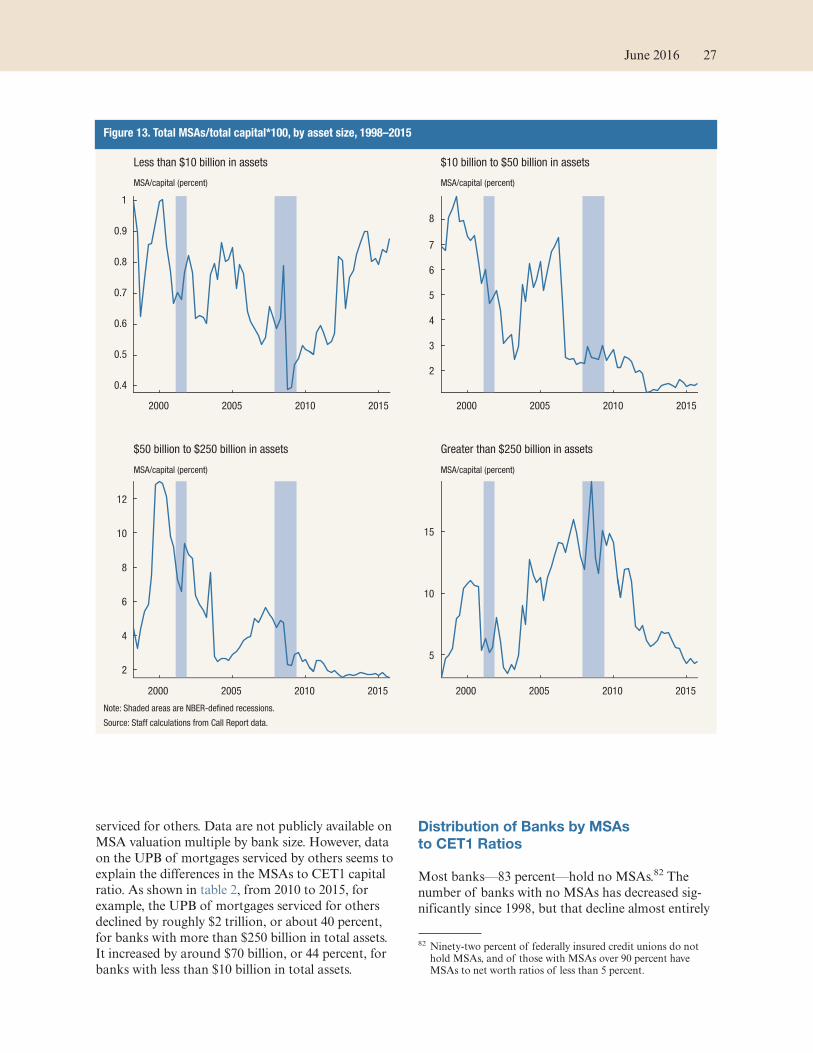
serviced for others. Data are not publicly available on
MSA valuation multiple by bank size. However, data
on the UPB of mortgages serviced by others seems to
explain the differences in the MSAs to CET1 capital
ratio. As shown in table 2, from 2010 to 2015, for
example, the UPB of mortgages serviced for others
declined by roughly $2 trillion, or about 40 percent,
for banks with more than $250 billion in total assets.
It increased by around $70 billion, or 44 percent, for
banks with less than $10 billion in total assets.
Distribution of Banks by MSAs
to CET1 Ratios
Most banks—83 percent—hold no MSAs.82 The
number of banks with no MSAs has decreased sig-
nificantly since 1998, but that decline almost entirely
82 Ninety-two percent of federally insured credit unions do not hold MSAs, and of those with MSAs over 90 percent have MSAs to net worth ratios of less than 5 percent.
Figure 13. Total MSAs/total capital*100, by asset size, 1998–2015
2000 2005 2010 2015
0.4
0.5
0.6
0.7
0.8
0.9
1
MSA/capital (percent) MSA/capital (percent)
MSA/capital (percent) MSA/capital (percent)
2000 2005 2010 2015
2
3
4
5
6
7
8
2000 2005 2010 2015
2
4
6
8
10
12
2000 2005 2010 2015
5
10
15
Less than $10 billion in assets $10 billion to $50 billion in assets
$50 billion to $250 billion in assets Greater than $250 billion in assets
Note: Shaded areas are NBER-defined recessions.
Source: Staff calculations from Call Report data.
June 2016 27
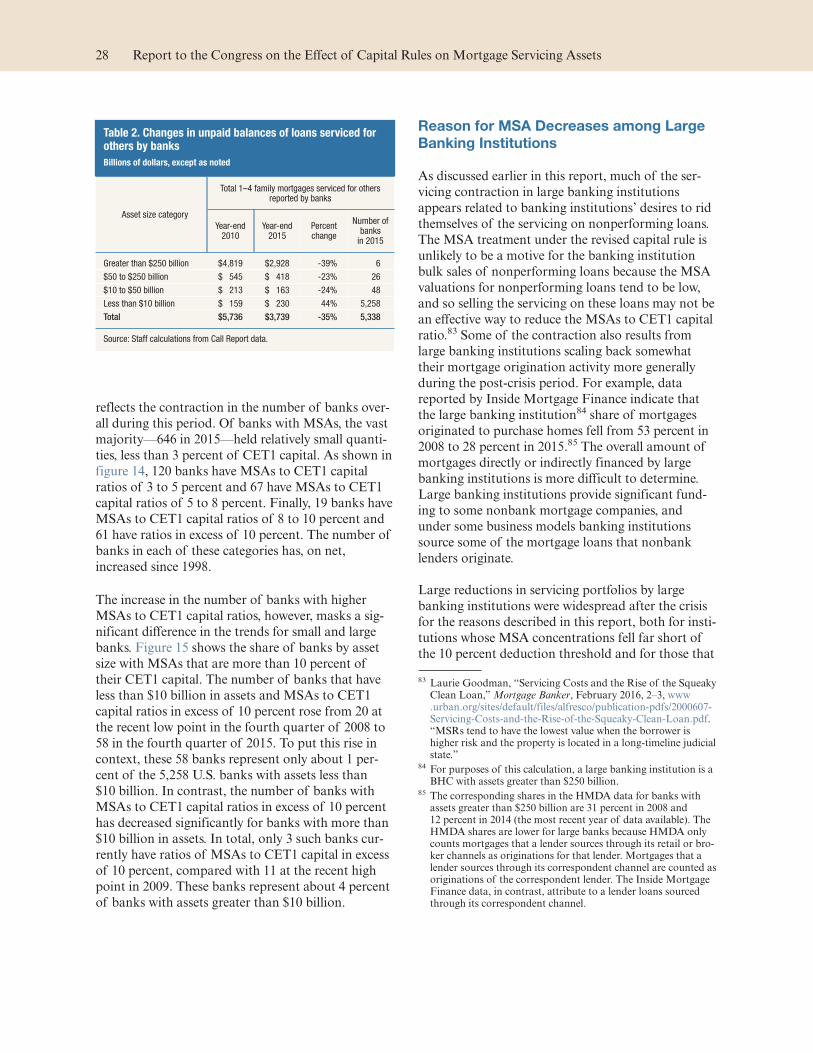
reflects the contraction in the number of banks over-
all during this period. Of banks with MSAs, the vast
majority—646 in 2015—held relatively small quanti-
ties, less than 3 percent of CET1 capital. As shown in
figure 14, 120 banks have MSAs to CET1 capital
ratios of 3 to 5 percent and 67 have MSAs to CET1
capital ratios of 5 to 8 percent. Finally, 19 banks have
MSAs to CET1 capital ratios of 8 to 10 percent and
61 have ratios in excess of 10 percent. The number of
banks in each of these categories has, on net,
increased since 1998.
The increase in the number of banks with higher
MSAs to CET1 capital ratios, however, masks a sig-
nificant difference in the trends for small and large
banks. Figure 15 shows the share of banks by asset
size with MSAs that are more than 10 percent of
their CET1 capital. The number of banks that have
less than $10 billion in assets and MSAs to CET1
capital ratios in excess of 10 percent rose from 20 at
the recent low point in the fourth quarter of 2008 to
58 in the fourth quarter of 2015. To put this rise in
context, these 58 banks represent only about 1 per-
cent of the 5,258 U.S. banks with assets less than
$10 billion. In contrast, the number of banks with
MSAs to CET1 capital ratios in excess of 10 percent
has decreased significantly for banks with more than
$10 billion in assets. In total, only 3 such banks cur-
rently have ratios of MSAs to CET1 capital in excess
of 10 percent, compared with 11 at the recent high
point in 2009. These banks represent about 4 percent
of banks with assets greater than $10 billion.
Reason for MSA Decreases among Large
Banking Institutions
As discussed earlier in this report, much of the ser-
vicing contraction in large banking institutions
appears related to banking institutions’ desires to rid
themselves of the servicing on nonperforming loans.
The MSA treatment under the revised capital rule is
unlikely to be a motive for the banking institution
bulk sales of nonperforming loans because the MSA
valuations for nonperforming loans tend to be low,
and so selling the servicing on these loans may not be
an effective way to reduce the MSAs to CET1 capital
ratio.83 Some of the contraction also results from
large banking institutions scaling back somewhat
their mortgage origination activity more generally
during the post-crisis period. For example, data
reported by Inside Mortgage Finance indicate that
the large banking institution84 share of mortgages
originated to purchase homes fell from 53 percent in
2008 to 28 percent in 2015.85 The overall amount of
mortgages directly or indirectly financed by large
banking institutions is more difficult to determine.
Large banking institutions provide significant fund-
ing to some nonbank mortgage companies, and
under some business models banking institutions
source some of the mortgage loans that nonbank
lenders originate.
Large reductions in servicing portfolios by large
banking institutions were widespread after the crisis
for the reasons described in this report, both for insti-
tutions whose MSA concentrations fell far short of
the 10 percent deduction threshold and for those that
83 Laurie Goodman, “Servicing Costs and the Rise of the Squeaky Clean Loan,” Mortgage Banker, February 2016, 2–3, www.urban.org/sites/default/files/alfresco/publication-pdfs/2000607-Servicing-Costs-and-the-Rise-of-the-Squeaky-Clean-Loan.pdf. “MSRs tend to have the lowest value when the borrower is higher risk and the property is located in a long-timeline judicial state.”
84 For purposes of this calculation, a large banking institution is a BHC with assets greater than $250 billion.
85 The corresponding shares in the HMDA data for banks with assets greater than $250 billion are 31 percent in 2008 and 12 percent in 2014 (the most recent year of data available). The HMDA shares are lower for large banks because HMDA only counts mortgages that a lender sources through its retail or bro-ker channels as originations for that lender. Mortgages that a lender sources through its correspondent channel are counted as originations of the correspondent lender. The Inside Mortgage Finance data, in contrast, attribute to a lender loans sourced through its correspondent channel.
Table 2. Changes in unpaid balances of loans serviced for others by banks
Billions of dollars, except as noted
Asset size category
Total 1–4 family mortgages serviced for others reported by banks
Year-end 2010
Year-end2015
Percent change
Number of banks
in 2015
Greater than $250 billion $4,819 $2,928 -39% 6
$50 to $250 billion $ 545 $ 418 -23% 26
$10 to $50 billion $ 213 $ 163 -24% 48
Less than $10 billion $ 159 $ 230 44% 5,258
Total $5,736 $3,739 -35% 5,338
Source: Staff calculations from Call Report data.
28 Report to the Congress on the Effect of Capital Rules on Mortgage Servicing Assets
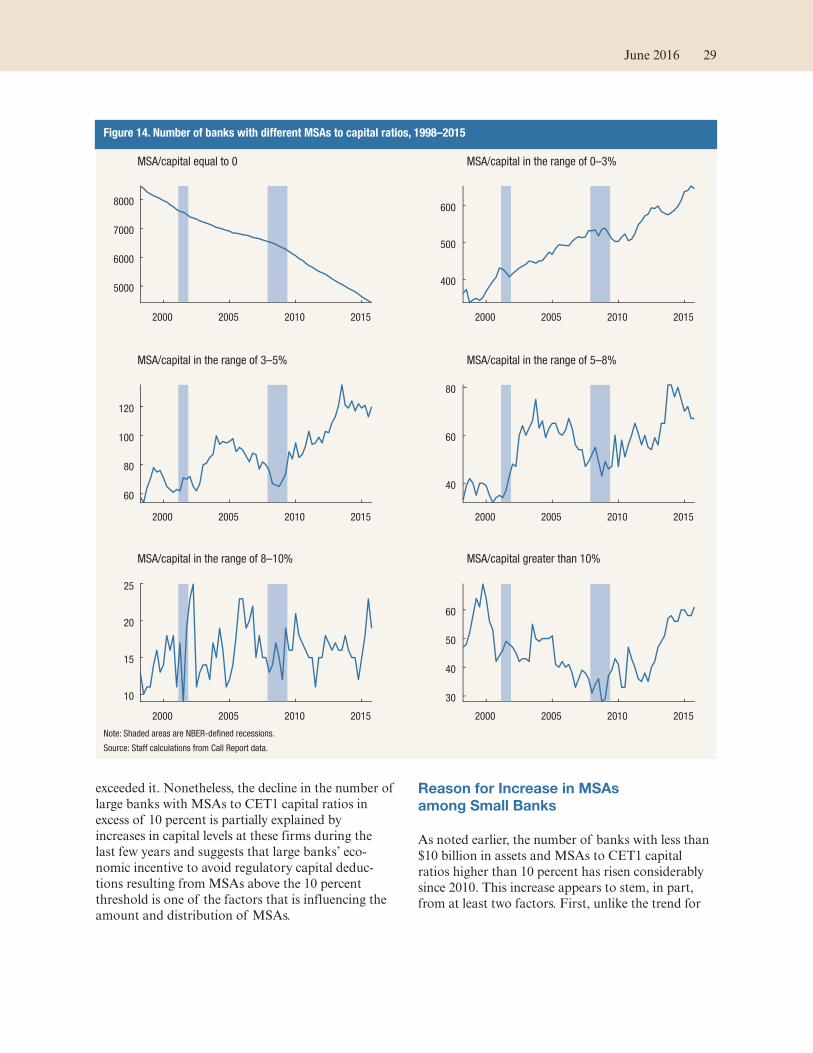
exceeded it. Nonetheless, the decline in the number of
large banks with MSAs to CET1 capital ratios in
excess of 10 percent is partially explained by
increases in capital levels at these firms during the
last few years and suggests that large banks’ eco-
nomic incentive to avoid regulatory capital deduc-
tions resulting from MSAs above the 10 percent
threshold is one of the factors that is influencing the
amount and distribution of MSAs.
Reason for Increase in MSAs
among Small Banks
As noted earlier, the number of banks with less than
$10 billion in assets and MSAs to CET1 capital
ratios higher than 10 percent has risen considerably
since 2010. This increase appears to stem, in part,
from at least two factors. First, unlike the trend for
Figure 14. Number of banks with different MSAs to capital ratios, 1998–2015
2000 2005 2010 2015
5000
6000
7000
8000
MSA/capital equal to 0
2000 2005 2010 2015
400
500
600
MSA/capital in the range of 0–3%
2000 2005 2010 2015
60
80
100
120
MSA/capital in the range of 3–5%
2000 2005 2010 2015
40
60
80
MSA/capital in the range of 5–8%
2000 2005 2010 2015
10
15
20
25
MSA/capital in the range of 8–10%
2000 2005 2010 2015
30
40
50
60
MSA/capital greater than 10%
Note: Shaded areas are NBER-defined recessions.
Source: Staff calculations from Call Report data.
June 2016 29

large banks, banks with less than $10 billion in assets
have increased their mortgage origination market
share from 13 percent in 2008 to 19 percent in 2014.86
Second, small banks appear to have switched their
MSA business models after the financial crisis. Dur-
ing the housing bubble, some of the larger firms typi-
cally served as aggregators by purchasing loans and
their accompanying servicing rights from smaller
banks. The aggregator business was profitable, in
part, because the GSEs charged lower guarantee
fees87 to firms that brought them larger quantities of
loans.88 Aggregators, in turn, shared some of these
cost savings with the smaller banks from whom they
purchased loans.
During and after the financial crisis, aggregators
pulled back sharply on their purchases of loans from
86 This calculation is based on HMDA data.
87 The GSEs charge lenders a fee to compensate the GSEs for their costs in taking on the credit risk of the loan.
88 Federal Housing Finance Agency, Recent Trends in the Enter-prises’ Purchases of Mortgages from Smaller Lenders and Non-bank Mortgage Companies, EVL-2014-010 (Washington, DC: 2014), 14, https://origin.www.fhfaoig.gov/Content/Files/EVL-2014-010_0.pdf.
Figure 15. Number of banks with MSAs to CET1 capital ratios higher than 10% by asset size, 1998–2015
2000 2005 2010 2015
20
30
40
50
60
Less than $10 billion in assets
2000 2005 2010 2015
2
4
6
8
10
$10 billion to $50 billion in assets
2000 2005 2010 2015
0
1
2
3
4
5
$50 billion to $250 billion in assets
2000 2005 2010 2015
0
1
2
3
4
5
Greater than $250 billion in assets
Number of banks Number of banks
Number of banks Number of banks
Note: Shaded areas are NBER-defined recessions.
Source: Staff calculations from Call Report data.
30 Report to the Congress on the Effect of Capital Rules on Mortgage Servicing Assets

smaller banks. This pullback reflected several factors.
First, the guarantee fee pricing became less favorable
to aggregators.89 Second, the GSEs began increasing
their demands that banks repurchase loans that had
performed poorly since being sold to the GSEs.90
Aggregators’ losses on these repurchases were dispro-
portionately concentrated among loans that they had
purchased from other firms.91 Third, the revised capi-
tal rule, stricter mortgage servicing regulations, and
the litigation experience of some banks may have
dampened aggregators’ interest in amassing large
portfolios of MSAs.92
With the withdrawal of the aggregators from the
market, smaller banks found it advantageous to sell
their loans directly to the GSEs through the cash
window.93 However, the GSEs, unlike the aggrega-
tors, do not purchase the servicing rights along with
the underlying loans. Some of these smaller banks
now appear to be retaining the servicing rights after
selling the loans that they originate to the GSEs, and
thereby recording an MSA, when they likely would
not have done so with a sale to an aggregator.
To illustrate the shift in business strategy on the part
of small banks, figure 16 shows the number and
share of small banks that sold any loans to the GSEs
in a given year. This calculation is based on data
reported by lenders under HMDA.94 Between 2011
and 2012, the number of small banks that sold loans
to the GSEs rose from 765 to 927, and remained
around this level through 2014.95 This 150-bank
increase in the number of small banks selling loans to
the GSEs is roughly comparable to the increase in the
number of banks recording an MSA during the same
period.
89 Federal Housing Finance Agency, “FHFA Announces Increase in Guarantee Fees,” news release, August 31, 2012, www.fhfa.gov/Media/PublicAffairs/Pages/FHFA-Announces-Increase-in-Guarantee-Fees.aspx.
90 Recent Trends, 16.91 Ibid.92 Ibid.93 The cash window refers to the manner by which the GSEs buy
individual loans directly from mortgage originators.
94 The calculation is restricted to mortgages originated in the first nine months of the year. Some loans that are originated in the fourth quarter of the year are not sold until the next calendar year, so calculations that include loans originated in that quar-ter may understate the share of loans that are sold.
95 This calculation may understate the number of small banks that shifted their strategy, because banks with assets under a certain threshold and banks that operate only in rural areas are not required to report their loan originations under HMDA. The share of larger banks that sold loans to the GSEs also increased during this period; these data are not shown because only a few banks are in this category.
Figure 16. Number and percent of banks with less than $10 billion in assets with any loans sold to Fannie Mae or Freddie Mac, 2004–14
0
200
400
600
800
1000
20142013201220112010200920082007200620052004
0
5
10
15
20
25
20142013201220112010200920082007200620052004
Percent
Source: Staff calculations based on HMDA data.
June 2016 31
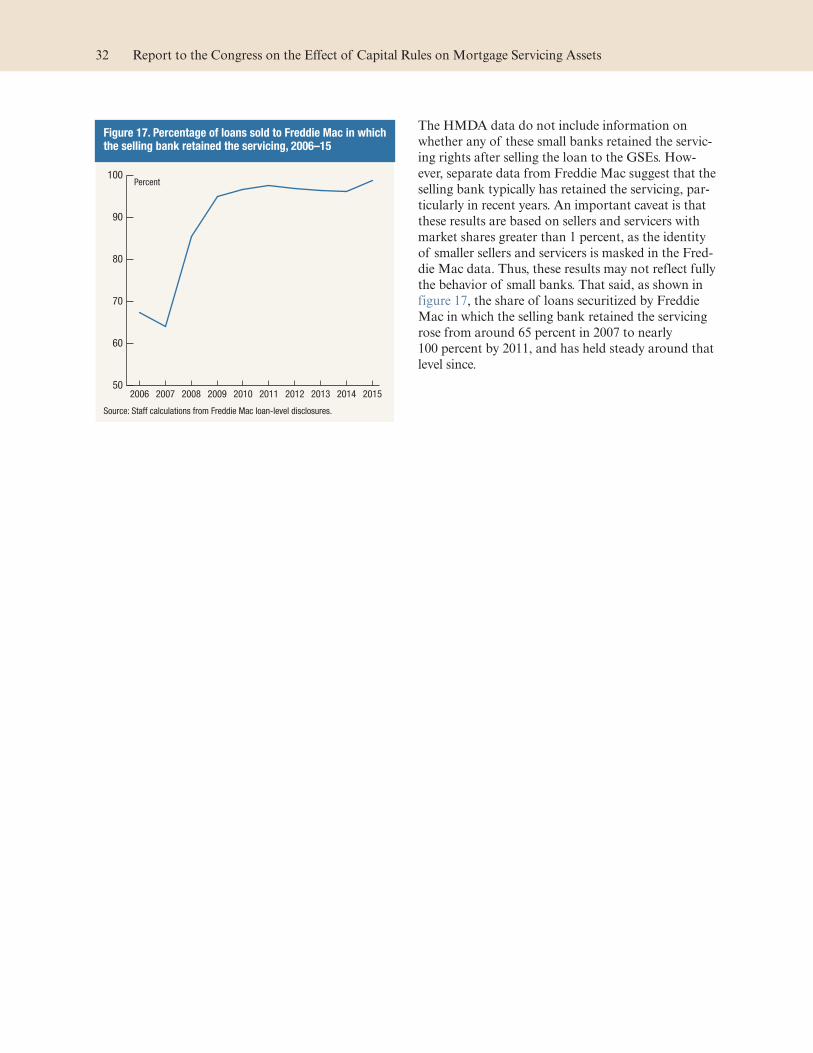
The HMDA data do not include information on
whether any of these small banks retained the servic-
ing rights after selling the loan to the GSEs. How-
ever, separate data from Freddie Mac suggest that the
selling bank typically has retained the servicing, par-
ticularly in recent years. An important caveat is that
these results are based on sellers and servicers with
market shares greater than 1 percent, as the identity
of smaller sellers and servicers is masked in the Fred-
die Mac data. Thus, these results may not reflect fully
the behavior of small banks. That said, as shown in
figure 17, the share of loans securitized by Freddie
Mac in which the selling bank retained the servicing
rose from around 65 percent in 2007 to nearly
100 percent by 2011, and has held steady around that
level since.
Figure 17. Percentage of loans sold to Freddie Mac in which the selling bank retained the servicing, 2006–15
50
60
70
80
90
100
2015201420132012201120102009200820072006
Percent
Source: Staff calculations from Freddie Mac loan-level disclosures.
32 Report to the Congress on the Effect of Capital Rules on Mortgage Servicing Assets

Potential Impact of the Revised Capital Rule on the Mortgage Servicing Business
Cost of Loan Servicing and Economies of Scale
One of the most significant factors affecting the abil-
ity of all firms to compete in the mortgage servicing
business is the increase in the cost of servicing loans.
For example, as shown in figure 18, data collected by
the Mortgage Bankers Association indicate that the
annual cost of servicing a performing loan more than
doubled from $59 in 2008 to $175 in 2015, whereas
the annual cost of servicing a nonperforming loan
more than quadrupled from $482 to $2,375 in the
same time period.96 In addition, the time it takes a
servicer to resolve a nonperforming loan has
increased substantially, adding to the total servicing
cost.97
Against this backdrop of rising costs overall, a firm
may also achieve lower servicing costs if it is able to
harness economies of scale. Some aspects of mort-
gage servicing become cheaper—as measured by the
average cost to service a loan—when the firm services
a larger number of loans. This relationship, known as
“economies of scale,” stems from the fact that some
costs, such as investments in technology and staff
expertise in regulatory compliance, are upfront
investments with benefits that are spread out across
the firm’s mortgage servicing book.
To illustrate this point, table 3 shows the average cost
to service a loan broken out by the size of the firm’s
servicing book. The estimates are based on data sub-
mitted by 160 independent mortgage companies and
subsidiaries of banks through their Quarterly Mort-
gage Bankers Financial Reporting Forms.98 The aver-
age cost to service a loan follows a U-shape. The
average annual cost as measured by total direct
expenses is roughly around $250 a year for the small-
est and the largest firms; the average annual costs are
lower for the firms servicing between 2,500 and
10,000 loans and between 10,000 and 50,000 loans, at
$170 and $219, respectively.
The differences in average cost reflect both econo-
mies of scale and the composition of the firms’ ser-
vicing book. As shown in the last row of the table,
the serious delinquency rate for the firms that service
the largest amount of loans (more than 50,000) is
7.7 percent, approximately eight times the delin-
quency rate of the firms with the smallest amount of
loans (less than 2,500). The high average servicing
cost for the firms with the largest amount of loans
likely reflects primarily their outsized share of delin-
quent loans.
That said, the fact that firms that service between
2,500 and 10,000 loans a year have lower average ser-
vicing costs than firms that service less than 2,500
loans is consistent with the idea that economies of
96 Data are from the Mortgage Bankers Association Servicing Operations Study and Forum.
97 Goodman, Servicing Costs, 2–3.98 For more information on the Mortgage Bankers Financial
Reporting Form (MBFRF), see www.fanniemae.com/content/guide_form/form-1002-mortgage-bankers-financial-reporting-form. Companies may choose to release their MBFRF data to the Mortgage Bankers Association for use in aggregate industry statistics.
Table 3. Mortgage servicing, dollar cost per loan
Expense
Servicing volume, number of loans
Less than 2,500
2,500-10,000
10,000- 50,000
Greater than
50,000
Total direct expenses $ 254 $ 170 $ 219 $ 242
Personnel $ 96 $ 76 $ 92 $ 115
Occupancy and equipment $ 7 $ 4 $ 9 $ 8
Technology-related $ 2 $ 4 $ 8 $ 10
Subservicing fees paid $ 138 $ 70 $ 70 $ 52
Other miscellaneous expenses $ 12 $ 17 $ 39 $ 58
Average number of loans serviced 1,231 5,166 22,940 368,327
Seriously delinquent rate (% based on $) 0.85 1.30 2.45 7.67
Number of companies reporting 36 45 47 32
Note: Expenses may not sum to total because of rounding.
Source: Mortgage Bankers Association, Quarterly Mortgage Bankers Performance
Report, 2015.
33
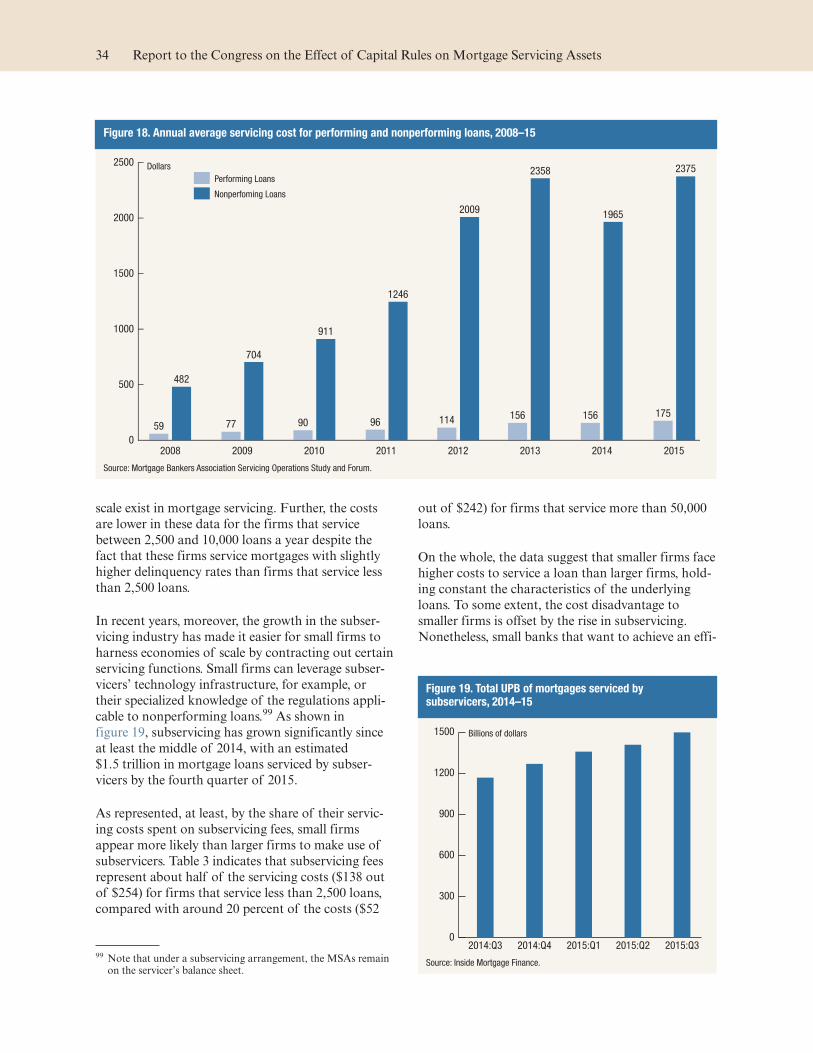
scale exist in mortgage servicing. Further, the costs
are lower in these data for the firms that service
between 2,500 and 10,000 loans a year despite the
fact that these firms service mortgages with slightly
higher delinquency rates than firms that service less
than 2,500 loans.
In recent years, moreover, the growth in the subser-
vicing industry has made it easier for small firms to
harness economies of scale by contracting out certain
servicing functions. Small firms can leverage subser-
vicers’ technology infrastructure, for example, or
their specialized knowledge of the regulations appli-
cable to nonperforming loans.99 As shown in
figure 19, subservicing has grown significantly since
at least the middle of 2014, with an estimated
$1.5 trillion in mortgage loans serviced by subser-
vicers by the fourth quarter of 2015.
As represented, at least, by the share of their servic-
ing costs spent on subservicing fees, small firms
appear more likely than larger firms to make use of
subservicers. Table 3 indicates that subservicing fees
represent about half of the servicing costs ($138 out
of $254) for firms that service less than 2,500 loans,
compared with around 20 percent of the costs ($52
out of $242) for firms that service more than 50,000
loans.
On the whole, the data suggest that smaller firms face
higher costs to service a loan than larger firms, hold-
ing constant the characteristics of the underlying
loans. To some extent, the cost disadvantage to
smaller firms is offset by the rise in subservicing.
Nonetheless, small banks that want to achieve an effi-
99 Note that under a subservicing arrangement, the MSAs remain on the servicer’s balance sheet.
Figure 18. Annual average servicing cost for performing and nonperforming loans, 2008–15
0
500
1000
1500
2000
2500
482
704
911
1246
2009
2358
1965
2375
59 77 96 114 156 156 175
Nonperfoming Loans
Performing Loans
20152014201320122011201020092008
Dollars
90
Source: Mortgage Bankers Association Servicing Operations Study and Forum.
Figure 19. Total UPB of mortgages serviced by subservicers, 2014–15
0
300
600
900
1200
1500
2015:Q32015:Q22015:Q12014:Q42014:Q3
Billions of dollars
Source: Inside Mortgage Finance.
34 Report to the Congress on the Effect of Capital Rules on Mortgage Servicing Assets
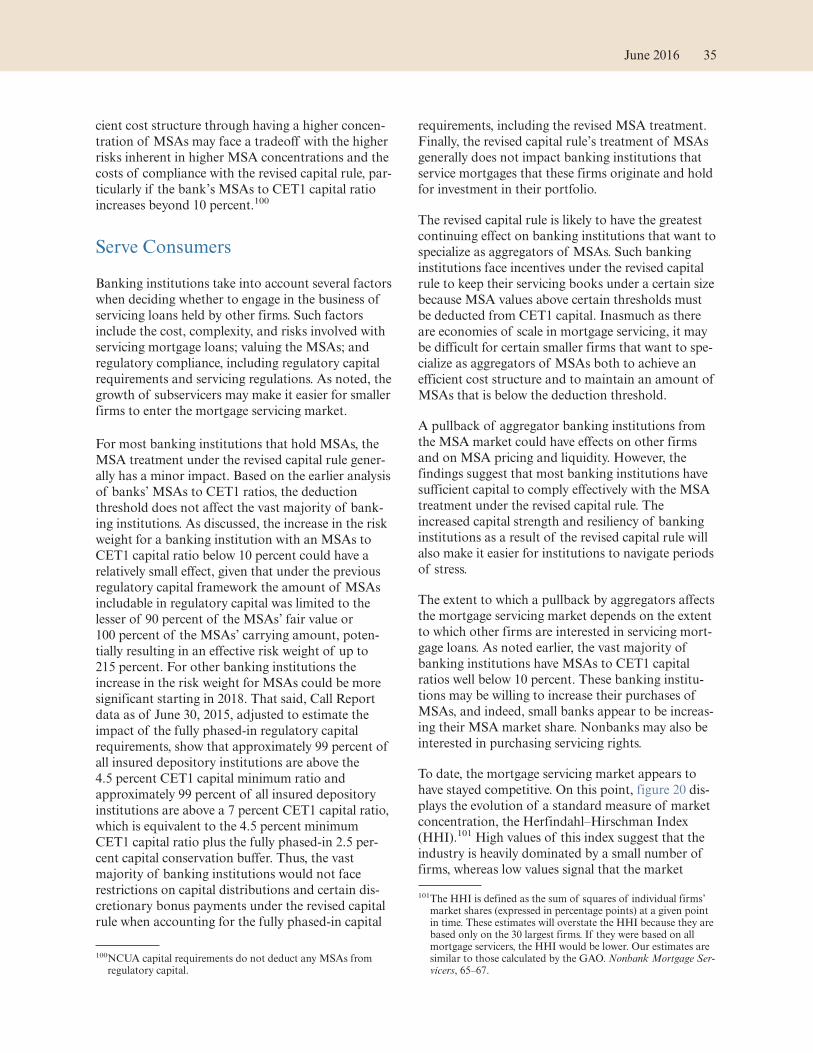
cient cost structure through having a higher concen-
tration of MSAs may face a tradeoff with the higher
risks inherent in higher MSA concentrations and the
costs of compliance with the revised capital rule, par-
ticularly if the bank’s MSAs to CET1 capital ratio
increases beyond 10 percent.100
Serve Consumers
Banking institutions take into account several factors
when deciding whether to engage in the business of
servicing loans held by other firms. Such factors
include the cost, complexity, and risks involved with
servicing mortgage loans; valuing the MSAs; and
regulatory compliance, including regulatory capital
requirements and servicing regulations. As noted, the
growth of subservicers may make it easier for smaller
firms to enter the mortgage servicing market.
For most banking institutions that hold MSAs, the
MSA treatment under the revised capital rule gener-
ally has a minor impact. Based on the earlier analysis
of banks’ MSAs to CET1 ratios, the deduction
threshold does not affect the vast majority of bank-
ing institutions. As discussed, the increase in the risk
weight for a banking institution with an MSAs to
CET1 capital ratio below 10 percent could have a
relatively small effect, given that under the previous
regulatory capital framework the amount of MSAs
includable in regulatory capital was limited to the
lesser of 90 percent of the MSAs’ fair value or
100 percent of the MSAs’ carrying amount, poten-
tially resulting in an effective risk weight of up to
215 percent. For other banking institutions the
increase in the risk weight for MSAs could be more
significant starting in 2018. That said, Call Report
data as of June 30, 2015, adjusted to estimate the
impact of the fully phased-in regulatory capital
requirements, show that approximately 99 percent of
all insured depository institutions are above the
4.5 percent CET1 capital minimum ratio and
approximately 99 percent of all insured depository
institutions are above a 7 percent CET1 capital ratio,
which is equivalent to the 4.5 percent minimum
CET1 capital ratio plus the fully phased-in 2.5 per-
cent capital conservation buffer. Thus, the vast
majority of banking institutions would not face
restrictions on capital distributions and certain dis-
cretionary bonus payments under the revised capital
rule when accounting for the fully phased-in capital
requirements, including the revised MSA treatment.
Finally, the revised capital rule’s treatment of MSAs
generally does not impact banking institutions that
service mortgages that these firms originate and hold
for investment in their portfolio.
The revised capital rule is likely to have the greatest
continuing effect on banking institutions that want to
specialize as aggregators of MSAs. Such banking
institutions face incentives under the revised capital
rule to keep their servicing books under a certain size
because MSA values above certain thresholds must
be deducted from CET1 capital. Inasmuch as there
are economies of scale in mortgage servicing, it may
be difficult for certain smaller firms that want to spe-
cialize as aggregators of MSAs both to achieve an
efficient cost structure and to maintain an amount of
MSAs that is below the deduction threshold.
A pullback of aggregator banking institutions from
the MSA market could have effects on other firms
and on MSA pricing and liquidity. However, the
findings suggest that most banking institutions have
sufficient capital to comply effectively with the MSA
treatment under the revised capital rule. The
increased capital strength and resiliency of banking
institutions as a result of the revised capital rule will
also make it easier for institutions to navigate periods
of stress.
The extent to which a pullback by aggregators affects
the mortgage servicing market depends on the extent
to which other firms are interested in servicing mort-
gage loans. As noted earlier, the vast majority of
banking institutions have MSAs to CET1 capital
ratios well below 10 percent. These banking institu-
tions may be willing to increase their purchases of
MSAs, and indeed, small banks appear to be increas-
ing their MSA market share. Nonbanks may also be
interested in purchasing servicing rights.
To date, the mortgage servicing market appears to
have stayed competitive. On this point, figure 20 dis-
plays the evolution of a standard measure of market
concentration, the Herfindahl–Hirschman Index
(HHI).101 High values of this index suggest that the
industry is heavily dominated by a small number of
firms, whereas low values signal that the market
100NCUA capital requirements do not deduct any MSAs from regulatory capital.
101The HHI is defined as the sum of squares of individual firms’ market shares (expressed in percentage points) at a given point in time. These estimates will overstate the HHI because they are based only on the 30 largest firms. If they were based on all mortgage servicers, the HHI would be lower. Our estimates are similar to those calculated by the GAO. Nonbank Mortgage Ser-vicers, 65–67.
June 2016 35
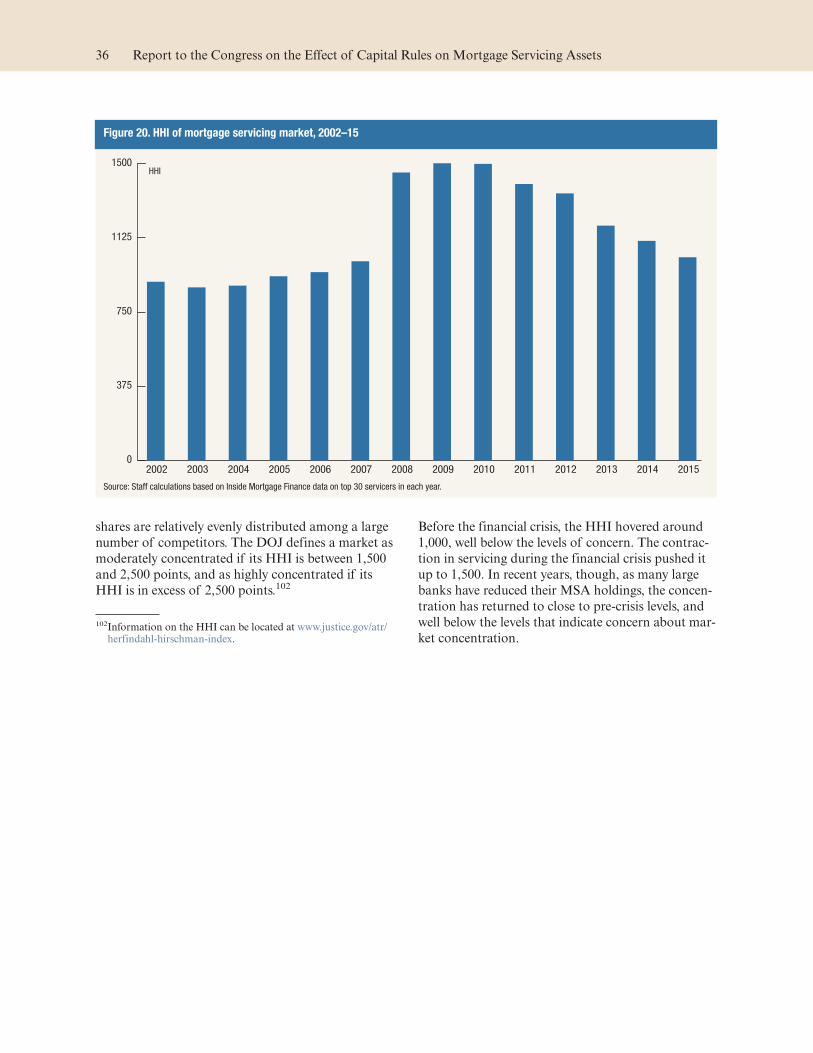
shares are relatively evenly distributed among a large
number of competitors. The DOJ defines a market as
moderately concentrated if its HHI is between 1,500
and 2,500 points, and as highly concentrated if its
HHI is in excess of 2,500 points.102
Before the financial crisis, the HHI hovered around
1,000, well below the levels of concern. The contrac-
tion in servicing during the financial crisis pushed it
up to 1,500. In recent years, though, as many large
banks have reduced their MSA holdings, the concen-
tration has returned to close to pre-crisis levels, and
well below the levels that indicate concern about mar-
ket concentration.
102Information on the HHI can be located at www.justice.gov/atr/herfindahl-hirschman-index.
Figure 20. HHI of mortgage servicing market, 2002–15
0
375
750
1125
1500
20152014201320122011201020092008200720062005200420032002
HHI
Source: Staff calculations based on Inside Mortgage Finance data on top 30 servicers in each year.
36 Report to the Congress on the Effect of Capital Rules on Mortgage Servicing Assets

Potential Impact of the Revised Capital Rule on Nonbanks
This section describes how the mortgage servicing
market might change if the revised capital rule were
also applied to nonbank firms. The analysis is a
hypothetical exercise based on estimates from public
filings. The federal banking agencies only have the
authority to set capital requirements for nonbanks
that are subject to the supervision of one of the agen-
cies, such as nonbank financial companies that the
FSOC has determined shall be supervised by the
Board.103 Other agencies have some ability to set
financial requirements for nonbank servicers. Under
its conservatorship authority, FHFA has the ability
to set financial strength requirements for the GSEs’
servicer counterparties. Ginnie Mae can also set crite-
ria for its servicer counterparties. Ginnie Mae and
FHFA recently enacted increases in these require-
ments, which took effect January 1, 2015,104 and
December 31, 2015,105 respectively. State regulators
have also proposed prudential standards that would
apply to nonbank servicers.106
Capital requirements for insured depository institu-
tions must be strong enough to limit the moral haz-
ard associated with government-provided deposit
insurance, which also tends to reduce the incentive
for private market participants to monitor the risk-
taking behavior of regulated banks. However, non-
bank firms, including nonbank servicers, do not have
access to deposit insurance and thus are more closely
monitored by a range of counterparties and stake-
holders. This difference implies that the capital
requirements that apply to banking institutions
would not necessarily be appropriate for nonbank
servicers.
If the revised capital rule were applied to nonbank
firms, the MSA treatment would likely affect non-
bank activity in the mortgage servicing market. How-
ever, the deduction of MSAs from regulatory capital
would prove far more consequential for nonbank ser-
vicers than the 250 percent risk weight for MSAs that
are not deducted. The discussion in this section,
therefore, focuses on the potential effect of the MSA
deduction approach.
The effect of this approach on nonbank servicers
depends on the structure of the nonbank servicer’s
balance sheet, which in turn depends on the servicer’s
corporate structure and business model. Broadly
speaking, nonbank servicers fall into three groups,
although most servicers are some combination of
these models. The first group consists of servicers
that have a REIT structure. The portfolios of REITs,
in order to meet REIT tax requirements, are heavily
weighted towards passive real-estate investments such
as MBS and whole loans held for investment. The
second group consists of firms that primarily special-
ize in servicing and that grow their portfolios by pur-
chasing MSAs in bulk. These firms have balance
sheets weighted heavily towards servicing advances
and MSAs. The third group consists of firms that
primarily originate mortgages, sell them into the sec-
ondary market, and retain the servicing rights. These
firms typically have portfolios of loans held for sale
in addition to MSAs and servicing advances.
Currently, aggregate holdings of MSAs by REITs are
small. REITs serviced 6 percent, measured by the
UPB, of mortgages serviced by nonbanks in 2015.107
However, direct REIT investments in MSAs
increased significantly in the wake of the 2013 IRS
PLR referenced earlier in this report. In particular,
REIT holdings of MSAs increased from $5 million in
103See 12 USC § 5365.104“Eligibility Requirements,” Ginnie Mae, www.ginniemae.gov/
doing_business_with_ginniemae/issuer_resources/how_to_become_an_issuer/Pages/eligibility_requirements.aspx/.
105Federal Housing Finance Agency, “Fannie Mae and Freddie Mac Issue New Eligibility Requirements for Seller/Servicers,” news release, May 20, 2015, www.fhfa.gov/Media/PublicAffairs/Pages/New-Eligibility-Requirements-for-SellerServicers.aspx.
106Conference of State Bank Supervisors and American Associa-tion of Residential Mortgage Regulators, “State Regulators Propose Prudential Regulatory Standards for Non-Bank Mort-gage Servicers,” news release, March 25, 2015, www.csbs.org/news/press-releases/pr2015/Pages/PR-032515.aspx.
107Tabulation based on Inside Mortgage Finance data of the top 50 holders of MSAs in 2015.
37
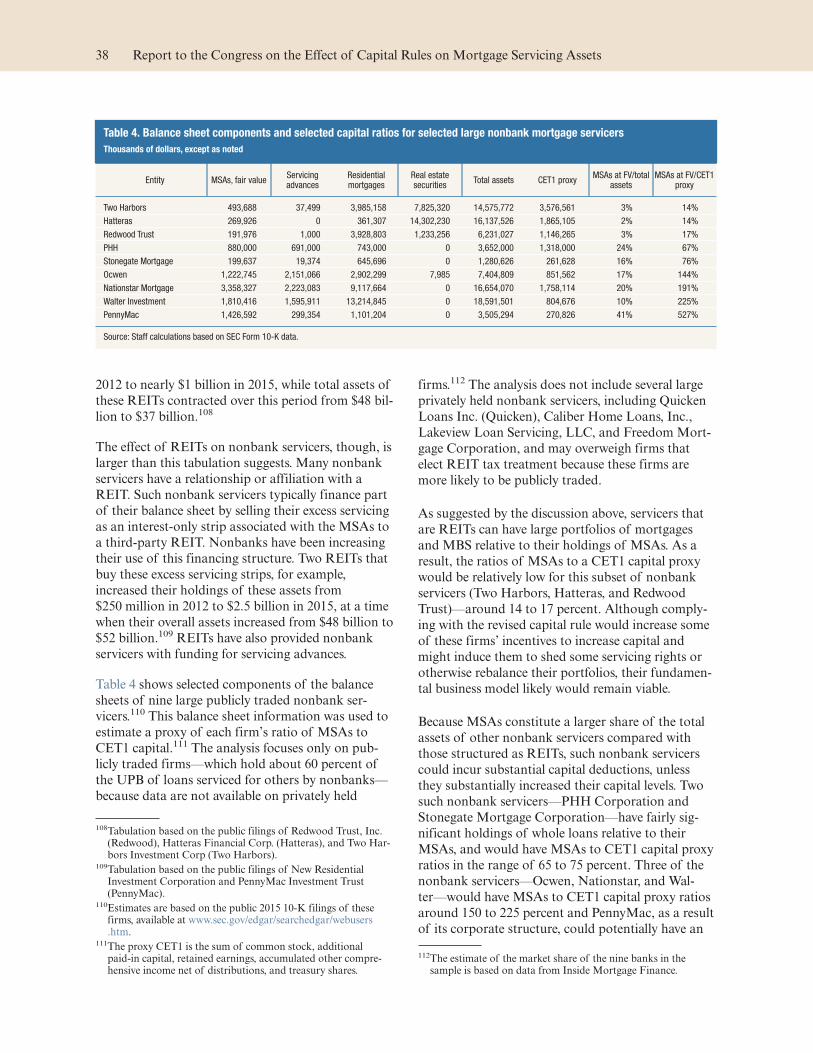
2012 to nearly $1 billion in 2015, while total assets of
these REITs contracted over this period from $48 bil-
lion to $37 billion.108
The effect of REITs on nonbank servicers, though, is
larger than this tabulation suggests. Many nonbank
servicers have a relationship or affiliation with a
REIT. Such nonbank servicers typically finance part
of their balance sheet by selling their excess servicing
as an interest-only strip associated with the MSAs to
a third-party REIT. Nonbanks have been increasing
their use of this financing structure. Two REITs that
buy these excess servicing strips, for example,
increased their holdings of these assets from
$250 million in 2012 to $2.5 billion in 2015, at a time
when their overall assets increased from $48 billion to
$52 billion.109 REITs have also provided nonbank
servicers with funding for servicing advances.
Table 4 shows selected components of the balance
sheets of nine large publicly traded nonbank ser-
vicers.110 This balance sheet information was used to
estimate a proxy of each firm’s ratio of MSAs to
CET1 capital.111 The analysis focuses only on pub-
licly traded firms—which hold about 60 percent of
the UPB of loans serviced for others by nonbanks—
because data are not available on privately held
firms.112 The analysis does not include several large
privately held nonbank servicers, including Quicken
Loans Inc. (Quicken), Caliber Home Loans, Inc.,
Lakeview Loan Servicing, LLC, and Freedom Mort-
gage Corporation, and may overweigh firms that
elect REIT tax treatment because these firms are
more likely to be publicly traded.
As suggested by the discussion above, servicers that
are REITs can have large portfolios of mortgages
and MBS relative to their holdings of MSAs. As a
result, the ratios of MSAs to a CET1 capital proxy
would be relatively low for this subset of nonbank
servicers (Two Harbors, Hatteras, and Redwood
Trust)—around 14 to 17 percent. Although comply-
ing with the revised capital rule would increase some
of these firms’ incentives to increase capital and
might induce them to shed some servicing rights or
otherwise rebalance their portfolios, their fundamen-
tal business model likely would remain viable.
Because MSAs constitute a larger share of the total
assets of other nonbank servicers compared with
those structured as REITs, such nonbank servicers
could incur substantial capital deductions, unless
they substantially increased their capital levels. Two
such nonbank servicers—PHH Corporation and
Stonegate Mortgage Corporation—have fairly sig-
nificant holdings of whole loans relative to their
MSAs, and would have MSAs to CET1 capital proxy
ratios in the range of 65 to 75 percent. Three of the
nonbank servicers—Ocwen, Nationstar, and Wal-
ter—would have MSAs to CET1 capital proxy ratios
around 150 to 225 percent and PennyMac, as a result
of its corporate structure, could potentially have an
108Tabulation based on the public filings of Redwood Trust, Inc. (Redwood), Hatteras Financial Corp. (Hatteras), and Two Har-bors Investment Corp (Two Harbors).
109Tabulation based on the public filings of New Residential Investment Corporation and PennyMac Investment Trust (PennyMac).
110Estimates are based on the public 2015 10-K filings of these firms, available at www.sec.gov/edgar/searchedgar/webusers.htm.
111The proxy CET1 is the sum of common stock, additional paid-in capital, retained earnings, accumulated other compre-hensive income net of distributions, and treasury shares.
112The estimate of the market share of the nine banks in the sample is based on data from Inside Mortgage Finance.
Table 4. Balance sheet components and selected capital ratios for selected large nonbank mortgage servicers
Thousands of dollars, except as noted
Entity MSAs, fair value Servicing advances
Residential mortgages
Real estate securities
Total assets CET1 proxy MSAs at FV/total
assetsMSAs at FV/CET1
proxy
Two Harbors 493,688 37,499 3,985,158 7,825,320 14,575,772 3,576,561 3% 14%
Hatteras 269,926 0 361,307 14,302,230 16,137,526 1,865,105 2% 14%
Redwood Trust 191,976 1,000 3,928,803 1,233,256 6,231,027 1,146,265 3% 17%
PHH 880,000 691,000 743,000 0 3,652,000 1,318,000 24% 67%
Stonegate Mortgage 199,637 19,374 645,696 0 1,280,626 261,628 16% 76%
Ocwen 1,222,745 2,151,066 2,902,299 7,985 7,404,809 851,562 17% 144%
Nationstar Mortgage 3,358,327 2,223,083 9,117,664 0 16,654,070 1,758,114 20% 191%
Walter Investment 1,810,416 1,595,911 13,214,845 0 18,591,501 804,676 10% 225%
PennyMac 1,426,592 299,354 1,101,204 0 3,505,294 270,826 41% 527%
Source: Staff calculations based on SEC Form 10-K data.
38 Report to the Congress on the Effect of Capital Rules on Mortgage Servicing Assets

MSAs to CET1 capital proxy ratio of around
525 percent. Thus, nonbank servicers without a
REIT structure would face pressures to increase their
capital levels or change their business models signifi-
cantly, or both, if they were subject to the revised
capital rule.
In the event that these nonbank servicers—other
than the three publicly traded REITs—left the mort-
gage servicing business, the concentration of the ser-
vicing industry, based on the HHI, would double,
from roughly 850 for the mortgage servicing industry
in 2015 to around 1,600.113 The analysis assumes, for
purposes of this exercise, that no new servicers enter
the market, and the portfolios of the nonbanks that
exit the market are spread across the remaining ser-
vicers in proportion to their current servicing share.
Although the increase in concentration is significant
under this scenario, it is generally consistent with the
HHI values in 2009 and 2010—the last time period
when nonbank servicers significantly reduced their
market share. Importantly, this higher value does not
appear to be problematic from a competition per-
spective, as DOJ guidelines consider markets with
HHIs between 1,500 and 2,500 to be moderately con-
centrated. Under these conditions, mortgage ser-
vicers would likely still have limited market power.
The assumptions underlying this exercise may not be
true in practice. For example, banking institution ser-
vicers may be reluctant to increase their market
share. In some cases, this reluctance may stem from
concerns about breaching the 10 percent deduction
threshold, particularly in a scenario where a banking
institution is considering acquiring the servicing
portfolio of a large nonbank. For example, as of the
fourth quarter of 2015, only three banking institu-
tion servicers that had a significant presence in the
servicing market would have been able to take on the
entire servicing portfolio of the two biggest nonbank
servicers (Nationstar and Walter) without the acquir-
ing banking institution breaching the deduction
threshold in the revised capital rule; only four bank-
ing institution servicers would have been able to take
on the entire servicing portfolio of any of the six
largest nonbank servicers (Nationstar, Walter, Penny-
Mac, Quicken, Ocwen, and PHH) without breaching
the threshold.114 In other cases, a banking institu-
tion’s reluctance to increase its servicing portfolio
might stem from the higher costs of servicing loans
and the banking institution’s experiences with non-
performing loans during and after the crisis. Offset-
ting this consideration to some extent is the fact that
the compensation for servicing loans might increase
after the nonbank firms left the market. This
increased compensation might offset any increases in
capital costs and might also induce new servicers to
enter the market.
113This estimate is based on Inside Mortgage Finance data on the top 50 servicers. The HHI presented earlier in the report was based on the top 30 servicers in order to maintain comparability across time. The HHI estimate in this section is lower than this earlier estimate because it is based on a larger number of servicers.
114We consider a servicer to have a significant presence in the ser-vicing market if it is listed in the Inside Mortgage Finance 2015 list of the top 50 servicers. Quicken’s MSA holdings are not publicly available because Quicken is a privately held company. For purposes of this calculation, Quicken’s MSA holdings are imputed from its mortgage servicing book as reported in Inside Mortgage Finance data, and from the relationship that holds for other nonbank servicers between their MSA holdings and their servicing book.
June 2016 39


Mortgage Servicing Assets Outside of the United States
The fact that MSAs are prominent in the United
States reflects the U.S. approach to mortgage finance.
Approximately 65 percent of first-lien mortgages in
the United States are held in securities guaranteed by
a GSE or Ginnie Mae.115 As discussed earlier in this
report, the fact that the GSEs and Ginnie Mae do
not service the mortgages in their securitized pools
necessitates a separate market for MSAs.
Other countries, however, have adopted mortgage
finance systems that do not create a considerable vol-
ume of MSAs.116 In particular, most non-U.S. coun-
tries use covered bonds rather than securitizations to
support their mortgage finance system. Covered
bonds are debt instruments primarily issued by banks
and secured by dedicated collateral such as mort-
gages. With a covered bond, however, the pool of
assets covering the bond remains on the issuer’s bal-
ance sheet and the issuance of the bond does not cre-
ate a separate MSA. In discussions with supervisory
authorities from other countries, they noted that
their supervised firms have negligible ratios of MSAs
to CET1 capital. These supervisors noted that these
amounts were likely attributable to the U.S. opera-
tions of their supervised banks, or were legacy
amounts associated with acquisitions.115Statistic calculated from table L.218 of the Financial Accounts
of the United States as the sum of lines 18 and 19 (GSEs and Agency- and GSE-backed mortgage pools) divided by (line 1, total liabilities, minus line 23, home equity loans).
116The International Financial Reporting Standards, which are the accounting standards for the consolidated financial statements
of all companies whose securities trade in a regulated market in the European Union, accommodates the creation of an MSA.
41

Analyses on Impact of the Revised Capital Rule
As mentioned above, the federal banking agencies
invited public comment on the proposed regulatory
capital treatment of MSAs, and addressed comments
on this approach in the final rule.
Under section 475 of the Federal Deposit Insurance
Corporation Improvement Act of 1991, the amount
of readily marketable purchased MSAs that a bank
may include in regulatory capital cannot be more
than 90 percent of their fair value.117 Section 475
provides the federal banking agencies with the
authority to remove the 90 percent limitation on pur-
chased MSAs, subject to a joint determination by the
agencies that its removal would not have an adverse
effect on the deposit insurance fund or the safety and
soundness of insured depository institutions. The
agencies evaluated the proposed treatment of MSAs
and determined that based on the conservative treat-
ment of MSAs under the revised capital rule, statu-
tory factors were consistent with a determination
that the 90 percent limitation could be removed.
In addition, the federal banking agencies considered
whether the revised capital rule appropriately reflects
the risks inherent in banking institutions’ business
models. Prior to issuing the revised capital rule, the
federal banking agencies conducted a pro-forma eco-
nomic impact analysis that showed that the vast
majority of small banking institutions would meet
the revised capital rule’s minimum CET1 capital
requirement of 4.5 percent plus the 2.5 percent capi-
tal conservation buffer on a fully phased-in basis,
including the deduction approach for MSAs. As pre-
viously noted in the discussion of the regulatory
capital treatment of MSAs, the agencies have long
limited the inclusion of MSAs and other intangible
assets in regulatory capital and believe the revised
capital rule’s treatment of MSAs contributes to the
safety and soundness of banking institutions by miti-
gating against MSA market value fluctuations that
may adversely affect banking institutions’ regulatory
capital base, particularly during periods of economic
distress.
Moreover, under the Regulatory Flexibility Act
(RFA), regulators must analyze the impact of signifi-
cant rules on small entities. Accordingly, the federal
banking agencies each conducted and published an
impact analysis. NCUA exempts credit unions with
total assets less than $100 million from the risk-based
capital requirement and determined that its rule
would not have a material impact on small credit
unions, consequently NCUA did not perform such
analysis.118
The impact analysis performed by the federal bank-
ing agencies depicted the aggregate effect on small
institutions of complying with the revised capital
rule. The economic impact analysis of the revised
capital rule considered its effect in its entirety, which
included the effect of changes to the MSA treatment
as one of many changes. The analysis was conducted
in a manner consistent with the RFA.
The OCC estimated that complying with the revised
capital rule would cost $55.4 million for OCC-
supervised institutions with assets of $500 million or
less. The OCC estimated that 41 small OCC-
supervised institutions would have a capital shortfall
of $163.6 million under the fully phased-in revised
capital rule. To estimate the cost of this capital short-
fall, the OCC calculated the approximate cost of rais-
ing this capital by considering the cost of losing tax
117Pub. L. No. 102-242, 105 Stat. 2236, 2386-87 (1991).
118NCUA risk-based capital requirements that will go into effect in 2019 will only apply to federally insured credit unions with total assets greater than $100 million. NCUA Interpretative Ruling and Policy Statement 15-1 amended the definition of small credit unions to those with assets less than $100 million. NCUA defined the investment in MSAs as a “small asset class.” Before finalizing risk-based capital requirements, NCUA identified 432 federally insured credit unions with assets over $100 million reporting MSAs ranging from less than 1 basis points to 132 basis points of total assets, with an average of 20 basis points of assets. In November 2015, NCUA provided a report to the House Financial Services Committee on the risk-based capital final rule containing further analysis of the rule. The report is available at www.ncua.gov/regulation-supervision/Documents/RBC/final-risk-based-capital-rule-report.pdf.
43
benefits when converting from debt to equity financ-
ing, which yielded a cost estimate of $0.9 million per
year for the full $163.6 million shortfall.
The Federal Reserve estimated that complying with
the revised capital rule would cost $27.3 million for
Federal Reserve-supervised institutions with assets of
$500 million or less. The Federal Reserve estimated
that nine small Federal Reserve-supervised institu-
tions would have a capital shortfall of $11.3 million
under the fully phased-in revised capital rule. To esti-
mate the cost of this capital shortfall, the Federal
Reserve calculated the approximate cost of raising
this capital by considering the cost of losing tax ben-
efits when converting from debt to equity financing,
which yielded a cost estimate of $6,391 per year for
the full $11.3 million shortfall.
In the RFA to the FDIC’s revised capital rule, the
FDIC estimated that complying with the revised
capital rule would impact approximately 74 FDIC-
supervised institutions with total assets of $500 mil-
lion or less (small FDIC-supervised institutions) that
did not hold sufficient capital to satisfy the require-
ments of the revised final rule. Those institutions,
which represented approximately 3 percent of small
FDIC-supervised institutions, collectively would need
to raise approximately $233 million in regulatory
capital to meet the minimum capital requirements of
the revised capital rule.119
The federal banking agencies published and invited
public comment on the treatment of MSAs under the
proposed revisions to the capital framework.120 The
federal banking agencies received numerous com-
ments on the proposal, including comments from
industry participants. The federal banking agencies
considered all substantive comments received on the
treatment of MSAs addressed in the preamble and
final rule published by the OCC and Federal Reserve,
and the interim final rule by the FDIC. NCUA’s pro-
posed and final rules reflect the analysis of each issue
that was presented by commenters.121
11979 Fed. Reg. 20,757 (April 14, 2014).12077 Fed. Reg. 52,792, 52,823 (August 30, 2012); 79 Fed. Reg.
11,183 (February 27, 2014); and 80 Fed. Reg. 4339 (January 27, 2015).
12178 Fed. Reg. 62,018, 62,069–62,070 (October 11, 2013); and 80 Fed. Reg. 66,625 (October 29, 2015).
44 Report to the Congress on the Effect of Capital Rules on Mortgage Servicing Assets
Recommendations for Legislative or Regulatory Actions
As reflected in the results of this study, MSA valua-
tions are inherently subjective and subject to uncer-
tainty, as they rely on assessments of future eco-
nomic variables. This reliance can lead to variance in
MSA valuations across firms and raises questions
regarding the ability of banking institutions to gener-
ate value from MSAs under adverse financial condi-
tions. These results support continued limitations on
the inclusion of MSAs in the regulatory capital of
banking institutions.
The current statutory framework provides sufficient
supervisory and regulatory tools for the federal bank-
ing agencies and NCUA to address developments in
the mortgage servicing market. Accordingly, the fed-
eral banking agencies and NCUA do not at this time
have any recommendations for additional legislative
or regulatory actions regarding the value of and abil-
ity to sell MSAs and the ability of banking institu-
tions to hold MSAs.
The past several years demonstrate, however, that the
mortgage servicing industry is evolving rapidly. The
federal banking agencies and NCUA will continue to
monitor developments in mortgage servicing industry
standards and practices, and will exercise their regu-
latory and supervisory authorities, as appropriate, to
pursue their respective statutory mandates to ensure
the safety and soundness of depository institutions
and the stability of the U.S. financial system.
45

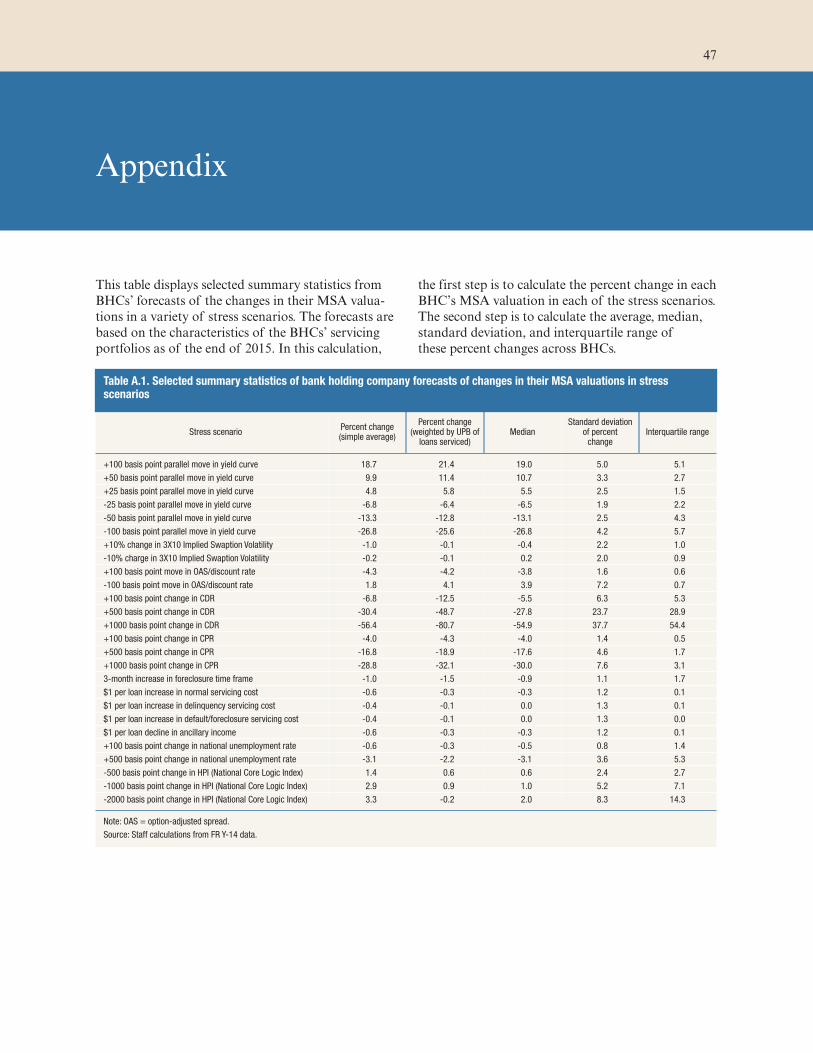
Appendix
This table displays selected summary statistics from
BHCs’ forecasts of the changes in their MSA valua-
tions in a variety of stress scenarios. The forecasts are
based on the characteristics of the BHCs’ servicing
portfolios as of the end of 2015. In this calculation,
the first step is to calculate the percent change in each
BHC’s MSA valuation in each of the stress scenarios.
The second step is to calculate the average, median,
standard deviation, and interquartile range of
these percent changes across BHCs.
Table A.1. Selected summary statistics of bank holding company forecasts of changes in their MSA valuations in stress scenarios
Stress scenario Percent change (simple average)
Percent change (weighted by UPB of
loans serviced) Median
Standard deviation of percent
change Interquartile range
+100 basis point parallel move in yield curve 18.7 21.4 19.0 5.0 5.1
+50 basis point parallel move in yield curve 9.9 11.4 10.7 3.3 2.7
+25 basis point parallel move in yield curve 4.8 5.8 5.5 2.5 1.5
-25 basis point parallel move in yield curve -6.8 -6.4 -6.5 1.9 2.2
-50 basis point parallel move in yield curve -13.3 -12.8 -13.1 2.5 4.3
-100 basis point parallel move in yield curve -26.8 -25.6 -26.8 4.2 5.7
+10% change in 3X10 Implied Swaption Volatility -1.0 -0.1 -0.4 2.2 1.0
-10% charge in 3X10 Implied Swaption Volatility -0.2 -0.1 0.2 2.0 0.9
+100 basis point move in OAS/discount rate -4.3 -4.2 -3.8 1.6 0.6
-100 basis point move in OAS/discount rate 1.8 4.1 3.9 7.2 0.7
+100 basis point change in CDR -6.8 -12.5 -5.5 6.3 5.3
+500 basis point change in CDR -30.4 -48.7 -27.8 23.7 28.9
+1000 basis point change in CDR -56.4 -80.7 -54.9 37.7 54.4
+100 basis point change in CPR -4.0 -4.3 -4.0 1.4 0.5
+500 basis point change in CPR -16.8 -18.9 -17.6 4.6 1.7
+1000 basis point change in CPR -28.8 -32.1 -30.0 7.6 3.1
3-month increase in foreclosure time frame -1.0 -1.5 -0.9 1.1 1.7
$1 per loan increase in normal servicing cost -0.6 -0.3 -0.3 1.2 0.1
$1 per loan increase in delinquency servicing cost -0.4 -0.1 0.0 1.3 0.1
$1 per loan increase in default/foreclosure servicing cost -0.4 -0.1 0.0 1.3 0.0
$1 per loan decline in ancillary income -0.6 -0.3 -0.3 1.2 0.1
+100 basis point change in national unemployment rate -0.6 -0.3 -0.5 0.8 1.4
+500 basis point change in national unemployment rate -3.1 -2.2 -3.1 3.6 5.3
-500 basis point change in HPI (National Core Logic Index) 1.4 0.6 0.6 2.4 2.7
-1000 basis point change in HPI (National Core Logic Index) 2.9 0.9 1.0 5.2 7.1
-2000 basis point change in HPI (National Core Logic Index) 3.3 -0.2 2.0 8.3 14.3
Note: OAS = option-adjusted spread.
Source: Staff calculations from FR Y-14 data.
47

0616
Board of Governors of the Federal Reserve System
www.federalreserve.gov
Federal Deposit Insurance Corporation
www.fdic.gov
Office of the Comptroller of the Currency
www.occ.gov
National Credit Union Administration
www.ncua.gov
Mossavar-Rahmani Center for Business & Government Weil Hall | Harvard Kennedy School | www.hks.harvard.edu/mrcbg
M-RCBG Associate Working Paper Series | No. 42
The views expressed in the M-RCBG Fellows and Graduate Student Research Paper Series are those of the author(s) and do not necessarily reflect those of the Mossavar-Rahmani Center for Business &
Government or of Harvard University. The papers in this series have not undergone formal review and approval; they are presented to elicit feedback and to encourage debate on important public policy challenges. Copyright belongs to the author(s). Papers may be downloaded for personal use only.
What’s Behind the Non-Bank Mortgage Boom?
Marshall Lux Robert Greene
June 2015
Page 1 of 38
What’s Behind the Non-Bank Mortgage Boom? June 1, 2015 Marshall Lux Senior Fellow, Mossavar-Rahmani Center for Business and Government, John F. Kennedy
School of Government, Harvard University Senior Advisor, The Boston Consulting Group [email protected] Robert Greene Research Assistant, Mossavar-Rahmani Center for Business and Government, John F. Kennedy
School of Government, Harvard University Master in Public Policy candidate, John F. Kennedy School of Government, Harvard University [email protected] Abstract Mortgages constitute a large, complex, and controversial market in the United States, shaped largely by federal policymaking. Since 2010, the role of non-banks – a term commonly used to define firms unassociated with a depository institution – in the overall mortgage market has grown handedly. In 2014, non-banks accounted for over 40 percent of total originations in terms of dollar volume versus 12 percent in 2010. Of the 40 largest servicers, 16 were non-banks, accounting for 20.5 percent of the total market and 28 percent of outstanding top-40 servicing balances, versus just 8 percent in 2010. We find that both regulatory factors and market factors are helping drive the non-bank boom, and identify key distinctions between pre-crisis non-banks and non-banks now. Today’s non-banks are: 1) subject to much more regulation and supervision; 2) more active in mortgage servicing than ever before; and 3) using technology to transform the mortgage market. Without non-banks, today’s sluggish mortgage market would be much less vibrant, and our analysis reveals positive impacts of non-banks on customers. However, non-banks’ growing involvement in riskier non-prime FHA-insured originations is concerning. And while reducing the counterparty risk non-banks pose to Fannie Mae and Freddie Mac is a worthwhile policy goal, implementing bank-like standards for non-banks is not the best strategy to substantially mitigate risks in the housing system, and could stunt innovation. Instead, reforming the GSEs and FHA insurance is critical to reducing both counterparty and borrower default risk. Policymakers should act to do so, embrace non-banks, and address unintended regulatory impacts driving depository institutions out of the market. JEL Codes: G21, G23, G28, G32 Acknowledgements We deeply thank Robert Glauber and Micah Jindal for their critical role in guiding our research, Edward Pinto for both data and his advice, and Darryl Getter for helpful feedback. We also gratefully acknowledge the support and insights of Ashwin Adarkar, Steve Freiberg, John Haigh, Caroline Harris-Gibson, David Kaden, Scott Leland, Brian Marein, Andrew McGloin, Neil Mehta, Jennifer Nash, Hester Peirce, Nicholas Rust, and Richard Zeckhauser.
Page 2 of 38
I. Introduction
In the United States, residential mortgages are among the most common and most important financial products. Worth $9.8 trillion outstanding as of year-end 2014, residential mortgages constitute one of the largest financial markets in the U.S.1 They are not just big in size; they are big in controversy. Mortgages were at the heart of the 2008-09 subprime crisis that led to the global financial meltdown and subsequent recession.
In the lead-up to that crisis, non-banks – a term we will use throughout this working paper for financial institutions that operate outside of, and are unaffiliated with, depository institutions – played a substantial role in the origination of subprime mortgages. We found that in 2006 – the height of the subprime boom – of the top 25 subprime lenders, representing 90.5 percent of the dollar volume of 2006 subprime originations, 15 were non-banks not affiliated with a depository institution, accounting for 42.5 percent of total subprime loans.2 Yet in 2006, non-banks accounted for just 30 percent of originations, according to Goldman Sachs.3 Of the 15 largest non-bank subprime originators, most expired during the crisis, including the two largest.4
By 2010, the subprime mortgage market had dissipated, and non-banks were responsible
for just 12 percent of mortgage originations.5 Since then, non-banks’ market share in mortgage originations has skyrocketed, increasing to 42 percent in 2014.6 Non-banks’ share of the mortgage-servicing market, largely dominated by depository institutions and their subsidiaries through the mid- and late 2000s, surged amongst the top 40 servicers – which accounted for 73 percent of the overall 2014 servicing market – from 8 percent in 2010 to 28 percent in 2014.7 Some policymakers have expressed a sense of growing alarm about non-banks’ increased participation in the mortgage market;8 memories of subprime non-bank lenders and their risky practices remain fresh. Regulators have moved to regulate non-banks using bank-like rules to reduce counterparty risk; for example, the Federal Housing Finance Administration (FHFA) – tasked with ensuring the safety and soundness of the housing government sponsored enterprises (GSEs) – recently proposed minimum capital standards for non-bank mortgage originators and servicers, and in May 2015, the GSEs adopted these proposed standards.9
1 Board of Governors of the Federal Reserve System, Financial Accounts of the United States, T.217 (Mar. 2015). 2 Inside Mortgage Finance data (authors’ calculations; ranks and percentages calculated in terms of dollar volume). 3 See Ryan N. Nash & Eric Beardsley, The Future of Finance: The rise of the new Shadow Bank, Goldman Sachs Equity Research (Mar. 2015), 53 (citing Inside Mortgage Finance and Goldman Sachs Investment Research data; percentage calculated in terms of total dollar volume of 2006 originations). 4 Inside Mortgage Finance data (authors’ calculations; ranks and percentages calculated in terms of dollar volume). 5 Ibid. (subprime market activity was “insufficient” to record from 2009 to 2012, according to Inside Mortgage Finance’s Mortgage Market Statistical Annual, 2013); Nash & Beardsley, supra note 3, at 53 (citing Inside Mortgage Finance and Goldman Sachs Investment Research data; percentage calculated in terms of total dollar volume of 2010 originations). 6 Ibid. (percentage calculated in terms of total dollar volume of 2014 originations). 7 Inside Mortgage Finance data (authors’ calculations; ranks and percentages calculated in terms of dollar volume). 8 See, U.S. House Committee on Oversight & Government Reform, Office of Rep. Elijah E. Cummings, Ranking Member, Cummings and Warren Request Investigation into Non-Bank Mortgage Servicing Industry (Oct. 2014). 9 See FHFA, Proposed Minimum Financial Requirements for Enterprise Seller/Servicers (Jan. 2015). See also Freddie Mac, Bulletin to Freddie Mac Sellers and Servicers, Subject: Seller/Servicer Eligibility (May 20, 2015); Fannie Mae, Servicing Guide Announcement (SVC-2015-08, May 20, 2015).

Page 3 of 38
To better understand the causes and consequences of the non-bank surge, and how
policymakers should react, we explored data from the American Enterprise Institute’s (AEI) International Center on Housing Risk, the Consumer Financial Protection Bureau (CFPB), Goldman Sachs, Inside Mortgage Finance, and other sources. We also surveyed and synthesized current research on the U.S. mortgage market. We concluded that efforts to further tighten non-bank mortgage originator and servicer – firms that hold, oftentimes through purchasing from the originator, mortgage servicing rights (MSRs) (contractual agreements giving the holder the right to handle mortgage collection and accounting in exchange for a payment) – regulation fail to take into account critical issues and nuances, and do not address large, underlying sources of risks in the U.S. housing finance system.
Through our analysis, we found that the non-banks of today are very different from the
non-banks of the subprime era. Prior to the crisis, fraudulent activities by both banks and non-banks were rife; non-banks were not heavily involved in mortgage servicing; technology was not vastly improving customer experience; Securities and Exchange Commission-regulated securities holding companies (SHCs) – that is, Wall Street investment banks – played a substantial role in the mortgage market; independent non-bank originators and servicers lacked a federal financial regulator; and some of these firms were deeply engaged in selling subprime mortgages, often in an imprudent fashion. Today, all non-bank mortgage originators and servicers are regulated by the CFPB and subject to strenuous examinations (and to heightened state regulation). Given that “deep” subprime originations have all but vanished,10 non-banks largely do not engage in that business, and have lower risk profiles than before the crisis. Most importantly, technology and innovation play critical roles in attracting and holding consumer customers – and thus market success – for many non-banks. We discovered that non-banks play a unique role in the mortgage industry and that, without their growth over the last few years, purchase mortgage originations would have likely declined substantially in 2014.
Our analysis reveals the positive impact of non-banks on customer experience. However,
our assessment of FICO score data provided to us by AEI’s International Center on Housing Risk reveals that higher-risk Federal Housing Administration (FHA)-backed loans – backed 100 percent by government – have begun to account for a disproportionate share of non-bank originations. In the event of a housing market downturn, an excessive proliferation of risky FHA-insured loans to non-creditworthy borrowers could result in system-wide risk by bringing about higher rates of defaults that, in turn, could bring about counterparty risk. This concern should draw the focus of policymakers.
It is now seven years after the crisis and almost five after the regulatory overhaul – enough time to begin to judge the effects of the regulation that followed the financial crisis. Throughout our analysis, we attempt to answer some important questions: What kinds of institutions, banks or non-banks, are involved in the various parts of the mortgage industry? How has the structure of the industry changed? What regulatory factors are driving these changes? What effect have new entrants had? Are calls for heightened non-bank mortgage originator 10 See Yuliya Demyanyk and Daniel Kolliner, FHA Lending Rebounds in Wake of Subprime Crisis, Federal Reserve Bank of Cleveland (Apr. 2015).
Page 4 of 38
regulations warranted? Will new non-bank servicer and seller requirements improve the long-term stability of the U.S. mortgage market? How should regulators balance safety and soundness concerns with the need for a regulatory climate that prizes and fosters innovation? II. A Brief History of the U.S. Mortgage Market
Before examining recent trends and attempting to examine these questions, an overview of how the U.S. mortgage market evolved and currently operates is necessary. It has been shaped by a history of heavy and ever-changing public sector involvement for nearly a century.
a) From post-depression to pre-subprime
The roots of the current system go back to the Great Depression, which saw the
destruction and reconstruction of a banking system that, at the time, provided mortgages for homeownership. In response, Congress passed the National Housing Act of 1934, which created the FHA to insure loans, and the Federal National Mortgage Association (Fannie Mae) (chartered in 1938) to purchase those loans, thus greatly enhancing liquidity in the mortgage market.11 At first a down payment of 20 percent was required, but this was soon lowered.12 During the mid-1900s, Fannie Mae borrowed to purchase mortgages adhering to this and other FHA standards.13
In response to the high budgetary costs of this system, President Johnson in 1968 recast Fannie Mae into a hybrid vehicle – a publicly traded, federally chartered GSE.14 Consequently, federal guarantees of Fannie Mae loans could be taken off the budget.15 The shadow of federal sponsorship entailed implicit government support, which would eventually help enable Fannie Mae to hold a very small amount of capital relative to its assets.16 The Department of Housing and Urban Development (HUD) tasked the GSEs to not only engage in promoting low- and middle-income family homeownership, and also to obtain “reasonable economic return.”17 Also in 1968, Ginnie Mae was created within HUD to guarantee payments on mortgage-backed securities (MBS) collateralized by mortgages guaranteed by the FHA and the Department of Veterans Affairs (VA); meanwhile, Fannie Mae would purchase government-insured mortgages in an effort to boost mortgage access.18 In 1970, FHA’s mission altered to promote even greater home ownership for low-income families.19
11 See Thomas N. Herzog, History of Mortgage Finance With an Emphasis on Mortgage Insurance (2009), at 20 & 34. 12 See ibid., at 20-21; See also Financial Crisis Inquiry Commission, Financial Crisis Inquiry Report, 2011 [hereinafter “FCIC Report”], at 38. 13 Ibid.; Herzog, supra note 11. 14 FCIC Report, supra note 12. 15 Ibid. 16 See Lawrence J. White, On Truly Privatizing Fannie Mae and Freddie Mac: Why It's Important, and How to Do It (Presented at the Conference on "Fixing the Housing Finance System," Wharton School, University of Pennsylvania, Apr. 2005), at 5-6 & 10-12. 17 FCIC Report, supra note 12, at 40-41 (citing 12 U.S.C. 1723a[h]) (amended 1992)). 18 See U.S. Government Accountability Office, Fannie Mae and Freddie Mac: Analysis of Options for Revising the Housing Enterprises’ Long-term Structures (GAO-09-782, Sep. 2009), at 13; FCIC Report, supra note 12, at 38-39. 19 See Mark Calabria, Fixing Mortgage Finance: What to Do with the Federal Housing Administration? (Cato Institute Briefing Papers, No. 123, Feb. 2012), at 3.
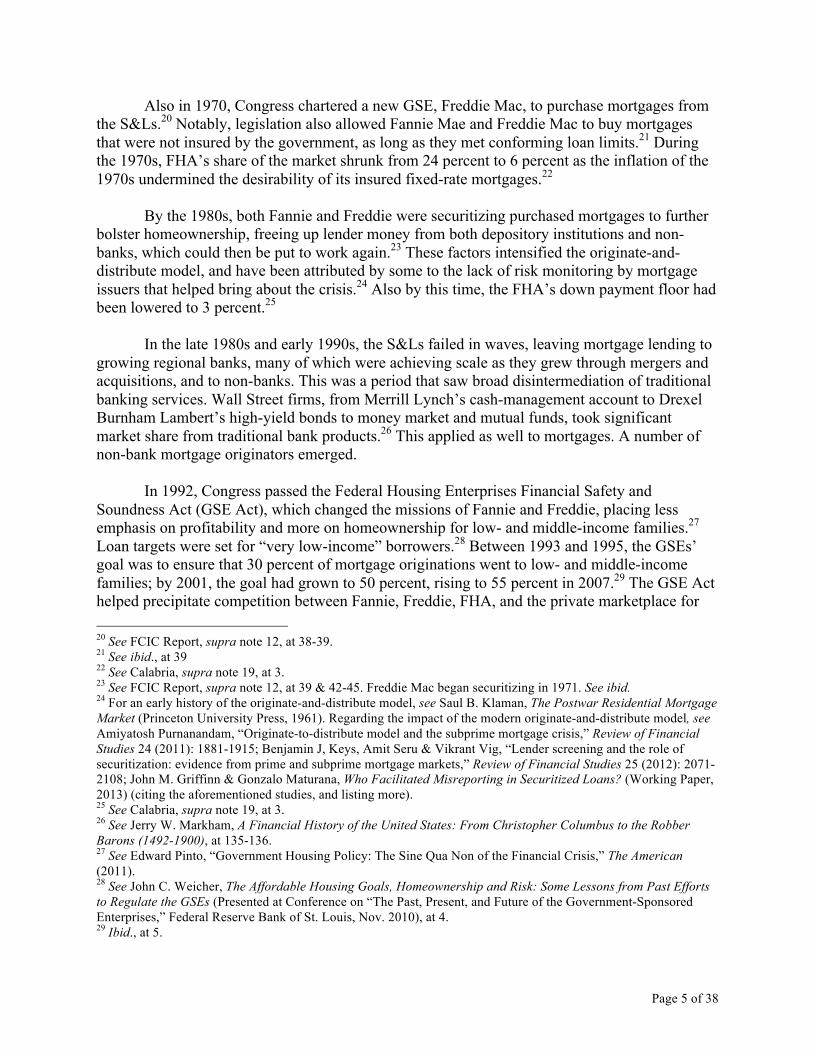
Page 5 of 38
Also in 1970, Congress chartered a new GSE, Freddie Mac, to purchase mortgages from the S&Ls.20 Notably, legislation also allowed Fannie Mae and Freddie Mac to buy mortgages that were not insured by the government, as long as they met conforming loan limits.21 During the 1970s, FHA’s share of the market shrunk from 24 percent to 6 percent as the inflation of the 1970s undermined the desirability of its insured fixed-rate mortgages.22
By the 1980s, both Fannie and Freddie were securitizing purchased mortgages to further
bolster homeownership, freeing up lender money from both depository institutions and non-banks, which could then be put to work again.23 These factors intensified the originate-and-distribute model, and have been attributed by some to the lack of risk monitoring by mortgage issuers that helped bring about the crisis.24 Also by this time, the FHA’s down payment floor had been lowered to 3 percent.25
In the late 1980s and early 1990s, the S&Ls failed in waves, leaving mortgage lending to growing regional banks, many of which were achieving scale as they grew through mergers and acquisitions, and to non-banks. This was a period that saw broad disintermediation of traditional banking services. Wall Street firms, from Merrill Lynch’s cash-management account to Drexel Burnham Lambert’s high-yield bonds to money market and mutual funds, took significant market share from traditional bank products.26 This applied as well to mortgages. A number of non-bank mortgage originators emerged.
In 1992, Congress passed the Federal Housing Enterprises Financial Safety and Soundness Act (GSE Act), which changed the missions of Fannie and Freddie, placing less emphasis on profitability and more on homeownership for low- and middle-income families.27 Loan targets were set for “very low-income” borrowers.28 Between 1993 and 1995, the GSEs’ goal was to ensure that 30 percent of mortgage originations went to low- and middle-income families; by 2001, the goal had grown to 50 percent, rising to 55 percent in 2007.29 The GSE Act helped precipitate competition between Fannie, Freddie, FHA, and the private marketplace for 20 See FCIC Report, supra note 12, at 38-39. 21 See ibid., at 39 22 See Calabria, supra note 19, at 3. 23 See FCIC Report, supra note 12, at 39 & 42-45. Freddie Mac began securitizing in 1971. See ibid. 24 For an early history of the originate-and-distribute model, see Saul B. Klaman, The Postwar Residential Mortgage Market (Princeton University Press, 1961). Regarding the impact of the modern originate-and-distribute model, see Amiyatosh Purnanandam, “Originate-to-distribute model and the subprime mortgage crisis,” Review of Financial Studies 24 (2011): 1881-1915; Benjamin J, Keys, Amit Seru & Vikrant Vig, “Lender screening and the role of securitization: evidence from prime and subprime mortgage markets,” Review of Financial Studies 25 (2012): 2071-2108; John M. Griffinn & Gonzalo Maturana, Who Facilitated Misreporting in Securitized Loans? (Working Paper, 2013) (citing the aforementioned studies, and listing more). 25 See Calabria, supra note 19, at 3. 26 See Jerry W. Markham, A Financial History of the United States: From Christopher Columbus to the Robber Barons (1492-1900), at 135-136. 27 See Edward Pinto, “Government Housing Policy: The Sine Qua Non of the Financial Crisis,” The American (2011). 28 See John C. Weicher, The Affordable Housing Goals, Homeownership and Risk: Some Lessons from Past Efforts to Regulate the GSEs (Presented at Conference on “The Past, Present, and Future of the Government-Sponsored Enterprises,” Federal Reserve Bank of St. Louis, Nov. 2010), at 4. 29 Ibid., at 5.
Page 6 of 38
low- and middle-income family market share, which resulted in much lower and even zero-down payments.30 The FHA lost market share as the GSEs introduced these products.31
Conforming loans began to make up a smaller portion of large depository institutions’ and large non-banks’ mortgage originations throughout the mid-2000s.32 But depository institutions – banks, credit unions, S&Ls – still made the vast majority of mortgage originations, and accounted for 84 percent of originations amongst the 40 largest originators in 2005.33 However, during this time, non-banks also became active market participants.34
b) Non-banks and the subprime crisis In the years leading up to the crisis, housing prices rose dramatically, lending standards
slipped, and both banks and non-banks, prudent and predatory lenders, found themselves sucked into the mortgage bubble. During this time, increasing home prices and loose credit, along with government-induced lower underwriting standards, fueled a massive surge in mortgage market participation. Originations increased 22 percent between 2004 and 200635 (there are two types of mortgage originations: purchase mortgages, which involve a long-term loan to buy a house and were dominant in the years leading up to the crisis; and refinancing, that is replacing the original mortgage with a loan with new terms). Non-conforming, private-label loans grew to account for more and more of the market; the GSEs’ market share of mortgages declined from 57 percent in 2003 to 37 percent in 2006.36
Pre-crisis capital rules further incentivized increased exposure to mortgages of lower
credit quality because of risk-weighting mechanisms that acted to further incentivize homeownership.37 From 2005 to 2008, of the top 40 servicers – which accounted for 72.8 and 80.0 percent of the servicing market in 2005 and 2008, respectively – depository institutions’ holdings of outstanding mortgage servicing obligations stayed relatively constant, between 85 and 89 percent.38 Non-banks were relatively non-existent in the pre-crisis servicing market.
Yet according to Goldman Sachs research, non-banks made up 30 percent of originations
in dollar volume during 2006, the height of the subprime boom.39 That year, of the 25 largest subprime lenders, 15 were independent non-banks, accounting for 42.5 percent of all subprime mortgages originated in 2006 – a clearly disproportionate share.40 However, it is also worth 30 See FCIC Report, supra note 12, at 454-456; Calabria, supra note 19, at 4. 31 See ibid. 32 Inside Mortgage Finance data. 33 Ibid. (authors’ calculations; ranks and percentages calculated in terms of dollar volume). 34 Ibid. 35 Ibid (in terms of dollar volume). 36 FCIC Report, supra note 12, at 105. 37 See Prasad Krishnamurthy, “Rules, Standards, and Complexity in Capital Regulation,” Journal of Legal Studies 43 (Jun. 2014): S273-S296. 38 Inside Mortgage Finance data (authors’ calculations; ranks and percentages calculated in terms of dollar volume). 39 Nash & Beardsley, supra note 3, at 53 (citing Inside Mortgage Finance and Goldman Sachs Investment Research data). 40 Inside Mortgage Finance data (authors’ calculations; rank and percentages calculated in terms of dollar volume). The 25 largest subprime originators accounted for 90.5 percent of the market. Ibid.
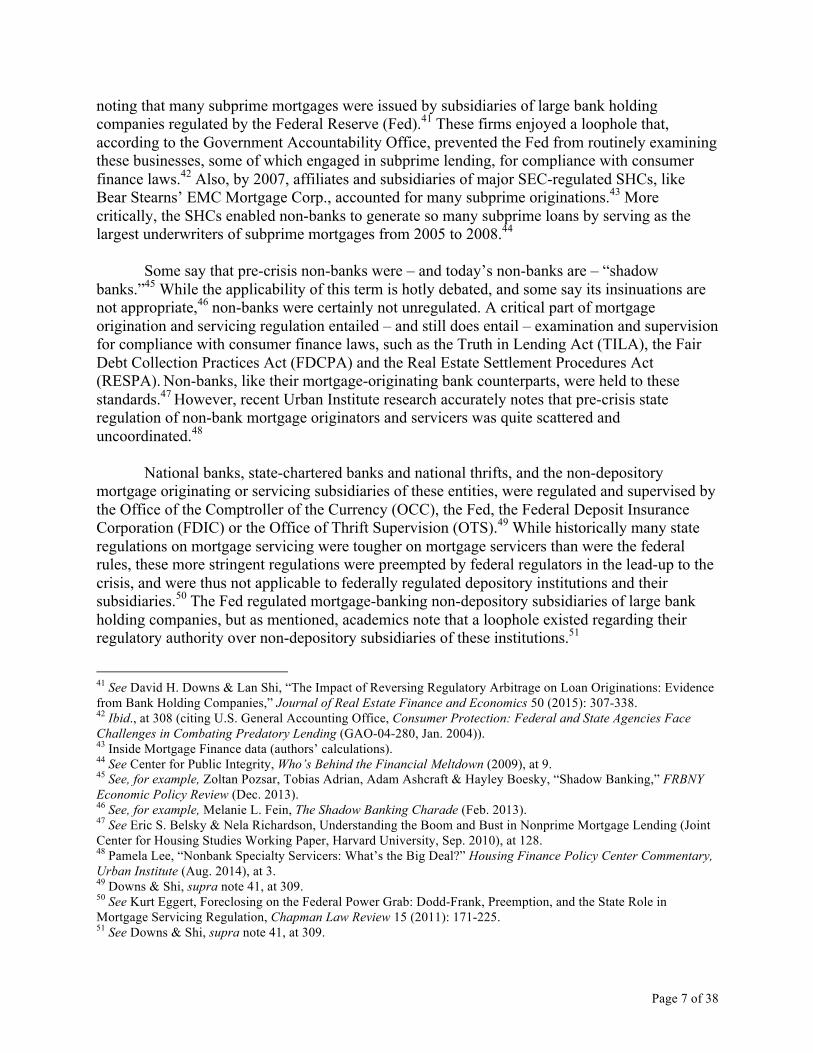
Page 7 of 38
noting that many subprime mortgages were issued by subsidiaries of large bank holding companies regulated by the Federal Reserve (Fed).41 These firms enjoyed a loophole that, according to the Government Accountability Office, prevented the Fed from routinely examining these businesses, some of which engaged in subprime lending, for compliance with consumer finance laws.42 Also, by 2007, affiliates and subsidiaries of major SEC-regulated SHCs, like Bear Stearns’ EMC Mortgage Corp., accounted for many subprime originations.43 More critically, the SHCs enabled non-banks to generate so many subprime loans by serving as the largest underwriters of subprime mortgages from 2005 to 2008.44
Some say that pre-crisis non-banks were – and today’s non-banks are – “shadow banks.”45 While the applicability of this term is hotly debated, and some say its insinuations are not appropriate,46 non-banks were certainly not unregulated. A critical part of mortgage origination and servicing regulation entailed – and still does entail – examination and supervision for compliance with consumer finance laws, such as the Truth in Lending Act (TILA), the Fair Debt Collection Practices Act (FDCPA) and the Real Estate Settlement Procedures Act (RESPA). Non-banks, like their mortgage-originating bank counterparts, were held to these standards.47 However, recent Urban Institute research accurately notes that pre-crisis state regulation of non-bank mortgage originators and servicers was quite scattered and uncoordinated.48
National banks, state-chartered banks and national thrifts, and the non-depository
mortgage originating or servicing subsidiaries of these entities, were regulated and supervised by the Office of the Comptroller of the Currency (OCC), the Fed, the Federal Deposit Insurance Corporation (FDIC) or the Office of Thrift Supervision (OTS).49 While historically many state regulations on mortgage servicing were tougher on mortgage servicers than were the federal rules, these more stringent regulations were preempted by federal regulators in the lead-up to the crisis, and were thus not applicable to federally regulated depository institutions and their subsidiaries.50 The Fed regulated mortgage-banking non-depository subsidiaries of large bank holding companies, but as mentioned, academics note that a loophole existed regarding their regulatory authority over non-depository subsidiaries of these institutions.51
41 See David H. Downs & Lan Shi, “The Impact of Reversing Regulatory Arbitrage on Loan Originations: Evidence from Bank Holding Companies,” Journal of Real Estate Finance and Economics 50 (2015): 307-338. 42 Ibid., at 308 (citing U.S. General Accounting Office, Consumer Protection: Federal and State Agencies Face Challenges in Combating Predatory Lending (GAO-04-280, Jan. 2004)). 43 Inside Mortgage Finance data (authors’ calculations). 44 See Center for Public Integrity, Who’s Behind the Financial Meltdown (2009), at 9. 45 See, for example, Zoltan Pozsar, Tobias Adrian, Adam Ashcraft & Hayley Boesky, “Shadow Banking,” FRBNY Economic Policy Review (Dec. 2013). 46 See, for example, Melanie L. Fein, The Shadow Banking Charade (Feb. 2013). 47 See Eric S. Belsky & Nela Richardson, Understanding the Boom and Bust in Nonprime Mortgage Lending (Joint Center for Housing Studies Working Paper, Harvard University, Sep. 2010), at 128. 48 Pamela Lee, “Nonbank Specialty Servicers: What’s the Big Deal?” Housing Finance Policy Center Commentary, Urban Institute (Aug. 2014), at 3. 49 Downs & Shi, supra note 41, at 309. 50 See Kurt Eggert, Foreclosing on the Federal Power Grab: Dodd-Frank, Preemption, and the State Role in Mortgage Servicing Regulation, Chapman Law Review 15 (2011): 171-225. 51 See Downs & Shi, supra note 41, at 309.
Page 8 of 38
In 2007 and 2008, home prices declined and mortgage originations fell drastically,
wreaking repercussions on the financial system, then the economy. Homeowners stopped paying, and the sharp decline in down payments that had occurred worsened the severity of the crisis, as borrowers who make low down payments are significantly more likely to default.52 The Financial Crisis Inquiry Commission (FCIC) reported that in 2008 and 2009, median conforming loans experienced serious delinquency rates of 1 and 2.5 percent, respectively.53 The FCIC also found that the median serious delinquency rate for FHA loans remained at roughly 6 percent; and for subprime loans, delinquencies soared from 29 to 39 percent.54 However, these statistics do not reveal that FHA-insured originations to borrowers with FICO scores under 600 (referred to by Cleveland Fed researchers as “deep subprime”) and private originations to borrowers of this risk profile experienced similar default rates.55 Similarly, FHA-insured originations and private originations to “subprime” borrowers (those with FICO scores between 601 and 660) also experienced similar crisis default rates.56 Notably, between 2002 and 2007, the delinquency rate of FHA mortgages was higher than that of subprime.57 And of all FHA-insured loans originated in 2007, 36 percent have experienced default.58
Overall, as mortgage delinquencies accelerated, many financial institutions were exposed
to enormous leveraged losses, and as defaults continued, the MBS market imploded. A number of major depository institutions with mortgage businesses were close to failing when they were acquired, like Washington Mutual by JPMorgan Chase & Co. and Countrywide by Bank of America. Many firms engaged in the mortgage market failed outright. Because of the contagion caused by the meltdown, Bear Stearns was taken over by Chase, Lehman Brothers failed, and Bank of America bought Merrill Lynch. Many non-bank originators failed. The two GSEs, Fannie Mae and Freddie Mac, that securitized the most mortgages leading up to the crisis all but collapsed in September 2008 and were seized by the federal government; they are still overseen under a Treasury conservatorship by the FHFA (the primary federal regulator of Fannie and Freddie, established in 2008 to consolidate regulatory authority from HUD and the Office of Federal Housing Enterprise Oversight [OFHEO] over the GSEs).59
To access Federal Reserve emergency funding, the major SHCs – Goldman Sachs and Morgan Stanley – converted to bank holding companies in 2008, and thus the pre-crisis non-
52 See, for example, Brent Smith, “Mortgage Reform and the Countercyclical Role of the Federal Housing Administration's Mortgage Mutual Insurance Fund,” FRB Richmond Economic Quarterly 97 (First Quarter 2011): 95-110; Christopher J. Meyer et al., The Rise in Mortgage Defaults (Finance and Economics Discussion Series, Divisions of Research & Statistics and Monetary Affairs, Federal Reserve Board, 2008-59, Nov. 2008). 53 FCIC Report, supra note 12, at 218. 54 Ibid. 55 Demyanyk and Kolliner, supra note 10. 56 Ibid. 57 See Mark Calabria, Testimony before the Subcommittee on Insurance, Housing & Community Opportunity, House Committee on Financial Services, on “The Future Role of FHA, RHS, and GNMA in the Single- and Multi-family Mortgage Markets” (May 2011), at 4. 58 Laurie Goodman et al., “VA Loans Outperform FHA Loans. Why? And What Can We Learn?” Housing Finance Policy Center Commentary, Urban Institute (Jul. 2014), at 9. 59 FCIC Report, supra note 12, at 316-317.

Page 9 of 38
bank regulatory structure ceased to exist.60 In 2009, mortgage originations and outstanding mortgages being serviced plummeted further.61 Subprime originations vanished, and the mortgage-origination industry consolidated rapidly.62 That year, the Federal Reserve closed the loophole that had existed for bank holding companies’ mortgage-originating subsidiaries.63 Additionally, for mortgage servicers, the immediate post-crisis period resulted in tighter regulation in various states.64
By 2010, only a handful of the non-banks that had operated during the subprime crisis –
notably, many that had minimized subprime exposure – remained in business.65 The mortgage industry had shrunk significantly and was dominated by depository institutions and their subsidiaries.66 Housing starts had plummeted to less than one-third of 2006 levels.67 In July that year, regulations authorized by the Secure and Fair Enforcement (SAFE) Mortgage Licensing Act of 2008 were issued, establishing a nationwide mortgage licensing system (NMLS) and streamlining non-bank mortgage origination rules across the states.68
That same month, Congress’s post-crisis reaction culminated in the Dodd-Frank
Consumer Protection and Wall Street Reform Act (Dodd-Frank Act), which, while not addressing two of the institutions at the core of the crisis, Fannie Mae and Freddie Mac, granted authority to new and existing regulators to greatly augment non-bank and depository institution mortgage origination and servicing regulation. Yet the vast majority of Dodd-Frank’s authorized rulemakings were not finalized until recent years, and as of early 2015, only 235 of the Act’s 390 required rulemakings had been finalized.69 The details of recently promulgated regulations authorized by Dodd-Frank and of other regulatory developments will be outlined in Section III. These details provide critical context to changes in industry composition described in Section IV.
III. Recent Policy Developments
Dodd-Frank’s most significant impact on mortgage origination and servicing is the creation of the CFPB, in which regulatory powers associated with existing consumer finance laws, such as TILA and RESPA, were consolidated.70 Critically, Dodd-Frank authorized the CFPB to supervise, examine, and regulate all non-banks engaged in the mortgage market.71 As
60 See Jon Hilsenrath, “Goldman, Morgan Scrap Wall Street Model, Become Banks in Bid to Ride Out Crisis,” Wall Street Journal (Sep. 22, 2008). 61 Inside Mortgage Finance data. 62 Ibid. 63 Downs & Shi, supra note 41. 64 Adam J. Levitin & Tara Twomey, “Mortgage Servicing,” Yale Journal on Regulation 28 (2011):1-90, at 68-69. 65 Inside Mortgage Finance data. 66 Ibid. 67 See infra Figure 2. 68 See Federal Financial Institutions Examination Council, Secure and Fair Enforcement for Mortgage Licensing Act (S.A.F.E. Act) FAQs, https://www.ffiec.gov/safeact.htm#saferec. 69 Davis Polk, Dodd-Frank Progress Report, 1st Quarter 2015. 70 Sec. 1061, Dodd–Frank Wall Street Reform and Consumer Protection Act (2010). 71 Ibid., at Sec. 1024.
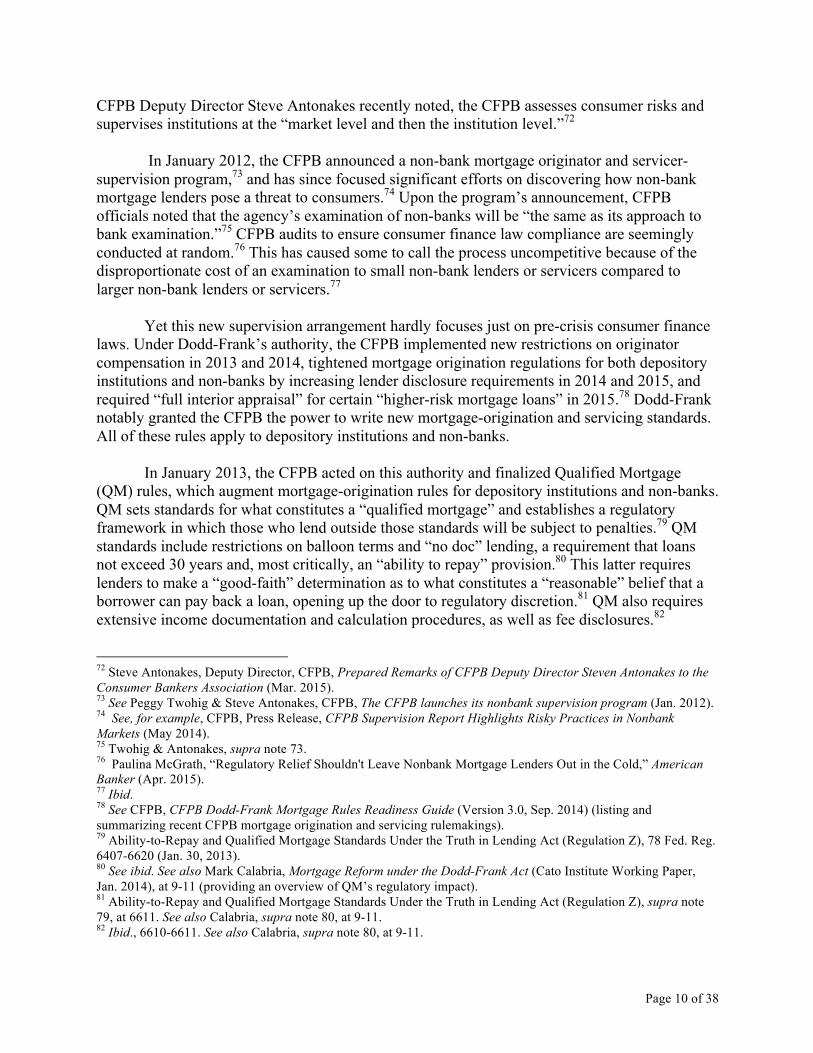
Page 10 of 38
CFPB Deputy Director Steve Antonakes recently noted, the CFPB assesses consumer risks and supervises institutions at the “market level and then the institution level.”72
In January 2012, the CFPB announced a non-bank mortgage originator and servicer-
supervision program,73 and has since focused significant efforts on discovering how non-bank mortgage lenders pose a threat to consumers.74 Upon the program’s announcement, CFPB officials noted that the agency’s examination of non-banks will be “the same as its approach to bank examination.”75 CFPB audits to ensure consumer finance law compliance are seemingly conducted at random.76 This has caused some to call the process uncompetitive because of the disproportionate cost of an examination to small non-bank lenders or servicers compared to larger non-bank lenders or servicers.77
Yet this new supervision arrangement hardly focuses just on pre-crisis consumer finance
laws. Under Dodd-Frank’s authority, the CFPB implemented new restrictions on originator compensation in 2013 and 2014, tightened mortgage origination regulations for both depository institutions and non-banks by increasing lender disclosure requirements in 2014 and 2015, and required “full interior appraisal” for certain “higher-risk mortgage loans” in 2015.78 Dodd-Frank notably granted the CFPB the power to write new mortgage-origination and servicing standards. All of these rules apply to depository institutions and non-banks.
In January 2013, the CFPB acted on this authority and finalized Qualified Mortgage
(QM) rules, which augment mortgage-origination rules for depository institutions and non-banks. QM sets standards for what constitutes a “qualified mortgage” and establishes a regulatory framework in which those who lend outside those standards will be subject to penalties.79 QM standards include restrictions on balloon terms and “no doc” lending, a requirement that loans not exceed 30 years and, most critically, an “ability to repay” provision.80 This latter requires lenders to make a “good-faith” determination as to what constitutes a “reasonable” belief that a borrower can pay back a loan, opening up the door to regulatory discretion.81 QM also requires extensive income documentation and calculation procedures, as well as fee disclosures.82
72 Steve Antonakes, Deputy Director, CFPB, Prepared Remarks of CFPB Deputy Director Steven Antonakes to the Consumer Bankers Association (Mar. 2015). 73 See Peggy Twohig & Steve Antonakes, CFPB, The CFPB launches its nonbank supervision program (Jan. 2012). 74 See, for example, CFPB, Press Release, CFPB Supervision Report Highlights Risky Practices in Nonbank Markets (May 2014). 75 Twohig & Antonakes, supra note 73. 76 Paulina McGrath, “Regulatory Relief Shouldn't Leave Nonbank Mortgage Lenders Out in the Cold,” American Banker (Apr. 2015). 77 Ibid. 78 See CFPB, CFPB Dodd-Frank Mortgage Rules Readiness Guide (Version 3.0, Sep. 2014) (listing and summarizing recent CFPB mortgage origination and servicing rulemakings). 79 Ability-to-Repay and Qualified Mortgage Standards Under the Truth in Lending Act (Regulation Z), 78 Fed. Reg. 6407-6620 (Jan. 30, 2013). 80 See ibid. See also Mark Calabria, Mortgage Reform under the Dodd-Frank Act (Cato Institute Working Paper, Jan. 2014), at 9-11 (providing an overview of QM’s regulatory impact). 81 Ability-to-Repay and Qualified Mortgage Standards Under the Truth in Lending Act (Regulation Z), supra note 79, at 6611. See also Calabria, supra note 80, at 9-11. 82 Ibid., 6610-6611. See also Calabria, supra note 80, at 9-11.

Page 11 of 38
Also in January 2014, an array of CFPB regulations amending RESPA and TILA went
into effect. The final rules greatly augment the mortgage-servicing market and include a large array of new requirements, including more timely and detailed billing and payoff statements, early intervention with delinquent customers, stricter loss-mitigation procedures, and increased recordkeeping.83 Dodd-Frank also required mortgage securitizers to maintain a risk position in securitized mortgages and finalized these rules in October 2014.84 However, Fannie Mae and Freddie Mac are exempted from the rules as long as they remain in federal conservatorship.85
CFPB rulemakings and examinations – a product of Dodd-Frank – apply to both banks
and non-banks. But Dodd-Frank, in conjunction with Basel III, particularly alters regulations for depository institutions engaged in the mortgage business through capital rule requirements.86 In July 2013, the Federal Reserve finalized its Basel III rulemaking, which by altering new risk-weights for depository institutions significantly affects the mortgage-servicing industry.87 Prior to the crisis, MSRs that could be included in regulatory capital (up to 50 percent of Tier 1 capital for banks) were assigned a 100 percent risk-weight; Basel III sets a 10 percent limit on the use of MSRs as common equity Tier 1 capital (a more restrictive category of capital than Tier 1), raises the risk-weight to 250 percent for MSRs included towards common equity Tier 1 capital, and sets a one-to-one dollar capital requirement for excluded MSRs.88 As we will discuss in greater depth later in Section IV, this readjustment of capital rules has had a major impact on depository institutions’ holding of MSRs.
The FSOC’s 2014 Annual Report urged prudential state regulators to cooperate with the
FHFA and CFPB to heighten regulatory restrictions on these non-bank entities that originate or service mortgages securitized by the two GSEs.89 In January 2015, before state regulators had the chance to act, the FHFA proposed “minimum financial requirements” for non-banks engaged in residential-mortgage origination and servicing.90 These requirements included:
• A minimum net worth requirement of “$2.5 million plus 25 basis points of unpaid principal balance (UPB)” for all loans currently serviced;
• A minimum capital ratio of at least 6 percent (tangible net worth/total assets); • A minimum liquidity requirement of 3.5 basis points for “total Agency loans;”
83 Mortgage Servicing Rules under the Real Estate Settlement Procedures Act (Regulation X), 78 Fed. Reg. 10901-11021 (Feb. 14, 2013). 84 Sec. 941, Dodd–Frank Wall Street Reform and Consumer Protection Act (2010); Credit Risk Retention, 79 Fed. Reg. 77601-77766 (Dec. 2014). 85 Ibid. 86 Sec. 171, Dodd–Frank Wall Street Reform and Consumer Protection Act (2010). 87 Regulatory Capital Rules, 78 Fed. Reg. 62017-62291 (Oct. 2013). 88 See Jeff L. Plagge, Chairman, American Bankers Association, to Jacob J. “Jack” Lew, Chairperson, FSOC (May 12, 2014) (explaining this shift and the impact it has had); Laurie Goodman & Pamela Lee, “OASIS: A Securitization Born from MSR Transfers,” Housing Finance Policy Center Commentary, Urban Institute (Mar. 2014). 89 Financial Stability Oversight Council, Annual Report (2014), at 10. 90 FHFA, Proposed Minimum Financial Requirements for Enterprise Seller/Servicers (Jan. 2015).

Page 12 of 38
• An additional liquidity ratio of 200 basis points for “total nonperforming agency servicing in excess of 6 percent of the total agency servicing UPB.”91
Then in March 2015, the Conference of State Bank Supervisors (CSBS) responded and
proposed a number of regulatory standards aimed at improving safety and soundness at non-bank mortgage servicers.92 These closely mirror those that were proposed by the FHFA for both servicers and originators, but only apply to servicers and exclude a minimum capital ratio requirement; also, under the CSBS’s proposal, the 3.5 basis point requirement would be applicable to all loans, not just Agency loans.93 Additionally, the CSBS proposal includes data-management standards, heightened risk-management requirements, governance standards, stress testing and living will requirements, and several other new regulatory standards.94
In May 2015, Fannie Mae and Freddie Mac adopted the FHFA’s proposed standards for sellers and servicers.95 Yet policymakers have still not fundamentally reformed Fannie Mae, Freddie Mac, or the FHA. Some estimates find that as much as 90 percent of the mortgage market is explicitly or implicitly government-insured, although private capital is creeping back into the market, and risk is increasingly borne by private sources.96 Data from AEI’s International Center for Housing Risk reveals that 80 percent of purchase mortgage (explained in Section IV) originations and 85 percent of owner-occupied purchase loans are implicitly or explicitly government-insured.97 Reliance upon these channels has been accompanied by lower down payment requirements and laxer insurance pricing: in December 2014, Fannie Mae introduced a 3 percent down payment mortgage, and in response the next month, FHA lowered its insurance premiums drastically.98 IV. Recent Industry Trends
To understand how the mortgage-origination and servicing markets have reacted to recent and past policy developments, and to assess the efficacy of regulatory frameworks, we analyzed data obtained from Inside Mortgage Finance, the U.S. Census, AEI’s International Center on Housing Risk, and the CFPB. We also assessed qualitative developments and the extent to which technological developments have augmented market structure. For the purpose of our analysis, mortgage originating and mortgage servicing subsidiaries of bank holding companies are
91 See ibid. 92 Conference of State Bank Supervisors & American Association for Residential Mortgage Regulators, Proposed Regulatory Prudential Standards for Non-Bank Mortgage Servicers (Mar. 2015) [hereinafter “CSBS & AARMR Proposed Regulatory Standards for Non-Banks”]. 93 Ibid. See Jones Day, State Regulators Propose New Prudential Standards for Non-bank Mortgage Servicers (Apr. 2015) (presenting an in-depth overview of similarities and differences between these and FHFA’s proposed standards). 94 See ibid; CSBS & AARMR Proposed Regulatory Standards for Non-Banks, supra note 92. 95 See supra note 9 and accompanying text. 96 See Fannie Mae, “The Return of Private Capital,” Fannie Mae Housing Insights 4 (Oct. 2014), at 2 (citing internal estimates as well as Goldman Sachs, The Mortgage Analyst (May 22, 2014)). 97 AEI’s International Center on Housing Risk, Mortgage Risk Index – May 2015 release (forthcoming, Jun. 2015). 98 See Fannie Mae, Fannie Mae Announces 97 Percent LTV Option for First-Time Homebuyers, Press Release (Dec. 8, 2014); FHA, FHA to Reduce Annual Insurance Premiums, Press Release (Jan. 8, 2015).

Page 13 of 38
classified as depository institutions as they are overseen by depository institution-regulators: the FRS, OCC, FDIC, OTS (pre-Dodd-Frank), or the National Credit Union Administration.
a) Mortgage origination trends
Figure 1 below reveals that a substantial scaling-back of depository institution participation in the origination market has accompanied a sizable increase in non-bank origination volume. Total mortgage originations declined to $1.240 trillion in 2014, from $3.120 trillion in 2005.99 Amongst the top 40 originators, we find that non-banks accounted for 37.5 percent of originations in 2014, up from 15.9 percent in 2005.100 Goldman Sachs research finds that overall, non-banks share of originations jumped from 12 to 42 percent during this time.101
Figure 1
Clearly, the decline in mortgage-origination volume (in terms of dollar amount) by depository institutions helps explain the rise in non-banks’ market share cited by
99 Inside Mortgage Finance data. 100 Ibid. (authors’ calculations; ranks and percentages calculated in terms of dollar volume). Due to data limitations, we only could assess trends in origination patterns amongst the top 40 servicers between 2005 and 2014, but during this time, the top 40 originators accounted for 97 to 69 percent of the market in terms of dollar volume. Ibid. Some firms listed as top 40 originators in the mid-2000s are subsidiaries of the same holding company. Ibid. It is thus possible depository institutions’ market share is marginally overstated between 2005 and 2007. 101 Nash & Beardsley, supra note 3, at 53 (citing Inside Mortgage Finance and Goldman Sachs Investment Research data; percentages calculated in terms of total dollar volume of 2005 and 2014 originations, respectively).

Page 14 of 38
policymakers.102 This decline is driven in part by declining home starts, which have yet to fully rebound since the crisis, as Figure 2 below indicates.
Figure 2
However, Figure 1 also includes mortgage refinancings, which boomed for several years
as a result of very low interest rates and were at their height in 2012. That year, refinancings represented 71.6 percent of originations in terms of dollar volume, as Figure 3 below indicates.
102 U.S. House Committee on Oversight & Government Reform, Office of Rep. Elijah E. Cummings, Ranking Member, supra note 8.

Page 15 of 38
Figure 3
As this boom ebbed in 2013 and 2014, the overall mortgage-origination market declined
in volume.103 During the boom, the FHFA’s Office of the Inspector General (FHFA OIG) noted that non-banks “[expanded] operations more aggressively than commercial banks in response to the recent boom in residential mortgage refinancing.”104 However, as Figure 4 reveals, non-banks also greatly expanded their role in purchase mortgage originations in the last two years: by 2014, of the top 20 purchase mortgage originators in terms of dollar volume – whose loans made up 55 percent, or $400.4 billion, of the total $725 billion in 2014 purchase mortgage originations – 10 were non-banks, accounting for 28 percent, or $111.1 billion, of 2014 purchase mortgages originated by the top 20 lenders.105 The purchase mortgage origination market has also become much more fragmented in recent years: in 2010, the top 20 lenders accounted for 81 percent of the market.106
103 Inside Mortgage Finance data. 104 Office of the Inspector General, FHFA, Recent Trends in the Enterprises’ Purchases of Mortgages from Smaller Lenders and Nonbank Mortgage Companies (EVL-2014-010, Jul. 2014), at 17. 105 Inside Mortgage Finance data (authors’ calculations; rank and percentages calculated in terms of dollar volume; purchase mortgage dollar volume data by originator was only available for 2010 through 2014). 106 Ibid. (authors’ calculations; rank and percentages calculated in terms of dollar volume).
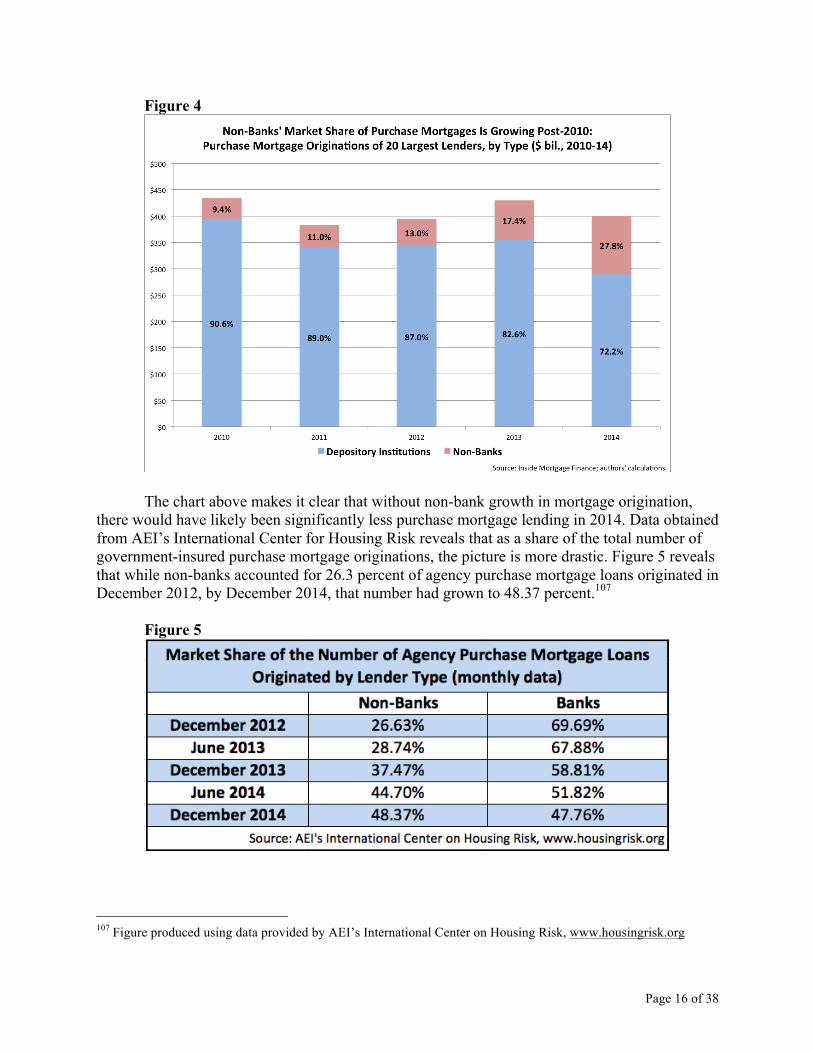
Page 16 of 38
Figure 4
The chart above makes it clear that without non-bank growth in mortgage origination, there would have likely been significantly less purchase mortgage lending in 2014. Data obtained from AEI’s International Center for Housing Risk reveals that as a share of the total number of government-insured purchase mortgage originations, the picture is more drastic. Figure 5 reveals that while non-banks accounted for 26.3 percent of agency purchase mortgage loans originated in December 2012, by December 2014, that number had grown to 48.37 percent.107
Figure 5
107 Figure produced using data provided by AEI’s International Center on Housing Risk, www.housingrisk.org
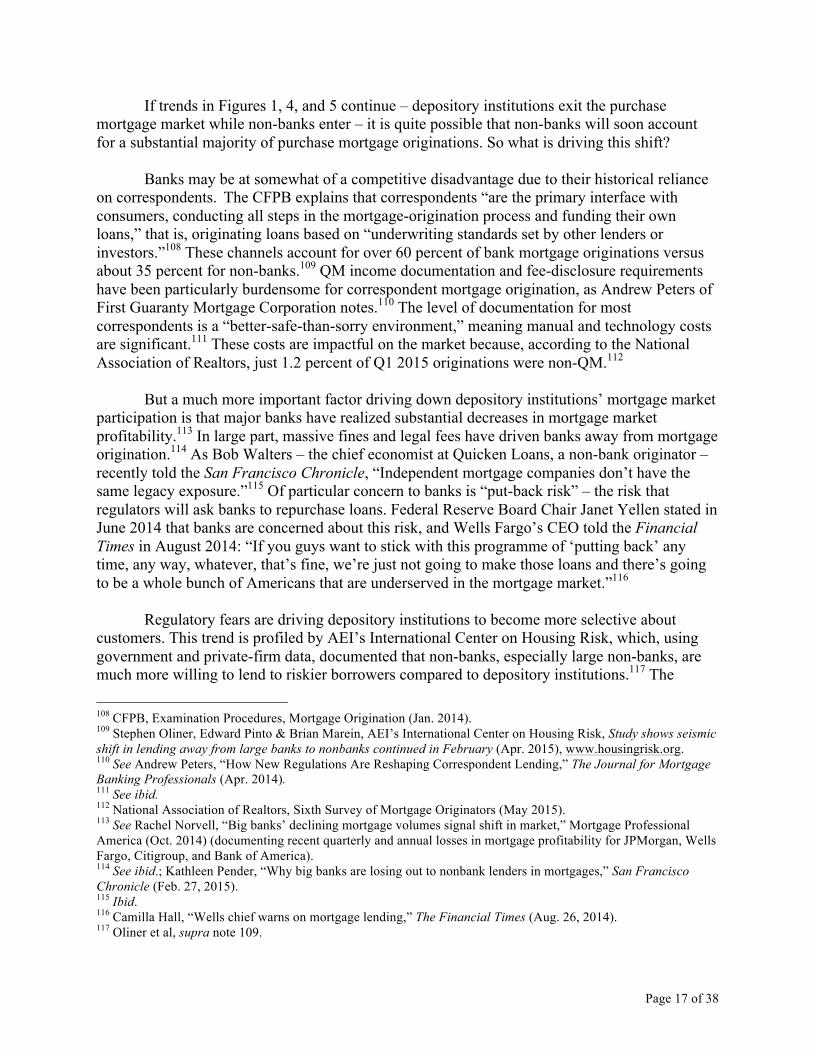
Page 17 of 38
If trends in Figures 1, 4, and 5 continue – depository institutions exit the purchase mortgage market while non-banks enter – it is quite possible that non-banks will soon account for a substantial majority of purchase mortgage originations. So what is driving this shift?
Banks may be at somewhat of a competitive disadvantage due to their historical reliance on correspondents. The CFPB explains that correspondents “are the primary interface with consumers, conducting all steps in the mortgage-origination process and funding their own loans,” that is, originating loans based on “underwriting standards set by other lenders or investors.”108 These channels account for over 60 percent of bank mortgage originations versus about 35 percent for non-banks.109 QM income documentation and fee-disclosure requirements have been particularly burdensome for correspondent mortgage origination, as Andrew Peters of First Guaranty Mortgage Corporation notes.110 The level of documentation for most correspondents is a “better-safe-than-sorry environment,” meaning manual and technology costs are significant.111 These costs are impactful on the market because, according to the National Association of Realtors, just 1.2 percent of Q1 2015 originations were non-QM.112
But a much more important factor driving down depository institutions’ mortgage market
participation is that major banks have realized substantial decreases in mortgage market profitability.113 In large part, massive fines and legal fees have driven banks away from mortgage origination.114 As Bob Walters – the chief economist at Quicken Loans, a non-bank originator – recently told the San Francisco Chronicle, “Independent mortgage companies don’t have the same legacy exposure.”115 Of particular concern to banks is “put-back risk” – the risk that regulators will ask banks to repurchase loans. Federal Reserve Board Chair Janet Yellen stated in June 2014 that banks are concerned about this risk, and Wells Fargo’s CEO told the Financial Times in August 2014: “If you guys want to stick with this programme of ‘putting back’ any time, any way, whatever, that’s fine, we’re just not going to make those loans and there’s going to be a whole bunch of Americans that are underserved in the mortgage market.”116 Regulatory fears are driving depository institutions to become more selective about customers. This trend is profiled by AEI’s International Center on Housing Risk, which, using government and private-firm data, documented that non-banks, especially large non-banks, are much more willing to lend to riskier borrowers compared to depository institutions.117 The
108 CFPB, Examination Procedures, Mortgage Origination (Jan. 2014). 109 Stephen Oliner, Edward Pinto & Brian Marein, AEI’s International Center on Housing Risk, Study shows seismic shift in lending away from large banks to nonbanks continued in February (Apr. 2015), www.housingrisk.org. 110 See Andrew Peters, “How New Regulations Are Reshaping Correspondent Lending,” The Journal for Mortgage Banking Professionals (Apr. 2014). 111 See ibid. 112 National Association of Realtors, Sixth Survey of Mortgage Originators (May 2015). 113 See Rachel Norvell, “Big banks’ declining mortgage volumes signal shift in market,” Mortgage Professional America (Oct. 2014) (documenting recent quarterly and annual losses in mortgage profitability for JPMorgan, Wells Fargo, Citigroup, and Bank of America). 114 See ibid.; Kathleen Pender, “Why big banks are losing out to nonbank lenders in mortgages,” San Francisco Chronicle (Feb. 27, 2015). 115 Ibid. 116 Camilla Hall, “Wells chief warns on mortgage lending,” The Financial Times (Aug. 26, 2014). 117 Oliner et al, supra note 109.
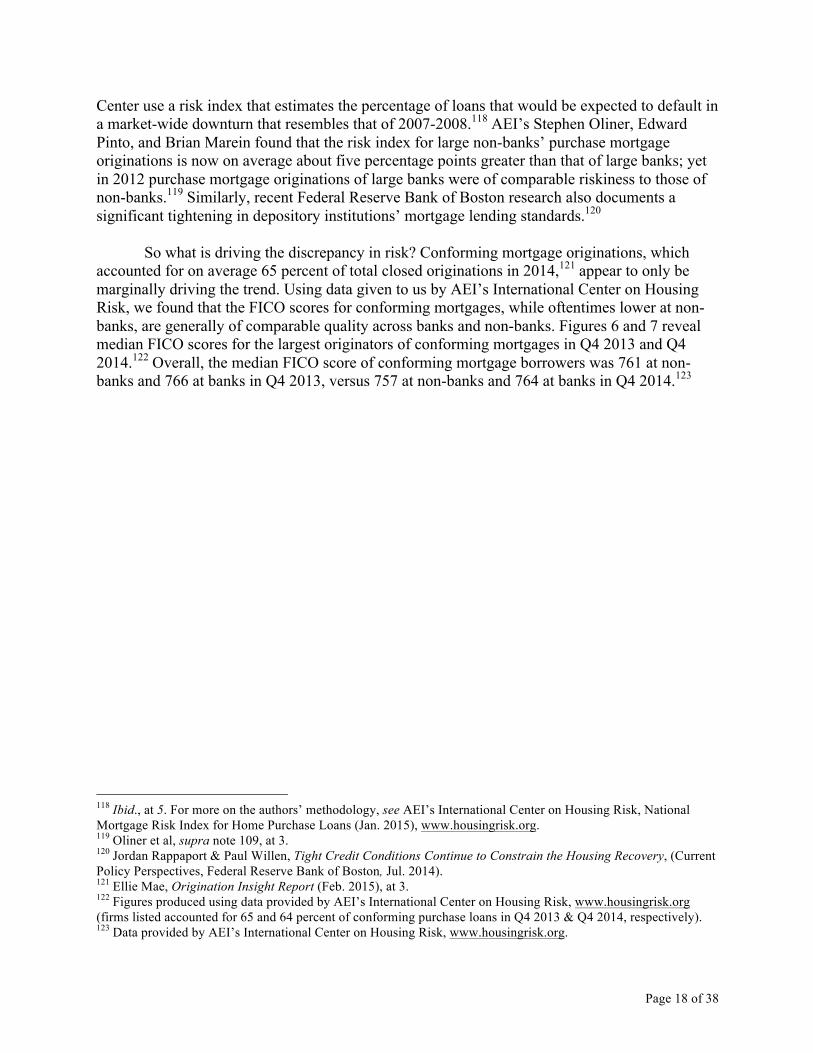
Page 18 of 38
Center use a risk index that estimates the percentage of loans that would be expected to default in a market-wide downturn that resembles that of 2007-2008.118 AEI’s Stephen Oliner, Edward Pinto, and Brian Marein found that the risk index for large non-banks’ purchase mortgage originations is now on average about five percentage points greater than that of large banks; yet in 2012 purchase mortgage originations of large banks were of comparable riskiness to those of non-banks.119 Similarly, recent Federal Reserve Bank of Boston research also documents a significant tightening in depository institutions’ mortgage lending standards.120
So what is driving the discrepancy in risk? Conforming mortgage originations, which accounted for on average 65 percent of total closed originations in 2014,121 appear to only be marginally driving the trend. Using data given to us by AEI’s International Center on Housing Risk, we found that the FICO scores for conforming mortgages, while oftentimes lower at non-banks, are generally of comparable quality across banks and non-banks. Figures 6 and 7 reveal median FICO scores for the largest originators of conforming mortgages in Q4 2013 and Q4 2014.122 Overall, the median FICO score of conforming mortgage borrowers was 761 at non-banks and 766 at banks in Q4 2013, versus 757 at non-banks and 764 at banks in Q4 2014.123
118 Ibid., at 5. For more on the authors’ methodology, see AEI’s International Center on Housing Risk, National Mortgage Risk Index for Home Purchase Loans (Jan. 2015), www.housingrisk.org. 119 Oliner et al, supra note 109, at 3. 120 Jordan Rappaport & Paul Willen, Tight Credit Conditions Continue to Constrain the Housing Recovery, (Current Policy Perspectives, Federal Reserve Bank of Boston, Jul. 2014). 121 Ellie Mae, Origination Insight Report (Feb. 2015), at 3. 122 Figures produced using data provided by AEI’s International Center on Housing Risk, www.housingrisk.org (firms listed accounted for 65 and 64 percent of conforming purchase loans in Q4 2013 & Q4 2014, respectively). 123 Data provided by AEI’s International Center on Housing Risk, www.housingrisk.org.

Page 19 of 38
Figure 6
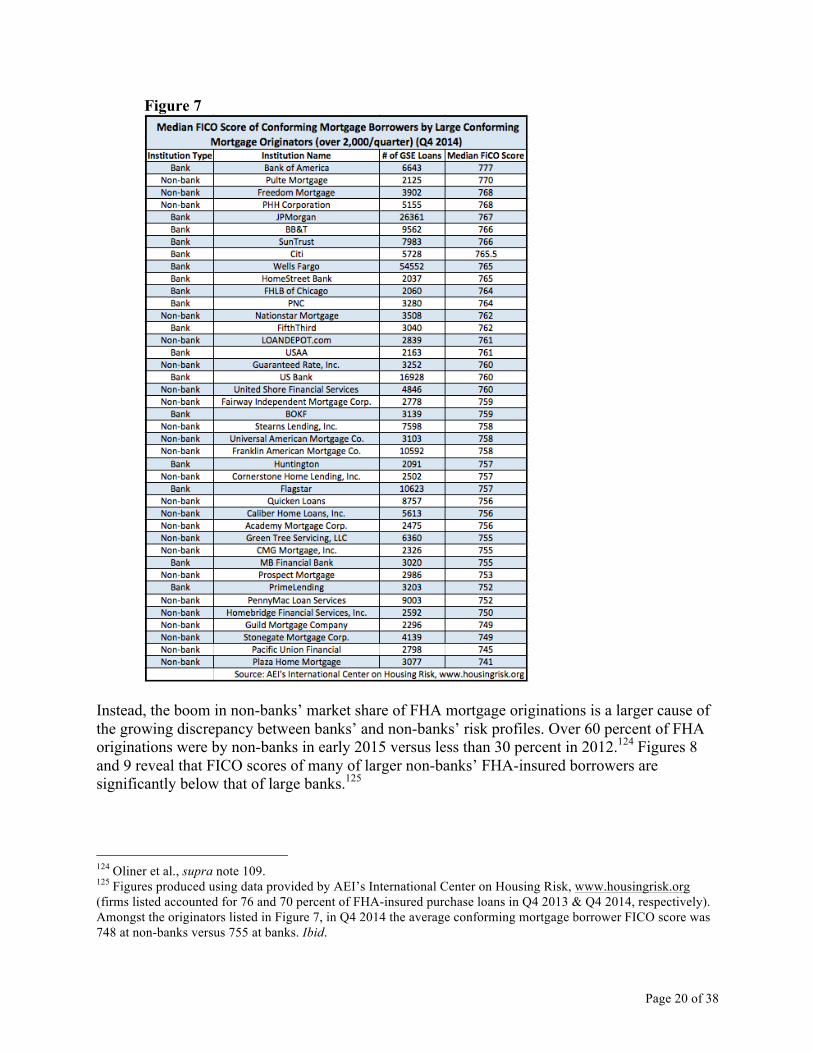
Page 20 of 38
Figure 7
Instead, the boom in non-banks’ market share of FHA mortgage originations is a larger cause of the growing discrepancy between banks’ and non-banks’ risk profiles. Over 60 percent of FHA originations were by non-banks in early 2015 versus less than 30 percent in 2012.124 Figures 8 and 9 reveal that FICO scores of many of larger non-banks’ FHA-insured borrowers are significantly below that of large banks.125
124 Oliner et al., supra note 109. 125 Figures produced using data provided by AEI’s International Center on Housing Risk, www.housingrisk.org (firms listed accounted for 76 and 70 percent of FHA-insured purchase loans in Q4 2013 & Q4 2014, respectively). Amongst the originators listed in Figure 7, in Q4 2014 the average conforming mortgage borrower FICO score was 748 at non-banks versus 755 at banks. Ibid.
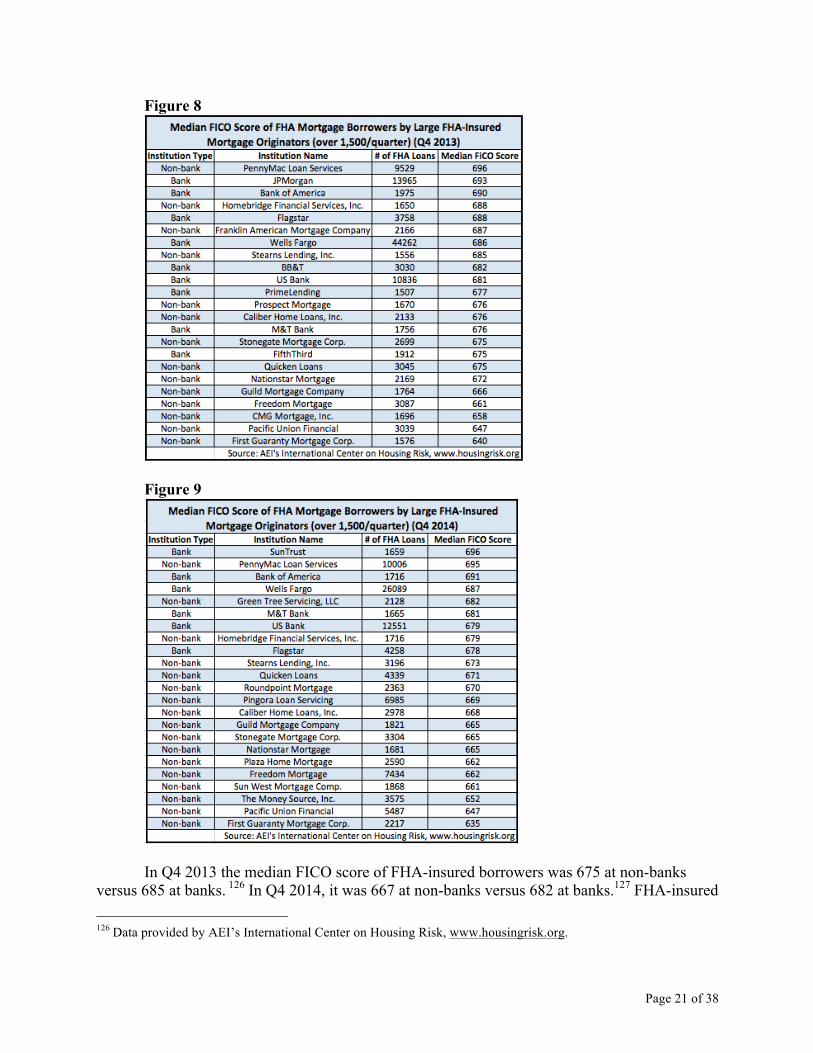
Page 21 of 38
Figure 8
Figure 9
In Q4 2013 the median FICO score of FHA-insured borrowers was 675 at non-banks
versus 685 at banks. 126 In Q4 2014, it was 667 at non-banks versus 682 at banks.127 FHA-insured 126 Data provided by AEI’s International Center on Housing Risk, www.housingrisk.org.
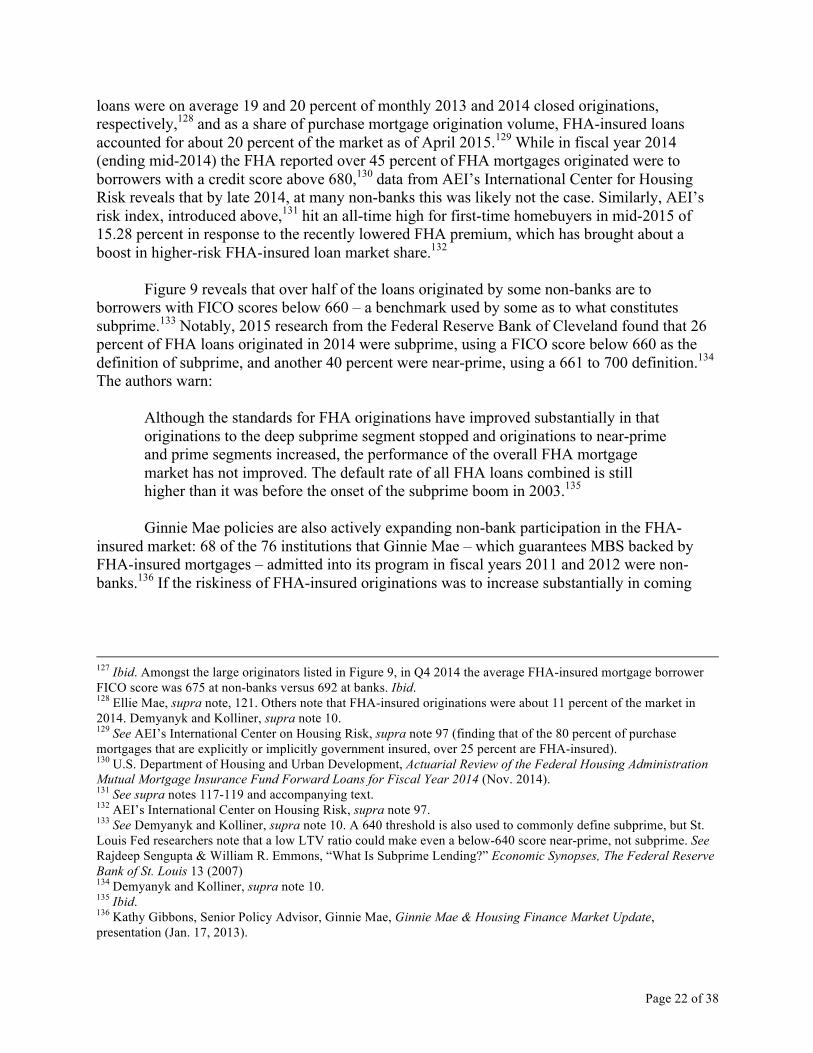
Page 22 of 38
loans were on average 19 and 20 percent of monthly 2013 and 2014 closed originations, respectively,128 and as a share of purchase mortgage origination volume, FHA-insured loans accounted for about 20 percent of the market as of April 2015.129 While in fiscal year 2014 (ending mid-2014) the FHA reported over 45 percent of FHA mortgages originated were to borrowers with a credit score above 680,130 data from AEI’s International Center for Housing Risk reveals that by late 2014, at many non-banks this was likely not the case. Similarly, AEI’s risk index, introduced above,131 hit an all-time high for first-time homebuyers in mid-2015 of 15.28 percent in response to the recently lowered FHA premium, which has brought about a boost in higher-risk FHA-insured loan market share.132
Figure 9 reveals that over half of the loans originated by some non-banks are to
borrowers with FICO scores below 660 – a benchmark used by some as to what constitutes subprime.133 Notably, 2015 research from the Federal Reserve Bank of Cleveland found that 26 percent of FHA loans originated in 2014 were subprime, using a FICO score below 660 as the definition of subprime, and another 40 percent were near-prime, using a 661 to 700 definition.134 The authors warn:
Although the standards for FHA originations have improved substantially in that originations to the deep subprime segment stopped and originations to near-prime and prime segments increased, the performance of the overall FHA mortgage market has not improved. The default rate of all FHA loans combined is still higher than it was before the onset of the subprime boom in 2003.135 Ginnie Mae policies are also actively expanding non-bank participation in the FHA-
insured market: 68 of the 76 institutions that Ginnie Mae – which guarantees MBS backed by FHA-insured mortgages – admitted into its program in fiscal years 2011 and 2012 were non-banks.136 If the riskiness of FHA-insured originations was to increase substantially in coming
127 Ibid. Amongst the large originators listed in Figure 9, in Q4 2014 the average FHA-insured mortgage borrower FICO score was 675 at non-banks versus 692 at banks. Ibid. 128 Ellie Mae, supra note, 121. Others note that FHA-insured originations were about 11 percent of the market in 2014. Demyanyk and Kolliner, supra note 10. 129 See AEI’s International Center on Housing Risk, supra note 97 (finding that of the 80 percent of purchase mortgages that are explicitly or implicitly government insured, over 25 percent are FHA-insured). 130 U.S. Department of Housing and Urban Development, Actuarial Review of the Federal Housing Administration Mutual Mortgage Insurance Fund Forward Loans for Fiscal Year 2014 (Nov. 2014). 131 See supra notes 117-119 and accompanying text. 132 AEI’s International Center on Housing Risk, supra note 97. 133 See Demyanyk and Kolliner, supra note 10. A 640 threshold is also used to commonly define subprime, but St. Louis Fed researchers note that a low LTV ratio could make even a below-640 score near-prime, not subprime. See Rajdeep Sengupta & William R. Emmons, “What Is Subprime Lending?” Economic Synopses, The Federal Reserve Bank of St. Louis 13 (2007) 134 Demyanyk and Kolliner, supra note 10. 135 Ibid. 136 Kathy Gibbons, Senior Policy Advisor, Ginnie Mae, Ginnie Mae & Housing Finance Market Update, presentation (Jan. 17, 2013).
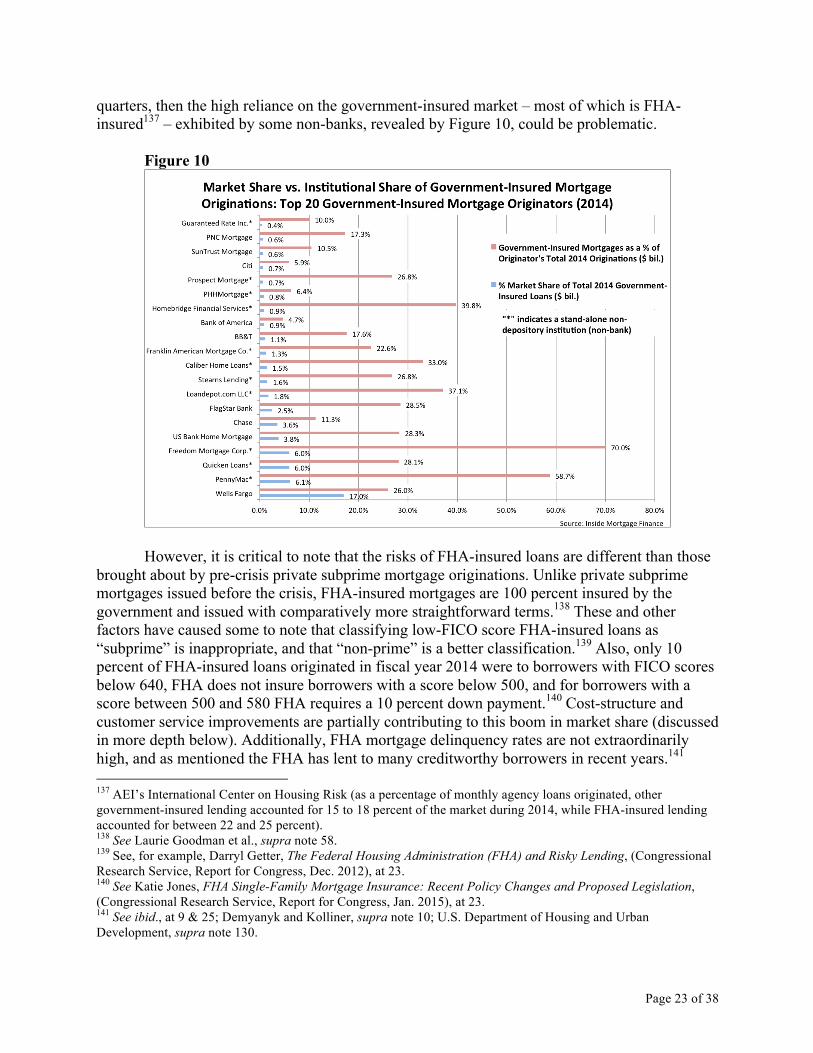
Page 23 of 38
quarters, then the high reliance on the government-insured market – most of which is FHA-insured137 – exhibited by some non-banks, revealed by Figure 10, could be problematic.
Figure 10
However, it is critical to note that the risks of FHA-insured loans are different than those
brought about by pre-crisis private subprime mortgage originations. Unlike private subprime mortgages issued before the crisis, FHA-insured mortgages are 100 percent insured by the government and issued with comparatively more straightforward terms.138 These and other factors have caused some to note that classifying low-FICO score FHA-insured loans as “subprime” is inappropriate, and that “non-prime” is a better classification.139 Also, only 10 percent of FHA-insured loans originated in fiscal year 2014 were to borrowers with FICO scores below 640, FHA does not insure borrowers with a score below 500, and for borrowers with a score between 500 and 580 FHA requires a 10 percent down payment.140 Cost-structure and customer service improvements are partially contributing to this boom in market share (discussed in more depth below). Additionally, FHA mortgage delinquency rates are not extraordinarily high, and as mentioned the FHA has lent to many creditworthy borrowers in recent years.141 137 AEI’s International Center on Housing Risk (as a percentage of monthly agency loans originated, other government-insured lending accounted for 15 to 18 percent of the market during 2014, while FHA-insured lending accounted for between 22 and 25 percent). 138 See Laurie Goodman et al., supra note 58. 139 See, for example, Darryl Getter, The Federal Housing Administration (FHA) and Risky Lending, (Congressional Research Service, Report for Congress, Dec. 2012), at 23. 140 See Katie Jones, FHA Single-Family Mortgage Insurance: Recent Policy Changes and Proposed Legislation, (Congressional Research Service, Report for Congress, Jan. 2015), at 23. 141 See ibid., at 9 & 25; Demyanyk and Kolliner, supra note 10; U.S. Department of Housing and Urban Development, supra note 130.

Page 24 of 38
Yet as mentioned the default rate of FHA-insured loans today is higher than before the
crisis,142 and their risk of default has increased since mid-2013; AEI’s risk index for these loans recently reached over 23 percent.143 Also, researchers at the New York Fed and NYU’s Stern School of Business find methodological flaws in FHA’s measure of delinquency.144 Wharton School of Business Professor Jack Guttentag points out that because FHA mortgage insurance premiums are not linked to credit scores, many low-income borrowers are taking on loans with terms less favorable than they could otherwise obtain.145 Of course, the 3.5 percent down payment requirement of FHA loans is making mortgages to some first-time borrowers.146 But Federal Reserve research notes that low down payments significantly and harmfully contribute to the severity of housing market downturns.147 Also, low down payments likely increase the risk of default; in fact, one older FHA study found that decreasing down payments from 10 to 3 percent increases the chance of default by 500 percent.148 And as Guttentag notes, some originators of FHA-insured mortgages can and do originate without regard for credit scores, and as long as FHA-insurance can be secured, they execute the loan.149 Overall, originations to riskier FHA-insured borrowers are contributing to non-banks growing market share.
Further driving non-bank participation in the FHA-insured mortgage market is regulatory activity, such as that mentioned above. JPMorgan CEO Jamie Dimon has cited the unpredictability with which the FHA litigates and fines as a reason to exit the FHA loan business.150 The Wall Street Journal also reports that heightened legal actions against banks are driving the non-bank surge in the FHA market.151 If government actions and market forces drive non-banks to engage in excessively risky FHA-insured originations, then in the event of a downturn, this could pose a risk both to neighborhoods highly reliant on FHA-insured mortgages and to a financially troubled FHA.152 Concentrated defaults could also put the GSEs at risk if concentrated delinquencies precipitate a decline in surrounding home prices.
In short, banks are scaling back origination volume due to regulatory pressures and a loss
in profitability. An increase in riskier FHA-insured originations by non-banks does pose a concern that explicit government insurance is enabling lending that could result in high defaults
142 Demyanyk and Kolliner, supra note 10. 143 Data from AEI’s International Center on Housing Risk. 144 Andrew Caplin et al., Is the FHA Creating Sustainable Homeownership? (NBER Working Paper No. 18190, Jul. 2012). 145 Jack Guttentag, “Subprime mortgage market still exists within the FHA,” The Washington Post (Jul. 3, 2013). 146 See Lisa Prevost, “F.H.A. Loans More Affordable,” The New York Times (Jan. 9, 2015). 147 See Meyer et al., supra note 52. 148 See Calabria, supra note 19, at 9 (citing George M. Von Furstenberg, “Default Risk on FHA-Insured Home Mortgages as a Function of the Terms of Financing: A Quantitative Analysis,” Journal of Finance 24 (1969): 459–77; Patric Hendershott and William Schultz, “Equity and Nonequity Determinants of FHA Single-Family Mortgage Foreclosures in the 1980s” Journal of the American Real Estate and Urban Economics Association 21 (1993)). 149 Guttentag, supra note 145. 150 See Saul Griffith, “Are Our Mortgage Markets Broken?” ValueWalk (Aug. 2014). 151 Joe Light, “Federal Mortgage Agency Says More Needed to Police Nonbank Lenders,” The Wall Street Journal (Apr. 28, 2015). 152 See Edward Pinto, Statement before the Committee on Financial Services, U.S. House of Representatives, “Examining the Proper Role of the Federal Housing Administration in our Mortgage Insurance Market” (Feb. 2013).
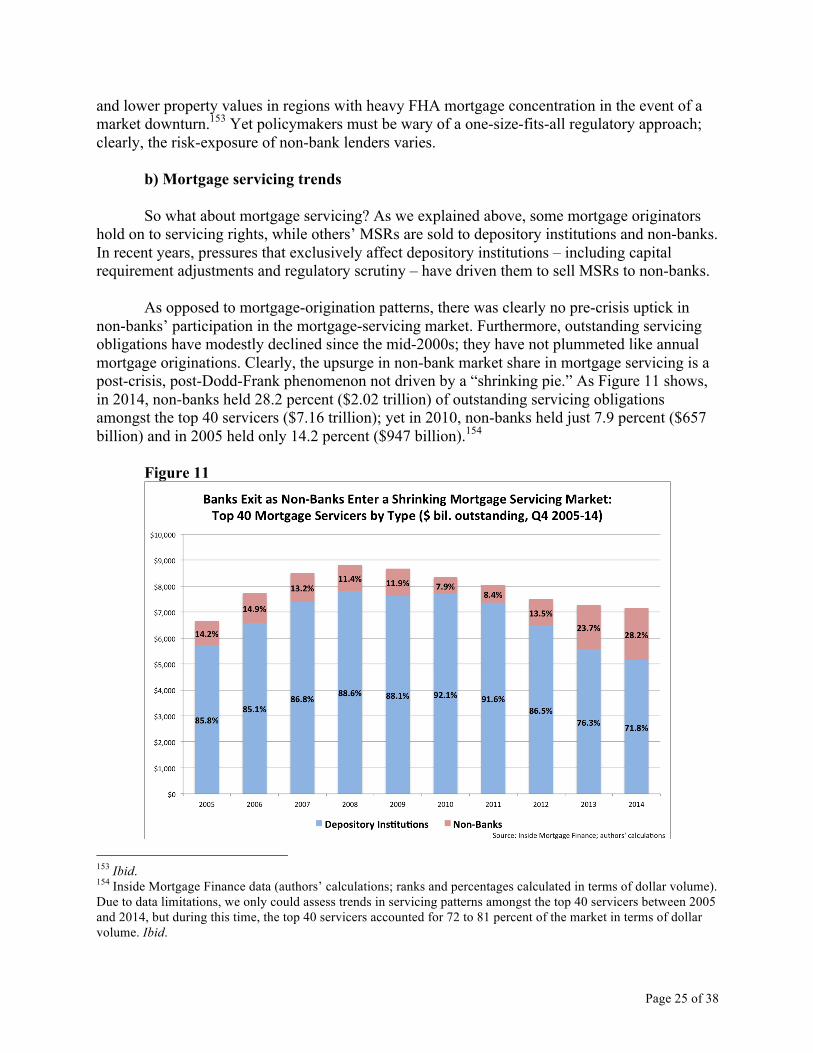
Page 25 of 38
and lower property values in regions with heavy FHA mortgage concentration in the event of a market downturn.153 Yet policymakers must be wary of a one-size-fits-all regulatory approach; clearly, the risk-exposure of non-bank lenders varies.
b) Mortgage servicing trends
So what about mortgage servicing? As we explained above, some mortgage originators hold on to servicing rights, while others’ MSRs are sold to depository institutions and non-banks. In recent years, pressures that exclusively affect depository institutions – including capital requirement adjustments and regulatory scrutiny – have driven them to sell MSRs to non-banks. As opposed to mortgage-origination patterns, there was clearly no pre-crisis uptick in non-banks’ participation in the mortgage-servicing market. Furthermore, outstanding servicing obligations have modestly declined since the mid-2000s; they have not plummeted like annual mortgage originations. Clearly, the upsurge in non-bank market share in mortgage servicing is a post-crisis, post-Dodd-Frank phenomenon not driven by a “shrinking pie.” As Figure 11 shows, in 2014, non-banks held 28.2 percent ($2.02 trillion) of outstanding servicing obligations amongst the top 40 servicers ($7.16 trillion); yet in 2010, non-banks held just 7.9 percent ($657 billion) and in 2005 held only 14.2 percent ($947 billion).154
Figure 11
153 Ibid. 154 Inside Mortgage Finance data (authors’ calculations; ranks and percentages calculated in terms of dollar volume). Due to data limitations, we only could assess trends in servicing patterns amongst the top 40 servicers between 2005 and 2014, but during this time, the top 40 servicers accounted for 72 to 81 percent of the market in terms of dollar volume. Ibid.
Page 26 of 38
What factors are driving the trend? For starters, depository institutions are aggressively selling MSRs to non-banks in response to Basel III capital requirements.155 For example, Citigroup sold 21 percent of its MSRs in 2013, worth $63 billion at the time, and banks have been aggressively selling off MSRs as a result of recent capital rules.156 The American Bankers Association notes that depository institutions will likely sell off an additional $2 to $3 billion in MSRs by 2017, and capital rules are a large reason this will occur.157 Also, Goldman Sachs research notes that the fines and penalties incurred by depository institutions engaged in servicing are driving their exit, and today’s non-banks – which were largely not active in pre-crisis origination and servicing – enjoy a regulatory advantage, driving their growth in market share.158 Large banks have had to pay $25 billion in fines as a result of mortgage-servicing misconduct,159 further incentivizing banks to reduce their role in the servicing market.
Another factor is cost. In large part due to technological innovations – which will be
discussed below – and also as a result of regulatory costs incurred by depository institutions, non-banks can service mortgages at significantly lower costs.160 For large non-bank specialty servicers, the cost of servicing ranges from 17 basis points to 25 basis points, whereas for some large banks it is as high as 90 basis points.161 Non-banks also do not have exposure to “legacy assets” – troubled mortgage obligations left over from before the crisis – which drive up costs.162
Yet there is reason to believe that the pendulum may be swinging. Regulators have begun
to aggressively pursue non-bank mortgage servicers.163 Also some non-banks have acquired MSRs too quickly, and Goldman Sachs research finds that in the servicing realm, non-banks’ market share is projected to increase at a slower pace.164 Also, it is not just regulatory forces driving banks to sell MSRs. Fannie Mae has actively facilitated this process. The Urban Institute reports that the GSE recently purchased 384,000 loans from Bank of America in order to distribute them to “specialty servicers.”165 Yet the emergence of specialty servicers has primarily been market-driven, and reflects the technical expertise and innovation of many non-banks. c) Innovation in the mortgage market
Churn in the mortgage market has been extraordinary. We found that only 11 of the top
40 mortgage originators that existed in 2006 exist amongst the top 40 today, and of those 11, just two (Quicken Loans and PHH) are non-banks.166 In 2014, the third largest originator was
155 See Plagge, supra note 88. 156 Heather Perlberg & Dakin Campbell, “Citigroup Selling Servicing Rights as Banks Shrink Role,” Bloomberg (Oct. 25, 2013). 157 See Plagge, supra note 88. 158 Nash & Beardsley, supra note 3, at 53. 159 Ibid. 160 Ibid., at 55. 161 Ibid. 162 Ibid., at 56. 163 See, for example, Ben Lane, “Ocwen’s bad day just got worse,” Housing Wire (May 20, 2014). 164 Nash & Beardsley, supra note 3, at 54. 165 See Lee, supra note 48, at 2. 166 Inside Mortgage Finance data (ranks calculated in terms of dollar volume).
Page 27 of 38
Quicken Loans,167 which is a non-bank that lacks the traditional bank branching network where many mortgages are sold. Instead, Quicken sells mortgages online, undercutting the banks with its lower costs and a business model through which it is better suited to engage regulators; it represents one of many so-called “disrupters” in the industry.168 In the origination market, behind Quicken come a number of non-banks.169 One is PHH – the sixth largest originator in terms of dollar volume– whose CEO recently noted that the firm is “a technology company that originates mortgages” and that “technology allows [PHH] to keep productivity and efficiency high and keep costs down.”170 In fact, technology drives all aspects of PHH’s business: from origination to processing to underwriting.171
How are non-banks so effective at using technology to improve their origination process? Many are taking a familiar incremental approach: using their digital tools to eliminate middlemen and automate the process in discrete and logical steps, integrating larger and larger segments. Heightened integration, greater efficiencies, lower costs, and improved ease of use for customers can and does bolster growth. These online and app-based service providers are following a path that tech companies have pursued for decades: rethink inefficient, paper-based systems with lots of intermediaries – appraisers, brokers, bankers, lawyers, each taking a fee – through digital means. They want to reach customers where they live: on desktops, tablets or smartphones; through video, text or chat; through extensive automation. And as opposed to depository institutions that must work to change existing mortgage origination and servicing processes, non-banks are oftentimes starting from scratch.
Notably, all three 2014 finalists of the 2014 Mortgage Technology Awards Online
Originator Award were non-banks.172 PennyMac was acclaimed for its phone call-matching service, which bolstered compliance.173 United Wholesale Mortgage used technology to improve relationships between the firm and brokers.174 And Waterstone Mortgage was applauded for rolling out a mobile app that provides direct access to origination systems.175 Larry Summers, Harvard University economics professor and former U.S. Treasury Secretary, recently noted that “technology-based businesses have the opportunity to transform finance over the next generation.”176
Innovation has also driven non-banks’ growth in servicing. Quicken Loans is the 10th
largest servicer,177 and its CEO notes that technology has enabled it to be a leader in mortgage-
167 Ibid. 168 See Nash & Beardsley, supra note 3, at 57-58. 169 Inside Mortgage Finance data (PHH [6th]; Penny Mac [8th]; Freedom Mortgage Corp. [10th]). See also Figures 6, 7, 8 & 9. 170 Inside Mortgage Finance data; BMC Software, Customer Success Story: PHH Mortgage Services (2009). 171 Ibid. 172 Mortgage Technology, “2014 Mortgage Technology Awards: Online Originator Award,” video, National Mortgage News (Dec. 29, 2014). 173 Ibid. 174 Ibid. 175 Ibid. 176 See Chris Matthews, “Larry Summers' full-throated endorsement of online lending,” Fortune (Apr. 15, 2015). 177 Inside Mortgage Finance data.
Page 28 of 38
servicing customer service.178 Most notably, Quicken has leveraged technology to predict the risk of default and determine loss reduction strategies.179 Technological innovation has also enabled other servicers – such as Walter Investment Management (ninth largest) and Nationstar (fifth largest) – to become more competitive by improving customer experience and channel efficiency; non-banks have lowered delinquency rates by leveraging technology to improve borrower education, streamline processes, and determine loan modification processes that effectively work.180 State regulators note that non-banks’ “advanced servicing technology systems” can improve “loss mitigation alternatives to troubled borrowers.”181
Ocwen Financial, the fourth largest servicer,182 has applied technology to service loans
that other firms would not handle. Ocwen was able to grow its servicing market share through a “superior level of technology,” according to Morningstar.183 It was able to perform rapid loan modification due to proprietary technology and has designed software that transformed how a servicer interacts with an at-risk borrower.184 Ocwen was recently acclaimed for its servicing practices by a New York City housing organization regarding its willingness and ability to modify loan terms for delinquent borrowers so they would be able to keep their homes.185
Most critically, non-bank participants in the mortgage market are on the cusp of future,
greater innovations that demand a careful regulatory hand. For example, SoFi is a venture-backed peer-to-peer lender marketplace aiming to disrupt a paperwork-heavy origination process by targeting young professionals not able to make a large down payment by taking into consideration employment history, school attended and projected income growth to offer individually tailored loan terms via mobile platforms.186 Privlo lends to customers with unconventional credit profiles by leveraging analytics to predict future income streams and even probabilities of growth.187 Even some familiar non-bank names have edged into the business: warehouse club Costco started marketing mortgages online in 2012 with a group of bank and
178 Quicken Loans, “Quicken Loans Earns Top Spot for Unprecedented 5th Consecutive Year in J.D. Power Study for Customer Satisfaction Among U.S. Mortgage Originators,” Quicken Loans Press Room (Nov. 13, 2014). 179 Mortgage Technology, “2013 Top Tech-Savvy Lenders and Servicers List Revealed,” National Mortgage News (Aug. 22, 2013). 180 See David Vita, in MortgageOrb, “LenderLive's David Vida on the New World of Servicing” (Oct. 4, 2011); Marilyn Alva, “Banks to Specialty Mortgage Servicers: Take My Loans,” Investor’s Business Daily (Jan. 25, 2013); Nash & Beardsley, supra note 3; Lee, supra note 48. Ranks are calculated in terms of dollar volume. See Inside Mortgage Finance data. 181 CSBS & AARMR Proposed Regulatory Standards for Non-Banks, supra note 92. 182 Inside Mortgage Finance data (in terms of dollar volume). 183 Morningstar, Operational Risk Assessments News Bulletin: Ocwen Loan Servicing, LLC, Morningstar Assigns ‘MOR RS1’ Non-Prime and Special Servicer Rankings to Ocwen Loan Servicing, LLC (2012). 184 Ibid. 185 Neighborhood Housing Services of New York City, Inc., Press Release, Neighborhood Housing Services of New York City Teams Up with Ocwen Financial Corporation to Offer Aid to Struggling Homeowners (Mar. 6, 2015). 186 See Ben McLannahan, “SoFi hopes to shake up mortgages online,” Financial Times (Mar. 11, 2015); Kayla Tausche, “Would you bypass a bank for your next mortgage?” CNBC (Oct. 7, 2014); Colin Robertson, “Peer-to-Peer Lender SoFi Now Offering Mortgages to Smart People,” The Truth About Mortgage (Oct. 9, 2014). 187 See Amina Elahi, “Privlo, 'cool math' and mortgage eligibility for founders, others,” Blue Sky Originals, The Chicago Tribune (Apr. 30, 2015).

Page 29 of 38
non-bank lenders188 and the U.S.’s largest retailer, Wal-Mart, has been considering mortgages.189 Figure 12 below profiles innovation in mortgage origination and servicing.
Figure 12
Certainly, innovation brings about risks. Pre-crisis originators like Countrywide and Indy Mac were once viewed as innovators as well, as were the securitizers on Wall Street. Yet so far, in a post-crisis period rich in experimentation, non-banks are having a positive effect – they are bringing about market fragmentation and improved customer experience. More critically, the mortgage industry is particularly vulnerable to change. There has always been an asymmetry of knowledge between consumers and mortgage providers, and existing processes are notoriously complex, cumbersome, and opaque – from finding rates to filing documents to closing.
d) Customer experience in the mortgage market
Innovation by non-bank mortgage originators and servicers appears to likely be improving customer experience, just as it is bolstering market share. Quicken Loans, the third largest originator, has won the JD Power Award for excellence in mortgage origination for the past five years.190 During the financial crisis, the Treasury Department found the three worst 188 See Colin Robertson, “Costco Mortgage Review: What Don’t They Do?” The Truth About Mortgage (Apr. 26, 2012). 189 See Beth McKenna, “Would You Apply for a Mortgage Loan from Walmart?” GoBankingRates (Jan. 23, 2013); Al Lewis, “Wal-Mart mortgages could fuel the next bubble,” MarketWatch (Dec. 5, 2012). 190 Quicken Loans, supra note 178.
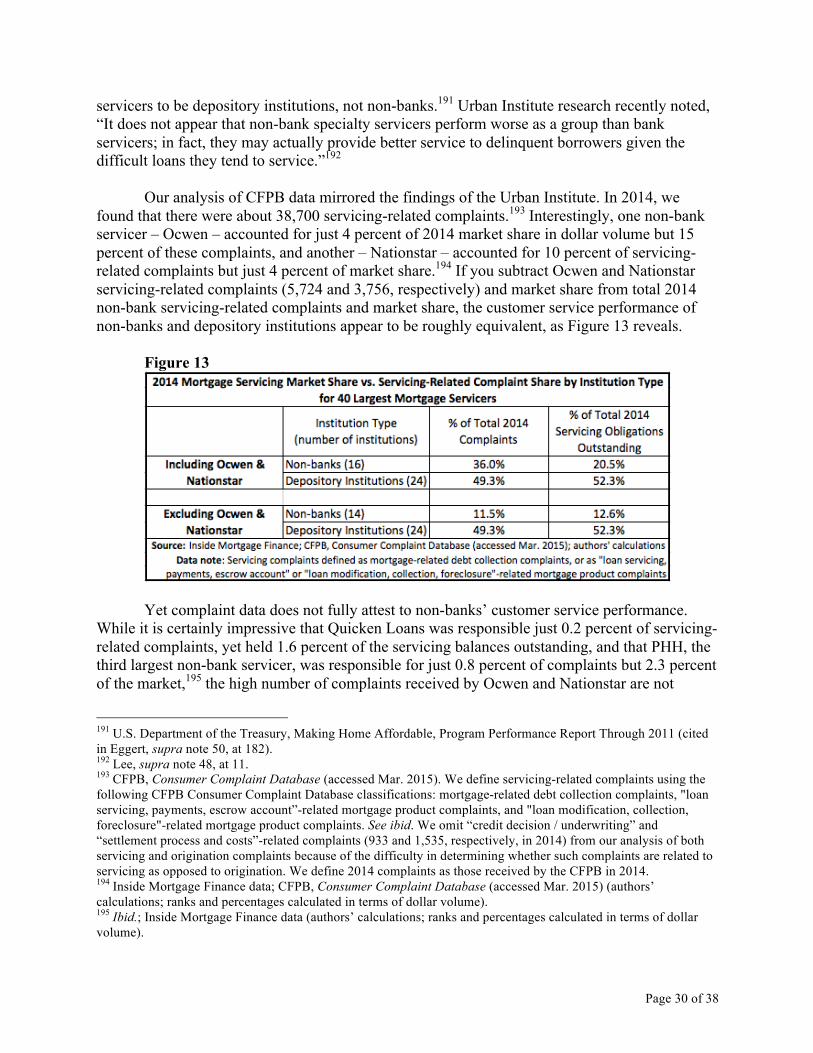
Page 30 of 38
servicers to be depository institutions, not non-banks.191 Urban Institute research recently noted, “It does not appear that non-bank specialty servicers perform worse as a group than bank servicers; in fact, they may actually provide better service to delinquent borrowers given the difficult loans they tend to service.”192
Our analysis of CFPB data mirrored the findings of the Urban Institute. In 2014, we
found that there were about 38,700 servicing-related complaints.193 Interestingly, one non-bank servicer – Ocwen – accounted for just 4 percent of 2014 market share in dollar volume but 15 percent of these complaints, and another – Nationstar – accounted for 10 percent of servicing-related complaints but just 4 percent of market share.194 If you subtract Ocwen and Nationstar servicing-related complaints (5,724 and 3,756, respectively) and market share from total 2014 non-bank servicing-related complaints and market share, the customer service performance of non-banks and depository institutions appear to be roughly equivalent, as Figure 13 reveals. Figure 13
Yet complaint data does not fully attest to non-banks’ customer service performance.
While it is certainly impressive that Quicken Loans was responsible just 0.2 percent of servicing-related complaints, yet held 1.6 percent of the servicing balances outstanding, and that PHH, the third largest non-bank servicer, was responsible for just 0.8 percent of complaints but 2.3 percent of the market,195 the high number of complaints received by Ocwen and Nationstar are not
191 U.S. Department of the Treasury, Making Home Affordable, Program Performance Report Through 2011 (cited in Eggert, supra note 50, at 182). 192 Lee, supra note 48, at 11. 193 CFPB, Consumer Complaint Database (accessed Mar. 2015). We define servicing-related complaints using the following CFPB Consumer Complaint Database classifications: mortgage-related debt collection complaints, "loan servicing, payments, escrow account”-related mortgage product complaints, and "loan modification, collection, foreclosure"-related mortgage product complaints. See ibid. We omit “credit decision / underwriting” and “settlement process and costs”-related complaints (933 and 1,535, respectively, in 2014) from our analysis of both servicing and origination complaints because of the difficulty in determining whether such complaints are related to servicing as opposed to origination. We define 2014 complaints as those received by the CFPB in 2014. 194 Inside Mortgage Finance data; CFPB, Consumer Complaint Database (accessed Mar. 2015) (authors’ calculations; ranks and percentages calculated in terms of dollar volume). 195 Ibid.; Inside Mortgage Finance data (authors’ calculations; ranks and percentages calculated in terms of dollar volume).
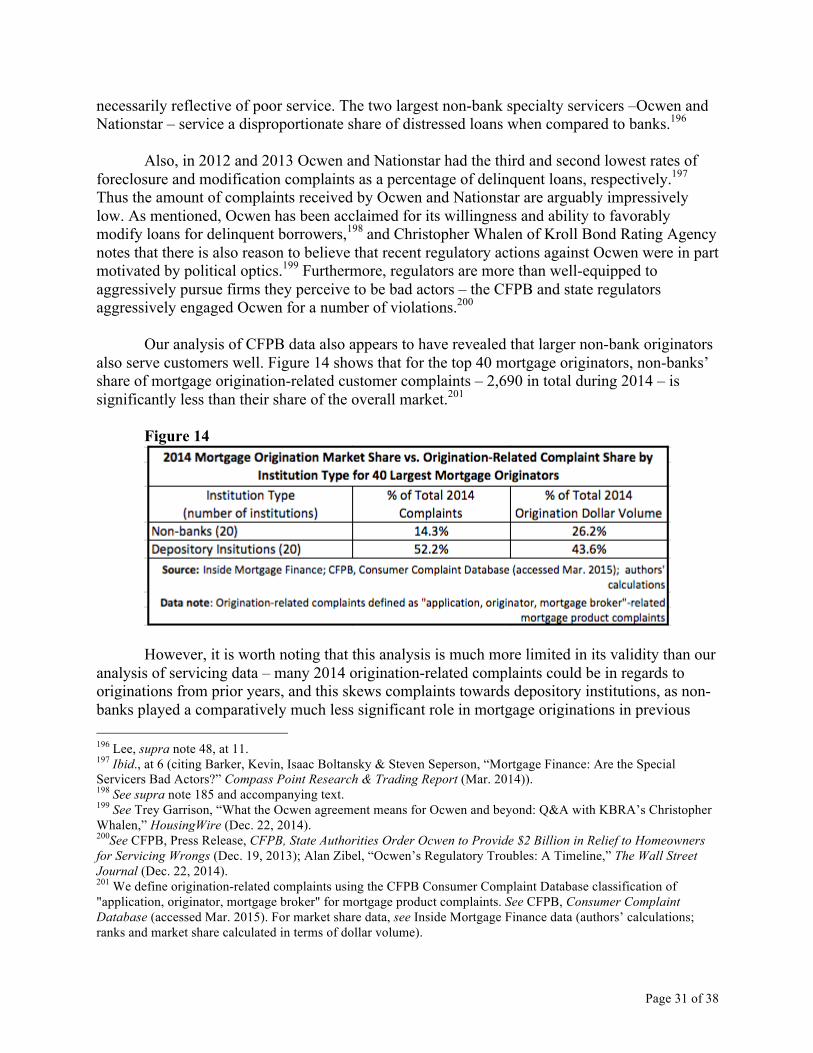
Page 31 of 38
necessarily reflective of poor service. The two largest non-bank specialty servicers –Ocwen and Nationstar – service a disproportionate share of distressed loans when compared to banks.196
Also, in 2012 and 2013 Ocwen and Nationstar had the third and second lowest rates of
foreclosure and modification complaints as a percentage of delinquent loans, respectively.197 Thus the amount of complaints received by Ocwen and Nationstar are arguably impressively low. As mentioned, Ocwen has been acclaimed for its willingness and ability to favorably modify loans for delinquent borrowers,198 and Christopher Whalen of Kroll Bond Rating Agency notes that there is also reason to believe that recent regulatory actions against Ocwen were in part motivated by political optics.199 Furthermore, regulators are more than well-equipped to aggressively pursue firms they perceive to be bad actors – the CFPB and state regulators aggressively engaged Ocwen for a number of violations.200
Our analysis of CFPB data also appears to have revealed that larger non-bank originators also serve customers well. Figure 14 shows that for the top 40 mortgage originators, non-banks’ share of mortgage origination-related customer complaints – 2,690 in total during 2014 – is significantly less than their share of the overall market.201
Figure 14
However, it is worth noting that this analysis is much more limited in its validity than our
analysis of servicing data – many 2014 origination-related complaints could be in regards to originations from prior years, and this skews complaints towards depository institutions, as non-banks played a comparatively much less significant role in mortgage originations in previous 196 Lee, supra note 48, at 11. 197 Ibid., at 6 (citing Barker, Kevin, Isaac Boltansky & Steven Seperson, “Mortgage Finance: Are the Special Servicers Bad Actors?” Compass Point Research & Trading Report (Mar. 2014)). 198 See supra note 185 and accompanying text. 199 See Trey Garrison, “What the Ocwen agreement means for Ocwen and beyond: Q&A with KBRA’s Christopher Whalen,” HousingWire (Dec. 22, 2014). 200See CFPB, Press Release, CFPB, State Authorities Order Ocwen to Provide $2 Billion in Relief to Homeowners for Servicing Wrongs (Dec. 19, 2013); Alan Zibel, “Ocwen’s Regulatory Troubles: A Timeline,” The Wall Street Journal (Dec. 22, 2014). 201 We define origination-related complaints using the CFPB Consumer Complaint Database classification of "application, originator, mortgage broker" for mortgage product complaints. See CFPB, Consumer Complaint Database (accessed Mar. 2015). For market share data, see Inside Mortgage Finance data (authors’ calculations; ranks and market share calculated in terms of dollar volume).
Page 32 of 38
years. Also, overall, there are simply much fewer origination-related complaints. Finally, regarding our analyses of origination and servicing related complaints, it is possible that there are factors that heighten the propensity of depository institutions’ customers to complain. V. Policy Recommendations
Policymakers are right to see the dramatic rise in non-banks’ share of the mortgage-origination and servicing market as potential cause for concern. However, as our analysis in Sections III and IV reveals, macroeconomic and regulatory environments have changed drastically since the financial crisis. Consequently, regulatory objectives should not just be driven by fear of pre-crisis regulatory mishaps. Instead, regulators should take into account lessons learned, strive not to overreact, and focus on establishing a regulatory environment that appropriately balances innovation, systemic stability and consumer protection, while keeping the regulatory playing field even. Most critically, they should address sources of risk, not symptoms. These goals necessitate establishing a delicate balance between priorities. Below, we outline a general framework and highlight some solutions that regulators should adapt when addressing the opportunities and risks brought about by non-bank mortgage originators and servicers.
a) Realistically assess non-bank risk and solutions
FHFA’s regulatory mission – and its mission as conservator – is to protect Fannie Mae and Freddie Mac. And in its recent proposed standards for servicers and originators, adopted in late May 2015 by the GSEs, the FHFA responded to a clear policy problem: non-bank originators and servicers may pose a counterparty risk to the GSEs in a market downturn. FHFA’s OIG correctly observed in early 2015 that “some of the new sellers, particularly non-bank mortgage companies, may lack the capacity to honor their representation and warranty commitments to the Enterprises.”202 And as Henry Cisneros and Mel Martinez of the Bipartisan Policy Center recently noted, Fannie and Freddie themselves lack the “financial cushion” to protect themselves against future losses.203
However, risks concerning the liquidity and capital levels of non-banks are likely
unaddressed by new standards. In assessing FHFA’s proposed rule, Fitch stated that it “does not view the capital and liquidity requirements as materially reducing the risk of default for mortgage servicers under stress.”204 Fitch also notes non-banks’ business is “mostly monoline, cyclical, short-term wholesale funded, thinly profitable and subject to operational and regulatory risks.”205 Yet valid concerns exist regarding the appropriateness and impacts on competitiveness of bank-like regulation for non-banks. Non-banks have no FDIC insurance or Fed access, and do not have the same access to short-term debt markets that large depository institutions utilize to capitalize on asset-liability mismatches.206 Bill Cosgrove of the Mortgage Bankers Association 202 Office of the Inspector General, FHFA, supra note 104, at 32. 203 Henry Cisneros & Mel Martinez, Bipartisan Policy Center, Years After Crisis, Housing Finance System Still in Need of Reform (Apr. 2015). 204 Fitch, FHFA's Proposed Capital Rules Not a Panacea (Feb. 3, 2015). 205 Ibid. 206 Christopher Whalen & Marjan Riggi, Capital Requirements for Non-Bank Mortgage Companies, Kroll Bond Rating Agency (May 2014).
Page 33 of 38
notes that non-banks largely access liquidity through warehouse lenders and repo financing.207 He also explains that while non-banks dedicate all capital to the mortgage business and mostly finance through personal capital and lines of credit, depository institutions have varying demands for capital, and a wide array of assets.208
The risk non-banks pose as counterparties is further mitigated by the fact that they do not appear to hold mortgages on their balance sheet. As of 2014, the GSEs as well as GSE- and Agency-backed pools hold 61 percent of originated home mortgages, while banks and credit unions hold 28 percent.209 Non-banks also generally hold significantly higher levels of tangible capital than depository institutions.210 Certainly, the GSEs’ recently implemented capital and liquidity standards will curb some of the counterparty risk associated with non-bank mortgage servicers, but in its proposal for heightened servicer and seller standards, the FHFA did not provide a clear justification for benefits associated with capital and liquidity requirements for non-banks.
More significantly, it appears that large non-banks are already in compliance with new
standards.211 Yet large non-banks have significantly riskier borrower profiles than small non-banks according to data from AEI’s International Center on Housing Risk,212 while some small non-banks will clearly have a more difficult time complying with these standards. Also, it will likely be difficult for some smaller players to enter the market. Pamela Lee of the Urban Institute notes, “regulators should consider the development of regulations that improve the safety and soundness of this channel, rather than those that eventually close it down.”213 Yet new standards will narrow origination channels. Thus the benefits of non-bank seller and servicer capital rules and minimum size requirements – while risk-mitigating for Fannie Mae and Freddie Mac – appear likely to also bring about some unintended consequences.
In short, it appears most clear is that these rules would likely not make a major difference in the event of a large-scale downturn. Also, FHFA’s OIG recently noted, the “recent shift in direct mortgage sales by smaller and non-bank mortgage company lenders reduces [Fannie Mae’s and Freddie Mac’s] concentration risks.”214 So if new servicer and seller standards result in industry consolidation, they could actually increase risk. Policymakers must exhibit caution when encouraging bank-like regulation for non-banks, and appropriately assess the impacts on competition and consumer experience of such rules.
b) Implement reforms to mitigate counterparty and default risk While new seller and servicer standards may marginally improve safety and soundness, truly addressing the risks associated with riskier non-bank originations and the risk of non-banks 207 Bill Cosgrove, “The importance of nonbanks in the mortgage market,” HousingWire (Apr. 29, 2015). 208 Ibid. 209 Board of Governors of the Federal Reserve System, supra note 1, at L.218. 210 Ibid. 211 Brena Swanson, “Nationstar, Walter ready for new FHFA nonbank requirements,” HousingWire (Feb. 2, 2015). 212 See Oliner et al, supra note 109. 213 Lee, supra note 48, at 11. 214 Office of the Inspector General, FHFA, supra note 104, at 32.
Page 34 of 38
as counterparties entails reforming the GSEs and improving FHA insurance procedures. While politically difficult, doing so would not just address concerns regarding safety and soundness, but also enable non-banks to continue innovating and competing.
A full discussion of the trade-offs between systemic risk and homeownership associated
with reforming the GSEs and FHA is outside this paper’s scope. However, recent legislation215 would have certainly been a step toward a more sustainable balance in which non-banks can innovate, and regulators can worry less that their failures will leave GSEs in a precarious financial position. More diversified risk channels in which there is a larger incentive for private risk monitoring would certainly mitigate the risk of individual originators and servicers.216
Of course, conforming mortgages originated by non-banks are largely going to credit-worthy borrowers, as Figures 6 and 7 and the accompanying text indicate. Instead, as we established, the risk profile of non-banks is largely being lowered by the high exposure of some non-banks to FHA-insured loans. Some non-banks may be taking advantage of FHA guarantees to proliferate loans that borrowers will not be able to repay.217 And while many FHA loans are going to credit-worthy borrowers, that an increasing portion of FHA loans could be going to riskier borrowers for whom this debt may not be appropriate218 is concerning. As discussed, low down payments – like those stemming from GSE and FHA policies – make it more likely that the borrower will default,219 as do large and unpredictable income swings.220 Worse, the geographic concentration of FHA-insured loans could likely intensify housing price declines in the event of a downturn,221 thus potentially fostering even more counterparty risk not just to FHA, but also to the GSEs, which could in turn precipitate system-wide risk. Also, Edward Pinto of AEI has expressed concern that FHA pressure is driving a rebirth in subprime markets.222
In order to prevent government-insured loans from becoming excessively risky,
policymakers should act now to ensure FHA pricing for insurance premiums better account for the true risk of default.223 Right now, the insurance premiums associated with a high-risk loan do not differ from those of a low-risk loan – FHA insurance premiums do not reflect credit risk.224 Importantly, because premiums do not reflect the propensity of a borrower to default to income
215 H.R. 2767, Protecting American Taxpayers and Homeowners Act of 2013; S.1217, Housing Finance Reform and Taxpayer Protection Act of 2014. 216 For legislation that would more effectively achieve these desirable ends, see ibid. For an overview of how winding down Fannie Mae and Freddie Mac could mitigate systemic risk, see White, supra note 17. 217 See Guttentag, supra note 145. 218 See ibid.; Figures 8 & 9 and accompanying text. 219 See supra note 98 & 146-149 and accompanying text. 220 See Darryl E. Getter, “Contributing to the Delinquency of Borrowers,” The Journal of Consumer Affairs (Summer 2003): 86-100. 221 See Charles A. Capone, Jr. & Albert Metz, Mortgage Default and Default Resolutions: Their Impact on Communities (presented at the Federal Reserve Bank of Chicago, Conference on Sustainable Community Development, Washington, DC, March 27, 2003), at 3-4; Pinto, supra note 145, at 27. 222 Edward Pinto, “Wells Fargo and subprime loans,” American Enterprise Institute (Feb. 14, 2014). 223 See Pinto, supra note 152, at 17-18 & 41; Calabria, supra note 57. 224 See Jones, supra note 140, at 22.

Page 35 of 38
shocks,225 they do not assess for one of the most significant sources of default that could bring about the end of a non-bank originator or servicer – large and unpredicted household income swings.226
To ensure non-banks do not originate risky mortgages for which customers are not
eligible, residual income should be incorporated into FHA decision-making as to whether to insure a mortgage, as it is for mortgages insured by the Department of Veterans Affairs (VA).227 As scholars at the Urban Institute explain, this entails the FHA assessing “the borrower’s ability to pay for food, clothing, transportation, medical expenses, and other day-to-day living expenses after paying for the expenses related to the home.”228 By “protect[ing] borrowers from entering into mortgage transactions that have a high likelihood of failure,”229 a residual income test would likely reduce the propensity of some non-banks to lend to severely subprime borrowers. Edward Pinto of AEI has noted that ensuring FHA only insures loans with a projected termination claim rate of less than 10 percent would also mitigate risk, and facilitate the FHA making a “reasonable and good faith determination” that borrowers “have a reasonable ability to repay.”230 Policymakers should also consider this reform option.
Additionally, as with VA-insured loans, which have significantly lower rates of
default,231 risk-sharing standards with issuers and borrowers should be implemented.232 Another way to prevent unscrupulous FHA-insured mortgage lending would be to require originators to “take back” any FHA-insured loan that defaults within six months of origination, as Mark Calabria of the Cato Institute has suggested.233 This would likely also reduce the risk position of some non-banks heavily engaged in FHA lending. Regardless, the status quo sets up an undesirable incentive system in which non-banks can issue mortgages that threaten to undermine mortgage market sustainability because insurance premiums fail to adequately price risk.
c) And avoid unintended consequences
Regulators have adopted a patchwork quilt of regulations aimed at mitigating various manifestations of risk within the mortgage market. A streamlined, balanced, and predictable regulatory environment is essential to ensuring that non-banks capture market share as a result of consumer-friendliness, innovation, and cost-cutting – not regulatory arbitrage. Unsurprisingly, recent Goldman Sachs market research lists regulatory factors as a lead competitive advantage for non-bank mortgage originators and servicers.234
225 See Stuart Quinn, FHA Premium Pricing: How Consumers are Winning, CoreLogic (Jan. 30, 2015) (providing an overview of existing premium rules). 226 See Getter, supra note 220. 227 For a discussion of this proposal, see Goodman et al., supra note 58, at 10-11. 228 Ibid., at 3. 229 Ibid., at 11. 230 See Edward Pinto, supra note 152, at 40 (citing Dodd-Frank Wall Street Reform and Consumer Protection Act, H.R. 4173, 111th Cong. (July 15, 2010), Section 1411). See also supra notes 74-75 and accompanying text. 231 See Goodman et al., supra note 58. 232 See Edward Pinto, FHA Watch, Vol. 2, No. 6 (Jun. 2013), 8. 233 See Calabria, supra note 57, at 7. 234 Nash & Beardsley, supra note 3, at 50.

Page 36 of 38
Mitigating unintended consequences starts with rethinking capital rules, which as we
documented above, are driving non-bank’s surge in market share. The FHFA OIG recently found that capital rules are a factor in driving depository institutions to participate less actively in the mortgage-servicing market.235 Academics, industry, and regulators all agree that Basel III capital requirements have driven depository institutions away from mortgage origination, servicing and securitization, and shifted it to non-depository institutions.236 Thus policymakers should reconsider the efficacy of existing risk-weights. Yet improperly constructed risk-weights could bring about different and potentially more damaging regulatory arbitrage, which is why a robust analysis of the costs and benefits of capital rules and alternatives is so critical.237
Similarly, uncoordinated regulatory objectives – the status quo – heighten unintended
consequences. For example, while Basel III discourages depository institutions from holding high levels of MSRs, New York regulators recently prevented the sale of MSRs held by Wells Fargo to Ocwen.238 Similar regulatory confusion prompted one commentator to recently note, "[a]t a point when you don’t know what exactly your regulator is going to do, it raises more concern when the regulator appears to take a very aggressive stance – all but threatening enforcement actions and fines and penalties” – as a result, banks exit the market.239 Unpredictable regulatory changes across the states and between federal and state regulators have certainly led to unnecessary regulatory costs,240 while advantaging the smaller non-banks that FHFA fears are unsuitable counterparties.241
Put-back rules are also resulting in unintended consequences. Existing rules – while well intended to ensure originators do not lend to un-creditworthy borrowers – may be discouraging origination without mitigating risk.242 As Pamela Patenaude, formerly of the Bipartisan Policy Center, notes, “Most underwriting errors will be detected soon after origination,” and thus the “current three-year put-back window is too long and should be reduced.”243 Similarly, CFPB’s QM rule has disrupted mortgage origination in unintended ways, and may be contributing to the non-bank surge.244
235 FHFA, supra note 9, at 16. 236 See, for example, Tobias Adrian & Adam B. Ashcraft, "Shadow Banking Regulation," Annual Review of Financial Economics 4 (2012): 99-140; New York State Department of Financial Services, Excerpts From Superintendent Lawsky’s Remarks on Non-Bank Mortgage Servicing in New York City (Feb. 12, 2014); Nash & Beardsley, supra note 3, at 54; Plagge, supra note 88. 237 See Krishnamurthy, supra note 37. 238 See Plagge, supra note 88. 239 Victoria Finkle, “Are Regulators Driving Banks Out of Mortgage Servicing?” Mortgage Servicing News (Mar. 3, 2014). 240 Neal Doherty & Maria Moskver, “The Consequences of the Cost of Compliance,” Legal League Quarterly (Q2 2014). 241 Office of the Inspector General, FHFA, supra note 104, at 3. 242 See Pamela Patenaude, “Here's a solid 3-point plan for put-back reform,” HousingWire (May 8, 2014). 243 Ibid. 244 See National Association of Realtors, supra note 113; Calabria, supra note 80; Faith Schwartz, Loan servicing: The Rise of the Non-Bank Servicer (Insights Blog, CoreLogic, Mar. 2015); supra notes 108-112 and accompanying text.
Page 37 of 38
To reduce regulatory arbitrage, reduce unintended consequences, and improve regulatory coordination, bipartisan legislation to bring about robust cost-benefit analysis and the non-binding review of federal financial rulemakings by the Office of Information and Regulatory Affairs (OIRA) – policies that we have endorsed for similar reasons in previous research – should be passed.245 OIRA review would be particularly helpful in the context of improving the coordination of non-bank mortgage originator and servicer regulation at the state and federal levels; former OIRA administrator and Harvard Law School professor Cass Sunstein notes that OIRA review of executive agency regulations fosters the participation of state governments in the federal rulemaking process.246 Critically, this legislation – entailing OIRA review and heightened cost-benefit analysis – would mitigate unintended consequences – such as those brought about by capital rules and put-back rules – by enabling federal financial regulators to better understand costs or benefits of their proposed regulatory actions.247 FHFA’s proposed standards for non-banks were accompanied by inadequate explanation and justification for costs or benefits, or policy alternatives. Similarly, as University of California at Berkeley Professor Prasad Krishnamurthy notes, the trade-offs between homeownership and system-wide stability brought about by capital rule risk-weights would be made more apparent and be better considered through cost-benefit analysis,248 which OIRA engages in. OIRA review would mitigate agency “tunnel vision” 249 – FHFA would be better equipped to weigh the costs to innovation and mortgage access that their proposals bring about, and banking regulators would better understand the implications to Fannie Mae and Freddie Mac caused by creating a competitive advantage for non-banks via capital rules. VI. Conclusion
Non-bank mortgage originators and servicers play a critical role in U.S. mortgage markets. Policymakers are right to be concerned about growing risk in U.S. mortgage origination and servicing markets, and to pay close scrutiny to the increased market share of non-bank mortgage originators and servicers. However, as our research suggests, the market-wide trends of and system-wide risks posed by today’s non-banks are different than those of pre-crisis subprime-originating non-banks. The increase in non-bank market share is more attributable to both the reduced presence of depository institutions in origination and servicing spheres and to an increase in non-bank origination and servicing volume. Regulatory arbitrage and differing cost structures, as well as innovation, are key factors in this trend. Some non-banks appear to be engaging borrowers of troublingly low creditworthiness as a result of FHA policies, driving an increase in their risk profile relative to depository institutions.
245 Marshall Lux & Robert Greene, The State and Fate of Community Banking (Harvard Kennedy School, M-RCBG Associate Working Paper Series, No. 37, Feb. 2015). 246 Cass Sunstein, The Office of Information and Regulatory Affairs: Myths and Realities (Harvard Public Law Working Paper No. 13-07, 2012), 21 & 33-34. 247 See Lux & Greene, supra note 245, at 27-28 for a discussion of these benefits. 248 Krishnamurthy, supra note 37. 249 For a discussion of agency “tunnel vision,” see Omri Ben-Shahar & Carl E. Schneider, The Futility of Cost Benefit Analysis in Financial Disclosure Regulation (Coase-Sandor Inst. for L. & Econ. Working Paper No. 680, 2014), at 15-16.

Page 38 of 38
Certainly non-banks, just like depository institutions that originate or service mortgages, pose a counterparty risk to the GSEs. However, bank-like standards for non-banks, when the riskiest non-banks appear to be the largest and best capitalized, will only marginally mitigate this risk. Truly improving both the vitality and stability of the U.S. mortgage market necessitates the more politically difficult task of reforming risk channels – that means reforming the GSEs and, more important in the context of non-banks, reforming FHA insurance guidelines, which appear to be enabling some non-banks to engage in lending to subprime borrowers while the government bears the risk. Regulatory coordination is also critical to mitigating unintended competitive advantages to non-banks brought about by the existing regulatory environment, such as capital rules creating a competitive advantage for non-banks. OIRA review and cost-benefit analysis of federal financial rulemakings could help ensure that the sometimes-conflicting objectives of FHFA, CFPB, banking regulators, and state regulators are better balanced in such a way that does not bring about regulatory arbitrage or unintended outcomes.
Note: On June 8, 2015, this working paper was updated to include a slightly edited Section II, part a), in response to helpful feedback we received regarding the early history of the FHA and the GSEs. Also, two edits were made within the accompanying text of footnotes 209 and 222.
OCC and OTS Mortgage Metrics Report Disclosure of National Bank and Federal Thrift Mortgage Loan Data
Fourth Quarter 2008
Office of the Comptroller of the Currency Office of Thrift Supervision
Washington, D.C.
April 2009

OCC and OTS Mortgage Metrics Report, Fourth Quarter 2008
Contents
Executive Summary..................................................................................................... 4
About Mortgage Metrics............................................................................................... 8
Definitions and Methods .............................................................................................. 9
PART I: Mortgage Performance...............................................................................................12
Overall Mortgage Portfolio ......................................................................................... 12
Overall Mortgage Performance.................................................................................. 13
Performance of Government Guaranteed Mortgages................................................ 14
Seriously Delinquent Mortgages, by Risk Category................................................... 15
Mortgages 30-59 Days Delinquent, by Risk Category ............................................... 16
First Payment Default, by Risk Category ................................................................... 17
PART II: Home Retention Actions ...........................................................................................18
A. Loan Modifications and Payment Plans............................................................................18
Newly Initiated Home Retention Actions.................................................................... 18
Newly Initiated Home Retention Actions Relative to Newly Initiated Foreclosures .... 19
B. Re-Default Rates of Modified Loans—in Aggregate ........................................................20
Re-Default Rates of Modified Loans: 60 or More Days Delinquent........................... 20
Re-Default Rates of Modified Loans: 30 or More Days Delinquent........................... 21
Re-Default Rates of Modified Loans: 90 or More Days Delinquent........................... 22
Re-Default Rates: Portfolio Loans vs. Loans Serviced for Others (60 or More Days Delinquent).................................................................................... 23
C. Re-Default Rates of Modified Loans—by Changes in Monthly Payments .....................24
Changes to Monthly Payments Due to Modification—Full Year 2008........................ 26
Changes to Monthly Payments Due to Modifications—by Quarters in 2008.............. 27
Modified Loans 60 or More Days Delinquent, by Changes to Monthly Payments: Re-Default Rates at Three, Six, and Nine Months after Modification......................... 28
Modified Loans Delinquent after Six Months, by Changes to Monthly Payments: Re-Default Rates Using Varying Definitions .............................................................. 29
Part III: Home Forfeiture Actions: Foreclosures, Short Sales, and Deed-in-Lieu-of-Foreclosure Actions......................................................................................30
Completed Foreclosures and Other Home Forfeiture Actions ................................... 30
- 2 -
OCC and OTS Mortgage Metrics Report, Fourth Quarter 2008
Home Retention Actions Relative to Forfeiture Actions by Risk Category ................. 31
Newly Initiated Foreclosures...................................................................................... 32
Appendices................................................................................................................................33
Appendix A—New Loan Modifications....................................................................... 33
Appendix B—New Payment Plans............................................................................. 34
Appendix C—First Quarter 2008: Re-Default Rates of Modified Loans, by Changes to Monthly Payments (60 or More Days Delinquent) ............................. 35
Appendix D—Second Quarter 2008: Re-Default Rate of Modified Loans, by Changes to Monthly Payments (60 or More Days Delinquent) ............................. 36
Appendix E—Third Quarter 2008: Re-Default Rate of Modified Loans, by Changes to Monthly Payments (60 or More Days Delinquent) ............................. 37
Appendix F—Short Sales and Deed-in-Lieu-of-Foreclosure Actions ......................... 38
Appendix G—Completed Foreclosures ..................................................................... 39
- 3 -

OCC and OTS Mortgage Metrics Report, Fourth Quarter 2008
Executive Summary This OCC and OTS Mortgage Metrics Report for the fourth quarter of 2008 provides performance data on first lien residential mortgages serviced by national banks and federally regulated thrifts, for both the fourth quarter and the full year. This is the fourth quarterly report and third joint report by the Office of the Comptroller of the Currency (OCC) and the Office of Thrift Supervision (OTS). This report provides a comprehensive picture of mortgage servicing activities of most of the industry’s largest mortgage servicers, covering approximately two-thirds of all mortgages outstanding in the United States and incorporating information on all types of mortgages serviced, including subprime mortgages. More than 90 percent of the mortgages covered were serviced for third parties as a result of loan sales and securitizations.
Key findings of the report are summarized below.
Mortgage Performance
• Credit quality declined during the fourth quarter, continuing the trend reported from the first three quarters. Over the full year, the percentage of current and performing mortgages decreased from 93.33 percent at the end of the first quarter to 89.95 percent at the end of the fourth quarter.
• This decline in credit quality occurred across all risk categories, e.g., prime, Alt-A, subprime, and “other” mortgages.1 Not surprisingly, subprime loans had the highest level of seriously delinquent loans, defined in the report as loans 60 or more days delinquent. The percentage of subprime loans that were seriously delinquent climbed from 10.75 percent at the end of the first quarter to 16.40 percent at the end of the fourth quarter. Similarly, the percentage of Alt-A loans that were seriously delinquent increased over the same period from 5.18 percent to 9.10 percent.
• The biggest percentage jump was in prime mortgages, which is the lowest risk loan category and accounts for approximately two-thirds of all mortgages in the overall portfolio. The percentage of seriously delinquent prime mortgages increased from the very low starting rate at the end of the first quarter of 1.11 percent to 2.40 percent at the end of the fourth quarter—an increase of over 115 percent—with a significant rise from the third to the fourth quarter.
• New in this report are data on first payment defaults, in which borrowers fail to make the very first payment on new loans—an important early indicator of loan performance and potential fraud. The percentage of first payment defaults increased significantly over the year in all risk categories of loans other than prime loans.
Home Retention Actions: Loan Modifications and Payment Plans
• Newly initiated home retention actions totaled 301,648 during the fourth quarter, an increase of 11.2 percent from the third quarter, up 16.3 percent from the second quarter, and up 44.5 percent from the first quarter.
• Somewhat surprisingly, loan modifications, which consist of changes to loan terms such as interest rates or the loan duration, although increasing in actual numbers, nevertheless constituted a decreased proportion of overall home retention actions in the fourth quarter in comparison with payment plans,
1 Approximately 14 percent of loans in the data were not accompanied by credit scores and are classified as “other.” This group includes a mix of prime, Alt-A, and subprime. In large part, the loans were result of acquisitions of loan portfolios from third parties where borrower credit scores at the origination of the loans were not available.
- 4 -
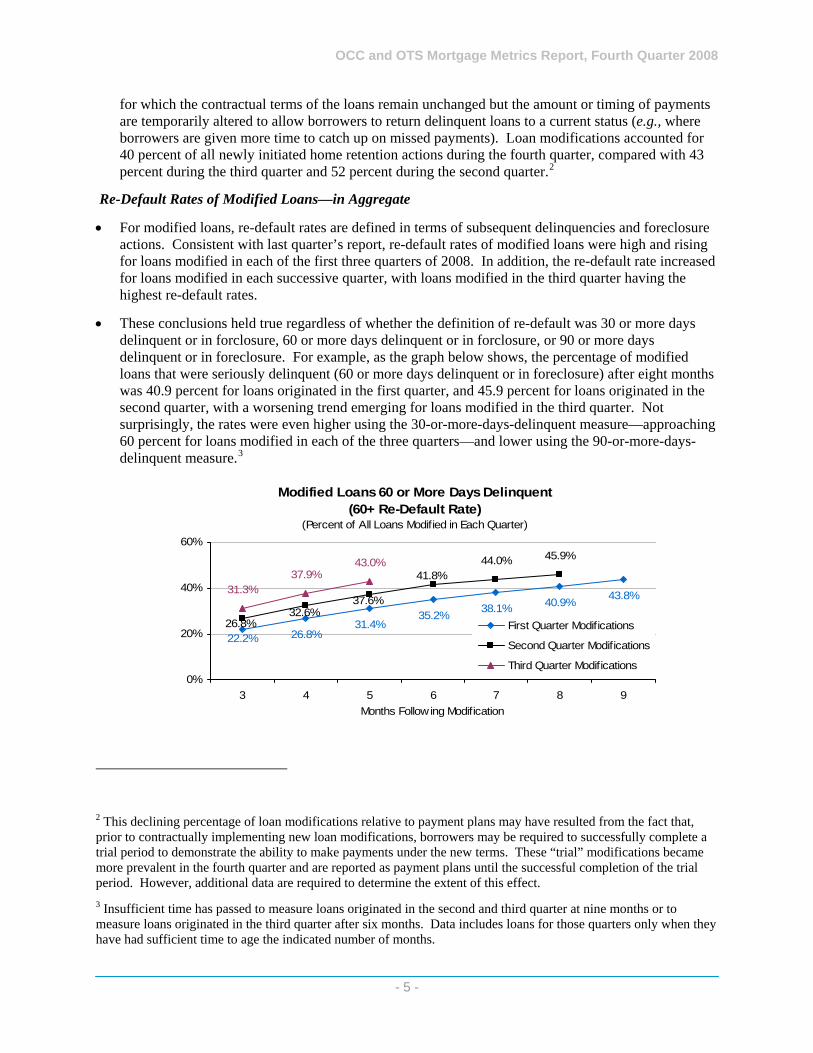
OCC and OTS Mortgage Metrics Report, Fourth Quarter 2008
for which the contractual terms of the loans remain unchanged but the amount or timing of payments are temporarily altered to allow borrowers to return delinquent loans to a current status (e.g., where borrowers are given more time to catch up on missed payments). Loan modifications accounted for 40 percent of all newly initiated home retention actions during the fourth quarter, compared with 43 percent during the third quarter and 52 percent during the second quarter.2
Re-Default Rates of Modified Loans—in Aggregate
• For modified loans, re-default rates are defined in terms of subsequent delinquencies and foreclosure actions. Consistent with last quarter’s report, re-default rates of modified loans were high and rising for loans modified in each of the first three quarters of 2008. In addition, the re-default rate increased for loans modified in each successive quarter, with loans modified in the third quarter having the highest re-default rates.
• These conclusions held true regardless of whether the definition of re-default was 30 or more days delinquent or in forclosure, 60 or more days delinquent or in forclosure, or 90 or more days delinquent or in foreclosure. For example, as the graph below shows, the percentage of modified loans that were seriously delinquent (60 or more days delinquent or in foreclosure) after eight months was 40.9 percent for loans originated in the first quarter, and 45.9 percent for loans originated in the second quarter, with a worsening trend emerging for loans modified in the third quarter. Not surprisingly, the rates were even higher using the 30-or-more-days-delinquent measure—approaching 60 percent for loans modified in each of the three quarters—and lower using the 90-or-more-days-delinquent measure.3
Modified Loans 60 or More Days Delinquent (60+ Re-Default Rate)
(Percent of All Loans Modified in Each Quarter)
26.8%31.4%
35.2% 38.1% 40.9% 43.8%31.3%37.9%
43.0%
22.2%
41.8%
37.6%32.6%
44.0% 45.9%
26.8%
0%
20%
40%
60%
3 4 5 6 7 8 9Months Following Modification
First Quarter Modifications
Second Quarter Modifications
Third Quarter Modifications
2 This declining percentage of loan modifications relative to payment plans may have resulted from the fact that, prior to contractually implementing new loan modifications, borrowers may be required to successfully complete a trial period to demonstrate the ability to make payments under the new terms. These “trial” modifications became more prevalent in the fourth quarter and are reported as payment plans until the successful completion of the trial period. However, additional data are required to determine the extent of this effect. 3 Insufficient time has passed to measure loans originated in the second and third quarter at nine months or to measure loans originated in the third quarter after six months. Data includes loans for those quarters only when they have had sufficient time to age the indicated number of months.
- 5 -
OCC and OTS Mortgage Metrics Report, Fourth Quarter 2008
• Also consistent with last quarter’s report, the re-default rate for loans serviced for third parties (approximately 91 percent of all serviced loans) was significantly higher than the re-default rate for loans held in the servicer’s own portfolio (9 percent of all serviced loans). For example, nine months after modification, the percentage of loans serviced for others that were seriously delinquent was 67 percent higher than loans held on-book (49.5 percent vs. 29.7 percent). This large difference is consistent with the fact that servicers generally have greater flexibility to modify loans held on their own books, especially before default has occurred, than they have with respect to loans serviced for others, which are often subject to more rigid contractual limitations on modification.
Re-Default Rates of Modified Loans—by Changes in Monthly Payments
As noted in last quarter’s report, the reasons for high re-default rates are not clear. They could result from such factors as a significantly worsening economy with more borrowers losing jobs, excessive borrower leverage, issues affecting consumer willingness to pay, or poor initial underwriting. None of these factors can be easily captured in the type of data gathered by this report.
But another potential factor can be assessed more easily through data collection: the extent to which changes in monthly payments affect re-default rates. Loan modifications can reduce monthly payments, leave monthly payments unchanged, or increase monthly payments, depending on the circumstances.
Loan modifications may result in an increase in monthly payments where borrowers and servicers agree to add past due principal and interest, advances for taxes or insurance, and other fees to the balance of the loans and re-amortize the new balances over the remaining life of the loans. The interest rate on the loans may or may not be changed in these situations. Modifications may also result in an increased monthly payment for adjustable rate mortgages about to reset where the interest rate is increased but not by as much as contractually required. Servicers’ modification activities also are dictated by private label and government agency servicing agreements which, in some cases, define the type and the amount of modification(s) that could be executed, and exclude modifications that reduce monthly payments. Servicers report, however, that recent changes in some government and private label servicing standards give them more flexibility to structure loan modifications that reduce monthly payments.
Servicers also modify some loans that leave principal and interest payments unchanged. One example is in cases where servicers “freeze” the current interest rate and payment instead of allowing the rate and payment to increase to the level that would otherwise be required under the contractual loan terms.
Modifications that result in a decrease in payments occur when banks elect to lower interest rates, extend the amortization period, or forgive or forbear principal.
Reduced payments make loan modifications more affordable, and it stands to reason that more affordable payments would be more sustainable and lead to lower re-default rates, whereas increased payments would lead to higher re-default rates. Data were collected for the first time in this quarter to determine whether loan modifications are more effective when loan payments are reduced. Modifications were grouped in four categories to reflect changes in monthly principal and interest payments, that is, modifications that (1) reduced monthly payments by more than 10 percent; (2) reduced monthly payments by 10 percent or less; (3) left monthly payments unchanged; and (4) increased monthly payments. Re-default rates were then calculated for each category. Key findings follow:
• Overall, as shown below, almost 42 percent of loans modified resulted in reduced monthly payments, with more than 29 percent resulting in payment reductions of more than 10 percent. However, the majority of loan modifications did not reduce monthly payments: nearly 27 percent resulted in unchanged monthly payments, and about 32 percent resulted in increased monthly payments.
- 6 -

OCC and OTS Mortgage Metrics Report, Fourth Quarter 2008
Changes in Monthly Payments for Loans Modified in 2008 Percent of All Modifications Number of Modifications in Each Category
Decreased by More Than 10% 29.31% 124,008
Decreased by 10% or Less 12.54% 53,083
Unchanged 26.58% 112,476
Increased 31.57% 133,585
Total 100.00% 423,152 • In the fourth quarter, there was a significant increase in modifications resulting in payment
reductions, as shown below. Unlike in previous quarters, such payment-reducing modifications constituted more than 50 percent of all modifications. Similarly, modifications that reduced monthly payments by more than 10 percent increased more than 11 percentage points, rising to 37.2 percent of all fourth quarter modifications.
Change in Monthly Principal and Interest Payments Due to Loan Modification* First Quarter Second Quarter Third Quarter Fourth Quarter
Number Percent Number Percent Number Percent Number Percent
Decreased by More than 10% 17,066 24.1% 35,687 27.9% 28,487 26.0% 42,768 37.2%
Decreased by 10% or Less 8,183 11.6% 15,731 12.3% 13,622 12.4% 15,547 13.5%
Unchanged 20,452 28.9% 34,228 26.8% 30,316 27.7% 27,480 23.9%
Increased 25,096 35.4% 42,269 33.0% 37,171 33.9% 29,049 25.3% Total 70,797 100.0% 127,915 100.0% 109,596 100.0% 114,844 100.0%
*Percentages may not add to 100 due to rounding • The data collected on re-default rates by changes in monthly payments provide support for the
premise that more affordable monthly payments produce more sustainable modifications. As shown in the chart below, modifications that decreased monthly payments had consistently lower re-default rates, with larger payment reductions resulting in lower re-default rates. When loan modifications decreased monthly payments by more than 10 percent, only 22.7 percent of those loans were seriously delinquent six months after modification. In contrast, when modifications left payments unchanged, 50.6 percent of such loans were seriously delinquent after six months, and for modifications that increased payments, the comparable rate was 45.8 percent.4
4 According to servicers, one explanation for why loan modifications that result in unchanged payments would produce higher re-default rates is that modifications where the payment is unchanged generally do not involve a full assessment of the borrowers’ capacity to continue their payments. Many of these modifications result from servicers freezing the interest rate on adjustable rate mortgages where borrowers face the risk of imminent default prior to the loan resetting to higher payments.
- 7 -

OCC and OTS Mortgage Metrics Report, Fourth Quarter 2008
Re-Default Rate of Modified Loans, by Changes in Payment (60 or More Days Delinquent) (Includes Loans Modified through the End of the Third Quarter)5
Three Months after Modification
Six Months after Modification
Nine Months after Modification
Decreased by More than 10% 13.8% 22.7% 26.2%
Decreased by 10% or Less 18.5% 33.0% 38.6%
Unchanged 41.9% 50.6% 53.5%
Increased 29.2% 45.8% 49.1% Home Forfeiture Actions—Foreclosures, Short Sales, and Deed-in-Lieu-of-Foreclosure Actions • Newly initiated foreclosure actions declined for the second consecutive quarter, decreasing 6.5
percent from the third quarter to 262,906 during the fourth quarter. Similarly, completed foreclosures decreased by 23.5 percent from the third to the fourth quarter. The declines in both measures of foreclosures may reflect, in addition to increased home retention activity, state moratoria on foreclosures and voluntarily suspensions of foreclosure proceedings by servicers in anticipation of a federal program governing loan modifications.
• Importantly, the number of newly initiated home retention actions—loan modifications and payment plans—exceeded the number of newly completed foreclosures and other home forfeiture actions by more than 2.8 times during the fourth quarter and for all risk categories.
About Mortgage Metrics
The OCC and OTS Mortgage Metrics Report presents key data on first lien residential mortgages serviced by national banks and thrifts, focusing on credit performance, loan modifications, payment plans, foreclosures, short sales, and deed-in-lieu-of-foreclosure actions. The OCC and OTS collect these data from the nine national banks6 and four thrifts7 that have the largest mortgage servicing portfolios among all national banks and thrifts—although as the result of merger and acquisition transactions last year, these 13 depository institutions are now owned by nine holding companies.8 The data represent almost 66 percent of all mortgages outstanding. Approximately 91 percent of the mortgages in the portfolio are owned by third parties as a result of loan sales and securitization by government-sponsored enterprises, the originating banks, and other financial institutions. At the end of December 2008, the 13 reporting institutions serviced more than 34.7 million first lien mortgage loans, totaling more than $6.1 trillion in outstanding balances.
5 Insufficient time has passed to measure loans originated in the second and third quarter at nine months or to measure loans originated in the third quarter after six months. Data include loans for those quarters only when they have had sufficient time to age the indicated number of months. 6 The nine banks are Bank of America, JPMorgan Chase, Citibank, First Horizon, HSBC, National City, USBank, Wachovia, and Wells Fargo. Washington Mutual FSB, previously reporting as a separate institution, was acquired by and merged into JPMorgan Chase in September 2008. 7 The thrifts are Countrywide, IndyMac, Merrill Lynch, and Wachovia FSB. 8The holding companies are Bank of America Corp., JPMorgan Chase, Citigroup, First Horizon, HSBC, OneWest (formerly IndyMac), PNC, US Bancorp, and Wells Fargo Corp.
- 8 -
OCC and OTS Mortgage Metrics Report, Fourth Quarter 2008
While the loans reflected in this report represent a very large percentage of the overall mortgage industry, they do not represent a statistically random sample of all mortgage loans. The characteristics of these loans differ in notable ways from the overall population of mortgages. Additionally, this report does not attempt to quantify or adjust for known seasonal effects that occur within the mortgage industry.
In addition to providing important information to the public, the data support the supervision of national bank and thrift mortgage practices. For example, the data provide an additional tool to help examiners assess emerging trends, identify anomalies, compare a servicer with peer institutions, evaluate asset quality and loan loss reserve needs, and evaluate loss mitigation actions.
The report continues to promote a common reporting framework using standardized reporting terms and elements, which allow better comparisons across the industry and over time. The report uses standardized definitions for prime, Alt-A, and subprime mortgages based on commonly used credit score ranges.
The OCC, OTS, and the participating institutions devoted significant resources to validating the data to ensure that the information is reliable, accurate, and consistent with information presented elsewhere. Steps to ensure the validity of the data include comparisons with institutions’ quarterly call and thrift financial reports and internal quality reviews conducted by the banks and thrifts and by the external vendor that compiled the data. However, data sets of this size and scope inevitably suffer from a degree of inconsistency, missing data, and other imperfections. This report notes cases in which data anomalies may have affected the results shown. The OCC and OTS require prior data submissions to be adjusted as errors and omissions are detected. In some cases, data presented in this report reflect resubmissions from institutions that restate and correct earlier information.
New in this Report
The agencies work to continually improve the quality of mortgage data reporting and have expanded their data-collection efforts to include information on the affordability and sustainability of loan modifications. Following the report released in December 2008, the agencies expanded the number of loan-level elements collected from mortgage servicers from 68 to 99. Also new in this report is information on the amount payments changed as a result of loan modifications; how loan modifications vary on the basis of payment change; the performance of government guaranteed mortgages (Federal Housing Administration (FHA) and Department of Veterans Affairs (VA) loans); and first payment default. Going forward, the OCC and OTS will continue to work to improve the quality and availability of the mortgage performance data presented in this report.
The OCC and OTS use a data vendor to aggregate, validate, store, and generate reports, but the agencies retain ownership and control of the data.
Definitions and Methods The report uses standardized definitions for three categories of mortgage creditworthiness based on the following ranges of borrowers’ credit scores at the time of origination:
• Prime—660 and above.
• Alt-A—620 to 659.
• Subprime—below 620.
Approximately 14 percent of loans in the data were not accompanied by credit scores and are classified as “other.” This group includes a mix of prime, Alt-A, and subprime. In large part, they are the result of
- 9 -

OCC and OTS Mortgage Metrics Report, Fourth Quarter 2008
acquisitions of loan portfolios from third parties where borrower credit scores at the origination of the loans were not available. Additional definitions are as follows:
• Seriously delinquent loans—All mortgages that are 60 or more days past due and all mortgages held by bankrupt borrowers who are 30 or more days past due. More generally, loan delinquencies are reported using the Mortgage Bankers Association (MBA) convention, which is that a loan is past due when a scheduled payment is unpaid for 30 days or more.
• Home retention actions—Loan modifications and payment plans. Home retention actions allow borrowers to retain ownership/occupancy of their homes, while attempting to return the loans to a current and performing status.
• Loan modifications—Mortgage for which terms of the loan are contractually changed with respect to interest rates or other terms of the loan.
• Payment plans—Short- to medium-term changes in scheduled terms and payments to return mortgages to a current and performing status. For purposes of this report, payment plans include loans that are in a trial periods with respect to making revised payments under a proposed loan modifications. The loans are reported as modifications after successful completion of the trial periods.
• Re-default rates—The percentage of modified loans that subsequently become delinquent or enter the foreclosure process. As alternative measures of delinquency, this report presents re-defaults rates using 30, 60, and 90 or more days delinquent and in process of foreclosure but focuses most frequently on the 60-day-delinquent measure.9
• Short sales—Sales of the mortgaged properties at prices that net less than the total amount due on the mortgages. Servicers and borrowers negotiate repayment programs, forbearance, and/or forgiveness for any remaining deficiency on the debt to lessen the adverse impact on borrowers’ credit records. A short sale has less adverse impact on borrowers than foreclosure.
• Deed-in-lieu-of-foreclosure actions—Borrowers transfer ownership of the properties (deeds) to servicers in full satisfaction of the outstanding mortgage debt to lessen the adverse impact of the debt on borrowers’ credit records. A deed-in-lieu-of-foreclosure action typically has less adverse impact on borrowers than foreclosure.
• Newly initiated foreclosures—Mortgages for which the servicers initiate formal foreclosure proceedings during the month (e.g., public notice or judicial filing). Many newly initiated foreclosures do not result in the loss of borrowers’ homes, because servicers simultaneously pursue other loss mitigation actions and borrowers may act to return their mortgages to current and performing status.
• Foreclosures in process—The number of mortgages for which servicers have begun a formal foreclosure proceedings (e.g., public notices or judicial filings) but have not yet completed the process resulting in the loss of borrowers’ homes. The foreclosure process varies by state and can take from two to 15 months or more to complete. Many foreclosures in process never result in
9 Some servicers offer modification programs that do not reset or “re-age” delinquency status following modification. The number of loans in this category represents a small percentage of the total number of loan modifications.
- 10 -

OCC and OTS Mortgage Metrics Report, Fourth Quarter 2008
the loss of borrowers’ homes, because servicers simultaneously pursue other loss mitigation actions and borrowers may act to return their mortgages to current and performing status.
• Completed foreclosures—Ownership of properties is transferred to servicers or investors and mortgage debts are extinguished. Completed foreclosures’ ultimate result is the loss of borrowers’ homes because of nonpayment.
The statistics and calculated ratios in this report are based on the number of loans rather than on the dollar amount outstanding.
- 11 -

OCC and OTS Mortgage Metrics Report, Fourth Quarter 2008
PART I: Mortgage Performance
This part of the report describes, in various ways, the credit performance of mortgages in the portfolio, that is, on an overall portfolio basis, of government guaranteed mortgages, by risk category of loan, and by first payment default.
Overall Mortgage Portfolio
The size of the combined national bank and thrift servicing portfolio increased slightly during the fourth quarter, ending the period with nearly 34.7 million loans totaling more than $6.1 trillion. The portfolio composition remained stable at about 67 percent prime, 10 percent Alt-A, 9 percent subprime, and 14 percent “other.”
Overall Mortgage Portfolio First Quarter Second Quarter Third Quarter Fourth Quarter
Total Servicing (Dollars in Millions) $6,079,356 $6,123,392 $6,116,550 $6,123,770
Total Servicing (Number of Loans) 34,610,694 34,749,007 34,640,765 34,696,618
Composition (Percent of All Mortgage Loans in the Portfolio)* Prime 66% 66% 67% 67%
Alt-A 10% 10% 10% 10%
Subprime 9% 9% 9% 9%
Other 15% 14% 14% 14%
Composition (Number of Loans in Each Risk Category of the Portfolio) Prime 22,706,884 23,097,175 23,061,521 23,097,770
Alt-A 3,575,785 3,598,311 3,578,284 3,577,000
Subprime 3,109,720 3,097,981 3,066,208 3,036,727
Other 5,218,305 4,955,540 4,934,752 4,985,121 *Percentages may not add to 100 due to rounding
Portfolio Composition (Percent of All Mortgage Loans in the Portfolio)
Fourth Quarter 2008
Prime67%
Other14%
Subprime9%
Alt-A10%
- 12 -
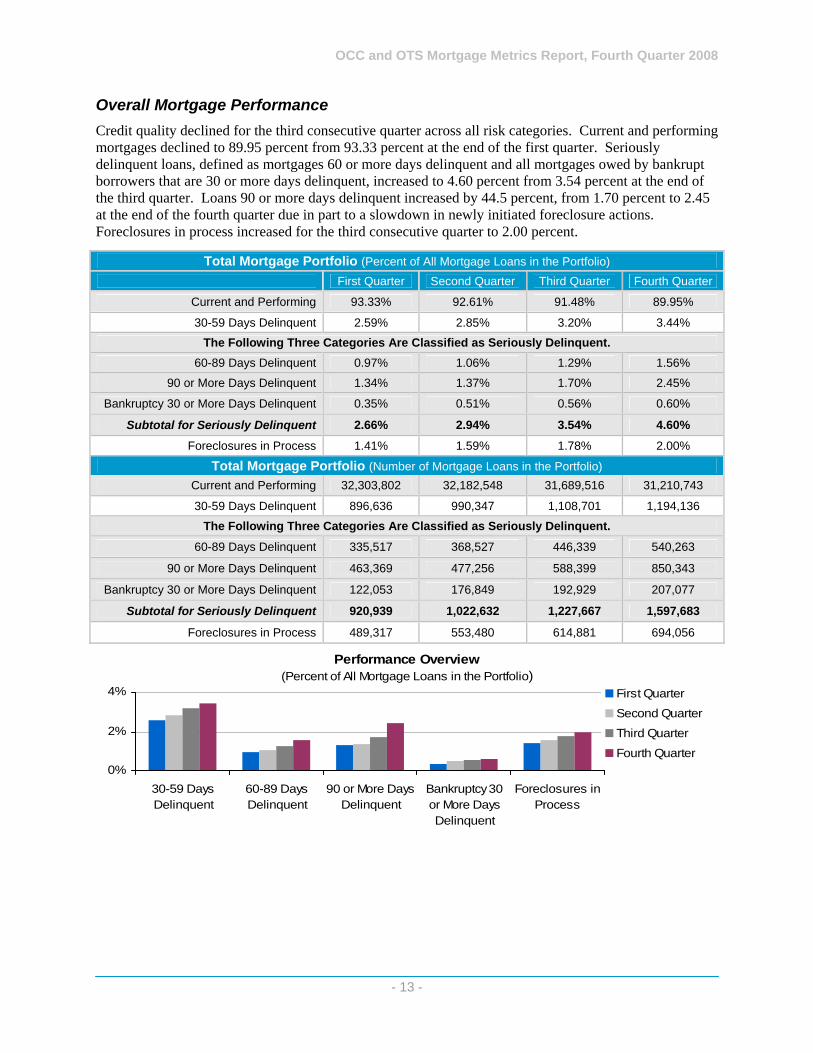
OCC and OTS Mortgage Metrics Report, Fourth Quarter 2008
Overall Mortgage Performance Credit quality declined for the third consecutive quarter across all risk categories. Current and performing mortgages declined to 89.95 percent from 93.33 percent at the end of the first quarter. Seriously delinquent loans, defined as mortgages 60 or more days delinquent and all mortgages owed by bankrupt borrowers that are 30 or more days delinquent, increased to 4.60 percent from 3.54 percent at the end of the third quarter. Loans 90 or more days delinquent increased by 44.5 percent, from 1.70 percent to 2.45 at the end of the fourth quarter due in part to a slowdown in newly initiated foreclosure actions. Foreclosures in process increased for the third consecutive quarter to 2.00 percent.
Total Mortgage Portfolio (Percent of All Mortgage Loans in the Portfolio) First Quarter Second Quarter Third Quarter Fourth Quarter
Current and Performing 93.33% 92.61% 91.48% 89.95%
30-59 Days Delinquent 2.59% 2.85% 3.20% 3.44%
The Following Three Categories Are Classified as Seriously Delinquent. 60-89 Days Delinquent 0.97% 1.06% 1.29% 1.56%
90 or More Days Delinquent 1.34% 1.37% 1.70% 2.45%
Bankruptcy 30 or More Days Delinquent 0.35% 0.51% 0.56% 0.60%
Subtotal for Seriously Delinquent 2.66% 2.94% 3.54% 4.60%
Foreclosures in Process 1.41% 1.59% 1.78% 2.00%
Total Mortgage Portfolio (Number of Mortgage Loans in the Portfolio) Current and Performing 32,303,802 32,182,548 31,689,516 31,210,743
30-59 Days Delinquent 896,636 990,347 1,108,701 1,194,136
The Following Three Categories Are Classified as Seriously Delinquent.
60-89 Days Delinquent 335,517 368,527 446,339 540,263
90 or More Days Delinquent 463,369 477,256 588,399 850,343
Bankruptcy 30 or More Days Delinquent 122,053 176,849 192,929 207,077
Subtotal for Seriously Delinquent 920,939 1,022,632 1,227,667 1,597,683
Foreclosures in Process 489,317 553,480 614,881 694,056
Performance Overview (Percent of All Mortgage Loans in the Portfolio)
0%
2%
4%
30-59 DaysDelinquent
60-89 DaysDelinquent
90 or More DaysDelinquent
Bankruptcy 30or More DaysDelinquent
Foreclosures inProcess
First QuarterSecond Quarter
Third Quarter
Fourth Quarter
- 13 -
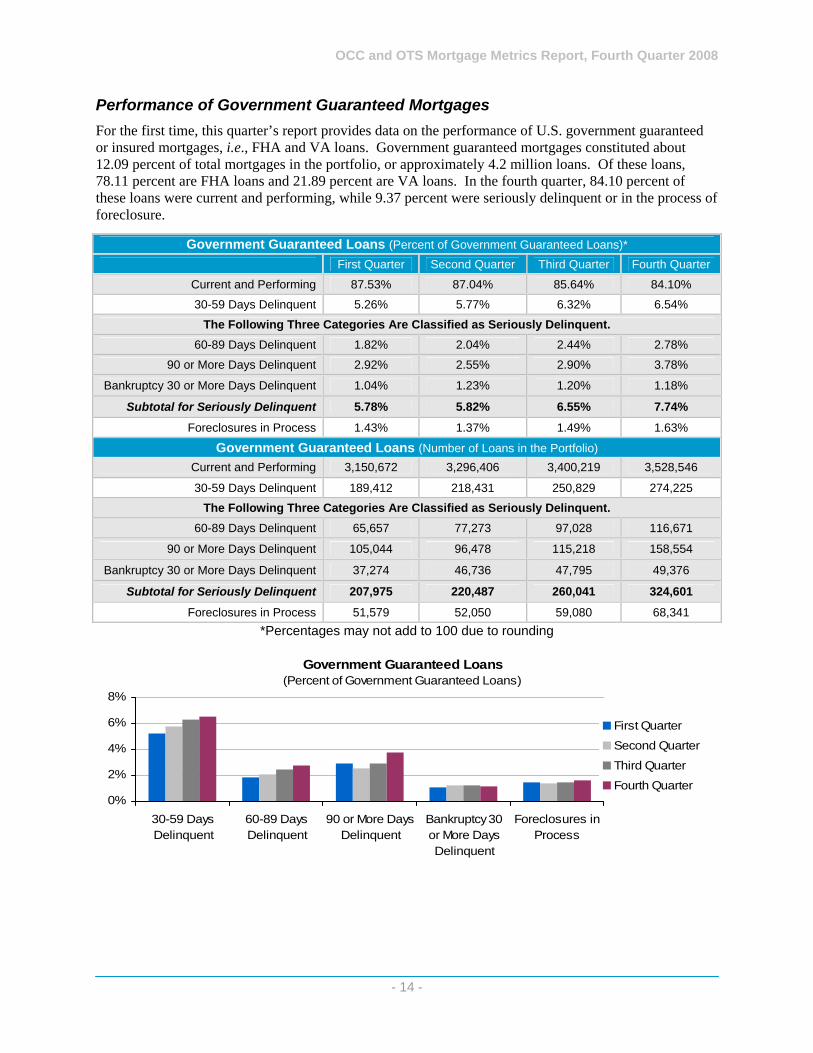
OCC and OTS Mortgage Metrics Report, Fourth Quarter 2008
Performance of Government Guaranteed Mortgages For the first time, this quarter’s report provides data on the performance of U.S. government guaranteed or insured mortgages, i.e., FHA and VA loans. Government guaranteed mortgages constituted about 12.09 percent of total mortgages in the portfolio, or approximately 4.2 million loans. Of these loans, 78.11 percent are FHA loans and 21.89 percent are VA loans. In the fourth quarter, 84.10 percent of these loans were current and performing, while 9.37 percent were seriously delinquent or in the process of foreclosure.
Government Guaranteed Loans (Percent of Government Guaranteed Loans)* First Quarter Second Quarter Third Quarter Fourth Quarter
Current and Performing 87.53% 87.04% 85.64% 84.10%
30-59 Days Delinquent 5.26% 5.77% 6.32% 6.54%
The Following Three Categories Are Classified as Seriously Delinquent. 60-89 Days Delinquent 1.82% 2.04% 2.44% 2.78%
90 or More Days Delinquent 2.92% 2.55% 2.90% 3.78%
Bankruptcy 30 or More Days Delinquent 1.04% 1.23% 1.20% 1.18%
Subtotal for Seriously Delinquent 5.78% 5.82% 6.55% 7.74%
Foreclosures in Process 1.43% 1.37% 1.49% 1.63%
Government Guaranteed Loans (Number of Loans in the Portfolio) Current and Performing 3,150,672 3,296,406 3,400,219 3,528,546
30-59 Days Delinquent 189,412 218,431 250,829 274,225
The Following Three Categories Are Classified as Seriously Delinquent. 60-89 Days Delinquent 65,657 77,273 97,028 116,671
90 or More Days Delinquent 105,044 96,478 115,218 158,554
Bankruptcy 30 or More Days Delinquent 37,274 46,736 47,795 49,376
Subtotal for Seriously Delinquent 207,975 220,487 260,041 324,601
Foreclosures in Process 51,579 52,050 59,080 68,341 *Percentages may not add to 100 due to rounding
Government Guaranteed Loans (Percent of Government Guaranteed Loans)
0%
2%
4%
6%
8%
30-59 DaysDelinquent
60-89 DaysDelinquent
90 or More DaysDelinquent
Bankruptcy 30or More DaysDelinquent
Foreclosures inProcess
First Quarter
Second Quarter
Third Quarter
Fourth Quarter
- 14 -

OCC and OTS Mortgage Metrics Report, Fourth Quarter 2008
Seriously Delinquent Mortgages, by Risk Category Seriously delinquent mortgages, defined as mortgages that are 60 or more days delinquent plus loans to bankrupt borrowers who are 30 or more days delinquent, increased to 4.60 percent of the total portfolio in the fourth quarter from 3.54 percent in the third quarter.
Seriously delinquent mortgages increased across all loan categories during the fourth quarter, continuing the trend reported in prior quarters. Serious delinquencies were highest for subprime loans at 16.40 percent and lowest for prime loans at 2.40 percent, reflecting the higher overall risk profile of subprime loans. Prime loans experienced a significant increase in serious delinquencies, increasing from 1.67 percent in the third quarter to 2.40 percent in the fourth quarter—an increase of nearly 44 percent.
Seriously Delinquent (Percent of All Mortgage Loans in Each Category) First Quarter Second Quarter Third Quarter Fourth Quarter
Prime 1.11% 1.30% 1.67% 2.40%
Alt-A 5.18% 5.80% 7.05% 9.10%
Subprime 10.75% 11.60% 13.52% 16.40%
Other 2.88% 3.10% 3.57% 4.42%
Overall 2.66% 2.94% 3.54% 4.60%
Seriously Delinquent (Number of Loans in the Portfolio) Prime 251,091 301,069 384,781 553,736
Alt-A 185,050 208,770 252,319 325,462
Subprime 334,251 359,314 414,498 498,154
Other 150,547 153,479 176,069 220,331
Total 920,939 1,022,632 1,227,667 1,597,683
Seriously Delinquent (Percent of All Mortgage Loans in Each Category)
0%
3%
6%
9%
12%
15%
18%
First Quarter Second Quarter Third Quarter Fourth Quarter
Prime
Alt-A
SubprimeOther
Overall
- 15 -
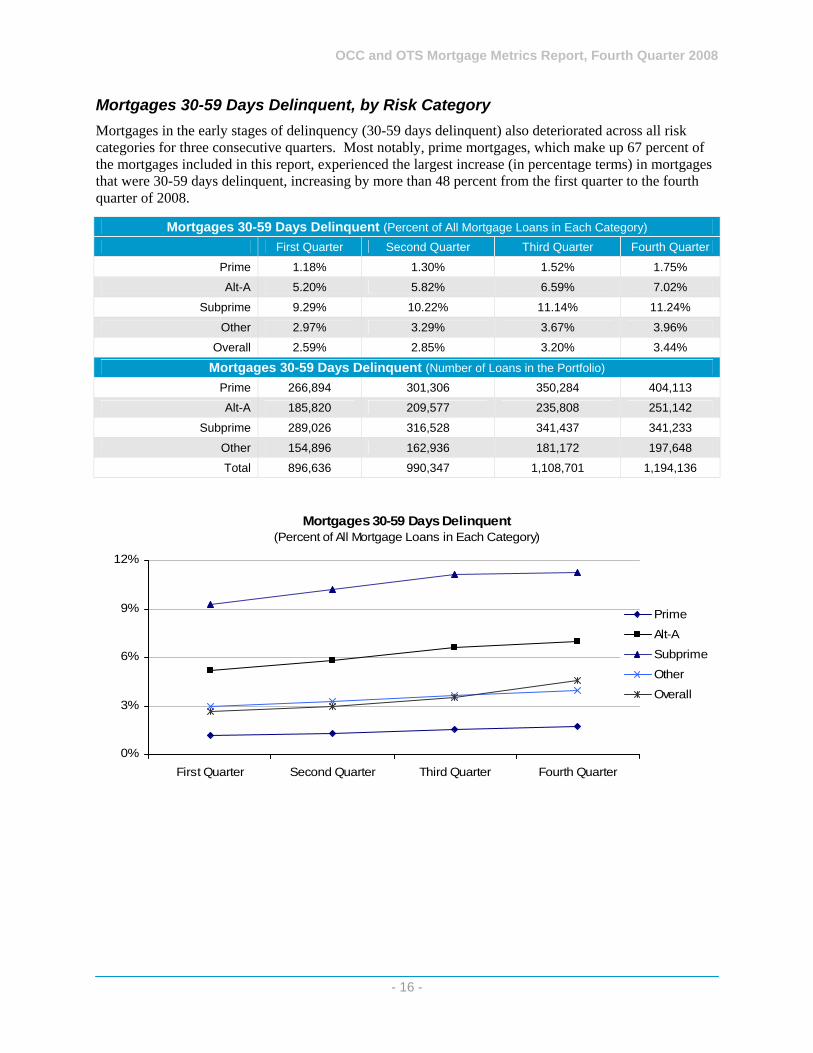
OCC and OTS Mortgage Metrics Report, Fourth Quarter 2008
Mortgages 30-59 Days Delinquent, by Risk Category Mortgages in the early stages of delinquency (30-59 days delinquent) also deteriorated across all risk categories for three consecutive quarters. Most notably, prime mortgages, which make up 67 percent of the mortgages included in this report, experienced the largest increase (in percentage terms) in mortgages that were 30-59 days delinquent, increasing by more than 48 percent from the first quarter to the fourth quarter of 2008.
Mortgages 30-59 Days Delinquent (Percent of All Mortgage Loans in Each Category) First Quarter Second Quarter Third Quarter Fourth Quarter
Prime 1.18% 1.30% 1.52% 1.75%
Alt-A 5.20% 5.82% 6.59% 7.02%
Subprime 9.29% 10.22% 11.14% 11.24%
Other 2.97% 3.29% 3.67% 3.96%
Overall 2.59% 2.85% 3.20% 3.44%
Mortgages 30-59 Days Delinquent (Number of Loans in the Portfolio) Prime 266,894 301,306 350,284 404,113
Alt-A 185,820 209,577 235,808 251,142
Subprime 289,026 316,528 341,437 341,233
Other 154,896 162,936 181,172 197,648
Total 896,636 990,347 1,108,701 1,194,136
Mortgages 30-59 Days Delinquent (Percent of All Mortgage Loans in Each Category)
0%
3%
6%
9%
12%
First Quarter Second Quarter Third Quarter Fourth Quarter
Prime
Alt-ASubprime
Other
Overall
- 16 -
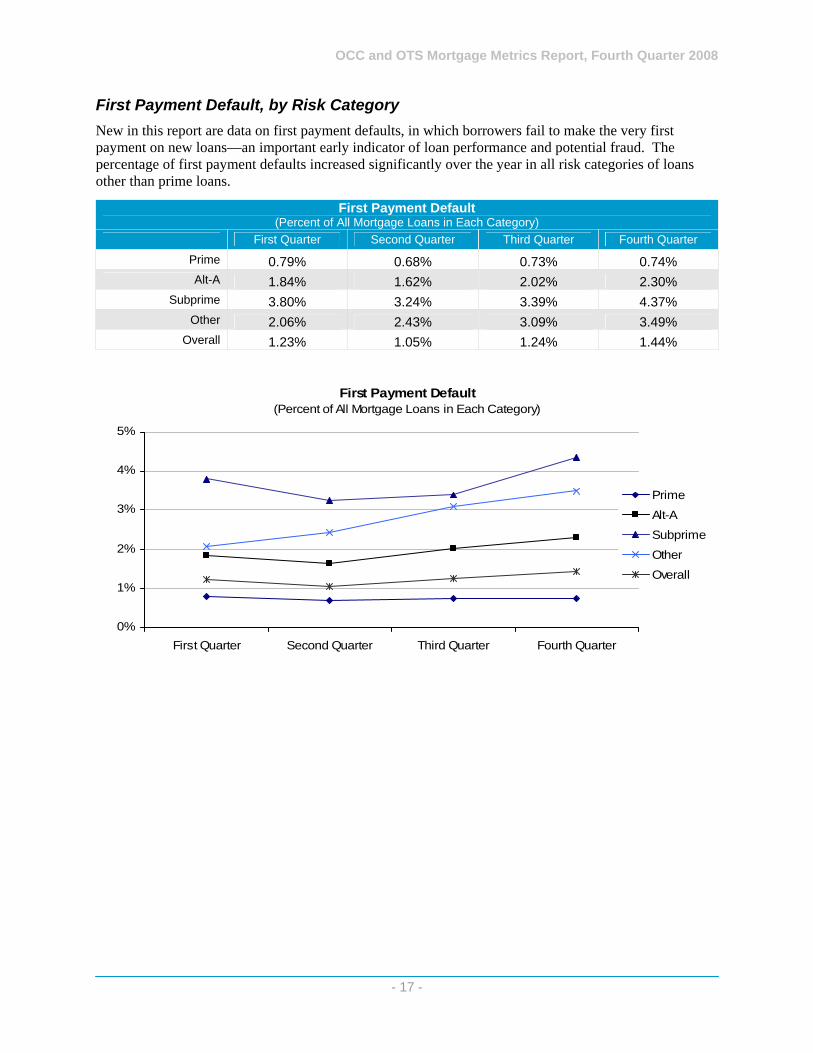
OCC and OTS Mortgage Metrics Report, Fourth Quarter 2008
First Payment Default, by Risk Category New in this report are data on first payment defaults, in which borrowers fail to make the very first payment on new loans—an important early indicator of loan performance and potential fraud. The percentage of first payment defaults increased significantly over the year in all risk categories of loans other than prime loans.
First Payment Default (Percent of All Mortgage Loans in Each Category)
First Quarter Second Quarter Third Quarter Fourth Quarter
Prime 0.79% 0.68% 0.73% 0.74% Alt-A 1.84% 1.62% 2.02% 2.30%
Subprime 3.80% 3.24% 3.39% 4.37% Other 2.06% 2.43% 3.09% 3.49%
Overall 1.23% 1.05% 1.24% 1.44%
First Payment Default(Percent of All Mortgage Loans in Each Category)
0%
1%
2%
3%
4%
5%
First Quarter Second Quarter Third Quarter Fourth Quarter
Prime
Alt-ASubprime
Other
Overall
- 17 -

OCC and OTS Mortgage Metrics Report, Fourth Quarter 2008
PART II: Home Retention Actions
Home retention actions are taken by servicers with the intent of keeping borrowers in their homes. Home retention actions include loan modifications, where servicers modify one or more mortgage terms (e.g., interest rates), and payment plans, where no terms are modified but borrowers are given time to catch up on missed payments.
A. Loan Modifications and Payment Plans
Newly Initiated Home Retention Actions Newly initiated home retention actions totaled 301,648 during the fourth quarter, an increase of more than 11 percent from the third quarter and an increase of more than 16 percent from the second quarter. Loan modifications accounted for 40 percent of all newly initiated home retention actions during the fourth quarter, compared with 43 percent during the third quarter and 52 percent during the second quarter.
This declining percentage of loan modifications relative to payment plans may have resulted from the fact that, prior to contractually implementing new loan modifications, borrowers are often required to successfully complete trial periods to demonstrate the ability to make payments under the new terms. These “trial” modifications became more prevalent in the fourth quarter and are reported as payment plans until the successful completion of the trial periods.
Number of Home Retention Actions—New Loan Modifications and Payment Plans First Quarter Second Quarter Third Quarter Fourth Quarter
Loan Modifications 74,208 134,478 116,483 121,496
Payment Plans 134,624 124,946 154,649 180,152
Total 208,832 259,424 271,132 301,648
Number of Home Retention Actions—New Loan Modifications and Payment Plans
74,208
134,478 116,483 121,496
134,624
124,946 154,649180,152
0
50,000
100,000
150,000
200,000
250,000
300,000
First Quarter Second Quarter Third Quarter Fourth Quarter
Payment Plans
Loan Modifications
- 18 -

OCC and OTS Mortgage Metrics Report, Fourth Quarter 2008
Newly Initiated Home Retention Actions Relative to Newly Initiated Foreclosures The following data show newly initiated home retention actions as a percentage of newly initiated foreclosures during the quarter. For any given risk category, a percentage exceeding 100 percent means newly initiated home retention actions exceeded newly initiated foreclosures.
The number of newly initiated home retention actions exceeded the number of newly initiated foreclosures during the quarter for all risk categories except prime borrowers. The percentage of newly initiated home retention actions relative to newly initiated foreclosures increased for all risk categories from the third to the fourth quarter.
Newly Initiated Home Retention Actions (Percent of Newly Initiated Foreclosures) First Quarter Second Quarter Third Quarter Fourth Quarter
Prime 39.13% 44.21% 51.36% 67.40%
Alt-A 72.44% 92.72% 103.83% 122.04%
Subprime 116.43% 150.75% 149.04% 176.17%
Other 91.98% 114.27% 124.55% 133.60%
Overall 74.54% 89.86% 96.39% 114.74%
Newly Initiated Home Retention Actions (Percent of Newly Initiated Foreclosures)
0%
30%
60%
90%
120%
150%
180%
Prime Alt-A Subprime Other Overall
First QuarterSecond Quarter
Third QuarterFourth Quarter
- 19 -

OCC and OTS Mortgage Metrics Report, Fourth Quarter 2008
B. Re-Default Rates of Modified Loans—in Aggregate
Re-Default Rates of Modified Loans: 60 or More Days Delinquent Consistent with last quarter’s report, re-default rates on modified loans—measured here as 60 or more days delinquent or in the process of foreclosure—were high and rising for loans modified in each of the first three quarters of 2008. In addition, the re-default rate increased for loans modified in each successive quarter, with loans modified in the third quarter having the highest re-default rates.10
Modified Loans 60 or More Days Delinquent (60+ Re-Default Rate)
Modification Date Three Months after Modification
Six Months after Modification
Nine Months after Modification
First Quarter 22.2% 35.2% 43.8%
Second Quarter 26.8% 41.8% X
Third Quarter 31.3% X X
Modified Loans 60 or More Days Delinquent (60+ Re-Default Rate)(Percent of All Loans Modified in Each Quarter)
26.8%
31.4%35.2%
38.1%40.9%
43.8%
31.3%
37.9%
43.0%
22.2%
41.8%
37.6%
32.6%
44.0%45.9%
26.8%
0%
20%
40%
60%
3 4 5 6 7 8 9Months Following Modification
First Quarter Modifications
Second Quarter Modifications
Third Quarter Modifications
10 Insufficient time has passed to measure loans originated in the second and third quarter at nine months or to measure loans originated in the third quarter after six months. Data include loans for those quarters only when they have had sufficient time to age the indicated number of months.
- 20 -
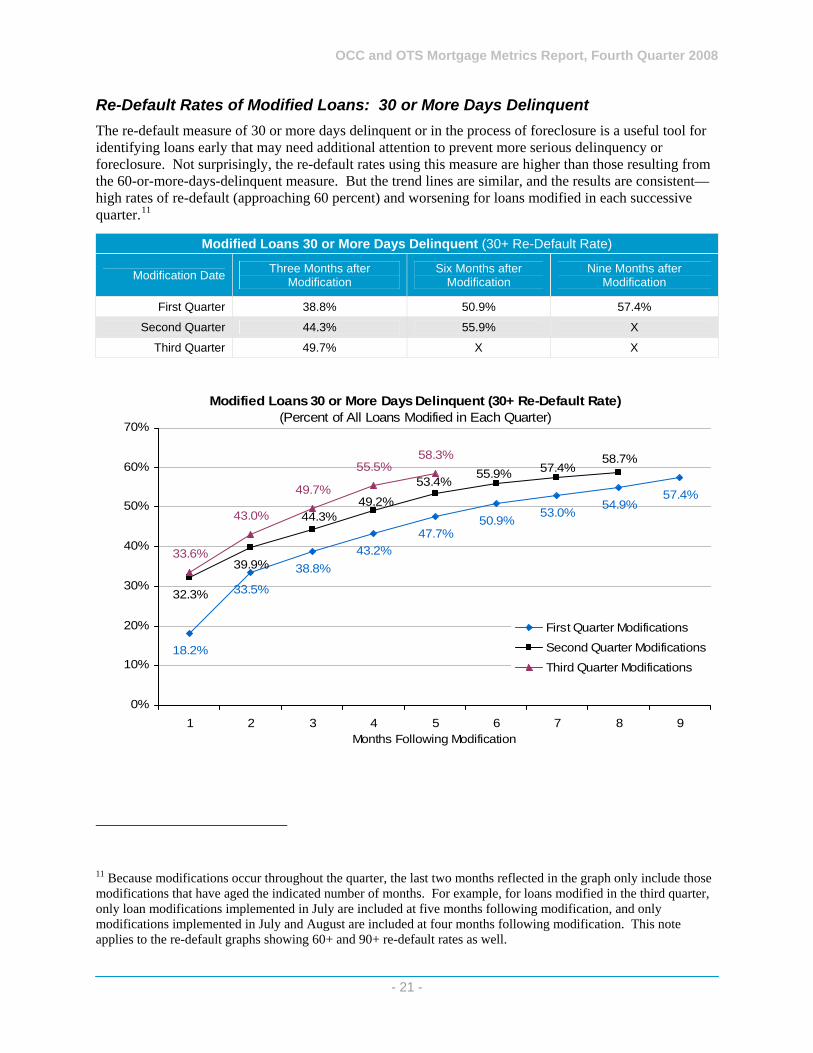
OCC and OTS Mortgage Metrics Report, Fourth Quarter 2008
Re-Default Rates of Modified Loans: 30 or More Days Delinquent The re-default measure of 30 or more days delinquent or in the process of foreclosure is a useful tool for identifying loans early that may need additional attention to prevent more serious delinquency or foreclosure. Not surprisingly, the re-default rates using this measure are higher than those resulting from the 60-or-more-days-delinquent measure. But the trend lines are similar, and the results are consistent—high rates of re-default (approaching 60 percent) and worsening for loans modified in each successive quarter.11
Modified Loans 30 or More Days Delinquent (30+ Re-Default Rate)
Modification Date Three Months after Modification
Six Months after Modification
Nine Months after Modification
First Quarter 38.8% 50.9% 57.4%
Second Quarter 44.3% 55.9% X
Third Quarter 49.7% X X
Modified Loans 30 or More Days Delinquent (30+ Re-Default Rate)(Percent of All Loans Modified in Each Quarter)
33.5%
38.8%43.2%
47.7%50.9%
53.0%54.9%
57.4%
39.9%33.6%
43.0%
49.7%
55.5%58.3%
18.2%
58.7%57.4%55.9%
53.4%
49.2%44.3%
32.3%
0%
10%
20%
30%
40%
50%
60%
70%
1 2 3 4 5 6 7 8 9Months Following Modification
First Quarter Modifications
Second Quarter Modifications
Third Quarter Modifications
11 Because modifications occur throughout the quarter, the last two months reflected in the graph only include those modifications that have aged the indicated number of months. For example, for loans modified in the third quarter, only loan modifications implemented in July are included at five months following modification, and only modifications implemented in July and August are included at four months following modification. This note applies to the re-default graphs showing 60+ and 90+ re-default rates as well.
- 21 -

OCC and OTS Mortgage Metrics Report, Fourth Quarter 2008
Re-Default Rates of Modified Loans: 90 or More Days Delinquent Using the re-default measure of 90 or more days delinquent or in the process of foreclosure, the rates of re-default are lower, as would be expected. Nevertheless, the trend line is similar to that of other re-default measures in that re-defaults increase over time, with rates worsening for loans modified in each successive quarter.
Modified Loans 90 or More Days Delinquent (90+ Re-Default Rate)
Modification Date Three Months after Modification
Six Months after Modification
Nine Months after Modification
First Quarter 13.0% 25.2% 34.6%
Second Quarter 16.3% 31.1% X
Third Quarter 18.5% X X
Modified Loans 90 or More Days Delinquent (90+ Re-Default Rate)(Percent of All Loans Modified in Each Quarter)
17.4%
21.6%25.2%
28.5%31.4%
34.6%
26.9%
31.1%34.1%
36.8%
18.5%
25.3%
31.2%
13.0%
21.7%
16.3%
0%
10%
20%
30%
40%
50%
3 4 5 6 7 8 9Months Following Modification
First Quarter Modifications
Second Quarter ModificationsThird Quarter Modifications
- 22 -

OCC and OTS Mortgage Metrics Report, Fourth Quarter 2008
Re-Default Rates: Portfolio Loans vs. Loans Serviced for Others (60 or More Days Delinquent) Also consistent with last quarter’s report, the re-default rate for loans serviced for third parties (91 percent of all serviced loans) was significantly higher than the re-default rate for loans held in the servicers’ own portfolios (9 percent of all serviced loans).12 This large difference (for example, 70 percent higher after six months) is consistent with the fact that servicers have generally greater flexibility to modify loans held on their own books, especially before default has occurred, than they have with respect to loans serviced for others, which are often subject to more rigid contractual limitations on modification.
Re-Default Rates for Portfolio Loans and Loans Serviced for Others (60 or More Days Delinquent)
Three Months after Modification
Six Months after Modification
Nine Months after Modification
On-Book Portfolio 18.5% 25.9% 29.7%
Serviced for Others 30.7% 44.1% 49.5%
Re-Default Rates for Portfolio Loans and Loans Serviced for Others (60 or More Days Delinquent)
18.5%22.3% 24.3% 25.9% 27.0% 28.2% 29.7%
30.7%
36.2%40.9%
44.1%46.5% 48.4% 49.5%
0%
10%
20%
30%
40%
50%
60%
3 4 5 6 7 8 9Months Following Modification
On-Book Portfolio
Serviced for Others
12 Of the loans serviced for others, 4.49 percent were held by Freddie Mac (FHLMC), 10.55 percent were held by Fannie Mae (FNMA), 0.16 percent were held by Ginnie Mae (GNMA), and 84.80 percent were held by private investors.
- 23 -
OCC and OTS Mortgage Metrics Report, Fourth Quarter 2008
C. Re-Default Rates of Modified Loans—by Changes in Monthly Payments
As noted in last quarter’s report, the reasons for high re-default rates are not clear. They could result from such factors as a significantly worsening economy with more borrowers losing jobs, excessive borrower leverage, issues affecting consumer willingness to pay, or poor initial underwriting. None of these factors can be easily captured in the type of data gathered by this report.
But another potential factor can be assessed more easily through data collection: the extent to which changes in monthly payments affect re-default rates. Loan modifications can reduce monthly payments, leave monthly payments unchanged, or increase monthly payments, depending on the circumstances.
Loan modifications may result in an increase in monthly payments where borrowers and servicers agree to add past due principal and interest, advances for taxes or insurance, and other fees to the balance of the loans and re-amortize the new balances over the remaining life of the loans. The interest rate on the loans may or may not be changed in these situations. Modifications may also result in an increased monthly payment for adjustable rate mortgages about to reset where the interest rate is increased but not by as much as contractually required. Servicers’ modification activities also are dictated by private label and government agency servicing agreements which, in some cases, define the type and the amount of modification(s) that could be executed, and exclude modifications that reduce monthly payments. Servicers report, however, that recent changes in some government and private label servicing standards give them more flexibility to structure loan modifications that reduce monthly payments.
Servicers also modify some loans that leave principal and interest payments unchanged. One example is in cases where servicers “freeze” the current interest rate and payment instead of allowing the rate and payment to increase to the level that would otherwise be required under the contractual loan terms.
Modifications that result in a decrease in payments occur when banks elect to lower interest rates, extend the amortization period, or forgive or forbear principal.
Reduced payments make loan modifications more affordable, and it stands to reason that more affordable payments would be more sustainable and lead to lower re-default rates, whereas increased payments would lead to higher re-default rates. Data were collected for the first time in this quarter to determine whether loan modifications are more effective when loan payments are reduced. Modifications were grouped in four categories to reflect changes in monthly principal and interest payments, that is, modifications that (1) reduced monthly payments by more than 10 percent; (2) reduced monthly payments by 10 percent or less; (3) left monthly payments unchanged; and (4) increased monthly payments. Re-default rates were then calculated for each category.
To understand the data summarized below, two additional points are worth noting. First, while it may seem counterintuitive that a loan modification would increase monthly principal and interest payments—which seem to be at cross-purposes with the goal of producing a sustainable modification—there can be appropriate reasons for a servicer to take such an approach. For loans serviced for others, servicers are often contractually required to take those actions that maximize the value of the mortgage to the holder of the mortgage (the investor). Under normal economic conditions, servicers often modify delinquent mortgages—especially as a first step—by capitalizing missed payments, interest, advances for taxes or insurance, and fees, and then re-amortizing that amount over the remainder of a mortgage term. This practice may be appropriate in cases where borrowers experience temporary cash flow or liquidity problems but have prospects to repay debt over time. Under more positive economic conditions, this practice was generally accepted by investors, servicers, and lenders as an effective loss mitigation strategy. However, in periods of economic stress, the same strategy of increasing monthly payment can carry additional risk and should be administered on a case-by-case basis where borrowers’ income is verified and servicers can have confidence that the modification is likely to be sustainable.
- 24 -

OCC and OTS Mortgage Metrics Report, Fourth Quarter 2008
Also servicers’ modification activities often are dictated by private label and government servicing agreements which, in some cases, define the type and the amount of modification(s) that could be executed. In this regard, a common type of loan modification that is allowed by these pooling and servicing agreements is the capitalization of missed principal and interest payments, fees, advances for taxes and insurance. Moreover, pooling and servicing agreements tended to target severely delinquent borrowers for modification rather than allowing servicers to work with borrowers who are either current or facing imminent default. Servicers report that recent changes in some government and private label servicing standards give them more flexibility to structure loan modifications that reduce monthly payments.
Second, the data summarized in this section of the report consistently show that re-default rates are higher for modifications that leave monthly payments unchanged than for modifications that increased monthly payments. The reasons for this apparent anomaly are unclear. According to servicers, one explanation for why loan modifications that result in unchanged payments would produce higher re-default rates is that modifications where the payments are unchanged generally do not involve a full assessment of the borrowers’ capacity to continue their payments. Many of these modifications result from servicers freezing the interest rate on adjustable rate mortgages where borrowers face the risk of imminent default prior to the loans resetting to higher payments.
- 25 -

OCC and OTS Mortgage Metrics Report, Fourth Quarter 2008
Changes to Monthly Payments Due to Modification—Full Year 2008 As the chart below shows, for all of 2008, 41.85 percent of all modifications reduced monthly principal and interest payments; 26.58 percent left payments unchanged; and 31.57 percent increased monthly payments.13
Changes in Monthly Payments for Loans Modified in 2008 Percent of All Modifications Number of Modifications in Each Category
Decreased by More than 10% 29.31% 124,008
Decreased by 10% or Less 12.54% 53,083
Unchanged 26.58% 112,476
Increased 31.57% 133,585
Total 100.00% 423,152
Changes in Monthly Payments for Loans Modified in 2008
Decreased by 10% or Less
53,00812.54%
Unchanged112,47626.58%
Increased133,58531.57%
Decreased by More than 10%
124,00829.31%
13 Some servicers were unable to report the change in monthly payment for all modifications due to system limitations and processing lag times. Payment change information was not reported on 3,412 modifications in the first quarter, 6,563 in the second quarter, 6,888 in the third quarter, and 6,652 in the fourth quarter.
- 26 -

OCC and OTS Mortgage Metrics Report, Fourth Quarter 2008
Changes to Monthly Payments Due to Modifications—by Quarters in 2008 In the fourth quarter, there was a significant shift toward modifications resulting in payment reductions, as shown below. Unlike in previous quarters, such payment-reducing modifications constituted more than 50 percent of all modifications. Similarly, modifications that reduced monthly payments by more than 10 percent increased more than 11 percentage points, rising to 37.2 percent of all fourth quarter modifications.
Change in Monthly Principal and Interest Payments Due to Loan Modification First Quarter Second Quarter Third Quarter Fourth Quarter
Number Percent Number Percent Number Percent Number Percent
Decreased by More than 10% 17,066 24.1% 35,687 27.9% 28,487 26.0% 42,768 37.2%
Decreased 10% or Less 8,183 11.6% 15,731 12.3% 13,622 12.4% 15,547 13.5%
Unchanged 20,452 28.9% 34,228 26.8% 30,316 27.7% 27,480 23.9%
Increased 25,096 35.4% 42,269 33.0% 37,171 33.9% 29,049 25.3% Total 70,797 100.0% 127,915 100.0% 109,596 100.0% 114,844 100.0%
Change in Monthly Principal and Interest Payments Due to Loan Modification
(Number of Modifications in Each Category)
17,06635,687 28,487
42,7688,183
15,73113,622
15,54720,452
34,22830,316
27,480
37,171
42,269
25,096
29,049
0
30,000
60,000
90,000
120,000
First Quarter Second Quarter Third Quarter Fourth Quarter
Decreased by More than 10% Decreased 10% or Less Unchanged Increased
- 27 -

OCC and OTS Mortgage Metrics Report, Fourth Quarter 2008
Modified Loans 60 or More Days Delinquent, by Changes to Monthly Payments: Re-Default Rates at Three, Six, and Nine Months after Modification As shown in the chart below, modifications that decreased monthly payments had consistently lower re-default rates, with significant payment reductions resulting in significantly lower re-default rates. When loan modifications decreased monthly payments by more than 10 percent, only 22.7 percent of those loans were seriously delinquent six months after modification. In contrast, when modifications left payments unchanged, 50.6 percent of such loans were seriously delinquent after six months, and for modifications that increased payments, the comparable rate was 45.8 percent.
Re-Default Rates of Modified Loans, by Changes in Payment (60 or More Days Delinquent) (Includes Loans Modified through the End of the Third Quarter)14
Three Months after Modification
Six Months after Modification
Nine Months after Modification
Decreased by More than 10% 13.8% 22.7% 26.2%
Decreased by 10% or Less 18.5% 33.0% 38.6%
Unchanged 41.9% 50.6% 53.5%
Increased 29.2% 45.8% 49.1%
Re-Default Rates of Modified Loans, by Changes in Payment (60 or More Days Delinquent)
(Includes Loans Modified through the End of the Third Quarter)
13.8%
22.7%26.2%
38.6%33.0%
18.5%
53.5%50.6%
41.9%
49.1%45.8%
29.2%
0%
15%
30%
45%
60%
3 Months 6 Months 9 months
Decreased by More than 10% Decreased by 10% or Less Unchanged Increased
14 Insufficient time has passed to measure loans originated in the second and third quarter at nine months or to measure loans originated in the third quarter after six months. Data include loans for those quarters only when they have had sufficient time to age the indicated number of months.
- 28 -
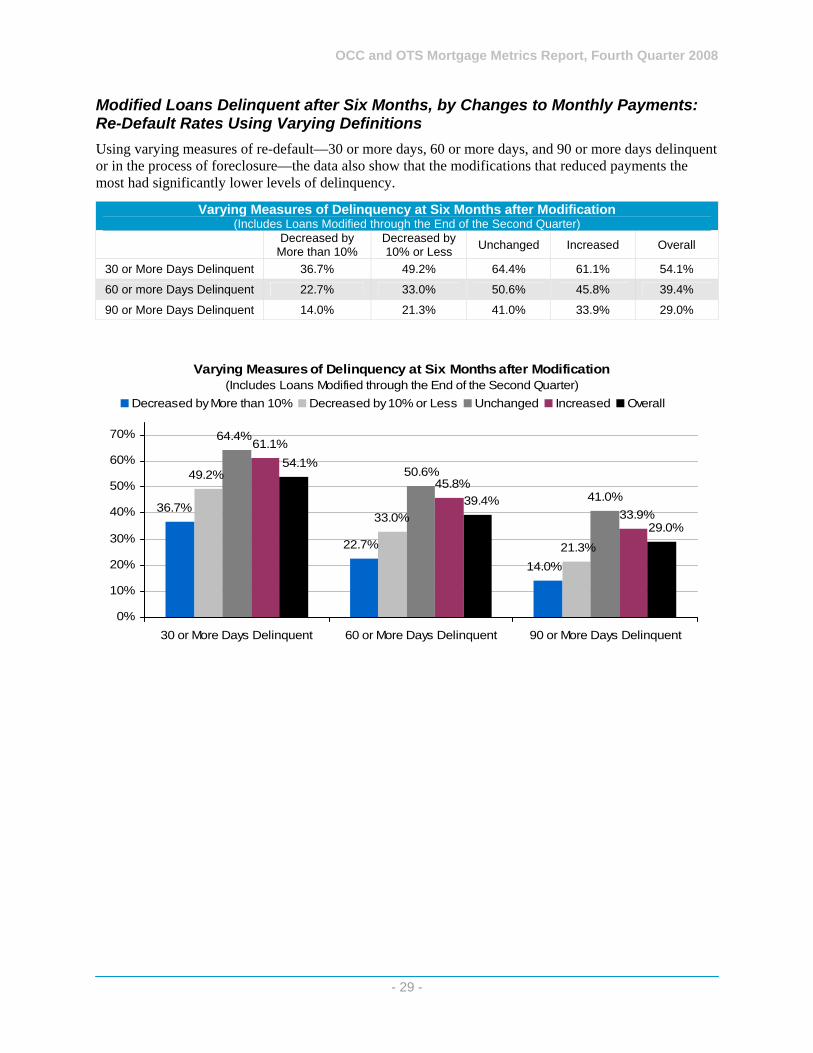
OCC and OTS Mortgage Metrics Report, Fourth Quarter 2008
Modified Loans Delinquent after Six Months, by Changes to Monthly Payments: Re-Default Rates Using Varying Definitions Using varying measures of re-default—30 or more days, 60 or more days, and 90 or more days delinquent or in the process of foreclosure—the data also show that the modifications that reduced payments the most had significantly lower levels of delinquency.
Varying Measures of Delinquency at Six Months after Modification (Includes Loans Modified through the End of the Second Quarter)
Decreased by More than 10%
Decreased by 10% or Less Unchanged Increased Overall
30 or More Days Delinquent 36.7% 49.2% 64.4% 61.1% 54.1%
60 or more Days Delinquent 22.7% 33.0% 50.6% 45.8% 39.4%
90 or More Days Delinquent 14.0% 21.3% 41.0% 33.9% 29.0%
Varying Measures of Delinquency at Six Months after Modification(Includes Loans Modified through the End of the Second Quarter)
14.0%
22.7%
36.7%
21.3%
33.0%
49.2%
41.0%
50.6%
64.4%
33.9%
45.8%
61.1%
29.0%
39.4%
54.1%
0%
10%
20%
30%
40%
50%
60%
70%
30 or More Days Delinquent 60 or More Days Delinquent 90 or More Days Delinquent
Decreased by More than 10% Decreased by 10% or Less Unchanged Increased Overall
- 29 -

OCC and OTS Mortgage Metrics Report, Fourth Quarter 2008
Part III: Home Forfeiture Actions: Foreclosures, Short Sales, and Deed-in-Lieu-of-Foreclosure Actions
Completed Foreclosures and Other Home Forfeiture Actions Completed foreclosures and other home forfeiture actions—short sales and deed-in-lieu-of-foreclosure actions—require borrowers to give up their homes. While homes are forfeited, both short sales and deed-in-lieu-of-foreclosure generally have less adverse impact on borrowers and their credit reports than foreclosure.
Completed foreclosures of 89,634 during the fourth quarter were 29 percent lower than the third quarter. While short sales and deed-in-lieu-of-foreclosure actions increased from 13,888 in the third quarter to 17,577 in the fourth quarter, total home forfeiture actions declined by 23.5 percent to 107,211 from the third to the fourth quarter. The number of home retention actions—loan modifications and payment plans—initiated during the fourth quarter was more than 2.8 times the number of completed foreclosures and other home forfeiture actions during the fourth quarter.
Completed Foreclosures and Other Home Forfeiture Actions
First Quarter
Second Quarter
Third Quarter
Fourth Quarter
New Short Sales 5,523 8,222 13,052 15,395
New Deed-in-Lieu-of-Foreclosure Actions 1,065 807 836 2,182
Completed Foreclosures 76,548 117,337 126,280 89,634
Total 83,136 126,366 140,168 107,211 Newly Initiated Home Retention Actions Relative
to Completed Foreclosures and Other Home Forfeiture Actions
251.19% 205.30% 193.43% 281.36%
New Completed Foreclosures and Other Home Forfeiture Actions
76,548
117,337126,280
89,634
5,523
8,222
13,052
15,395
2,182
1,065
807
836
0
25,000
50,000
75,000
100,000
125,000
150,000
First Quarter Second Quarter Third Quarter Fourth Quarter
Completed Foreclosures Short Sales Deed-in-Lieu-of-Foreclosure
- 30 -

OCC and OTS Mortgage Metrics Report, Fourth Quarter 2008
Home Retention Actions Relative to Forfeiture Actions by Risk Category
During the fourth quarter, newly initiated home retention actions—loan modifications and payment plans—increased for all risk categories, while the number of completed foreclosures and other home forfeiture actions—short sales and deed-in-lieu-of-foreclosure actions—decreased for all risk categories.
Newly initiated home retention actions were more than 2.8 times the number of completed foreclosures and other home forfeiture actions during the fourth quarter. For subprime loans, newly initiated home retention actions were more than 4.7 times the number of completed foreclosures and other home forfeiture actions. All risk categories reflected a significantly greater number of new home retention actions relative to home forfeiture actions during the fourth quarter.
Newly Initiated Home Retention Actions (Percent of Completed Foreclosures and Other Home Forfeiture Actions)
First Quarter Second Quarter Third Quarter Fourth Quarter Prime 164.42% 113.25% 101.29% 167.93%
Alt-A 226.88% 194.19% 198.32% 297.19%
Subprime 373.18% 345.34% 344.15% 470.54%
Other 230.62% 210.08% 215.23% 268.20%
Overall 251.19% 205.30% 193.43% 281.36%
Newly Initiated Home Retention Actions (Percent of Completed Foreclosures and Other Home Forfeiture Actions)
0%
100%
200%
300%
400%
500%
Prime Alt-A Subprime Other Overall
First Quarter
Second QuarterThird Quarter
Fourth Quarter
- 31 -

OCC and OTS Mortgage Metrics Report, Fourth Quarter 2008
Newly Initiated Foreclosures The number of newly initiated foreclosures declined for the second consecutive quarter, falling 6.5 percent from the third quarter to 262,906. Newly initiated foreclosures decreased for every risk category except “other,” which increased by 744, or 2.4 percent, from the third to the fourth quarter.
Newly initiated foreclosures were concentrated disproportionately in subprime loans, which experienced 26 percent of all newly initiated foreclosures in the quarter, despite representing only 9 percent of all loans.15
Number of Newly Initiated Foreclosures First Quarter Second Quarter Third Quarter Fourth Quarter
Prime 105,698 121,058 117,285 109,379
Alt-A 61,187 60,427 57,648 53,957
Subprime 77,539 75,030 75,786 68,247
Other 35,737 32,174 30,579 31,323
Total 280,161 288,689 281,298 262,906
Number of Newly Initiated Foreclosures
0
30,000
60,000
90,000
120,000
Prime Alt-A Subprime Other
First QuarterSecond Quarter
Third QuarterFourth Quarter
15 The drop in completed and newly initiated foreclosures may reflect national emphasis on preventing foreclosure, as well as state moratoria laws and voluntary suspension of foreclosure proceedings by servicers in anticipation of a federal program governing loan modifications.
- 32 -
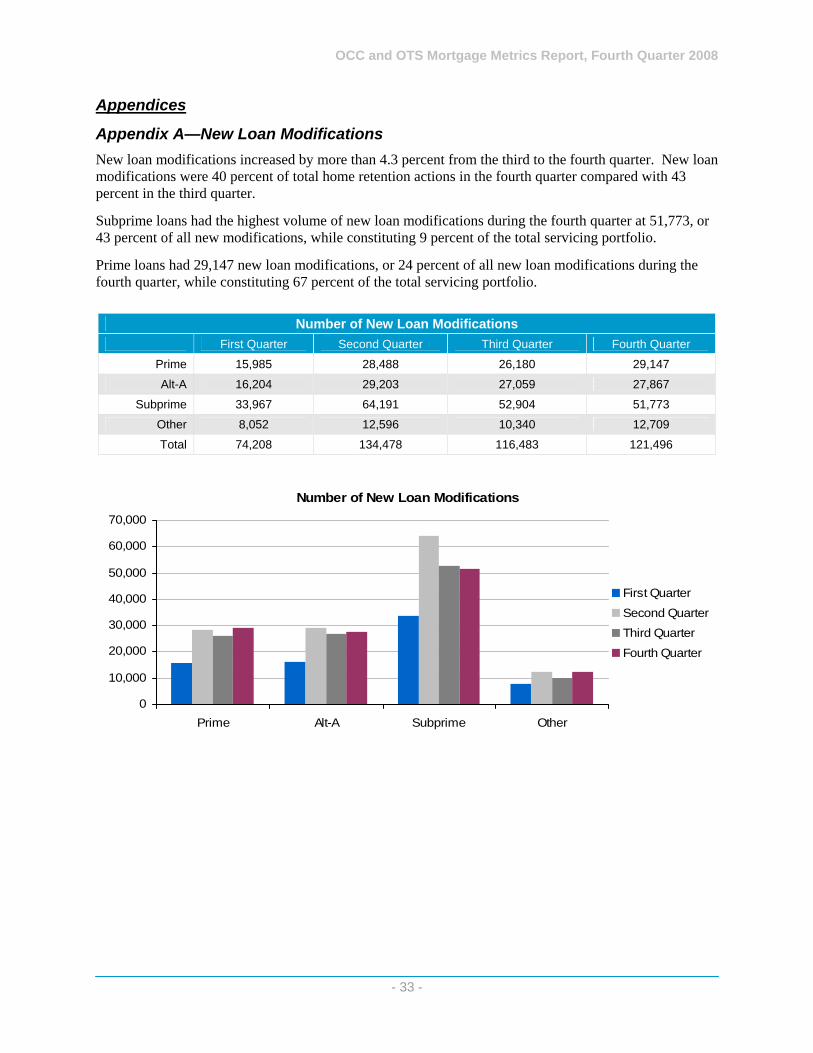
OCC and OTS Mortgage Metrics Report, Fourth Quarter 2008
Appendices
Appendix A—New Loan Modifications New loan modifications increased by more than 4.3 percent from the third to the fourth quarter. New loan modifications were 40 percent of total home retention actions in the fourth quarter compared with 43 percent in the third quarter.
Subprime loans had the highest volume of new loan modifications during the fourth quarter at 51,773, or 43 percent of all new modifications, while constituting 9 percent of the total servicing portfolio.
Prime loans had 29,147 new loan modifications, or 24 percent of all new loan modifications during the fourth quarter, while constituting 67 percent of the total servicing portfolio.
Number of New Loan Modifications First Quarter Second Quarter Third Quarter Fourth Quarter
Prime 15,985 28,488 26,180 29,147
Alt-A 16,204 29,203 27,059 27,867
Subprime 33,967 64,191 52,904 51,773
Other 8,052 12,596 10,340 12,709
Total 74,208 134,478 116,483 121,496
Number of New Loan Modifications
0
10,000
20,000
30,000
40,000
50,000
60,000
70,000
Prime Alt-A Subprime Other
First Quarter
Second QuarterThird Quarter
Fourth Quarter
- 33 -
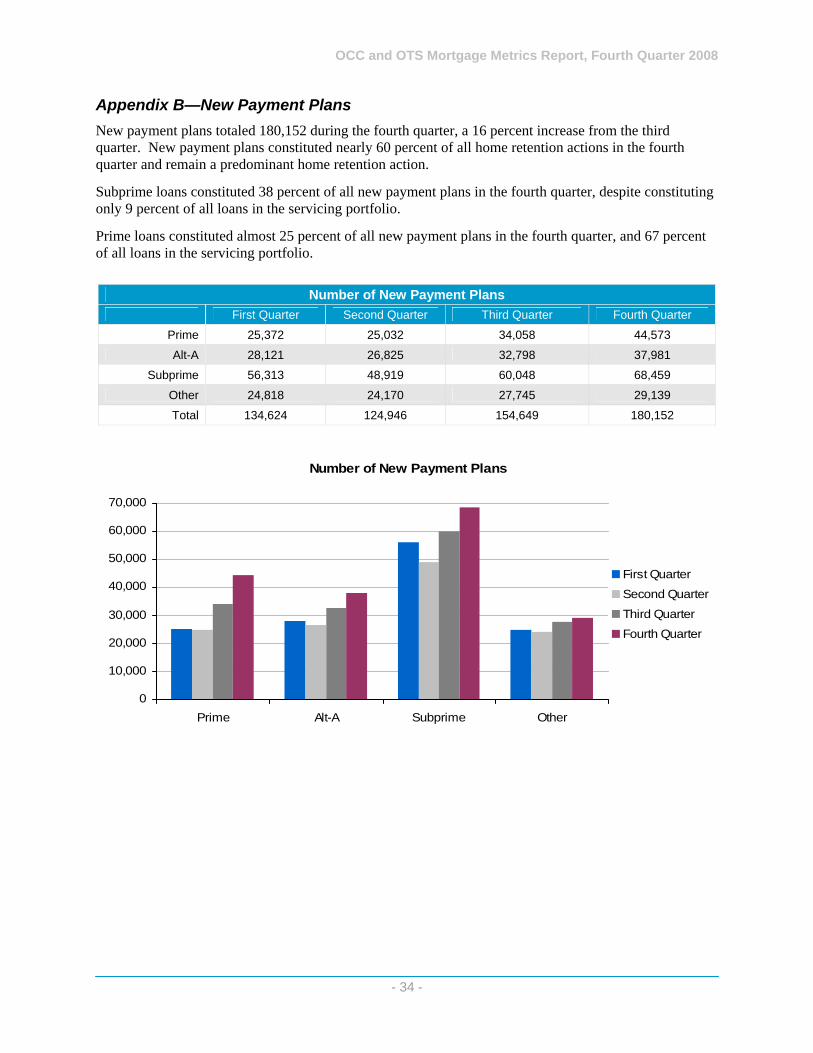
OCC and OTS Mortgage Metrics Report, Fourth Quarter 2008
Appendix B—New Payment Plans New payment plans totaled 180,152 during the fourth quarter, a 16 percent increase from the third quarter. New payment plans constituted nearly 60 percent of all home retention actions in the fourth quarter and remain a predominant home retention action.
Subprime loans constituted 38 percent of all new payment plans in the fourth quarter, despite constituting only 9 percent of all loans in the servicing portfolio.
Prime loans constituted almost 25 percent of all new payment plans in the fourth quarter, and 67 percent of all loans in the servicing portfolio.
Number of New Payment Plans First Quarter Second Quarter Third Quarter Fourth Quarter
Prime 25,372 25,032 34,058 44,573
Alt-A 28,121 26,825 32,798 37,981
Subprime 56,313 48,919 60,048 68,459
Other 24,818 24,170 27,745 29,139
Total 134,624 124,946 154,649 180,152
Number of New Payment Plans
0
10,000
20,000
30,000
40,000
50,000
60,000
70,000
Prime Alt-A Subprime Other
First QuarterSecond Quarter
Third QuarterFourth Quarter
- 34 -
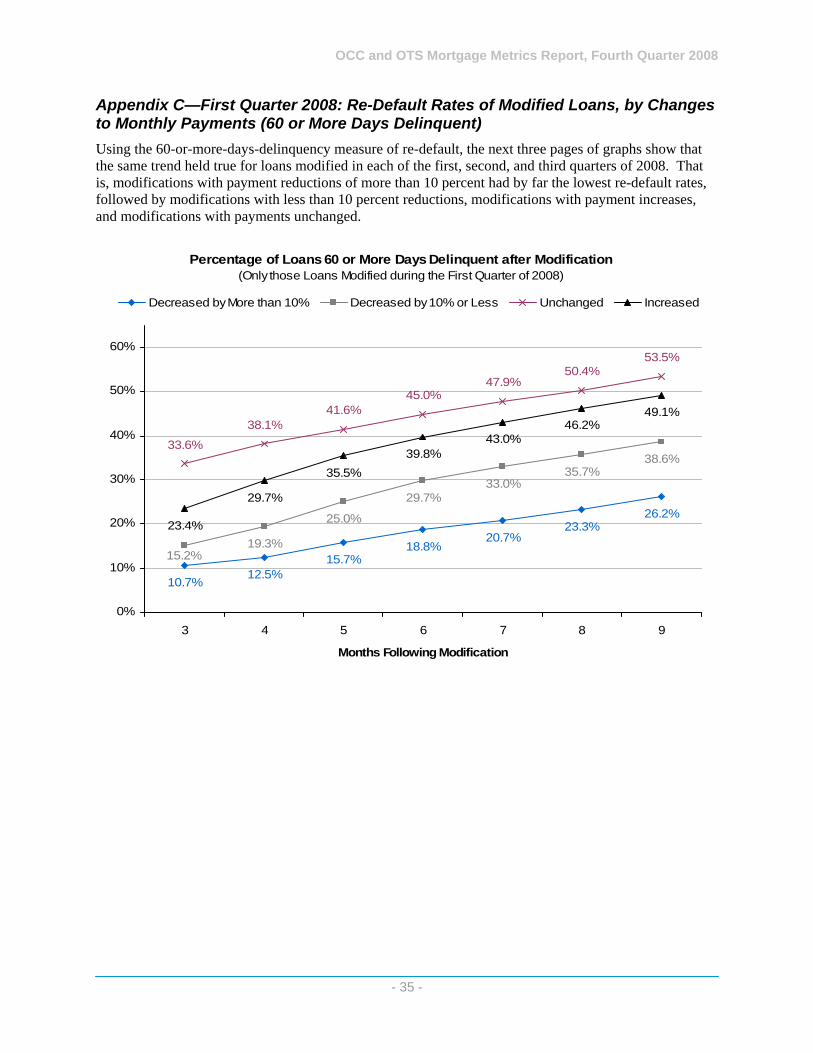
OCC and OTS Mortgage Metrics Report, Fourth Quarter 2008
Appendix C—First Quarter 2008: Re-Default Rates of Modified Loans, by Changes to Monthly Payments (60 or More Days Delinquent) Using the 60-or-more-days-delinquency measure of re-default, the next three pages of graphs show that the same trend held true for loans modified in each of the first, second, and third quarters of 2008. That is, modifications with payment reductions of more than 10 percent had by far the lowest re-default rates, followed by modifications with less than 10 percent reductions, modifications with payment increases, and modifications with payments unchanged.
Percentage of Loans 60 or More Days Delinquent after Modification(Only those Loans Modified during the First Quarter of 2008)
10.7%12.5%
15.7%18.8%
20.7%23.3%
26.2%
19.3%
25.0%
29.7%33.0%
35.7%38.6%
33.6%
38.1%41.6%
45.0%47.9%
50.4%53.5%
23.4%
29.7%
35.5%
15.2%
49.1%46.2%
39.8%43.0%
0%
10%
20%
30%
40%
50%
60%
3 4 5 6 7 8 9
Months Following Modification
Decreased by More than 10% Decreased by 10% or Less Unchanged Increased
- 35 -
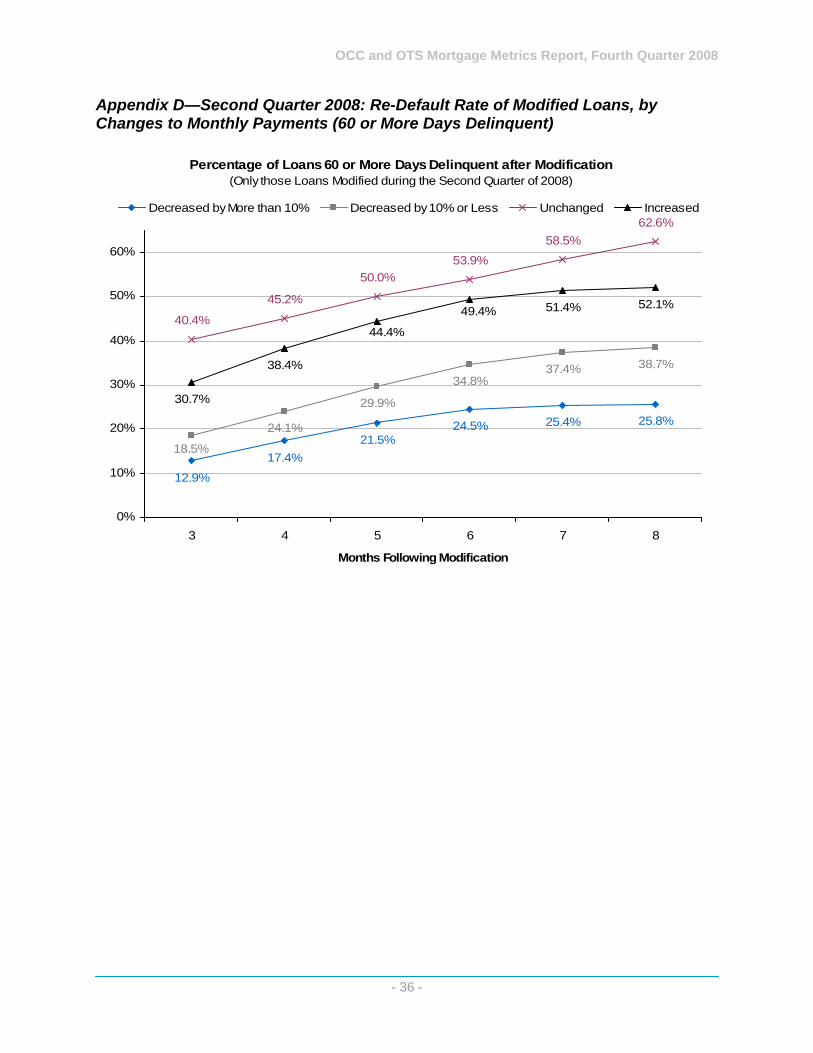
OCC and OTS Mortgage Metrics Report, Fourth Quarter 2008
Appendix D—Second Quarter 2008: Re-Default Rate of Modified Loans, by Changes to Monthly Payments (60 or More Days Delinquent)
Percentage of Loans 60 or More Days Delinquent after Modification(Only those Loans Modified during the Second Quarter of 2008)
12.9%
17.4%21.5%
24.5% 25.4% 25.8%24.1%
29.9%
34.8%37.4% 38.7%
40.4%
45.2%
50.0%53.9%
58.5%62.6%
30.7%
38.4%
51.4% 52.1%
18.5%
44.4%
49.4%
0%
10%
20%
30%
40%
50%
60%
3 4 5 6 7 8
Months Following Modification
Decreased by More than 10% Decreased by 10% or Less Unchanged Increased
- 36 -
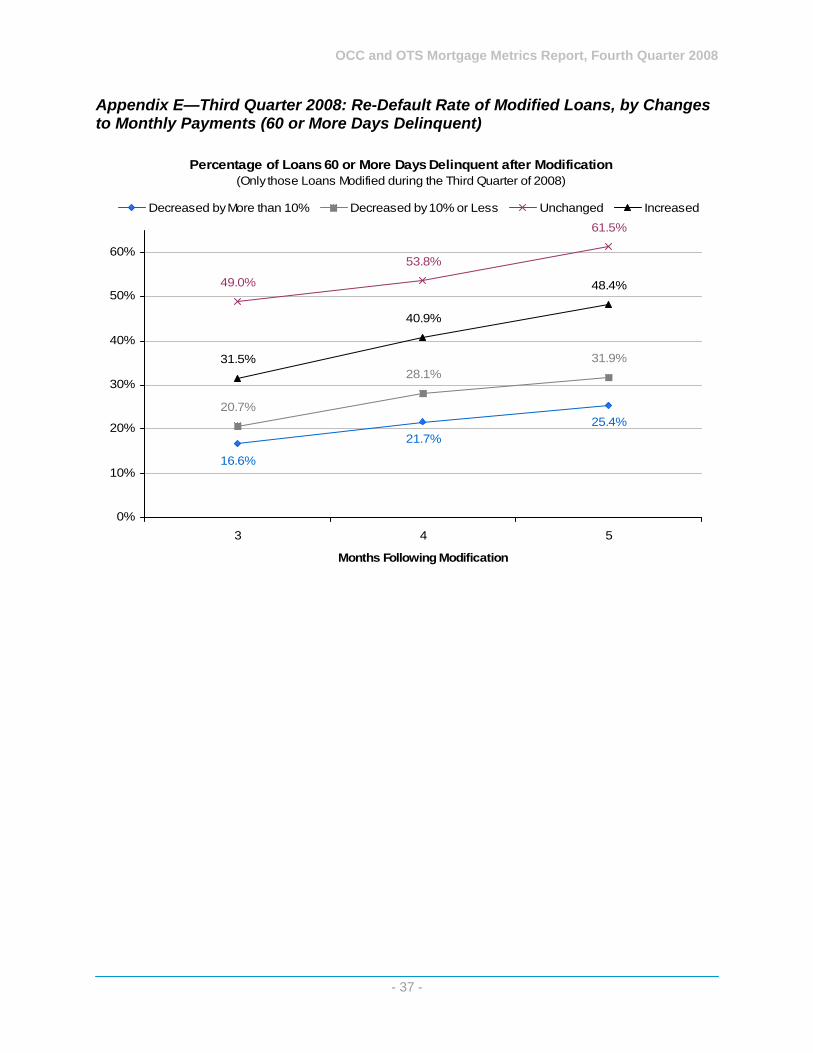
OCC and OTS Mortgage Metrics Report, Fourth Quarter 2008
Appendix E—Third Quarter 2008: Re-Default Rate of Modified Loans, by Changes to Monthly Payments (60 or More Days Delinquent)
Percentage of Loans 60 or More Days Delinquent after Modification(Only those Loans Modified during the Third Quarter of 2008)
16.6%
21.7%25.4%
20.7%
28.1%31.9%
49.0%
53.8%
61.5%
31.5%
40.9%
48.4%
0%
10%
20%
30%
40%
50%
60%
3 4 5
Months Following Modification
Decreased by More than 10% Decreased by 10% or Less Unchanged Increased
- 37 -
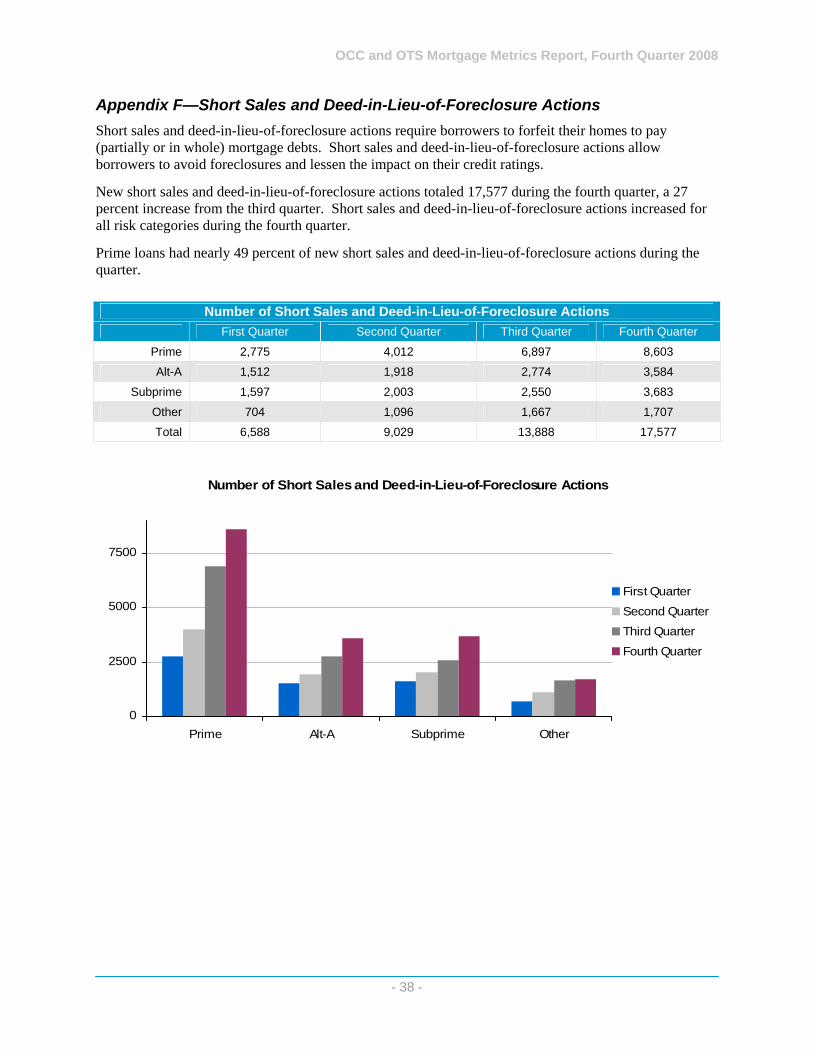
OCC and OTS Mortgage Metrics Report, Fourth Quarter 2008
Appendix F—Short Sales and Deed-in-Lieu-of-Foreclosure Actions Short sales and deed-in-lieu-of-foreclosure actions require borrowers to forfeit their homes to pay (partially or in whole) mortgage debts. Short sales and deed-in-lieu-of-foreclosure actions allow borrowers to avoid foreclosures and lessen the impact on their credit ratings.
New short sales and deed-in-lieu-of-foreclosure actions totaled 17,577 during the fourth quarter, a 27 percent increase from the third quarter. Short sales and deed-in-lieu-of-foreclosure actions increased for all risk categories during the fourth quarter.
Prime loans had nearly 49 percent of new short sales and deed-in-lieu-of-foreclosure actions during the quarter.
Number of Short Sales and Deed-in-Lieu-of-Foreclosure Actions First Quarter Second Quarter Third Quarter Fourth Quarter
Prime 2,775 4,012 6,897 8,603
Alt-A 1,512 1,918 2,774 3,584
Subprime 1,597 2,003 2,550 3,683
Other 704 1,096 1,667 1,707
Total 6,588 9,029 13,888 17,577
Number of Short Sales and Deed-in-Lieu-of-Foreclosure Actions
0
2500
5000
7500
Prime Alt-A Subprime Other
First Quarter
Second QuarterThird Quarter
Fourth Quarter
- 38 -
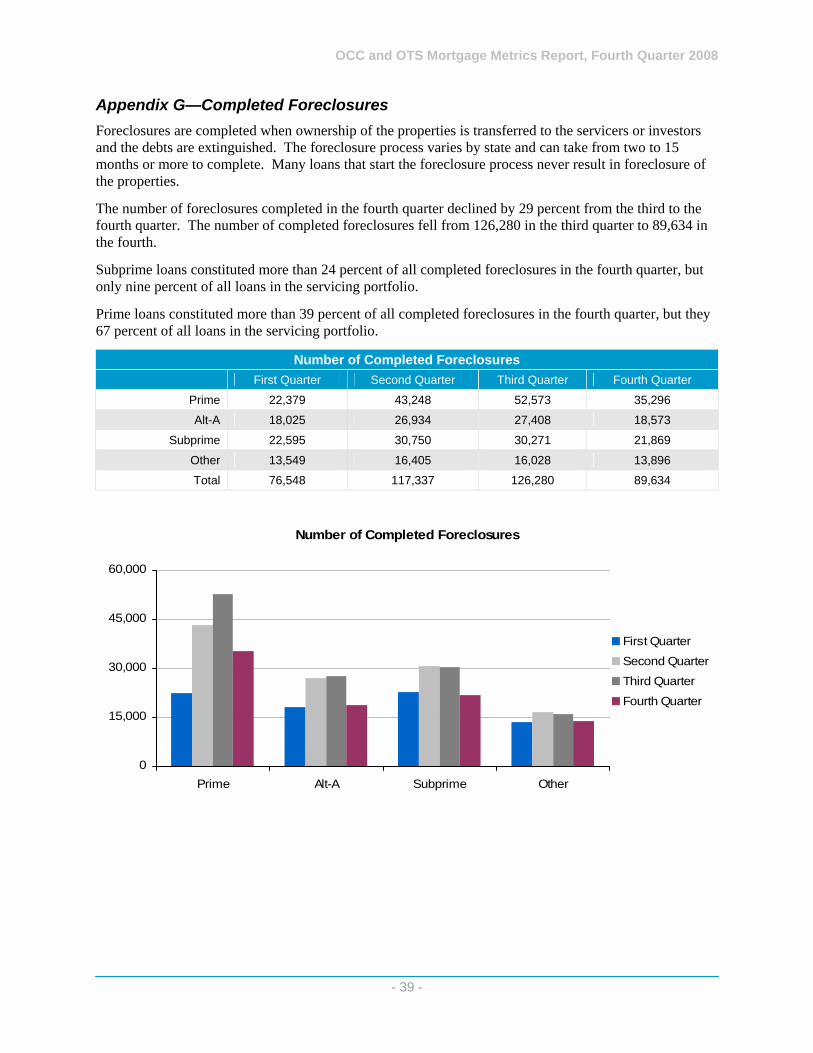
OCC and OTS Mortgage Metrics Report, Fourth Quarter 2008
Appendix G—Completed Foreclosures Foreclosures are completed when ownership of the properties is transferred to the servicers or investors and the debts are extinguished. The foreclosure process varies by state and can take from two to 15 months or more to complete. Many loans that start the foreclosure process never result in foreclosure of the properties.
The number of foreclosures completed in the fourth quarter declined by 29 percent from the third to the fourth quarter. The number of completed foreclosures fell from 126,280 in the third quarter to 89,634 in the fourth.
Subprime loans constituted more than 24 percent of all completed foreclosures in the fourth quarter, but only nine percent of all loans in the servicing portfolio.
Prime loans constituted more than 39 percent of all completed foreclosures in the fourth quarter, but they 67 percent of all loans in the servicing portfolio.
Number of Completed Foreclosures First Quarter Second Quarter Third Quarter Fourth Quarter
Prime 22,379 43,248 52,573 35,296
Alt-A 18,025 26,934 27,408 18,573
Subprime 22,595 30,750 30,271 21,869
Other 13,549 16,405 16,028 13,896
Total 76,548 117,337 126,280 89,634
Number of Completed Foreclosures
0
15,000
30,000
45,000
60,000
Prime Alt-A Subprime Other
First Quarter
Second QuarterThird Quarter
Fourth Quarter
- 39 -
OCC Mortgage Metrics Report Disclosure of National Bank Mortgage Loan Data Fourth Quarter 2016
Office of the Comptroller of the Currency Washington, D.C.
March 2017

OCC Mortgage Metrics Report, Fourth Quarter 2016
- 2 -
Contents
About Mortgage Metrics ............................................................................................... 3
Executive Summary ...................................................................................................... 4
Figure 1. Total Serviced Mortgage Portfolio—Outstanding Principal in $ Billions ....... 5
Figure 2. Total Serviced Mortgage Portfolio—Number of Loans in Thousands ........... 5
Figure 3. Composition—Loans in Thousands by Borrower Risk Category .................. 6
Figure 4. Composition—Percentage of Mortgages by Borrower Risk Category........... 6
Figure 5. Number of Loans in Delinquency and Foreclosures in Process .................... 7
Figure 6. Percentage of Loans Current and Performing and in Delinquency ............... 7
Figure 7. Newly Initiated Foreclosures—Loans in Thousands ..................................... 8
Figure 8. Completed Foreclosures and Other Home Forfeiture Actions—Loans in Thousands ................................................................................................................... 8
Table 1. Number of Mortgage Modification Actions .................................................. 9
Table 2. Number of Modification Actions in Combination Actions ........................ 10
Table 3. Changes in Monthly Principal and Interest Payments by State ............... 11
Table 4. Number of Re-Defaults for Loans Modified Six Months Previously ........ 12
Appendix A—Definitions and Method ....................................................................... 13

OCC Mortgage Metrics Report, Fourth Quarter 2016
- 3 -
About Mortgage Metrics
The Office of the Comptroller of the Currency (OCC) collects data on first-lien residential mortgage loans serviced by seven national banks with large mortgage-servicing portfolios.1 The OCC Mortgage Metrics Report is published quarterly to promote broader understanding of mortgage portfolio performance and modification activity in the federal banking system, support supervision of regulated institutions, and fulfill section 104 of the Helping Families Save Their Homes Act of 2009 (codified at 12 USC 1715z-25), as amended by section 1493(a) of the Dodd-Frank Wall Street Reform and Consumer Protection Act.
• This report presents performance data for the fourth quarter of 2016.
• The data in this report reflect a portion of first-lien residential mortgages in the country. The characteristics of the loans included here may differ from the overall population. The loans included are not a statistically representative, random sample.
• The loans include those owned by the reporting banks, as well as loans that the banks service for others as a fee-based business.
• This report covers the performance of first-lien home mortgages in the portfolios of reporting banks. It excludes junior liens, Home Equity Lines of Credit (HELOCs), and Home Equity Conversion Mortgages (reverse mortgages) because of their unique performance characteristics.
• The OCC continually reviews the format and content of this report to ensure it supports supervisory needs and provides meaningful data. As a result of this process, the following two changes were made, beginning with the report for the third quarter of 2016:
o Original FICO credit score had been used previously to describe borrower credit risk characteristics. The OCC does not endorse or require the use of any particular proprietary or vendor-provided credit scoring model for credit risk management or other reporting purposes. Therefore, servicers now submit data for Prime, Alt-A, Subprime, and Other mortgages, as displayed in figures 3 and 4 on page 6, using their internal credit scoring system.
o First lien mortgages for the purchase of homes had previously been included in the report and continue to be included. The report now also includes first-lien, closed-end home equity loans.
• The OCC also instituted changes to its data collection method beginning with the third quarter of 2016. Banks now submit aggregate data directly to the OCC rather than loan level data to a third-party aggregator. This new process resulted in some variances from previous quarters. The OCC expects reporting banks to have addressed these processing issues in the fourth quarter of 2016 and reflected any adjustments in the year end 2016 data.
1 The seven national banks are Bank of America, Citibank, HSBC, JPMorgan Chase, PNC, U.S. Bank, and Wells Fargo. Data through the fourth quarter of 2015 include CIT/OneWest.
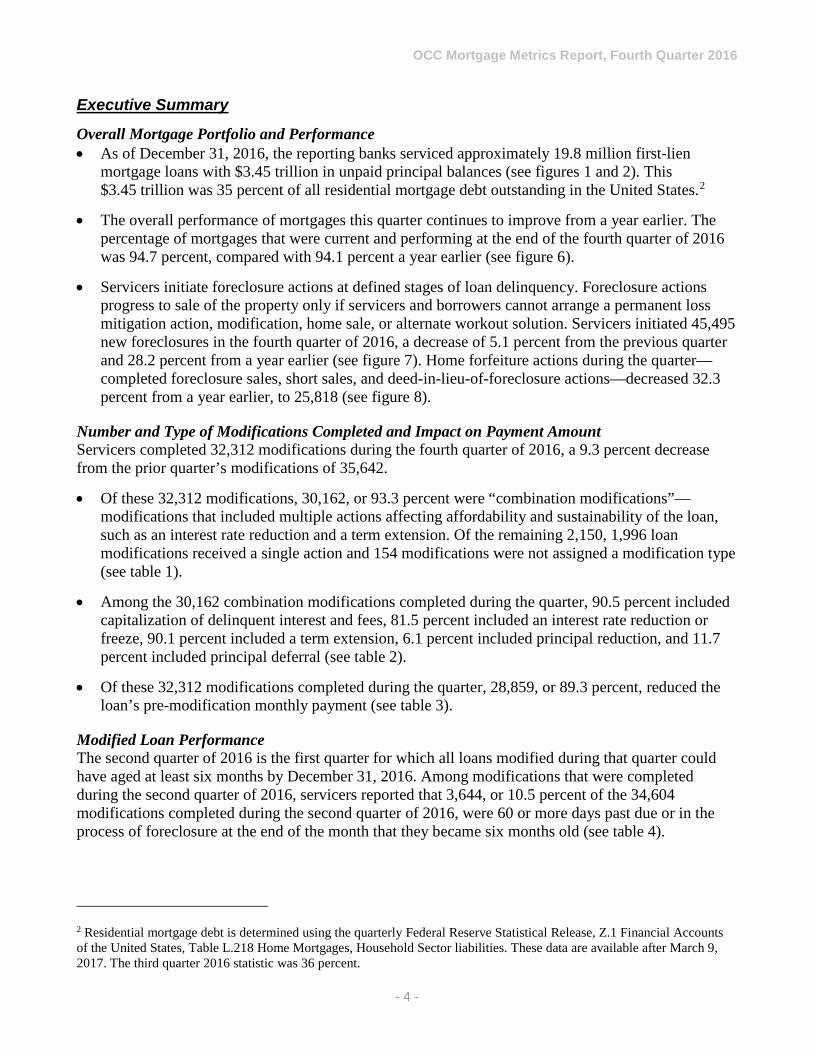
OCC Mortgage Metrics Report, Fourth Quarter 2016
- 4 -
Executive Summary
Overall Mortgage Portfolio and Performance • As of December 31, 2016, the reporting banks serviced approximately 19.8 million first-lien
mortgage loans with $3.45 trillion in unpaid principal balances (see figures 1 and 2). This $3.45 trillion was 35 percent of all residential mortgage debt outstanding in the United States.2
• The overall performance of mortgages this quarter continues to improve from a year earlier. The percentage of mortgages that were current and performing at the end of the fourth quarter of 2016 was 94.7 percent, compared with 94.1 percent a year earlier (see figure 6).
• Servicers initiate foreclosure actions at defined stages of loan delinquency. Foreclosure actions progress to sale of the property only if servicers and borrowers cannot arrange a permanent loss mitigation action, modification, home sale, or alternate workout solution. Servicers initiated 45,495 new foreclosures in the fourth quarter of 2016, a decrease of 5.1 percent from the previous quarter and 28.2 percent from a year earlier (see figure 7). Home forfeiture actions during the quarter—completed foreclosure sales, short sales, and deed-in-lieu-of-foreclosure actions—decreased 32.3 percent from a year earlier, to 25,818 (see figure 8).
Number and Type of Modifications Completed and Impact on Payment Amount Servicers completed 32,312 modifications during the fourth quarter of 2016, a 9.3 percent decrease from the prior quarter’s modifications of 35,642.
• Of these 32,312 modifications, 30,162, or 93.3 percent were “combination modifications”—modifications that included multiple actions affecting affordability and sustainability of the loan, such as an interest rate reduction and a term extension. Of the remaining 2,150, 1,996 loan modifications received a single action and 154 modifications were not assigned a modification type (see table 1).
• Among the 30,162 combination modifications completed during the quarter, 90.5 percent included capitalization of delinquent interest and fees, 81.5 percent included an interest rate reduction or freeze, 90.1 percent included a term extension, 6.1 percent included principal reduction, and 11.7 percent included principal deferral (see table 2).
• Of these 32,312 modifications completed during the quarter, 28,859, or 89.3 percent, reduced the loan’s pre-modification monthly payment (see table 3).
Modified Loan Performance The second quarter of 2016 is the first quarter for which all loans modified during that quarter could have aged at least six months by December 31, 2016. Among modifications that were completed during the second quarter of 2016, servicers reported that 3,644, or 10.5 percent of the 34,604 modifications completed during the second quarter of 2016, were 60 or more days past due or in the process of foreclosure at the end of the month that they became six months old (see table 4).
2 Residential mortgage debt is determined using the quarterly Federal Reserve Statistical Release, Z.1 Financial Accounts of the United States, Table L.218 Home Mortgages, Household Sector liabilities. These data are available after March 9, 2017. The third quarter 2016 statistic was 36 percent.

OCC Mortgage Metrics Report, Fourth Quarter 2016
- 5 -
Figure 1. Total Serviced Mortgage Portfolio—Outstanding Principal in $ Billions Figure 1 reports the outstanding principal balance of reported loans and shows the declining amount of unpaid balance from the fourth quarter of 2014 through the fourth quarter of 2016.
Figure 2. Total Serviced Mortgage Portfolio—Number of Loans in Thousands Figure 2 reports the number of first-lien residential mortgages serviced by the seven reporting banks and illustrates the decline in their servicing portfolios from the fourth quarter of 2014 through the fourth quarter of 2016.
$3,906 $3,821
$3,760 $3,727 $3,678
$3,628 $3,573
$3,495 $3,453
$3,000
$3,200
$3,400
$3,600
$3,800
$4,000
$4,200
4Q14 1Q15 2Q15 3Q15 4Q15 1Q16 2Q16 3Q16 4Q16
23,122 22,666
22,116 21,850 21,473
21,124 20,705 20,392
19,838
15,000
17,500
20,000
22,500
25,000
4Q14 1Q15 2Q15 3Q15 4Q15 1Q16 2Q16 3Q16 4Q16
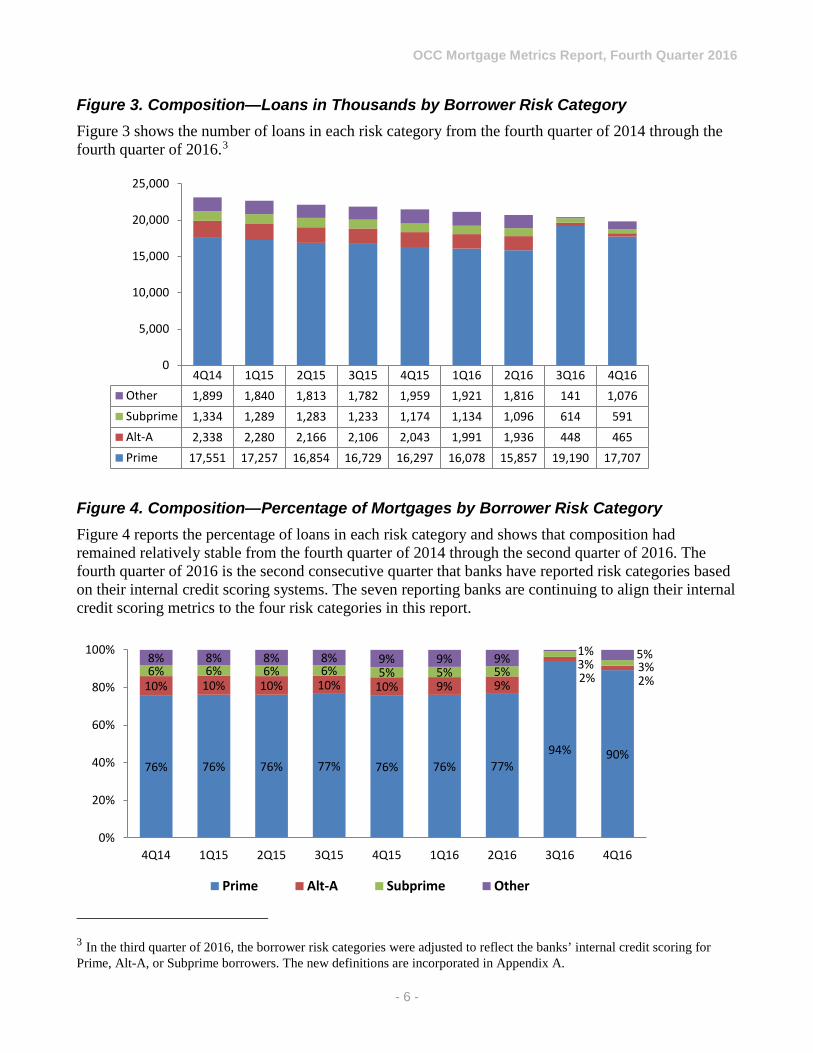
OCC Mortgage Metrics Report, Fourth Quarter 2016
- 6 -
Figure 3. Composition—Loans in Thousands by Borrower Risk Category Figure 3 shows the number of loans in each risk category from the fourth quarter of 2014 through the fourth quarter of 2016.3
Figure 4. Composition—Percentage of Mortgages by Borrower Risk Category Figure 4 reports the percentage of loans in each risk category and shows that composition had remained relatively stable from the fourth quarter of 2014 through the second quarter of 2016. The fourth quarter of 2016 is the second consecutive quarter that banks have reported risk categories based on their internal credit scoring systems. The seven reporting banks are continuing to align their internal credit scoring metrics to the four risk categories in this report.
3 In the third quarter of 2016, the borrower risk categories were adjusted to reflect the banks’ internal credit scoring for Prime, Alt-A, or Subprime borrowers. The new definitions are incorporated in Appendix A.
4Q14 1Q15 2Q15 3Q15 4Q15 1Q16 2Q16 3Q16 4Q16Other 1,899 1,840 1,813 1,782 1,959 1,921 1,816 141 1,076Subprime 1,334 1,289 1,283 1,233 1,174 1,134 1,096 614 591Alt-A 2,338 2,280 2,166 2,106 2,043 1,991 1,936 448 465Prime 17,551 17,257 16,854 16,729 16,297 16,078 15,857 19,190 17,707
0
5,000
10,000
15,000
20,000
25,000
76% 76% 76% 77% 76% 76% 77%94% 90%
10% 10% 10% 10% 10% 9% 9% 2% 2%6% 6% 6% 6% 5% 5% 5% 3% 3%8% 8% 8% 8% 9% 9% 9% 1% 5%
0%
20%
40%
60%
80%
100%
4Q14 1Q15 2Q15 3Q15 4Q15 1Q16 2Q16 3Q16 4Q16
Prime Alt-A Subprime Other
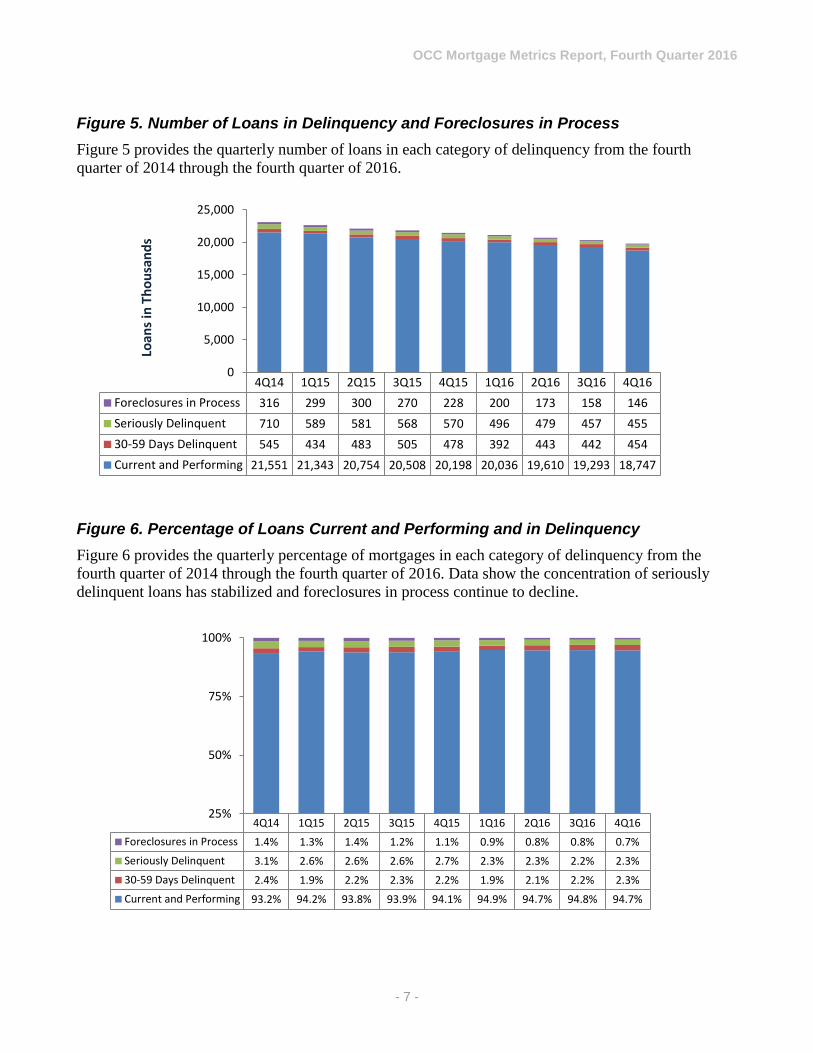
OCC Mortgage Metrics Report, Fourth Quarter 2016
- 7 -
Figure 5. Number of Loans in Delinquency and Foreclosures in Process Figure 5 provides the quarterly number of loans in each category of delinquency from the fourth quarter of 2014 through the fourth quarter of 2016.
Figure 6. Percentage of Loans Current and Performing and in Delinquency Figure 6 provides the quarterly percentage of mortgages in each category of delinquency from the fourth quarter of 2014 through the fourth quarter of 2016. Data show the concentration of seriously delinquent loans has stabilized and foreclosures in process continue to decline.
4Q14 1Q15 2Q15 3Q15 4Q15 1Q16 2Q16 3Q16 4Q16Foreclosures in Process 316 299 300 270 228 200 173 158 146Seriously Delinquent 710 589 581 568 570 496 479 457 45530-59 Days Delinquent 545 434 483 505 478 392 443 442 454Current and Performing 21,551 21,343 20,754 20,508 20,198 20,036 19,610 19,293 18,747
0
5,000
10,000
15,000
20,000
25,000
Loan
s in
Thou
sand
s
4Q14 1Q15 2Q15 3Q15 4Q15 1Q16 2Q16 3Q16 4Q16Foreclosures in Process 1.4% 1.3% 1.4% 1.2% 1.1% 0.9% 0.8% 0.8% 0.7%Seriously Delinquent 3.1% 2.6% 2.6% 2.6% 2.7% 2.3% 2.3% 2.2% 2.3%30-59 Days Delinquent 2.4% 1.9% 2.2% 2.3% 2.2% 1.9% 2.1% 2.2% 2.3%Current and Performing 93.2% 94.2% 93.8% 93.9% 94.1% 94.9% 94.7% 94.8% 94.7%
25%
50%
75%
100%

OCC Mortgage Metrics Report, Fourth Quarter 2016
- 8 -
Figure 7. Newly Initiated Foreclosures—Loans in Thousands Figure 7 reports the number of new foreclosure actions initiated quarterly from the fourth quarter of 2014 through the fourth quarter of 2016. Data show a steady decline in newly initiated foreclosures since first quarter 2015.
Figure 8. Completed Foreclosures and Other Home Forfeiture Actions—Loans in Thousands Figure 8 shows the number of foreclosure and other home forfeiture actions completed quarterly from the fourth quarter of 2014 through the fourth quarter of 2016. Data show a declining trend in completed foreclosures and other home forfeiture actions.
4Q14 1Q15 2Q15 3Q15 4Q15 1Q16 2Q16 3Q16 4Q16Newly Initiated Foreclosures 75.4 83.1 70.7 64.2 63.4 58.9 48.7 48.0 45.5
0
20
40
60
80
100Lo
ans i
n Th
ousa
nds
4Q14 1Q15 2Q15 3Q15 4Q15 1Q16 2Q16 3Q16 4Q16New Deed-in-Lieu-of-Foreclosure 1.2 1.3 1.3 1.2 1.1 1.4 1.2 1.0 0.8New Short Sales 9.2 7.6 8.4 8.0 7.7 6.9 6.8 6.3 4.9Completed Foreclosures 39.3 38.5 37.3 33.1 29.3 30.2 25.3 25.1 20.1
0
20
40
60
Loan
s in
Thou
sand
s
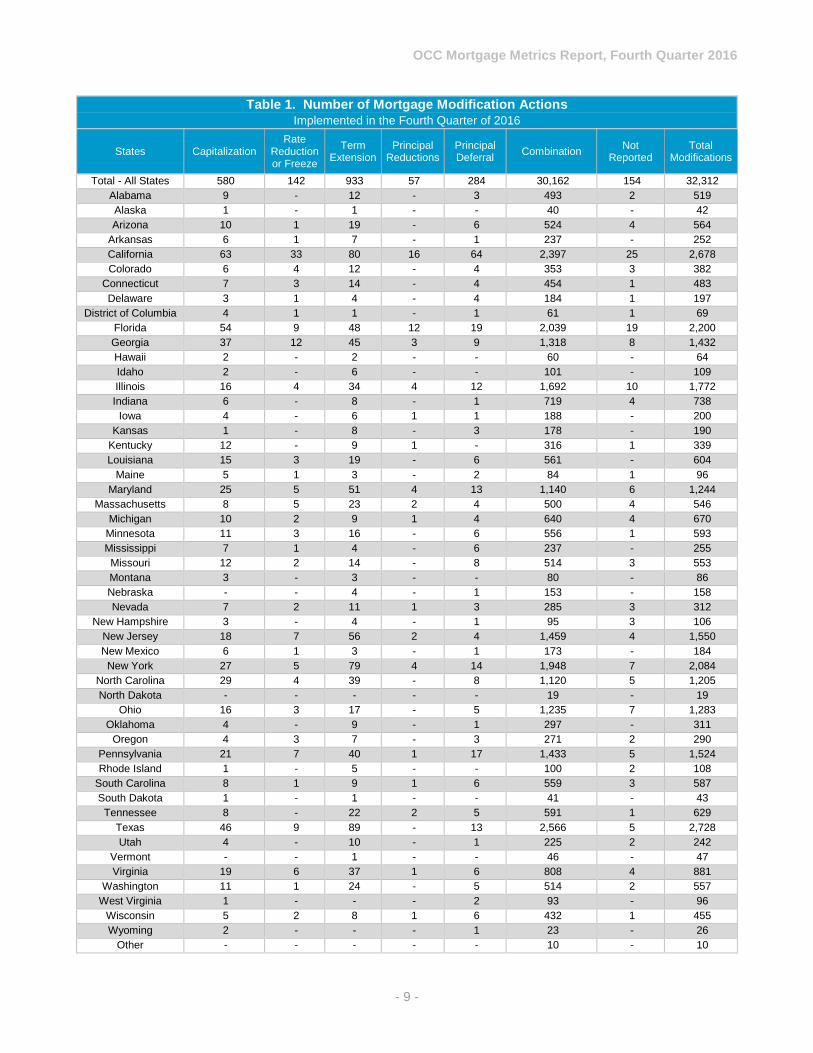
OCC Mortgage Metrics Report, Fourth Quarter 2016
- 9 -
Table 1. Number of Mortgage Modification Actions Implemented in the Fourth Quarter of 2016
States Capitalization Rate
Reduction or Freeze
Term Extension
Principal Reductions
Principal Deferral Combination Not
Reported Total
Modifications
Total - All States 580 142 933 57 284 30,162 154 32,312 Alabama 9 - 12 - 3 493 2 519 Alaska 1 - 1 - - 40 - 42 Arizona 10 1 19 - 6 524 4 564
Arkansas 6 1 7 - 1 237 - 252 California 63 33 80 16 64 2,397 25 2,678 Colorado 6 4 12 - 4 353 3 382
Connecticut 7 3 14 - 4 454 1 483 Delaware 3 1 4 - 4 184 1 197
District of Columbia 4 1 1 - 1 61 1 69 Florida 54 9 48 12 19 2,039 19 2,200 Georgia 37 12 45 3 9 1,318 8 1,432 Hawaii 2 - 2 - - 60 - 64 Idaho 2 - 6 - - 101 - 109 Illinois 16 4 34 4 12 1,692 10 1,772 Indiana 6 - 8 - 1 719 4 738
Iowa 4 - 6 1 1 188 - 200 Kansas 1 - 8 - 3 178 - 190
Kentucky 12 - 9 1 - 316 1 339 Louisiana 15 3 19 - 6 561 - 604
Maine 5 1 3 - 2 84 1 96 Maryland 25 5 51 4 13 1,140 6 1,244
Massachusetts 8 5 23 2 4 500 4 546 Michigan 10 2 9 1 4 640 4 670
Minnesota 11 3 16 - 6 556 1 593 Mississippi 7 1 4 - 6 237 - 255 Missouri 12 2 14 - 8 514 3 553 Montana 3 - 3 - - 80 - 86 Nebraska - - 4 - 1 153 - 158 Nevada 7 2 11 1 3 285 3 312
New Hampshire 3 - 4 - 1 95 3 106 New Jersey 18 7 56 2 4 1,459 4 1,550 New Mexico 6 1 3 - 1 173 - 184 New York 27 5 79 4 14 1,948 7 2,084
North Carolina 29 4 39 - 8 1,120 5 1,205 North Dakota - - - - - 19 - 19
Ohio 16 3 17 - 5 1,235 7 1,283 Oklahoma 4 - 9 - 1 297 - 311
Oregon 4 3 7 - 3 271 2 290 Pennsylvania 21 7 40 1 17 1,433 5 1,524 Rhode Island 1 - 5 - - 100 2 108
South Carolina 8 1 9 1 6 559 3 587 South Dakota 1 - 1 - - 41 - 43 Tennessee 8 - 22 2 5 591 1 629
Texas 46 9 89 - 13 2,566 5 2,728 Utah 4 - 10 - 1 225 2 242
Vermont - - 1 - - 46 - 47 Virginia 19 6 37 1 6 808 4 881
Washington 11 1 24 - 5 514 2 557 West Virginia 1 - - - 2 93 - 96
Wisconsin 5 2 8 1 6 432 1 455 Wyoming 2 - - - 1 23 - 26
Other - - - - - 10 - 10

OCC Mortgage Metrics Report, Fourth Quarter 2016
- 10 -
Table 2. Number of Modification Actions in Combination Actions Implemented in the Fourth Quarter of 2016
States Capitalization Rate
Reduction or Freeze
Term Extension
Principal Reduction Principal Deferral
Total Combination Modifications
Total - All States 27,285 24,571 27,163 1,826 3,538 30,162 Alabama 452 396 460 27 26 493 Alaska 27 39 35 1 2 40 Arizona 477 418 478 17 46 524
Arkansas 220 202 206 4 14 237 California 2,158 1,900 1,943 247 397 2,397 Colorado 313 262 323 5 22 353
Connecticut 408 366 410 48 71 454 Delaware 170 152 168 9 16 184
District of Columbia 57 50 53 6 8 61 Florida 1,901 1,676 1,728 248 406 2,039 Georgia 1,180 1,090 1,204 65 116 1,318 Hawaii 56 43 45 4 10 60 Idaho 94 79 92 2 8 101 Illinois 1,539 1,430 1,545 145 370 1,692 Indiana 677 608 680 22 52 719
Iowa 174 146 178 3 15 188 Kansas 166 142 168 - 4 178
Kentucky 291 250 292 7 24 316 Louisiana 517 466 494 20 37 561
Maine 76 64 71 5 13 84 Maryland 1,009 932 1,015 84 141 1,140
Massachusetts 444 398 456 28 60 500 Michigan 583 524 572 42 53 640
Minnesota 514 443 518 11 52 556 Mississippi 217 205 212 12 15 237 Missouri 482 434 479 34 37 514 Montana 70 45 73 2 3 80 Nebraska 142 124 146 1 6 153 Nevada 250 228 245 28 41 285
New Hampshire 87 65 86 3 9 95 New Jersey 1,299 1,166 1,348 161 298 1,459 New Mexico 153 149 161 6 9 173 New York 1,747 1,598 1,752 177 325 1,948
North Carolina 1,006 877 1,027 25 68 1,120 North Dakota 16 14 19 - - 19
Ohio 1,138 1,058 1,134 40 122 1,235 Oklahoma 272 248 271 8 20 297
Oregon 252 207 235 13 26 271 Pennsylvania 1,289 1,144 1,311 83 175 1,433 Rhode Island 89 79 94 9 17 100
South Carolina 522 449 498 24 43 559 South Dakota 35 32 40 - 1 41 Tennessee 539 504 525 22 52 591
Texas 2,218 2,184 2,423 41 107 2,566 Utah 200 162 213 4 4 225
Vermont 42 35 40 1 2 46 Virginia 724 639 723 37 79 808
Washington 478 403 469 14 45 514 West Virginia 88 73 82 2 3 93
Wisconsin 397 351 392 29 65 432 Wyoming 21 14 22 - 3 23
Other 9 8 9 - - 10

OCC Mortgage Metrics Report, Fourth Quarter 2016
- 11 -
Table 3. Changes in Monthly Principal and Interest Payments by State Modifications Implemented in the Fourth Quarter of 2016
States Decreased by 20% or
More
Decreased by 10% to Less Than 20%
Decreased by Less Than
10% Unchanged Increased Not
Reported Total
Modifications
Total - All States 16,288 7,048 5,523 309 2,990 154 32,312 Alabama 271 108 88 5 44 3 519 Alaska 18 11 10 - 3 - 42 Arizona 289 127 110 5 30 3 564
Arkansas 105 55 56 2 34 - 252 California 1,449 625 373 45 175 11 2,678 Colorado 185 108 63 4 22 - 382
Connecticut 278 87 74 3 40 1 483 Delaware 84 45 30 3 32 3 197
District of Columbia 27 22 12 2 5 1 69 Florida 1,126 460 326 29 251 8 2,200 Georgia 685 315 282 8 139 2 1,432 Hawaii 30 10 15 - 9 - 64 Idaho 50 36 11 1 11 - 109 Illinois 1,036 315 252 11 151 7 1,772 Indiana 345 162 167 5 58 1 738
Iowa 80 48 46 1 25 - 200 Kansas 94 40 31 3 22 - 190
Kentucky 152 79 66 3 36 3 339 Louisiana 287 135 112 7 63 - 604
Maine 32 17 26 2 18 1 96 Maryland 566 276 256 14 129 3 1,244
Massachusetts 253 133 87 3 67 3 546 Michigan 377 137 102 7 44 3 670
Minnesota 297 135 104 8 49 - 593 Mississippi 126 53 46 4 26 - 255 Missouri 291 97 110 11 43 2 553 Montana 42 18 14 1 11 - 86 Nebraska 75 42 26 - 15 - 158 Nevada 166 65 48 3 27 3 312
New Hampshire 45 27 24 1 8 1 106 New Jersey 820 312 240 5 160 13 1,550 New Mexico 84 46 39 1 13 1 184 New York 1,016 467 334 21 241 5 2,084
North Carolina 578 288 222 10 94 13 1,205 North Dakota 9 5 5 - - - 19
Ohio 678 225 225 4 136 15 1,283 Oklahoma 145 64 57 2 43 - 311
Oregon 139 65 50 4 32 - 290 Pennsylvania 778 338 236 16 120 36 1,524 Rhode Island 53 21 20 - 13 1 108
South Carolina 266 140 98 7 75 1 587 South Dakota 15 13 9 1 5 - 43 Tennessee 294 152 125 7 51 - 629
Texas 1,407 587 488 18 225 3 2,728 Utah 119 61 41 1 19 1 242
Vermont 16 15 10 - 6 - 47 Virginia 445 215 150 7 62 2 881
Washington 254 133 107 4 58 1 557 West Virginia 43 20 24 2 6 1 96
Wisconsin 251 84 72 7 39 2 455 Wyoming 8 8 4 1 5 - 26
Other 9 1 - - - - 10

OCC Mortgage Metrics Report, Fourth Quarter 2016
- 12 -
Table 4. Number of Re-Defaults for Loans Modified Six Months Previously Modified Loans 60 or More Days Delinquent After Six Months by Changes in Principal and Interest Payments
States Decreased by 20% or
More
Decreased by 10% to Less Than
20%
Decreased by Less Than 10% Unchanged Increased Not
Reported Total
Re-Defaults
Total - All States 1,236 817 821 32 719 19 3,644 Alabama 23 11 10 - 14 - 58 Alaska - 1 2 1 1 - 5 Arizona 29 11 13 - 11 - 64
Arkansas 8 8 8 - 7 - 31 California 63 56 54 2 28 - 203 Colorado 19 11 7 1 7 - 45
Connecticut 20 18 12 - 19 - 69 Delaware 9 4 14 - 9 1 37
District of Columbia 2 3 2 1 1 - 9 Florida 74 57 41 1 52 2 227 Georgia 51 29 38 - 35 1 154 Hawaii 1 4 1 - 1 - 7 Idaho 1 4 1 - 1 - 7 Illinois 86 39 35 1 26 1 188 Indiana 26 21 21 1 26 - 95
Iowa 9 10 11 - 10 - 40 Kansas 10 8 6 - 8 - 32
Kentucky 10 7 6 - 5 - 28 Louisiana 21 19 10 - 18 - 68
Maine 2 3 3 - 4 - 12 Maryland 53 19 33 2 33 - 140
Massachusetts 18 11 12 1 13 1 56 Michigan 25 19 21 - 14 1 80
Minnesota 24 16 17 1 13 - 71 Mississippi 11 6 7 - 8 - 32 Missouri 36 16 16 2 17 - 87 Montana 3 2 - - 4 - 9 Nebraska 10 4 1 1 8 - 24 Nevada 13 8 5 - 4 - 30
New Hampshire 3 1 1 1 3 - 9 New Jersey 47 39 35 - 31 1 153 New Mexico 8 9 6 - 3 - 26 New York 62 35 35 3 45 2 182
North Carolina 62 42 45 1 27 1 178 North Dakota 1 1 - - - - 2
Ohio 65 39 49 1 37 1 192 Oklahoma 26 9 8 - 8 - 51
Oregon 6 8 3 - 6 - 23 Pennsylvania 71 50 46 3 25 5 200 Rhode Island 10 4 1 - 1 - 16
South Carolina 23 19 17 1 16 - 76 South Dakota 2 - 1 - 2 - 5 Tennessee 28 15 19 1 20 1 84
Texas 100 59 74 4 49 1 287 Utah 4 6 6 - 12 - 28
Vermont 1 2 - - - - 3 Virginia 27 34 34 1 17 - 113
Washington 12 10 10 - 10 - 42 West Virginia 5 3 4 - 2 - 14
Wisconsin 16 5 18 1 7 - 47 Wyoming - 2 2 - - - 4
Other - - - - 1 - 1
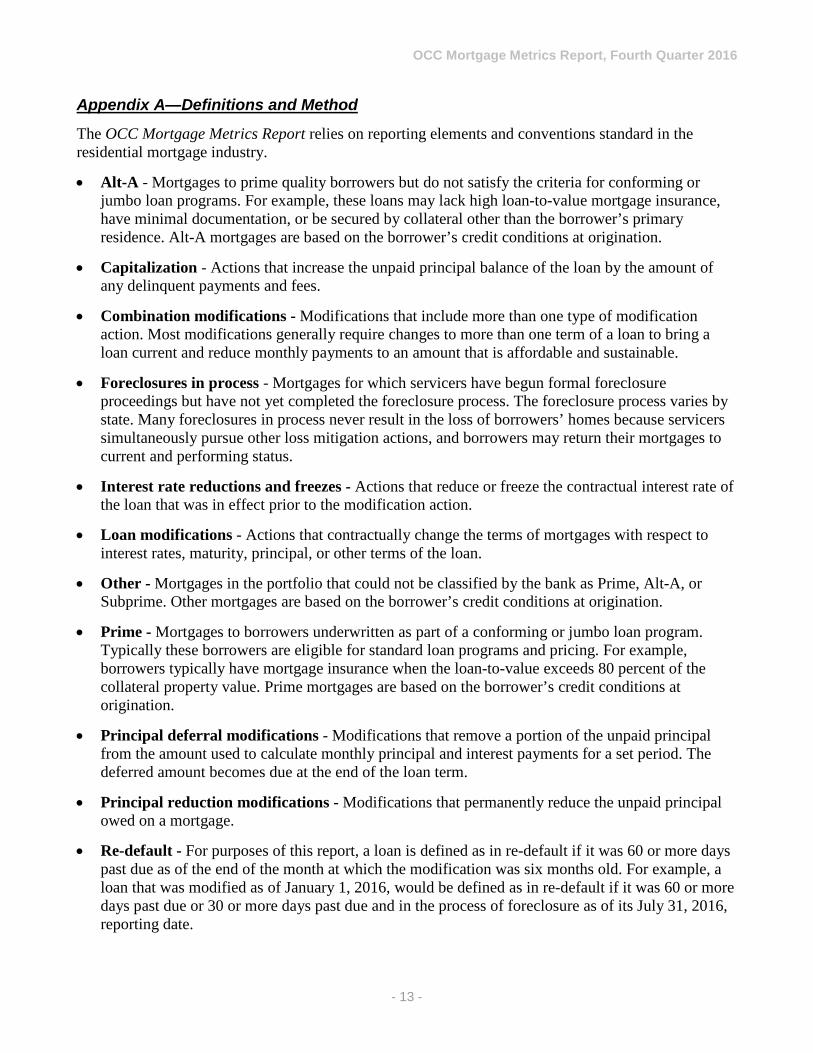
OCC Mortgage Metrics Report, Fourth Quarter 2016
- 13 -
Appendix A—Definitions and Method
The OCC Mortgage Metrics Report relies on reporting elements and conventions standard in the residential mortgage industry.
• Alt-A - Mortgages to prime quality borrowers but do not satisfy the criteria for conforming or jumbo loan programs. For example, these loans may lack high loan-to-value mortgage insurance, have minimal documentation, or be secured by collateral other than the borrower’s primary residence. Alt-A mortgages are based on the borrower’s credit conditions at origination.
• Capitalization - Actions that increase the unpaid principal balance of the loan by the amount of any delinquent payments and fees.
• Combination modifications - Modifications that include more than one type of modification action. Most modifications generally require changes to more than one term of a loan to bring a loan current and reduce monthly payments to an amount that is affordable and sustainable.
• Foreclosures in process - Mortgages for which servicers have begun formal foreclosure proceedings but have not yet completed the foreclosure process. The foreclosure process varies by state. Many foreclosures in process never result in the loss of borrowers’ homes because servicers simultaneously pursue other loss mitigation actions, and borrowers may return their mortgages to current and performing status.
• Interest rate reductions and freezes - Actions that reduce or freeze the contractual interest rate of the loan that was in effect prior to the modification action.
• Loan modifications - Actions that contractually change the terms of mortgages with respect to interest rates, maturity, principal, or other terms of the loan.
• Other - Mortgages in the portfolio that could not be classified by the bank as Prime, Alt-A, or Subprime. Other mortgages are based on the borrower’s credit conditions at origination.
• Prime - Mortgages to borrowers underwritten as part of a conforming or jumbo loan program. Typically these borrowers are eligible for standard loan programs and pricing. For example, borrowers typically have mortgage insurance when the loan-to-value exceeds 80 percent of the collateral property value. Prime mortgages are based on the borrower’s credit conditions at origination.
• Principal deferral modifications - Modifications that remove a portion of the unpaid principal from the amount used to calculate monthly principal and interest payments for a set period. The deferred amount becomes due at the end of the loan term.
• Principal reduction modifications - Modifications that permanently reduce the unpaid principal owed on a mortgage.
• Re-default - For purposes of this report, a loan is defined as in re-default if it was 60 or more days past due as of the end of the month at which the modification was six months old. For example, a loan that was modified as of January 1, 2016, would be defined as in re-default if it was 60 or more days past due or 30 or more days past due and in the process of foreclosure as of its July 31, 2016, reporting date.

OCC Mortgage Metrics Report, Fourth Quarter 2016
- 14 -
• Seriously delinquent loans - Mortgages that are 60 or more days past due, and all mortgages held by bankrupt borrowers whose payments are 30 or more days past due.
• Subprime - Mortgages to borrowers that display a range of credit risk characteristics that may include a weakened credit history, reduced repayment capacity, or incomplete credit history. A weakened credit history may include prior delinquencies, judgments, bankruptcies, or foreclosures on the credit report at the time of underwriting. Subprime mortgages are based on the borrower’s credit conditions at origination.
• Term extensions - Actions that delay the final maturity date of the loan that was in effect prior to the modification action.
Loan delinquencies are reported using the Mortgage Bankers Association convention that a loan is past due when a scheduled payment has not been made by the due date of the following scheduled payment. The statistics are based on the number of loans, unless stated otherwise.
Percentages are rounded to one decimal place unless the result is less than 0.1 percent, which is rounded to two decimal places. The report uses whole numbers when approximating. Values in tables may not total 100 percent because of rounding.
Results are not seasonally adjusted.
Mortgage Lending RulesSensible Reforms for Banks and Consumers
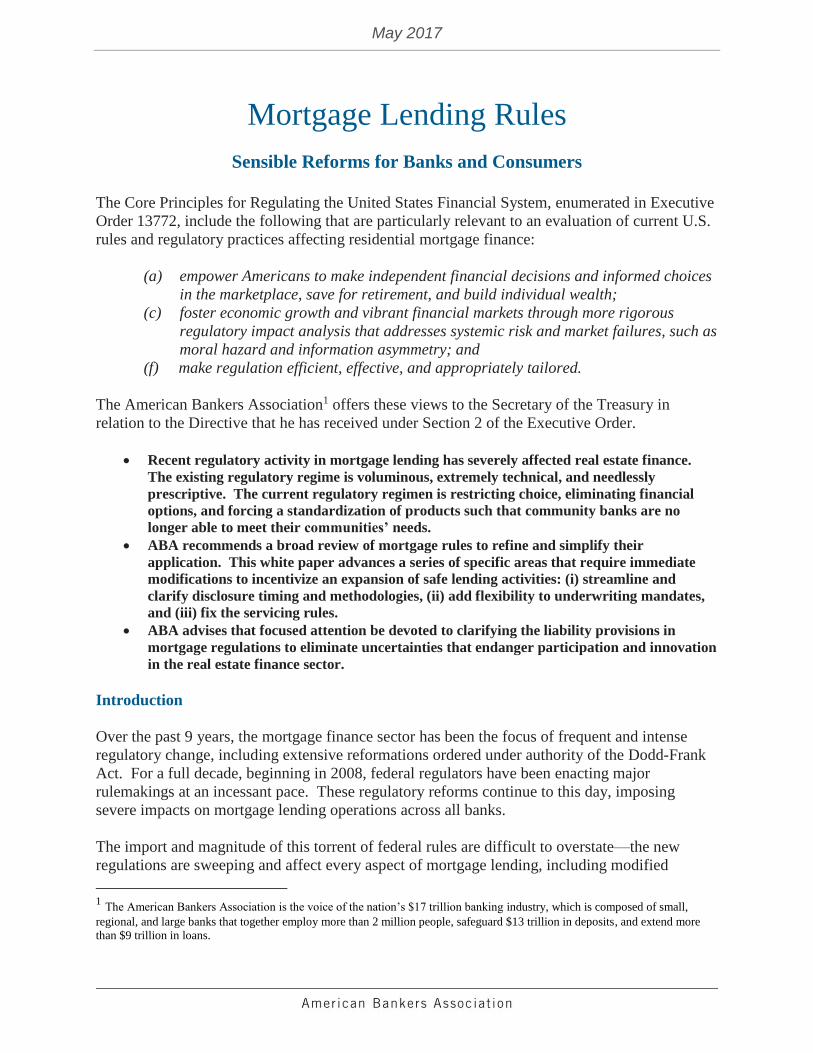
May 2017
Mortgage Lending Rules
Sensible Reforms for Banks and Consumers
The Core Principles for Regulating the United States Financial System, enumerated in Executive
Order 13772, include the following that are particularly relevant to an evaluation of current U.S.
rules and regulatory practices affecting residential mortgage finance:
(a) empower Americans to make independent financial decisions and informed choices
in the marketplace, save for retirement, and build individual wealth;
(c) foster economic growth and vibrant financial markets through more rigorous
regulatory impact analysis that addresses systemic risk and market failures, such as
moral hazard and information asymmetry; and
(f) make regulation efficient, effective, and appropriately tailored.
The American Bankers Association1 offers these views to the Secretary of the Treasury in
relation to the Directive that he has received under Section 2 of the Executive Order.
Recent regulatory activity in mortgage lending has severely affected real estate finance.
The existing regulatory regime is voluminous, extremely technical, and needlessly
prescriptive. The current regulatory regimen is restricting choice, eliminating financial
options, and forcing a standardization of products such that community banks are no
longer able to meet their communities’ needs.
ABA recommends a broad review of mortgage rules to refine and simplify their
application. This white paper advances a series of specific areas that require immediate
modifications to incentivize an expansion of safe lending activities: (i) streamline and
clarify disclosure timing and methodologies, (ii) add flexibility to underwriting mandates,
and (iii) fix the servicing rules.
ABA advises that focused attention be devoted to clarifying the liability provisions in
mortgage regulations to eliminate uncertainties that endanger participation and innovation
in the real estate finance sector.
Introduction
Over the past 9 years, the mortgage finance sector has been the focus of frequent and intense
regulatory change, including extensive reformations ordered under authority of the Dodd-Frank
Act. For a full decade, beginning in 2008, federal regulators have been enacting major
rulemakings at an incessant pace. These regulatory reforms continue to this day, imposing
severe impacts on mortgage lending operations across all banks.
The import and magnitude of this torrent of federal rules are difficult to overstate—the new
regulations are sweeping and affect every aspect of mortgage lending, including modified
1 The American Bankers Association is the voice of the nation’s $17 trillion banking industry, which is composed of small,
regional, and large banks that together employ more than 2 million people, safeguard $13 trillion in deposits, and extend more
than $9 trillion in loans.
May 2017
2
disclosure forms and timetables, required underwriting methodologies, loan term prohibitions,
limitations on fees and pricing, requirements regarding third party relationships, allowable
compensation to employees, staff registration and training requirements, appraisal and valuation
obligations, counseling disclosures for borrowers, servicing procedures, servicing-related
prohibitions, escrow account requirements, data reporting requirements, record retention
responsibilities, fair lending, and other areas. These continuous rule expansions have made
mortgages the riskiest and most labor-intensive products that banks can offer.
The stifling burdens brought by these regulatory changes have made it difficult for institutions to
stay profitable or even continue operations in their markets. In a qualitative sense, the mortgage
reform rules are very prescriptive and detailed, placing significant impediments to banks’
abilities to properly serve their communities or tailor products that meet local needs. These rules
are often defective in that they contain errors and fail to clearly define implementation
requirements and liabilities. In a quantitative sense, the new rules are extremely lengthy and
complex, spanning thousands of pages of regulatory and interpretive material, and carrying
substantial administrative and legal liabilities. Further, substantial amounts of unofficial agency
guidance is added subsequent to final rule issuances and the validity of these materials is often
uncertain. In this sense, a most significant impact to ABA-member banks engaged in real estate
lending activities is the burden and confusion brought about by the sheer volume of reforms that
have occurred in a short span of time. The intense regulatory activity is destabilizing business
models and legal/risk calculations across all markets.
The damaging impact of ongoing regulatory reforms is evidenced by ABA survey data reflecting
a continuing decrease in product choice and elimination of financial options across the board.
There is an undeniable increase in costs that are directly attributable to this regulatory torrent.
97% of banks responding to our surveys report that their institutions have experienced higher
mortgage specific costs as a result of recent regulatory reforms.
84% of responding banks report that they are being forced to hire additional staff as a direct result
of new regulations.
93% report that legal/regulatory consulting costs are swelling because of new regulations.
Reliable market studies by Mortgage Bankers Association suggest that over the past decade, the
cost of originating a mortgage has increased by 72% over the past decade, from approximately
$4,376 in the third quarter of 2009 to approximately $7,562 by the fourth quarter of 2016.
Our banks do not formally report to ABA when they exit market segments, but we can confirm
that a significant number of community banks have ceased mortgage operations entirely in
response to the heavy regulatory burdens and increase in legal risks. Many more have
discontinued specific mortgage products as a result of increased regulatory burden, leaving
consumers with fewer options in the marketplace.
As it affects mortgage servicing, the recent CFPB servicing rules as well as new Basel III capital
requirements have driven up the cost of mortgage servicing for all banks. The annual cost of
servicing a performing loan more than doubled from $59 in 2008 to $175 in 2015, whereas the
annual cost of servicing a nonperforming loan more than quadrupled from $482 to $2,375 in the
same time period. As the cost to service mortgage loans has increased, mortgage servicing has
been increasingly acquired by non-bank mortgage companies, including REITs, hedge funds, and

May 2017
3
private equity firms that are able to leverage significant economies of scale because they are not
subject to Basel III’s unfavorable capital treatment of mortgage servicing assets.
Recommendations
As a threshold position, ABA is fully supportive of well-regulated markets where well-crafted
rules are effective in protecting consumers against abuse. Banks support clear disclosures and
processes to assure that consumers receive clear and comprehensive information that enables
them to understand the transaction and make the best decision for their families. ABA does not,
therefore, advocate for a wholesale deconstruction of existing consumer protection regulations;
rather, ABA believes that full-scale reviews of, and careful fixes to, existing regulations must be
undertaken to assure that the laws are necessary, protective, effective, balanced, and certain in
their application.
ABA has collected a long and detailed list of the various elements that must be fixed and
corrected to remove legal uncertainty, duplication, and unnecessary impediments to mortgage
financing. This paper focuses on a select number of targeted and critical regulatory provisions
that can be readily fixed to relieve regulatory burdens and boost their legal certainty and ability
to lend.
The recommendations below fall into four general areas—
Reforms to Disclosure Requirements: ABA recommends a series of steps to streamline and
clarify the disclosure methodology applicable to the origination of residential mortgage
transactions. These recommendations will offer security to banks that they are “doing it right,”
thus removing legal doubts that hamper operations and swell costs.
Liberalize Underwriting Mandates: ABA advances various recommendations that will expand
responsible lending but still maintain protections that afford consumers the assurance that they
are receiving loans that they can afford.
Fix the Servicing Rules: ABA recommends numerous reforms that will correct servicing
regulations to avoid unintended consequences and encourage banks to service residential
mortgages.
Clarify Liabilities and Cures: ABA advises that more attention be devoted to liabilities in
mortgage regulations; these provisions are so laden with uncertainties that they greatly endanger
participation and innovation in this entire sector.
ABA believes that targeted and focused adjustments to current regulations will go a very long
way in repairing most of the defects that adversely impact bank lenders and capital reinvestment
into their communities. The recommendations are as follows—
TILA-RESPA Integrated Disclosures:
Revise TRID Tolerances: Under current TRID regulations, creditors must observe closing cost
tolerances that prohibit fees from increasing beyond initial disclosures by specific amounts. TRID’s
cost tolerance system is extremely convoluted, operating under a three-prong tolerance system that
contains uncertain exemptions and rules for corrections. ABA believes that the current tolerance
system should be entirely eliminated and replaced with a “single tolerance” standard of 10%, with
more focused applicability.
May 2017
4
Under this proposal, a single 10% tolerance would apply to all lender fees, and fees charged by
providers that are specifically required by the lender. The tolerance would exclude fees for services
that are not credit-related (recording fees, government taxes) and settlement fees, where a specific
provider is not required by the lender. All fees not subject to the 10% tolerance would continue to be
regulated under RESPA’s “Good Faith” standards.
ABA’s approach would ease compliance burdens without removing consumer protections. The
single-prong approach eliminates the extremely convoluted tolerance system imposed under current
rules, where the tolerance limits vary in accordance to the type of service, if the service is required by
the lender, if a provider was initially disclosed to the borrower by the lender, and whether the
borrower is permitted to shop for the provider. The existing regulations demand very complex
systems to manage compliance risks, and often results in unpredictable (and unfair) liabilities for the
lender based on other parties’ actions, such as those of the title insurance company, that are extremely
difficult to control.
Under the current tolerance rules, estimated credits offered by lenders for no-cost mortgage loans may
not be later reduced to match actual costs. This often results in payments being made paid to
borrowers even where the payment does not cover any transaction cost. To avoid this awkward
result, many lenders have simply stopped offering these consumer-friendly products. Lenders should
be permitted to adjust estimated credits to match actual costs without being unfairly penalized by this
inflexible rule.
Remove Three-Day Waiting Period: Currently, TRID provides that the final Closing Disclosure
(CD) be provided to the consumer three business days before the settlement—this requirement should
be eliminated (and replaced by the former RESPA rule mandating one-day advance availability). The
delay is unnecessary and detrimental to consumers in mortgage transactions—(i) it does not enhance
consumer protection in refinance transactions, as borrowers have an absolute right of rescission that
provides greater protections; and (ii) it is unsuitable in the home-purchase setting, as purchase money
transactions generally involve dynamic and fluid negotiations, and price/cost adjustments right until
the point of settlement. Our banks report that TRID’s 3-day delay often frustrates borrowers that
need to close on their homes under tight deadlines, or require the use of loan proceeds for immediate
purposes.
Permit Correction of Closing Disclosure: Current regulations should be amended to allow a creditor
to issue corrected Closing Disclosures at settlement to update last minute fee changes without having
to absorb increases not attributed to the creditor. Presently, creditors are held responsible for many
justified fee changes, even “borrower-requested” changes, merely because the cost adjustments occur
after an initial Closing Disclosure was issued. This requirement has forced lenders to incorporate
expensive and very rigid loan origination systems with inflexible processes to avoid even minor fee
adjustments that cause liabilities for lenders and extended delays for consumers. ABA believes that
lenders and consumers will be helped by allowing legitimate and good faith cost adjustments to occur
up to the point of settlement, without penalizing stakeholders.
Exempt Construction Loans & Temporary Financing: Temporary financing transactions that
generally encompass construction lending should be entirely excluded from TRID coverage.
Construction loans are complex transactions with third party building contractors involved that often
times do not allow meaningful disclosure to consumers within three days from learning the 6 trigger
items for disclosure. As a result, a creditor’s good faith estimate can be wildly inaccurate given that
the construction contract may not be executed (some consumers may not even have a builder
identified) at the time of the disclosure. TRID’s current construction loan disclosures require
May 2017
5
computation flows that are convoluted and yield erroneous numerical outcomes. Confusion with
numerous provisions of the rule, including disbursements of construction contract costs, the projected
payments table, and variations applicable to the alternative disclosures, among other issues. The
ongoing regulatory disarray has sparked a concerning flight away from construction financing by
many banks.
ABA believes that temporary financing transactions that generally encompass construction lending
should be excluded from TRID coverage. Construction-to-Permanent loans are generally structured
as a single loan with two distinct phases. The second, or permanent phase, of the transaction will be
fully subject to TRID disclosures, and the consumer will be well protected on the long-term financing
of the overall project. The initial phase, or pure “construction” phase, which concerns contractor
negotiations, disparate disbursements of funds at times and in amounts that are unascertainable at the
start, and interest‐only payments to the lender by the consumer, is a form of temporary financing that
should be exempt from TRID.
Ability to Repay – Qualified Mortgages:
Portfolio Loans Should Qualify as QM: Under existing Ability-to-Repay (ATR) rules, lenders must
determine whether a borrower has a reasonable ability to repay a mortgage, and must document the
loan applicant’s income, before the loan is consummated. Loans that are originated under specific
underwriting guidelines, as defined in the regulation, qualify for more favorable safe harbor treatment
as a Qualified Mortgage, or “QM.” ABA believes that all mortgages originated and held in a bank’s
own portfolio should be considered QM, and should be afforded safe harbor legal treatment. This
approach is consistent with safe lending principles because holding loans in portfolio means that the
bank is retaining 100% of the risk on that loan. Banks will offer portfolio products only when they
can adequately assure that it is a “safe” loan and can absorb the full risk of repayment. Since
institutions are not likely to make unsound loans in instances where the loan is held in-house, the
ability-to-repay protections are inherent in the underwriting analysis that the bank chooses to apply.
Eliminate the 43% Debt-to-Income Standard: In order to attain a presumption of compliance, or
“Qualified Mortgage” status (QM), a lender must assure that the DTI on the loan is no greater than
43%. Instituting such a rigid DTI limitation is arbitrary, misplaced and results in inflexible
underwriting conditions that are resulting in the rejection of many creditworthy applicants. The rule’s
forced focus on one data point—the DTI—is not conducive to allowing banks to review a mortgage
applicant’s fuller credit picture. The codification of a hard-lined DTI ratio halts any ability to
consider viable compensating factors that open credit possibilities for deserving consumers.
The QM rules should not prescribe inflexible underwriting criteria. Since the Dodd-Frank legislation
instructs the regulator to take into account debt-to-income ratios when setting QM standards, the
solution is to increase the DTI threshold to a higher level in order to afford lenders more leeway in
setting their own standards, in full consideration of their communities’ needs and their appetite for
risk.
A more appropriate alternative standard for considering an individual’s ability to repay would be a
well-defined residual income analysis. ABA urges that the QM rules should provide that, in addition
to DTI, creditors have the option of considering residual income to determine whether an applicant
qualifies for a loan. For instance, the Veteran Administration’s residual income test is an established
and market-accepted standard that would provide an excellent model to serve as an alternative to the
QM DTI requirement.

May 2017
6
Revisit and Expand Appendix Q: Under the QM rules, Appendix Q sets forth the definitions and
standards for calculating “debt” and “income” for purposes of calculating the DTI limits applicable to
attaining safe harbor treatment. The guidelines set forth in Appendix Q were generally derived from
the FHA Insurance program, and as such, constitute only one option among many market standards
for safe underwriting. Various other guidelines currently exist—whether they be from Freddie Mac,
Fannie Mae, the VA, or the Federal Home Loan Banks—that are as safe and established as the FHA
guidelines. These additional alternatives must be made available as acceptable guidelines for
allowing banks to certify loans into QM status.
Consider Acceptable Replacement for the GSE/Agency Alternative QM: The ATR regulations
contain a special “GSE QM,” which provides that loans that comply with GSE underwriting
specifications automatically qualify as QM. This special GSE QM continues to be a critical QM
alternative in the current market. However, this alternative is only temporary and is set to expire once
GSEs are no longer in conservatorship or until 2021, whichever is earlier. ABA urges the CFPB to
initiate a formal process for soliciting stakeholder input to begin the development of a workable and
transparent set of criteria for the configuration of a viable QM standard that replaces the “GSE
Patch.” The new QM standard must be as broad as the current GSE QM, and must be sufficiently
robust to completely replace it. The standard must set forth methodologies that achieve flexible
underwriting standards, and they must be fully consistent with Dodd-Frank requirements. ABA
believes that this endeavor is urgent in light of the impending sunset requirements for this special
provision.
Eliminate the Points and Fees Test: In order to qualify for QM’s safe harbor treatment, the points
and fees payable in connection with a loan cannot exceed certain thresholds. This so-called points-
and-fees test is extremely complex, with definitions that are unclear and often inconsistent in their
application. There should be a reconsideration of the points-and-fees thresholds as this item is among
the most convoluted elements of the law and threatens high liability for banks. More importantly, this
test operates as a redundant consumer protection provision, as price controls that achieve the same
end are found elsewhere in mortgage regulations. The points-and-fees test often poses a significant
hurdle to qualifying consumers into mortgage loans.
Raise the RESPA Servicing Rule Threshold: The new servicing rule requirements under RESPA are
extensive, are an overreaction to the financial crisis when servicers could not keep up with the barrage
of loans going into default, and go too far in specifying exacting detail of how to service a mortgage
loan. The threshold to trigger compliance with many parts of the servicing rules is just 5000
mortgages, or just 1 mortgage whose servicing rights are purchased when the lender will be servicing
for others. The servicing rules require precision to orchestrate that translates into a need for increased
staffing that a small servicer cannot afford. The threshold should be increased to 25,000 mortgages,
or 1000 loans whose servicing rights are purchased, so that only large servicers will be bound by the
increased complexity.
Mortgage Servicing Regulations:
Many banks that make residential mortgage loans also engage in mortgage servicing, which
primarily consists of collecting mortgage payments and forwarding them to the “owner” of the
loan; collecting insurance and tax payments; and addressing problems such as late payments,
delinquencies, and defaults.
May 2017
7
Banks commonly sell mortgage loans into the secondary market “servicing retained.” Under this
approach, a bank sells the loan to an investor but retains the right to service the loan. This
strategy is an important way for banks to maintain valuable customer relationships, while selling
long-term credit assets in order to manage interest rate risk. Servicing mortgage loans for
investors is a specialty of many U.S. banks and has provided a strong source of fee income for
decades.
Collectively, recent complicated servicing rules, inappropriately targeted capital requirements,
and inconsistent regulatory policy are creating an environment that discourages banks from
servicing mortgage loans, which provide important and long-term relationships with consumers.
The following targeted recommendations will foster and enable increased mortgage servicing
activities in banks.
Simplify and Clarify the Servicing Rules. Since 2013, the CFPB has issued six rulemakings
that govern mortgage servicing practices. The rules apply to payment crediting, periodic
statement requirements, error resolution, information requests, force-placed insurance,
communicating with delinquent borrowers, and loss mitigation. All mortgage borrowers deserve
high-quality mortgage servicing that is accurate and responsive to customer inquiries. However,
some aspects of the CFPB servicing rules are over-engineered and need to be rationalized. Some
of the most convoluted aspects of the rules were not required by the Dodd-Frank Act. Rather,
CFPB elected to issue certain provisions using its “discretionary rulemaking authority.” For
example, when a borrower requests a loan modification, the CFPB’s loss mitigation rules trigger
complicated and inflexible procedural and timing requirements. While it is in a lender/servicer’s
economic interest to work with financially distressed borrowers, the rules are overly rigid and
subject servicers to civil and regulatory penalties for non-compliance. Failure to comply with the
various notice and response times within the allotted timeframes could subject servicers to
supervisory or other consequences if a deadline is exceeded by one or two days—even when
there is no borrower harm. Since these draconian directives are non-legislative, CFPB must
reconsider these requirements with more rigorous regulatory impact analysis.
Limit Successors in Interest. Recent amendments to the servicing rules provide “successors in
interest” with the same rights as mortgage borrowers, even if the successor does not assume the
mortgage loan obligation. As a result, a successor in interest who is not obligated on a mortgage
loan—but rather has a mere, possibly unperfected, ownership interest in mortgaged property—is
entitled to detailed information regarding the mortgage loan. This is particularly concerning in
situations where a transferor borrower is still living (e.g., a non-borrowing spouse obtains title to
the property as part of a divorce settlement). While ABA appreciates the objective of preventing
unnecessary foreclosure in successor in interest situations, this aspect of the servicing rules
constitutes significant overreach by CFPB and is altogether inconsistent with a borrower’s
expectation of privacy and confidentiality. For this reason, the successor in interest provisions of
the servicing rules should be limited to situations involving the death of an obligor. In addition,
servicers should be protected from RESPA liability as to non-obligor successors.
Repeat Requests for Loss Mitigation. Subject to very narrow exceptions, servicers must
comply with the CFPB’s loss mitigation procedural requirements for all loss mitigation
applications submitted by a borrower. ABA does not oppose considering a borrower for loss
mitigation multiple times. However, any requirement to do so should permit restrictions on the
frequency and number of times that a servicer is required to comply with the loss mitigation
requirements over the life of a loan. In other words, there should be a limit on the frequency with
May 2017
8
which banks are required to apply the loss mitigation rules for repeat loss mitigation applications.
Requiring a borrower to perform under a loss mitigation arrangement for a minimum period of
time before the loss mitigation requirements are triggered again would also help to provide a
more effective allocation of resources by enabling servicers to focus their loss mitigation
personnel on helping borrowers who are in genuine need of assistance, such as those filing their
first loss mitigation application rather than those who may be manipulating the loss mitigation
process.
Need for Flexibility when Rules Change. Since 2013, servicers have been faced with a
continual stream of amendments to the servicing rules. In fact, servicers have questions about
how to interpret and apply regulations that go into effect less than 6 months from now. In such an
environment, regulatory and supervisory flexibility is warranted. The ongoing amendments
necessitate programming and systems changes that are much more complex than a few computer
keystrokes. As has been the case with many of the CFPB’s mortgage-related rulemakings, once
vendors provide the necessary upgrades, banks may need several months to implement and test
the changes, revise internal policies and procedures, and train staff. For these reasons,
coordinated, inter-agency flexibility is needed.
Capital Treatment of MSAs. As the CFPB servicing rules have dramatically increased the cost
of servicing (particularly for delinquent loans), banks are also dealing with unfavorable capital
treatment for mortgage servicing assets. The Basel III capital rules mandated a significant
increase in bank capital and provided unfavorable capital treatment to mortgage servicing assets.
The Basel III capital provisions on MSAs—which apply to all U.S. banks regardless of size—
were suggested by regulators from foreign countries that have vastly different mortgage systems
than our own and that do not have MSAs. Agencies must reopen deliberation in this area and
better consider the impact of the onerous new rules on the U.S. marketplace and American
consumers.
The new limits on the extent to which banks may include MSAs in Tier 1 capital calculations
make it very expensive for banks to hold MSAs in excess of the Basel III thresholds. The
increased capital requirements result in higher funding costs, which in turn create a disincentive
for banks to service mortgage loans that they make to their customers. The Basel III capital
requirements do not apply to non-bank servicers, and an active regulatory arbitrage is draining
MSAs from the secure and experienced hands of the banking industry.
Clarify Liabilities and Provide for Cures:
A critical element of uncertainty under the current regulatory regime continues to be the scope
and effect of RESPA and TILA’s liability provisions given the application of the new regulations
and the overhaul of all mortgage-related disclosures. Since the launch of the new Dodd-Frank
rules, banks have expressed significant anxiety about the mix of old and new statutory remedies,
which engender considerable doubt as to which statutory provision applies to which particular
circumstance, and the extent to which statutory penalties affect non-creditors, including
investors. The continued uncertainty in liability forces industry stakeholders to assume that the
more stringent liability will apply in all instances of non-compliance, even if that is not the intent
of the legislation or the Bureau. In the long run, the resulting impact to consumers is
significant—lenders and investors will limit exposure to uncertainty and confusion, and this will
result in diminished product choice and increased costs for borrowers.

May 2017
9
ABA recommends that agencies provide more detailed descriptions of the specific statutory
provisions under RESPA and/or TILA (or other applicable statutes) as they apply to TRID. It is
only through a more precise description of the statutory authority for each disclosure element
that industry stakeholders and government authorities will be able to properly identify penalties
and liabilities applicable under the law. Regulators must craft matrices that explicitly address
how liability might attach to any specific compliance point. Any such matrix should include: (1)
each regulatory provision that provides for a disclosure item or requirement; (2) a description of
the statutory section relied upon for each disclosure item or requirement; (3) if curable, how it
may be cured, e.g., as a tolerance refund, as a non-numeric clerical error, or under Section 130(b)
of TILA; and (4) clarifying comments, where needed.
If regulators provide a matrix as described, issued as official commentary to the regulations, it
would facilitate proper application of the law, and would allow market participants to recognize
and manage their responsibility and/or accountability in the transaction.
Finally, and of equal importance, ABA urges that regulators expand the availability of cure
provisions across all mortgage regulations. Current mortgage rules involve technicalities and
delineate methodologies and computations that govern how triggers are set or how disclosure
figures must be calculated and reflected in forms and apportioned in mandated comparison
tables. Often, technical oversights occur that do not affect consumer choice or understanding.
Even where they do, lenders often have ample opportunity to fix mistakes so that consumers are
not harmed or misled in their decision-making. The regulations must apply to reasonably allow
banks to correct hyper-technical and clerical oversights without triggering penalty provisions or
forcing the process to begin anew. The rules must provide for official ways to correct mistakes
and afford ways in which lenders can deal directly with consumers to resolve harmless or clerical
lapses.