Nitrogen balances in farmers fields under alternative uses of a cover crop legume: a case study from...
16
ORIGINAL ARTICLE Nitrogen balances in farmers fields under alternative uses of a cover crop legume: a case study from Nicaragua Sabine Douxchamps • Franc ¸ois-Lionel Humbert • Rein van der Hoek • Martin Mena • Stefano M. Bernasconi • Axel Schmidt • Idupulapati Rao • Emmanuel Frossard • Astrid Oberson Received: 16 October 2009 / Accepted: 12 April 2010 / Published online: 1 May 2010 Ó Springer Science+Business Media B.V. 2010 Abstract Canavalia brasiliensis (canavalia), a drought tolerant legume, was introduced into the smallholder traditional crop-livestock production system of the Nicaraguan hillsides as green manure to improve soil fertility or as forage during the dry season for improving milk production. Since nitrogen (N) is considered the most limiting nutrient for agricultural production in the target area, the objec- tive of this study was to quantify the soil surface N budgets at plot level in farmers fields over two cropping years for the traditional maize/bean rotation and the alternative maize/canavalia rotation. Mineral fertilizer N, seed N and symbiotically fixed N were summed up as N input to the system. Symbiotic N 2 fixation was assessed using the 15 N natural abundance method. Nitrogen output was quantified as N export via harvested products. Canavalia derived in average 69% of its N from the atmosphere. The amount of N fixed per hectare varied highly according to the biomass production, which ranged from 0 to 5,700 kg ha -1 . When used as green manure, canava- lia increased the N balance of the maize/canavalia rotation but had no effect on the N uptake of the following maize crop. When used as forage, it bears the risk of a soil N depletion up to 41 kg N ha -1 unless N would be recycled to the plot by animal manure. Without N mineral fertilizer application, the N budget remains negative even if canavalia was used as green manure. Therefore, the replenishment of soil N stocks by using canavalia may need a few years, during which the application of mineral N fertilizer needs to be maintained to sustain agricul- tural production. Keywords 15 N natural abundance method Canavalia brasiliensis Forage legume Nicaraguan hillsides Nitrogen budget On-farm trials Abbreviations BG Bean grain BP Bean plant CB Canavalia above-ground biomass S. Douxchamps (&) F.-L. Humbert E. Frossard A. Oberson ETH Zurich, Institute of Plant, Animal and Agroecosystem Sciences, Eschikon 33, 8315 Lindau, Switzerland e-mail: [email protected] R. van der Hoek A. Schmidt Centro Internacional de Agricultura Tropical (CIAT), Managua, Nicaragua M. Mena Instituto Nicaraguense de Tecnologı ´a Agropecuaria (INTA), Managua, Nicaragua S. M. Bernasconi ETH Zurich, Geological Institute, Zurich, Switzerland I. Rao Centro Internacional de Agricultura Tropical (CIAT), Cali, Colombia 123 Nutr Cycl Agroecosyst (2010) 88:447–462 DOI 10.1007/s10705-010-9368-2
-
Upload
independent -
Category
Documents
-
view
3 -
download
0
Transcript of Nitrogen balances in farmers fields under alternative uses of a cover crop legume: a case study from...
ORIGINAL ARTICLE
Nitrogen balances in farmers fields under alternative usesof a cover crop legume: a case study from Nicaragua
Sabine Douxchamps • Francois-Lionel Humbert • Rein van der Hoek •
Martin Mena • Stefano M. Bernasconi • Axel Schmidt • Idupulapati Rao •
Emmanuel Frossard • Astrid Oberson
Received: 16 October 2009 / Accepted: 12 April 2010 / Published online: 1 May 2010
� Springer Science+Business Media B.V. 2010
Abstract Canavalia brasiliensis (canavalia), a
drought tolerant legume, was introduced into the
smallholder traditional crop-livestock production
system of the Nicaraguan hillsides as green manure
to improve soil fertility or as forage during the dry
season for improving milk production. Since nitrogen
(N) is considered the most limiting nutrient for
agricultural production in the target area, the objec-
tive of this study was to quantify the soil surface N
budgets at plot level in farmers fields over two
cropping years for the traditional maize/bean rotation
and the alternative maize/canavalia rotation. Mineral
fertilizer N, seed N and symbiotically fixed N were
summed up as N input to the system. Symbiotic N2
fixation was assessed using the 15N natural abundance
method. Nitrogen output was quantified as N export
via harvested products. Canavalia derived in average
69% of its N from the atmosphere. The amount of N
fixed per hectare varied highly according to the
biomass production, which ranged from 0 to
5,700 kg ha-1. When used as green manure, canava-
lia increased the N balance of the maize/canavalia
rotation but had no effect on the N uptake of the
following maize crop. When used as forage, it bears
the risk of a soil N depletion up to 41 kg N ha-1
unless N would be recycled to the plot by animal
manure. Without N mineral fertilizer application, the
N budget remains negative even if canavalia was
used as green manure. Therefore, the replenishment
of soil N stocks by using canavalia may need a few
years, during which the application of mineral N
fertilizer needs to be maintained to sustain agricul-
tural production.
Keywords 15N natural abundance method �Canavalia brasiliensis � Forage legume �Nicaraguan hillsides � Nitrogen budget �On-farm trials
Abbreviations
BG Bean grain
BP Bean plant
CB Canavalia above-ground biomass
S. Douxchamps (&) � F.-L. Humbert �E. Frossard � A. Oberson
ETH Zurich, Institute of Plant, Animal and
Agroecosystem Sciences, Eschikon 33, 8315 Lindau,
Switzerland
e-mail: [email protected]
R. van der Hoek � A. Schmidt
Centro Internacional de Agricultura Tropical (CIAT),
Managua, Nicaragua
M. Mena
Instituto Nicaraguense de Tecnologıa Agropecuaria
(INTA), Managua, Nicaragua
S. M. Bernasconi
ETH Zurich, Geological Institute, Zurich, Switzerland
I. Rao
Centro Internacional de Agricultura Tropical (CIAT),
Cali, Colombia
123
Nutr Cycl Agroecosyst (2010) 88:447–462
DOI 10.1007/s10705-010-9368-2
CBR Canavalia biomass removed
d15N 15N natural abundance signature (%)
M/B Maize-bean
M/C Maize-canavalia
M/CX Maize-canavalia with X% of canavalia
biomass removed
MG Maize grain
MDG Maize damaged grain
MC Maize cob
MH Maize husk
MRE Maize recycled ears
MR Maize residues (stalks and leaves)
N Nitrogen
%Ndfa Rate of nitrogen derived from the
atmosphere
Nfert Amount of nitrogen applied with mineral
fertilizers (kg ha-1)
Nfix Amount of nitrogen fixed (kg ha-1)
Nseed Amount of nitrogen supplied through seeds
(kg ha-1) at the time of sowing
NX Amount of nitrogen in the plant part X
(kg ha-1)
Introduction
Population growth in the rural poor areas of devel-
oping countries has contributed to land use intensi-
fication that adversely affects soil fertility, with
nutrient depletion and soil erosion being major
causes of soil degradation (Tan et al. 2005). Crop
and livestock productivity therefore declines, causing
decreased income generation opportunities, and food
insecurity. In the Nicaraguan hillsides, population is
expanding at an annual growth rate of 1.3% (IFAD
2009). Cropping is limited to two short and succes-
sive rainy seasons, and therefore livestock suffers
forage shortage during the long dry season of
5–6 months. Smallholders are mostly affected by
the declined soil fertility due to their marginalized
situation and their inability to overcome production
constraints (Pfister 2003). Agricultural production
usually does not exceed the needs for subsistence,
making the sale of products almost impossible.
Sufficient amounts of mineral fertilizers are not
affordable and in small-scale farms, nitrogen (N)
depletion is a major production constraint (Ayarza
et al. 2007; Smyth et al. 2004).
Introduction of cover crop legumes can be bene-
ficial to such a system due to their ability to add N via
symbiotic N2 fixation (Boddey et al. 1997; Ojiem
et al. 2007) and to provide surface mulch during the
dry season or to provide fodder to livestock (Said and
Tolera 1993). In order to identify the most suitable
legume for the Nicaraguan hillsides, forage special-
ists and local extentionists induced farmer participa-
tory evaluation of potential legume species. Among
all the legumes tested, Canavalia brasiliensis Mart.
Ex. Benth (canavalia), also known as Brazilian jack
bean, attracted most attention from farmers mainly
due to its vigorous growth, good soil cover and
outstanding level of adaptation to drought stress
based on green forage yield. Moreover, canavalia is
also adapted to a wide range of other stress factors,
including low fertility soils (CIAT 2004; Schloen
et al. 2005; Schmidt et al. 2005).
Previous studies have indeed shown positive
effects of canavalia on crop productivity when
integrated in the crop rotation (Bordin et al. 2003).
Maize yield was higher after a rotation with canavalia
than after other cover crops, because of its high
biomass production and rapid litter decomposition
rate (de Carvalho et al. 2008). In an on-station study
over 4-years, the use of canavalia green manure in
rotation with maize was equivalent to a replacement
of 50 kg N ha-1 of mineral N fertilizer (Burle et al.
1999). Canavalia brasiliensis is known to nodulate
well (Alvarenga et al. 1995) but its contribution
through symbiotic N2 fixation has not been quanti-
fied. The integration of a highly productive legume
crop in a cropping system could also increase mining
of nutrients (Bunemann et al. 2004), and a yield
increase of the subsequent crop also means higher N
export via harvested products. The contribution of a
legume to a system may also be further diminished if
crop residues are used as fodder (Peoples and
Craswell 1992). Before promoting the use of cana-
valia to smallholders, it is important to evaluate
whether canavalia results in a net N input to the
cropping system, i.e., whether the N input through
symbiotic N2 fixation exceeds N output through
harvest. Such imbalances can be revealed by calcu-
lating the N budgets for the rotations of interest.
Nutrient budgets are commonly used as indicators of
changes in soil fertility at national or regional scale
(Bindraban et al. 2000; Smaling et al. 1993), and
more recently have been useful to evaluate soil
448 Nutr Cycl Agroecosyst (2010) 88:447–462
123

fertility status and nutrient efficiency of African
smallholder crop-livestock systems (Rufino et al.
2009; Zingore et al. 2007). However, there is no
published information on on-farm N budgets on the
alternative uses of forage legumes in Central Amer-
ica. We chose the soil surface budget approach where
all the N entering the soil via soil surface and leaving
the soil via crop uptake are recorded (Adu-Gyamfi
et al. 2007; Oenema et al. 2003; Watson et al. 2002).
Canavalia was tested either as green manure to
improve soil fertility or as forage to improve milk
production. When used as green manure, it was left
on the plot during the whole dry season and was
incorporated at the onset of the next rainy season
before sowing maize. As forage, it was cut and
removed at the beginning of the dry season to
simulate grazing. The use of the traditional maize/
bean (M/B) rotation as control does not mean that
canavalia should replace bean. Indeed, farmers grow
bean on only half of the cultivated area. Thus there is
possibility to grow canavalia on the other half, and to
alternate each year between the areas under maize/
canavalia (M/C) and M/B rotations.
The main objective of this study was to quantify
the soil surface N budgets at plot level in farmers
fields over two cropping years for the traditional M/B
rotation and the alternative M/C rotation. We tested
the hypothesis that the introduction of canavalia into
the traditional rotation will help reversing soil N
depletion by (1) fixing a high proportion of N, (2)
increasing the N budget of the crop rotation, and (3)
thereby increasing maize yields the year following its
integration into the production system. We empha-
sized N output via crop harvest and N input via N2
fixation of canavalia and bean. We also assessed N
recycled with crop residues.
Materials and methods
Study area and farmer practices
The study area is located in the hillsides of northern
Nicaragua, in the Rio Pire watershed (Municipality of
Condega, Department of Esteli), within a 2 km radius
around the community of Santa Teresa (13�180N,
86�260W) (Fig. 1). Soils are classified as Udic and
Pachic Argiustolls (MAGFOR 2008). The climate is
classified as tropical savannah (Aw) according to the
Koppen-Geiger classification (Peel et al. 2007).
Annual mean rainfall is 825 mm (INETER 2009)
and has a bimodal distribution pattern (Fig. 2).
Farmers are traditional crop-livestock smallhold-
ers, cultivating maize and bean on about 2 ha of land,
and sharing an area for grazing on less productive
pastures based on Jaragua grass (Hyperrenia rufa).
Cultivation is done essentially with hand-held tools.
Prior to sowing maize land is usually prepared with a
plough pulled by oxen if accessibility to the field and
slopes allow; otherwise it is prepared manually using
a hoe. Maize is sown at the end of May, at the onset
Fig. 1 Location of the sites in the Rio Pire watershed (source:
INETER). The map inserted at the bottom right depicts
Nicaragua, the grey square being the study area
0
30
60
90
120
150
180
210
240
270
300
Jan Feb Mar Apr May Jun Jul Aug Sep Oct Nov Dec
mm
historic norm20072008
Fig. 2 Monthly rainfall distribution during the 2 years of the
study with the historical normal value for the region (mean
monthly precipitations since 1977), measured at the meteoro-
logical station of Condega (source: INETER 2009)
Nutr Cycl Agroecosyst (2010) 88:447–462 449
123

of the first rainy season. Maize is fertilized with urea
and sometimes also with NPK fertilizer. At maturity,
plants are cut above the ears and maize ears are left
drying on the stalks for 2–3 months. Meanwhile,
beans are sown around mid-September between the
maize rows to take advantage of the part of the
bimodal rainfall pattern. Both maize and beans are
harvested in December. In January, at the beginning
of the dry season, forage is getting scarce in the
grazing area, and farmers let their cows enter the
cultivated fields to graze crop residues.
System treatments and experimental design
Four farmers of Santa Teresa, who were interested in
integrating canavalia in a part of their production
area, were identified. They chose themselves the site
for the experiment within their farm. Crop manage-
ment was done by the farmers, whereas data and
samples were collected by the scientists. Sites are
named after farmer’s initials: FC (Felipe Calderon),
GR (Gabriel Ruiz), LP (Lorenzo Peralta) and PT
(Pedro Torres). General site characteristics are given
in Table 1.
On each site five crop rotations were established
on 70–100 m2-plots, and repeated in three completely
randomized blocks, for a total of 60 plots. The control
treatment was the traditional M/B rotation. The four
others were M/C rotations with four different cutting
intensities to simulate grazing, i.e. with 0% (M/C0),
50% (M/C50), 75% (M/C75) or 100% (M/C100)
removal of canavalia biomass (Fig. 3). Land was
prepared according to the usual practice, with hoe on
FC site and ploughing with oxen on the other sites.
Farmers sowed maize (Zea mays var. Catacamas) at
the end of May 2007, by hand, with a seeding rate of
23 kg per hectare, with a row-to-row spacing of
75 cm and a plant-to-plant spacing of 50 cm. Com-
pound NPK fertilizer (12–30–10) and urea were
applied 8 and 22 days after sowing respectively. The
doses varied from 0 to 8 kg N ha-1 for NPK complex
and from 30 to 60 kg N ha-1 for urea, according to
each farmer’s usual practices (Table 2). Weed control
was done before maize germination by spraying
glyphosate and after germination manually with a
large knife. Cypermethrin1 was used for insect
control. Bean (Phaseolus vulgaris var. INTA seda
rojo) or canavalia (var. CIAT17009) were sown
between maize rows at the end of September with a
seeding rate of 78 and 51 kg per hectare, respec-
tively. No fertilizer was applied to either legume
crop. Maize and bean harvest occurred between
November and December according to the usual
practice. In January, the different percentages of
canavalia above ground biomass were removed from
the field. In May 2008, remaining standing maize
stalks and canavalia plants were cut with large knife
and left on the ground as mulch. Fields in 2008 were
prepared as described for 2007, using either plough or
hoe, and treatments were repeated on the same plots.
Farmers did not reduce mineral fertilizer application
after the first canavalia rotation.
Precipitation during crop growth (May to January),
measured at the meteorological station of the nearby
municipality Condega, was similar for both years
(about 920 mm), which is 19% above the normal
rainfall (Fig. 2). Temperature for both years was also
similar, with a mean of 24�C, a maximum of 33�C
and a minimum of 16�C (INETER 2009).
Table 1 Selected properties of the four study sites
Site Altitude masl Situation Slope range % Texture pH Total Ca g/kg Total Nb g/kg Available Pc mg/kg
FC 706 Hill 3–17 Clay 6.4 (0.1) 25.2 (2.4) 1.90 (0.15) 10.1 (3.5)
GR 707 Hill 7–34 Sandy loam 6.3 (0.4) 10.9 (4.0) 1.02 (0.34) 14.7 (6.6)
LP 674 Valley 1–5 Clay loam 6.2 (0.3) 21.8 (0.9) 1.57 (0.06) 75.5 (7.2)
PT 651 Valley 0–3 Sandy clay loam 6.7 (0.3) 14.8 (1.4) 1.13 (0.10) 41.9 (6.0)
Sites are named after farmer’s initials. For soil chemical properties: averages on all plots (0–10 cm depth), with standard deviation in
parenthesis (n = 15)a Measured following Nelson and Sommers (1982)b Measured following Krom (1980)c Measured with anion-exchange resins (Tiessen and Moir 1993)
1 (RS)-Cyano-3-phenoxybenzyl-2,2-dimethyl-3-(2,2-dichlorvi-
nyl)-cyclopropan-1-carboxylat.
450 Nutr Cycl Agroecosyst (2010) 88:447–462
123
Symbiotic N2 fixation
The rates of N derived from the atmosphere (%Ndfa) in
canavalia and bean were assessed both years using the15N natural abundance method (Shearer and Kohl
1986), which is based on the slight natural differences
between the 15N abundance of the soil and the 15N
abundance of the atmosphere. As reference plants,
non-fixing dicotyledonous weeds (Oberson et al. 2007)
growing at the same time as the legumes have been
selected and marked in the field to avoid them being cut
during weed control by the farmers. Other herbaceous
and shrubby weeds were excluded. Two weeds were
chosen in the immediate proximity (i.e. within a radius
of 50 cm) of each marked legume. Weeds were limited
to four different species per site and per year, each of
them being present at least five times for each legume
and as well distributed as possible across the site.
Species chosen were Baltimora recta, Delilia biflora,
Euphorbia graminea, Euphorbia hirta, Lagascea
mollis, Melanthera aspera, Mitrocarpus hirtus,
Richardia scabra, Borreria suaveolens, Ageratum
conyzoides, and Conyza Canadensis (Table 2). Sam-
pling of canavalia occurred 3 months after planting,
before drought, at the beginning of the flowering
period. For bean, sampling occurred at the growth
stage of late flowering to early pod filling. Five bean
plants and five canavalia plants were harvested per
block, together with their paired weeds, resulting in
thirty legumes and sixty reference plants per site and
per year. Table 2 shows slightly lower sample num-
bers, as in a few cases the marked plant did not develop
well and was therefore not harvested. Plants were dried
and analyzed for their 15N abundance (see below).
The %Ndfa for each legume plant was calculated
following Shearer and Kohl (1986), using its two
paired weeds as references. The final %Ndfa per
legume and per site was then calculated as the
average of the fifteen %Ndfa estimated from single
legume plants for this site.
maize canavalia
maize drying canavalia partially removed
bean
Month J J A S O N J F M ARainfall
DM
Canavalia as forage
M/B
M/C0
M/C50
M/C75
M/C100
Traditional system
Canavalia as green manureCanavalia partially grazed (50%)Canavalia partially grazed (75%)
Evaluation of production (1)(2) (3)
(2)
(1)
(3)
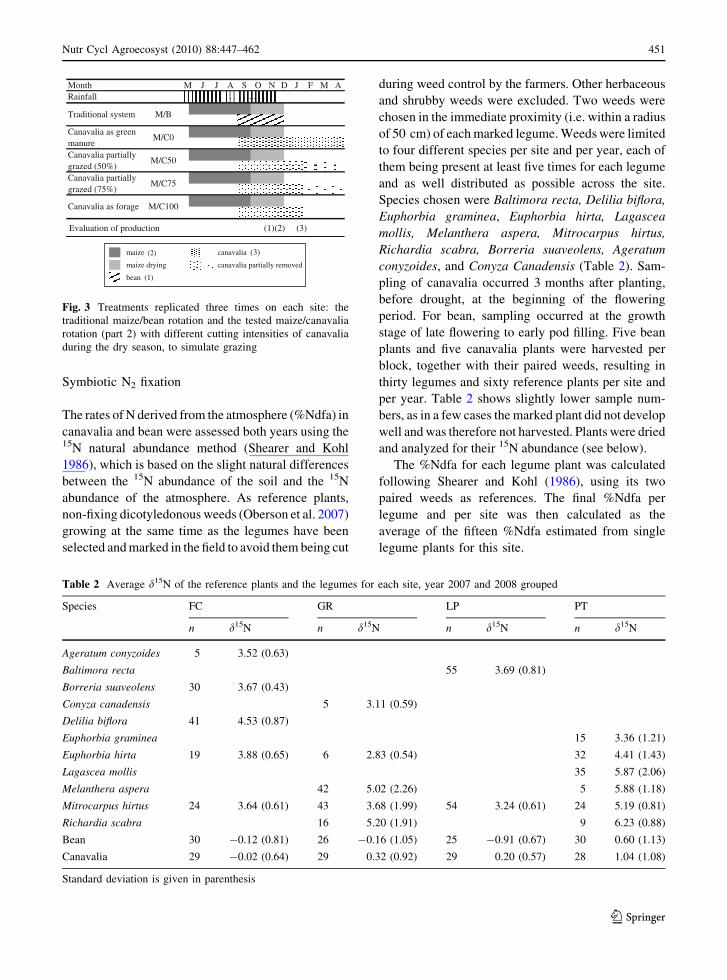
Fig. 3 Treatments replicated three times on each site: the
traditional maize/bean rotation and the tested maize/canavalia
rotation (part 2) with different cutting intensities of canavalia
during the dry season, to simulate grazing
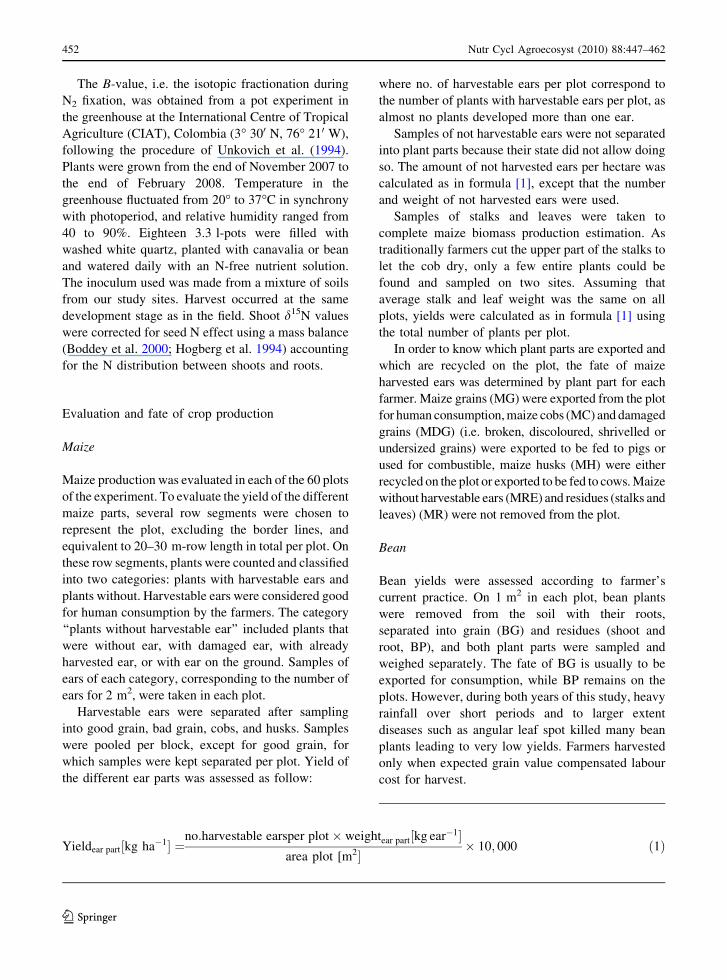
Table 2 Average d15N of the reference plants and the legumes for each site, year 2007 and 2008 grouped
Species FC GR LP PT
n d15N n d15N n d15N n d15N
Ageratum conyzoides 5 3.52 (0.63)
Baltimora recta 55 3.69 (0.81)
Borreria suaveolens 30 3.67 (0.43)
Conyza canadensis 5 3.11 (0.59)
Delilia biflora 41 4.53 (0.87)
Euphorbia graminea 15 3.36 (1.21)
Euphorbia hirta 19 3.88 (0.65) 6 2.83 (0.54) 32 4.41 (1.43)
Lagascea mollis 35 5.87 (2.06)
Melanthera aspera 42 5.02 (2.26) 5 5.88 (1.18)
Mitrocarpus hirtus 24 3.64 (0.61) 43 3.68 (1.99) 54 3.24 (0.61) 24 5.19 (0.81)
Richardia scabra 16 5.20 (1.91) 9 6.23 (0.88)
Bean 30 -0.12 (0.81) 26 -0.16 (1.05) 25 -0.91 (0.67) 30 0.60 (1.13)
Canavalia 29 -0.02 (0.64) 29 0.32 (0.92) 29 0.20 (0.57) 28 1.04 (1.08)
Standard deviation is given in parenthesis
Nutr Cycl Agroecosyst (2010) 88:447–462 451
123
The B-value, i.e. the isotopic fractionation during
N2 fixation, was obtained from a pot experiment in
the greenhouse at the International Centre of Tropical
Agriculture (CIAT), Colombia (3� 300 N, 76� 210 W),
following the procedure of Unkovich et al. (1994).
Plants were grown from the end of November 2007 to
the end of February 2008. Temperature in the
greenhouse fluctuated from 20� to 37�C in synchrony
with photoperiod, and relative humidity ranged from
40 to 90%. Eighteen 3.3 l-pots were filled with
washed white quartz, planted with canavalia or bean
and watered daily with an N-free nutrient solution.
The inoculum used was made from a mixture of soils
from our study sites. Harvest occurred at the same
development stage as in the field. Shoot d15N values
were corrected for seed N effect using a mass balance
(Boddey et al. 2000; Hogberg et al. 1994) accounting
for the N distribution between shoots and roots.
Evaluation and fate of crop production
Maize
Maize production was evaluated in each of the 60 plots
of the experiment. To evaluate the yield of the different
maize parts, several row segments were chosen to
represent the plot, excluding the border lines, and
equivalent to 20–30 m-row length in total per plot. On
these row segments, plants were counted and classified
into two categories: plants with harvestable ears and
plants without. Harvestable ears were considered good
for human consumption by the farmers. The category
‘‘plants without harvestable ear’’ included plants that
were without ear, with damaged ear, with already
harvested ear, or with ear on the ground. Samples of
ears of each category, corresponding to the number of
ears for 2 m2, were taken in each plot.
Harvestable ears were separated after sampling
into good grain, bad grain, cobs, and husks. Samples
were pooled per block, except for good grain, for
which samples were kept separated per plot. Yield of
the different ear parts was assessed as follow:
where no. of harvestable ears per plot correspond to
the number of plants with harvestable ears per plot, as
almost no plants developed more than one ear.
Samples of not harvestable ears were not separated
into plant parts because their state did not allow doing
so. The amount of not harvested ears per hectare was
calculated as in formula [1], except that the number
and weight of not harvested ears were used.
Samples of stalks and leaves were taken to
complete maize biomass production estimation. As
traditionally farmers cut the upper part of the stalks to
let the cob dry, only a few entire plants could be
found and sampled on two sites. Assuming that
average stalk and leaf weight was the same on all
plots, yields were calculated as in formula [1] using
the total number of plants per plot.
In order to know which plant parts are exported and
which are recycled on the plot, the fate of maize
harvested ears was determined by plant part for each
farmer. Maize grains (MG) were exported from the plot
for human consumption, maize cobs (MC) and damaged
grains (MDG) (i.e. broken, discoloured, shrivelled or
undersized grains) were exported to be fed to pigs or
used for combustible, maize husks (MH) were either
recycled on the plot or exported to be fed to cows. Maize
without harvestable ears (MRE) and residues (stalks and
leaves) (MR) were not removed from the plot.
Bean
Bean yields were assessed according to farmer’s
current practice. On 1 m2 in each plot, bean plants
were removed from the soil with their roots,
separated into grain (BG) and residues (shoot and
root, BP), and both plant parts were sampled and
weighed separately. The fate of BG is usually to be
exported for consumption, while BP remains on the
plots. However, during both years of this study, heavy
rainfall over short periods and to larger extent
diseases such as angular leaf spot killed many bean
plants leading to very low yields. Farmers harvested
only when expected grain value compensated labour
cost for harvest.
Yieldear part½kg ha�1� ¼no:harvestable earsper plot� weightear part½kg ear�1�
area plot [m2�� 10; 000 ð1Þ
452 Nutr Cycl Agroecosyst (2010) 88:447–462
123
Canavalia
At each canavalia cutting time, above-ground biomass
(CB) production was assessed in each plot with the
Comparative Yield Method (Haydock and Shaw 1975)
in which the yields of random 1 m2-quadrants are rated
with respect to a set of five reference quadrants
preselected to provide a scale covering the range of
biomass encountered within each plot. Ten quadrants
were rated per plot. Different proportions—100, 75, 50
or 0%—of the available biomass were removed
according to the experimental plan, by cutting cana-
valia with large knifes either on a plant number basis,
or on a height basis when plants were undistinguish-
able. The M/C100 plots, where all the biomass was
removed and weighed, were used as control of the
biomass estimate obtained with the Comparative Yield
Method. Samples of the above ground biomass were
taken from each block. Removed biomass (CBR) was
exported from the plot to be fed to animals.
Plant analysis
Canavalia, bean and reference plants sampled in the
field were dried in a wooden oven at about 40�C until
constant dry weight and ground with a rotary knife mill
at CIAT-Nicaragua. Maize plant parts were dried at
ambient temperature and ground with the same mill.
Canavalia and bean samples from the greenhouse were
dried at 70�C and ground with a rotary knife mill at
CIAT-Colombia.
All samples were then shipped to Switzerland,
powdered with a ball mill (Retsch, GmbH, Germany)
and analyzed for total N on a Thermo Electron
FlashEA 1112 Automatic Elemental Analyzer. The
d15N of legumes and reference plants were measured
at the Geological Institute of the ETH Zurich on a
Thermo Electron FlashEA 1112 coupled in continu-
ous-flow with a Thermo-Fisher MAT 253 mass
spectrometer. Finely ground field pea seed with an
atom % 15N of 0.367 was used as analytical standard.
Soil surface N budgets
Soil surface N budgets were estimated for all plots
and for both years (May to January) following the
equation:
N budget kg N ha�1� �
¼ N input� N output
¼ Nfixþ Nfert þ Nseedð Þ� Nexportð Þ ð2Þ
where Nfix is the contribution of symbiotic N2
fixation, Nfert is the mineral fertilization, Nseed
accounts for maize, bean and canavalia seeds and
Nexport is the amount of N exported from the plot.
Nfix was calculated as the product of %Ndfa, N
concentration and legume biomass. Nfert was calcu-
lated for each site based on the amount of fertilizer
applied by the farmer and the N concentration in urea
and NPK complex. Nseed was calculated as the
product of N concentration and seed density.
Nexport from the plot differed for each site
according to the fate given by each farmer to the
different plant parts of the crops and was estimated
as:
Nexport kg N ha�1� �
¼ NMG þ NMDG þ NMC
þ NMH þ NBG þ NCBR ð3Þ
where NX is the amount of N in kg ha-1 in each of
the mentioned plant part X, obtained from its N
concentration multiplied by its biomass production in
kg ha-1 (dry matter basis).
NMH equals 0 if the farmer left the husks on the
plot. NBG equals 0 if the farmer decided to not harvest
beans, or in M/C rotations. NCBR equals 0 in M/B and
M/C0 rotations.
Nitrogen recycled with crop residues
The amount of N recycled on each plot is the amount
of N in crop residues and in remaining canavalia,
calculated as follows:
Nrecycled kg N ha�1� �
¼ NMR þ NBP þ NðCB�CBRÞþ NMH þ NBG þ NMRE
ð4Þ
where NX is the amount of N in kg ha-1 in each of
the mentioned plant material X, obtained from its N
concentration multiplied by its biomass production in
kg ha-1.
NMH equals 0 if the farmer exports the husks. NBG
equals 0 if the farmer decided to harvest beans, or in
M/C rotations. N(CB-CBR) equals 0 in M/B and M/
C100 rotations.
Nutr Cycl Agroecosyst (2010) 88:447–462 453
123

Data analysis
Statistical analyses were performed using the pro-
gram R (R Development Core Team, 2007). Right-
skewed variables were log-transformed before the
analysis. Yields were submitted to a Wilcoxon’s
rank-sum test to check for significant differences
between the 2 years. The significance of the effects of
site and treatment on crop production and on N
balance was tested by an analysis of variance using
aov and lme functions in R (Pinheiro and Bates
2000). The model was composed by treatment as
fixed factor, site and bloc as random factors, bloc
being nested within site.
Results
N inputs: symbiotic N2 fixation
The B-values obtained from the greenhouse experi-
ment were -1.26% for canavalia and -3.74% for
bean. The d15N of the reference plants ranged from
0.2 to 13.1% in 2007 and from 0.5 and 8.4% in 2008.
Table 2 presents the average d15N per species and per
site, for both years together as there was no signif-
icant difference between the 2 years. The d15N of the
legumes ranged from -2 to 2%, with extreme values
up to 4.6% in 2007 and 2.6% in 2008. Each legume
had significantly lower d15N than its two reference
plants. Figure 4 shows the d15N of each N2-fixing
plant and the mean d15N of its paired reference plants
for all sites in 2007 and in 2008. Average %Ndfa was
55 and 58% for bean, and 64 and 74% for canavalia
in 2007 and 2008, respectively. Among sites, mean
%Ndfa did not vary much, with a standard deviation
of 3–9%. For bean, average Ndfa did not differ
significantly between 2007 and 2008 (P = 0.478).
For canavalia, average Ndfa in 2008 was significantly
(P = 0.000) higher than in 2007.
N outputs: crop production
Maize
Maize grain yields (Fig. 5) conformed to the usual
production of the region (personal communication
from the farmers), with an average yield of
2,410 kg ha-1 in 2007 and 2,070 kg ha-1 in 2008.
Grain yields were not significantly different between
the 2 years (P = 0.107). The first year of rotation made
no effect on grain yields of the subsequent year
(P = 0.187). Yields were affected significantly by the
site in 2008 (P = 0.025) but not in 2007 (P = 0.135).
Bean
Bean grain production (Fig. 5) was much lower for
both years compared with the farmer reported mean
production value of 1300 kg ha-1. This was mainly
due to heavy rains and diseases. The grain yield
ranged 13 to 320 kg ha-1 in 2007 and from 0 to
FC
-4.00
-2.00
0.00
2.00
4.00
6.00
8.00
10.00
δ15N
(‰)
GR
-4.00
-2.00
0.00
2.00
4.00
6.00
8.00
10.00
δ15N
(‰)
LP
-4.00
-2.00
0.00
2.00
4.00
6.00
8.00
10.00
δ15N
(‰)
PT
-4.00
-2.00
0.00
2.00
4.00
6.00
8.00
10.00
δ15N
(‰)
sample number
bean canavalia bean canavalia2007 2008
legume references
Fig. 4 Delta 15N of individual legumes and mean d15N of their
paired references on all sites in 2007 and 2008. The position of
the vertical line between years and between legumes varies for
each site according to the number of samples analyzed
454 Nutr Cycl Agroecosyst (2010) 88:447–462
123

470 kg ha-1 in 2008. Yields were not significantly
different between 2007 and 2008 (P = 0.832).
Canavalia
Canavalia biomass production (Fig. 5) varied
between 0 and 5,700 kg ha-1, with a mean value of
2,110 kg ha-1 in 2007. In 2008, the biomass pro-
duction varied between 290 and 4,330 kg ha-1, with
a mean value of 1,530 kg ha-1. Biomass did not
significantly differ between both years (P = 0.223)
and was not influenced by the site neither in 2007
(P = 0.070) nor in 2008 (P = 0.999). The removal
of canavalia biomass at the beginning of the dry
season in 2007 had no significant effect on the
production in 2008 (P = 0.066). The variation in
canavalia biomass production within GR and PT sites
was higher than the variation between sites.
N budgets
The components of the soil surface N budget and the
resulting balance for each treatment on each site are
presented in Table 3. Nitrogen input from mineral
fertilizers applied to maize was from 38 to
68 kg N ha-1. Mineral fertilizers and seeds contrib-
uted per site equally to M/B and M/C rotation. In
relation to the overall N inputs, Nfert represented on
average for both years 88% of the total N input in the
M/B rotation, and 69% in the M/C rotation. For both
years, Nseed represented from 3 to 6% of the total N
input. The contribution of symbiotic N2 fixation to the
M/B rotation did not exceed 8 kg N ha-1 (8 and 3% of
the total N input in 2007 and 2008, respectively),
whereas it was on average 22 and 17 kg N ha-1 (or 29
and 24% of the total N input) in the M/C rotation in
2007 and 2008, respectively. Nitrogen exported
through maize harvest ranged from 16 to
67 kg N ha-1. Canavalia represented an export of up
to 87 kg N ha-1 in 2007 and 39 kg N ha-1 in 2008
when the whole aboveground biomass was removed.
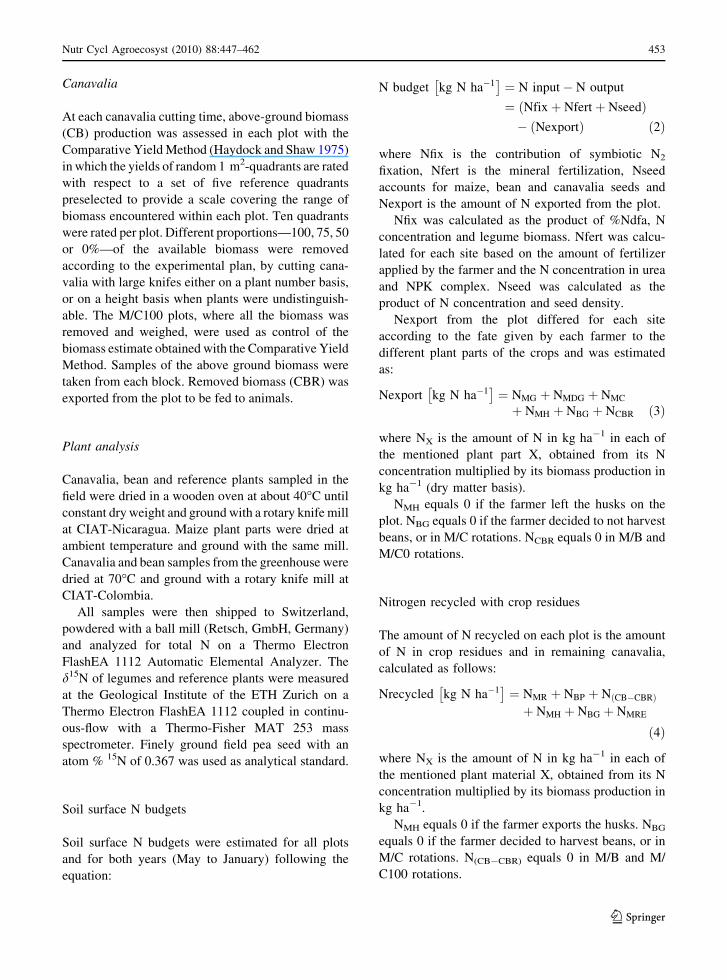
The M/C0 treatment showed in most cases the
highest N balance per site, with an average surplus of
33 kg N ha-1 in 2007 and 26 kg N ha-1 in 2008
(Fig. 6). In 2007, M/C100 treatments resulted in most
cases with a negative N balance with an average
depletion of 15 kg N ha-1. In 2008, the M/C100
balance was in average in equilibrium, with
2 kg N ha-1 in average. An average surplus of 14
and 17 kg N ha-1 in 2007 and 2008, respectively was
observed with the M/B treatment. The N balance for
both years was influenced by the site (P = 0.015 in
2007 and P = 0.003 in 2008). Treatments had a highly
significant effect on the N balance in 2007 (P = 0.000)
and a significant effect in 2008 (P = 0.006).
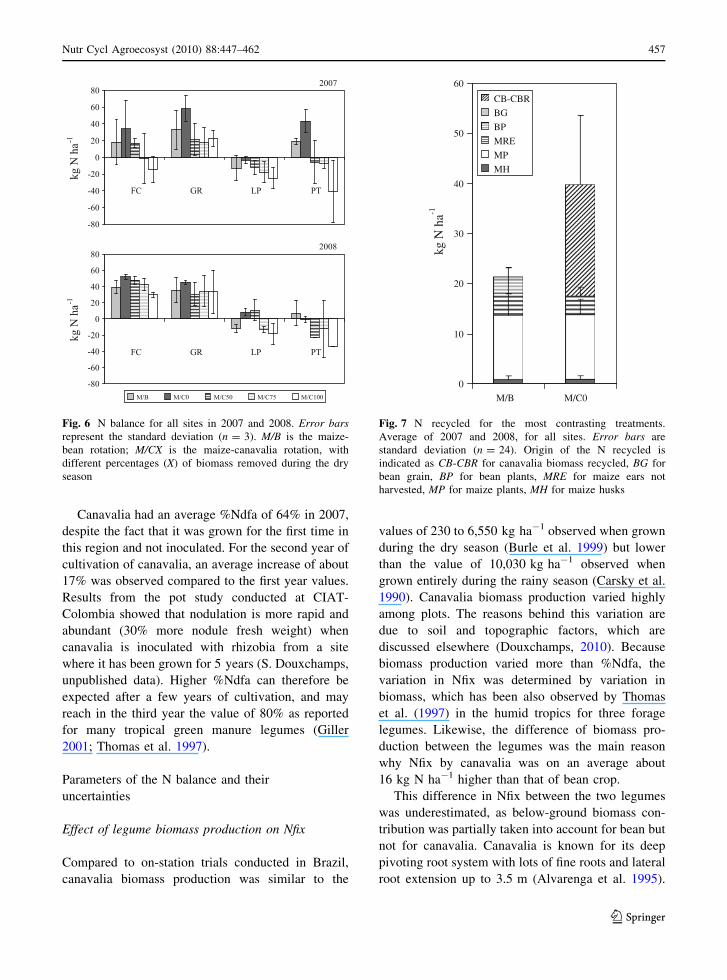
N recycled
For the most contrasting treatments M/B and M/C0,
the amount of N recycled and its source are presented
in Fig. 7. After maize harvest, about 18 kg N ha-1
were recycled on the plot with maize residues,
independent of the treatment, which represents about
Maize grain yield
0
1000
2000
3000
4000
5000
FC GR LP PT
kg h
a-1
Bean grain yield
0
100
200
300
400
500
FC GR LP PT
kg h
a-1
Canavalia biomass production
0
1000
2000
3000
4000
5000
6000
FC GR LP PT
kg h
a-1
2007 2008
Fig. 5 Maize grain production (n = 15), bean grain produc-
tion (n = 3) and canavalia biomass production (n = 12). Errorbars represent the standard deviation
Nutr Cycl Agroecosyst (2010) 88:447–462 455
123

32% of the overall maize N uptake. Nitrogen recycled
in the M/C0 rotation is higher than in the M/B
rotation. Bean residues contributed with about
3 kg N ha-1 to the N recycled. When canavalia was
not removed, an average value of 22 kg N ha-1 was
recycled on the plot with canavalia biomass.
Discussion
Symbiotic N2 fixation estimated with the 15N
natural abundance method
The suggested minimum difference of 2% between
reference plants and legumes (Unkovich et al. 1994)
was reached at all sites and for both M/B and M/C
treatments (Fig. 4). Standard deviation of all refer-
ence species d15N per site was in average 1.1%, and
was not higher than 2.2%, which shows that soil
d15N was relatively homogeneous on each site. For
canavalia, the B-value obtained was in the range
reported for tropical legume species used as forage or
cover crops (Unkovich et al. 2008). The value for
bean was slightly lower than -2.2 reported for
common bean by Unkovich et al. (2008).
Bean %Ndfa was higher than the average of 36%
reported by Herridge et al. (2008) for common bean
in farmers fields. Canavalia %Ndfa in 2007 was in the
range of the 57–69% reported by Giller (2001) for
Canavalia ensiformis.
Table 3 N budget by site, in kg N ha-1, means for each treatment (n = 3)
N input N output
Nfert Nseed Nfix Nexport 2007 Nexport 2008
Maize Beans Canavalia 2007 2008 NM NBG NCBR NM NBG NCBR
FC
M/B 60 0.4 3.2 1 (0) 2 (2) 47 (26) 0 (0) 22 (7) 5 (7)
M/C0 60 0.4 2.5 18 (10) 11 (4) 48 (34) 0 (0) 23 (7) 0 (0)
M/C50 60 0.4 2.5 21 (3) 18 (6) 52 (7) 15 (2) 23 (7) 12 (4)
M/C75 60 0.4 2.5 12 (11) 18 (2) 63 (28) 14 (12) 22 (7) 16 (2)
M/C100 60 0.4 2.5 21 (4) 19 (6) 67 (14) 31 (6) 29 (1) 24 (8)
GR
M/B 68 0.4 3.2 7 (1) 4 (0) 37 (24) 10 (1) 30 (16) 11 (1)
M/C0 68 0.4 2.5 26 (11) 11 (2) 38 (26) 0 (0) 34 (4) 0 (0)
M/C50 68 0.4 2.5 33 (20) 28 (6) 58 (18) 25 (16) 40 (21) 19 (2)
M/C75 68 0.4 2.5 32 (27) 21 (13) 50 (13) 36 (32) 37 (20) 21 (12)
M/C100 68 0.4 2.5 25 (17) 10 (6) 38 (11) 35 (23) 34 (25) 13 (7)
LP
M/B 38 0.4 3.2 8 (2) 0 (0) 55 (15) 7 (3) 47 (10) 1 (0)
M/C0 38 0.4 2.5 13 (3) 16 (6) 57 (6) 0 (0) 49 (1) 0 (0)
M/C50 38 0.4 2.5 13 (4) 14 (10) 56 (9) 10 (2) 34 (14) 10 (8)
M/C75 38 0.4 2.5 13 (4) 19 (12) 56 (13) 15 (3) 53 (6) 21 (14)
M/C100 38 0.4 2.5 13 (4) 18 (3) 59 (13) 20 (4) 53 (16) 25 (6)
PT
M/B 38 0.4 3.2 5 (4) 0 (0) 28 (8) 0 (0) 35 (16) 0 (0)
M/C0 38 0.4 2.5 18 (3) 8 (6) 16 (11) 0 (0) 47 (8) 0 (0)
M/C50 38 0.4 2.5 32 (4) 15 (0) 44 (20) 34 (8) 51 (15) 11 (0)
M/C75 38 0.4 2.5 24 (28) 24 (19) 38 (3) 34 (37) 51 (33) 26 (20)
M/C100 38 0.4 2.5 42 (18) 27 (0) 37 (22) 87 (30) 49 (12) 39 (0)
Standard deviation is given in parenthesis. M/B is the maize-bean rotation; M/C is the maize-canavalia rotation; NM is N export
through maize, i.e. through grains, damaged grains, cobs and husks; NBG is N export through bean grains; NCBR is N export through
canavalia biomass removed
456 Nutr Cycl Agroecosyst (2010) 88:447–462
123
Canavalia had an average %Ndfa of 64% in 2007,
despite the fact that it was grown for the first time in
this region and not inoculated. For the second year of
cultivation of canavalia, an average increase of about
17% was observed compared to the first year values.
Results from the pot study conducted at CIAT-
Colombia showed that nodulation is more rapid and
abundant (30% more nodule fresh weight) when
canavalia is inoculated with rhizobia from a site
where it has been grown for 5 years (S. Douxchamps,
unpublished data). Higher %Ndfa can therefore be
expected after a few years of cultivation, and may
reach in the third year the value of 80% as reported
for many tropical green manure legumes (Giller
2001; Thomas et al. 1997).
Parameters of the N balance and their
uncertainties
Effect of legume biomass production on Nfix
Compared to on-station trials conducted in Brazil,
canavalia biomass production was similar to the
values of 230 to 6,550 kg ha-1 observed when grown
during the dry season (Burle et al. 1999) but lower
than the value of 10,030 kg ha-1 observed when
grown entirely during the rainy season (Carsky et al.
1990). Canavalia biomass production varied highly
among plots. The reasons behind this variation are
due to soil and topographic factors, which are
discussed elsewhere (Douxchamps, 2010). Because
biomass production varied more than %Ndfa, the
variation in Nfix was determined by variation in
biomass, which has been also observed by Thomas
et al. (1997) in the humid tropics for three forage
legumes. Likewise, the difference of biomass pro-
duction between the legumes was the main reason
why Nfix by canavalia was on an average about
16 kg N ha-1 higher than that of bean crop.
This difference in Nfix between the two legumes
was underestimated, as below-ground biomass con-
tribution was partially taken into account for bean but
not for canavalia. Canavalia is known for its deep
pivoting root system with lots of fine roots and lateral
root extension up to 3.5 m (Alvarenga et al. 1995).
2007
-80
-60
-40
-20
0
20
40
60
80
FC GR LP PT
kg N
ha-1
2008
-80
-60
-40
-20
0
20
40
60
80
FC GR LP PT
kg N
ha-1
M/B M/C0 M/C50 M/C75 M/C100
Fig. 6 N balance for all sites in 2007 and 2008. Error barsrepresent the standard deviation (n = 3). M/B is the maize-
bean rotation; M/CX is the maize-canavalia rotation, with
different percentages (X) of biomass removed during the dry
season
0
10
20
30
40
50
60
M/B M/C0
kg N
ha-1
CB-CBR
BG
BP
MRE
MP
MH
Fig. 7 N recycled for the most contrasting treatments.
Average of 2007 and 2008, for all sites. Error bars are
standard deviation (n = 24). Origin of the N recycled is
indicated as CB-CBR for canavalia biomass recycled, BG for
bean grain, BP for bean plants, MRE for maize ears not
harvested, MP for maize plants, MH for maize husks
Nutr Cycl Agroecosyst (2010) 88:447–462 457
123
Besides the problems encountered in trying to
estimate or recover such a root system, the rapid
turnover of belowground tissues and root exudation
make difficult to determine below-ground N contri-
butions (Cherr et al. 2006). Below-ground N associ-
ated with or derived from roots can represent up to
50% of the total plant N of legumes (Herridge et al.
2008). To account for below-ground N, Unkovich
et al. (2008) suggested a multiplication by factor 2 for
fodder legumes, which would give for canavalia in
our trial an average Nfix of 44 kg N ha-1 in 2007 and
34 kg N ha-1 in 2008. For bean, only dry roots were
recovered, whereas exudates and root turnover were
not taken into account. By using the multiplication
factor of 1.4 suggested by Unkovich et al. (2008), the
maximum Nfix for bean in our trial would be of
11 kg N ha-1.
Effect of on-farm conditions on Nfert, Nseed,
and Nexport
Nfert and Nseed were distributed by hand, by
different farmers. Distribution of fertilizer and seed
was not as exact as when it is done by machines or in
on-station trials. As N contained in seeds remained
small compared to the other factors of the budget, its
potential variation had relatively small effect on the
N balance estimations. Likewise, plant density was
also somewhat heterogeneous between plots.
The estimation of Nexport by maize was also
affected by human factors. For example, people do
not enter the fields very carefully: they may drop ears
on the ground, or sometimes grab an appetizing
maize ear to eat on the way back home. This may be
one reason why plants with empty husks were found.
The amount of empty husks represented on average
6% of the good ears.
Therefore, the results from the different sites
should not be combined as one single effect of
canavalia when introduced on-farm, but rather be
seen as a range of possible responses, taking into
account farmers practices and their impacts on data
variability. One may argue that those conditions
render difficult to design a precise nutrient manage-
ment guidelines for the region. Uncertainties are
however part of budget calculations at all scales, and
there are various ways to deal with them in the
subsequent decision making process (Oenema et al.
2003). As farmers cannot afford taking risks, safety
margins have to be taken into account.
Interpretation of the balances
Both years and on all sites, increasing cutting
intensities of canavalia reduced the N balance. On
one hand, canavalia increased N input into the system
compared to M/B rotation, but on the other hand it
increased soil N depletion if completely removed.
Under M/B rotation, balance depended much on bean
yields. When beans were harvested, the balance
became negative, except in the sites where high
amounts of mineral fertilizer were applied (FC and
GR). The positive to neutral N balance on M/B is
mainly due to the low yields of common bean.
Assuming yields of 800 kg N ha-1 (FAO 2009), N
export through bean harvest would become about
30 kg N ha-1, which brings the balance estimate
to negative in most cases, with an average value
of -6 kg N ha-1 and a maximum value of
-40 kg N ha-1 on LP site. A positive N balance
for the M/B rotation does not mean that the system is
sustainable: lower bean yields mean lower or no
income. Likewise, the observation of a higher N
balance for all treatments of a site is due to reduced N
export by maize. For example, on FC site maize
yields were much higher in 2007 than in 2008, and
thus the balance resulted much lower. When export
through maize grain is not compensated by mineral
fertilizers, as on LP and PT sites, the N balance
becomes negative. If we would include the below
ground N contribution from the legumes as presented
above, the deficit observed in the M/C100 rotations
would be in five of eight cases compensated, with
an average balance of 18 kg N ha-1. The impact on
M/B rotations would be lower, and would not
compensate the deficit observed on LP site, which
would remain at about -10 kg N ha-1.
Effect of canavalia on maize yields
Many experiments have demonstrated the positive
effect of legumes on succeeding crops (Peoples and
Craswell 1992). However, in this study, the integration
of canavalia as green manure had no effect on the
following maize crop, probably because (1) one year of
rotation is not sufficient to observe an effect, (2) the
mineral fertilizer background is too high compared to
458 Nutr Cycl Agroecosyst (2010) 88:447–462
123
the N input by canavalia, and (3) other factors related to
management practices may have limited a productivity
increase. For example, MRE, i.e. the amount of ears not
harvested, represent a potential maize yield increase if
crop management is improved. On all sites and for the
2 years, MRE had a mean value of 350 kg ha-1, which
corresponds to a loss of 10% of good grain yield.
According to farmers, up to 50% of maize grain yield
losses can occur in the region due to this problem and
these losses do not include post harvest losses. Before
important changes in nutrient management as the
introduction of a legume in the rotation, the traditional
system could be improved by a few simple efforts.
There are opportunities to increase productivity with
improved management, e.g., concerning plant density,
timing of fertilizer application and weed control.
N recycled and rotation sequence
According to the design of the experiment, we
expected that in the green manure scenario M/C0,
the N of crop residues is recycled within the plot, as
no cows would enter the field to graze. However, in
practice, according to participatory workshops with
farmers, there will probably be only one type of M/C
rotation. Farmers will allow cows to graze totally
canavalia at the onset of the dry season. Regrowth,
which was not expected when the experiment was
designed, has been observed during the dry season
when plants are not cut down to the ground level i.e.,
after grazing, and may be used for soil improvement.
The former N recycled would in this case represent
the amount of N available for grazing during the dry
season. Rufino et al. (2006) reported for African dairy
studies that on average about 80% of the ingested N
is returned with manure. Assuming the same propor-
tion recycled for cows in our trial and all N excreted
being returned to the grazed plot, 33 kg N ha-1 on
average would be recycled through canavalia grazing,
under the form of faeces and urine. While the urine
fraction would fall on a single spot at high concen-
tration, the faeces fraction can be uniformly distrib-
uted on the plot surface by farmers. An efficient
animal manure management would therefore be
essential to maximize N recycling and compensate
the N deficit observed with M/C100 rotation.
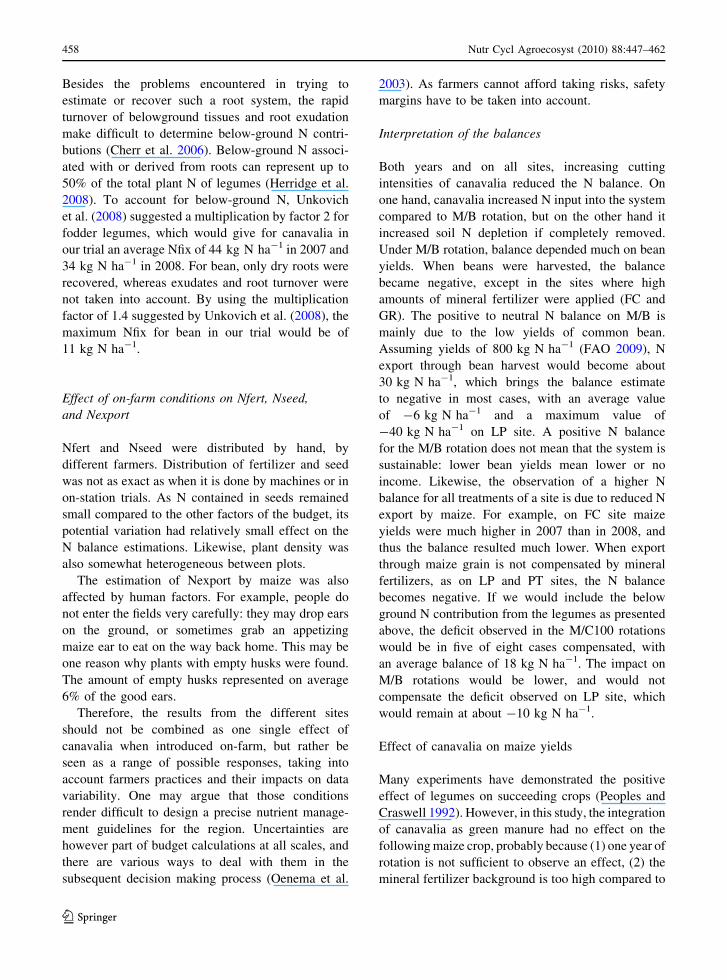
The proposed rotation sequence would therefore
be to alternate this most probable M/C rotation with
the M/B rotation: canavalia would grow on the area
not cultivated by beans (i.e. about 1 ha), and crops
would be exchanged the following year, i.e., on the
same area the sequence would be M/B-M/C-M/B-M/
C etc. (Fig. 8). In the traditional sequence, the
succession of M/B and M (maize alone) rotations
depletes N stocks over years, moreover on sites with
low mineral fertilizer applications. The alternative
sequence will build up N stocks year after year.
Moreover, canavalia can reduce erosion and decrease
weed pressure. The time until seeing an effect on
agricultural productivity depends on the biophysical
limitations of each site and the management options
chosen by the farmers. Canavalia yield is assumed to
be maintained over years. Legume yields can
decrease after a few years of cultivation due to pests
and diseases, as has been reported in other trials
(Bunemann et al. 2004). However, this has not yet
been observed with canavalia in a 6-year on-station
experiment where canavalia was planted on the same
plots every year (A. Schmidt et al., unpublished data).
Still, the proposed rotation sequence needs long term
testing on-farm. The use of models, once calibrated,
can also be useful in predicting the effects of rotation
sequences on soil fertility (Walker et al. 2008).
Limitations of the soil surface N budget approach
The underlying assumption of a nutrient budget is
that of a mass balance i.e. nutrient input to the system
minus nutrient outputs from the system equals the
change in storage within the system (Meissinger and
Randall 1991). However, soil surface budgets con-
sider soil as a black box, and do not provide
Traditional sequence
M/B M M/B M M/B M
Alternative sequence
M/B M/C M/C M/B M/B M/C
Year 1 Year 2 Year 3
…
…
Fig. 8 Traditional rotational sequences on the 2 ha cropping
area of a smallholder farm, and proposed alternative sequence
including canavalia. Bold area enlightens the rotation succeed-
ing on the same area. M/B is the maize-bean rotation, M/C is
the maize-canavalia rotation, M is maize alone
Nutr Cycl Agroecosyst (2010) 88:447–462 459
123

information on the fate or origin of any budget
surplus i.e. whether it is lost from the system or
stored in the soil (Watson et al. 2002). Due to
unaccounted N losses, like leaching and gaseous
losses, N balances are overestimated unless they
would be compensated by atmospheric N deposition.
Accurate data being unavailable for the study region,
atmospheric deposition was not included in the
budget and assumed to be equal for all farms. Surface
lateral nutrient flows, i.e. inputs and outputs by
sedimentation, erosion and runoff were also not
quantified. Despite the fact that those processes are
left out, soil surface budgets based on ‘‘easy-to-
measure’’ flows have proved their utility in providing
useful information to farmers and policy makers on
soil fertility and on the need for restoration (Adu-
Gyamfi et al. 2007; Rego et al. 2003), even in sloping
hillsides of the tropics (Briggs and Twomlow 2002).
These flows are also the easiest to manipulate to
influence the nutrient balances in the short term
(Bekunda and Manzi 2003). However, the estimation
of lateral nutrient flows and gaseous losses is
essential if an extrapolation of N budgets at landscape
level and for a longer time frame is envisaged
(Smaling et al. 1993). Finally, to predict how much N
can be expected from the use of canavalia over years,
an in-depth study on soil N fluxes is needed,
including a determination of the fertilizer value of
manure from cows fed with canavalia, an evaluation
of N losses and of the belowground contribution of
the legumes, and an assessment of the N minerali-
zation rate for the different soil types of the
Nicaraguan hillsides.
Conclusions
When used as green manure, canavalia represents a
net N input into the crop rotation due to symbiotic N
fixation. Still, mineral fertilizers are necessary to
maintain the N balance positive. Using canavalia as
forage depletes soil N, and should be compensated by
an effective return of animal manure on the plots. The
introduction of canavalia in the Nicaraguan hillsides
has the potential to improve agricultural production.
However, the time needed to visualize an effect on
crop productivity depends on the biophysical limita-
tions of each site and the management done by the
farmers.
Acknowledgments We warmly thank Don Felipe Calderon,
Don Gabriel Ruiz, Don Lorenzo Peralta and Don Pedro Torres,
the four farmers of Santa Teresa who participated in this study.
We also gratefully acknowledge fieldwork assistance by
Alexander Benavidez (INTA) and Noemi Uehlinger (ETH),
as well as samples preparation by Elbis Chavarria and Gonzalo
Borrero (CIAT). We thank two anonymous reviewers as well
as Prof. Dr. Georg Cadisch (University of Hohenheim,
Germany) for useful comments on an earlier version of the
manuscript. Financial support was provided by the North–
South Center of ETH Zurich.
References
Adu-Gyamfi JJ, Myaka FA, Sakala WD, Odgaard R, Vester-
ager JM, Hogh-Jensen H (2007) Biological nitrogen fix-
ation and nitrogen and phosphorus budgets in farmer-
managed intercrops of maize-pigeonpea in semi-arid
southern and eastern Africa. Plant Soil 295:127–136
Alvarenga RC, da Costa LM, Moura Filho W, Regazzi AJ
(1995) Potential of some green manure cover crops for
conservation and recuperation of tropical soils. Pesqui
Agropecu Bras 30:175–185
Ayarza M, Amezquita E, Rao I, Barrios E, Rondon M, Rubiano
Y, Quintero M (2007) Advances in improving agricultural
profitability and overcoming land degradation in savanna
and hillside agroecosystems of tropical America. In:
Bationo A, Waswa B, Kihara J, Kimetu J (eds) Advances
in integrated soil fertility management in sub-saharan
africa: challenges and opportunities. Springer, Dordrecht,
pp 209–229
Bekunda M, Manzi G (2003) Use of the partial nutrient budget
as an indicator of nutrient depletion in the highlands of
southwestern Uganda. Nutr Cycl Agroecosyst 67:187–195
Bindraban PS, Stoorvogel JJ, Jansen DM, Vlaming J, Groot
JJR (2000) Land quality indicators for sustainable land
management: proposed method for yield gap and soil
nutrient balance. Agric Ecosyst Environ 81:103–112
Boddey RM, De Moraes Sa JC, Alves BJR, Urquiaga S (1997)
The contribution of biological nitrogen fixation for sus-
tainable agricultural systems in the tropics. Soil Biol
Biochem 29:787–799
Boddey RM, Peoples MB, Palmer B, Dart PJ (2000) Use of the
15 N natural abundance technique to quantify biological
nitrogen fixation by woody perennials. Nutr Cycl Agro-
ecosyst 57:235–270
Bordin L, Farinelli R, Penariol FG, Fornasieri Filho D (2003)
Double crop - Common bean with upland rice, submitted
to rates of nitrogen fertilization after green cover under
no-tillage system. Bragantia 62:417–428
Briggs L, Twomlow SJ (2002) Organic material flows within a
smallholder highland farming system of South West
Uganda. Agric Ecosyst Environ 89:191–212
Bunemann EK, Smithson PC, Jama B, Frossard E, Oberson A
(2004) Maize productivity and nutrient dynamics in
maize-fallow rotations in western Kenya. Plant Soil
264:195–208
Burle ML, Lathwell DJ, Suhet AR, Bouldin DR, Bowen WT,
Resck DVS (1999) Legume survival during the dry season
460 Nutr Cycl Agroecosyst (2010) 88:447–462
123

and its effect on the succeeding maize yield in acid
savannah tropical soils. Trop Agricul 76:217–221
Carsky RJ, Reid WS, Suhet AR, Lathwell DJ (1990) Screening
legume green manures as nitrogen-sources to succeeding
non-legume crops: 3. The buried bag method. Plant Soil
128:275–282
Cherr CM, Scholberg JMS, McSorley R (2006) Green manure
approaches to crop production: a synthesis. Agronomy J
98:302–319
CIAT (2004) Annual report 2004. Tropical grasses and
legumes (IP5). Optimizing genetic diversity for multi-
purpose use, Cali, Colombia. 217 p
de Carvalho AM, Bustamante MMD, Sousa JGA, Vivaldi LJ
(2008) Decomposition of plant residues in latosol under
corn crop and cover crops. Rev Bras Cienc Solo 32:2831–
2838
Douxchamps S (2010) Integration of Canavalia brasiliensis in
the crop-livestock system of the Nicaraguan hillsides:
environmental adaptation and nitrogen dynamics. PhD
thesis No 18859, ETH Zurich, Switzerland
FAO (2009) http://faostat.fao.org/
Giller KE (2001) Nitrogen fixation in tropical cropping sys-
tems. CABI, Wallingford, 423 p
Haydock KP, Shaw NH (1975) The comparative yield method
for estimating dry matter yield of pasture. Aust J Exp
Agric Animal Husb 15:663–670
Herridge DF, Peoples MB, Boddey RM (2008) Global inputs
of biological nitrogen fixation in agricultural systems.
Plant Soil 311:1–18
Hogberg P, Nasholm T, Hogbom L, Stahl L (1994) Use of
15 N labeling and 15 N natural-abundance to quantify the
role of mycorrhizas in N-uptake by plants - Importance of
seed-N and of changes in the 15 N labeling of available-
N. New Phytol 127:515–519
IFAD (2009) http://www.ruralpovertyportal.org/web/guest/
country/statistics/tags/nicaragua
INETER (2009) http://www.ineter.gob.ni/Direcciones/meteo
rologia/
Krom MD (1980) Spectrophotometric determination of
ammonia - a study of a modified Berthelot reaction using
salicylate and dichloroisocyanurate. Analyst 105:305–316
MAGFOR (2008) Municipio de Condega—Subgrupos Tax-
onomicos. Ministerio Agropecuario y Forestal, Managua
Meissinger JJ, Randall GW (1991) Estimating nitrogen budgets
for soil-crop systems. In: Follett RF, Keeney DR, Cruse
RM (eds) Managing nitrogen for groundwater quality and
farm profitability. SSSA Madison, Wisconsin, pp 85–124
Nelson DW, Sommers LE (1982) Total carbon, organic carbon
and organic matter. Methods of soil analysis. American
Society of Agronomy, Madison
Oberson A, Nanzer S, Bosshard C, Dubois D, Mader P, Fros-
sard E (2007) Symbiotic N-2 fixation by soybean in
organic and conventional cropping systems estimated by
N-15 dilution and N-15 natural abundance. Plant Soil
290:69–83
Oenema O, Kros H, de Vries W (2003) Approaches and
uncertainties in nutrient budgets: implications for nutrient
management and environmental policies. Euro J Agron-
omy 20:3–16
Ojiem JO, Vanlauwe B, de Ridder N, Giller KE (2007) Niche-
based assessment of contributions of legumes to the
nitrogen economy of Western Kenya smallholder farms.
Plant Soil 292:119–135
Peel MC, Finlayson BL, McMahon TA (2007) Updated world
map of the Koppen-Geiger climate classification. Hydrol
Earth Syst Sci 11:1633–1644
Peoples MB, Craswell ET (1992) Biological nitrogen-fixa-
tion—investments, expectations and actual contributions
to agriculture. Plant Soil 141:13–39
Pfister F (2003) Resource potentials and limitations of a Nic-
araguan agricultural region. Swiss Federal Institute of
Technology, Zurich, p 139
Pinheiro JC, Bates DM (2000) Mixed-effects models in S and
S-PLUS. Springer, Berlin
R Development Core Team (2007) R: a language and envi-
ronment for statistical computing. R Foundation for Sta-
tistical Computing, Vienna
Rego TJ, Rao VN, Seeling B, Pardhasaradhi G, Rao J (2003)
Nutrient balances - a guide to improving sorghum- and
groundnut-based dryland cropping systems in semi-arid
tropical India. Field Crops Res 81:53–68
Rufino MC, Rowe EC, Delve RJ, Giller KE (2006) Nitrogen
cycling efficiencies through resource-poor African crop-
livestock systems. Agric Ecosyst Environ 112:261–282
Rufino MC, Tittonell P, Reidsma P, Lopez-Ridaura S, Hen-
gsdijk H, Giller KE, Verhagen A (2009) Network analysis
of N flows and food self-sufficiency - a comparative study
of crop-livestock systems of the highlands of East and
southern Africa. Nutr Cycl Agroecosyst 85:169–186
Said AN, Tolera A (1993) The supplementary value of forage
legume hays in sheep feeding - Feed-intake, nitrogen-
retention and body-weight change. Livest Prod Sci
33:229–237
Schloen M, Peters M, Schultze-Kraft R (2005) Canavalia
brasiliensis Mart. ex Benth
Schmidt A, Peters M, Franco L H and Schultze-Kraft R (2005)
Canavalia brasiliensis—a multipurpose legume for the
sub-humid tropics. In: Mara FPO’, Wilkins RJ, ‘t Man-
netje L, Lovett DK, RPAM, Boland TM (eds) XX inter-
national grassland congress: offered papers, Wageningen
Academic Publishers, pp 382
Shearer G, Kohl DH (1986) N2 fixation in field settings: esti-
mations based on natural abundance. Aust J Plant Physiol
13:699–744
Smaling EMA, Stoorvogel JJ, Windmeijer PN (1993) Calcu-
lating soil nutrient balances in Africa at different scales.2.
District Scale. Fert Res 35:237–250
Smyth J, Ayarza MA, Brizuela L, Orozco PP (2004) Testing
diagnosis of the NuMaSS expert system for N and P
applications in corn-based systems (eds) Integrated soil
fertility management in the tropics. TSBF annual report
2004, CIAT, Cali, Colombia
Tan ZX, Lal R, Wiebe KD (2005) Global soil nutrient deple-
tion and yield reduction. J Sustain Agric 26:123–146
Thomas RJ, Asakawa NM, Rondon MA, Alarcon HF (1997)
Nitrogen fixation by three tropical forage legumes in an
acid-soil savanna of Colombia. Soil Biol Biochem
29:801–808
Tiessen H, Moir J (1993) Characterisation of available P by
sequential extraction. In: Carter MR (ed) Soil sampling
and methods of analysis. CRC Press Inc, Boca Raton, pp
75–86
Nutr Cycl Agroecosyst (2010) 88:447–462 461
123

Unkovich MJ, Pate JS, Sanford P, Armstrong EL (1994)
Potential precision of the d15 N natural abundance
method in the field estimates of nitrogen fixation by crop
and pasture legumes in south-west Australia. Aust J Agric
Res 45:119–132
Unkovich MJ, Herridge DF, Peoples MB, Cadisch G, Boddey
RM, Giller KE, Alves B, Chalk PM (2008) Measuring
plant-associated nitrogen fixation in agricultural systems.
ACIAR Monograph No. 136, 258 pp
Vanlauwe B, Giller KE (2006) Popular myths around soil
fertility management in sub-Saharan Africa. Agric Eco-
syst Environ 116:34–46
Walker AP, van Noordwijk M, Cadisch G (2008) Modelling of
planted legume fallows in Western Kenya. (II) produc-
tivity and sustainability of simulated management strate-
gies. Agrofor Syst 74:143–154
Watson CA, Bengtsson H, Ebbesvik M, Loes AK, Myrbeck A,
Salomon E, Schroder J, Stockdale EA (2002) A review of
farm-scale nutrient budgets for organic farms as a tool for
management of soil fertility. Soil Use Manag 18:264–273
Zingore S, Murwira HK, Delve RJ, Giller KE (2007) Influence
of nutrient management strategies on variability of soil
fertility, crop yields and nutrient balances on smallholder
farms in Zimbabwe. Agric Ecosyst Environ 119:112–126
462 Nutr Cycl Agroecosyst (2010) 88:447–462
123