Nigerian Journal of Rural Sociology Vol. 16, No. 1, June 2015
110
Nigerian Journal of Rural Sociology Vol. 16, No. 1, June 2015 1 qqqqqqqqqqqqqqqqqq
-
Upload
khangminh22 -
Category
Documents
-
view
0 -
download
0
Transcript of Nigerian Journal of Rural Sociology Vol. 16, No. 1, June 2015
Nigerian Journal of Rural Sociology Vol. 16, No. 1, June 2015
1
qqqqqqqqqqqqqqqqqq

Nigerian Journal of Rural Sociology Vol. 16, No. 1, June 2015
2
ISSN 0189 - 7543
NIGERIAN
JOURNAL OF
RURAL SOCIOLOGY
Vol. 16 No. 1 JUNE, 2015
Published by:
The Nigerian Rural Sociological Association

Nigerian Journal of Rural Sociology Vol. 16, No. 1, June 2015
3
THE EDITORIAL BOARD
Editor-in-Chief
Ademola Kuponiyi
Dept. of Agricultural Extension and Rural Development, LAUTECH, Ogbomoso, Nigeria
Associate Editors
O. A. Adeokun
Olabisi Onabanjo University, College of Agricultural Sciences (Yewa Campus), Ayetoro, Ogun State,
Nigeria
Grace Adebo
Dept. of Agricultural Economics and Extension, University of Ado-Ekiti, Nigeria
A. J. Farinde
Dept. of Agricultural Extension and Rural Sociology, Obafemi Awolowo University, Jle-lfe, Nigeria
L. A. Akinbile
Dept. of Agricultural Extension and Rural Development, University of Ibadan, Ibadan, Nigeria
Editorial Advisers
Barnabas M. Dlamini
Faculty of Agriculture, University of Swaziland, Luyengo Campus, Swaziland
A.A.Jibowo
Department of Agriculture Education, University of Swaziland, Luyengo, Swaziland
Janice E. Olawoye
Dept. of Agricultural Extension and Rural Development, University of Ibadan, Ibadan, Nigeria
J. A. Kwarteng
Faculty of Agriculture, University of Cape Coast, Cape Coast, Ghana
Managing Editor
O. T. Yekinni
Department of Agricultural Extension and Rural Development, University of Ibadan, Ibadan, Nigeria
Editorial Policy
The purpose of the Journal is to provide an avenue for fostering creativity, scholarship and scientific
information in Rural Sociology, Agricultural Extension, Agricultural Economics, Human Ecology and
other related disciplines. Attention is focused on agricultural and rural development. Priority will
therefore be given to articles on rural society. The Journal will also accept methodological,
theoretical, research or applied contributions in these areas. Opportunity is open to scientists and
development experts within and outside the country to submit relevant papers for publication. The
journal basically follows a peer reviewed process in its assessment of manuscripts.

Nigerian Journal of Rural Sociology Vol. 16, No. 1, June 2015
4
INSTRUCTIONS TO CONTRIBUTORS
Manuscripts
Manuscripts submitted are not supposed to have been published or being considered for publication
elsewhere. Papers should be between 3,000 and 5,000 words. Only electronic copy should be
submitted; with 12 font size and Times New Roman font type and double line spaced. The TITLE of
the paper should be followed by the names, initials and address(es) of the author(s). An ABSTRACT
of about 150 words which reports the research problem, purpose, method, results and conclusion
should be provided. Keywords consisting of four to five words should be provided after the abstract.
Articles should be written in English only. Research papers, review articles, case studies, postgraduate
projects are welcome. Submit to the Editor-in-Chief through the journal’s website
http://www.journal.nrsa.org.ng.
TABLES, FIGURES and Other illustrations should be numbered consecutively and located
appropriately within texts after the point of first mention. However, authors should ensure that table
does not spill over to the next page. REFERENCE AND LEGENDS TO ILLUSTRATIONS should
be placed appropriately within the body of the paper and authors should ensure that they are in camera
ready form. Guidelines on illustrations should follow the American Psychological Association [APA]
Publication Style Manual.
FOOTNOTES should be avoided as much as possible. Acknowledgements should appear after
Conclusion before the reference list.
REFERENCES should be cited within the text as follows: Abiodun (2009) found that ................... On
the other hand, after stating the findings, the author's name and year of publication can be inserted; for
example, income was positively correlated with educational attainment (Abiodun, 2009). The
references should then appear in alphabetical order of the names of first authors in the list of
references. For the reference list, the APA Publication Style Manual should be adopted. E.g. Abiodun,
J. R. (2009) for single authored paper and Abiodun J. R. and Alabi, O. E. (2009) for double authored.
Reprints: These will be provided on request from authors.

Nigerian Journal of Rural Sociology Vol. 16, No. 1, June 2015
5
CONTENTS
SN Paper title Author(s) Pages
1 An exploration of emerging corrupt practices
of textile dealers identified by consumers in
Oyo state, Nigeria
Bamidele, T. A. 7 – 10
2 Analysis of sharp practices involved in
mechanisation processes amongst arable crop
farmers in Ogbomoso agricultural zone of
Oyo state, Nigeria
Bamigboye, E. O. and
Oladosu, I. O.
11 – 14
3 Approaches to overcoming corruption in the
Nigerian agricultural sector
Enwelu, I. A. 15 – 22
4 Arable crop farmers’ characteristics affecting
the utilisation of Information and
Communication Technology for Agricultural
Marketing Information in Oyo State, Nigeria
Adeniyi, R. T. and
Yekinni, O. T.
23 – 29
5 Assessment of sharp practices among farmers
in cocoa farming in Nigeria: Implications to
sustainable improvement of cocoa production
and trade
Famuyiwa, B. S.,
Oduwole, O. O., Malik,
M. B. and Williams, O. A.
30 – 37
6 Capital assets as building blocks for resiliency and sustainable livelihoods among Rural dwellers in Hadejia-Nguru Wetlands, Nigeria
Tafida, A. A. and Galtima, M.
38 – 42
7 Corrupt practices in the Growth Enhancement
Support Scheme (GESS): Empirical
evidences from farmers in Osun and Ondo
state
Lawal, B. O. and
Oyedokun, M. O.
43 – 49
8 Crop farmers’ perception of growth
enhancement scheme in curbing corruption in
inorganic fertilizer delivery in Odeda local
government area of Ogun state Nigeria
Oyetoro, J. O., Rahman,
S. B., Oladipo, S. O. and
Jolayemi, J. O.
50 – 54
9 Effect of NYSC/MDGS/WAP agro-enterprise
loan on beneficiaries’ well-being in South
west Nigeria
Tijani, S. A. and Ayinla,
M. A.
55 – 60
10 Effect of training on the use of modern
beekeeping technologies in Oyo state,
Nigeria
Eforuoku, F. and Thomas,
K. A.
61 – 66
11 Effectiveness of e-wallet scheme towards
curbing corrupt/sharp practices in agricultural
input accessibility by smallholder farmers in
Kano State, Nigeria
Yusuf, O. J., Abdullahi,
K. A. and Haruna, S. K.
67 – 75
12 Incidence of sharp practices in GES
redemption centres of Oyo state
Ladele, A. A, Oyelami, B.
O.
76 – 82

Nigerian Journal of Rural Sociology Vol. 16, No. 1, June 2015
6
SN Paper title Author(s) Pages
13 Perceived effect of bribery and corruption at
the grassroots: the case of local government
employees in southern Taraba, Nigeria
Lawi, B. D. and Musa, N.
Y.
83 – 86
14 Perception of corrupt practices among
extension agents of Oyo State Agricultural
development Programme (OYSADEP)
Alaka, F. A. and
Ashimolowo, O. R.
87 – 92
15 Rural women’s perception of effectiveness of
food nutrition and health
technologies/information and corruption-
induced constraints under Fadama III in Edo
state, Nigeria
Koyenikan , M. J. and E.
E. Obar
93 – 98
16 Rural women’s perception of market-related
sharp practices in Kwara state, Nigeria
Onikoyi, M. P., Olutegbe,
N. S. and Adeyemo, A. A.
99 – 105
17 Utilisation of Trade Route Incident Mapping
System (TRIMS) as an advocacy tool against
non-tariff payments among traders in Ogun
state, Nigeria
Jonathan, A. A. and
Oyelami, B. O.
106 – 110

Nigerian Journal of Rural Sociology Vol. 16, No. 1, June 2015
7
AN EXPLORATION OF EMERGING CORRUPT PRACTICES AMONG TEXTILE DEALERS IN
EGBEDA LOCAL GOVERNMENT AREA OF OYO STATE, NIGERIA
Bamidele, T. A. Department of Family Nutrition and Consumer Sciences, Faculty of Agriculture,
Obafemi Awolowo University, Ile-lfe, Osun state
ABSTRACT
Rural dwellers as textile consumers are prone to the pandemic corrupt practices of dealers involved in textile
manufacturing and merchandising. The need to ensure that consumers get value for money spent on textile
materials led to this study. The study investigated the corrupt practices among textile dealers in rural areas of
Oyo State. Structured interview schedule was used to elicit information from 216 consumers in Kukumoda
village, in Oyo State using purposive sampling technique. Data collected were analysed using descriptive
statistics. The results revealed that the respondents had a mean age of 35.5 years, 66.6% were females and
70.3% were married. Educational level of respondents shows that majority were non-literate. Analysis of the
corrupt practices of textile dealers shows that all (100%) of the respondents had experienced colour bleeding,
sub- standard and counterfeit textiles materials (100%). Other major corrupt practices were: wrong branding
and labelling (97.3%), measurement cheat (85.1%), exchange of textiles for low quality after payment (77.8%)
while 52.5% had suffered from used imported textiles not subjected to health check. Consequences of corrupt
practices of textile dealers include: frequent replacement of textiles and loss of confidence in locally made
textiles among others. This shows that consumers in the study area made choices in the consumption of textiles
based on false claims by dealers. There is an urgent need for legislation to provide consumers with more
reliable and comprehensive information about the content and the composition of the textile materials. Standard
Organization of Nigeria (SON) should be empowered to penalize erring manufacturers. Keywords: Rural dwellers, textiles, consumers, corrupt practices, dealers.
INTRODUCTION
Textile is an indispensable material widely used in every society for different purposes primarily for covering one’s nakedness. Fibre according to Jeffreys (2006) which is the major raw
material used in the production of textiles undergoes series of processes such as carding, spinning, twisting, weaving and sometimes, dyeing to produce textiles. Until recently, textiles were
basically produced from cotton. However, recent development shifted attention from cotton to synthetic-based clothing and this has left textile consumers with little or no information about
textile materials (Damalie 2009). At every stage of textile production, dealers could engage in unethical behaviour which is a precursor to fraud. The experience of consumers in recent times in the
consumption of textiles could be described as terrible and one that could endanger the safety of human life (Okunola, Lawal and Kehinde, 2014). Corruption in textiles production and
merchandising arises from the failure of manufacturers and retailers to adhere to the expected code of business conduct or specifications established by various nations across the world (Otaru, 2012). Burns et al (1997) states that several countries, including the US and the UK, are committed to rolling out enforcement programmes, with increasingly stringent standards as well as stiff
penalties that would send shock waves to clothing manufacturers as well as retailers; however, the story appears to be different in Nigeria. Corruption among textile dealers is a specific form of
misconduct engaged in by textile dealers to obtain financial benefits in textile manufacturing and
distribution instead of consumers obtaining value
for money as far as textile purchases are concerned (Jeffreys 2006). Robust evidence as declared by (NAFDAC, 2008) showed that many consumers of the above
mentioned essential material have been noted to have experienced varying degree of cheating, hurts, and short changing in the hands of numerous corrupt textile dealers. These false claims of the
manufacturers and sellers appear to have led consumers into perplexity as far as purchases are concerned (Bello-Imam 2005). Generally, textile consumers make choices based on the false claims
of manufacturers and sellers. As consumers become less tolerant of false claims of the manufacturers, efforts must be geared towards identifying these corrupt practices as well as
curbing same in the textile sector. Dearth of empirical research on the corrupt practices of textile dealer necessitated the study. This study therefore came to being as a response to this with
objectives of cross-examining the experiences of the victims of this incongruity through the dimension that the fraudulent practices is taking, corrupt practice experience of consumers in the consumption of textile materials, and the consequences of these deceptive acts on the consumers and the country at large. Therefore, the study explores the sharp
practices of textile dealers as identified by textile consumers in Kukumoda village in Oyo State so as to guarantee and help consumers to make informed buying.

Nigerian Journal of Rural Sociology Vol. 16, No. 1, June 2015
8
METHODOLOGY
The study was carried out in Kukumoda village, Egbeda Local Government Area, Ibadan in Oyo State. The residents of the Local Government Area are Yoruba and other tribes from various parts
of the country. The people are of Christianity, Islamic and traditional religious background and are predominantly farmers, civil servants and traders. Part of the Local Government assumes urban status as it seats around Ibadan International Airport. The selection of the village was based on the socio-economic status of the people and their accessibility to major textile markets in the city. To
evaluate false claims of the textile dealers as experienced by the consumers and consequences of such practice, structured interview schedule was used to elicit information from two hundred and
sixteen purposively selected respondents. Respondents whose garments were adjudged B-grade garments and textiles with print failure were selected at different locations in the village as this would offer a better statistical and geographical coverage of corrupt experience of rural dwellers as far as textile consumption is concerned. Information such as age, sex marital status,
occupation of respondents, types of textiles consumers consume, whether or not sharp practices take place in the textile sector, corrupt practices respondents experienced and consequences of such
act on the consumers and country at large were collected from respondents. Data collected were analyzed using descriptive statistics in form of frequencies and percentages.
RESULTS AND DISCUSSION
Data in Table 1 show personal characteristics of respondents. Respondents’ ages ranged between
below 30 and above 40 years with a mean of 35.5years and standard deviation 7.1607. In addition, 62.5% of respondents were between 31 and 35 years and females 66.7%. Marital status
revealed that 70.3% were married, 34.7% had no formal education but 19.0% had completed tertiary education. Also, 19.9% of respondents were students, Farming (27.8%), petty trading (33.3%)
and civil service (19.0%). Findings revealed that more than have of the respondents were youth with females constituting majority of the study population. A plausible explanation could be that women take care of domestic matters in the house in which buying of clothes is not excluded. In addition, the consumers cut across educated and non-educated although educated constituted a
slightly higher percentage compared to the non-educated ones as having education would hone respondents’ knowledge of fabric identification.
Table 1: Personal Characteristics of Respondents
Socioeconomic characteristics
Frequency Percentage
Age (yrs) < 30 31 - 35
36 - 40 >40
19 135
25 37
Mean=35.5
8.8 62.5
11.6
17.1
SD= 7.1067
Sex
Male
Female
72
144
33.3
66.7
Marital Status
Single Married
64 152
29.6 70.3
Educational level
None Primary Secondary
Tertiary
75 41 59
41
34.7 19.0 27.3
19.0
Occupation
Schooling Farming Petty Trading
Civil service
43 60 72
41
19.9 27.8 33.3
19.0
Source: Field survey, 2014
Data in Table 2 show pattern of fraudulent practices of textile dealers as identified by the
consumers. From the table, all (100%) of the respondents attested that textile dealers use low quality dye for printing textiles which crocks or bleeds easily, false guaranteeing, mislabelling and branding (93.9%), wilful importation of substandard quality textiles that did not conform to specifications (100%) and 99.1% textiles not subjected to health check. In addition, 88.9% of
respondents declared that sellers altered their measuring tapes from 36 inches to 35 inches, 79.2% reported wilful measurement cheating of the amount of fabric measured and all the respondents
indicated that textile dealers exchanged textiles for low quality materials after payment. Findings revealed that textile dealers engaged in various corrupt practices to deceive the consumers and this has given rise to the tradition of mutual suspicion among the consumers and sellers in terms of the sincerity in correctness of measuring tools being used (Odo, 2015). The attendant result of this is
gradual destruction of loyalty, which in the long run will impact negatively on the developmental process of the country if allowed to continue unrestrained and increased health problems from
unclean imported used clothing.

Nigerian Journal of Rural Sociology Vol. 16, No. 1, June 2015
9
Table 2: Corrupt practice of textile dealers
identified by respondents
Corrupt Practices Frequency Percentage
Use of low quality
Paint for printing
216 100
False guaranteeing,
mislabelling and
branding
203 93.9
Importation of sub
standard textiles
216 100
Importation of used
clothing not subjected
to health checks
214 99.1
Alteration of
measuring tool
192 88.9
Measurement cheat 171 79.2
Exchange of material
for low quality after
payment
216 100
Clothing purchased
Ankara 216 100
Tie-dye/batik 139 64.4
Used imported clothing 119 55.1
Cut and sew materials 211 97.7
Source: Field survey, 2014
Corrupt practices as experienced by consumers are presented in Table 3. From the Table all (100%)
of the respondents had experienced colour crocking/bleeding, 100% sub standard and counterfeit textiles materials, 97.2% had bought falsely guaranteed and mislabelled textiles while
85.2% had suffered measurement cheat In addition, 77.8% had experienced exchange of textiles for low quality material after payment and 52.8% had chosen textiles that were not subjected to health
check. Among the consumers, the range of textiles mostly purchased include Ankara (100%), tie
dye/batik-adire (64.4%), Used imported clothing (55.1%) and (97.7%) cut and sew. However,
ankara, adire and cut and sew materials constituted the most cited textiles where the consumers reported experiences of fraudulent of practice. Overall, findings revealed the existence of fraudulent practices in the production and selling of textiles and since clothing is a basic need of humans, consumers purchased textiles inspite of the sharp practices of textile dealers in the study
area as covering of one’s nakedness is a necessity. Table 3: Corrupt Practice Experience of Respondents
Corrupt experience Frequency Percentage
Colour
crocking/bleeding
216 100
Sub- standard quality 216 100
Corrupt experience Frequency Percentage
textiles
False guaranteeing and
Mislabelling
210 97.3
Measurement cheat 184 85.2
Exchange of material
for low quality after
payment
168
77.8
Hazard from imported
used clothing
114
52.8
Source: Field survey, 2014
Results in Table 4 show the consequences of the fraudulent practices of textile dealers both on the consumers and the country at large as identified
by the consumers. From the Table, all (100%) of the respondents had frequently replaced textiles at short intervals and had led to waste of money. Also, 100% of the respondents had met with disappointment in the choice of textiles made, 91.7% had suffered health hazards arising from the importation of unclean used clothing and 99.1% had lost interest in made in Nigeria textiles. In
addition, 96.8% of respondents stated that fraudulent practices of textiles dealers could led to reduction in export earnings which could portend danger for the country. These fraudulent practices
have led to a loss of interest in textiles made in Nigeria by the international community and drastic reduction in the export earnings of the country and had increased the consumption of used imported textiles which has increased health problems of consumers (Oyinola, 2011). Table 4: Consequences of the Corrupt Practices on the Consumers and the Country
Effects Frequency Percentage
Frequent replacement of
textiles
216 100
Waste of money 216 100 Loss of confidence/ Disappointment
216 100
High risk of health problems
198 91.7
Loss of interest in Nigerian textiles
214 99.1
Reduction in export earnings
209 96.8
Source: Field survey, 2014
CONCLUSION
Discovering sharp practices among textile dealers shows that corruption exists in every facet of human undertaking and not necessarily events that are peculiar to public sector and public
officials. It is obvious that the absence of straightforward and effective political self-control to ensure that the menace of corruption is curtailed at the higher level in Nigeria has provided a fertile
Nigerian Journal of Rural Sociology Vol. 16, No. 1, June 2015
10
ground for the same to breed and manifest at the
lower level as obtained in the textile sector.
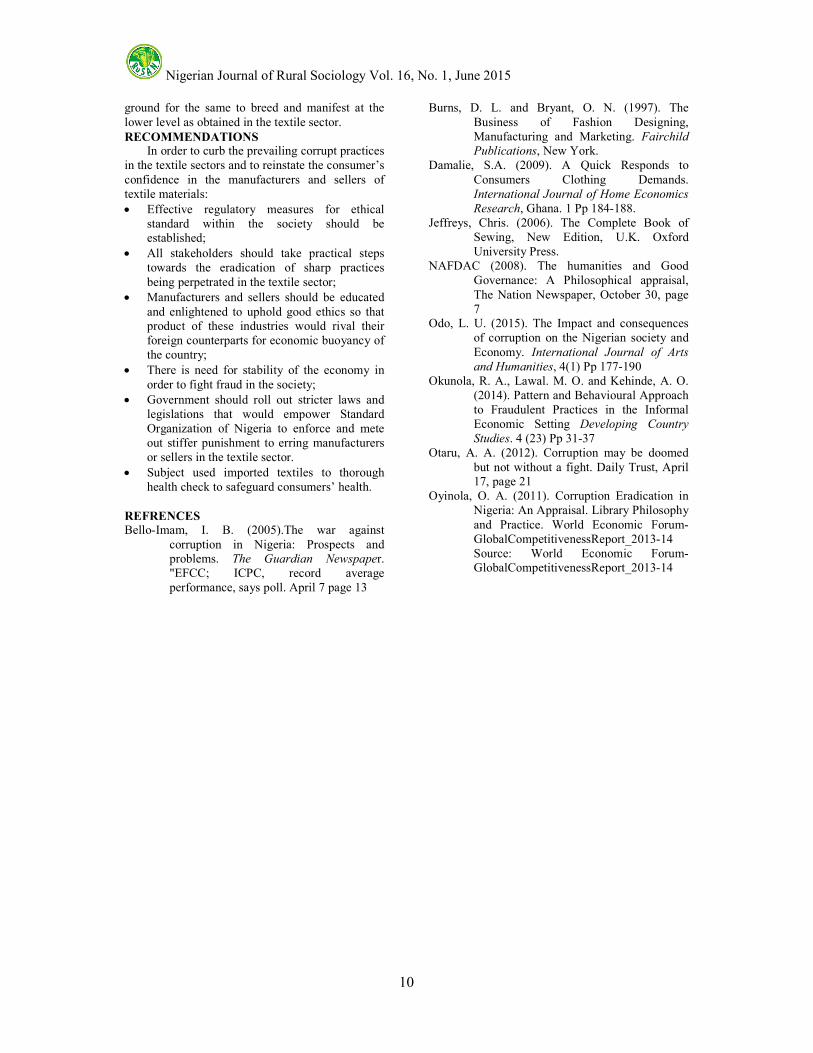
RECOMMENDATIONS In order to curb the prevailing corrupt practices in the textile sectors and to reinstate the consumer’s
confidence in the manufacturers and sellers of textile materials:
• Effective regulatory measures for ethical standard within the society should be established;
• All stakeholders should take practical steps towards the eradication of sharp practices
being perpetrated in the textile sector;
• Manufacturers and sellers should be educated
and enlightened to uphold good ethics so that product of these industries would rival their foreign counterparts for economic buoyancy of the country;
• There is need for stability of the economy in
order to fight fraud in the society;
• Government should roll out stricter laws and legislations that would empower Standard Organization of Nigeria to enforce and mete out stiffer punishment to erring manufacturers or sellers in the textile sector.
• Subject used imported textiles to thorough health check to safeguard consumers’ health.
REFRENCES
Bello-Imam, I. B. (2005).The war against
corruption in Nigeria: Prospects and problems. The Guardian Newspaper. "EFCC; ICPC, record average performance, says poll. April 7 page 13
Burns, D. L. and Bryant, O. N. (1997). The
Business of Fashion Designing, Manufacturing and Marketing. Fairchild
Publications, New York. Damalie, S.A. (2009). A Quick Responds to
Consumers Clothing Demands. International Journal of Home Economics
Research, Ghana. 1 Pp 184-188. Jeffreys, Chris. (2006). The Complete Book of
Sewing, New Edition, U.K. Oxford University Press.
NAFDAC (2008). The humanities and Good Governance: A Philosophical appraisal,
The Nation Newspaper, October 30, page 7
Odo, L. U. (2015). The Impact and consequences of corruption on the Nigerian society and
Economy. International Journal of Arts
and Humanities, 4(1) Pp 177-190 Okunola, R. A., Lawal. M. O. and Kehinde, A. O.
(2014). Pattern and Behavioural Approach to Fraudulent Practices in the Informal Economic Setting Developing Country
Studies. 4 (23) Pp 31-37 Otaru, A. A. (2012). Corruption may be doomed
but not without a fight. Daily Trust, April 17, page 21
Oyinola, O. A. (2011). Corruption Eradication in Nigeria: An Appraisal. Library Philosophy
and Practice. World Economic Forum-GlobalCompetitivenessReport_2013-14 Source: World Economic Forum-GlobalCompetitivenessReport_2013-14
Nigerian Journal of Rural Sociology Vol. 16, No. 1, June 2015
11
ANALYSIS OF SHARP PRACTICES INVOLVED IN MECHANISATION PROCESSES AMONGST
ARABLE CROP FARMERS IN OGBOMOSO AGRICULTURAL ZONE OF OYO STATE, NIGERIA
Bamigboye, E.O1 and Oladosu, I.O2
1. Department of Agricultural Extension and Rural Development, Obafemi Awolowo University, Ile-Ife 2. Department of Agricultural Extension and Rural Development, Ladoke Akintola University of Technology,
Ogbomoso
ABSTRACT
Agricultural Mechanization (AM) is the application of tractorisation technology into the field of agriculture to
improve agricultural output. The study investigated sharp practices involved in mechanisation processes
amongst arable crop farmers in Ogbomoso Agricultural Zone of Oyo State, Nigeria. Specifically, the personal
characteristics of respondents were described, various forms of sharp practices identified, the extent of sharp
practices on farmers’ production level examined and measures used to curb the sharp practices were identified.
A total number of 150 arable crop farmers were selected using multistage sampling technique, and requisite
information was collected using interview schedule. Frequency counts, percentages, Mechanisation process
Sharp Practices Used Index (MPSP UI) was used to access the extent of sharp practices on the arable crop
farmers. Majority (80%) of the arable crop farmers were male, only 52% had formal educational experiences at
varying levels and about 60% farmed between 5 to 8 hectares of land. Results further showed most common
sharp practices of mechanisation processes as improper farm ploughing, collection of money and refusal to go
to farmers’ farm, ploughing land only to get to a stage and disguise as if the tractor is faulty. Inability of the
arable crop farmers to ascertain the accurate farm size measurement (64%) was a major reason for being a
victim. The extent of MPSP revealed that Ploughing of land only to get to a stage and disguise as if the tractor
is faulty ranked first in the MPSPs (30.0%) among the five MPSP considered in the study It was concluded that
arable crop farmers should be educated on the correct farm size measurement to forestall future cheats, which if
not curbed can hinder optimum farm earnings.
Key words: Farm size measurement, arable crop farmers, sharp practices, farm mechanisation
INTRODUCTION
Agricultural modernisation is an inevitable process of social development, with agricultural
mechanisation as one of its important phases. According to Manta and Aduba (2013), Agricultural Mechanisation (AM) was defined as the application of tractorisation technology into the
field of agriculture to improve agricultural output. It is a deliberate or conscious departure from peasant and subsistence agriculture into commercial agriculture. This process also involves
the development and management of machines for field production, water control, material handling as well as post-harvest operations (Rahman and Lawal, 2003).
In Nigeria, farmers’ demand for agricultural machinery and their use to a great extent determine their agricultural productivity and level of awareness. Anthony (1995) was of the opinion that
if AM is implemented in the right way, it will have a considerable effect on agricultural productivity thus increasing peasant farmers’ output while optimising input cost. This in a way was supported by the work of Manta and Aduba (2013). (2003) that human being are limited to less than 0.1 KW continuous power output. Some researchers have conducted field studies
on agricultural bush clearing in the tropics. For instance Anazodo (1986) developed appropriate methods and equipment for agricultural land clearing and development in Nigeria. Oni and
Adeoti (1994) conducted field experiment to determine the effects of mechanised land clearing
and tractor traffic on agricultural soils and crop growth. Okore, et al. (2006) carried out field studies on impact of land clearing methods and
cropping systems on labile Soil C and pools in the Humid zone Forest of Nigeria. Also, Fagbemi and Gana (1994) attempted to produce guidelines for agricultural bush clearing in
Nigeria. They include processes, operational techniques, specifications and factors to consider in mechanized agricultural bush clearing. Couper, 1996 working under the International Institute for
Tropical Agriculture, produced a guide for agricultural land clearing in the tropics. Although these works are useful and relevant but they failed to give a comprehensive approach to mechanised
agricultural bush clearing, and why many of the farmers are not breaking even, one of the major reasons is the insincerity on the part of the tractor operators which this present work conceived as
sharp practices. Sharp practices could be defined as a clever way of cheating on an individual using the ignorance of the other party. Most farmers in Ogbomoso Agricultural Zone of Oyo State are aware of mechanisation technologies and farming that are most suitable for their agricultural environments The general objective of this study was to
analyse sharp practices that are involved in mechanisation processes among arable crop farmers in Ogbomoso Agricultural Development Zone of Oyo State, Nigeria. The specific objectives
included to:

Nigerian Journal of Rural Sociology Vol. 16, No. 1, June 2015
12
(1) describe the personal characteristics of the
arable crop farmers, (2) identify various sharp practices in
mechanisation processes (3) determine extent of involvement in sharp
practices of mechanisation processes on arable crop farmers production level
METHODOLOGY
The study was conducted in Ogbomoso Agricultural Zone, Oyo State, Nigeria between April and May 2015. A multi-stage sampling procedure was used for sample selection. At the
first stage, Ogbomoso Agricultural Zone was purposively selected for the study due to the predominance of arable crop farmers in the zone. The population of the study were all arable crop
farmers in the selected local governments. The second stage involved a random selection of three Local Government Areas of the Zone, Orire, Ogo oluwa and Surulere that have a high concentration of arable crop farmers. At the third stage, 50 farmers were randomly selected in each of the LGAs used for the study. A total of 150 respondents were used for the study.
Data for the study were collected through the use of validated structured interview schedule. Frequency distribution, percentages, means and standard deviation were used to describe the data.
Mechanisation process Sharp Practices Used Index (MPSP UI) was used to assess the extent of sharp practices on the arable crop farmers.
RESULTS AND DISCUSSION
Personal characteristics of respondents
Results revealed that most arable crop farmers in the study area were male. This is especially true
since 80.0% of the arable crop farmers were male. Majority (72.7%) were between ages of 40-59 years. Two-third (69.3%) of the arable crop farmers were Christians. Majority (86.7%) were married,
8.7% single and 4.7% were widowers. This high population of married respondents is in conformity with the local culture identified by Jibowo (2003) that majority of adult populations in southwestern
Nigeria are married. This could suggest additional farm labour from children and spouses. The average household size was 6.54±2.87 persons. Educational level of respondents showed that 52% had educational experiences at varying levels. Though respondents in the study area appear not to be highly educated, they may not have problem appreciating new farm ideas and innovations when
disseminated to them. (Table 1).
Table 1: Distribution of respondents by age, sex,
religion, marital status, household size and educational level; n=150
Variable Frequency Percentage
Age 20-29 8 5.3
30-39 27 18.0 40-59 109 72.7 Above 60 6 4.0
Sex Male 120 80 Female 30 20
Religion Christianity 104 69.3
Islam 35 23.3 Traditional adherence 8 5.3 No affliction 3 2
Marital status
Single 13 8.7 Married 130 86.7 Widowed 7 4.7
Household size 1-4 45 30.0 5-8 89 59.3 9-12 12 8.0 13-20 2 1.3
Above 21 1 0.7
Educational level Pry education only 18 12.0 Secondary education 60 40.0 No formal education 72 48.0
Source: Field survey, 2015
The result in Table 2 shows that 53.3% of the arable crop farmers had farm size between 5-6.99 hectares. The large farm size of the arable crop farmers shows the true characteristic feature of commercial farming as involving large farm size. It can be inferred from the study that farmers in the study area are experienced since more than half of
them 61.3% indicated having up to 10years experience in arable crop production. Table 2 further shows that land acquisition is mostly by lease and that 68.6% had functional contact with
extension agents. This finding is in line with the report of Bamigboye (2015) who reported that only 60% of farmers actually had functional contact with an extension agent and that other contacts are not functional in Ekiti State. Table 2: Distribution of respondents by farm size, farming experience, method of acquiring land and functional contact with extension agents; n=150
Variables Frequency Percentage
Farm size (ha) ˂ 1 10 6.7 1-2.99 15 10.0
3.0-4.99 35 23.3
5-6.99 80 53.3
7 and above 10 6.7

Nigerian Journal of Rural Sociology Vol. 16, No. 1, June 2015
13
Variables Frequency Percentage
Farming experience
1-5 8 5.3 6-10 50 33.3 10 and above 92 61.3
Method of acquiring land
Family inheritance 42 28.0 Outright purchase 18 12.0 Lease 85 56.6 Gift 5 3.3
Functional contact with
extension agents
Yes 103 68.6 No 47 31.3
Source: Field survey, 2015
Farmers’ awareness about MPSPs
Result in Table 3 shows that about 68.0% were aware about MPSPs whereas 40.0% claimed that they were not aware of any MPSPs. The implication is that many of the farmers may not be interacting with other farmers in the neighbourhood and consequently become the victims of sharp practices.
Table 3: Farmers’ awareness about MPSPs
Variable Frequency Percentage
Yes 102 68.0 No 48 32.0
Source: Field survey, 2015
Types of MPSPs in which tractor operators
duped arable crop farmers
Result in Table 4 shows that almost half (45.3%) of the arable crop farmers were being affected by MPSPS inform of incorrect farm size measurement as one of the areas where tractor
operators practice their dubious act in form of sharp
practices. Improper farm ploughing (17.3%), collected money and refused to do the work at the scheduled time(14.7%), collected money and refused to go to farmers farm (12.0%). All these
were the various sharp practices in ascending orders. Detailed analysis revealed that the five identified sharp practices, if not curtailed, can impede agricultural development initiatives. Table 4: Distribution of respondents by the types of mechanisation process sharp practices
MPSP Frequency Percentage
Improper farm ploughing 26 17.3 Collection of money and
refusal to go to farmers’ farm
18
12.0
Ploughing of land only to get to a stage and disguised
as if the tractor is faulty
16 10.6
In correct farm size measurement
68 45.3
Collect money and refusal to do the work at the scheduled time
22
14.7
Source: Field survey, 2015
Extent of Mechanisation processes sharp
practices
Result in Table 5 shows the extent of MPSPs using sharp practices index (SPI). The result shows that Ploughing of land only to get to a stage and
disguise as if the tractor is faulty ranked first in the MPSPs (30.0%) among the five MPSP considered in the study.
Table 5: Ranking of MPSP by extent of involvement
MPSP Large extent
Some extent
Small extent
None extent
MPSPI % Rank
Improper farm ploughing 12 10 2 1 24 10.1 4th
Collection of money and refusal to go to farmers farm
48 16 4 2 68 28.7 2nd
Ploughing of land only to get to a stage and disguised as if the tractor is faulty
60 8 5 73 30.8 1st
In correct farm size
measurement
39 12 4 4 54 22.7 3rd
Collect money and refusal to do the work at the scheduled time
- 16 2 - 18 7.6 5th
Summation (∑) = 237
Suggested ways to curb MPSPs sharp practices
Result in Table 6 shows ways suggested by arable crop farmers to curb mechanization processes sharp practices, 53.2% suggested that Government should embark on land preparation services for farmers as this will guide against incorrect farm size measurement that is one of the serious MPSP that farmers are victim. Also, 48.0%
suggested that farmers should form themselves into group to purchase a tractor as this will enhance good job performance and curtail unreasonable behaviour of commercial tractor hiring services, 22.2% were of the opinion that farmers should own and educated on how to use GPS. Detailed analysis revealed that if the suggested ways to curb mechanisation processes sharp practices are

Nigerian Journal of Rural Sociology Vol. 16, No. 1, June 2015
14
followed religiously the opportunity to curb it will
be very high. Table 6: Distribution of arable crop farmers by suggested ways to curb sharp practices
Variable Frequency Percentage
Farmers to strive to own personal tractor
23
15.3
Group of farmers to strive to own personal tractor
72
48.0
Farmers to be educated on how to use GPS
34
22.7
Government should embark in land preparation services for farmers
82
53.2
Source: Field survey, 2015
CONCLUSIONS AND RECOMMENDATION Sharp practices in mechanisation processes in
agricultural production have been identified. In conclusion, the findings of the study revealed that most arable crop farmers in the study area were aware of mechanisation processes sharp practices,
and they have been a victim one way or the other. The MPSPs that farmers are mostly involved are incorrect farm size measurement and improper farm ploughing. The key suggestions on how to
curb the MPSPs are, Government should embark in land preparation services for farmers and that farmers should form themselves into groups to purchase tractors. The study recommended proper utilisation of tractor and that extension agents should endeavour to educate the farmers on how to determine the farm size of their farm land.
REFERENCES
Anazodo, U. G. N. (1986): Appropriate methods and equipment for agricultural land clearing and development in Nigeria: basic
considerations. An invited paper presented at the National Workshop on Soil Erosion and Land Clearing and Soil Testing. Centre for Rural Development and Co-operatives, University of Nigeria, Nsukka. 24 pages.
Anthony penin, (1995): Empirical Evidence of mechanization effects on Smallholder Crop
Production Systems in Botswana,
Agricultural System 41(1995) 199-210 Bamigboye E.O (2015) Analysis of Indigenous
Climate Change Adaptation Strategies among Arable Crop Farmers in Ekiti and
Oyo States, Nigeria. Unpublished Ph.D. Thesis Department of Agricultural Economics and Extension, Ladoke Akintola University of Technology. Ogbomoso PP240
Couper, D.C. (1996) Land Clearing for Agricultural Research Stations. IITA Research Guide 5. Ibadan Nigeria. 16 pages.
Fagbemi, A. A. and Gana, G. I. 1994. The sequence
of NALDA land development activities. National Agricultural Land Development Authority. Abuja, Nigeria.1- 10 pages.
Jibowo, A.A(2003):Essential of Rural Sociology,
Gbemi Sodipo Press Ltd. Abeokuta, Nigeria.pp 21
Manta, I.H and Aduba, J.J (2013): Mechanisation Practice: A tool for Agricultural Development in Nigeria: A case study of Ifelodun Local Government Area of Kwara State. International Journal of Basic and Applied Sciences Vol.2. No.3 . 2013pp
98-106 NCAER,(1973): Impact of Mechanisation in
Agriculture on Employment Report of National Council of Applied Economic
Research , New Delhi. Okore, I. K; Tijani-Eniola H; Agboola. A. A. and
Aiyelari, E.A. (2006): Impact of land clearing methods and cropping systems on
labile soil C and N pools in the humid zone forest of Nigeria. Agriculture, Ecosystems and Environment, ELSEVIER 120 (2007), 250-258.
Oni, K .C and Adeoti, J. S. (1994): Mechanized land clearing and tractor traffic effects on agricultural soil and crop growth. Agricultural Mechanization in Asia, Africa
and Latin America. 36 (4). 25-29. Rahman, S. A. and Lawal, A. B. (2003): Economic
analysis of maize-based cropping systems in Giwa Local Government Area of Kaduna
State, Nigeria, An International Journal of
Agricultural Sciences, Science, Environment
and Technology.3:139-148

Nigerian Journal of Rural Sociology Vol. 16, No. 1, June 2015
15
APPROACHES TO OVERCOMING CORRUPTION IN THE NIGERIAN AGRICULTURAL SECTOR
Enwelu, I. A. Department of Agricultural Extension, University of Nigeria, Nsukka, Nigeria
Email Addresses: [email protected]
ABSTRACT
The paper explored the causes and effects of corruption in the Nigerian agricultural sector and various
approaches to overcome it and prevent it in the long-run. The paper was based on desk review of available
relevant literature. Information was accessed through web search, journals, newspapers, magazines, books and
reports. The major causes of corruption identified were: colonial influence, ethnic inclination/patron-client
relationships; psychological influence and poor remuneration/ condition of service. The effects of corruption in
the agricultural sector included: strangled economic development, neglect of real development priorities in
favour of oil, widened the gap between the rich and the poor, increased debt burden- loans paid to private
pockets, thus creating opportunity for food for thought and in the short-run increasing economic efficiency. The
main approaches to overcome corruption include: awareness creation/campaign against corruption, strong
political will backed with financial resources; creation of strong and durable institutions in terms of ethical
reorientation; revitalized functional civil service; and full independent anti-corruption commission. In
conclusion, corruption is prevalent in all facets of human endeavour. It cuts across professions, faiths, religious
denominations and political systems and affects both young and old, man and woman alike. There is need for a
renewed focus on agriculture to rid it of corruption and inefficiency. It is important that corruption stamped out
in our agricultural sector to serve our poor rural farming communities better.
Keywords: Agriculture sector, corruption, patron-client relationship
INTRODUCTION
Nigeria is undoubtedly one of the most richly endowed nations of the world in terms of human
and natural resources. Unfortunately, Nigeria today is one of the developing countries struggling to feed her citizens who incidentally are mostly engaged in agricultural production. Historically,
agriculture is one of the oldest occupations dating back from early man who was engaged in gathering of fruits and food crops. In Nigeria, agriculture was the dominant sector of the economy before the oil
boom era. According to World Bank (1989), agriculture has always been expected to play a key role in supplying food for the population and raw materials for industry, providing employment,
earning foreign exchange and serving as a market for the industrial sector. The ability of the agricultural sector to fulfil these roles has varied over the last three decades. Presently, the capacity
of agriculture to fulfil these roles has worsened. One of the factors militating against the performance of the agricultural sector in fulfilling these roles is corruption.
According to Dike (2008), there are many unresolved problems in Nigeria, but the issue of the upsurge of corruption is troubling. And the damages it has done to the polity are astronomical. It is believed by many in the society that corruption is the bane of Nigeria. Consequently, the issue keeps reoccurring in every academic and informal discussion in Nigeria. And the issue will hardly go
away soon! Corruption is prevalent in all facets of human endeavour. Some writers say that corruption is endemic in all governments, and that it is not
peculiar to any continent, region and ethnic group. It cuts across faiths, religious denominations and
political systems and affects both young and old, man and woman alike. Corruption is found in democratic and dictatorial politics; feudal,
capitalist and socialist economies. Christian, Muslim, Hindu, and Buddhist cultures are equally bedevilled by this monster. Corrupt practices did not begin today; the history is as old
as the world. Ancient civilizations have traces of widespread illegality and corruption. Thus, corruption has been ubiquitous in complex societies from
ancient Egypt, Israel, Rome, and Greece down to the present time (Lipset and Lenz, 2000). Although corruption can be found in all countries and cultures, some countries are more
prone to corruption than others. Similarly, corruption can be found in every profession: medicine, pharmacy, law, education, and agriculture to mention but a few. And so,
corruption in the agricultural sector is the main focus of this paper. Generally speaking, corruption is a perversion or a change from good to bad (Dike, 2008).
Specifically, it involves the violation of established rules for personal gain and profit (Sen, 1999) and efforts to secure wealth or power through illegal means/ private gain at public expense; or a misuse of public power for private benefit (Lipset and Lenz, 2000). This definition includes such behaviour as bribery (use of a reward to pervert the judgment of
a person in a position of trust); nepotism (bestowal of patronage by reason of ascriptive relationship rather than merit); and misappropriation (illegal appropriation of public resources for private uses
(Banfield, 1958; United Nations, 1990). Furthermore, Osoba (1996) defines corruption as

Nigerian Journal of Rural Sociology Vol. 16, No. 1, June 2015
16
an anti-social behaviour conferring improper
benefits contrary to legal and moral norms, and which undermine the authorities to improve the living conditions of the people. Dike (2008) observes that even though some of
these definitions of corruption have been around for over decades, the recent development in Nigeria where discoveries of stolen public funds run into billions of US Dollars and Nigeria Naira, make these definitions very adequate and appropriate. Corruption is probably the main means to accumulate quick wealth in Nigeria. Corruption occurs in many forms, and it has contributed
immensely to the poverty and misery of a large segment of the Nigerian population. It is also pertinent to observe that the foregoing definitions of corruption have bearing in the
agricultural sector. Consequently, the overall objective of this paper is to explore various approaches to overcome corruption in the agricultural sector. Specifically, the paper sought to: identify causes of corruption in agriculture in Nigeria; describe instances of corruption in agricultural sector; ascertain effects of corruption on agriculture; as well as determine approaches to
overcoming/ preventing corruption in the agricultural sector.
METHODOLOGY
The paper was based on desk review of available relevant literature. Information was accessed mainly through web search, journals, magazines, periodicals, newspapers, books and
reports.
RESULTS AND DISCUSSION
Causes of corruption in agriculture in Nigeria
It is an effort in futility to treat an ailment without establishing the cause. The causes of corruption in Nigeria are many and diverse and as such have trickled down and/or overwhelmed the
agricultural sector. Attempt is made in this study to present causes of corruption in agriculture in Nigeria thus:
Colonial influence
Prior to the colonial period, Nigeria culture and economy had little or no corrupting tendencies and as such few cases of corruption if any could be observed. The origin of corruption in Nigeria can be traced to the time of colonial invasion of Africa. Johnson (1995) defines colonialism as international system of economic exploitation in which more powerful nations dominate weaker ones. However,
Munyae and Gwen (1998) make a distinction between two phases of colonialism namely active and passive colonialism. The former refers to conquest of a people followed by the direct control
(or domination) of the same by conquerors using a combination of measures such as military coercion
and dominance of major internal institutions such
as polity. The later, on the other hand represents what is commonly referred to as neo-colonialism or extension of especially economic domination of a people beyond the attainment of self rule. This
second phase of colonization is associated with practices, policies and structures inherited from the first phase. The researchers affirm that active colonialism is associated with the origin/birth of corrupt practices while passive colonialism is considered to be partially responsible for the entrenchment of it. As stated earlier, since African (Nigerian)
economy could not accommodate corruption, the industrial revolution of the 19th century pioneered by colonial masters provided a fertile ground for corruption. It was the financial growth which
accompanied this historical event that was directly responsible for the birth of white-collar crime which is a component of corruption (Robb, 1992; Munyae and Gwen, 1998). This behaviour was instilled into the colonial peoples during the colonial period and was carried into the post colonial era. This was inevitable considering the fact that colonialism was an extension of the new
economic order and its concomitant problems which resulted from industrial revolution. Since corruption requires a well developed monetary economy to thrive, the new economies
promoted by colonial governments had to nurture the conditions for the evolution of structures that were conducive to corrupt practices. One way to achieve that was introduction of payment of taxes
by the colonized countries. In Nigeria, British government introduced compulsory tax payable only in cash for purposes of meeting the cost of administration and generation of cheap labour
necessary for the establishment of productive activities (Munyae and Gwen, 1998). According to them, it was not the introduction of taxation per se
that encouraged corrupt behaviour but the manner
in which the tax itself was collected. To collect taxes, the colonial government mostly relied on local leaders and especially the chiefs. Above all, to motivate them to generate as much tax revenue as
possible and to do so with zeal, the colonial administration allowed the chiefs to retain a part of it. This practice led to taking of kickbacks by African chiefs (Nigeria). This scenario, gave an entirely new meaning to the traditional practice of giving gifts to chiefs which had existed in different parts of Africa long before colonialism. In the British ‘gift’ to chiefs, it
was a source of inducement to use obnoxious means to collect taxes from their kinsmen. Gradually, these corrupting tendencies grew and matured and the beneficiaries (chiefs) became
instrument of oppression and retrogression – a phenomenon being witnessed in contemporary

Nigerian Journal of Rural Sociology Vol. 16, No. 1, June 2015
17
time. The task force sent to establish agricultural
projects in communities colluded with the chiefs in the communities to frustrate the projects. Blinded by the financial gains, the chiefs collaborated with the colonial masters and coerced
African men, migrant labourers and even slaves to work in their industries (including agro-allied industries) at their home country. The women were left at home to carry out farm work and even sell their few animals to augment money for payment of tax (Colclough and McCarthy, 1980; Tlou and Campbell, 1984).
Ethnic inclination/patron-client relationships
The post colonial African leaders applied the principle of divide and rule which they learned from the colonial masters by favouring one tribe over another. The political equation in Nigeria has
been such that one major tribe joins another major tribe to be in power and share the ‘national cake’. Such patron-client relationships are maintained through corrupt practices. Munyae and Gwen (1998), state that people in such position are not only overwhelmed with financial pressure from their family, but also from kin, clan, hometown and tribal or ethnic constituents. Such obligations are
almost always fulfilled through corrupt means. Thus the participants in corruption are many besides the politicians or elites who actually engage in the act (Brima, 2009).
Psychological influence
According to Brima (2009), there are numerous psychological factors that can help to explain some causes of corruption. Internally, some
people are ‘naturally evil’ and will commit criminal acts, including corrupt ones in any type of system. However, pressure and peer comparison can contribute greatly to acts of corruption especially
where the socially revered are the corrupt ones. For instance, a person who corruptly enriched himself and ‘helped’ his people secure employment in agricultural institution where he served will be
given a red carpet reception while his counterpart who avoided being entangled in corruption will be ignored and derided in his/her community. This can impact psychological effects on the upcoming ones
who see such people and others around them benefiting from corruption being recognized to choose to indulge in corruption too.
Poor remuneration/condition of service
One major direct cause of corruption in the agricultural sector is poor and untimely remuneration and condition of service of agricultural staff. If the take home pay of any
worker is not enough to take care of the family and other immediate needs, there will be compelling need to seek other means of making both ends to meet although one may be tempted to say that such
means must not be through corrupt practices like taking bribes or embezzling public funds, but
psychological influence of the surrounding
environment may compel the person to see corruption as the easiest option. Also, judicial system where the culprits (corrupt workers) are to be disciplined is affected by the same poor
conditions of service. In such situations, it is the poor people that suffer the brunt of injustices as the rich always stand a better chance of getting justice over the poor. A typical case of poor condition of service and corruption that follows it was the abuse of motorcycles provided to extension agents by the World Bank to help them in their farm and home visits. When the World Bank handed over the
Agricultural Development Projects to the states, the allowances to maintain the motorcycles were stopped and extension agents began to use the motorcycles for transportation (“Okada”) business.
Instances of corrupt practices in agricultural
sector
Land title/tenure - Land is a major factor in agricultural production. However, in rural Nigeria, land ownership is one of the key limiting factors of production (Peterman et al., 2010). The land tenure system in Nigeria encouraged fragmentation of land such that land required by farmers to engage
in profitable agribusiness is rarely available. The Nigerian land use Act of 1978 nationalised all land and vested authority in the State Governor who holds it in trust on behalf of all. In practice
however, the way land is owned and accessed varies from place to place in Nigeria and can be an amalgam of traditional, Islamic Sharia and other local governance practices (Mabogunje, 2010). The
Land Use Act instead of solving the problem of land users including farmers become politicised such that the process of obtaining Certificate of Occupancy is fraught with corrupt practices starting
from the clerk that carries file to the highest authority. In rural areas, women who are the majority that use land for agricultural purposes some times fall into the hand of fraudsters who
promise to give land to them. Sometimes, people requiring land for agricultural purposes procure land through individuals that have multiple titles to the land. Rodney (2002) confirms that problems
with land ownership, registration, tenure and sales impede agricultural development in many countries. Multiple titles exist on many parcels and the rights of family members, especially women and children, are not well defined in some societies. Moreover, registration of title is often a slow, complex, and costly process, which is vulnerable to bribes offered or demanded for service.
Distribution of farm inputs/credit
availability - Farm inputs are required for the agricultural sector to flourish in Nigeria. For instance fertiliser, agrochemicals, improved crop
and animal varieties etc are needed to boost agricultural productivity. Unfortunately,
Nigerian Journal of Rural Sociology Vol. 16, No. 1, June 2015
18
government officials responsible for equitable
distribution and sale of these commodities take bribes and even make the process of getting the materials complex and difficult. Farmers who may require credit to engage in farm business face the
same ordeal. According to Rodney (2002), corruption occurs in the allocation of government-subsidised credit. Most typically, unnecessary fees and percentage payments are ways that government officials use to garner funds when granting credit. Farm supply/transportation - Another area corruption manifests in agricultural sector is supply/transportation of agricultural equipment and
materials. For instance people empowered to import farm machinery and irrigation equipment negotiate with manufacturers to supply inferior products at the same amount for the superior
products. Also, transporters of agricultural equipment and materials collude with government officials to divert the goods to unknown destinations sometimes outside the shores of the country. Rodney (2002) asserts that corruption in government contracts or licenses for agricultural supplies is common. Poor quality, undelivered goods and high prices are typical outcomes from
collusion between government officials and private sector firms. An example is a government agency buying fertiliser from a private sector company at an elevated price and receiving a share of the profit.
This increases the cost of agricultural production and eliminates competition in the fertiliser industry as other firms have little chance of getting the government contract.
Product standards and certification -
Product standards and certification constitute another source of corruption, as individual producers attempt to bribe produce inspectors to
get the desired certification. The efforts of Standard Organisation of Nigeria (SON) are appreciated but the effects are yet to be felt by poor farmers who are the main beneficiaries. The development of
quality improvement centres in rural communities in Nigeria will help support objective grading of products by pooling produce for inspection and eliminating the opportunity for individual
producers to offer bribes (Rodney, 2002). White elephant projects - Poorly executed projects especially in the agricultural sector are the conduit for personal enrichment. There are many cases of abandoned agricultural projects in the country because of corruption. For instance the Vegetable Oil Production Plant in Nachi Enugu State known as (AVOP) established by old
Anambra State Government was razed down by fire to cover up corruption in the industry. Similarly, the first cashew processing industry for export in Nigeria was established by Premier
Cashew Processing Industry at Oghe, in Ezeagu Local Government Area of Enugu State. The
factory was modernized in 1989 when an ultra-
modern Japanese technology was installed to increase the operating capacity to about 2000 metric tonnes per year. However, the plant has since been closed down due to management
problem (Ezeagu, 2002). The Cotton Mill industry in the North has sacked most of its staff and others remaining are being owed months of unpaid salaries. The Fertiliser Plant at Onne Port Harcourt to mention but a few is an agriculture related project operating at skeletal level far below the objectives of setting it up. The canker worm stifling the life of these projects and more is corruption
within and among all stakeholders involved in managing the projects. It is pertinent to observe that agricultural projects like the Rubber Estate in Ondo State being managed by foreign stakeholders
continues to function optimally and contributing to economic growth of the country because of zero tolerance to corruption.
Effects of corruption in the agricultural
sector - The effects of corruption on a nation’s socio-political and economic development are myriad. Agriculture is the backbone of any developing country and as such when agricultural
sector is adversely affected all other sectors are equally affected. Corruption is a monster that has directly and indirectly affected agricultural sector for decades. The effects of corruption in the
agricultural sector are mainly negative although positive effects may be argued. The summary of effects of corruption is as follows:
Strangulating economic development -
Corruption in agricultural sector strangles economic development through poor execution of agro-industrial projects. Agro-allied industries are fraught with such corrupt practices as bribery,
nepotism, misappropriation, kickback etc. Consequently, the ability of these industries to generate income and employment is hampered with poor resource farmers seriously receiving the bulk
of the impacts. Corruption presents a scenario where money meant for development of a particular agricultural project is not released because the opportunity of embezzling the money
is not clearly established. This has negative impacts on economic growth. Lipset and Lenz (2000) note that the effect on growth, is in part, a result of reduced level of investment, as it adds to investment risk. Corruption is a complex phenomenon. Its roots lie deep in bureaucratic and political institutions, and its effect on development varies with country conditions. But while costs may
vary and systemic corruption may coexist with strong economic performance, experience suggests that corruption is bad for development. It leads governments to intervene where they need not, and
it undermines their ability to enact and implement policies in areas in which government intervention

Nigerian Journal of Rural Sociology Vol. 16, No. 1, June 2015
19
is clearly needed—whether environmental
regulation, health and safety regulation, social safety nets, macroeconomic stabilization, or contract enforcement (World Bank, 1997).
Neglect of real development priorities in
favour of oil - One of the greatest impacts of corruption normally arises out of the choices and priorities of governments. This occurs when the real development priorities of a country are often neglected in favour of those that generate the greatest personal gains for the decision makers. Here, it is clearly evident that many projects have become white elephants and easy route for personal
enrichment (Brima, 2009). The discovery of oil in Nigeria opens a greater opportunity for policy makers and administrators to generate the greatest personal gain through corrupt practices. There was
so much money in the country then that the problem of managers of the economy was how to spend the money. Agriculture which would have been a willing horse to receive the money in other to lay a solid foundation for real development was utterly neglected. The agricultural programmes by successive governments in Nigeria like Operation Feed the Nation, Green Revolution etc are poorly
implemented because of corruption. Nwakoby (2007) laments that there is lack of integrity, accountability and transparency on the part of people who are supposed to implement
developmental projects in the rural areas. Public funds (made for rural projects) are stashed away in bank vaults in Europe and America, while an overwhelming proportion of the population live in
abject poverty.
Widening of the gap between the rich and
the poor - Another serious effect of corruption in the agricultural sector is its ability to widen the gap
between the rich and the poor. In developing country like Nigeria where majority of people are engaged in agriculture, any diversion of money meant for agricultural projects is likely to
negatively affect the larger population which are mostly poor farmers. Developing economies are predominantly buffeted with barrages of corrupt practices that have deep anchorage in the socio-
political and cultural psyche and existence in such nations. This is particularly so in Sub-Saharan Africa where majority of the populations especially in the rural areas suffer untold hardship as a result of what can be termed as organised or systematised corruption (Brima, 2009). Increase in debt burden - Governments at various levels (federal, state and local) in Nigeria
have embarked on various strategies geared towards making funds (in form of loans) available to farmers to improve agricultural production. When loans taken by governments on the pretext of
undertaking some agricultural projects are diverted to private accounts and coffers, the attendant effect
is that such loans would have to be paid with
interest and at the same time increasing the debt burden of the country (Brima, 2009).
Corruption in increasing economic
efficiency only on the short-run - There is this
believe that giving bribes to agricultural staff in order to procure farm inputs like fertiliser, agro-chemicals, improved varieties of crops/animals etc may help the farmers meet up with their time-bound activities. This may be true in the short-run but in the long-run the cost of production will increase thereby increasing the profitability of the farm business. World Bank (1997) argues that
corruption may not distort the short-run efficiency of an economy if it merely entails a transfer of economic rents from a private party to a government official. It however agrees that the
problem with this line of reasoning is that it fails to take into account any objective other than short-term efficiency. Opportunity for food for thought - Although it is hard to believe, but when corruption has gone full circle, there may be a ray of light at the end of the tunnel. This is because the slightest opportunity of change can be overwhelmingly embraced by
majority of the people like what is being witnessed in Nigeria recently. Similarly, Dike (2008) reports that the scandals associated with the Abacha era (looting of the treasury and human rights
violations) have given the nation some food for thought. The last administration of Good-luck Ebele Jonathan is currently under attack. Nigeria is still perplexed and preoccupied with the issues of
how to strengthen the nation’s essential governmental structures to avoid the reoccurrence of these kinds of looting and atrocities in future. Gluckman (1955) also opines that scandals
associated with corruption sometimes have the effect of strengthening a value system of a society as a whole. However, according to Dike (2008), the apparent benefits of corruption notwithstanding, no
right thinking person in Nigeria where ubiquitous corruption has ravaged the society will agree that corruption is beneficial, no matter how plausible it may be.
Approaches of overcoming corruption in the
agricultural sector
There may be no single approach that can stamp out corruption completely in our society. Only multifaceted approaches can attempt to ameliorate the effect of corruption in the short-run and when sustained may prevent corruption in the long-run. Therefore, there may be no clear-cut
short-run and long-run approaches in overcoming corruption as most short-run approaches may continue in the long-run. However, for the purpose of this study, short-run and long-run approaches of
overcoming corruption in agriculture are presented.

Nigerian Journal of Rural Sociology Vol. 16, No. 1, June 2015
20
Short-run approaches to overcome corruption
in agriculture
Awareness creation/campaign against corruption - The best way to start the war against corruption is through awareness creation/campaign.
The general public including the farmers shall be inundated with information of the evil of corruption in agriculture. The media including radio, television, newspaper, magazine, social media (face-book, twitter etc) and other communication outfits should be used in enlightening all segments of the society on the negative effects of corruption on our collective survival. Agricultural institutions
should organise seminars, symposia, conferences and other academic fora to enlighten stake holders in agriculture about the need to fight the scourge (corruption). Faith-based organisations and other
governmental organisations should be in fore-front in the campaign against corruption.
Political will/finance to prosecute
corruption in agriculture - This awareness/campaign should be followed by the political will and adequate finance by governments (federal, states, and local governments) to fight corruption in agriculture. The go vernments should
identify and prosecute known recent cases of corruption in agriculture. There is need to unravel what led to poor performance of Songhai Farms in some States of Nigeria, skeletal services by Cotton
Mill and Fertiliser Plant at Onne, Port Harcourt. Dike (2008) affirms that prosecuting all the known corrupt political heavy weights in the society should be put into practice as they contribute in
making the nation’s inchoate laws inoperable. However, this will only be a temporary measure in fighting corruption. Principally, only men and women of virtue have the moral justification to
wage the war of corruption.
Tough penalties/rules with vigorous
enforcement - It is not enough to prosecute people involved in corruption if adequate punishment is
not meted out to them to serve as deterrent to others. Those prosecuted and found culpable should be made to face the laws of the land. There shall be no sacred cows. There shall be put in place
adequate rules and regulations guiding all operations in agriculture and punishments for circumventing any of the rules and regulations. Also, there shall be watch dogs trained like the forest guards and deployed to police all agricultural projects to ensure vigorous enforcement of these rules. Dike (2008) affirms that making tough rules with vigorous enforcement can deter corrupt
behaviour. However, it is important to point out here that use of force to fight corruption may not be a sustainable approach because when the force is removed people may revert to the status quo.
Officers who are in position of power and
authority must be well remunerated - An Igbo
adage says, “You cannot give a person with dry
skin palm oil to keep for you”. Similarly, it is very risky to assume that agricultural staff who handle and receive funds for agricultural projects should imbibe the virtues of integrity not to tamper with
the funds when back home their families or loved ones cannot eat or be taking to hospital for treatment. In-fact, all staff of agriculture should be well paid and on time especially the chief executive, those in charge of project monitoring and execution, finance and audit staff and staff charged with the responsibility of enforcing rules and regulations. The officer receiving the payment
would know that corrupt behaviour may involve serious loss of a high-salary employment if things were to go bad (that is, if he or she is caught with his or her hand in the cookie jar) (Sen, 2000).
Long-run approaches to prevent corruption in
agriculture
Agricultural extension education approach -
One of the cardinal objectives of extension is education of clientele to bring about changes in their attitude, skill and knowledge. According to Laogun (2011), every extension worker is a teacher with no fixed classroom but wherever he/she meets
people. His teaching is not by courses of study formally arranged, but is on any problem of immediate importance in farming or rural living such as corruption. Therefore, the extension agency
can be reorganised to emphasize the teaching of zero tolerance to corruption in the agricultural sector. The extension agents in addition to their normal training of farmers should also train them to
abhor corruption by refusing to give or take bribes in any agricultural undertaking. This can be achieved through value re-orientation and sensitization of farmers to imbibe patriotic spirit.
According to Dike (2008), the re-orientation of the youth in Nigeria to a good value system could help in the war against corruption. The World Values Surveys of 1990-1993 has a lot of attitude and
value information, which notes a relationship between values and corruption (World Values Study Group, 1994). Preaching the gospel and practice of virtue is the ultimate solution to
behavioural change and reduction in corruption. The farmers should be made to express love for their country by shunning corruption.
Strengthening of social and governmental
institutions - There is need to strengthen institutions such as banks, schools, clubs, cooperatives, labour rotatory groups etc which are directly or indirectly involved in agriculture with a
view to ridding them of corruption. The process of obtaining agricultural loans should be simple and transparent. A mechanism should be put in place such that bank official collaborators in crime
should easily be detected and adequately punished. The children in schools should be taught moral and

Nigerian Journal of Rural Sociology Vol. 16, No. 1, June 2015
21
citizenship lessons early in life and reward system
put in place for exemplary students/pupils.
Full independent anti-corruption outfit - Corruption fighters club can be established in both rural and urban areas to wage war against
corruption in the agricultural sector. This outfit should be fully independent and free from control and manipulation of any other authority in issues of corruption and other related offences. Also, it should be well funded through direct budget
allocation.
CONCLUSION
Corruption is prevalent in all facets of human endeavour. It cuts across professions, faiths, religious denominations and political systems and affects both young and old, man and woman alike.
Origin of corruption in Nigeria can be traced to the colonial invasion of Africa. Pressure and peer comparison contribute greatly to acts of corruption especially where the socially revered are the corrupt ones. There are instances of corruption in land title/tenure for agricultural purposes as well as in distribution of farm inputs or in the allocation of government subsidised credit. Corruption in
agricultural sector strangles economic development through poor execution of agro-industrial projects. Short-run approaches to overcome corruption in agriculture include political will to prosecute all
known cases of corruption in agriculture and tough penalties/rules with vigorous enforcement. Long-run approach to prevent corruption in agriculture is through agricultural extension education approach.
There is need for a renewed focus on agriculture to rid it of corruption and inefficiency. There is dire need to stump out corruption in our agricultural sector and serve our poor rural farming
communities better.
REFERENCES
Banfield, Edward (1958). The Moral Basis of a
Backward Society (Chicago: Free Press) Brima, (2009). The Negative Effects of Corruption
on Developing Nations: A Perspective on Sierra Leone’s Effort to (Centre for
Accountability and Rule of Law – CARL, Sierra Leone) http://carl-sl.org/home/articles/125-the-negative-effects-of-corruption-on-developing-nations-a-perspective-on-sierra-leones-effort-to
Colclough, C. and S. McCarthy (1980). The Political Economy of Botswana: A Study of Growth and Distribution, New York: Oxford
University Press Dike, V. E. (2008). Corruption in Nigeria: a new
paradigm for effective control. Africa Economic Analysis
www.AfricaEconomicAnalysis.org
Ezeagu, W. (2002). Assessment of the situation and
development prospects for the cashew sector, a report carried out on behalf of the International Trade Center UNCTAD/WTO (ITC) and funded by the ITC Global Trust
Fund under project Gluckman, Max (1955). Custom and Conflicts in
Africa, Oxford Johnson, A. G. (1995). The Blackwell Dictionary
of Sociology: A User’s Guide to Sociological Language, Oxford, UK: Blackwell Publishers Ltd
Laogun (2011). Extension teaching/learning
process and extension methods. Agricultural Extension in Nigeria. A publication of the Agricultural Extension Society of Nigeria: 270-278
Lipset, Seymour Martin, and Gabriel Salman Lenz (2000). Corruption, Culture, and Markets, in Culture Matters, Lawrence E. Harrison, and Samuel P. Huntington, eds., (New York: Basic Books), p.112.
Mabogunye, A. L. (2010). Land reforms in Nigeria: progress, problems and propects. At: http://siteresources.woorldbank.org/EXTAR
D/reources/3336681-1236436879081/58933116054/mabogunje.pdf
Munyae, M. M. and Gwen N. L. (1998).
Interrogating our past: colonialism and corruption in Sub-Saharan Africa, African Journal of Political Science, Vol. 3 No.2, 15-28
Nwakoby, C. N. O. (2007) Impact of the NEPAD Programme in the Nigerian Economy: Journal of the Management Sciences, Vol. vii, No 2, Amazing Grace: Enugu.
Osoba, S. O. (1996). Corruption in Nigeria: historical perspectives, Review of African Political Economy, 69:371-386
Peterman, A., Quisumbing, A., Behman, J. and
Nkonya, E. (2010). Understanding Gender Differences in Agricultural Productivity in Uganda
and Nigeria IFPRI Discussion Paper 01003 IFPRI Poverty, Health and Nutrition
Division Robb, G. (1992). White-collar Crime in Modern
England, London: Cambridge University Press
Rodney, F. (2002). Corruption and Agricultural Sector. Sectoral Perspective on Corruption.
MSI (USAID, DCCH/DG) Sen. A. (2000). Social Exclusion: Concept,
Application and Scrutiny. Social Development papers No. 1. Office of Environment and Social Development, Asian Development Bank
Sen, Amartya (1999). Development as Freedom (New York: Anchor Books), p.275

Nigerian Journal of Rural Sociology Vol. 16, No. 1, June 2015
22
Tlou, T. and Campbell, A. (1984). History of
Botswana, Gaborone: Macmillan Botswana Publishing Company
United Nations (1990). Practical Measures Against Corruption, New York: United Nations
World Bank (1989). Nigeria - Strategy for agricultural growth. Washington, DC: World Bank. http://documents.worldbank.org/curated/en/1989/12/739210/nigeria-strategy-agricultural-growth
World Bank (1997). Helping Countries Combat
Corruption - The Role of the World Bank: Poverty Reduction and Economic Management (www1.worldbank.org/publicsector/anticorr
upt/corruptn/corrptn.pdf file) World Values Study Group (1994). World Values
Survey Code Book, ICPSR 6160 (Ann Arbor, Mich., August)

Nigerian Journal of Rural Sociology Vol. 16, No. 1, June 2015
23
ARABLE CROP FARMERS’ CHARACTERISTICS AFFECTING THE UTILISATION OF
INFORMATION AND COMMUNICATION TECHNOLOGY FOR AGRICULTURAL MARKETING
INFORMATION IN OYO STATE, NIGERIA Adeniyi, R. T. and Yekinni, O. T.
Department of Agricultural Extension and Rural Development, Faculty of Agriculture and Forestry, University
of Ibadan, Ibadan, Nigeria E-mail: [email protected]
ABSTRACT
Marketing information research is a key supportive service to commercialisation of agricultural enterprises for
current prices of agricultural produce in the market. The utilisation of ICT-based agricultural marketing
information (AMI) by arable crop farmers are functions of some farmers’ attributes. This study assessed the
respondents’ socioeconomic and farm enterprise characteristics affecting the use of AMI by arable crop farmers
in Oyo state. A multistage sampling procedure was used to select 143 respondents for the study. Data collected
with interview schedule were analysed using descriptive and inferential statistics such as Chi square and PPMC
at p=0.05. Results show that majority of the farmers were male (83.2%), with mean household size of 7 persons,
45.7 years of age and 9.5 years of formal education. Most (82.5%) respondents had farming as their primary
occupation and earned mean monthly income of ₦98,087.9 with the mean year of farming experience of 32.8
years. Mostly used ICT tools for the AMI were radio (274.1), mobile phone (232.8) and television (140). More
of the farmers had low level of use (55.2%) of the use of ICT-based AMI. There were significant relationships
between respondents’ use of ICT-based AMI and primary (χ2=19.51) and secondary occupation (χ
2= 34.77)
while years of formal education (r=0.261, p=0.000) and farming experience (r=0.44, p= 0.000) were equally
positively correlated with their use of ICT based AMI. Formal education and farming experience of farmers
were among factors responsible for the effective use of ICT-based AMI among the agricultural entrepreneurs.
Due to the nature of ICTs, adult literacy is a prerequisite in order to improve their skills and attitude towards
the use of ICT-based AMI.
Keywords: Agricultural information research, ICT-based information and agricultural entrepreneurs’ characteristics
INTRODUCTION
Information is the most important facilitator and main core of the marketing system as it is a sine qua none for agricultural development. (Farhad, Roya, and Maryam, 2011). Hence, farmers
need access to update and extract information in order to improve the quality and quantity of the agricultural products marketing. Information communication and technology according to
Arokoyo (2011) are the technologies that facilitate communication and the processing of information by electronic means. This definition encompasses the full range of ICTs from radio and television to
telephones (fixed and mobile), instant messaging, e-bulletins, computers and the internet which are the potential tools that could be used by farmers to utilise agricultural marketing information
(Arokoyo, 2011; Federal Ministry of Agriculture and Rural Development (FMARD), 2011). Empowering Small Holders Farmers in Market (ESFIM, 2010) submits that Agriculture Market Information Systems (AMIS) is a process that collects, processes and disseminates information on the situation and the dynamics of agricultural markets. Furthermore, Economic Commission for
Latin America and the Caribbean (ECLAC), Food and Agriculture Organisation of the United Nation (FAO) and Inter America Institute for Cooperation on Agriculture (IICA) (2012) posit that market
information disseminated through ICTs provides input for production and market oriented decision
which help farmers to compare and share
information and knowledge related to production and marketing of agricultural produce. Price information services as identified by United States Agency for International
Development (USAID) (2011) are in four categories according to the type of provider: mobile network co-operators, third–party service providers (company), buyers providing market price
information to producers and Market Information System service offered by governments. In other words, this will accord the agricultural entrepreneurs opportunity to select the best service
that will be most convenient and economical to access marketing information for marketing their produce. Lack of access to reliable and up to date
market price information is a serious problem for small holder farmers that are characterised by large number of small, scattered farms and unorganised market across Africa including Nigeria (IFAD, 2008). Without this information, they are vulnerable to unscrupulous traders, who give them absurd prices that make them sell below market rates. Furthermore, they are reluctant to diversify
into different cash crops for fear of not finding a profitable market for their output (IFAD, 2008). This situation will among other things predispose farmers to: glut of produce in the market, scarcity
of farm produce and exploitative activities of middle men. Hence, these in turn pose

Nigerian Journal of Rural Sociology Vol. 16, No. 1, June 2015
24
discouragement to the cassava and maize farmers’
entrepreneur as the hope of marketing their produce for the desired reward that commensurate their labour becomes vague. However, Nigerian farmers’ personal and enterprise characteristics status may
be responsible for their inability to use improved information technologies services which is one of the most important ingredients for improving market participation, sales revenue, and crop income in the country. Therefore, it is important to assess the extent to which concerned entrepreneurs’ characteristics like age, primary occupation, years of formal education and others, have contributed to
their use of the AMI services to leverage their enterprises. To this end, this study analysed the Cassava and Maize Farmers’ characteristics affecting the use of Information and
Communication Technology-Based AMI in Oyo State. The general objective of this study was to assess the socio-economic and farm enterprise characteristics affecting the use of AMI by arable crop farmers in Oyo state. Specifically, the study was conducted to: 1. describe the socio-economic characteristics of
the respondents in the study area, 2. examine the respondents’ enterprise
characteristics in the study area, 3. ascertain the sources of agricultural marketing
information available to the respondents in the study area,
4. ascertain the extent to which the respondents use the ICT-enabled agricultural market
information in the study area, 5. identify the various purposes for which
respondents use ICT-based agricultural marketing information in the study area.
METHODOLOGY
The study was carried out in Oyo state. The population of study consists of all arable crop
(cassava and maize) farmers in Oyo state. The first stage of sample selection involved the random selection of 50% (two) of the four ADP zones in the state. The selected ADP zones were
Ibadan/Ibarapa zone and Saki zone. The second stage involved the random sampling of one block from each of the selected zones. Ona-Ara block was selected in Ibarapa/Ibadan zone, while Igbeti block was selected in Saki zone. The third stage involved random sampling of 50% of the extension cells in each block, giving a total number of eight cells in all i.e. four cells per block. The fourth stage
involves the random selection of 20% of farmers from the list of cassava and maize farmers in the selected cells; giving a total of 143 respondents for the study. Data was collected using structured
questionnaire, which was administered as interview schedule basically to circumvent illiteracy barrier.
Data collected were analysed using descriptive and
inferential statistics such as PPMC and Chi square to test the hypothesis of the study.
RESULTS AND DISCUSSION
Socio-economic characteristics
The data presented in Table 1 indicates that 72.8% of the respondents were within the age bracket of 33 and 52 years while 14.7% were below 33 years. The mean age of 45.7 years shows that most farmers in the study area are young and actively involved in farming. This corroborates the findings of Olaniyi, Adetumbi, and Adereti (2013),
who reported that, majority of their study target were of average age. Distribution of respondents by sex reveals that, majority (83.2%) of the respondent were male while (16.8%) were female. The
implication of this finding is that, farming in the study area was dominated by men. This is in line with the studies of Oyeyinka and Bello (2013) and Olaniyi.et al (2013) who reported that male dominates farming activities. Appreciable number of the farmers (79.0%) had formal education with the mean years of education being 9.6 years. This result implies appreciable level of literacy among
the farmers, which is an important factor for successful commercial farming. More so, literacy will make the farmers keen on to getting information and use it as noted by Ezeh (2013) &
Anthony and Adwinmea (2013). According to Anthony and Adwinmea (2013) both formal and informal education are important for successful commercial farming. Furthermore, one quarter
(25.2%) of the respondents had between 1 and 5 members in their households, about two-third (63.0%) had between 6 and 10 persons while few (5.6%) of them had between 11 and 15 members in
their households with 7 persons being mean household size. This implies a fairly large household size among the respondents in the study area. A study by Olajide (2011) also found a
similar trend of household size among rural population. The large family size might be with the motive of using the family members as a source of farm labour. On their primary occupation, the result
shows that most (82.5%) of the respondents were primarily farmers, 11.2% were civil servants, 4.2% were traders and 2.15% were artisan. This implies that the income generating activities of most of the respondent in the study area comes from farming. Furthermore, the result from the study indicates that only 33.6% of the respondents did not have any secondary occupation. The result also shows
that they were into farming (19.6%), trading (30.1%), artisanship (13.3%) and politics (3.5%). This implies that diversification of livelihood activities is a means to augment their income
during the off-seasons; as asserted by Ebitigha (2008) that diversification assist in insulation

Nigerian Journal of Rural Sociology Vol. 16, No. 1, June 2015
25
against environmental, economic shocks, trend and
season.
Table 1: Distribution of respondents according
by personal characteristics n=143
Variable Frequency Percentage
Age
22-32 12 8.4 33-42 43 30.1 43-52 61 42.7
53-62 19 13.3 63-72 08 5.6
Sex Male 119 83.2 Female 24 16.8
Years of formal
education
None 30 21.0
1-6 25 17.5 7-12 45 31.5 >12 43 30.1
House hold size
1-5 36 25.2 6-10 90 63.0 11-15 8 5.6 16-20 6 4.2
21-25 2 1.4 26-30 1 0.7
Primary
occupation
Farming 118 82.5 Traditional 6 4.2 Artisan 3 2.1 Civil servant 16 11.2
Secondary
occupation
None 48 33.6 Farming 28 19.6
Trading 43 30.1 Artisan 19 13.3 Politics 5 3.5
Source: Field survey, 2014
Enterprise characteristics of arable crop
farmers
Information on arable crop farmers’ enterprise characteristics in Table 2 shows that other crops cultivated by the respondents aside cassava and maize were yam (47.6%), vegetables (42.0%) and
cowpea (35.7%). The less cultivated crops among the respondents were water melon (0.7%), rice (1.4%), and some cash crops like cocoa (16.8%), Oil palm (13.3%) and plantain (3.5%). The
diversification in crop production might be due to the subsistence nature of agriculture being practiced by the respondents in the study area. This also implies that the respondents cultivated both arable and cash crop in the study area probably to have a steady income source all year round. This is in tandem with the findings of Anthony and Adwinmea (2013) that farmers usually cultivate
more than one crop as a way to minimise risk in
term of bad weather or low prices. The results of the study further shows that 57.4% of the respondents had small farm size of between 1 and 5 acres, 31.5% of them had between 6 and 10 acres
(medium farm size) while 11.2% had between 11 and 15 acres (large farm size). This farm size classification is in agreement with the classification of farm sizes made by Akinsorotan (2007). With the mean farm size being 6.6 acres, it could be deduced that most of the respondents had farm sizes above the subsistence level. Minimum farming experience of the
respondents in the study area was 7 years while the maximum was 65 years. Most (44.8%) of the respondents had between 17 and 26 years of experience in their enterprises, (26.6% ) had
between 7 and 16 years of experience while 0.7% had between 47 and 56 years of experience. With the above distribution and the mean of 23.8 years, it could be deduced that the respondents had quite high numbers of years of farming experience, which may have broaden their knowledge and experiences in their enterprises. According to the affirmation of Ezeh (2013), farming experience of
farmers is directly proportional to knowledge gained to tackle farm production problems and to enable higher output and income. The finding of the study also affirms that most (62.9%) of the
respondents fund their enterprises with their personal savings, 20.3% funded with cooperative credit and loan while 12.6% borrowed money from their family members. The result further shows that
3.5% of the farmers in the study area took bank loans while 0.7% sought financial assistance from friends. This result implies that most of the entrepreneurs do not have access to substantial
funds for their enterprises, but rather depended mostly on use of the profit realised in previous season. It could also be inferred from this that, their inability to access and utilise loan from bank may
be due to farmers’ lack of certificates of occupancy or adequate collateral security. Result of the study further shows the minimum (₦7,470) and the maximum (₦415,000) range of
farmer’s monthly income in the study area with the mean monthly income of ₦98,087.9. This suggests that most of the entrepreneurs operated on medium scale. This implies that the farmers would have enough to cater for utilisation of AMI. This disagrees with the findings of Ezeh (2013) that most farmers were low income earners (₦21,000 – ₦40,000 monthly) as they were smallholders.
Table 2 Distribution of respondents by enterprise characteristics n=143
Variables Frequency Percentages
Crop cultivated
Maize 143 100

Nigerian Journal of Rural Sociology Vol. 16, No. 1, June 2015
26
Variables Frequency Percentages
Cassava 143 100 Yam 68 47.6 Cowpea 51 35.7 Vegetable 60 42.0
Water melon 2 1.4 Rice 1 0.7 Cocoa 24 16.8 Oil palm 19 13.3
Plantain 5 3.5
Farm size 1-5 82 57.4 6-10 45 31.5 11-15 6 4.2 16-20 8 5.6 21-25 1 0.7 26-35 0 0.0
36-45 0 0.0 46-50 1 0.7
Year of farming experience 7-16 38 26.6
17-26 64 44.8 27-36 25 17.5 37-46 13 9.1 47-56 2 1.4
56-65 1 0.7
Monthly income 7,000-77000 53 37.1 77001-147000 73 50.4
147001-217000 13 9.1 217001-287000 09 2.8 287001-357000 00 00 357001-42700 1.0 0.7
Sources of finance Self 90 62.9 Family 18 12.6 Friend 1 0.7
Cooperative society
29 20.3
Bank 5 3.5
Source: Field survey, 2014
Available Agricultural Marketing Information
(AMI) sources
The study’s finding unveils that, friend and family was the available AMI source to all the respondents in the study area, this is closely
followed by 99.3% of the respondents with other farmers were their available AMI source while extension agents were available source for 98.6% of the respondents. Radio and phone were the most
(97.9% and 80.4%) available ICT- based AMI in the study area. On the other hand, the ICT-based AMI tools that were not available to many
respondents included Internet (27.3%), Cinema
(3.5%) and Fax (1.4%). This implies that social sources as well as ICTs tools were the available AMI sources in the study area. This is corroborated by the assertion of Ogbonna and Agwu (2013) that
radio, television and mobile phones were the most available ICTs to agricultural produce marketers. Table 3: Distribution of farmers by Available Agricultural Marketing Information sources (AMI), n=143
Information
channels
Available Percentage
Friends/ Families
143 100
Other farmers 142 99.3 Cooperative
society
87 60.8
Extension agents
141 98.6
Radio 140 97.9
Television 73 51.0 News paper 39 27.3 Poster 86 60.1 Internet 39 27.3 Mobile phone 115 80.4 Notice board 57 39.5 Media van 25 17.5 Hand bill 84 58.7
Magazine 32 22.4 Cinema 5.0 3.5 Fax 2 1.4
Source: Field survey, 2014
Use of ICT-based AMI
Table 4 shows the frequency of use of different ICT-based AMI devices in the study area. The weighted score derived from the responses to the use of the tools shows that radio (274.1) was the
most frequently used ICT for AMI for cassava and maize in the study area. This is followed by mobile phone (232.8), television (140.0), poster (114.8), and hand bills (112.70); cinema (13.3) and fax (7.9)
were the least used ICT-based AMI sources. This shows that majority of the respondents still rely on use of radio for receiving Agricultural marketing information which is in tandem with the study of
Usman et al, (2012) and Ogbonna and Agwu (2013) that, radio (M=2.71), mobile phones (M=2.64) and television (M=2.02) were the ICTs mostly used by the farmers.
Table 4: Distribution of respondents by use of ICT-based AMI n=143
ICT tools Always Occasionally Rarely Never Weighted score Rank
Radio 76.2 21.7 2.1 0.0 274.1 1st Mobile phone 64.3 12.6 13.7 8.4 232.8 2nd

Nigerian Journal of Rural Sociology Vol. 16, No. 1, June 2015
27
ICT tools Always Occasionally Rarely Never Weighted score Rank
Television 23.1 25.2 20.3 31.5 140 3rd Poster 7.0 33.6 26.6 32.9 114.8 4th Hand bill 16.1 25.9 19.6 38.5 112.7 5th
Newspaper 12.6 16.1 25.2 46.2 95.2 6th Notice board 12.6 20.3 18.2 49.0 86.6 7th Internet 11.9 6.3 11.2 70.6 49.5 8th Media van 2.1 7.0 19.6 71.3 39.9 9th
Magazine 4.2 10.5 10.5 74.8 34.1 10th Cinema 1.4 2.1 4.9 91.6 13.3 11th Fax 2.1 3.5 94.4 0.0 7.9 12th
Source: Field survey, 2014
On the level of ICT-based AMI used by the respondents, as shown in Table 5, the results show that, (55.2%) of the respondents were low level users of the ICT-based AMI while 44.8% were categorised as high level users. This finding is in
line with that of Usman, Adeboye, Oluyole and Ajijola,(2012) that the level of access and utilisation of ICTS facilities were generally low among farmers.
Table 5: Distribution of Respondents by Level of Use of ICT-Based AMI
Level of use Frequency Percentage
Low 79 55.2
High 64 44.8 Total 143 100.0
Source: Field survey, 2014
Purpose of using ICT-based Agricultural
Market Information
Table 6 shows the various purposes of use of ICT-based AMI by the respondents in the study area .The distribution by weighted score shows that
ICT-based AMI were mostly used for farm input survey (188.1), search for farm input (184.6), produce transportation facilitation (166.4), credit facilities survey (160.1) and market outlet survey
(159.4). This implies that ICT tools were used for various relevant marketing activities by the respondents in the study area which is in consonance with findings of Usman. et al. (2012)
that, marketing information is one of the most relevant ICTs services that could be offered to farmers in Nigeria.
Table 6: Distribution of respondents by purpose use of ICT-based AMI, n = 143
Purposes of use To a large extent
To a lesser extent
Not at all Weighted score
Rank
Farm input survey 88.8 10.5 0.7 188.1 1st Search for farm input prices 84.6 15.4 0.0 184.6 2nd
Produce transportation facilitation 66.4 33.6 0.0 166.4 3rd Credit facilities survey 67.1 25.9 7.0 160.0 4th Market outlet survey 66.4 26.6 7.0 159.4 5th Information search on crop cultivation 62.9 32.2 4.9 158.0 6th
Marketing research 52.4 36.4 11.2 139.2 7th
Source: Field survey, 2014
Hypotheses of the study
Hypothesis 1 was set to test for relationship between socio-economic characteristics of the
farmers and their extent of use of ICT-based AMI. Chi-square result shown in Table 7 depicts the two nominal socio-economic characteristics; primary occupation (χ2=19.518; p=0.000) and secondary
occupation (χ2=34.776; p=0.000) were significantly related to the use of ICT-based AMI. This implies that occupations of the respondents were among the major factors contributed to the effectiveness of the use of ICT-based AMI by the respondents in the study area as it determines the purpose and means of searching for ICT-based AMI by the respondents. However, sex and other education did
not affect respondents’ use of ICT-based AMI in the study area which was in agreement with the
submission of Banmeke and Ajayi (2008) that gender is not significant to the use of ICT. Table 7: Chi-square correlation between
socioeconomic characteristics of respondents and their level of use of ICT-based AMI
Variables χ2-value
P-value
Df Decision
Sex 1.522 0.217 1 Not significant
Other
education
8.852 0.182 6 Not
significant Primary occupation
19.518 0.000 3 Significant
Secondary occupation
34.776 0.000 4 Significant
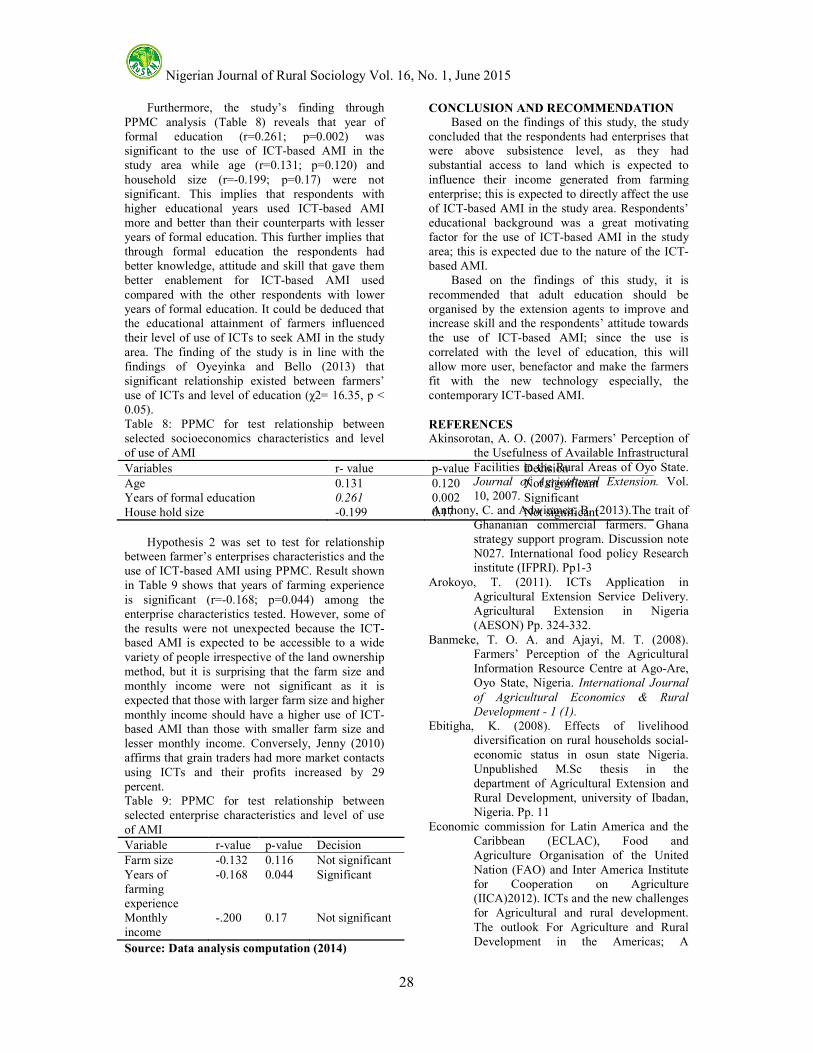
Nigerian Journal of Rural Sociology Vol. 16, No. 1, June 2015
28
Furthermore, the study’s finding through
PPMC analysis (Table 8) reveals that year of formal education (r=0.261; p=0.002) was significant to the use of ICT-based AMI in the study area while age (r=0.131; p=0.120) and
household size (r=-0.199; p=0.17) were not significant. This implies that respondents with higher educational years used ICT-based AMI more and better than their counterparts with lesser years of formal education. This further implies that through formal education the respondents had better knowledge, attitude and skill that gave them better enablement for ICT-based AMI used
compared with the other respondents with lower years of formal education. It could be deduced that the educational attainment of farmers influenced their level of use of ICTs to seek AMI in the study
area. The finding of the study is in line with the findings of Oyeyinka and Bello (2013) that significant relationship existed between farmers’ use of ICTs and level of education (χ2= 16.35, p < 0.05). Table 8: PPMC for test relationship between selected socioeconomics characteristics and level of use of AMI
Variables r- value p-value Decision
Age 0.131 0.120 Not significant Years of formal education 0.261 0.002 Significant
House hold size -0.199 0.17 Not significant
Hypothesis 2 was set to test for relationship between farmer’s enterprises characteristics and the use of ICT-based AMI using PPMC. Result shown in Table 9 shows that years of farming experience
is significant (r=-0.168; p=0.044) among the enterprise characteristics tested. However, some of the results were not unexpected because the ICT-based AMI is expected to be accessible to a wide
variety of people irrespective of the land ownership method, but it is surprising that the farm size and monthly income were not significant as it is expected that those with larger farm size and higher
monthly income should have a higher use of ICT-based AMI than those with smaller farm size and lesser monthly income. Conversely, Jenny (2010) affirms that grain traders had more market contacts
using ICTs and their profits increased by 29 percent.
Table 9: PPMC for test relationship between selected enterprise characteristics and level of use
of AMI
Variable r-value p-value Decision
Farm size -0.132 0.116 Not significant
Years of farming experience
-0.168 0.044 Significant
Monthly income
-.200 0.17 Not significant
Source: Data analysis computation (2014)
CONCLUSION AND RECOMMENDATION
Based on the findings of this study, the study concluded that the respondents had enterprises that were above subsistence level, as they had substantial access to land which is expected to
influence their income generated from farming enterprise; this is expected to directly affect the use of ICT-based AMI in the study area. Respondents’ educational background was a great motivating factor for the use of ICT-based AMI in the study area; this is expected due to the nature of the ICT-based AMI. Based on the findings of this study, it is
recommended that adult education should be organised by the extension agents to improve and increase skill and the respondents’ attitude towards the use of ICT-based AMI; since the use is
correlated with the level of education, this will allow more user, benefactor and make the farmers fit with the new technology especially, the contemporary ICT-based AMI.
REFERENCES
Akinsorotan, A. O. (2007). Farmers’ Perception of the Usefulness of Available Infrastructural
Facilities in the Rural Areas of Oyo State. Journal of Agricultural Extension. Vol. 10, 2007.
Anthony, C. and Adwinmea, B. (2013).The trait of
Ghananian commercial farmers. Ghana strategy support program. Discussion note N027. International food policy Research institute (IFPRI). Pp1-3
Arokoyo, T. (2011). ICTs Application in Agricultural Extension Service Delivery. Agricultural Extension in Nigeria (AESON) Pp. 324-332.
Banmeke, T. O. A. and Ajayi, M. T. (2008). Farmers’ Perception of the Agricultural Information Resource Centre at Ago-Are, Oyo State, Nigeria. International Journal
of Agricultural Economics & Rural
Development - 1 (1).
Ebitigha, K. (2008). Effects of livelihood diversification on rural households social-
economic status in osun state Nigeria. Unpublished M.Sc thesis in the department of Agricultural Extension and Rural Development, university of Ibadan, Nigeria. Pp. 11
Economic commission for Latin America and the Caribbean (ECLAC), Food and Agriculture Organisation of the United
Nation (FAO) and Inter America Institute for Cooperation on Agriculture (IICA)2012). ICTs and the new challenges for Agricultural and rural development.
The outlook For Agriculture and Rural Development in the Americas; A
Nigerian Journal of Rural Sociology Vol. 16, No. 1, June 2015
29
perspective on Latin America and the
Caribean.2011-2012. San Joes Coaster Rica. Pp115-139.
Empowering Small Holders Farmers in Market (ESFIM), (2010).Market information
system. Medwell mg Journals. Vol 5. Issue
6 Pp. 338-341. Ezeh, A. N. (2013a). Access and Application of
Information and Communication Technology (ICT) Among Farming Households of South East Nigeria. Agriculture and Biology Journal of North
America (2013), 4 (6): 605-616. ISSN
Print: 2151-7517, ISSN Online: 2151-7525, Doi:10.5251/Abjna.2013.4.6.605.616. Science huβ,
Http://Www.Scihub.Org/ABJNA Farhad, L., Roya, M., and Maryam,O. N. (2011).
Identifying appropriate information and communication technology (ICT) in improving marketing of agricultural products in Garmsar City, Iran, African Journal of Biotechnology Vol. 10(55), pp. 11537-11540, 21 September, 2011
Available online at http://www.academicjournals.org/AJB DOI: 10.5897/AJB11.1636 ISSN 1684–5315 © 2011 Academic Journals
Federal Ministry of Agriculture and Rural Development (2011). Agricultural Transformation Agenda: We Will Grow Nigeria’s Agricultural Sector.
IFAD (2008). Improving marketing strategies in Western and central Africa. Enabling poor rural people to overcome poverty. Rome, Italy. www.ifad.org.www.rural poverty
portal.org. Pp. 1-4. Jenny, C. A. (2010). Does Digital Divide or
provide? : The Impact of cell phones on Grain Markets in Niger. Job Market Paper.
www.cgdev.org /Aker_job_Mark….r_15jan08_2. Pp 1
Ogbonna, O. I, and Agwu, A. E. (2013). Access
and use of information communication Technologies by Rural Farmers In Enugu North Senatorial Zone, Enugu State. Scholarly Journal of Agricultural Science
Vol. 3(7), Pp. 264-270. Available Online At Http:// Www. Scholarly-Journals.Com/SJAS ISSN 2276-7118.
Olajide, B. R. (2011). Assessment of Farmers’ Access to Agricultural Information on Selected Food Crops in Iddo District of Oyo State, Nigeria. Journal of
Agricultural and Food Information Vol.
12 No. 3 & 4: 354-363 Olaniyi, O. A., Adetumbi, S. I. and Adereti, M. A.
(2013). Accessibility and relevance of information and communication
technologies (ICTs) among cassava farmers in Nigeria. African journal of
agricultural research vol. 8(35), pp. 4514-4522, 12 September, 2013 DOI:10.5897/AJAR2013.7260
Oyeyinka, R. A. and Bello, R. O. (2013). Farmers Use of ICTs for Marketing Information Outlets in Oyo State, Nigeria. Journal of
Agricultural Science; Vol. 5, No. 11; 2013 Canadian Centre of Science and Education. doi:10.5539/jas.v5n11p150 URL:
http://dx.doi.org/10.5539/jas.v5n11p150 United States Agency for International
Development (USAID) (2011). Using ICT to provide Agricultural information in
Africa. Briefing paper of United state agency international development. Pp. 1-5
Usman, J. M., Adeboye, J. A., Oluyole, K. A. and Ajijola, S. (2012). Use of information and
communication technologies by Rural farmers in Oluyole local government area of Oyo state, Nigeria. Journal of Stored
Products and Postharvest Research .Vol.
3(11), pp.156-159. www.cyiar.org/consortium news/vitamin.

Nigerian Journal of Rural Sociology Vol. 16, No. 1, June 2015
30
ASSESSMENT OF SHARP PRACTICES AMONG FARMERS IN COCOA FARMING IN NIGERIA:
IMPLICATIONS FOR SUSTAINABLE IMPROVEMENT OF COCOA PRODUCTION AND TRADE 1Famuyiwa, B. S., 1Oduwole, O. O. 2Malik, M. B., and 1Williams, O. A.
1Cocoa Research Institute of Nigeria, Ibadan 2University of Ibadan, Ibadan Nigeria
E-mail: [email protected]
ABSTRACTS
The study investigated various areas of sharp practices among cocoa farmers in Nigeria, in an attempt to
deduce the implications to sustainable improvement of cocoa production and trade. More specifically, it
examined the socio-economic characteristics, determines levels of sharp practices, and establish the
relationships that exist between cocoa practices and their yield, quality and health. A set of pre-tested
questionnaire was used to solicit information from 600 respondents that were selected through multistage
sampling procedure from five geo-political zones where cocoa on commercial grown basis. Results showed that
majority (94%) male dominated cocoa farming while 81.5% were literate and a mean age of 48.6+14.0 years. It
also revealed that 67.5% aknowledged to high level sharp practices. However, there were negative and
significant relationship between sharp practices and yield r=-0.138; quality r=-0.172; and health r=-0.156; at
p<0.01. This implies that as cocoa farmers’ sharp practices increases, their yield, quality and health decreases.
Though increase in sub-standard bean yield has a negative consequence to sustainable cocoa farm practices
and trade, hence efforts should be made to change farmers’ operational behaviour for improved yield.
Keywords: Sharp practices, cocoa farming, sustainable, improvement, production and trade
INTRODUCTION
The term sharp practices is described by Wikipedia (2015) as a pejorative phrase to describe sneaky or cunning behaviour which is within
technical rules and law. Some other studies described it as misrepresentation, trickery, illegal and dishonesty in business operations. Ladele and Fadairo (2013) likened it to corruption, while
Friedrich (1989) in his study described corruption as a kind of behaviour that deviates from socially agreed norms and value. This term can however, be applicable to agriculture and more specifically
farming; this means misrepresentation and cutting corners in farming operations. It can also be said that sharp practices in every form of the qualifying terms along the value chain of all agricultural
products and most especially cocoa. In farm practices, sharp practices have been identified to cause serious economic, social, and environmental problems. Hence its actions are at variance with the
objectives of sustainability. Cocoa is one of the cash crops from the non-oil sector that contributes to the nation’s Gross Domestic Product (GDP). It contributed 5% to the
world market as stated by the Nigeria Investigative Reporting Project (NIRP, 2015) and serves as means of employment to over 2 million farm families while some agro-allied industries rely on cocoa beans as their raw materials. Cocoa has been discovered to play major roles in human health. It prevents heart disease, fights fatigue, prevents diabetes, prevents hypertension, prevents breast
cancer, arrests persistent cough, boosts your brain power, reduces the risk of blood clot and boosts libido (Cocoa Producer Alliance, COPAL 2007, ICCO,2008, and NCDC, 2008).
In spite of all these qualities and opportunities of its production to improve the nation’s economy,
it has been established in separate studies by Asogwa and Dongo (2008), Lawal et al (2005) and Ogunjimi and Farinde (2012) that farmers face a lot of operational challenges such as pests’
infestations, soil infertility and climate change. Attempt to solve these problems have led to indiscriminate use of chemicals and other pesticides; which are equally described as sharp
practices. Sosan and Akingbohungbe (2009) identified traces of pesticide residue in the blood serum and breast milk of some surveyed cocoa farm families. It has also been discovered that
farmer practices in cocoa plantation if unguided, can damage the environment (Wikipedia, 2015). A study by Famuyiwa (2013) established a positive relationship between farmers’ operational habits
and their farm yield. In another study by Sosan, Akingbohungbe, Durosimi and Ojo (2010) they attributed some health related issues such as prostate cancer, developmental effect, reproductive
defect, endocrine problems, headache, are predominant in cocoa growing areas due to farmers’ sharp practices in the use of pesticides. Consequently, farmers and stakeholders in the
cocoa value chain are exposed to environmental hazards due to farmers’ behavioural habits as a result of their sharp practices, socio-economic factors, and inappropriate usage of pesticides as reported by Mohit (2008). This has led to the International Cocoa and Confectionaries Organization (ICCO) (2008) to make concerted efforts in campaigning against indiscriminate use of
pesticides and Cocoa Alliance (2014) issued a warning letter to member states on the threat to stop exporting cocoa with Minimum Residue level (MRL) above 0.01mg.
Africa produces about 71.62 % of the world cocoa production, America about17.89%, while

Nigerian Journal of Rural Sociology Vol. 16, No. 1, June 2015
31
Asia and Oceania contribute about 10.46% (ICCO,
2015). However, consumption pattern is skewed toward the less producing countries; European Union 36 %, North America 24 %, North America 24 %, Asia and Oceania 16 %, Latin America 10
%, Other Europe 10 % and Africa 4 % (ICCO, 2014). Sustainability in the pattern of production rest on consumption hence those that dictate the bean quality do not go into much production, but consume high, while those that produce high because of their low income are much into sharp practices. Different interventions on sustainable farming
were developed to meet the world standard in the aspects of social, economic and environmental preservation. Sustainable farming definition can be deduced from the definition of sustainable
development by International Institute for Sustainable Development (IISD) (2013) as farming that meets the needs of the present without compromising the ability of future generations to meet their needs. To achieve this, ICCO, (2008) came up with list of Good Agricultural practices (GAP) for cocoa to guide farmers’ production. In 2004, there was an inauguration of National Cocoa
development Committee that started the cocoa rebirth (NCDC, 2008). During President Johnathan government in Nigeria, Cocoa Transformation Agenda (CocTA), which was an arm of
Agricultural Transformation Agenda (ATA) was inaugurated to improve cocoa production both in quality and quantity (Babatunde, 2012). However, studies have shown that traces of
chemical residues have been discovered in breast milk and blood serum of those feeding on some products of cocoa beans and relatives of cocoa farm families (Sosan and Akingbohungbe, 2009).
Consequently, there is a threat on the exportation of Nigeria cocoa due to some traces of chemical residues found in exported cocoa beans. Ogunjimi and Farinde (2012), Dongo and Asogwa (2009)
have also traced these residues to indiscriminate use of pesticides. Farmers who happen to be at the lower ebb of the ladder determine the quality, through their practices. More importantly, the
habits of stakeholders along cocoa value chain go a long way to determine the quality of cocoa and allied products produced for human consumption. This is justified by the request from the ICCO to the Stakeholders along the value chain, to adhere to Good Agricultural Practices (GAP) by farmers to reduce the residues found in exported cocoa beans. It requires a concise study of the extent to which
how farmers who are the primary producers of cocoa beans exhibit negative habits in their farm practices and deduce implications for sustainable production and trade. Therefore, to get a quality
bean, habits of farmers producing the beans need to
be redirected towards effective adoption of good
agricultural practices (GAP) The major objective of the study is to assess sharp practices in cocoa farming operations among farmers in Nigeria. The specific objectives are to;
1. assess the socio-economic characteristics of the farmers,
2. assess major sharp practices among the farmers,
3. determine the level of sharp practices among respondents,
4. evaluate the extent of cocoa farming sharp practices, and
5. deduce implications for cocoa production and trade. Hypothesis - There is no significant
relationship between cocoa farmers’ sharp practices
and yield in the study area
METHODOLOGY
A multistage sampling procedure was used in selecting respondents for the study using CRIN geographical information system (GIS) generated land use/land cover in cocoa farms in Nigeria. Stage one involved purposive selection of five from
six geo-political zones where cocoa is commercially grown in Nigeria. Stage two involved purposive selection (based on their production levels; the highest producing state was
selected) of one state from each of the five geo-political zones that support commercial production of cocoa, this gives a total number of five states (Ondo, Kogi, Abia, Cross Rivers and Taraba) from
the fourteen states. At stage three, selection of two local government Areas (LGAs) which were purposively selected (on their levels of production; the highest and the lowest producing LGAs) from
the list of LGAs based on their production level of cocoa to give 10 LGAs. Stage four was a random selection of one community from the lists of communities in each LGAs to give 10
communities. While stage five involved systematic random selection of 60 smallholder cocoa farmers from the list of cocoa farmers in each community to give 600 smallholders as the respondents for the
study. A structured interview schedule was used to elicit information from the respondents while data were analysed using descriptive and inferential statistical tools.
Development of scale to measure sharp practices
among farmers in cocoa farming
From exhaustive review of literature, (Lawal et
al; ICCO, 2008; Farinde and Ogunjimi, 2009;
CRIN, 2009 and Wright and Boorse, 2010), 54 sharp practices in cocoa farming were identified and standardized by six research scientists; one from each discipline (Entomology, Pathology,
Agronomy, Breeding, Processing, Soil protection and Nutrition, Economics and Extension) who

Nigerian Journal of Rural Sociology Vol. 16, No. 1, June 2015
scored each sharp practice. Practice with the score of .6 coefficient were considered appropriate for
the study based on David’s descriptor as explained by Subair (2007). Twenty nine sharp practices were finally considered. The 29 sharp practices were measured with a dichotomous scale of 1: 0,
practiced with a score of 1 and none practiced with a score of 0. However, the scores on yield, quality and effect on health were scored as 1 for practice for those sharp practices that affect and 0 for not
affecting yield, quality and health based on opinion of the Scientists. The data were subjected to descriptive and parametric analysis using SPSS 17.
RESULTS AND DISCUSSIONS
Socio-economic characteristics
The study revealed that about 46.2% of the respondents were between 41-60 years old with a
mean age of 48.57 + 14.08. This is an indication that middle aged group of the population are now going into farming. This supports sustainability as farming activities can only be handled by young
people. However, youthful age may encourage sharp practices, in attempt to cut corners. It also revealed that majority (94%) of the respondents were male, indicating majority of the farm were handled by male. It corroborates the findings of Oladipupo et al (2010) that farm work is skewed towards male because of gender inequalities.1 also shows that respondents had mean farm size
of 10.40 + 2.0 ha, with a mean age of farm a+ 2.2 years. The study supports the findings of Oluyole and Sanusi (2010). However the farmers’ mean farm age was 32.33+ 20.03 years. Very few
(18%) had farm equal or less than 10 years. About 48.67% were under 30 years production, while 51.33% cultivated farms more than 30 years old. The result corroborates Ogunjimi and Farinde (2010) that cocoa production in Nigeria is affected by old age. Majority (84.30%) had no extension contact.
Farmers’ contact with extension promotes access to appropriate information that supports sustainability. It implies that the respondents did not have access to information.
Table 1: Respondents’ socioeconomic characteristics N=600
Variables Freq Perc
Age 20-40 221 36.9 41-60 277 46.2 61-80 90 15.1 81-100 12 2
Sex
Male 564 94 Female 36 6
Nigerian Journal of Rural Sociology Vol. 16, No. 1, June 2015
32
. Practice with the score of .6 coefficient were considered appropriate for
David’s descriptor as explained (2007). Twenty nine sharp practices were
finally considered. The 29 sharp practices were measured with a dichotomous scale of 1: 0,
practiced with a score of 1 and none practiced with a score of 0. However, the scores on yield, quality
h were scored as 1 for practice for those sharp practices that affect and 0 for not
affecting yield, quality and health based on opinion of the Scientists. The data were subjected to descriptive and parametric analysis using SPSS 17.
The study revealed that about 46.2% of the 60 years old with a
. This is an indication that middle aged group of the population are now
ts sustainability as farming activities can only be handled by young
people. However, youthful age may encourage sharp practices, in attempt to cut corners. It also revealed that majority (94%) of the respondents were male, indicating majority of the farm practices were handled by male. It corroborates the findings
(2010) that farm work is skewed towards male because of gender inequalities. Table 1 also shows that respondents had mean farm size
2.0 ha, with a mean age of farm at 32.30 2.2 years. The study supports the findings of
However the farmers’ 20.03 years. Very few
(18%) had farm equal or less than 10 years. About 48.67% were under 30 years production, while
tivated farms more than 30 years old. The result corroborates Ogunjimi and Farinde (2010) that cocoa production in Nigeria is affected
Majority (84.30%) had no extension contact.
Farmers’ contact with extension promotes access to information that supports sustainability.
It implies that the respondents did not have access
Table 1: Respondents’ socioeconomic
Mean Std
48.57 14.08
Variables Freq Perc
Farm Size
0.5 - 10 ha 448 74.711 - 20 ha 86 14.3
21 - 30 ha 37 6.2
31 - 40 ha 5 0.8
> 40 ha 24 4
Age of Farm
<10 108 18
11 - 20 years 109 18.2
21 - 30 years 75 12.5
31 - 40 years 122 20.3
41 - 50 years 107 17.8
51 - 60 years 50 8.3
61 - 70 years 9 1.5
> 70 years 20 3.3
Farmers’ Extension
contact
Yes 76 12.70
No 524 87.30
Source: Field survey, 2013
Farmers’ sources of information
Figure 1 shows that majority (70%) seek information from Input dealers and 60% from friends and neighbours. However, only about 20% seek from research institutes and 20% from extension agents. Information is the acquisitioknowledge on an interest issue. Information
seeking behaviour is vital in agricultural development. This result indicated that the respondents do not seek information from experts. There is every possibility to be exposed to
environmental hazards. This is an indication that inappropriate sources of information as operational habit is high among the farmers and can encourage sharp practices. Consequently this behaviour does
not encourage sustainability of cocoa farming and lead to downsizing cocoa international trade.
Figure 1: Distribution of respondents by sources of information N=600 Source: Field survey, 2013 *Multiple responses were recorded
Perc Mean Std
74.7 10.4 2.0 14.3
6.2
0.8
4
18 32.3 2.2
18.2
12.5
20.3
17.8
8.3
1.5
3.3
12.70
87.30
Figure 1 shows that majority (70%) seek information from Input dealers and 60% from
owever, only about 20% and 20% from
extension agents. Information is the acquisition of knowledge on an interest issue. Information
seeking behaviour is vital in agricultural This result indicated that the
respondents do not seek information from experts. There is every possibility to be exposed to
s is an indication that inappropriate sources of information as operational habit is high among the farmers and can encourage sharp practices. Consequently this behaviour does
not encourage sustainability of cocoa farming and national trade.
Figure 1: Distribution of respondents by sources of

Nigerian Journal of Rural Sociology Vol. 16, No. 1, June 2015
Farmers’ educational level
Figure 2 shows the respondents educational
level with about 57% been able to have between complete primary to complete secondary education. However, only 24.5% did not complete primary education while 18.5% did not have any form of
formal education. Education is ability to be able to read and write. This result corroborates the natiliteracy rate of 59.57% as stated by UNESCO 2015 (Wikipedia, 2016). It shows that about 57% of the
farmers can read and write. This may be due to youth and retired civil servant entering the profession. There is high tendency for the respondent to understand different kinds of
hazards. Though this does not have control over their sharp practices. It can be deduced that literate farmers engaging in sharp practices do so because of quick financial returns and is negative to
sustainable cocoa farming. This is implied in the report of Mohit, 2008 that farmers in Ondo state use pesticides indiscriminately because of inability to purchase or scarce recommended pesticides.
Source: Field survey, 2013. Fig 2: Showing level of education of cocoa farmers in the study area.
Years of farming experience
Figure 3 revealed that the respondents had high years of farming experience in cocoa with mean
24+ 14.93 years. Experience is measured in years spent on job. It also brings about accumulation of Table 2: Distribution of respondents by level of production of cocoa
Production Level Scores
High Level >503kg
Medium >393<503
Low Level 393kg <
Source: Field survey, 2013 Minimum =11.67kg/ha Maximum =993.06kg/ha Mean = 218.79 kg/ha Standard deviation = 92.63 N=600
Farmers practice of sharp practices
Table 2 shows the major behavioural activities in cocoa farming where there are sharp practices among farmers in order. The first group of
Nigerian Journal of Rural Sociology Vol. 16, No. 1, June 2015
33
Figure 2 shows the respondents educational
ave between complete primary to complete secondary education. However, only 24.5% did not complete primary education while 18.5% did not have any form of
formal education. Education is ability to be able to read and write. This result corroborates the national literacy rate of 59.57% as stated by UNESCO 2015 (Wikipedia, 2016). It shows that about 57% of the
farmers can read and write. This may be due to youth and retired civil servant entering the profession. There is high tendency for the
erstand different kinds of
hazards. Though this does not have control over their sharp practices. It can be deduced that literate farmers engaging in sharp practices do so because of quick financial returns and is negative to
s is implied in the report of Mohit, 2008 that farmers in Ondo state use pesticides indiscriminately because of inability to purchase or scarce recommended pesticides.
Showing level of education of cocoa farmers
Figure 3 revealed that the respondents had high years of farming experience in cocoa with mean
Experience is measured in years spent on job. It also brings about accumulation of
knowledge. Experience supports sustainability but at times brings over confidence on the job. Encarta
(2009) opined that this may promote behavioural inflexibility.
Figure 3: Distribution of respondents by years of farming experience, n=600 Source: Field survey, 2013
Mean = 24 years Standard deviation = 14.93 years
Farmers’ production level
The study revealed, as shown in Table 2 that majority (62.83%) produced below 503kg/ha, with only 37.17% producing more than 503 kg, as in Table 2. CRIN, (2011) opined that many factors are
contributing to farmers low production. With production mean of 218.79kg/ha, such militating factors could be some sharp practices like; not seeking appropriate information, not attending
meeting, use of banned pesticides and not collection of required planting materials from the appropriate places. For instance a farmer who does not have information about CRIN high yielding
varieties will still plant the old varieties. Majority of these sharp practices have negative effect on cocoa yield and reduce the quality of beans hence consequence effect on trade.
Table 2: Distribution of respondents by level of production of cocoa
Frequency Percentage
223 37.17
59 9.83
318 53.00
Table 2 shows the major behavioural activities in cocoa farming where there are sharp practices among farmers in order. The first group of
behaviour is during spraying such as ‘not using
protective glasses when spraying’ ranking 1mean of (0.83), followed by use of hand glove (0.82), wearing overall/protective and boot (0.81),
Legend
Nigerian Journal of Rural Sociology Vol. 16, No. 1, June 2015
Experience supports sustainability but at times brings over confidence on the job. Encarta
(2009) opined that this may promote behavioural
Figure 3: Distribution of respondents by years of
The study revealed, as shown in Table 2 that majority (62.83%) produced below 503kg/ha, with only 37.17% producing more than 503 kg, as in
ed that many factors are
contributing to farmers low production. With production mean of 218.79kg/ha, such militating factors could be some sharp practices like; not seeking appropriate information, not attending
meeting, use of banned pesticides and not ollection of required planting materials from the
appropriate places. For instance a farmer who does not have information about CRIN high yielding
varieties will still plant the old varieties. Majority of these sharp practices have negative effect on
yield and reduce the quality of beans hence
behaviour is during spraying such as ‘not using
protective glasses when spraying’ ranking 1st with a followed by use of hand glove
(0.82), wearing overall/protective and boot (0.81),
Legend

Nigerian Journal of Rural Sociology Vol. 16, No. 1, June 2015
34
while nose cover had (0.79). This category of
behaviour is followed by famers’ sharp practices at breaking of pods (0.77) and in the use of pesticides. The list sharp practice according to the rank order is child labour with mean (0.47).
However, Table 3 shows the overall
categorization of the farmers into levels of sharp practices with majority (67.5%) indicating high level of sharp practices
Table 3: Mean rank order of farmers’ sharp practices
S/N Cocoa farmers' sharp practices Mean Std. Deviation Rank
1 Not using protective glasses when spraying 0.83 0.38 1
2 Not using Hand gloves when spraying 0.82 0.38 2
3 Not using Overall/Protective clothing when spraying 0.81 0.39 3
4 Not using Jungle boots during spraying 0.81 0.39 3
5 Not using nose protector when spraying 0.79 0.41 5
6 Use of sharp objects to break pod 0.77 0.42 6
7 Inappropriate disposal of unused chemicals 0.76 0.43 7
8 Using fertilizer/chemical not recommended for cocoa production
0.76 0.43 7
9 Using fertilizer/chemical not in the list of approved agrochemical
0.76 0.43 7
10 Inappropriate disposal of used chemical containers 0.76 0.43 7
11 Use of expired fertilizer/chemical 0.73 0.45 11
12 Use of polythene bags 0.72 0.45 12
13 Not washing of hands after chemical application 0.71 0.45 13
14 Drying of cocoa beans on bare concrete 0.71 0.46 13
15 Not reading chemical instruction before usage 0.71 0.46 13
16 Spraying of chemical against the wind 0.7 0.46 16
17 Inappropriate disposal of bad cocoa beans 0.69 0.46 17
18 Scooping/stirring chemical with bare hands 0.68 0.47 18
19 Not seeking right knowledge on recommended chemicals on cocoa
0.68 0.47 18
20 Use of unwashed containers for chemical application 0.68 0.47 18
21 Pod waste deposits as heap around farm area 0.67 0.47 21
22 Over dosage use of fertilizer/chemical 0.66 0.47 22
23 Application of fertilizer without prior test of soil/plant requirement
0.65 0.48 23
24 Taking advice from retailers 0.6 0.49 24
25 Not attending crop association meetings 0.59 0.49 25
26 Fermenting for less than 5 days 0.59 0.49 25
27 Mixing of fertilizer/chemicals as single dose application 0.48 0.5 27
28 Deposits of sweating from fermented cocoa bean 0.48 0.5 27
29 Use of child labour 0.47 0.5 29
Source: Field survey, 2013

Nigerian Journal of Rural Sociology Vol. 16, No. 1, June 2015
35
Level of sharp practices
Table 3: Farmers’ levels of sharp practices
Level of sharp practices
Scores Frequency Percentage
High level > 20.06 405 67.5 Low level < 20.06 195 32.5
Source: Field survey, 2013 Mean = 20.06
Standard deviation = 8.03 Maximum = 29 Minimum = 00.0
Correlate of farmers’ sharp practices and cocoa
yield, quality and health in the study areas
Table 4 showed that there were significant and
negative relationship between cocoa farmers’ sharp practices and yield at (r= -0.138; p>0.01), bean quality (r=-0.172; p<0.01) and health (r=-0.156;p<0.01) This implies that as farmers’ sharp
practices increase, there were decrease in yield, quality and health. This observation is supported by the study of Asogwa and Dongo (2009), in farmers’ use of pesticides. Mohit 2008 also attested to this that farmers in cocoa farming use pesticides indiscriminately which is referred to sharp practice to increase their yield.
Table 4: Correlation of farmers’ sharp practices and cocoa yield, quality and health in the study areas
Variable r r2 p Coefficient of
determination
Decision
Farmers' yield -0.138** 0.019 0.000 1.91% Significant
Bean quality -0.172** 0.030 0.001 3% Significant
Health -0.156** 0.024 0.000 2.43% Significant
Source: Field survey, 2013 ** p< 0.01
CONCLUSION
The study concluded that the mean age of farmers was 48.57 years with 10.4 ha farm size. Seventy per cent seek information from input dealers while 57% were able to complete primary
to secondary education. Among the sharp practices, non-use of protective materials when spraying, rank highest with 67.5% of the respondents, belonging to a group of sharp practices use.
However, there were significant and negative correlation between sharp practices and yield, quality and health at p<0.01.
Implications for cocoa sustainable production
and trade
The following implications for cocoa sustainable production and trade deduced from the
study are; To sustainable cocoa production Sustainable production is defined as Sustainable Production is the creation of goods and services using processes and systems that are: non-polluting, conserving of energy and natural resources, economically viable, safe and healthful for workers, communities, and consumers, socially
and creatively rewarding for all working people (Lowell Center for Sustainable Production (LCSP), 2016).
• Sharp practices among farmers are high hence it will affect yield, quality and health
• Farmers health and sustainable production will be affected by the identified sharp practices if not addressed
• When prices are low as regard of low quality and low yield, production will not be sustainable.
To trade Trade is defined as the buying and selling of goods and services on a market (Oxford Dictionary, 2000). Sharp practices reduce yield, quality and contribute to negative health. These will
consequently reduce the activity of cocoa trade. Adherence to Good Agricultural Practices, which prevent sharp practices • Increase quality and price of traded cocoa
• Improve trust in the cocoa value chain
• Increase efficiency in the cocoa value chain
RECOMMENDATIONS
• Enforcement of GAP for quality bean production
• Training and retraining of cocoa farmers on hazardous effect of sharp practices for sustainable cocoa production.
• Encouraging farmers to belong to farmers organisation in order to share knowledge from training
• Legislative policy on eradication of sharp
practices associated with cocoa farming operations and in all aspect of the cocoa value chain, such as safety use of chemicals will reduce the risk associated with sharp practices.
REFERENCES Asogwa, E. U. and Dongo, L. N. (2009) Problems
associated with pesticide usage and
application in Nigeria cocoa production: A

Nigerian Journal of Rural Sociology Vol. 16, No. 1, June 2015
36
review. African Journal of Agriculture
Research Vol. 4(8), pp. 675-683, August, 2009.Available online at http://www.academicjournals.org/AJAR.
Babatunde, J., 2012. Cocoa Transformation: Can
new team lift Nigeria’s cocoa production? Available from www.vanguardngr.com/2012/02/cocoa-transformation-can-new-team-lift-nigerias-cocoa-production/
COPAL (2007) The impact of cocoa consumption on health and wealth. Cocoa Producer Alliance COPAL presentation at 3rd
National Cocoa Day, Osogbo 2007, 3rd-5th February 2007 Osogbo Nigeria. Pp 38-74
Covey, S (2012) Harmony habits tips archives.
https://harmonyhabit.wordpress.com/category/goal-setting/
CRIN (2009) Cocoa research Institute of Nigeria (CRIN). Annual report 2008
CRIN (2011) Cocoa production survey 2007 final report; submitted to NCDC December, 2008
Famuyiwa, B.S., Torimiro, D.O, and Adesoji, S.A
(2013) Determination of Cocoa Farmers’ Knowledge on Environmental Hazards Associated with Cocoa Farming Operations in Nigeria. International
Journal of Knowledge, Innovation and Entrepreneurship, Volume 1. Issues 1-2. 2013.
Friedrich, Carl J., (1989). “Corruption concepts in
historical perspective”, in Heidenheimer, A., Johnston, Michael and LeVine, Victor (eds) Political Corruption: A Handbook, New Brunswick: Transaction publishers,
pp. 15-24. ICCO (2008) Manual of best known practices in
cocoa production. Version 1. Consultative board on the world cocoa economy
sixteenth meeting Berlin, Monday, 26 May 2008 at 10.00am CB/16/2
ICCO (2014) The world cocoa economy: current status, challenges and prospects. Multi-
year expert meeting on commodities and development. http://unctad.org/meetings/en/Presentation/SUC_MEM2014_09042014_ICCO.pdf
IISD (2013) What is sustainable development?. https://www.iisd.org/sd/
Ladele, A. A. and O. S. Fadairo (2013) Official Corruption and Sharp Practices As
Impediments To Transforming Smallholders To Agribusiness: Lessons From Agricultural Development Interventions in Nigeria Nigerian Journal
of Rural Sociology Vol. 14, No. 1, October 2013
Lawal, B. O., Torimiro D. O., Banjo, A. D and
Joda, A. O. (2005) Operational habits and health hazards associated with pesticide usage by cocoa farmers in Nigeria: lessons for extension work. J. Hum. Ecol., 17(3):
191-195 (2005) LCSP, (2016) What is sustainable production?
http://www.sustainableproduction.org/abou.who.php
Mohit, J. (2008) Nigerian farmers want government to buy off banned pesticides Submitted on Wed, 07/23/2008 - 14:35. http://www.topnews.in/
NCDC (2008) NCDC (2008) A handbook of the 4th National Cocoa day held in Akure, Ondo State, Nigeria. Published by NCDC
NIRP, (2015) Cocoa: A farmer’s nightmare crop
Ogunjimi, S.I., and Farinde A.J. (2012) Farmers’ Knowledge Level of Precautionary Measures in Agro-Chemicals Usage on Cocoa Production in Osun and Edo States, Nigeria. International Journal of Agriculture and Forestry. 2012; 2(4): 186-194
Quallette, J. (1998) Habit and intension in everyday
life: the multiple processes by which past behavior predicts future behavior. Psychological Bulletin Copyright 1998 by the American Psychological Association,
Inc.1998, Vol. 124, No. 1, 54-74 0033-2909198
Subair, S. K. (2007) Attitude of farmers towards cultivation of bambara groundnut in North
East Botswana. 22nd Annual Conference of AIAEE. pp 638-645 www.aiaee.org
Sofroniou, A (2013) Psychology, concepts of behavior. Published by Lulu.com 2013 pp
133 Sosan, M. B., Akingbohungbe, A. E. (2009)
Occupational Insecticide Exposure and Perception of safety measures among
cacao farmers in southwestern Nigeria. Archives of environment and occupational health 64 (3) 185-193, 2009.
Sosan, M. B., Akingbohungbe, A. E., Durosinmi,
M. A., Ojo, I. A. O. (2010) Erythrocyte chrolinesterase Enzyme activity and Haemoglobin values in cacao farmers of Southwestern Nigeria as related to insecticides exposures. Archieves of Environment and occupational Health 65(1) 27-32
Starr, C., Taggart, R. (1992) Biology: the unity and
diversity of life. 6th ed. Wadsworth Publishing; Belmont, CA: 1992.
Wikipedia (2015) Environmental effect of cocoa production.
https://en.wikipedia.org/wiki/Environmental_effects_of_cocoa_production

Nigerian Journal of Rural Sociology Vol. 16, No. 1, June 2015
37
Wikipedia (2015) sharp practices.
https://en.m.wikipedia.org/wiki/Sharp practices
Wikipedia (2016). UNESCO https://en.m.wikipedia.org/wiki/UNESCO
Wright, R. T. and Boorse, D. F. (2011). Environmental Science: Toward a
sustainable future Plus mastering
environmental science with Access card package, 11/E Four categories of human environmental hazards. Http://wps.prenhall.com/esm_wright_envi
sci11_oa

Nigerian Journal of Rural Sociology Vol. 16, No. 1, June 2015
38
CAPITAL ASSETS AS BUILDING BLOCKS FOR LIVELIHOOD ACTIVITIES AND
SUSTAINABILITY AMONG RURAL DWELLERS IN HADEJIA-NGURU WETLANDS, NIGERIA 1Tafida, A. A. and 2Galtima, M.
1Department of Agricultural Economics and Extension, Modibbo Adama University of Technology, Yola, Nigeria
2Department of Geography, Modibbo Adama University of Technology, Yola, Nigeria
E-mail: [email protected], tafidaaa2mautech.edu.ng
ABSTRACT Farming remains the most important livelihood activity in many communities. However, it is increasingly
becoming unable to provide sufficient means of survival for the rural populace on its own. To that effect, people
over the years have diversified their livelihood portfolios into other non-farm activities in an attempt to build
their resiliency. This paper examines capital assets’ availability and productivity, and the resilience strategies
adopted by rural dwellers in the Hadejia-Nguru-Gashua wetlands in mitigating their prevailing ecological,
environmental and management challenges. Stratified random sampling technique was used to draw 172
respondents from 15 communities of the wetlands. The study assessed assets availability and utilisation, as well
as the pattern of the resilience strategies adopted. Results revealed that the people have access to capital assets
and have developed multiple livelihood portfolios. It is therefore, recommended that more awareness should be
created to facilitate construction and expansion of these livelihood activities.
Keywords: Capital assets, resilience, livelihood activities, wetlands, rural community
INTRODUCTION
The Hadejia-Nguru-Gashua wetlands is endowed with vast land and other resources; forest, grazing areas, wildlife and water ranging from uplands to the low lands stretching down to the
aquatic environment where fish and diverse aquatic organisms abound. The wetlands system support a significant number of the populace for livelihoods in terms of cultural, socioeconomic development,
food security and community livelihoods (Tafida and Galtima, 2015). The wetlands directly support about 1.5 million farmers, herders and fishermen (Wikipedia, 2015). These once-very productive
wetlands system have in the last two decades witnessed series of ecological problems. In addition, the current climatic changes and poor resource management in the area further
accentuated the problems (Kaugama and Ahmed, 2014). The primary direct drivers of degradation and biodiversity loss in the wetland include changes in the environmental factors, infrastructure
development, land use, water withdrawal, pollution, over-exploitation of resources, and the introduction of invasive aquatic species-typha grass (Ovie et al., 2007).
In fact, studies have shown that wetlands are among the world’s most stressed ecosystems (Mitsch and Gosselink, 2000; Smardon, 2009; Keddy, 2010). Exacerbating the situation is the recent recurring human security insurgence and other setbacks in the region, which greatly endanger and jeopardize the lives and livelihoods of the rural dwellers dependent on the wetland
resources particularly in terms of food security. Earlier study by Chambers and Conway (1992) indicated that livelihood and survival of individuals, household groups and communities are
vulnerable to stresses (e.g. declining yield on soils, which degrade through salination, acidity or
erosion, declining in common property resource, declining water tables and rainfall etc), and shocks (e.g. wars, persecution, civil violence, droughts, storms, floods, famine, epidemic of crop pests or of animal or human illness among others).
The wetland community livelihoods are affected by ecological, environmental management and other induced social challenges. The people have apparently developed some strategies against
their plight; affecting the wetland and community livelihoods, though the rural dwellers often developed some resilience strategies against their plight. This is possible based on the premise that a
rural household has access to certain amount of resources generally referred to as capitals assets, which can be utilised to fashion out a set of livelihood strategies (crop farming, livestock
rearing, off farm employment, etc.) to improve its welfare (Chambers and Conway, 1992) However, these strategies performed by the wetland’s people remain fragmented. Against this backdrop the study
attempts to consolidate the strategies for sustainability of the natural resource base and for improvement in the livelihoods of the practitioners. As defined by Ellis (2000), a livelihood is made up
of the abilities, assets (stores, resources, claims, and access) and activities necessary for a means of living. Assets are the basic material or social, tangible or intangible services, resources, skills or attributes. They are the physical, natural, social, financial, and human resources that people use for constructing their livelihoods. Assets can be understood as partly chosen by design to reduce
vulnerability and to enable the household to survive stresses and shocks with minimum risk of threat to future livelihood (Cambers and Conway, 1992) This paper advocates that consolidation and
optimum use of capital assets in multiple livelihood portfolios would improve resilience and enhance

Nigerian Journal of Rural Sociology Vol. 16, No. 1, June 2015
sustainability of the dwindling wetlands resource base. It is against this background, the paper
intends to look at the capital assets accessibility and resilience strategies of the rural people in the wetlands.
METHODOLOGY
The Hadejia-Nguru wetlands are located between 12° 39′0″N and 10° 35′30″E, and receive the bulk of its water from Rivers Katagum,
Jama’are, Kafin Hausa and Burum Gana. These Rivers, originating mainly from the neighbouring states of Kano, and Bauchi, flow westerly and eventually unite at Gashua to form the Komadugu
Yobe River system that empties into the Lake Chad. The total land area is estimated to be about 84,000km2 (DFID-JWL, unpublished) in Ovie al., 2006. The wetlands provides employment,
income and food security to millions farmers who integrate farming with fishing and livestock herding - the dominant rural economic activities of the area. The nature of annual flooding in, the
region has made the area to be fertileproductive. The area provides grazing to about 506,000 cattle, 437,000 sheep, and 529,000 goats (HNWCP, unpublished) in Ovie et al. Bade people constitute the major ethnic group; although the Hausas, Fulanis, and Kanuris aform a sizeable population. are also important in the area. Primary data were mainly used for the
study using household interview schedule and Focus Group Discussion (FGD). Two hundred and ten (210) questionnaires were administered in 15 communities of the wetlands, using stratification
and simple random sampling technique out of which 172 were successfully retrieved and analyzed. The data were analyzed mainly using descriptive statistics. Capital assets were analyzed using scoring technique. For each asset, a scale of 1-5 with the later being the highest in terms of productivity were given for the respondents to
score the present status of each asset compared
Figure 1: Sustainable Livelihood Framework (Adopted from
Nigerian Journal of Rural Sociology Vol. 16, No. 1, June 2015
39
sustainability of the dwindling wetlands resource base. It is against this background, the paper
intends to look at the capital assets accessibility and rural people in the
Nguru wetlands are located ′0″N and 10° 35′30″E, and receive
the bulk of its water from Rivers Katagum,
Jama’are, Kafin Hausa and Burum Gana. These the neighbouring
states of Kano, and Bauchi, flow westerly and eventually unite at Gashua to form the Komadugu
Yobe River system that empties into the Lake Chad. The total land area is estimated to be about
JWL, unpublished) in Ovie et
2006. The wetlands provides employment,
income and food security to millions farmers who integrate farming with fishing and livestock
the dominant rural economic activities of the area. The nature of annual flooding in, the
rea to be fertile and productive. The area provides grazing to about 506,000 cattle, 437,000 sheep, and 529,000 goats
(2006). The Bade people constitute the major ethnic group; although the Hausas, Fulanis, and Kanuris also form a sizeable population. are also important in the area. Primary data were mainly used for the
study using household interview schedule and Focus Group Discussion (FGD). Two hundred and ten (210) questionnaires were administered in 15
the wetlands, using stratification
and simple random sampling technique out of which 172 were successfully retrieved and
The data were analyzed mainly using descriptive statistics. Capital assets were analyzed
sset, a scale of 5 with the later being the highest in terms of
productivity were given for the respondents to
score the present status of each asset compared
with its status 20 years or more. Finally the average score for each asset was presented as the
status of the assets.
CONCEPTUAL FRAMEWORK
Rural livelihood remains a complex
phenomenon; natural vagaries, multidimensional poverty, and vulnerability affect their livelihoods negatively. However, no matter how poor, the locals often have assets on which they can draw to
pursue a diversified livelihood strategies and outcomes in order to attain sustainability. Taking a lead from the concept of sustainable livelihood (Figure 1) developed by the UK Department for
International Development (DFID, Deductions from studies in the wetlands have showed that the people are vulnerable to certain ecological, environmental, drought, flood, reduced
water table and rainfall and insect infestation on crop and animal diseases, which affect their livelihoods negatively (Neiland, 2000; Tafida and Galtima, 2015). At the same time, the framework
emphasizes that the poor people have assets and choices irrespective of their conditions, which the present paper intends to help in consolidating and broadening the choices of the people dependent on wetland resources. Empirical evidence from a variety of locations suggests that rural households do indeed engage in multiple activities and rely on diversified income portfolios. In sub
Africa, a range of 30–50 per cent reliance on nonfarm income sources is common; but it may attain 80–90 per cent in southern Africa. Certain policy, institution and processes are instrumental through
operational laws, policies, culture and established institutions often guide these engagements. To some extent, they approve good practices and checkmate the bad ones. Finally, the whole idea of the framework leads to livelihood outcome in terms of more income, increased well-vulnerability, improved food security and
sustainable natural resources.
Figure 1: Sustainable Livelihood Framework (Adopted from DFID, 1999)
Nigerian Journal of Rural Sociology Vol. 16, No. 1, June 2015
with its status 20 years or more. Finally the average score for each asset was presented as the current
Rural livelihood remains a complex
natural vagaries, multidimensional poverty, and vulnerability affect their livelihoods negatively. However, no matter how poor, the
ts on which they can draw to
pursue a diversified livelihood strategies and outcomes in order to attain sustainability. Taking a lead from the concept of sustainable livelihood (Figure 1) developed by the UK Department for
International Development (DFID, 1999). Deductions from studies in the wetlands have showed that the people are vulnerable to certain ecological, environmental, drought, flood, reduced
water table and rainfall and insect infestation on crop and animal diseases, which affect their
2000; Tafida and Galtima, 2015). At the same time, the framework
emphasizes that the poor people have assets and choices irrespective of their conditions, which the present paper intends to help in consolidating and
choices of the people dependent on wetland resources. Empirical evidence from a variety of locations suggests that rural households do indeed engage in multiple activities and rely on diversified income portfolios. In sub-Saharan
er cent reliance on non-farm income sources is common; but it may attain
90 per cent in southern Africa. Certain policy, institution and processes are instrumental through
operational laws, policies, culture and established e engagements. To
some extent, they approve good practices and checkmate the bad ones. Finally, the whole idea of the framework leads to livelihood outcome in terms
-being, reduced vulnerability, improved food security and

Nigerian Journal of Rural Sociology Vol. 16, No. 1, June 2015
RESULTS AND DISCUSSION
Capital assets Accessibility
The livelihood approach considered a myriad range of livelihood assets irrespective of the community or situation of the people. These capital assets comprise of the Human, Natural, Physical,
Financial and Social, which can be used to construct a livelihood strategy. The current study analyzed three components from each of the five capital assets that cut across the respondents, as
presented in figure 2. On the natural asset, the result shows the accessibility and productivity of land to be 2.8 on the scale of 5 points being the highest. Forestry is rated 2,5 while fisheries is 1.8
on the scale of 5 scored by the respondents. This shows that the productivity of the major natural resource base in the area has reduced remarkably with fisheries as the worst hit. Physical
infrastructure has equally dwindled with p(electricity) reduced to 0.6, road 2.5 and market
Figure 2: Capital assets accessibility a
Key: P=Physical assets; M=market, R=Road, P=power
H=Human assets; E= years of experience, S=number of skills, Sc=Years of schooling,
N=Natural=Natural assets, L= Land, F=Forestry, F=Fisheries
S=Social assets; C=Cooperative membership, R=Remittances, L=Linkages
F=Financial assets; S=savings, D=Disposable items, L=Livestock
Resilience strategies
Although, majority of the people in HadejiaNguru-Gashua wetlands are farmers, it is evident
from the study that they engaged in multiple livelihood activities as a resilience strategy against their environmental, ecological and other challenges. Figure, 3, shows that farming among
the five categories of activity analyzed still remains the most important livelihood activity in the community contributing 48.5% to the overall
income. This is followed by fishing with 19.8% and livestock with 14.4%, others comprise of trading (8.6%) and services (8.7%).The diversity
Nigerian Journal of Rural Sociology Vol. 16, No. 1, June 2015
40
The livelihood approach considered a myriad livelihood assets irrespective of the
community or situation of the people. These capital assets comprise of the Human, Natural, Physical,
Financial and Social, which can be used to construct a livelihood strategy. The current study
ts from each of the five capital assets that cut across the respondents, as
presented in figure 2. On the natural asset, the result shows the accessibility and productivity of land to be 2.8 on the scale of 5 points being the
while fisheries is 1.8
on the scale of 5 scored by the respondents. This shows that the productivity of the major natural resource base in the area has reduced remarkably with fisheries as the worst hit. Physical
infrastructure has equally dwindled with power (electricity) reduced to 0.6, road 2.5 and market
3.2, points. In terms of human capital, the people have vast experience with average years of
experience in the primary occupation of 22.2 years, average number of skills was ranked 3 and average number of years spent in school was 4.1 years. Social asset was assessed in terms of cooperative
membership, remittances and linkages as in figure 2. While the financial capital assessment centered on savings disposables items and livestock. Livelihood strategies and outcomes at the
household level depend to a large degree on the amounts and qualities of these assets owned or controlled by the household. Land and water endowments can be viewed as elements of natural
capital, while human capital includes the amouand quality of labour available. The optimal combination of investments in the five forms of capital might be viewed as a necessary condition
for achieving sustainable rural development.
Figure 2: Capital assets accessibility and productivity in the wetlands
Key: P=Physical assets; M=market, R=Road, P=power
H=Human assets; E= years of experience, S=number of skills, Sc=Years of schooling,
N=Natural=Natural assets, L= Land, F=Forestry, F=Fisheries
embership, R=Remittances, L=Linkages
F=Financial assets; S=savings, D=Disposable items, L=Livestock
Although, majority of the people in Hadejia-wetlands are farmers, it is evident
from the study that they engaged in multiple livelihood activities as a resilience strategy against their environmental, ecological and other challenges. Figure, 3, shows that farming among
ty analyzed still remains the most important livelihood activity in the community contributing 48.5% to the overall
income. This is followed by fishing with 19.8% and livestock with 14.4%, others comprise of trading (8.6%) and services (8.7%).The diversity of
livelihoods is an important feature of rural survival but often overlooked by the architects of policy. Diversity is closely allied to flexibility, resilience
and stability. In this sense, diverse livelihood systems are less vulnerable than undiversifithey are also likely to prove more sustainable over time, precisely because they allow for positive
adaptation to changing circumstances. In a broad sense, analysis of ‘resilience’ is about the potential capacity of systems to adapt to shocks, rec
that disturbance and change are integral component of complex systems.
3.2, points. In terms of human capital, the people have vast experience with average years of
experience in the primary occupation of 22.2 years, average number of skills was ranked 3 and average
r of years spent in school was 4.1 years. Social asset was assessed in terms of cooperative
membership, remittances and linkages as in figure 2. While the financial capital assessment centered on savings disposables items and livestock.
es and outcomes at the
household level depend to a large degree on the amounts and qualities of these assets owned or controlled by the household. Land and water endowments can be viewed as elements of natural
capital, while human capital includes the amount and quality of labour available. The optimal combination of investments in the five forms of capital might be viewed as a necessary condition
for achieving sustainable rural development.
livelihoods is an important feature of rural survival but often overlooked by the architects of policy. Diversity is closely allied to flexibility, resilience
and stability. In this sense, diverse livelihood systems are less vulnerable than undiversified ones; they are also likely to prove more sustainable over time, precisely because they allow for positive
adaptation to changing circumstances. In a broad sense, analysis of ‘resilience’ is about the potential capacity of systems to adapt to shocks, recognizing
that disturbance and change are integral component

Nigerian Journal of Rural Sociology Vol. 16, No. 1, June 2015
CONCLUSION
Ecological, environmental, management and other human factors have grossly undermined the potentials of the hitherto rich HadejiaGashua wetlands, thereby subjecting millions of
people dependent on the natural resource base for their livelihood into poverty and poor socioeconomic well-being. In spite of their conditions, the people always draw their capital
assets of Human, Physical, Natural, Human and Social to construct a multiple livelihood portfolio as resilience strategies to address their plight and to attain sustainability. Though an excellent and better
approach, it has been consolidated and broadened to achieve meaningful outcomes. Therefore, this study have shown that assets accessibility and pattern of resilience strategies adopted have
consolidated the people thoughts bhorizon of their opportunities in order to sustain the dwindling natural resource base, improve their well-being and to guide the policy. The challenge, therefore, lies in operationalizing the concept of resilience and making it practically and pragmatically meaningful when it comes to its
implementation on the ground.
REFERENCES
Carpenter, S. R., B. H. Walker, J. M. Anderies and
N. Abel (2001). From metaphor to measurement: resilience of what to what? Ecosystems Vol. 4 pp 765-781
Chambers, R, Conway G. 1992. Sustainable rural
livelihoods Practical concepts for the 21st century. Institute of Development Studies
(IDS) Discussion Paper 296 in Brighton, Sussex
DFID (1999) Sustainable livelihoods guidance sheets. department for international development (DFID), London, UK
Nigerian Journal of Rural Sociology Vol. 16, No. 1, June 2015
41
nvironmental, management and other human factors have grossly undermined the
rich Hadejia-Nguru-Gashua wetlands, thereby subjecting millions of
people dependent on the natural resource base for their livelihood into poverty and poor
being. In spite of their conditions, the people always draw their capital
assets of Human, Physical, Natural, Human and Social to construct a multiple livelihood portfolio as resilience strategies to address their plight and to
Though an excellent and better
approach, it has been consolidated and broadened to achieve meaningful outcomes. Therefore, this study have shown that assets accessibility and pattern of resilience strategies adopted have
consolidated the people thoughts broaden the horizon of their opportunities in order to sustain the dwindling natural resource base, improve their
being and to guide the policy. The challenge, therefore, lies in operationalizing the concept of resilience and making it practically and pragmatically meaningful when it comes to its
Carpenter, S. R., B. H. Walker, J. M. Anderies and
N. Abel (2001). From metaphor to measurement: resilience of what to what?
Conway G. 1992. Sustainable rural
livelihoods Practical concepts for the 21st Institute of Development Studies
in Brighton,
DFID (1999) Sustainable livelihoods guidance sheets. department for international
ment (DFID), London, UK
Ellis, F. (1999). Rural Livelihood diversity in
developing countries: evidence and policy implications Odi Natural Resources Perspective no 40 April 1999 pp. 40.
Ellis F. (2000). The determinants of rural
livelihood diversification countries. Journal of Agricultural
Economics, 51(2): 289-302 HNWCP (1997). Water management options for
the Hadejia-Jamaare-Yobe River Basin. IUCN- The World Conservation Union
Keddy, P.A. Wetland Ecology Principles and
Conservation: Cambridge University Press:
Cambridge, UK, 2010. Kaugama, H. H., & Ahmed, B. A. (2014). Prospect
and Challenges of Farming along the Hadejia-Nguru wetlands in Jigawa State
Nigeria. International Journal of Academic
Research and Management Science, 3
43-52. Mitsch, W.J. and Gosselink, J.G. (2000)
3rd ed.; John Wiley and sons: New York, NY, USA, 2000.
Neiland, A. E. (1997). Traditional Management of
Artisanal fisheries in North East Nigeria: Final Report, CEMSRE Report No 43, Portsmouth, UK. 400p
Neiland, A. (2000). “Traditional management
system and poverty alleviation in Nigeria”. paper presented at the seminar on livelihoods and fisheries management in the sahelian region.CIFA/PD/FAO
Ougadougou. Burkina Faso 3Pp93-114
Ovie, S.I., B.M.B. Ladu and A. A Tafida (2006). Food security and poverty alleviation
through improved valuation and governance of River Fisheries in Africa. characterization of key fisheries stakeholders and the impact of fisheries on livelihoods in the Komad
Nigerian Journal of Rural Sociology Vol. 16, No. 1, June 2015
Ellis, F. (1999). Rural Livelihood diversity in
developing countries: evidence and policy Natural Resources
Perspective no 40 April 1999 pp. 40. Ellis F. (2000). The determinants of rural
in developing Journal of Agricultural
HNWCP (1997). Water management options for
Yobe River Basin. The World Conservation Union
Wetland Ecology Principles and
ge University Press:
Kaugama, H. H., & Ahmed, B. A. (2014). Prospect and Challenges of Farming along the
Nguru wetlands in Jigawa State
International Journal of Academic
Research and Management Science, 3(6),
tsch, W.J. and Gosselink, J.G. (2000) Wetlands, 3rd ed.; John Wiley and sons: New York,
Neiland, A. E. (1997). Traditional Management of
Artisanal fisheries in North East Nigeria: Final Report, CEMSRE Report No 43,
and, A. (2000). “Traditional management
system and poverty alleviation in Nigeria”. paper presented at the seminar on livelihoods and fisheries management in the sahelian region.CIFA/PD/FAO
Ougadougou. Burkina Faso 3-5 Jul. 2000
, S.I., B.M.B. Ladu and A. A Tafida (2006). Food security and poverty alleviation
through improved valuation and governance of River Fisheries in Africa. characterization of key fisheries stakeholders and the impact of fisheries on livelihoods in the Komadugu-

Nigerian Journal of Rural Sociology Vol. 16, No. 1, June 2015
42
Yobe Basin of Lake Chad, Nigeria. Project
report No.1 Ovie, S.I., Raji, A., Ladu, B. M.B. and Tafida A. A.
(2007). Characterization of key stakeholders in the Kamadugu Yobe Basin of Lake Chad,
Nigerian Journal of Arid Zone Fisheries
3(2):66-76
Smardon, R.C. (2009).Sustaining the Worlds
wetlands; Setting Policies and Resolving
Conflicts; Springer Press: New York, NY,
USA, 2009 Tafida, A. A and Galtima, M.
(2015).Environmentally induced alternative livelihood strategies among the artisanal
fisher folk of Kainji Lake Basin, Nigeria. International Journal of Environmental
Science and Development Vol. 7 No.1

Nigerian Journal of Rural Sociology Vol. 16, No. 1, June 2015
43
CORRUPT PRACTICES IN THE GROWTH ENHANCEMENT SUPPORT SCHEME (GESS):
EMPIRICAL EVIDENCE FROM FARMERS’ PERCEPTION IN OSUN AND ONDO STATES,
NIGERIA Lawal, B. O. and Oyedokun, O.
Institute of Agricultural Research and Training, Moor Plantation, Ibadan
E-mail: [email protected]
ABSTRACT
The study was carried out to investigate corrupt practices perceived by farmers in the Growth Enhancement
Support Scheme (GESS) in Osun and Ondo states. A structured interview schedule was designed to elicit
information from 187 farmers that were selected through a multistage sampling procedure. Results show that all
(100%) the farmers interviewed were aware of the GES scheme. More than half of the farmers benefitted from
improved seeds (67.3%) and bags of fertiliser (52.9%). Majority of the farmers (71.7%) agreed to the statement
that ‘there is diversion of inputs to retailers who in turn sell the commodity to farmers at the prevailing market
price’. Sixty-two percent of the farmers agreed to the statements on ‘disappearance of input dealers/officials at
redemption centres’ and that of ‘repeatedly requesting farmers to come to the redemption centres to redeem
their inputs without receiving the inputs’. Other corrupt practices perceived by farmers included distant
redemption centres (54.5%), non-appearance of farmers’ name in the redemption list (65.2%) and use of delay
tactics by officials at the redemption centres denying farmers of their inputs (45.5%). More than half (52.9%) of
the farmers had positive perception of corrupt practices among officers involved in the implementation of the
scheme. Years of schooling was found to be positive and significantly correlated with perception of corrupt
practices (r=0.166; p≤ 0.05). The study recommended the need for increase in the number of the redemption
centres, timely input supply, proper monitoring of the officials involved in the distribution of the inputs and
reduction of needless bureaucratic regulations.
Keywords: Corrupt practices, Growth Enhancement Support Scheme, farmers’ perception, farmers.
INTRODUCTION
Agriculture is the mainstay of the economy of Nigeria contributing about 40.0% to the Gross Domestic Product (GDP) (National Bureau of
Statistics, 2012) and also employs 70% of the active population (FGN, 2008). It is an important sector of the economy with high potentials for employment generation, food security and poverty
reduction. Attempts have been made in past years to boost farmers’ productivity through supply of farm inputs such as improved seeds and seedlings, agrochemicals and fertilisers at subsidised rates.
However, corruption, dishonesty and political interruption in the distributing channels have been major challenges as a large proportion of these inputs could not reach farmers. Most of the inputs
were diverted by political elites for personal gains (Adesina, 2013). The bid to do things differently and surmount the difficulties encountered in the distribution of fertiliser by past government led to
the introduction of the Growth Enhancement Support Scheme (GESS) under the Agricultural Transformation Agenda (ATA) which was designed for smallholder farmers. It was designed for the specific purpose of providing affordable agricultural inputs (fertilisers and hybrid seeds) to farmers in order to increase their yields per hectare, make it comparable to world standard and
ultimately achieving food security in Nigeria and lift five (5) million resource-poor farmers annually out of subsistence farming to commercial agriculture within three (3) years (Adesina, 2013).
The major stakeholders include the Federal Government of Nigeria, State Government in all
the 36 States of Federation, Federal Ministry of Agriculture and Rural Development, Input Suppliers, Agro-dealers, farmers groups and individual farmers (Natsa, 2013).
Corruption is a social-human factor that entails abuse of public office for gains. It encompasses unilateral abuses by government officials such as embezzlement and nepotism as well as abuses
linking public and private actors such as bribery, extortion, influence peddling and fraud (Centre for Democracy and Governance, 1999). It is a serious challenge to agriculture and has hindered
agricultural productivity and subsequent food security in the country. The Corruption Perception Index ranks countries and territories based on how corrupt their public sector is perceived to be.
Nigeria was ranked 144th in the Transparency International’s ‘Corruption Perception Index in 2013 and 136th in 2014 out of 175 countries/territories surveyed. However, the report
released by the Germany-based non-governmental organisation in 2015 showed that the country is the 39th most corrupt nation among the 175 countries on the index (This day, 2015). Meanwhile, Nigeria shared same position in the index with Cameroun, Iran, Lebanon, Kyrgyzstan and Russia. According to Johnson and Sharma (2004), corruption is more than bribery. Various forms of
corruption exist in the society. It includes bribery and grafting (extortion and kickbacks), kleptocracy (stealing and privatizing public funds), misappropriation (forgery, embezzlement, misuse
of public funds/goods and illegal appropriation of public funds/goods for private use), non-

Nigerian Journal of Rural Sociology Vol. 16, No. 1, June 2015
44
performance of duties and unfairly giving best jobs
to friends while in position of authority (cronyism/nepotism), influence peddling (favour-brokering and conflict of interest), acceptance of improper gifts (speed money), protecting
maladministration (cover- ups, perjury) and abuse of power (intimidation and torture). Others include manipulations of regulations (bias and rigging), electoral malpractice (vote buying and election rigging), rent seeking (public officials who illegally charge for services after creating artificial shortage), illegal campaign contributions (giving unregulated gifts to influence policies and
regulations), clientelism and patronage (politicians giving material favours in exchange for citizen support) (Bawa et al, 2010). With the introduction of the Growth Enhancement Support Scheme
(GESS), which seeks to bypass fraudulent middlemen in distributing subsidised fertiliser to farmers, it is expected to eliminate the brazen fraud of the past but has however created new forms of corruption. This includes systemic challenges and lapses, introduction of illegal fees and politicizing of the fertiliser subsidy. It is against this background that the study
investigated corrupt practices perceived by farmers in the GESS in Osun and Ondo states. The specific objectives of the study were to describe the personal and socioeconomic characteristics of the
farmers in the study area, determine farmers’ awareness and sources of information regarding GESS, examine benefits derived from the GESS by the farmers and find out farmers’ perception of
corrupt practices in the scheme. The study also hypothesised that there is no significant relationship between the socioeconomic characteristics of farmers and their perception of
corrupt practices in the GES scheme.
METHODOLOGY
The study was carried out in two states of
Southwest Nigeria. A multi-stage sampling procedure was used to sample farmers in each of the state. The first stage involved the selection of two out of the six states that make up the southwest
Nigeria using simple random sampling technique. Ondo and Osun states were thus selected for the study. The second stage involved the selection of two agricultural zones from each state. At the third stage, two extension blocks were randomly selected in each of the zones making a total of eight blocks. At the fourth stage, three cells/communities were randomly selected from each block and from these;
ten farmers were selected using random sampling technique. A total of 240 farmers were interviewed, however, 187 copies of the completed interview guides were retrieved for data analysis. Data for the
study were collected using a structured interview schedule.
Perception of corrupt practices by farmers in
the GESS was measured by generating a list of 12 perception statements (6 positive and 6 negative) which were responded to on a 5-point scale of Strongly Agree, Agree, Undecided, Disagree and
Strongly Disagree. Scores of 5, 4, 3, 2 and 1 were awarded to positive statements and the reverse for negative statements, respectively. Respondents with scores of mean and above were regarded as having positive perception while respondents with scores below mean were categorized as having negative perception. Data collected for the study were analysed using frequencies, percentages,
means and standard deviation and Pearson Product Moment Correlation.
RESULTS AND DISCUSSION
Socio-economic characteristics of farmers -
The data in Table 1 show that the mean age of famers was 49 years which is an indication that most of the farmers were in the middle age category and active. However, only 17.1% of the farmers were within the age of 60 and above. Seventy-one percent of the farmers were male while 28.9% were female. Fifty-four percent of the
farmers spent more than 6 years in school; an indication that they were educated. The mean number of years spent in school was 10.6 years. Only 17.1% of the farmers had no formal
education. This implies that majority of the farmers can read and write and keep abreast of current happening in the society. Household size of farmers varied from 1 to 9 with a mean of 6.8 persons. Half
of the farmers had household size of between 4 and 6 people. Also, a little above half (51.3%) of the farmers had farm size of between 1 and 4 acres and majority were into arable crop production such as
cassava (96.7%), maize (98.3%), vegetable (65.7%) and rice production (52.4%). Forty-four percent of the farmers had more than 20years of farming experience while more than half (65.2%) were
members of social organisations such as cassava growers association and maize growers association among others. Almost half (49.7%) of the farmers indicated their access to extension agents more than
once a month in the last 6 months of the study. Table 1: Distribution of farmers by socioeconomic characteristics (n=187)
Socioeconomic characteristics
Frequency Percentage Mean
Age Below 30 05 2.7 30-39 28 15.0 49 40-50
50-59 60 and above
66
56 32
35.3
29.9 17.1
Sex Male 133 71.1

Nigerian Journal of Rural Sociology Vol. 16, No. 1, June 2015
45
Socioeconomic characteristics
Frequency Percentage Mean
Female 54 28.9
Years of
Schooling None
32
17.1
1-6 52 28.9 10.6
7-12 44 26.2 13-18 >18
32 04
25.7 2.1
Household size
1-3 10 5.3 6.89 4-6 94 50.3 7-9 >9
49 34
26.2 18.2
Farm size (acre)
<1 1-2 3-4
4-5 >5
Crop
Enterprise
Engaged by
farmers Maize Cassava
Vegetables Rice Yam Plantain
Tree crops
15 55 41
42 34 184 179 123 98
79 74 69
8.0 29.4 21.9
22.4 18.1 98.3 96.7 65.7 52.4
42.2 39.5 38.8
3
Year of farming
experience
1-5 24 12.8 21.7
6-10 27 14.4 11-15 22 11.8 16-20 >20
32 82
17.1 43.9
Membership of
Social
organisation
Yes 122 65.2
No 65 34.8
Number of
contact with
Extension agent in 6 months
None 24 12.8 1-3 26 13.9 4-6 44 23.5 9 7-9 20 10.7 >9 73 39.0
*Multiple responses were provided by respondents Source: Field Survey, 2014
Awareness, Registration and Information
sources - All (100%) the farmers were aware of the GESS and had registered for the programme one time or the other. Sources of information varied
among farmers. Majority (73.7%) of the farmers
obtained information on GESS from the Agricultural Development Programme (ADP) staff. However, 64.1% and 58.9% of the farmers obtained their information from farmers groups and
mass media, respectively. This also shows the mass awareness campaign of the government during registration. Only 26.7% of the farmers obtained information from the local government staff which is an indication that local government staff are not close to farmers at the grass roots (Table 2). Table 2: Distribution of farmers by awareness, registration and information sources on GESS
Variables Frequency Percentage
Awareness
Aware 187 100.00 Not aware
Registration of name
Yes
No
00 187
00
00.00 100.0
0.0
Information sources ADP staff Farmers’ Association
138* 120
73.7 64.1
Friends and Neighbours
105 56.1
Ministry of Agriculture
Local Government officials
25 50
13.4 26.7
Research Institutes 41 21.9 Mass Media 110 58.9
*Multiple responses were provided by respondents
Source: Field Survey, 2014
Benefits derived from GESS - Benefits derived from the GESS included access to
subsidised seeds (67.3%), access to subsidised fertilisers (52.9%), increased production as a result of subsidised inputs (32.6%) and increased income (31.6%) (Figure 1). Forty percent (40.1%) of the
farmers however, indicated that their crop yield was relatively constant while 27.3% indicated a decrease in crop yield. Only 32.6% of the farmers had their crop yield increased. This implies that the
benefits of the scheme have not been able to translate into increased productivity and income for most of the farmers.

Nigerian Journal of Rural Sociology Vol. 16, No. 1, June 2015
Source: Field Survey, 2014
Perception of corrupt practices by farmers
The data in Table 3 show the distribution of farmers based on their responses to perception statements on corrupt practices in the GESS. The data show that “diversion of input to retailers who in turn sell the commodities to farmers at prevailing market price was agreed to by 71.1% of the farmers (mean=3.88). This is related to influence peddling
and misappropriation forms of corruption. Also, 62.6% and 17.1% of the farmers agreed and strongly agreed to the statement on ‘disappearance of input and government officials at the redeeming
centres’ (mean=3.86). Requesting farmers to come to the redeeming centres repeatedly to redeem inputs without giving them the inputs was agreed to by 62.6% and 20.9% of farmers (mean=3.85). Forty-three percent and 13.9% of the farmers agreed and strongly agreed to the statementexistence of redeeming centres in their
communities. Thirty- seven percent of farmers agreed to the statement on non-appearance of their names in the redemption list (mean=3.44) despite the fact that they registered their names with the
Table 3: Distribution of farmers by responses to statements on perception of corrupt GESS
Perception statements Strongly agree
Diversion of inputs to retailers who in turn sell the commodities to farmers at the prevailing market practice.
24 (12.8)
Disappearance of input dealer’s officials at the redeeming centres
32 (17.1)
Requesting farmers to
come to the redemption centres repeatedly to
39 (20.9)
Nigerian Journal of Rural Sociology Vol. 16, No. 1, June 2015
46
Perception of corrupt practices by farmers -
The data in Table 3 show the distribution of s based on their responses to perception
statements on corrupt practices in the GESS. The data show that “diversion of input to retailers who in turn sell the commodities to farmers at prevailing market price was agreed to by 71.1% of the farmers
8). This is related to influence peddling
and misappropriation forms of corruption. Also, 62.6% and 17.1% of the farmers agreed and strongly agreed to the statement on ‘disappearance of input and government officials at the redeeming
Requesting farmers to come to the redeeming centres repeatedly to redeem inputs without giving them the inputs was agreed to by 62.6% and 20.9% of farmers (mean=3.85).
three percent and 13.9% of the farmers agreed and strongly agreed to the statement on the existence of redeeming centres in their
seven percent of farmers appearance of their
names in the redemption list (mean=3.44) despite the fact that they registered their names with the
government officials. Thirty- two percent of farmers also agreed that input and government
officials at the redeeming centres use delay tactics so that farmers can get frustrated and leave the centre without collecting inputs. About thirtypercent of the farmers strongly disagreed that input
officials did not request for gratification for services rendered to farmers. They believed some of them paid more than the pegged price for inputs. Thirty-two percent and 6.4% of the farmers agreed
and strongly agreed to the statement that input officials never requested for gratification for services rendered. However, 33.7% strongly disagreed with the statement.
The bureaucracy in the distribution of inputs at the redeeming centres is a factor that could lead orpromote corruption as many farmers may lose interest or get fed up with the situation thereby
giving chances to non- farmers or impostors to take advantage of the situation. Forty-three percent of the farmers disagree with the statement on denial of impostors by input dealers. It is evident from the
foregoing that various forms of corruption paraded itself in the distribution of inputs to farmers which range from abuse of office, influence peddling, bribery (extortion and kickbacks), nepotism, speed money and manipulations of regulations (Johnson and Sharma, 2004; Fadairo and Ladele, 2014). The data in Table 4 revealed that more than half (52.9%) of the farmers had positive perception of
corruption in the GESS while 47.1% had negative perception. This is an indication that corrupt practices exists in the agricultural sector especially in the implementation of the scheme. This
corroborates the findings of Nyankakyi (2002), Fadairo and Oladele (2014). It is also an indication that corrupt practices is not only political class, officials in rural development also have tendency of indulging in such when they have the opportunity to do.
Table 3: Distribution of farmers by responses to statements on perception of corrupt practices in the operation of
Agree Undecided Strongly disagree
Disagree Mean
133 (71.1) 17 (9.1) 10 (5.3) 3 (1.6) 3.88
117 (62.6) 22 (11.8) 11 (5.9) 5 (2.7)
3.86
117 (62.6) 5 (2.7) 15 (8.0) 11(5.9)
3.85
two percent of farmers also agreed that input and government
officials at the redeeming centres use delay tactics so that farmers can get frustrated and leave the
About thirty-four strongly disagreed that input
officials did not request for gratification for services rendered to farmers. They believed some of them paid more than the pegged price for inputs.
two percent and 6.4% of the farmers agreed
statement that input officials never requested for gratification for services rendered. However, 33.7% of farmers
the statement.
The bureaucracy in the distribution of inputs at the redeeming centres is a factor that could lead or promote corruption as many farmers may lose interest or get fed up with the situation thereby
farmers or impostors to take three percent of
the farmers disagree with the statement on denial of tors by input dealers. It is evident from the
foregoing that various forms of corruption paraded itself in the distribution of inputs to farmers which range from abuse of office, influence peddling, bribery (extortion and kickbacks), nepotism, speed
and manipulations of regulations (Johnson and Sharma, 2004; Fadairo and Ladele, 2014). The data in Table 4 revealed that more than half (52.9%) of the farmers had positive perception of
corruption in the GESS while 47.1% had negative indication that corrupt
practices exists in the agricultural sector especially in the implementation of the scheme. This
corroborates the findings of Nyankakyi (2002), Fadairo and Oladele (2014). It is also an indication
common to the political class, officials in rural development also have tendency of indulging in such when they have
practices in the operation of
Mean Std .Dev
Rank
3.88 0.75 1
3.86 0.85 2
3.85 1.03 3

Nigerian Journal of Rural Sociology Vol. 16, No. 1, June 2015
47
Perception statements Strongly agree
Agree Undecided Strongly disagree
Disagree Mean Std .Dev
Rank
redeem their inputs
without receiving inputs Non-appearance of farmers’ names in the redemption list
53 (28.3) 69 (36.9) 5 (2.7) 28(15.0)
32(17.1)
3.44 1.46 4
Redemption centres available in most communities
21 (11.2) 81 (43.3) 9(4.8)
51(27.3)
25(13.4)
3.12 1.27 5
Use of delay tactics at redemption centres so as to frustrate farmers
26 (13.9) 59(31.6)
21 (11.2) 62(33.2)
19(10.2) 3.06 1.27 6
Input officials never requested for gratification
for services rendered
12 (6.4) 62 (33.2) 38 (20.3) 63(33.7)
12 (6.4) 2.99 1.09 7
Strong denial of impostors by government officials and agro-dealers but
ensured farmers have access to inputs
21 (11.2) 51 (27.3) 9 (4.8) 15(13.4)
81(43.3)
2.88 1.29 8
Verification of GES cards/text messages of farmers by government officials at redeeming centres without man-know-man
9 (4.8) 67(35.8)
19 (10.2) 69 (36.9) 23 (12.3) 2.84 1.18 9
Farmers received not more than the amount of inputs they are entitled to
22 (11.8) 38(20.3)
14 (7.5) 85(45.5)
28 (15.0) 2.69 1.09 10
Farmers received no alert
messages regarding input collection or alert came late
25 (13.4) 34(18.2) 5(2.7)
86 (46)
37 (19.8) 2.51 1.29 11
Only registered farmers
obtained inputs at the redemption centres
9 (4.8) 21 (11.2)
3 (1.6) 95 (50.8) 59 (31.6) 2.08 1.10 12
Figures in parentheses are percentages Source: Field Survey, 2014
Table 4: Distribution of respondents based on categories of perception of corruption (n=187)
Categories of Perception
Frequency Percentage
Positive (37-48)
99 52.9
Negative (24-36)
88 47.1
Total 187 100.0
Source: Field Survey, 2014
Relationship between selected farmers’
socioeconomic characteristics variables and
perception of corrupt practices
The results on the relationship between farmers’ socioeconomic characteristics and their perception of corrupt practices (Table 5) show that only years of schooling of farmers (r=0.166) had a positive and significant relationship with farmers’
perception of corrupt practices at p≤ 0.05 level of significance. This implies that as farmers’ years of education increases, there is also increase in the tendency of the farmers to be able to perceive
corrupt practices better in a given situation. Educated farmers are likely to have adequate information on the prevailing situations in their environment. This is in support of Truex (2011)
who found education as a consistently strongest determinant of corruption acceptance in Nepal. He established that education plays a significant role in determining attitudes towards corruption. More educated individuals were consistently more critical of corruption. Education is likely to be “the key driver of social norms” (Heyneman, 2003; Heyneman, 2004) and therefore will be a key
element in turning people’s perception from corruption acceptance to corruption rejection.

Nigerian Journal of Rural Sociology Vol. 16, No. 1, June 2015
48
Table 5: Correlation analysis showing relationship
between farmers’ socioeconomic characteristics and their perception of corrupt practices
Farmers’ characteristics
Correlation Coefficient (r)
p-value Decision
Age 0.050 0.497 NS
Number of years spent in school
0.166* 0.039 S
Farm size 0.005 0.948 NS
Household
size
-0.035 0.640 NS
Years in Agricultural business
-0.059 0.439 NS
Number of contact with extension agent in the past 6 months
0.101 0.216 NS
*Significant at p<0.05
CONCLUSION AND RECOMMENDATIONS
The findings of the study led to the following
conclusions: Farmers in the study area had awareness and registered for GES scheme. Majority of the farmers obtained information on GESS from the
Agricultural Development Programme staff (ADP), farmers group and mass media indicating high awareness campaign of the programme. Benefits derived from the GESS by farmers include access
to subsidised seeds, access to subsidised fertilisers, increased production and increased income. Farmers were able to identify and perceive corrupt practices in the scheme. The corrupt practices
prevalent among the officers of the scheme ranged from bribery, extortion and kickbacks, influence peddling, abuse of power, nepotism and non-performance of duties. More than half of the
farmers had positive perception of corruption in the GES scheme which implies some forms of sharp practices in the implementation of the scheme. Farmers’ years of schooling positively influenced
their perception of corrupt practices in the study area. Based on the findings of the study, the following recommendations were made. (1) There is need to increase the number of
redemption centres in each communities so as to reduce the inefficiency in the number of redemption centres in the communities. While
government appears willing to commit billions of funds to subsidise inputs for farmers, significant resources should also be committed
to monitor the scheme effectively to prevent
fraud and corruption in all its forms so that smallholders can gain better access to subsidised inputs. In the same vein, many needless bureaucratic red tape and regulations
in public offices must be eliminated. This is because too much bureaucracy drives people to bribe to get through the red tape.
(2) Corruption inhibits social and economic development, impacting negatively on attempts to fight hunger and famine coherently and systematically, hence there is need for systematic and political will on the part of the
government through massive enlightenment campaigns and ensuring that deterrents are punished severely. Policy makers should take the advantage of the unique opportunity
provided by corrupt cases in GESS to push reforms of poorly designed subsidy schemes.
(3) Education has been found to play a significant role in corruption perception. Hence, there is need to invest in the education of the citizenry by the government. This will promote social cohesion (which is the acceptance of and support for social norms and behaviour),
ensure social contract and the willingness to act responsibly, or be good citizens and shun corrupt practices.
REFERENCES
Adesina, A. (2013). Press briefing on Agricultural reform. In: Acha, E., Boosting food security through Growth Enhancement Support
Scheme. The Road Newspaper. July 17th 2013. Accessed on 20th March, 2014.
Bawa, D.B., Ani, A.O and Nuhu, H.S (2010). Challenges of Greed and Corruption in
Agricultural Extension Development and Practice in Nigeria. Agricultural Journal 5 (1): 25-30.
Centre for Democracy and Governance (1999). A
handbook on fighting corruption. Technical publication series, Bureau for Global Programmes. United States Agency for International Development, Washington,
D.C., pp.5-18. Fadairo, O and Ladele, A (2014). Attitudes and
Perception of Corrupt Practices among Public Officials in the Agricultural Sector in Southwestern Nigeria. Developing Country
Studies 4(8): 1-9 ISSN 2225-0565 (Online) Retrieved 15 August from http://.iiste.org
Federal Government of Nigeria (2008). “National Food Security Program” Federal Ministry of Agriculture and Water Resources, Abuja, Nigeria.
Heyneman, S.P. (2003). “Defining the Influence of Education on Social Cohesion.”

Nigerian Journal of Rural Sociology Vol. 16, No. 1, June 2015
49
International Journal of Educational Policy,
Research and Practice 3&4: 73-97. Heyneman, S.P (2004). “Education and
Corruption.” International Journal of
Educational Development 24 (6):
637-648. Johnson, R. A. and Sharma, S. (2004). The
Struggle against corruption: A comparative study. New York: Palgrave MacMillan.
National Bureau of Statistics (2012). Review of Nigerian Economy in 2011 and Economic Outlook for 2012-2014. National Bureau of
Statistics, Nigeria. Natsa, R. T. (2013). Farmers Fault Federal
Government’s Growth Enhancement Scheme. The Leadership Newspaper.
July 4, 2013. Accessed on 12th March, 2014.
Nyantakyi, K.R. (2002), “Corruption: What is it?”
In Corruption and Development in Africa. Proceedings of a seminar organised by the Ghana Academy of Arts and Sciences with the Friedrich Ebert Foundation on
June 17-19. Ghana Academy of Arts and Sciences, Accra.
This day (2013). Understanding the Growth Enhancement Support Scheme. Retrived from http:/www.thisdaylive.com/articles/understanding-the-growth-enhancement-support scheme 153425/ accessed on June 14, 2015.
Truex, R (2011). “Corruption, Attitudes, and Education: Survey Evidence from Nepal.” World Development 39 (7): 1133-1142.

Nigerian Journal of Rural Sociology Vol. 16, No. 1, June 2015
50
CROP FARMERS’ PERCEPTION OF GROWTH ENHANCEMENT SCHEME IN CURBING
CORRUPTION IN INORGANIC FERTILISER DELIVERY IN ODEDA LOCAL GOVERNMENT
AREA OF OGUN STATE NIGERIA 1Oyetoro, J. O., 1Rahman, S. B., 1Oladipo, S. O. and 2Jolayemi, J. O.
1Department of Agricultural Extension and Rural Development, LAUTECH, Ogbomoso 2Department of Agricultural Education, Kwara State College of Education, Oro
E-mail: [email protected]
ABSTRACT
The study investigate crop farmers’ perception of Growth Enhancement Scheme (GES) in curbing corruption in
inorganic fertiliser delivery in Odeda Local Government Area of Ogun State Nigeria. Two-stage sampling
technique was used to select the 117 GES crop farmers and data was obtained with the aid of structured
interview schedule. Data was analyzed using frequency counts, percentages, means and t-test analysis. Findings
of the study revealed that mean age of the respondents was 51.9 years and the mean years of farming experience
was 29.2 years. The study also discovered that 62.4% of the respondents claimed to be facing serious problem
on cumbersome procedure in accessing fertiliser. The study also revealed that respondents developed negative
perception towards the following statements: “A token needs to be paid for easy registration of GES”; “None
registered farmers can also manoeuvre their way to get fertiliser”; “At fertiliser redemption centre, it is whom
you know to get fertiliser”; “Bad GSM network connectivity does not impaired redemption of fertiliser” and
“the price of GES fertiliser was not the same in the same locality”. Furthermore, no significant differences
existed (t= 0.948, p= 0.976) in the perceptional status index of male and female respondents of GES in curbing
corruption in inorganic fertiliser delivery. The study concluded that respondents perceived GES as being
effective in curbing corruption in fertiliser delivery and therefore recommends that efforts should be made to
ensure timely delivery of inorganic fertiliser by the GES stakeholders and sensitize people more about the
scheme.
Key words: Farmers’ Perception, Growth Enhancement Scheme (GES), Corruption, Fertiliser delivery.
INTRODUCTION
The Growth Enhancement Support Scheme (GESS) was designed as a component of the
Agricultural Transformation Agenda (ATA) of the Federal Government. The ATA is the Government’s response to the crisis that has riddled the agricultural sector in the past and seeks to put
agricultural growth at the centre of the Government’s development objective given its critical role for food security and economic diversification. At inception, the broad objective of
the GESS was to achieve food security for the nation at the macro level, and increase household income for the farmers at the micro level. The scheme was designed to encourage the stakeholders
in the fertiliser value chain to work together to improve productivity, household food security and raise the income of the farmer by providing direct subsidy through the supply of discounted fertilisers
and seeds. In the past, fertiliser procurement and distribution in the country has been fraught with fraud, discrepancies and inefficiencies. Governments at the Federal and State levels were spending a lot of money on farm inputs which were not reaching the intended beneficiaries (small holder farmers) and thus, had no impact on the national food output. The Federal Government was
involved in the direct procurement and distribution of fertilisers and this weakened the ability of private companies to participate in the sector and compete efficiently for market share. As with most
subsidy regimes, the sector was grossly under developed and the opportunities for corruption
were rampant (Fertiliser Producers and Suppliers Association of Nigeria (FEPSAN, 2012). Several scholars have defined corruption in
many ways. World Bank Independent Evaluation Group (2006) described corruption as the abuse of office for private gains. Public office is abused for private gain when an official accepts, solicits, or
extorts a bribe. Azelama (2002) observed corruption as any action or omission enacted by a member of an organisation, which is against the rules, regulations, norms, and ethics of the
organisation and the purpose is to meet the selfish end of the member at the detriment of the organisation. Waziri (2010) considered corruption as a pervasion or a change from the generally
accepted law or rules for personal benefit. Over the years, the distribution of fertilisers has remained a racketeering business for some group of persons. Farmers have had to lament the poor handling and
management of the fertiliser distribution because past governments failed to nip the racketeering in the bud. The ex-minister of Agriculture and Rural Development (Dr. Akinwumi Adesina) lamented that between 1980 and 2010, the Federal and State governments spent over N873 billion on fertiliser subsidies and out of this amount, Nigeria lost N776 billion to corruption and fertiliser racketeering
within this period (Ajayi, 2015). Available field information showed that further progress has been recorded in the area of input supply, production and other levels along the value
chain. Although varied challenges were reported from participating farmers in states with GES

Nigerian Journal of Rural Sociology Vol. 16, No. 1, June 2015
51
implementation. For instance, 65%-70% of
registered farmers accessed fertilisers/certified seeds, while 118,639 bundles of cassava cuttings were also distributed to farmers. A total of 6,053,211.40Metric Tonnes of fertiliser was
procured and distributed directly to farmers at redemption centres across the nation with no middleman. Also, the National Agricultural Seed Council indicated that the use of improved seeds increased from 14% in 2012 to 23.5% in 2013 and registered seed companies increased from 30 in 2012 to 75 in 2013. These have had direct positive impacts on field crop performance, output,
employment generation and income of farmers. It is estimated that 3.26 million jobs had been created by ATA along the target value chain commodities. The identified challenges of GES were: untimely
supply of input, inadequate resources and equipment to clear large expanse of lands for cultivation, inadequate extension workers, lack of direct financing of every value chain funding at the Green House level, untimely commencement of GES activities, inadequate sensitization and enlightenment of field actors, bad GSM network connectivity, particularly in rural areas, which
impaired redemption; few redemption centres; hence, farmers moved long distances to redeem their inputs; lack of credit facilities to support poor farmers and high cost of credit to commercial
farmers and lack of irrigation facilities for dry season farming or for supplementary irrigation during protracted dry spells. (National Agricultural Extension and Research Liaison Services
(NAERLS) and Federal Department of Agricultural Extension (FDAE) (2013). The study is set to ascertain the selected socioeconomic characteristics of respondents; determines the constraints facing
respondents in accessing inorganic fertiliser and determines respondents’ perception of GES in curbing corruption in inorganic fertiliser delivery.
METHODOLOGY
The study was conducted in Odeda Local Government Area of Ogun state, Nigeria. It’s headquarter is at Odeda, a place situated along
Abeokuta- Ibadan Road, which is about 10 kilometers from Abeokuta (the State Capital). The headquarters of the Local Government Area is on the A5 highway7°13′00″N 3°31′00″E. It has an area of 1,560 km² and a population of 109,449peoples at the 2006 census. It has an extensive landmass mostly grass. The vegetation of the Local Government is mainly Orchard and of
thick grasses. Thus, the land is suitable for crop production and livestock rearing (Wikipedia, 2014). The local government has 10wards. Two- stages sampling technique was used to select the
respondents. The first stage involved random selection of 4 wards which are: Alabata, Obantoko,
Odeda and Osiele. The second stage involved
random selection of 10% of crop farmers’ beneficiaries of GES. Thus, 11 respondents were selected from Alabata, 55 from Obantoko, 29 from Odeda and 22 from Osiele to give a sample size of
117respondents. The dependent variable is the perceptional status of the respondents, 10 perceptional statements were asked the respondents and response were scored on 5 point Likert scale of strongly agreed- 5, agreed- 4, undecided- 3, disagreed -2, strongly disagreed -1. The scoring were reversed for negative statements. The independent variables consists of the selected
socioeconomics characteristics of respondents. Descriptive statistical tools used were frequency counts and percentages while t-test analysis was used to establish the significant difference between
the perceptional status of GES in curbing corruption in inorganic fertiliser delivery of male and female respondents.
RESULTS AND DISCUSSION
Socioeconomic characteristics of respondents
Data presented in Table 1 shows the distribution of respondents according to their socio-
economic characteristics. The mean age of the respondents was 51.9 years. This means that respondents were in their middle ages having strength and vigour to cope with rigour involved in
crop production activities. The result support the findings of Oyetoro (2014) that crop farmers in South Western Nigeria are becoming of age as many in farming are in their 50’s. The study also
revealed that most of the respondents (67.5%) were male. The mean years of farming experience was 29.2 years. This implies that respondents in the study area have farmed for sufficient years to
develop enormous knowledge on crop production activities. Also, the mean farm size is 2.6hectares. According to Food and Agriculture Organisation (2010), farm size of less than 5hectares is classified
to be small scale farming. Table1: Distribution of respondents according to their selected socioeconomic characteristics, n=117
Socioeconomic characteristics
Frequency Percentage Mean
Age (years)
Less than 30 5 4.3 31-50 56 47.9 51-70 52 44.4 51.9 71 and above 4 3.4
Sex Male 79 67.5 Female 38 32.5
Marital status
Single 3 2.6 Widow/widower
12 10.2
Divorced 3 2.6

Nigerian Journal of Rural Sociology Vol. 16, No. 1, June 2015
52
Socioeconomic characteristics
Frequency Percentage Mean
Married 99 84.6
Years of
farming
experience
(years)
≤ 5 1 0.9 6-10 7 6.0 29.2 11years and above
109 93.1
Farm size
(hectares)
≤ 3 68 58.1 2.6 4-10 38 32.5
11 and above 11 9.4
Source: field survey, 2015.
Constraints facing respondents in accessing
inorganic fertiliser
Data in Table 2 revealed that high fertiliser
price is a serious problem to 51.3% of the respondents. This finding corroborated the report of FEPSAN (2012) that most GES farmers are facing challenge of high fertiliser price. It should be noted that respondents paid 50% of the cost of fertiliser while federal and state governments bear the remaining cost of 50%. This means that some farmers cannot still afford the subsidised fertiliser
price. Also, 62.4% of the respondents are facing serious problem on cumbersome procedure in accessing fertiliser, only 38.5% of the respondents claimed serious problem of not meeting up with the
required quantity of fertiliser. This means that most of the respondents are contented with quantity of fertiliser received through GES. Also, 42.7% of the respondents claimed serious problem of availability
of lower quantity of fertiliser (such as half bag-25kg). It means that most respondents operates on small scale basis and may not be able to afford 50kg fertiliser bag. All the respondents claimed that
getting the needed type of fertiliser is not a problem. However, majority (76.1%) of the respondents claimed that late delivery of fertilisers to farmers was a serious problem. This means that
supply of fertilisers to farmers through GES may not meet planting season which can affect crop production in the study area. Table2: Distribution of respondents according to
constraints facing them in accessing inorganic fertiliser
Constraints* Serious Mild Not a problem
High Fertiliser price
60(51.3) 30(25.6) 27(23.1)
Constraints* Serious Mild Not a problem
Cumbersome
procedure in accessing fertiliser
73(62.4) 20(17.1) 24(20.5)
Quantity
required is not met
45(38.5) 10(8.5) 62(53.0)
Lower quantity such as half bag (25kg) not available
50(42.7) 10(8.5) 57(48.8)
Problem of getting the
needed type of fertiliser
0 (0.0) 10(8.5) 107(91.5)
Late delivery of fertilisers to
farmers
89(76.1) 20(17.1) 8(6.8)
Source: Field survey, 2015. Figures in parentheses are percentages * Multiple responses
Crop farmers’ perception of GES in curbing
corruption in inorganic fertiliser delivery
The statements whose weighted mean values are equal to or greater than the grand mean (2.56)
are classified to have positive perception by the respondents while the mean values less than the grand mean are classified to have negative perception by the respondents. Hence, respondents
developed positive perception towards the following statements: Only progressive farmers obtained information /alert on their e-wallet system; procurement of fertiliser through GES was
not usually timely for crop production and through GES, the needed bags of inorganic fertiliser cannot be met. However, respondents developed negative perception towards the following statements: a
token needs to be paid for easy registration of GES; none registered farmers can also manoeuvre their way to get fertiliser; at fertiliser redemption centre, it is whom you know to get fertiliser; bad GSM
network connectivity does not impair redemption of fertiliser; obtaining fertiliser type demanded was not easy at point of collection and the price of GES fertiliser was not the same in the same locality.
Developing negative perception towards the statements above implies that respondents perceived GES as being effective in curbing corruption in inorganic fertiliser delivery.

Nigerian Journal of Rural Sociology Vol. 16, No. 1, June 2015
53
Table 3: Distribution of respondents according to their perception of GES in curbing corruption in inorganic
fertiliser delivery
Perception statements* Strongly agreed
Agreed Undecided
Disagreed
Strongly disagreed
Mean
Abnormal cash payments usually made before procurement of fertiliser
0 (0.0) 8(6.8) 16(13.7) 81(69.2) 12(10.3) 3.86
A token needs to be paid for easy registration
of GES
0 (0.0) 0 (0.0) 32(27.4) 51(43.6) 32(27.4) 2.16
None registered farmers can also manoeuvre their way to get fertiliser
0 (0.0) 0 (0.0) 21(17.9) 63(53.8) 33(28.2) 2.26
Only progressive farmers got information /alert on their e-wallet system
4(3.4) 14(12.0) 0 (0.0) 21(17.9) 78(66.7) 3.13
At fertiliser redemption centre, it is whom you know to get fertiliser
0 (0.0) 1(0.9) 13(11.1) 59(50.4) 44(37.6) 1.75
Procurement of fertiliser through GES was not
usually timely for crop production
60(51.3) 34(29.1) 3(2.6) 19(16.2) 1(0.9) 2.58
Bad GSM network connectivity does not impaired redemption of fertiliser
22(18.8) 16(13.7) 0 (0.0) 38(32.5) 41(35.0) 2.44
Obtaining fertiliser type demanded was not
easy at point of collection
0 (0.0) 4(3.4) 24(20.5) 32(27.4) 57(48.7) 1.56
Through GES, the needed bags inorganic fertiliser cannot be met
105(89.8) 2(1.7) 0 (0.0) 7(5.9) 3(2.6) 1.72
The price of GES fertiliser was not the same in the same locality
3(2.6) 3(2.6) 8(6.8) 48(41.0) 55(47.0) 2.30
Grand Total 2.56
Source: Field survey, 2015. Figures in parentheses are percentages * Multiple responses
Paired Sample t-test Analysis of the Difference between the Perceptional Status Index of Male and Female Respondents on GES in Curbing
Corruption in Inorganic Fertiliser Delivery. Data in Table 4 shows no significant differences (t= 0.948, p= 0.976) in the perceptional status index of male and female respondents of GES in curbing
corruption in inorganic fertiliser delivery. This means that gender has on influence on the perception of both male and female respondents on GES in curbing corruption in inorganic fertiliser
delivery. Table 4: Paired sample t test analysis of the difference between the perceptional status index of male and female respondents on GES in curbing
corruption in fertiliser delivery
Variables t-value p-value Decision
Perceptional status index of male and
22.42 0.948
0.976 Not significant
female
respondents
14.06
Source: Field survey (2015)
CONCLUSION AND RECOMMENDATIONS
Based on the findings of this study, it is concluded that respondents perceived GES as being effective in curbing corruption in inorganic fertiliser delivery. The study recommends that
efforts should be made to ensure timely delivery of inorganic fertiliser. Also procedure to access fertiliser should be less cumbersome to encourage
more participants for the programme to maximally achieve the goals set for it.
REFERENCES
Ajayi, O. (2015): The Goodluck Jonathan Agriculture Revolution, Vanguard Newspaper. Available onlinehttp://www.vanguardngr.com/2015/
02/goodluck-jonathan-agriculture-revolution/ Accessed on 20th June, 2015
Azelama J.U (2002): Public Enterprise Management in Nigeria, Ambik Press,
Benin-City, Nigeria Fertiliser Producers and Suppliers Association of
Nigeria (FEPSAN, 2012): The Growth Enhancement Support Scheme (GESS)
Monitoring Report. Food and Agriculture Organisation (2014):
Characterization of small farmers in Asia and the pacific, Rome, Italy. URL http://www.fepsannigeria.com/files/GESS%20Monitoring%20Report%20FC%20Revised%20%20Final.pdf
National Agricultural Extension and Research
Liaison Services (NAERLS) and Federal Department of Agricultural Extension (FDAE) (2013): Agricultural Performance

Nigerian Journal of Rural Sociology Vol. 16, No. 1, June 2015
54
Survey Report of 2013 Wet Season in
Nigeria, Ahmadu Bello University, NAERLS Press, Zaria.
Oyetoro J.O (2014): Assessment of Contribution of University Based Extension Projects to
Arable Crop Production in South West Nigeria. Unpublished Ph.D Thesis, Department of Agricultural Extension and Communication Technology, Federal University of Technology, Akure, Nigeria.
Waziri, F. (2010): Corruption and Governance Challenges, Nigeria Conference
Proceedings, Monograph Series
Number 7, Cleen Foundation, Abuja, Nigeria.
Wikipedia (2014): Odeda location in Nigeria. https://en.m.wikipedia.org/wiki/odeda
World Bank Independent Evaluation Group (2006): Engaging With Fragile States: An IEG Review of World Bank Support To Low-Income Countries Under Stress, The World Bank, Washington Dc. www.worldbank.org/ieg

Nigerian Journal of Rural Sociology Vol. 16, No. 1, June 2015
55
EFFECT OF THE NYSC/MDGs/WAP AGRO-ENTERPRISE LOAN ON BENEFICIARIES’ WELL-
BEING IN SOUTH WEST NIGERIA
Tijani, S. A. and Ayinla, M. A. Department of Agricultural Extension and Rural Development,
Faculty of Agriculture and Forestry, University of Ibadan, Oyo State Nigeria
E-mail: [email protected]
ABSTRACT A strong link exists between poverty and income, thus attainment of full employment by youths can reduce
poverty, crimes, terrorism and prostitution. This study investigated the effect of NYSC/MDGs/WAP on the well-
being of beneficiaries in Southwest, Nigeria. Simple random sampling technique was used to select 120
respondents (ex-corps members). Data were collected with a structured questionnaire and analysed using both
descriptive (frequency and percentages) and inferential statistics (Chi-square and PPMC). The mean age of the
respondents was 30.8 years, 67.5% were married with 3-5 family size, 73.3% were Christians and 73.3% were
male. Those with B.Sc certificate were 46.7%, HND certificate 23.3%. Results indicate that 91.8% used the loan
to start up a business, 89.2% engaged in agro-enterprises, with 35.8% into poultry production, 8.3% into
beekeeping, while the remaining 10.8% diverted the loan into other businesses. Most of the respondents
indicated training (89.2%) and self dependence (81.7%) as their benefits from the programme. Most severe
constraint faced by respondents was inadequate credit facility/ loan. However, 55.8% of the respondents had
favourable attitude and 53.3% had high well-being status. Marital status was significantly related to well-being
of respondents (r=0.045, p=0.023). Attitude (r=0.554, p=0.000) of beneficiaries, benefit derived (r=0.284,
p=0.002) and constraint encountered (r=-0.250, p=0.006) were significantly related to their well-being.
Participants’ involvement in NYSC/MDGs/WAP was beneficial and it has positive effect on their well-being. To
ensure sustainability, availability of land, creation of marketing opportunities and follow-up becomes
imperative.
Keyword: Well-being, NYSC/MDGs/WAP, youth empowerment, agro-enterprise loan
INTRODUCTION
The agricultural sector is a major contributor to the Nigerian economy. Agriculture serves as the
largest non-oil export earner, the largest employer of labour and a key contributor to wealth creation and poverty alleviation, as a large percentage of the population derive their income from agriculture
(NEEDS, 2004). The sector is estimated to constitute about 40% of the Gross Domestic Product (GDP) and remains one of the areas identified to address youth unemployment in the
country (FMARD, 2000). Nevertheless, poverty, hunger and unemployment have been on the increase since the late 1990s in Nigeria (FOS, 2011). The National Bureau of Statistics (2012)
estimated the unemployment rate to be 23.9 per cent. In an attempt to checkmate the growing rate of unemployment and poverty, several programmes
were introduced by past governments in the country. Some of such interventions include: Operation Feed the Nation (OFN), Better Life Programme (BLP), National Directorate of Employment (NDE), Poverty Eradication Programme (PEP), Farm Settlement Scheme (FSS), National Agency for Poverty Eradication Programme (NAPEP) among others. These
strategies proved ineffective at addressing their intended purposes due to reasons such as low productivity, conflicts, poor management, political instability, lack of continuity, poor monitoring and
evaluation, misappropriation of fund to mention a few.
The National Youth Service Corp (NYSC), established in 1973 by the Federal Government with a view to promote national unity and ensure
proper establishment and development of communities, targeted the youths of Nigeria. The scheme requires graduates across the country from universities, polytechnics and colleges to
participate in the national service for a calendar year. The NYSC has helped in creating entry level jobs for many Nigerian youths, however due to the increase in school enrolment and number of higher
institutions of learning as well as increase in the number of children attending schools and completing tertiary education, millions of young people face a bleak future of employment
opportunities (Longe Report, 1992). Adesanya, (2013) confirmed that out of the number of graduates who complete the NYSC scheme yearly, only 10% are employed in a desired place of work.
However since inception, the NYSC has collaborated with several agencies in many areas of human and societal developmental needs towards meeting national and global challenges. One of which is its collaboration in 2009 with the Millennium/Sustainable Development Goals (M/SDGs) Office in Abuja, Nigeria to engage interested youth in agriculture with the aim of
creating employment, reducing poverty and hunger. NYSC/M/SDGs/WAP is an economic empowerment programme which focuses on the Millennium/Sustainable Development Goal 1 (one)
geared towards eradicating extreme hunger and poverty. It seeks to equip corps members with

Nigerian Journal of Rural Sociology Vol. 16, No. 1, June 2015
56
agro-entrepreneurial skills/training by empowering
them with interest free loan to generate employment, eradicate extreme poverty and hunger. Meanwhile, the inability of youth to engage in
agriculture as a means of employment in Nigeria has been attributed to lack of access to finance and micro-credit, land, dis-interest of young people in agriculture among others, thus increasing the rate of unemployment. This has resulted in unwholesome effects such as increase in political unrest, drug abuse, increase in crime rate, illicit sex trade, kidnapping, human trafficking, terrorism,
low self-esteem among others. Strategies such as creating an enabling environment for agro-business, including building critical infrastructure, making regulatory services transparent and
providing sustainable access to enterprise finance with the aim of generating employment for graduates, non-graduates and school leavers in the agricultural sector have been undertaken by government. The strategies place emphasis on self-employment in agricultural production and marketing. In 2013, the programme was recorded to have empowered over 3,500 participants in
various enterprises. However, the effect of the programme on the well-being of beneficiaries’ has not been ascertained which therefore necessitated the focus of this study. The specific objectives were
to: 1) determine socioeconomic characteristics of
the respondents 2) ascertain the benefits derived from the
programme by the beneficiaries; 3) determine the attitude of the beneficiaries
towards the programme; 4) identify the constraints faced by the
beneficiaries; 5) ascertain the effect of the programme on
beneficiaries’ well-being.
METHODOLOGY
The study area was the Southwest geo-political zone of Nigeria. The zone consists of six states: Ekiti, Lagos, Ogun. Ondo, Osun and Oyo. The
zone lies between latitudes 60 and 90 north and longitudes 20 and 60 east. It has a total land mass of 77,818km2 and a projected population of 28,767,752 in 2002 (NPC, 1991). The population for the study comprised all the beneficiaries of the NYSC/MDG/WAP loans who have operated a business enterprise for at least three years in Southwest, Nigeria. Random sampling technique
was used to select a total of 120 respondents, from whom data were collected with the use of structured questionnaire. Benefits derived was measured as: large extent (2), less extent (1) and
not at all (0). Attitude towards the programme: Likert-scale of SA (5), A (4), U (3), D (2), SD (1)
for positively-worded statements and vice versa for
negative statements. Purpose of loan utilisation: business expansion (1), start-up capital (2), not utilised = 0. Constraint: severe (2), mild (1) and not a constraint (0). Well-being was measured by
adapting the Warwick Edinburgh Mental Well-being scale and the Ryffs Scale of Psychological Wellbeing. Respondents’ well-being was obtained through addition of the four dimensions of well-being (material, economic, social and psychological), after which aggregated scores from the dimensions provided the basis for categorization of beneficiaries’ well-being into
high, average and low levels.
RESULT AND DISCUSSION
Personal characteristics of respondents -
Age distribution of respondents ranged between 24 and 39 years as indicated in Table 1 and the mean age was 30.8±2.83 years. This shows that they were still in their productive age wherein their energies could be harnessed and utilised for productive ventures in agriculture. More males (73.3%) were involved in the programme relative to females (26.7%) which, according to Agbebaku (2004), is
attributable to the popular belief that agriculture is mainly for males because of the drudgery associated with it. Most of them were married (67.5%) with 53.3% having a household size of 3 –
5 persons. These may have prompted their involvement in the programme so as to augment their finance which can positively affect their well-being. This agrees with Ani et al. (2007) that
married persons have more financial responsibilities. Additionally, 89.2% indicated that they established an agro-enterprise with the loan obtained from the programme, which gives a hint
of youth willingness to involve in agriculture provided there is a source of finance. This is also reflected in the academic background of the respondents, as agricultural and non-agricultural
graduates participated in the programme. Table 1: Distribution of respondents by personal characteristics
Variable Freque
ncy
Percent
age
Mean Std.
Dev.
Age
24-27 28-31 32-35 36-39
Sex
Male
Female
12 52 53 3 88
32
10.0 43.3 44.2 2.5 73.3
26.7
30.8
2.83
Marital status
Single
Married
39
81
32.5
67.5

Nigerian Journal of Rural Sociology Vol. 16, No. 1, June 2015
57
Variable Freque
ncy
Percent
age
Mean Std.
Dev.
Own farm size
0-1 2-3 4-5
6-7
107 8 3
2
89.2 6.7 2.5
1.7
1.04
Degree type
HND B.Sc
B.Agric B.A B.Ed
M.Sc
28 56
18 4 5
9
23.3 46.7
15.0 3.3 4.2
7.2
Enterprises
Agriculture
Non-Agriculture
107
13
89.2
10.8
Household size
1-2 3-5 6-8
9-11 12-14
50 64 1
4 1
41.7 53.3 0.8
3.3 0.8
2.50
2.41
Source: Field survey, 2014.
Loan utilisation - Findings on loan utilisation by the respondents as presented in Table 2 indicate that majority (91.7%) of the respondents used the loan to start up an agro-business enterprise sequel
to the training they received. Likewise, 5.8% indicated that they diversified into other businesses which are non-agricultural, while 2.5% who were already into one form of business used the loan to
scale-up their business. It follows that the respondents, after undergoing training set-up business enterprises for the purpose which loan was procured. This aligns with the observation of
Adekunle (2009) that many of the school leavers trained by the National Directorate of Employment (NDE) started business for the purpose which they obtained the loan. The result also shows that 35.8%
of the respondents that utilised the loan for
agriculture were into poultry farming, followed by fish farming (30.8%), while 14.2% were involved in Plantain sucker multiplication, Snailery (11.7%), Grasscutter rearing and Animal husbandry (10.0%
respectively), piggery as well as beekeeping (8.3%). The rationale for choosing poultry/ fish production as income generating activities by the respondents may be because of short gestation period, high demand for poultry and fish products and high turnover rates on investment, compared to other livestock such as sheep, goat and cattle. This claim is supported by Sanyang (2002) who posited
that women engage in poultry production because of its high turnover rate when compared to other livestock.
Table 2: Distribution of respondents by purpose of loan utilisation
Loan utilisation Frequency Percentage
Start-up a business Scale-up of business Diversification of business
110 3 7
91.7 2.5 5.8
Source: Field survey, 2014.
Benefits derived from involvement in
NYSC/MDGs/WAP - Benefits derived by the
respondents from the programme are shown in Table 3a. Majority of the respondents indicated that, to a large extent, their involvement in the NYSC/MDGs/WAP programme resulted in
empowerment (89.2%), self-dependent (81.7%) and improved self-esteem (86.5%). It follows that the beneficiaries were better-off after the programme than they were before it started, which
can help to confer a positive well-being status on them against a state of unemployment that could lead to depression, low self-esteem, frustration and a number of other negative consequences (Ipaye,
1998).
Table 3a: Distribution of respondents by benefits derived
Benefit derived Not at all Less Extent Large extent Weighted
Score
Training/empowerment Self-dependence High self esteem Increased scale of production
Improved standard of living Improved skills Increased savings and investment
5.0 (6) 8.3 (10) 13.3 (16) 15.0 (36)
16.7 (20) 30.8 (37) 30.0 (36)
5.8 (7) 10.0(12) 17.5(21) 51.7(52)
33.3(40) 30.0(36) 43.3(52)
89.2 (107) 81.7 (98) 69.2 (83) 33.3 (32)
50.0 (60) 39.2 (47) 26.7 (3.2)
221 208 187 142
130 130 116
Source: Field survey, 2014. The level of benefit derived by the respondents as depicted in Table 3b revealed that 57.5% derived high benefit, while 42.5% derived low benefit. Since a higher proportion of them derived a high
level of benefit, it is expected that this will have a positive effect on their well-being.

Nigerian Journal of Rural Sociology Vol. 16, No. 1, June 2015
58
Table 3b: Distribution of respondents by level of
benefit derived
Categories Mean
Frequency
Percentage
Low (0 - 9) High (10 - 14)
51
69
42.5
57.5
Source: Field survey, 2014.
Attitude towards NYSC/MDGs/WAP
programme - Table 4 reveals that 55.8% of the respondents had favourable attitude towards the programme (mean = 77). This positive disposition infers that they are willing and ready to venture into agriculture as a means of livelihood, provided necessary requirements are met. It behoves on relevant stakeholders, particularly the government,
to encourage youths in the country through provision of credit that can be used to set-up or scale-up agro-enterprises which can serve as a veritable tool in curtailing unemployment and its
attendant vices.
Table 4: Distribution of respondents by level of attitude
Categories Frequency Percentage
Favourable (77 - 122)
Unfavourable (45 - 76)
67
53
55.8
44.2
Mean = 77 Source: Field survey, 2014.
Constraints to involvement in agro-enterprise
Table 5 shows that 71.7% of the respondents identified inadequate credit facility as the major constraint limiting their involvement in agro-enterprise. This is indicative of the point that the
size of loan disbursed after training is not for instance commensurate to the start-up capital required by a beneficiary to establish an agro-enterprise. Similarly, 46.7% pointed out that lack of monitoring/follow up is a major issue affecting involvement in agro-enterprise. This view is explainable from the fact that loan procured by certain beneficiaries may not be used for the
purpose it was intended for, thus depriving intended beneficiaries who would have procured such loan and invest it in an agro-enterprise. Also, certain challenges encountered by beneficiaries
could be spotted during monitoring that can lead to improvement of the programme subsequently. However, inadequate management skill (89.2%) and poor record keeping of production activities (88.3%) among other issues were not considered as constraints by the respondents. From these, it is fitting to say that the training the programme beneficiaries went through was quite detailed, as
they were adequately taught how to establish and manage the agro-enterprises.
Table 5: Distribution of respondents by constraints faced in the establishment of agro-enterprise
Constraint Not a
Constraint
Minor
Constraint
Major
constraint
Rank
Inadequate credit facility 15.0 (18) 13.3 (1) 71.7 (8) 1 Lack of monitoring follow-up 44.2 (53) 9.2 (11) 46.7 (5) 2
No ready market for produce 40.8 (49) 20.8 (25) 38.3 (4) 3
Poor returns on investment 45.0 (54) 23.3 (28) 31.7 (3) 4
Feed price instability 47.5 (57) 30.0 (36) 22.5 (2) 5
Unavailability of land /space 55.0 (55) 17.5 (21) 27.5 (3) 6
Inability to repay 55.0 (66) 18.3 (22) 26.7 (3) 7
Diseases/pest attack 59.2 (71) 21.7 (26) 19.2 (2) 8
Poor harvest 53.3 (64) 39.2 (47) 7.5 (9) 9
Natural hazards 68.3 (82) 12.5 (15) 19.2 (2) 10
Insufficient access to farm inputs 68.3 (82) 15.0 (18) 16.7(2) 11 Inadequate training 72.5 (87) 12.5 (15) 15.0 (1) 12
Poor basic training knowledge 75.0 (90) 14.2 (17) 10.8 (1) 13
Inadequate equipment 86.7 (104) 6.7 (8) 6.7 (8) 14
Inadequate managerial skill 89.2 (107) 5.8 (7) 5.0 (66) 15
Record keeping of production activities 88.3 (106) 6.7 (8) 5.0 (6) 16
Source: Field survey, 2014.
Well-being of the respondents
The respondents’ economic, psychological and social well -being level had increased positively due to their engagement in various agro-enterprise as this has hyped –up their self-esteem, financial
security and reduce the emotional burden caused by unemployment. However, their material well-being is low.
Table 6 shows that majority (53.3%) of
respondents had high well-being. This implies that the NYSC/MDGs/WAP programme impacted positively on the respondents with 48.3%, 59.2%, 58.3% and 53.5% respectively having high well-
being in material, economic, social and psychological dimensions of well-being. However, finding also showed that 43.3% had low well-being. This outcome is buttressed by Emeh (2012),
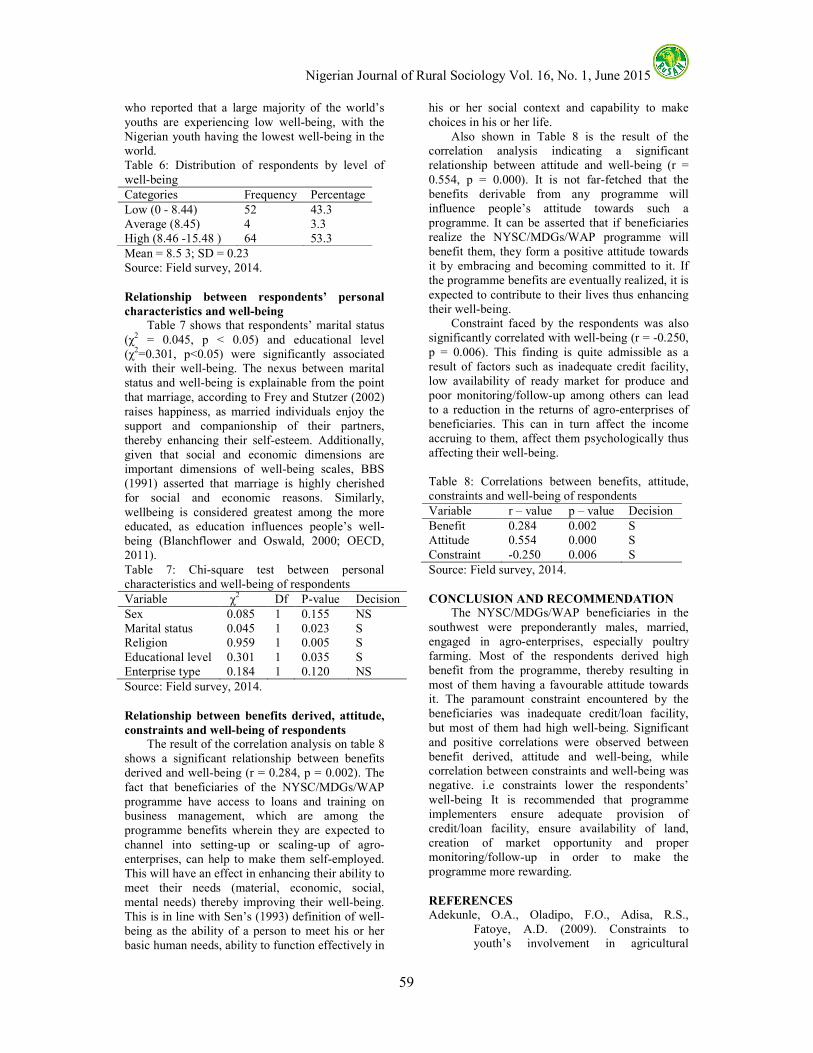
Nigerian Journal of Rural Sociology Vol. 16, No. 1, June 2015
59
who reported that a large majority of the world’s
youths are experiencing low well-being, with the Nigerian youth having the lowest well-being in the world. Table 6: Distribution of respondents by level of
well-being
Categories Frequency Percentage
Low (0 - 8.44) Average (8.45) High (8.46 -15.48 )
52 4 64
43.3 3.3 53.3
Mean = 8.5 3; SD = 0.23 Source: Field survey, 2014.
Relationship between respondents’ personal
characteristics and well-being
Table 7 shows that respondents’ marital status
(χ2 = 0.045, p < 0.05) and educational level (χ2=0.301, p<0.05) were significantly associated with their well-being. The nexus between marital status and well-being is explainable from the point
that marriage, according to Frey and Stutzer (2002) raises happiness, as married individuals enjoy the support and companionship of their partners, thereby enhancing their self-esteem. Additionally, given that social and economic dimensions are important dimensions of well-being scales, BBS (1991) asserted that marriage is highly cherished for social and economic reasons. Similarly,
wellbeing is considered greatest among the more educated, as education influences people’s well-being (Blanchflower and Oswald, 2000; OECD, 2011).
Table 7: Chi-square test between personal characteristics and well-being of respondents
Variable χ2 Df P-value Decision
Sex Marital status Religion
Educational level Enterprise type
0.085 0.045 0.959
0.301 0.184
1 1 1
1 1
0.155 0.023 0.005
0.035 0.120
NS S S
S NS
Source: Field survey, 2014.
Relationship between benefits derived, attitude,
constraints and well-being of respondents The result of the correlation analysis on table 8 shows a significant relationship between benefits derived and well-being (r = 0.284, p = 0.002). The
fact that beneficiaries of the NYSC/MDGs/WAP programme have access to loans and training on business management, which are among the programme benefits wherein they are expected to
channel into setting-up or scaling-up of agro-enterprises, can help to make them self-employed. This will have an effect in enhancing their ability to meet their needs (material, economic, social, mental needs) thereby improving their well-being. This is in line with Sen’s (1993) definition of well-being as the ability of a person to meet his or her basic human needs, ability to function effectively in
his or her social context and capability to make
choices in his or her life. Also shown in Table 8 is the result of the correlation analysis indicating a significant relationship between attitude and well-being (r =
0.554, p = 0.000). It is not far-fetched that the benefits derivable from any programme will influence people’s attitude towards such a programme. It can be asserted that if beneficiaries realize the NYSC/MDGs/WAP programme will benefit them, they form a positive attitude towards it by embracing and becoming committed to it. If the programme benefits are eventually realized, it is
expected to contribute to their lives thus enhancing their well-being. Constraint faced by the respondents was also significantly correlated with well-being (r = -0.250,
p = 0.006). This finding is quite admissible as a result of factors such as inadequate credit facility, low availability of ready market for produce and poor monitoring/follow-up among others can lead to a reduction in the returns of agro-enterprises of beneficiaries. This can in turn affect the income accruing to them, affect them psychologically thus affecting their well-being.
Table 8: Correlations between benefits, attitude, constraints and well-being of respondents
Variable r – value p – value Decision
Benefit 0.284 0.002 S Attitude 0.554 0.000 S
Constraint -0.250 0.006 S
Source: Field survey, 2014.
CONCLUSION AND RECOMMENDATION The NYSC/MDGs/WAP beneficiaries in the
southwest were preponderantly males, married, engaged in agro-enterprises, especially poultry farming. Most of the respondents derived high benefit from the programme, thereby resulting in
most of them having a favourable attitude towards it. The paramount constraint encountered by the beneficiaries was inadequate credit/loan facility, but most of them had high well-being. Significant
and positive correlations were observed between benefit derived, attitude and well-being, while correlation between constraints and well-being was negative. i.e constraints lower the respondents’
well-being It is recommended that programme implementers ensure adequate provision of credit/loan facility, ensure availability of land, creation of market opportunity and proper monitoring/follow-up in order to make the programme more rewarding.
REFERENCES
Adekunle, O.A., Oladipo, F.O., Adisa, R.S., Fatoye, A.D. (2009). Constraints to youth’s involvement in agricultural

Nigerian Journal of Rural Sociology Vol. 16, No. 1, June 2015
60
production in Kwara state, Nigeria.
Journal of Agricultural Extension, Vol. 13(1): 102-108.
Agbebaku, O.M. (2004). Comparative Analysis in the Perception of Participants of Farm
Practical Training Programme of the University of Ibadan and University of Agriculture, Abeokuta. An Unpublished BSc Project in the Department of Agricultural Extension and Rural Development, University of Ibadan, Nigeria.
Ani, D.P, Achamber N.I and Asogwa B.C (2007):
Effects of Nigerian Agricultural Cooperative and Rural Development (NACRDB) loan scheme on farmers’ in Markurdi Local Government Area, Benue
state. Nigerian Journal of Rural
Sociology, Vol. 9:1 (2009):107-11 BBS(1991) Statistical Yearbook of Bangladesh
Bureau of Statistics, Dhaka Blanchflower, David G. and Andrew. Oswald.
(2000). Well-Being Over Time in Britain and the USA. NBER Working Paper No. 6102. Cambridge, Mass: National Bureau
of Economic Research. Emeh, I. E. J. (2012). “Tackling Youth
Unemployment in Nigeria; The Lagos State
Development and Empowerment Programmes
Initiatives” Afro Asian Journal of Social Sciences Vol. 3 No. 3
Federal Ministry of Agriculture and Rural Development. (2000). Agriculture in
Nigeria: the new policy thrust. Federal Republic of Nigeria.
Frey B S and Stutzer A,(2002). What can Economists learn from Happiness Research? Journal of Economic Literature, vol 40, 2002, pp 402-435
Ipaye, B. (1998). Counselling the unemployed: Some exploratory ideas for the Nigerian
Counsellors. Counsellor. Longe Report (1992). In the NISER data on the
actual high level manpower supply. NEEDS, (2004). National Economic Empowerment
and Development Strategy. Nigeria March 2004 pp. 76.
Ryff C. And C, Keyes (1995). the structure of psychological well-being revisited. Journal of
personality and social psychology;69(4):pp 719 – 727.
Sen, Amartya K. (1993).Capability and Well-being.
in Martha C. Nussbaum and Amartya K. Sen (eds), The Quality of Life, Oxford: Clarendon Press, pp. 30. 53.

Nigerian Journal of Rural Sociology Vol. 16, No. 1, June 2015
61
EFFECT OF TRAINING ON THE USE OF MODERN BEEKEEPING TECHNOLOGIES IN OYO
STATE, NIGERIA
Eforuoku, F. and Thomas, K. A. Department of Agric. Extension and Rural Development, University of Ibadan, Ibadan
E-mail: [email protected]
ABSTRACT The Oyo State Ministry of Agriculture, Natural Resources and Rural Development recently trained producers
on the use of modern beekeeping technologies with the aim of enhancing their global competitiveness. This
paper examined the effectiveness of the training programme. Multistage sampling procedure was used in
selecting 131 trained beekeepers from the 3 senatorial districts in Oyo state. The data collected were analysed
with the aid of descriptive and inferential statistics. The study revealed that Beekeepers had 6±4 mean years of
experience, 74.6% of beekeepers had between 1 and 10 years of experience; 61.1% got their initial capital from
personal saving and information about beekeeping and training was from a variety of sources with a higher
percent (43.5%) from beekeepers association. Increased quantity of honey produced (1.92) was the most
important benefit derived from the use of the technology while, invasion by Fulani herdsmen (1.68) and lack of
credit facilities (1.40) were the major constraints to use of modern beekeeping technologies. There was
significant difference in the level of use of modern beekeeping technologies before and after the training (t-
=18.419; p≤0.050). The training was effective as there was increased use of modern beekeeping technologies
after the training. It is recommended that the training should be replicated in other states and for other
agricultural enterprises and government should formulate policy that will guide grazing of livestock to reduce
invasion of Fulani herdsmen
Keywords: Training effectiveness, modern beekeeping technologies, constraints to beekeeping
INTRODUCTION
Bees are one of the most important organisms
on Earth; they belong to the Order Hymenoptera
which includes the honey bees, bumble bees, stingless bees, and carpenter bees. Although there are over 20,000 species of wild bees, the species
usually managed by beekeepers is the Western honey bee (Apismellifera adansoni) which is
common in West Africa in general, and Nigeria in particular. This species are very prolific honey
producers and are managed by beekeepers for honey and other bee products (Olorunyomi, 2009). Beekeeping is as old as any agricultural practice and has been an alternative source of income to
farmers especially in rural communities. However, Ojeleye (2003) observed that commercial beekeeping was almost non-existent in Nigeria until recently despite Nigeria’s high potential for
beekeeping, due to its excellent flora and fauna diversity. Beekeeping exists in almost all states in Nigeria, yet majority of its production are on subsistence level. These producers make use of
gourd hives, pot, basket, straw hives, and sometimes, hollow tree trunks. Also during harvesting, the hives are crudely broken-into using smoke to suppress the bees without ensuring that harvesting was due. Many times, eggs, larvae and pupa are harvested along with honey and the comb, which often lead to poor-quality of products, delay in time of re-colonization of hive by bees and
sometimes total absconding from the hive by the bees. These numerous disadvantages led to the invention of modern beekeeping technologies. Modern bee-keeping technologies are suitable
for commercial beekeeping and will enable local producers compete favourably in production with
other producers on the global scene. Hence, the Department of Rural Development under the Oyo
State Ministry of Agriculture, Natural Resources and Rural Development trained beekeepers in Oyo state on the use of modern beekeeping technologies from 19th-22nd April 2011 with the help of Subject
Matter Specialists (SMSs). The training also involved giving of incentives which included: the provision of modern beehives (which allow the beekeeper to examine the comb before harvesting),
harvesting kits and honey extraction machine. Since the use of modern beekeeping is beneficial to beekeepers and the training was taken over two years ago, the benefits and effect of the training are
expected to be obvious. One will then wonder why the market is still dominated with traditionally produced bee products. It is against this backdrop that this study was designed to investigate the
effect of the training on the use of modern beekeeping technology among beekeepers in Oyo State. The specific objectives are to:
1. examine the enterprise characteristics of trained bee keepers,
2. identify constraints to the use of modern beekeeping technologies,
3. ascertain the benefits of the use of modern beekeeping technologies; and
4. compare the level of use of modern beekeeping technologies before and after the training.
METHODOLOGY Area of study - Oyo state is located in the South-West geopolitical zone of Nigeria. It was one
of the three states carved out of the former Western State of Nigeria in 1976. The State consists of 33

Nigerian Journal of Rural Sociology Vol. 16, No. 1, June 2015
62
Local Government Areas and has a population of
5,591,589 people (National Population Commission, 2006). Oyo State covers a total of 27,249 square kilometres of land mass and it is bounded in the south by Ogun State, in the north by
Kwara State, in the west it is partly bounded by Ogun State and partly by the Republic of Benin, while in the east by Osun State. The landscape consists of old hard rocks and dome shaped hills, which rise gently from about 500 meters in the southern part and reaching a height of about 1,219 metres above sea level in the northern part. The climate in the State favours the cultivation of crops
like Maize, Yam, Cassava, Millet, Rice, Plantain, Cocoa tree, Palm tree and Cashew. Population of the study - The population comprised 394 participants trained by the
Department of Rural Development in Ministry of
Agriculture, Natural Resources and Rural Development of Oyo State.
Sampling procedure and sample size -
Multistage sampling procedure was used to select
respondents for the study. Out of the 3 senatorial districts in Oyo state, Oyo North and Oyo Central were purposively selected due to the larger number of participants in the training. A proportionate sample of 45% of the LGAs was selected in the selected senatorial district: 5 and 6 LGAs from Oyo Central and Oyo North respectively. Finally 65% of the total trainees were sampled randomly to give a
total of 131 trained beekeepers for the study.
Table 1: Summary of sampling procedures and sample size of the study
Selected senatorial district
Number of LGA
45 % LGA
Names of selected LGA Number of Trainee
65% Proportion of Trainee
Cum. Total
Oyo Central 11 5 Egbeda 31 20 20 Lagelu 18 12 32 Ibadan North 17 11 43 Ibadan West 21 14 57 Ibadan South-East 19 12 69
Oyo North
13
6
Iseyin 14 9 78
Kajola 20 13 91 Saki-west 18 12 103 Irepo 12 8 111 Ogbomoso North 15 10 121
Ogbomoso South 19 12 133 Cumulative Total 133
Measurement of variables
Dependent variable - Effect of training on
modern beekeeping technologies
Fourteen (14) modern technology practices from the training were listed and respondents were asked to indicate which of the practices they used
before the training and after the training. This was measured using “No” and “yes” response options and scored 0 and 1 respectively. Respondents’ scores were computed to generate scores for use
before training and use after training. The scores for before training and after training were subtracted to get the effect of the training, the effect score was categorized into high effect and low
effect using the mean.
Independent variable - Enterprise characteristics
of trained beekeepers
• Years of experience: Respondents were asked to indicate in year(s) how long they have been practicing beekeeping.
• Sources of capital: respondents were asked
how they raised their initial capital to start beekeeping enterprise: personal savings, family and friends, loan and cooperative society
• Sources of information: respondents were asked how they heard about the training on modern beekeeping training from a list of sources of information which were: family and
friends, beekeepers association, television, newspapers, radio, extension agent.
• Membership of beekeepers association: respondents were asked if they are members of Beekeepers Association of Nigeria, Oyo State
chapter.
Involvement in beekeeping enterprise
• Number of hives: respondents were asked to state the total number of beehives in their apiary/apiaries. The hives were categorized based on standard size: large, medium and
small sizes.
Constraints faced by trained beekeepers in using
modern beekeeping technologies Fifteen (15) possible constraints to use of
modern beekeeping technologies were listed. Respondents indicated the severity of these constraints on a 3-point rating scale of 2, 1 and 0 for “severe constraint”, “mild constraint”, and “not
a constraint”. The mean scores were computed and

Nigerian Journal of Rural Sociology Vol. 16, No. 1, June 2015
63
used to rank from the most severe constraints to the
least severe.
Benefits of using modern beekeeping technologies Fifteen (15) possible benefits of using modern beekeeping technologies were presented to
respondents. These benefits were measured on a 3-point rating scale of 2, 1 and 0 for “great benefit”, “small benefit” and “no benefit”. The mean score for each benefit item were used to rank these benefit from the greatest to the least.
Method of data collection and analysis
Primary data were collected from the respondents using well-structured questionnaire.
Data collected were analysed with the aid of descriptive statistical tools which include frequencies, percentage distribution and mean. The hypotheses tested for significance difference
between use of modern beekeeping technologies before and after training, this was analysed using paired sample t-test.
RESULT AND DISCUSSION
Enterprise characteristics of trained beekeepers Result on Table 2 presents the enterprise characteristics of respondents. It reveals that a
larger percent (39.7%) had between 5 and 9 years of experience and 35.1% had less than 4 years of experience. This implies that majority (74.6%) of the trained beekeeper had less than 10 years of
beekeeping experience which suggest that that commercial beekeeping is a relatively new enterprise in the area. This supports the findings of Matanmi et al (2008), who reported that majority
of beekeepers are new in the enterprise. Table 2 also reveals that 61.1% of the respondent got their initial capital from personal savings. This is in line with the findings of Folayan
and Bifarin (2013) that most agricultural enterprises depend on personal savings as start-up credit. It was also revealed that information on
training was from a variety of sources with a larger percentage from beekeepers association 43.5% while, family and friends had 30.5%. Furthermore, majority (85.0%) of the trained beekeepers are
members of Beekeepers Association of Nigeria (BAN) Oyo State chapter. Table 2: Distribution of respondents by enterprise characteristics
Enterprise characteristics
Frequency
Percentages
Mean
Years of
experience
Less than 4 years 46 35.1 6±4 5-9 years 52 39.7
10-14 years 29 22.1 15-19 years 4 3.1
Source of capital Personal Savings 80 61.1
Enterprise characteristics
Frequency
Percentages
Mean
Family and Friends 10 7.6
Loan 29 22.1 Cooperative Society
12 9.2
Source of
information on
training
Family and friends 40 30.5 Beekeepers Association
57 43.5
Television 8 6.1 Newspapers 2 1.5 Radio 10 7.6
Extension Agent 14 10.7
Membership
Beekeepers
Association of
Nigeria
Yes 111 85.0 No 20 15.0
Source: Field survey, 2013
Involvement in beekeeping
The distribution of hives is very important for this study because it is an indicator of the involvement of the respondents in beekeeping.
Table 3 reveals that the number of hives possessed by a respondent ranged between 2 and 100 hives. The mean number of hives was 16 ±14 hives, more than half (62.6%) of trained beekeepers possessed
between 2 and 16 hives. The hives were categorised into: large, medium and small based on their standardized measurement known to the respondents and those who construct hives. Table
2, further reveals that 60.6% of respondents used medium hives, 28.0% used small hives while only 25.2% used large hives. This implies that use of medium hives is most used hive among
respondents. This is likely because medium hives was the recommended hives from the training are most convenient to use.
Table 3: Distribution of respondents based on involvement in beekeeping enterprise
Beekeeping enterprise characteristics
Frequency Percentages Mean
Number of hives
2-16 hives 82 62.6 16 ±14 17-31 hives 38 29.0 32-46 hives 5 3.8 47-61 hives 5 3.8 Above 61hives 1 0.8
Hive categories Large hives 33 25.2 Medium hives 82 60.6
Small hives 36 28.0

Nigerian Journal of Rural Sociology Vol. 16, No. 1, June 2015
64
Total 131 100
Source: Field survey, 2013
Benefits derived from of use of modern
beekeeping technologies
Table 4 reveals that increased quantity of
honey produced ranked highest among the benefits derived from the training, followed by the benefit of retaining the bees’ colony after harvesting and improved quality of honey. This implies that the
most prominent advantage of using modern
beekeeping was increased production of honey from hive, as the ultimate reason for engaging in beekeeping was for increased production of honey which will generate more income and improve the
livelihood of beekeepers. This corroborates GEF (2009) which posit that increased production of honey is leading to the improvement of beekeepers’ livelihoods
Table 4: Distribution of respondents by benefits derived from the use of modern beekeeping technologies
SN Statements Great Benefit
Small Benefit
No Benefit
Mean Rank
F % F % F %
1. Increased quantity of honey produced 121 92.3 9 6.9 1 0.8 1.92 1st 2. Improved quality of honey 119 90.8 11 8.4 1 0.8 1.90 3rd 3. Easier access to apiary 118 90.1 9 6.9 4 3.1 1.87 4th
4. Retains bees colony after harvesting 119 90.8 12 9.2 0 0.0 1.91 2nd 5. Natural biodiversity conservation 74 56.5 53 40.5 4 3.1 1.53 9th 6. Lower production cost 49 37.4 62 47.3 20 15.3 1.22 15th 7. Early discovery of swarming. 64 48.9 42 32.1 25 19.1 1.30 14th 8. Easy inspection of hive. 76 58.0 32 24.4 23 17.6 1.41 12th 9. Prevents aggressiveness of bees 81 61.8 37 28.2 13 9.9 1.52 10th 10. Less bee stings on humans 91 69.5 35 26.7 5 3.8 1.66 6th 11. Better assessment of colonies 80 61.1 46 35.1 5 3.8 1.58 7th 12. Prevent the harvesting of brood (eggs,
larvae, pupae)
95 72.5 11 8.4 25 19.1 1.54
8th
13. better evaluation of beekeeping as a business
89 67.9 19 14.5 23 17.6 1.50
11th
14. Increase in shelf-life of bee products 79 60.3 27 20.6 25 19.1 1.41 12th 15. Safer bee-product for human
consumption 110 84.0 19 14.5 2 1.5
1.82 5th
Source: Field survey, 2013
Constraints to use of modern beekeeping
technologies
The result on Table 5 reveals that invasion by Fulani herds men ranked highest in order of severity among the constraints to the use of modern beekeeping technologies; this was because hives were placed in the farm and forest vegetation which exposed them to Fulani herdsmen searching for
green pasture for their herds. The results also reveal that lack of credit facilities and high cost of standard equipment ranked second in order of severity, this implies that high cost of purchasing
some of these modern technologies such as honey extraction machine and kits, discouraged
beekeepers from use of modern technologies to the latter. This supports the findings by Ouma et al
(2006), that prominent among problems affecting the use of improved agricultural technologies by farmers was access to credit; as farmers who have access to credit are more likely to use improved technology innovations compared with farmers who do not have access to credit. This is because
use of improved technologies may require extra resource commitment that can only be met through acquisition of credit facilities.
Table 6: Distribution of respondents by constraints to use of modern beekeeping technologies
SN Constraints items Not a
constraint
Mild
constraint
Severe
constraint
Mean Rank
F % F % F %
1. Land tenure problem. 28 21.4 39 9.8 64 48.9 1.28 7th 2. Un-colonization hives. 24 18.3 71 54.2 36 27.5 1.09 9th 3. Frequent absconding of bees 21 16.0 60 45.6 50 38.2 1.22 8th
4. Invasion by Fulani herds men 6 4.6) 30 22.9 95 72.5 1.68 1st 5. Bush burning 17 13.0 54 41.2 60 45.8 1.33 5th
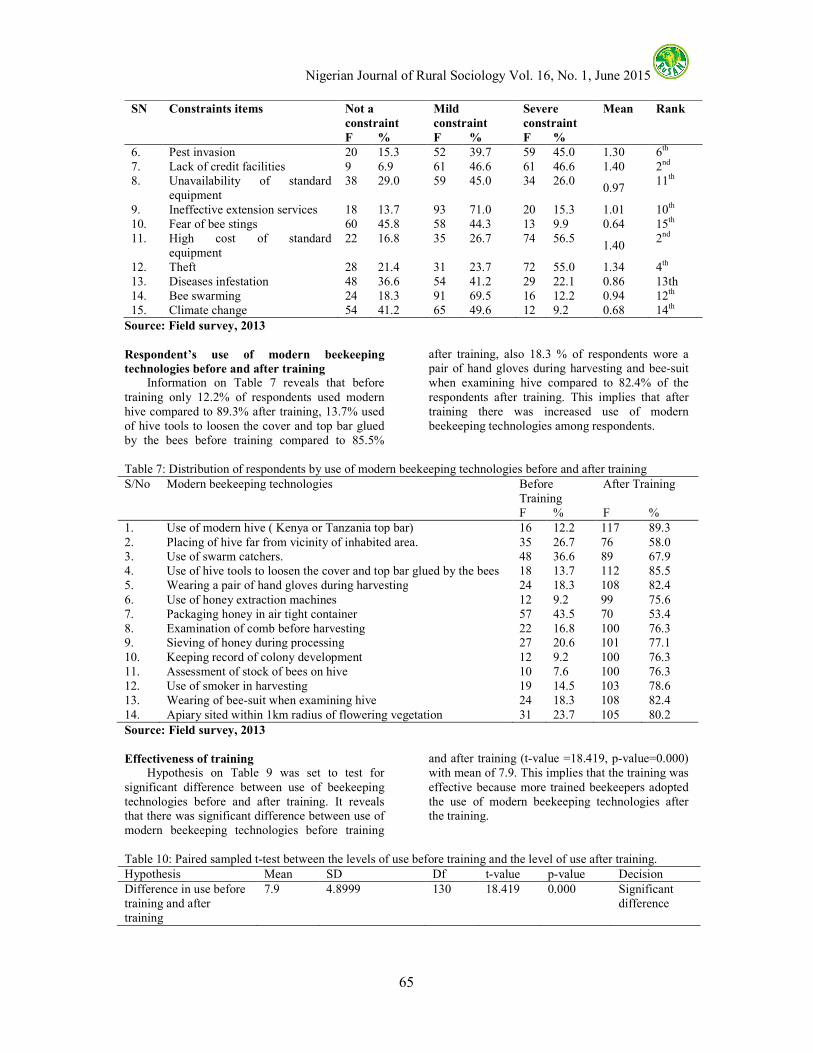
Nigerian Journal of Rural Sociology Vol. 16, No. 1, June 2015
65
SN Constraints items Not a
constraint
Mild
constraint
Severe
constraint
Mean Rank
F % F % F %
6. Pest invasion 20 15.3 52 39.7 59 45.0 1.30 6th 7. Lack of credit facilities 9 6.9 61 46.6 61 46.6 1.40 2nd 8. Unavailability of standard
equipment 38 29.0 59 45.0 34 26.0
0.97 11th
9. Ineffective extension services 18 13.7 93 71.0 20 15.3 1.01 10th 10. Fear of bee stings 60 45.8 58 44.3 13 9.9 0.64 15th 11. High cost of standard
equipment 22 16.8 35 26.7 74 56.5
1.40 2nd
12. Theft 28 21.4 31 23.7 72 55.0 1.34 4th 13. Diseases infestation 48 36.6 54 41.2 29 22.1 0.86 13th 14. Bee swarming 24 18.3 91 69.5 16 12.2 0.94 12th 15. Climate change 54 41.2 65 49.6 12 9.2 0.68 14th
Source: Field survey, 2013
Respondent’s use of modern beekeeping
technologies before and after training
Information on Table 7 reveals that before
training only 12.2% of respondents used modern hive compared to 89.3% after training, 13.7% used of hive tools to loosen the cover and top bar glued by the bees before training compared to 85.5%
after training, also 18.3 % of respondents wore a pair of hand gloves during harvesting and bee-suit when examining hive compared to 82.4% of the
respondents after training. This implies that after training there was increased use of modern beekeeping technologies among respondents.
Table 7: Distribution of respondents by use of modern beekeeping technologies before and after training
S/No Modern beekeeping technologies Before Training
After Training
F % F %
1. Use of modern hive ( Kenya or Tanzania top bar) 16 12.2 117 89.3
2. Placing of hive far from vicinity of inhabited area. 35 26.7 76 58.0 3. Use of swarm catchers. 48 36.6 89 67.9 4. Use of hive tools to loosen the cover and top bar glued by the bees 18 13.7 112 85.5 5. Wearing a pair of hand gloves during harvesting 24 18.3 108 82.4
6. Use of honey extraction machines 12 9.2 99 75.6 7. Packaging honey in air tight container 57 43.5 70 53.4 8. Examination of comb before harvesting 22 16.8 100 76.3 9. Sieving of honey during processing 27 20.6 101 77.1
10. Keeping record of colony development 12 9.2 100 76.3 11. Assessment of stock of bees on hive 10 7.6 100 76.3 12. Use of smoker in harvesting 19 14.5 103 78.6 13. Wearing of bee-suit when examining hive 24 18.3 108 82.4
14. Apiary sited within 1km radius of flowering vegetation 31 23.7 105 80.2
Source: Field survey, 2013
Effectiveness of training
Hypothesis on Table 9 was set to test for
significant difference between use of beekeeping technologies before and after training. It reveals that there was significant difference between use of modern beekeeping technologies before training
and after training (t-value =18.419, p-value=0.000) with mean of 7.9. This implies that the training was
effective because more trained beekeepers adopted the use of modern beekeeping technologies after the training.
Table 10: Paired sampled t-test between the levels of use before training and the level of use after training.
Hypothesis Mean SD Df t-value p-value Decision
Difference in use before training and after training
7.9 4.8999 130 18.419 0.000 Significant difference

Nigerian Journal of Rural Sociology Vol. 16, No. 1, June 2015
66
CONCLUSIONS AND RECOMMENDATION
This study concluded that training on use of modern beekeeping was effective as there was significant difference in use of modern beekeeping technologies before training and after training.
Information on training was sourced mainly through beekeepers association while, personal saving was the major source of credit. The benefit derived most from the use of the modern beekeeping technology was increase in quantity of honey produced. Invasion by Fulani herdsmen and lack of credit facilities were the major constraints to the use of the modern beekeeping technologies.
It is therefore recommended that, the training should be replicated in other states and for other agricultural enterprises also government should formulate policy that will guide grazing of
livestock such as setting up of grazing centres for cattle should be set up so as to reduce invasion of Fulani herdsmen into apiaries
REFERENCES
Ayansola, A. A. (2012) An appraisal of apicultural practices in south-western Nigeria. Journal of Agricultural Science, 3(2): Pp.
79-84 Folayan, J. A. and Bifarin, J. O. (2013) Profitability
analysis of honey production in Edo North Local Government Area of Edo State,
Nigeria. Journal of Agricultural
Economics and Development Vol. 2(2), Pp. 60-64
GEF (Global Environment Facility) (2009) Hand-
book: Towards Enhancing the Impacts of Environmental Projects. Methodological Paper 2. 46 pp. Available at: www.thegef.org/gef/sites/thegef.org
Matanmi, B.M, Adesiji, G.B., and Adegoke, M. A (2008) An analysis of activities of bee hunters and beekeepers in Oyo state, Nigeria. African Journal of Livestock
Extension, 6 (7), Pp. 3 National Population Commission (2006): Result of
2006 Population Census, N.P.C, Abuja, Nigeria.
Ojeleye, B. (2003): Honey Production in Nigeria. A Three-day Beekeeping and Honey Production Training Workshop Conducted by Centre for Bee Research and
Development (CEBRAD), Ibadan, Held at the Faculty of Agriculture, University of Ilorin, Nigeria.
Olorunyomi, O. L (2009) Modern Beekeeping
Made Easy. Ayodeji printing press: Ondo state. Nigeria. Pp. 5, 14
Ouma, J.O., De Groot, H. and Owour, O. (2006) Determinants of Improved Maize
Seed and Fertiliser Use in Kenya: Policy Implications. Paper presented at the International Association of Agricultural Economists’ Conference, Gold Coast,
Australia.

Nigerian Journal of Rural Sociology Vol. 16, No. 1, June 2015
67
EFFECTIVENESS OF E-WALLET SCHEME IN CURBING SHARP PRACTICES ASSOCIATED
WITH AGRICULTURAL INPUT ACCESSIBILITY AMONG SMALLHOLDER FARMERS IN KANO
STATE, NIGERIA 1Yusuf, O. J., 2Abdullahi, K. A. and 3Haruna, S. K
1Department of Agricultural Economics and Extension Services, Kwara State University, Malete 2Department of Agricultural Economics and Extension, Federal University Dustin-Ma, Kastina
3National Agricultural Extension and Research Liaison Services, Ahmadu Bello University, Zaria E-mail: [email protected]
ABSTRACT
Farm inputs, such as improved seedlings and fertilisers, are germane to enhancing farmers’ productivity.
However, government efforts at making them affordable and accessible to farmers are fraught with sharp and
corrupt practices. The electronic wallet scheme was introduced by the federal government to curb the menace.
This study evaluated the effectiveness of the scheme in curbing sharp practices associated with agricultural
input accessibility by smallholder farmers in Kano State. Using structured interview schedule, the study elicited
information from 180 respondents selected from 9 LGAs of the state through multistage sampling procedure.
Data were collected on socio-economic and e-wallet scheme related characteristics of the respondents and their
perception about the effectiveness of scheme. Frequency counts, percentages and weighted mean score values
were used for data analysis. Majority of the beneficiaries of the scheme were male (88.9%), married (81.1%)
and within their productive age range (mean age = 43.1 years). Some, although very few, were neither
registered in the scheme (5%), nor had mobile phone (3%), while more proportion (about 32%) did not attend
the requisite e-wallet training, yet they benefitted from input distribution under the scheme. Farm inputs
benefitted from were mainly subsidised fertiliser and improved seeds and frequency of benefit was low.
Although beneficiaries mostly perceived e-wallet scheme as effective in ensuring transparency and reducing
sharp practices prevalent in the old system, yet the ‘people’ component (i.e. human factor) of the e-wallet
system seemed vulnerable which could undermine the success of the initiative. Recommended, amongst others,
is need for government to pay special attention to disproportion in gender composition amongst beneficiaries,
while also ensuring that stipulated conditions, such as registration of beneficiaries, possession of mobile
phones, and attendance of necessary training are abided with in order to check corrupt practices. Lastly, but
perhaps most importantly, government should be on the lookout for culprits and defaulters and sanction them
appropriately.
INTRODUCTION Agriculture used to be the mainstay of
Nigeria’s economy before the discovery of oil. The agricultural sector was the most important in terms of its contribution to domestic production, employment and foreign exchange. It contributed
as much as 60% to the nation’s Gross Domestic Product (GDP) prior to the oil boom in the 1960s. But, the story changed afterwards with agriculture’s contribution becoming as low as 22 %
by 1980. The National Bureau of Statistics reported that the trend in the share of agriculture in the GDP shows a substantial variation and long-term decline from 60% in the early 1960 through 48.8% in the
1970s and 22.2% in the 1980s (NBS, 2014). This was largely due to the neglect of the agricultural sector in deference to oil. Successive national governments realized the potentials of agriculture towards employment generation, food security and poverty reduction. As such, several government initiatives have been established in order to ensure agriculture attains its
full potential. Prominent amongst these schemes include National Accelerated Food Production Projects established in 1972, Agricultural Development Projects (ADPs) established in 1975
and the subsequent Multi-State Agricultural Development Projects (MSADPs) later established
in 1986. Others include Operation Feed the Nation programme of 1976, River Basin Development
Authority (RBDA), (1973) and the Green Revolution Programme (1980). Later in the between mid and early 90s, the Directorate of Food, Road and Rural Infrastructure (DFRRI) was
established in 1986, National Directorate of Employment (NDE), (1986), Nigeria Agricultural Insurance Scheme (NAIS), (1987) and National Fadama Development Project (NFDP), (1992). In
the last one and half decade, Poverty Alleviation Programme (PAP) was established in the year 2000, National Special Programme for Food Security (NSPFS) in 2003 and National Economic
Empowerment and Development Strategy (NEEDS) programme was introduced in 2004 (Adebayo and Okuneye, 2011; Jibowo, 2005). Much lately was the Agricultural Transformation Agenda of the last democratic administration in 2012. Although the different governmental initiatives might have had different foci, the common theme
across them was to ensure enhancing farmers’ productivity through provision of farm inputs, such as fertilisers, improved seeds and seedlings, etc. As aptly put by Jibowo (2005) ‘the Federal
Government special agricultural development schemes were aimed at boosting food production

Nigerian Journal of Rural Sociology Vol. 16, No. 1, June 2015
68
and farmers’ income through the provision of
agricultural infrastructure, inputs and effective extension work’. Sadly, however, most of these initiatives often did not outlive the regime that established them. Asides, a perennial problem
afflicting the agricultural sector is that governmental effort towards making these inputs affordable and accessible to farmers is fraught with sharp and corrupt practices. Corruption is a global problem that affects development and has been present for ages (Carr and Jago, 2014). The menace of corruption has adversely impacted on virtually every sector of the
Nigerian economy, agriculture inclusive. Several attempts made over the years to boost farmers’ productivity include supplying of farm inputs such as improved seeds, agrochemicals and fertilisers at
subsidised prices to the farmers. However, a large proportion of these inputs could not get to real farmers, as a result of the high level of corruption, insincerity and political interruption in the distribution channels (Adebo, 2014). Earlier, Adesina (2013) pointed out that the old system used in supplying inputs to the farmers was weak, inefficient and fraudulent, hence a large proportion
of the farmers could not benefit from it. Furthermore, inputs meant for the farmers were diverted by political elites to other countries for personal gains. In addition, most of the fertilisers
eventually supplied to farmers were adulterated, thus damaging the environment and reducing farmers’ productivity Adesina (2013). Information Technology (IT) has great
potentials in curbing the menace of corruption (Carr and Jago, 2014). The deployment of IT in agriculture is not new, as evident in the Geneva plan of action of the World Summit of Information
Society (WSIS) where e-agriculture is one of the identified action lines (e-agriculture, 2015). However, its use in tackling the menace of corruption in agriculture has not been largely
exploited. An example of the deployment of IT in eradicating corrupt tendencies and sharp practices in the agricultural sector in Nigeria was the introduction of Electronic Wallet (e-wallet) in
purchase and distribution of agricultural inputs in 2012. The e-wallet is a major component of Growth Enhancement Scheme (GES); an initiative introduced under the Agricultural Transformation Agenda of the federal government. An e-wallet is defined as an efficient and transparent electronic device system that makes use of vouchers for the purchase and distribution of
agricultural inputs (Adesina, 2013). That is, e-wallet involves use of information technology to check corrupt practices and tendencies in agricultural input dissemination to farmers.
Although certain studies (e.g. Adebo, 2014; Akinbile et al., 2014) have focused on the
effectiveness of the e-wallet approach towards
effective agricultural service delivery, and have evaluated factors associated with famers’ willingness to utilise the e-wallet scheme for accessing agricultural information, none has
however examined the use of information technology via e-wallet approach to check the menace of corruption in the agricultural sector. This study was designed to fill that gap. The main objective of the study was to evaluate the effectiveness of the e-wallet scheme in curbing sharp practices associated with agricultural input accessibility among smallholder farmers.
Specific objectives were to: i. describe the socioeconomic characteristics of
the e-wallet scheme beneficiaries; ii. ascertain what agricultural inputs they had
access to and its frequency; iii. determine the perception of beneficiaries about
effectiveness of the e-wallet scheme
METHODOLOGY
Kano State was the study. There are 3 geopolitical zones in the state. Respondents included in the study were selected through a multi-
stage sampling procedure. Firstly, one Local Government Area was purposefully chosen from each geopolitical zone on the basis of having access to extension service delivery and frequent farming
activities in both dry and wet seasons. This gave 3 LGAs namely Bichi from Kano North senatorial zone, Bunkure from Kano South senatorial zone and Kura in Kano Central zone. Then 3
communities were purposefully selected from each LGA based on inclusion in the irrigation scheme of Kano Irrigation Project (KRIP) and Watari Irrigation Project (WIP), making 9 villages. This
was to ensure that respondents to be selected would not have irrigation problem with their farming activities. The villages thus picked were: Badume, Damargu and Hagagawa in Bichi LGA, Barkun,
Bunkure cikin gari and Shirin in Bunkure LGA and Agolas, Bugau and Karfi in Kura LGA. Lastly, 20
respondents were again purposefully selected from list of registered farmers with the 2 irrigation
projects across the 9 communities, giving a total of 180 beneficiaries of the e-wallet scheme in Kano state sampled for the study. Primary data was used for the study. Data collection was done with use of structured interview schedule administered to the respondents with the assistant of trained enumerators, including state ADP extension agent. Data collected included
socioeconomic and e-wallet scheme related characteristics of the respondents. Data were also collected on beneficiaries’ perception about the effectiveness of the e-wallet scheme.
Independent variables such as sex, marital status, major occupation, crops cultivated etc were

Nigerian Journal of Rural Sociology Vol. 16, No. 1, June 2015
69
measured at nominal level. Others such as age,
household size, farm size, years of farming experience, etc were measured with absolute values provided. ‘Beneficiaries’ perception about effectiveness of e-wallet scheme in curbing sharp
practices’ was the dependent variable. It was measured through responses to 20 perceptional statements on a 5 point Likert-type scale as follows: Strongly agreed (SA) – 5, Agreed (A) – 4, Undecided (U) – 3, Disagreed (D) – 2 and Strongly Disagreed (SD) – 1. Data were summarized using descriptive statistics such as frequency counts, percentages,
mean and standard deviation. In addition weighted mean score (WMS) was computed for each perceptional statement. For the purpose of this analysis, responses were first recorded viz: SA – 4,
A – 3, D – 2, SD – 1 & U – 0. The recoding was done to ensure that ‘undecided’ responses did not unduly affect the weighted mean value. Then, the frequencies of each option were multiplied by its weight, summed together and then divided by the total number of respondents (180). The WMS thus calculated ranged between 1 and 4, which depending on the value obtained on this continuum
indicated the degree of respondents’ concordance with each statement. Furthermore, respondents’ overall perception about the statements was obtained using mean plus/minus standard deviation,
with mean – standard deviation indicating unfavorable perception, mean + standard deviation indicating favorable perception, and proportion in between these two range indicating indifference
disposition.
RESULTS AND DISCUSSION
Personal and socioeconomic characteristics of
respondents
Results in Table 1 show that majority (83.3%) of the respondent fell between 31 and 60 years age bracket. Few (11.7%) were below 30 years while
only 5% were above 60 years old. Mean age of respondent was 43.1 years with standard deviation of 10.2. Also, majority (88.9%) of respondents were male with just 11.1% female. In the same
vein, majority (81.1%) were married while 14.4% were still single. Very few (3.3% and 1.1%) were divorced and separated, respectively. These results indicate that majority of the e-wallet scheme beneficiaries were largely male, married and of middle-age. This suggests a disproportionate gender composition of the beneficiaries of the e-wallet scheme in favour of
the male gender, finding which supported that of Adebo (2014), where more male beneficiaries reportedly participated in the e-wallet scheme in Kwara State. This might not be unconnected with
the condition prevalent within the socio-cultural
milieu of the study area where male is the dominant
gender. Results further show that the primary occupation of majority (88.3%) of the respondents was farming. Thirty percent were primarily
artisans, while 20.6%, 11.7% and 10% were primarily traders, civil servants and teachers respectively. This indicates that the beneficiaries in the e-wallet scheme were primarily farmers. This is not unexpected given that one of the desires of the federal government in the establishment of the scheme, according to Adesina (2013), was to target real farmers engaged in farming activities and
eliminate influx of political farmers predominant in the old system on input distribution. The results also show that about 28% and 30% of the respondents completed secondary and
tertiary education, respectively. About 22% had koranic education while 10% completed primary education only. This indicates that respondents completed some sort of formal education at various levels, and is similar to findings reported by Akinbile et al. (2014) where beneficiaries of the e-wallet scheme in Osun State were reportedly mostly literate. This might likely have implication
on respondents’ responsiveness and participation in the scheme, as educational status is expected to enable them make better and well informed decision. This submission is further supported by
findings of Obinne (1991) who opined that education is an important factor that has been established to influence adoption of modern farm practices.
Also, majority (93.9%) cultivated between 1 and 5 acres, while very few (6.1%) had between 6 and 10 acres of farm land. Average farm size was 2.6 acres. This indicates that majority of the
respondents were small scale farmers, and this agreed with the submission of Olayide (1992), Orisakwe and Agumuo (2004) and Akinbile et al. (2014) that most Nigerian farmers are small-scale
farmers that cultivate small area of land. Furthermore, large proportion (65%) of the respondents had as much as 6 members of household. About 27% had between 7 and 12
individuals. Average household size was 5.5. This is similar to findings reported by Akinbile (2014) where about 63% of e-wallet scheme beneficiaries in Osun State had below 6 members of household. The implication of the finding is that family labour might be readily available for use for household farming activities.

Nigerian Journal of Rural Sociology Vol. 16, No. 1, June 2015
70
Table 1: Personal and socioeconomic
characteristics of the e-wallet scheme beneficiaries, n = 180
Variable Frequency Percentage
Age (years)
Below 30
31 – 60 Above 60 Mean
Standard deviation
21
150 9 43.1
10.2
11.7
83.3 5.0
Sex
Male
Female
160
20
88.9
11.1
Marital status
Married Single
Separated
Divorce
146 26
2
6
81.1 14.4
1.1
3.3
Educational level
No formal education Koranic education Adult education Pry school incomplete Pry school completed Sec. school incomplete Sec. school completed
Tertiary education
2 40 1 8 18 4 50
57
1.1 22.2 0.6 4.4 10.0 2.2 27.8
31.7
Household size
Below 6 7 – 12
13 – 18 Above 18 Mean Standard deviation
117 48
11 4 5.5 5.2
65.0 26.7
6.1 2.3
Primary occupation*
Farming Artisan Teaching Trading
Civil servant
159 54 18 37
21
88.3 30.0 10.0 20.6
11.7
Farm size (Acres)
1 – 5 6 – 10 Mean
Standard
169 11 2.6
2.3
93.9 6.1
Source: Computed from field survey, 2015
*Multiple responses applicable
Results in Figure 1 show that above average (57.8% and 56.1%) of the respondents cultivated rice and maize respectively. About 38%, 27% and
22% cultivated sorghum, cowpea and groundnut, respectively, while about 16% each cultivated millet and tomatoes. The results indicate beneficiaries of the e-wallet scheme were farmers cultivating a wide variety of arable crops. This could be as a result of the economic and cultural
importance of these crops, being major staples
common in the study area. The implication of this finding is that farmers having access to subsidised input under the e-wallet scheme would enable them enhance their production of locally important staple
crops common amongst inhabitants of the study area.
Figure 1: Distribution showing crop cultivated by the beneficiaries of the e-wallet scheme
E-wallet scheme related characteristics of
beneficiaries
Results in Table 2 show that majority (96.7% and 95%) of the respondents had mobile phone and were registered beneficiaries in the e-wallet scheme. About 56% got registered in the scheme in 2012; 38% registered in 2013 while very few (0.6%) got registered in 2014. Also, About 68%
attended training organised for beneficiaries of the scheme. The results indicate that about 5% and 3.3% of the beneficiaries were neither registered in the scheme nor had mobile phone, while about 32%
did not attend the training, yet they benefitted from input distribution under the scheme. Registration in the scheme, possession of mobile phones and attendance of the training were part of condition for inclusion of beneficiaries in the scheme (Signal alliance, 2014). Adebo (2014) found that 86% of the beneficiaries of the e-wallet scheme in Kwara state had mobile phones, while
all (100%) registered in the scheme and participated in the e-wallet training. The inclusion of non-registered individuals, as well as those not possessing mobile phones, although very minute
tends to suggest corrupt practices prevailing in the e-wallet scheme. Similarly, as much as 32% of the beneficiaries who did not participate in the compulsory training could undermine the
transparency drive of the scheme. Results in Table 2 further show that majority (96.7% and 94.4%) of the respondents had benefitted from subsidised fertiliser and improved
seeds, respectively, under the scheme. While about 42% each had benefitted from subsidised seeds once, only about 12% benefitted thrice from subsidised input. On the other hand, about 41% had

Nigerian Journal of Rural Sociology Vol. 16, No. 1, June 2015
71
benefitted from subsidised fertiliser twice, while
35% and 21.1% benefitted from this input once and thrice, respectively. The results indicate that fewer proportion of the respondents had benefitted from subsidised input up to three times, which implies
low frequency of time they had access to input supply under the scheme. This is similar to result obtained by Adebo (2014) where fewer proportion (20%) among beneficiaries of the e-wallet scheme in Kwara State had access to input beyond three times. The finding suggests that beneficiaries might not have access to sufficient input needed for their farming activities under the e-wallet scheme.
Table 2: e-wallet scheme related information, n = 180
Variable Frequency Percentage
Possession of mobile
phone
Yes
No
176
6
96.7
3.3
Registration in
scheme
Yes
No
171
9
95.0
5.0
Year of 1st
registration
2012 2013 2014
Not applicable
101 69 1
9
56.1 38.3 0.6
5.0
Attendance of e-
wallet training
Yes
No
123
57
68.3 31.7
Farm input
benefitted from
Subsidised improved seeds
Subsidised fertiliser
170
174
94.4
96.7
Frequency of time
benefitted
Subsidised seeds
Once Twice Thrice
Not applicable
76 75 21
10
42.2 41.7 11.7
5.6
Subsidised fertiliser
Once Twice
Thrice Not applicable
63 73
38 6
35.0 40.6
21.1 3.4
Source: Computed from field survey, 2015
Beneficiaries’ perception about effectiveness of
the e-wallet towards curbing corrupt practices
Results in Table 3 show that majority (about 87%) believed that the ‘introduction of e-wallet scheme greatly enhanced transparency in processes
involved in purchase and distribution of agricultural inputs amongst smallholder farmers’. This statement recorded weighted mean of score of 3.22 out of possible 4. However, about 69% still believed that ‘large proportion of agricultural inputs could not still reach farmers under the e-wallet scheme due to corrupt practices’ (WMS = 2.77). These results indicate that, although
beneficiaries strongly believed that e-wallet scheme enhanced transparency in accessibility of farm inputs, yet, they still believed that corrupt tendencies still persist under the scheme.
About 69% believed that political interference could prevent successful implementation of the scheme (WMS = 2.72), as shown in Table 3. However, only about 39% believed that ‘diversion of inputs by political elites for personal gain still persists under the scheme’ (WMS = 1.91). In the same vein, large proportion, about 63%, believed that political farmers have been sidelined in the e-
wallet scheme (WMS = 2.49). These results suggest beneficiaries were favorably disposed to the effectiveness of the e-wallet scheme in reducing political influx that characterized the old system.
Similarly, about 79% believed that fraudulent practices prevalent in the old system of input distribution have been greatly reduced. Also, a total of 56.7% were opposed to the
view that fertiliser adulteration prevalent in the old system still persists under the e-wallet scheme while just 37.2% favored the view (WMS = 2.04). This indicates that above half of the beneficiaries
did not favor the view of prevalence of fertiliser adulteration in the scheme. Results in Table 3 further show that about 67.2% believed that ‘large proportion of farmers
now have easy accessibility to agricultural inputs due to transparency of the scheme’ (WMS = 2.64). Similarly, about 83% favoured the view that ‘use of e-voucher to redeem agricultural inputs from agro-
dealers enhances efficient and transparent distribution of inputs amongst smallholder farmers’. In same vein, about 64% also believed that ‘use of e-voucher to redeem agricultural inputs from agro-dealers guarantees reduction of corrupt practices’; WMS of 2.86 and 2.48, respectively, were recorded here. These findings agree with earlier submission buttressing beneficiaries’
favourable perception of e-wallet scheme in enhancing transparency and reducing corruption associated with input distribution amongst smallholder farmers.

Nigerian Journal of Rural Sociology Vol. 16, No. 1, June 2015
72
Table 3: Perception of beneficiaries about effectiveness of the e-wallet scheme in curbing corruption
Statements SA A D SD U WMS
Introduction of e-wallet scheme
greatly enhanced transparency in processes involved in purchase and distribution of agricultural inputs amongst smallholder farmers
87 (48.3) 70 (38.9) 3 (1.7) 12 (6.7) 8 (4.4) 3.22
Large proportion of agricultural inputs could still not reach farmers under the e-wallet scheme due to corrupt practices
65 (36.1) 60 (33.3) 21 (11.7) 16 (8.9) 18 (10.0) 2.77
Political interference prevents the successful implementation of the e-wallet scheme
64 (35.6) 60 (33.3) 11 (6.1) 31 (17.2) 14 (7.8) 2.72
Diversion of inputs by political elites for personal gain still persists under the e-wallet scheme
35 (19.4) 35 (19.4) 29 (16.1) 40 (22.2) 41 (22.8) 1.91
Political farmers have been totally sidelined through the new approach used in the scheme
46 (25.6) 67 (37.2) 20 (11.1) 24 (13.3) 23 (12.8) 2.49
Fraudulent practices involved in the old system of input distribution have been greatly reduced under the e-wallet scheme
65 (36.1) 78 (43.3) 9 (5.0) 10 (5.6) 18 (10.0) 2.90
Large proportion of farmers now
has easy accessibility to agricultural inputs due to transparency of the e-wallet scheme
52 (28.9) 69 (38.3) 17 (9.4) 26 (14.4) 16 (8.9) 2.64
The e-wallet scheme has greatly reduced the inefficiency that characterized the old system of input distribution
58 (32.2) 55 (30.6) 21 (11.7) 14 (7.8) 32 (17.8) 2.52
Fertiliser adulteration prevalent in the old system still persists under the e-wallet scheme
34 (18.9) 33 (18.3) 30 (16.7) 72 (40.0) 11 (6.2) 2.04
Use of e-voucher to redeem
agricultural inputs from agro-dealers guarantees reduction of corrupt practices prevalent in the old system
59 (32.8) 56 (31.1) 18 (10.0) 6 (3.3) 41 (22.8) 2.48
Use of e-voucher to redeem agricultural inputs from agro-dealers enhances efficient and transparent distribution of
agricultural inputs amongst smallholder farmers
59 (32.8) 90 (50.0) 3 (1.7) 2 (1.1) 26 (14.5) 2.86
SA – Strongly agreed; A – Agreed; D – Disagreed; SD – Strongly disagreed; U - Undecided
Source: Computed from field survey, 2015
Results in Table 4 show that majority (66.1%) of the respondents were of the opinion that ‘18 years age limit criteria for inclusion and participation in the e-wallet scheme is not
thwarted’, while few, about 15%, disagreed with this view. The statement recorded WMS of 2.64. This indicates respondents’ favourable perception
about under aged not been engaged to perpetuate corrupt tendencies through impersonation in the scheme. Also, about 53.9% of the respondents did not support the opinion that ‘helpline personnel and
redemption supervisors discharge their responsibilities diligently without demand for ‘tip-off’. Only about 18% supported this view. WMS

Nigerian Journal of Rural Sociology Vol. 16, No. 1, June 2015
73
was low, 1.39. In same vein, only about 48.9%
supported the view that ‘helpline personnel and redemption supervisors sluggishly delay in discharge of their responsibilities when not ‘tipped-off’”, while about 40% did not hold this view. The
results here indicate that ‘people’ component within the e-wallet system still seemed vulnerable to sharp practices. This finding mirrors the general trend in government business in the country, which further explains the root cause of prevalent corrupt personnel in the scheme. Results in Table 4 further show that majority (72.3%) favoured the view that ‘cumbersomeness
of procedure in getting approval from cellulants encourages corrupt practices’. Similarly, majority (77.2%) favoured opinion that ‘insufficient fertiliser and seed supply encountered sometimes in
the scheme breeds corrupt practices’. WMS recorded for these statements were 2.78 and 2.82, respectively. These indicate that presence of
bureaucratic complexities also tend to encourage
corrupt practices within the e-wallet system. Majority (74.5%) supported the opinion that ‘subsidised inputs are delivered by agro-dealers at half cost to smallholder farmers without demand
for any hidden charges. The statement recorded a very high WMS of 2.75. Also, about 43% supported the opinion that subsidised inputs are distributed to all farmers registered in the scheme without preferential treatment’. Similarly, majority (73.9%) favoured the view that ‘inclusion and registration of farmers at the onset of the scheme was transparent’. WMS was 2.87. Lastly, majority
(77.8%) supported the view that e-wallet scheme has renewed respondents’ confidence of transparency in government programmes and initiatives for smallholder farmers. WMS was 2.85.
These results further reflect the respondents’ resolve about transparency and lack of corrupt practices under the e-wallet scheme.
Table 4: Perception of beneficiaries about effectiveness of the e-wallet scheme in curbing corruption (continued)
Statements SA A D SD U WMS
18 years age limit criteria for inclusion and participation in the e-wallet scheme is not thwarted/circumvented
65 (36.1) 54 (30.0) 14 (7.8) 12 (6.7) 35 (19.5) 2.64
Helpline personnel and redemption
supervisors discharge their responsibilities diligently without demand for ‘tip-off’
13 (7.2) 20 (11.1) 41 (22.8) 56 (31.1) 50 (27.8) 1.39
Helpline personnel and redemption
supervisors sluggishly delay in discharge of their responsibilities when not ‘tipped-off’
40 (22.2) 48 (26.7) 20 (11.1) 25 (13.9) 47 (26.1) 2.05
Cumbersomeness of procedure in getting
approval from ‘cellulants’ encourage corrupt practices
73 (40.6) 57 (31.7) 15 (8.3) 8 (4.4) 27 (15.0) 2.78
Insufficient fertiliser and seed supply encountered sometimes encountered in
the scheme breeds corrupt practices
70 (38.9) 69 (38.3) 8 (4.4) 5 (2.8) 28 (15.6) 2.82
Subsidised inputs are delivered by agro-dealers at half cost to smallholder farmers without demand for any ‘hidden
charges’
84 (46.7) 50 (27.8) 4 (2.2) 1 (0.6) 41 (22.8) 2.75
Subsidised inputs are distributed to all farmers registered in the scheme without preferential treatment
32 (17.8) 45 (25.0) 41 (22.8) 45 (25.0) 17 (9.4) 2.17
Inclusion and registration of farmers at the onset of the scheme was transparent
66 (36.7) 67 (37.2) 16 (8.9) 19 (10.6) 12 (6.7) 2.87
The e-wallet scheme has renewed my confidence of transparency in government programmes and initiatives for smallholder farmers
68 (37.8) 72 (40.0) 8 (4.4) 9 (5.0) 23 (12.8) 2.85
SA – Strongly agreed; A – Agreed; D – Disagreed; SD – Strongly disagreed; U - Undecided
Source: Computed from field survey, 2015
Nigerian Journal of Rural Sociology Vol. 16, No. 1, June 2015
Overall perception of beneficiaries about the
effectiveness of the e-wallet scheme
Results in Figure 2 show that, overall, few(15%) of the beneficiaries had perception about the effectiveness of the escheme towards curbing sharp and corrupt practices
associated with agricultural input distribution. While fewer (13.9%) had unfavourable perception, majority (71.1%) were indifferent. The results reflect mixed perception of the respondents about
the effectiveness of the e-wallet scheme, as reflected in the discussion in previous subsection above. Little proportion of the respondents favorably perceiving the scheme as effectiveness
implies the need to look at critical areas of the scheme which still encourages corruption to thrive as previously highlighted, so as to improve overall perception of the scheme among the beneficiaries.
CONCLUSION AND RECOMMENDATION
Based on the major findings of the study, it
was concluded that majority of the respondents were male, married and within their productive age range. Also, very few beneficiaries were neither registered in the scheme, had mobile phone, nor
attended the e-wallet training, yet they benefitted from input distribution under the scheme. Farm inputs benefitted from were mainly fertiliser and improved seeds and frequency of
benefit was low. In addition, the beneficiaries mostly perceived e-wallet scheme as effective in ensuring transparency and reducing sharp practices prevalent in the old system. Nonetheless, ‘people’
component (i.e. human factor) of the esystem still seemed vulnerable and could undermine the success of the initiative. From the foregoing, it is recommended that
special attention should be paid to disproportion in gender composition amongst beneficiaries of the scheme. Also, there is need to ensure that all beneficiaries are duly registered, compulsorily
attend necessary training and meet any stipulated conditions before benefitting from farm inputs under the scheme in order to check corrupt practices. There is also need for continued encouragement of the beneficiaries to decline lobbying or tipping-off any official involved in thscheme, and re-assuring them not doing this will not undermine their chances of procuring inputs.
Nigerian Journal of Rural Sociology Vol. 16, No. 1, June 2015
74
Overall perception of beneficiaries about the
Results in Figure 2 show that, overall, few 15%) of the beneficiaries had favourable
perception about the effectiveness of the e-wallet scheme towards curbing sharp and corrupt practices
input distribution. favourable perception,
71.1%) were indifferent. The results mixed perception of the respondents about
wallet scheme, as reflected in the discussion in previous subsection above. Little proportion of the respondents favorably perceiving the scheme as effectiveness
at critical areas of the scheme which still encourages corruption to thrive as previously highlighted, so as to improve overall perception of the scheme among the beneficiaries.
CONCLUSION AND RECOMMENDATION
Based on the major findings of the study, it
was concluded that majority of the respondents were male, married and within their productive age range. Also, very few beneficiaries were neither registered in the scheme, had mobile phone, nor
allet training, yet they benefitted from input distribution under the scheme. Farm inputs benefitted from were mainly subsidised
er and improved seeds and frequency of
benefit was low. In addition, the beneficiaries as effective in
ensuring transparency and reducing sharp practices prevalent in the old system. Nonetheless, ‘people’
i.e. human factor) of the e-wallet system still seemed vulnerable and could
foregoing, it is recommended that
special attention should be paid to disproportion in gender composition amongst beneficiaries of the scheme. Also, there is need to ensure that all beneficiaries are duly registered, compulsorily
and meet any stipulated conditions before benefitting from farm inputs under the scheme in order to check corrupt practices. There is also need for continued encouragement of the beneficiaries to decline
off any official involved in the assuring them not doing this will
not undermine their chances of procuring inputs.
Lastly, but perhaps most importantly, government should be on the lookout for culprits and defaulters
and sanction them appropriately.
REFERENCES
Adebo, G. M (2014) Effectiveness of e
practice in grassroots agricultural service delivery in Nigeria: A case study of Kwara state growth enhancement support scheme. Journal of
Biology and Agricultural Sciences
– 9 Adebayo and Okuneye (2011) Economics of
Agricultural Extension. In Madukwe,
M.C. (ed.) Agricultural Extension
in Nigeria A publication of Agricultural Extension Society of
Adesina A (2013) Speech of Former Honorable
Minister of Agriculture and Rural Development, Federal Republic of Nigeria, Governor from Nigeria, at the 36th Session of the IFAD Governing
Council Akinbile, L. A., Akwiwu, U, N. and Alade, O.O.
(2014) Determinants of farmers willingness to utilise eaccessing agricultural information inState, Nigeria. Nigerian Journal of Rural
Sociology 15 (1): 105 – 113Carr, I. and Jago, R. (2014) Petty corruption,
development and information technology as an antidote Round Table
465 – 482 E-agriculture (2015) online document accessed
from http://www.e-agriculture.org/wsis
follow on 8th October, 2015 Jibowo, A.A. (2005). History of Agricultural
Extension in Nigeria. In:
(ed.) Agricultural Extension in Nigeria. Publication of Agricultural Extension Society of
12. NBS (2014) retrieved online from
nigerianstat.gov.ng/sectorstat/sectors/Agri
culture on October
Obinne, C. P. O. (1991) Adoption of improved cassava production technologies by smalscale farmers in Bendel State. Sci. Technol. 1 (1): 12 – 15
Olayide, S.O. (1992) A quantitative analysis of food requirements supplies and demands in Nigeria 1968-1985. Federal Department of Agriculture
Orisakwe, L and Agumuo, F. (2004) Adoptimproved agro-forestry technology among contact farmers in Imo State, Nigeria. Journal of Agriculture and Rural
Development 2 (1): 1 – 9
Lastly, but perhaps most importantly, government should be on the lookout for culprits and defaulters
2014) Effectiveness of e-wallet
practice in grassroots agricultural service in Nigeria: A case study of
Kwara state growth enhancement support Experimental
Biology and Agricultural Sciences 2 (4): 1
2011) Economics of Agricultural Extension. In Madukwe,
Agricultural Extension
A publication of Agricultural Nigeria
2013) Speech of Former Honorable
Minister of Agriculture and Rural , Federal Republic of
Nigeria, Governor from Nigeria, at the 36th Session of the IFAD Governing
Akinbile, L. A., Akwiwu, U, N. and Alade, O.O. 2014) Determinants of farmers
e e-wallet for accessing agricultural information in Osun
Nigerian Journal of Rural
113 2014) Petty corruption,
development and information technology Round Table 103 (5):
2015) online document accessed
agriculture.org/wsis-
October, 2015 History of Agricultural
: S.F. Adedoyin Agricultural Extension in
Publication of Agricultural Nigeria, pp1-
2014) retrieved online from nigerianstat.gov.ng/sectorstat/sectors/Agri
8th 2015
1991) Adoption of improved cassava production technologies by small-scale farmers in Bendel State. J. Agric.
15 1992) A quantitative analysis of
food requirements supplies and demands 1985. Federal Department
2004) Adoption of forestry technology among
contact farmers in Imo State, Nigeria. Asia
Journal of Agriculture and Rural

Nigerian Journal of Rural Sociology Vol. 16, No. 1, June 2015
75
Signal Alliance (2014). ERP FOR THE
AGRICULTURE SECTOR IN NIGERIA. Transforming Big Data into Big Value in Agriculture Industry. Retrieved from
http://www.slideshare.net/signalalliance/e
rp-for-the-agriculture-in-nigeria on April 23, 2014

Nigerian Journal of Rural Sociology Vol. 16, No. 1, June 2015
76
INCIDENCE OF SHARP PRACTICES IN GROWTH ENHANCEMENT SUPPORT SCHEME
REDEMPTION CENTRES OF OYO STATE
Ladele, A.A and Oyelami, B.O. Department of Agricultural Extension and Rural Development, University of Ibadan, Ibadan, Nigeria
E-mail: [email protected]
ABSTRACT
Growth Enhancement Support (GES) Scheme was a key component of Nigerian Agricultural Transformation
Agenda (ATA) programme under which redemption centres were established for farmers’ easy access to
subsidised inputs. Close observation however revealed that some forms of activities that ultimately decimated
the level of success attainable under this scheme were perpetrated across redemption centres. This study
therefore examined the forms of sharp practices, their causes and effects on the scheme at large. In-depth
interview with key informants (IDI) was used to elicit information from strategic officers across selected
redemption centres under the scheme in three agricultural zones (Ibadan/Ibarapa, Oyo and Ogbomoso) of the
state. Data obtained from the study were analysed using descriptive and qualitative analysis. The study
unravelled cryptic practices such as registration and sales of inputs by non-practicing farmers, exchange of E-
wallet code for money by farmers, deployment of farmers’ input to wrong redemption centres and so on. The
study concluded that various forms of sharp practices occurred under the scheme which respondents perceived
to have had a negative effect on beneficiaries. It was therefore recommended among other things that, there is a
need for an on-field validation of GES scheme data base to sieve out non-practicing farmers, introduction of
external supervisors for monitoring activities at redemption centres and a feed-back mechanism from
beneficiaries. These will serve to forestall the repetition of similar incidents in subsequent intervention
programmes.
Keywords: Sharp practices, Growth enhancement support scheme, Redemption centres
INTRODUCTION
Agriculture is considered a strong weapon to tackle the problem of poverty and the achievement of the Millennium Development Goals (MDGs). It
contributes about 40% of the nation’s gross domestic product (GDP) and engages over 70% of all employments. In fact, of the total population of 165 million people in Nigeria, the majority are
found across the rural communities where agriculture is the predominant occupation (Adesina, 2013). It is remarkable that Nigeria has a huge potential in agriculture with 84 million hectares of
arable land, cheap and largely untapped water resources and a market of 165 million people. Suppose these resources were appropriately utilised, Nigeria should be a power house of food
production. Contrariwise, less than 40% of the available arable land is cultivated by smallholder farmers who rarely have access to mechanised implements and agro-inputs. Only ten tractors are
available per 100 hectares of farmland in Nigeria compared to 241 tractors per hectare in Indonesia, while Nigeria’s average fertiliser usage stands at 13kg per hectare as against the average annual usage of 100kg per hectare obtainable elsewhere in the world (World Bank, 2013; IFDC, 2013). Consequently, Nigeria has been a net importer of food, spending over $10 billion a year for the
importation of wheat, rice, sugar and fish alone. According to Adesina (2013), Forty years is the average life span of people in rural Nigeria, but in that period millions of farmers never saw or got
subsidised fertilisers, supposedly meant for them. In that period, despite the billions of Naira spent
successively over four decades, no more than 11% of smallholder farmers get subsidised fertilisers by the government. The corruption in the system was massive, due to government direct procurement and
distribution of fertilisers. The system disempowered small farmers as the political elites and power brokers siphoned off fertilisers meant for poor farmers. The private sector was displaced
and as a result never built fertiliser supply chains to reach farmers. The corruption was so rife in the system that it was common for a bulk of the fertilisers supplied to be half sand and half
fertilisers. Subsidised fertilisers were sold off on the open market and exported into other neighbouring countries. Farm productivity continued to decline, food security worsened and
incomes of farmers declined, despite massive increases in fertiliser subsidies for decades. The system was no better for seeds, as direct government procurement of seeds led to entrenched
corruption and rent seeking, as government officials gave away contracts to cronies, who supplied grains instead of high quality seeds to farmers. With a strong resolve to ensure that all genuine farmers across the country get access to quality farm inputs, a massive overhaul of the national fertiliser and seed supply system was embarked
upon under the Agricultural Transformation Agenda (ATA) of the federal republic of Nigeria. Direct procurement and distribution of fertilisers and seeds were eliminated and all fertiliser and
seed companies began to sell directly to farmers and no more to the government. All fertiliser and

Nigerian Journal of Rural Sociology Vol. 16, No. 1, June 2015
seeds supply contracts were scrapped and production of foundation seed handed over to the
private sector (FMARD, 2014). In its place, the government launched the Growth Enhancement Support (GES) Scheme to provide targeted support for seed and fertiliser to about 20 million Nigerian
farmers. The GES scheme is based upon an Electronic Wallet (E-wallet) System, developed to use mobile phones to deliver seeds at no cost and 50% subsidy on fertilisers and a national farmer
data base containing millions of farmers2014). An E-wallet is a voucher in text format received on a cell phone that entitles the owner to buy agro-inputs with a discount. It was developed
by the company Cellulant Nigeria Limited.
Prerequisites for participation in GESS E
system
Participation in the E-wallet system required the eligibility of both farmers and agrofarmers’ part, they must be above 18 yhave participated in the annual national farmer
registration exercise conducted by the state government to capture farmers’ personal detailed information using a biometric platform, own a functional cell phone with a registered SIM card and have a credit of at least 60 naira on their cell phone for transactions to take place. Similarly, an agro-input dealer must be selected by the state to be able to participate in the scheme and also own a
Figure 1: Electronic Wallet System process through text messages
Nigerian Journal of Rural Sociology Vol. 16, No. 1, June 2015
77
seeds supply contracts were scrapped and production of foundation seed handed over to the
FMARD, 2014). In its place, the ernment launched the Growth Enhancement
GES) Scheme to provide targeted support for seed and fertiliser to about 20 million Nigerian
farmers. The GES scheme is based upon an wallet) System, developed to
liver seeds at no cost and 50% subsidy on fertilisers and a national farmer
data base containing millions of farmers (FMARD, wallet is a voucher in text format
received on a cell phone that entitles the owner to It was developed
by the company Cellulant Nigeria Limited.
Prerequisites for participation in GESS E-wallet
wallet system required the eligibility of both farmers and agro-dealers. On farmers’ part, they must be above 18 years of age have participated in the annual national farmer
registration exercise conducted by the state government to capture farmers’ personal detailed information using a biometric platform, own a functional cell phone with a registered SIM card
e a credit of at least 60 naira on their cell phone for transactions to take place. Similarly, an
input dealer must be selected by the state to be able to participate in the scheme and also own a
functional cell phone with a registered SIM card. Agro-dealers do not need to have extra credit on
their cell phones. They must attend training programmes designed for the scheme, understand the process of E-wallet system and regularly attend reconciliation meetings with other stakeholders.
The agro-dealers are required to conduct honest business and guide against fraud; choose and prepare a location for the business transaction; provide storage facilities and be available at
appropriate time to attend to farmers’ needs. Other prominent personalities in the sare the helpline staff and redemption supervisors. Each state Agricultural Development Project
(ADP) supplied helpline staffs, and about 3helpline staffs were assigned to each Local Government Area (LGA). The helpline staffs and redemption supervisors connect farmers on daily
basis to attend to their needs. The redemption supervisor helps in validating the farmer’s identity as well as the code in the message received on his/her phone and then compares with the names
and codes in the farmers’ register sent by Cellulant Company. The subsidised farm input is delivered to farmers directly through their mobile phones. The scheme is aimed at providing a direct link between the farmers and the government (Ezeh, 2013). The flow chart in figure 1 presents Ethrough text messages:
Figure 1: Electronic Wallet System process through text messages
Nigerian Journal of Rural Sociology Vol. 16, No. 1, June 2015
functional cell phone with a registered SIM card. dealers do not need to have extra credit on
their cell phones. They must attend training programmes designed for the scheme, understand
wallet system and regularly attend reconciliation meetings with other stakeholders.
e required to conduct honest business and guide against fraud; choose and prepare a location for the business transaction; provide storage facilities and be available at
appropriate time to attend to farmers’ needs. Other prominent personalities in the scheme
are the helpline staff and redemption supervisors. Each state Agricultural Development Project
ADP) supplied helpline staffs, and about 3-5 helpline staffs were assigned to each Local
LGA). The helpline staffs and sors connect farmers on daily
basis to attend to their needs. The redemption supervisor helps in validating the farmer’s identity as well as the code in the message received on his/her phone and then compares with the names
er sent by Cellulant Company. The subsidised farm input is delivered to farmers directly through their mobile phones. The scheme is aimed at providing a direct link between
Ezeh, 2013). The flow chart in figure 1 presents E-wallet process

Nigerian Journal of Rural Sociology Vol. 16, No. 1, June 2015
78
The E-wallet system is farmer friendly as it
allows them to do their transactions in local languages. As at 2013, approximately 23 million E-wallet transactions were completed by farmers on their mobile phones with majority in local Nigerian
languages. For example, 45% of transactions were in Hausa, 25% was in English, 17% was in Yoruba, 12% was in pidgin while 1% was in Igbo. The national rollout GES scheme in Nigeria commenced on 9th May, 2012. Ekiti state was the first state to commence rollout of GES scheme in Nigeria. The E-wallet system was designed and operated by Cellulant Corporation a private sector
contractor on behalf of the Federal Government of Nigeria in 36 states and the Federal Capital Territory (FCT). The redemption or provision of improved seeds and fertilisers occurred in all 774
LGAs of the country. The private sector service providers participating in the scheme within the first two years of implementation included 25 fertiliser producing, importing and blending companies, 77 seed companies and 1800 agro-dealers that operated 2300 redemption sites across the country over a period of 6 months (FMARD, 2014). Figures 2 and 3 show the distribution of
total redemption transactions across agro-ecological zones in Nigeria and states in the South-West agro-ecological zones.
Figure 2: Distribution of total redemption transactions by agro-ecological zones.
Figure 3: Distribution of total redemption transactions by South-West States. As impressive as some of the success stories of
GES scheme have been, it is important to note that there were hiccups during implementation that attempted marring the success of this scheme.
These hiccups essentially were diverse in nature.
While some were institutional, others were technological and yet some were artificial. Artificial hiccups were those created by ill-motivated and corrupt individuals who aimed at
manipulating activities of the scheme for selfish gains. While these activities might not properly fit into the legal definition of corruption, they could well be termed as sharp practices which ultimately could metamorphosis into corruption if not proactively nipped in the bud. According to Ayoola (2015), sharp practices connote sneaky or cunning behaviour apparently within the rules or law but
deceitful and exploitative. Other words that could describe sharp practices are unethical acts, fraud, dishonesty, misconduct, taking undue advantage, cutting corners, etc. The Business dictionary
(2015), as well explained it as a word that describes cunningness, deceit, misrepresentation, trickery and other unscrupulous behaviour just short of the legal definition of fraud. Sharp practice has common features with corruption, except that while corrupt acts are punishable under the law, sharp practices are sneaky and cunning such that they do not substantively fall under the grip of definite legal
sanctions. In fact, the national chairman of the agro-dealers association in Nigeria referred to these acts of sharp practice as the bane of GES scheme
(Leadership News, 2015). The federal Ministry of Agriculture and Rural Development in the 2013 Agricultural Transformation Agenda Score Card Report also admitted that there were pockets of
challenges that confronted GES scheme at implementation level (FMARD, 2014). This study therefore aims at identifying some of these unscrupulous activities (sharp practices)
perpetrated during GES scheme implementation with their causes and implications on the society at large. The main objective of the study was to
investigate incidence of sharp practices in growth enhancement support scheme redemption centres of Oyo State. The specific objectives of the study were to:
1. describe forms of sharp practices in growth enhancement support scheme redemption centres,
2. identify causes of sharp practices in growth enhancement support scheme redemption centres and
3. determine effects of sharp practices on growth enhancement support scheme in the state
METHODOLOGY The study was carried out in Oyo State. The state is located between coordinates 8000N and
4000E and covers approximately a land area of 28,454sq kilometres. Oyo state has a population of

Nigerian Journal of Rural Sociology Vol. 16, No. 1, June 2015
79
5,591,589 according to 2006 census (Tijani,
Oyewole and Olabode, 2012). Oyo State comprises 33 LGAs which have been delineated into four ADP agricultural zones. The total number of active redemption centres across the agricultural zones in
the state was 43 as at 2013. In-depth interview with key informants (IDI) was used to elicit information from redemption centre supervisors and helpline staffs across selected redemption centres under the scheme in three agricultural zones (Ibadan/Ibarapa, Oyo and Ogbomoso) of the state. Data obtained from the study were analysed using descriptive and qualitative analysis.
RESULTS AND DISCUSSION
Personal characteristics of respondents
Respondents to the study were mainly
redemption centre supervisors and helpline staffs who served across various redemption centres in the state under the GES scheme right from inception. The lowest academic qualification possessed among the respondents was the Higher National Diploma (HND) while the highest was a Master of Technology in agriculturally related field of study. The level of education of GES scheme
officers was appreciably high; this was necessary because the duty to perform was technical and needed some level of ICT skills. The age range of the respondents was between 30 and 45; this
implies the crop of personnel recruited for the GES scheme exercise were able bodied individuals who possess the strength to do the assignment however rigorous it may prove to be. They were also men
and women in their middle age, usually characterised with lots of aspirations and goals to achieve; if such individuals happen to be greedy, they could probably have high tendencies for sharp
practices. Most of the respondents were males, married and were still in their active years of service. Eighty per cent of them were Christians while the remaining twenty per cent were Muslims.
Forms of sharp practices observed during GES
scheme implementation in the study area
Sharp practice is a word that describes cunningness, deceit, misrepresentation, trickery and
other unscrupulous behaviour just short of the legal definition of fraud (Business dictionary, 2015). Various forms of sharp practices perpetrated during GES scheme implementation originated from different stakeholders in the scheme such as farmers (the beneficiaries), the agro-dealers and the GES scheme facilitators i.e. the helpline staffs and redemption centre supervisors. Individuals among
these stakeholders demonstrated sharp practices either differently or by conniving with each other as described below:
Sharp practices from farmers (the beneficiaries)
1. Sales of subsidised inputs after redemption - It was discovered that some beneficiaries sold their
inputs after redemption, especially fertiliser. The
most common rate at which it was sold was between N3000 to N4000 per bag. Among the reasons adduced to this practice was the late commencement of input redemption. Some farmers
who sold their redeemed fertiliser claimed to have earlier bought from the open market and by this act they intend to reclaim the money already spent. 2. Trickery - Some beneficiaries brought between two to three ID cards to their redemption centres to redeem inputs. Such beneficiaries claimed that the real owners of the ID cards were indisposed, and they wanted to redeem on their behalf.
3. Tendering of phony E-wallet message/voucher
code - There were as well cases of deceit found with some farmers. Such farmers feigned already used E-wallet messages including the voucher code
and came to present it for redemption of input. This was not discovered until during reconciliation exercise and such individuals were eventually traced by the assistance of helpline staffs that were usually familiar with the farmers. 4. Multiple registrations - Some farmers were found to register twice within the same LGA. In order to escape being discovered they decided to
register with different names and phone numbers. Others who registered twice with the same name and phone number decided to do so in different LGAs.
5. Consumption of rice seed instead of planting -
Some farmers under the disguise of late arrival of input went ahead to process the paddy rice (seed) supplied to them and consumed it instead of
planting. 6. Tendering of already used ID cards - The study also revealed that some beneficiaries tendered already used ID cards to redeem inputs the second
time. These were however discovered and turned down.
Sharp practices from connivance between
beneficiaries and agro-dealers
Exchange of E-wallet vouchers for money -
Some farmers, especially the non-practicing ones were found to exchange the E-wallet vouchers contained in the messages sent to them for money
with agro-dealers at a rate ranging between N500 to N1500 depending on their bargaining power. This act expressly contradicts the guiding principle of the scheme and it was much pronounced in urban centres.
Sharp practices from connivance between agro-
dealers and GES scheme facilitators
Collusion - It was discovered in some
instances that collusion occurred between agro-dealers and help lines/redemption centre supervisors to deny farmers the opportunity of redeeming inputs. Such farmers were deceived that
their names were missing in the register, only for these agro-dealers to sell the inputs later and share

Nigerian Journal of Rural Sociology Vol. 16, No. 1, June 2015
80
the money with the GES scheme facilitators in
question. To put it in the words of a respondent from Ogbomoso South LGA, he said “Some agro-dealers saw the scheme as a means to enrich themselves. So they enticed assigned GES scheme
representative (s) to their redemption centres into shady deals to deny some farmers of their inputs. They also connived together to perfect reports that farmers who did not show up to redeem inputs have redeemed. When the agro-dealer later sells the inputs or chooses to pay for them (at subsidised price), they together share the money”. A case similar to this was reported by Leadership News
(2015), when a female farmer from Kachia LGA of Kaduna State who has been benefitting from the scheme suddenly stopped receiving E-wallet messages and was so sidelined. She went extra
miles by visiting her registration centre where other farmers were being attended to and made enquiries. She even located her name on the farmers’ register and despite this she was denied access to the subsidised inputs. According to the earlier quoted respondent, this practice occurred mostly in the third year of GESS implementation when unemployed youths were engaged to serve as help-
line officers. It was easier for some agro-dealers to coerce them based on their newness in the system. Those who gave in also exercised no qualm, believing that they had little or nothing at stake.
Sharp practices from seed companies Supply of inferior seeds - Inputs, especially maize seed supplied by some seed companies were found to be of inferior quality. Such packs of seed
contained broken seeds, full of chaff, and even streak infested etc.
Sharp practices from non-beneficiaries
Facade - Some non-registered farmers brought
registered farmers’ messages in disguise to redeem inputs. Such farmers were lackadaisical towards the national registration exercise but later realized their mistakes when the scheme turned out to be real.
They then attempted to benefit from the scheme by using other beneficiaries’ e-wallet messages, however, such farmers were discovered as their names could not be found in the register.
Causes of sharp practices during GES scheme
implementation
The various forms of sharp practices discovered during GES scheme implementation came in through different channels which could be regarded as causes for these forms of practices. These causes are identified as follows:
From the government
1. Registration of non-practicing farmers These set of beneficiaries were prominent in exchange of E-wallet messages for money and sales of inputs.
2. Under-aged registration
There were cases of registration of beneficiaries
who fell under the minimum accepted age of 18 years. This gave insincere agro-dealers the chance to divert such inputs for selfish gain. 3. Late commencement of GES scheme redemption
exercise This excuse was given by some beneficiaries who engaged in selling of redeemed inputs. 4. Insufficient inputs at redemption centres This excuse was put forward by some buyers of redeemed inputs 5. Mix-up of farmers’ names on the register There were instances of mix-up in collation of
farmers’ names such that some farmers were directed to redeem their inputs at centres outside their states or location. An example of this was the case of farmers in Surulere LGA of Oyo State who
were asked to go and redeem their inputs from redemption centres in Surulere area of Lagos State. This type of challenge could push desperate farmers to buy redeemed inputs from those who are willing to sell.
From technological hiccups
This was mainly related to the challenge of poor network connection. Messages from Cellulant
Company could not reach farmers located in areas due to poor network connection. Consequently, there were frequent cases of delayed delivery on either messages sent to/responses expected from
Cellulant due to bad network. This was also corroborated by the findings of Adebo (2014), that 43.5% of her respondents experienced constraints from poor network coverage in their efforts to GES
scheme inputs.
From GES scheme system
1. Weak quality control system The quality control of some inputs approved for
delivery to redemption centres at some points was not thorough and this led to the delivery of poor quality inputs. 2. Inadequate planning
Plans to supply all registered farmers were not adequately made at some points during implementation which led to insufficient inputs to reach all farmers who came to redeem, especially
in 2012. This is in consonance with the findings of Adebo (2014) in her study conducted among GES scheme beneficiaries in Kwara State, who found out that 52% of her respondents, complained of insufficient fertilisers in their respective redemption centres.
From beneficiaries 1. High level of poverty among farmers
This led to abandonment or exchange of inputs for money which dubious agro-dealers took advantage of. 2. Farmers’ interest in exchanging E-wallet
vouchers for money
Nigerian Journal of Rural Sociology Vol. 16, No. 1, June 2015
81
Non-practicing farmers took more interest in
exchanging inputs for money or selling rather utilising them 3. Farmers’ interest in selling redeemed inputs rather utilising them
4. Release of personal identification cards by beneficiaries to others This led to trickery by others who were mostly non-beneficiaries
Consequences of sharp practices under GES
scheme implementation
On agricultural production
1. Inputs not redeemed by genuine farmers did not
optimally benefit agricultural production. 2. Agricultural production could not attain the estimated target. 3. There was reduced agricultural production along
with other losses incurred by farmers as a result of inferior inputs supplied.
On agricultural productivity
1. Failure to redeem inputs as designed led to reduced productivity and profitability 2. Insufficient inputs allotted to farmers decimated productivity Beyond reduced productivity, some farmers’
experienced total loss caused by inferior inputs as they carried out no viability test before planting the seeds redeemed. This led to the conclusion that in some instances grains were supplied in place of
seed
On objectives of the scheme
1. The objectives of the scheme were not fully realized
2. The success attainable under the scheme was decimated
On the society at large
1. Failures arising from inferior inputs distributed
led to farmers’ discouragement and made them repulsive to subsequent messages from extension workers 2. Reduced productivity caused by inferior inputs
led to losses and worsened standard of living for farmers 3. There was a rise in the level of sharp practices in the society as some farmers were already
confessing that during the next available opportunity, they will also engage in sharp practices. This mind-set got stronger reinforcement when it was noticed that perpetrators of sharp practice went scot-free. One of the extension personnel who served as help-line staff reported the comments of some farmers as follows: “We actually received the E-wallet messages instructing
us to go and redeem inputs at the redemption centre. However, we felt since there was no money, we should ignore the messages. Only to learn later that some others went to the redemption centre with
such messages and collected money (about N1,500)
in exchange for their messages. The next available
opportunity will surely not elude us!”
Conclusion and Recommendations
The study concluded that various forms of sharp
practices occurred during the implementation of GES scheme in the State. These practices would likely have decimated the level of success attainable under the scheme. It further affected the sincere attitude some farmers had towards the scheme. There is therefore a need to proactively curtail its spread so as to improve on the successes recorded so far in the scheme and provide a
platform for better future implementation. The following are therefore recommended: 1. Sincerity among agro-dealers and helpline personnel should be encouraged
2. Stricter monitoring should be factored into the scheme 3. Stricter enforcement of guiding rules and principles should be encouraged 4. Prompt punitive measures should be applied during implementation to serve as deterrent to others 5. Law enforcement agents particularly in mufti
should be present at redemption centres to curb sharp practices 6. Number of supervisors saddled with the responsibility of monitoring redemption centres
activities should be increased 7. The scheme should leverage on ADP’s staff acquaintance with farmers to curb sharp practices. 8. An on-field validation of the current farmers’
registration data base should be carried out to sieve out non-practising farmers.
REFERENCES
Adebo, G.M. 2014. Effectiveness of E-wallet Practice in Grassroots Agricultural Services
Delivery in Nigeria- A case study of Kwara State
Growth Enhancement Support Scheme. Journal of Experimental Biology and
Agricultural Sciences. 2 (4): 9. Adesina A.A., 2013. Keynote address delivered on
the occasion of the 2013 Annual Conference of the Southern African Confederation of Agricultural Union (SACAU) on the 13th – 14th May, 2013 at white sands beach hotel and conference centre, Dar es salaam, Tanzania. Nigerianagriculturenews.ng. Accessed on 27/08/2015.
Ayoola G.B. 2015. Transparency, Corruption and Sharp Practices: The Policy Analyst’s Viewpoint. Keynote/Lead Paper delivered at the 24th Annual National Congress of
Nigerian Rural Sociology Association (NRSA), at Ladoke Akintola University of

Nigerian Journal of Rural Sociology Vol. 16, No. 1, June 2015
82
Technology, Ogbomoso on 12th October,
2015. Business Dictionary 2015.
www.businessdictionary.com/definition/sharp-practice.html. accessed on 03/11/2015
Ezeh and Nnemah, 2013. Access and Application of Information Communication Technology (ICT) among farming households of South-East Nigeria. Agriculture and Biology Journal of North America.doi:10.5251/abjna.2013.4.6.605.616.
Federal Ministry of Agriculture and Rural
Development, 2014. Agricultural Transformation
Agenda, 2013 Report SCORE CARD. http/:www.fmard.gov.ng/ accessed on
27/08/2015.
International Fertiliser Distribution Center, 2013.
International Fertiliser Distribution Center Projects in Nigeria. http://www.ifdc.org/Nationa/Nigeria. accessed on 19/10/2015.
Leadership News, 2015. Politicians, Bane of Growth Enhancement Scheme? www.leadershipnews.ng.org. accessed on 27/08/2015.
Tijani, S.A., Oyewole M.F. and Olabode, C.B. 2012. Contributions of local soap enterprise to livelihood of rural women in selected Local Government Areas of Oyo
State. Nigerian Journal of Rural
Sociology. 13 (1): 49-57. World Bank, 2013. Nigeria/World Bank data.
Trading Economics available on
http:/tradineconomics.com/Nigeria/indicators-wb accessed on 08/10/2015

Nigerian Journal of Rural Sociology Vol. 16, No. 1, June 2015
83
PERCEIVED EFFECT OF BRIBERY AND CORRUPTION AT THE GRASSROOTS: THE CASE OF
LOCAL GOVERNMENT EMPLOYEES IN SOUTHERN TARABA, NIGERIA 1Lawi, B. D. and 2Musa N. Y.
1Department of Agricultural Extension, Taraba State College of Agriculture, Jalingo, Taraba State 2Department of Agricultural Economics and Extension, Federal University Wukari, Wukari, Taraba State
Email: [email protected]
ABSTRACT
There are observed variations in the distribution of social infrastructural facilities in rural Nigeria. This study
examined the perceived effect of bribery and corruption on the provision of social infrastructural facilities in
rural areas of Taraba State, Nigeria. Data for the study were collected mainly from primary sources. A total of
375 respondents from three Local Government Areas (LGAs) were used for the study. Research findings
revealed that public funds were misapplied while demanding and receiving gratifications ranked first among the
types of bribery and corruption identified in the study area. Overall, the finding of the study holds some
implications for agricultural and rural development as the result of the Pearson product Moment Correlation
led to the rejection of the null hypothesis, suggesting a significant relationship of 0.0098 or 98 percent between
bribery and corruption and the provision of social infrastructural facilities that can enhance rural livelihoods.
Keywords: Perceived effect, corrupt practices, rural infrastructure, public funds.
INTRODUCTION
The development of rural areas has for long continued to attract the attention of successive governments in Nigeria. Yet, Ehimiri, et al., (2012) have observed that the rural areas are still the most vulnerable to poverty with greater proportion of their population moving out to urban areas on an
annual basis. However, Olajide and Udoh, (2012) averred that poor infrastructural development in rural areas has continued to encourage the process of rural-urban migration with attendant adverse
effects on rural development in the country. Historically, the economy of Nigeria was directly or indirectly dependent on agricultural produce prior to the discovery of oil, but Musa,
(2013) argued that Nigeria’s achievements in agricultural and rural development in the 1970s later witnessed a decline because the country shifted attention from agriculture to oil.
Meanwhile, bribery and corruption has been implicated in the setbacks observed in Nigeria since the discovery of oil (Lawi, 2015) and this can continue to pose serious threat to agricultural and
rural development efforts if allowed to go unchecked. Chuka, (2012) stated that bribery and corruption is the giving and receiving of something of value (e.g.
money, sex, gifts, etc) whether demanded or not, to influence the receiver’s action favourably toward the giver. Bribery and corruption are not victimless crimes. They hit the poorest people hardest and undermine economic development. No country is immune from corruption. It flourishes where pay is low and where management controls are weak. Kenny, (2006) argued that estimates regarding the
cost of corruption in infrastructural development indicates that 5 to 20 percent of construction costs are being lost to bribe payments. . Consequently, over the years, Nigeria has seen her wealth being
siphoned with little to show in living conditions of
the average human beings, especially those living in the rural areas. It is in the light of the foregoing, this study was formulated to assess the perception of civil servants on the effect of bribery and corruption on the provision of social infrastructural facilities at the grassroots, using local government councils in
southern Taraba as a case study. The choice of the study area was premised on the fact that no previous study of this nature is known, to the best of the authors’ knowledge, to have been conducted
in the study area. Similarly, it focused on civil servants in the local government councils because they are employed by government, and government is saddled with the responsibility of providing
social infrastructure for the comfort of rural and urban people alike. The study therefore seeks to achieve the following specific objectives: i. To describe the personal characteristics of the
respondents ii. To identify the types of bribery and corruption
prevalent in the Local Government Areas iii. To examine the perceived effect of bribery and
corruption on the provision of social infrastructure
Hypothesis There is no significant relationship between
bribery and corruption and the provision of social infrastructure.
METHODOLOGY
The research area was Taraba south senatorial district, Nigeria located at the southern part of Taraba State. It is made up of five Local Government Areas (LGAs) namely; Wukari,
Takum, Donga, Ibi and Ussa plus a development area called Yangtu. The study area lies approximately between latitudes 5o86’N and 7o30’N and longitudes 9o24E and 10o45’E. It is
bordered on the west by Plateau state, south west by Benue state and south east by Cross River state.

Nigerian Journal of Rural Sociology Vol. 16, No. 1, June 2015
84
Multi-stage sampling was adopted in this
study. In the first stage, three out of the five LGAs in the study area were randomly selected. This was followed by the selection of departments. Since there were six departments in each LGA, all the six
were selected. In the final state, respondents were chosen at random in proportion to population of employees in each LGA. Although four hundred questionnaires were administered for data collection, only three hundred and seventy five were used for the study. Data collected were analyzed using percentage, rating scale and the Pearson Product-Moment Correlation (PPMC).
RESULTS AND DISCUSSION Table 4.1revealed that respondents between 20-30 years were 14.7%, 31-40 years were 33.1%,
41-50 years were 34.9%, while 51 years and above were 17.3%. This result shows an active and agile work force. Similarly the result for gender indicates that 59.2% of the respondents were males, while 40.8% were females. This shows that males are more in government employment in Taraba South Senatorial district than females. This could be attributed to the reluctance of government to
employ female workers as a result of the yearly maternity leave and excuses to attend to family issues giving rise to low productivity. The result for marital status revealed that
26.1% respondents were single, 61.9% were married, 4% were either divorced or separated from spouse, and 8% were single parents as a result of deceased spouse. This result shows that over 70%
of the respondents have family responsibilities which involve finances and if there is no proper remuneration, they can cut corners to take care of their family.
On the other hand, the result on educational level revealed that 8% respondents were holders of SSCE/TC II Certificates, 49.1% were holders of OND/NCE Certificates, 40.8% were those with
B.Sc./B.A/HND certificates, and 2.1% have M.Sc./PhD certificates. This shows that most of the respondents have an understanding of the questionnaire items and gave appropriate
responses. The result on grade level indicated that 6.9% respondents fell in the category of 01-05 grade levels, 51.5% were of the category 06-10 grade levels, 32.3% were in the 11-15 grade level category, while 9.3% fell under the grade level 16 and above. The middle cadre (06-10) has the highest number indicating high productivity.
Lastly, the result of the years of service revealed that5.3% respondents had less than 1 year experience in service, 11.5% had spent between 1-6 years in service, 52.8% had between 7-12 years
working experience and 30.4% had spent 12 years and above in service. This result shows that there
were more experienced workers who know the
nitty-gritty of government work in the local government areas studied. Table1: Demographic characteristics of
respondents
Variables Frequency Percentage
Age
20-30
31-40
41-50
51 and above
55
124
131
65
14.67
33.07
34.93
17.33
Gender
Male
Female
222
153
59.2
40.8
Marital Status
Single
Married
Divorced/Separated
Spouse Deceased
98
232
15
30
26.13
61.87
4.00
8.00
Educational Level
SSCE/TC II
OND/NCE/CERT.
B.Sc./B.A/HND
M.Sc./PhD
33
184
153
5
8.00
49.07
40.80
2.13
Grade Level
01-05
06-10
11-15
16 and above
26
193
121
35
6.93
51.47
32.27
9.33
Years of Service
Below 1 year
1-6 years
7-12
12 years and above
20
43
198
114
5.33
11.47
52.80
30.40
Total 375 100
Source: Field Survey, 2014.
Table 2 reveals that 74.1% respondents agreed that receiving gratification is high in their
departments while 59.7% indicated that demanding and receiving tokens was deeply rooted in their departments. Similarly, 57.1% agreed that staff demand brown envelopes(money put in an
envelope, usually brown to avoid suspicion, given to a government official to seek for favour ) in order to do their paid official duties while 61.6% agreed that misapplication of public resources
occur in the civil service. This finding shows that different types of corrupt practices are prevalent among local government employees with receiving of gratification being topmost.

Nigerian Journal of Rural Sociology Vol. 16, No. 1, June 2015
Table 2: Types of bribery and corruption prevalent in local government councils
Types Frequency
Percentage
Receiving gratification
278 74.1
Misapplication of public resources
231 61.1
Demanding tokens 224 59.7Demanding brown
envelops
214 57.0
Source: Field survey, 2014
Table 3 reveals that 74.1% respondents agreed that receiving gratification is high in their departments while 25.9% disagreed to that
assertion;59.7% agreed that demanding and receiving tokens was deeply rooted in their departments while 40.3% said no to that;57.1%
Table 3 Perceived effect of bribery and corruption on the provision of social infrastructure
Do these variables affect the provision of social infrastructure?
Receiving gratification Demanding/receiving tokens Demand for brown envelops
Misapplication of public funds Tokens replaces shortfalls in salaries Poverty responsible for bribery
Source: Field Survey, 2014
The result in Table 4 indicates that the calculated r-value of 0.870* is greater than the critical r-value of 0.098 at 0.05 level of significance and 373 degree of freedom. The null hypothesis is therefore rejected. The conclusion then is that there is a significant relationship between bribery and corruption and provision of social infrastructure in
the study area. This finding is in close agreement with Effim (2012) who argued that when money meant for the provision of infrastructural facilities are stolen by those responsible for managing the
funds, it therefore mean that the lives of the majority especially the poor are at risk.
Nigerian Journal of Rural Sociology Vol. 16, No. 1, June 2015
85
Table 2: Types of bribery and corruption prevalent
Percentag Rank
74.1 1st
61.1 2nd
59.7 3rd 57.0 4th
Table 3 reveals that 74.1% respondents agreed that receiving gratification is high in their
while 25.9% disagreed to that
assertion;59.7% agreed that demanding and receiving tokens was deeply rooted in their departments while 40.3% said no to that;57.1%
agreed that staff demand brown envelopes in exchange of their paid official duties while 42.9%
disagreed with that;61.6% agreed that misapplication of public resources occurred in the civil service while 38.4% disagreed with the notion;66.7% agreed that proceeds from tokens
received helped to augment shortfalls in their salaries while 33.3% said no; and 60.5%that poverty was a factor responsible for bribery and corruption while 39.5% disagreed.
The above result shows that bribery and corruption was high in the various departments, and this can result in sub-standard or abandoned projects which will in turn have adverse effects on
the citizenry. This finding closely agrees with Chuka (2012) who argued that corruption diverts expenditure away from health, the maintenance of infrastructure and provision of public services.
Table 3 Perceived effect of bribery and corruption on the provision of social infrastructure
Do these variables affect the provision of social SA A D SD
100 178 70 27 80 144 99 52 82 132 100 61
80 151 90 54 99 151 69 56
64 163 116 32
The result in Table 4 indicates that the value of 0.870* is greater than the
value of 0.098 at 0.05 level of significance and 373 degree of freedom. The null hypothesis is therefore rejected. The conclusion then is that there
significant relationship between bribery and corruption and provision of social infrastructure in
the study area. This finding is in close agreement with Effim (2012) who argued that when money meant for the provision of infrastructural facilities
len by those responsible for managing the
funds, it therefore mean that the lives of the
CONCLUSION AND RECOMMENDATIONS
On the basis of the findings, it can be concluded that significant relationship exist between bribery and corruption and social infrastructural provision in the study area. The study also found out that public funds were not usually used for the purposes they were meant to
serve. This could be attributed to the low level of social infrastructure noticed in the study area. Similarly, of the different types of bribery and corruption that prevailed in the study area,
receiving gratification in order to perform official duties ranked first. It is therefore recommended that local government employees be adequately enlightened on the dangers of bribery and corruption. Specifically, the position of the law should be made known to them through seminars and workshops with a view to discourage the practice. There should also be proper monitoring
and evaluation of staff to ensure compliance with civil service rules. Furthermore routine internal and external auditing should be undertaken to ensure that funds are used for the intended purposes.
REFERENCES
Chuka, B. O. (2012) Combating Fraud and White
Collar Crimes: Lessons from Nigeria:
Paper presented at 2nd Annual Fraud &
Nigerian Journal of Rural Sociology Vol. 16, No. 1, June 2015
agreed that staff demand brown envelopes in exchange of their paid official duties while 42.9%
disagreed with that;61.6% agreed that misapplication of public resources occurred in the civil service while 38.4% disagreed with the notion;66.7% agreed that proceeds from tokens
received helped to augment shortfalls in their ; and 60.5% agreed
that poverty was a factor responsible for bribery and corruption while 39.5% disagreed.
The above result shows that bribery and corruption was high in the various departments, and
standard or abandoned which will in turn have adverse effects on
the citizenry. This finding closely agrees with Chuka (2012) who argued that corruption diverts expenditure away from health, the maintenance of infrastructure and provision of public services.
CONCLUSION AND RECOMMENDATIONS
On the basis of the findings, it can be concluded that significant relationship exist between bribery and corruption and social infrastructural provision in the study area. The study also found out that public funds were not usually used for the purposes they were meant to
serve. This could be attributed to the low level of cture noticed in the study area.
Similarly, of the different types of bribery and corruption that prevailed in the study area,
receiving gratification in order to perform official duties ranked first. It is therefore recommended that
yees be adequately enlightened on the dangers of bribery and corruption. Specifically, the position of the law should be made known to them through seminars and workshops with a view to discourage the practice. There should also be proper monitoring
aluation of staff to ensure compliance with civil service rules. Furthermore routine internal and external auditing should be undertaken to ensure that funds are used for the intended purposes.
Combating Fraud and White
Collar Crimes: Lessons from Nigeria:
Annual Fraud &

Nigerian Journal of Rural Sociology Vol. 16, No. 1, June 2015
86
Corruption Africa Summit, held at
Zanzibar Beach Resort, Zanzibar Republic of Tanzania.
Effim, J.A. (2012) Embezzlement of Public Funds:
A Crime against Humanity in Cameroon.
http://www.monitor.upeace.org/innerpg.cfm?id_article=938. Data accessed 6/6/14
Ehimiri, N. C., Onyeneke, R. U., Chidiebere-Mark, N. M. and Nnabuihe, V. C. (2012). Effect and Prospect of Rural to Urban Migration on the Poverty Status of Migrants in Abia State, Nigeria, Agricultural Science
Research Journal 2(4): 145 – 153
Kenny, C. (2006) Measuring and Reducing the
Impact of Corruption in Infrastructure.
World Bank Policy Research Working
paper 4099, December, 2006
Lawi, B.D. (2015)……. Unpublished MSc Thesis, Department of Sociology, University of Calabar
Musa, N.Y (2013). Agricultural and rural development programmes in Nigeria; Trends and constraints, Daily Independent
Newspaper, 29th May, 2013 Olajide, A and Udoh, G (2012). Rural-Urban
Migration: Migrants Perceptions of Problems and Benefits in Oyo State Nigeria. International Conference on
Humanities, Economics and Geography (ICHEG'2012) March 17-18, 2012 Bangkok

Nigerian Journal of Rural Sociology Vol. 16, No. 1, June 2015
87
PERCEPTION OF CORRUPT PRACTICES AMONG EXTENSION AGENTS OF OYO STATE
AGRICULTURAL DEVELOPMENT PROGRAMME (OYSADEP) 1Alaka, F. A. and 2Ashimolowo, O. R.
1Federal College of Education (Special), Oyo 2Federal University of Agriculture, Abeokuta
E-mail: [email protected]
ABSTRACT
Corruption has been a perennial clog in the wheel of development of all the sectors of Nigeria economy,
agriculture inclusive. Staffers of different establishments engage in some conducts tantamount to corruption
advertently and in some instances, inadvertently. This study focused on the perception of some practices; that
were considered corrupt, by agricultural Extension Agents (EA) of Oyo State Agricultural Development
Programme (OYSADEP). Simple random sampling was used to select 85 EAs (out of the total of 170)
representing the sample size. Structured questionnaire was used to collect data from the respondents on their
personal characteristics, awareness and perception of the different forms of corrupt practices. Descriptive
statistics, (frequency counts, percentages and mean) were used to summarize the data. More (35.3%, 64.7% and
29.4%) were between 32and 36 years of age, male, and had crop production as their area of specialization,
respectively. Most (88. 2%) of the respondents knew abuse of office as corrupt practice, while the least known
(9.4%) corrupt practice was bureaucratic conflict of interest. So also, patronage was known by just 17.6% as a
corrupt practice. Majority (55%) of the respondents perceived corruption as impeding development. There was
no significant relationship between awareness of various forms of corruption and perception of different
corruption related statements. Therefore, it could be inferred that there exist a fair virtue within staffers of EAs
of OYSADEP, but they were not aware of the semantics used in describing the different forms of corrupt
practices. Many of the different forms of corrupt practices were not known to be such, while those that were
known were not so derided. Hence, high toleration for those practices was implied. The current war against
corruption by the present administration in the country should be holistic in covering public officers in the
agricultural sector, as well as ensure mass media orientation to enhance attitudinal change.
Keywords: Bureaucratic conflict, Corrupt Practices, Extension Agents.
INTRODUCTION Corruption as a topical issue is a monster against development and in-fact human survival and existence, which cannot be over flogged and must be tackled head long. It is more devastating
than any deadliest disease on earth not even ebola or leukaemia, because these only affect individuals or few people in close proximity bear the consequence.
The ravaging scourge of corruption is not ordinarily borne by the vast majority of Nigerians, but it is being acknowledged and documented by international reputable bodies. The 2010 corruption
perception index (CPI) released by the transparency international (TI) shows that corruption has increased in Nigeria with the country currently ranking 134th out of 180 countries surveyed in
2010, ranking below Ghana, Cameroon, Niger and Benin. (Daily Trust, 2010; Online Nigeria, 2010). Oyejide (2008) argued that the associated types and level of corruption in Nigeria may have been influenced and heightened by the direct access of government to oil windfall income in an environment of weak public institutions, capture or near capture of the state powerful vested interest
and inability of the citizens to effectively assert their rights. The number of international conventions and domestic laws against corruption, as well as the
emergence of the transparency international with over 100 chapters around the world, confirms the
global trend of significant increase in the attention
being given to overcome the problem of corruption as observed by UNDP (2008). Fadairo and Ladele (2014) opine that, corruption is not a new phenomenon, but the
magnitude and the different forms of its manifestation is most worrisome. They assert further that, it has spread its tentacles to every sphere of our national life. Ades and Di Tella,
(1996) see corruption as the biggest threat to development. Fadairo and Ladele observe further that corruption benefits the rich and the well-to-do. It enriches the rich and disproportionally affects the
poor, unprotected and the under priviledge there-by worsening their circumstance. In this light, the case of the rural poor could be seen to be more precarious since poverty is more entrenched in the
rural community than urban. Anand (2006) states that most disturbing today is the growing tolerance and Nigerians’ acceptance of corruption as an in-evitable and integral part of our civil society. Corruption impacts severely on social, political and economic development, culminating in crippled democracy. In the bid to get out of the endemic quagmire inherent in
corruption, no effort should be spared at fighting and subduing the malaise. In realization of this, the present administration in the country has made the curtailing and eradication of corruption as one of its
cardinal programmes in order to bring the much required positive change.

Nigerian Journal of Rural Sociology Vol. 16, No. 1, June 2015
88
The process of solving a problem starts with
the proper identification of the different forms in which it exists. Against this backdrop, UNDP (2008) lists the following as elements of corruption and thus examples of corrupt practices; bribery,
fraud, money laundering, extortion, kickback, peddling influence, cronyism/clientellism, nepotism, patronage, inside trading, speed money, embezzlement and abuse of public property. The in-depth incursion of corruption into all facets of our lives calls for both individual and collective efforts of all and sundry towards stamping out the endemic corruption in the
different sector of our economy. Spector (2005) argued that while comprehensive government reforms to address endemic corruption may be needed, sector specific solutions can be pursued as
an approach for more systemic reforms. It is sequel to these that this study has been carried out with the following specific objectives:
• To identify the personal characteristics of the respondents.
• To examine the different forms of corruption practices engaged in by respondents or aware
of by respondent.
• To determine the awareness of the respondents to different forms of corrupt practices.
• To determine the perception of staff of Oyo State Agricultural Development Programme (OYSADEP) to corruption.
The hypothesis was stated in null form was
stated thus; There is no significant relationship between the awareness and perception of different forms of corruption by the respondents.
METHODOLOGY The study was conducted in Oyo State, which has a gentle land topography in the south, rising to
a Plateau of 40 metres and above in the North. The vegetation pattern of the state is that of the rainforest in the South and guinea savannah to the North. The climate is equatorial, notably with dry and wet seasons with relatively high humidity. Based on prevailing climate and soil characteristics, the following crops are cultivated; maize, cassava, yam, sorghum, vegetable, cowpea
and tree crops such as cocoa, oil palm, kolanut, coffee and citrus. In addition, some people rear livestock such as goat, swine and poultry. The state has 33 local government areas and is
divided into four Agricultural zones by OYSDEP; namely Ibadan/Ibarapa, Oyo/Ogbomoso, and Saki. All Extension Agents of OYSADEP are the target of the study. There are 170 extension agents with the OYSADEP spread across the four zones viz, Ibadan/Ibarapa 56 EAs, Shaki has 42, Oyo has 40 and Ogbomoso has 32EAs. Fifty percent (50%)
these EAs were randomly selected, making 85 EAs
which formed the sample size. Data was collected through the use of structured questionnaires. UNDP (2008) guide on various ways in which corruption manifests and
could be measured were applied in dichotomy of “Known as Corruption” and “Not known as Corruption”. Different measures (in percentages) were taken of each of the various forms of corrupt practices. “Known as Corruption’’ was assigned a score of 1, while “Not known as Corruption” was assigned 0. Mean of each of the different forms of corrupt practices were calculated as well as the
overall mean. Items with mean below the overall mean were categorized as low Awareness, while those equal to and above were taken as High Awareness level. Descriptive statistics means and
ranking were used to compare responses to various forms of corruption. This is quite significant as it evaluates different cases of corruption and which form is more prevalent in OYSADEP. Perception of the respondents about corruption was measured by generating a list of 20 perception statements which were responded to on a 3-point scale of Agree, Uncertain and Disagree. Scores of
3, 2, and 1 were awarded to positive statements and the reverse for negative statements respectively (adapted from Fadairo and Ladele, 2014). Respondents with scores of mean and above were
regarded as having favourable perception, while those with scores below mean were categorized as having unfavourable perception.
Table 1: Sample Selection of Respondents
Zone No. of Extension Agents
Number Selected (50%)
Ibadan/Ibarapa 56 28 Shaki 42 21
Oyo 40 20 Ogbomosho 32 16
Total 170 85
PPMC was used in testing the hypothesis at 0.05
level of significance.
RESULTS AND DISCUSSIONS
Table 2 reveals that majority (35.1%) were
between 32 and 36 years of age with a mean age of 38years and standard deviation of 15.85. This is in line with the observation of Adeola and Ayoade (2011). It is a direct indication that majority of the respondents were young and active which may positively influence their active performance on the field. A large percentage (64.7%) were male while 35.3% were female. This implies that OYSADEP
Extension Service was male dominated. It is clear from the table that more (45.9%) of the respondents’ Educational qualifications was

Nigerian Journal of Rural Sociology Vol. 16, No. 1, June 2015
89
BSc degrees; followed by HND with 25.9%; M.Sc
with 22.3% and OND constituted 5.9%. However, none of the respondents was holder of NCE certificate. It is also clear from the table that majority (29.4%) of the respondents specialized in
Crops, followed by those with Extension bias who were; 27.1% . Proportion of respondents that studied Livestocks, and Agricultural Economics were 20% and 17.6% respectively. However, those who graduated in Environmental Management and Protection were the least (5.9%). This is in absolute agreement with the findings of Adeola and Ayoade (2011). This indicates that Extension Agents of
OYSADEP have diverse areas of specialization which could help the practice of unified system of extension. However, extension work may not be very effective since there are more non-extension
specialists in the system. Table 2: Distribution of respondents according to their personal characteristics
Characteristics Frequency Percentage
Age (in year)
27-31 12 14.1
30-36 30 35.3 37-41 19 22.4 42-46 16 18.8
>46 8 9.4
Sex
Male 55 64.7 Female 30 35.3
Educational
Level
M.Sc 19 22.3 B.Sc 39 45.9
HND 22 25.9 OND 5 5.9
Characteristics Frequency Percentage
NCE 0 0.0
Area of
Specialize
Crops production 25 29.4 Livestock production
17 20
Agric Economics 15 17.6 Agric Extension 23 27.1 Environmental mgt & Protein
5 5.9
Total 85 100
Source: Field survey, 2015
Awareness of respondents about different forms
of corrupt practices
As shown in Table 3, the well known forms of corrupt practices in descending order were bribery (100%), abuse of office (88.2%), private use of public resources (84.7%) and impropriety (76.5%).
The least known form of corrupt practice was bureaucratic conflict of interest (9.4%). The overall mean of 1.53 was used to categorize respondents to low awareness and high awareness levels. Consequently, it was discovered that out of the nine corrupt practices, only four had their means above the benchmark. Hence, low level of awareness of the different forms of corrupt practices were
observed among the respondents. This implies that majority of the respondents had very high tendency to engage in corrupt practices particularly unwittingly because of
ignorance. The finding is in agreement with the position of Nyantakiyi (2002) who posited that the simplistic reasoning that corruption is the malignant hobby of politicians is fallacious.
Table 3: Awareness of Respondents about different forms of corrupt practices, n = 85
Forms of Corrupt Practice Known as Corruption Not Known as Corruption Mean
Freq. % Freq. %
Nepotism 40 47 45 53 1.47 Patronage 15 17.6 70 82.4 1.18 Pork barrelling 22 25.9 63 74.1 1.26
Bribery 85 100 0 0 2.0 Influence peddling 20 23.5 65 76.5 1.24 Bureaucratic conflict of interest 8 9.4 77 90.6 1.09 Impropriety 65 76.5 20 23.5 1.76
Private use of public resources 72 84.7 13 15.3 1.85 Abuse of office 75 88.2 10 11.8 1.88
Total 1.53
Source: Field survey, 2015
Perception of corruption
Table 4 reveals that most (95.3%) of the respondents agreed that making loyalty a condition for assigning position of responsibility to sub-
ordinate is good. The same trend is obtained for tradition of ‘man knows man to get things done’ is
normal, indicated by 82.4% of the respondents. Also 82.4% of the respondents agreed that looking for short cut helps wealth redistribution. This is in line with the argument of Ladele (2010) who
observed that corruptions is fast becoming a cultural problem in our national system in Nigeria.

Nigerian Journal of Rural Sociology Vol. 16, No. 1, June 2015
90
It was also observed that 77.6% and 70.6% of
the respondents agreed that immorality grows out of stress and imbalances in the society; and that the poor who complain against corrupt practices by public officials would do worse if given the
opportunities, respectively. These observations were buttressed by Nyantakoyi (2002) who established a nexus between poverty, inequality and corruption. Nyatankoyi (2002) explained further that poverty provides the propitious environment for corruption to thrive. It can be inferred from the foregone that corruption by public officials has many root causes
and that they have various reasons to believe that corruption is inescapable. The current mantra of war against corruption will triumph only with integrated approach of
measures. It will require proactive and holistic actions engaging the impeccable rule of law to prosecute and punish culprits appropriately. The categorization of respondents using the overall mean of 1.76 showed that majority (55%)
had unfavourable perception of corruption, while
45% had favourable perception of corruption. This negates Fadairo and Ladele (2014) assertion in a similar study, which indicated a reversed order. It can therefore be said that there exists a fair culture
of virtue amongst the extension agents in OYSADEP. This is in congruence with the report of the survey conducted by Centre for Democracy and Development-Ghana (CDD-Ghana;2000) on a like study in Ghana which also showed unfavourable attitude and perception of corruption among majority (76.0%) of their respondents. Although, the observations of this study and that of
CDD- Ghana (2000) might appear to follow similar trend, however, the degrees of unfavourable perception of corruption (55% for the formal, and 76% for the latter) shows a very wide margin
against extension Agent of OYSADEP. Hence, more still needs to be done in ridding off corruption out of OYSADEP.
Table 4: Distribution of Respondents to Statements on Perception of Corruption
Statements Agree Uncertain Disagree Mean Freq. % Freq. % Freq. %
Bribe taking and giving is a form of dishonesty 46 54.1 28 32.9 11 13 2.41
Fraud has been made a way of life in Nig. So it impossible to eradicate
52 61.2 9 10.6 24 28.2 1.57
Dishonesty does not impede development 15 17.6 30 35.3 40 47.1 2.29 Indulgence encourages removal of
entrepreneurship clog of bureaucracy
60 70.6 5 5.9 20 23.5 1.53
Dishonesty subverts public interest to favour private interest
30 35.3 16 18.8 39 45.9 1.89
Bribes are ways of earning additional income to
boost take home and better living
50 58.8 05 5.9 30 35.3 1.77
Fraudulent acts shutout best hands 40 47.1 17 20 28 32.9 2.14 Looking for short cuts helps wealth redistribution equitably
70 82.4 02 2.4 13 15.3 1.33
Inequality is promoted by gratification 06 7.1 04 4.8 75 88.2 1.19 Making loyalty a condition for assigning position of responsibilities is good
81 95.3 01 1.2 3 3.5 1.08
Dishonesty in public service is a disincentive to
few honest staff
38 44.7 12 14.1 35 41.2 2.04
Due process emboldens illegitimate groups of people at the corridor of power
48 56.5 02 2.4 35 41.2 1.85
Immorality grows out of stress and imbalances in
society
66 77.6 04 4.8 15 17.6 2.60
Financial probity and accountability are known with only experts, rich and influential people
55 64.7 10 11.8 20 23.5 1.59
The poor who complains against corrupt practices by public officials would do worse he giving the opportunities
60 70.6 03 3.5 22 25.9 1.55
The tradition of man knows man to get things done is normal
70 82.4 02 2.4 13 15.3 1.33
The process of taking maximum advantages (due and undue) of occupied public office is abnormal
52 61.2 03 3.5 30 35.3 1.74
No matter how bad the financial circumstance of a public official is, he must not be dishonest
27 31.8 03 3.5 55 64.7 1.67

Nigerian Journal of Rural Sociology Vol. 16, No. 1, June 2015
91
Statements Agree Uncertain Disagree Mean Freq. % Freq. % Freq. %
The belief of illegal sharing of national cake
should be discouraged
06 7.1 04 4.8 75 88.2 1.19
Application of quota system in distributing opportunities leads to inefficiency
57 67.1 03 3.5 25 29.4 2.38
Source: Field survey, 2015
Hypothesis testing
The Pearson Product Moment Correlation Analysis on Table 5 tested the relationship between awareness of different forms of corruption and perception of the forms of corruption by the respondents. The result shows that there was no significant relationship between their Awareness and
Perception of the corrupt practices, with p-value of 0.064, indicating that the null hypothesis should be accepted. This shows that although the respondents
could perceive some of the perceptional statements as being unethical but some of the semantics used in capturing the different forms of corrupt practices were unknown to the respondents. Table 5: Correlation between Awareness and perception of different forms of corrupt practices by the Respondents
Variable r-value p-value Decision
Awareness
Vs Perception
0.086
0.064
NS
Correlation is significant at 0.05
CONCLUSION AND RECOMMENDATIONS
It is clear from the study that there was low level of awareness of corrupt practices amongst the respondents and hence they may engage in some of the corruption practices inadvertently. However,
they have unfavourable perception of corruption, although, the unfavourable perceptions are not so strong. In essence, policy against corruption calls for pro-activeness in its implementation to
substantially achieve success. Sequel to the foregone observations, the following recommendations are considered germane;
1. There is a very prompt need for orientation seminar on forms of corrupt practices, implication and consequences for public officials generally, and extension agents in
particulars. 2. Intensive media awareness campaign against
all forms of corruption should be embarked upon by government to achieve attitudinal change in Extension Agents.
3. The existing media campaign programmes based solely on bribery as corruption, should
have content redesigning to contain all the different forms of corrupt practices.
4. Finally, after sensitization and enlightenment programmes have been done, the power of the law on corruption should be invoked to punish offenders. This will make Extension Agents, and Public officials key properly into the anti corruption agenda of the present
administration.
REFERENCES
Adeola, R.G. and Ayoade, A.R. (2011). Extension
Agents Perception the information needs of Women Farmers in Oyo State, Nigeria. Global Journal of Human Social Sciences. Vol. 11. Issue 10. Version 1.0 pp 221-240
Ades, A. & Di Tella, R. (1996). The Causes and Consequences of Corruption: A Review of Recent Empirical Contributions. IDS Bulletin: Liberalization and the New
Corruption. Vol. 27. No.2 pp. 6-11. Anand, A.S. (2006). ‘’Effects of Corruption on
Good Governance and Human Rights’. Welcome Address delivered at National
Conference on ‘’Effects of corruption on Good Governance and Human Rights’’ held in New Delhi on 9th May 2006. Retrieved September, 5th , 2015 from
http//www.jansamachar.net Centre for Democracy and Development-
Ghana(CDD-Ghana, 2000). The Ghana Governance and Corruption Survey.
Evidence from Households, Enterprise and Public Officials. pp. 22-23
Daly Trust, (2009). ‘’CPI: Aondoakaa was wrong’’. Daily Trust Newspaper, Friday,
20th November,2009.Ladele, A.A. (2010). ‘’Broaching research on official Corruption in Agric in Nigeria’’. Proceeding of the 15th Annual National
Conference of Agricultural Extension Society of Nigeria (AESON) held at the Obafemi Awolowo University, Ife, on May 10-14, 2010.
Fadairo, O. and Ladele, A. (2014). Attitudes and perception of corrupt practices among public officials in the Agricultural Sector in South Western Nigeria. In online
journals of International Institute for Science, Technology and Education (IISE)

Nigerian Journal of Rural Sociology Vol. 16, No. 1, June 2015
92
Developing Countries Series, Vol. No.8.,
2014.www.iiste.org. Nyantakyi, K.R. (2002). ‘’Corruption: What is it’’.
In Corruption and Development in Africa. A Proceeding of a Seminar organised by
the Ghana Academy of Arts and Sciences with the Friedrich Ebert Foundation on June 17-19. Ghana Academy of Arts and Sciences, Accra.
Oyejide, A.T. (2008). Corruption and Development. A Nigerian Perspective Paper Presented at the 2008 annual
conference of Institute of Chartered
Accountants of Nigeria in Abuja. Specto, B.I.(2005).’’Fighting Corruption’’. In
Fighting Corruption in Developing Countries: Strategies and Analysis.
Bloomfied, CT: Kumarian Press. Pp. 1-9. United Nations Development programme, Oslo
Governance Centre (UNDP, 2008). A users’ Guide to Measuring Corruption. Global Integrity by Raymond June, Afoza Chowdhury, Nathaniel Heller and Jonathan Werve. New York.
Nigerian Journal of Rural Sociology Vol. 16, No. 1, June 2015
93
RURAL WOMEN’S PERCEIVED EFFECTIVENESS OF FADAMA III FACILITATORS’
DISSEMINATION OF ON AND OFF-FARM TECHNOLOGIES IN EDO STATE NIGERIA 1Koyenikan, M. J. and E. E. Obar2
1Department of Agricultural Economics and Extension Services, University of Benin, Nigeria 2Department of Agricultural Extension and Rural Development, University of Ibadan, Nigeria
E-mail: [email protected]
ABSTRACT
The Third National Fadama Development Programme (Fadama-III) aimed at the inclusion of rural women in
recognition of their multiple and pivotal roles in household food, nutrition and health (HHFNH) security.
However, constraints rooted in corruption and unethical practices could have limited achievement. This study
therefore examined rural women’s perception of effectiveness of HHFNH technologies disseminated by
Fadama-III Facilitators in Edo State. The sample comprised seventy five (75) women Fadama Users’ Group
(FUG) members drawn through a multistage process. Data were collected through the administration of a well
structured interview schedule and analysed using descriptive statistics while Pearson’s correlation was used to
test the hypotheses. Majority of the women were between 31 and 50 years (65.4%), married (74.7%) and family
size of 9-12 persons (68.0%) and 48.0% had no formal education. Facilitators were perceived to be effective in
dissemination of several on- and off-farm but more in on-farm technologies including those on storage
( X =3.60), pest and disease management ( X =3.57), harvesting ( X =3.53), HIV/AIDS awareness ( X =3.29),
personal hygiene, water treatment ( X =3.28) and vegetable consumption ( X =3.28). Family size (r=0.234),
cooperative membership (r=0.258), farming experience (r=0.170) and annual income (r=0.248) had significant
relationships with perceived effectiveness of facilitators in technology dissemination at 5% level. Most of the
serious constraints to optimising benefits were related to credit and other inputs access which are rooted in
corruption and sharp practices such as short changing beneficiaries ( X =3.61), disbursement to non- farmers
and fictitious Fadama Users’ Groups ( X =3.61) and fraudulent group registration ( X =3.54). Continuous
capacity building for facilitators and rural women and programme monitoring and supervision are
recommended to optimize and sustain the benefits of Fadama-III users’ group membership. Keywords: Perceived effectiveness, on- and off-farm technologies, constraints, rural women
INTRODUCTION
It is estimated that of the 1.20 billion hungry and poor people in the world over 800 million suffer from chronic undernourishment. Out of these 34 million live in Asia while 186 million live in
Sub-Saharan African (Daudu and Madukwe, 2012). Major challenge facing developing countries in the world is the production of sufficient food for its bourgeoning population (Nwosu, 2005). According
to Food and Agriculture Organisation (FAO) (1996), the intervention in the food deficit situation through agricultural programmes during the late 1970s and early 1980s led to a significant improvement in production throughout the 1990s. However, the increased aggregate food production has not necessarily translated into improved household food security.
Food security refers to when all people, at all times, have physical and economic access to sufficient, safe and nutritious food that meets their dietary needs and food preferences for an active
and healthy life (World Food Summit, 1996) Food security exists when all people, at all times, have physical, social and economic access to sufficient, safe and nutritious food to meet their dietary needs and food preferences for an active and healthy life (Idachaba, 2006) Nutrition security thus requires that household member have access not only to food, but also to
other requirement for a healthy life such as health care, a hygienic environment and knowledge of
personal hygiene (International Fund for
Agricultural Development, 2006). Nutrition is the foundation for health and development upon which all the Millennium Development Goals (MDGs) now the Sustainable Development Goals (SDGs)
depend (FAO, 2000) Various infections, notably diarrhoea and respiratory diseases, measles, malaria, intestinal parasites and infection with Human
Immunodeficiency Virus (HIV/AIDS) have a major impact on nutritional status. The interaction of infection and inadequate food consumption causing growth retardation in children leads to a vicious cycle, the mal-nutrition – infection complex (FAO, 2006). To break the cycle, it is necessary to improve environmental health conditions by addressing problems of contaminated water,
disposal of human excrete and household wastes, and poor food and personal hygiene in homes and places of food processing and marketing. Women play an important role in food security
and the economic well being of farm families (Adekanye, Otitolaiye and Opaluwa, 2009). In individual households; food security is a daily concern of consumption and intra household resource allocation. Women’s multiple role in food production including home gardening, subsistence fishing, marketing, fish processing and informal food selling are resource seeking tasks that
contribute to the household food basket (Balakrishnan, 2006).

Nigerian Journal of Rural Sociology Vol. 16, No. 1, June 2015
94
Despite women’s population and level of
involvement in agriculture, they are constrained to optimize their potentials by factors such as inadequate labour saving technologies, limited access to land and other resources, inadequate
involvement in decision making, poor education, poor access to inputs and credits (Jiggins, Samanta and Olawoye 1997; Adisa and Okunade, 2005). It is on this note that various programmes including Fadama-III were implemented to address the needs of women and enhance their role performance through the dissemination of technologies by the facilitators or extension agents.
The Third National Fadama Development Programme (NFDP-III) was designed to sustainably increase the incomes of Fadama users, reduce poverty, increase food security and
contribute to the achievement of MDGs. The rural poor: crop farmers, pastoralists, fisherfolk, traders, processors, hunters, gatherers, other economic interest groups (EIGs), vulnerable groups: widows, handicapped, youths, PLWHIV/AIDS and service providers are to benefit. The facilitator is the link between the Fadama development project management and
beneficiaries. They disseminate technologies/information to the farmers to achieve set objectives. According to Etzioni (1976), the actual effectiveness of a specific organisation is
determined by the degree to which it realizes its goals. Effective facilitation is a critical element to the overall success of any programme. Its main purpose is to contribute to the sustainability of the
programmes (Third National Fadama Development Project, 2009). According to IFAD (2006), women’s empowerment through facilitators who are responsible for the dissemination of
technologies do not only benefit the women themselves but also their families and communities. They mobilize women and reach out to them in groups. Obinne (2002) noted that women naturally
like to meet and learn something new in groups. They are usually the target population for the household food, nutrition and health security of agricultural programmes because of the pivotal role
they play. It is a truism that corruption is not a new phenomenon, what is new and worrisome is the magnitude and forms it has taken (Fadairo and Ladele, 2014). The issue of corruption is so serious that no initiative whether on food security or poverty alleviation or anything else for that matter will work in the absence of ethical public
behaviour. In Nigeria, it is one of the many unresolved problems (Ayobolu, 2006) that have critically hobbled and skewed development including Fadama III. The programme could not be
said to have optimized potentials or effectively addressed the technology needs of the women with
respect to household food, nutrition and health as
there are still traces of poverty, malnutrition, diseases and even mortality. Ozowa, (1995) posited that ineffective dissemination of technologies and/or the constraints to programme effectiveness
could be attributed to ineffective facilitation and inadequate facilitators for the dissemination of technologies. The effectiveness of the facilitators to adequately deliver and implement the expected activities could make or mar their effectiveness at imparting on the women. It is against this background that the study assessed facilitators’ effectiveness in dissemination
of food, nutrition and health related technologies and the corruption induced constraints in fadama-
III programme. Specifically the study: 1. described the socio economic characteristics of
the rural women in Edo state, 2. identified the food, nutrition and health
technologies disseminated by the Facilitators of NFDP-III,
3. assessed rural women’s perception of effectiveness of facilitators in the delivery of food, nutrition and health related technologies/information to them, and
4. identified rural women’s perceived corruption induced constraints to optimizing benefits from the technologies disseminated by NFDP-III.
METHODOLOGY
Edo State, Nigeria has tropical climate with two distinct seasons; dry and wet seasons. The major crops cultivated in the state include both cash
and food crops like yam, rubber, oil palm, cocoa, cassava, melon and maize. A multistage process was used to draw a sample of seventy five (75) women who participated in the Third National
Fadama Development Programme (NFDP-III). Firstly, the three (3) agro-ecological zones: Edo South, Edo Central and Edo North. Random selection of one Local Government Area per agro-
ecological zone followed by selection of five (5) Fadama Users’ Groups (FUGs) per LGA to give a total of fifteen (15) FUGs. Finally, five (5) women were randomly selected per FUG making a total of
25 women per LGA and 75 women for the 3 LGAs. Data were obtained with structured questionnaire and analysed using descriptive and inferential statistics; mean scores and frequency counts as well as Pearson’s Product Moment Correlation (PPMC) was used. Perception of effectiveness in technology dissemination was measured for 21 on-farm and 35
off-farm items generally disseminated information/technologies using a 5 point Likert type scale; highly effective, very effective, effective, little effective and not effective with
scores 5,4,3,2 and 1 respectively. Mid point=3, ≥3=effective. Minimum score=56, maximum=285.

Nigerian Journal of Rural Sociology Vol. 16, No. 1, June 2015
95
Corruption-induced constraints was obtained
using a 4 – point Likert scale; very very serious, serious, little serious, and not serious with scores 4,3,2 and 1, respectively for Mid point=2.5, ≥2.5=serious.
RESULTS AND DISCUSSION
Socioeconomic Characteristics
Table 1 shows that majority of the women were between 31 and 50 years (65.4%) which indicates that most of the respondents were in their middle age, active’ Majority were married (74.7%) which concurs with the findings of Akwiwu,
Nwajiuba and Nnadi (2005). High proportion of the respondents had family size of 9-12 persons (68.0%) while 48.0% had no formal education which suggests that Household Food, Nutrition and
Health Security technologies will be necessary for the women via extension services. Income of majority was N200,400,000 (mean=N282,000) an indication of above minimum wage of N204,000 in Nigeria and ability of most of the Fadama-III beneficiaries to live above US dollar $1 per poverty line (World Bank,2002; National Bureau of Statistics, 2010).
Table 1: Socio-economic characteristics of respondents
Variables Frequency Percent Mean
Age (years)
30 & below 5 6.7
31-40 17 22.7
41-45 32 42.7
>50 21 28.0
Marital status Single 7 9.3
Married 56 74.7
Widowed 10 13.3
Divorced 2 2.7
Family size
1-4 8 10.7
5-8 16 21.3 8.9
9-12 51 68.0
Educational
qualification
No formal education
36 48.0
Primary
education
23 30.7
Secondary education
11 14.7
Tertiary education
5 6.7
Cooperative
membership
<2 cooperative 28 37.3
3< cooperative 47 62.7
Farming
experience
(years)
Variables Frequency Percent Mean
5 & below 33 44.0
6-10 29 38.7
11-15 10 13.3 7.83years
>15 5 4.0
Annual income
(N)
100,000-200,000
15 20.0
200 001-400,000
51 68.0 N282,000
>400,000 9 12.0
Source: Field Survey, 2012
Perceived facilitators’ effectiveness
Table 2a shows that facilitators were perceived
to be effective in the dissemination of technologies related to pest and disease management (Mean = 3.47), routine management (Mean= 3.48) and storage (Mean = 3.60). Although this is finding is
contrary to the assertion of Agbamu, (2005) and finding of Ejechi, (2015) that the problems of agriculture are as a result of insufficient and ineffective extension services to farmers in general and women farmers in particular but consistent with FAO (1993) in which the facilitators were effective in pest control. Also values from Tables 2a and 2b show that facilitators were perceived to
be more effective in on- farm than off- farm technologies.
Table 2a: Perceived facilitators’ effectiveness in
on-farm activities
NFDP Technologies disseminated Mean Std. Dev
Crop Site selection for Crops 2.93 1.018 Land preparation for Crops 2.97 .972
Marking/pegging out Farm 2.67 1.256 Planting techniques 3.35* .626 Improved plant varieties 3.45* .501 Weeding 3.35* .557
Pest and disease management
3.47* .502
Fertiliser type 3.39* .543 Fertiliser application 3.35* .647
Harvesting 3.35* .647 Storage 3.45* .501 Marketing 2.99 1.046
Livestock
Construction of pens 2.80 1.127 Animal/Improved species 2.91 1.055 Diagnosis of sick animals 3.07* .963 Formulation of feed 2.83 1.143 Feeding 3.24* .786 Pest and disease control 3.45* .527 Periodic management 3.45* .552 Routine management 3.48* .529
Marketing 3.11* 1.021

Nigerian Journal of Rural Sociology Vol. 16, No. 1, June 2015
96
Source: Field survey, 2012.
*Effective (mean ≥ 3.00) Table 2b shows that facilitators were effective in packaging (Mean = 3.04), drying (Mean=3.13),
organic farming (Mean=3.21), vegetable consumption (Mean=3.28), HIV/AIDS awareness (Mean=3.29), personal hygiene (Mean=3.28) which is an indication that most household nutrition and health technologies/non economic technologies were not well emphasized. This is contrary to Koyenikan and Omoregbee, (2011) that the problems of agriculture are as a result of
insufficient and ineffective extension services to women farmers.
Table 2b: Perceived facilitators’ effectiveness in
off-farm activities
NFDP
Technologies disseminated Mean Std. Dev
Value addition Packaging 3.04* .706 Flavouring 2.19 .996 Fortification 2.25 1.140
Modification 1.99 1.046
Storage / preservation
techniques
Drying 3.13* .528
Freezing 3.01* .647 Airtight 1.99 1.145 Heating 3.03* .615 Fermenting 2.65 .893
Chemical storage 2.12 1.052 Smoking 3.03* .697
Nutrition Food enrichment 2.57 .989 Home gardening 2.76 .898 Organic farming 3.21* .444
Supplementary feeding Vegetable consumption 3.28* .481
Fruit consumption 3.16* .616 Soybeans utilisation 2.16 .594 Processing techniques 3.03* .592 Utilisation 2.85 .833
Food combination 2.19 1.087
Health HIV/AIDS Awareness 3.29* .487 Adequate feeding 3.23* .509 Personal hygiene 2.03 .944 Stigmatization/confidentiality
3.19* .485
Prevention and control 3.24* .541
Sex education 2.61 .985 Care giving 3.23* .452 Sanitation 3.27* .528
Hygiene
Personal hygiene 3.28* .452 Water treatment 3.28* .452 Food treatment 3.27* .475 Environmental sanitation 2.44 .740
NFDP
Technologies disseminated Mean Std. Dev
Reproductive issues
Teenage pregnancy 2.07 .664 Sex education 2.35 1.109 Child spacing 2.53 .920
Source: Field Survey, 2012. *Effective (mean ≥ 3.00)
Perceived constraints to optimising benefits
from Fadama III by rural women
Table 3 shows that the most serious constraints
perceived by the women to optimising benefits related to credit and other inputs accessed. A critical look at these constraints (as indicated on the table with **), show that they are rooted in sharp,
corrupt and unethical practices which include reduction in credit accessed/short changing
beneficiaries ( X =3.61), disbursement to non farmers and fictitious Fadama Users’ Groups
( X =3.61), fraudulent group registration ( X =3.54),
undue bureaucracy for tips ( X =3.51), elite
domination/influence peddling ( X =3.49),
favouritism and discrimination ( X =3.49),
dereliction of duty ( X =3.37), acquisition of sub
standard facilities and equipment ( X =3.37), supply
low quality inputs ( X =3.37). Fraudulent group registration, bureaucratic conflict of interest, nepotism and influence peddling concur with the findings of Anderson (2002) as forms of corruption in Sweden.
Table 3: Perceived constraints to optimising benefits from Fadama III by rural women
Constraints Mean SD Rank
**Shortfalls in credit accessed/short changing
beneficiaries
3.61* .432 1st
**Disbursement to non farmers and fictitious
Fadama Users’ Groups
3.61* .151 1st
**Fraudulent group registration
3.54* .601 3rd
**Undue bureaucracy for tips
3.51* .236 4th
**Elite domination/influence peddling
3.49* .423 5th
**Favouritism and
discrimination
3.49* .256 6th
**Dereliction of duty by facilitators
3.37* .390
7th
**Acquisition of sub
standard facilities and equipment
3.37* .238 8th
**Supply of low quality inputs
3.33* .408 9th
No time to attend women meetings
1.84 .239 10th

Nigerian Journal of Rural Sociology Vol. 16, No. 1, June 2015
97
Source: Field Survey Data, 2012 *serious
constraints (Mean ≥ 2.50) **corruption related
Relationship between socio economic
characteristics of respondents and perceived
facilitators’ effectiveness
Table 4 shows the correlation between the perceived facilitators’ effectiveness in technologies dissemination and selected variables. Family size of respondents (r = 0.0234; P < 0.050), cooperative membership (r = 0.258; P < 0.050), farming experience (r = 0.170; P < 0.050) and annual income (r = 0.248; P < 0.050) had significant
relationship with perceived facilitators’ effectiveness in technology dissemination. This implies that women with larger farms, more years of farming experience, cooperative membership
and higher income perceived facilitators to be effective in the technology dissemination. It could imply that the women feel they benefited from the services .
Table 5: Relationship between the socio economic characteristics of respondents and perceived facilitators’ effectiveness of technologies
disseminated
Variables Correlation
coefficient (r)
p-value
Age (years) 0.143 0.081 Family Size (ha) 0.234* 0.007 Educational 0.048 0.556
Cooperative member (no.) 0.258* 0.001 Farming experience (year) 0.170* 0.037 Annual income (N) 0.248* 0.002
*Significant at the 5% level (p<0.050) Source: Field Survey Data, 2012
CONCLUSION
The study concludes that women perceived Fadama III Facilitators to be effective in more
crops and livestock on-farm technology dissemination than in off-farm technologies. Constraints which hindered women from benefiting optimally from the programme revolved around
capital and other inputs. Women with large family size, more cooperative membership, long years of farming experience and higher annual income perceived the facilitators to be effective.
RECOMMENDATIONS
Based on the findings of this study, the following recommendations are made: 1. Facilitators should ensure adequate linkage to
credit/sources of funding and mobilization of resources within FUGs. Ensure that women
have access to quality inputs and services
especially after NFDP closure for
sustainability of groups. 2. Programme monitoring and supervision should
be ensured to prevent corrupt practices in the programme,
3. Continuous capacity building for facilitators in off-farm technologies and consequently update and upgrade technical skills of women in order to optimize and sustain the benefits of Fadama-III users’ group membership
4. Sensitization of programme staff, women beneficiaries and other stakeholders on the ills of corruption and related practices.
REFERENCES Adekanye,T.O., Otitolaiye, J.O., & Opaluwa, H.I.
(2009). Food and Agricultural Production
in Nigeria. Some Empirical consideration for Engendering Economic Policy for africa. A paper presented at IEFFE conference on Feministic Economic, Boston, Massachusetts, USA, pp. 26-28
Adisa, B., & Okunade, E.O. (2005). Women in Agricultural Extension. Agricultural Extension in Nigeria. Ed. S.F. Afolayan,
Illorin AESON, ARMTI, Illorin, pp. 69-77.
Agbamu, J.U (2005). Problems and prospects of
agricultural extension service in
developing countries. Agricultural Extension Society of Nigeria, Ilorin, Nigeria pp.159 – 169.
Akwiwu C.D., Nwajiuba, C.U. & Nnadi (2005)
Harnessing the potentials of Youths for Rural Household Food Security in Nigeria. Anim. Pod., Res. Adv., 1:104-110
Anderson, S. (2002). Corruption in Sweden:
exploring danger zones and change. Unpublished PhD thesis submitted to the Department of Political Science, Umea University, Sweden.
Ayobolu, J. (2006). EFCC, corruption and the due process. Segun Toyin Dawodu, USA
Balakrishnan, R. (2006). Rural Women and Food
Security: Current Situation and
perspective. Oxford University Press, pp. 60-61
Chale, F. (1990). Strengthening Agricultural Extension- A study of problems and constraints in extension strategies and methods for reaching rural women (Terminal Report). FAO of the United Nations, Rome.
Dauda, S., & Madukwe, M.C. (2012). Factors that influence the role performance cilitators in the second national Fadama development project in Nigeria. Journal of Sustainable
Development in Africa, 14(8), 176

Nigerian Journal of Rural Sociology Vol. 16, No. 1, June 2015
98
Doyle, M., Kaner, S., Lind, L., Toldi, C., Fisk, S.,
& Berger, B. (2007). Facilitators’ Guide to Participatory Decision –Making , Jossey-Bass., ISBN 0-7879-8266-0, pp. 21-22
Ejechi, M. E. (2015). Determinants of adoption of
cassava technologies by male farmers in Nasarawa State, Nigeria. Journal of
Agricultural Extension. Vol. 19 (1) p122-130
Etzioni, A. (1976). Modern Orgainisations. New Delhi: Prentice Hall of India, Pvt. Ltd., p. 8
Fadairo, O., & Ladele A. (2014). Attitudes and
perception of corrupt practices among public officials in the agricultural sector in Southwestern Nigeria. Developing Country Studies, 4(8), 1.
Food and Agriculture Organisation (FAO) (1993) Agriculture Extension and Farm Women in the 1980s. Rome FAO Series 0125. pp. 1-6
Food and Agriculture Organisation (FAO) (1996). Household food insufficiency is associated with poorer health; 133:120-6.
Food and Agriculture Organisation (FAO) (2000).
The state of Food Insecurity in the world. Rome: FAO, United Nations.
Food and Agriculture Organisation (FAO) (2006). Agriculture, Food and Nutrition for
Africa: A resource book for teachers. FAO Corporate Document Repository
Hondale, G. (1982). Supervising Agricultural Extension Practices and Procedures for
Improving yield level performance. Journal of Agriculture Administration, 9 ,pp. 39-45
Idachaba, F. S. (2006). Strategic and Policies for
Food Security and Economic Development
in Nigeria. Lagos: CBN.
International Fund for Agricultural Development
(IFAD) (2006). Food Security and Nutrition Security. www.Ifad.org
Jiggins, J., Samanta, R.K., & Olawoye, J.E. (1997). Improving Women Farmers’ Access to
services . In improving Agricultural Extension: a reference manual. (Eds.) B. E. Swanson, R.P. Bentz and A.J. Sofranko. FAO/UN, 1997, pp. 73-82.
Koyenikan, M. J. and F. E. Omoregbee, (2011). Training needs for facilitators of rural women development prodrammes in Nigeria: the case of National Special
Programme for Food Security. International Journal of Agricultural
Economics and Extension Services. Vol.1 (1) p48-59.
Midmore, D.J., Ninez, V. & Venkataraman, R. (1991). Household Gardening projects in Asia: past experience and future directions. AVRDC Technical Bulletin, China.
Nwosu, K. I. (2005). Agricultural rebirth for improved production in Nigeria. Proceeding of the 39th Annual Conference
of the Agric Society of Nigeria. Held at University of Benin, Nigeria October, 9th – 13th pp. 18 – 23
Ozowa, V.N. (1997). Information Needs of Small
Scale Farmers in Africa: The Nigerian Example. Quarterly Bulletin of the International Association of Agricultural Information Specialists: IAALD/CABI
40(1): 15-20 Third National Fadama Development Project
(2009). Facilitators’ Handbook for Third National Fadama Development Project,
pp. 1-10

Nigerian Journal of Rural Sociology Vol. 16, No. 1, June 2015
99
RURAL WOMEN’S PERCEPTION OF MARKET-RELATED SHARP PRACTICES IN KWARA
STATE, NIGERIA 1Onikoyi, M. P., 2Olutegbe, N. S. and 2Adeyemo, A. A.
1Agricultural and Rural Management Training Institute (ARMTI), Ilorin, Kwara state 2Department of Agricultural Extension and Rural development, University of Ibadan, Ibadan
E-mail: [email protected]
ABSTRACT
The study determined rural women’s perception of market-related sharp practices in Kwara state, Nigeria. A
total of 120 interview schedules were administered on rural market women and information were obtained on
their personal characteristics, perceived common market-related sharp practices, perception of sharp practices
and other factors perceived to influence perpetration of sharp practices among respondents. Both descriptive
and inferential statistical tools were employed in analyzing the data. Results reveal that majority were Muslims
(62.5%), married (71.7%), had no formal education (51.7%), while 50.8% were food stuff sellers. The average
age and household size were 42 years and 7 persons, respectively. Common sharp practices perceived to be
perpetrated were use of wrong scale (94.2%), adjustment of measuring device (85.0%) and bagging of
commodities with stones (80.8%). Although a large proportion (61.7%) of the respondents condemned sharp
practices by their perceptions, several other factors such as lack of measurement standard (mean = 1.77),
customers’ ignorance of consequences (mean = 1.71), poor supervision by designated government agencies
(mean = 1.66) and lack of fear of God (mean = 1.63) were perceived to account for high level of market-related
sharp practices. Respondents’ level of education (χ2 = 9.404) and household size (r = -0.209) were significantly
related to their perception of sharp practices. The study concluded that although respondents’ perception of
sharp practices was unfavourable, other non-behavioural factors may have forced the rural market women to
engage in perpetration of such practices. Keywords: Rural women, sharp practices, market, perception.
INTRODUCTION
The concept of fraud, corruption and corrupt practices has remained a topical issue in many countries, including Nigeria. Indeed, literature is
replete with academic discussions on the subject in the country. For example, the phenomena have attracted the attention of scholars (Anifowose, 2002; Ibrahim, 2003; Aluko, 2002; Nwabueze,
2002; Olaopa, 1998; Maduagwu, 1996 and Akindele, 1995) over the years and virtually all successive governments in the Nigeria have shown committed interest in tackling corruption. It is
pertinent to remark that although the two concepts - fraud and corruption - are often used interchangeably, there is a need to make a distinction between them, at least, for the sake of
clarity and better appreciation of their import in this study. Corruption is mostly associated with public sector and public officials; for example Azelama (2002) defines corruption as any action or omission
enacted by a member of an organisation, which is against the rules, regulations, norms, and ethics of the organisation and the purpose is to meet the selfish end of the member, sometimes at the detriment of the organisation. However, fraud in the view of Rossouw and Arkhuysn (2000) is a phenomenon that is not limited to the public sector. They maintained that public officials, any
employee in the private sector or even individuals in the informal sector can be perpetrators of fraud. Some definitions also differentiate between ‘petty’ and ‘large-scale’ (or ‘grand’) corruption,
with the former occurring at the local lower level and usually involving relatively small sums of
money and gifts, and the former taking place higher up in the hierarchy and involving relatively large amounts of money and costly favours. These become necessary in view of its implication for the
moral fabric of society and the sustenance of living. Unethical behaviour, which is precursor to fraud and criminality (Rossouw and Arkhuysn, 2000) can be destructive where no proactive action is taken
and may lead to collapse of the entire society. In view of this, the distinction between corruption and fraud is that corruption implies a third party involvement while fraud does not necessarily imply
third-party involvement. Though the study of fraud and corruption within the society is often considered attractive, academic research of these phenomena has been limited substantially to the
formal sector of the economy. The Nigerian agricultural production has advanced beyond subsistence production and agricultural marketing has become a very important
component of the production system. Agricultural produce marketing is an integral and crucial part of food production process in a viable farm enterprise. Agricultural produce marketing is viewed as the flow of goods and services from the point of initial farm production to the hands of the ultimate consumer (Adekanye 1988; Kohls and Uhi, 1990; AMA, 1994; Bibagambah, 1996). Onyeabor (2009)
added that agricultural produce marketing depicts a process of demands and motivation of sellers to distribute food items unto ultimate consumers at a profit, considering the high level of farming
activities in our rural areas. Rural marketing activities are on the increase. Hence, the need for a
Nigerian Journal of Rural Sociology Vol. 16, No. 1, June 2015
100
study of this aspect of the economy was based on
its importance to human life. Many consumers of household commodities have been noted to have suffered varying degree of cheating, damages, and short changing in the hands of numerous
unscrupulous sellers or distributors (NAFDAC, 2008). In spite of this, adequate academic effort has not been given to the activities of players within the informal market sector. Continued perpetuation of sharp practices at varying degrees therefore raises questions on the disposition of rural market women to these acts in the process of their marketing activities. It is against this backdrop that the study
was carried out with the aim of investigating the following objectives. The main objective of this study, therefore, was to investigate rural market women’s perception
of market-related sharp practices in Kwara State, Nigeria. The specific objectives of the study were to:
1. determine the personal characteristics of rural market women in the study area,
2. assess the perception of rural market women towards sharp/corrupt practices , and
3. examine the perceived factors encouraging
perpetuation of sharp/corrupt practices among rural market women in the study area
Statement of hypotheses
Hypothesis 1 - There is no significant
relationship between selected respondents’ personal characteristics and their perception of sharp practices Hypothesis 2 - There is no significant
relationship between factors encouraging perpetuation of corrupt practises among rural market women and their perception of sharp practices
METHODOLOGY
The study was carried out in Kwara state, Nigeria. The state is located within the North
Latitude 110 21 and 110 451. It is sandwiched between longitudes 20 451 and 60 401 East of Greenish Meridian. The state has a land area of 32,500 square kilometers (3,250,000 hectares) with
a temperature range of between 300C and 350C. The population of the State is 2.3 million people (NPC, 2006). The target population for the study was the 300 members of Market Association of Nigeria in the nine Local Government Areas (LGAs) of Kwara State. The LGAs included Asa, Ilorin East, Ilorin West, Ilorin South (Kwara Central); Moro (Kwara North) ; Irepodun, Ifelodun,
Oyun and Offa (Kwara South Senatorial District). The study used a two-stage random sampling technique. Stage one involved a random selection of six LGAs (that is, 67% of the LGAs in which
members were located in Kwara State). The six LGAs included Ilorin East, Ilorin South, Ilorin
West, Irepodun, Oyun and Offa LGAs. The second
stage involved a random selection of 20, 25, 26, 18, 16 and 15 members from the market association registered in Ilorin East, Ilorin South, Ilorin West, Irepodun, Oyun and Offa LGA respectively based
on the number of members each LGA. Thus a total of 120 members were selected as respondents. Data were collected by means of structured interview schedule and analyzed with percentages, frequencies and chi square and correlation analysis. Primary data for the study were collected from respondents using structured questionnaire and interview schedule. The perceived sharp practices
which is the dependent variable was measured by asking the respondents to indicate which of the practises they considered as corrupt as listed in the questionnaire . The mean scores for each type of
perceived sharp practise were used to group the respondents into high and low categories. To determine the factors encouraging perpetuation of corrupt practises among rural market women each of the respondents was asked to indicate from a list of factors such as ignorance of customers, lack of measurement standard, financial pressure to maximise profit, weak punitive measures,
depreciating social values, poor supervision from designated government agencies, on a 3-point scale of major factor (2), minor factor (1) and not a factor (0).
The data collected were analyzed using descriptive statistics such as frequency distribution tables, percentages and mean. Hypothesis were analyzed using chi-square
RESULTS AND DISCUSSION
Personal characteristics of respondents
The age distribution of the respondents as
shown in Table 1 reveals that majority (39.2%) were within the ages of 31-40 years, 15.0% were aged less than 30years, while 9.2% of the respondents older than 60. These imply that most
of the respondents are still relatively young and in their productive stage. The Table also shows that majority (86.7%) were married, 18.3% being widow. The educational
status of the respondents indicated that 51.7% of the respondents had no formal education, 37.0% had primary education, while only a few (17.5%) had secondary school education, the larger % of the respondents with no formal education agrees with the finding of (Aqueela 2005) that two third of the one billion of illiterate persons in the world are women and girls. Membership of associations,
(98.8%) of the respondents belonged to market associations. associations, In Nigeria, the structural role of men and women in the agricultural cycle reveal that women are more active specifically in
processing and marketing of agricultural products. Women constitute overwhelming population of

Nigerian Journal of Rural Sociology Vol. 16, No. 1, June 2015
101
those who are involved in agricultural produce
marketing as against the men who focus more on artisan, subsistent farming and civil service occupations Enugu State Agricultural Development Programme (ENADEP, 2009) Table 1 also shows
that majority had (42.5%) had household size of between 7-9 members. Table 1: Distribution of respondents by personal characteristics
Variables Categories Percentage (n = 120)
Age < 30 31-40 41-50 51-60
>60
15.0 39.3 23.3 13.3
9.2
Religion Christianity Islam Traditional
34.2 62.5 3.3
Marital
status
Single Married Widowed Divorced
8.3 71.7 18.3 1.7
Educational
level
Non formal Primary
Secondary
51.7 30.8
17.5
Household
size
1-5 6-10 11-15
16-20
62.6 34.5 2.3
0.6
Commodity
marketed
Rice Maize Food stuff
Groceries Yam Vegetables
12.5 16.7 50.8
8.3 5.0 6.7
Association
membership
Member
Non member
98.8
1.2
Source: Field Survey, 2015.
Perceived sharp practises amongst rural market
woman
Table 2 presents the distribution of the respondents based on the frequency of perceived sharp practises amongst rural market woman. Majority (94.2%) identified use of wrong scale of
measurement, short-changing of customers (70.8 %,) and bagging of commodity with stones (80.8%) as the commonly perpetuated market-related sharp practices in the study area. This corroborates the
findings of okunola et al, (2014) that fraudulent practices usually take different patterns depending on the situation, the environment and the nature of goods bought in the market. Such practices range from tampering with measurement module (kongo), short-changing people through prices, adulteration of products (mixing with ‘foreign’ products) for extra gains to offering substandard products for
sale. Other sharp practises identified amongst rural
market woman include adulteration of commodity
(65.8%) and sales of substandard products for the price of quality ones. This finding justifies the position of Crane and Dirk (2004) that business life is confronted with
enormous and complex ethical problems. It further reveals the various dimensions which unethical practices may take. The findings also corroborates the position of Rossouw and Arkhuysn (2000) that fraud and corruption traverse every facet of human endeavour and not necessarily phenomena that are peculiar to public sector and public officials.
Table 2: Perceived Sharp Practises Amongst Rural Market Woman
Sharp practises F %
Use of wrong scale of measurement
113 94.2
Adulteration of commodity 79 65.8
Bloating 62 51.7 Short-changing of customers 85 70.8 Bagging of commodity with stones/fillers
97 80.8
Wrong adjustment of measuring modules
102 85.0
Substandard products for sale 85 70.8
Source: Field Survey, 2015.
Perception of rural market women to sharp
practices
Table 3.1 presents the distribution of the respondents based on the perception of rural market
women towards common market related sharp practices in the study area. The study reveals that 42.5% disagreed that it is a good idea to mix bad nuts with good ones and that it’s not a bad idea to
mix sub-standard commodity with good ones. However this is against common market related sharp practices that pervade common food markets in Nigeria. This is according to okunolaet al (2014)
who reported the common sharp practices in Nigerian food market as ranging from tampering with measurement module (kongo), short-changing people through prices, adulteration of products
(mixing with ‘foreign’ products) for extra gains to offering substandard products for sale. The study further reveals that 44.2% disagree that they do not see anything bad in adjusting
measuring modules, after all I can equally be a victim, and (44.2%) and that country has become so bad that we hardly can be very faithful to customers hundred per cent. and that adjusting bag size to reduce quantity is rather a smart way of increasing profit (28.3%). To further establish the unfavourable disposition towards sharp practices, the study reveals that 40.0% agreed that 39.2%
agreed that they were at home with standard measurement for market items if the government can come up with one and that they believe God

Nigerian Journal of Rural Sociology Vol. 16, No. 1, June 2015
102
will punish anyone who makes wrong adjustment
of measuring equipment (26.7%). The findings implies that based on the items used as indicators of sharp practices, a large number of the market women in the study area have unfavourable
perception towards a number of sharp practices being perpetuated in the market. The study however reveals some of the sharp practices to which a number of the respondents were favourably disposed. For example the study revealed that 35.% agreed that life is a game of smartness, as one should not only always be at the receiving end. Also, 29.2 strongly agreed that
people can adjust measuring bowls as long as
customers do not know (29.2%) and that in this era
of economic hardship, we have come to stay with some measures of smart dealings (33.3%). This implies that sharp practices in its entirety are not being considered as wrong in all of the dimensions
in which it manifests in the food market. The overall summary of respondents’ perception of sharp practices reveals (Table 4) that a large number or rural market women in the study area had unfavourable perception towards sharp practices. This implies that sharp practices of various forms are seen as evil acts which should be discouraged among the women.
Table 3 Perceptions of Rural Market Women to Sharp Practices (n = 120)
Attitudinal Questions SA A U D SA
It is a good idea to mix bad nuts with good ones 5.0 8.3 10.8 42.5 33.3 People can adjust measuring bowls as long as customers don’t
know
6.7 29.2 10.3 25.0 29.2
It’s not a bad idea to mix sub-standard commodity with good ones
8.3 23.3 3.3 42.5 22.5
Adjusting bag size to reduce quantity is rather a smart way of increasing profit
6.7 25.8 11.7 28.3 27.5
In this era of economic hardship, we have come to stay with some measures of smart dealings
15.0 33.3 15.8 16.7 19.2
I don’t see anything bad in adjusting my measuring device,
after all I can equally be a victim
3.3 23.3 14.2 44.2 15.0
The country has become so bad that we hardly can be very faithful to customers hundred percent
22.5 21.7 15.0 28.3 12.5
I will rather loss than cheat my customers 11.7 20.8 26.7 22.5 18.5
It is not anybody business how I sell my markets, even if I cheat customers
22.5 20.8 21.7 25.8 9.2
I am at home with standard measurement for market items if the government can come up with one
39.2 27.5 8.3 15.8 9.2
Life is a game of smartness; do me I do you 16.7 35.8 17.5 17.5 12.5 I believe in transparency and trust as a trader in the market 24.2 35.0 19.2 13.3 8.3 I will rather inflate price for rich men who come around to buy, after all they have all embezzled to have so much
24.2 28.3 17.5 25.8 42
The only way to catch up with co-market women is to ‘apply wisdom’
17.5 40.0 19.2 15.8 7.5
Inflating prices occasionally is our only chance of sharing in the national cake
23.3 22.5 20.8 25.0 8.3
I believe God will punish anyone who makes wrong adjustment of measuring equipment
26.7 27.5 23.3 10.8 11.7
Source: Field Survey, 2015
Table 4: Categorization of respondents’ perception
of rural market women to sharp practises
Perception Categories
Frequency Percentage Mean Std Dev
Favourable 74 61.7 68.5 8.5
Unfavourable 46 38.3
Perceived factors encouraging perpetuation of
sharp practices
Table 5 presents the distribution of the respondents based on their rating of perceived
factors encouraging perpetuation of sharp practises
by rural market women in the study area. Majority (81.7%) of the respondents opined that lack of measurement standard was a major factor that encouraged Perpetuation of Sharp Practises, A larger proportion (67.5%) of the respondents also identified Poor supervision from designated government agencies, which is in tandem with (Dike 2008) who stated that the lukewarm attitude
of those who are supposed to enforce the laws of the land could lead to people engaging in corrupt behaviour, knowing fully well that they would get

Nigerian Journal of Rural Sociology Vol. 16, No. 1, June 2015
103
away with it. Also, 60.3% of the respondents
identified financial pressure to maximise profit as a major factor. This may be as result of the extension family setting which is common in the rural area, which often attracts higher responsibilities in the
form of financial commitment. This is also in tandem with Onalaja and Onalaja (1997) who opined that influence of extended family system
and pressure to meet family obligations are more in
less developed societies. About seventy one percent of the respondents identified existence of commodity association as minor factor while 31.7% identified poor upbringing as a no factor that
encouraged perpetuation of sharp practises.
Table 5 Perceived factors encouraging perpetuation of Sharp Practises:
Factors Major factor Minor factor Not a factor Mean Rank F % F % F %
Ignorance of customers 92 76.7 21 17.5 7 5.8 1.71 2
Lack of measurement standard 98 81.7 16 13.3 6 5.0 1.77 1
Poor supervision from designated government agencies
81 67.5 37 30.8 2 1.7 1.66 3
Existence of commodity association 17 14.2 73 60.8 30 25.0 0.89 12
Financial pressure to maximise profit 72 60.3 34 28.3 14 11.7 1.48 8
Poor market coordination 49 40.8 55 45.8 16 13.3 1.28 9
Poor sanction methods 68 56.7 44 36.7 8 6.7 1.50 7
Weak punitive measures 76 63.3 40 33.3 4 3.3 1.60 5
Poor market price 73 60.8 43 35.8 4 3.3 1.57 6
Depreciating social values 52 43.3 40 33.3 28 23.3 1.20 10
Poor upbringing 61 50.8 21 17.5 38 31.7 1.19 11
Lack of fear of God 83 69.2 30 25.0 7 5.8 1.63 4
Hypotheses testing
The study reveals that there was a significant relationship between rural market women’s level of education and their perception of market-related sharp practices (χ2 =9.404, P=0.009)
This implies that formal education is important to enlightening the people on corrupt practices in the study area. This result agrees with UNDP (2012) that posited that education is an essential tool in enlightening the people and informing them of societal expectations. However the study reveals no significant relationship between respondents’ religion (χ2 =4.806, P>0.05), marital status (χ2
=6.230, P>0.05), membership association (χ2 =2.256, P>0.05) and perception of sharp practices among rural market women. Table 5b shows the correlation analysis
between respondents’ age, household size and perception of market related sharp practices in the
study area. Results reveal that there were
significant correlation between respondents’ age (r = 0.307), household size (r = -0.222) and perception of sharp practices. This implies that while the younger market women may not have so
much against perpetuation of sharp practices, their older have unfavourable perception towards it. as perception improves with age. It is expected that the elderly in the society are custodian of social values, and it is expected that even though the emerging generations may not appreciate these values, the same may not be said of the older folks. The significant relationship of household size may
not also be unconnected to increasing family responsibilities which may put more pressure of the women and may thereby be a factor increasing perpetuation of sharp practices in the study area.
Table 5a: Relationship between respondents’ socio-economic characteristics and perceived sharp practices
Characteristics χ2 value Df p–value Decisions
Religion 4.806 2 0.090 NS Marital status *6.230 3 0.101 NS Educational level 9.404 2 0.009 S Membership of association 2.256 1 0.133 NS
*p < 0.05

Nigerian Journal of Rural Sociology Vol. 16, No. 1, June 2015
104
Table 5b: Table showing PPMC results of
relationship between age, household size of respondents and their perception of market related sharp practices
Variables r P Decision
Age 0.307 0.012 S Household
size
-0.222 0.031 S
CONCLUSION AND RECOMMENDATION
The study concludes that sharp practices manifest in different dimensions among market women in the study area, the most prominent ones bothering on use of wrong scale and modules of measurement. The study further described factors encouraging sharp practices among rural market
women as multi-pronged, as all the stakeholders including government regulatory agencies, customers and even the market women themselves are culpable. It identifies lack of standard
measurement scales/modules among traders, ignorance of customers, as well as poor supervision from designated authority. However, in spite of the prevalence of sharp practices, market women still perceived the practices to be evil, and so should not be allowed to thrive in the marketing systems of agricultural produce in the study area. The study further establishes that perception of sharp
practices among rural market women improved with age, while households with large members were more likely to favour sharp practices, perhaps due to increasing household responsibilities.
• The role of government through such agencies as CPC (Consumers Protection Council)
cannot be overemphasized and it is recommended that such agencies should be mandated to take cases in often neglected areas like rural market and the like into cognizance.
This can be better achieved by developing measures adaptable to the realities in the rural markets so as to effectively fight cases of sharp practices in the study area.
• Government should also reintroduce uniform
measurement module which must be constantly inspected by government and union officials.
• Market associations should also ensure strict compliance to standard and honest practices among its members and punitive measures
should be extolled against violators.
• Customers should also be well educated from time to time so they are able to know and demand for their rights to transparent dealings with sellers af agricultural commodities.
REFERENCES
Akindele, S.T. (1990). Corruption and Economic Retardation: A Retrospective Analysis of
Nigeria’s Experience since Independence,
in Bamisaye, O. (ed.) Readings in the
Political Economy of Nigeria Since Independence, Lagos Ventures Limited, Nigeria.
Akindele, S.T. (1995). Corruption: An Analytical
Focus on the Problems of Conceptualization, Ife Psychologia, Vol. 3, No. 1 pp 55-69.
Aluko, M.A.O. (2002). The Institutionalization of Corruption and its Impact on Political Culture and Behaviour in Nigeria, Nordic Journal of African Studies, Vol. 11, No. 3.pp23-25
Adejugbe, M.A. (ed.), Perspectives on Nigeria’s fledging Fourth Republic, Lagos: Malthouse Press Limited.
Aqeela S, Tanuir A M and Mohammed Z 2005
Gender Participation in Livestock Production Activities and Their Consumption Trend of Proteinous Diet in Tehsil Fatch Jung. Pakistan Journal of
Agricultural Science 42: pp 3-4 Azelama, J. U. (2002). Public enterprises
management in Nigeria. Ambik Press. Babalola, A. (1995). Corruption and Political Crisis
in Nigeria: A Sociological Viewpoint, The Conference Proceedings of the Nigerian Anthropological and Sociological Association (December) pp 59.
Coleman, J. W. (1985). The Criminal Elite: The
Sociology of White Collat Crime. Crane, A. and Dirk, M. (2004). Journal of business
Ethics 54 (4), 323-337, Oxford University
Press Dike, V.E. (2008). “Corruption in Nigeria: A New
Paradigm for Effective Control”. Retrieved 27th September,2011
fromwww.AfricaEconomicAnalysis.org ENADEP; (2009). Enugu State Agricultural
Development Programme; Annual Report; 36pp
Ibrahim, J. (2003). Corruption in Nigeria: Transition, persistence and continuity. The
Nigerian Social Scientist, 6(2), 3-13. Joubert, S. (1993). Corporate crime: a
criminologist's perspective. Acta
Criminologica, 6(2), 9-15. Labanji, B. (1970). Anatomy of Corruption in
Nigeria. Maduagwu, M. O. (1996). Nigeria in Search of
Political Culture: The Political Class, Corruption and Democratization. Corruption and
Democratization in Nigeria. Ibadan: Agbo
Areo Publishers, 3-12. Makinde, M. (2008). The humanities and Good
Governance: A Philosophical appraisal,
www.iiste.org ISSN 2224-607X (Paper)
Nigerian Journal of Rural Sociology Vol. 16, No. 1, June 2015
105
ISSN 2225-0565 (Online)Vol.4, No.23, pp
30 and 31 National Population Commission. (2006). NPC
(2006). Nigeria Population Census
Report, NPC Abuja.
Nwabueze, N. (2002). Corruption: A Sociological Perspective. Perspectives on Nigeria’s fledging Fourth Republic, Adejugbe, MA
(ed.), Lagos: Malthouse Press Limited. Odekunle, F. (1981).Criminological Knowledge
and Nigeria’s Crime problem: The Dilemma of Social Scientists in Nigeria, in Sanda, A.O. (ed.), Social Science and
Social Policy in Nigeria, Ibadan: NISER. Olaopa, O. R. (1998). Corruption: An Analytical
Reconsideration. Journal of the Nigerian
Anthropological and Sociological
Association, Vols, 1.
Okunola, R.A. (2014). Developing Country Studies
www.iiste.orgISSN 2224-607X (Paper) ISSN 2225-0565 (Online) Vol.4, No.23, 2014
Onalaja, Taiwo & Kehinde Onalaja, How
Polygamy Wrecks Nigeria, Africa. CAPWONA Books, UK, 1997
Onyeabor, E. N. (2009). Marketing and Distribution Channels. Agricultural
Marketing for Developing Economies, 14-25.
Oyediran, O., Nwosu, H., Takanya, B., Anifowose, R., Radejo, F., Ogbobodo, G., & Agbaje,
A. (2002). New Approach Government. Rossouw, M. and Arkhuysn, F. (2000). Defining
and Understanding Fraud: A South African Case Study, Business Ethics
Quarterly, Vol. 10, N0. 4, pp. 885- 889

Nigerian Journal of Rural Sociology Vol. 16, No. 1, June 2015
106
TRADE ROUTE INCIDENT MAPPING SYSTEM (TRIMS) EVALUATION OF NON-TARIFF
PAYMENTS AMONG TRADERS IN OGUN STATE, NIGERIA
Akinwale, J. A. and Oyelami, B. O. Department of Agricultural Extension and Rural Development,
University of Ibadan,
Ibadan, Nigeria. E-mail: [email protected]
ABSTRACT
In pursuant of their livelihood, traders, and transporters often face non-tariff payments while moving their
agricultural and non-agricultural goods to and from markets and other points of sale. These incidents
incrementally and gradually hike the cost of doing business in Nigeria and, hinder food surpluses in rural areas
from getting to urban areas resulting into rural poverty. The sources, depth and extent of the obstacles faced by
the traders were investigated in this study. Content analysis of TRIMS website for a six-month period was used
for this study. The results showed that 60.7% of male and 39.3% of female encountered incidents of non-tariff
barriers. It also revealed that 67.8% of the report was on the Nigerian Police, 12.4% on Road Safety Corps,
3.0% on Customs, 8.2% on Local Government Authority and 8.6% on other agencies (Immigration, National
Drug Law Enforcement Agency, and Nigeria Army). Within the period, a total sum of N973, 047.00 was
reported as non-tariff payments. The results further showed that 57.2% of the respondents recorded less than 30
minutes of time lost, 31.2% recorded up to one hour of time lost and 11.6% recorded more than one hour of
time lost. The test of hypothesis indicated a strong positive association between time lost (29.8±41.0) and non-
tariff payments (40,543.6±66,661.7). In order to achieve economic growth, the anti-grafts agencies in the study
area should be strengthened to promptly apprehend officers responsible in any case reported to the website so
as to serve as deterrent to other corrupt officers. Keywords: Trade route, Non-tariff payment, Incident mapping, Corruption.
INTRODUCTION
Bribery, corruption and delays are endemic in commercial transportation along the West African trade routes. In Nigeria trade routes are tempting
targets for uniform and non-uniform men who are eager to supplement their incomes by skimming a little cash from traders moving their goods along them. Trade route corruption is a complex and
multifaceted problem whose causes and solutions involve many stakeholders, some of whom are on both sides of the divide (GhanaWeb, 2009). Corruption is a significant obstacle to doing
business in Nigeria. Corruption is criminalised primarily by the criminal code. Accepting or giving gifts ('gratifications') as well as facilitation payments are illegal, and individuals can be
penalised with up to seven years imprisonment (GAN, 2015). Despite a strong legal framework, Nigeria is unable to prevent corruption: in practice, gifts, bribery and facilitation payments are the
norm. While corruption risks are pervasive throughout all institutions, it has been found to be most prevalent among the Nigeria Police (Transparency International, 2013). This is more evident in the commercial transportation business. The cost of these bribes and delays are passed from the driver to the trader, then to the shopkeeper and
ultimately to the consumer; what begins with a corrupt official taking a few extra naira from driver or directly from the trader passing through the trade routes ends with millions of people paying inflated
prices they can hardly afford for essential goods. This lack of checks and informal payments create
market uncertainty and raises food price volatility and as such undermine the livelihood of the traders and consumers. In Ogun State, traders encounter series of
roadblocks mostly set up by law enforcement agencies (such as Police, Road Safety, National Drug Law Enforcement Agency, Customs, Quarantine Services e.t.c.) in the course of their
business activities. In a study conducted by Schuhmann in 2015, a trader mentioned that he encountered fifteen check points leading to Obada/Idi-Emi market and that in some days he
paid more than what he earned. Apart from non-tariff payments often called facilitation fees (‘egunje’); the traders often experience delays and harassments. The drivers are not also left out as
their attitude such as overloading their trucks, failure to have the right documents and lack of professional demeanor usually make them victims to same ordeal from the law enforcement agencies.
On a broader sense, non-tariff payments along trade routes limit the growth of the economy as the food surpluses in the rural areas are frequently hindered from getting to urban areas where they are needed. This leads to poor returns to small-scale farmers due to low demand resulting to rural poverty, inadequate agricultural raw materials for agro allied companies leading to increase
unemployment and food insecurity as a result of poor access to food. Therefore, curbing informal payments along the trade routes will offer benefits to farmers, traders, consumers and the
governments. Such benefits include farmers making more money from meeting rising demands

Nigerian Journal of Rural Sociology Vol. 16, No. 1, June 2015
107
for their products; consumers getting cheaper
access to food as well as job creation as a result of a growing agricultural sector and ultimately government will be better able to deal with the issue of food insecurity. Since these cannot be
achieved without an in-depth knowledge of the nature of the malaise, it is therefore essential for Nigerians to understand which stakeholders are responsible for perpetuating corruption on the trade routes and which stakeholders are responsible for eliminating it, in order to focus efforts of civil society on holding these parties accountable. Efforts at measuring corruption have included
estimates of corruption based on surveys of perception (Olken and Barron, 2012), surveys on bribe-payers (Svensson, 2003) and through direct observation (Olken and Barron, 2009). While these
approaches have been instrumental in bringing issues on corruption to the front burner, they are not without certain shortfalls. For instance surveys of perception have been criticised for not always reflecting the real context of a situation or complexity of the actual level or experience of corruption within a country. This is because, the best perception-based surveys do not always
account for indirect effects of subjective factors, and their margins of error are large when compared with actual corruption (Bertrand and Mullainathan, 2001). Also, the surveys of bribe-payers and direct
observation are deficient in that there is likely to be common unobservable factors affecting the probability of being asked for a bribe and the probability of offering a bribe. This is sequel to the
fact that the presence of researcher may cause people to act or respond differently or as result of bias in observation from the researcher’s interpretation (Lee and Guven, 2013)..
It is against these shortfalls that recent approaches in the measure of corruption are now taking a paradigm shift to the use of technology and especially Information and Communication
Technology (ICT). For instance, the Ogun State Government through the office of the Special Adviser Millennium Development Goals, the Ogun State Council of Chambers of Commerce, Industry,
Mines and Agriculture (OGUNCCIMA) and the Deutsche Gesellschaft für Internationale Zusammenarbeit (GIZ) in collaboration with a consortium of civil society organisations, faith-based organisations, mobile network operators, media and other committed actors from the public and private have embarked on a crowd sourcing ICT application called Trade Route Incident
Mapping Incident System (TRIMS) to check non-tariff payments by traders along trade routes in the State. TRIMS is a crowd-sourced facility for traders
and general citizens to send anonymous, coded text messages to a pubic website (www.trimsonline.org)
on non-tariff barriers encountered leading to delays
and increase cost of essential goods such as perishable food items and agricultural goods. The coded messages on agency involved, costs incurred, time lost, sex of the trader, forms of
harassment and location of the incidence are sent to 7447 or 09030007447. The messages are then uploaded on the website to provide information on incidents along the trade routes. As a pilot project that has been on since 2013 it has now becomes necessary to look into its performance. This study therefore examines TRIMS evaluation of non-tariff payments among traders in Ogun state.
The main objective of the study was to examine TRIMS evaluation of non-tariff payments among traders in Ogun state. The specific objectives of the study were to:
1. identify agencies responsible for demanding non-tariff payments from traders along trade routes in the study area
2. determine the volume of non-tariff payments involved
3. ascertain how much time is lost by traders as a result of these trade barriers in the course of doing business and
4. describe the forms of harassment encountered by traders along the trade routes.
Hypothesis of the study
There is no significant relationship between time
lost through trade barriers and non-tariff payments.
METHODOLOGY Content analysis of the project website was
used to obtain data relating to research objectives of the study. According to Krippendorff (1980), content analysis is a research technique for making replicable and valid inferences from data to their
context. The crowd-sourced data on statistics section of the home page of the website was chosen as the unit of analysis as it covers all the content categories examined in this study. The content
categories include: agencies concerned, costs incurred, time lost, sex of the trader, forms of harassment and location of the incidence. The data on statistics page was reviewed and content
categories counted on weekly basis within the twenty four (24) weeks starting from 20th March, 2015 (when the website became active) to 10th September, 2015. The population of the study included traders and transporters who ply the trade routes of the state. The sample size represented all the active users from the 20 Local Government Areas who
sent queries to the website at a particular period. Data was analysed using descriptive statistics (means, frequencies and percentages) and Pearson Product Moment Correlation (PPMC).

Nigerian Journal of Rural Sociology Vol. 16, No. 1, June 2015
108
RESULTS AND DISCUSSION
Incidence of non-tariff payments according to
sex of respondents Table 1 shows that 60.7% of male and 39.3% of female encountered incident of non-tariff
payments along the trade routes. This result may suggest that men are more vulnerable to the plight of non-tariff payments hence, they report the incidences more on TRIMS. The result reinforces earlier findings that women are less likely to take part in corrupt transactions than men, are less involved in bribery and that there is worldwide gender difference in tolerance for corruption
(Dollar et al., 1999; Swamy et al. 2001). It implies that men are likely to be involved in speeding up the process and, therefore, experience less delay in the course of doing business along the trade routes
than their female counterparts. Table 1: Distribution of respondents based on sex
Sex of users
Frequency Percentage Mean S.D
Male 748 60.7 31.2 47.8 Female 484 39.3 20.2 30.4 Total 1232 100.0
Source: TRIMS, 2015
Incidence of non-tariff payments based on
government agencies
The result in Table 2 shows that majority (67.8%) of incidence of non-tariff payments from trade barriers were occasioned by the Nigerian
Police Force. The result further shows that on the average the Nigerian Police Force, Road Safety Corps, Local Government Authority were responsible for causing 34.8, 6.4 and 4.2 trade
barriers respectively on weekly basis. The finding is supported by USAID (2014) that revealed the presence of an average of six (6) checkpoints at every 100km in West African countries. The
presence of these multiple checkpoints constitute trade barriers that will invariably discourage itch-free movement of people, goods and services along trade routes in Ogun State, Nigeria.
Table 2: Distribution of incidence of non-tariff payments based on government agency
Agency Freq Perc Mean S.D
Customs 36 3.0 1.5 2.4 Police 835 67.8 34.8 49.6
Road Safety Corps 153 12.4 6.4 8.4 Local Government Authority
101 8.2 4.2 7.6
Others (NDLEA, Immigrations, Nigerian Army
107 8.6 4.5 6.0
TOTAL 1232
Source: TRIMS, 2015
Volume of non-tariff payment based on
governmental agencies Table 3 presents the amount of bribes that road users parted with-in the course of their trading activities. The leading government agency in the
collection of the graft was the Nigerian Police (44.6%), followed by Road Safety Corps (31.1%). The average bribes per week were N18,091.42, N12,639.63, N4,604.17, N3,800.00 and N1,408.30 for the Nigeria Police, Road Safety Corps, Local Government Authority, other agencies and Nigeria Customs Services respectively. This finding is corroborated by CLEEN Foundation (2012) that
rated men of the Nigeria Police as the number one bribe taking public officials in Nigeria. Others in the report after Nigeria Police were; Immigration, Custom, Prison Services and Road Safety Corps.
The result suggests that instead of being a crime-prevention measure, checkpoints in Ogun state have become tools for extorting money from road users. This type of corruption which affects mainly the lower income groups may lead to increase in the cost of doing business and push up the price of foods that eventually get to the market, stifle rural development and eventually lead to rural poverty in
the study area. Table 3: Distribution of total amount of non-tariff payments according to agencies
Agency Amount
(N)
Perc Mean S.D
Customs 33,800 3.5 1,408.3 3202.7 Police 434,194 44.6 18,091.4 33032.6 Road Safety Corps
303,351 31.1 12,639.6 23,551.7
Local Government Authority
110,500 11.4 4,604.1 9702.8
Others
(NDLEA, Immigrations, Nigerian Army
91,202 9.4 3,800.1 6922.9
TOTAL 973,047 100.0
Source: TRIMS, 2015
Time lost from trade barriers along trade routes
Table 4 shows time lost while negotiating non-
tariff payment by road users along the trade routes. From the result, 57.2% of the respondents recorded less than thirty (30) minutes time lost, 31.2% recorded up to one hour time lost and 11.6% recorded more than one hour time lost. The delays as a result of trade barriers can lead to reduced revenue from the loss of man-hour or diminished profits especially on perishable goods
that require getting to the market at the right time and in the best condition.
Nigerian Journal of Rural Sociology Vol. 16, No. 1, June 2015
109
Table 4: Categorisation of time-lost from trade
barriers
Time lost Freq Perc Mean SD
Less than thirty minutes
660 57.2 27.5 36.2
Up to one hour 360 31.2 15.0 23.3 More than one
hour
134 11.6 5.6 7.8
TOTAL 1154 100.0
Source: TRIMS, 2015
Forms of harassment arising from non-tariff
payments among traders
Table 5 reveals the forms of harassment experienced from government officials along trade routes in Ogun State. The result shows that
majority (54.6%) of the respondents reported one form of harassment or the other; 31.5% reported physical harassment, 20.4% reported verbal harassment and 2.7% reported sexual harassment.
The result indicates that getting goods to the final destination is not a smooth process but an ordeal for both traders and transporters in Ogun state. This type of situation may in the long run impair trade across towns in the state as the business activities become unattractive and uncompetitive. Table 5: Distribution of forms of harassment
encountered by traders in doing business
Type of harassment
Freq Perc Mean SD
No harassment
526 45.4 21.9 29.7
Verbal
harassment
236 20.4 9.8 16.9
Physical harassment
365 31.5 15.2 21.6
Sexual
harassment
31 2.7 1.3 2.3
TOTAL 1154 100.0
Source: TRIMS, 2015
Hypothesis testing Relationship between time lost through trade
barriers and non-tariff payments
The result of Person Product Moment Correlation in Table 6 shows a significant
association between time lost and non-tariff payments. The PPMC coefficient of 0.88 indicates a strong correlation between the two variables. It implies that time lost along trade barrier depends
on amount of non-tariff payments. This is possible as the traders may want to resist such payments and fight for their right and in the process experience much delay.
Table 6: Pearson Product Moment Correlation
showing significant relationship between time lost and non-tariff payment
Mean r-value
p-value
Decision
Time lost 29.82 0.88 0.001 S Non-tariff
payment
40543.63
Source: TRIMS, 2015
CONCLUSION AND RECOMMENDATIONS
There is no gainsaying the fact that TRIMS has marked an innovative approach in the study of corruption and sharp practices in Nigeria. The Nigerian Police was found to be a prominent government agency in collection of graft in the
study area. The volume of non-tariff payments involved and time lost by traders as a result of trade barrier were found to be substantial. Also, the traders reported to have experienced one form of
harassment or the other in the course of doing business. The study found a strong positive correlation between time lost as a result of delays from trade barriers and non-tariff payments. This pointed to the fact that the traders were aware of their rights to free movement by offering some resistance and might just be helpless to this social malaise of corruption. Therefore, any efforts
channeled at reducing the time lost will inevitably have direct effect on the ease of doing business in the study area. Thus special task force against trade barriers should be constituted in the study area. The
task force will among others monitor the activities of government officials along the trade routes. Similarly, anti-graft agencies in the study area should be empowered to promptly apprehend
officers responsible in any case reported to the website so as to serve as deterrent to other corrupt officers. This will remove existing bottlenecks in doing business and stimulate economic growth
toward achieving food security.
REFERENCES
Bertrand, M. and S. Mullainathan 2001. ‘Do
People Mean What They Say?
Implications for Subjective Survey
Data.” American Economic Review 91 (2): 67-72
CLEEN Foundation, 2012. Nigeria Police is number one bribe-takers. Retrieved on October 3rd, 2015 from URL http://www.trends.com.ng/2012/07/nigeria-police-number-bribe-takers-cleen-foundation-report
Dollar, D., R. Fismand and R. Gatti 1999. Are women really the ‘fairer’ sex? Corruption
and women in government. Policy research report on gender and

Nigerian Journal of Rural Sociology Vol. 16, No. 1, June 2015
110
development Working paper series
No. 4 GAN, 2015. Business corruption in Nigeria-
Business anti-corruption portal. Retrieved on May 2nd, 2016, from www.business-
anti-corruption.com Ghana Web, 2009. The role of stakeholders in
fighting corruption. Retrieved on May 2nd, 2016, from http://www.mail.ghanaweb.com>features>articles
Krippendorff, K. 1980 Content analysis: An
Introduction to its Methodology. Sage
Publications, London, 1980. Lee, W. and C. Guven 2013. Engaging in
corruption: the influence of cultural values and contagion effects at the micro
level. IZA Discussion Paper No. 7685 Olken, B. and P. Barron 2009. The Simple
Economics of Extortion: Evidence from
Trucking in Aceh. Journal of Political
Economy 117(3): 417-452. Schuhmann, F. 2015. Trade route incident mapping
systems borderless 2015 conference. Retrieved September 24th, 2015, from
http:// http://www.borderlesswa.com/sites Swamy, A., S. Knack, Y. Lee and O. Azfar 2001.
Gender and corruption. Journal of
Development Economics, 64: 22-55
Svensson, J. 2003. Who must pay bribes and how much? Evidence from a cross section of firms. The Quarterly Journal of
Economics 118(1): 207-230.
Transparency International, 2013. The anti-corruption catalyst: realising the MDGs by 2015. Retrieved September 24th, 2015, from URL http://www.transparency.org
TRIMS, 2015. www.trimsonline.org USAID, 2014. Report on road harassments in West
Africa. Retrieved October 3rd, 2015, from http://www.westafricagateway.org