National Assessment Program : Civics and Citizenship Education 2010 : year 6 and year 10 : technical...
104
National Assessment Program – Civics and Citizenship Technical Report 2010
Transcript of National Assessment Program : Civics and Citizenship Education 2010 : year 6 and year 10 : technical...

NationalAssessmentProgram –Civics andCitizenshipTechnical
Report
2010


EveJulNicWo Sep
eline Gebian Fraillcole Werolfram Sc
ptember
Nation
Civi
bhardt on rnert chulz
r 2011
nal Ass
ics and
Year 6
TECHN
sessm
d Citize
6 and
NICAL
ent Pr
enship
Year 1
REPOR
rogram
p 2010
10
RT
m –

© Australian Curriculum, Assessment and Reporting Authority 2011 This work is copyright. You may download, display, print and reproduce this material in unaltered form only (retaining this notice) for your personal, non-commercial use or use within your organisation. All other rights are reserved. Requests and inquiries concerning reproduction and rights should be addressed to: ACARA Copyright Administration, ACARA Level 10, 255 Pitt Street Sydney NSW 2000 Email: [email protected]
The authors wish to acknowledge the expert contributions of Martin Murphy to this technical report, which took the form of developing text that was integrated into this document, and reviewing and editing sections of this report.
Main cover image: Top left-hand image, “College Captains at ANZAC Day memorial service, Nagle College, Bairnsdale, 25 April 2008” Top right-hand image, courtesy of ACARA Bottom left-hand image, courtesy of ACER

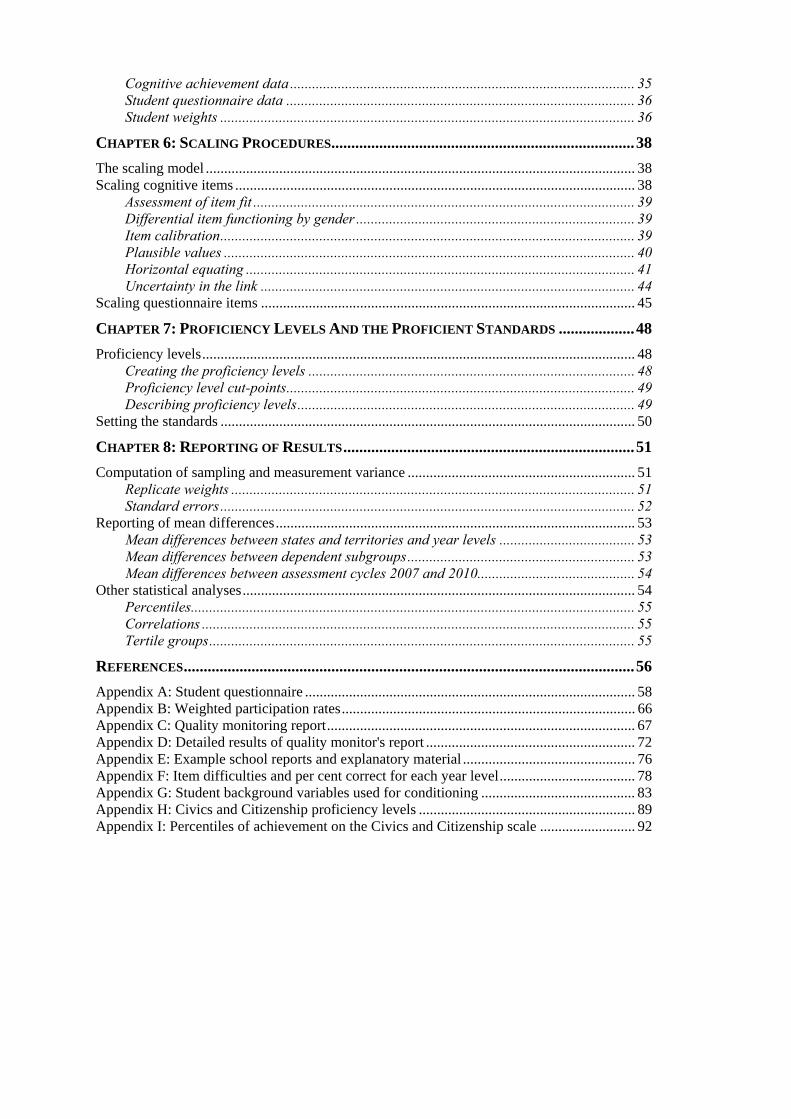
CONTENTS
CHAPTER 1: INTRODUCTION .......................................................................................... 1 National Assessment Program – Civics and Citizenship ............................................................. 1 Participants .................................................................................................................................. 2 The assessment format ................................................................................................................ 2 Reporting of the assessment results ............................................................................................. 2 Structure of the technical report .................................................................................................. 2
CHAPTER 2: ASSESSMENT FRAMEWORK AND INSTRUMENT DEVELOPMENT .............. 4 Developing the assessment framework ....................................................................................... 4 Item development ........................................................................................................................ 6 Field trial ..................................................................................................................................... 7 Main study cognitive instruments ............................................................................................... 8 Score guide .................................................................................................................................. 9 Student questionnaire ................................................................................................................ 11 Student background information ............................................................................................... 11
CHAPTER 3: SAMPLING AND WEIGHTING ................................................................... 13 Sampling .................................................................................................................................... 13
First sampling stage .......................................................................................................... 15 Second sampling stage ...................................................................................................... 16
Weighting .................................................................................................................................. 17 First stage weight .............................................................................................................. 18 Second stage weight .......................................................................................................... 19 Third stage weight ............................................................................................................. 19 Overall sampling weight and trimming ............................................................................. 19
Participation rates ...................................................................................................................... 20 Unweighted response rates including replacement schools .............................................. 20 Unweighted response rates excluding replacement schools ............................................. 20 Weighted response rates including replacement schools .................................................. 21 Weighted response rates excluding replacement schools .................................................. 21 Reported response rates .................................................................................................... 21
CHAPTER 4: DATA COLLECTION PROCEDURES .......................................................... 25 Contact with schools.................................................................................................................. 26 The NAP – CC Online School Administration Website ........................................................... 26
The collection of student background information ............................................................ 27 Information management ........................................................................................................... 27 Within-school procedures .......................................................................................................... 27
The school contact officer ................................................................................................. 27 The assessment administrator ........................................................................................... 28
Assessment administration ........................................................................................................ 28 Quality control ........................................................................................................................... 29 Online scoring procedures and scorer training .......................................................................... 30 School reports ............................................................................................................................ 30
CHAPTER 5: DATA MANAGEMENT .............................................................................. 32 Sample database ........................................................................................................................ 32 School database ......................................................................................................................... 32 Student tracking database .......................................................................................................... 32 Final student database ................................................................................................................ 33
Scanning and data-entry procedures ................................................................................. 33 Data cleaning .................................................................................................................... 33 Student background data ................................................................................................... 34
Cognitive achievement data .............................................................................................. 35 Student questionnaire data ............................................................................................... 36 Student weights ................................................................................................................. 36
CHAPTER 6: SCALING PROCEDURES............................................................................ 38 The scaling model ..................................................................................................................... 38 Scaling cognitive items ............................................................................................................. 38
Assessment of item fit ........................................................................................................ 39 Differential item functioning by gender ............................................................................ 39 Item calibration ................................................................................................................. 39 Plausible values ................................................................................................................ 40 Horizontal equating .......................................................................................................... 41 Uncertainty in the link ...................................................................................................... 44
Scaling questionnaire items ...................................................................................................... 45
CHAPTER 7: PROFICIENCY LEVELS AND THE PROFICIENT STANDARDS ................... 48 Proficiency levels ...................................................................................................................... 48
Creating the proficiency levels ......................................................................................... 48 Proficiency level cut-points ............................................................................................... 49 Describing proficiency levels ............................................................................................ 49
Setting the standards ................................................................................................................. 50
CHAPTER 8: REPORTING OF RESULTS ......................................................................... 51 Computation of sampling and measurement variance .............................................................. 51
Replicate weights .............................................................................................................. 51 Standard errors ................................................................................................................. 52
Reporting of mean differences .................................................................................................. 53 Mean differences between states and territories and year levels ..................................... 53 Mean differences between dependent subgroups .............................................................. 53 Mean differences between assessment cycles 2007 and 2010........................................... 54
Other statistical analyses ........................................................................................................... 54 Percentiles......................................................................................................................... 55 Correlations ...................................................................................................................... 55 Tertile groups .................................................................................................................... 55
REFERENCES ................................................................................................................. 56 Appendix A: Student questionnaire .......................................................................................... 58 Appendix B: Weighted participation rates ................................................................................ 66 Appendix C: Quality monitoring report .................................................................................... 67 Appendix D: Detailed results of quality monitor's report ......................................................... 72 Appendix E: Example school reports and explanatory material ............................................... 76 Appendix F: Item difficulties and per cent correct for each year level ..................................... 78 Appendix G: Student background variables used for conditioning .......................................... 83 Appendix H: Civics and Citizenship proficiency levels ........................................................... 89 Appendix I: Percentiles of achievement on the Civics and Citizenship scale .......................... 92
TABLES
Table 2.1: Four aspects of the assessment framework and their concepts and processes .............. 5 Table 2.2: Booklet design for NAP – CC 2010 field trial and main assessment ........................... 8 Table 3.1: Year 6 and Year 10 target population and designed samples by state and territory ... 15 Table 3.2: Year 6 breakdown of student exclusions according to reason by state and territory .. 17 Table 3.3: Year 10 breakdown of student exclusions according to reason by state and
territory ....................................................................................................................... 17 Table 3.4: Year 6 numbers and percentages of participating schools by state and territory ........ 23 Table 3.5: Year 10 numbers and percentages of participating schools by state and territory ...... 23 Table 3.6: Year 6 numbers and percentages of participating students by state and territory ....... 24 Table 3.7: Year 10 numbers and percentages of participating students by state and territory ..... 24 Table 4.1: Procedures for data collection ..................................................................................... 25 Table 4.2: The suggested timing of the assessment session. ........................................................ 29 Table 5.1: Variable definitions for student background data ....................................................... 34 Table 5.2: Transformation rules used to derive student background variables for reporting ....... 35 Table 5.3: Definition of the constructs and data collected via the student questionnaire ............ 37 Table 6.1: Booklet means in 2007 and 2010 from different scaling models ................................ 40 Table 6.2: Description of questionnaire scales............................................................................. 46 Table 6.3: Transformation parameters for questionnaire scales................................................... 47 Table 7.1: Proficiency level cut-points and percentage of Year 6 and Year 10 students in
each level in 2010 ....................................................................................................... 49 Table 8.1: Equating errors on percentages between 2007 and 2010 ............................................ 55
FIGURES
Figure 2.1: Equating method from 2010 to 2004 ............................................................................ 9 Figure 2.2: Example item and score guide .................................................................................... 10 Figure 6.1: Relative item difficulties in logits of horizontal link items for Year 6 between
2007 and 2010 ............................................................................................................. 42 Figure 6.2: Relative item difficulties in logits of horizontal link items for Year 10 between
2007 and 2010 ............................................................................................................. 42 Figure 6.3: Discrimination of Year 6 link items in 2007 and 2010 ............................................... 43 Figure 6.4: Discrimination of Year 10 link items in 2007 and 2010 ............................................. 43


NAP – CC 2010 Technical Report 1. Introduction
1
CHAPTER 1: INTRODUCTION
Julian Fraillon
In 1999, the State, Territory and Commonwealth Ministers of Education, meeting as the tenth Ministerial Council on Education, Employment, Training and Youth Affairs (MCEETYA)1, agreed to the National Goals for Schooling in the Twenty-first Century. Subsequently, MCEETYA agreed to report on progress toward the achievement of the National Goals on a nationally-comparable basis, via the National Assessment Program (NAP). As part of NAP, a three-yearly cycle of sample assessments in primary science, civics and citizenship and ICT was established.
The first cycle of the National Assessment Program – Civics and Citizenship (NAP – CC) was held in 2004 and provided the baseline against which future performance would be compared. The second cycle of the program was conducted in 2007 and was the first cycle where trends in performance were able to be examined. The most recent assessment was undertaken in 2010. This report describes the procedures and processes involved in the conduct of the third cycle of the NAP – CC.
National Assessment Program – Civics and Citizenship The first two cycles of NAP – CC were conducted with reference to the NAP – CC Assessment Domain.
In 2008, it was decided to revise the NAP – CC Assessment Domain. It was replaced by the NAP – CC Assessment Framework, developed in consultation with the 2010 NAP – CC Review Committee. The assessment framework extends the breadth of the assessment domain in light of two key curriculum reforms:
• the Statements of Learning for Civics and Citizenship (SOL – CC; Curriculum Corporation, 2006); and
• the implicit and explicit values, attitudes, dispositions and behaviours in the Melbourne Declaration on Educational Goals for Young Australians (MCEETYA, 2008).
The assessment framework consists of four discrete aspects which are further organised according to their content. The four aspects are:
• Aspect 1 – civics and citizenship content; • Aspect 2 – cognitive processes for understanding civics and citizenship; • Aspect 3 – affective processes for civics and citizenship; and • Aspect 4 – civics and citizenship participation.
Aspects 1 and 2 were assessed through a cognitive test of civics and citizenship. Aspects 3 and 4 were assessed with a student questionnaire. 1 Subsequently the Ministerial Council on Education, Early Childhood Development and Youth Affairs (MCEECDYA).
NAP – CC 2010 Technical Report 1. Introduction
2
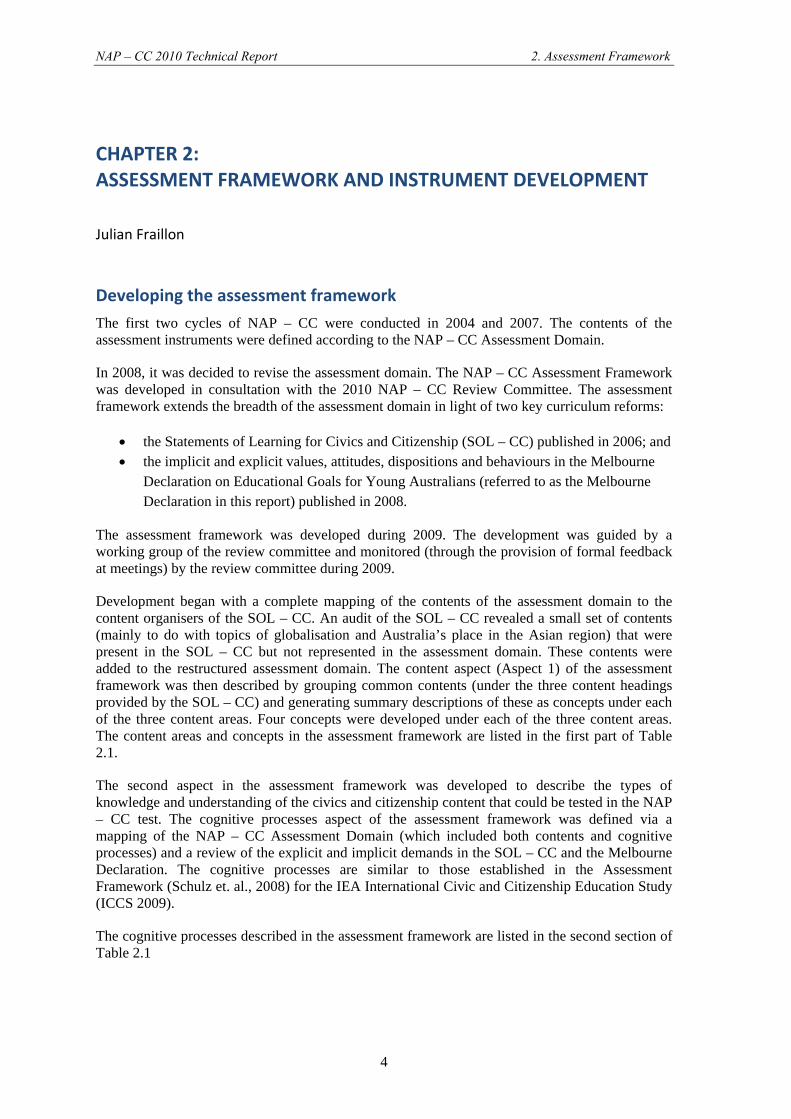
Participants Schools from all states and territories, and from the government, Catholic and independent sectors, participated. Data were gathered from 7,246 Year 6 students from 335 schools and 6,409 Year 10 students from 312 schools.
The assessment format The students’ regular classroom teachers administered the assessment between 11 October and 1 November 2010. The assessment comprised a pencil-and-paper test with multiple-choice and open-ended items, and a questionnaire. The cognitive assessment booklets were allocated so that a student in each class completed one of nine different test booklets. The test contents varied across the booklets, but the same questionnaire (one for Year 6 and one for Year 10) was included in each booklet at each year level. The questionnaires for Years 6 and 10 were largely the same. The Year 10 questionnaire included some additional questions that were asked only at that year level.
Students were allowed no more than 60 minutes at Year 6 and 75 minutes at Year 10 to complete the pencil-and-paper test and approximately 15 minutes for the student questionnaire.2
Reporting of the assessment results The results of the assessment were reported in the NAP – CC Years 6 and 10 Report 2010.
Mean test scores and distributions of scores were shown at the national level and by state and territory. The test results were also described in terms of achievement against the six proficiency levels described in the NAP – CC scale and against the Proficient Standard for each year level. Achievement by known subgroups (such as by gender and Indigenous or non-Indigenous status) was also reported.
The questionnaire results were reported both in terms of responses to individual items (percentages of students selecting different responses) and, where appropriate, scores on groups of items that formed common scales. Some relevant subgroup comparisons were made for questionnaire data, as were measures of the association between test scores and selected attitudes and behaviours measured by the questionnaire.
Structure of the technical report This report describes the technical aspects of NAP – CC 2010 and summarises the main activities involved in the data collection, the data collection instruments and the analysis and reporting of the data.
Chapter 2 summarises the development of the assessment framework and describes the process of item development and construction of the instruments.
Chapter 3 reviews the sample design and describes the sampling process. This chapter also describes the weighting procedures that were implemented to derive population estimates.
Chapter 4 summarises the data collection procedures, including the quality control program.
Chapter 5 summarises the data management procedures, including the cleaning and coding of the data.
2 Students could use as much time as they required for completing the questionnaire, but it was designed not to take more than 15 minutes for the majority of students.

NAP – CC 2010 Technical Report 1. Introduction
3
Chapter 6 describes the scaling procedures, including equating, item calibration, drawing of plausible values and the standardisation of student scores.
Chapter 7 examines the process of standards-setting and creation of proficiency levels used to describe student achievement.
Chapter 8 discusses the reporting of student results, including the procedures used to estimate sampling and measurement variance, and the calculation of the equating errors used in tests of significance for differences across cycles.
NAP – CC 2010 Technical Report 2. Assessment Framework
4
CHAPTER 2: ASSESSMENT FRAMEWORK AND INSTRUMENT DEVELOPMENT
Julian Fraillon
Developing the assessment framework The first two cycles of NAP – CC were conducted in 2004 and 2007. The contents of the assessment instruments were defined according to the NAP – CC Assessment Domain.
In 2008, it was decided to revise the assessment domain. The NAP – CC Assessment Framework was developed in consultation with the 2010 NAP – CC Review Committee. The assessment framework extends the breadth of the assessment domain in light of two key curriculum reforms:
• the Statements of Learning for Civics and Citizenship (SOL – CC) published in 2006; and • the implicit and explicit values, attitudes, dispositions and behaviours in the Melbourne
Declaration on Educational Goals for Young Australians (referred to as the Melbourne Declaration in this report) published in 2008.
The assessment framework was developed during 2009. The development was guided by a working group of the review committee and monitored (through the provision of formal feedback at meetings) by the review committee during 2009.
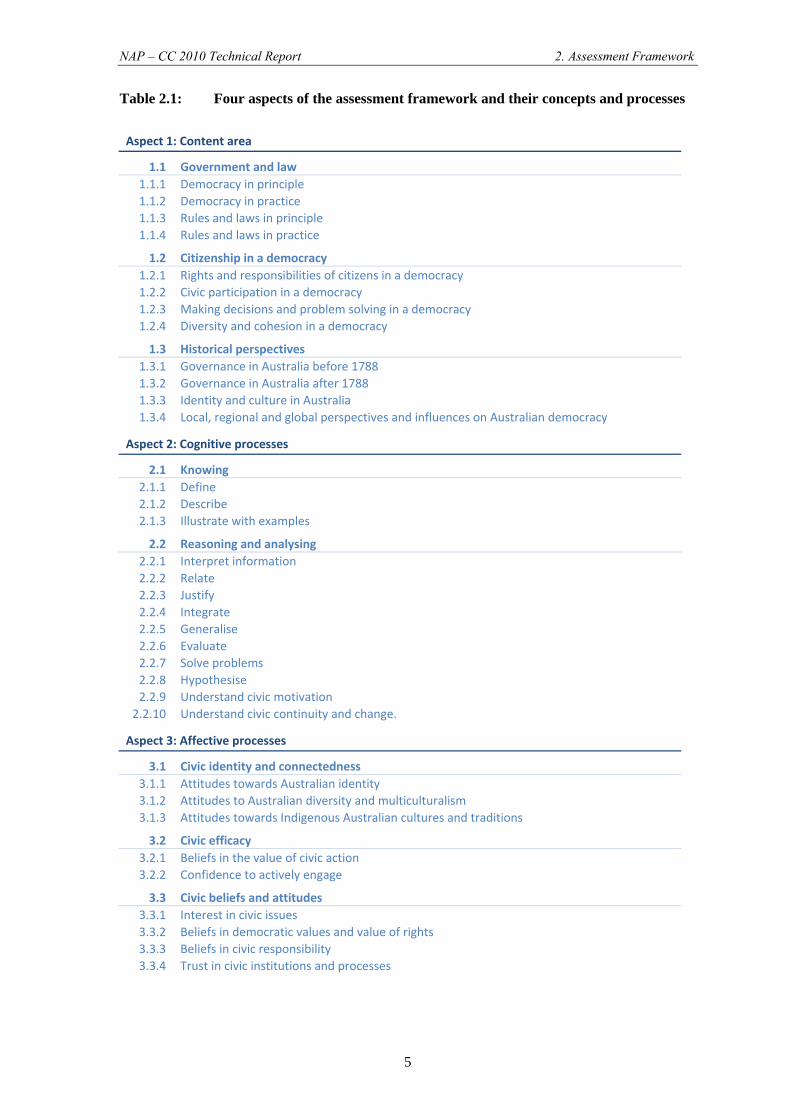
Development began with a complete mapping of the contents of the assessment domain to the content organisers of the SOL – CC. An audit of the SOL – CC revealed a small set of contents (mainly to do with topics of globalisation and Australia’s place in the Asian region) that were present in the SOL – CC but not represented in the assessment domain. These contents were added to the restructured assessment domain. The content aspect (Aspect 1) of the assessment framework was then described by grouping common contents (under the three content headings provided by the SOL – CC) and generating summary descriptions of these as concepts under each of the three content areas. Four concepts were developed under each of the three content areas. The content areas and concepts in the assessment framework are listed in the first part of Table 2.1.
The second aspect in the assessment framework was developed to describe the types of knowledge and understanding of the civics and citizenship content that could be tested in the NAP – CC test. The cognitive processes aspect of the assessment framework was defined via a mapping of the NAP – CC Assessment Domain (which included both contents and cognitive processes) and a review of the explicit and implicit demands in the SOL – CC and the Melbourne Declaration. The cognitive processes are similar to those established in the Assessment Framework (Schulz et. al., 2008) for the IEA International Civic and Citizenship Education Study (ICCS 2009).
The cognitive processes described in the assessment framework are listed in the second section of Table 2.1
NAP – CC 2010 Technical Report 2. Assessment Framework
5
Table 2.1: Four aspects of the assessment framework and their concepts and processes
Aspect 1: Content area
1.1 Government and law 1.1.1 Democracy in principle 1.1.2 Democracy in practice 1.1.3 Rules and laws in principle 1.1.4 Rules and laws in practice
1.2 Citizenship in a democracy 1.2.1 Rights and responsibilities of citizens in a democracy 1.2.2 Civic participation in a democracy 1.2.3 Making decisions and problem solving in a democracy 1.2.4 Diversity and cohesion in a democracy
1.3 Historical perspectives 1.3.1 Governance in Australia before 1788 1.3.2 Governance in Australia after 1788 1.3.3 Identity and culture in Australia 1.3.4 Local, regional and global perspectives and influences on Australian democracy
Aspect 2: Cognitive processes
2.1 Knowing 2.1.1 Define 2.1.2 Describe 2.1.3 Illustrate with examples
2.2 Reasoning and analysing 2.2.1 Interpret information 2.2.2 Relate 2.2.3 Justify 2.2.4 Integrate 2.2.5 Generalise 2.2.6 Evaluate 2.2.7 Solve problems 2.2.8 Hypothesise 2.2.9 Understand civic motivation 2.2.10 Understand civic continuity and change.
Aspect 3: Affective processes
3.1 Civic identity and connectedness 3.1.1 Attitudes towards Australian identity 3.1.2 Attitudes to Australian diversity and multiculturalism 3.1.3 Attitudes towards Indigenous Australian cultures and traditions
3.2 Civic efficacy 3.2.1 Beliefs in the value of civic action 3.2.2 Confidence to actively engage
3.3 Civic beliefs and attitudes 3.3.1 Interest in civic issues 3.3.2 Beliefs in democratic values and value of rights 3.3.3 Beliefs in civic responsibility 3.3.4 Trust in civic institutions and processes
NAP – CC 2010 Technical Report 2. Assessment Framework
6
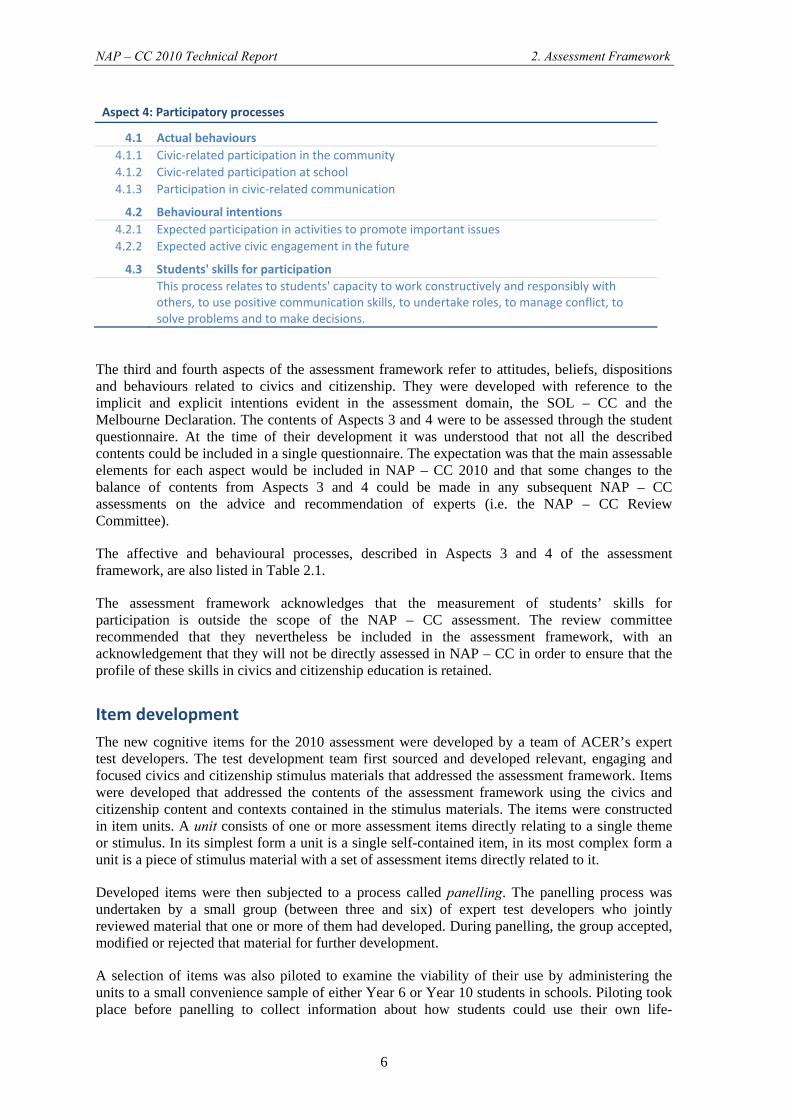
Aspect 4: Participatory processes
4.1 Actual behaviours 4.1.1 Civic‐related participation in the community 4.1.2 Civic‐related participation at school 4.1.3 Participation in civic‐related communication
4.2 Behavioural intentions 4.2.1 Expected participation in activities to promote important issues 4.2.2 Expected active civic engagement in the future
4.3 Students' skills for participation
This process relates to students' capacity to work constructively and responsibly with others, to use positive communication skills, to undertake roles, to manage conflict, to solve problems and to make decisions.
The third and fourth aspects of the assessment framework refer to attitudes, beliefs, dispositions and behaviours related to civics and citizenship. They were developed with reference to the implicit and explicit intentions evident in the assessment domain, the SOL – CC and the Melbourne Declaration. The contents of Aspects 3 and 4 were to be assessed through the student questionnaire. At the time of their development it was understood that not all the described contents could be included in a single questionnaire. The expectation was that the main assessable elements for each aspect would be included in NAP – CC 2010 and that some changes to the balance of contents from Aspects 3 and 4 could be made in any subsequent NAP – CC assessments on the advice and recommendation of experts (i.e. the NAP – CC Review Committee).
The affective and behavioural processes, described in Aspects 3 and 4 of the assessment framework, are also listed in Table 2.1.
The assessment framework acknowledges that the measurement of students’ skills for participation is outside the scope of the NAP – CC assessment. The review committee recommended that they nevertheless be included in the assessment framework, with an acknowledgement that they will not be directly assessed in NAP – CC in order to ensure that the profile of these skills in civics and citizenship education is retained.
Item development The new cognitive items for the 2010 assessment were developed by a team of ACER’s expert test developers. The test development team first sourced and developed relevant, engaging and focused civics and citizenship stimulus materials that addressed the assessment framework. Items were developed that addressed the contents of the assessment framework using the civics and citizenship content and contexts contained in the stimulus materials. The items were constructed in item units. A unit consists of one or more assessment items directly relating to a single theme or stimulus. In its simplest form a unit is a single self-contained item, in its most complex form a unit is a piece of stimulus material with a set of assessment items directly related to it.
Developed items were then subjected to a process called panelling. The panelling process was undertaken by a small group (between three and six) of expert test developers who jointly reviewed material that one or more of them had developed. During panelling, the group accepted, modified or rejected that material for further development.
A selection of items was also piloted to examine the viability of their use by administering the units to a small convenience sample of either Year 6 or Year 10 students in schools. Piloting took place before panelling to collect information about how students could use their own life-
NAP – CC 2010 Technical Report 2. Assessment Framework
7
experiences (within and out of school) to answer questions based largely on civic knowledge and about how students could express reasoning on civics and citizenship issues using short extended response formats.
Two ACER staff members also ran piloting test sessions with Indigenous students in selected schools in Western Australia and the Northern Territory. The students in these sessions completed a selection of items from the 2007 NAP – CC school release materials and discussed their experience of completing the questions with the ACER staff members. Information from these sessions was used to inform test developers about the perspectives that the Indigenous students were bringing to the NAP – CC assessment materials. Feedback from these sessions was presented to the review committee.
The coherence with and coverage of the assessment framework by the item set was closely monitored through an iterative item development process. Each cognitive item was referenced to a single concept in Aspect 1 of the assessment framework and to one of the two main organising processes (knowing or reasoning and analysing) in Aspect 2 of the framework.
Item response types included: compound dual choice (true/false), multiple choice, closed constructed and extended constructed item types. The number of score points allocated to items varied. Dual and multiple choice items had a maximum score of one point. Closed and extended constructed response items were each allocated a maximum of between one and three score points.
Consultation with outside experts and stakeholders occurred throughout the item development process, and before and after trialling, draft and revised versions of the items were shared with the review committee and the Performance Measurement and Reporting Taskforce (PMRT)3.
Field trial A field trial was conducted in March 2010. At Year 6, 50 schools participated with 1,094 students completing the assessments. At Year 10, 48 schools participated with 1,005 students completing the assessments. The sample of schools was a representative random sample, drawn from all sectors from the three states of Victoria, New South Wales and Queensland.
Field trial data were analysed in a systematic way to determine the degree to which the items measured civics and citizenship proficiency according to both the NAP – CC scale and the assessment framework. The review committee then reviewed the results from the field trial data analysis.
In total, 230 items were used in the field trial, 30 of which were secure trend items from previous assessment cycles used for the purpose of equating the field trial items to the NAP – CC scale. This equating was used to support item selection for the final cognitive instrument. The items were presented in a balanced cluster rotation in test booklets. Thirteen clusters of items were established at each year level for the field trial. Each test booklet comprised three clusters. Each cluster appeared in three test booklets – once in the first, second and third position. Table 2.2 shows the booklet design for the NAP – CC 2010 field trial and main assessment.
3 Australian Curriculum, Assessment and Reporting Authority (ACARA) ACARA has assumed the advisory role previously undertaken by PMRT as of 2010.
NAP – CC 2010 Technical Report 2. Assessment Framework
8
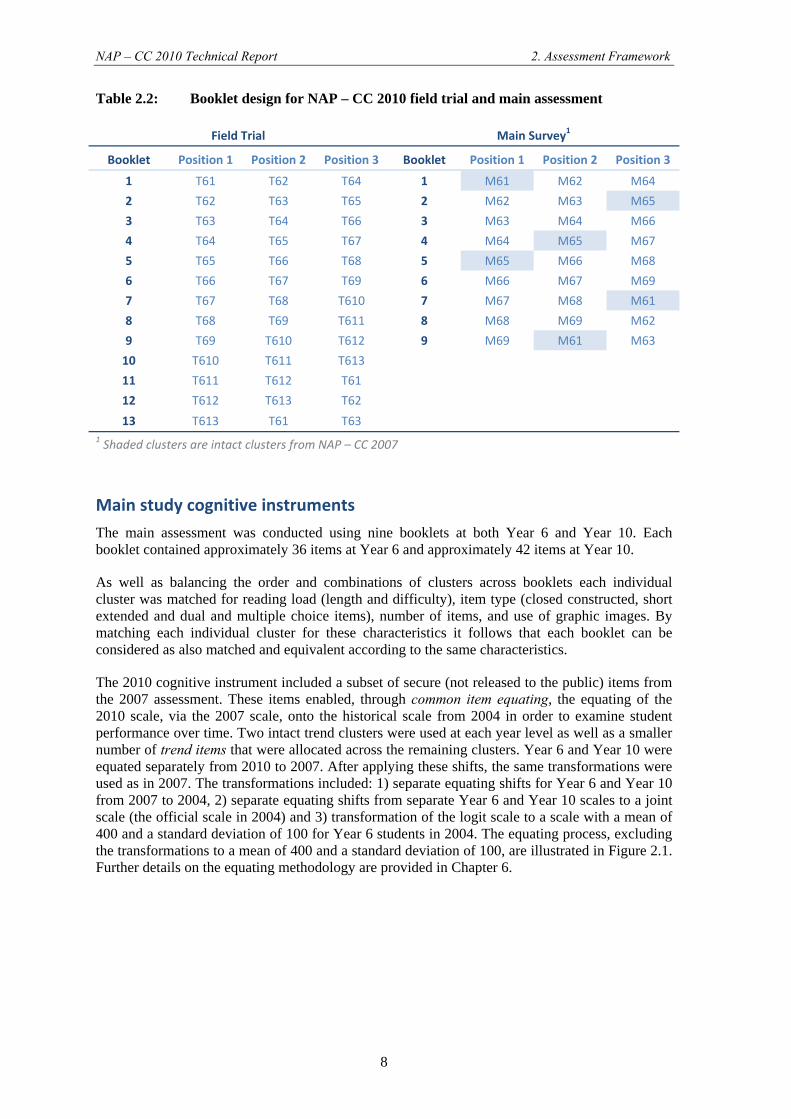
Table 2.2: Booklet design for NAP – CC 2010 field trial and main assessment
Field Trial Main Survey1
Booklet Position 1 Position 2 Position 3 Booklet Position 1 Position 2 Position 3
1 T61 T62 T64 1 M61 M62 M64
2 T62 T63 T65 2 M62 M63 M65
3 T63 T64 T66 3 M63 M64 M66
4 T64 T65 T67 4 M64 M65 M67
5 T65 T66 T68 5 M65 M66 M68
6 T66 T67 T69 6 M66 M67 M69
7 T67 T68 T610 7 M67 M68 M61
8 T68 T69 T611 8 M68 M69 M62
9 T69 T610 T612 9 M69 M61 M63
10 T610 T611 T613
11 T611 T612 T61
12 T612 T613 T62
13 T613 T61 T63 1 Shaded clusters are intact clusters from NAP – CC 2007
Main study cognitive instruments The main assessment was conducted using nine booklets at both Year 6 and Year 10. Each booklet contained approximately 36 items at Year 6 and approximately 42 items at Year 10.
As well as balancing the order and combinations of clusters across booklets each individual cluster was matched for reading load (length and difficulty), item type (closed constructed, short extended and dual and multiple choice items), number of items, and use of graphic images. By matching each individual cluster for these characteristics it follows that each booklet can be considered as also matched and equivalent according to the same characteristics.
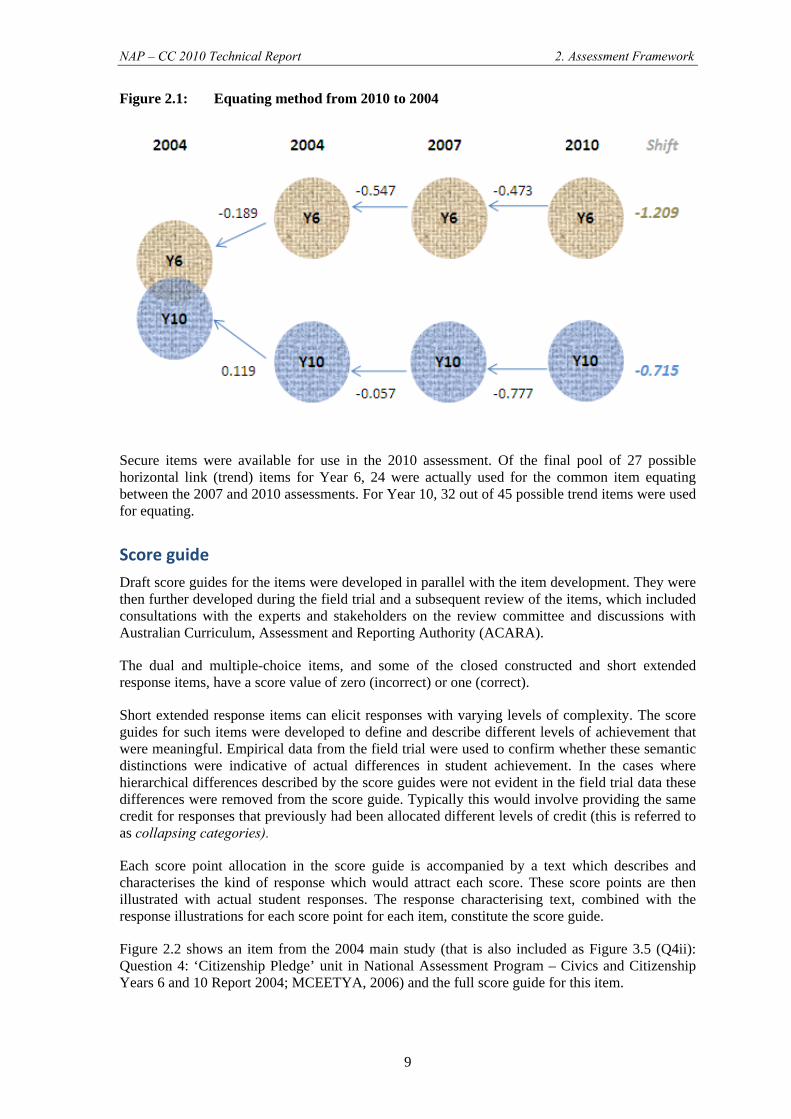
The 2010 cognitive instrument included a subset of secure (not released to the public) items from the 2007 assessment. These items enabled, through common item equating, the equating of the 2010 scale, via the 2007 scale, onto the historical scale from 2004 in order to examine student performance over time. Two intact trend clusters were used at each year level as well as a smaller number of trend items that were allocated across the remaining clusters. Year 6 and Year 10 were equated separately from 2010 to 2007. After applying these shifts, the same transformations were used as in 2007. The transformations included: 1) separate equating shifts for Year 6 and Year 10 from 2007 to 2004, 2) separate equating shifts from separate Year 6 and Year 10 scales to a joint scale (the official scale in 2004) and 3) transformation of the logit scale to a scale with a mean of 400 and a standard deviation of 100 for Year 6 students in 2004. The equating process, excluding the transformations to a mean of 400 and a standard deviation of 100, are illustrated in Figure 2.1. Further details on the equating methodology are provided in Chapter 6.
NAP – CC 2010 Technical Report 2. Assessment Framework
9
Figure 2.1: Equating method from 2010 to 2004
Secure items were available for use in the 2010 assessment. Of the final pool of 27 possible horizontal link (trend) items for Year 6, 24 were actually used for the common item equating between the 2007 and 2010 assessments. For Year 10, 32 out of 45 possible trend items were used for equating.
Score guide Draft score guides for the items were developed in parallel with the item development. They were then further developed during the field trial and a subsequent review of the items, which included consultations with the experts and stakeholders on the review committee and discussions with Australian Curriculum, Assessment and Reporting Authority (ACARA).
The dual and multiple-choice items, and some of the closed constructed and short extended response items, have a score value of zero (incorrect) or one (correct).
Short extended response items can elicit responses with varying levels of complexity. The score guides for such items were developed to define and describe different levels of achievement that were meaningful. Empirical data from the field trial were used to confirm whether these semantic distinctions were indicative of actual differences in student achievement. In the cases where hierarchical differences described by the score guides were not evident in the field trial data these differences were removed from the score guide. Typically this would involve providing the same credit for responses that previously had been allocated different levels of credit (this is referred to as collapsing categories).
Each score point allocation in the score guide is accompanied by a text which describes and characterises the kind of response which would attract each score. These score points are then illustrated with actual student responses. The response characterising text, combined with the response illustrations for each score point for each item, constitute the score guide.
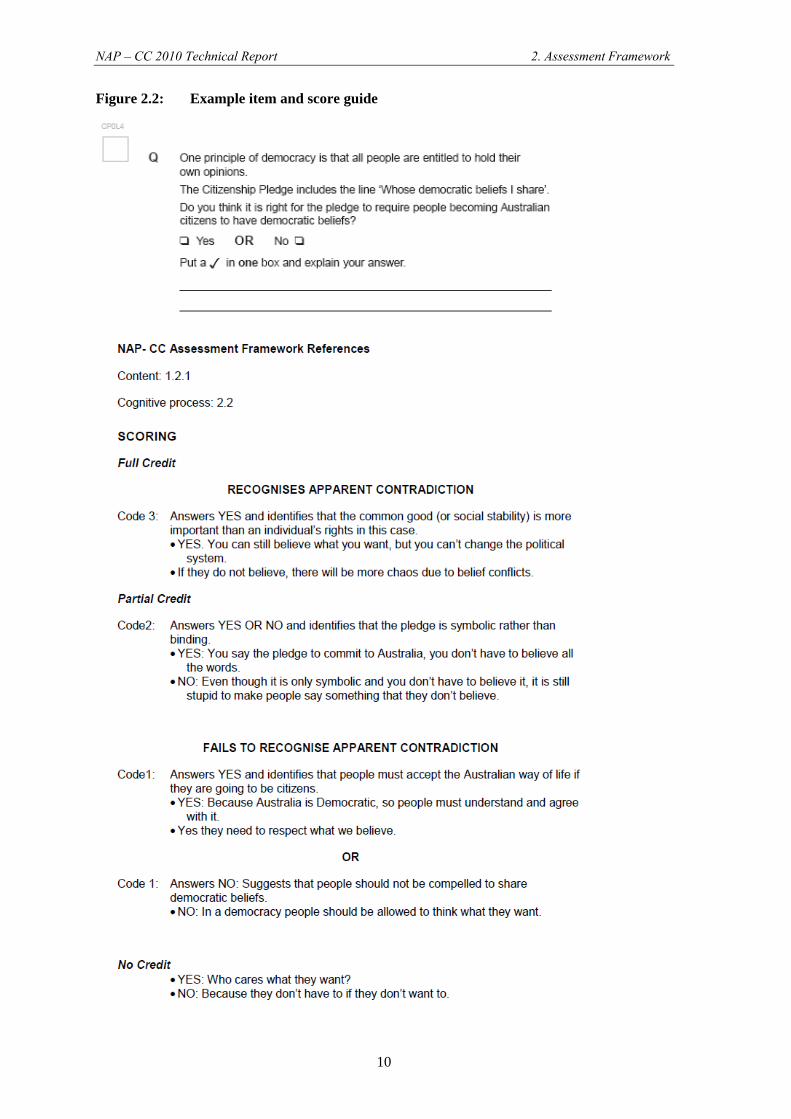
Figure 2.2 shows an item from the 2004 main study (that is also included as Figure 3.5 (Q4ii): Question 4: ‘Citizenship Pledge’ unit in National Assessment Program – Civics and Citizenship Years 6 and 10 Report 2004; MCEETYA, 2006) and the full score guide for this item.
NAP – CC 2010 Technical Report 2. Assessment Framework
10
Figure 2.2: Example item and score guide
NAP – CC 2010 Technical Report 2. Assessment Framework
11
The score guide included the following information:
• the reference to the relevant content and cognitive process in the assessment framework; • descriptions of the content and concepts that characterise responses scored at each level;
and • sample student responses that illustrate the properties of the responses at each level.
Student questionnaire Previous NAP – CC assessments included fairly brief student questionnaires dealing primarily with student civics and citizenship experiences within and out of school. The development of the assessment framework with reference to explicit and implicit expectations of the SOL – CC as well as the Melbourne Declaration resulted in the inclusion of a significantly expanded questionnaire in NAP – CC 2010, which was endorsed by the review committee.
The student questionnaire items were developed to focus on Aspects 3 and 4 of the assessment framework. The items were reviewed by the review committee and refined on the basis of their feedback.
Students’ attitudes towards civic and citizenship issues were assessed with questions covering five constructs:
• importance of conventional citizenship behaviour; • importance of social movement related citizenship behaviour; • trust in civic institutions and processes; • attitudes towards Australian Indigenous culture; and • attitudes towards Australian diversity (Year 10 students only).
Students’ engagement in civic and citizenship activities was assessed with questions concerning the following areas:
• participation in civics and citizenship related activities at school; • participation in civics and citizenship related activities in the community (Year 10
students only); • media use and participation in discussion of political or social issues; • interest in political or social issues; • confidence to actively engage in civic action; • valuing civic action; • intentions to promote important issues in the future; and • expectations of future civic engagement (Year 10 students only).
A copy of the student questionnaire can be found in Appendix A.
Student background information Information about individual and family background characteristics was collected centrally through schools and education systems (see Chapter 4 for more information on the method of collection). The background variables were gender, age, Indigenous status, cultural background (country of birth and main language other than English spoken at home), socio-economic background (parental education and parental occupation) and geographic location. The structure of these variables had been agreed upon by the PMRT as part of NAP and follows the guidelines

NAP – CC 2010 Technical Report 2. Assessment Framework
12
given in the 2010 Data Standards Manual – Student Background Characteristics (MCEECDYA, 2009, referred to as 2010 Data Standards Manual in this report).
NAP – CC 2010 Technical Report 3. Sampling and Weighting
13
CHAPTER 3: SAMPLING AND WEIGHTING
Eveline Gebhardt & Nicole Wernert
This chapter describes the NAP – CC 2010 sample design, the achieved sample, and the procedures used to calculate the sampling weights. The sampling and weighting methods were used to ensure that the data provided accurate and efficient estimates of the achievement outcomes for the Australian Year 6 and Year 10 student populations.
Sampling The target populations for the study were Year 6 and Year 10 students enrolled in educational institutions across Australia.
A two-stage stratified cluster sample design was used in NAP – CC 2010, similar to that used in other Australian national sample assessments and in international assessments such as the Trends in International Mathematics and Science Study (TIMSS). The first stage consists of a sample of schools, stratified according to state, sector, geographic location, a school postcode based measure of socio-economic status and school size; the second stage consists of a sample of one classroom from the target year level in sampled schools. Samples were drawn separately for each year level.
The sampling frame
The national school sampling frame is a comprehensive list of all schools in Australia, which was developed by the Australian Council for Educational Research (ACER) and includes information from multiple sources, including the Australian Bureau of Statistics and the Commonwealth, state and territory education departments.
School exclusions
Only schools containing Year 6 or Year 10 students were eligible to be sampled. Some of these schools were excluded from the sampling frame. Schools excluded from the target population included: non-mainstream schools (such as schools for students with intellectual disabilities or hospital schools), schools listed as having fewer than five students in the target year levels and very remote schools (except in the Northern Territory). These exclusions account for 1.7 per cent of the Year 6 student population and 1.2 per cent of the Year 10 student population.
The decision to include very remote schools in the Northern Territory sample for 2010 corresponds to the procedure used in 2007. The decision to include remote schools in this jurisdiction was made on the basis that, in 2007, very remote schools constituted over 20 per cent of the Year 6 population and over 10 per cent of the Year 10 population in the Northern Territory (in contrast to less than 1% when considering the total population of Australia). The inclusion of very remote schools in the Northern Territory in the NAP – CC 2010 sample does not have any impact on the estimates for Australia or the other states.
NAP – CC 2010 Technical Report 3. Sampling and Weighting
14
The designed sample
For both the Year 6 and Year 10 samples, sample sizes were determined that would provide accurate estimates of achievement outcomes for all states and territories. The expected 95 per cent confidence intervals were estimated in advance to be within approximately ±0.15 to ±0.2 times the population standard deviation for estimated means for the larger states. This expected loss of precision was accepted given the benefits in terms of the reduction in the burden on individual schools and in the overall costs of the survey. Confidence intervals of this magnitude require an effective sample size (i.e., the sample size of a simple random sample that would produce the same precision as a complex sample design) of around 100-150 students in the larger states. Smaller sample sizes were deemed as sufficient for the smaller states and territories because of their relative small student populations. As the proportion of the total population surveyed becomes larger the precision of the sample increases for a given sample size, this is known as the finite population correction factor.
In a complex, multi-stage sample such as the one selected for this study, the students selected within classes tend to be more alike than students selected across classes (and schools). The effect of the complex sample design (for a given assessment) is known as the design effect. The design effect for the NAP – CC 2010 sample was estimated based on data from NAP – CC 2007.
The actual sample sizes required for each state and territory were estimated by multiplying the desired effective sample size by the estimated design effect (Kish, 1965, p. 162). The process of estimating the design effect for NAP – CC 2010 and the consequent calculation of the actual sample size required is described below.
Any within-school homogeneity reduces the effective sample size. This homogeneity can be measured with the intra-class correlation, ρ , which reflects the proportion of the total variance in a characteristic in the population that is accounted for by clusters (classes within schools). Knowing the size of ρ and the size of each cluster’s sample size b, the design effect for an estimate of a mean or percentage for a given characteristic y can be approximated using
( ) 1 ( 1)deff y b ρ= + −
Achievement data from NAP – CC 2007 were used to estimate the size of the intra-class correlation. The intra-class correlations for a design with one classroom per school were estimated at 0.36 and 0.37 for Year 6 and Year 10 respectively. The average cluster sample size (taking into account student non-response) was estimated as 20 from the 2007 survey, leading to design effects of approximately 7.8 for Year 6 and 8.0 for Year 10. Target sample sizes were then calculated by multiplying the desired effective sample size by the estimated design effect. Target sample sizes of around 900 students at both year levels were determined as sufficient for larger states. However, the target sample size in the larger states was increased at Year 10 (compared to that used in 2004 and 2007) due to some larger than desired confidence intervals that had been observed at this year level in the 2007 results.
Table 3.1 shows the population of schools and students and the designed sample.
NAP – CC 2010 Technical Report 3. Sampling and Weighting
15
Table 3.1: Year 6 and Year 10 target population and designed samples by state and territory
Year 6 Year 10
Population Planned Sample Population Planned Sample
Schools Students Schools Students Schools Students Schools Students
NSW 2095 86255 45 900 778 85387 45 900
VIC 1707 65053 45 900 566 65448 45 900
QLD 1154 55412 45 900 441 57433 45 900
SA 562 18940 45 900 195 19577 45 900
WA 665 16360 45 900 240 28503 45 900
TAS 211 6647 45 900 87 6801 40 800
NT 109 2883 30 600 47 2481 30 600
ACT 97 4492 28 560 34 4773 25 500
Australia 6600 256042 328 6560 2388 270404 320 6400
First sampling stage
The school sample was selected from all non-excluded schools in Australia which had students in Year 6 or Year 10. Stratification by state, sector and small schools was explicit, which means that separate samples were drawn for each sector within states and territories. Stratification by geographic location, the Socio-Economic Indexes for Areas (SEIFA) (a measure of socio-economic status based on the geographic location of the school) and school size was implicit, which means that schools within each state were ordered by size (according to the number of students in the target year level) within sub-groups defined by a combination of geographic location and the SEIFA index. The selection of schools was carried out using a systematic probability-proportional-to-size (PPS) method.
The number of students at the target year (the measure of size, or MOS) was accumulated from school to school and the running total was listed next to each school. The total cumulative MOS was a measure of the size of the population of sampling elements. Dividing this figure by the number of schools to be sampled provided the sampling interval.
The first school was sampled by choosing a random number between one and the sampling interval. The school, whose cumulative MOS contained the random number was the first sampled school. By adding the sampling interval to the random number, a second school was identified. This process of consistently adding the sampling interval to the previous selection number resulted in a PPS sample of the required size.
On the basis of an analysis of small schools (schools with a MOS lower than the assumed cluster sample size of 20 students) undertaken prior to sampling, it was decided to increase the school sample size in some strata in order to ensure that the number of students sampled was close to expectations. As a result, the actual number of schools sampled (see Table 3.4 and Table 3.5 below) was slightly larger than the designed sample (see Table 3.1 above). The actual sample drawn is referred to as the implemented sample.
As each school was selected, the next school in the sampling frame was designated as a replacement school to be included in cases where the sampled school did not participate. The school previous to the sampled school was designated as the second replacement. It was used if neither the sampled nor the first replacement school participated. In some cases (such as secondary schools in the Northern Territory) there were not enough schools available for the
NAP – CC 2010 Technical Report 3. Sampling and Weighting
16
replacement samples to be drawn. Because of the use of stratification, the replacement schools were generally similar (with respect to geographic location, socio-economic location and size) to the school for which they were a replacement.
After the school sample had already been drawn, a number of sampled schools were identified as meeting the criteria for exclusion. When this occurred, the sampled school and its replacements were removed from the sample and removed from the calculation of participation rates. One school was removed from the Year 6 sample and two schools were removed from the Year 10 sample. These exclusions are included in the exclusion rates reported earlier.
Second sampling stage
The second stage of sampling consisted of the random selection of one class within sampled schools. In most cases, one intact class was sampled from each sampled school. Where only one class was available at the target year level, that class was automatically selected. Where more than one class existed, classes were sampled with equal probability of selection.
In some schools, smaller classes were combined to form so-called pseudo-class groups prior to sampling. For example, two multi-level classes with 13 and 15 Year 6 students respectively could be combined into a single pseudo-class of 28 students. This procedure helps to maximise the number of students selected per school (the sample design was based on 25 students per school before student non-response), and also to minimise the variation in sampling weights (see discussion below). Pseudo-classes were treated like other classes and had equal probabilities of selection during sampling.
Student exclusions
Within the sampled classrooms, individual students were eligible to be exempted from the assessment on the basis of the criteria listed below.
• Functional disability: Student has a moderate to severe permanent physical disability such that he/she cannot perform in the assessment situation.
• Intellectual disability: Student has a mental or emotional disability and is cognitively delayed such that he/she cannot perform in the assessment situation.
• Limited assessment language proficiency: The student is unable to read or speak the language of the assessment and would be unable to overcome the language barrier in the assessment situation. Typically, a student who has received less than one year of instruction in the language of the assessment would be excluded.
Table 3.2 and Table 3.3 detail the numbers and percentages of students excluded from the NAP –CC 2010 assessment, according to the reason given for their exclusion.
The number of student-level exclusions was 91 at Year 6 and 80 at Year 10. This brought the final exclusion rate (combining school and student exclusions) to 2.8 per cent at Year 6 and 2.3 per cent at Year 10.
NAP – CC 2010 Technical Report 3. Sampling and Weighting
17
Table 3.2: Year 6 breakdown of student exclusions according to reason by state and territory
Functional Disability
Intellectual Disability
Limited English Proficiency Total %
NSW 3 3 0 6 0.5
VIC 0 6 0 6 0.6
QLD 6 4 3 13 1.2
SA 0 8 1 9 0.9
WA 0 6 1 7 0.6
TAS 1 12 11 24 2.3
NT 1 12 10 23 4.1
ACT 0 2 1 3 0.4
Australia 11 53 27 91 1.1
Table 3.3: Year 10 breakdown of student exclusions according to reason by state and territory
Functional Disability
Intellectual Disability
Limited English Proficiency Total %
NSW 1 2 0 3 0.3
VIC 0 4 10 14 1.4
QLD 2 5 7 14 1.3
SA 0 4 22 26 2.4
WA 0 0 0 0 0.0
TAS 0 9 5 14 1.5
NT 0 0 3 3 0.9
ACT 3 2 1 6 0.8
Australia 6 26 48 80 1.1
Weighting While the multi-stage stratified cluster design provides a very economical and effective data collection process in a school environment, oversampling of sub-populations and non-response cause differential probabilities of selection for the ultimate sampling elements, the students. Consequently, one student in the assessment does not necessarily represent the same number of students in the population as another, as would be the case with a simple random sampling approach. To account for differential probabilities of selection due to the design and to ensure unbiased population estimates, a sampling weight was computed for each participating student. It was an essential characteristic of the sample design to allow the provision of proper sampling weights, since these were necessary for the computation of accurate population estimates.
The overall sampling weight is the product of weights calculated at the three stages of sampling:
• the selection of the school at the first stage; • the selection of the class or pseudo-class from the sampled schools at the second stage;
and • the selection of students within the sampled classes at the third stage.
NAP – CC 2010 Technical Report 3. Sampling and Weighting
18
First stage weight
The first stage weight is the inverse of the probability of selection of the school, adjusted to account for school non-response.
The probability of selection of the school is equal to its MOS divided by the sampling interval (SINT) or one, whichever is the lower. (A school with a MOS greater than the SINT is a certain selection, and therefore has a probability of selection of one. Some very large schools were selected with certainty into the sample.)
The sampling interval is calculated at the time of sampling, and for each explicit stratum it is equal to the cumulative MOS of all schools in the stratum, divided by the number of schools to be sampled from that stratum. The MOS for each school is the number of students recorded on the sampling frame at the relevant year level (Year 6 or Year 10).
This factor of the first stage weight, or the school base weight, was the inverse of this probability
Following data collection, counts of the following categories of schools were made for each explicit stratum:
• the number of schools that participated ( ); • the number of schools that were sampled but should have been excluded ( ); and • the number of non-responding schools ( ).
Note that equals the total number of sampled schools from the stratum.
Examples of the second class ( ) were:
• a sampled school that no longer existed; and • a school that, following sampling, was discovered to have fitted one of the criteria for
school level exclusion (e.g. very remote, very small), but which had not been removed from the frame prior to sampling.
In the case of a non-responding school ( ), neither the originally sampled school nor its replacements participated.
Within each explicit stratum, an adjustment was made to account for school non-response. This non-response adjustment (NRA) for a stratum was equal to
The first stage weight, or the final school weight, was the product of the inverse of the probability of selection of the school and the school non-response adjustment
/
NAP – CC 2010 Technical Report 3. Sampling and Weighting
19
Second stage weight
The second stage weight was the inverse of the probability of selection of the classes from the sampled school.
In some schools, smaller classes were combined to form a pseudo-class group prior to sampling. This was to maximise the potential yield, and also to reduce the variation in the weights allocated to students from different classes of the same school.
Classes or pseudo-classes were then sampled with equal probability of selection. In most cases, one intact class was sampled from each sampled school.
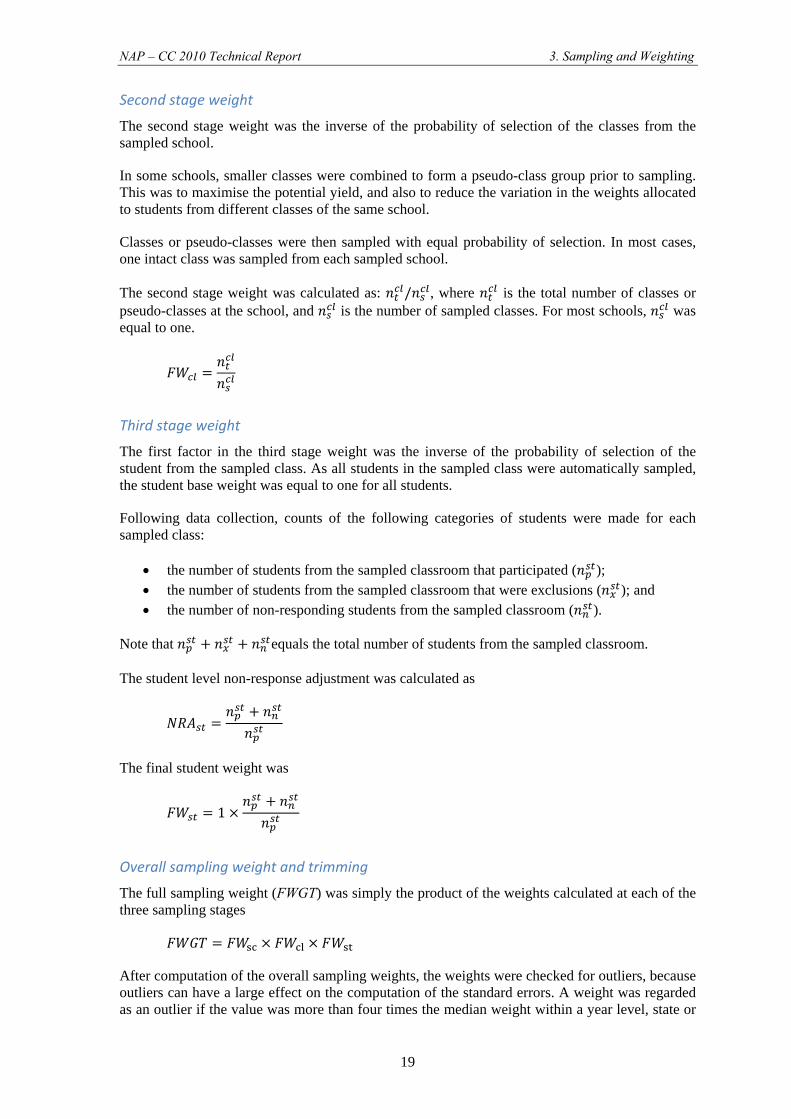
The second stage weight was calculated as: / , where is the total number of classes or pseudo-classes at the school, and is the number of sampled classes. For most schools, was equal to one.
Third stage weight
The first factor in the third stage weight was the inverse of the probability of selection of the student from the sampled class. As all students in the sampled class were automatically sampled, the student base weight was equal to one for all students.
Following data collection, counts of the following categories of students were made for each sampled class:
• the number of students from the sampled classroom that participated ( ); • the number of students from the sampled classroom that were exclusions ( ); and • the number of non-responding students from the sampled classroom ( ).
Note that equals the total number of students from the sampled classroom.
The student level non-response adjustment was calculated as
The final student weight was
1
Overall sampling weight and trimming
The full sampling weight (FWGT) was simply the product of the weights calculated at each of the three sampling stages
After computation of the overall sampling weights, the weights were checked for outliers, because outliers can have a large effect on the computation of the standard errors. A weight was regarded as an outlier if the value was more than four times the median weight within a year level, state or
NAP – CC 2010 Technical Report 3. Sampling and Weighting
20
territory and sector (a stratum). Only the weights of eight Year 10 students from one school in Victoria were outliers. These outliers were trimmed by replacing their value with four times the median weight of the stratum.
Participation rates Separate participation rates were computed (1) with replacement schools included as participants and (2) with replacement schools regarded as non-respondents. In addition, each of these rates was computed using unweighted and weighted counts. In any of these methods, a school and a student response rate was computed and the overall response rate was the product of these two response rates. The differences in computing the four response rates are described below. These methods are consistent with the methodology used in TIMSS (Olson, Martin & Mullis, 2008).
Unweighted response rates including replacement schools
The unweighted school response rate, where replacement schools were counted as responding schools, was computed as follows
where is the number of responding schools from the original sample, is the total number of responding replacement schools, and is the number of non-responding schools that could not be replaced.
The student response rate was computed over all responding schools. Of these schools, the number of responding students was divided by the total number of eligible, sampled students.
where is the total number of responding students in all responding schools and is the total number of eligible, non-responding, sampled students in all responding schools.
The overall response rate is the product of the school and the student response rates.
Unweighted response rates excluding replacement schools
The difference of the second method with the first is that the replacement schools were counted as non-responding schools.
This difference had an indirect effect on the student response rate, because fewer schools were included as responding schools and student response rates were only computed for the responding schools.
The overall response rate was again the product of the two response rates.
NAP – CC 2010 Technical Report 3. Sampling and Weighting
21
Weighted response rates including replacement schools
For the weighted response rates, sums of weights were used instead of counts of schools and students. School and student base weights (BW) are the weight values before correcting for non-response, so they generate estimates of the population being represented by the responding schools and students. The final weights (FW) at the school and student levels are the base weights corrected for non-response. Since there was no class-level non-response, the class level response rates were equal to one and for simplicity excluded from the formulae below.
School response rates are computed as follows
∑ ∑
∑ ∑
where indicates a school, 1 1 all responding schools, a student and the responding students in school i. First, the sum of the responding students’ FW was computed within schools. Second, this sum was multiplied by the school’s BW (numerator) or the school’s FW (denominator). Third, these products were summed over the responding schools (including replacement schools). Finally, the ratio of these values was the response rate.
As in the previous methods, the numerator of the school response rate is the denominator of the student response rate
∑ ∑
∑ ∑
The overall response rate is the product of the school and student response rates
Weighted response rates excluding replacement schools
Practically, replacement schools were excluded by setting their school BW to zero and applying the same computations as above. More formally, the parts of the response rates are computed as follows
∑ ∑
∑ ∑
∑ ∑
∑ ∑
Reported response rates
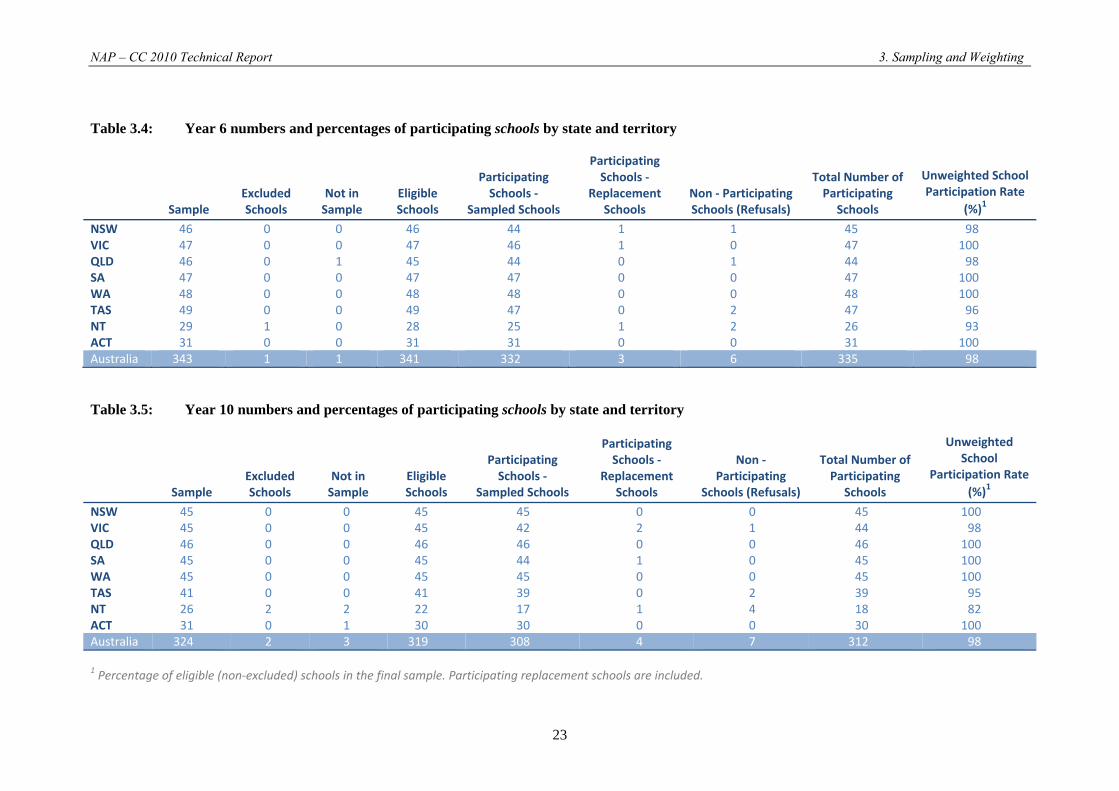
The Australian school participation rate in both Year 6 and Year 10 was 98 per cent including replacement schools and 97 per cent excluding replacement schools. When including replacement
NAP – CC 2010 Technical Report 3. Sampling and Weighting
22
schools, the lowest unweighted school participation rates were recorded in the Northern Territory (93% in Year 6 and 82% in Year 10). Four states and territories had a school response rate of 100 per cent in Year 6 and five in Year 10. Table 3.4 and Table 3.5 detail Year 6 and Year 10 school exclusions, refusals and participation information, including the unweighted school participation rates nationally and by state or territory.
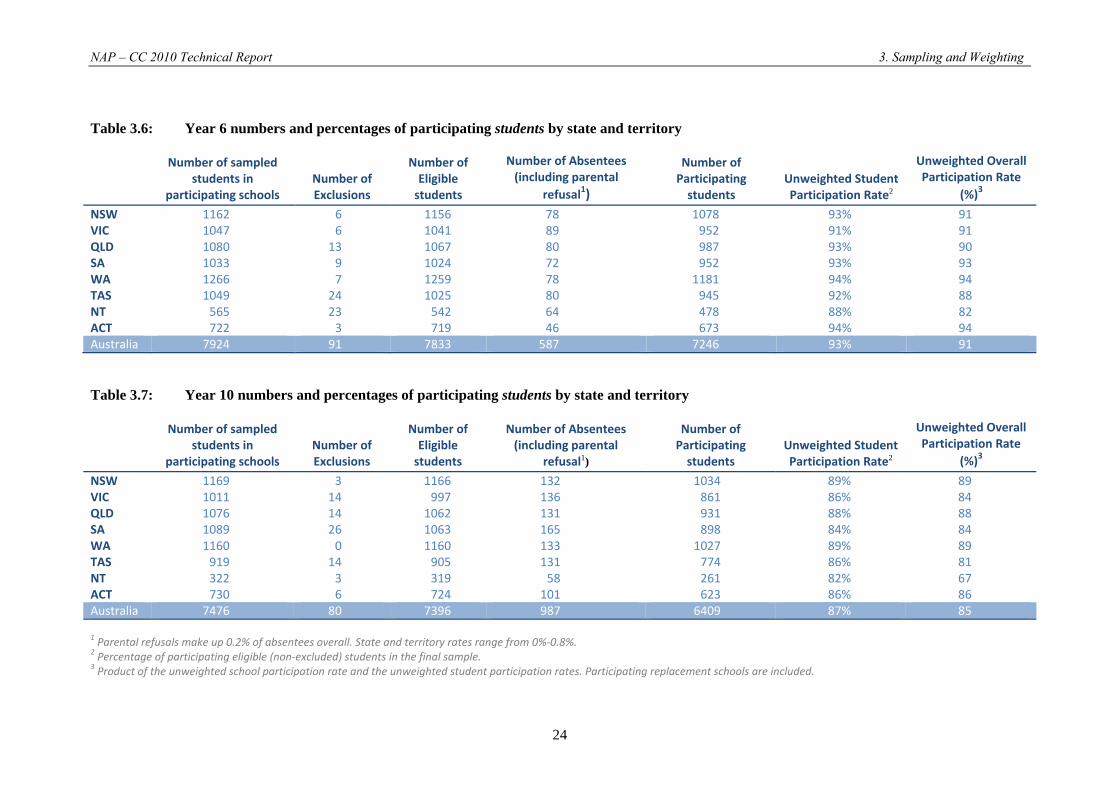
Of the sampled students in responding schools (including replacement schools), 93 per cent of Year 6 students and 87 per cent of Year 10 students participated in the assessment. Therefore, combining the school and student participation rates, the NAP – CC 2010 achieved an overall participation rate of 91 per cent at Year 6 and 85 per cent at Year 10. Table 3.6 and
Table 3.7 show student exclusions, information on absentees and participation, as well as the student and overall participation rates nationally and by state or territory in Year 6 and Year 10.
The values of the weighted participation rates are very similar to the unweighted participation rates and are therefore provided in Appendix B.
NAP – CC 2010 Technical Report 3. Sampling and Weighting
23
Table 3.4: Year 6 numbers and percentages of participating schools by state and territory
Sample Excluded Schools
Not in Sample
Eligible Schools
Participating Schools ‐
Sampled Schools
Participating Schools ‐
Replacement Schools
Non ‐ Participating Schools (Refusals)
Total Number of Participating
Schools
Unweighted School Participation Rate
(%)1
NSW 46 0 0 46 44 1 1 45 98VIC 47 0 0 47 46 1 0 47 100QLD 46 0 1 45 44 0 1 44 98SA 47 0 0 47 47 0 0 47 100WA 48 0 0 48 48 0 0 48 100TAS 49 0 0 49 47 0 2 47 96NT 29 1 0 28 25 1 2 26 93ACT 31 0 0 31 31 0 0 31 100Australia 343 1 1 341 332 3 6 335 98
Table 3.5: Year 10 numbers and percentages of participating schools by state and territory
Sample Excluded Schools
Not in Sample
Eligible Schools
Participating Schools ‐
Sampled Schools
Participating Schools ‐
Replacement Schools
Non ‐ Participating
Schools (Refusals)
Total Number of Participating
Schools
Unweighted School
Participation Rate (%)1
NSW 45 0 0 45 45 0 0 45 100 VIC 45 0 0 45 42 2 1 44 98 QLD 46 0 0 46 46 0 0 46 100 SA 45 0 0 45 44 1 0 45 100 WA 45 0 0 45 45 0 0 45 100 TAS 41 0 0 41 39 0 2 39 95 NT 26 2 2 22 17 1 4 18 82 ACT 31 0 1 30 30 0 0 30 100 Australia 324 2 3 319 308 4 7 312 98
1 Percentage of eligible (non‐excluded) schools in the final sample. Participating replacement schools are included.
NAP – CC 2010 Technical Report 3. Sampling and Weighting
24
Table 3.6: Year 6 numbers and percentages of participating students by state and territory
Number of sampled students in
participating schools Number of Exclusions
Number of Eligible students
Number of Absentees (including parental
refusal1)
Number of Participating students
Unweighted Student Participation Rate2
Unweighted Overall Participation Rate
(%)3
NSW 1162 6 1156 78 1078 93% 91VIC 1047 6 1041 89 952 91% 91QLD 1080 13 1067 80 987 93% 90SA 1033 9 1024 72 952 93% 93WA 1266 7 1259 78 1181 94% 94TAS 1049 24 1025 80 945 92% 88NT 565 23 542 64 478 88% 82ACT 722 3 719 46 673 94% 94Australia 7924 91 7833 587 7246 93% 91
Table 3.7: Year 10 numbers and percentages of participating students by state and territory
Number of sampled students in
participating schools Number of Exclusions
Number of Eligible students
Number of Absentees (including parental
refusal1)
Number of Participating students
Unweighted Student Participation Rate2
Unweighted Overall Participation Rate
(%)3
NSW 1169 3 1166 132 1034 89% 89VIC 1011 14 997 136 861 86% 84QLD 1076 14 1062 131 931 88% 88SA 1089 26 1063 165 898 84% 84WA 1160 0 1160 133 1027 89% 89TAS 919 14 905 131 774 86% 81NT 322 3 319 58 261 82% 67ACT 730 6 724 101 623 86% 86Australia 7476 80 7396 987 6409 87% 85
1 Parental refusals make up 0.2% of absentees overall. State and territory rates range from 0%‐0.8%. 2 Percentage of participating eligible (non‐excluded) students in the final sample. 3 Product of the unweighted school participation rate and the unweighted student participation rates. Participating replacement schools are included.
NAP – CC 2010 Technical Report 4. Data Collection
25
CHAPTER 4: DATA COLLECTION PROCEDURES
Nicole Wernert
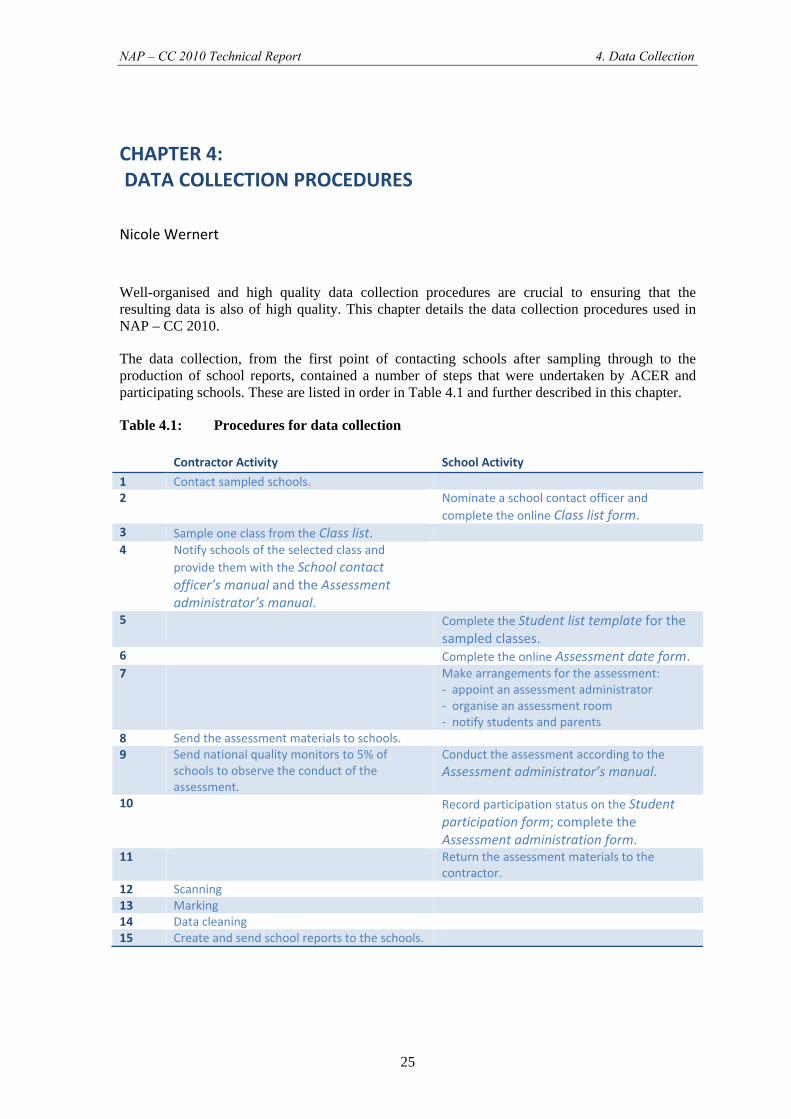
Well-organised and high quality data collection procedures are crucial to ensuring that the resulting data is also of high quality. This chapter details the data collection procedures used in NAP – CC 2010.
The data collection, from the first point of contacting schools after sampling through to the production of school reports, contained a number of steps that were undertaken by ACER and participating schools. These are listed in order in Table 4.1 and further described in this chapter.
Table 4.1: Procedures for data collection
Contractor Activity School Activity
1 Contact sampled schools. 2 Nominate a school contact officer and
complete the online Class list form. 3 Sample one class from the Class list. 4 Notify schools of the selected class and
provide them with the School contact officer’s manual and the Assessment administrator’s manual.
5 Complete the Student list template for the sampled classes.
6 Complete the online Assessment date form. 7 Make arrangements for the assessment:
‐ appoint an assessment administrator ‐ organise an assessment room ‐ notify students and parents
8 Send the assessment materials to schools.9 Send national quality monitors to 5% of
schools to observe the conduct of the assessment.
Conduct the assessment according to the Assessment administrator’s manual.
10 Record participation status on the Student participation form; complete the Assessment administration form.
11 Return the assessment materials to the contractor.
12 Scanning 13 Marking 14 Data cleaning 15 Create and send school reports to the schools.
NAP – CC 2010 Technical Report 4. Data Collection
26
Contact with schools The field administration of NAP – CC 2010 required several stages of contact with the sampled schools to request or provide information.
In order to ensure the participation of sampled schools, education authority liaison officers were appointed for each jurisdiction. The liaison officers were expected to facilitate communication between ACER and the schools that were selected in the sample from their respective jurisdiction. The liaison officers helped to achieve a high participation rate for the assessment, which ensured valid and reliable data.
The steps involved in contacting schools are described in the following list.
• Initially, the principals of the sampled schools were contacted to inform them of their selection. If the sampled school was unable to take part (as confirmed by an education authority liaison officer), the replacement school had to be contacted.
• The initial approach to the principal of sampled schools included a request to name a school contact officer, who would coordinate the assessment in the school, and to list all of the Year 6 or Year 10 classes in the school along with the number of students in each class (using the Class list form).
• Following their nomination, school contact officers were sent the School contact officer’s manual as well as a notification of the randomly selected class for that school. At this time they were asked to provide student background details for the students in the selected class via the Student list form, as well as the school’s preferred dates for testing (on the Assessment date form). A copy of the Assessment administrator’s manual was also provided.
• The assessment materials were couriered to schools at least a week before the scheduled assessment date. The school contact officer was responsible for their secure storage while they were in the school and was also responsible for making sure all materials (whether completed or not) were returned through the prepaid courier service provided.
• The final contact with schools was to send them the results for the participating students and to thank them for their participation.
At each of those stages requiring information to be sent from the schools, a definite timeframe was provided for the provision of this information. If the school did not respond in the designated timeframe, follow-up contact was made via fax, email and telephone.
The NAP – CC Online School Administration Website In 2010, all information provided by schools was submitted to ACER via a secure website. The NAP – CC Online School Administration Website contained the following forms:
• the School details form (to collect the contact details for the school and the school contact officer);
• the Class list form (a list of all of the Year 6 or Year 10 classes in the school along with the number of students in each class);
• the Student list form (a list of all students in the selected class or pseudo-class, along with the standard background information required by MCEECDYA – see below); and
• the Assessment date form (the date that the school has scheduled to administer the assessment within the official assessment period).
NAP – CC 2010 Technical Report 4. Data Collection
27
The collection of student background information
In 2004, Australian Education Ministers agreed to implement standard definitions for student background characteristics (detailed in the 2010 Data Standards Manual (MCEECDYA, 2009)), to collect student background information from parents and to supply the resulting information to testing agents so that it can be linked to students’ test results. The information collected included: sex, date of birth, country of birth, Indigenous status, parents’ school education, parents’ non-school education, parents’ occupation group, and students’ and parents’ home language.
By 2010, all schools were expected to have collected this information from parents for all students and to be storing this data according to the standards outlined in the 2010 Data Standards Manual (MCEECDYA, 2009). To collect this data from schools, an EXCEL template was created, into which schools could paste the relevant student details for each student in the sampled class or pseudo-class. This template was then uploaded onto the NAP – CC Online School Administration Website.
Where possible, education departments undertook to supply this data directly to ACER, rather than expecting the school to provide it. In these cases, schools were simply required to verify the student details provided by the education department.
Information management In order to track schools and students, different databases were constructed. The sample database identified the sampled schools and their matching replacement schools and also identified the participation status of each school. The school database contained a record for each participating school and contact information as well as details about the school contact officer and participating classes. The student tracking database contained student identification and participation information. The final student database contained student background information, responses to test items, achievement scale scores, responses to student questionnaire items, attitude scale scores, final student weights and replicate weights.
Further information about these databases and the information that they contained is provided in Chapter 5.
Within‐school procedures As the NAP – CC 2010 assessment took place within schools, during schools hours, the participation of school staff in the organisation and administration of the assessment was an essential part of the field administration. This section outlines the key roles within schools.
The school contact officer
Participating schools were asked to appoint a school contact officer to coordinate the assessment within the school. The school contact officer’s responsibilities were to:
• liaise with ACER on any issues relating to the assessment; • provide ACER with a list of Year 6 or Year 10 classes; • complete names and student background information for students in the class or pseudo-
class selected to participate; • schedule the assessment and arrange a space for the session(s); • notify teachers, students and parents about the assessment according to the school’s
policies; • select assessment administrator(s); • receive and securely store the assessment materials;
NAP – CC 2010 Technical Report 4. Data Collection
28
• assist the assessment administrator(s) as necessary; • check the completed assessment materials and forms; • arrange a follow-up session if needed; and • return the assessment materials.
Each school contact officer was provided with a manual (the School contact officer’s manual) that described in detail what was required and provided a checklist of tasks and blank versions of all of the required forms. Detailed instructions were also provided regarding the participation and exclusion of students with disabilities and students from non-English speaking backgrounds.
The assessment administrator
Each school was required to appoint an assessment administrator. In most cases this was the regular class teacher. This was done to minimise the disruption to the normal class environment.
The primary responsibility of the assessment administrator was to administer NAP – CC 2010 to the sampled class, according to the standardised administration procedures provided in the Assessment administrator’s manual. The assessment administrator’s responsibilities included:
• ensuring that each student received the correct assessment materials which had been specially prepared for them;
• recording student participation on the Student participation form; • administering the test and the questionnaire in accordance with the instructions in the
manual; • ensuring the correct timing of the testing sessions, and recording the time when the
various sessions start and end on the Assessment administration form; and • ensuring that all testing materials, including all unused as well as completed assessment
booklets, were returned following the assessment.
The teachers were able to review the Assessment administrator’s manual before the assessment date and raise any questions they had about the procedures with ACER or the state and territory liaison officers responsible for the program. As a result, it was expected that a fully standardised administration of the assessments would be achieved.
The assessment administrator was expected to move around the room while the students were working to see that students were following directions and answering questions in the appropriate part of the assessment booklet. They were allowed to read questions to students but could not help the students with the interpretation of any of the questions or answer questions about the content of the assessment items.
Assessment administration Schools were allowed to schedule the assessment on a day that suited them within the official assessment period. In 2010 the assessment period was between the 11th of October and the 22nd of October in Tasmania, the Northern Territory, Victoria and Queensland; and between the 18th of October and the 29th of October in New South Wales, the ACT, South Australia and Western Australia.
The timing of the assessment session was standardised. Year 6 students were expected to be given exactly 60 minutes to complete the assessment items while Year 10 students were given 75 minutes. The administration and timing of the student questionnaire and breaks were more flexible. To ensure that these rules were followed, the assessment administrator was required to
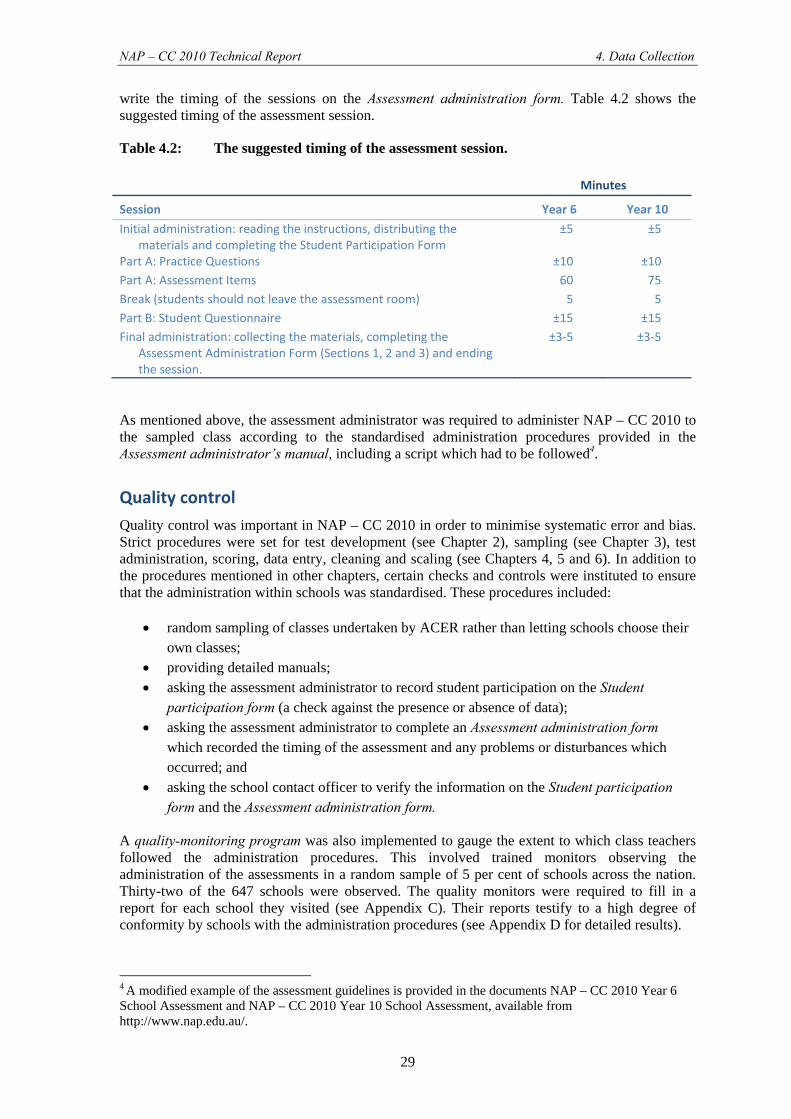
NAP – CC 2010 Technical Report 4. Data Collection
29
write the timing of the sessions on the Assessment administration form. Table 4.2 shows the suggested timing of the assessment session.
Table 4.2: The suggested timing of the assessment session.
Minutes
Session Year 6 Year 10
Initial administration: reading the instructions, distributing the materials and completing the Student Participation Form
±5 ±5
Part A: Practice Questions ±10 ±10Part A: Assessment Items 60 75Break (students should not leave the assessment room) 5 5Part B: Student Questionnaire ±15 ±15Final administration: collecting the materials, completing the
Assessment Administration Form (Sections 1, 2 and 3) and ending the session.
±3‐5 ±3‐5
As mentioned above, the assessment administrator was required to administer NAP – CC 2010 to the sampled class according to the standardised administration procedures provided in the Assessment administrator’s manual, including a script which had to be followed4.
Quality control Quality control was important in NAP – CC 2010 in order to minimise systematic error and bias. Strict procedures were set for test development (see Chapter 2), sampling (see Chapter 3), test administration, scoring, data entry, cleaning and scaling (see Chapters 4, 5 and 6). In addition to the procedures mentioned in other chapters, certain checks and controls were instituted to ensure that the administration within schools was standardised. These procedures included:
• random sampling of classes undertaken by ACER rather than letting schools choose their own classes;
• providing detailed manuals; • asking the assessment administrator to record student participation on the Student
participation form (a check against the presence or absence of data); • asking the assessment administrator to complete an Assessment administration form
which recorded the timing of the assessment and any problems or disturbances which occurred; and
• asking the school contact officer to verify the information on the Student participation form and the Assessment administration form.
A quality-monitoring program was also implemented to gauge the extent to which class teachers followed the administration procedures. This involved trained monitors observing the administration of the assessments in a random sample of 5 per cent of schools across the nation. Thirty-two of the 647 schools were observed. The quality monitors were required to fill in a report for each school they visited (see Appendix C). Their reports testify to a high degree of conformity by schools with the administration procedures (see Appendix D for detailed results).
4 A modified example of the assessment guidelines is provided in the documents NAP – CC 2010 Year 6 School Assessment and NAP – CC 2010 Year 10 School Assessment, available from http://www.nap.edu.au/.
NAP – CC 2010 Technical Report 4. Data Collection
30
Online scoring procedures and scorer training In 2010, completed booklets were scanned and the responses to multiple- or dual-choice questions were captured and translated into an electronic dataset. The student responses to the questionnaire were also scanned and the data translated into the electronic dataset.
Student responses to the constructed response questions were cut and presented to the team of scorers using a computer-based scoring system. Approximately half of the items were constructed response and, of these, most required a single answer or phrase.
Score guides were prepared by ACER and refined during the field trial process. Three teams of experienced scorers were employed and trained by ACER. Most of the scorers had been involved in scoring for the 2007 assessment. Two teams of six and one team of five scorers were established and each team was led by a lead scorer.
Scoring and scorer training was conducted by cluster. Each item appeared in one cluster at its target year level. Each common item (vertical link) between Year 6 and Year 10 therefore appeared in one cluster at each year level. The clusters were scored in a sequence that maximised the overlap of vertical link items between consecutive clusters. This was done to support consistency of marking of the vertical link items and to minimise the training demands on scorers.
The training involved scorers being introduced to each constructed response item with its score guide. The scoring characteristics for the item were discussed and scorers were then provided between five and 10 example student responses to score (the number of example responses used was higher for items that were known—on the basis of experience from the field trial or previous NAP – CC cycles—to be more difficult to score). The scorers would then discuss their scores in a group discussion with a view to consolidating a consensus understanding of the item, the score guide and the characteristics of the student responses in each score category.
Throughout the scoring process, scorers continued to compare their application of the scores to individual student responses and sought consistency in their scoring through consultation and by moderation within each scoring team. Since the number of scorers was small enough to fit in a single room, the scorers were able to seek immediate clarification with the ACER scoring trainer and, where appropriate, the lead scorers.
The lead scorer in each team undertook check scoring and was thus constantly monitoring the reliability of the individual scorers and the team as a whole. Over 7 per cent (7.3%) of all items were double-scored by lead scorers. Less than 6 per cent of the double-scored scripts required a score change. Throughout the scoring process, advice to individual scorers and the team about clarification and alteration of scoring approaches was provided by ACER staff and by the scoring leaders. This advisory process was exercised with a view to improve reliability where it was required.
School reports Following data entry and cleaning (see Chapter 5), reports of student performance were sent to each participating school. As each Year 6 and Year 10 student completed one of the nine different year level test booklets, nine reports were prepared for each school (one for each booklet).
The reports provided information about each student’s achievement on the particular test booklet that they completed. These reports contained the following information:
• a description of the properties of a high quality response to each item; • the maximum possible score for each item;

NAP – CC 2010 Technical Report 4. Data Collection
31
• the percentage of students who achieved the maximum score on each item (weighted to be proportionally representative of the Australian population); and
• the achievement of each student on each item in the test booklet.
An example of a Year 6 and a Year 10 report (for one test booklet only), and the accompanying explanatory material can be found in Appendix E.
NAP – CC 2010 Technical Report 5. Data Management
32
CHAPTER 5: DATA MANAGEMENT
Nicole Wernert
As mentioned in Chapter 4, several databases were created to track schools and students in the NAP – CC 2010: the sample database; the school database; the student tracking database and the final student database. The integrity and accuracy of the information contained in these databases was central to maintaining the quality of the resulting data. This chapter provides details of the information contained in these databases, how the information was derived and what steps were taken to ensure the quality of the data.
A system of IDs was used to track information in these databases. The sampling frame ID was a unique ID for each school that linked schools in the sample back to the sampling frame. The school ID comprised information about cohort, state and sector as well as a unique school number. The student ID included the school ID and also a student number (unique within each school).
Sample database The sample database was produced by the sampling team, and comprised a list of all schools sampled and their replacements. Information provided about each school included contact details, school level variables of interest (sector, geolocation, and SEIFA), sampling information such as MOS, and their participation status.
The participation status of each school was updated as needed by the survey administration team. After the assessment, this information was essential to compute the school sample weights needed to provide accurate population estimates (see Chapter 3).
School database The school database was derived from the sample database, containing information about the participating schools only. It contained relevant contact details, taken from the sample database, as well as information obtained from the school via the NAP – CC Online School Administration Website. This information included data about the school contact officer, the class or pseudo-class sampled to participate, and the assessment date.
Student tracking database The student tracking database was derived from the student list (submitted by schools via the NAP – CC Online School Administration Website) and, following the return of completed assessment materials, from information on the Student participation form.
Prior to testing, the student tracking database contained a list of all students in the selected class or pseudo-class for each of the participating schools, along with the background data provided via the student list. Student IDs were assigned and booklets allocated to student IDs before this information (student ID and booklet number) was used to populate the Student participation forms.
NAP – CC 2010 Technical Report 5. Data Management
33
After the assessment had concluded, the information from the completed Student participation form was manually entered into the Student tracking form. A single variable was added that recorded the participation status of each student (participated, absent, excluded or no longer in the sampled class). In addition, any new students that had joined the class and had completed a spare booklet were added. Where new students had been added, their background details were also added, taken from the Record of student background details form, which was designed to capture these data for unlisted students. If this information had not been provided by the school, and could not be obtained through contact with the school, it was recorded as missing, except in the case of gender, where gender was entered if it could be imputed from the school type (i.e. where single-sex) or deduced from the name of the student.
Final student database The data that comprise the final student database came from three sources: the cognitive assessment data and student questionnaire data captured from the test booklets, the student background data and student participation data obtained from the student tracking database, and school level variables transferred from the sample database. In addition to these variables, student weights and replicate weights were computed and added to the database.
Scanning and data‐entry procedures
The cognitive assessment data were derived from the scanned responses to multiple- and dual-choice questions and the codes awarded to the constructed response questions by scorers through the computerised scoring system. The data from the student questionnaire were also captured via scanning.
Data captured via scanning were submitted to a two-stage verification process. Firstly, any data not recognised by the system were submitted to manual screening by operators. Secondly, a percentage of all scanned data was submitted for verification by a senior operator.
In order to reduce the need for extensive data cleaning, the scanning software was constructed with forced validation of codes according to the codebook. That is, only codes applicable to the item would be allowed to be entered into the database.
Any booklets that could not be scanned (due to damage or late arrival) but still had legible student responses were manually entered into the data capturing system and were subject to the same verification procedures as the scanned data.
Data cleaning
While the achievement and questionnaire data did not require data cleaning due to the verification procedures undertaken, once combined with the student background and participation data further data cleaning was undertaken to resolve any inconsistencies, such as the ones listed below.
• Achievement and questionnaire data were available for a student but the student was absent according to the student participation information.
• A student completed a booklet according to the student participation data but no achievement or questionnaire data were available in the test.
• Achievement and questionnaire data were available for students with Student IDs that should not be in the database.
• In some cases the year of assessment was entered as 2011. This was corrected into 2010.
NAP – CC 2010 Technical Report 5. Data Management
34
• After computing the age of students in years, all ages outside a range of six years for each year level (from nine to 13 years in Year 6 and from 13 to 18 years in Year 10) were set to missing.
Student background data
The student list contained the student background variables that were required. Table 5.1 presents the definitions of the variables used for collection.
Table 5.1: Variable definitions for student background data
Question Name Format
Gender GENDER Boy (1) Girl (2)
Date of Birth DOB Free response, dd/mm/yyyyIndigenous status ATSI No (i.e. not Indigenous) (1)
Aboriginal (2) Torres Strait Islander (3) Both Aboriginal AND Torres Strait Islander (4) Missing (9)
Student Country of Birth SCOB The 4‐digit code from the Standard Australian Classification of Countries (SACC) Coding Index 2nd Edition.
Language other than English at home (3 questions = Student/ Mother/ Father)
LBOTESLBOTEP1LBOTEP2
The 4‐digit code from the Australian Standard Classification of Languages (ASCl) Coding Index 2nd Edition.
Parent’s occupation group (2 questions = Mother/ Father)
OCCP1 Senior Managers and Professionals (1) OCCP2 Other Managers and Associate Professionals (2) Tradespeople & skilled office, sales and service staff
(3) Unskilled labourers, office, sales and service staff (4) Not in paid work (8) Missing (9)
Parent’s highest level of schooling (2 questions = Mother/ Father)
SEP1 Year 12 or equivalent (1)SEP1 Year 11 or equivalent (2) Year 10 or equivalent (3) Year 9 or equivalent or below (4) Missing (0)
Parent’s highest level of non‐school education (2 questions = Mother/ Father)
NSEP1 Bachelor degree or above (8)NSEP2 Advanced diploma/diploma (7) Certificate I to IV (inc. trade cert.) (6) No non‐school qualification (5) Missing (0)
Variables were also derived for the purposes of reporting achievement outcomes. In most cases, these variables are variables required by MCEECDYA. The transformations undertaken followed the guidelines in the 2010 Data Standards Manual (MCEECDYA, 2009). Table 5.2 shows the derived variables and the transformation rules used to recode them.
NAP – CC 2010 Technical Report 5. Data Management
35
Table 5.2: Transformation rules used to derive student background variables for reporting
Variable Name Transformation rule
Geolocation ‐ School
GEOLOC Derived from MCEETYA Geographical Location Classification
Gender GENDER Classified by response; missing data treated as missing unless the student was present at a single‐sex school or unless deduced from student name.
Age – Years AGE Derived from the difference between the Date of Assessment and the Date of Birth, transformed to whole years.
Indigenous Status INDIG Coded as Indigenous if response was ‘yes’ to Aboriginal, OR Torres Strait Islander OR Both.
Country of Birth COB The reporting variable (COB) was coded as 'Australia' (1) or 'Not Australia' (2) according to the SACC codes.
LBOTE LBOTE Each of the three LOTE questions (Student, Mother or Father) was recoded to 'LOTE' (1) or 'Not LOTE' (2) according to ASCL codes. The reporting variable (LBOTE) was coded as 'LBOTE' (1) if response was ‘LOTE’ for any of Student, Mother or Father. If all three responses were 'Not LOTE' then the LBOTE variable was designated as 'Not LBOTE' (2). If any of the data were missing then the data from the other questions were used. If all of the data were missing then LBOTE was coded as missing.
Parental Education PARED Parental Education equalled the highest education level (of either parent). Where one parent had missing data the highest education level of the other parent was used. Only if parental education data for both parents were missing, would Parental Education be coded as ‘Missing’.
Parental Occupation
POCC Parental Occupation equalled the highest occupation group (of either parent). Where one parent had missing data or was classified as ‘Not in paid work’, the occupation group of the other parent was used. Where one parent had missing data and the other was classified as ‘Not in paid work’, Parental Occupation equalled ‘Not in paid work’. Only if parental occupation data for both parents were missing, would Parental Occupation be coded as ‘Missing’.
Cognitive achievement data
The cognitive achievement test was designed to assess the content and concepts described in Aspects 1 and 2 of the assessment framework. Responses to test items were scanned and data were cleaned. Following data cleaning, the cognitive items were used to construct the NAP – CC proficiency scale. Chapter 6 details the scaling procedures used. The final student database contained original responses to the cognitive items and the scaled student proficiency scores. In total, 105 items were used for scaling Year 6 students and 113 items were used for scaling Year 10 students.
Four codes were applied for missing responses to cognitive items. Code 8 was used if a response was invalid (e.g. two responses to a multiple choice item), code 9 was used for embedded missing responses, code r was used for not reached items (consecutive missing responses at the end of a booklet with exception of the first one which was coded as embedded missing) and code n for not administered (when the item was not in a booklet).
NAP – CC 2010 Technical Report 5. Data Management
36
Student questionnaire data
The student questionnaire was included to assess the affective and behavioural processes described in Aspects 3 and 4 of the assessment framework. The questionnaire included items measuring constructs within two broad areas of interest: students’ attitudes towards civics and citizenship issues, and students’ engagement in civics and citizenship activities. The content of the constructs are described in Table 5.3 and the questionnaire is provided in Appendix A.
Student responses to the questionnaire items were, when appropriate, scaled to derive attitude scales. The methodology for scaling questionnaire items is consistent with the one used for cognitive test items and is described in Chapter 6.
Missing responses to the questions were coded in the database as 8 for invalid responses, 9 for missing responses and n for not administered. Missing scale scores were coded as 9999 for students that responded to less than two items in a scale and 9997 for scales that were not administered for a student.
Student weights
In addition to students’ responses, scaled scores and background data, student sampling weights were added to the database. Computation of student weights is described in Chapter 3. In order to compute unbiased standard errors, 165 replication weights were constructed and added to the database. Chapter 8 describes how these replication weights were computed and how they were, and should be used for computing standard errors.
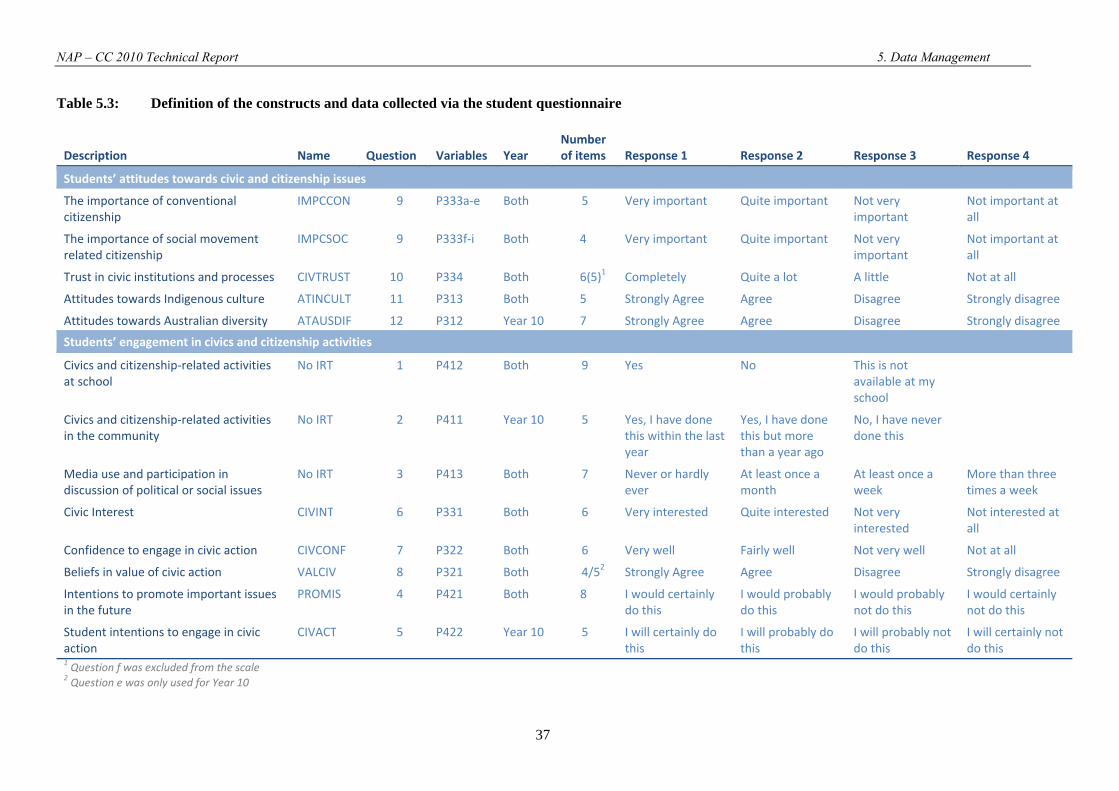
NAP – CC 2010 Technical Report 5. Data Management
37
Table 5.3: Definition of the constructs and data collected via the student questionnaire
Description Name Question Variables Year Number of items Response 1 Response 2 Response 3 Response 4
Students’ attitudes towards civic and citizenship issues
The importance of conventional citizenship
IMPCCON 9 P333a‐e Both 5 Very important Quite important Not very important
Not important at all
The importance of social movement related citizenship
IMPCSOC 9 P333f‐i Both 4 Very important Quite important Not very important
Not important at all
Trust in civic institutions and processes CIVTRUST 10 P334 Both 6(5)1 Completely Quite a lot A little Not at all
Attitudes towards Indigenous culture ATINCULT 11 P313 Both 5 Strongly Agree Agree Disagree Strongly disagree
Attitudes towards Australian diversity ATAUSDIF 12 P312 Year 10 7 Strongly Agree Agree Disagree Strongly disagree
Students’ engagement in civics and citizenship activities
Civics and citizenship‐related activities at school
No IRT 1 P412 Both 9 Yes No This is notavailable at my school
Civics and citizenship‐related activities in the community
No IRT 2 P411 Year 10 5 Yes, I have done this within the last year
Yes, I have done this but more than a year ago
No, I have never done this
Media use and participation in discussion of political or social issues
No IRT 3 P413 Both 7 Never or hardly ever
At least once a month
At least once a week
More than three times a week
Civic Interest CIVINT 6 P331 Both 6 Very interested Quite interested Not very interested
Not interested at all
Confidence to engage in civic action CIVCONF 7 P322 Both 6 Very well Fairly well Not very well Not at all
Beliefs in value of civic action VALCIV 8 P321 Both 4/52 Strongly Agree Agree Disagree Strongly disagree
Intentions to promote important issues in the future
PROMIS 4 P421 Both 8 I would certainly do this
I would probably do this
I would probably not do this
I would certainly not do this
Student intentions to engage in civic action
CIVACT 5 P422 Year 10 5 I will certainly do this
I will probably do this
I will probably not do this
I will certainly not do this
1 Question f was excluded from the scale 2 Question e was only used for Year 10
NAP – CC 2010 Technical Report 6. Scaling Procedures
38
CHAPTER 6: SCALING PROCEDURES
Eveline Gebhardt & Wolfram Schulz
Both cognitive and questionnaire items were scaled using item response theory (IRT) scaling methodology. The cognitive items formed one NAP – CC proficiency scale, while a number of different scales were constructed from the questionnaire items.
The scaling model Test items were scaled using IRT scaling methodology. Use of the one-parameter model (Rasch, 1960) means that in case of dichotomous items, the probability of selecting a correct response (value of one) instead of an incorrect response (value of zero) is modelled as
( )( )Pi
n i
n i
( )exp
expθ
θ δθ δ
=−
+ −1
where Pi(θ) is the probability of person n to score 1 on item i, θn is the estimated ability of person n and δi is the estimated location of item i on this dimension. For each item, item responses are modelled as a function of the latent trait θn.
In the case of items with more than two (k) categories (as for example with Likert-type items) the above model can be generalised to the Rasch partial credit model (Masters & Wright, 1997), which takes the form of
0
0 0
exp ( )( ) 0,1, ,
exp ( )i i
x
n i ijk
x i im k
n i ijh k
P x mθ δ τ
θθ δ τ
=
= =
− += =
− +
∑
∑ ∑K
where Pxi(θ) denotes the probability of person n to score x on item i, θn denotes the person's ability, the item parameter δi gives the location of the item on the latent continuum and τij denotes an additional step parameter.
The ACER ConQuest Version 2.0 software (Wu, Adams, Wilson, & Haldane, 2007) was used for the estimation of model parameters.
Scaling cognitive items This section outlines the procedures for analysing and scaling the cognitive test items. They are somewhat different from scaling the questionnaire items, which will be discussed in the subsequent section.

NAP – CC 2010 Technical Report 6. Scaling Procedures
39
Assessment of item fit
The model fit for cognitive test items was assessed using a range of item statistics. The weighted mean-square statistic (infit), which is a residual based fit statistic, was used as a global indicator of item fit. Weighted infit statistics were reviewed both for item and step parameters. The ACER ConQuest Version 2.0 software was used for the analysis of item fit. In addition to this, the software provided item characteristic curves (ICCs). ICCs provide a graphical representation of item fit across the range of student abilities for each item (including dichotomous and partial credit items). The functioning of the partial credit score guides was further analysed by reviewing the proportion of responses in each response category and the correct ordering of mean abilities of students across response categories. The following five items were removed from the scale due to poor fit statistics: AF31 and AF32 for Year 6, CO31, CS21 and WP11 for Year 10 (the last two items were also deleted in 2007).
There were no strict criteria for removing items from the test. Items were flagged for discussion based on a significant higher infit mean square combined with low discrimination (item-rest correlation of about 0.2 or lower). The item development and data analysis team considered the ICC and the content of the item before a decision was made about removal of the item for scaling.
Differential item functioning by gender
The quality of the items was also explored by assessing differential item functioning (DIF) by gender. Differential item functioning occurs when groups of students with the same ability have different probabilities of responding correctly to an item. For example, if boys have a higher probability than girls with the same ability on an item, the item shows gender DIF in favour of boys. This constitutes a violation of the model, which assumes that the probability is only a function of ability and not of any group membership. DIF results in the advantaging of one group over another group. The item in this example advantages boys. Two item units (SE for Years 6 and 10 and QT for Year 10), each consisting of four items, were removed from the scale because they favoured one gender group.
Item calibration
Item parameters were calibrated using the full sample. The student weights were rescaled, to ensure that each state or territory was equally represented in the sample. Items were calibrated separately for Year 6 and Year 10.
In 2010 for the first time, a so-called booklet effect was detected. Since the assignment of booklets to students is random, the average ability is expected to be equal across. However, the average ability varied significantly across booklets. This indicated that item difficulties varied across booklet and constituted a violation of the scaling model which assumes that the probability of correct item responses depends only on the students’ ability (and not on the booklet they have completed). To take the booklet effect into account, booklet was added to the scaling model as a so-called facet. Including booklet as a facet leads to the estimation of an additional parameter reflecting the differences in overall average difficulty among booklets.
Although the average ability for each booklet changes, the overall mean ability is not affected, because the booklet parameters sum up to zero. In addition, the item parameters hardly change by adding booklet parameters. Therefore, including booklets as a facet does not have a systematic effect on trends.
Table 6.1 shows that the range in booklet means is larger in 2010 than in 2007, especially for Year 10 students. The table also shows that the facet model accounts for these differences between booklets and decreases the range in booklet means.
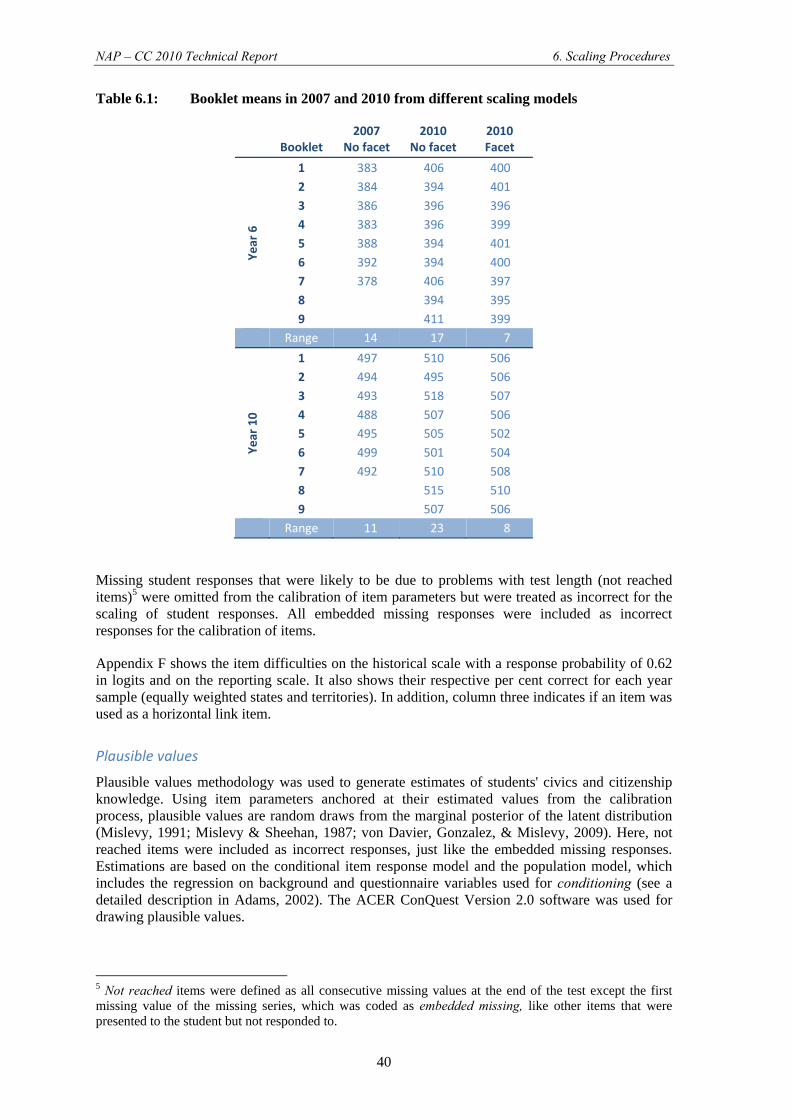
NAP – CC 2010 Technical Report 6. Scaling Procedures
40
Table 6.1: Booklet means in 2007 and 2010 from different scaling models
Booklet 2007
No facet 2010
No facet 2010Facet
Year 6
1 383 406 400 2 384 394 401 3 386 396 396 4 383 396 399 5 388 394 401 6 392 394 400 7 378 406 397 8 394 395 9 411 399
Range 14 17 7
Year 10
1 497 510 506 2 494 495 506 3 493 518 507 4 488 507 506 5 495 505 502 6 499 501 504 7 492 510 508 8 515 510 9 507 506
Range 11 23 8
Missing student responses that were likely to be due to problems with test length (not reached items)5 were omitted from the calibration of item parameters but were treated as incorrect for the scaling of student responses. All embedded missing responses were included as incorrect responses for the calibration of items.
Appendix F shows the item difficulties on the historical scale with a response probability of 0.62 in logits and on the reporting scale. It also shows their respective per cent correct for each year sample (equally weighted states and territories). In addition, column three indicates if an item was used as a horizontal link item.
Plausible values
Plausible values methodology was used to generate estimates of students' civics and citizenship knowledge. Using item parameters anchored at their estimated values from the calibration process, plausible values are random draws from the marginal posterior of the latent distribution (Mislevy, 1991; Mislevy & Sheehan, 1987; von Davier, Gonzalez, & Mislevy, 2009). Here, not reached items were included as incorrect responses, just like the embedded missing responses. Estimations are based on the conditional item response model and the population model, which includes the regression on background and questionnaire variables used for conditioning (see a detailed description in Adams, 2002). The ACER ConQuest Version 2.0 software was used for drawing plausible values.
5 Not reached items were defined as all consecutive missing values at the end of the test except the first missing value of the missing series, which was coded as embedded missing, like other items that were presented to the student but not responded to.
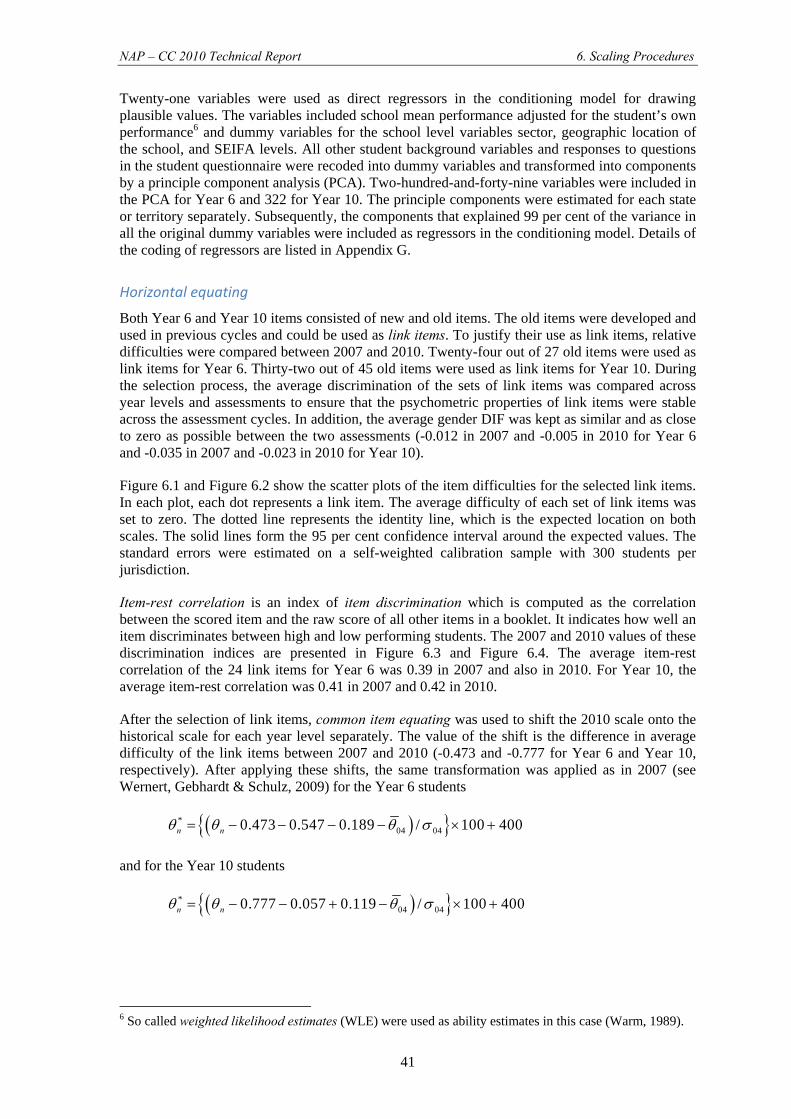
NAP – CC 2010 Technical Report 6. Scaling Procedures
41
Twenty-one variables were used as direct regressors in the conditioning model for drawing plausible values. The variables included school mean performance adjusted for the student’s own performance6 and dummy variables for the school level variables sector, geographic location of the school, and SEIFA levels. All other student background variables and responses to questions in the student questionnaire were recoded into dummy variables and transformed into components by a principle component analysis (PCA). Two-hundred-and-forty-nine variables were included in the PCA for Year 6 and 322 for Year 10. The principle components were estimated for each state or territory separately. Subsequently, the components that explained 99 per cent of the variance in all the original dummy variables were included as regressors in the conditioning model. Details of the coding of regressors are listed in Appendix G.
Horizontal equating
Both Year 6 and Year 10 items consisted of new and old items. The old items were developed and used in previous cycles and could be used as link items. To justify their use as link items, relative difficulties were compared between 2007 and 2010. Twenty-four out of 27 old items were used as link items for Year 6. Thirty-two out of 45 old items were used as link items for Year 10. During the selection process, the average discrimination of the sets of link items was compared across year levels and assessments to ensure that the psychometric properties of link items were stable across the assessment cycles. In addition, the average gender DIF was kept as similar and as close to zero as possible between the two assessments (-0.012 in 2007 and -0.005 in 2010 for Year 6 and -0.035 in 2007 and -0.023 in 2010 for Year 10).
Figure 6.1 and Figure 6.2 show the scatter plots of the item difficulties for the selected link items. In each plot, each dot represents a link item. The average difficulty of each set of link items was set to zero. The dotted line represents the identity line, which is the expected location on both scales. The solid lines form the 95 per cent confidence interval around the expected values. The standard errors were estimated on a self-weighted calibration sample with 300 students per jurisdiction.
Item-rest correlation is an index of item discrimination which is computed as the correlation between the scored item and the raw score of all other items in a booklet. It indicates how well an item discriminates between high and low performing students. The 2007 and 2010 values of these discrimination indices are presented in Figure 6.3 and Figure 6.4. The average item-rest correlation of the 24 link items for Year 6 was 0.39 in 2007 and also in 2010. For Year 10, the average item-rest correlation was 0.41 in 2007 and 0.42 in 2010.
After the selection of link items, common item equating was used to shift the 2010 scale onto the historical scale for each year level separately. The value of the shift is the difference in average difficulty of the link items between 2007 and 2010 (-0.473 and -0.777 for Year 6 and Year 10, respectively). After applying these shifts, the same transformation was applied as in 2007 (see Wernert, Gebhardt & Schulz, 2009) for the Year 6 students
( ){ }*04 040.473 0.547 0.189 / 100 400n nθ θ θ σ= − − − − × +
and for the Year 10 students
( ){ }*04 040.777 0.057 0.119 / 100 400n nθ θ θ σ= − − + − × +
6 So called weighted likelihood estimates (WLE) were used as ability estimates in this case (Warm, 1989).
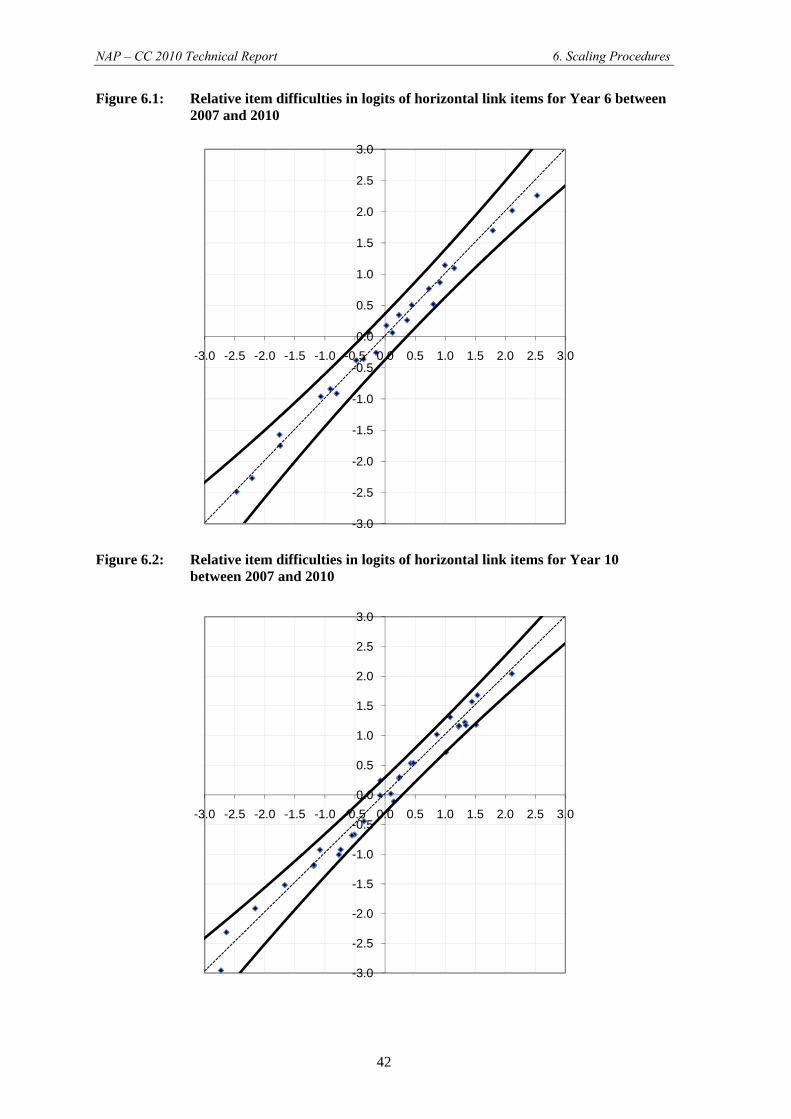
NAP – CC 2010 Technical Report 6. Scaling Procedures
42
Figure 6.1: Relative item difficulties in logits of horizontal link items for Year 6 between 2007 and 2010
Figure 6.2: Relative item difficulties in logits of horizontal link items for Year 10 between 2007 and 2010
-3.0
-2.5
-2.0
-1.5
-1.0
-0.5
0.0
0.5
1.0
1.5
2.0
2.5
3.0
-3.0 -2.5 -2.0 -1.5 -1.0 -0.5 0.0 0.5 1.0 1.5 2.0 2.5 3.0
-3.0
-2.5
-2.0
-1.5
-1.0
-0.5
0.0
0.5
1.0
1.5
2.0
2.5
3.0
-3.0 -2.5 -2.0 -1.5 -1.0 -0.5 0.0 0.5 1.0 1.5 2.0 2.5 3.0
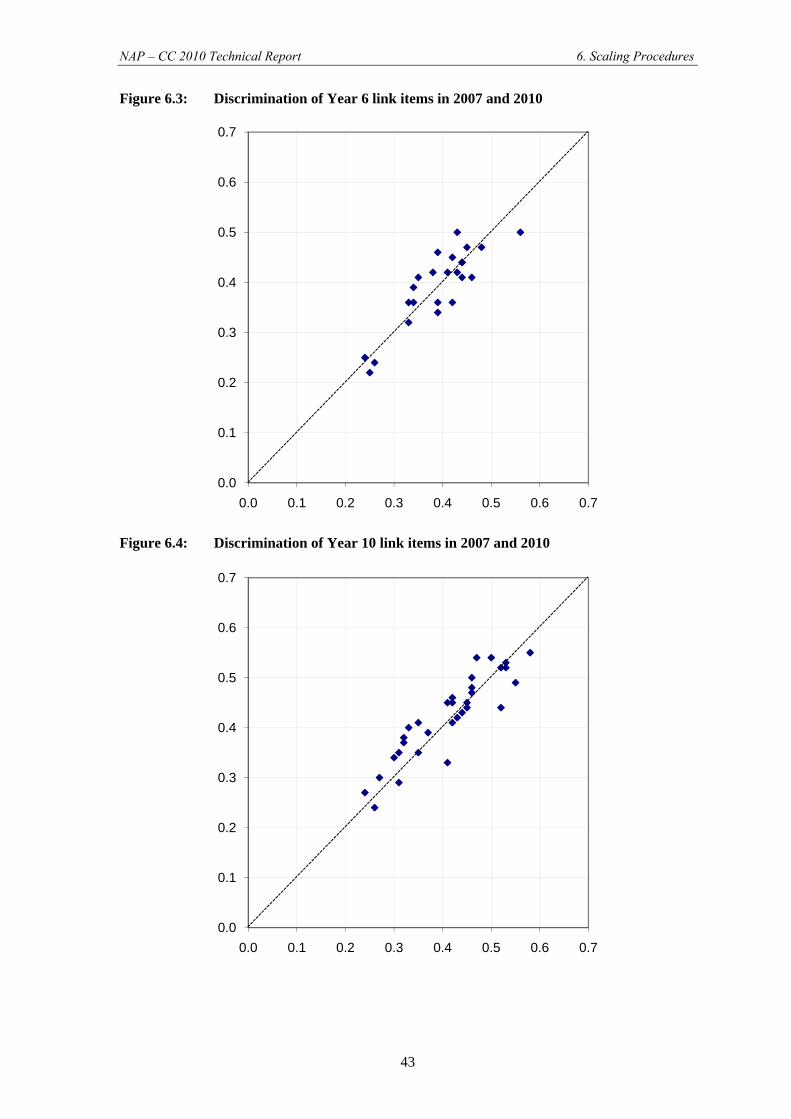
NAP – CC 2010 Technical Report 6. Scaling Procedures
43
Figure 6.3: Discrimination of Year 6 link items in 2007 and 2010
Figure 6.4: Discrimination of Year 10 link items in 2007 and 2010
0.0
0.1
0.2
0.3
0.4
0.5
0.6
0.7
0.0 0.1 0.2 0.3 0.4 0.5 0.6 0.7
0.0
0.1
0.2
0.3
0.4
0.5
0.6
0.7
0.0 0.1 0.2 0.3 0.4 0.5 0.6 0.7
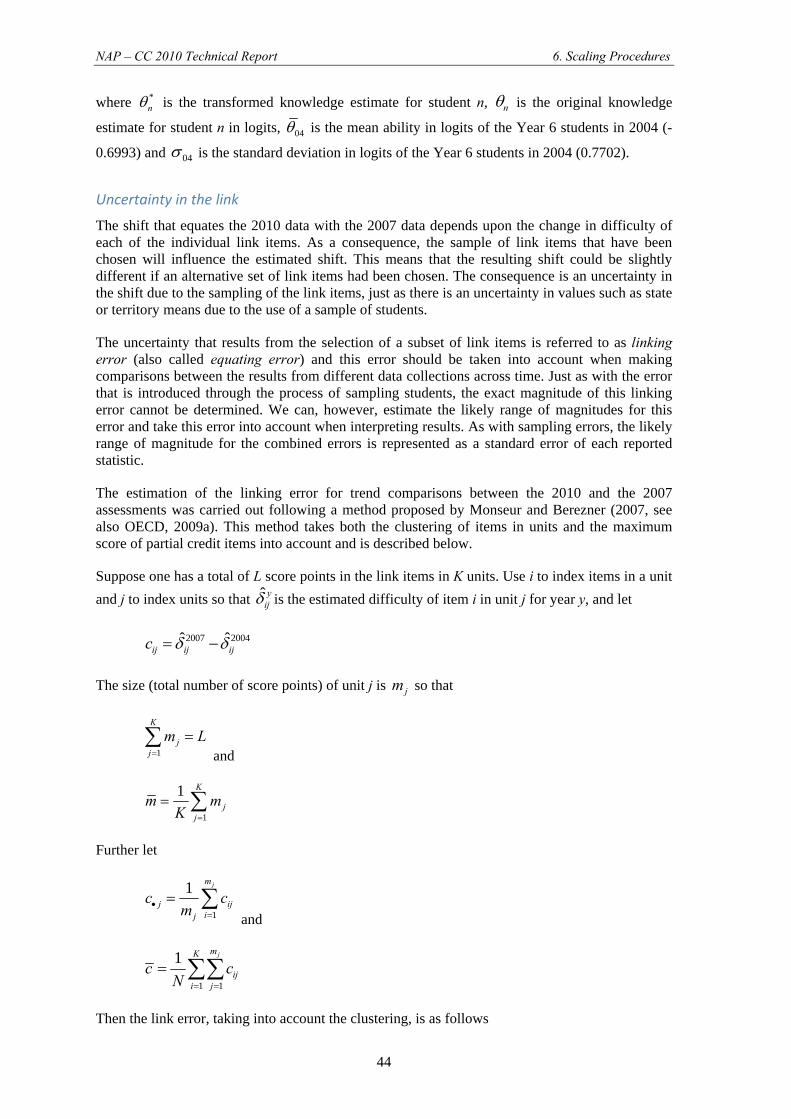
NAP – CC 2010 Technical Report 6. Scaling Procedures
44
where *nθ is the transformed knowledge estimate for student n, nθ is the original knowledge
estimate for student n in logits, 04θ is the mean ability in logits of the Year 6 students in 2004 (-
0.6993) and 04σ is the standard deviation in logits of the Year 6 students in 2004 (0.7702).
Uncertainty in the link
The shift that equates the 2010 data with the 2007 data depends upon the change in difficulty of each of the individual link items. As a consequence, the sample of link items that have been chosen will influence the estimated shift. This means that the resulting shift could be slightly different if an alternative set of link items had been chosen. The consequence is an uncertainty in the shift due to the sampling of the link items, just as there is an uncertainty in values such as state or territory means due to the use of a sample of students.
The uncertainty that results from the selection of a subset of link items is referred to as linking error (also called equating error) and this error should be taken into account when making comparisons between the results from different data collections across time. Just as with the error that is introduced through the process of sampling students, the exact magnitude of this linking error cannot be determined. We can, however, estimate the likely range of magnitudes for this error and take this error into account when interpreting results. As with sampling errors, the likely range of magnitude for the combined errors is represented as a standard error of each reported statistic.
The estimation of the linking error for trend comparisons between the 2010 and the 2007 assessments was carried out following a method proposed by Monseur and Berezner (2007, see also OECD, 2009a). This method takes both the clustering of items in units and the maximum score of partial credit items into account and is described below.
Suppose one has a total of L score points in the link items in K units. Use i to index items in a unit and j to index units so that ˆ y
ijδ is the estimated difficulty of item i in unit j for year y, and let
2007 2004ˆ ˆij ij ijc δ δ= −
The size (total number of score points) of unit j is jm so that
1
K
jj
m L=
=∑ and
1
1 K
jj
m mK =
= ∑
Further let
1
1 jm
j ijij
c cm•
=
= ∑ and
1 1
1 jmK
iji j
c cN = =
= ∑∑
Then the link error, taking into account the clustering, is as follows
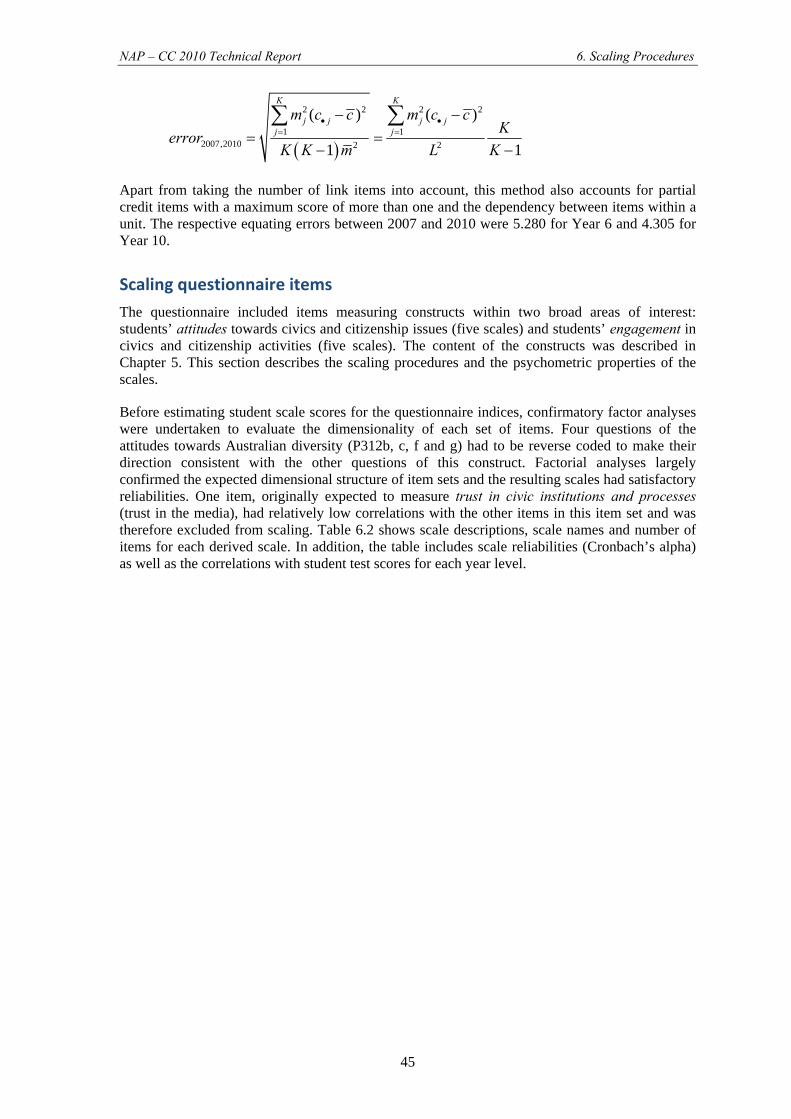
NAP – CC 2010 Technical Report 6. Scaling Procedures
45
( )
2 2 2 2
1 12007,2010 2 2
( ) ( )
1 1
K K
j j j jj j
m c c m c cKerror
K K m L K
• •= =
− −= =
− −
∑ ∑
Apart from taking the number of link items into account, this method also accounts for partial credit items with a maximum score of more than one and the dependency between items within a unit. The respective equating errors between 2007 and 2010 were 5.280 for Year 6 and 4.305 for Year 10.
Scaling questionnaire items The questionnaire included items measuring constructs within two broad areas of interest: students’ attitudes towards civics and citizenship issues (five scales) and students’ engagement in civics and citizenship activities (five scales). The content of the constructs was described in Chapter 5. This section describes the scaling procedures and the psychometric properties of the scales.
Before estimating student scale scores for the questionnaire indices, confirmatory factor analyses were undertaken to evaluate the dimensionality of each set of items. Four questions of the attitudes towards Australian diversity (P312b, c, f and g) had to be reverse coded to make their direction consistent with the other questions of this construct. Factorial analyses largely confirmed the expected dimensional structure of item sets and the resulting scales had satisfactory reliabilities. One item, originally expected to measure trust in civic institutions and processes (trust in the media), had relatively low correlations with the other items in this item set and was therefore excluded from scaling. Table 6.2 shows scale descriptions, scale names and number of items for each derived scale. In addition, the table includes scale reliabilities (Cronbach’s alpha) as well as the correlations with student test scores for each year level.
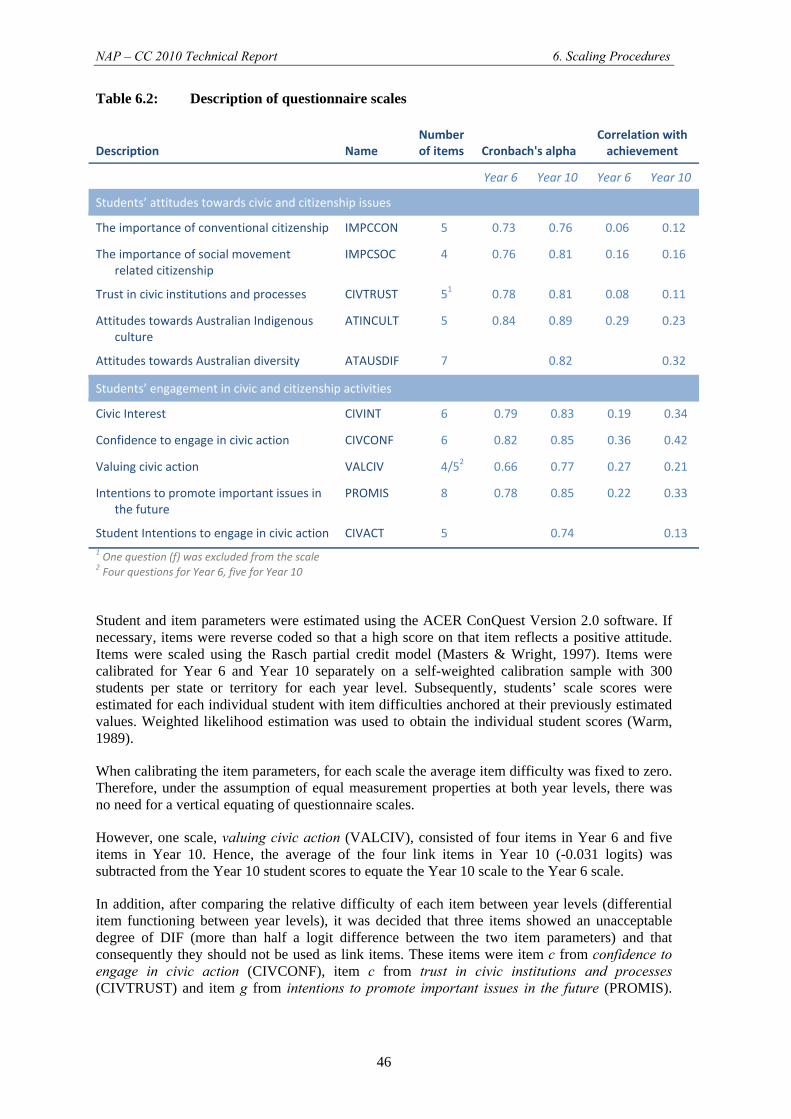
NAP – CC 2010 Technical Report 6. Scaling Procedures
46
Table 6.2: Description of questionnaire scales
Description Name Number of items Cronbach's alpha
Correlation with achievement
Year 6 Year 10 Year 6 Year 10
Students’ attitudes towards civic and citizenship issues
The importance of conventional citizenship IMPCCON 5 0.73 0.76 0.06 0.12
The importance of social movement related citizenship
IMPCSOC 4 0.76 0.81 0.16 0.16
Trust in civic institutions and processes CIVTRUST 51 0.78 0.81 0.08 0.11
Attitudes towards Australian Indigenous culture
ATINCULT 5 0.84 0.89 0.29 0.23
Attitudes towards Australian diversity ATAUSDIF 7 0.82 0.32
Students’ engagement in civic and citizenship activities
Civic Interest CIVINT 6 0.79 0.83 0.19 0.34
Confidence to engage in civic action CIVCONF 6 0.82 0.85 0.36 0.42
Valuing civic action VALCIV 4/52 0.66 0.77 0.27 0.21
Intentions to promote important issues in the future
PROMIS 8 0.78 0.85 0.22 0.33
Student Intentions to engage in civic action CIVACT 5 0.74 0.131 One question (f) was excluded from the scale 2 Four questions for Year 6, five for Year 10
Student and item parameters were estimated using the ACER ConQuest Version 2.0 software. If necessary, items were reverse coded so that a high score on that item reflects a positive attitude. Items were scaled using the Rasch partial credit model (Masters & Wright, 1997). Items were calibrated for Year 6 and Year 10 separately on a self-weighted calibration sample with 300 students per state or territory for each year level. Subsequently, students’ scale scores were estimated for each individual student with item difficulties anchored at their previously estimated values. Weighted likelihood estimation was used to obtain the individual student scores (Warm, 1989).
When calibrating the item parameters, for each scale the average item difficulty was fixed to zero. Therefore, under the assumption of equal measurement properties at both year levels, there was no need for a vertical equating of questionnaire scales.
However, one scale, valuing civic action (VALCIV), consisted of four items in Year 6 and five items in Year 10. Hence, the average of the four link items in Year 10 (-0.031 logits) was subtracted from the Year 10 student scores to equate the Year 10 scale to the Year 6 scale.
In addition, after comparing the relative difficulty of each item between year levels (differential item functioning between year levels), it was decided that three items showed an unacceptable degree of DIF (more than half a logit difference between the two item parameters) and that consequently they should not be used as link items. These items were item c from confidence to engage in civic action (CIVCONF), item c from trust in civic institutions and processes (CIVTRUST) and item g from intentions to promote important issues in the future (PROMIS).
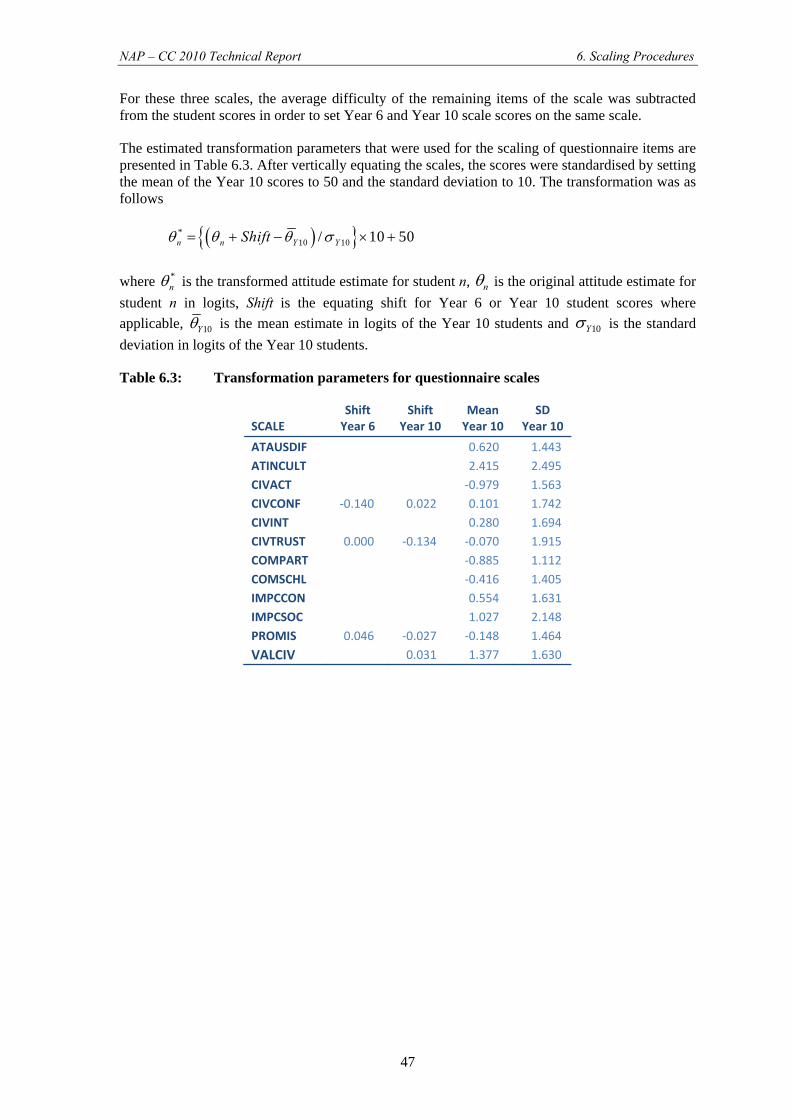
NAP – CC 2010 Technical Report 6. Scaling Procedures
47
For these three scales, the average difficulty of the remaining items of the scale was subtracted from the student scores in order to set Year 6 and Year 10 scale scores on the same scale.
The estimated transformation parameters that were used for the scaling of questionnaire items are presented in Table 6.3. After vertically equating the scales, the scores were standardised by setting the mean of the Year 10 scores to 50 and the standard deviation to 10. The transformation was as follows
( ){ }*10 10/ 10 50n n Y YShiftθ θ θ σ= + − × +
where *nθ is the transformed attitude estimate for student n, nθ is the original attitude estimate for
student n in logits, Shift is the equating shift for Year 6 or Year 10 student scores where applicable, 10Yθ is the mean estimate in logits of the Year 10 students and 10Yσ is the standard deviation in logits of the Year 10 students.
Table 6.3: Transformation parameters for questionnaire scales
SCALE ShiftYear 6
ShiftYear 10
MeanYear 10
SDYear 10
ATAUSDIF 0.620 1.443 ATINCULT 2.415 2.495 CIVACT ‐0.979 1.563 CIVCONF ‐0.140 0.022 0.101 1.742 CIVINT 0.280 1.694 CIVTRUST 0.000 ‐0.134 ‐0.070 1.915 COMPART ‐0.885 1.112 COMSCHL ‐0.416 1.405 IMPCCON 0.554 1.631 IMPCSOC 1.027 2.148 PROMIS 0.046 ‐0.027 ‐0.148 1.464
VALCIV 0.031 1.377 1.630
NAP – CC 2010 Technical Report 7. Proficiency Levels
48
CHAPTER 7: PROFICIENCY LEVELS AND THE PROFICIENT STANDARDS
Julian Fraillon
Proficiency levels One of the key objectives of NAP – CC is to monitor trends in civics and citizenship performance over time. The NAP – CC scale forms the basis for the empirical comparison of student performance. In addition to the metric established for the scale, a set of proficiency levels with substantive descriptions was established in 2004. These described levels are syntheses of the item contents within each level. In 2004 descriptions for Level 1 to Level 5 were established based on the item contents. In 2007 an additional description of Below Level 1 was derived. Comparison of student achievement against the proficiency levels provides an empirically and substantively convenient way of describing profiles of student achievement.
Students whose results are located within a particular level of proficiency are typically able to demonstrate the understandings and skills associated with that level, and also typically possess the understandings and skills defined as applying at lower proficiency levels.
Creating the proficiency levels
The proficiency levels were established in 2004 and were based on an approach developed for the OECD’s Project for International Student Assessment (PISA). For PISA, a method was developed that ensured that the notion of being at a level could be interpreted consistently and in line with the fact that the achievement scale is a continuum. This method ensured that there was some common understanding about what being at a level meant and that the meaning of being at a level was consistent across levels. Similar to the approach taken in the PISA study (OECD, 2005, p.255) this method takes the following three variables into account:
• the expected success of a student at a particular level on a test containing items at that level;
• the width of the levels in that scale; and • the probability that a student in the middle of a level would correctly answer an item of
average difficulty for that level.
To achieve this for NAP – CC, the following two parameters for defining proficiency levels were adopted by the PMRT:
• setting the response probability for the analysis of data at p = 0.62; and • setting the width of the proficiency levels at 1.00 logit.
With these parameters established, the following statements can be made about the achievement of students relative to the proficiency levels.

NAP – CC 2010 Technical Report 7. Proficiency Levels
49
• A student whose result places him/her at the lowest possible point of the proficiency level is likely to get approximately 50 per cent correct on a test made up of items spread uniformly across the level, from the easiest to the most difficult.
• A student whose result places him/her at the lowest possible point of the proficiency level is likely to get 62 per cent correct on a test made up of items similar to the easiest items in the level.
• A student at the top of the proficiency level is likely to get 82 per cent correct on a test made up of items similar to the easiest items in the level.
The final step is to establish the position of the proficiency levels on the scale. This was done together with a standards setting exercise in which a Proficient Standard was established for each year level. The Year 6 Proficient Standard was established as the cut-point between Level 1 and Level 2 on the NAP – CC scale and the Year 10 Proficient Standard was established as the cut-point between Level 2 and Level 3.
Clearly, other solutions with different parameters defining the proficiency levels and alternative inferences about the likely per cent correct on tests could also have been chosen. The approach used in PISA, and adopted for NAP – CC, attempted to balance the notions of mastery and ‘pass’ in a way that is likely to be understood by the community.
Proficiency level cut‐points
Six proficiency levels were established for reporting student performances from the assessment. Table 7.1 identifies these levels by cut-point (in logits and scale score) and shows the percentage of Year 6 and Year 10 students in each level in NAP – CC 2010.
Table 7.1: Proficiency level cut-points and percentage of Year 6 and Year 10 students in each level in 2010
Cut‐points Percentage
Proficiency Level Logits Scale Scores Year 6 Year 10
Level 5 0 1
Level 4 1 12
Level 3 13 36
Level 2 38 32
Level 1 35 14
Below Level 1 13 5
Describing proficiency levels
To describe the proficiency levels, a combination of experts’ knowledge of the skills required to answer each civics and citizenship item and information from the analysis of students’ responses was utilised.
2.34 795
1.34 665
0.34 535
‐0.66 405
‐1.66 275
NAP – CC 2010 Technical Report 7. Proficiency Levels
50
Appendix H provides the descriptions of the knowledge and skills required of students at each proficiency level. The descriptions reflect the skills assessed by the full range of civics and citizenship items covering Aspects 1 and 2 of the assessment framework.
Setting the standards The process for setting standards in areas such as primary science, information and communications technologies, civics and citizenship and secondary (15-year-old) reading, mathematics and science was endorsed by the PMRT at its 6 March 2003 meeting and is described in the paper, Setting National Standards (PMRT, 2003).
This process, referred to as the empirical judgemental technique, requires stakeholders to examine the test items and the results from the national assessments and agree on a proficient standard for the two year levels.
The standards for NAP – CC were set in March 2005, following the 2004 assessment. A description of this process is given in the NAP – CC 2004 Technical Report (Wernert, Gebhardt, Murphy and Schulz, 2006).
The cut-point of the Year 6 Proficient Standard was located at -0.66 logits on the 2004 scale. This defined the lower edge of Proficiency Level 2 in Table 7.1. The Year 10 Proficient Standard is located at the lower edge of Proficiency Level 3.
The Proficient Standards for Year 6 and Year 10 civics and citizenship achievement were endorsed by the Key Performance Measures subgroup of the PMRT in 2005.
NAP – CC 2010 Technical Report 8. Reporting of Results
51
CHAPTER 8: REPORTING OF RESULTS
Eveline Gebhardt & Wolfram Schulz
Student samples were obtained through two-stage cluster sampling procedures: in the first stage schools were sampled from a sampling frame with a probability proportional to their size; in the second stage intact classes were randomly sampled within schools (see Chapter 3 on sampling and weighting). Cluster sampling techniques permit an efficient and economic data collection. However, these samples are not simple random samples and using the usual formulae to obtain standard errors of population estimates would not be appropriate.
This chapter describes the method that was used to compute standard errors. Subsequently it describes the types of statistical analyses and significance tests that were carried for reporting of results in the NAP – CC Years 6 and 10 Report 2010.
Computation of sampling and measurement variance Unbiased standard errors include both sampling variance and measurement variance. Replication techniques provide tools to estimate the correct sampling variance on population estimates (Wolter, 1985; Gonzalez and Foy, 2000) when subjects were not selected through simple random sampling. For NAP – CC the jackknife repeated replication technique (JRR) is used to compute the sampling variance for population means, differences, percentages and correlation coefficients. The other component of the standard error of achievement test scores, the measurement variance, can be computed using the variance between the five plausible values. In addition, for comparing achievement test scores with those from previous cycles, equating error is added as a third component of the standard error.
Replicate weights
Generally, the JRR method for stratified samples requires the pairing of primary sampling units (PSUs)—here: schools—into pseudo-strata. Assignment of schools to these so-called sampling zones needs to be consistent with the sampling frame from which they were sampled. Sampling zones were constructed within explicit strata and schools were sorted in the same way as in the sampling frame so that adjacent schools were as similar to each other as possible. Subsequently pairs of adjacent schools were combined into sampling zones. In the case of an odd number of schools within an explicit stratum or the sampling frame, the remaining school was randomly divided into two halves and each half assigned to the two other schools in the final sampling zone to form pseudo-schools. One-hundred-and-sixty-five sampling zones were used for the Year 6 and 154 for the Year 10 data in 2010.
For each of the sampling zones a so-called replicate weight variable was computed so that one random school of the paired schools had a contribution of zero (jackknife indicator is zero) and the other a double contribution (jackknife indicator equals two) whereas all other schools remained the same (jackknife indicator equals one). One replicate weight for each sampling zone replicate weights is computed by simply multiplying student weights with the jackknife indicators.
NAP – CC 2010 Technical Report 8. Reporting of Results
52
For each year level sample 165 replicate weights were created. In Year 10, which had only 154 sampling zones, the last 11 replicate weights were equal to the final sampling weight. This was done to have a consistent number of replicate weight variables in the final database.
Standard errors
In order to compute the sampling variance for a statistic t, t is estimated once for the original sample S and then for each of the jackknife replicates Jh. The JRR variance is computed using the formula
( ) [ ]2
1
)()(∑=
−=H
hhjrr StJttVar
where H is the number of sampling zones, t(S) the statistic t estimated for the population using the final sampling weights, and t(Jh) the same statistic estimated using the weights for the hth jackknife replicate. For all statistics that are based on variables other then student test scores (plausible values) the standard error of t is equal to
( )tVart jrr=)(σ
The computation of JRR variance can be obtained for any statistic. Standard statistical software does not generally include any procedures for replication techniques. Specialist software, the SPSS® Replicates Add-in7, was used to run tailored SPSS® macros which are described in the PISA Data Analysis Manual SPSS®, Second Edition (OECD, 2009b) to estimate JRR variance for means and percentages.
Population statistics on civics and citizenship achievement scores were always estimated using all five plausible values. If θ is any computed statistic and iθ is the statistic of interest computed on one plausible value, then
∑=
=M
iiM 1
1 θθ
with M being the number of plausible values.
The sampling variance U is calculated as the average of the sampling variance for each plausible value Ui
∑=
=M
iiU
MU
1
1
Using five plausible values for data analysis also allows the estimation of the amount of error associated with the measurement of civics and citizenship ability due to the lack of precision of the test. The measurement variance or imputation variance BM was computed as
( )2
111 ∑
=
−−
=M
iiM M
B θθ
7 The SPSS® add-in is available from the public website https://mypisa.acer.edu.au
NAP – CC 2010 Technical Report 8. Reporting of Results
53
The sampling variance and measurement variance were combined in the following way to compute the standard error
11 mSE U BM
⎛ ⎞= + +⎜ ⎟⎝ ⎠
with U being the sampling variance.
The 95 per cent confidence interval, as presented in the NAP – CC Years 6 and 10 Report 2010, is 1.96 times the standard error. The actual confidence interval of a statistic is from the value of the statistic minus 1.96 times the standard error to the value of the statistic plus 1.96 times the standard error.
Reporting of mean differences The NAP – CC Years 6 and 10 Report 2010 included comparisons of achievement test results across states and territories, that is, means of scales and percentages were compared in graphs and tables. Each population estimate was accompanied by its 95 per cent confidence interval. In addition, tests of significance for the difference between estimates were provided, in order to describe the probability that differences were just a result of sampling and measurement error.
The following types of significance tests for achievement mean differences in population estimates were reported:
• between states and territories; • between student background subgroups; and • between assessment cycles 2007 and 2010.
Mean differences between states and territories and year levels
Pair wise comparison charts allow the comparison of population estimates between one state or territory and another or between Year 6 and Year 10. Differences in means were considered significant when the test statistic t was outside the critical values ±1.96 (α = 0.05). The t value is calculated by dividing the difference in means by its standard error that is given by the formula
22_ jiijdif SESESE +=
where SEdif_ij is the standard error of the difference and SEi and SEj are the standard errors of the compared means i and j. The standard error of a difference can only be computed in this way if the comparison is between two independent samples like states and territories or year levels. Samples are independent if they were drawn separately.
Mean differences between dependent subgroups
The formula for calculating the standard error provided above is only suitable when the subsamples being compared are independent (see OECD 2009b for more detailed information). In case of dependent subgroups, the covariance between the two standard errors needs to be taken into account and JRR should be used to estimate the sampling error for mean differences. As subgroups other than state or territory and year level are dependent subsamples (for example gender, language background and country of birth subgroups), the difference between statistics for subgroups of interest and the standard error of the difference were derived using the SPSS® Replicates Add-in. Differences between subgroups were considered significant when the test
NAP – CC 2010 Technical Report 8. Reporting of Results
54
statistic t was outside the critical values ±1.96 (α = 0.05). The value t was calculated by dividing the mean difference by its standard error.
Mean differences between assessment cycles 2007 and 2010
The NAP – CC Years 6 and 10 Report 2010 also included comparisons of achievement results across cycles. As the process of equating the tests across the cycles introduces some additional error into the calculation of any test statistic, an equating error term was added to the formula for the standard error of the difference (between cycle means, for example). The computation of the equating errors is described in Chapter 6.
The value of the equating error between 2007 and 2010 is 5.280 units on the NAP – CC scale for Year 6 and 4.305 for Year 10 (see also Chapter 6). When testing the difference of a statistic between the two assessments, the standard error of the difference is computed as follows
( ) 2 2 210 07 10 07SE SE SE EqErrµ µ− = + +
where µ can be any statistic in units on the NAP – CC scale (mean, percentile, gender difference, but not percentages) and SE is the respective standard error of this statistic.
To report the significance of differences between percentages at or above Proficient Standards, the equating error for each year level could not directly be applied. Therefore, the following replication method was applied to estimate the equating error for percentages at Proficient Standards.
For each year level cut-point that defines the corresponding Proficient Standard (405 for Year 6 and 535 for Year 10), a number of n replicate cut-points were generated by adding a random error component with a mean of 0 and a standard deviation equal to the estimated equating error (5.280 for Year 6 and 4.305 for Year 10). Percentages of students at or above each replicate cut-point (ρn) were computed and an equating error for each year level was estimated as
( ) ( )n
EquErr on2ρρ
ρ−
=
where ρo is the percentage of students at or above the (reported) Proficient Standard. The standard errors of the differences between percentages at or above Proficient Standards were calculated as
( ) ( ) ( ) ( )2 2 210 07 10 07SE SE SE EqErrρ ρ ρ ρ ρ− = + +
where ρ10 is the percentages at or above the Proficient Standard in 2010 and ρ07 in 2007.
For NAP – CC 2010, 5000 replicate cut-points were created. Equating errors were estimated for each sample or subsample of interest. The values of these equating errors are in Table 8.1.
Other statistical analyses While most tables in the NAP – CC Years 6 and 10 Report 2010 present means and mean differences, some also included a number of additional statistical analyses.
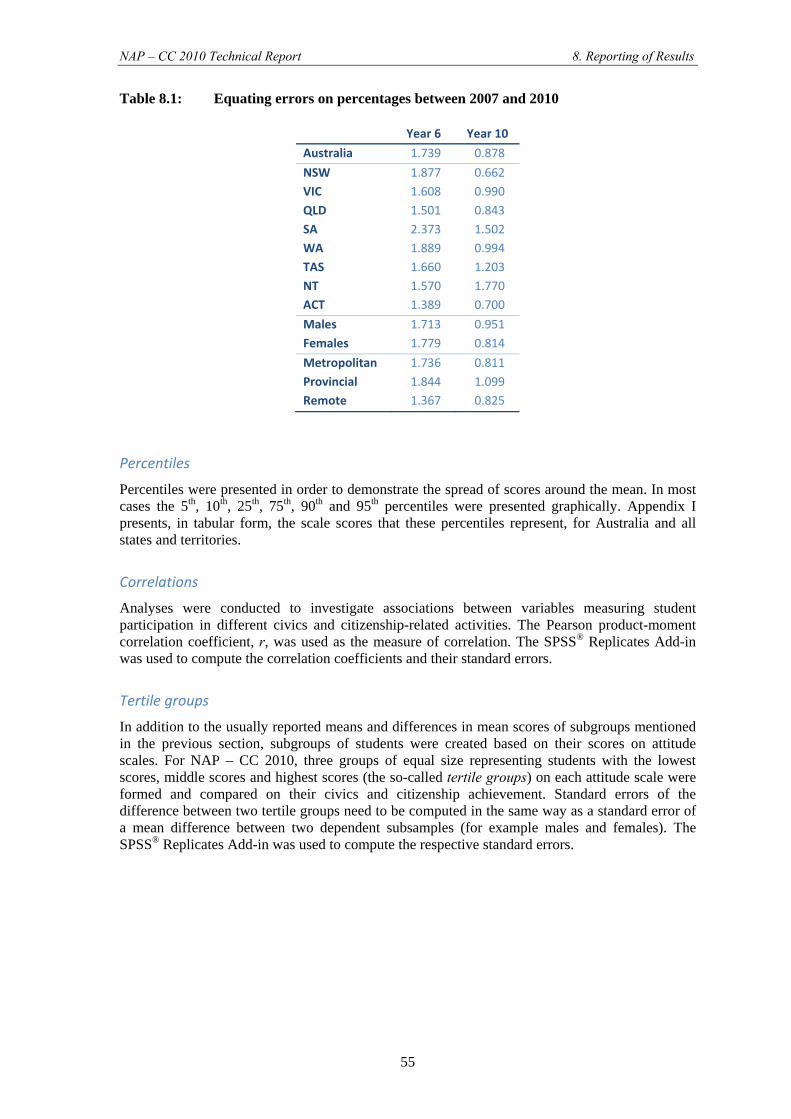
NAP – CC 2010 Technical Report 8. Reporting of Results
55
Table 8.1: Equating errors on percentages between 2007 and 2010
Year 6 Year 10
Australia 1.739 0.878
NSW 1.877 0.662VIC 1.608 0.990QLD 1.501 0.843SA 2.373 1.502WA 1.889 0.994TAS 1.660 1.203NT 1.570 1.770ACT 1.389 0.700
Males 1.713 0.951Females 1.779 0.814
Metropolitan 1.736 0.811Provincial 1.844 1.099Remote 1.367 0.825
Percentiles
Percentiles were presented in order to demonstrate the spread of scores around the mean. In most cases the 5th, 10th, 25th, 75th, 90th and 95th percentiles were presented graphically. Appendix I presents, in tabular form, the scale scores that these percentiles represent, for Australia and all states and territories.
Correlations
Analyses were conducted to investigate associations between variables measuring student participation in different civics and citizenship-related activities. The Pearson product-moment correlation coefficient, r, was used as the measure of correlation. The SPSS® Replicates Add-in was used to compute the correlation coefficients and their standard errors.
Tertile groups
In addition to the usually reported means and differences in mean scores of subgroups mentioned in the previous section, subgroups of students were created based on their scores on attitude scales. For NAP – CC 2010, three groups of equal size representing students with the lowest scores, middle scores and highest scores (the so-called tertile groups) on each attitude scale were formed and compared on their civics and citizenship achievement. Standard errors of the difference between two tertile groups need to be computed in the same way as a standard error of a mean difference between two dependent subsamples (for example males and females). The SPSS® Replicates Add-in was used to compute the respective standard errors.
NAP – CC 2010 Technical Report References
56
REFERENCES
Adams, R. J., & Wu, M. L. (2002). PISA 2000 Technical Report. Paris: OECD.
Curriculum Corporation (2006). Statements of Learning for Civics and Citizenship. Carlton South: Curriculum Corporation.
Gonzalez, E. J., & Foy, P. (2000). Estimation of sampling variance. In: M.O. Martin, K.D. Gregory & S.E. Semler (Eds.), TIMSS 1999 Technical Report. Chestnut Hill, MA: Boston College.
Kish, L. (1965). Survey Sampling. New York: John Wiley & Sons.
Masters, G. N., & Wright, B. D. (1997). The partial credit model. In: W.J Van der Linden & R.K. Hambleton (Eds.), Handbook of Modern Item Response Theory 101–122. New York/Berlin/Heidelberg: Springer.
MCEECDYA (2009). 2010 Data Standards Manual – Student Background Characteristics. Carlton South: MCEECDYA.
ACARA (2011). National Assessment Program – Civics and Citizenship Years 6 and 10 Report 2010. Sydney: ACARA.
MCEETYA (2006). National Assessment Program – Civics and Citizenship Years 6 and 10 Report 2004. Melbourne: MCEETYA.
MCEETYA (2008). Melbourne Declaration on Educational Goals for Young Australians. Melbourne: MCEETYA
Mislevy, R. J. (1991). Randomization-based inference about latent variables from complex samples. Psychometrika, 56, 177−196.
Mislevy, R. J., & Sheehan, K. M. (1987). Marginal estimation procedures. In: A.E. Beaton (Ed.), The NAEP 1983-1984 Technical Report, 293−360. Princeton, NJ: Educational Testing Service.
Monseur, C., & Berezner, A. (2007). The computation of equating errors in international surveys in education. Journal of Applied Measurement, 8(3), 323−335.
OECD (2005). PISA 2003 Technical Report. Paris: OECD.
OECD (2009a). PISA 2006 Technical Report. Paris: OECD.
OECD (2009b). PISA Data Analysis Manual SPSS® Second Edition. Paris: OECD.
Olson, J. F., Martin, M. O., & Mullis, I. V. S. (Eds.). (2008). TIMSS 2007 Technical Report. Chestnut Hill, MA: TIMSS & PIRLS International Study Center, Boston College.
NAP – CC 2010 Technical Report References
57
PMRT (2003). Setting National Standards. Paper presented at the March 2003 meeting of the Performance Measurement and Reporting Taskforce.
Rasch, G. (1960). Probabilistic Models for Some Intelligence and Attainment Tests. Copenhagen: Nielsen and Lydiche.
Schulz, W., Fraillon, J., Ainley, J., Losito, B., & Kerr, D. (2008). International Civic and Citizenship Education Study : Assessment Framework. Amsterdam: IEA.
Von Davier, M., Gonzalez, E., & Mislevy, R. (2009). What are plausible values and why are they useful? IERI Monograph Series, (Vol. 2, pp 9−36). Hamburg and Princeton: IERInstitute and ETS.
Warm T. A. (1989). Weighted likelihood estimation of ability in Item Response Theory. Psychometrika, 54, 427−450.
Wernert, N., Gebhardt, E., & Schulz, W. (2009). National Assessment Program − Civics and Citizenship Year 6 and Year 10 Technical Report 2007. Melbourne: ACER.
Wernert, N., Gebhardt, E., Murphy, M., & Schulz, W. (2006). National Assessment Program – Civics and Citizenship Years 6 and 10 Technical Report 2004. Melbourne: ACER.
Wolter, K. M. (1985). Introduction to Variance Estimation. New York: Springer-Verlag.
Wu, M. L., Adams, R. J., Wilson, M. R., & Haldane, S. A. (2007). ACER ConQuest Version 2.0: Generalised item response modelling software [computer program]. Melbourne: ACER.
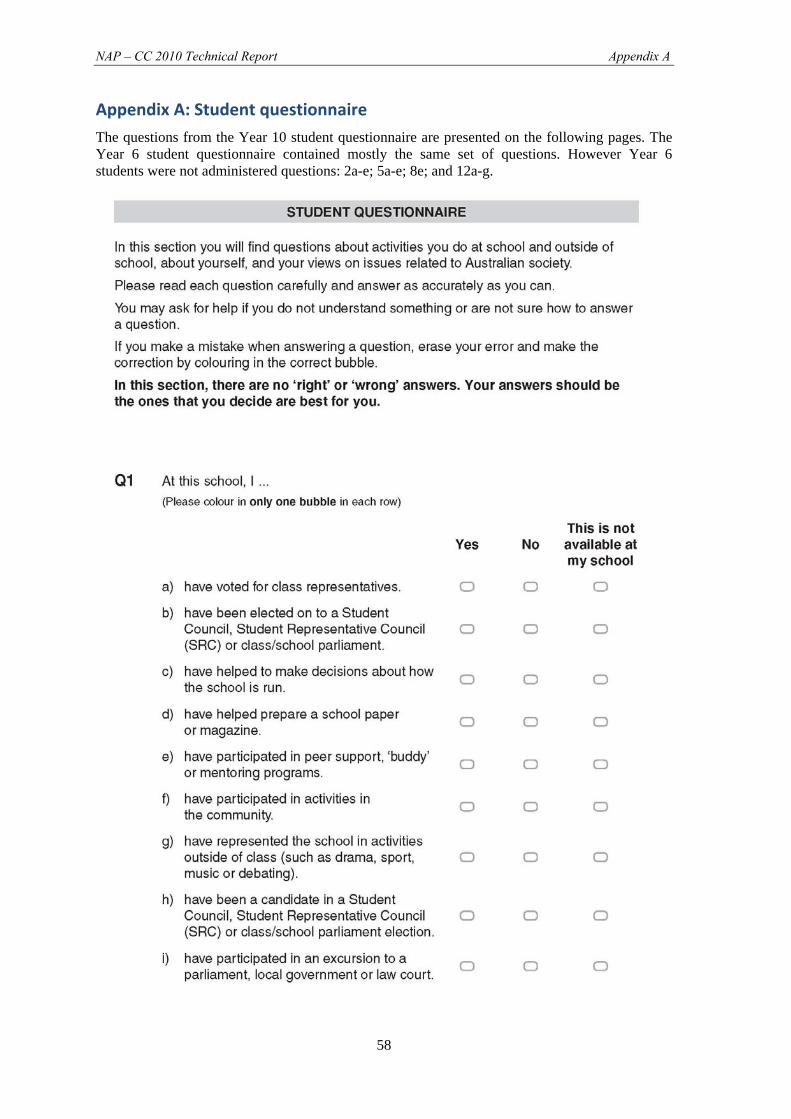
NAP – CC 2010 Technical Report Appendix A
58
Appendix A: Student questionnaire The questions from the Year 10 student questionnaire are presented on the following pages. The Year 6 student questionnaire contained mostly the same set of questions. However Year 6 students were not administered questions: 2a-e; 5a-e; 8e; and 12a-g.
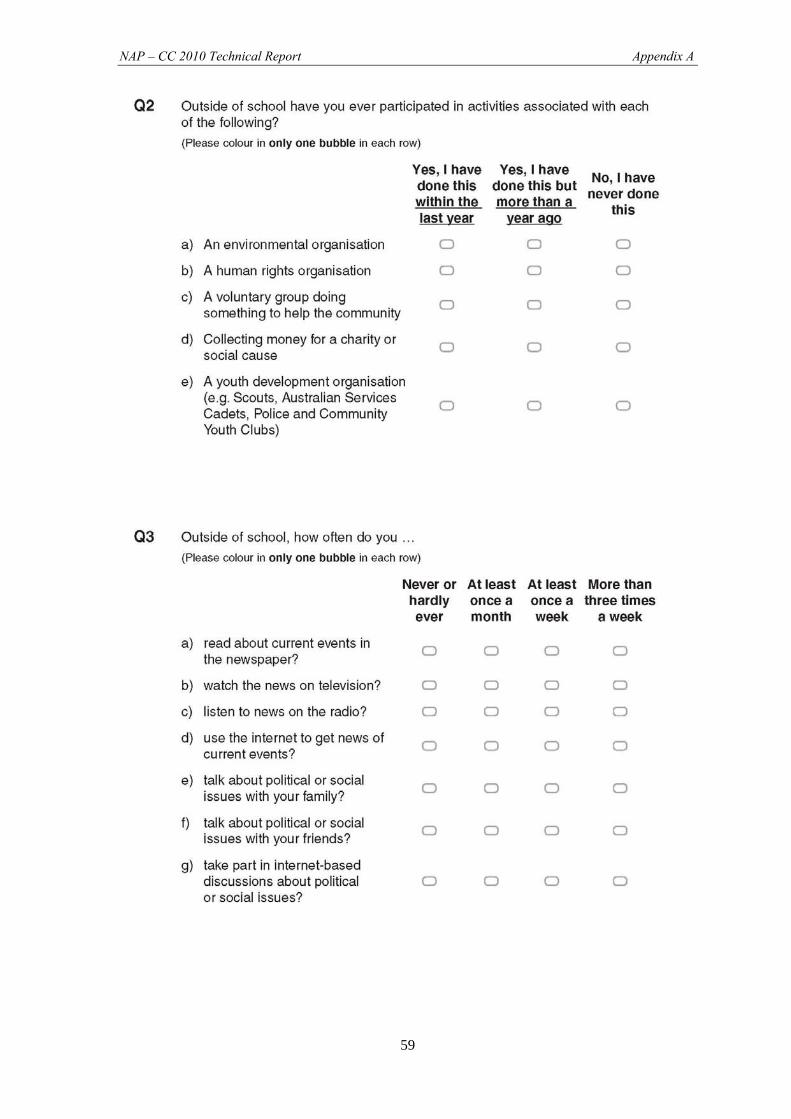
NAP – CC 2010 Technical Report Appendix A
59
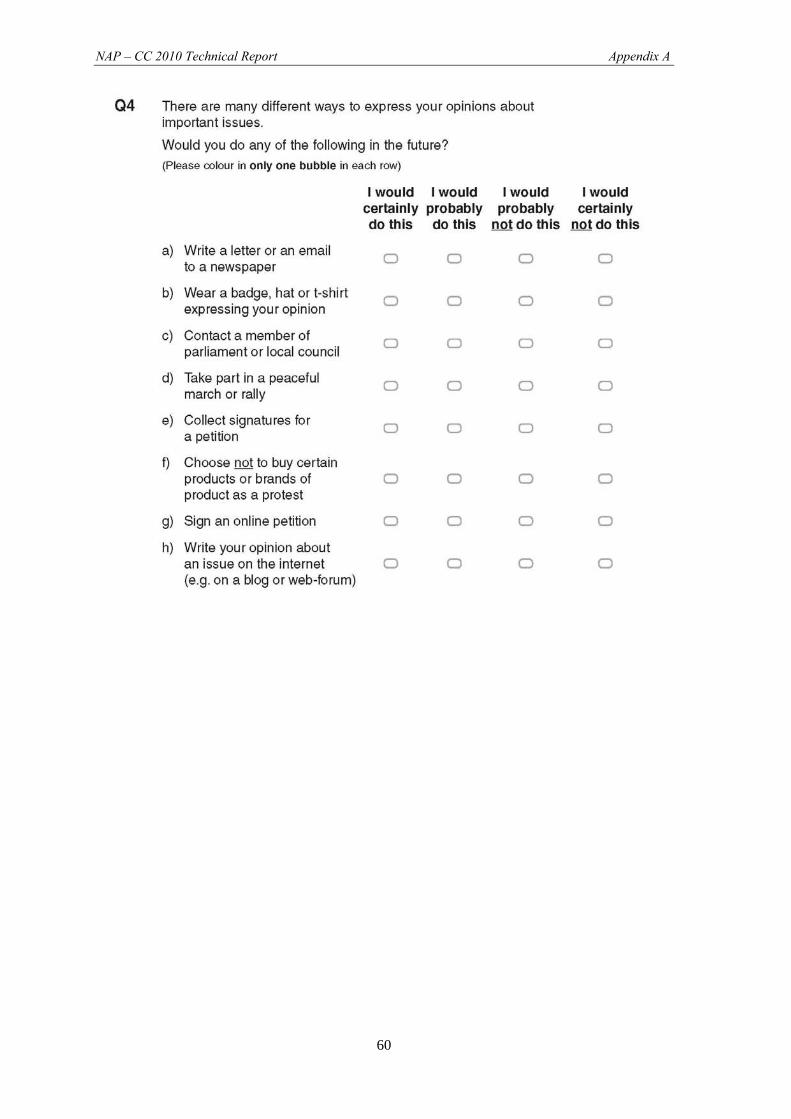
NAP – CC 2010 Technical Report Appendix A
60
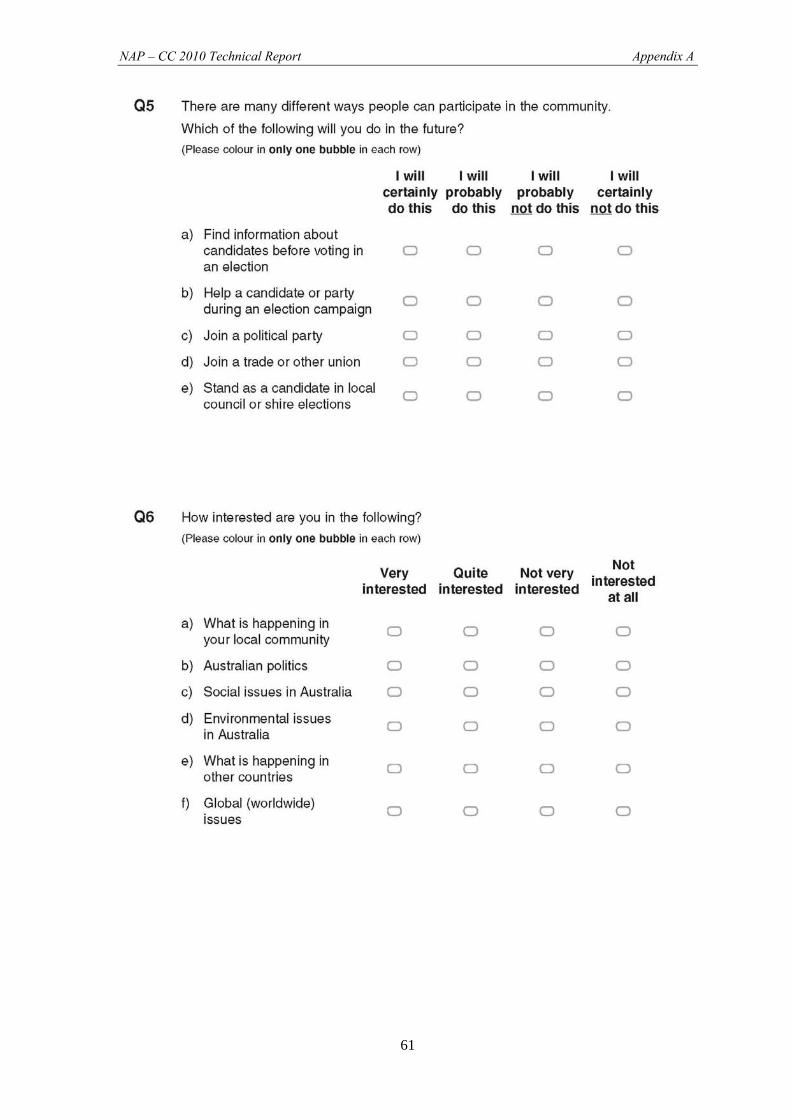
NAP – CC 2010 Technical Report Appendix A
61
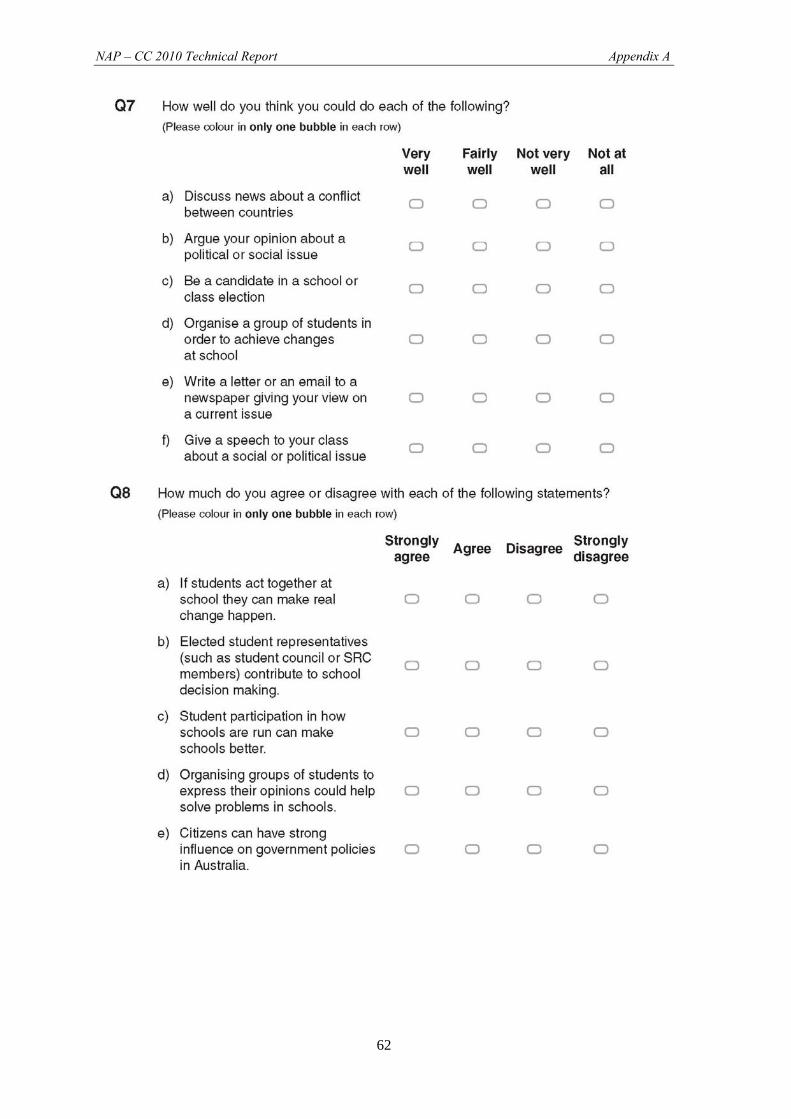
NAP – CC 2010 Technical Report Appendix A
62
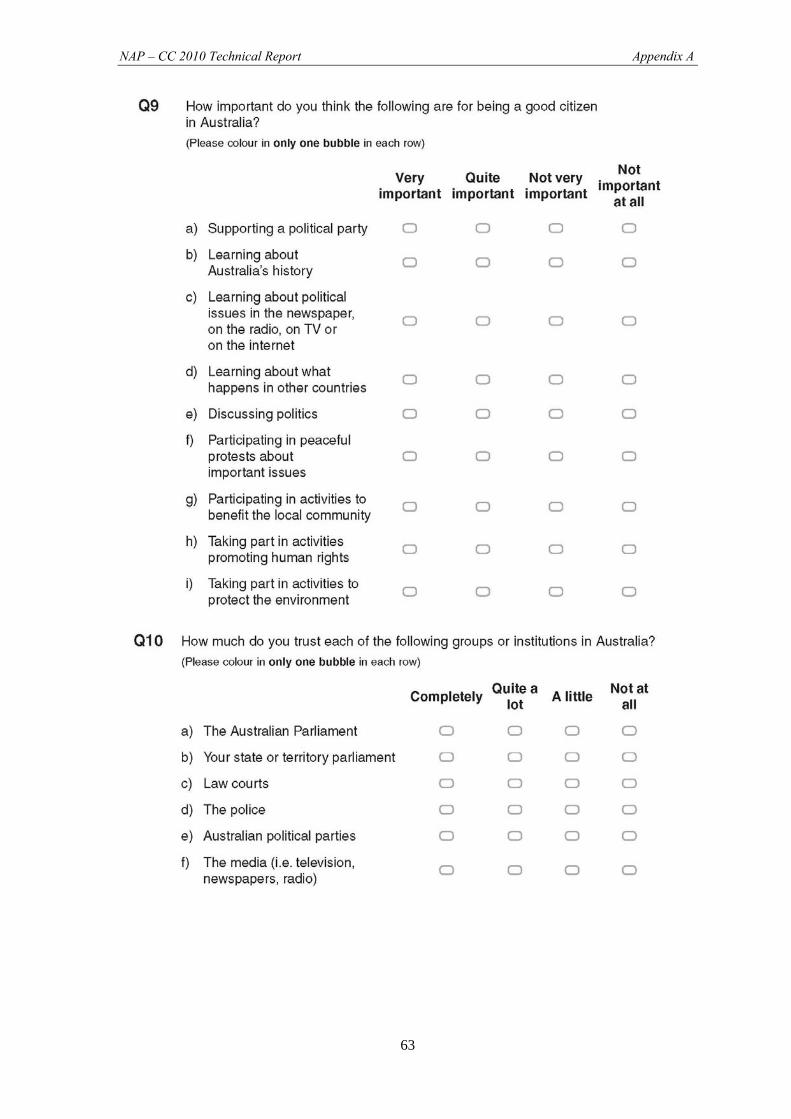
NAP – CC 2010 Technical Report Appendix A
63
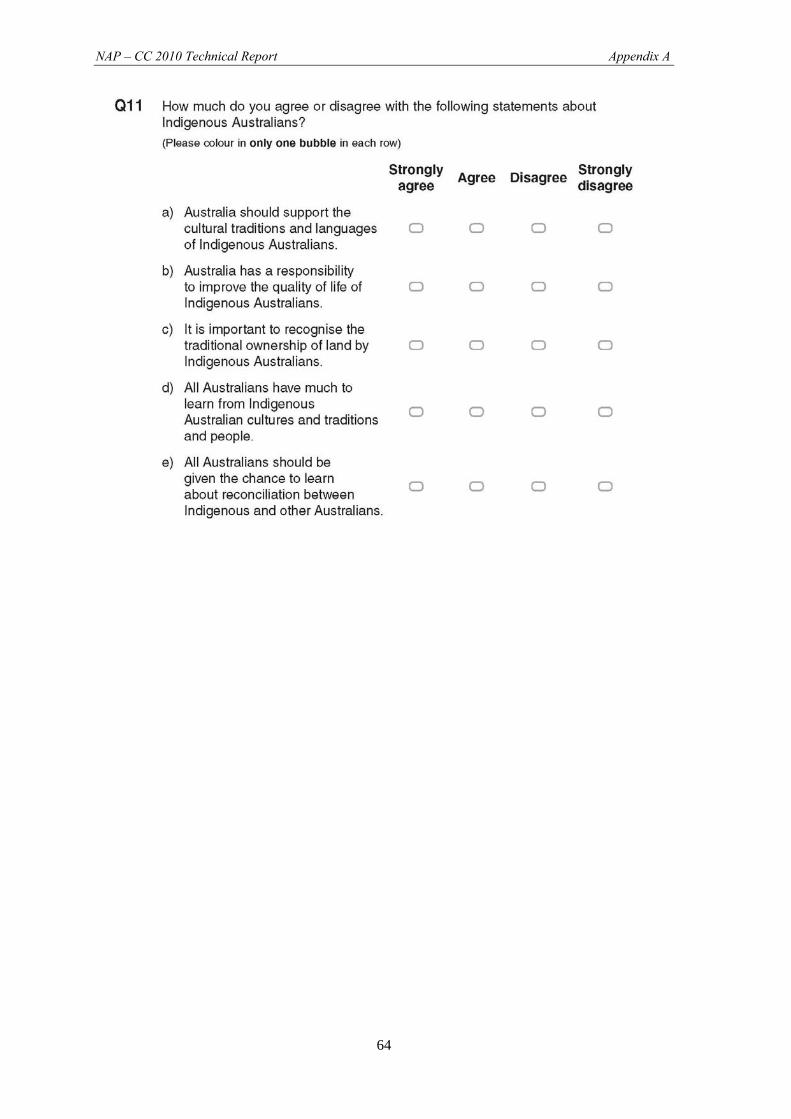
NAP – CC 2010 Technical Report Appendix A
64
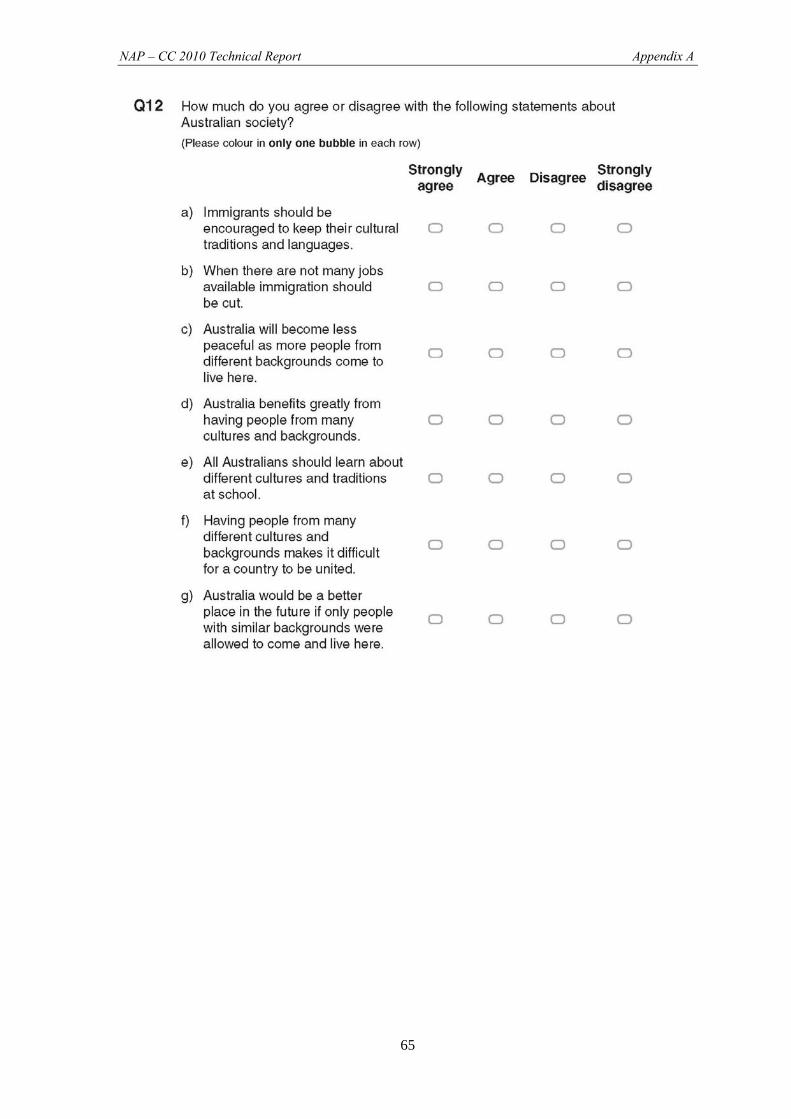
NAP – CC 2010 Technical Report Appendix A
65
NAP – CC 2010 Technical Report Appendix B
66
Appendix B: Weighted participation rates
Year 6 participation rates Year 10 participation rates
School Student Overall School Student Overall
Including replacement schools
Australia 99 93 92 99 87 87
NSW 98 93 91 100 88 88
VIC 100 92 92 98 86 84
QLD 98 93 91 100 88 88
SA 100 93 93 100 85 85
WA 100 93 93 100 89 89
TAS 96 92 88 95 86 81
NT 93 89 83 81 82 66
ACT 100 93 93 100 86 86
Excluding replacement schools
Australia 98 93 91 98 87 86
NSW 96 93 90 100 88 88
VIC 99 92 91 94 86 80
QLD 98 93 91 100 88 88
SA 100 93 93 98 85 83
WA 100 93 93 100 89 89
TAS 96 92 88 95 86 81
NT 90 89 81 81 82 66
ACT 100 93 93 100 86 86
NAP – CC 2010 Technical Report Appendix C
67
Appendix C: Quality monitoring report
NAP – CC 2010 Technical Report Appendix C
68
NAP – CC 2010 Technical Report Appendix C
69
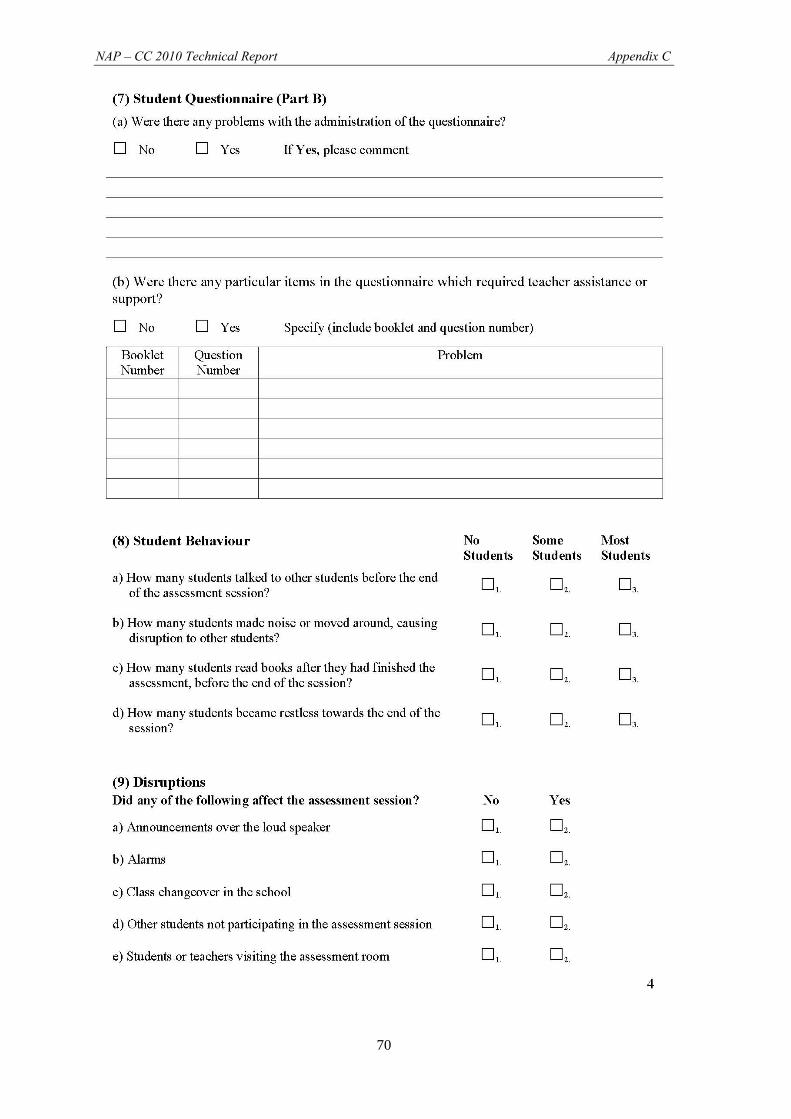
NAP – CC 2010 Technical Report Appendix C
70

NAP – CC 2010 Technical Report Appendix C
71
NAP – CC 2010 Technical Report Appendix D
72
Appendix D: Detailed results of quality monitor's report This appendix contains a summary of the findings from the NAP – CC 2010 quality monitoring program. Thirty-two schools were visited (17 primary schools and 15 secondary schools), equalling five per cent of the sample. The schools in the quality monitoring program included schools from all states and territories, all sectors and also covered metropolitan, regional and remote areas.
Timing
While much of the timing of the different assessment administration tasks are given as a guide, the time for Part A (the cognitive assessment) was to be no more than 60 minutes at Year 6 and no more than 75 minutes at Year 10 (the assessment could finish earlier if all students had finished before then). Therefore, the quality monitors were asked to record the start and finish times for Part A. While Part B (the student questionnaire) did not have bounded times, the start and finish times for this were also recorded.
Table D.1 presents the average time taken for Parts A and B at Year 6 and Year 10, as well as the shortest and longest recorded times for each part at each year level.
Table D.1: Average, minimum and maximum times taken for parts A and B of NAP – CC 2010
Year 6 Year 10
Part A Part B Part A Part B
Recorded administration time
Average 52 16 52 17
Shortest recorded 37 8 33 13
Longest recorded 60 20 67 30
As well as recording the actual time taken, quality monitors were asked to indicate how long ‘most of the students’ took to complete each of Parts A and B, and also how long the slowest students took to complete each of Parts A and B. Table D.2 presents the average time taken as well as the shortest and longest times recorded for each part at each year level, for each of these questions.
Table D.2: Average, minimum and maximum times recorded for ‘most students’ and for the ‘slowest students’ for parts A and B of NAP – CC 2010
Year 6 Year 10
Part A Part B Part A Part B
Time Taken by 'most students'
Average 38 12 38 11
Shortest recorded 28 8 30 6
Longest recorded 50 15 50 13
Time Taken by 'the slowest students'
Average 50 15 51 15
Shortest recorded 38 8 33 10
Longest recorded 60+ 20 67 20
NAP – CC 2010 Technical Report Appendix D
73
Location for the assessment
At all schools visited, the location of the assessment was judged to match the requirements set out in the School contact officer’s manual.
Administration of the assessment (Parts A and B)
A total of four schools (two at each year level) were noted as having varied from the script given in the Assessment administrator’s manual. In all cases these variations were considered to have been minor (e.g. addition or deletion of single words or omitting to ask for student responses to the practice questions).
Similarly, only five schools were said to have departed from the instructions on the timing of the assessment and all but one of these variations was considered to have been minor (mainly to do with the administration tasks). In the case where the variation was considered to have been major, the teacher had underestimated the time required, so each student was moved onto Part B as they finished Part A.
In none of these situations was it judged that the variations made to the script or timing of the assessment affected the performance of the students.
Completion of the Student participation form
In all cases the assessment administrator was judged to have recorded attendance properly on the Student participation form. The assignment of the spare booklets to new students was only required in seven schools and in all cases this was done correctly. There were no instances of the spare booklets being needed for lost or damaged booklets.
Assessment booklet content and format
There were two recorded instances of problems with the assessment booklets. In both cases, this was to do with the names on the pre-printed label – in one case the names were not all from the selected class, in the other, surnames had been printed before first names.
There were no recorded instances of problems with specific items.
Assistance given
Assessment administrators were instructed to give only limited assistance to students – they could read a question aloud if required, or answer any general questions about the task, but not answer any questions about any specific questions. In all cases but three (all at Year 6) the quality monitor judged that the assessment administrator had answered all questions appropriately. Where they had not, the assessment administrator provided some interpretation of the intent of the question but this was not judged to have provided the answer to the question.
Extra assistance was given to students with special needs in five schools (four at Year 6 and one at Year 10). The assistance, in most cases, was provided by a teacher assistant who read the questions to the student in another room. In some cases the student was also given a little longer to complete the assessment. One student, with a vision impairment, was allowed to use a magnifying glass and ruler to enable him to complete the assessment independently.
Student questionnaire
There was one recorded instance of problems with the administration of the student questionnaire. This was simply disruption by a restless student.
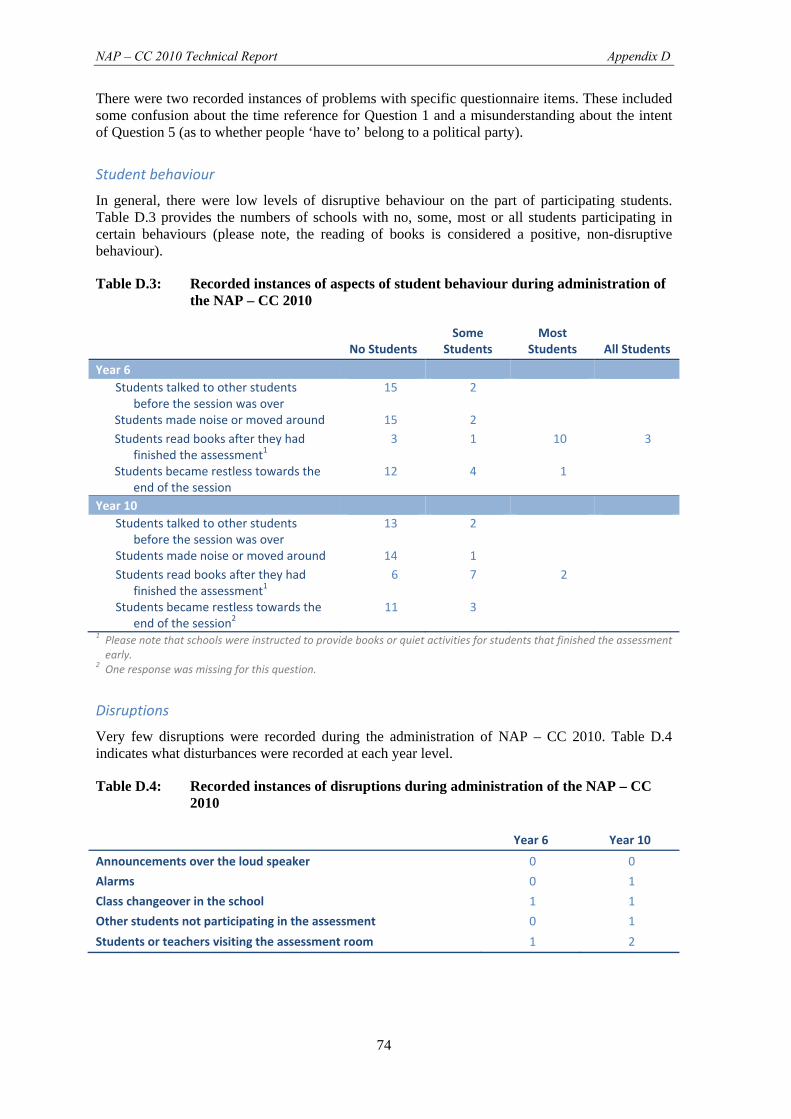
NAP – CC 2010 Technical Report Appendix D
74
There were two recorded instances of problems with specific questionnaire items. These included some confusion about the time reference for Question 1 and a misunderstanding about the intent of Question 5 (as to whether people ‘have to’ belong to a political party).
Student behaviour
In general, there were low levels of disruptive behaviour on the part of participating students. Table D.3 provides the numbers of schools with no, some, most or all students participating in certain behaviours (please note, the reading of books is considered a positive, non-disruptive behaviour).
Table D.3: Recorded instances of aspects of student behaviour during administration of the NAP – CC 2010
No Students Some
Students Most
Students All Students
Year 6 Students talked to other students
before the session was over 15 2
Students made noise or moved around 15 2 Students read books after they had
finished the assessment1 3 1 10 3
Students became restless towards the end of the session
12 4 1
Year 10 Students talked to other students
before the session was over 13 2
Students made noise or moved around 14 1 Students read books after they had
finished the assessment1 6 7 2
Students became restless towards the end of the session2
11 3
1 Please note that schools were instructed to provide books or quiet activities for students that finished the assessment early.
2 One response was missing for this question.
Disruptions
Very few disruptions were recorded during the administration of NAP – CC 2010. Table D.4 indicates what disturbances were recorded at each year level.
Table D.4: Recorded instances of disruptions during administration of the NAP – CC 2010
Year 6 Year 10
Announcements over the loud speaker 0 0
Alarms 0 1
Class changeover in the school 1 1
Other students not participating in the assessment 0 1
Students or teachers visiting the assessment room 1 2

NAP – CC 2010 Technical Report Appendix D
75
Follow‐up session
Schools were required to hold a follow-up session if less than 85 per cent of the eligible students participated in the assessment session. A follow-up session was judged to be required in two Year 6 schools and six Year 10 schools. In all but two cases (both Year 10) the quality monitor made the assessment that these schools would undertake the follow-up session. Where a follow-up session was judged to be unlikely, this was due to either logistics or a high number of regular absentees.
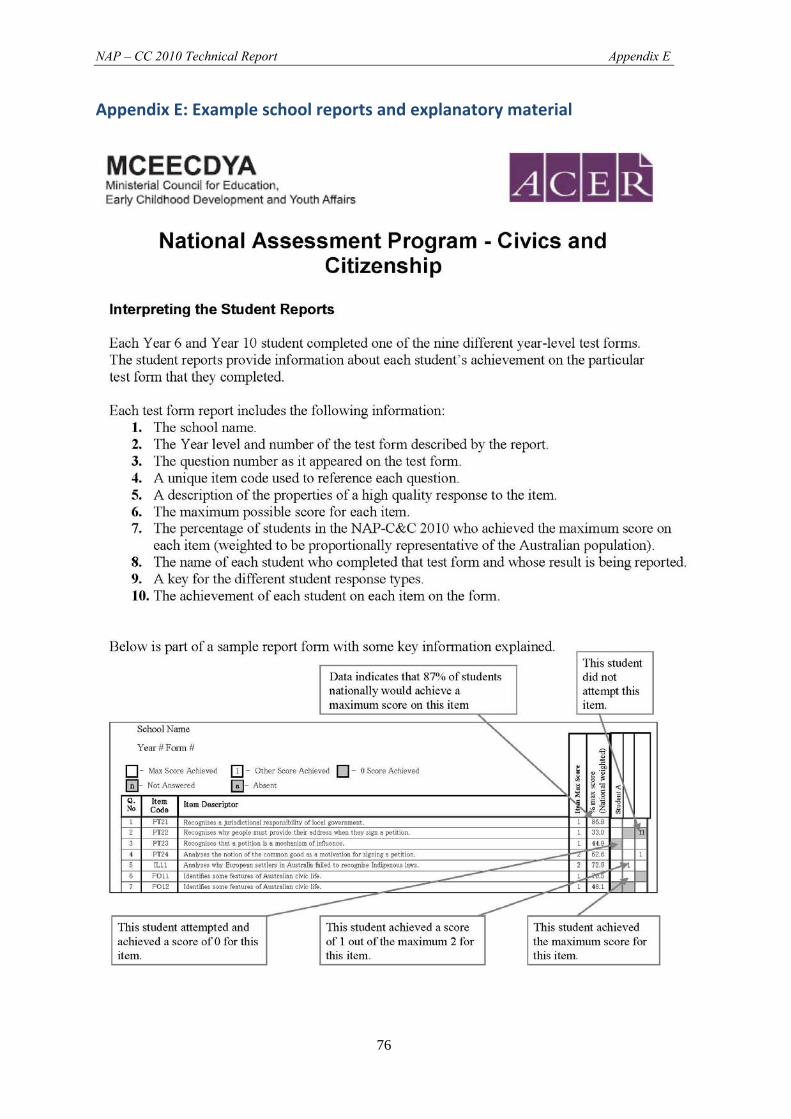
NAP – CC 2010 Technical Report Appendix E
76
Appendix E: Example school reports and explanatory material
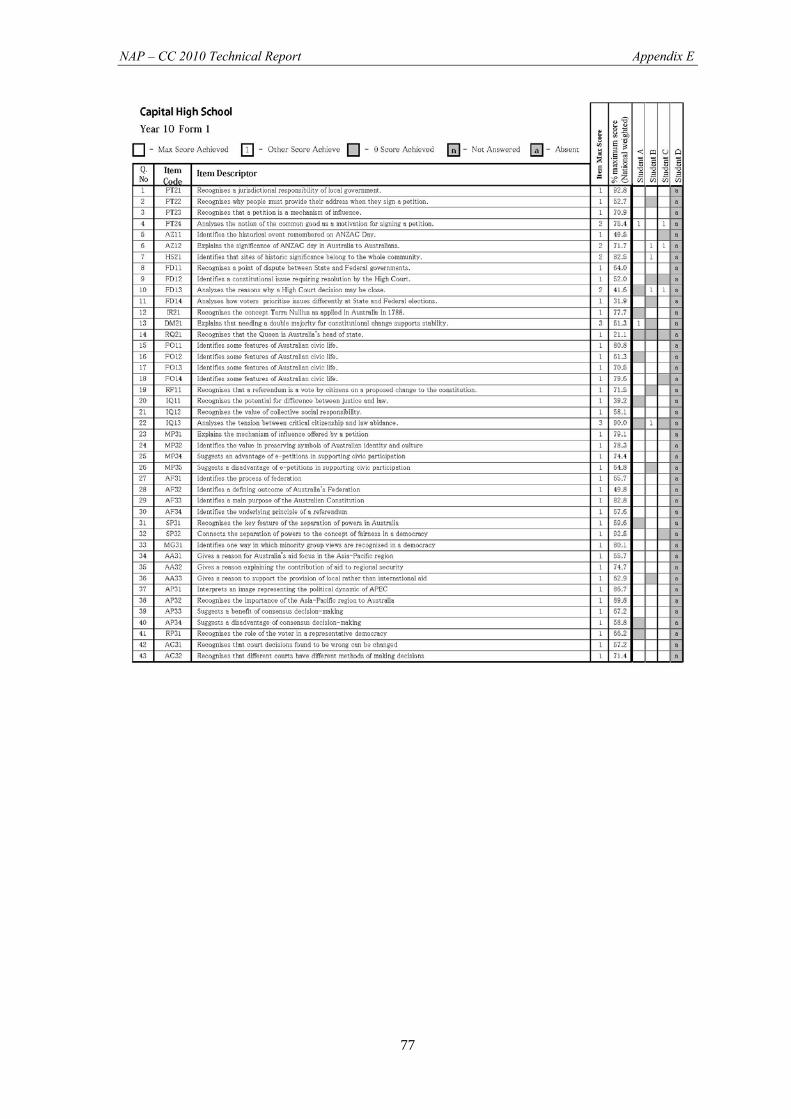
NAP – CC 2010 Technical Report Appendix E
77
NAP – CC 2010 Technical Report Appendix F
78
Appendix F: Item difficulties and per cent correct for each year level
Year 6
Item Link RP62 Scaled Correct
1 AD31 No ‐0.018 488 47%
2 AD35 No ‐0.656 406 60%
3 AF33 No ‐0.832 383 62%
4 AF34 No 0.655 576 32%
5 AJ31 No ‐1.674 273 78%
6 AP21 Yes ‐1.858 249 81%
7 AP31 No ‐1.488 298 75%
8 AP32 No ‐1.649 277 77%
9 AP33 No 0.093 503 44%
10 AP34 No 0.397 542 38%
11 BO21 Yes ‐0.129 474 48%
12 BO22 Yes ‐0.355 445 52%
13 BO23 No 1.625 702 17%
14 BO24 Yes 1.827 728 14%
15 BO25 Yes 1.717 714 16%
16 CA31 No ‐2.821 124 91%
17 CA32 No ‐1.405 308 74%
18 CA33 No ‐0.231 461 51%
19 CA34 No 0.443 548 38%
20 CC31 No ‐1.764 262 79%
21 CC32 No ‐0.715 398 61%
22 CG11 No ‐1.053 354 67%
23 CV32 No ‐1.157 341 69%
24 DR31 No 0.662 577 33%
25 DR32 No 0.294 529 39%
26 ER31 No ‐1.808 256 80%
27 ER32 No ‐0.621 410 59%
28 FL14 Yes 0.770 591 31%
29 FL17 Yes 0.887 606 32%
30 FL18 Yes ‐1.284 324 72%
31 FO11 Yes ‐1.115 346 70%
32 FO12 No ‐0.033 486 48%
33 FO13 Yes ‐0.267 456 53%
34 FO14 Yes ‐0.624 410 61%
35 FT31 No ‐0.964 366 66%
36 FT32 No ‐0.463 431 56%
37 FT33 No 1.701 712 17%
38 GC31 No 0.644 574 33%
39 GC33 No ‐0.384 441 54%
40 GC34 No ‐0.684 402 60%
41 GS31 No ‐0.427 435 55%
42 GS32 No ‐1.736 265 79%
43 GS33 No ‐0.951 367 65%
NAP – CC 2010 Technical Report Appendix F
79
Year 6
Item Link RP62 Scaled Correct
44 HS21 Yes ‐0.022 488 48%
45 HW31 No ‐1.544 290 75%
46 HW32 No ‐1.915 242 81%
47 HW33 No ‐2.015 229 82%
48 IC11 Yes 1.330 663 23%
49 IJ21 Yes ‐0.142 472 49%
50 IL11 No 0.069 500 46%
51 LG22 Yes ‐0.679 403 62%
52 LG31 No ‐0.673 403 60%
53 LG33 No ‐0.974 364 66%
54 MA31 No ‐1.617 281 77%
55 MA32 No ‐0.330 448 53%
56 MA33 No ‐1.093 349 68%
57 MA34 No ‐1.430 305 74%
58 MA35 No ‐0.249 458 51%
59 PO31 No ‐1.652 276 78%
60 PO32 No 1.166 642 29%
61 PO33 No ‐0.702 400 61%
62 PP21 No ‐1.378 312 73%
63 PP22 Yes ‐2.798 127 90%
64 PT21 Yes ‐2.088 220 85%
65 PT22 No 0.722 584 33%
66 PT23 Yes 0.176 514 44%
67 PT24 No 0.041 496 46%
68 PT31 No ‐1.422 306 74%
69 PT32 No ‐1.454 302 75%
70 PT33 No ‐0.110 476 49%
71 RE11 No ‐1.155 341 69%
72 RE13 No ‐1.533 292 75%
73 RE14 No ‐0.758 392 61%
74 RF11 Yes 0.420 545 36%
75 RL31 No ‐2.556 159 89%
76 RL32 No ‐3.574 27 95%
77 RL33 No ‐1.781 259 80%
78 RP32 No ‐0.063 483 47%
79 RP34 No ‐0.924 371 65%
80 RP35 No ‐0.755 393 62%
81 RR21 No 0.098 503 46%
82 RR22 Yes ‐1.204 334 72%
83 RR23 Yes ‐0.666 404 62%
84 RR31 No 0.375 539 38%
85 RR32 No ‐1.226 332 71%
86 RS11 Yes 0.594 568 33%
87 SG31 No ‐1.325 319 72%
88 SG32 No ‐1.258 327 71%
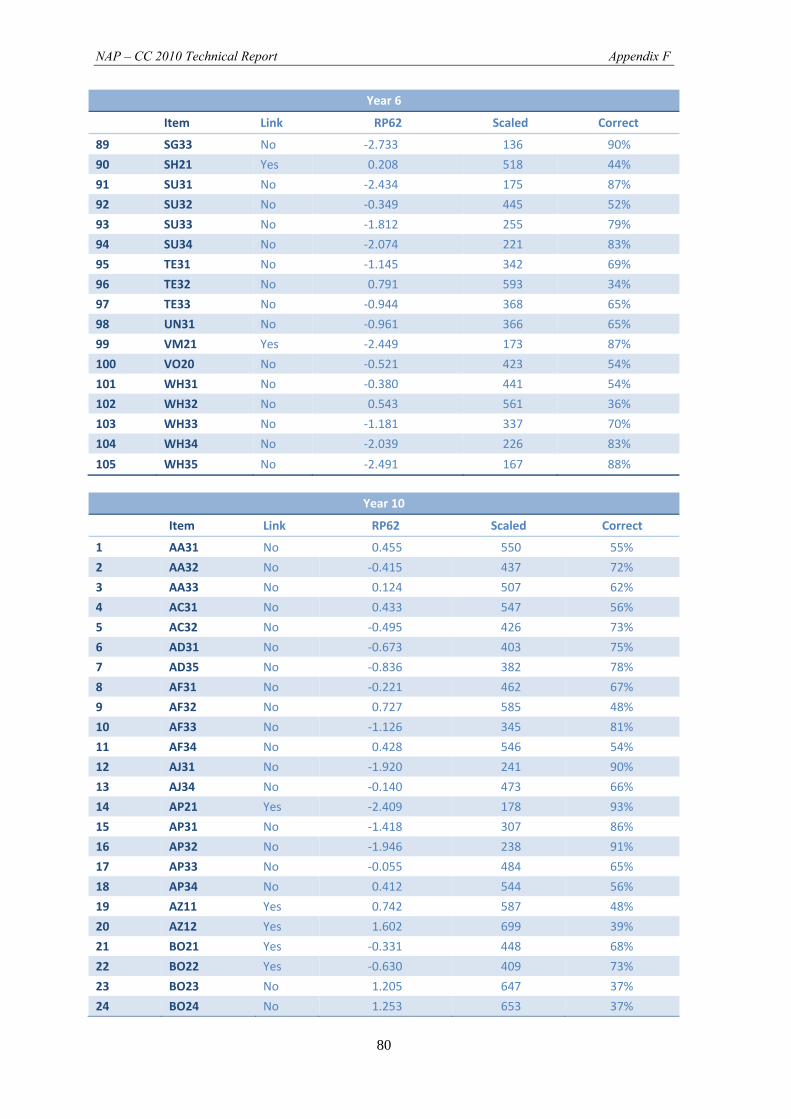
NAP – CC 2010 Technical Report Appendix F
80
Year 6
Item Link RP62 Scaled Correct
89 SG33 No ‐2.733 136 90%
90 SH21 Yes 0.208 518 44%
91 SU31 No ‐2.434 175 87%
92 SU32 No ‐0.349 445 52%
93 SU33 No ‐1.812 255 79%
94 SU34 No ‐2.074 221 83%
95 TE31 No ‐1.145 342 69%
96 TE32 No 0.791 593 34%
97 TE33 No ‐0.944 368 65%
98 UN31 No ‐0.961 366 65%
99 VM21 Yes ‐2.449 173 87%
100 VO20 No ‐0.521 423 54%
101 WH31 No ‐0.380 441 54%
102 WH32 No 0.543 561 36%
103 WH33 No ‐1.181 337 70%
104 WH34 No ‐2.039 226 83%
105 WH35 No ‐2.491 167 88%
Year 10
Item Link RP62 Scaled Correct
1 AA31 No 0.455 550 55%
2 AA32 No ‐0.415 437 72%
3 AA33 No 0.124 507 62%
4 AC31 No 0.433 547 56%
5 AC32 No ‐0.495 426 73%
6 AD31 No ‐0.673 403 75%
7 AD35 No ‐0.836 382 78%
8 AF31 No ‐0.221 462 67%
9 AF32 No 0.727 585 48%
10 AF33 No ‐1.126 345 81%
11 AF34 No 0.428 546 54%
12 AJ31 No ‐1.920 241 90%
13 AJ34 No ‐0.140 473 66%
14 AP21 Yes ‐2.409 178 93%
15 AP31 No ‐1.418 307 86%
16 AP32 No ‐1.946 238 91%
17 AP33 No ‐0.055 484 65%
18 AP34 No 0.412 544 56%
19 AZ11 Yes 0.742 587 48%
20 AZ12 Yes 1.602 699 39%
21 BO21 Yes ‐0.331 448 68%
22 BO22 Yes ‐0.630 409 73%
23 BO23 No 1.205 647 37%
24 BO24 No 1.253 653 37%
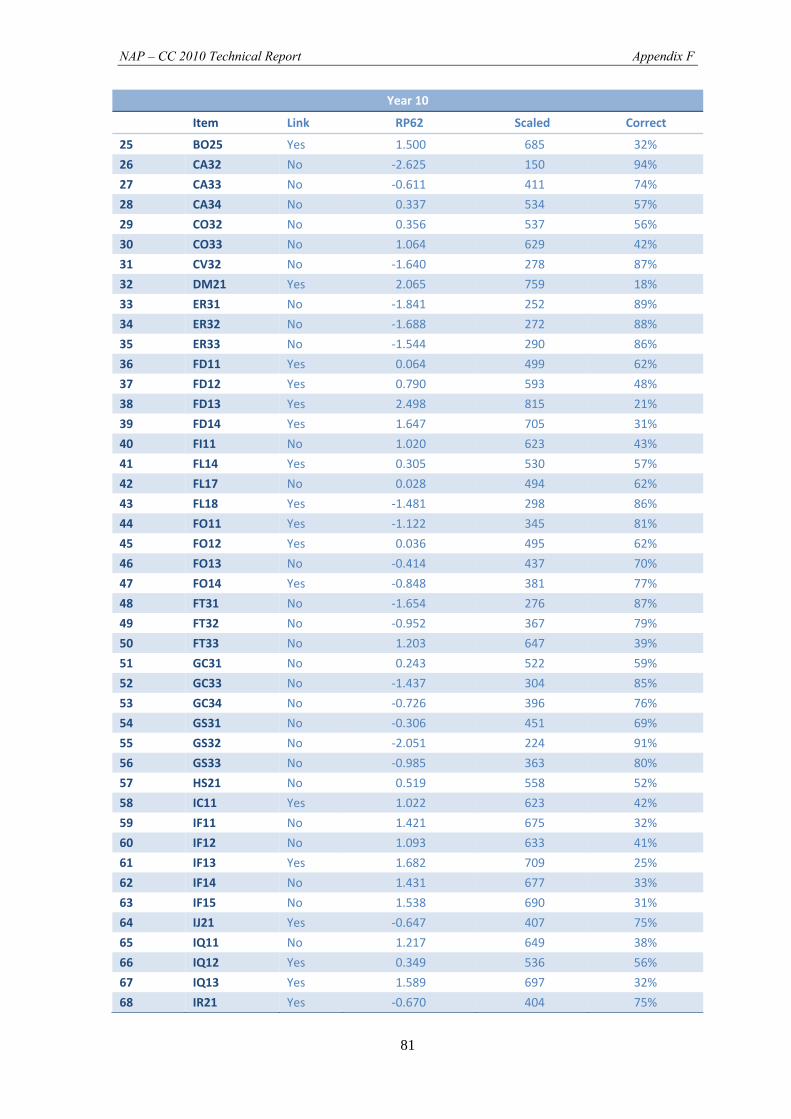
NAP – CC 2010 Technical Report Appendix F
81
Year 10
Item Link RP62 Scaled Correct
25 BO25 Yes 1.500 685 32%
26 CA32 No ‐2.625 150 94%
27 CA33 No ‐0.611 411 74%
28 CA34 No 0.337 534 57%
29 CO32 No 0.356 537 56%
30 CO33 No 1.064 629 42%
31 CV32 No ‐1.640 278 87%
32 DM21 Yes 2.065 759 18%
33 ER31 No ‐1.841 252 89%
34 ER32 No ‐1.688 272 88%
35 ER33 No ‐1.544 290 86%
36 FD11 Yes 0.064 499 62%
37 FD12 Yes 0.790 593 48%
38 FD13 Yes 2.498 815 21%
39 FD14 Yes 1.647 705 31%
40 FI11 No 1.020 623 43%
41 FL14 Yes 0.305 530 57%
42 FL17 No 0.028 494 62%
43 FL18 Yes ‐1.481 298 86%
44 FO11 Yes ‐1.122 345 81%
45 FO12 Yes 0.036 495 62%
46 FO13 No ‐0.414 437 70%
47 FO14 Yes ‐0.848 381 77%
48 FT31 No ‐1.654 276 87%
49 FT32 No ‐0.952 367 79%
50 FT33 No 1.203 647 39%
51 GC31 No 0.243 522 59%
52 GC33 No ‐1.437 304 85%
53 GC34 No ‐0.726 396 76%
54 GS31 No ‐0.306 451 69%
55 GS32 No ‐2.051 224 91%
56 GS33 No ‐0.985 363 80%
57 HS21 No 0.519 558 52%
58 IC11 Yes 1.022 623 42%
59 IF11 No 1.421 675 32%
60 IF12 No 1.093 633 41%
61 IF13 Yes 1.682 709 25%
62 IF14 No 1.431 677 33%
63 IF15 No 1.538 690 31%
64 IJ21 Yes ‐0.647 407 75%
65 IQ11 No 1.217 649 38%
66 IQ12 Yes 0.349 536 56%
67 IQ13 Yes 1.589 697 32%
68 IR21 Yes ‐0.670 404 75%
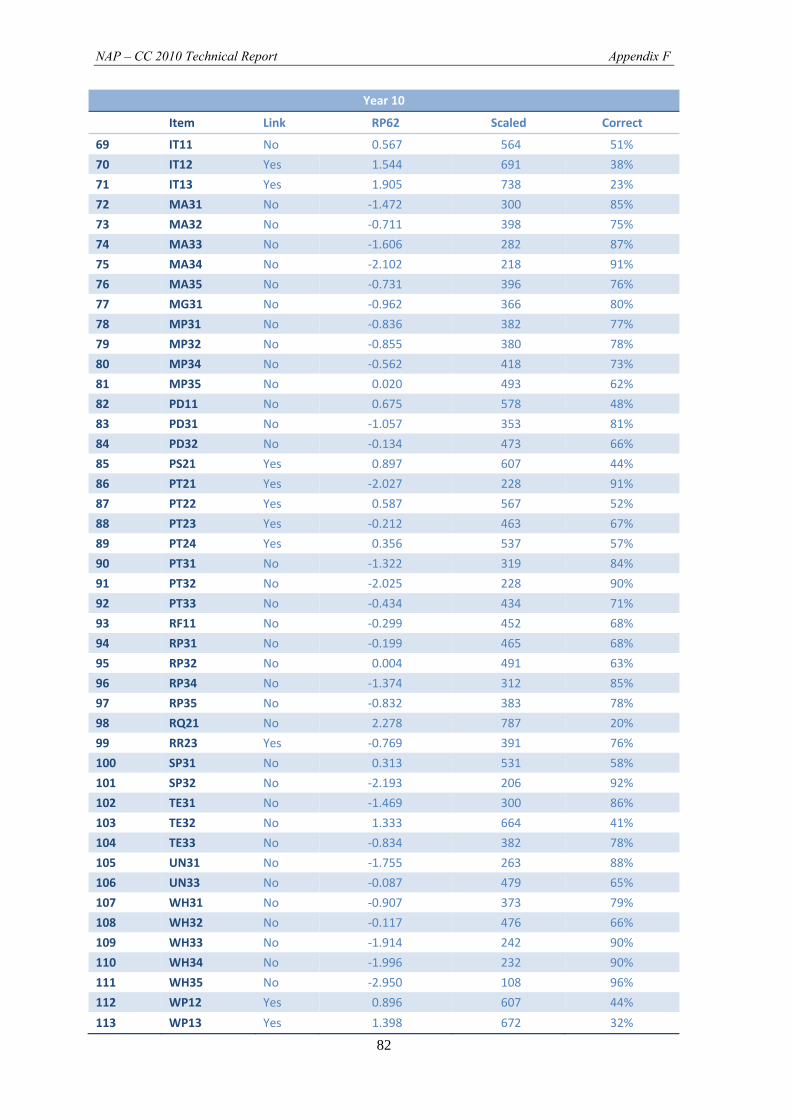
NAP – CC 2010 Technical Report Appendix F
82
Year 10
Item Link RP62 Scaled Correct
69 IT11 No 0.567 564 51%
70 IT12 Yes 1.544 691 38%
71 IT13 Yes 1.905 738 23%
72 MA31 No ‐1.472 300 85%
73 MA32 No ‐0.711 398 75%
74 MA33 No ‐1.606 282 87%
75 MA34 No ‐2.102 218 91%
76 MA35 No ‐0.731 396 76%
77 MG31 No ‐0.962 366 80%
78 MP31 No ‐0.836 382 77%
79 MP32 No ‐0.855 380 78%
80 MP34 No ‐0.562 418 73%
81 MP35 No 0.020 493 62%
82 PD11 No 0.675 578 48%
83 PD31 No ‐1.057 353 81%
84 PD32 No ‐0.134 473 66%
85 PS21 Yes 0.897 607 44%
86 PT21 Yes ‐2.027 228 91%
87 PT22 Yes 0.587 567 52%
88 PT23 Yes ‐0.212 463 67%
89 PT24 Yes 0.356 537 57%
90 PT31 No ‐1.322 319 84%
91 PT32 No ‐2.025 228 90%
92 PT33 No ‐0.434 434 71%
93 RF11 No ‐0.299 452 68%
94 RP31 No ‐0.199 465 68%
95 RP32 No 0.004 491 63%
96 RP34 No ‐1.374 312 85%
97 RP35 No ‐0.832 383 78%
98 RQ21 No 2.278 787 20%
99 RR23 Yes ‐0.769 391 76%
100 SP31 No 0.313 531 58%
101 SP32 No ‐2.193 206 92%
102 TE31 No ‐1.469 300 86%
103 TE32 No 1.333 664 41%
104 TE33 No ‐0.834 382 78%
105 UN31 No ‐1.755 263 88%
106 UN33 No ‐0.087 479 65%
107 WH31 No ‐0.907 373 79%
108 WH32 No ‐0.117 476 66%
109 WH33 No ‐1.914 242 90%
110 WH34 No ‐1.996 232 90%
111 WH35 No ‐2.950 108 96%
112 WP12 Yes 0.896 607 44%
113 WP13 Yes 1.398 672 32%
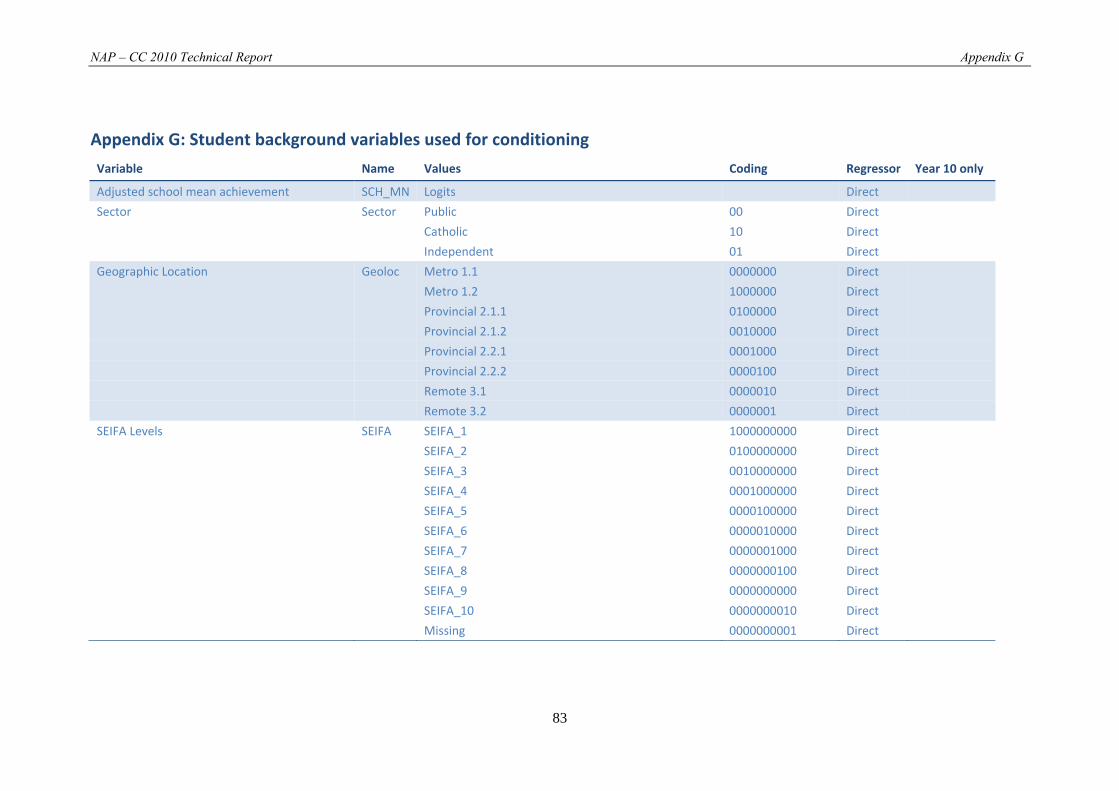
NAP – CC 2010 Technical Report Appendix G
83
Appendix G: Student background variables used for conditioning
Variable Name Values Coding Regressor Year 10 only
Adjusted school mean achievement SCH_MN Logits Direct
Sector Sector Public 00 Direct
Catholic 10 Direct
Independent 01 Direct
Geographic Location Geoloc Metro 1.1 0000000 Direct
Metro 1.2 1000000 Direct
Provincial 2.1.1 0100000 Direct
Provincial 2.1.2 0010000 Direct
Provincial 2.2.1 0001000 Direct
Provincial 2.2.2 0000100 Direct
Remote 3.1 0000010 Direct
Remote 3.2 0000001 Direct
SEIFA Levels SEIFA SEIFA_1 1000000000 Direct
SEIFA_2 0100000000 Direct
SEIFA_3 0010000000 Direct
SEIFA_4 0001000000 Direct
SEIFA_5 0000100000 Direct
SEIFA_6 0000010000 Direct
SEIFA_7 0000001000 Direct
SEIFA_8 0000000100 Direct
SEIFA_9 0000000000 Direct
SEIFA_10 0000000010 Direct
Missing 0000000001 Direct
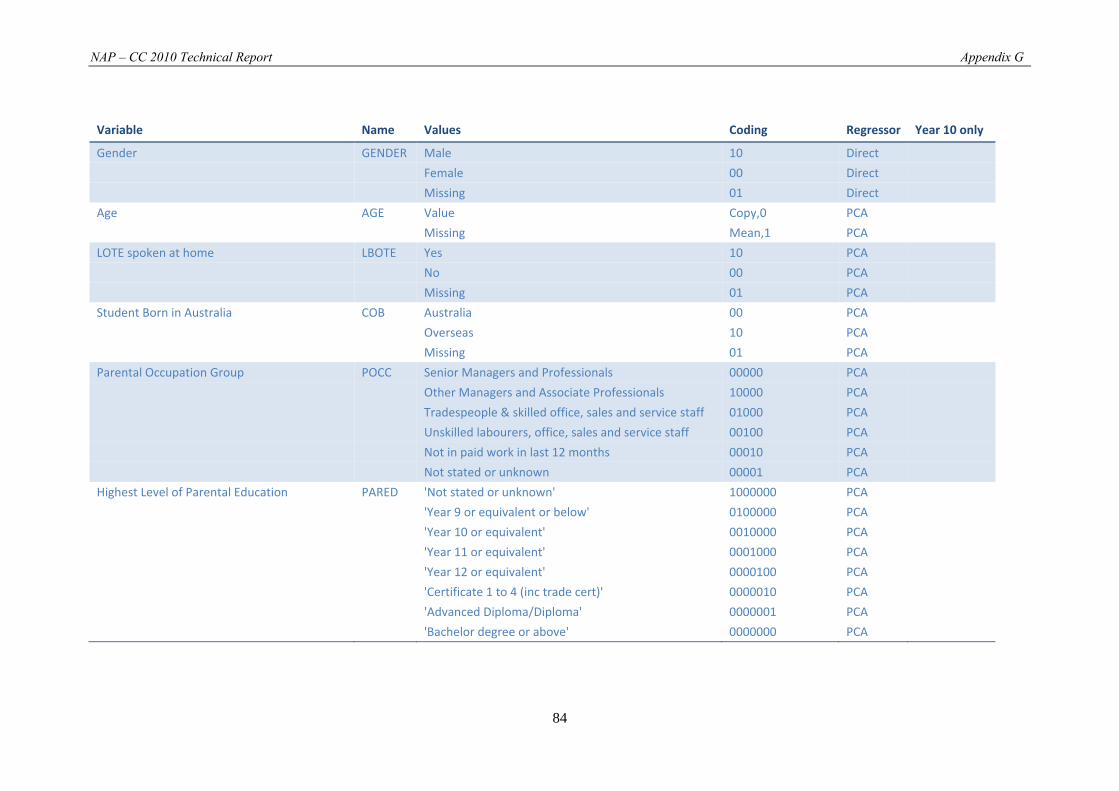
NAP – CC 2010 Technical Report Appendix G
84
Variable Name Values Coding Regressor Year 10 only
Gender GENDER Male 10 Direct
Female 00 Direct
Missing 01 Direct
Age AGE Value Copy,0 PCA
Missing Mean,1 PCA
LOTE spoken at home LBOTE Yes 10 PCA
No 00 PCA
Missing 01 PCA
Student Born in Australia COB Australia 00 PCA
Overseas 10 PCA
Missing 01 PCA
Parental Occupation Group POCC Senior Managers and Professionals 00000 PCA
Other Managers and Associate Professionals 10000 PCA
Tradespeople & skilled office, sales and service staff 01000 PCA
Unskilled labourers, office, sales and service staff 00100 PCA
Not in paid work in last 12 months 00010 PCA
Not stated or unknown 00001 PCA
Highest Level of Parental Education PARED 'Not stated or unknown' 1000000 PCA
'Year 9 or equivalent or below' 0100000 PCA
'Year 10 or equivalent' 0010000 PCA
'Year 11 or equivalent' 0001000 PCA
'Year 12 or equivalent' 0000100 PCA
'Certificate 1 to 4 (inc trade cert)' 0000010 PCA
'Advanced Diploma/Diploma' 0000001 PCA
'Bachelor degree or above' 0000000 PCA
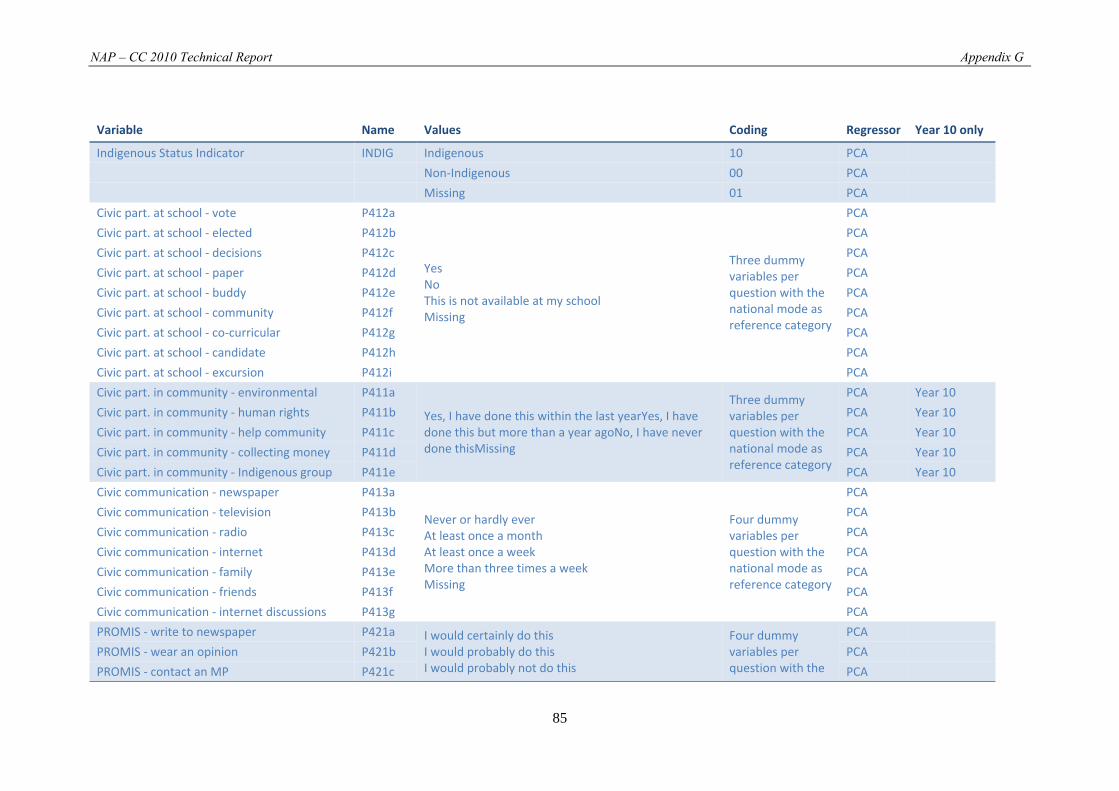
NAP – CC 2010 Technical Report Appendix G
85
Variable Name Values Coding Regressor Year 10 only
Indigenous Status Indicator INDIG Indigenous 10 PCA
Non‐Indigenous 00 PCA
Missing 01 PCA
Civic part. at school ‐ vote P412a
Yes No This is not available at my school Missing
Three dummy variables per question with the national mode as reference category
PCA
Civic part. at school ‐ elected P412b PCA
Civic part. at school ‐ decisions P412c PCA
Civic part. at school ‐ paper P412d PCA
Civic part. at school ‐ buddy P412e PCA
Civic part. at school ‐ community P412f PCA
Civic part. at school ‐ co‐curricular P412g PCA
Civic part. at school ‐ candidate P412h PCA
Civic part. at school ‐ excursion P412i PCA
Civic part. in community ‐ environmental P411a
Yes, I have done this within the last yearYes, I have done this but more than a year agoNo, I have never done thisMissing
Three dummy variables per question with the national mode as reference category
PCA Year 10
Civic part. in community ‐ human rights P411b PCA Year 10
Civic part. in community ‐ help community P411c PCA Year 10
Civic part. in community ‐ collecting money P411d PCA Year 10
Civic part. in community ‐ Indigenous group P411e PCA Year 10
Civic communication ‐ newspaper P413a
Never or hardly ever At least once a month At least once a week More than three times a week Missing
Four dummy variables per question with the national mode as reference category
PCA
Civic communication ‐ television P413b PCA
Civic communication ‐ radio P413c PCA
Civic communication ‐ internet P413d PCA
Civic communication ‐ family P413e PCA
Civic communication ‐ friends P413f PCA
Civic communication ‐ internet discussions P413g PCA
PROMIS ‐ write to newspaper P421a I would certainly do this I would probably do this I would probably not do this
Four dummy variables per question with the
PCA
PROMIS ‐ wear an opinion P421b PCA
PROMIS ‐ contact an MP P421c PCA
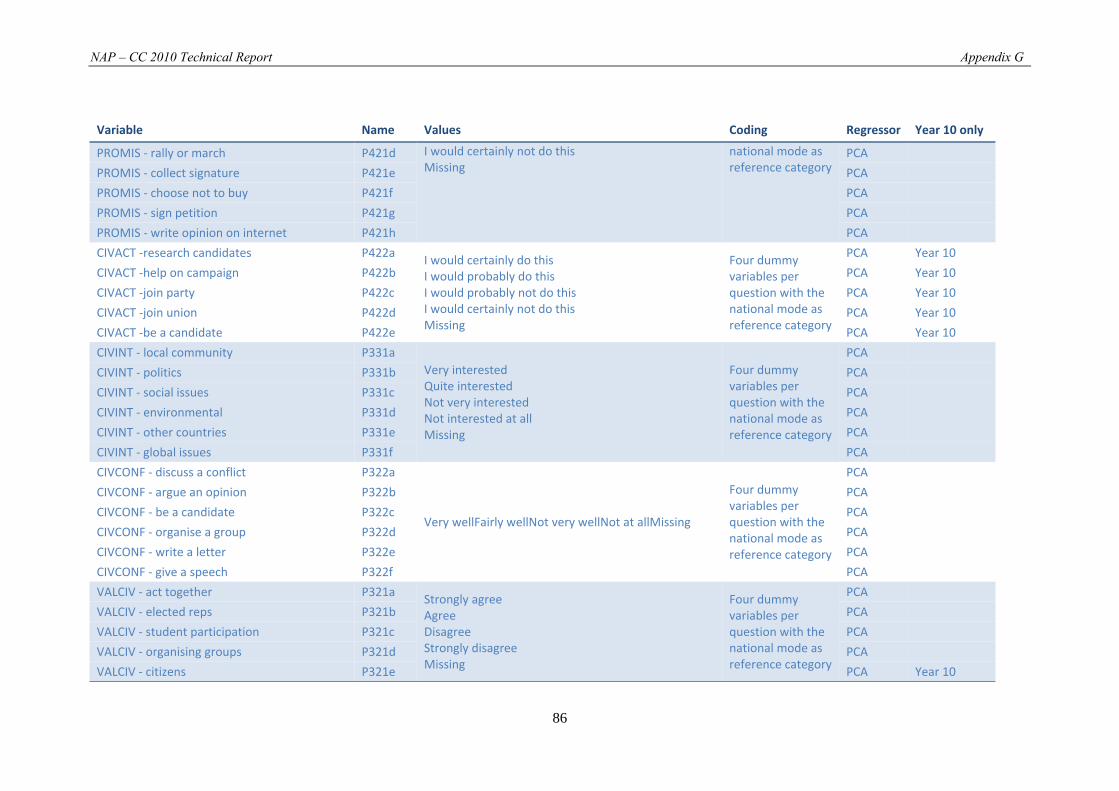
NAP – CC 2010 Technical Report Appendix G
86
Variable Name Values Coding Regressor Year 10 only
PROMIS ‐ rally or march P421d I would certainly not do thisMissing
national mode as reference category
PCA
PROMIS ‐ collect signature P421e PCA
PROMIS ‐ choose not to buy P421f PCA
PROMIS ‐ sign petition P421g PCA
PROMIS ‐ write opinion on internet P421h PCA
CIVACT ‐research candidates P422a I would certainly do this I would probably do this I would probably not do this I would certainly not do this Missing
Four dummy variables per question with the national mode as reference category
PCA Year 10
CIVACT ‐help on campaign P422b PCA Year 10
CIVACT ‐join party P422c PCA Year 10
CIVACT ‐join union P422d PCA Year 10
CIVACT ‐be a candidate P422e PCA Year 10
CIVINT ‐ local community P331a Very interested Quite interested Not very interested Not interested at all Missing
Four dummy variables per question with the national mode as reference category
PCA
CIVINT ‐ politics P331b PCA
CIVINT ‐ social issues P331c PCA
CIVINT ‐ environmental P331d PCA
CIVINT ‐ other countries P331e PCA
CIVINT ‐ global issues P331f PCA
CIVCONF ‐ discuss a conflict P322a
Very wellFairly wellNot very wellNot at allMissing
Four dummy variables per question with the national mode as reference category
PCA
CIVCONF ‐ argue an opinion P322b PCA
CIVCONF ‐ be a candidate P322c PCA
CIVCONF ‐ organise a group P322d PCA
CIVCONF ‐ write a letter P322e PCA
CIVCONF ‐ give a speech P322f PCA
VALCIV ‐ act together P321a Strongly agree Agree Disagree Strongly disagree Missing
Four dummy variables per question with the national mode as reference category
PCA
VALCIV ‐ elected reps P321b PCA
VALCIV ‐ student participation P321c PCA
VALCIV ‐ organising groups P321d PCA
VALCIV ‐ citizens P321e PCA Year 10
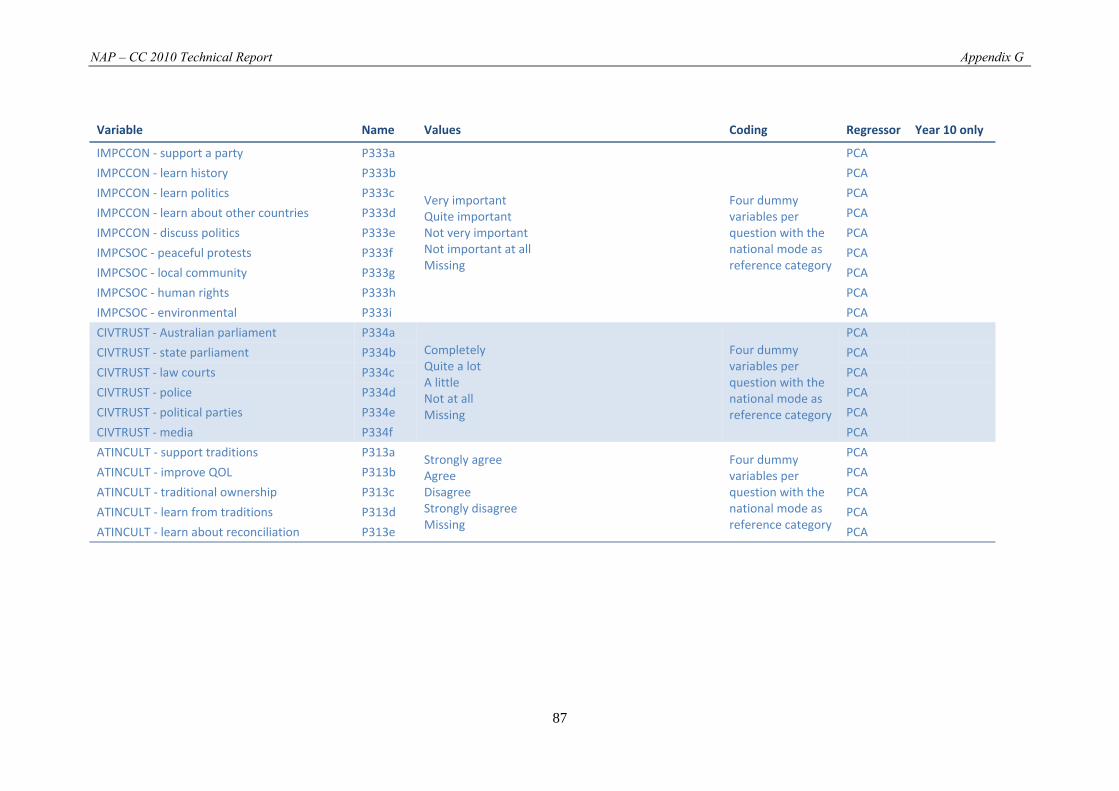
NAP – CC 2010 Technical Report Appendix G
87
Variable Name Values Coding Regressor Year 10 only
IMPCCON ‐ support a party P333a
Very important Quite important Not very important Not important at all Missing
Four dummy variables per question with the national mode as reference category
PCA
IMPCCON ‐ learn history P333b PCA
IMPCCON ‐ learn politics P333c PCA
IMPCCON ‐ learn about other countries P333d PCA
IMPCCON ‐ discuss politics P333e PCA
IMPCSOC ‐ peaceful protests P333f PCA
IMPCSOC ‐ local community P333g PCA
IMPCSOC ‐ human rights P333h PCA
IMPCSOC ‐ environmental P333i PCA
CIVTRUST ‐ Australian parliament P334a Completely Quite a lot A little Not at all Missing
Four dummy variables per question with the national mode as reference category
PCA
CIVTRUST ‐ state parliament P334b PCA
CIVTRUST ‐ law courts P334c PCA
CIVTRUST ‐ police P334d PCA
CIVTRUST ‐ political parties P334e PCA
CIVTRUST ‐ media P334f PCA
ATINCULT ‐ support traditions P313a Strongly agree Agree Disagree Strongly disagree Missing
Four dummy variables per question with the national mode as reference category
PCA
ATINCULT ‐ improve QOL P313b PCA
ATINCULT ‐ traditional ownership P313c PCA
ATINCULT ‐ learn from traditions P313d PCA
ATINCULT ‐ learn about reconciliation P313e PCA
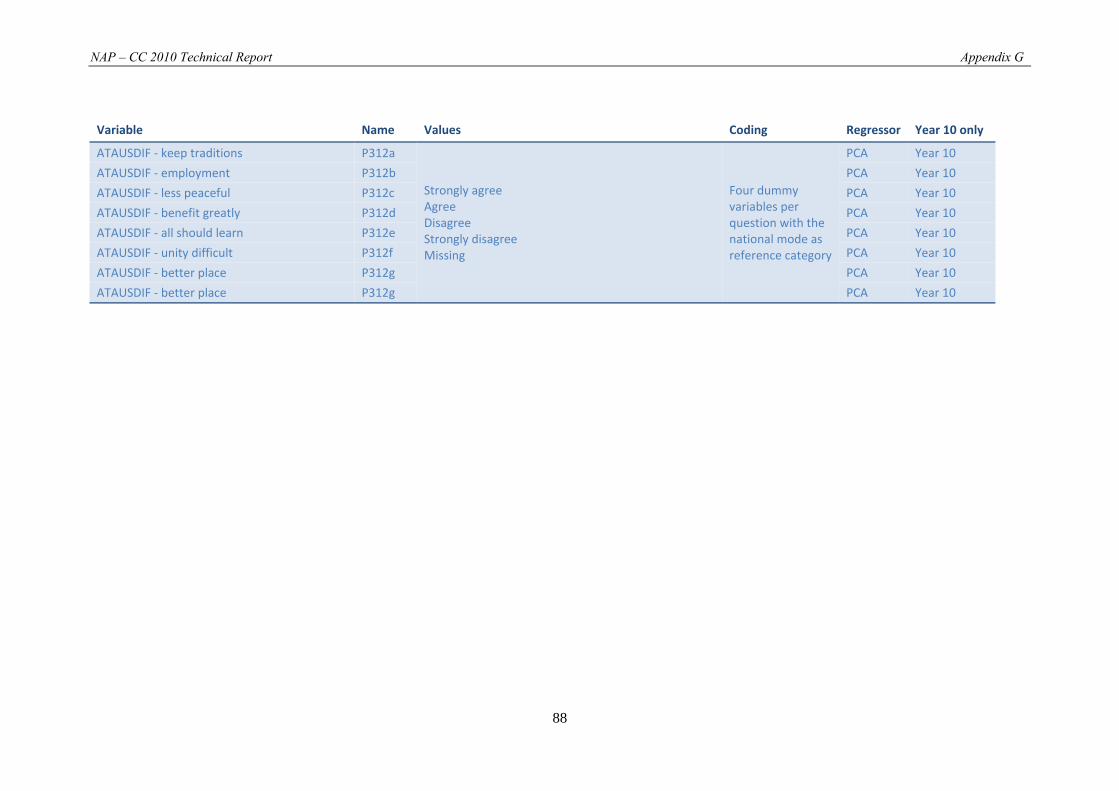
NAP – CC 2010 Technical Report Appendix G
88
Variable Name Values Coding Regressor Year 10 only
ATAUSDIF ‐ keep traditions P312a
Strongly agree Agree Disagree Strongly disagree Missing
Four dummy variables per question with the national mode as reference category
PCA Year 10
ATAUSDIF ‐ employment P312b PCA Year 10
ATAUSDIF ‐ less peaceful P312c PCA Year 10
ATAUSDIF ‐ benefit greatly P312d PCA Year 10
ATAUSDIF ‐ all should learn P312e PCA Year 10
ATAUSDIF ‐ unity difficult P312f PCA Year 10
ATAUSDIF ‐ better place P312g PCA Year 10
ATAUSDIF ‐ better place P312g PCA Year 10
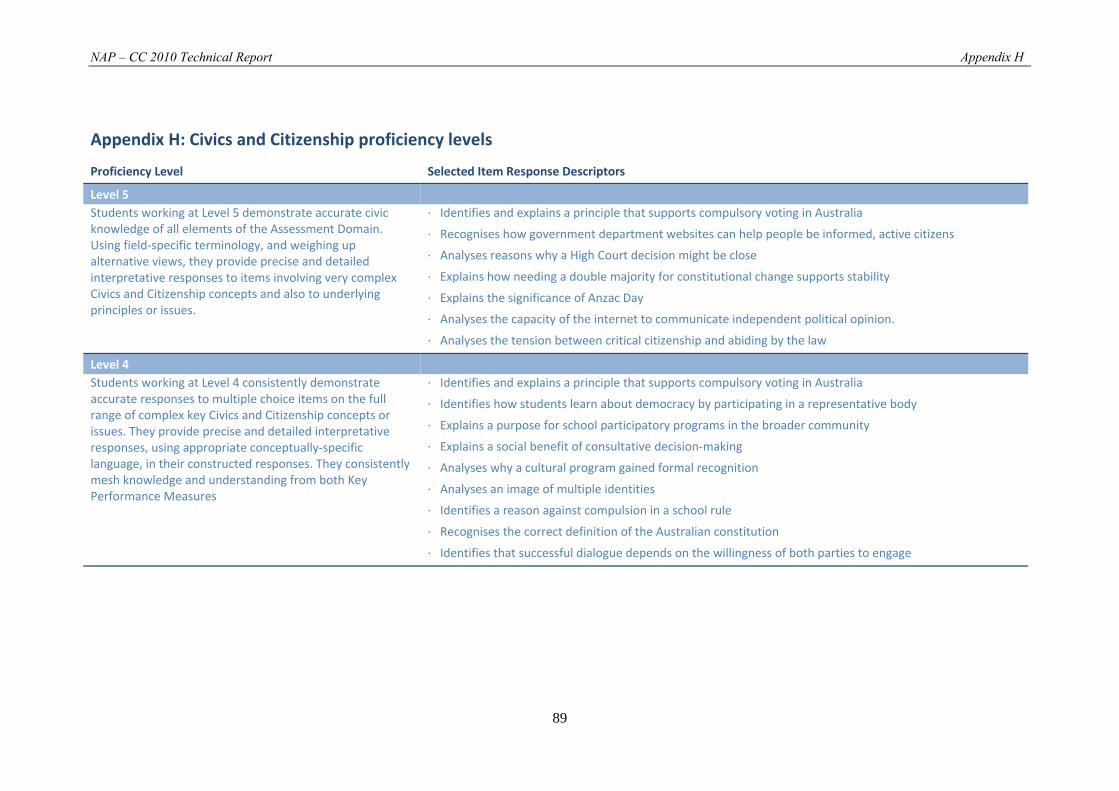
NAP – CC 2010 Technical Report Appendix H
89
Appendix H: Civics and Citizenship proficiency levels
Proficiency Level Selected Item Response Descriptors
Level 5 Students working at Level 5 demonstrate accurate civic knowledge of all elements of the Assessment Domain. Using field‐specific terminology, and weighing up alternative views, they provide precise and detailed interpretative responses to items involving very complex Civics and Citizenship concepts and also to underlying principles or issues.
∙ Identifies and explains a principle that supports compulsory voting in Australia
∙ Recognises how government department websites can help people be informed, active citizens
∙ Analyses reasons why a High Court decision might be close
∙ Explains how needing a double majority for constitutional change supports stability
∙ Explains the significance of Anzac Day
∙ Analyses the capacity of the internet to communicate independent political opinion.
∙ Analyses the tension between critical citizenship and abiding by the law
Level 4 Students working at Level 4 consistently demonstrate accurate responses to multiple choice items on the full range of complex key Civics and Citizenship concepts or issues. They provide precise and detailed interpretative responses, using appropriate conceptually‐specific language, in their constructed responses. They consistently mesh knowledge and understanding from both Key Performance Measures
∙ Identifies and explains a principle that supports compulsory voting in Australia
∙ Identifies how students learn about democracy by participating in a representative body
∙ Explains a purpose for school participatory programs in the broader community
∙ Explains a social benefit of consultative decision‐making
∙ Analyses why a cultural program gained formal recognition
∙ Analyses an image of multiple identities
∙ Identifies a reason against compulsion in a school rule
∙ Recognises the correct definition of the Australian constitution
∙ Identifies that successful dialogue depends on the willingness of both parties to engage
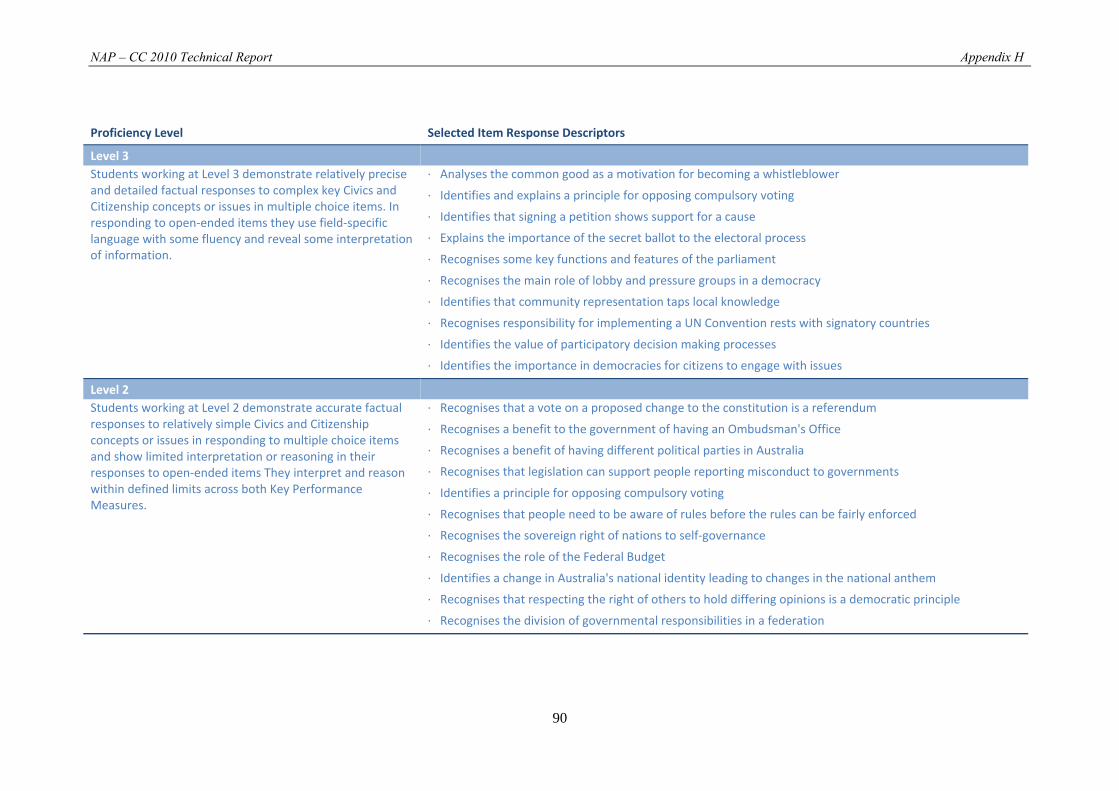
NAP – CC 2010 Technical Report Appendix H
90
Proficiency Level Selected Item Response Descriptors
Level 3 Students working at Level 3 demonstrate relatively precise and detailed factual responses to complex key Civics and Citizenship concepts or issues in multiple choice items. In responding to open‐ended items they use field‐specific language with some fluency and reveal some interpretation of information.
∙ Analyses the common good as a motivation for becoming a whistleblower
∙ Identifies and explains a principle for opposing compulsory voting
∙ Identifies that signing a petition shows support for a cause
∙ Explains the importance of the secret ballot to the electoral process
∙ Recognises some key functions and features of the parliament
∙ Recognises the main role of lobby and pressure groups in a democracy
∙ Identifies that community representation taps local knowledge
∙ Recognises responsibility for implementing a UN Convention rests with signatory countries
∙ Identifies the value of participatory decision making processes
∙ Identifies the importance in democracies for citizens to engage with issues
Level 2 Students working at Level 2 demonstrate accurate factual responses to relatively simple Civics and Citizenship concepts or issues in responding to multiple choice items and show limited interpretation or reasoning in their responses to open‐ended items They interpret and reason within defined limits across both Key Performance Measures.
∙ Recognises that a vote on a proposed change to the constitution is a referendum
∙ Recognises a benefit to the government of having an Ombudsman's Office
∙ Recognises a benefit of having different political parties in Australia
∙ Recognises that legislation can support people reporting misconduct to governments
∙ Identifies a principle for opposing compulsory voting
∙ Recognises that people need to be aware of rules before the rules can be fairly enforced
∙ Recognises the sovereign right of nations to self‐governance
∙ Recognises the role of the Federal Budget
∙ Identifies a change in Australia's national identity leading to changes in the national anthem
∙ Recognises that respecting the right of others to hold differing opinions is a democratic principle
∙ Recognises the division of governmental responsibilities in a federation
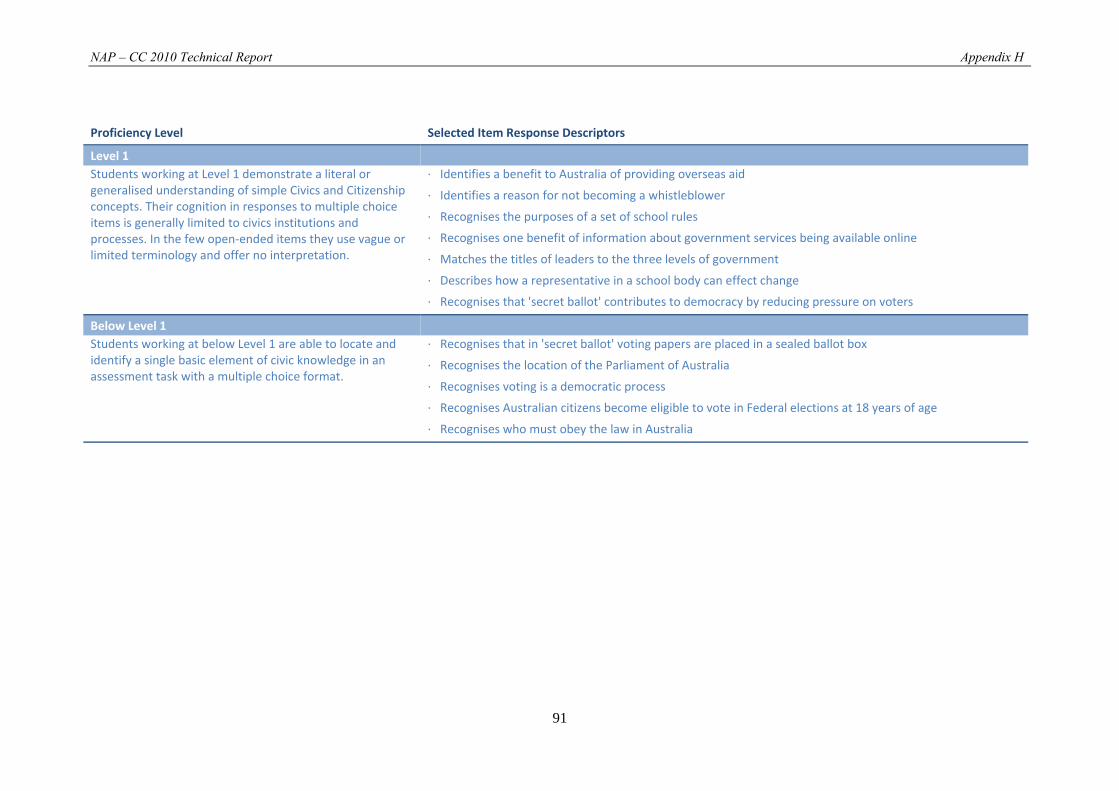
NAP – CC 2010 Technical Report Appendix H
91
Proficiency Level Selected Item Response Descriptors
Level 1 Students working at Level 1 demonstrate a literal or generalised understanding of simple Civics and Citizenship concepts. Their cognition in responses to multiple choice items is generally limited to civics institutions and processes. In the few open‐ended items they use vague or limited terminology and offer no interpretation.
∙ Identifies a benefit to Australia of providing overseas aid
∙ Identifies a reason for not becoming a whistleblower
∙ Recognises the purposes of a set of school rules
∙ Recognises one benefit of information about government services being available online
∙ Matches the titles of leaders to the three levels of government
∙ Describes how a representative in a school body can effect change
∙ Recognises that 'secret ballot' contributes to democracy by reducing pressure on voters
Below Level 1 Students working at below Level 1 are able to locate and identify a single basic element of civic knowledge in an assessment task with a multiple choice format.
∙ Recognises that in 'secret ballot' voting papers are placed in a sealed ballot box
∙ Recognises the location of the Parliament of Australia
∙ Recognises voting is a democratic process
∙ Recognises Australian citizens become eligible to vote in Federal elections at 18 years of age
∙ Recognises who must obey the law in Australia
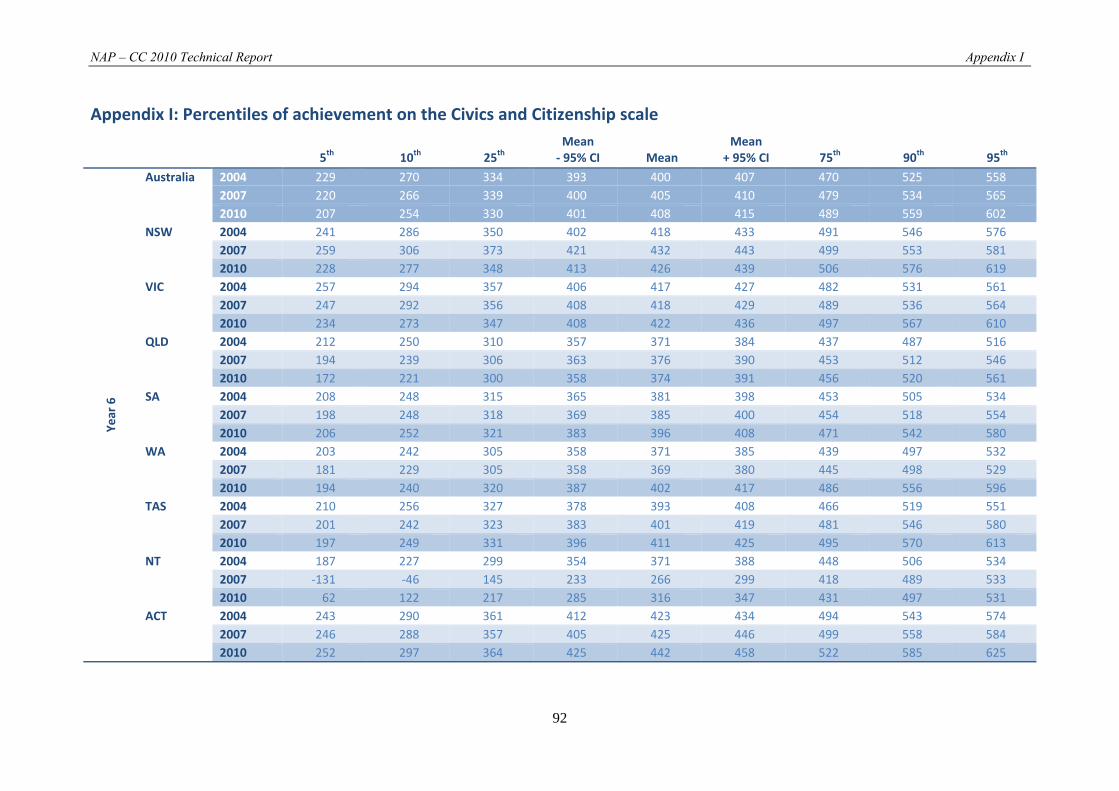
NAP – CC 2010 Technical Report Appendix I
92
Appendix I: Percentiles of achievement on the Civics and Citizenship scale
5th 10th 25th Mean‐ 95% CI Mean
Mean+ 95% CI 75th 90th 95th
Year 6
Australia 2004 229 270 334 393 400 407 470 525 558 2007 220 266 339 400 405 410 479 534 565 2010 207 254 330 401 408 415 489 559 602
NSW 2004 241 286 350 402 418 433 491 546 576 2007 259 306 373 421 432 443 499 553 581 2010 228 277 348 413 426 439 506 576 619
VIC 2004 257 294 357 406 417 427 482 531 561 2007 247 292 356 408 418 429 489 536 564 2010 234 273 347 408 422 436 497 567 610
QLD 2004 212 250 310 357 371 384 437 487 516 2007 194 239 306 363 376 390 453 512 546 2010 172 221 300 358 374 391 456 520 561
SA 2004 208 248 315 365 381 398 453 505 534 2007 198 248 318 369 385 400 454 518 554 2010 206 252 321 383 396 408 471 542 580
WA 2004 203 242 305 358 371 385 439 497 532 2007 181 229 305 358 369 380 445 498 529 2010 194 240 320 387 402 417 486 556 596
TAS 2004 210 256 327 378 393 408 466 519 551 2007 201 242 323 383 401 419 481 546 580 2010 197 249 331 396 411 425 495 570 613
NT 2004 187 227 299 354 371 388 448 506 534 2007 ‐131 ‐46 145 233 266 299 418 489 533 2010 62 122 217 285 316 347 431 497 531
ACT 2004 243 290 361 412 423 434 494 543 574 2007 246 288 357 405 425 446 499 558 584 2010 252 297 364 425 442 458 522 585 625
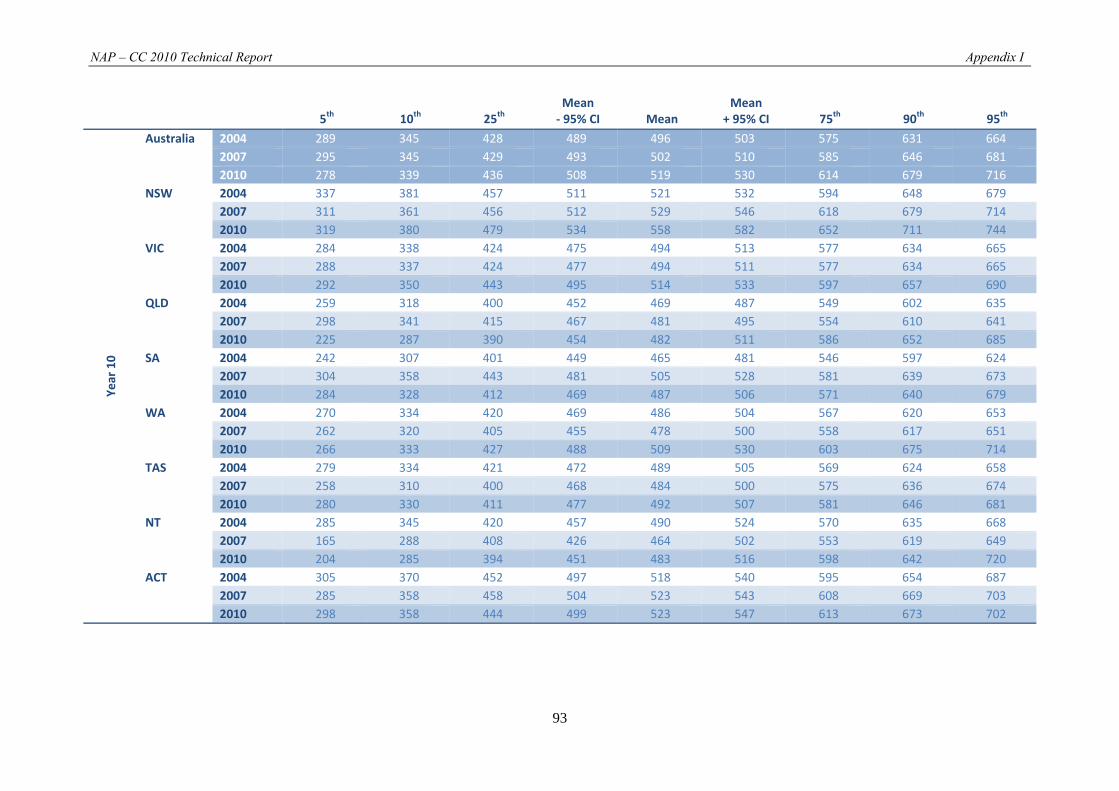
NAP – CC 2010 Technical Report Appendix I
93
5th 10th 25th Mean‐ 95% CI Mean
Mean+ 95% CI 75th 90th 95th
Year 10
Australia 2004 289 345 428 489 496 503 575 631 664 2007 295 345 429 493 502 510 585 646 681 2010 278 339 436 508 519 530 614 679 716
NSW 2004 337 381 457 511 521 532 594 648 679 2007 311 361 456 512 529 546 618 679 714 2010 319 380 479 534 558 582 652 711 744
VIC 2004 284 338 424 475 494 513 577 634 665 2007 288 337 424 477 494 511 577 634 665 2010 292 350 443 495 514 533 597 657 690
QLD 2004 259 318 400 452 469 487 549 602 635 2007 298 341 415 467 481 495 554 610 641 2010 225 287 390 454 482 511 586 652 685
SA 2004 242 307 401 449 465 481 546 597 624 2007 304 358 443 481 505 528 581 639 673 2010 284 328 412 469 487 506 571 640 679
WA 2004 270 334 420 469 486 504 567 620 653 2007 262 320 405 455 478 500 558 617 651 2010 266 333 427 488 509 530 603 675 714
TAS 2004 279 334 421 472 489 505 569 624 658 2007 258 310 400 468 484 500 575 636 674 2010 280 330 411 477 492 507 581 646 681
NT 2004 285 345 420 457 490 524 570 635 668 2007 165 288 408 426 464 502 553 619 649 2010 204 285 394 451 483 516 598 642 720
ACT 2004 305 370 452 497 518 540 595 654 687 2007 285 358 458 504 523 543 608 669 703 2010 298 358 444 499 523 547 613 673 702
NAP – CC 2010 Technical Report Index
94
INDEX
booklet design ............................................. 7 booklet effect ............................................. 39 certain selection ........................................ 18 cluster sample size .................................... 14 clusters ........................................................ 7 collapsing categories .................................. 9 common item equating .......................... 8, 41 conditioning .............................................. 40 confidence interval .................................... 53 design effect .............................................. 14 education authority liaison officer ............ 26 effective sample size .................................. 14 empirical judgemental technique .............. 50 equating error ........................................... 44 exclusion rate ............................................ 17 facet ........................................................... 39 finite population correction factor ............ 14 independent samples ................................. 53 intra-class correlation .............................. 14 item discrimination ................................... 41 item response theory ................................. 38 item response types ..................................... 7 item-rest correlation ................................. 41 jackknife indicator .................................... 51 jackknife repeated replication technique .. 51 link items ................................................... 41
linking error .............................................. 44 measure of size .......................................... 15 measurement variance .............................. 51 non-response adjustment .......................... 18 one-parameter model ................................ 38 panelling ..................................................... 6 primary sampling units ............................. 51 probability-proportional-to-size ............... 15 Proficient Standard ................................... 49 pseudo-class .............................................. 16 Rasch partial credit model ........................ 38 replacement school ................................... 15 replicate weight ......................................... 51 sample sizes ............................................... 14 sampling interval ................................ 15, 18 sampling variance ..................................... 51 sampling weight ........................................ 17 sampling zones .......................................... 51 school contact officer ................................ 26 simple random samples ............................. 51 tertile groups ............................................. 55 trend items ................................................... 8 two-stage stratified cluster sample design 13 unit .............................................................. 6 weighted likelihood estimates ................... 41 weighted mean-square statistic ................. 39