Multinational Diversification and Corporate Performance: Evidence from European Firms
26
Multinational Diversification and Corporate Performance: Evidence from European Firms Ike Mathur Department of Finance, Southern Illinois University, Carbondale, IL 62901-4626 e-mail: [email protected] Manohar Singh Department of Managerial Sciences, University of Nevada, Reno, Reno, NV 89509 Kimberly C. Gleason Department of Finance and Real Estate, Florida atlantic University, Boca Raton, FL 33431 Abstract We investigate the empirical relationship between accounting based measures of performance and the degree of multinational diversification for a set of European chemical industry firms. We find that for these firms, the degree of multinational diversification is strongly related to superior financial performance. The results hold for each of the three sample years. The findings suggest that multinational firms outper- form purely domestic and exporting firms. The results provide strong support for gains from multinational diversification. The results indicate that while greater European unification may have eroded potential benefits of exploiting international capital and product market imperfections, the benefits of firm specific economies of scope and scale as well as managerial and financial synergies are still realised through exports. Keywords: Multinational diversification; corporate performance; European unification JEL classification: F23, F21, F31 1. Introduction A large volume of literature has evolved to explain multinational organisational growth and performance. Theoretical and empirical studies have tried to answer questions related to the motivations for going global and factors determining nature, We thank the editor John Doukas, an anonymous referee, and participants at the 2001 Financial Management Association and the 2002 Eastern Finance Association for their helpful comments that have improved the quality of the paper. European Financial Management, Vol. 10, No. 3, 2004, 439–464 # Blackwell Publishing Ltd. 2004, 9600 Garsington Road, Oxford OX4 2DQ, UK and 350 Main Street, Malden, MA 02148, USA.
-
Upload
independent -
Category
Documents
-
view
2 -
download
0
Transcript of Multinational Diversification and Corporate Performance: Evidence from European Firms

Multinational Diversification andCorporate Performance: Evidence fromEuropean Firms
Ike MathurDepartment of Finance, Southern Illinois University, Carbondale, IL 62901-4626
e-mail: [email protected]
Manohar SinghDepartment of Managerial Sciences, University of Nevada, Reno, Reno, NV 89509
Kimberly C. GleasonDepartment of Finance and Real Estate, Florida atlantic University, Boca Raton, FL 33431
Abstract
We investigate the empirical relationship between accounting based measures ofperformance and the degree of multinational diversification for a set of Europeanchemical industry firms. We find that for these firms, the degree of multinationaldiversification is strongly related to superior financial performance. The results hold foreach of the three sample years. The findings suggest that multinational firms outper-form purely domestic and exporting firms. The results provide strong support for gainsfrom multinational diversification. The results indicate that while greater Europeanunification may have eroded potential benefits of exploiting international capital andproduct market imperfections, the benefits of firm specific economies of scope and scaleas well as managerial and financial synergies are still realised through exports.
Keywords: Multinational diversification; corporate performance; Europeanunification
JEL classification: F23, F21, F31
1. Introduction
A large volume of literature has evolved to explain multinational organisationalgrowth and performance. Theoretical and empirical studies have tried to answerquestions related to the motivations for going global and factors determining nature,
We thank the editor John Doukas, an anonymous referee, and participants at the 2001
Financial Management Association and the 2002 Eastern Finance Association for their
helpful comments that have improved the quality of the paper.
European Financial Management, Vol. 10, No. 3, 2004, 439–464
# Blackwell Publishing Ltd. 2004, 9600 Garsington Road, Oxford OX4 2DQ, UK and 350 Main Street, Malden, MA 02148, USA.

composition, modes and degree of multinational diversification and impact of global-isation on performance. Previous studies have predominantly dealt with US multi-national corporations (MNCs). Given that Europeans firms have emerged as majorcompetitors vis-a-vis US and Japanese global corporations, additional insights can begained from studying the profitability impact of the expansion of these corporationsas European economic unification continues to evolve.This study examines the issue of the relationship between the nature and the degree
of multinational diversification on the one hand and financial performance on theother for a set of chemical industry firms from thirteen European countries. The studyseeks to provide answers to the following questions: 1. Is international diversificationof business operations (domestic versus global) reflected in the differential financialperformance of corporations? 2. If the nature of operations matters, does the differ-ence in strategy of only market diversification through exports by Export OrientedUnits (EOUs) and that of production and market diversification in the form offoreign direct investment (FDI) by MNCs, result in differential financial performanceof EOUs versus MNCs? 3. Does variation in the degree of multinational diversifica-tion, as measured by the ratio of foreign sales to total sales (FSTS), the ratio offoreign assets to total assets (FATA) and a more refined Entropy index measure,significantly explain the differences in profitability, if any, among EOUs and MNCs?The results of our study suggest that a strong association exists between multi-
national activity and performance, hence providing affirmative answers to the abovequestions. An important aspect of this study is that our analyses of the comparativeperformance of domestic units (DOMs), EOUs and MNCs suggest significant perform-ance gains by going from DOM to EOU status and from EOU to MNC status. Theresults are consistent with the internalisation theory, according to which operationalintegration by MNCs results in superior profitability performance.The paper is organised as follows. In Section 2 we provide an overview of the
theoretical foundations for our study and formulate our hypotheses. Relevant empiricalresearch is also summarised in this section. Section 3 describes the sample and themethodology used to analyse the issues. Section 4 offers a discussion of the results. Wepresent the conclusions of the study in Section 5.
2. Conceptual considerations and evidence
2.1. Theoretical foundations
Pioneering work in the direction of developing a cohesive theory of MNCs has beenattributed to Hymer (1976), who emphasised the role of market competition andCoasian type economies in determining the behaviour of FDI. Hymer viewed theMNC as a multi-plant firm with benefits of vertical integration flowing from Coasianeconomies generated by virtue of a firm’s operations spread across industries andcountries. In addition, Hymer stressed the role of firm specific advantages in terms ofthe firm possessing intangible assets such as technological know-how and managerialskills. There are other schools of thought that trace the origin of the new theories,highlighting the role of transaction costs (Dunning’s Eclectic Theory (1979) andRugman’s Internalisation Theory (1982), to the theoretical works by Buckley andCasson (1976) and Hennart (1982). Internalisation theory provides an economic logicfor the existence of MNCs. Market imperfections force transaction costs ontothe firms conducting international business and to avoid open-market inefficient
440 Ike Mathur, Manohar Singh and Kimberly C. Gleason
# Blackwell Publishing Ltd, 2004
transactions, MNCs opt for vertical integration, thereby internalising those operationswithin the organisation. Williamson’s (1975) argument is that uncertainty and a smallnumber of market agents in combination with opportunism and bounded rationalitygive rise to costs of writing, executing and enforcing arms-length contingent claimscontracts with market intermediaries, which are higher than the costs associated withinternalising those transactions. Thus, MNCs, through the creation of a transactionsstructure internal to the organisation can better capture these cost reduction benefits.Grubel (1968) and Lessard (1973) show the risk reduction benefits of multinational
diversification due to the creation of portfolios of projects that are less than perfectlycorrelated. Risk reduction benefits will eventually get transformed into more efficientfinancial capital sourcing and higher profitability. But since there are more stringentbarriers for the individual investors as compared to MNCs, they cannot realise thesebenefits through financial diversification as efficiently as MNCs (Mathur andHanagan, 1983). An additional source of performance gains lies in financial synergiesthat can be created through multinational diversification (Agmon and Lessard, 1977).Increased profitability could result from a combination of market failures, firm
specific rent generating resources and less restrictive regulatory regimes in foreigneconomies (Gray and Gray, 1981). The Product cycle theory (Vernon, 1966) suggeststhat foreign expansion is related positively to the innovations in products and servicesproduced by the MNCs. Kogut (1983) sums up the rationale for multinationaloperations by emphasising that, ‘the primary advantage of multinational firm, asdifferentiated from a national corporation, lies in the flexibility to transfer resourcesacross borders through globally maximising networks’.Some evidence on domestic corporate diversification strategy indicates that
diversification may not be value enhancing. Denis et al. (1997), Berger and Ofek(1994) and Billet and Mauer (2000) show that corporate value losses are attributableto the strategy of business diversification, while studies by Comment and Jarrell(1994), Bengtsson (2000) and Gillan et al. (2000), among others, report that corporaterefocusing strategies result in value gains.However, more recent evidence shows that the reported diversification discount may in
fact be an artefact of data selection andmethodological approaches adopted to analyse theissue. For example, Villalonga (2004a) shows that either there is no diversification discount,or there exists a diversification premium. In a subsequent paper (Villalonga, 2004b) she usesnew business segment data to show that in actuality diversified firms trade at a premium.Graham et al. (2002) show that when firms add business segments due to reportingchanges, there are no changes in the diversification discount. However, some of thediscount manifests itself when firms acquire units that are already discounted. Campa andKedia (2002) show that the diversification discount may be related to firm characteristicsthat lead them to diversify. Whited (2001) argues that the diversification discount may bean artefact of measurement errors, while Fee and Thomas (2004) state that this discountmay be related to greater information asymmetries associated with diversified firms.With regard to multinational diversification, Denis et al. (2002) report a valuation
discount for globally diversified firms relative to domestic firms. They suggest that anincrease [decrease] in the degree of multinational diversification reduces [increases]excess value. They conclude that similar to the case of industrial diversification, thecosts of multinational diversification outweigh the benefits. However, Mansi andReeb (2002) question the validity of industrial diversification discount as a negativeperformance consequence of a diversification strategy. They argue that in a contingentclaims framework risk reduction leads to reduction in the call option value of firm
Multinational Diversification and Corporate Performance 441
# Blackwell Publishing Ltd, 2004

equity and that the reported diversification discount stems from diversification conse-quent risk-reduction benefits. They provide supporting empirical evidence to thiseffect and also report that the discount is positively related to leverage and isnon-existent in all-equity firms. Analogously, given that multinational diversificationis argued to yield risk reduction benefits, multinational firms may appear to suffer valuediscounts compared to domestic firms. Given Mansi and Reeb’s (2002) framework, thisdiscount, however cannot be attributed to multinational diversification.With the above evidence in mind, we can summarise the logic for suggesting gains
from multinational diversification strategy as follows: (1) Portfolio diversificationbenefits that may not be achieved by shareholders through direct investment abroad;(2) Higher returns associated with exploiting product and factor market imperfectionsand internalisation of information; (3) Reduced variability of aggregate earningsdue to non-synchronised nature of economic phases across countries; (4) Financialand managerial synergy; (5) Tax reduction and tax avoidance benefits due todifferential tax laws across countries; (6) Economies of scale and scope; (7) Positivegrowth opportunities, especially in developing countries.
2.2. Testable hypotheses
H1: The above arguments suggest that firms may be motivated by potential perform-ance gains to operate globally. The gains may flow from tapping product and/orcapital market imperfections and inefficiencies, Therefore, irrespective of the factwhether global activity is in terms of exports or FDI, firms by virtue of being globallyactive should experience superior performance relative to domestic firms. This formsthe basis of our first hypothesis: Global diversification through exporting or by under-taking FDI contributes to the superior financial performance of diversified firms.H2: Once the decision has been made by a firm to go global, the next logical questionthat arises relates to the choice of strategy of global business. The choice betweenexporting and direct investing abroad is obviously a function of multiple firm, industryand market specific factors. Most importantly, in European countries, capturingeconomies of scale and scope may necessitate expanding the customer base beyondborders through exporting domestically produced products. Thus, reaching a mini-mum cost optimum production level may only be possible through the creation ofexport markets. Also, export strategy seems to be less risky than FDI and probablyless costly, since establishing production facilities abroad may involve large initialfixed costs.
Furthermore, while export strategy may be a more appropriate choice if there arelarge product market imperfections, FDI is a better course of action if, in combin-ation with product market imperfections, large capital market inefficiencies exist. Thus,while export strategy may appear to be less risky, its potential gains are also limited.Exports may be subject to trade barriers and policy regulation in addition to marketrelated barriers – arm’s length contract negotiation and execution – and consequenttransactions costs. If the customer base in a particular market is large enough towarrant establishment of production/service facility there, FDI may be a betterproposition since it may lead to substantial transaction cost saving benefits. FDI, asopposed to exporting, may yield additional benefits in terms of allowing the firm tolocate in a better regulatory environment and have a richer production base – capital,labour and technology, etc.
442 Ike Mathur, Manohar Singh and Kimberly C. Gleason
# Blackwell Publishing Ltd, 2004

Thus, the exporting strategy and the FDI strategy appear to play complementaryroles in generating performance gains. To test the proposition that investing abroadyields greater benefits than those from exporting, we have to analyse whether MNCs(exporting and producing abroad) have superior performance relative to EOUs (onlyexporting abroad). Financial intuition suggests that MNCs should gain more frominternational diversification relative to EOUs who are able to exploit only productmarket imperfections. Based on this discussion we formulate our second hypothesis:Diversification through different strategies (i.e., export orientation versus FDI) resultsin significant differential financial performance.
H3: It is logical to ask whether all EOUs are better than DOMs and all MNCs arebetter than EOUs and DOMs, irrespective of the extent of their global investment.Specifically, we need to understand whether the relationship between internationaldiversification and performance is conditional upon the degree of diversification. Onan a priori basis, theory does not suggest a unique relationship. The diversification-performance relationship can be linear (positive or negative) or nonlinear (U shapedor inverted U shaped) depending on firm and market specific factors. For example,Geringer et al. (1989) find that an inverted U-shaped relationship exists betweeninternational diversification and performance, suggesting the existence of an optimaldegree of internationalisation, beyond which the costs of expanding abroad mayoutweigh the benefits. Hitt et al. (1994) argue that increased international diversifica-tion may erode benefits due to increased transaction costs and higher costs of infor-mation collection, processing and dissemination. Hitt et al. (1997) argue that thecombination of expanded range of resources used and the increased scope of govern-ance exceeding managerial capabilities may eventually result in transactional andinformational costs exceeding the benefits of international diversification. Doukas(1995) shows that when corporations with high growth opportunities make foreignacquisitions, the market rewards their desire to internationalise with a higher positivereturn relative to low growth firms making similar moves. In addition, agency issuesare evident when foreign acquisition event returns are negatively related to the degreeof free cash flow for low growth firms. Thus, a multinational diversification strategywill be profitable to the extent that firms have genuine growth opportunities and arenot expanding abroad for managerial motives.
However, given that internalisation of activities is rationalised in terms of economiesof scale, scope and learning, we should expect to see initially higher costs of establishingfacilities abroad. Subsequently, as firms grow abroad, economies of scale and scope startto come into play along with the benefits of increased experience. Thus, there could be aninitial performance decline. Once economies of scale, scope and learning/experience flowin, performance should improve, yielding a U-shaped non-linear relationship betweenthe degree of multinational diversification and performance.Hypothesis 3 seeks to answer the question related to the nature and magnitude of
the relationship between performance and the degree of multinational diversificationmeasured on a continuous scale: A higher degree of multinational diversificationresults in superior financial performance.There could also be additional potential costs resulting from the following: (1) Purely
market share perseverance induced foreign expansion may adversely effect returns(Knickerbocker, 1973); (2) Domestic market saturation forced foreign expansion maynot yield benefits to cover the costs of global expansion (Shapiro, 1986); (3) Non-profit
Multinational Diversification and Corporate Performance 443
# Blackwell Publishing Ltd, 2004

maximising managerial behaviour may result in non-economic foreign expansion(Rugman, 1982); (4) Financial, business and socio-political risk involved in a foreigneconomy may be perceived negatively by investors (Aliber, 1984); (5) Possible doubletaxation and discriminatory regulations hold the potential for generating negative stockprice reaction (Scholes and Wolfson,1992). Which of the two tendencies, namelyperformance enhancing or performance discounting, dominates will determine the netimpact of multinational diversification strategies. It becomes more of an empirical issue.
2.3. Empirical evidence
There is a vast body of empirical literature measuring risk reduction and returnenhancement effects of multinationalism. The basic premise remains that a firm’sgains flow from its ability to ‘exploit uniquely international distortions in capitalmarkets or production’ (Doukas and Travlos, 1988). Hughes et al. (1975), drawing aparallel between the existence of conglomerates and MNCs, suggest that (a) marketimperfections induce barriers to diversification at the individual investor level and(b) potential synergistic gains/financial economies realised by MNCs are two possibleexplanations for the existence of MNCs. MNCs are shown, in their empirical results,to have superior risk-adjusted performance relative to domestic firms. Kindelberger’s(1972) and Caves’ (1974) works suggest that MNCs’ ability to derive gains fromnon-financial market imperfections lead them to become superior foreign investmentvehicles as they extend domestically-secured oligopolistic market powers to inter-national settings. While Jacquillat and Solnik (1978) suggest investment in MNCs tobe poor substitutes for international portfolio diversification, Agmon and Lessard(1977) show that barriers to international financial diversification do exist and MNCsare more efficient in achieving the diversification objective. They further show thatinvestors recognise (and reward) this superior diversification potential of MNCs.Mikhail and Shawky (1979) use a risk-adjusted performance measure to provideevidence of MNCs earning excess returns. Errunza and Senbet (1981) report a positiverelationship between the extent of international activity of MNCs and their excessmarket value. While Fatemi (1984) reports negative excess returns to shareholders ofmultinational firms operating in competitive foreign markets, Michel and Shaked(1986) show that domestic firms have superior risk adjusted performance relative tomultinationals. The results of another study by Grant (1987) suggests that in the staticand dynamic analysis of British manufacturing firms, multinationalisation and profit-ability are positively related and overseas production strongly contributes to increasesin sales and profitability. His argument emphasises the role of firm specific compe-tencies rather than capital market imperfections in generating performance gains.Doukas and Travlos (1988) assert that foreign acquisitions result in valuation gainsrealised by MNCs. Waheed and Mathur (1995) also report mixed wealth effects due togeographic dispersion gains. In general, these studies, using stock-market basedperformance measures, do not provide conclusive evidence on the role of the degreeof multinationalism on firm performance.The relationship between profitability and diversification may be more complex
than normally postulated in empirical settings. In terms of the cause and effectrelation, Grant et al. (1988) in their study on multinational diversification suggest atwo-way causal positive relation between profitability and global expansion.Corporate diversification strategy is a dual dimension decision. Managers may find
complementarities or conflicts between the product and multinational diversification
444 Ike Mathur, Manohar Singh and Kimberly C. Gleason
# Blackwell Publishing Ltd, 2004

strategies. Results of a study of product and multinational diversification by Geringeret al. (1989) suggest that degree of diversification, measured by the ratio of foreignsales to total sales, may have a non-linear concave relation with performance. Danielsand Bracker (1989) provide evidence of a positive association between internationaldiversification at a level of 40–50% of foreign sales to total sales and foreign assets tototal assets. Beyond these proportions the benefits are neither significant nor consist-ent. Hitt et al. (1997) show that, while for highly product diversified firms, the relationbetween multinational diversification and performance is linear and positive, itbecomes inverted and U shaped for moderately product diversified firms and turnsinsignificant for product focused firms. Their evidence suggests the existence ofcomplimentarities across the two diversification types.Kim et al. (1993) empirically support the notion that multinational firms can increase
returns and reduce risks by virtue of having (a) economies of scale and scope beyonddomestic product diversification, (b) a more innovation/learning stimulating dynamicenvironment and (c) the potential to tap cost reduction benefits by choosing least costcombination across awider global base. Examining the dynamic interaction of product andinternational diversification strategies usingquestionnairedata, Sambharya (1995)providesevidence that there is no significant gain from international or product diversificationstrategies individually. But, interactively (a negative correlation between these two typesof diversification) the combination of these two strategies explains the realisation ofperformance gains by multinational firms. Madura and Rose (1987) suggest that themore specialised firms may realise risk reduction benefits by diversifying internationally.Despite a large volume of research on the issue, the evidence remains inconclusive and at
times contradictory. More recently, Tallman and Li’s (1996) results imply a linear positive,thoughweak relation between accounting performance and international operations.How-ever, this relationship holds only when the degree of foreign investment (country scope) isdefinedas thenumberof countries inwhich firmshave subsidiaryunits.Ramaswamy (1993)also finds only weak effects of multinational diversification on profitability.The limited number of studies using accounting-based performance effects of multi-
national diversification do not provide convincing evidence of diversification gains.1
More importantly, evidence on European MNCs has not been provided in earlierworks. This paper seeks to address this issue by distinguishing between the roles of twodifferent strategies of multinational diversification, i.e., export oriented strategy (EOUunits) and FDI strategy (MNC units). Given the ongoing process of European unifica-tion, our study of European companies sheds light on the crucial but unsettled issue ofthe relation between performance and level and the strategy of global diversification.2
1Accounting based performance measures are particularly relevant for two reasons. First, we
are interested in both export and FDI performance. Accounting measures are better suited than
market-based measures to capture realised performance. Second, accounting measures are less
vulnerable to market-specific forces. Accounting measures are more stable under conditions of
short-term economic shocks that may vary across countries.2During the study period, European firms faced an economic environment in which barriers to
the flow of capital and products were breaking down due to the ongoing unification process. To
the extent that these firms engage in ‘within Europe’ multinational operations, unification
would lead to elimination of gains that could be attributed to the exploitation of market
segmentation and imperfections. Existence of gains despite legal unification would highlight
the role of firm-specific factors (as opposed to market factors) in generating a positive influence
on the financial performance of diversified firms.
Multinational Diversification and Corporate Performance 445
# Blackwell Publishing Ltd, 2004
3. Data and methodology
3.1. Data source and description
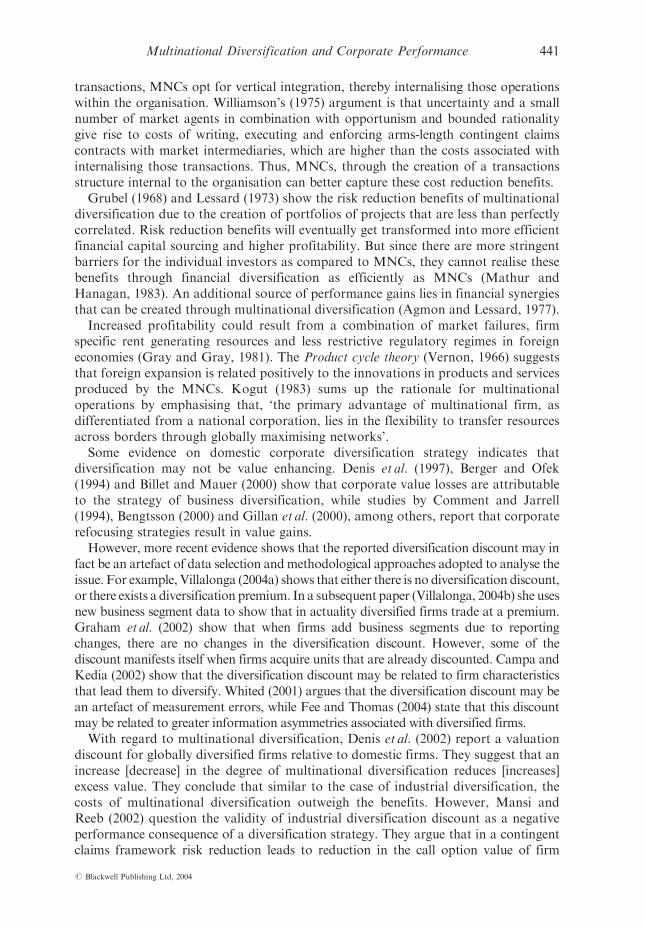
Our data spans the three-year period from 1991 to 1993. The annual balance sheetand income statement data for European companies belonging to the chemicalindustry category (primary SIC 28) were retrieved from WorldScope.3 The followingcriteria are utilised as filters to obtain the final sample: (1) Figures for total assets andnet sales were available; (2) The ratio of R&D expenditures to net sales is available;(3) Companies with foreign sales should be exporting goods a year prior to the sampleperiod. This measure is used to ensure that the status of the firm does not changeduring the reporting period; (4) Companies with foreign assets should be holdingforeign assets for a year prior to the sample period. This measure is used to ensurethat the status of the firm does not change during the reporting period. The abovesample selection criteria resulted in 136, 140 and 134 cross-sectional observations forthe years 1991, 1992 and 1993, respectively. The distribution of the sample firms bycountry is provided in Appendix 1. The largest number of firms is from the UK,followed by France and Germany.
3.2. Description of variables
Dependent variables. Four profitability measures, namely, (a) return on equity (ROE);(b) return on assets (ROA); (c) ratio of pre-tax income to net sales, pre-tax margin(PTMARG); (d) ratio of pre-tax income to total assets (PTINCTA) are considered forevaluating the comparative performance of the three categories of firms.
Independent variables. To address the question of differences in performance duemultinationality, we use an indicator/dummy variable for the complete sample foreach individual year. INTDUM¼ 0 for DOMs and is¼ 1 for EOUs or MNCs. Toaddress the question of differences in performance due to firms following differentdiversification strategies, we use another indicator/dummy variable for the subset ofEOU and MNCs only. FADUM¼ 0 for EOU and is¼ 1 for MNC.Three measures are utilised to measure the firms’ degree of diversification: (a) ratio
of foreign sales to total sales (FSTS) as a measure of export orientation; (b) ratio offoreign assets to total assets (FATA) as a measure of FDI; (c) foreign sales basedentropy measure of foreign diversification (DT) (Jacquemin and Berry, 1979; Palepu,1985).
3 The chemical industry is global. The comparative advantage does not depend on any firm-
specific factor. The factors contributing to successful multinationalisation are firm-specific
comparative advantages. Our goal is to address the microlevel relationship between
multinational diversification strategy and performance, while isolating macro country level
influences. The chemical industry suits this purpose very nicely. Further, we restrict our
analysis to one industry to isolate industry specific influences on firm performance. By
imposing this restriction, we are better able to highlight the role of firm-specific strategic
factors in determining performance. The results obtained are less noisy and performance
gains and losses can be more plausibly linked to the strategy of multinational diversification.
446 Ike Mathur, Manohar Singh and Kimberly C. Gleason
# Blackwell Publishing Ltd, 2004

Additionally, five control variables are used in the analyses: (a) Size: log of net salesrevenue (in billion USD); (b) Leverage: ratio of total debt to total assets (%); (c)Intangibles: ratio of R&D expenditures to net sales (%); (d) Efficiency Measure: netsales per employee (in million USD); (e) Growth: total asset growth rate.
3.3. Methodology
Data analyses are undertaken at two stages. At the first stage, descriptive statistics aswell as nonparametric and parametric tests are used for comparative performance ofthe three categories of firms. Statistically significant differences in performance acrossthe categories would provide preliminary evidence on the association between perform-ance and multinational diversification along with other possible factors explainingdifferential performance, such as size, capital structure and growth, efficiency andintangibility. At the second stage multiple regression models are estimated, for eachof the above-mentioned hypotheses, to quantify the relation of profitability with natureand scale of global diversification. The test model for Hypothesis 1 is
Ri ¼ �i þ �1iLGSLð?ÞS þ �2iDBT
ð�ÞAþ �3iRD
ðþÞSLS þ �4i
ðþÞTAG
þ �5iðþÞ
SðþÞLEMPþ �6iINTDUM þ "i ð1Þ
H01 : �6i ¼ 0 HA1 : �6i > 0
whereLGSLS¼Log of net sales (billion USD),DBTA¼Ratio of total debt to total assets (%),
RDSLS¼Ratio of R&D expenditures to net sales (%),TAG¼Annual growth rate of total assets (%),
SLEMP¼ Sales per employee (million USD),INTDUM¼Binary dummy variable as specified previously and
Ri¼Profitability measure and i¼ 1, 2, 3, 4 for ROE, ROA, PTMARG andPTINCTA, respectively.The hypothesised signs of the coefficients are provided in parentheses below the
model.The test model for Hypothesis 2 is
Ri ¼ �i þ �1iLGSLð?ÞS þ �2iDBTA
ð�Þþ �3iRDS
ðþÞLS þ �4iTAG
þ �5iðþÞ
SLEMPþðþÞ
�6iFADð�ÞUM þ "i ð2Þ
H02 : �6i ¼ 0 HA2 : �6i > 0
where Ri¼Profitability measure and i¼ 1, 2, 3, 4 for ROE, ROA, PTMARG andPTINCTA, respectively and FADUM¼Binary dummy variable as specified previously.The test model for Hypothesis 3 is
Ri ¼ �i þ !1iLGSLð?ÞS þ !2iDBT
ð�ÞAþ !3iRD
ðþÞSLðþÞS þ !4i
ðþÞTDðþÞGþ
ðþÞ!5iSLEMP
þ !6iFSTS þ !7iFATAþ "i ð3Þ
Multinational Diversification and Corporate Performance 447
# Blackwell Publishing Ltd, 2004

H03 : !6i ¼ 0; !7i ¼ 0 HA3 : !6i > 0; !7i > 0
where Ri¼Profitability measure and i¼ 1, 2, 3, 4 for ROE, ROA, PTMARG andPTINCTA, respectively, FSTS¼Ratio of foreign sales to total sales (%),FATA¼Ratio of foreign assets to total assets (%) and DT¼Foreign sales basedentropy measure of total international diversification (Jacquemin and Berry, 1979).The regression models are also estimated with dummy variables for countries.
4. Results and discussion
4.1. Descriptive statistics and mean comparison tests
Descriptive statistics for the sample parameters of interest for the complete sample areprovided in Table 1.
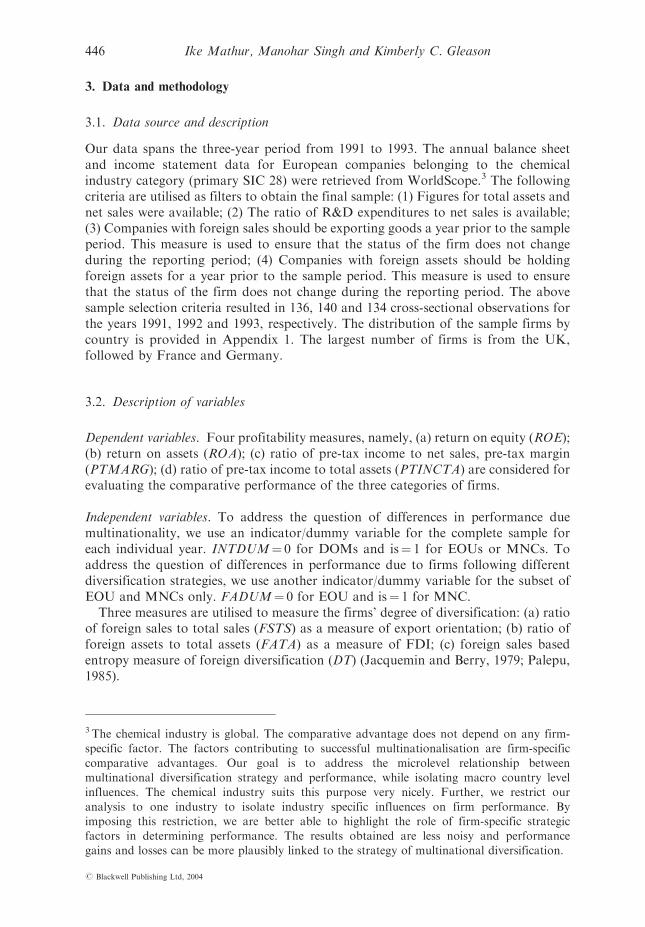
Profitability measures. Non-parametric tests for the mean difference in each of theprofitability measures indicate that profitability increases monotonically with thecategory of diversification for each of the three years. This evidence provides supportfor our main hypotheses, namely, that internationally diversified firms are superiorperformers relative to non-diversified firms and firms undertaking FDI reap addedperformance gains over and above those attributable to export-led diversification. Thedifference in profitability is more significant and pronounced for pre-tax measures ofprofitability (PTMARG and PTINCTA) as compared to after-tax measures of profit-ability (ROE and ROA), supporting our conjecture that differential tax and accountingtreatments may be diluting diversification gains attributable to internationalexpansion.
Size. Size in terms of net sales indicates that MNCs and EOUs are significantly largerthan DOMs. We conduct t tests for differences in the means for EOUs and MNCsand find no significant difference in average size across groups.4 This is true for eachof the three years included in our sample. In combination with the previous results, asignificant though indirect implication is that performance may vary across EOU andMNC groups despite their belonging to the same industry and being of similar size.This result suggests that differences in adopted diversification strategies may explainsuperior performance by MNCs relative to EOUs, largely due to their splitting assetdeployment across borders, thereby tapping gains from international product andfactor market imperfections.
Growth. The figures suggest that for 1991 and 1992, while there is a significantdifference in asset growth for DOMs on the one hand and globally diversified firmson the other, within the group of global firms based on separate nonparametricMann-Whitney U tests, performed for two sample comparisons, EOUs and MNCsdo not differ in growth rates. For 1993, the difference across groups is found to beinsignificant for sales growth.
4 Similar results are obtained when total assets are used to measure size.
448 Ike Mathur, Manohar Singh and Kimberly C. Gleason
# Blackwell Publishing Ltd, 2004

Table1
Descriptivestatistics.
Sizeismeasuredin
term
sofSLS¼Net
salesrevenue(inbillionUSD).TA¼Totalassets(inbillionUSD).Growth
isin
term
sofTAG¼Totalasset
growth.NSLG¼Netsalesgrowth.Perform
ance
proxiesare
ROE¼Return
onequity;ROA¼Return
onassets;PTIN
CTA¼Ratioofpre-taxincome
tototalassets;PTMARG¼Ratioofpre-taxincometo
netsales.Leverageismeasuredinterm
sofDBTA¼Ratiooftotaldebtto
totalassets.Measures
ofdegreeofdiversificationareFSTS¼Ratioofforeignsalesto
totalsalesto
measureexportorientation;FATA¼Ratioofforeignassetsto
totalassets
tomeasure
extentofFDI;DT¼Foreignsalesbasedentropymeasure
offoreigndiversification.S.E
isstandard
errorofthemean.
PERIO
D1991
1992
1993
Percentiles
Percentiles
Percentiles
Variable
Mean
S.E.
Median
25
50
75
Mean
S.E.
Median
25
50
75
Mean
S.E.
Median
25
50
75
TA
5.60
1.07
1.27
0.35
1.27
4.35
4.84
0.86
1.16
0.26
1.16
4.23
5.75
0.89
1.30
0.37
1.30
5.05
SLS
5.79
1.14
1.16
0.42
1.16
4.59
4.80
0.90
1.03
0.30
1.03
4.05
5.20
0.86
1.30
0.39
1.30
4.67
NSLG
6.75
1.59
5.44
�1.32
5.44
11.19
9.73
3.79
2.95
�1.63
2.95
8.38
6.15
1.28
4.76
�1.68
4.76
12.65
TAG
6.87
1.05
6.06
1.34
6.06
11.52
8.55
1.66
4.81
1.08
4.81
13.00
5.45
1.18
3.67
�1.43
3.67
9.94
ROE
12.15
1.59
11.14
3.65
11.14
19.50
10.87
1.23
10.76
4.22
10.76
18.61
8.08
3.55
11.16
4.90
11.16
17.81
ROA
6.23
0.49
6.15
3.08
6.15
9.63
6.40
0.42
6.15
3.61
6.15
9.18
5.97
0.57
6.28
2.73
6.28
9.10
PTMARG
6.48
0.62
6.17
3.14
6.17
10.21
6.52
0.61
6.33
2.15
6.33
9.88
6.34
0.83
6.48
2.51
6.48
11.81
PTIN
CTA
0.07
0.01
0.07
0.03
0.07
0.11
0.06
0.01
0.06
0.02
0.06
0.10
0.06
0.01
0.06
0.03
0.06
0.11
DBTA
24.43
1.25
23.56
15.47
23.56
31.14
24.39
1.16
25.51
14.51
25.51
33.05
23.40
1.13
22.90
14.15
22.90
29.17
FSTS
50.93
2.82
55.98
31.24
55.98
74.75
49.30
2.52
53.98
28.58
53.98
70.68
52.36
2.40
58.27
36.92
58.27
70.40
FATA
8.79
1.56
0.00
0.00
0.00
15.09
10.20
1.47
0.00
0.00
0.00
21.49
11.39
1.51
0.00
0.00
0.00
23.31
DT
0.90
0.04
1.06
0.66
1.06
1.27
0.91
0.04
1.06
0.69
1.06
1.27
0.92
0.04
1.08
0.68
1.08
1.27
Multinational Diversification and Corporate Performance 449
# Blackwell Publishing Ltd, 2004
Table 2
Strategy subgroups mean comparisons.
This table contains comparison tests related to the mean differences in firm specific char-
acteristics among the sample subgroups based on the multinational strategy chosen by the
sample firms. The strategy subgroups are DOM¼Domestic firms; EOU¼Export Oriented
Units; MNC¼ firms with foreign direct investment. Performance proxies are ROE¼Return on
equity; ROA¼Return on assets; PTINCTA¼Ratio of pre-tax income to total assets;
PTMARG¼Ratio of pre-tax income to net sales. Size is measured in terms of SLS¼Net
sales revenue (in billion USD). TA¼Total assets (in billion USD). Leverage is in terms of
DBTA¼Ratio of total debt to total assets (%). Intangibles are defined as RDSLS¼Ratio of
research and development (R&D) expenditures to net sales (%). Efficiency measure is
SLEMP¼Net sales per employee (in million USD). Growth is in terms of TAG¼Total asset
growth. NSLG¼Net sales growth.
Variable DOM EOU MNC H-statistic
Profitability
PTINCTA 1991 0.08 6.66 9.47 18.65a
1992 3.48 5.63 7.93 9.40a
1993 1.07 5.36 9.63 11.39a
PTMARG 1991 0.49 6.47 9.42 18.68a
1992 1.68 6.20 8.43 13.96a
1993 �1.66 6.17 9.33 9.93a
ROE 1991 2.88 11.97 17.98 12.24a
1992 2.56 8.05 16.51 12.05a
1993 �15.4 3.62 22.81 20.81a
ROA 1991 2.12 6.32 8.10 12.51a
1992 4.19 5.57 7.85 12.05a
1993 1.14 5.44 8.41 13.13a
Size
TA 1991 0.52 5.18 9.34 23.65a
1992 0.49 5.19 11.83 30.90a
1993 0.52 5.79 7.46 22.14a
SLS 1991 0.64 5.18 8.54 26.40a
1992 0.58 4.83 6.88 23.50a
1993 0.66 5.14 6.83 23.01a
Growth
TAG 1991 0.58 8.73 9.48 6.46b
1992 5.74 7.23 11.83 5.12c
1993 1.08 5.51 6.86 3.23
NSLG 1991 9.86 7.11 7.14 1.69
1992 1.68 6.20 8.43 13.96a
1993 2.90 4.24 10.15 7.41b
Intangibility
RDSLS 1991 2.18 4.15 2.58 3.01
1992 2.49 4.66 3.13 3.27
1993 2.55 4.48 3.47 2.96
450 Ike Mathur, Manohar Singh and Kimberly C. Gleason
# Blackwell Publishing Ltd, 2004

Efficiency/intangibility. There are no significant differences in the ratio of R&Dexpenditures to sales across the groups. The efficiency measure indicates differencesfor 1992 and 1993.
Leverage. No significant differences are observed in terms of capital structure acrossthe categories, possibly because the sample observations are from the same industrialcategory.
4.2. Regression results
In Tables 3 through 6 we present the sequential regression results for hypotheses 1through 3, respectively. The results are strongly consistent with the theories of themultinational enterprise proposed by Hymer (1976), Dunning (1979) and Rugman(1982) and provide ample support for the proposition that multinational diversifica-tion leads to financial performance gains. They also indicate that while the strategy ofexport orientation leads to improved profitability relative to the strategy of domesticoperations, the strategy of direct foreign asset deployment further consolidates diver-sification gains, supporting findings previously reported by, for example, Errunza andSenbet (1981), Doukas and Travlos (1988), Grant et al. (1988) and Kim, Hwang andBurgers (1993).Table 3 summarises the results for hypothesis 1. The model is designed to provide
insights into whether international diversification of any form provides significantimprovement in the financial performance of a firm. Model 1 uses the previouslymentioned five control variables, along with the binary dummy variable, INTDUM,to provide the estimate of performance gains specific to international diversification.We have a set of four separate regressions for each sample year, based on differentperformance measures as the dependent variable. Regressions A and B use post-taxperformance (ROE and ROA, respectively) and Regressions C and D use pre-taxmargin (PTMARG) and the ratio of pre-tax income to total assets (PTINCTA) asperformance proxies.As hypothesised, a highly significant positive coefficient for INTDUM (at the 5%
significance level or higher) appears for almost all of the profitability measures andacross each of the three years, suggesting substantial gains from international diversi-fication irrespective of the strategy adopted. The one exception is the ROE regressionfor 1991. Robustness is notable as the above coefficient retains its sign andsignificance in seven of the eleven remaining regressions reported, even after controlling
Efficiency
SLEMP 1991 0.21 0.20 0.17 2.82
1992 0.19 0.20 0.16 5.37c
1993 0.14 0.18 0.17 7.36b
Leverage
DBTA 1991 25.55 24.13 26.49 1.52
1992 23.62 24.57 26.42 1.07
1993 23.51 24.40 21.86 0.31
a, b, c Significant at the 1%, 5%, and 10% levels, respectively.
Multinational Diversification and Corporate Performance 451
# Blackwell Publishing Ltd, 2004

Table3
Crosssectionalregressionresultsforhypothesis1.
Ri¼
�þ�1iSLSþ�2D
BTAþ�3iTAG
þ�4iRDSLSþ�5iSLEMPþ�6iINTDUM
þ"
Thistablecontainstheresultsofmultipleregressionanalysisinvestigatingifglobaldiversificationthroughexportingorbyundertakingforeigndirect
investm
ent(FDI)contributesto
thesuperiorfinancialperform
ance
ofdiversified
firm
s.ThetestvariableisadummyIN
TDUM
¼0forDOMs,and¼1
forEOUsorMNCs.Thestrategysubgroupsare
DOM
¼Domesticfirm
s;EOU¼ExportOrientedUnits;MNC¼firm
swithforeigndirectinvestm
ent.
Perform
ance
proxiesareROE¼Return
onequity;ROA¼Return
onassets;PTIN
CTA¼Ratioofpre-taxincometo
totalassets;PTMARG¼Ratioof
pre-taxincometo
net
sales.SizeismeasuredasSLS¼Lgofnet
salesrevenue(inbillionUSD).Leverageisin
term
sofDBTA¼Ratiooftotaldebt
tototalassets(%
).Intangiblesare
defined
asRDSLS¼RatioofR&D
expendituresto
net
sales(%
).Efficiency
measure
isSLEMP¼Net
salesper
employee
(inmillionUSD).Growth
isin
term
sofTAG¼Totalasset
growth.
DEPT
PERIO
DSLS
DBTA
TAG
RDSLS
SLEMP
INTDUM
�R2 %
ROE
1991
3.476
�0.339a
0.178
�0.215
8.193
5.195
3.190
10.3
1992
0.568
�0.352a
0.263a
�0.330
�12.797c
8.163a
11.474b
21.9
1993
�3.711
�1.028a
0.789a
0.232
�20.844
27.410b
17.854
24.5
Pooled
�0.034
�0.603a
0.408a
�0.134
�4.325
13.174a
11.767b
16.4
ROA
1991
0.550
�0.075b
0.144a
0.009
�0.362
2.772
2.910
20.3
1992
�0.505
�0.005c
0.124a
0.002
�3.300
2.495b
6.345a
27.7
1993
�0.125
�0.109a
0.242a
�0.051
�4.732
4.649a
4.504b
39.7
Pooled
�0.019
�0.083a
0.163a
�0.026
�2.391
3.327a
4.631a
29.5
PTMARG
1991
0.638
�0.108a
0.118a
0.076
3.018
5.110a
1.094
21.2
1992
�0.256
�0.122a
0.105a
0.079
�1.020
5.367a
4.485c
22.5
1993
0.080
�0.242a
0.247a
0.221
2.272
7.294a
2.737
39.4
Pooled
0.218
�0.164a
0.151a
0.114
1.014
5.880a
2.918b
26.8
PTIN
CTA
1991
0.006
0.001a
0.001a
0.001
0.001
0.051a
0.037b
23.2
1992
�0.005
�0.002a
0.001a
�0.001
�0.047
0.037b
0.090a
21.4
1993
�0.001
�0.002a
0.002a
0.001
�0.060
0.052a
0.075a
38.3
Pooled
0.001
�0.002a
0.001a
�0.001
�0.030
0.047a
0.068a
27.9
a,b,cSignificantatthe1
%,5
%,and10%
levels,respectively.
452 Ike Mathur, Manohar Singh and Kimberly C. Gleason
# Blackwell Publishing Ltd, 2004

Table4
Crosssectionalregressionresultsforhypothesis2.
Ri¼
�þ�1iSLSþ�2D
BTAþ�3iTAG
þ�4iRDSLSþ�5iSLEMPþ�6iFADUM
þ"
Thistable
containstheresultsofmultiple
regressionanalysisinvestigatingifglobaldiversificationbyundertakingFDIcontributesto
thesuperior
financialperform
ance
ofdiversified
firm
s.Thetest
variable
isadummyFADUM
¼0forEOU,andis¼1forMNC.Thestrategysubgroupsare
DOM
¼Domesticfirm
s;EOU¼ExportOrientedUnits;MNC¼firm
swithforeigndirectinvestm
ent.Perform
ance
proxiesareROE¼Return
onequity;
ROA¼Return
onassets;PTIN
CTA¼Ratioofpre-taxincometo
totalassets;PTMARG¼Ratioofpre-taxincometo
net
sales.Sizeismeasuredas
SLS¼Logofnet
salesrevenue(inbillionUSD).Leverageisin
term
sofDBTA¼Ratiooftotaldebtto
totalassets(%
).Intangiblesare
defined
as
RDSLS¼RatioofR&Dexpendituresto
netsales(%
).Efficiency
measureisSLEMP¼Netsalesper
employee
(inmillionUSD).Growth
isinterm
sof
TAG¼Totalassetgrowth.
DEPT
PERIO
DSLS
DBTA
TAG
RDSLS
SLEMP
FADUM
�R2 %
ROE
1991
2.168
�0.359a
0.143
�0.061
�0.260
5.900c
12.793
5.5
1992
0.904
�0.382a
0.266a
�0.269
�8.504
7.214a
15.583b
28.4
1993
�0.722
�0.686a
0.832a
0.766
�30.710
16.644a
20.292
25.9
Pooled
1.244
�0.597a
0.407a
0.060
�2.516
11.679a
14.605a
18.3
ROA
1991
�0.033
�0.087a
0.134a
0.055
�0.274
2.966b
7.165a
20.9
1992
�0.366
�0.057c
0.125a
0.011
�2.213
1.686b
7.720a
27.7
1993
�0.472
�0.064c
0.222a
0.160c
�4.156
2.629a
7.343a
43.2
Pooled
0.382
�0.082a
0.165a
0.013
�2.309
2.309a
5.401a
30.1
Multinational Diversification and Corporate Performance 453
# Blackwell Publishing Ltd, 2004

Table4
Continued.
DEPT
PERIO
DSLS
DBTA
TAG
RDSLS
SLEMP
FADUM
�R2 %
PTMRG
1991
0.067
�0.139a
0.097a
0.156
5.190
3.335a
7.329a
21.2
1992
�0.136
�0.118a
0.114a
0.120
1.499
2.166c
7.854a
19.9
1993
�0.635
�0.177a
0.216a
0.456a
5.567
2.992b
8.281a
33.9
Pooled
1.027
�0.162a
0.156a
0.170
0.683
3.269a
4.344a
25.7
PTIN
CTA
1991
0.002
0.032a
0.001b
�0.001
0.008
0.032a
0.107a
25.2
1992
�0.003
�0.002a
0.001a
�0.001
�0.025
0.021b
0.106a
23.4
1993
�0.005
�0.002a
0.001a
0.002
�0.037
0.037a
0.097a
39.6
Pooled
0.006
�0.002a
0.001a
�0.001
�0.030
0.032a
0.079a
28.6
a,b,cSignificantatthe1
%,5
%,and10%
levels,respectively.
454 Ike Mathur, Manohar Singh and Kimberly C. Gleason
# Blackwell Publishing Ltd, 2004

for country specific factors.5 In all cases, however, the positive sign of the coefficient ofINTDUM indicates that globally active firms outperform purely domestic firms.The size variable, LGSLS is consistently insignificant. A notable result relates to the
consistently significant negative influence of leverage on performance. As is the casewith previous studies, the negative coefficient of DBTA indicates that higher levels ofdebt in a firm’s total asset base lower the profitability of the firm. The intangibilityvariable, RDSLS, is consistently insignificant for all measures of profitability and forall of the sample years and its sign is not consistent across various regressions. Thegrowth measure, TAG, is consistently positive and significant at the 1% level for allthe profitability measures and for each of the sample years. Though intuitively thismay be perplexing, given the insignificant relationship between size and profitability,the positive and significant coefficient may be viewed as a consequence of reversecausality – higher returns may be reinvested to generate higher growth rate. Finally,the coefficient of the efficiency measure sales per employee is neither significant norconsistently of the same sign across various specifications.6 The insignificance of theefficiency measure, SLEMP, may be due to differential labour costs across countriesand, hence, might not be a comparative measure of cost efficiency for these companies.It should also be noted that in five of the six regressions utilising the pre-tax
measures (PTMARG and PTINCTA) of profitability, performance is significantlydetermined by global operations, while in the case of after-tax measures (ROE andROA), only two of the six INTDUM coefficients are significant. This result is possiblydue to differential tax regimes and accounting treatments across borders, resulting inthe dilution of profitability differentials as determined by the diversification status.Model 2 is designed along the same lines as explained in the case of hypothesis 1
for the sub-sample of internationally diversified companies. The dummy variableINTDUM is replaced by FADUM to provide an estimate of additional performancegains, if any, for adopting a direct asset deployment strategy in the case of MNCs.Table 4 summarises the results for hypothesis 2.Consistent with theoretical literature, a highly significant positive coefficient for
FADUM (in most cases at a less than 5% significance level) for each of the profit-ability measures and for each of the three years implies that international diversifica-tion, through direct asset deployment abroad by MNCs, further consolidates thegains reflected in the form of superior financial performance in comparison withdiversification through exports by EOUs. Thus, MNCs are able to tap internationalfactor market imperfections and translate them into higher profitability. Similar to theresults for hypothesis 1, the robustness of the results for hypothesis 2 is evident sincethe FADUM coefficients are consistently positive and significant across variousprofitability proxies and sample periods.An interesting feature comes to the surface when we include country dummy
variables. Except for Norway and Switzerland, all other countries represent theEuropean Union. In the pre-unification year (1991), after controlling for countryspecific differences, the pre-tax performance proxies are significantly explained by
5The regression results with the dummy variables for countries are not reported in this paper.
They are available from the authors.6No significant deterioration in R2 is observed when the efficiency measure is dropped from the
model, indicating that the inclusion of the efficiency measure does not improve the explanatory
power of the model.
Multinational Diversification and Corporate Performance 455
# Blackwell Publishing Ltd, 2004

the MNC dummy variable. In contrast, in the period following unification (1992 and1993), both the pre-tax and after-tax performance measures are not significantlyexplained by the MNC dummy variable once we control for country specific factors.This may be due to the erosion of benefits to FDI arising from the exploitation ofcapital market imperfections following unification. However, in the pre- and after-unification years, the country specific factors adjusted pre- and after-tax performancevariables exhibit a significant positive relationship with the degree of export orientation.The size variable appears with a negative sign and is insignificant in all cases.
Leverage again appears as having a significantly negative influence on the rates ofreturns. Total asset growth (TAG) is again positively associated with profitabilityindices. Overall, hypothesis 2 – within the group of internationally diversified firms,the strategy of FDI strengthens profitability – receives empirical support.Model 3 is designed for the complete set of firms. The dummy variables of the earlier
models are replaced the continuous measures of international diversification, namely theratio of foreign sales to total sales (FSTS is a measure for degree of export orienteddiversification) and ratio of foreign assets to total assets (FATA is a measure of degree ofFDI) to provide evidence on the issue of the relationship between the degree of multi-national diversification and returns. Table 5 summarises the results for hypothesis 3. Thecoefficient estimates of FSTS are all positive and significant in nine of the twelve cases. Inall pre-tax performance regressions, FSTS appears with significant positive coefficientsfor all three sample periods, strongly indicating that in our sample, firms having higherproportion of their sales revenue originating abroad, experience significantly higher ratesof return. In seven of the nine equations for which FSTS is significant, even aftercontrolling for country specific factors, its coefficient appears with a positive coefficient.In all but one of the six equations with pre-tax income as the dependent variable, FSTSremains significant even after the introduction of country dummies.There is, thus, convincing evidence that a strong positive association exists between
the degree to which firms generate their sales in foreign markets and their overall ratesof return. The results are consistent with various theories of multinational diversifica-tion and with the previous empirical evidence provided by Geringer et al. (1989) andGrant et al. (1988), suggesting superior financial performance as a consequence ofoperational diversification abroad.Finally, the coefficient estimates of the second measure of international diversifica-
tion, FATA, are consistently positive in all regressions and for all sample years andsignificant for ten of the twelve regression estimates reported. Thus, globally operat-ing firms are able to exploit factor market distortions to realise performance gains.The coefficients for both FSTS and FATA being positive and significant, providestrong support for our hypothesis that MNCs realise improved profitability byfollowing the strategy of directly investing abroad. These gains for MNCs throughFDI are in addition to those attributable to foreign sales alone. Consistently signifi-cant and positive coefficients for FATA and FSTS in various regressions indicate therobustness of the results. There is clear evidence that MNCs are able to exploiteconomic rents from imperfections in global factors and product markets, by eitherreducing their costs and/or by improving productivity.After controlling for country specific differences, the FSTS coefficient still remains
significant, indicating that firms are able to exploit benefits of economies of scale,managerial and financial synergies and other country specific factor endowments,irrespective of their country of domicile. More importantly, the performance gainsremain significant even in post-unification years (1992 and 1993) for pre-tax measures.
456 Ike Mathur, Manohar Singh and Kimberly C. Gleason
# Blackwell Publishing Ltd, 2004

Table5
Crosssectionalregressionresultsforhypothesis3.
Ri¼
�þ�1iSLSþ�2D
BTAþ�3iTAG
þ�4iRDSLSþ�5iSLEMPþ�6iFSTSþ�7iFATAþ"
Thistablecontainsresultsofmultipleregressionanalysisinvestigatingifthetypeanddegreeofglobaldiversificationbyundertakingexportsand/orFDI
contributeto
thesuperiorfinancialperform
ance
ofdiversified
firm
s.Thetestvariableinterm
sdegreeofdiversificationareFSTS¼Ratioofforeignsales
tototalsalesto
measure
export
orientation;FATA¼Ratioofforeignassetsto
totalassetsto
measure
extentofFDI.Thestrategysubgroupsare
DOM
¼Domesticfirm
s;EOU¼Export
OrientedUnits;MNC¼Firmswithforeigndirectinvestm
ent.Perform
ance
proxiesare
ROE¼Return
on
equity;ROA¼Return
onassets;PTIN
CTA¼Ratioofpre-taxincometo
totalassets;PTMARG¼Ratioofpre-taxincometo
netsales.Sizeismeasured
interm
sofSLS¼Logofnet
salesrevenue(inbillionUSD).Leverageisin
term
sofDBTA¼Ratiooftotaldebtto
totalassets(%
).Intangiblesare
defined
asRDSLS¼RatioofR&Dexpendituresto
netsales(%
).Efficiency
measureisSLEMP¼Netsalesperem
ployee
(inmillionUSD).Growth
isin
term
sofTAG¼Totalassetgrowth.
DEPT
PERIO
DSLS
DBTA
TAG
RDSLS
SLEMP
FSTS
FATA
�R2 %
ROE
1991
2.503
�0.359a
0.190c
�0.207
10.490
0.085
0.096
5.630
15.7
1992
�0.383
�0.371a
0.267a
�0.247
�9.068
0.099b
0.170b
14.305a
25.6
1993
�2.990
�1.014a
0.818a
0.265
�18.156
0.148
0.413b
26.240c
24.3
Pooled
�0.751
�0.621a
0.424a
�0.074
�0.697
0.120b
0.246a
16.422a
17.8
ROA
1991
0.542
�0.083b
0.154a
0.013
�0.224
0.024
0.032
3.997b
20.3
1992
�0.693
�0.054b
0.126a
0.001
�2.463
0.028c
0.039c
7.190a
29.0
1993
�0.085
�0.108a
0.246a
�0.059
�4.067
0.037b
0.048c
5.864a
38.9
Pooled
�0.107
�0.087a
0.168a
�0.020
�1.766
0.314a
0.040a
5.740a
30.0
Multinational Diversification and Corporate Performance 457
# Blackwell Publishing Ltd, 2004

Table5
Continued.
DEPT
PERIO
DSLS
DBTA
TAG
RDSLS
SLEMP
FSTS
FATA
�R2 %
PTMARG
1991
0.312
�0.123a
0.134a
0.008
3.929
0.058a
0.064b
3.188
23.2
1992
�0.846
�0.132a
0.110a
0.096
0.987
0.794a
0.055c
6.246a
23.6
1993
�0.186
�0.242a
0.250a
0.196
4.300
0.076a
0.077c
4.851c
37.5
Pooled
�0.236
�0.171a
0.158a
0.115
2.784
0.073a
0.687a
4.883a
29.8
PTIN
CTA
1991
0.007
�0.002a
0.001a
�0.001
0.002
0.001b
0.001c
0.057a
21.7
1992
�0.0071
�0.0017a
0.001a
�0.008
�0.035
0.0004b
0.0004
0.102a
22.9
1993
�0.001
�0.002a
0.002a
0.001
�0.005
0.001c
0.001b
0.091a
38.5
Pooled
�0.001
�0.002a
0.001a
�0.001
�0.022
0.001a
0.001a
0.084a
28.6
a,b,cSignificantatthe1
%,5
%,and10%
levels,respectively.
458 Ike Mathur, Manohar Singh and Kimberly C. Gleason
# Blackwell Publishing Ltd, 2004

This implies that while unification may have eroded potential benefits of exploitinginternational product market imperfections, the benefits of economies of scope and scaleas well as managerial and financial synergies are still realised through exports.In contrast, FATA, although significantly positive for all performance measures in
each of the sample years, does not remain so when we control for country specificfactor differences. It is consistent with financial intuition, considering that the verylogic behind gains for diversification lies in the existence of product and factor marketdifferences across political borders. If we control for country specific factor differ-entials, no product or factor market differentials are anticipated, nor are benefits fromexporting or investing abroad. It may be the case that due to unification, Europe isbecoming virtually one uniform market with the effect being the same as completeintegration where international diversification cannot generate performance gains.The question arises as to why, despite unification, FSTS still remains significant
even after controlling for country differentials and in the post-unification period aswell. It must be realised that gains from exporting arise from two sources, namelyinternational product market imperfections (which become irrelevant after controllingfor country factors and during the post-unification years) and firm specific factorsgenerating benefits in terms of financial, operating and managerial economies of scaleand scope. The latter source of gains still remains intact even in the post-unificationperiod and after controlling for country differentials.In the case of FDI, however, the dominant source of gains is market imperfections
and segmentation, which is eroded once we control for country differentials. Further-more, whatever remaining benefits MNCs derive from selling abroad are capturedthrough FSTS, the coefficient of which remains consistently significant. A furthercomplication seems to be that if unification creates a level playing field, then in theyears 1992 and 1993, investing abroad should have had no significant contribution toperformance. In this case, the coefficient of FATA should be insignificant. Here,however, one must realise that unification is one thing – more of an elimination oflegal/regulatory barriers – and complete market integration is another. Differentcountries exhibit unequal factor endowments and different business environments,uneven levels of manpower, labour skill, technology and different corporate organisa-tional structure, as well as culture. While in the post-unification period the regulatoryenvironment may have been moderated, the pure market conditions differential maystill allow realisation of gains from investing abroad. Thus, in our results, thecoefficient of FATA remains significant for post unification years. However, oncewe control for country specific factors using dummies that capture regulatory as wellas market economic differentials, FATA no longer appears significant.The results related to the control variable coefficients are similar to the ones
observed in earlier model specifications.In summary, the Model 3 results suggest that international diversification creates a
positive influence on profitability through export orientation as well as through FDI.In addition, it appears that the higher the degree of foreign operations, the higher isthe rates of realised financial returns.
4.3. Robustness checks
Entropy measure of diversification. When we use entropy measure of internationaldiversification, the results, reported in Table 6, confirm our findings of a positive
Multinational Diversification and Corporate Performance 459
# Blackwell Publishing Ltd, 2004

Table6
Crosssectionalregressionsforperform
ance-internationaldiversification(entropy)relationship.
Ri¼
�þ�1iSLSþ�2D
BTAþ�3iTAG
þ�4iRDSLSþ�5iSLEMPþ�6iDT
þ"
Thistablecontainstheresultsofmultipleregressionanalysisinvestigatingifthedegreeofglobaldiversificationbyundertakingexportscontributeto
the
superiorfinancialperform
ance
ofdiversified
firm
s.Thetestvariablein
term
sdegreeofdiversificationisDT¼Foreignsalesbasedentropymeasure
of
foreign
diversification.Thestrategysubgroupsare
DOM
¼Domesticfirm
s;EOU¼Export
Oriented
Units;
MNC¼Firmswith
foreign
direct
investm
ent.
Perform
ance
proxiesare
ROE¼Return
onequity;ROA¼Return
onassets;
PTIN
CTA¼Ratioofpre-taxincometo
totalassets;
PTMARG¼Ratioofpre-taxincometo
net
sales.
Sizeis
measuredasSLS¼Logofnet
salesrevenue(inbillionUSD).Leverageis
interm
sof
DBTA¼Ratiooftotaldebtto
totalassets(%
).Intangiblesare
defined
asRDSLS¼RatioofR&D
expendituresto
netsales(%
).Efficiency
measure
is
SLEMP¼Netsalesperem
ployee
(inmillionUSD).Growth
isinterm
sofTAG¼Totalassetgrowth.Thefiguresreported
inparenthesesarecoefficient
significance
probabilityvalues.
DEPT
PERIO
DSLS
DBTA
TAG
RDSLS
SLEMP
DT
aR2
DOF
F
ROE
1991
4.678b
�0.276b
0.180
�0.469
6.505
1.480
2.390
0.096
103
2.928b
1992
0.275
�0.313a
0.261a
�0.475b
�13.732c
6.501b
13.944a
0.240
116
7.422a
1993
�2.592
�1.002a
0.822a
0.075
�28.219
14.967c
25.801c
0.226
127
7.485a
ROA
1991
1.225c
�0.061c
0.181a
�0.146
�1.108
0.582
2.953
0.194
103
5.376a
1992
�0.551
�0.038
0.126a
�0.050
�3.401
1.86c
7.031a
0.276
116
8.763a
1993
0.074
�0.104a
0.248a
�0.077
�5.994
2.51b
5.852a
0.375
127
14.299a
PTMARG
1991
0.553
�0.090b
0.249a
0.002
1.287
2.685c
2.598
0.263
103
7.482a
1992
�0.975
�0.104
0.113a
0.048
�1.048
5.127a
6.329a
0.212
116
6.477a
1993
0.026
�0.235a
0.253a
0.165
0.746
5.111a
4.875c
0.356
127
13.243a
PTIN
CTA
1991
0.014
�1.474a
0.002a
�0.002c
�0.013
0.018
0.040c
0.263
103
7.487a
1992
�0.005
�0.006a
0.001a
�0.001
�0.051c
0.029b
0.10a
0.209
116
6.381a
1993
0.009
�0.003a
0.002a
�0.001
�0.075
0.026c
0.090a
0.362
127
13.587a
a,b,cSignificantatthe1%,5%,and10%
levels,respectively.
460 Ike Mathur, Manohar Singh and Kimberly C. Gleason
# Blackwell Publishing Ltd, 2004

relationship between the degree of export orientation and firm performance. In allregressions the coefficient of the entropy measure DT is positive and in 9 of the 12cases it is statistically significant.
Lagged performance impact. To investigate the issue of causation running from theprevious degree of foreign diversification leading to higher future performance with alag, we estimated lagged FSTS regressions. The results (available from the authors)show that international diversification yields significant performance gains.
Controlling for the interactive effects of international and product diversification. Hittet al. (1997), among others, provide evidence that the relationship between perform-ance and international diversification may be conditional on a firm being productdiversified. Therefore, we check the robustness of our results by controlling for theinfluence of product diversification. We control for product diversification by intro-ducing a dummy¼ 1 for multi-segment firms and¼ 0 otherwise and running regres-sion using interactive dummies for international and product diversification. We dothis for all years and for all performance measures. With a few exceptions, results (notreported) show no impact of product diversification. The main reason for this may bethat we are dealing with firms belonging to only one industry, namely, the chemicalindustry. There may not be enough variation in within industry diversification amongthe sample firms.
Testing for non-linearity. Finally, we test for possible non-linearity in the relationshipbetween performance and the degree of international diversification. The results (notreported) indicate that none of the coefficient showing non-linearity is significant atthe conventional 5% level. Thus, we cannot definitively conclude in favor of evidenceon the non-linearity of the relationship between performance and internationaldiversification.
5. Conclusions
The intent of this study is to address three basic questions, namely, (a) are therefinancial performance gains attributable to multinational diversification, (b) are theredifferential performance effects related to the strategies of export orientation versusforeign direct investment and (c) do higher degrees of export orientation and directasset deployment abroad translate into superior financial performance? For oursample of European chemical industry firms the findings provide strong affirmativeanswers to all three of the above questions. The results provide ample evidence thatfirms involved in multinational operations, irrespective of the strategy (EOU versusFDI) outperform purely domestic units. The results are in conformance witharguments by Hymer (1976), Dunning (1979), Rugman (1982) and Williamson(1975) that highlight the importance of tapping imperfections in international productand factor markets. The accounting based performance gains related to multinationaldiversification are in consonance with market-based value gains reported by Doukasand Travlos (1988), Mikhail and Shawky (1979) and Errunza and Senbet (1981), whoattribute these gains to the existence of market imperfections and generation ofmanagerial synergy. Our results fall more in line with those reported by Grant et al.(1988) and Geringer et al. (1989), who provide evidence of gains from exporting. Inaddition, our evidence suggests increased profitability associated with FDI, thereby
Multinational Diversification and Corporate Performance 461
# Blackwell Publishing Ltd, 2004

corroborating Kogut’s (1983) rationale that cross-border transfers of resourcesfacilitate the globally maximising network.Our study, by focusing on European firms in the years surrounding European
unification, provides timely and interesting observations that while European unifica-tion may have eroded potential benefits of exploiting international capital andproduct market imperfections, the benefits of firm specific economies of scope andscale as well as managerial and financial synergies are still realised through exports.
References
Agmon, T. and Lessard, D. R., ‘Investor recognition of corporate international diversification’,
Journal of Finance, Vol. 32, 1977, pp. 1049–55.
Aliber, R. Z., ‘International banking: a survey’, Journal of Money Credit and Banking, Vol. 16,
1984, pp. 661–84.
Bengtsson, Lars, ‘Corporate strategy in a small open economy: reducing product diversification
while increasing international diversification’, European Management Journal, Vol. 18, 2000,
pp. 444–53.
Berger, P. G. and Ofek, E., ‘Diversification’s effect on firm value’, Journal of Financial
Economics, Vol. 37, 1994, pp. 39–65.
Billet, M. T. and Mauer, D. C., ‘Diversification and the value of internal capital markets: the
case of tracking stock’, Journal of Banking and Finance, Vol. 24, 2000, pp. 1457–1490.
Buckley,P. J. andCasson,M.TheFuture ofMultinationalEnterprise (NewYork:MacMillan, 1976).
Campa, J. M. and Kedia, S., ‘Explaining the diversification discount’, Journal of Finance,
Vol. 57, 2002, 1731–62.
Caves, R. E., ‘International trade investment and imperfect markets’, Princeton Papers in
International Economics, November 1974, pp. 1–97.
Comment, R. and Jarrell, G. A., ‘Corporate focus and stock returns’, Journal of Financial
Economics, Vol. 37, 1994, pp. 67–87.
Daniels, J. and Bracker, J., ‘Profit performance: do foreign operations make a difference?’
Management International Review, Vol. 29, 1989, pp. 46–56.
Denis, D. J., Denis, D. K. and Sarin, A., ‘Agency problems, equity ownership and corporate
diversification’, Journal of Finance, Vol. 52, 1997, pp. 135–60.
Denis, D. J., D. K. Denis and K. Yost., ‘Global diversification, industrial diversification and
firm value’, Journal of Finance Vol. 57, 2002, 1951–79.
Doukas, J., ‘Overinvestment, Tobin’s q and gains from foreign acquisitions,’ Journal of Banking
and Finance, Vol. 19, 1995, 1285–1303.
Doukas, J. and Travlos, N., ‘Effect of corporate multinationalism on shareholders wealth:
evidence from international acquisitions’, Journal of Finance, Vol. 43, 1988, pp. 1161–75.
Dunning, J. H., ‘Explaining changing patterns of international production: in defense of eclectic
theory’, Oxford Bulletin of Economics and Statistics, Vol. 41, 1979, pp. 269–95.
Errunza, V. A. and Senbet, L. W., ‘The effects of international operations on the market value
of the firm: theory and evidence’, Journal of Finance, Vol. 36, 1981, pp. 401–17.
Fatemi, A. M., ‘Shareholder benefits from corporate international diversification’, Journal of
Finance, Vol. 39, 1984, pp. 1325–44.
Fee, C. E. and Thomas, S., ‘Corporate diversification, asymmetric information and firm value:
evidence from stock market trading characteristics’, Journal of Corporate Finance, Vol. 10,
2004, pp. 105–29.
Geringer, J. M., Beamish, P. W. and da Costa, R. C., ‘Diversification strategy and international-
isation: implications for MNE performance’, Strategic Management Journal, Vol. 10, 1989,
pp. 109–19.
Gillan, S. L., Kensinger, J. W. and Martin, J. D., ‘Value creation and corporate diversification:
the case of Sears, Roebuck & Co’, Journal of Financial Economics, Vol. 55, 2000, pp. 103–37.
462 Ike Mathur, Manohar Singh and Kimberly C. Gleason
# Blackwell Publishing Ltd, 2004

Graham, J., Lemmon, M. and Wolf, J., ‘Does corporate diversification destroy value?’ Journal
of Finance, Vol. 57, 2002, pp. 695–720.
Grant, R., ‘Multinationality and performance among British manufacturing companies’,
Journal of International Business Studies, Vol. 18, No. 3, 1987, pp. 79–89.
Grant, R. M., Jammine, A. P. and Thomas, H., ‘Diversity, diversification and profitability
among British manufacturing companies, 1972–1984’, Academy of Management Journal, Vol.
31, 1988, pp. 771–801.
Gray, M. J. and Gray, H. P., ‘The multinational bank: a financial MNC ?’, Journal of Banking
and Finance, Vol. 5, 1981, pp. 33–63.
Grubel, H. G., ‘Internationally diversified portfolios: welfare gains and capital flows’, American
Economic Review, Vol. 58, 1968, pp. 1299–1314.
Hennart, J. F. A Theory of Multinational Enterprise (University of Michigan Press, 1982).
Hitt, M., Hoskisson, R. and Ireland. R., ‘A mid-range theory of interactive effects of
international and product diversification on innovation and performance’, Journal of
Management, Vol. 20, 1994, pp. 297–326.
Hitt, M., Hoskisson, R. and Kim, H., ‘International diversification: effects on innovation and
firm performance in product-diversified firms’, Academy of Management Journal, Vol. 40,
1997, pp. 767–98.
Hughes, J. S., Logue, D. E. and Sweeny, R. J., ‘Corporate international diversification and
market assigned measures of risk and diversification’, Journal of Financial and Quantitative
Analysis, Vol. 10, 1975, pp. 627–637.
Hymer, S. H. The International Operations of National Firms: a Study of FDI (Cambridge MA.
MIT Press, 1976(1960)).
Jacquemin, A. P. and Berry, C. H., ‘Entropy measure diversification and corporate growth’,
Journal of Industrial Economics, Vol. 27, 1979, pp. 359–70.
Jacquillat, B and Solnik, B. H., ‘Multinationals are poor tools for diversification’, Journal of
Portfolio Management, Vol. 4, 1978, pp. 8–12.
Kim, W. C., Hwang, P. and Burgers, W. P., ‘Multinationals diversification and the risk-return
trade-off’, Strategic Management Journal, Vol. 14, 1993, pp. 275–86.
Kindelberger, C. P., ‘The benefits of international money’, Journal of International Economics,
Vol. 2, 1972, pp. 425–42.
Knickerbocker, F. T. Oligopolistic Reaction and Multinational Enterprise (Division of Research,
School of Business Administration, Harvard University, 1973).
Kogut, B., ‘Foreign direct investment as a sequential process’, in, K. P. Kindelberger and
D. Andretsch (eds), The Multinational Corporations In 1980s (Cambridge: MIT Press, 1983,
pp. 38–56).
Lessard, D., ‘International portfolio diversification’, Journal of Finance, Vol. 28, 1973,
pp. 619–32.
Madura, J. and Rose, L. C., ‘Are product specialisation and international diversification
strategies compatible?’ Management International Review, Vol. 27, No 3, 1987, pp. 38–44.
Mansi, S. A. and Reeb, D. M., ‘ Corporate diversification: what gets discounted?’, Journal of
Finance Vol. 57, 2002, 2167–83.
Mathur, I. and Hanagan, K., ‘Are multinational corporations superior investment vehicles for
achieving international diversification?’ Journal of International Business Studies, Vol. 14,
Winter 1983, pp. 135–46.
Michel, A. and Shaked, I., ‘Multinational corporations versus domestic corporations: financial
performance and characteristics’, Journal of International Business Studies, Vol. 17, 1986,
pp. 89–100.
Mikhail, A. D. and Shawky, H. A., ‘Investment performance of US based multinational
corporations’, Journal of International Business Studies, Vol. 10, Spring/Summer 1979,
pp. 53–66.
Palepu, K., ‘Diversification strategies, profit performance and the entropy measure’, Strategic
Management Journal, Vol. 6, 1985, 239–55.
Multinational Diversification and Corporate Performance 463
# Blackwell Publishing Ltd, 2004

Ramaswamy, R., ‘Multinationality and performance: an empirical examination of moderating
effects of configuration’, Academy of Management, Best Papers Proceedings, 1993.
Rugman, A. ‘Internalization and non-equity forms of international involvement’, in
A. Rugman, (ed.), New Theories of Multinational Enterprise (London: Croom Helm, 1982).
Shapiro, A. Multinational Financial Management (Boston MA: Allyn and Bacon, 1986).
Sambhraya, R. B., ‘The combined effect of international diversification and product diversifi-
cation strategies on the performance of US-based multinational corporations’, Management
International Review, Vol. 35, 1995, pp. 197–218.
Scholes, M. and Wolfson, M. Taxes and Business Strategy: a Planning Approach (Prentice Hall,
1992).
Tallman, S. and Li, J., ‘Effects of international diversity and product diversity on the perform-
ance of multinational firms’, Academy of Management Journal, Vol. 39, 1996, pp. 179–96.
Vernon, R., ‘International investment and international trade in the product cycle’, Quarterly
Journal of Economics, Vol. 81, 1966, pp. 190–207.
Villalonga, B., ‘Does diversification cause the ‘‘diversification discount’’?’ Financial Manage-
ment, Vol. 33, 2004a, pp. 5–27.
Villalonga, B., ‘Diversification discount or premium? New evidence from the Business Informa-
tion Tracking Series’, Journal of Finance, Vol. 59, 2004b, pp. 477–506.
Waheed, A. and Mathur, I., ‘Wealth effects of foreign expansion by U.S. banks’, Journal of
Banking and Finance, Vol. 5, 1995, pp. 823–42.
Whited, T., ‘Is it efficient investment that causes the diversification discount?’ Journal of
Finance, Vol. 56, 2001, 1667–91.
Williamson, O. E. Markets and Hierarchies: Analysis and Antitrust Implications (New York:
Free Press, 1975).
Appendix 1. Country breakdown of sample firms
Number of firms
Country 1991 1992 1993
1. Austria 1 2 2
2. Belgium 2 2 2
3. Denmark 0 0 2
4. Finland 7 7 7
5. France 22 23 23
6. Germany 17 19 17
7. Ireland 1 2 1
8. Italy 13 14 13
9. Netherlands 6 6 6
10. Norway 4 5 5
11. Sweden 3 3 3
12. Switzerland 11 11 11
13. United Kingdom 49 46 42
Total 136 140 134
464 Ike Mathur, Manohar Singh and Kimberly C. Gleason
# Blackwell Publishing Ltd, 2004