The new generation magnetic-iron-detector to measure the iron overload in the human liver
Upload
independentCategory
view
3download
0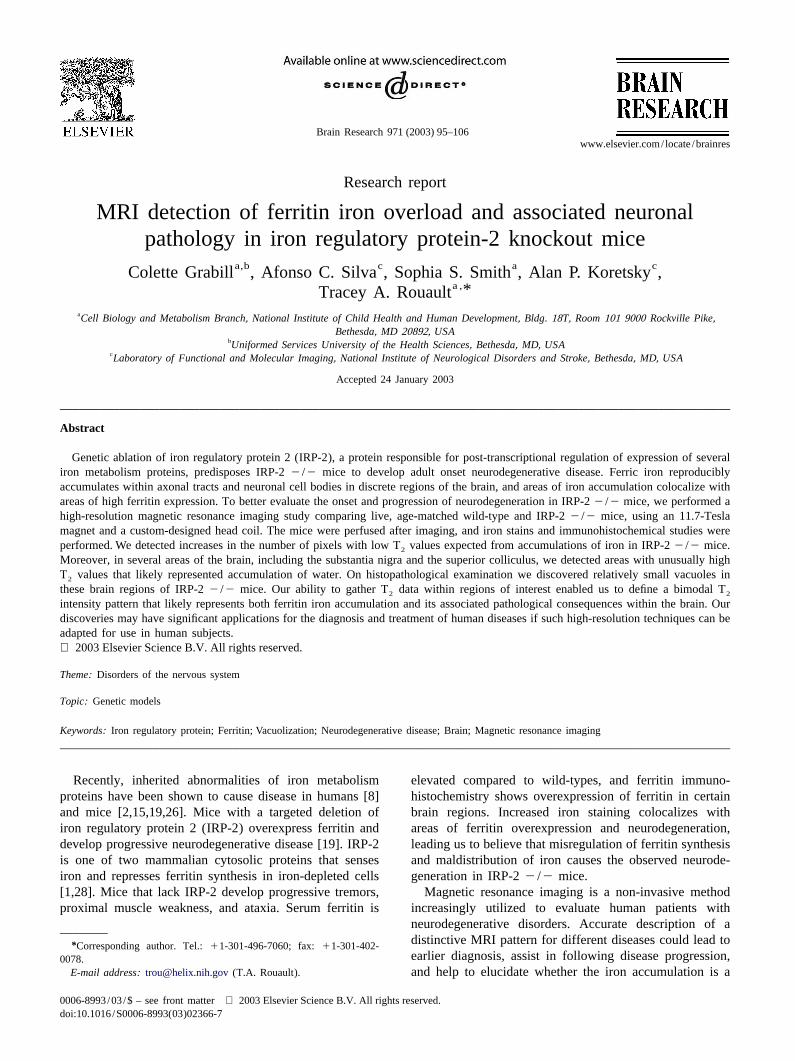
Brain Research 971 (2003) 95–106www.elsevier.com/ locate/brainres
Research report
M RI detection of ferritin iron overload and associated neuronalpathology in iron regulatory protein-2 knockout mice
a,b c a cColette Grabill , Afonso C. Silva , Sophia S. Smith , Alan P. Koretsky ,a ,*Tracey A. Rouault
aCell Biology and Metabolism Branch, National Institute of Child Health and Human Development, Bldg. 18T, Room 101 9000Rockville Pike,Bethesda, MD 20892,USA
bUniformed Services University of the Health Sciences, Bethesda, MD, USAcLaboratory of Functional and Molecular Imaging, National Institute of Neurological Disorders and Stroke, Bethesda, MD, USA
Accepted 24 January 2003
Abstract
Genetic ablation of iron regulatory protein 2 (IRP-2), a protein responsible for post-transcriptional regulation of expression of severaliron metabolism proteins, predisposes IRP-22 /2 mice to develop adult onset neurodegenerative disease. Ferric iron reproduciblyaccumulates within axonal tracts and neuronal cell bodies in discrete regions of the brain, and areas of iron accumulation colocalize withareas of high ferritin expression. To better evaluate the onset and progression of neurodegeneration in IRP-22 /2 mice, we performed ahigh-resolution magnetic resonance imaging study comparing live, age-matched wild-type and IRP-22 /2 mice, using an 11.7-Teslamagnet and a custom-designed head coil. The mice were perfused after imaging, and iron stains and immunohistochemical studies wereperformed. We detected increases in the number of pixels with low T values expected from accumulations of iron in IRP-22 /2 mice.2
Moreover, in several areas of the brain, including the substantia nigra and the superior colliculus, we detected areas with unusually highT values that likely represented accumulation of water. On histopathological examination we discovered relatively small vacuoles in2
these brain regions of IRP-22 /2 mice. Our ability to gather T data within regions of interest enabled us to define a bimodal T2 2
intensity pattern that likely represents both ferritin iron accumulation and its associated pathological consequences within the brain. Ourdiscoveries may have significant applications for the diagnosis and treatment of human diseases if such high-resolution techniques can beadapted for use in human subjects. 2003 Elsevier Science B.V. All rights reserved.
Theme: Disorders of the nervous system
Topic: Genetic models
Keywords: Iron regulatory protein; Ferritin; Vacuolization; Neurodegenerative disease; Brain; Magnetic resonance imaging
Recently, inherited abnormalities of iron metabolism elevated compared to wild-types, and ferritin immuno-proteins have been shown to cause disease in humans [8] histochemistry shows overexpression of ferritin in certainand mice [2,15,19,26]. Mice with a targeted deletion of brain regions. Increased iron staining colocalizes withiron regulatory protein 2 (IRP-2) overexpress ferritin and areas of ferritin overexpression and neurodegeneration,develop progressive neurodegenerative disease [19]. IRP-2 leading us to believe that misregulation of ferritin synthesisis one of two mammalian cytosolic proteins that senses and maldistribution of iron causes the observed neurode-iron and represses ferritin synthesis in iron-depleted cells generation in IRP-22 /2 mice.[1,28]. Mice that lack IRP-2 develop progressive tremors, Magnetic resonance imaging is a non-invasive methodproximal muscle weakness, and ataxia. Serum ferritin is increasingly utilized to evaluate human patients with
neurodegenerative disorders. Accurate description of adistinctive MRI pattern for different diseases could lead to*Corresponding author. Tel.:11-301-496-7060; fax:11-301-402-earlier diagnosis, assist in following disease progression,0078.
E-mail address: [email protected](T.A. Rouault). and help to elucidate whether the iron accumulation is a
0006-8993/03/$ – see front matter 2003 Elsevier Science B.V. All rights reserved.doi:10.1016/S0006-8993(03)02366-7
96 C. Grabill et al. / Brain Research 971 (2003) 95–106
cause or a consequence of the pathology. The underlying flurane in a gas mixture of 50% N :50% O delivered2 2
principle of visualizing iron on MRI is that the iron storage through a face mask during the entire procedure. Toprotein ferritin has a superparamagnetic core which dis- prevent motion during the scans, the mice were fitted to arupts the magnetic field and produces a lower (darker) custom-built head holder consisting of a bite bar placedsignal on T weighted images [11]. Many MRI studies of inside the facemask. Body temperature was monitored2
human patients with neurodegenerative diseases have been using a rectal probe and maintained greater than 358Creported [3,18,24], and perfused brains from rats with a using a warm water pad placed underneath their body.mutation in DMT1 have been imaged [38], but to the best After imaging, animals recovered by breathing room airof our knowledge, MRI has not been previously used to while still on the warm water pad.study iron overload in mice with neurodegenerative dis-ease. 1 .3. MRI methods
The objective of our study was to utilize MRI as a toolfor non-invasive detection of brain iron accumulation and All images were acquired using an 11.7-T/31-cmassociated pathology in IRP-22 /2 mice. We initially horizontal magnet (Magnex, Abingdon, UK), interfaced tohypothesized that overexpression of ferritin and increased a Bruker AVANCE console (Bruker, Billerica, MA). Im-iron deposition in specific brain regions of IRP-22 /2 ages were acquired using an 89-mm Helmholtz transmitmice would result in detection of lower T values (darker RF coil and an 8315-mm ellipsoidal receive surface RF2
areas) in affected areas of the brain. In this study, we coil, built to conform to the shape of the mouse skull so asconfirmed that we could reliably detect lower T values in to optimize signal-to-noise over the entire mouse brain.2
areas of the brain known to accumulate ferritin iron in After positioning the mouse head in the magnet isocenter,IRP-2 2 /2 mice. In addition, we generated histograms global shimming was performed, and tri-pilot spin-echothat represent the full spectrum of high-resolution T scout images were obtained to aid slice positioning for the2
values from several regions of interest and discovered a multi-slice T maps. Twenty-four, 250-mm thick coronal2
second unexpected abnormality. Several areas of the brain slices were chosen spaced 500mm apart to cover most ofcontained higher intensities (longer T ) that are most the brain, from the cerebellum to the olfactory bulb. T2 2
consistent with increased water content within brain paren- maps were obtained using a Carr, Purcell, Meiboom, Gillchyma, and/or decreases in iron content. Histological (CPMG) multi-echo spin-echo sequence with the following
2examination of the brains showed the presence of previ- parameters: field of view (FOV)52.5632.56 cm ; matrixously unappreciated fluid filled vacuoles, which may help size52563256; slice thickness5250mm; NEX51; repeti-to explain both the MRI data and the neurological disorder tion time (TR)510 s; inter-echo time (TE)510 ms;seen in IRP-22 /2 mice. number of echoes58. The corresponding nominal res-
2olution of each pixel was 10031003250mm . T weight-1
ing of the images was avoided by the long TR, and the1 . Methods range of echo times (10–80 ms) was adequate for sampling
T values shorter and longer than the average T for brain2 2
1 .1. Control versus knockout groups tissue at 11.7 T, which in our study is approximately 35 ms(see Section 2). Total scan acquisition time was on the
Twenty-two mice ranging in age from 6 to 14 months order of 42 min. The typical signal-to-noise ratio (SNR)were used in this study. The animals were divided into a for this sequence was 56:1.control group, consisting of 11 C57/BL6 mice (six males,five females, mean age 9.5 months, mean weight 33.6 g),1 .4. Data and image analysisand the knockout group consisting of 11 IRP-22 /2 mice(six males, five females, mean age 9.5 months, mean T maps were obtained on a pixel-by-pixel basis by2
weight 31.5 g). Genotyping of each animal was done by fitting each pixel to a two-parameter mono-exponentialSouthern Blot analysis [19]. On the days of the MRI curve, using Bruker’s ParaVision Curve Fitting Algorithm.experiments, one or two mice from the knockout group Seven distinct anatomical regions of the brain were chosenwere individually paired for sex, age, and weight with for region-of-interest (ROI) analysis of T values. Cerebel-2
mice from the control group. Although formal motor and lar white matter, superior colliculus, substantia nigra,balance testing was not performed prior to imaging, all of interpeduncular nucleus, fornix, and fimbria of hippocam-the IRP-22 /2 animals in this study had easily visible pus were either previously known to be affected by ironphenotypical changes including ataxia, tremor, hind leg misregulation in IRP-22 /2 mice, or predicted to ac-weakness, and poor grooming habits. cumulate iron based on low T values obtained from2
preliminary pilot studies. The seventh region, the cortex,1 .2. Animal preparation an area of the brain that does not accumulate significant
amounts of iron based on Perls’ DAB staining in our IRP-2Mice were anesthetized by inhalation of 1.5–2% iso- 2 /2 mouse model [19], was used as a control.
C. Grabill et al. / Brain Research 971 (2003) 95–106 97
ROIs were obtained by carefully outlining an entire rabbit IgG conjugated to biotin as the secondary antibodyanatomical region without including any surrounding (Vector Laboratories, Burlingame, CA), followed bystructures. T histograms were obtained from the pixels avidin–biotin complex labeled with horseradish peroxidase2
within each ROI, and statistical analysis was performed on (ABC Elite Kit, Vector Laboratories, Burlingame, CA).the histograms. The mean T value and the standard HRP was visualized using the substrate diaminobenzidine2
deviation of individual T histograms were computed. We (DAB, Vector Laboratories) with incubation at room tem-2
noticed that the standard deviations of histograms in the perature for 1 h and counterstained with methyl green.IRP-2 2 /2 group were consistently larger than in the Three 9-month-old IRP-22 /2 and three age-matchedwild-type group, suggesting that the knockout mice pre- wild-type animals were also perfusion fixed with 2%sented a broader range of T values. To better measure the glutaraldehyde, epoxy embedded, and stained with2
dispersion of the histograms, we computed the ratio toluidine blue and safranin by Dr. Bernard Jortner ofmean T /S.D. and compared the two groups. Student Virginia Polytechnic Institute, Blacksburg, VA, to allow2
t-tests were run for each ROI to determine statistical reliable evaluation of brain morphology (method discusseddifferences. In addition, an average histogram was ob- in Ref. [13]).tained for each ROI by summing the individual histogramsfrom each mouse in each of the two groups. Theseaveraged histograms were fit to a gamma variate function 2 . Resultsof the type:
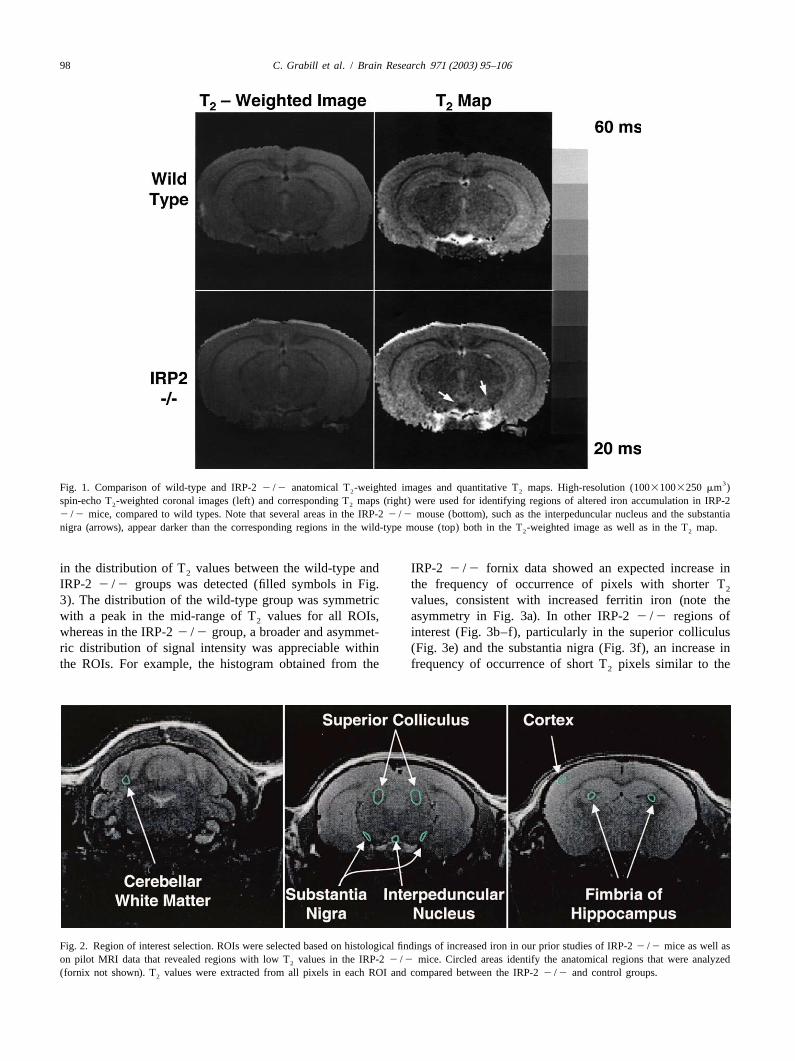
Fig. 1 shows typical MR coronal images of the mouseT 2B2]2s dC DG T 5 A ? T 2B ?e (1) brain obtained at 11.7 T. The left column shows T -s d s d2 2 2
weighted images from a wild-type mouse (top) and fromMean T and standard deviation were computed from the2 an IRP-22 /2 mouse (bottom). The T -weighted images2best fits to the region-specific averaged histograms andshow excellent contrast between gray and white matter. Inreported. Statistical difference between the fits to data from the IRP-2 2 /2 mouse (bottom left), significantthe IRP-2 2 /2 group and the wild-type group was heterogeneities in signal intensities can be noticed in whiteassessed by a pairedt-test on all ROIs except the cortex. matter tracts, such as the cingulum, and in medial regions,
Data are presented as mean6S.D. Unless otherwise such as the superior colliculus and the interpeduncularspecified, differences were considered statistically signifi- nucleus. In order to better identify regions of altered T2cant atP,0.05. contrast between wild-type and IRP-22 /2 mice, quan-
titative T maps were obtained. The right column of Fig. 12
1 .5. Histology shows the corresponding T maps from the same slices2
shown in the left column. The grayscale bar shows theOne to 2 days after imaging, mice from both groups range of T values in the T maps. Regional2 2
were perfusion fixed. They were anesthetized with 0.3 mg heterogeneities in T values can be easily identified both in2
pentobarbital prior to the procedure, and perfused with the wild-type as well as in the IRP-22 /2 mouse brain. Inphosphate-buffered saline wash (pH 7.4), followed by 4% addition, some regions, such as the interpeduncular nu-paraformaldehyde fix. The brains remained within the skull cleus, tended to have lower T values in the knockout mice2
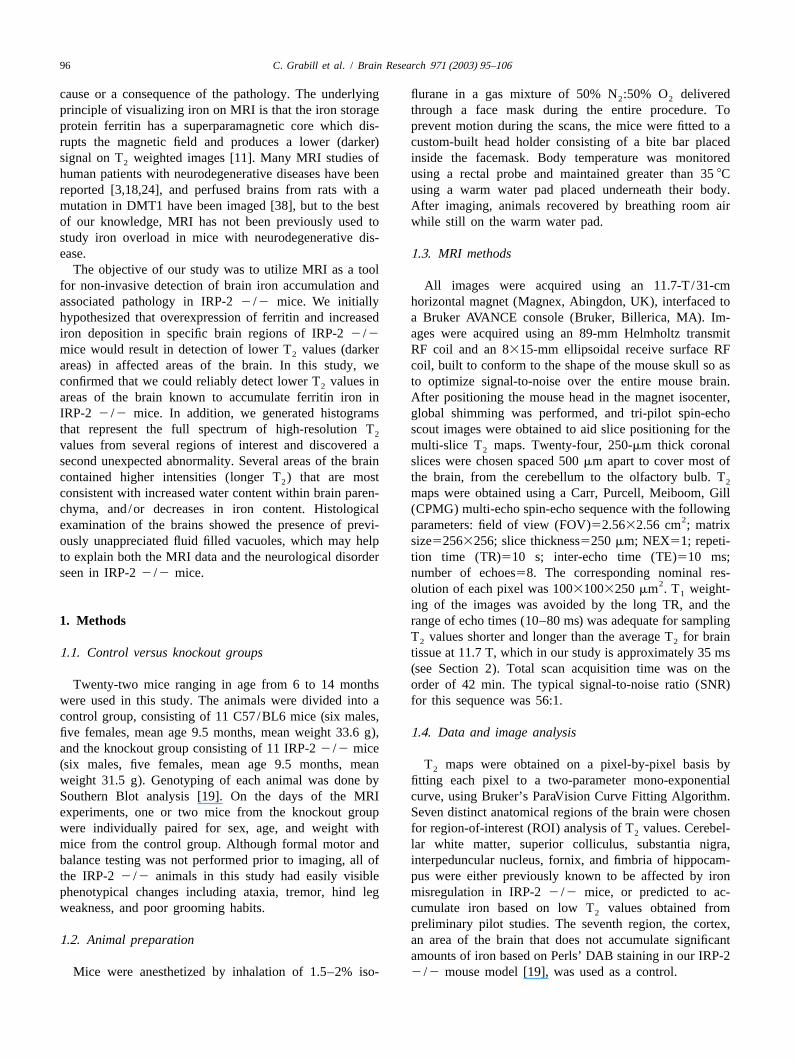
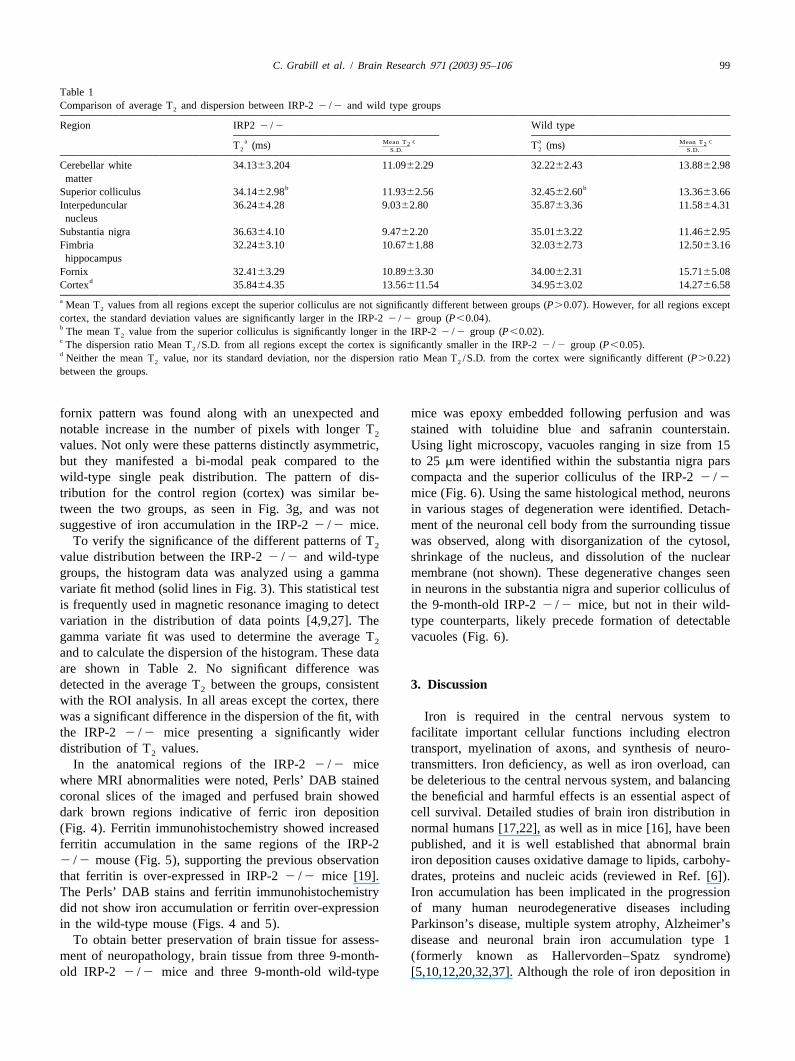
overnight in 4% paraformaldehyde at 48C. The brains compared to the wild-type mice (Fig. 1, right column).were then carefully removed and sent for histological Seven ROIs were chosen for comparison of T values2
sectioning (American Histo Labs, Gaithersburg, MD). The between the control and knockout groups. Fig. 2 shows anbrains were cut in 7-mm thick coronal sections and placed example of designated ROIs. Mean T values were calcu-2
on sialinated slides. Hematoxylin and eosin stain was used lated for each ROI. These T averages were then compared2
to identify anatomy. We stained sequential sections with between groups. We predicted that we would find lower T2
Perls’ DAB for ferric iron and performed ferritin immuno- values from IRP-22 /2 mice compared to wild-typehistochemistry. mice. Surprisingly, the average T values of the specified2
For Perls’ DAB staining, the slides were dewaxed in regions were not significantly different between the IRP-2xylene, rehydrated using sequentially decreasing concen-2 /2 and control groups, as shown in Table 1. Neverthe-trations of ethanol, washed in TBS Buffer, and treated with less, the dispersion of T values within all ROIs except the2
a 1:1 solution of 2% HCl and 2% KFeCN for 40 min. The cortex was significantly broader for the knockout grouptissues were again washed in the same buffer and treated (Table 1). This broader dispersion, measured both from thefor 35 min with DAB–Tris–H O . They were dehydrated standard deviation of the average T values, as well as2 2 2
in increasing concentrations of ethanol, cleared in xylene, from an index expressed by the average T divided by the2
and mounted on slides using permount. standard deviation, may be indicative of altered ironFerritin immunohistochemistry was performed using distribution in the brains of the IRP-22 /2 mice.
prediluted ferritin antibody (Biogenesis, Kingston, NH) per To further study the distribution of T values, histo-2
the manufacturer’s recommendations. We used goat anti- grams were created for each ROI. A consistent difference
98 C. Grabill et al. / Brain Research 971 (2003) 95–106
3Fig. 1. Comparison of wild-type and IRP-22 /2 anatomical T -weighted images and quantitative T maps. High-resolution (10031003250 mm )2 2
spin-echo T -weighted coronal images (left) and corresponding T maps (right) were used for identifying regions of altered iron accumulation in IRP-22 2
2 /2 mice, compared to wild types. Note that several areas in the IRP-22 /2 mouse (bottom), such as the interpeduncular nucleus and the substantianigra (arrows), appear darker than the corresponding regions in the wild-type mouse (top) both in the T -weighted image as well as in the T map.2 2
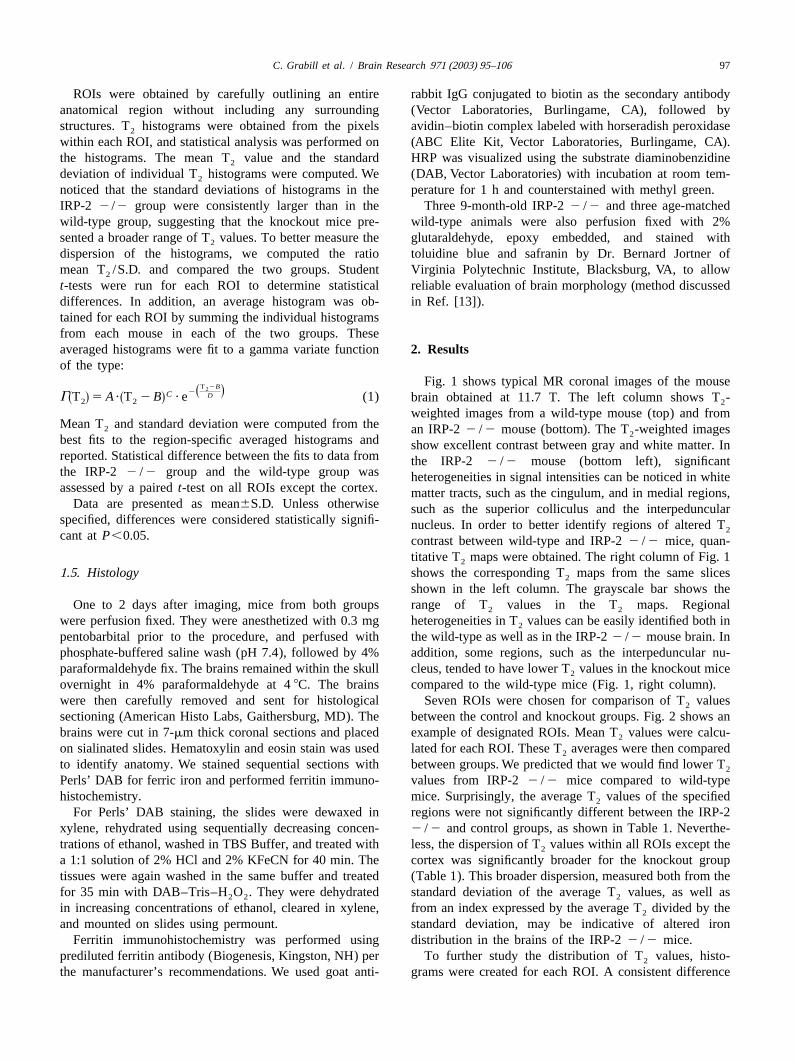
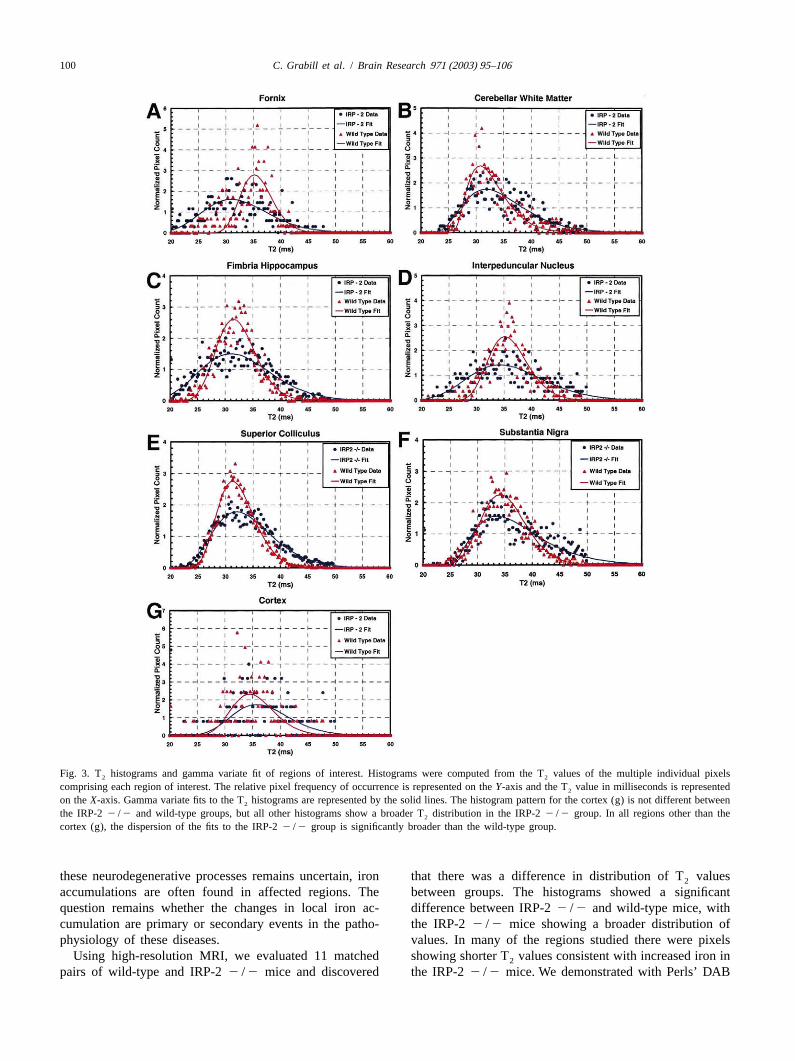
in the distribution of T values between the wild-type and IRP-22 /2 fornix data showed an expected increase in2
IRP-2 2 /2 groups was detected (filled symbols in Fig. the frequency of occurrence of pixels with shorter T2
3). The distribution of the wild-type group was symmetric values, consistent with increased ferritin iron (note thewith a peak in the mid-range of T values for all ROIs, asymmetry in Fig. 3a). In other IRP-22 /2 regions of2
whereas in the IRP-22 /2 group, a broader and asymmet- interest (Fig. 3b–f), particularly in the superior colliculusric distribution of signal intensity was appreciable within (Fig. 3e) and the substantia nigra (Fig. 3f), an increase inthe ROIs. For example, the histogram obtained from the frequency of occurrence of short T pixels similar to the2
Fig. 2. Region of interest selection. ROIs were selected based on histological findings of increased iron in our prior studies of IRP-22 /2 mice as well ason pilot MRI data that revealed regions with low T values in the IRP-22 /2 mice. Circled areas identify the anatomical regions that were analyzed2
(fornix not shown). T values were extracted from all pixels in each ROI and compared between the IRP-22 /2 and control groups.2
C. Grabill et al. / Brain Research 971 (2003) 95–106 99
Table 1Comparison of average T and dispersion between IRP-22 /2 and wild type groups2
Region IRP22 /2 Wild typea c a cMean T Mean T2 2]] ]]T (ms) T (ms)2 2S.D. S.D.
Cerebellar white 34.1363.204 11.0962.29 32.2262.43 13.8862.98matter
b bSuperior colliculus 34.1462.98 11.9362.56 32.4562.60 13.3663.66Interpeduncular 36.2464.28 9.0362.80 35.8763.36 11.5864.31nucleus
Substantia nigra 36.6364.10 9.4762.20 35.0163.22 11.4662.95Fimbria 32.2463.10 10.6761.88 32.0362.73 12.5063.16hippocampus
Fornix 32.4163.29 10.8963.30 34.0062.31 15.7165.08dCortex 35.8464.35 13.56611.54 34.9563.02 14.2766.58
a Mean T values from all regions except the superior colliculus are not significantly different between groups (P.0.07). However, for all regions except2
cortex, the standard deviation values are significantly larger in the IRP-22 /2 group (P,0.04).b The mean T value from the superior colliculus is significantly longer in the IRP-22 /2 group (P,0.02).2c The dispersion ratio Mean T /S.D. from all regions except the cortex is significantly smaller in the IRP-22 /2 group (P,0.05).2d Neither the mean T value, nor its standard deviation, nor the dispersion ratio Mean T /S.D. from the cortex were significantly different (P.0.22)2 2
between the groups.
fornix pattern was found along with an unexpected and mice was epoxy embedded following perfusion and wasnotable increase in the number of pixels with longer T stained with toluidine blue and safranin counterstain.2
values. Not only were these patterns distinctly asymmetric, Using light microscopy, vacuoles ranging in size from 15but they manifested a bi-modal peak compared to the to 25mm were identified within the substantia nigra parswild-type single peak distribution. The pattern of dis- compacta and the superior colliculus of the IRP-22 /2tribution for the control region (cortex) was similar be- mice (Fig. 6). Using the same histological method, neuronstween the two groups, as seen in Fig. 3g, and was not in various stages of degeneration were identified. Detach-suggestive of iron accumulation in the IRP-22 /2 mice. ment of the neuronal cell body from the surrounding tissue
To verify the significance of the different patterns of T was observed, along with disorganization of the cytosol,2
value distribution between the IRP-22 /2 and wild-type shrinkage of the nucleus, and dissolution of the nucleargroups, the histogram data was analyzed using a gamma membrane (not shown). These degenerative changes seenvariate fit method (solid lines in Fig. 3). This statistical test in neurons in the substantia nigra and superior colliculus ofis frequently used in magnetic resonance imaging to detect the 9-month-old IRP-22 /2 mice, but not in their wild-variation in the distribution of data points [4,9,27]. The type counterparts, likely precede formation of detectablegamma variate fit was used to determine the average T vacuoles (Fig. 6).2
and to calculate the dispersion of the histogram. These dataare shown in Table 2. No significant difference wasdetected in the average T between the groups, consistent3 . Discussion2
with the ROI analysis. In all areas except the cortex, therewas a significant difference in the dispersion of the fit, with Iron is required in the central nervous system tothe IRP-2 2 /2 mice presenting a significantly wider facilitate important cellular functions including electrondistribution of T values. transport, myelination of axons, and synthesis of neuro-2
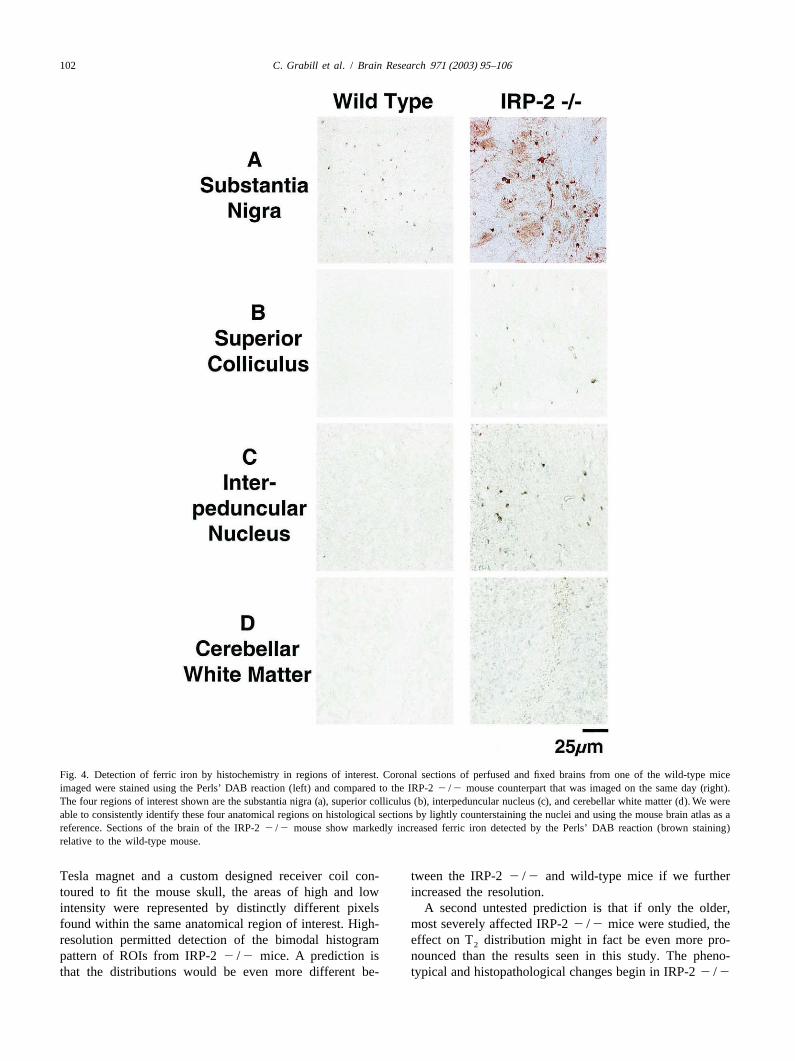
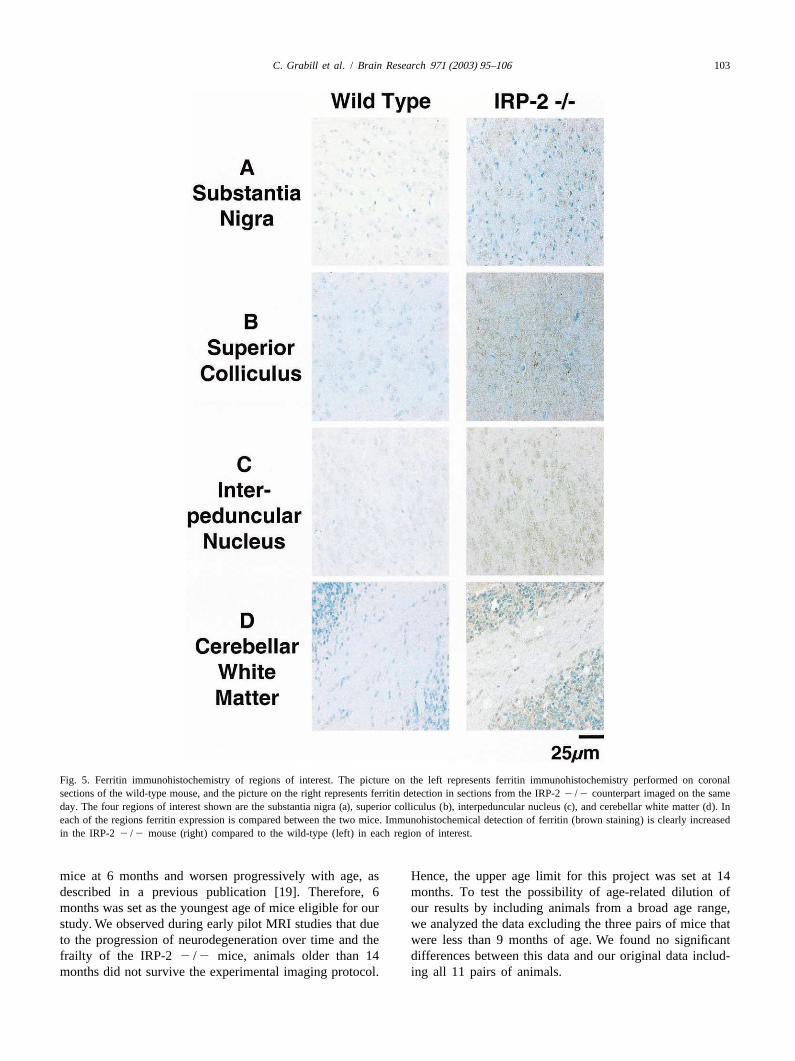
In the anatomical regions of the IRP-22 /2 mice transmitters. Iron deficiency, as well as iron overload, canwhere MRI abnormalities were noted, Perls’ DAB stained be deleterious to the central nervous system, and balancingcoronal slices of the imaged and perfused brain showed the beneficial and harmful effects is an essential aspect ofdark brown regions indicative of ferric iron deposition cell survival. Detailed studies of brain iron distribution in(Fig. 4). Ferritin immunohistochemistry showed increased normal humans [17,22], as well as in mice [16], have beenferritin accumulation in the same regions of the IRP-2 published, and it is well established that abnormal brain2 /2 mouse (Fig. 5), supporting the previous observation iron deposition causes oxidative damage to lipids, carbohy-that ferritin is over-expressed in IRP-22 /2 mice [19]. drates, proteins and nucleic acids (reviewed in Ref. [6]).The Perls’ DAB stains and ferritin immunohistochemistry Iron accumulation has been implicated in the progressiondid not show iron accumulation or ferritin over-expression of many human neurodegenerative diseases includingin the wild-type mouse (Figs. 4 and 5). Parkinson’s disease, multiple system atrophy, Alzheimer’s
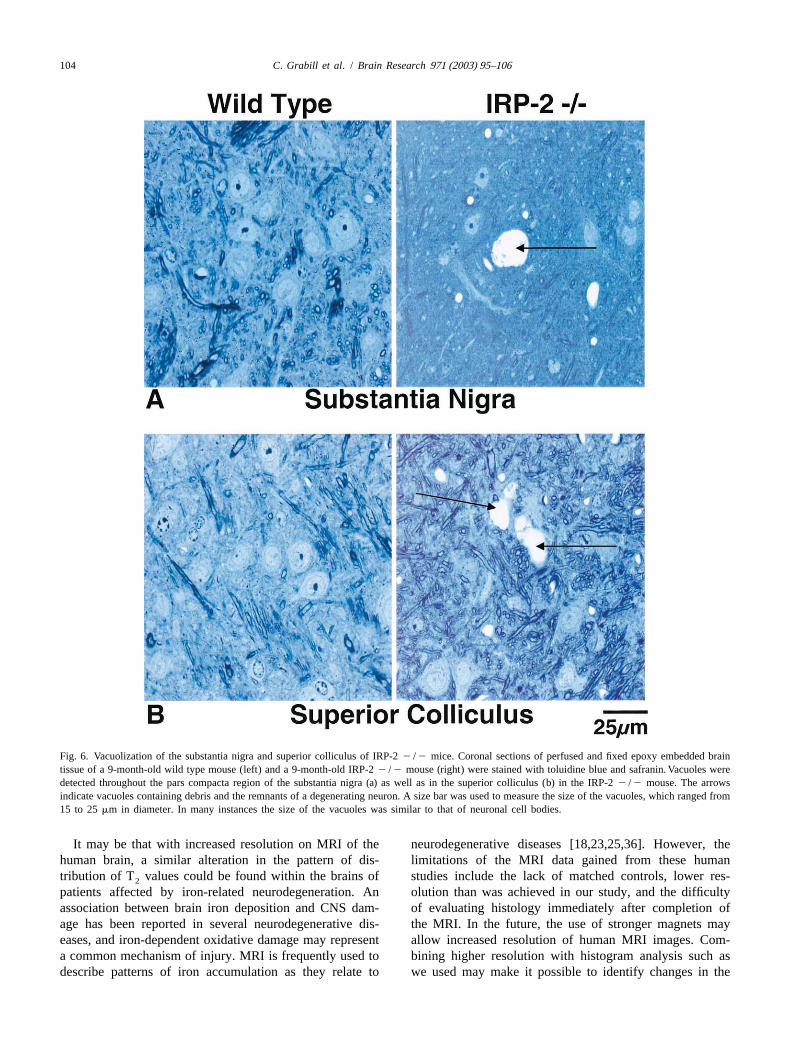
To obtain better preservation of brain tissue for assess- disease and neuronal brain iron accumulation type 1ment of neuropathology, brain tissue from three 9-month- (formerly known as Hallervorden–Spatz syndrome)old IRP-2 2 /2 mice and three 9-month-old wild-type [5,10,12,20,32,37]. Although the role of iron deposition in
100 C. Grabill et al. / Brain Research 971 (2003) 95–106
Fig. 3. T histograms and gamma variate fit of regions of interest. Histograms were computed from the T values of the multiple individual pixels2 2
comprising each region of interest. The relative pixel frequency of occurrence is represented on theY-axis and the T value in milliseconds is represented2
on theX-axis. Gamma variate fits to the T histograms are represented by the solid lines. The histogram pattern for the cortex (g) is not different between2
the IRP-22 /2 and wild-type groups, but all other histograms show a broader T distribution in the IRP-22 /2 group. In all regions other than the2
cortex (g), the dispersion of the fits to the IRP-22 /2 group is significantly broader than the wild-type group.
these neurodegenerative processes remains uncertain, iron that there was a difference in distribution of T values2
accumulations are often found in affected regions. The between groups. The histograms showed a significantquestion remains whether the changes in local iron ac- difference between IRP-22 /2 and wild-type mice, withcumulation are primary or secondary events in the patho- the IRP-22 /2 mice showing a broader distribution ofphysiology of these diseases. values. In many of the regions studied there were pixels
Using high-resolution MRI, we evaluated 11 matched showing shorter T values consistent with increased iron in2
pairs of wild-type and IRP-22 /2 mice and discovered the IRP-22 /2 mice. We demonstrated with Perls’ DAB
C. Grabill et al. / Brain Research 971 (2003) 95–106 101
Table 2 such as Creutzfeldt–Jakob disease, and are generallyAnalysis of gamma variate fit to T histograms2 referred to as ‘spongiform changes’ [31]. SpongiformRegion IRP22 /2 Wild type encephalopathies are usually infectious diseases caused by
a b a bMean T Mean T2 2 prions, and the CNS findings on MRI have been well]] ]]T (ms) T (ms)2 2S.D. S.D.
described in the literature as increased T signal intensity2Cerebellar 31.8365.37 5.93 30.7663.2 9.61in the affected areas [21,33,34]. Neuronal vacuolizationwhite matterhas also recently been described in the pediatric neuro-Superior 32.0365.27 6.08 31.2863.36 9.31
colliculus surgery literature where it was observed histologically inInterpeduncular 34.3366.79 5.06 35.1863.51 10.02 the basal nucleus of Meynert in the brains of five infantsnucleus with hydrocephalus [35]. Another form of human brain
Substantia nigra 33.5665.83 5.76 34.1564.07 8.39vacuolization occurs predominantly in the pyramidal cellsFimbria 31.0466.44 4.82 31.563.53 8.92of the hippocampus in patients with Alzheimer’s diseasehippocampus
Fornix 31.0165.87 5.28 35.1762.88 12.21 [30]. In this ‘granulovacuolar degeneration’, intracytoplas-Cortex 35.7365.14 6.95 34.4763.82 9.02 mic vesicles containing a dark center granule and measur-a Mean T values are not significantly different between groups (P. ing 1–5mm in diameter were observed within neurons, but2
0.19). However, the standard deviation values are significantly larger in the underlying molecular events are poorly understood,the IRP-22 /2 group (P,0.0001). and no correlative findings have been described on MRI.b The dispersion ratio Mean T /S.D. is significantly smaller in the IRP-22 Another explanation offered in the literature for high T22 /2 group (P,0.002).
values is the gliosis that often accompanies neurodegenera-tion. In the classic ‘Tiger’s Eye’ finding in the globus
stains and immunohistochemistry that the regions of pallidus of patients with NBIA Type 1 disease, a hy-interest were rich in ferric iron and ferritin, consistent with perintense medial region consistent with gliosis, demyeli-previous findings from these mice. nation, neuronal loss, and axonal swelling is surrounded by
In addition to the expected increase of pixels with a hypointense lateral region where iron accumulation mayshorter T values, many of the ROIs in the IRP-22 /2 account for the decreased T signal intensity [14]. In2 2
mice also showed an increase in the number of pixels with patients with Huntington’s disease, an increased T signal2
longer T values. Increases in T could be caused by is noted in the putamen, even though this region is known2 2
decreases in ferritin iron within discrete pixels or by to accumulate significant amounts of iron, and a decreaseincreases in fluid accumulation within pixels. Iron stains in signal intensity would therefore be expected. It has beenfrom ROIs did not reveal focal areas of iron depletion proposed that gliosis or another unknown pathologicalwithin intact tissue. However, fluid-filled vacuoles were process is responsible for causing the increased T intensi-2
detected within the parenchyma of epoxy embedded IRP-2 ty in Huntington’s patients [7,29]. Similar phenomena may2 /2 brains using light microscopy. In the toluidine blue occur in the superior colliculus and substantia nigra of ourand safranin stained epoxy embedded sections, we iden- IRP-22 /2 mice. The significant iron and ferritin demon-tified neurons within the substantia nigra and superior strated by our Perls’ DAB and ferritin immunohistochemis-colliculus that appeared to be at various different stages of try correlate well with the statistically significant increasedegeneration. We also discovered many ‘empty holes’ in in low T values, but neuronal degeneration and vacuoliza-2
which remnants of nuclei and traces of debris were found. tion are likely responsible for the notably increased T2
The process appeared to begin with the neuronal cell values.membrane separating from the surrounding tissue, de- A key to recognizing that T values in the ROIs of the2
veloping a ‘necklace-like’ ring of detachment. This un- IRP-22 /2 mice vary across a wider range than in thetethering was followed by loss of nuclear and cell mem- wild types is the relatively high-resolution achieved in thisbrane integrity, and general disorganization of the cell. We study. If the resolution had been lower, it is likely that thepropose that these neurons degenerate, undergo phago- increased T values associated with vacuolization would2
cytosis, and are ultimately replaced by fluid-filled vac- have averaged out the low T values associated with2
uoles. The size of many of the vacuoles is comparable to ferritin iron accumulation. The fact that the average T2
the size of neuronal cell bodies in these regions. These values for the ROIs are not significantly different betweenvacuoles were easily distinguished from blood vessels the IRP-22 /2 and wild-type animals suggests that areassince the vacuoles lack endothelial-lining cells and were of iron overload in the IRP-22 /2 mice, represented bynot found in similarly perfused wild-type mice. Three pixels with low intensity, are intermixed with vacuoles andwild-type animals were compared to three IRP-22 /2 degenerating neurons, represented by pixels with highmice, and a marked statistical increase in vacuolization intensity. These pixels are all contained within the chosenwas noted in the IRP-22 /2 (Smith, S., and Rouault, ROI, making the average T value of the IRP-22 /2 the2
T.A., manuscript in preparation). same as the wild-type ROI, despite the considerableVacuoles found in the central nervous system of humans variation in T value distribution between the two groups.2
are usually associated with spongiform encephalopathies Because of the high-resolution we achieved using an 11.7
102 C. Grabill et al. / Brain Research 971 (2003) 95–106
Fig. 4. Detection of ferric iron by histochemistry in regions of interest. Coronal sections of perfused and fixed brains from one of the wild-type miceimaged were stained using the Perls’ DAB reaction (left) and compared to the IRP-22 /2 mouse counterpart that was imaged on the same day (right).The four regions of interest shown are the substantia nigra (a), superior colliculus (b), interpeduncular nucleus (c), and cerebellar white matter (d). We wereable to consistently identify these four anatomical regions on histological sections by lightly counterstaining the nuclei and using the mouse brain atlas as areference. Sections of the brain of the IRP-22 /2 mouse show markedly increased ferric iron detected by the Perls’ DAB reaction (brown staining)relative to the wild-type mouse.
Tesla magnet and a custom designed receiver coil con- tween the IRP-22 /2 and wild-type mice if we furthertoured to fit the mouse skull, the areas of high and low increased the resolution.intensity were represented by distinctly different pixels A second untested prediction is that if only the older,found within the same anatomical region of interest. High- most severely affected IRP-22 /2 mice were studied, theresolution permitted detection of the bimodal histogram effect on T distribution might in fact be even more pro-2
pattern of ROIs from IRP-22 /2 mice. A prediction is nounced than the results seen in this study. The pheno-that the distributions would be even more different be- typical and histopathological changes begin in IRP-22 /2
C. Grabill et al. / Brain Research 971 (2003) 95–106 103
Fig. 5. Ferritin immunohistochemistry of regions of interest. The picture on the left represents ferritin immunohistochemistry performed on coronalsections of the wild-type mouse, and the picture on the right represents ferritin detection in sections from the IRP-22 /2 counterpart imaged on the sameday. The four regions of interest shown are the substantia nigra (a), superior colliculus (b), interpeduncular nucleus (c), and cerebellar white matter (d). Ineach of the regions ferritin expression is compared between the two mice. Immunohistochemical detection of ferritin (brown staining) is clearly increasedin the IRP-22 /2 mouse (right) compared to the wild-type (left) in each region of interest.
mice at 6 months and worsen progressively with age, as Hence, the upper age limit for this project was set at 14described in a previous publication [19]. Therefore, 6 months. To test the possibility of age-related dilution ofmonths was set as the youngest age of mice eligible for our our results by including animals from a broad age range,study. We observed during early pilot MRI studies that due we analyzed the data excluding the three pairs of mice thatto the progression of neurodegeneration over time and the were less than 9 months of age. We found no significantfrailty of the IRP-2 2 /2 mice, animals older than 14 differences between this data and our original data includ-months did not survive the experimental imaging protocol. ing all 11 pairs of animals.
104 C. Grabill et al. / Brain Research 971 (2003) 95–106
Fig. 6. Vacuolization of the substantia nigra and superior colliculus of IRP-22 /2 mice. Coronal sections of perfused and fixed epoxy embedded braintissue of a 9-month-old wild type mouse (left) and a 9-month-old IRP-22 /2 mouse (right) were stained with toluidine blue and safranin. Vacuoles weredetected throughout the pars compacta region of the substantia nigra (a) as well as in the superior colliculus (b) in the IRP-22 /2 mouse. The arrowsindicate vacuoles containing debris and the remnants of a degenerating neuron. A size bar was used to measure the size of the vacuoles, which ranged from15 to 25mm in diameter. In many instances the size of the vacuoles was similar to that of neuronal cell bodies.
It may be that with increased resolution on MRI of the neurodegenerative diseases [18,23,25,36]. However, thehuman brain, a similar alteration in the pattern of dis- limitations of the MRI data gained from these humantribution of T values could be found within the brains of studies include the lack of matched controls, lower res-2
patients affected by iron-related neurodegeneration. An olution than was achieved in our study, and the difficultyassociation between brain iron deposition and CNS dam- of evaluating histology immediately after completion ofage has been reported in several neurodegenerative dis- the MRI. In the future, the use of stronger magnets mayeases, and iron-dependent oxidative damage may represent allow increased resolution of human MRI images. Com-a common mechanism of injury. MRI is frequently used to bining higher resolution with histogram analysis such asdescribe patterns of iron accumulation as they relate to we used may make it possible to identify changes in the
C. Grabill et al. / Brain Research 971 (2003) 95–106 105
Coulthad, M. Jackson, A. Jackson, D. McHale, D. Hay, W. Barker,distribution of T values in affected ROIs of human brains.2A. Markham, D. Bates, A. Curtis, J. Burn, Mutation in the geneCareful characterization of T value distribution patterns2 encoding ferritin light polypeptide causes dominant adult-onset basal
could aid in the diagnosis of iron-related neurodegenera- ganglia disease, Nat. Genet. 28 (2001) 350–354.tive diseases, as well as in evaluation of progression and [9] J. Dehmeshki, G.J. Barker, P.S. Tofts, Classification of diseaseresponse to treatment. subgroup and correlation with disease severity using magnetic
resonance imaging whole-brain histograms: application to mag-Our study represents a successful application of mag-netization transfer ratios and multiple sclerosis, IEEE Trans. Med.netic resonance imaging in detection of iron overload andImaging 21 (2002) 320–331.
neurodegeneration in a genetically engineered mouse[10] D. Dickson, W. Lin, W. Liu, S. Yen, Multiple system atrophy: amodel. By carefully evaluating the data acquired from sporadic synucleinopathy, Brain Pathol. 9 (1999) 721–732.high-resolution MRI images, we discovered evidence for [11] B. Drayer, P. Burger, R. Darwin, S. Riederer, R. Herfkens, G.A.
Johnson, MRI of brain iron, Am. J. Roentgenol. 147 (1986) 103–unexpected pathology in IRP-22 /2 mice that was110.confirmed histologically. We have described a distinctive
[12] M. Gerlach, D. Ben-Shachar, P. Riederer, M.B. H Youdim, AlteredMRI pattern that may facilitate the diagnosis and moni-brain metabolism of iron as a cause of neurodegenerative diseases?,
toring of human iron-related neurodegenerative diseases. J. Neurochem. 63 (1994) 793–807.Future studies in our lab will include acquisition of three- [13] M.A. Hayat, in: Principles and Techniques of Electron Microscopy,
Van Nostrand Reinhold, New York, 1970.dimensional images at higher resolution to trace affected[14] S. Hayflick, J. Penzien, W. Michl, U. Sharif, N.P. Rosman, P.tracts, as well as serial imaging of animals starting in the
Wheeler, Cranial MRI changes may precede symptoms in Hallervor-neonatal period to follow the developmental progression ofden-Spatz syndrome, Pediatr. Neurol. 25 (2001) 166–169.
the disease. [15] P. Hilditch-Maguire, F. Trettel, L. Passani, A. Auerbach, F. Per-sichetti, M. MacDonald, Huntingtin: an iron-regulated proteinessential for normal nuclear and perinuclear organelles, Hum. Mol.Genet. 9 (2000) 2789–2797.A cknowledgements
[16] J.M. Hill, The distribution of iron in the brain, in: M.B.H. Youdim(Ed.), Brain Iron: Neurochemical and Behavioral Aspects, Taylor
The authors would like to acknowledge the technical and Francis, London, 1988, pp. 1–24.[17] A.H. Koeppen, The history of iron in the brain, J. Neurol. Sci. 134assistance of Torri Wilson and Ashley Lakin. This work
(Suppl.) (1995) 1–9.was supported by the NINDS intramural research program,[18] A. Lang, T. Curran, J. Provias, C. Bergeron, Striatonigral degenera-the intramural program of NICHD, and the Lookout Fund.
tion: iron deposition in putamen correlates with the slit-like voidThe views expressed are those of the authors and do not signal of magnetic resonance imaging, Can. J. Neurol. Sci. 21reflect the official policy or position of the USUHS, the (1994) 311–318.Department of Defense or the United States Government. [19] T. LaVaute, S. Smith, S. Cooperman, K. Iwai, W. Land, E. Meyron-
Holtz, S. Drake, G. Miller, M. Abu-Asab, M. Tsokos, R. Switzer III,A. Grinberg, P. Love, N. Tresser, T. Rouault, Targeted deletion ofthe gene encoding iron regulatory protein-2 causes misregulation of
R eferences iron metabolism and neurodegenerative disease in mice, Nat. Genet.27 (2001) 209–214.
[20] S. Levine, Iron deposits in multiple sclerosis and Alzheimer’s[1] P. Aisen, C. Enns, M. Wessling-Resnick, Chemistry and biology ofdisease brains, Brain Res. 760 (1997) 298–303.eukaryotic iron metabolism, Int. J. Biochem. Cell. Biol. 33 (2002)
[21] Y. Mao-Draayer, S.P. Braff, K.J. Nagle, W. Pendlebury, P.L. Penar,940–959.R.E. Shapiro, Emerging patterns of diffusion-weighted MR imaging[2] G. Anderson, L. Powell, Of metals, mice, and men: what animalin Creutzfeldt-Jakob disease: case report and review of the literature,models can teach us about body iron loading, J. Clin. Invest. 105Am. J. Neuroradiol. 23 (2002) 550–556.(2000) 1185–1186.
[22] C.M. Morris, J.M. Candy, A.E. Oakley, C.A. Bloxham, J.A.[3] G. Bartzokis, T.A. Tishler, MRI evaluation of basal ganglia ferritinEdwardson, Histochemical distribution of non-haem iron in theiron and neurotoxicity in Alzheimer’s and Huntington’s disease,human brain, Acta Anat. 144 (1992) 235–257.Cell. Mol. Biol. 46 (2000) 821–833.
[23] J.E. Nielsen, L.N. Jensen, K. Krabbe, Hereditary haemochromatosis:[4] T. Benner, S. Heiland, G. Erb, M. Forsting, K. Sartor, Accuracy ofa case of iron accumulation in the basal ganglia associated with agamma variate fits to concentration–time curves from dynamicparkinsonian syndrome, J. Neurol. Neurosurg. Psychiatry 59 (1995)susceptibility-contrast enhanced MRI: influence of time resolution,318–321.maximal signal drop and signal-to-noise, Magn. Reson. Imaging 15
[24] R.V. Parsey, K.R. Krishnan, A new MRI ratio method for in vivo(1997) 307–317.estimation of signal hypointensity in aging and Alzheimer’s disease,[5] D. Berg, M. Gerlach, M.B.H. Youdin, K.L. Double, L. Zecca, P.Prog. Neuro-Psycholopharmacol. Biol. Psychiat. 21 (1997) 1257–Riederer, G. Becker, Brain iron pathways and their relevance to1267.Parkinson’s disease, J. Neurochem. 79 (2002) 225–236.
[25] R.V. Parsey, K.R. Krishnan, Quantitative analysis of T2 signal[6] C. Campbell, M. Smith, L. Sayre, S. Bondy, G. Perry, Mechanismsintensities in Alzheimer’s disease, Psychiatry Res. 82 (1998) 181–by which metals promote events connected to neurodegenerative185.diseases, Brain Res. Bull. 55 (2001) 125–132.
[26] H. Puccio, D. Simon, M. Cossee, O. Criqui-Filipe, F. Tiziano, J.[7] J. Chen, P. Hardy, W. Kucharczyk, M. Clauberg, J. Joshi, A.Vourlas,Melki, C. Hindelang, R. Matyas, P. Rustin, M. Koenig, MouseM. Dhar, R.M. Henkelman, MR of human postmortem brain tissue:models for Friedreich ataxia exhibit cardiomyopathy, sensory nervecorrelative study between T2 and assays of iron and ferritin indefect and Fe-S enzyme deficiency followed by intramitochondrialParkinson and Huntington disease, Am. J. Neuroradiol. 14 (1993)iron deposits, Nat. Genet. 27 (2001) 181–186.275–281.
[27] M. Rausch, K. Scheffler, M. Rudin, E.W. Radu, Analysis of input[8] A.R. Curtis, C. Fey, C. Morris, L. Bindoff, P. Ince, P. Chinnery, A.
106 C. Grabill et al. / Brain Research 971 (2003) 95–106
functions from different arterial branches with gamma variate [34] A. Uemura, T. O’uchi, T. Sakamoto, N. Yashiro, High signal of thefunctions and cluster analysis for quantitative blood volume mea- striatum in sporadic Creutzfeldt-Jakob disease: sequential change onsurements, Magn. Reson. Imaging 18 (2000) 1235–1243. T2-weighted MRI, Neuroradiology 44 (2002) 314–318.
[28] T. Rouault, R.D. Klausner, Regulation of iron metabolism in [35] N. Ulfig, Neuronal vacuolation in the basal nucleus of meynerteukaryotes, Curr. Top. Cell. Regul. 35 (1997) 1–19. caused by fetal hydrocephalus, Pediatr. Neurosurg. 36 (2002) 320–
[29] D.S. Sax, F.S. Buonanno, Putaminal changes in spin-echo magnetic 323.resonance imaging signal in bradykinetic / rigid forms of Huntin- [36] J. Vymazal, A. Righini, R. Brooks, M. Canesi, C. Mariani, M.gton’s disease, Neurology 36 (1986) 311. Leonardi, G. Pezzoli, T1 and T2 in the brain of healthy subjects,
[30] J. Su, J.P. Kesslak, E. Head, C. Cotman, Caspase-cleaved amyloid Patients with Parkinson disease, and patients with Multiple Systemprecursor protein and activated caspase-3 are co-localized in the atrophy: relation to iron content, Radiology 211 (1999) 489–495.granules of granulovacuolar degeneration in Alzheimer’s disease [37] B. Zhou, S. Westaway, B. Levinson, M. Johnson, J. Gitschier, S.and Down’s syndrome brain, Acta Neuropathol. 104 (2002) 1–6. Hayflick, A novel pantothenate kinase (PANK2) gene is defective in
[31] M.S. Sy, P. Gambetti, B.S. Wong, Human prion diseases, Med. Clin. Hallervorden-Spatz syndrome, Nat. Genet. 28 (2001) 345–349.North Am. 86 (2002) 551–571. [38] H. Zywicke, P. van Gelderen, J. Connor, J. Burdo, M. Garrick, K.
[32] K. Thompson, S. Shoham, J.R. Connor, Iron and neurodegenerative Dolan, J. Frank, J. Bulte, Microscopic R2* mapping of reduceddisorders, Brain Res. Bull. 55 (2002) 155–164. brain iron in the Belgrade rat, Ann. Neurol. 52 (2002) 102–105.
[33] G.G. Tribl, G. Strasser, J. Zeitlhofer, S. Asenbaum, C. Jarius, P.Wessely, D. Prayer, Sequential MRI in a case of Creutzfeldt-Jakobdisease, Neuroradiology 44 (2002) 223–226.
Copyright © 2022 FDOKUMEN