mrg43.pdf - eCommons@Cornell
139
COMPARISONS OF BACTERIA FROM THE GENUS PROVIDENCIA ISOLATED FROM WILD DROSOPHILA MELANOGASTER A Dissertation Presented to the Faculty of the Graduate School of Cornell University In Partial Fulfillment of the Requirements for the Degree of Doctor of Philosophy by Madeline Rose Galac August, 2012
-
Upload
khangminh22 -
Category
Documents
-
view
1 -
download
0
Transcript of mrg43.pdf - eCommons@Cornell

COMPARISONS OF BACTERIA FROM THE GENUS PROVIDENCIA
ISOLATED FROM WILD DROSOPHILA MELANOGASTER
A Dissertation
Presented to the Faculty of the Graduate School
of Cornell University
In Partial Fulfillment of the Requirements for the Degree of
Doctor of Philosophy
by
Madeline Rose Galac
August, 2012

© 2012 Madeline Rose Galac

COMPARISONS OF BACTERIA FROM THE GENUS PROVIDENCIA
ISOLATED FROM DROSOPHILA MELANOGASTER
Madeline Rose Galac, Ph. D.
Cornell University 2012
Multiple strains representing four species of bacteria belonging to the genus
Providencia have been isolated from wild caught Drosophila melanogaster: Providencia
sneebia, Providencia burhodogranariea strain B, Providencia burhodogranariea strain D,
Providencia rettgeri, and Providencia alcalifaciens. Using this laboratory-friendly and natural
host, D. melanogaster, I determined how these bacteria differ in their ability to cause host
mortality, replicate within the fly and trigger the fly’s immune response as measured by
transcription of antimicrobial peptides. Although each bacterium has a unique profile of these
phenotypes, in general the greater amount of mortality a given bacterium causes, the more
proliferative it is and the greater antimicrobial peptide transcription they evoke in the host. An
exception to this was P. sneebia which killed about 90% of infected flies and reached greater
numbers within the fly than any of the other bacteria, but induced less antimicrobial peptide
transcription than the less virulent Providencia. Coinfections in D. melanogaster with P.
sneebia and P. rettgeri, which induces greater antimicrobial peptide expression and is less
virulent than P. sneebia, allowed me to conclude that P. sneebia is actively avoiding
recognition by the immune response. I sequenced and annotated draft genomes of these four
species then compared them to each other. I found that about 50% of each genome belongs to

the Providencia core genome and about 15% of each genome consists of genes unique to that
species. Four Providencia genomes of isolates originating from the human gut have also been
sequenced, which include additional isolates of P. rettgeri and P. alcalifaciens as well as
isolates of the species Providencia stuartii and Providencia rustigianii. When I compared
orthologs of all eight sequenced Providencia genomes, I found that the percent of each
genome that consists of the core genome and the unique genes stays largely the same. I found
that each bacterium has type 3 secretion system, a known virulence factor. This means that
presence of a type 3 secretion system does not correlate to those found to be virulent toward
D. melanogaster. This work establishes D. melanogaster-Providencia as a model system for
the study of host-pathogen interactions.
iii
BIOGRAPHICAL SKETCH
Madeline R. Galac was born to Alan and Mary Galac in 1983 in Buffalo, NY. Her love
of science was fostered early as a result of her mother’s interest in science. She remembers
very fondly the large tank of Xenopus in the house for most of her young life. In junior high
and high school, biology classes taught by Mr. Heinomen and Mr. Leavell helped Madeline to
specify her scientific interest in biology. Madeline tried out different biological jobs by
interning at both the Buffalo Zoological Society in Buffalo, NY and the Niagara Falls
Aquarium in Niagara Falls, NY. She found that she loved the hands on interactions with the
animals and was saddened by the difficulty of getting and then maintaining such a job.
Madeline continued her scientific education by pursuing a bachelor’s degree in biology
at the State University of New York at Stony Brook in Stony Brook, NY. In 2002, the
summer of after her freshmen year, she decided to do another internship to see if she liked
primary scientific research. Dr. Joel Huberman at the Roswell Park Cancer Institute in
Buffalo, NY agreed to let her help his grad student Sanjay Kumar for the summer. It was this
summer that she not only determined that she enjoyed research but also learned about some of
the quirks that go along with it, such as trying to explain to others why the very specific thing
you are studying is important and the awkwardness of graduate students. Once back in Stony
Brook, Madeline sought out a lab to do research in while completing her degree. She joined
Dr. Jen-Chih Hsiesh’s lab studying the interactions of proteins involved in Wnt signaling. In
the summer of 2003, Madeline went to Woods Hole, MA to do research at The Woods Hole
Oceanographic Institute with Dr. Sonya Dyhrman which included her only field work to date,
an 11 day research cruise collecting toxic dinoflagellates in the Gulf of Maine. In her final

iv
semester at SUNY Stony Brook, Madeline took a class entitled “Darwinian Medicine” which
had a strong influence on her research interests as a graduate student. This class focused on
host-pathogen interactions and gave the most in depth explanation of evolution that she had
been exposed to during her education. The paper she wrote for that class about the Bubonic
Plague pathogen, Yersinia pestis, cultivated her interest in the evolution of pathogenic
bacteria.
In 2005 Madeline came to Cornell University in Ithaca, NY to pursue a Ph.D. in the
field of Genetics and Development. She joined Dr. Brian Lazzaro’s lab to look at host-
pathogen interactions using the well-studied model host Drosophila melanogaster infected
with different strains of natural pathogens of the genus Providencia. During her research, she
was tricked into doing whole genome sequencing of these Providencia, which lead to
Madeline becoming a bioinformatician.
Madeline hopes to continue researching the way that bacteria interact with other
organisms in their environment using both bioinformatics and wet lab approaches.

v
ACKNOWLEDGMENTS
Firstly, I would like to thank my advisor, Dr. Brian Lazzaro. I really appreciated his
ability to balance guidance with letting me do things on my own. Brian taught me how to do
good science and pushed me to work really hard but also knew that sometimes I needed a
break. I am so grateful for that equilibrium.
I am extremely sad to leave my lab behind, as I fear I will never find a group of people
that are as much fun to work with as they were. I think we always did a good job of balancing
science with fun, whether it was science related fun or not. They were all a great group of
people that helped and supported me in my work when I needed it. It is amazing to have a
group of people that you know will always lend an extra hand when you need it for an
experiment. I will always think fondly on these days every Halloween. I hope that the
tradition of dressing up that started while I was in the lab continues for many years to come.
I had so much support from those that were not here in Ithaca, though they did all visit
at some point. Thank you to my parents for being supportive, loving, and for all the effort you
have put into understanding this process and what it is I am actually studying. Thanks also to
my little brothers for all of your love. Thank you to all of my friends from high school,
especially Kelly Stornelli. Even though they have picked on me a lot about being a science
nerd, I know I had their love and support. I would also like to thank Jessie Dern. She is
amazing and I do not know what I would do without her in my life.
I have had the privilege to become friends with some amazing and smart people
during my time here. I really don’t know how I was so lucky to have found them. Fortunately,
to save me the time of listing them individually, I feel there are distinct, though overlapping,

vi
groups which include all of them: the G&D and BMCB classes that started with me, the
entomology grad students who befriended me when I joined the Lazzaro lab, Girls Night
ladies, all the various forms of my trivia team, and The Brewing Conspiracy. It was because
of your fun, support, and love that I that will warmly look back on my time in Ithaca.
I would like to thank Cresten Mansfeldt and Punita Juneja for helping me organize and
pull off multiple dance parties. Thanks also to all of those that attended and danced into the
night with us. They certainly would not have been as much fun without you. I really
appreciated those parties not only for the dancing but for also reminding me that there are
things beyond this degree.
There are few people I need to thank individually as I don’t know that I would have
finished this dissertation without them. I cannot even count the numbers of times they have
lent me support both personally and scientifically with incredible patience. They were my
rocks: Punita Juneja, Lauren Cator, Sarah Short, Fred Heberle, and Cresten Mansfeldt. They
have been there for the good and the bad, in other words, all the reasons for which one “needs
a beer” while in grad school.
vii
TABLE OF CONTENTS
CHAPTER 1: INTRODUCTION 1
1. Introduction 2
2. Drosophila melanogaster as a model host 3
3. Natural D. melanogaster Pathogens 5
4. Bacteria of the genus Providencia 6
5. Chapter 2: Compartive Pathology of Providencia in D. melanogaster 7
6. Chapter 3: Genomic Comparisons of Providencia 8
7. Appendix: Attempted Verification of Putative Virulence Factors 10
8. Summary 10
CHAPTER 2: COMPARTIVE PATHOLOGY OF BACTERIA IN THE GENUS
PROVIDENCIA TO A NATURAL HOST, DROSOPHILA MELANOGASTER 15
Abstract 16
1. Introduction 17
2. Methods and Materials 20
2.1 Fly stocks and bacteria strains 20
2.2 Mortality 20
2.3 Bacterial load 21
2.4 Antimicrobial peptide expression 22
2.5 Coinfection 23
2.6 Biofilm formation 24
2.7 Antibiotic protection assay 25

viii
3. Results 26
3.1 Mortality 26
3.2 Bacterial load 35
3.3 D. melanogaster immune response to infection 37
3.4 Coinfections with P. rettgeri and P. sneebia 41
3.5 Biofilm formation 47
3.6 Antibiotic protection assay 47
4. Discussion 49
CHAPTER 3: COMPARATIVE GENOMICS OF BACTERIA IN THE GENUS
PROVIDENCIA ISOLATED FROM WILD DROSOPHILA MELANOGASTER 57
Abstract 58
1. Background 59
2. Methods 60
2.1 Bacteria Strains Sequenced 60
2.2 Genome Sequencing and Assembly of P. rettgeri and P. sneebia 60
2.3 Genome Sequencing and Assembly of P. alcalifaciens and P. burhodogranaiea 64
2.4 PCR and Sanger Sequencing Methods 65
2.5 Annotation Methods 66
2.6 Plasmid Identifications and Analysis 66
2.7 Identification of Orthologs 68
2.8 Alignments of Orthologs 68
2.9 Phylogenetic Analysis 69
2.10 Synteny and Regional Comparisons 69

ix
2.11 Recombination Analysis 70
2.12 Positive Selection Analysis 70
2.13 Phage Identification 70
3. Results and Discussion 71
3.1 Basic Genome Information 71
3.2 Plasmids 77
3.3 Genomic Synteny 77
3.4 Phylogeny 79
3.5 Orthologs and Unique Genes 79
3.6 Recombination and Positive Selection 85
3.7 Similarity of Dmel Isolates to Providencia Isolates from the Human Gut 88
3.8 Species Specific Genes 92
3.9 Type 3 Secretion Systems 93
4. Conclusions 96
CHAPTER 4: CONCLUSION 102
APPENDIX: ATTEMPTED VERIFICATION OF PUTATIVE VIRULENCE
FACTORS 106
Abstract 107
1. Introduction 108
2. Methods and Materials 110
2.1 Bacteria Strains 110
2.2 Suicide plasmid 111

x
2.3 Creating the deletion 111
2.4 Restriction digestions of pLD55 and inserts 117
2.5 Ligations of inserts into pLD55 117
2.6 Transformation of constructs into E. coli 117
2.7 Conjugation with P. rettgeri 118
2.8 Electroporation with P. sneebia 118
2.9 Selecting and screening for the ATPase deletion 119
2.10 Infections with mutants in D. melanogaster 120
3. Results 120
4. Discussion 121

xi
LIST OF FIGURES
CHAPTER 2: COMPARTIVE PATHOLOGY OF BACTERIA IN THE GENUS
PROVIDENCIA TO A NATURAL HOST, DROSOPHILA MELANOGASTER 15
Figure 2.1 Mortality of D. melanogaster from Providencia Infection 27
Figure 2.2 Mortality of D. melanogaster from Infection with Other Isolates
of P. sneebia and P. burhodogranariea strain B 30
Figure 2.3 Mortality of Immune Mutant D. melanogaster 33
Figure 2.4 Mortality of D. melanogaster After Infection with Type strains of other
Providencia species 34
Figure 2.5 Providencia Bacterial Load in D. melanogaster 36
Figure 2.6 DptA Expression in Flies Infected with Providencia 39
Figure 2.7 AMP Expression in Flies Infected with Providencia as measured by QPCR 40
Figure 2.8 DptA Expression in Flies Infected with P. sneebia, P. rettgeri or Both
Measured by QPCR 42
Figure 2.9 AMP Expression in Flies Infected with P. sneebia and P. rettgeri
as measured by QPCR 43
Figure 2.10 Survival of D. melanogaster from infections with P. sneebia and
P. rettgeri or both 45
Figure 2.11 Bacterial load of D. melanogaster from infections with P. sneebia and
P. rettgeri or both 46

xii
CHAPTER 3: COMPARATIVE GENOMICS OF BACTERIA IN THE GENUS
PROVIDENCIA ISOLATED FROM WILD DROSOPHILA MELANOGASTER 57
Figure 3.1 Flow chart illustrating steps taken in the assembly of the P. sneebia
and P. rettgeri genomes 62
Figure 3.2 Circular maps of Providencia sneebia genome and plasmids 73
Figure 3.3 Circular maps of Providencia rettgeri genome and plasmid 74
Figure 3.4 Maps of Providencia alcalifaciens genome and plasmid 75
Figure 3.5 Map of Providencia burhodogranariea genome 76
Figure 3.6 Alignments of the protein translations of the whole genomes of all four
Providencia species isolated from D. melanogaster 78
Figure 3.7 Phylogenetic relationships of all four Providencia species isolated
from D. melanogaster and Proteus mirabilis 80
Figure 3.8 Shared and unique gene totals among all four Providencia species
isolated from D. melanogaster 81
Figure 3.9 GO terms enriched in the unique genes of each species compared to
the full set of Providencia isolated from D. melanogaster 84
Figure 3.10 GO terms enriched in the unique genes of each species when
comparing the isolates collected from D. melanogaster (Dmel) to the
isolates from the Human Microbiome Project (HMP) 91
Figure 3.11 Similarity of Type 3 Secretion Systems (T3SS) 95

xiii
APPENDIX: ATTEMPTED VERIFICATION OF PUTATIVE VIRULENCE
FACTORS 106
Figure A.1 Diagram of primer locations and steps in crossover PCR protocol 112
Figure A.2 Flowchart of steps taken and planned for deletion of ATPases in
P. sneebia and P. rettgeri 113

xiv
LIST OF TABLES
CHAPTER 2: COMPARTIVE PATHOLOGY OF BACTERIA IN THE GENUS
PROVIDENCIA TO A NATURAL HOST, DROSOPHILA MELANOGASTER 15
Table 2.1 Bacterial Strains Used 29
Table 2.2 Statistics of Mortality of other isolates of P. sneebia and P.
burhodogranariea strain B 31
Table 2.3 Providencia isolated from D. melanogaster are not able to form biofilms 48
Table 2.4 Providencia isolated from D. melanogaster are not intracellular pathogens 50
CHAPTER 3: COMPARATIVE GENOMICS OF BACTERIA IN THE GENUS
PROVIDENCIA ISOLATED FROM WILD DROSOPHILA MELANOGASTER 57
Table 3.1 Basic genomic information of all four D. melanogaster isolated
Providencia 72
Table 3.2 Orthologous gene clusters with evidence for positive selection 87
APPENDIX: ATTEMPTED VERIFICATION OF PUTATIVE VIRULENCE
FACTORS 106
Table A.1 Primer sequences used for crossover PCR 115
Table A.1 Primer annealing temperatures used for crossover PCR 116

CHAPTER 1
INTRODUCTION
1
1. Introduction
When closely related bacteria vary in a complicated phenotype, comparing them
across a detailed dissection of the phenotype can give insight into how that phenotype is
accomplished. For example, virulence is a complex and broad phenotype which can often
be broken down into a more detailed aspects such as bacterial load during infection,
bacterial location within the host, or host cell shape upon bacterial contact. By comparing
the way closely related bacteria differ in the details of virulence, one can reveal how the
more lethal ones are acting on the host. Differences in complex phenotypes among
closely related bacteria are often the result of horizontal gene transfer as it can provide
the bacteria with the multiple genes it may need for a complicated phenotype all at once
[1]. Horizontal gene transfer notwithstanding, closely related bacteria have more similar
gene content aiding the identification of those genes which do differ. Hence, when
genomic information is available for such bacteria, this phenotypic information can lead
to hypotheses for the genomic differences that are the cause.
In this thesis, both pathological and genomic comparisons are presented for five
distinct strains of bacteria in the genus Providencia: Providencia sneebia, Providencia
rettgeri, Providencia alcalifaciens, Providencia burhodogranariea strain B, and
Providencia burhodogranariea strain D. These strains were all isolated from infected
wild caught Drosophila melanogaster. The second chapter examines the infection
biology of these bacteria in their laboratory-friendly natural host. In the third chapter,
draft genomes of the four different species were sequenced and compared to examine
both their general genomic differences and identify putative virulence factors.
2

2. Drosophila melanogaster as a model host
D. melanogaster has been used as a model host to study varied aspects of
infection of many different bacteria. The innate immune response of D. melanogaster,
particularly the humoral response and the protein pathways involved, have been well
characterized, mostly using generic immune elicitors such as non-pathogenic bacteria or
bacterially derived molecules that stimulate the innate immune response [2]. Recognition
of these immune elicitors in the fly causes a signaling cascade that results in the
transcription of numerous genes [2]. Among the genes that are transcribed as part of the
humoral immune response are antimicrobial peptides, which directly kill the bacteria [2].
The triggering of the humoral immune response signaling pathways and the resulting
response is the idealized fly immune response to the presence of bacteria as it should
allow the fly to kill or remove the infecting bacteria and survive the infection. There are
many different ways by which a bacteria can thwart this idealized fly response, such as
suppression of the immune signaling, avoidance of recognition by the immune response,
or being located somewhere in the host where the molecules like antimicrobial peptides
cannot reach. Such tactics by the bacteria can allow it to replicate during infection and
possibly kill the insect host.
The D. melanogaster signaling cascades of the humoral innate immune response
have been found to be conserved in many other organisms, including humans [2]. This
conservation of proteins and the laboratory tools available for D. melanogaster often
leads to the fly being chosen as a model host to study the interactions of the innate
immune response and human bacterial pathogens (i.e. [3–5]). While there are many
things to be learned from the fly-bacteria interaction for human pathogens, the infections
3

may not accurately reflect the biology that occurs when the pathogen is in its natural host.
Despite the similarity in innate immunity protein pathways, there are a lot of differences
between flies and humans, such as vastly different body temperatures, circulatory
systems, and internal organs, which may lead to different infection dynamics and,
therefore, not accurately reflect the natural host-pathogen interaction. These types of
problems with model host-pathogen pairs have been identified in other systems. The
human bacterial pathogen Burkholderia has been studied in many model hosts including
nematodes, wax moths, and mice [6]. It has been found that Burkholderia does not
require the same virulence factors during infection across these different model hosts [6].
Similar levels of specificity in the genes involved in a host-pathogen interaction have
been seen with mosquitoes and Plasmodium. Due to the specificity of which animals
mosquitoes take their blood meal from, a particular mosquito species will only encounter
a subset of Plasmodium species in nature. When mosquitoes are infected in the lab with
either a Plasmodium species they encounter in nature or one which they do not, it has
been found that different host factors are required for the establishment of infection by
each Plasmodium species [7]. This has implications for studies that use a non-naturally
occurring mosquito-Plasmodium pair as a model for what happens in nature. For these
reasons, one should be cautious when using unnatural or model host-pathogen pairs as the
information may not accurately reflect what the pathogen does during infection with its
natural host or how the natural host responds to infection.
4

3. Natural D. melanogaster Pathogens
While the focus has mostly been on D. melanogaster as a model host, there has
been some work on those bacteria that naturally infect them. These bacteria hold the
potential to have co-evolved with D. melanogaster or to be generalist which infect other
hosts as well. The bacteria Wolbachia spp. and Spiroplasma spp. have evolved to be
heritable endosymbiont pathogens in D. melanogaster [8,9]. These bacteria live within
the fly and are vertically transmitted. Therefore Wolbachia spp. and Spiroplasma spp.
will not have the same infection dynamics as pathogenic infections a fly can have during
its lifetime, which it either survives or succumbs to. Some such infectious bacterial
pathogens of D. melanogaster have been identified and studied [10–14].
The isolates of Providencia studied here were isolated from the hemolymph of
wild caught D. melanogaster [15,16]. The hemolymph of a healthy fly should be sterile
so the presence of bacteria indicates that the bacteria are causing an infection in the fly.
These bacteria were grouped into 5 distinct strains which represented four species, based
on their 16S and housekeeping gene sequences and other identifiers [16]. Since these
bacteria are closely related, their differences in virulence towards D. melanogaster
provides a good system for comparisons to identify virulence mechanisms. Additionally,
because these bacteria are natural pathogens of D. melanogaster, there is no concern over
artifactual phenotypes during infection from unnatural host-pathogen pairs.
The infections in this study are established through pin-prick infections with a
small needle coated in bacteria. This allows us to circumvent how the flies get infected to
then focus on what happens once the bacteria are within the fly. Nevertheless, I think this
method may actually mimic one way flies can get infections in nature. I hypothesize that
5

these bacteria may be making the transition from present in the environment to infectious
agent through cuticle breaches caused by ectoparasitic mites [17]. Wild caught flies often
have healed wounds as indicated by melanization independent of natural pigmentation
patterns and frequently carry ectoparasitic mites that could be the cause of some of these
wounds (P. Juneja, personal communication). Mite wounds in honey bees have been
shown to be secondarily colonized by environmental bacteria [18]. Mites might not just
be the source of cuticle breaches exposing the fly to infections, but could also be carrying
bacteria that could lead to infection. One of the bacteria studied here, P.
burhodogranariea, has additionally been isolated from a mite removed from a wild
caught D. melanogaster (P. Juneja, personal communication).
4. Bacteria of the genus Providencia
Bacteria of the genus Providencia are a ubiquitous Gram-negative bacteria
isolated from numerous locations and environments around the world. They belong to the
tribe Proteeae with the closely related genera Proteus and Morganella [19]. Providencia
isolated from soil samples from India and Los Alamos National Laboratory have been
shown to breakdown toxic soil contamination [20,21]. Providencia have been found to
cause urinary tract infections and traveler’s diarrhea but are also known to be part of the
normal human gut flora [22–24]. The ability of Providencia isolated from such infections
to invade human cells has been found to vary across strains and species [22,23,25,26].
They have also caused more serious bacterial infections in humans such as meningitis
[27]. Providencia’s role in human infections has led to many studies on the variation in
the structure of their cell surface proteins and the genes which encode for them [28].
6

In addition to their associations with human infections, Providencia have been
isolated from varied animal related locations such as penguin feces in German zoos, sea
turtles in the Mediterranean, shark mouths in Brazil, entomopathogenic nematodes all
over the world, and snakes from Vietnam [29–33]. This extends to also being found in
association with different insects such as blowflies, stable flies, Mexican fruit flies, and
house flies [34–37]. Providencia have been isolated on external surfaces or in the gut of
Drosophila melanogaster both in the wild and in the laboratory [38,39]. Providencia
have been found to be part of the normal gut flora of numerous species of Drosophila
both from the lab and from the wild, though they make up a larger part of the gut
microbiome in wild flies [39]. Although these associations say that these bacteria are
present in and around these insects, it is unclear if they are capable of causing diseases.
Two exceptions to this are an isolate of Providencia rettgeri isolated from
entomopathogenic nematodes was found to be pathogenic to waxmoth larvae [32] and an
unidentified species of Providencia which was found to be pathogenic to Drosophila
paulistorum [40]. All this points to Providencia generally being around in the
environment, which suggests that they were isolated as generalists and opportunistic
pathogens.
5. Chapter 2: Comparative Pathology of Providencia in D. melanogaster
The second chapter of this thesis is about D. melanogaster infections with these
five different strains of Providencia. I measured how much fly mortality results from
bacterial infection, how much the bacteria replicate within the fly during infection, and
how strong of an immune response the flies mount to the infection as determined by
7

antimicrobial peptide gene expression. Each strain has a unique profile of these
phenotypes indicating that there are differences in virulence mechanisms ranging from
being passively cleared to rapidly replicating and killing the fly. I identified a general
trend that those bacteria that caused the most mortality were also able to replicate the
most and lead to more antimicrobial peptide transcription. Identifying this trend allowed
us to see that P. sneebia was an outlier as it causes about 90% fly mortality and replicates
to significantly higher numbers during infection but induces a lower amount of
antimicrobial peptide mRNA compared to the others examined. Through co-infections of
P. sneebia and P. rettgeri, which induces greater antimicrobial peptide expression and is
less virulent than P. sneebia, I concluded that P. sneebia is not causing a strong fly
immune response because it is actively avoiding recognition by the immune response and
is protected from antimicrobial peptides expressed due to the presence of P. rettgeri. I
tested two possible mechanisms P. sneebia could be using to avoid recognition, biofilm
formation and intracellular replication, but did not find evidence for either. This work
establishes these Providencia strains as highly varied in their pathology to D.
melanogaster.
6. Chapter 3: Genomic Comparisons of Providencia
To find genes that could potentially lead to the phenotypic differences seen in
these strains as well as look at other information in the genomes, I sequenced the
genomes of P. sneebia, P. rettgeri, P. alcalifaciens, and P. burhodogranariea strain B.
While a single bacterial genome provides information about what genes are present in
that bacterium, comparisons to other genomes can add more detail such as uniqueness or
8

conservation of a gene [41,42]. Comparing bacteria that are closely related but vary in
specific phenotypes, such as virulence, can help narrow down what genetic differences
are the cause of the phenotypic differences [41,42]. Next generation sequencing has aided
whole genome sequencing and subsequent genomic comparisons of many organisms,
particularly bacteria, by lowering the cost and increasing the ease of obtaining genomes.
This increase in genomes and comparative studies allows for organisms at different
phylogenic distances to be compared which has broadened the types of questions that can
be addressed [41].
I sequenced, assembled and annotated draft genomes of P. sneebia, P. rettgeri, P.
alcalifaciens, and P. burhodogranariea strain B then compared their genomic content. I
found these bacteria to have a large core genome and about 15% of the total genes of
each genome are unique to that species. There have been additional Providencia genomes
sequenced as part of the Human Microbiome Project [43], which include additional
isolates of P. alcalifaciens and P. rettgeri as well as the species Providencia rustiganni
and Providencia stuartii. When all eight of the Providencia genomes are analyzed, the
percentage of each genome that comprises of the core genome or unique genes stays
relatively consistent. This suggests that the large amount of similarity will extend to the
genomes of additional members of the genus. When looking for well known virulence
factors I found that each genome encodes at least one type 3 secretion systems though all
4 D. melanogaster isolated strains did not have homologous type 3 secretion system [44].
The universal presence of a T3SS in all of the Providencia genomes indicates that
bacterial virulence towards D. melanogaster or other hosts cannot be predicted solely
based on the existence of this virulence factor for these strains.
9

7. Appendix: Attempted Verification of Putative Virulence Factors
The genomic comparisons revealed a putative virulence factor in the type 3
secretion systems (T3SS). These genes produce proteins which form a large needle-like
apparatus which inject proteins, called effector proteins, into host cells [44]. I sought to
create bacterial strains that are missing an essential T3SS gene to see how the virulence
phenotypes change in both P. sneebia and P. rettgeri during infection in D.
melanogaster. By creating the knockout in both species I would be able to compare the
results to see if and how the T3SS is involved in virulence and then make hypotheses as
to the function of the effector proteins during infection. I successfully made the
constructs for genomic integration of an in-frame deletion of an essential T3SS protein
for both species and integrated the whole plasmid into P. rettgeri’s genome but was
unable to get the plasmid into the genome of P. sneebia. Without genomic integration of
the plasmid, I was unable to excise the plasmid to create the in-frame deletion in P.
sneebia. I was therefore unable to resolve the amount the type 3 secretion systems
contribute to the virulence of P. sneebia or P. rettgeri towards D. melanogaster.
8. Summary
The D. melanogaster-Providencia system used here is a powerful and informative
system to examine host-pathogen interactions and infection biology in naturally occurring
pairs. The initial pathology of infections with Providencia isolated from wild infected D.
melanogaster has been determined and the genomes of the four bacterial species have
been sequenced. We found these isolates of Providencia to vary in their infection
phenotypes in the host from which they were isolated but their gene content is highly
10

similar. Their genomes are also very similar to isolates of Providencia found in human
feces suggesting that equally high amounts of homogeneity among gene content will be
found in additional members of the genus. This, with the fact that Providencia have been
isolated from a wild variety of locations and environments, suggests that they are
generalist and opportunistic pathogens of varied hosts.
References
1. Dobrindt U, Hochhut B, Hentschel U, Hacker J (2004) Genomic islands in pathogenic and environmental microorganisms. Nature reviews Microbiology 2: 414–424.
2. Lemaitre B, Hoffmann J (2007) The host defense of Drosophila melanogaster. Annu Rev Immunol 25: 697–743.
3. Apidianakis Y, Rahme LG (2009) Drosophila melanogaster as a model host for studying Pseudomonas aeruginosa infection. Nature protocols 4: 1285–1294.
4. Castonguay-Vanier J, Vial L, Tremblay J, Déziel E (2010) Drosophila melanogaster as a model host for the Burkholderia cepacia complex. PloS one 5: e11467.
5. Mansfield BE, Dionne MS, Schneider DS, Freitag NE (2003) Exploration of host-pathogen interactions using Listeria monocytogenes and Drosophila melanogaster. Cellular Microbiology 5: 901–911.
6. Uehlinger S, Schwager S, Bernier SP, Riedel K, Nguyen DT, et al. (2009) Identification of specific and universal virulence factors in Burkholderia cenocepacia strains by using multiple infection hosts. Infection and immunity 77: 4102–4110.
7. Cohuet A, Osta M a, Morlais I, Awono-Ambene PH, Michel K, et al. (2006) Anopheles and Plasmodium: from laboratory models to natural systems in the field. EMBO reports 7: 1285–1289.
8. Merçot H, Charlat S (2004) Wolbachia infections in Drosophila melanogaster and D. simulans: polymorphism and levels of cytoplasmic incompatibility. Genetica 120: 51–59.
9. Haselkorn TS (2010) The Spiroplasma heritable bacterial endosymbiont of Drosophila. Fly 4: 80–87.
11

10. Vodovar N, Vinals M, Liehl P, Basset A, Degrouard J, et al. (2005) Drosophila host defense after oral infection by an entomopathogenic Pseudomonas species. Proc Natl Acad Sci USA 102: 11414–11419.
11. Vodovar N, Vallenet D, Cruveiller S, Rouy Z, Barbe V, et al. (2006) Complete genome sequence of the entomopathogenic and metabolically versatile soil bacterium Pseudomonas entomophila. Nature biotechnology 24: 673–679.
12. Liehl P, Blight M, Vodovar N, Boccard F (2006) Prevalence of local immune response against oral infection in a Drosophila/Pseudomonas infection model. PLoS Pathogens 17: 193–199.
13. Acosta Muniz C, Jaillard D, Lemaitre B, Boccard F (2007) Erwinia carotovora Evf antagonizes the elimination of bacteria in the gut of Drosophila larvae. Cellular microbiology 9: 106–119.
14. Basset a, Khush RS, Braun a, Gardan L, Boccard F, et al. (2000) The phytopathogenic bacteria Erwinia carotovora infects Drosophila and activates an immune response. Proceedings of the National Academy of Sciences of the United States of America 97: 3376–3381.
15. Lazzaro BP (2002) A Population and Quantitative Genetic Analysis of the Drosophila melanogaster Antibacterial Immune Response. Pennsylvania State University, USA.
16. Juneja P, Lazzaro BP (2009) Providencia sneebia sp. nov. and Providencia burhodogranariea sp. nov., isolated from wild Drosophila melanogaster. International journal of systematic and evolutionary microbiology 59: 1108–1111.
17. Vallet-Gely I, Lemaitre B, Boccard F (2008) Bacterial strategies to overcome insect defences. Nature reviews Microbiology 6: 302–313.
18. Kanbar G, Engels W (2003) Ultrastructure and bacterial infection of wounds in honey bee (Apis mellifera) pupae punctured by Varroa mites. Parasitology research 90: 349–354.
19. O’Hara CM, Brenner FW, Miller JM (2000) Classification, identification, and clinical significance of Proteus, Providencia, and Morganella. Clinical microbiology reviews 13: 534–546.
20. Kitts C, Cunningham D, Unkeefer P (1994) Isolation of three hexahydro-1, 3, 5-trinitro-1, 3, 5-triazine-degrading species of the family Enterobacteriaceae from nitramine explosive-contaminated soil. Applied and environmental 60: 4608–4711.
21. Ahire KC, Kapadnis BP, Kulkarni GJ, Shouche YS, Deopurkar RL (2012) Biodegradation of tributyl phosphate by novel bacteria isolated from enrichment cultures. Biodegradation 23: 165–176.
22. Albert MJ, Alam K, Ansaruzzaman M, Islam MM, Rahman a S, et al. (1992) Pathogenesis of Providencia alcalifaciens-induced diarrhea. Infection and immunity 60: 5017–5024.
12

23. Sobreira M, Leal NC, Magalhães M, Guth BE, Almeida a M (2001) Molecular analysis of clinical isolates of Providencia alcalifaciens. Journal of medical microbiology 50: 29–34.
24. Yoh M, Matsuyama J, Ohnishi M, Takagi K, Miyagi H, et al. (2005) Importance of Providencia species as a major cause of travellers’ diarrhoea. Journal of medical microbiology 54: 1077–1082.
25. Janda JM, Abbott SL, Woodward D, Khashe S (1998) Invasion of HEp-2 and other eukaryotic cell lines by Providenciae: further evidence supporting the role of Providencia alcalifaciens in bacterial gastroenteritis. Current microbiology 37: 159–165.
26. Maszewska A, Torzewska A, Stączek P, Różalski A (2010) Enterocyte-like Caco-2 cells as a model for in vitro studies of diarrhoeagenic Providencia alcalifaciens invasion. Microbial pathogenesis: 1–9.
27. Sipahi OR, Bardak-Ozcem S, Ozgiray E, Aydemir S, Yurtseven T, et al. (2010) Meningitis due to Providencia stuartii. Journal of clinical microbiology 48: 4667–4668.
28. Ovchinnikova OG, Liu B, Guo D, Kocharova N a, Shashkov AS, et al. (2012) Localization and molecular characterization of putative O antigen gene clusters of Providencia species. Microbiology (Reading, England) 158: 1024–1036.
29. Muller HE (1983) Providencia friedericiana, a New Species Isolated from Penguins. International journal of systematic bacteriology 33: 709–715.
30. Foti M, Giacopello C, Bottari T, Fisichella V, Rinaldo D, et al. (2009) Antibiotic Resistance of Gram Negatives isolates from loggerhead sea turtles (Caretta caretta) in the central Mediterranean Sea. Marine pollution bulletin 58: 1363–1366.
31. Interaminense J a, Nascimento DCO, Ventura RF, Batista JEC, Souza MMC, et al. (2010) Recovery and screening for antibiotic susceptibility of potential bacterial pathogens from the oral cavity of shark species involved in attacks on humans in Recife, Brazil. Journal of medical microbiology 59: 941–947.
32. Jackson TJ, Wang H, Nugent MJ, Griffin CT, Burnell AM, et al. (1995) Isolation of insect pathogenic bacteria, Providencia rettgeri, from Heterorhabditis spp. Journal of Applied Bacteriology: 237–244.
33. Jho Y-S, Park D-H, Lee J-H, Cha S-Y, Han JS (2011) Identification of bacteria from the oral cavity and cloaca of snakes imported from Vietnam. Laboratory animal research 27: 213–217.
34. Ahmad A, Broce A, Zurek L (2006) Evaluation of significance of bacteria in larval development of Cochliomyia macellaria (Diptera: Calliphoridae). Journal of medical entomology 43: 1129–1133.
35. Mramba F, Broce a, Zurek L (2006) Isolation of Enterobacter sakazakii from stable flies, Stomoxys calcitrans L. (Diptera: Muscidae). Journal of food protection 69: 671–673.
13

36. Kuzina LV, Peloquin JJ, Vacek DC, Miller TA (2001) Isolation and Identification of Bacteria Associated with Adult Laboratory Mexican Fruit Flies , Anastrepha ludens ( Diptera : Tephritidae ). Current Microbiology 42: 290 –294. doi:10.1007/s002840110219.
37. Gupta AK, Nayduch D, Verma P, Shah B, Ghate HV, et al. (2012) Phylogenetic characterization of bacteria in the gut of house flies (Musca domestica L.). FEMS microbiology ecology 79: 581–593.
38. Corby-Harris V, Pontaroli AC, Shimkets LJ, Bennetzen JL, Habel KE, et al. (2007) Geographical distribution and diversity of bacteria associated with natural populations of Drosophila melanogaster. Applied and environmental microbiology 73: 3470–3479.
39. Chandler JA, Lang JM, Bhatnagar S, Eisen J a, Kopp A (2011) Bacterial communities of diverse Drosophila species: ecological context of a host-microbe model system. PLoS genetics 7: e1002272.
40. Miller S, Campbell B, Becnel J, Ehrman L (1995) Bacterial Entomopathogens from the Drosophila paulistorum Semispecies Complex. Journal of invertebrate pathology 65: 125–131.
41. Hardison RC (2003) Comparative genomics. PLoS biology 1: E58.
42. Hu B, Xie G, Lo C-C, Starkenburg SR, Chain PSG (2011) Pathogen comparative genomics in the next-generation sequencing era: genome alignments, pangenomics and metagenomics. Briefings in functional genomics 10: 322–333.
43. Peterson J, Garges S, Giovanni M, McInnes P, Wang L, et al. (2009) The NIH Human Microbiome Project. Genome research 19: 2317–2323.
44. Troisfontaines P, Cornelis GR (2005) Type III secretion: more systems than you think. Physiology (Bethesda, Md) 20: 326–339.
14

CHAPTER 2
COMPARTIVE PATHOLOGY OF BACTERIA
IN THE GENUS PROVIDENCIA TO A
NATURAL HOST, DROSOPHILA MELANOGSATER
This work has been published and reprinted with permission: Galac MR, Lazzaro BP (2011) Comparative pathology of bacteria in the genus Providencia to a natural host, Drosophila melanogaster. Microbes and Infection 13: 673–683.
15
Abstract
Bacteria in the genus Providencia are pathogens of many organisms, including humans
and insects. We and colleagues have isolated five different strains belonging to four distinct
Providencia species as natural infections of Drosophila melanogaster captured in the wild. We
found that these isolates vary considerably in pathology to infected D. melanogaster, differing in
the level of mortality they cause, their ability to replicate within the host and the level that the
fly’s immune response is elicited. One interesting bacterium was Providencia sneebia, which
causes nearly complete mortality and reaches large numbers in the fly but does not elicit a
comparably strong immune response. Through coinfection experiments, we determined that P.
sneebia avoids recognition by the immune system. We tested for biofilm formation and
replication within D. melanogaster cells as possible mechanisms for P. sneebia escape from host
immunity, but did not find evidence for either. D. melanogaster and Providencia provide a
powerful system for studying general host-pathogen interactions, and for understanding how the
well-studied immune model host D. melanogaster interacts with its natural bacterial pathogens.
16

1. Introduction
Closely related bacterial pathogens may utilize a wide range of mechanisms to infect
hosts, in part because virulence mechanisms are genetically labile and are often horizontally
transferred between reasonably distantly related microbes [1]. Understanding differences in
pathology between closely related bacteria highlights recent shifts in virulence, and can
ultimately lead to the identification of the underlying genetic basis. Several strains and species of
the γ-Proteobacterial genus Providencia have recently been isolated from field infections of wild
caught Drosophila melanogaster ([2,3], P. Juneja and S. M. Short unpublished), and in the
present work we contrast the pathological interactions of these bacterial species within their
Drosophila host. D. melanogaster is a well established model host for studying innate immunity
[4] and the pathology of virulent bacteria (e.g. [5–8]), but few natural pathogens of D.
melanogaster have been identified or extensively studied (but see [9–11]). We believe that
Drosophila and Providencia comprise a powerful natural system for the study of variation in
virulence and host-pathogen interactions. Because many microbial virulence strategies focus on
conserved aspects of eukaryotic physiology and cell biology, inferences from this system can
apply across broad host ranges, including from insects to humans.
Bacteria of the genus Providencia are Gram-negative opportunistic pathogens that have
been isolated from a wide variety of environments and organisms ranging from humans to
insects to sea turtles and shark mouths [12–15]. Providencia rettgeri, Providencia alcalifaciens,
and Providencia stuartii have all been isolated from human stool samples both as part of the
natural human gut flora and as the cause of gastric upset such as traveler’s diarrhea [16–18].
Some strains of P. alcalifaciens, but no strains of P. rettgeri or P. stuartii, have been found to be
intracellularly invasive in human cell lines [16,17,19,20]. Providencia also cause urinary tract
17
and other nosocomial infections in humans [12,13]. Numerous studies surveying bacteria
associated with insects such as blowflies, stable flies and Mexican fruit flies have isolated
Providencia species either from the whole insect or specifically from the gut (e.g. [21–23]),
although it is unclear whether these and other associations have meant the bacteria were acting as
pathogens or were simply present in the insects’ environment. Providencia have been recurrently
found in association with D. melanogaster, including in a survey for bacterial associates in a
natural population [24], in the hemolymph of laboratory cultures of domino mutant larvae that
are void of hemocytes and generally sick with bacterial infections [25], and as natural infections
in wild caught D. melanogaster ([2,3], P. Juneja and S. M. Short unpublished).
The D. melanogaster innate immune system has been well described, primarily from
experiments measuring the response to injection of avirulent bacteria or generic immune elicitors
(reviewed in [4]). D. melanogaster is also an excellent model for studying the pathology of
virulent bacteria, since many virulence mechanisms are effective across a broad range of hosts.
As a result, Drosophila has successfully been used as an experimental host to model clinical
pathogenesis in humans and animals, insect vectoring of human disease and microbiological
control of insect agricultural and medical pests. For example, Drosophila has been used to study
opportunistic human infectors such as Serratia marcescens and the pathologies of Pseudomonas
aeruginosa communities found in cystic fibrosis patients [7,26]. D. melanogaster has also stood
in as a model host for other arthropods such as ticks and mosquitoes that bear Francisella
tularensis infections, ticks that host Ehrlichia chaffeensis, and caterpillars infected with
Photorhabdus luminescens vectored by entomopathogenic nematodes [27–29].
Despite previous studies of bacterial pathogens of other animals using D. melanogaster
as a model host, very little is known about the bacteria that infect D. melanogaster itself in its
18

natural habitat. In some of the few efforts to identify bacterial pathogens of wild Drosophila, four
different species belonging to the genus Providencia were recovered along with isolates of other
bacteria from the hemolymph of wild caught D. melanogaster ([2,3], P. Juneja and S. M. Short
unpublished). Since the hemolymph of a healthy fly should be sterile, the presence of bacteria
can be considered to constitute an infection. Two of the recovered Providencia species are the
previously described P. rettgeri and P. alcalifaciens [12]. The other two species were identified
as novel species named Providencia sneebia and Providencia burhodogranariea, the latter of
which has two distinct strains designated B and D [3].
In this paper, we determine the pathology of Providencia species and strains in D.
melanogaster, where pathology is defined as the proportion of mortality caused by the bacteria,
the bacterial ability to proliferate within the fly, and the levels of host immunity induced by
infection as measured by the expression of antimicrobial peptide (AMP) genes. We find
Providencia to be highly variable in all three phenotypes. The ability of the bacteria to proliferate
within the fly, the amount of AMP expression, and the level of mortality the bacterial cause are
often all positively correlated, with the most deadly bacteria reaching the highest amount within
the fly and inducing the highest levels of AMP expression. A notable and interesting variation to
this pattern is P. sneebia, which kills about 90% of infected flies and reaches very large numbers
in these flies but induces less AMP expression than other Providencia species, even those that
cause significantly lower mortality and do not proliferate as effectively within flies. Through
coinfections with P. sneebia and P. rettgeri, we concluded that P. sneebia is able to actively
avoid recognition by the fly’s immune system and is resistant to ectopic immune induction. Two
possible hypotheses to explain these observations are that P. sneebia invades and replicates
within insect cells or forms a biofilm during infection, but we do not find evidence supporting
19

either hypotheses in vitro, suggesting that P. sneebia virulence mechanisms are more
complicated. The diversity of virulence profiles we observe among these Providencia isolates
indicates they will be a rich substrate for future study of Providencia infection dynamics in a
natural and experimentally tractable host.
2. Methods and materials
2.1. Fly stocks and bacteria strains
D. melanogaster fly stocks that were used were either wild type OregonR (OreR),
OR;imd10191;OR [30], Toll 1-RxA,ry,h,st,e/Tm3 Ser [31], or expressing green fluorescent protein
(GFP) under the promoter of the AMP Diptericin A (DptA), DptA-GFP [32]. They were
maintained on standard glucose medium (12 g agar, 100 g glucose and 100 g Brewer’s yeast per
1.2 L of water, plus a final concentration of 0.04% phosphoric acid and 0.4% propionic acid
added to inhibit microbial growth in the food) and kept at room temperature (22-24oC). Table 1
provides a complete list of Providencia bacterial strains. All Providencia strains were grown in
LB media at 37oC overnight with shaking, except for P. burhodogranariea strains, which were
grown at 25oC. Listeria monocytogenes 10403S was grown at 37oC in BHI medium with
shaking. Escherichia coli Mach1-T1, a cloning strain (Invitrogen Corp), was grown at 37oC in
LB medium with shaking.
2.2. Mortality
Overnight cultures used for infecting flies were grown to saturation and then diluted to an
A600nm of 1.0. To deliver infections, a 0.15 mm minuten pin (Fine Science Tools) mounted on a
200 µL pipet tip was dipped into the diluted overnight culture and poked into the thorax of a CO2
20

anesthetized fly. This delivers about 103 to 104 bacteria to each fly. Sterilely wounded flies were
pricked with a needle that was sterilized in 95% ethanol. Anesthetized control flies were handled
in the same way as the others but were not wounded. Flies were maintained in vials with food at
room temperature and surviving flies were counted once a day for 6 days after infection.
Infection with each bacterium was performed on at least 2 days with controls done on each day.
Product limit survival estimates and homogeneity by log-rank tests were conducted using proc
lifetest in SAS version 9.1 (SAS Institute). P-values were corrected for multiple tests in some
cases by a Bonferroni correction with a cut off value of p = 0.0025 for comparing all strains that
are the focus of the paper, p = 0.00625 for comparing among P. sneebia isolates only, and p =
0.025 for comparing only among P. burhodogranariea strains. In contrasts of different strains of
P. burhodogranariea, only those infections that were preformed on the same day were
compared.
2.3. Bacterial load
To measure systemic bacterial load in infected flies, single OreR flies were infected by
pinprick as described in Section 2.2, then homogenized in 500 µL LB and plated by robotic
spiral platers (manufactured by Don Whitley Scientific and Spiral Biotech) on LB agar plates at
0, 2, 4, 6, 10, 18, 24, and 32 h post infection. Flies were kept in vials with food at room
temperature between infection and homogenization. The LB agar plates were incubated
overnight at 25oC for P. burhodogranariea or 37oC for P. rettgeri, P. alcalifaciens, P. sneebia
and sterile wound. Gut commensal bacteria grow more slowly than Providencia under these
conditions, so by limiting incubation to overnight we exclude any commensal bacteria from our
assay. The number of colony forming units (CFU) on each plate was recorded using a counter
21

associated with the spiral platers, allowing the concentration of viable bacteria in each
homogenate to be calculated based on the number and position of colonies on the plates.
Bacterial loads for flies infected with P. alcalifaciens and P. sneebia were compared at each
individual time point using proc glm in SAS version 9.1 with the model: ln(CFU+1) = bacterial
treatment + sex. The boxplot was generated using the function boxplot in R. A small number of
surviving flies from each treatment were also homogenized at 7-10 days post infection as
described above.
2.4. Antimicrobial peptide expression
We first examined DptA-GFP flies to determine how much AMP expression occurred
during infection. We infected flies on replicate days as described in Section 2.2 and kept them in
vials with food until the time examined. Other AMP promoters examined which had
undetectable levels of fluorescence were Defensin, Drosocin, Attacin and Cecropin [32]. At 6,
24, and 32 h post infection flies were anesthetized and examined under a dissecting scope and
scored for the intensity of GFP fluorescence blind of the treatment. This assay was restricted to
females because males were found to have too much background fluorescence.
For quantification of AMP expression by QPCR, OreR flies were either infected with a
bacterium or sterilely wounded as described in Section 2.2 then were frozen at -‐80oC in pools
of 8 flies at 2, 4, 6, 10, 18, 24, and 32 h post treatment. Flies were maintained in vials with food
at room temperature between infection and freezing. Each treatment was performed on at least
two different days. Total RNA was extracted with Trizol (Invitrogen Corp) using the
manufacturer’s suggested protocol, then reverse transcribed to cDNA from poly-T primers using
standard procedures. The abundances of the AMPs Diptericin A (DptA), Drosomycin (Drs) and
22

Defensin (Def ) and the housekeeping gene rp49 were quantified by QPCR on an ABI 7000
Sequence Detection System (Applied Biosystems) using specific TaqMan primers and the
manufacturer’s suggested protocol (primer and probe sequences available upon request). For
statistical analysis, gene expression at each hour was examined separately in proc glm in SAS
version 9.1 using the model: AMP Ct = Rp49 Ct + treatment + date infected. Correction for
multiple tests was achieved using the Tukey-Kramer method. Least squares means were
recovered at the mean Rp49 Ct. Fold induction was calculated as 2 to the power of the difference
between the Ct of the sterile wound control and the Ct of the infection treatment for each time
post infection.
2.5. Coinfection
For coinfections, overnight cultures of P. rettgeri and P. sneebia were grown to
saturation and then diluted to an A600nm of 2.0. The bacteria were then mixed at proportions 1:1,
1:3 or 3:1 with either the alternate bacteria or LB. Flies were then infected in the thorax with a
small needle dipped in the culture as described in Section 2.2, replicated on two different days.
Although three different proportions of each bacterium were examined, we found that the results
were the same for each infection class (singly infected P. rettgeri, singly infected P. sneebia, or
coinfected) regardless of the mixing proportion, allowing us to pool all proportions in final
analyses. We only examined male flies for AMP expression and bacterial load in the coinfection
because we had found no difference between the sexes in our primary examination of mono-
infections. At 6, 24, and 32 h post infection flies were frozen at -‐80oC. RNA extraction, QPCRs,
and statistical analysis for AMP expression were performed as described in Section 2.4. Fisher’s
combined probability was used to summarize the independent expression experiments.
23

For the examination of AMP expression in DptA-GFP flies, infected or control flies were
placed in vials with standard fly food and examined blind of treatment at 6, 24, and 32 h post
infection with a dissecting scope. Here, only female flies were examined due to male background
fluorescence. The survival of these same flies was monitored up to six days post infection and
statistically analyzed as in Section 2.2.
Determination of the bacterial load of coinfected flies and statistical analysis was carried
out as described in Section 2.3. To distinguish between P. sneebia and P. rettgeri, we took
advantage of P. rettgeri’s natural resistance to tetracycline. All samples were plated on LB plates
without antibiotic and on plates with a tetracycline concentration of 10 µg/mL. The number of
CFU on the tetracycline plates was inferred to be the count of P. rettgeri and the difference in
CFU between the paired plates was assumed to be the P. sneebia count. PCR and restriction
enzyme digestion of the 16S gene looking for species-specific digestion pattern was done to
check that the proper species were growing on the correct plates. This experiment was carried
out twice on different days.
2.6. Biofilm formation
Overnight bacteria cultures were diluted to an A600nm of 1.0, then gently centrifuged into
a pellet and washed three times with 1 x PBS, and ultimately concentrated to 20X. 5 µl of bacteria
or PBS, as a control, were added to 200 µL of Schneider’s media with 10% fetal calf serum in a
96-well plate. Bacteria that received the antibiotic treatment sat in media alone for approximately
1 h before the antibiotics were added to the well. The antibiotics ceftazidime and kanamycin
were added to a final concentration of 1 mg/mL and 200 µg/mL, respectively. At 6 and 24 h after
the bacteria or antibiotics were added to the media, the wells were washed three times with
24

sterile water before the addition of 0.1% crystal violet, and then incubated for 15 min. The wells
were then washed twice with water before drying for 5 h. 30% acetic acid was added to the wells
to solubilize the crystal violet. The A540nm was read using Multiskan Spectrum plate reader
(Thermo Scientific). The final absorbance was calculated as the difference from the PBS control
well at that time.
2.7. Antibiotic protection assay
D. melanogaster S2 cells were maintained in Schneider’s media with 10% fetal calf
serum at 25oC. For the antibiotic protection assay, cells were seeded in 6 well plates the day
before the assay was carried out so that there would be approximately 105 cells/mL the next day.
Overnight cultures of bacteria were washed three times with PBS before addition to the wells
containing S2 cells at a multiplicity of infection of 10. After 2 h the media was removed and the
cells, which lightly adhere to the bottom of the wells, were washed while still in the wells three
times with PBS. Schneider’s media with 10% fetal calf serum containing 1 mg/mL ceftazidime
and 20 µg/mL kanamycin was then added to the wells. Neither ceftazidime nor kanamycin
should penetrate eukaryotic cell membranes, so only extracellular bacteria should be killed. The
cells were incubated with the antibiotics for 2 h to kill extracellular bacteria. At 0, 6 and 24 h
following this 2 h incubation, the media only was removed from the wells and centrifuged. The
pellet was then washed with water before being plated on BHI or LB plates, depending on the
bacteria, to provide an estimate of the number of viable bacteria in suspension (this number
should be near zero because of the presence of antibiotics). The S2 cells were then washed off
with water and spun down and washed again with water. The pellet was then resuspended in BHI
media before being plated on either BHI or LB. CFUs were manually counted to yield the
25

number of viable bacteria residing inside the S2 cells.
3. Results
3.1. Mortality
Given that closely related bacteria often vary in their virulence to a given host, we
hypothesized that the different strains of Providencia isolated from wild caught Drosophila
melanogaster might also vary in pathology (Table 2.1). There was minimal mortality (5-10%)
among control flies either only anesthetized on CO2 or wounded with a sterile needle. When flies
are infected with P. burhodogranariea strain D, less than 10% of infected flies died by six days
post infection (Figure 2.1). This is not significantly different from the amount of mortality from
either control (Figure 2.1; P. burhodogranariea strain D contrasted to CO2 control: p = 0.0612,
P. burhodogranariea strain D-sterile wound: p = 0.0436, not significant after correcting for
multiple tests). About 40% of flies infected with P. burhodogranariea strain B die from the
infection, which is highly significantly different from P. burhodogranariea strain D (p <
0.0001), although for unknown reasons, P. burhodogranariea strain B infections displayed more
day-to-day variation in mortality than infections with any other bacteria with mortality rates
ranging from 20% to 60%. P. rettgeri strain Dmel likewise caused moderate mortality, with
fewer than 50% of the flies dying. The amounts of mortality caused by P. rettgeri and P.
burhodogranariea strain B are not significantly different from each other (p = 0.0303), although
both infections caused significantly higher mortality than is observed in controls (all p < 0.0001).
P. sneebia strain Type and P. alcalifaciens strain Dmel each caused much greater mortality than
any of the other species. Within the first two days of infection, P. sneebia kills about 90% of
infected flies and P. alcalifaciens causes mortality in 99% of infected flies. Mortality from
26

Figure 2.1. Mortality of D. melanogaster from Providencia Infection. Wild type D. melanogaster were infected through pinprick infections with different strains of Providencia. All treatments result in highly significant differences in mortality (all pairwise contrasts p < 0.0001), except the difference between sterile needle and CO2 controls, between infection with P. burhodogranariea strain D and either control, and between P. rettgeri and P. burhodogranariea strain B (in all cases p > 0.0025, the Bonferroni-corrected cut off value).
27
infections with each P. sneebia and P. alcalifaciens is significantly different from all other
treatments, including each other (all p < 0.0001). Thus, there are three major classes of virulence
among our isolated Providencia as defined by mortality: P. burhodogranariea strain D causes
minimal mortality, P. rettgeri and P. burhodogranariea strain B cause moderate amounts of
mortality, and P. sneebia and P. alcalifaciens are highly virulent.
Multiple isolates of P. sneebia and P. burhodogranariea strain B have been recovered
from the hemolymph of wild caught D. melanogaster (Table 2.1) [2,3]. We infected flies with
each of these to test whether there is heterogeneity among isolates in the mortality caused by
these strains. Of the two other isolates of P. burhodogranariea strain B, only isolate B97 is
significantly different than the Type strain B, with B97 causing less mortality (Figure 2.2;
Supplementary Table 1; p = 0.0003). Eight P. sneebia isolates were tested and all caused greater
than 80% mortality, although some of them cause slightly but significantly different mortality
than the Type strain (Table 2.2). This suggests that while there is some variation among isolates,
P. sneebia can be considered to always be highly virulent while P. burhodogranariea is never
highly virulent.
The Drosophila humoral immune response is activated by two major signaling pathways,
the Toll pathway and the Imd pathway [4]. The Imd pathway tends to be more responsive to
Gram-negative bacteria, whereas the Toll pathway preferentially activated by Gram-positive
bacteria. We therefore hypothesized that the Imd pathway would be more important in fighting
Providencia. We measured the mortality of flies that were mutationally deficient in either the
Toll or Imd pathway after infection with Providencia. We found Toll pathway mutants showed
no significant difference in mortality compared to wild type flies after infection with either strain
of P. burhodogranariea or with P. rettgeri (p > 0.05, in all cases). P. sneebia and P.
28

Table 2.1. Bacterial Strains Used. (*) indicates the strains that are the main focus of this work.
Species Strain DSM # Isolated from Citation Providencia burhodogranariea
Type/B* 19968 wild D. melanogaster hymolymph
[2, 3]
B97 wild D. melanogaster hymolymph
[2, 3]
B18 wild D. melanogaster hymolymph
[2, 3]
D* wild D. melanogaster hymolymph
[2, 3]
Providencia rettgeri Dmel* wild D. melanogaster hymolymph
[2, 3]
Type 4542 fowl cholera [12] Providencia alcalifaciens Dmel* wild D. melanogaster
hymolymph P. Juneja and S. M. Short, unpublished
Type 30120 infant dysentery [12] Providencia sneebia Type* 19967 wild D. melanogaster
hymolymph [2, 3]
A16 wild D. melanogaster hymolymph
[2]
A36 wild D. melanogaster hymolymph
[2]
A75 wild D. melanogaster hymolymph
[2, 3]
A83 wild D. melanogaster hymolymph
[2]
A91 wild D. melanogaster hymolymph
[2, 3]
A101 wild D. melanogaster hymolymph
[2, 3]
A102 wild D. melanogaster hymolymph
[2, 3]
A104 wild D. melanogaster hymolymph
[2]
Providencia heimbachae Type 3591 penguin feces [12] Providencia stuartii Type 4539 human [12] Providencia vermicola Type 17385 entomopathogenic
nematode [37]
Providencia rustigiannii Type 4541 human feces [13]
29

Figure 2.2. Mortality of D. melanogaster from Infection with Other Isolates of P. sneebia and P. burhodogranariea strain B. Wild type D. melanogaster were infected through pin prick infections with different strains of Providencia. All isolates of P. burhodogranariea strain B cause low to moderate mortality, while infection with any isolate of P. sneebia results in high mortality.
30

Table 2.2. Statistics of Mortality of other isolates of P. sneebia and P. burhodogranariea strain B. P-value cut off was corrected for multiple testing using a Bonferronii correction resulting in a cut off value of p = 0.00625 for P. sneebia isolates and p = 0.025 for P. burhodogranariea strains. Values in bold are those that are significant. P. sneebia strain Type P. sneebia strain A101 0.099 P. sneebia strain A102 0.0003 P. sneebia strain A104 0.0002 P. sneebia strain A16 <0.0001 P. sneebia strain A36 0.0019 P. sneebia strain A75 0.8125 P. sneebia strain A83 0.6826 P. sneebia strain A91 0.2144 P. burhodogranariea strain B P. burhodogranariea strain B18 0.0326 P. burhodogranariea strain B97 0.0003
31

alcalifaciens did cause significantly greater mortality in the Toll mutant flies compared to the
wild type flies (p < 0.05, in both cases), but flies of both genotypes suffered severe mortality
within 2 days of infection with these bacteria (Figure 2.3A). In contrast, Imd mutant flies
infected with any strain of Providencia suffered very high mortality within 2 days post infection
(Figure 2.3B). Notably, we observed high mortality in flies infected with the P. rettgeri and P.
burhodogranariea strains, which cause only moderate to low mortality in wild type flies (Figure
2.3B). All Providencia infections in Imd mutant flies were significantly different than those seen
in infected wild type flies (p < 0.05, in all cases). These data indicate that the Imd pathway is
essential to fighting Providencia infection, and that P. rettgeri and P. burhodogranariea
infections are controlled by the host immune system and not simply limited by inherent failure of
the bacteria to be able to colonize the fly.
We were intrigued by the recurrent isolation of diverse Providencia species from
Drosophila, so we examined the amount of mortality caused in D. melanogaster by the Type
strains of 6 Providencia species isolated in other contexts, including P. rettgeri and P.
alcalifaciens isolates not derived from Drosophila (Table 2.1; Figure 2.4). Except for P.
alcalifaciens strain Type, all species caused less than 20% fly mortality in wild type flies. The
Type strain of P. alcalifaciens caused less mortality than our Dmel strain (Figure 2.4; p <
0.0001), which suggests there are genetic differences between the strains. The Type strain of P.
rettgeri also caused less mortality than our Dmel strain (Figure 2.4; p < 0.0001). These data
indicate that the high amount of Providencia-induced D. melanogaster mortality is specific to
those strains that were isolated from wild flies.
32

Figure 2.3. Mortality of Immune Mutant D. melanogaster. (A) Toll (B) Imd pathway deficient flies. When the Imd pathway is non-functional, all bacteria are highly virulent, while when the Toll pathway is mutated, the bacteria cause the same degree of mortality as seen in the wild type flies.
33

Figure 2.4. Mortality of D. melanogaster After Infection with Type strains of other Providencia species. Only those Providencia strains that were isolated from wild Drosophila are able to cause a high mortality. The Type strains of P. rettgeri and P. alcalifaciens are both significantly different from the Dmel strains (P. rettgeri strain Dmel contrasted to P. rettgeri strain Type: p < 0.0001. P. alcalifaciens strain Dmel contrasted with P. alcalifaciens strain Type: p < 0.0001).
34

3.2. Bacterial load
For a given host and pathogen pair, bacterial proliferation and host mortality may or may
not be correlated. To test our hypothesis that the Providencia species that cause the highest
mortality are those that are best able to replicate in flies, we measured the number of bacteria
present in D. melanogaster at multiple time points for the first 32 h after infection. Plates from
control flies that were sham-infected with a sterile needle did not have any bacteria growth after
the overnight incubation period (data not shown), indicating that the control flies did not have
any Providencia within or on them. Commensal bacteria from the gut begin to appear on all
plates after they have been incubated for at least 24 h. Infections with the five bacteria start to
diverge in CFU counts around 10 h post infection (Figure 2.5). There are a few individual flies
that are able to clear the infection during the first few hours. It is unclear why some flies are able
to clear their infections and others are not, although we suspect it reflects minor heterogeneities
in the infection process.
Flies infected with either strain of P. burhodogranariea cleared their infections or
maintained stable bacterial loads around the level of the initial introduction over the first 32 h of
infection (Figure 2.5). These bacteria are eventually cleared from all surviving flies, as survivors
have no bacteria present 7-10 days post infection (data not shown). P. rettgeri, P. sneebia and P.
alcalifaciens all show an increase in the number of CFU per fly after 6 h of infection. Among the
flies infected with P. rettgeri, there is a large amount of variation in the number of bacteria
present in individual flies at 24 and 32 h post infection, ranging from 103 to 107 CFU per fly
(Figure 2.5). It seems likely that this variation reflects divergence in the infection trajectory
among individual flies, where those with the highest bacterial loads probably succumb to the
infection and the others survive. Flies that survived their infections for 7-10 days post infection
35

Figure 2.5. Providencia Bacterial Load in D. melanogaster. Boxplot of the number of CFU present in D. melanogaster during the first 32 hours post infection. Note that the y-axis is a log scale. Whiskers approximate two times the standard deviation. The table under the graph has the number of flies that had no CFU at each time point for each treatment, as well as the total infected flies per treatment at each time point. Flies with no CFU present were not included in the boxplot. Sterilely wounded control flies never had any CFU at any time point.
36

carried either no CFU or between 102 and 3 x 10⁴ CFU per fly (data not shown). Both P. sneebia
and P. alcalifaciens are able to rapidly proliferate to very high numbers in the fly by 32 h post
infection, which is shortly before flies die from these infections. The number of bacteria present
in the infected flies is significantly different between P. sneebia and P. alcalifaciens at 18 h post
infection (p = 0.0115), but not at 24 and 32 h (both p > 0.05). Approximately 10% of the total P.
sneebia infected flies had no bacteria present at their time of sampling. These flies were most
likely able to clear the bacteria within the first few hours of infection and probably represent the
small percent of flies that survive in the mortality assays (Figure 2.1). This hypothesis is
supported by the observation that flies infected with P. sneebia that survive 7-10 days post
infection are free of Providencia (data not shown). In total, across all species, these data
demonstrate that the Providencia species that are best able to proliferate within the fly are those
that cause the highest mortality.
3.3. D. melanogaster immune response to infection
Insects respond to the presence of bacteria by activating their humoral immune system,
which results in the production of antimicrobial peptides (AMPs). Induction of AMP gene
expression varies among different microbes and immune elicitors [33], and we hypothesized that
the Providencia bacteria that were most proliferative during infection would cause the highest
induction of the immune response. To initially test this hypothesis, we infected transgenic flies
that express GFP driven by AMP promoters [32] then examined individual flies by eye at 6, 24,
and 32 h post infection. Although the expression patterns of several different AMPs were
examined (see Section 2.4), only DptA produced a strong fluorescence after infection with most
Providencia. Both P. burhodogranariea strains failed to drive detectable fluorescence signal
37

even with DptA. As expected, DptA-GFP expression was localized to the immune responsive fat
body. We repeatedly saw that flies that were infected with P. sneebia showed lower fluorescence
than flies infected with P. alcalifaciens or P. rettgeri, both in the intensity of the GFP expression
as well as the proportion of a single fly expressing GFP (Figure 2.6A). This contrasted with our
expectation based on the high levels of P. sneebia proliferation within flies and host mortality
caused by infection.
We used QPCR of AMP mRNAs to better quantify the immune response of infected flies
for the first 32 h of infection relative to control flies that were wounded with a sterile needle. By
calculating the fold induction over the sterile wound, we could determine the amount of AMP
expression that was specifically attributable to the bacteria and not to the wound in delivering the
infection (Figure 2.6B). Consistent with our observations of the DptA-GFP flies, P. sneebia
infections consistently resulted in lower expression of DptA than P. rettgeri and P. alcalifaciens
did at later times in the infection progression. At 24 and 32 h after infection with P. sneebia,
DptA expression was not significantly different from expression in response to the sterile wound
alone (Figure 2.6B; both p > 0.05). In contrast, P. rettgeri and P. alcalifaciens induced
significantly higher levels of expression than the sterile wound at 24 and 32 h after infection
(Figure 2.6B; in all cases p < 0.05). None of the bacterial infections drove DptA expression
above the level seen from sterile wound alone prior to 24 h post infection, and flies infected with
either strain of P. burhodogranariea never showed DptA expression above what is seen for the
sterile wound treatment at any time point (Figure 2.6B).
Providencia induction of Drs over sterile wound was generally much smaller, and none
of the infection treatments differ significantly from the sterile wound until 32 h post-infection
(Figure 2.7A). The pattern of Def expression was more complex, with strong induction in
38

Figure 2.6. DptA Expression in Flies Infected with Providencia. (A) DptA-GFP flies infected with (left to right) a sterile needle, P. sneebia, or P. rettgeri at 32 hours post infection. (B) Graph of DptA expression as measured by QPCR. The fold induction was calculated as the level of expression above that caused by a sterile wound alone. Error bars represent the standard error. At each time point, treatments labeled with “a” are not significantly different from the sterile wound alone while those with “b” are significantly different from the sterile wound (corrected for multiple tests by Tukey-Kramer method, cut off p = 0.05).
39

Figure 2.7. AMP Expression in Flies Infected with Providencia as measured by QPCR. (A) Drs (B) Def. The fold induction was calculated as the level of expression above that caused by a sterile wound alone. Error bars represent the standard error. (*) indicates those treatments that were significantly different from wounding with a sterile needle (corrected for multiple tests by Tukey-Kramer method, cut off p = 0.05).
40
response to P. rettgeri and P. alcalifaciens infections at 18 and 24 h post infection (Figure 2.7B).
The induction of Def in response to P. sneebia is much delayed relative to P. alcalifaciens and P.
rettgeri infection, with strong induction not appearing until 32 h post infection.
In summary, we observed that some of Providencia species that proliferate the most
within the fly and cause the greatest host mortality also drive higher AMP expression. An
interesting departure from this trend is P. sneebia, which is highly virulent and reaches the
highest abundance within the fly, but expression of DptA caused by P. sneebia infection is never
significantly higher than that caused by a sterile wound (Figure 2.6B).
3.4. Coinfections with P. rettgeri and P. sneebia
P. sneebia could avoid inducing a strong immune response by actively evading detection
by the host or by actively suppressing the immune response. To distinguish between these two
possibilities, we took advantage of the differences in mortality and immune induction resulting
from P. rettgeri and P. sneebia infections. We coinfected flies with both bacteria simultaneously
and then measured AMP expression, host mortality, and bacterial load. We hypothesized that if
P. sneebia actively suppresses the immune response, we would see low levels of AMP
expression even in the presence of P. rettgeri. Alternatively, if P. sneebia is not detected by the
immune system, we would expect to see high levels of AMP expression induced by the presence
of P. rettgeri in the coinfection.
We measured DptA, Drs and Def levels in groups of flies either coinfected or infected
with an individual bacteria at 6, 24, and 32 h post infection by QPCR (Figure 2.8-2.9). Across all
3 AMPs, infection with P. sneebia alone caused a lower immune response than infection with P.
rettgeri alone at 32 h post infection (Fisher’s combined probability, p = 0.00061), consistent with
41

Figure 2.8. DptA expression by D. melanogaster Infected with P. sneebia, P. rettgeri or Both Measured by QPCR. The fold induction was calculated as the level of expression over that caused by a sterile wound alone. Error bars represent the standard error.
42

Figure 2.9. AMP Expression in Flies Coinfected with P. sneebia and P. rettgeri as measured by QPCR. (A) Def (B) Drs. The fold induction was calculated as the level of expression above that caused by a sterile wound alone. Error bars represent standard error.
43

the results presented in the previous section. Expression of the 3 AMPs at 32 h post infection in
coinfected flies was not significantly different from expression in flies singly infected with P.
rettgeri (Fisher’s combined probability, p = 0.528), but coinfected flies had significantly higher
expression than flies infected with P. sneebia (Fisher’s combined probability, p = 0.014). This
result was further supported by visually examining the level of GFP expression in individual
DptA-GFP flies, in which coinfected and P. rettgeri infected flies fluoresced more intensely than
flies infected with P. sneebia. These data show that the lower expression of AMPs in flies
infected with P. sneebia alone is not due to suppression of the immune response.
Consistent with previous mortality measurements (Figure 2.1), approximately 40% of the
flies infected with P. rettgeri alone died from their infections, whereas about 95% of the flies
infected with P. sneebia died within 72 h (Figure 2.10). Coinfected flies exhibited 85%
mortality. While all three treatments are significantly different than each other (in all cases p <
0.01), the overall mortality of coinfected flies is clearly more similar to that of flies infected with
P. sneebia alone (Figure 2.10). When bacterial load was measured at 32 h post infection, we
observed that the abundance of each individual bacterium in the coinfected flies was not
significantly different than their levels in flies that are singly infected (Figure 2.11; in all cases p
> 0.05). Thus, it appears that the growth trajectories of the bacteria are completely independent
of each other, and coinfected flies carry a bacterial load equivalent to the sum of each single
infection. Considering all three coinfection phenotypes together, it is evident that P. sneebia is
not able to suppress the host immune response, but is able to proliferate and cause host mortality
even in the presence of an immune response triggered by P. rettgeri.
44

Figure 2.10. Survival of D. melanogaster from infections with P. sneebia, P. rettgeri or both.
45

Figure 2.11. Bacterial load of D. melanogaster infected with P. sneebia, P. rettgeri or both. The two bacteria are plotted separately in pale colors for the coinfected flies. Whiskers approximate two times the standard deviation. Coinfected flies show full induction of the immune system, but succumb to their infections and permit bacterial growth that is not different than what is observed in single infections.
46

3.5. Biofilm formation
One way that P. sneebia could protect itself from recognition and the microbicidal AMPs
is by forming a biofilm within the fly [34]. The fly would only be able to detect bacteria at the
perimeter of the biofilm, and thus the magnitude of the immune response would not be
proportional to the total number of bacteria present. Additionally the bacteria within the biofilm
would be able to freely multiply without being affected by expressed AMPs. We tested all of our
Providencia isolates for their ability to form biofilms in vitro in 96-well plates. E. coli was used
as a control that can form a biofilm [35]. None of our Providencia isolates formed a biofilm
(Table 2.3). However, we cannot definitively rule out the possibility that P. sneebia might form a
biofilm within the fly, since there could be host-specific molecules that act as signal to trigger P.
sneebia biofilm formation in vivo.
3.6. Antibiotic protection assay
Another way that P. sneebia could evade detection and proliferate would be if it were
able to invade cells and replicate within them. Strains of P. alcalifaciens that were isolated from
human patients with diarrhea have been shown to invade human cells, demonstrating that some
Providencia are able to do the first step in this process [16,17,19,20]. We used an antibiotic
protection assay to test whether P. sneebia is able to divide within D. melanogaster cells. We
also tested whether P. alcalifaciens and P. rettgeri are able to divide within D. melanogaster
cells since they proliferate within the fly during infection. E. coli was used as a negative control
bacteria that would be passively phagocytosed by the cells but is unable to replicate within. L.
monocytogenes was used as a positive control that is able to replicate within insect cells [36].
Bacteria were exposed to a phagocytic D. melanogaster cell line for 2 h before antibiotics were
47

Table 2.3. Providencia isolated from D. melanogaster are not able to form biofilms. Measurements of absorbance of crystal violet at 540nm of replicate wells after biofilm formation in vitro. E. coli, which is capable of forming a biofilm, has much higher absorbance than any of the Providencia species.
Relative biomass (A540nm) without antibiotics with antibiotics 6 hours 24 hours 6 hours 24 hours Bacteria average std dev average std dev average std dev average std dev E. coli 0.0717 +/- 0.0277 0.2471 +/- 0.0929 0.0208 +/- 0.0054 0.0219 +/- 0.0021 P. sneebia -0.0027 +/- 0.0047 0.0343 +/- 0.0036 -0.0023 +/- 0.0084 0.0125 +/- 0.0010 P. alcalifaciens 0.0039 +/- 0.0108 0.0261 +/- 0.0161 0.0007 +/- 0.0031 0.0058 +/- 0.0006 P. rettgeri 0.0056 +/- 0.0098 0.0277 +/- 0.0020 0.0117 +/- 0.0112 0.0104 +/- 0.0041 P. burhodogranariea strain B
0.0043 +/- 0.0002 0.0258 +/- 0.0063 0.0030 +/- 0.0074 0.0065 +/- 0.0001
P. burhodogranariea strain D
0.0048 +/- 0.0083 0.0127 +/- 0.0028 0.0060 +/- 0.0006 0.0121 +/- 0.0040
48

added to the media to kill all extracellular bacteria. At 0, 6 and 24 h post antibiotic killing of
extracellular bacteria, both the media and the cells were plated separately and CFU were
counted. The CFU found in the media were minimal by comparison to those within the cells.
Since E. coli will only be passively phagocytosed by the cells, it was used as a standard for
determining if any of our strains are actively invading the cells. Among all replicates, there were
consistently fewer P. sneebia and P. rettgeri than E. coli inside host cells at the 0 h time point
(Table 2.4), suggesting that these bacteria have some resistance to phagocytosis by these D.
melanogaster cells. By contrast, P. alcalifaciens had higher numbers of CFU than E. coli at the
initial time point suggesting that our strain of P. alcalifaciens is invasive. The positive control, L.
monocytogenes, was able to replicate to high numbers within the cells. P. rettgeri, P. sneebia, P.
alcalifaciens, and the negative control, E. coli, all had fewer intracellular CFU 24 h after addition
of antibiotic than at 0 h, indicating that none of them are able to replicate within the insect cells.
These data suggest that P. sneebia does not avoid recognition by the immune response by
invading and proliferating in D. melanogaster cells.
4. Discussion
We have established that closely related bacteria in the genus Providencia vary in their
pathology in a natural host, Drosophila melanogaster, as measured by the amount of mortality
they cause, their ability to replicate within the host and the magnitude of the host immune
response to their presence. Those bacteria which are able to grow most effectively in the fly
often also trigger the most robust immune response and result in the most host death. However,
one of these bacteria, P. sneebia, causes nearly complete mortality and quickly replicates to high
numbers within the fly but does not induce a strong immune response. Through coinfections with
49

Table 2.4. Providencia isolated from D. melanogaster are not intracellular pathogens. Number of CFU within D. melanogaster S2 cells at 0, 6, and 24 hours post antibiotic killing of extracellular bacteria. Two replicate wells were measured each day and the experiment was carried out on multiple days with similar results. Listeria monocytogenes, which is capable of intracellular invasion and proliferation, grows to high density within host cells, whereas Providencia and E. coli, which is not capable of intracellular invasion, are progressively eliminated.
0 hour 6 hour 24 hour well CFU CFU CFU
P. sneebia 1 543 468 28 2 466 460 22
P. rettgeri 1 285 110 49 2 138 120 88
P. alcalifaciens 1 2541 2988 1620 2 2265 2061 1170
E. coli 1 1734 942 154 2 1500 465 105
L. monocytogenes 1 7570 8617 109680 2 7145 14749 141200
PBS 0 0 0
50

the less virulent P. rettgeri, we concluded that P. sneebia is able to actively avoid detection by
the immune system as well as protect itself from the immune response. We did not find evidence
that P. sneebia forms a biofilm or replicates intracellularly in vitro. Although we were unable to
determine the exact virulence mechanisms used by P. sneebia during infection of D.
melanogaster, our data imply that P. sneebia implements more complicated or multiple strategies
to subvert the immune system.
We note that the proportion of flies that die from each bacterial infection in the mortality
assays is approximately equivalent to the proportion of flies that sustain high numbers of bacteria
in the load experiments, suggesting that the individual flies in which Providencia is able to
replicate are those that succumb to the infection. The data we have for flies infected with P.
burhodogranariea strain B does not conform to this hypothesis, as that bacterium causes a
moderate amount of mortality despite not replicating within the fly as much as the similarly
virulent P. rettgeri. This suggests that P. burhodogranariea strain B might do proportionally
more damage to the fly, possibly by producing a harmful compound, at a lower density than the
other bacteria. This also points at a distinction between the two P. burhodogranariea strains, as
they both have similar levels of bacteria present during the first 32 h of infection but strain D
causes significantly less mortality. The two strains are defined as distinct based on differences in
metabolic profiles and in sequence of some housekeeping genes [3]. Our data suggest there are
likely to be further genetic differences between the strains, including in genes involved in the
phenotypes examined here.
Although we are primarily interested in Providencia species that are natural pathogens of
D. melanogaster, we also examined mortality due to infection by other species in the genus,
which have been isolated as clinical infections of humans and other animals, or in one case,
51

Providencia vermicola, as an associate of entomopathogenic nematodes [12,13,37]. The only
bacteria we found to cause high mortality in infected Drosophila are those which were originally
isolated from wild caught D. melanogaster. Two of these species were also previously described
as clinical pathogens of humans, but in both of these species, P. alcalifaciens and P. rettgeri, the
Dmel strain isolated from D. melanogaster caused greater mortality than the Type strain of the
species. These results suggest that Providencia strains may become highly adapted to the host
species they infect, and that the isolates recovered from D. melanogaster may be genetically
suited to infect Drosophila and its close relatives. More detailed genomic and pathological
examination of Providencia should reveal genes specifically involved in virulence to Drosophila.
Because we are specifically interested in the D. melanogaster-Providencia interaction
after infection has occurred, we have relied on artificial infections to deliver the bacteria.
Nevertheless, it is worth considering how the bacteria may establish infections in the wild. Our
Providencia isolates do not cause mortality after being fed to flies in reasonable doses in the
laboratory (data not shown), so it is not likely that they orally infect flies in the wild unless they
are aided by coinfectors (e.g. [38,39]). There is good reason to believe, however, that our method
of infecting through a pinprick wound may mimic infections that wild D. melanogaster can
receive [40]. Wild caught flies often have melanization independent of natural pigmentation
patterns, indicating healed wounds, and frequently carry ectoparasitic mites that could be the
cause of some of these wounds (unpublished observation). Mite wounds in honey bees have been
shown to be secondarily colonized by environmental bacteria [41]. P. burhodogranariea strain B
has been isolated from a mite pulled from a wild caught D. melanogaster (P. Juneja, personal
communication), suggesting that mites may also directly vector bacterial infections, although fly-
to-fly transmission of Providencia via mites has not been experimentally demonstrated.
52

We anticipate that D. melanogaster-Providencia system will be an excellent one for
continued examination of many aspects of host and pathogen interactions. There is ample
phenotypic diversity in the host-pathogen interaction, with clear variation among Providencia
species in pathological phenotypes. Both the bacteria and the insect host can be easily and
inexpensively manipulated in the lab, providing a valuable setting to conduct research that will
not only give insight into interactions specific to this host-pathogen pairing, but also into generic
virulence mechanisms and their genetic basis. D. melanogaster has been extensively studied as a
generic host for pathogenic bacteria and a model for innate immune system function, and these
Providencia isolates now provide an opportunity to study how flies fight those bacteria that
infect them in their natural environment.
Acknowledgments
We would like to thank Punita Juneja, Sarah Short, Jacob Crawford, Susan Rottschaefer,
and Jennifer Comstock for helpful comments on the manuscript, discussion and help collecting
the data. This work was supported by NSF grant DEB-0415851 and NIH grant AI083932.
Reference
1. Gal-Mor O, Finlay BB (2006) Pathogenicity islands: a molecular toolbox for bacterial virulence. Cellular microbiology 8: 1707–1719.
2. Lazzaro BP (2002) A Population and Quantitative Genetic Analysis of the Drosophila melanogaster Antibacterial Immune Response Pennsylvania State University, USA.
3. Juneja P, Lazzaro BP (2009) Providencia sneebia sp. nov. and Providencia burhodogranariea sp. nov., isolated from wild Drosophila melanogaster. International journal of systematic and evolutionary microbiology 59: 1108–1111.
53

4. Lemaitre B, Hoffmann J (2007) The host defense of Drosophila melanogaster. Annu Rev Immunol 25: 697–743.
5. Brandt SM, Dionne MS, Khush RS, Pham LN, Vigdal TJ, et al. (2004) Secreted bacterial effectors and host-produced Eiger/TNF drive death in a Salmonella-infected fruit fly. PLoS Biology 2: e418.
6. Vodovar N, Acosta C, Lemaitre B, Boccard F (2004) Drosophila: a polyvalent model to decipher host-pathogen interactions. Trends Microbiol 12: 235–242.
7. Nehme NT, Liégeois S, Kele B, Giammarinaro P, Pradel E, et al. (2007) A model of bacterial intestinal infections in Drosophila melanogaster. PLoS pathogens 3: e173.
8. Berkey CD, Blow N, Watnick PI (2009) Genetic analysis of Drosophila melanogaster susceptibility to intestinal Vibrio cholerae infection. Cellular microbiology 11: 461–474.
9. Vodovar N, Vinals M, Liehl P, Basset A, Degrouard J, et al. (2005) Drosophila host defense after oral infection by an entomopathogenic Pseudomonas species. Proc Natl Acad Sci USA 102: 11414–11419.
10. Vodovar N, Vallenet D, Cruveiller S, Rouy Z, Barbe V, et al. (2006) Complete genome sequence of the entomopathogenic and metabolically versatile soil bacterium Pseudomonas entomophila. Nature biotechnology 24: 673–679.
11. Liehl P, Blight M, Vodovar N, Boccard F (2006) Prevalence of local immune response against oral infection in a Drosophila/Pseudomonas infection model. PLoS Pathogens 17: 193–199.
12. O’Hara CM, Brenner FW, Miller JM (2000) Classification, identification, and clinical significance of Proteus, Providencia, and Morganella. Clinical microbiology reviews 13: 534–546.
13. Manos J, Belas R (2006) The Genera Proteus, Providencia, and Morganella. In: Dworken M, Falkow S, Rosenberg E, Schleifer KH, Stackenbrandt E, editors. Prokaryotes, vol. 6. Singapore: Springer. pp. 245–269.
14. Foti M, Giacopello C, Bottari T, Fisichella V, Rinaldo D, et al. (2009) Antibiotic Resistance of Gram Negatives isolates from loggerhead sea turtles (Caretta caretta) in the central Mediterranean Sea. Marine pollution bulletin 58: 1363–1366.
15. Interaminense J a, Nascimento DCO, Ventura RF, Batista JEC, Souza MMC, et al. (2010) Recovery and screening for antibiotic susceptibility of potential bacterial pathogens from the oral cavity of shark species involved in attacks on humans in Recife, Brazil. Journal of medical microbiology 59: 941–947.
16. Albert MJ, Alam K, Ansaruzzaman M, Islam MM, Rahman a S, et al. (1992) Pathogenesis of Providencia alcalifaciens-induced diarrhea. Infection and immunity 60: 5017–5024.
17. Sobreira M, Leal NC, Magalhães M, Guth BE, Almeida a M (2001) Molecular analysis of clinical isolates of Providencia alcalifaciens. Journal of medical microbiology 50: 29–34.
54

18. Yoh M, Matsuyama J, Ohnishi M, Takagi K, Miyagi H, et al. (2005) Importance of Providencia species as a major cause of travellers’ diarrhoea. Journal of medical microbiology 54: 1077–1082.
19. Janda JM, Abbott SL, Woodward D, Khashe S (1998) Invasion of HEp-2 and other eukaryotic cell lines by Providenciae: further evidence supporting the role of Providencia alcalifaciens in bacterial gastroenteritis. Current microbiology 37: 159–165.
20. Maszewska A, Torzewska A, Stączek P, Różalski A (2010) Enterocyte-like Caco-2 cells as a model for in vitro studies of diarrhoeagenic Providencia alcalifaciens invasion. Microbial pathogenesis: 1–9.
21. Kuzina LV, Peloquin JJ, Vacek DC, Miller TA (2001) Isolation and Identification of Bacteria Associated with Adult Laboratory Mexican Fruit Flies , Anastrepha ludens ( Diptera : Tephritidae ). Current Microbiology 42: 290 –294. doi:10.1007/s002840110219.
22. Ahmad A, Broce A, Zurek L (2006) Evaluation of significance of bacteria in larval development of Cochliomyia macellaria (Diptera: Calliphoridae). Journal of medical entomology 43: 1129–1133.
23. Mramba F, Broce a, Zurek L (2006) Isolation of Enterobacter sakazakii from stable flies, Stomoxys calcitrans L. (Diptera: Muscidae). Journal of food protection 69: 671–673.
24. Corby-Harris V, Pontaroli AC, Shimkets LJ, Bennetzen JL, Habel KE, et al. (2007) Geographical distribution and diversity of bacteria associated with natural populations of Drosophila melanogaster. Applied and environmental microbiology 73: 3470–3479.
25. Braun a, Hoffmann J a, Meister M (1998) Analysis of the Drosophila host defense in domino mutant larvae, which are devoid of hemocytes. Proceedings of the National Academy of Sciences of the United States of America 95: 14337–14342.
26. Sibley CD, Duan K, Fischer C, Parkins MD, Storey DG, et al. (2008) Discerning the complexity of community interactions using a Drosophila model of polymicrobial infections. PLoS pathogens 4: e1000184.
27. Vonkavaara M, Telepnev MV, Rydén P, Sjöstedt A, Stöven S (2008) Drosophila melanogaster as a model for elucidating the pathogenicity of Francisella tularensis. Cellular microbiology 10: 1327–1338.
28. Luce-Fedrow A, Von Ohlen T, Chapes SK (2009) Ehrlichia chaffeensis infections in Drosophila melanogaster. Infection and immunity 77: 4815–4826.
29. Hallem E a, Rengarajan M, Ciche T a, Sternberg PW (2007) Nematodes, bacteria, and flies: a tripartite model for nematode parasitism. Current biology 17: 898–904.
30. Pham LN, Dionne MS, Shirasu-Hiza M, Schneider DS (2007) A specific primed immune response in Drosophila is dependent on phagocytes. PLoS pathogens 3: e26.
31. Anderson KV, Jürgens G, Nüsslein-Volhard C (1985) Establishment of dorsal-ventral polarity in the Drosophila embryo: genetic studies on the role of the Toll gene product. Cell 42: 779–789.
55

32. Tzou P, Ohresser S, Ferrandon D, Capovilla M, Reichhart J, et al. (2000) Tissue-specific inducible expression of antimicrobial peptide genes in Drosophila surface epithelia. Immunity 13: 737–748.
33. Lemaitre B, Reichhart JM, Hoffmann J a (1997) Drosophila host defense: differential induction of antimicrobial peptide genes after infection by various classes of microorganisms. Proceedings of the National Academy of Sciences of the United States of America 94: 14614–14619.
34. Høiby N, Bjarnsholt T, Givskov M, Molin S, Ciofu O (2010) Antibiotic resistance of bacterial biofilms. International journal of antimicrobial agents 35: 322–332.
35. Chavant P, Gaillard-Martinie B, Talon R, Hébraud M, Bernardi T (2007) A new device for rapid evaluation of biofilm formation potential by bacteria. Journal of microbiological methods 68: 605–612.
36. Mansfield BE, Dionne MS, Schneider DS, Freitag NE (2003) Exploration of host-pathogen interactions using Listeria monocytogenes and Drosophila melanogaster. Cellular Microbiology 5: 901–911.
37. Somvanshi VS, Lang E, Sträubler B, Spröer C, Schumann P, et al. (2006) Providencia vermicola sp. nov., isolated from infective juveniles of the entomopathogenic nematode Steinernema thermophilum. International journal of systematic and evolutionary microbiology 56: 629–633.
38. de Oliveira D, de Souza TDACB, Murate LS, Jankevicius JV, Gaziri LCJ, et al. (2004) Protease and phospholipase inhibition protect Veneza zonata (Hemiptera Coreidae) against septicemia caused by parasite trypanosomatid 563DT. Journal of invertebrate pathology 85: 9–17.
39. Broderick N a, Raffa KF, Handelsman J (2006) Midgut bacteria required for Bacillus thuringiensis insecticidal activity. Proceedings of the National Academy of Sciences of the United States of
40. Vallet-Gely I, Lemaitre B, Boccard F (2008) Bacterial strategies to overcome insect defences. Nature reviews Microbiology 6: 302–313.
41. Kanbar G, Engels W (2003) Ultrastructure and bacterial infection of wounds in honey bee ( Apis mellifera) pupae punctured by Varroa mites. Parasitology research 90: 349–354.
56

CHAPTER 3
COMPARATIVE GENOMICS OF BACTERIA IN THE
GENUS PROVIDENCIA ISOLATED FROM WILD
DROSOPHILA MELANOGASTER
57

Abstract
Background
Comparative genomics can be an initial step in finding the genetic basis for phenotypic
differences among bacterial strains and species. Bacteria belonging to the genus Providencia have been
isolated from numerous and varied environments. We sequenced, annotated and compared draft genomes
of P. rettgeri, P. sneebia, P. alcalifaciens, and P. burhodogranariea. These bacterial species that were all
originally isolated as infections of wild Drosophila melanogaster and have been previously shown to vary
in virulence to experimentally infected flies.
Results
We found that these Providencia species share a large core genome, but also possess distinct sets
of genes that are unique to each isolate. We compared the genomes of these isolates to draft genomes of
four Providencia isolated from the human gut and found that the core genome size does not substantially
change upon inclusion of the human isolates. We found many adhesion related genes among those genes
that were unique to each genome. We also found that each isolate has at least one type 3 secretion system
(T3SS), a known virulence factor, though not all identified T3SS belong to the same family nor are in
syntenic genomic locations.
Conclusions
The Providencia species examined here are characterized by high degree of genomic similarity
which will likely extend to other species and isolates within this genus. The presence of T3SS islands in
all of the genomes reveal that their presence is not sufficient to indicate virulence towards D.
melanogaster, since some of the T3SS-bearing isolates are known to cause little mortality. The variation
in adhesion genes and the presence of T3SSs indicates that host cell adhesion is likely an important aspect
of Providencia virulence.
58

1. Background
Providencia are ubiquitous Gram-negative bacteria in the family Enterobacteriaceae that
are often opportunistic pathogens. They are commonly found to cause traveler’s diarrhea and
urinary tract infections in humans but have also been isolated from more severe human infections
such as meningitis [1–4]. They have been identified as part of the normal human gut flora and
the genomes of some strains have been sequenced as part of the Human Microbiome Project [5].
Additionally, Providencia have been associated with numerous animals worldwide, including
isolation from penguin feces in German zoos [6], sea turtles in the Mediterranean [7], shark
mouths in Brazil [8], entomopathogenic nematodes globally [9], and snakes from Vietnam [10].
Providencia have also been found in association with insects such as blowflies [11], stable flies
[12], Mexican fruit flies [13], and house flies [14]. Providencia have also been found in the guts
and external environment of Drosophila melanogaster [15,16].
Providencia strains have been additionally isolated as infectious agents of D.
melanogaster and have been shown to have distinct phenotypes including varied virulence
towards D. melanogaster [17,18]. Two species, Providencia sneebia and Providencia
alcalifaciens, were found to be highly virulent, causing 90-100% mortality in infected flies.
Infections with the other two, Providencia rettgeri and Providencia burhodogranariea, caused
only moderate mortality, with 30-40% of infected flies succumbing to the infection [18]. The
more lethal bacteria tended to proliferate to higher densities in the fly, and triggered greater
expression of antibacterial immune genes, with the exception of P. sneebia, which did not induce
substantial antimicrobial peptide gene expression despite rapid and lethal proliferation [18].
In the present work, we have sequenced, annotated, and compared the draft genomes of
the four species isolated from infections in wild D. melanogaster: P. sneebia, P. rettgeri, P.
59

burhodogranariea and P. alcalifaciens. We compared our sequences to draft genomes of four
sequenced species of Providencia isolated from the human gut [5]. We sought specifically to
identify the core Providencia genome and accessory genes, to establish which genes may be
evolving under positive selection, and to annotate differences in gene content that contribute to
physiological differences among the isolates.
2. Methods
2.1 Bacteria Strains Sequenced
The four bacteria strains that were sequenced in this study were isolated from the
hemolymph of wild caught Drosophila melanogaster [18]. They are the Providencia sneebia
Type strain (DSM 19967) [GenBank:AKKN00000000], Providencia rettgeri strain Dmel1
[GenBank:AJSB00000000], Providencia alcalifaciens strain Dmel2
[GenBank:AKKM00000000], and Providencia burhodogranariea Type strain (DSM 19968)
[Genbank:AKKL00000000].
2.2 Genome Sequencing and Assembly of P. rettgeri and P. sneebia
Bacterial DNA was extracted using Puregene DNA Purification Kit (Gentra Systems Inc.,
Minneapolis, MN) according to the manufacturer’s directions for Gram-negative bacteria. The
DNA was then sequenced using FLX Roche/454 Sequencing Technology at Cornell University’s
Life Science Core Laboratory Center in Ithaca, NY.
P. sneebia and P. rettgeri were sequenced with approximately 500,000 reads of an
average length of 250 bp, providing about 30X coverage for each genome. The sequences for
each species were obtained from separate full-plate sequencing runs and independently
60

assembled using the LaserGene SeqMan (version 8) software with the manufacturer’s
recommended parameters (Figure 3.1). An additional 180,000 reads were obtained from a 454
sequencing plate on which the DNA from P. sneebia and P. rettgeri was separated by a rubber
gasket. During the sequencing process, this gasket leaked allowing a very small amount of
reciprocal contamination. We did not want to discard these sequences entirely, but we also
wanted to avoid any contaminating reads fouling our assemblies. Therefore our second assembly
step was to assemble the reads from the half-plate to those contigs initially assembled with the
uncontaminated full-plate reads using SeqMan (Figure 3.1). From this second step of assembly,
we retained: (1) contigs that contained half-plate reads assembled to full-plate contigs, increasing
the depth of those contigs, (2) contigs in which half-plate reads bridged previously separate
contigs from the full-plate assemblies, allowing them to be stitched together, and (3) novel
contigs containing only half-plate reads but with a coverage depth of 30X or greater.
Contaminating sequences in the half-plate reads would presumably fail to map to full-plate
assemblies or would result in low-coverage contigs, so we infer that the small number of
molecules that leaked through the gasket have been effectively discarded. After the second
round of assembly, the P. sneebia genome was mapped into 72 contigs and the P. rettgeri
genome was mapped into 71 contigs.
As we were annotating the P. sneebia and P. rettgeri genome sequences (see “2.5
Annotation Methods” section below), we noticed several instances of sequential open reading
frames (ORFs) that were annotated with the same predicted function and whose combined length
equaled the size of genes with the same functional annotation in other bacteria. Closer inspection
revealed that these instances were generally due to a stop codon or frameshift mutation that
interrupted the ORF, causing it to be annotated as two genes with identical function. These
61

Figure 3.1. Flow chart illustrating steps taken in the assembly of the P. sneebia and P. rettgeri genomes.
62

inferred mutations tended to happen after short homopolymer runs. Individual reads varied in
the lengths of these homopolymer sequences, and the contig assembly often did not reflect the
most common sequence length among the reads. It is a known problem that Roche/454
Sequencing often results in errors in homopolymer run lengths [19]. To improve the accuracy of
inferred homopolymer lengths, we re-aligned all of the Roche/454 sequencing reads to our
assembled reference sequences using the program BWA [20] (Figure 3.1). The consensus
homopolymer length from the BWA alignment was used to fix the assembled contigs before any
further analysis was performed. This correction improved our gene annotations by eliminating
sequencing errors that interrupted ORFs.
We aimed to improve the assemblies of our P. sneebia and P. rettgeri genomes by
joining contigs through PCR followed by direct Sanger sequencing. However, the order and
orientation of the contigs was unknown. We hypothesized that there would be synteny among the
genomes of Providencia species and isolates as well as species in the closely related genus
Proteus, which we could use to predict the order and orientations of the contigs in our assemblies
(Figure 3.1). We used MUMmer (version 3.22) [21] to compare P. sneebia and P. rettgeri to the
draft genomes of Providencia rettgeri DSM 1131 (283 contigs) [GenBank:ACCI00000000],
Providencia alcalifaciens DSM 30120 (79 contigs) [GenBank:ABXW00000000], Providencia
stuartii ATCC 25827 (120 contigs) [GenBank:ABJD00000000], and Providencia rustigianii
DSM 4541 (127 contigs) [GenBank:ABXV00000000] as well as the completed genome of
Proteus mirabilis strain HI4320 [GenBank:NC_010554.1]. Where two of our P. rettgeri or P.
sneebia contigs had similarity to a single contig of one of the other genome sequences, we
designed PCR primers to amplify across the inferred gap. Successful amplifications were
sequenced by primer walking and the resultant sequences were used to bridge contigs in the
63

assemblies. PCR and sequencing methods are described below in the “2.4 PCR and Sanger
Sequencing Methods” section. We found that designing the primers inset about 900 bp from the
contig breakpoints helped to ensure specificity in amplification, especially because repetitive
sequences in the genome can be the cause of contig breaks in genome assemblies. Using this
method, we reduced the number of contigs in the P. sneebia assembly from 72 to 67 and in the P.
rettgeri assembly from 71 to 64.
To further connect the P. sneebia and P. rettgeri assemblies, we contracted the MapIt
optical mapping service from OpGen, Inc. (Gaithersburg, MD) and analyzed the resulting data
using their program MapSolver (version 2.1.1) (Figure 3.1). An in silico digestion of our contigs
allowed them to be oriented onto an in vitro restriction digestion map of each bacterium’s
physical genome. This ordered and oriented the contigs and allowed us to identify those contigs
that comprised the majority of each genome. We used the optical map to identify physically
consecutive contigs, then designed primers for PCR and Sanger sequencing to close most of the
remaining gaps. The optical map also indicated a small number of computational misassemblies
and allowed them to be fixed. After optical mapping and final gap closing, our draft genome
sequences were assembled into 14 contigs for P. sneebia and 9 contigs for P. rettgeri.
2.3 Genome Sequencing and Assembly of P. alcalifaciens and P. burhodogranariea
P. alcalifaciens and P. burhodogranariea were sequenced by paired-end 454 sequencing.
Libraries were constructed for each bacterium with an approximately 3 kb insert size, and
roughly 1 million paired-end sequence reads of an average length of 250 bases were collected.
The paired-end reads were assembled using Roche/454’s Newbler Assembler (version 2.5.3),
64

which resulted in 15 scaffolds for P. alcalifaciens and 8 scaffolds for P. burhodogranariea,
sequenced to roughly 35X coverage.
2.4 PCR and Sanger Sequencing Methods
PCR primers for gap closing were designed either using Primer3 [22] or with a primer
design function within SeqMan. PCRs were performed using a genomic DNA template with a
final concentration of 1.2 ng/µl in each PCR reaction volume.
When the size of the expected product was unknown or was expected to be less than 5 kb,
the PCR was done with Taq polymerase (New England Biolabs, Beverly, MA) with an annealing
temperature gradient ranging from 2oC higher to 2oC lower than the melting temperature of the
primers. PCR cycling parameters were as follows: (1) 2 minutes at 95oC, (2) 30 seconds at 95oC,
(3) 30 seconds at annealing temperature gradient, (4) 1 minute at 72oC, (5) repeat steps 2-4 for
34 more cycles, (6) 5 minutes at 72oC. 3.5 µl of each PCR product was prepared for sequencing
by treatment with 5 units of Exonuclease I (USB Corp., Cleveland, OH) and 0.5 units of shrimp
alkaline phosphatase (USB Corp. , Cleveland, OH) at 37oC for one hour before heat-killing the
enzymes at 65oC for 15 minutes. PCR products were then directly sequenced using ABI BigDye
Terminator (Applied Biosystems, Foster City, CA) according to the manufacturer’s directions.
PCR for products with an expected size greater than 5 kb was done using high fidelity
iProof polymerase (Bio-Rad, Hercules, CA). Annealing temperatures and extension times were
determined using manufacture’s suggested methods. The PCR cycling parameters were: (1) 30
seconds at 98oC, (2) 7 seconds at 98oC, (3) 20 seconds at appropriate annealing temperature, (4)
appropriate extension time at 72oC, (5) repeat steps 2-4 for 29 more cycles, (6) 7 minutes at
65

72oC. Products were prepared for sequencing with PCR purification clean up columns
(Invitrogen, Calsbad, CA) before being sequenced directly.
2.5 Annotation Methods
Genomic open reading frames were determined and annotated using the RAST Server
(version 4) [23]. Gene ontology terms (GO terms) were assigned to the ORFs identified by
RAST using Blast2GO (version 2.5) [24]. Fisher’s Exact Test for enriched GO categories was
done within Blast2GO using a p-value cut off of 0.05 after adjusting for a false discovery rate
(FDR) of 0.05 for multiple testing.
2.6 Plasmid Identifications and Analysis
The circular DNA structure of plasmids means that they will appear to be arbitrary
broken when forming linear contigs during assembly of sequencing reads. We tested all potential
plasmid contigs for a circular physical structure by designing PCR primers approximately 500
bases from the ends of the contig facing outward off each end of the contig. This primer design
means that a product would be formed only if the ends of the contig were connected in the
physical DNA. Any PCR product amplified from such primers was then sequenced with Sanger
sequencing to confirm that the sequence supported a circular physical arrangement of the
sequence. PCR reactions and Sanger sequencing was done as described above in “PCR and
Sanger sequencing methods”.
Putative plasmids were identified in multiple ways. We speculated that one P. rettgeri
contig might be a plasmid because it had substantially higher depth of coverage than other
contigs, and when we compared the contig to itself using MUMmer, we found that it was
66

composed of the same sequence repeated multiple times. We hypothesized that the contig might
actually represent a completely sequenced, high copy number plasmid, and that the circular
shape of the physical DNA sequence was resulting in a tandem repeat of the sequence in the in
silico assembly. PCR and Sanger sequencing confirmed that this contig is a plasmid.
To more systematically assess whether contigs from the assemblies were plasmids, we
looked for contigs with identical sequence present at both ends. We hypothesized that the
arbitrary break point of the physical circular structure to form a linear contig could result in
identical sequence at each end of the contig. We used MUMmer to compare contigs to
themselves. For P. sneebia and P. rettgeri, we examined all contigs which did not align to the
optical map since we do not expect plasmids to map to the chromosomal genome. We identified
three P. sneebia plasmids using this method, all of which were confirmed by PCR and Sanger
sequencing. We identified no additional P. rettgeri contigs as putative plasmids using this
approach. For P. alcalifaciens and P. burhodogranariea, we examined every scaffolds smaller
than 6 kb in length, but none contained the same sequence at both ends of the contig.
When examining the synteny of the genomes (see “2.10 Synteny and Regional
Comparisons” section below), we noticed that some of the contigs of P. alcalifaciens had no
similarity to sequences in any of the other genomes. We hypothesized that these contigs could be
plasmids that are unique to P. alcalifaciens. We tested four contigs by PCR and Sanger
sequencing. One contig was confirmed to be a plasmid while the other three did not produce
PCR products and therefore showed no evidence of being plasmids.
All putative plasmids were compared to each other using MUMmer. In order to
determine whether our confirmed plasmids or previously sequenced Providencia plasmids [25–
27] were present but undetected in the remaining sequences from this study, we constructed a
67
BLAST database of all of the reads from the Roche/454 sequencing of each individual species
and searched for reads matching each Providencia plasmid using BLAST+ (version 2.2.25). Four
previously identified Providencia plasmids were used as query sequences: pDIJ09-518a
[GenBank:HQ834472.1], pGHS09-09a [GenBank:HQ834473.1], pMR0211
[GenBank:JN687470.1], and R7K [Genbank:NC_010643.1].
2.7 Identification of Orthologs
Orthologous genes were identified as shared among three different sets of bacteria: (1)
the strains of P. sneebia, P. rettgeri, P. alcalifaciens, and P. burhodogranariea sequenced in this
study; (2) the strains of P. sneebia, P. rettgeri, P. alcalifaciens, and P. burhodogranariea
sequenced in this study plus Proteus mirabilis strain HI4320; (3) the strains of P. sneebia, P.
rettgeri, P. alcalifaciens, and P. burhodogranariea sequenced in this study plus the strains of P.
rettgeri, P. alcalifaciens, P. stuartii, and P. rustigianii sequenced as part of the Human
Microbiome Project [5]. Orthologous gene clusters were identified using OrthoMCL (version
2.0.2) [28]. BLAST results used within OrthoMCL were performed with an e-value cut off of 10-
10. The output from OrthoMCL was parsed using custom Python scripts.
2.8 Alignments of Orthologs
Orthologous gene clusters found among the strains sequenced in this study and Proteus
mirabilis were aligned for phylogenetic analysis (see “2.9 Phylogenetic Analysis” section
below). Those orthologs of the strains sequenced in this study only were aligned for use in the
recombination and positive selection analyses (see “2.11 Recombination Analysis” and “2.12
Positive Selection Analysis” sections below). Only clusters of clear 1:1:1:1:1 or 1:1:1:1
68

orthology were retained, respectively. Alignments of the protein translation of the genes were
done using ClustalW (version 2.1) [29] followed by back-translation to the nucleotide alignment
using PAL2NAL (version 13) [30]. Alignments were visually inspected and poor alignments
were removed as follows. We eliminated alignments where the difference in amino acid identity
between the most-similar and least-similar pairs of species were greater than 40% out of concern
that these might not be true orthologs. We also excluded alignments that had both an average
protein identity that was less than 60% and a difference between the highest and lowest pair-wise
protein identities greater than 20%. Those alignments that had an average protein identity of less
than 70% were examined by hand to ensure proper alignment.
2.9 Phylogenetic Analysis
The alignments of all 1689 ortholog clusters that included the Proteus mirabilis outgroup
were concatenated using FASconCAT (version 1) [31]. RAxML (version 7.2.8) [32] was used
to construct the phylogenetic trees for the concatenation of all orthologous genes as well as for
each individual orthologous cluster. Proteus mirabilis was set as an outgroup.
2.10 Synteny and Regional Comparisons
Synteny among genomes was examined using Mauve (version 2.3.1) [33], Artemis
Comparison Tool (version 1) [34], and MUMmer. Comparisons of particular regions of the
genomes were done using EasyFig (version 1.2) [35].
69

2.11 Recombination Analysis
Evidence for recombination was examined by executing the programs GENECONV
which implements the Sawyer method [36] and PhiPack [37]. GENECONV was run using the
default settings, which estimates p-values on 10,000 permutations of each alignment. PhiPack
runs 3 separate tests: Pairwise Homoplasy Index, Maximum χ2, and Neighbor Similarity Score.
The Pairwise Homoplasy Index was calculated on a window size of 50 while Maximum χ2 was
calculated on a window that is 2/3 the size of the polymorphic sites. We did 1000 permutations
in PhiPack to calculate each p-value. The p-values of all tests were corrected for multiple testing
using the program Q-value [38] with a FDR of 10%.
2.12 Positive Selection Analysis
Positive selection analysis was done using PAML (version 4.4) [39] on the 1937
orthologous clusters which are Providencia-specific. Site-model tests were implemented using
codeml to compare model M8a (beta+ω=1) to M8 (beta+ω) [39,40]. The log-likelihoods from
each test were compared in a likelihood ratio test assuming a χ2 distribution of the test statistic.
We corrected for multiple testing using a q-value cut off which was calculated with the program
Q-value [38] using a FDR of 20% [41,42].
2.13 Phage Identification
Phage genes were identified and classified using PHAST [43].
70

3. Results and Discussion
3.1 Basic Genome Information
The genomes of Providencia sneebia, Providencia rettgeri, Providencia alcalifaciens and
Providencia burhodogranariea were sequenced in this study and assembled into 14, 9, 15 and 8
contigs or scaffolds, respectively (Table 3.1, Figures 3.2-3.5). The sequenced isolates were
obtained from the hemolymph of wild Drosophila melanogaster and therefore will be referred to
collectively as Dmel isolates in this paper. The summed contig or scaffold lengths of these
assemblies vary from 4.5 Mb to 3.5 Mb, with P. burhodogranariea having the largest genome
and P. sneebia having the smallest (Table 3.1). Because we know the sizes of the P. sneebia and
P. rettgeri physical genomes from optical maps, we can discern that our P. sneebia assembly is
missing approximately 300 kb of sequence and our P. rettgeri assembly is missing
approximately 100 kb of sequences (Table 3.1). Based on the average gene size for each genome,
we estimate that our annotated gene sets are missing roughly 275 out of 3750 for P. sneebia and
107 genes out of 4650 total for P. rettgeri (Table 3.1). Thus, we estimate that we have
assembled approximately 93% of the P. sneebia coding genome and 98% of the P. rettgeri
coding genome. Both P. alcalifaciens and P. burhodogranariea were sequenced with paired-end
reads, resulting in scaffolds with sequence gaps of known sizes. These gaps can break up open
reading frames, resulting in the absence of some genes from our inferred annotations. Since we
did not optically map P. alcalifaciens or P. burhodogranariea, we do not know the precise sizes
of their physical genomes. Because of the small assembly gaps, our annotations bear the caveat
that a small number of genes may be inferred as absent when they are actually present in the
physical genome.
71

Table 3.1. Basic genomic information of all four D. melanogaster isolated Providencia.
Species Strain DSM1 Sequenced size2
Physical size3
# of contigs
or scaffolds
Average GC %
# of genes
Est. # of
missing genes4
Providencia sneebia Type 19967 chromosome 3.5 Mb 3.8 Mb 14 38.08 3482 275
pPSN1 10787 bp 10787 bp 1 33.50 12 0 pPSN2 7592 bp 7592 bp 1 35.05 12 0 pPSN3 4321 bp 4321 bp 1 31.50 4 0
Providencia rettgeri
Dmel1 - chromosome 4.2 Mb 4.3 Mb 9 40.20 4532 107
pPRET1 5567 bp 5567 bp 1 40.81 6 0 Providencia alcalifaciens
Dmel2 - chromosome 4.2 Mb unk 15 41.17 3900 unk
pPALC1 14114 bp 14114 bp 1 37.57 17 0 Providencia
burhodogranariea Type 19968 chromosome 4.5 Mb unk 8 38.23 3985 unk
1Strain number in DSM Culture Collection 2Sum of the contigs or scaffolds lengths 3Size of the physical chromosome as determined by optical maps. “unk” indicates unknown physical size. 4Estimated from the known length of sequence missing from these assemblies divided by the average gene length. “unk” indicates that the number of missing genes cannot be calculated due to an unknown physical size.
72
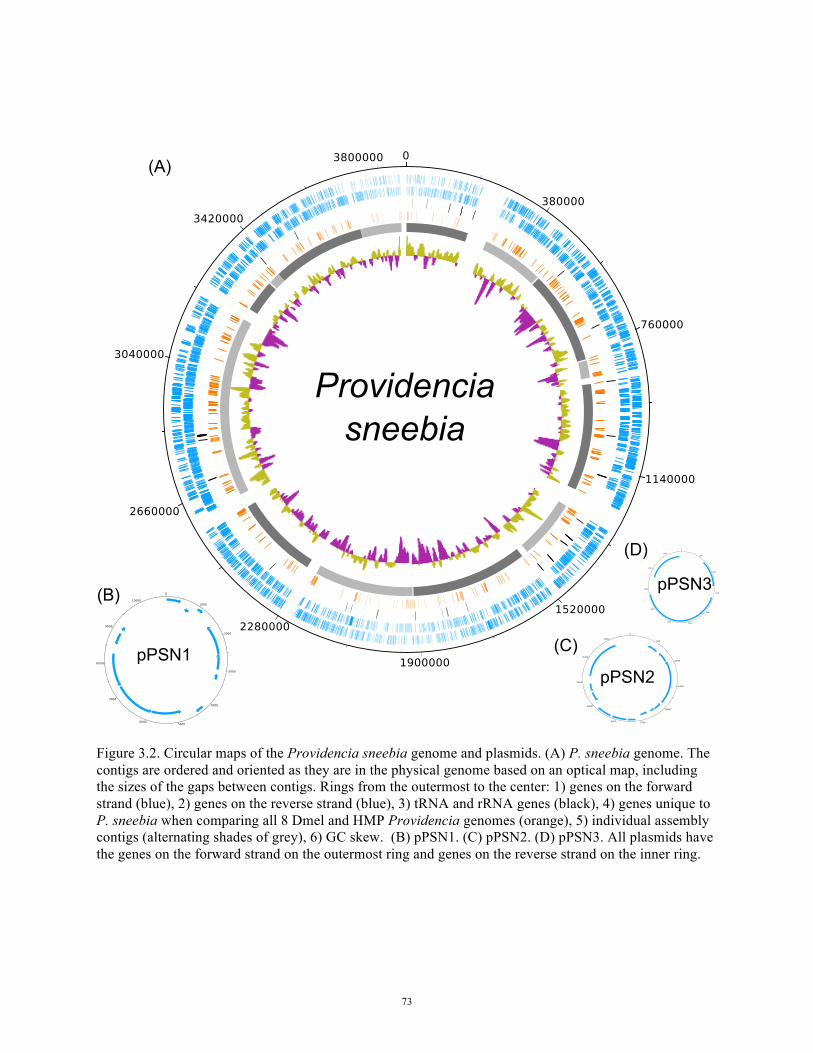
Figure 3.2. Circular maps of the Providencia sneebia genome and plasmids. (A) P. sneebia genome. The contigs are ordered and oriented as they are in the physical genome based on an optical map, including the sizes of the gaps between contigs. Rings from the outermost to the center: 1) genes on the forward strand (blue), 2) genes on the reverse strand (blue), 3) tRNA and rRNA genes (black), 4) genes unique to P. sneebia when comparing all 8 Dmel and HMP Providencia genomes (orange), 5) individual assembly contigs (alternating shades of grey), 6) GC skew. (B) pPSN1. (C) pPSN2. (D) pPSN3. All plasmids have the genes on the forward strand on the outermost ring and genes on the reverse strand on the inner ring.
73

Figure 3.3. Circular maps of the Providencia rettgeri genome and plasmid. (A) P. rettgeri genome. The contigs are ordered and oriented as they are in the physical genome based on an optical map, including the sizes of the gaps between contigs. Rings from the outermost to the center: 1) genes on the forward strand (red), 2) genes on the reverse strand (red), 3) tRNA and rRNA genes (black), 4) genes unique to P. rettgeri when comparing all 8 Dmel and HMP Providencia genomes (orange), 5) individual assembly contigs (alternating shades of grey), 6) GC skew. (B) pPRET1. The plasmid has the genes on the forward strand on the outermost ring and genes on the reverse strand on the inner ring.
74

Figure 3.4. Maps of the Providencia alcalifaciens genome and plasmid. (A) P. alcalifaciens genome. The contigs are ordered and oriented for maximum synteny with P. rettgeri. The contigs are not positioned in a complete circle because the order and orientation of the contigs are not empirically known. The size of the gaps between contigs is unknown. Rings from the outermost to the center: 1) genes on the forward strand (purple), 2) genes on the reverse strand (purple), 3) tRNA and rRNA genes (black), 4) genes unique to P. alcalifaciens when comparing all 8 Dmel and HMP Providencia genomes (orange), 5) individual contigs (alternating shades of grey), 6) GC skew. (B) pPALC1. The plasmid has the genes on the forward strand on the outermost ring and genes on the reverse strand on the inner ring.
75

Figure 3.5. Map of the Providencia burhodogranariea genome. The contigs are ordered and oriented for maximum synteny with P. rettgeri. The contigs are not positioned in a complete circle because the order and orientation of the contigs are not empirically known. The size of the gaps between contigs is unknown. Rings from the outermost to the center: 1) genes on the forward strand (yellow), 2) genes on the reverse strand (yellow), 3) tRNA and rRNA genes (black), 4) genes unique to P. burhodogranariea when comparing all 8 Dmel and HMP Providencia genomes (orange), 5) individual contigs (alternating shades of grey), 6) GC skew.
76

3.2 Plasmids
We found 3 plasmids in P. sneebia, 1 in P. rettgeri, 1 in P. alcalifaciens and none in P.
burhodogranariea (Table 3.1; Figures 3.2-3.5). We compared these plasmids to each other and
found them to have no similarity in gene content. We also checked whether any of these
plasmids were undetected in the sequencing reads of the Dmel isolates other than the one that
each plasmid was assembled from. We found that while some plasmid genes were present on the
chromosomes of other species, the complete plasmids were found only in the species from which
they were initially recovered. Four plasmids have been isolated and sequenced by other groups
studying other Providencia isolates [25–27], but we did not find any of these plasmids in the
sequencing reads of our isolates. None of our novel Providencia plasmids contain genes with
functional annotations that lead to a clear functional designation for the overall plasmid, such as
“virulence” or “antibiotic resistance.” Our findings indicate that plasmids found in Providencia
vary considerably in their identity, conservation, and probable functions.
3.3 Genomic Synteny
The optical maps of P. sneebia and P. rettgeri allowed us to order and orient the contigs
as they are found in the physical chromosome for those two assemblies. The contigs of P.
burhodogranariea and P. alcalifaciens were ordered and oriented so that they were as similar to
the P. rettgeri and P. sneebia genomic orientations as possible, assuming the most parsimonious
evolution of genome arrangements (Figure 3.6). It is in principle possible that any of the P.
burhodogranariea and P. alcalifaciens contigs could be inverted or rearranged relative to their
positions on our comparative syntenic plot, but only if the rearrangement breakpoints lie at
contig breakpoints. While there are many small rearrangements found among the genomes, there
77

Figure 3.6. Alignments of the protein translations of the whole genomes of all four Providencia species isolated from D. melanogaster. The contigs of P. sneebia and P. rettgeri were ordered and oriented as they are in the physical genome based on optical maps made of each genome. P. alcalifaciens and P. burhodogranariea contigs were ordered and oriented for maximum synteny with P. rettgeri, therefore assuming parsimony in the number of genomic arrangements. Similarity was calculated using promer function in MUMmer [21]. Red dots represent similar sequence in the same orientation in each genome pair while blue indicates that the similarity is in the opposite orientations in the genome pairs.
78

are only two large inversions apparent across the four species. Both inversions are in P. sneebia
relative to the other genomes (Figure 3.6). The ends of the largest P. sneebia inversion, which is
about 800 kb in length, fall within single contigs of both P. burhodogranariea and P.
alcalifaciens, supporting the hypothesis that the inversion is derived in and unique to P. sneebia.
3.4 Phylogeny
We determined an overall phylogenetic relationship from a concatenated alignment of the
single-copy orthologs shared by all four Dmel Providencia sequenced here, rooted with Proteus
mirabilis (Figure 3.7). This tree is based on 1689 single copy orthologs shared among these five
species. The phylogenetic tree indicates that P. sneebia and P. burhodogranariea share a
common ancestor before either of them share a common ancestor with the P. rettgeri and P.
alcalifaciens species pair (Figure 3.7). This is consistent with the phylogenetic relationships
proposed previously based on the 16S rRNA gene and five housekeeping genes [17].
3.5 Orthologs and Unique Genes
We wanted to know how much gene content is shared among the Dmel Providencia
isolates so we used a BLAST-based method to find all orthologous gene clusters. There are a
total of 3644 orthologous clusters containing between 10 and 2 genes, as well as one exceptional
cluster containing 20 fimbrial-related usher genes with at least 3 genes originating from each
genome. Fimbrial-related usher proteins chaperone other proteins to the bacterial cell surface to
form a proteinaceous extension involved in surface adhesion [44]. We found that 3293 genes are
present as single copies in each genome, or 90% of the total ortholog clusters. The majority of
these clusters, 1983, comprise the core genome of these Providencia isolates (Figure 3.8),
79

Figure 3.7. Phylogenetic relationships of all four Providencia species isolated from D. melanogaster and Proteus mirabilis. This phylogeny is constructed from a concatenation of 1689 orthologous genes shared by all five species and was inferred using maximum likelihood methods within the program RAxML [32]. The scale bar indicates number of substitutions per site. Each node of the tree is supported by a bootstrap value of 100. Above the line for each bacterial lineage is the number of inferred gene gains and losses on that lineage. Losses are preceded by (-) and gains by (+).
80
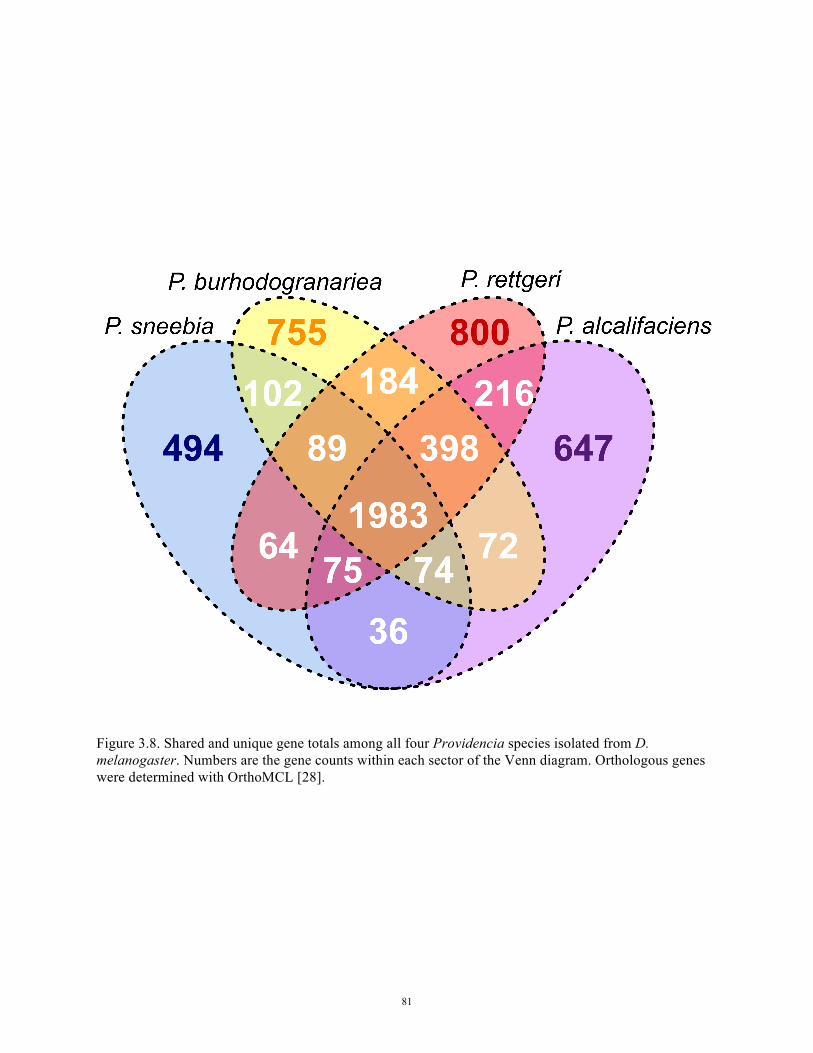
Figure 3.8. Shared and unique gene totals among all four Providencia species isolated from D. melanogaster. Numbers are the gene counts within each sector of the Venn diagram. Orthologous genes were determined with OrthoMCL [28].
81

meaning that the genes are shared as single-copy orthologs across all four sequenced species.
The core genome is 49-62% of the total genes in each genome, revealing that the species have a
substantially homogeneous gene content. The next largest group of orthologous clusters is that
which contains genes present in P. rettgeri, P. alcalifaciens, and P. burhodogranariea but absent
from P. sneebia (Figure 3.8). This is consistent with these three genomes each being almost one
megabase bigger than that of P. sneebia. Given that P. sneebia shares a common ancestor with P.
burhodogranariea before either shares a common ancestor with the more distantly related P.
rettgeri and P. alcalifaciens (Figure 3.7), the absence of these genes in P. sneebia appears to
reflect genome reduction in P. sneebia. To specifically examine putative gene loss, we
determined the number of orthologous clusters that were missing a gene from only 1 of the 4
genomes (Figure 3.7 and 3.8). While P. rettgeri, P. alcalifaciens, and P. burhodogranariea have
between 74 and 89 genes that are apparently lost in their lineages, P. sneebia appears to have
specifically lost 398 genes. As revealed in the analysis of genomic synteny above, differences in
gene number and genome sizes generally are the result of small duplications, deletions, or
insertions. In particular, the missing genes in P. sneebia do not result from large block deletions
but instead arise from many small deletions eliminating individual genes distributed around the
genome (Figure 3.6).
We found 137 orthologous clusters which contained paralogous duplications unique to a
single genome. The majority of these clusters contain genes that are related to mobile elements
or phages suggesting that there are families of transposons or phages that are specific to
individual species. Most other clusters of species-specific paralog groups were annotated as
hypothetical proteins.
82

We were able to determine genes unique to each genome by identifying those genes that
were not assigned to any orthologous cluster (Figure 3.7 and 3.8). The genomes varied in the
absolute number of unique genes, with the smallest genome, that of P. sneebia, having the
fewest. Despite their variation in number among the genomes, unique single-copy genes
represent 15-19% of their total genome content for each species.
The genes unique to each bacterium were tested for enrichment of gene ontology (GO)
terms compared to those genes found in either the Dmel Providencia core genome or the
individual whole genome from which the unique genes were drawn (Figure 3.9). GO terms
enriched among the genes unique to each species were often related to interactions with phage or
bacteria, including genes encoding phage lysozymes, bacteriocins, and restriction enzymes. This
strongly suggests that these Providencia have acquired or developed different ways to deal with
varied genome parasites and competitor organisms. There may also imply variation in the phage
or bacteria to which these Providencia are most often exposed.
Based on GO annotation, the genes unique to P. rettgeri are enriched for those involved
in rhamnose metabolic process compared to both the core and whole genome. While the
particular strain of P. rettgeri we sequenced has not been tested for its ability to metabolize
rhamnose, the type strain of P. rettgeri has been shown to metabolize this sugar while the same
strains of P. sneebia and P. burhodogranariea sequenced in this study were unable to [17]. The
type strain of P. alcalifaciens has also been tested for its ability to metabolize rhamnose, but the
data were ambiguous [17]. The collective data are suggestive that rhamnose metabolism may be
unique to P. rettgeri among these strains of Providencia, although previous work has shown that
not all strains of P. rettgeri are able to metabolize rhamnose [45].
83

Figure 3.9. GO terms enriched in the unique genes of each species compared to the full set of Providencia isolated from D. melanogaster. GO terms were assigned and calculation of enrichment was done using a Fisher’s Exact Test using Blast2GO [24]. GO terms have been collapsed to only the most specific child term when multiple terms described the same group of genes.
84

All four species have genes with the GO term “pilus” significantly overrepresented in
their unique genes compared to the core genome, although the absolute number of these genes
varies for each genome (Figure 3.9). Pili are protein structures that extend from the surface of
bacterial cells to allow the bacteria to adhere to substrates [44]. The majority of the unique genes
given the pilus GO term are annotated as fimbrial proteins, which are the proteins that constitute
the pilus structure [44]. The genic diversity indicates a high amount of variation in these fimbrial
proteins. Pilus related proteins are often antigenic, so this variation in pilus protein could be a
result of pressure to avoid host immune responses [46]. Alternatively, the distinction in fimbrial
proteins could be due to variation among the species in adherence to specific surfaces [46]. As
mentioned above, the largest orthologous gene cluster shared among the sequenced Providencia
consisted of fimbrial-related usher proteins. These observations in combination show
conservation of the genes which function to form the pilus but diversity of the genes encoding
the proteins of the physical pilus structure itself.
3.6 Recombination and Positive Selection
Positive selection and recombination are two primary forces in bacterial evolution.
Recombination rates have been found to vary widely in bacteria and it has been hypothesized
that generalist bacteria or those in the process of adapting to new environments have higher rates
of recombination [47]. These Providencia are closely related and were isolated from similar
environments, so it is possible that there would have been opportunity for recombination among
them. We examined 1937 orthologs in the core genome of the Dmel Providencia species for
recombination, which is slightly reduced from the total 1983 core genome orthologs shown in
Figure 3.8 due to the removal of comparatively poor sequence alignments (see Methods section
85

“2.8 Alignments of Orthologs”). Among the 1937 orthologs examined, 781 orthologous clusters
that showed evidence for recombination. The genes belonging to clusters exhibiting
recombination are evenly distributed around the physical genomes of each bacteria, and we do
not find evidence for hotspots of recombination.
We used the program PAML (Yang, 2007) to test for evidence of positive selection in the
Providencia core genome, excluding genes that showed evidence of recombination since these
violate the assumptions of the tests in PAML [48]. This left 1156 orthologous clusters in the core
genome shared by the four Dmel Providencia species isolates. We used PAML to compare the
likelihood of a model which does not allow for positive selection, termed model M8a, to a model
that does allow for selection at various sites along the gene, model M8 [39,40]. We found 21
genes that yielded nominal p-values of less than 0.05, indicating that the model allowing for
selection fit the data significantly better that the neutral model (Table 3.2). However, none of
these 21 genes remained significant after application of a FDR of 20% [38]. Our selection test is
extremely underpowered within Providencia given the small number of species examined and
their close phylogenetic relationship to one another. We considered running the same site model
tests on the four Dmel Providencia species plus Proteus mirabilis, but we there are too many
synonymous changes on the lineage leading to Proteus mirabilis for the tests to be conducted
appropriately. We present some genes that show nominal evidence for positive selection below,
but stress that the selection results are provisional and further investigation into the biological
function and adaptive significance of these genes is warranted.
One gene exhibiting evidence for positive selection is the TolC precursor (p = 0.003). The
TolC gene has also been found to be under positive selection in E. coli [49]. This gene encodes
an outer membrane protein that is part of a transporter system which transports toxins or
86
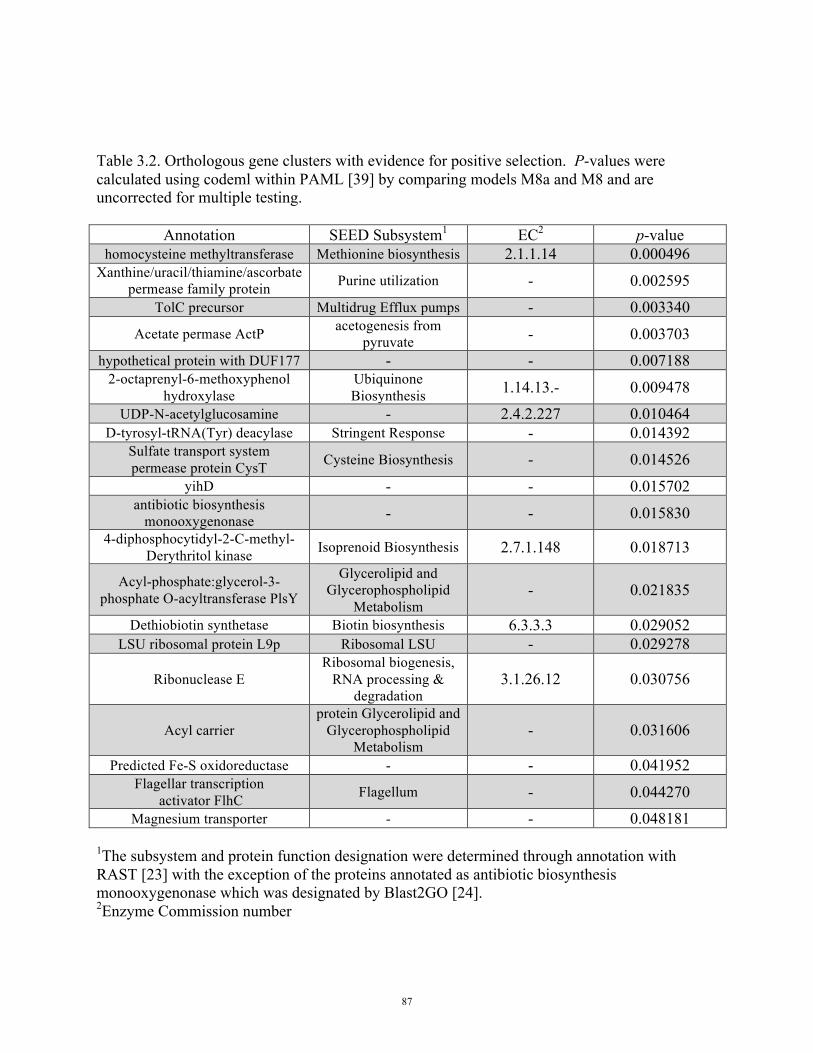
Table 3.2. Orthologous gene clusters with evidence for positive selection. P-values were calculated using codeml within PAML [39] by comparing models M8a and M8 and are uncorrected for multiple testing.
Annotation SEED Subsystem1 EC2 p-value homocysteine methyltransferase Methionine biosynthesis 2.1.1.14 0.000496
Xanthine/uracil/thiamine/ascorbate permease family protein Purine utilization - 0.002595
TolC precursor Multidrug Efflux pumps - 0.003340 Acetate permase ActP acetogenesis from
pyruvate - 0.003703 hypothetical protein with DUF177 - - 0.007188
2-octaprenyl-6-methoxyphenol hydroxylase
Ubiquinone Biosynthesis 1.14.13.- 0.009478
UDP-N-acetylglucosamine - 2.4.2.227 0.010464 D-tyrosyl-tRNA(Tyr) deacylase Stringent Response - 0.014392
Sulfate transport system permease protein CysT Cysteine Biosynthesis - 0.014526
yihD - - 0.015702 antibiotic biosynthesis
monooxygenonase - - 0.015830 4-diphosphocytidyl-2-C-methyl-
Derythritol kinase Isoprenoid Biosynthesis 2.7.1.148 0.018713
Acyl-phosphate:glycerol-3-phosphate O-acyltransferase PlsY
Glycerolipid and Glycerophospholipid
Metabolism - 0.021835
Dethiobiotin synthetase Biotin biosynthesis 6.3.3.3 0.029052 LSU ribosomal protein L9p Ribosomal LSU - 0.029278
Ribonuclease E Ribosomal biogenesis,
RNA processing & degradation
3.1.26.12 0.030756
Acyl carrier protein Glycerolipid and
Glycerophospholipid Metabolism
- 0.031606
Predicted Fe-S oxidoreductase - - 0.041952 Flagellar transcription
activator FlhC Flagellum - 0.044270 Magnesium transporter - - 0.048181
1The subsystem and protein function designation were determined through annotation with RAST [23] with the exception of the proteins annotated as antibiotic biosynthesis monooxygenonase which was designated by Blast2GO [24]. 2Enzyme Commission number
87

antibiotics out of the cell [50,51]. It is possible that different proteins or varying amounts of
proteins are transported by TolC in the various Providencia species, in which case selection may
act on TolC to optimize interaction with different partners or vary secretion amounts.
Two different orthologous gene clusters showing weaker signal for positive selection
were annotated as being involved in glycerolipid and glycerophospholipid metabolism (p = 0.022
and p = 0.032). This subsystem is involved in making lipids that are transported to the bacterial
cell surface. The signatures of positive selection suggest possible adaptation in lipid and protein
structures on the surface of these Providencia species.
We found the protein FlhC to also show weak evidence for positive selection (p = 0.044).
This protein forms a heterodimer with FlhD to become the master regulatory complex of
flagellar protein production, and these proteins have also been shown to regulate the expression
of many other genes, including virulence genes [52–54].
3.7 Similarity of Dmel Isolates to Providencia Isolates from the Human Gut
Four Providencia isolated from human feces have been sequenced as part of the Human
Microbiome Project [5]. These included isolates of P. rettgeri and P. alcalifaciens as well as
isolates of the species Providencia stuartii and Providencia rustigianii. These isolates will be
referred to as the HMP isolates, to distinguish them from the Dmel isolates sequenced in our
study.
We hypothesized that the four HMP isolates might have specialized genes to facilitate
living in the human gut while the Dmel isolates would have genes enabling infection of D.
melanogaster and other insects. To test this hypothesis, we extracted all orthologs of the eight
genomes, yielding 4926 total ortholog clusters. Only 177 orthologous clusters, 3.5% of the total,
88

contained no genes from any HMP isolates and were therefore specific to the Dmel isolates.
None of these contained genes found in all four Dmel isolates, meaning there are no genes that
are exclusive to and universal in these isolates. Similarly, only 354, or 7.2% of the total ortholog
clusters contain no genes from any Dmel isolate and therefore were exclusive to the HMP
isolates. The majority of the HMP-specific ortholog clusters, 235 clusters, only contain two
orthologous genes. Eleven of the HMP-specific ortholog clusters are found in all four of the
isolates. Eight of these are assigned annotations that relate to phage activity and are physically
co-localized in their respective genome. It is therefore unlikely that they are required for
colonization of the human gut per se, but instead they probably reflect the shared phage pressure
in the common environment. These isolates did not all originate from the same human,
suggesting that the relevant phage may be pervasive in human guts. These phage genes were
identified as belonging to Fels-2 in P. alcalifaciens HMP and the Myoviridae prophages PSP3 in
P. stuartii HMP, P. rettgeri HMP, and P. rustigianii HMP. These two prophages are closely
related to each other [55]. Of the 354 HMP isolate specific orthologs and paralogs, 69 of them
are found only in P. stuartii. Most of these, 47, are annotated as hypothetical proteins. The total
data indicate that there are no endogenous Providencia genes that are specific to and ubiquitous
in either isolation environment we examined, but we do find evidence that the bacteria are
exposed to different phages in the respective environments.
The core genome derived from all eight Providencia genome sequences contained 1925
genes, only very slightly fewer than the 1983 genes in the core genome of the Dmel Providencia
isolates. This gives us added certainty that the core genome of Providencia as a whole is highly
conserved.
89
The proportion of genes unique to any one of the HMP isolates is approximately the same
as the unique gene complement in the Dmel strains. Unique genes represent 9% to 17% of the
gene total for each of the isolates when all eight genomes are examined. Unsurprisingly, the
HMP isolates of P. alcalifaciens and P. rettgeri share genes with only the Dmel isolates of these
same species. Whereas 16% of the P. alcalifaciens Dmel genome consisted of unique genes
when the Dmel isolates were considered alone, that value drops to 9% when the HMP isolates
are also considered. The number of unique genes in P. rettgeri Dmel shows a similar decrease,
from 19% of the total genes when Dmel isolates are considered in isolation to 10% after
inclusion of the HMP isolates. However, these decreases in the count of unique genes are not
only due to the addition of another isolate of the same species. Of the 800 genes initially
considered unique to the Dmel isolate of P. rettgeri, 167 are found in the HMP isolates of P.
stuartii, P. alcalifaciens, or P. rustigianii. Half of the decrease in apparently unique genes in P.
alcalifaciens Dmel is due to orthologs in the HMP isolates of P. stuartii, P. rettgeri and P.
rustigianii.
The unique, single copy genes for each of the eight genomes were assigned GO terms and
then examined for GO term enrichment relative to either the whole genome or the core genome
of all eight sequenced Providencia (Figure 3.10). Both the Dmel isolate of P. burhodogranariea
and the HMP isolate of P. alcalifaciens had no GO terms enriched in their unique genes
compared to either their respective whole genomes or the core genome. This suggests that the
distinct genes acquired by these isolates have a wide variety of functions. There is also no shared
enrichment for GO terms among all isolates originating from the human gut or among all those
isolated from D. melanogaster, further emphasizing that there is no class of genes that tie the
isolates together based on isolation environment. P. rustigianii HMP’s unique genes also are
90

Figure 3.10. GO terms enriched in the unique genes of each species when comparing the isolates collected from D. melanogaster (Dmel) to the isolates from the Human Microbiome Project (HMP). GO terms were assigned and calculation of enrichment was done using a Fisher’s Exact Test using Blast2GO [24]. GO terms have been collapsed to only the most specific child term when multiple terms described the same group of genes. No GO terms were enriched in P. burhodogranariea Dmel or P. alcalifaciens HMP.
91

enriched in GO terms relating to the endoplasmic reticulum (ER) membrane compared to both
the core and P. rustigianii HMP whole genome (Figure 3.10). These proteins each have a
PGAP1-like domain, which is known to function in the ER, but since bacteria do not have an ER,
they are unlikely to be functioning the same way in P. rustigianii. Although this domain is found
in other bacteria, to our knowledge, no bacterial function has been determined for this domain.
GO categories related to transposons or transposition were enriched in several genomes,
suggesting that the genomes have unique transposable elements (Figure 3.10). Additionally, P.
rustigianii HMP unique genes have a number of GO terms related to viruses that are enriched
over the core and whole genome (Figure 3.10). These genes are present in multiple locations
throughout the genome and are either annotated as phage proteins or are surrounded by prophage
genes. This, again, emphasizes the variety of prophages and other mobile elements inserted in
these genomes.
As seen when considering the Dmel genomes alone, the HMP genomes are also enriched
for unique genes with the GO term “pilus” relative to the core genome (Figure 3.10). The
enrichment in the GO term “pilus” unexpectedly disappears from the Dmel isolates of P.
burhodogranariea and P. alcalifaciens after addition of the HMP isolates because some of the
genes with this GO term previously considered “unique” are additionally found in the HMP
isolates. P. sneebia and P. rettgeri retain enrichment of the pilus GO term as well as other GO
terms related to adhesion in their unique genes over the core genome.
3.8 Species Specific Genes
Two different isolates of both P. rettgeri and P. alcalifaciens have now been sequenced.
One isolate of each species was sequenced from infected wild D. melanogaster (Dmel) while the
92

other was isolated from human feces (HMP). There are 202 ortholog clusters that contain genes
found only in the Dmel and HMP isolates of P. rettgeri, with six clusters containing more than
two genes. The two isolates of P. alcalifaciens uniquely share 190 species-specific orthologous
clusters. Unfortunately, most of these species-specific genes are annotated as hypothetical
proteins so they do not lend any insight into biological distinction of these species from others in
the Providencia genus. As described above for the individual isolates, genes annotated with the
GO term “pilus” are enriched in genes specific to P. alcalifaciens relative to the Providencia
core genome, and P. rettgeri is enriched for pilus genes and genes involved in rhamnose
metabolic processes.
3.9 Type 3 Secretion Systems
A type 3 secretion system (T3SS) is a needle-like apparatus used by Gram-negative bacteria
for injecting effector proteins into host cells [56]. The genes encoding the proteins of the needle
machinery are physically clustered and may be acquired via horizontal gene transfer as a single
“pathogenicity island”. Transcription of the genes encoding the T3SS machinery and secretion of
the effector proteins is triggered by external signals indicating that the bacteria is in the infection
environment [57]. The functions of the translocated effector proteins vary greatly among
bacteria, and include toxins that kill the host cells and proteins that manipulate host cell
cytoskeletal activity or other cell biology to the advantage of the bacterium. Effector proteins are
not necessarily encoded for within the same pathogenicity island as the genes encoding the T3SS
needle apparatus, and may be acquired and evolve independently of the machinery [58].
All four Providencia sequenced in this study have at least one T3SS island (Figure 3.11A). P.
sneebia Dmel, P. alcalifaciens Dmel, and P. rettgeri Dmel all have a similar T3SS island, which
93

Figure 3.11. Similarity of Type 3 Secretion Systems (T3SS). (A) Alignment of the whole genomes of P. sneebia, P. rettgeri, P. alcalifaciens, and P. burhodogranariea with the locations of each T3SS marked by blue boxes. (B) Alignment of T3SS-1 and some surrounding genes in P. sneebia, P. rettgeri, P. alcalifaciens, and Proteus mirabilis. Since this island falls within the inversion in P. sneebia’s genome, the region is displayed as the reverse-complement for ease of viewing. (C) Alignment of T3SS-2 and some surrounding genes in P. sneebia and P. burhodogranariea. (D) Alignment of T3SS-1 and T3SS-2 and some surrounding genes in P. sneebia. Figures were made using EasyFig [35]. Lines connecting the sequence schematics indicate regions of similarity, with darker grey indicating greater similarity. Colored arrows indicate individual genes and their direction. The black boxes behind the genes indicate the approximate boundaries of the T3SS island based on gene annotation.
94

will be referred to as T3SS-1. These T3SS-1 islands are similar in sequence, gene content, gene
orientation, and ATPase homology (Figure 3.11B). It is likely that this island was acquired prior
to speciation of the sequenced Providencia as it is shared with Proteus mirabilis and the HMP
Providencia isolates (Figure 3.11 A and B) and is found in the same syntenic region in all three
Dmel genomes, although this position lies inside the P. sneebia inversion. The genomic region
surrounding the T3SS-1 island is much less conserved than the genes of the island itself. Even
though P. sneebia, P. alcalifaciens, and P. rettgeri all share this T3SS, these bacteria have been
shown to vary in virulence towards D. melanogaster [18]. Some work has been done to
characterize the T3SS-1 island of Proteus mirabilis during infection of the mouse ascending
urinary tract, but disrupting the function of the secretion machinery had no effect on the
bacteria’s ability to colonize the mouse [59].
There is a second T3SS island present in the P. sneebia genome that is also found in P.
burhodogranariea. We refer to this as T3SS-2. The T3SS-2 island is not found in any of the
Providencia HMP isolates. Although T3SS-2 is not syntenically conserved in its genomic
location between P. sneebia and P. burhodogranariea, the sequences and gene contents of the
islands from the two species are much similar to each other than they are to T3SS-1 of P.
sneebia, P. alcalifaciens, and P. rettgeri, or even than the respective T3SS-1 islands are to each
other (Figure 3.11). It would be equally parsimonious to conclude that the P. sneebia and P.
burhodogranariea genomes have separately acquired T3SS-2 islands or to infer a single
acquisition by their common ancestor followed by a subsequent relocation of the island in one of
the genomes.
The ATPases of T3SS-1 and T3SS-2 belong to different families. The T3SS-1 ATPase
belongs to the Inv-Mxi-Spa ATPase family, which generally functions in cell invasion [58]. The
95

ATPase of T3SS-2 belongs to the Ysc ATPase family, which is commonly found in extracellular
pathogens [58]. Since P. sneebia carries both T3SS islands, it might be capable of functioning as
both an extracellular pathogen and an intracellular one depending on infection context.
However, the ATPase of T3SS-1 in our sequenced P. sneebia isolate contains a premature stop
codon at codon 281 of the 420 codon gene, which likely abolishes the function of T3SS-1 in this
isolate. We confirmed this stop codon by PCR and Sanger sequencing. We additionally
sequenced the T3SS-1 ATPase from 8 additional isolates of P. sneebia originating from the
hemolymph of wild caught D. melanogaster and found that they all have this stop codon (data
not shown). While this does not mean all isolates of P. sneebia will have a stop codon in the
ATPase of T3SS-1, it does suggest that this ATPase does not need to be functional for P. sneebia
to cause an infection in D. melanogaster. None of the sequenced strains of P. sneebia, P.
rettgeri and P. alcalifaciens showed evidence for the ability to intracellularly replicate in D.
melanogaster cells in vitro, although P. alcalifaciens showed some evidence for being invasive
and P. rettgeri and P. sneebia had evidence for resisting phagocytosis [18]. While a T3SS may
be involved in these phenotypes for each species, it remains possible that these bacteria may
have different intracellular replication or invasive phenotypes in D. melanogaster in vivo or in
other hosts. Indeed, different strains of P. alcalifaciens have previously been shown to exhibit
invasion of vertebrate cells [60,61].
4. Conclusions
We sequenced and compared the draft genomes of four species of Providencia that were
all isolated from the hemolymph of wild caught D. melanogaster [17,18]. We found the core
genome of these isolates to be about 60% of the total coding content for each genome, even after
96

inclusion of four isolates of Providencia originating from human feces. We found no genes that
were specific to and universal in bacteria isolated either from D. melanogaster or from the
human gut. Approximately 15% of each genome sequence consisted of genes unique to that
isolate. These genes should explain variable phenotypes among the isolates, including metabolic
differences [17] and variation in virulence towards D. melanogaster [18]. We found that each of
these isolates has at least one type 3 secretion system. The unique genes of each genome are
enriched for genes with the “pilus” GO term, suggesting variation in substrates that the bacteria
adhere to. The T3SSs and the variety of adhesion molecules suggest that host cell contact is an
important part of the virulence mechanisms for these Providencia.
Acknowledgements We would like to thank Qi Sun for his help in assembling the genomes and finding orthologs,
Jacob Crawford for his help using BWA during assemblies, Shannon Hedtke for her assistance in
the phylogenetic analysis, Nathan Clark for his help with the positive selection analysis, and
Henk den Bakker for assistance in submitting the genomes to GenBank. We would also like to
thank Sarah Short, David Duneau, Jacob Crawford, Susan Rottschaefer, Rob Unckless and
Virginia Howick for helpful comments on the manuscripts and discussions.
References
1. Albert MJ, Alam K, Ansaruzzaman M, Islam MM, Rahman a S, et al. (1992) Pathogenesis of Providencia alcalifaciens-induced diarrhea. Infection and immunity 60: 5017–5024.
2. Sobreira M, Leal NC, Magalhães M, Guth BE, Almeida a M (2001) Molecular analysis of clinical isolates of Providencia alcalifaciens. Journal of medical microbiology 50: 29–34.
3. Yoh M, Matsuyama J, Ohnishi M, Takagi K, Miyagi H, et al. (2005) Importance of Providencia species as a major cause of travellers’ diarrhoea. Journal of medical microbiology 54: 1077–1082.
97

4. Sipahi OR, Bardak-Ozcem S, Ozgiray E, Aydemir S, Yurtseven T, et al. (2010) Meningitis due to Providencia stuartii. Journal of clinical microbiology 48: 4667–4668.
5. Peterson J, Garges S, Giovanni M, McInnes P, Wang L, et al. (2009) The NIH Human Microbiome Project. Genome research 19: 2317–2323.
6. Muller HE (1983) Providencia friedericiana, a New Species Isolated from Penguins. International journal of systematic bacteriology 33: 709–715.
7. Foti M, Giacopello C, Bottari T, Fisichella V, Rinaldo D, et al. (2009) Antibiotic Resistance of Gram Negatives isolates from loggerhead sea turtles (Caretta caretta) in the central Mediterranean Sea. Marine pollution bulletin 58: 1363–1366.
8. Interaminense J a, Nascimento DCO, Ventura RF, Batista JEC, Souza MMC, et al. (2010) Recovery and screening for antibiotic susceptibility of potential bacterial pathogens from the oral cavity of shark species involved in attacks on humans in Recife, Brazil. Journal of medical microbiology 59: 941–947.
9. Jackson TJ, Wang H, Nugent MJ, Griffin CT, Burnell AM, et al. (1995) Isolation of insect pathogenic bacteria, Providencia rettgeri, from Heterorhabditis spp. Journal of Applied Bacteriology: 237–244.
10. Jho Y-S, Park D-H, Lee J-H, Cha S-Y, Han JS (2011) Identification of bacteria from the oral cavity and cloaca of snakes imported from Vietnam. Laboratory animal research 27: 213–217.
11. Ahmad A, Broce A, Zurek L (2006) Evaluation of significance of bacteria in larval development of Cochliomyia macellaria (Diptera: Calliphoridae). Journal of medical entomology 43: 1129–1133.
12. Mramba F, Broce a, Zurek L (2006) Isolation of Enterobacter sakazakii from stable flies, Stomoxys calcitrans L. (Diptera: Muscidae). Journal of food protection 69: 671–673.
13. Kuzina LV, Peloquin JJ, Vacek DC, Miller TA (2001) Isolation and Identification of Bacteria Associated with Adult Laboratory Mexican Fruit Flies , Anastrepha ludens ( Diptera : Tephritidae ). Current Microbiology 42: 290 –294. doi:10.1007/s002840110219.
14. Gupta AK, Nayduch D, Verma P, Shah B, Ghate HV, et al. (2012) Phylogenetic characterization of bacteria in the gut of house flies (Musca domestica L.). FEMS microbiology ecology 79: 581–593.
15. Corby-Harris V, Pontaroli AC, Shimkets LJ, Bennetzen JL, Habel KE, et al. (2007) Geographical distribution and diversity of bacteria associated with natural populations of Drosophila melanogaster. Applied and environmental microbiology 73: 3470–3479.
16. Chandler JA, Lang JM, Bhatnagar S, Eisen J a, Kopp A (2011) Bacterial communities of diverse Drosophila species: ecological context of a host-microbe model system. PLoS genetics 7: e1002272.
98

17. Juneja P, Lazzaro BP (2009) Providencia sneebia sp. nov. and Providencia burhodogranariea sp. nov., isolated from wild Drosophila melanogaster. International journal of systematic and evolutionary microbiology 59: 1108–1111.
18. Galac MR, Lazzaro BP (2011) Comparative pathology of bacteria in the genus Providencia to a natural host, Drosophila melanogaster. Microbes and infection 13: 673–683.
19. Shendure J, Ji H (2008) Next-generation DNA sequencing. Nature biotechnology 26: 1135–1145.
20. Li H, Durbin R (2010) Fast and accurate long-read alignment with Burrows-Wheeler transform. Bioinformatics 26: 589–595.
21. Kurtz S, Phillippy A, Delcher AL, Smoot M, Shumway M, et al. (2004) Versatile and open software for comparing large genomes. Genome biology 5: R12.
22. Rozen S, Skaletsky H (2000) Primer3 on the WWW for general users and for biologist programmers. Methods Mol Biol 132: 365–386.
23. Aziz RK, Bartels D, Best AA, DeJongh M, Disz T, et al. (2008) The RAST Server: rapid annotations using subsystems technology. BMC genomics 9: 75.
24. Conesa A, Götz S, García-Gómez JM, Terol J, Talón M, et al. (2005) Blast2GO: a universal tool for annotation, visualization and analysis in functional genomics research. Bioinformatics 21: 3674–3676.
25. Guillard T, Cambau E, Neuwirth C, Nenninger T, Mbadi A, et al. (2012) Description of a 2,683-base-pair plasmid containing qnrD in two Providencia rettgeri isolates. Antimicrobial agents and chemotherapy 56: 565–568.
26. Mc Gann P, Hang J, Clifford RJ, Yang Y, Kwak YI, et al. (2012) Complete Sequence of a Novel 178-Kilobase Plasmid Carrying blaNDM-1 in a Providencia stuartii Strain Isolated in Afghanistan. Antimicrobial agents and chemotherapy 56: 1673–1679.
27. Revilla C, Garcillán-Barcia MP, Fernández-López R, Thomson NR, Sanders M, et al. (2008) Different pathways to acquiring resistance genes illustrated by the recent evolution of IncW plasmids. Antimicrobial agents and chemotherapy 52: 1472–1480.
28. Li L, Stoeckert CJ, Roos DS (2003) OrthoMCL: identification of ortholog groups for eukaryotic genomes. Genome research 13: 2178–2189.
29. Larkin M a, Blackshields G, Brown NP, Chenna R, McGettigan P a, et al. (2007) Clustal W and Clustal X version 2.0. Bioinformatics 23: 2947–2948.
30. Suyama M, Torrents D, Bork P (2006) PAL2NAL: robust conversion of protein sequence alignments into the corresponding codon alignments. Nucleic acids research 34: W609–12.
31. Kück P, Meusemann K (2010) FASconCAT: Convenient handling of data matrices. Molecular phylogenetics and evolution 56: 1115–1118.
99
32. Stamatakis A (2006) RAxML-VI-HPC: maximum likelihood-based phylogenetic analyses with thousands of taxa and mixed models. Bioinformatics 22: 2688–2690.
33. Darling AE, Mau B, Perna NT (2010) progressiveMauve: Multiple Genome Alignment with Gene Gain, Loss and Rearrangement. PLoS ONE 5: e11147.
34. Carver TJ, Rutherford KM, Berriman M, Rajandream M-A, Barrell BG, et al. (2005) ACT: the Artemis Comparison Tool. Bioinformatics 21: 3422–3423.
35. Sullivan MJ, Petty NK, Beatson S a (2011) Easyfig: a genome comparison visualizer. Bioinformatics 27: 1009–1010.
36. Sawyer S (1989) Statistical tests for detecting gene conversion. Molecular biology and evolution 6: 526–538.
37. Bruen TC, Philippe H, Bryant D (2006) A simple and robust statistical test for detecting the presence of recombination. Genetics 172: 2665–2681.
38. Storey JD, Tibshirani R (2003) Statistical significance for genomewide studies. Proceedings of the National Academy of Sciences of the United States of America 100: 9440–9445.
39. Yang Z (2007) PAML 4: phylogenetic analysis by maximum likelihood. Molecular biology and evolution 24: 1586–1591.
40. Swanson WJ, Nielsen R, Yang Q (2003) Pervasive adaptive evolution in mammalian fertilization proteins. Molecular biology and evolution 20: 18–20.
41. Soyer Y, Orsi RH, Rodriguez-Rivera LD, Sun Q, Wiedmann M (2009) Genome wide evolutionary analyses reveal serotype specific patterns of positive selection in selected Salmonella serotypes. BMC evolutionary biology 9: 264.
42. Orsi RH, Sun Q, Wiedmann M (2008) Genome-wide analyses reveal lineage specific contributions of positive selection and recombination to the evolution of Listeria monocytogenes. BMC evolutionary biology 8: 233.
43. Zhou Y, Liang Y, Lynch KH, Dennis JJ, Wishart DS (2011) PHAST: a fast phage search tool. Nucleic acids research 39: W347–52.
44. Kline K a, Dodson KW, Caparon MG, Hultgren SJ (2010) A tale of two pili: assembly and function of pili in bacteria. Trends in microbiology 18: 224–232.
45. Penner JL, Hinton N a, Hennessy J (1975) Biotypes of Proteus rettgeri. Journal of clinical microbiology 1: 136–142.
46. Gerlach RG, Hensel M (2007) Protein secretion systems and adhesins: the molecular armory of Gram-negative pathogens. International journal of medical microbiology : IJMM 297: 401–415.
47. Didelot X, Maiden MCJ (2010) Impact of recombination on bacterial evolution. Trends in microbiology 18: 315–322.
100

48. Anisimova M, Nielsen R, Yang Z (2003) Effect of recombination on the accuracy of the likelihood method for detecting positive selection at amino acid sites. Genetics 164: 1229–1236.
49. Petersen L, Bollback JP, Dimmic M, Hubisz M, Nielsen R (2007) Genes under positive selection in Escherichia coli. Genome research 17: 1336–1343.
50. Piddock LJV (2006) Multidrug-resistance efflux pumps - not just for resistance. Nature reviews Microbiology 4: 629–636.
51. Delepelaire P (2004) Type I secretion in gram-negative bacteria. Biochimica et biophysica acta 1694: 149–161.
52. McCarter LL (2006) Regulation of flagella. Current opinion in microbiology 9: 180–186.
53. Sule P, Horne SM, Logue CM, Prüss BM (2011) Regulation of cell division, biofilm formation, and virulence by FlhC in Escherichia coli O157:H7 grown on meat. Applied and environmental microbiology 77: 3653–3662.
54. Givaudan A, Lanois A (2000) flhDC, the Flagellar Master Operon of Xenorhabdus nematophilus: Requirement for Motility, Lipolysis, Extracellular Hemolysis, and Full Virulence in Insects. Journal of bacteriology 102: 107–115.
55. Lavigne R, Darius P, Summer EJ, Seto D, Mahadevan P, et al. (2009) Classification of Myoviridae bacteriophages using protein sequence similarity. BMC microbiology 9: 224.
56. Galán JE, Wolf-Watz H (2006) Protein delivery into eukaryotic cells by type III secretion machines. Nature 444: 567–573.
57. Francis MS, Wolf-Watz H, Forsberg A (2002) Regulation of type III secretion systems. Current opinion in microbiology 5: 166–172.
58. Troisfontaines P, Cornelis GR (2005) Type III secretion: more systems than you think. Physiology (Bethesda, Md) 20: 326–339.
59. Pearson MM, Mobley HLT (2007) The type III secretion system of Proteus mirabilis HI4320 does not contribute to virulence in the mouse model of ascending urinary tract infection. Journal of medical microbiology 56: 1277–1283.
60. Albert MJ, Ansaruzzaman M, Bhuiyan N a., Neogi PKB, Faruque a. SG (1995) Characteristics of invasion of HEp-2 cells by Providencia alcalifaciens. Journal of Medical Microbiology 42: 186–190.
61. Janda JM, Abbott SL, Woodward D, Khashe S (1998) Invasion of HEp-2 and other eukaryotic cell lines by Providenciae: further evidence supporting the role of Providencia alcalifaciens in bacterial gastroenteritis. Current microbiology 37: 159–165.
101

CHAPTER 4
CONCLUSION
102

This work establishes the basic differences in infection biology among multiple strains in
the bacterial genus Providencia that were isolated from infected wild Drosophila melanogaster.
Comparisons of several infection phenotypes of these Providencia gave insight into the possible
methods these bacteria are using to be virulent towards D. melanogaster [1]. The phenotypes I
measured created an infection profile for each strain and allowed me to determine that
Providencia sneebia differs from the general pattern seen with the other strains. Most of the
strains had a correlation between the phenotypes such that those that caused the most host
mortality were also the most prolific and induced the most antimicrobial peptide transcription by
the host. In contrast, P. sneebia causes death in about 90% of infected flies and replicates the
most out of the strains but induces a lower amount of antimicrobial peptides expression than the
less virulent strains. By coinfecting D. melanogaster with both P. sneebia and another strain
which causes less mortality but greater immune response transcription, I was able to conclude
that P. sneebia is able to actively avoid recognition by the fly immune system.
To determine the differences in genomic content of these Providencia strains, I
sequenced, assembled and compared the draft genomes of four of them [2]. I found these
genomes to have a large amount of homogeneity in gene content both among themselves and in
comparison with four other Providencia genomes sequenced as part of the Human Microbiome
Project. This suggests that additional Providencia strains and isolates will also be found to have a
sizable core similarity. Each genome also has a repertoire of unique genes that are enriched for
the pilus-related genes in each species. All sequenced Providencia genomes have a type 3
secretion system (T3SS) so their virulence differences towards D. melanogaster are not
explained by just the presence of this known virulence factor. The presence of T3SS and
103

differences in adhesion molecules leads to the hypothesis that these bacteria require contact with
host cells to be virulent, though each bacterium may be virulent towards different hosts.
There are still many unanswered questions about these particular host-pathogen
interactions. For example, the location of the bacteria in D. melanogaster during infection is
unknown. Knowing if the bacteria are located throughout the fly or if they colonize a specific
location would provide more insight into their virulence mechanisms, particularly for P. sneebia
and Providencia alcalifaciens as they both replicate to very high numbers during infection. The
protocol that I developed to insert DNA into the genome of Providencia rettgeri could be used to
insert GFP into the genome to then track the bacteria within the fly during infection [2].
Although this insertion protocol was unsuccessful with P. sneebia, it is possible that this protocol
may also work for Providencia burhodogranariea and P. alcalifaciens, as I did not attempt
genetic manipulations of these bacteria. The availability of the genome sequences allow for the
location of gene insertions to be chosen to minimize the effect on other genes [2]. Since
fluorescent bacteria can be seen through the fly cuticle and the observation of where the bacteria
are located is non-destructive, infection within a single fly can be tracked for the whole course of
infection [3]. I hypothesized in Chapter 2 that those flies that carry the largest bacterial burden
are those flies that succumb to the infection [1]. Although not precisely quantitative, this method
could be used to determine if those flies with the greatest amount of bacteria are in also those
that die from infection. The comparison of the multiple strains will continue to aid in the
determination of the infection biology of these strains with D. melanogaster.
Beyond just these specific host-pathogen pairs, the infection biology found with D.
melanogaster-Providencia may be applicable to other host-pathogen pairs. Bacteria often
horizontally transfer genes, particularly virulence related genes, therefore, any genes whose
104

function is identified in this system could be found in another pathogenic bacteria and be
relevant to other host-pathogen pairs [4]. These Providencia strains can also be used to study the
host side of the interaction, beyond just the transcriptional read out of the innate immune
response. The variability in virulence across these closely related strains can provide
comparisons to see how D. melanogaster responds to different pathogens.
References
1. Galac MR, Lazzaro BP (2011) Comparative pathology of bacteria in the genus Providencia to a natural host, Drosophila melanogaster. Microbes and infection 13: 673–683.
2. Galac MR (2012) Comparisons of bacteria from the genus Providencia isolated from wild Drosophila melanogaster. Cornell University, USA.
3. Elrod-Erickson M, Mishra S, Schneider D (2000) Interactions between the cellular and humoral immune responses. Current Biology 10: 781–784.
4. Gal-Mor O, Finlay BB (2006) Pathogenicity islands: a molecular toolbox for bacterial virulence. Cellular microbiology 8: 1707–1719.
105

APPENDIX
ATTEMPTED VERIFICATION OF
PUTATIVE VIRULENCE FACTORS
106

Abstract
Type 3 secretion systems (T3SS) have evolved to facilitate injection of bacterial proteins
into eukaryotic cells in order to manipulate the host for the bacterial pathogen’s benefit. Two
natural Drosophila melanogaster bacterial pathogens, Providencia sneebia and Providencia
rettgeri, both contain T3SSs but have different infection phenotypes in the fly. I sought to
generate mutant strains of both bacteria containing a deletion of a vital T3SS gene with the
anticipation of determining the role of the T3SSs for each bacteria during infections in D.
melanogaster. Although I was unable to complete the construction of these deletion mutants, I
outline here the methodological steps taken towards making these strains. I also discuss what I
hypothesize could have been the results from disabling the T3SS system and what the
implication would have been for T3SS involvement in P. sneebia or P. rettgeri infections.
107

1. Introduction
Type 3 Secretion Systems (T3SS) are a complex of proteins involved in virulence of
many different bacterial species, particularly in Gram-negative pathogens [1]. The T3SS proteins
assemble to form a needle-like apparatus used to breach host cell membranes to inject proteins
into the host cytosol. These injected proteins, called effector proteins, manipulate the host cell in
a variety of ways to the benefit of the infecting bacterium. The genes encoding the T3SS needle
apparatus proteins are located within a single operon, generating what is called a pathogenicity
island. This genomic structure of T3SS genes allows all of the genes to be transferred to other
bacteria through horizontal gene transfer. Effectors proteins can be contained within these
pathogenicity islands, but more often they are located elsewhere in the genome [1]. As these
islands contain many genes, it is not easy to delete all of them to implicate T3SS in virulence
phenotypes. The machinery can instead be disabled by deleting a protein essential to the
function of the needle, such as the ATPase that provides energy for secretion of the effector
proteins [2]. The construction of pathogenic bacteria without a functional T3SS can allow for the
dissection of how the T3SS is involved in the bacterial virulence.
I analyzed the infection pathology of four different species of the genus Providencia that
were isolated as natural bacterial pathogens of Drosophila melanogaster in this same host and
sequenced their genomes [3,4]. I found these bacteria to vary in their pathology during infection
in D. melanogaster [3]. In particular, Providencia sneebia is able to kill 90% of infected flies
within 48 hours while Providencia rettgeri only kills 40% of infected flies. I also found that P.
sneebia replicates to significantly higher numbers during infection than P. rettgeri but causes a
lower induction of D. melanogaster antimicrobial peptides [3]. By coinfecting flies with both of
108

these bacteria, I was able to conclude that the reason for P. sneebia’s lower immune induction is
that it avoids recognition by the immune system [3].
In analyzing the genomes of these Providencia I found two different T3SS. The first
one, T3SS-1, is found in 3 of the four species: P. sneebia, P. rettgeri and Providencia
alcalifaciens. It is most likely that this island was acquired prior to speciation and was lost from
the fourth species, Providencia burhodogranariea [4]. T3SS-1 is similar in all three species, as
well as in the closely related Proteus mirabilis, in protein sequence, gene content, and gene
order. Additionally, the island is found in similar genomic locations in all three Providencia [4].
The second T3SS, T3SS-2, is found in only P. sneebia and P. burhodogranariea. Although the
T3SS-2 island is found in different locations in the genomes those two bacteria, the T3SS-2
island in each bacteria is very similar in protein sequence, gene content, and gene order [4].
The P. sneebia T3SS-1 ATPase has a mutation that creates a stop codon at codon 281
middle of the 420-codon gene, which was verified by Sanger sequencing. This suggests that
T3SS-1 may not be functional in P. sneebia and therefore, further destruction of this ATPase
may have no effect on virulence. The ATPase is the only known essential gene of T3SS,
suggesting that P. sneebia lacks TTSS-1 function [2]. T3SS vary a lot in what triggers expression
of both the apparatus forming genes and the effector protein genes. These external triggers can
be things like temperature, contact with the host cell, environmental factors or a combination of
these [5–7]. It is unlikely that the apparatus for T3SS-1 and T3SS-2 are being expressed at the
same time. Therefore it is unlikely that the ATPase from T3SS-2 would be able to function with
the rest of the T3SS-1 machinery to compensate for the loss of T3SS-1 ATPase function.
Furthermore, the ATPases of T3SS-1 and T3SS-2 belong to different families which have been
suggested to function in different ways. The T3SS-1 is part of the Inv-Mxi-Spa ATPase family
109

which commonly functions in cell invasion, while T3SS-2 is part of the Ysc ATPase family and
is generally found in extracellular pathogens [1].
To gain insight into the functionality and involvement in virulence of the T3SS-2 and to
verify that T3SS-1 is nonfunctional in P. sneebia, I sought to make strains that contain an in-
frame deletion each ATPase. I also wanted to delete the ATPase present in the T3SS-1 island of
P. rettgeri to determine the effect of the loss of its T3SS-1 on its virulence. I designed primers to
create in-frame deletions of each ATPase. I intended to use suicide plasmids that would integrate
these in-frame deletions into each genome via homologous recombination. I next planned to use
negative selection to select for those bacteria that excised the plasmid from the genome. Those
that excised the plasmid would be screened by PCR to identify bacteria that had the in-frame
deletion instead of the reversion to the wild type configuration. After creating strains with the
deleted ATPase, I anticipated doing infections in wild type D. melanogaster to see how the loss
of each T3SS affected P. sneebia and P. rettgeri’s virulence by measuring host mortality,
bacterial load and host antimicrobial peptide expression after infection.
2. Methods and Materials
2.1 Bacterial strains
The type strain of P. sneebia (DSM 19967) and the Dmel1 strain of P. rettgeri were used
in this study [3,8]. The E. coli strain S17 was used during construction of the in-frame deletion
plasmids. All three strains were grown in LB at 37oC with shaking.
110

2.2 Suicide plasmid
To do a knock out by homologous recombination, a plasmid must be selected which is
unable to replicate within the bacterium. This ensures that descendent bacteria with the antibiotic
resistance or other selective marker associated with the plasmid have an integration of the
plasmid into the genome and are not maintaining the plasmid in the cytosol. I opted to use a
plasmid with a R6Kγ origin because these plasmids can only replicate in host bacteria with a
specific pi protein encoded by the pir gene [9]. To ensure that neither P. sneebia nor P. rettgeri
contain the pir gene, I created databases of all of the Roche/454 sequencing reads with BLAST+
(version 2.2.25) and used blastx to search for similarity to the pi protein [4]. I found no evidence
that P. sneebia or P. rettgeri have the pir gene. I choose the R6Kγ origin plasmid pLD55, which
has a locus with multiple restriction sites, an origin for transfer through conjugation, and genes
that allow for negative selection once integrated into the bacterial genome [9].
2.3 Creating the deletion
I designed 4 primers to create an in-frame deletion for each ATPase using the method of
crossover PCR as described in Link et al. 1997 (Figure A.1) [10]. This method first creates two
PCR products with complementary sequences at the 3’ end of one product (Product A in Figure
A.1) and the 5’ end of the other (Product B in Figure A.1) which allows them to overlap in a
second PCR resulting in the formation of one product to create the in-frame deletion (Figure A.1,
steps 1 and 2 in Figure A.2). Two of the primers, L1 and R2, were designed on either side of the
ATPase gene, placed equal distance from where the deletion will ultimately be (Figure A.1).
These primers included different restriction enzyme cut sites at their 5’ ends, XhoI or NotI. Two
internal primers, R1 and L2, were designed to create the in-frame deletion (Figure A.1). The
111

Figure A.1. Diagram of primer locations and steps in crossover PCR protocol.
112

Figure A.2. Flowchart of steps taken and planned for deletion of ATPases in P. sneebia and P. rettgeri. See Figure A.1 for reference of primer and product names.
113

right internal primer, R1, contained the last 57 bases at the 3’ end of the ATPase while the left
internal primer, L2, contained first 18 bases from 5’ end of the ATPase and the complement of
the 21 nucleotides of the 5’ end of the right internal primer, R1 (Figure A.1).
The deletion was created in a two-step crossover PCR process. The first round of PCRs
was done using genomic DNA for the template to create either side of the deletion with the pair
of internal and external primers, L1 with L2 to make Product A and R1 with R2 to make Product
B (Figure A.1, steps 1 in Figure A.2). The second PCR uses the products of the first PCR as
templates, Product A and Product B, with the outermost primers, L1 and R2 (Figure A.1, steps 1
in Figure A.2). The complimentary 21 bases at the 5’ ends of both internal primers allow the
products of the first PCR step to anneal into a single molecule that contains the in-frame deletion
and flanking sequence. See Table A.1 for sequences of primers used.
The first PCR step (step 1 in Figure A.2) was done using high fidelity iProof polymerase
(Bio-Rad) in 50 µl reaction with 300 ng of genomic DNA. The PCR cycles were: 1) 98oC for 30
seconds, 2) 98oC for 7 seconds, 3) appropriate annealing temperature for 20 seconds, 4) 72oC for
20 seconds, 5) repeat steps 2-4 for 30 cycles, 6) 72oC for seven minutes. Annealing temperatures
were determined using manufacturer’s suggested method (Table A.2). These products were then
gel purified using the E.Z.N.A Gel Extraction Kit (Omega). The second PCRs (step 2 in Figure
A.2), the crossover PCR, was done with a total volume of 100 µl divided into two separate tubes,
with approximately 87 ng of each of the products from the first round in each tube using iProof
polymerase. The same PCR cycles and purification methods were performed in a manner similar
to those of the first round.
114
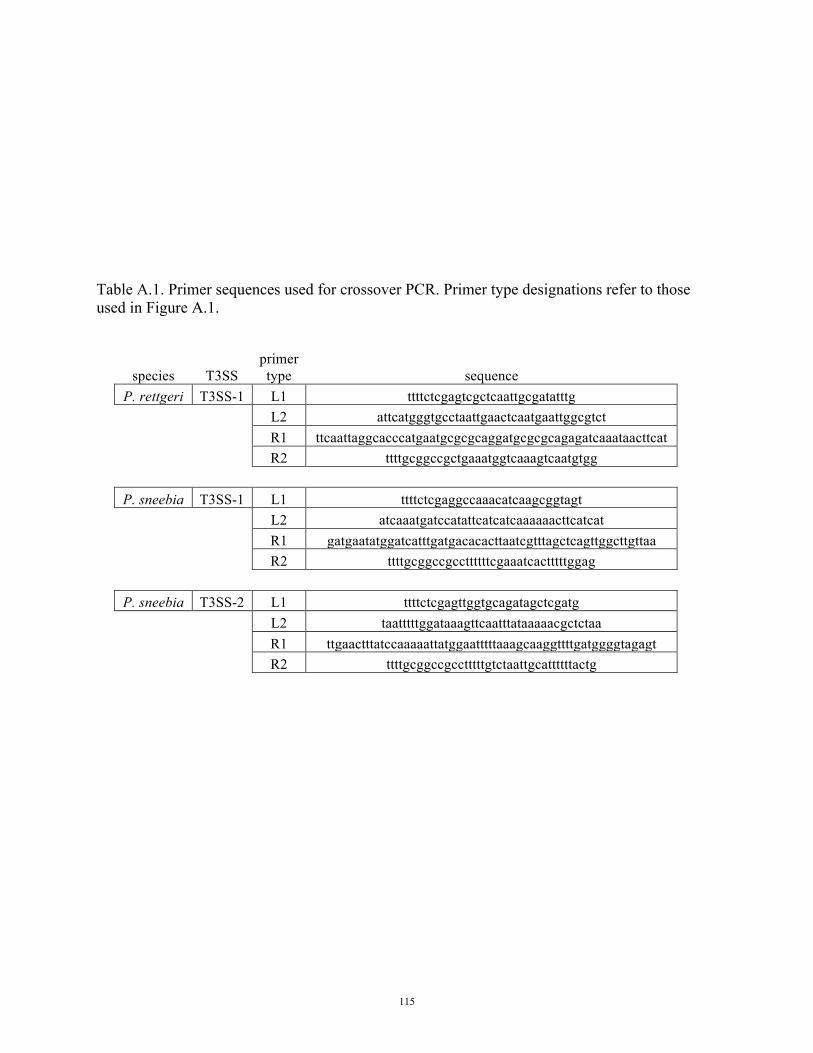
Table A.1. Primer sequences used for crossover PCR. Primer type designations refer to those used in Figure A.1.
species T3SS primer type sequence
P. rettgeri T3SS-1 L1 ttttctcgagtcgctcaattgcgatatttg
L2 attcatgggtgcctaattgaactcaatgaattggcgtct
R1 ttcaattaggcacccatgaatgcgcgcaggatgcgcgcagagatcaaataacttcat
R2 ttttgcggccgctgaaatggtcaaagtcaatgtgg
P. sneebia T3SS-1 L1 ttttctcgaggccaaacatcaagcggtagt
L2 atcaaatgatccatattcatcatcaaaaaacttcatcat
R1 gatgaatatggatcatttgatgacacacttaatcgtttagctcagttggcttgttaa
R2 ttttgcggccgccttttttcgaaatcactttttggag
P. sneebia T3SS-2 L1 ttttctcgagttggtgcagatagctcgatg
L2 taatttttggataaagttcaatttataaaaacgctctaa
R1 ttgaactttatccaaaaattatggaatttttaaagcaaggttttgatggggtagagt
R2 ttttgcggccgcctttttgtctaattgcattttttactg
115

Table A.2. Primer annealing temperatures used for crossover PCR. Primer type designations refer to those used in Figure A.1.
species T3SS primer type pair crossover PCR step annealing temp P. rettgeri T3SS-1 L1-L2 1 62oC
R1-R2 1 69oC
L1-R2 2 62oC
P. sneebia T3SS-1 L1-L2 1 61oC
R1-R2 1 68oC
L1-R2 2 66oC
P. sneebia T3SS-2 L1-L2 1 59oC
R1-R2 1 67oC
L1-R2 2 64oC
116

2.4 Restriction digestions of pLD55 and inserts
Digestions of gel purified products or plasmid pLD55 were performed with XhoI and
NotI at 37oC for 2 hours, followed by a 20 minute incubation at 65oC to inactivate the enzymes
(step 3 in Figure A.2). The products were then cleaned by gel purification from a fresh 1% TAE
gel. The inserts were extracted using Purelink gel extraction kit (Invitrogen). The digested
plasmid was extracted using SNAP gel purification kit (Invitrogen).
2.5 Ligations of inserts into pLD55
The purified digested products were run on a gel to help estimate the proper volumes to
add to the ligation reaction in order to achieve an approximately 3:1 insert to vector ratio (step 4
in Figure A.2). Ligations were done in a volume of 10 µl at 22oC for two hours.
2.6 Transformation of constructs into E. coli
E. coli strain S17 cells were made chemically competent. Bacteria were grown in 8 ml of
liquid LB until A600 was between 0.2 and 0.4, indicating the bacteria were in log phase. The
bacteria were then spun down in 5 separate tubes at 4oC at 7000 rpm for 10 minutes. The pellets
were washed with 333 µl of ice cold 0.1M CaCl2 and mixed into one tube. The E. coli were spun
and washed again before the addition of 12 µl DMSO. After a 15 minute incubation on ice, 11 µl
more of DMSO were added followed by another 15 minute incubation on ice. The bacteria were
aliquoted into pre-chilled 1.5 mL tubes before being snap frozen in a dry ice and ethanol bath.
For transformation, DNA was added to gently thawed competent cells. The cells were
then incubated on ice for at least 30 minutes, followed by a 30 second heat shock at 42oC, and
immediately returned to ice (step 5 in Figure A.2). Next 200 µl SOC media was added to the
117

bacteria and they were shaken at 37oC for one hour. The transformation was then plated on LB
media containing tetracycline and grown overnight at 37oC. The pLD55+deletion construct
provides resistance to tetracycline, allowing selection of transformants.
2.7 Conjugation with P. rettgeri
E. coli strain S17 carrying the plasmid with the pLD55+deletion construct and P. rettgeri
were grown separately in liquid LB, with antibiotics added to the E. coli containing medium to
maintain the plasmid, until log phase (step 6 in Figure A.2). Bacteria were then spun down and
washed twice with LB. The bacteria were gently pelleted a third time, and each pellet was
resuspended in 100 µl LB and then mixed into the same tube. The 200 µl of mixed bacteria were
pipetted onto a filter paper placed on top of a LB plate and incubated overnight at 37oC. The
filter paper was then removed and vortexed in a tube with 1 ml of liquid LB. Multiple 50 µl
aliquots of the bacteria-LB mixture were spread on LB plates that contained both tetracycline
and erythromycin. P. rettgeri strain Dmel1 is naturally resistant to erythromycin while E. coli
strain S17 is not so its presence inhibits growth of all E. coli donor strains. The tetracycline was
present to select for those P. rettgeri that obtained genomic integration of pLD55+deletion.
2.8 Electroporation with P. sneebia
I tried the conjugation protocol described above for P. rettgeri with P. sneebia but was
unsuccessful at getting the plasmids described here, or other plasmids, into P. sneebia with it.
Instead, I developed a method for transformation by electroporation for P. sneebia (step 6 in
Figure A.2). P. sneebia cells were made electrocompetent by growing at 37oC until mid log
phase 500 mL of SOC media spiked with 5 mL of an overnight culture. The bacteria were then
118

chilled on ice at 4oC for one hour followed by centrifugation at 6000 rpm for 20 minutes. The
bacteria were then washed in sterile cold water twice before being resuspended in 20 mL cold
20% glycerol and spun again at 8000 rpm for 10 minutes. The pellet was resuspended in 2 mL
20% glycerol and 30 µl was aliquoted into chilled 1.5 mL tubes to be flash frozen with an
ethanol and dry ice bath. Electroporation was successful after adding around 100 ng of plasmid
DNA to an electrocompetent P. sneebia aliquot and shocking the cells at 1.8 kV. After shocking,
the bacteria were grown for an hour at 37oC in 1 ml SOC media before being plated on selective
medium. This electroporation protocol was successful in getting the pEGFP plasmid (Clontech)
into P. sneebia but not either of the plasmids designed here for creating a deletion of each T3SS
ATPase.
I tried to an alternative protocol to make electrocompetent cells but this was also
unsuccessful. In this protocol 2 ml of overnight P. sneebia culture were spun for 2 minutes at
8000 g at room temp. The cells were then washed in 2 ml of sterile 300 mM sucrose before being
spun again. Cells were washed with 300 mM sucrose and pelleted again before being
resuspended in 200 µl of 300 mM sucrose and placed on ice to await addition of DNA and
electroporation.
2.9 Selecting and screening for the ATPase deletion
After transforming P. rettgeri and P. sneebia with the ATPase-deletion plasmid and
selecting for genomic integration, I intended to cause the plasmid to excise from the genome and
then screen for the in-frame deletion (steps 7 and 8 in Figure A.2). Bacteria with
pLD55+deletion genomic integration would be grown on selective media containing fusaric acid
which kills bacteria possessing the tetAR genes present on pLD55, therefore selecting for
119

survival of those isolates that successfully excised the plasmid from their genome [11,12].
Approximately half of the surviving bacteria would have the ATPase deletion construct, while
the other half would have reverted back to wild type, depending on which way the plasmid is
excised from the genome. I planned screen isolates by PCR, using the outside most L1 and R2
primers, expecting a 1.5 kb product for the wild type bacteria compared to an 500 bp product in
bacteria that have sustained the deletion (Figure A.1). After PCR verification of the deletion of
the ATPase, I intended use Sanger sequencing methods to sequence the region around and
including the deletion to verify that an in-frame deletion had been created.
2.10 Infections with mutants in D. melanogaster
Infections of D. melanogaster with the ATPase-deleted bacteria would be performed as
previously described [3]. The phenotypes of mortality from infection, amount of bacterial
replication during infection, and the antimicrobial peptide expression by the fly during infection
would be measured.
3. Results
I was able to create the plasmids containing an in-frame deletion with flanking regions of
each T3SS ATPase on the pLD55 backbone. Using conjugation, I was able to insert the
appropriate plasmid into the genome of P. rettgeri. Although I made several attempts to get the
applicable plasmids into P. sneebia by both conjugation and multiple electroporation protocols, I
was never successful at achieving genomic insertion. As I was unable to get the deletion
construct into the genome of P. sneebia, I was unable to create a strain with either T3SS ATPase
deleted to test the involvement of T3SS in P. sneebia virulence. I did not continue on with the
120

subsequent steps of creating the in-frame deletion for P. rettgeri as my main interest was in
determining the role T3SS in P. sneebia’s virulence and P. rettgeri was being constructed as a
comparison.
4. Discussion
The most likely explanation for why the P. sneebia electroporation protocol worked with
the pEGFP plasmid but not with the plasmids created here for deleting each T3SS ATPase is that
maintenance of pEGFP did not require genomic integration. It is possible that the plasmid did get
within P. sneebia cells but was not integrated into the genome, and since the suicide plasmids
were unable to replicate, no transformants were established. It is possible that a longer period of
growth after electroporation prior to being plated on selective media could allow for genomic
integration to happen. There could also be other barriers in P. sneebia to successfully integrating
DNA into the genome, which would be harder to surmount.
Had I been successful in creating the T3SS ATPase deletions, I had some hypotheses as
to the phenotypes that I would have seen during fly infections with these mutant bacteria. I
hypothesize that deleting the ATPase from T3SS-1 in P. sneebia would have no effect on
infection phenotypes since the endogenous gene already carries a premature stop codon. But I
predict that deleting the ATPase in T3SS-2 would decrease the amount of D. melanogaster host
mortality seen from infection. I also hypothesize that there would be a slight reduction in P.
rettgeri induced mortality in D. melanogaster with the inhibition of proper T3SS-1 function. I
think that both bacteria are using T3SS, T3SS-1 in P. rettgeri and T3SS-2 in P. sneebia, in their
virulence towards D. melanogaster and that the difference seen in their infection phenotypes
results from different effector proteins or from the presence of non-T3SS related proteins. The
121

idea that each bacteria is using their T3SSs in very different ways is supported by the varied
functions that are suggested based on the different ATPase families each belong to. It is most
likely that T3SS-2 is functioning extracellularly while T3SS-1 is functioning to get the bacteria
within the host cells. Although this suggests that P. rettgeri may be an intracellular pathogen, I
did not find that P. rettgeri has the ability to replicate within D. melanogaster cells [3]. This may
be because the P. rettgeri’s T3SS-1 is not used to be an intracellular pathogen of D.
melanogaster or the proper signal was not present in the experimental setup as the transcription
of T3SS apparatuses or secretion of certain effector proteins can be dependent on specific
external triggers [5].
Acknowledgements
I would like to thank Barbara Bowen for help with cloning and both Anthony Hay and
Joe Peters for the gifts of bacteria stocks.
References
1. Troisfontaines P, Cornelis GR (2005) Type III secretion: more systems than you think. Physiology (Bethesda, Md) 20: 326–339.
2. Cornelis GR (2010) The type III secretion injectisome, a complex nanomachine for intracellular “toxin” delivery. Biological chemistry 391: 745–751.
3. Galac MR, Lazzaro BP (2011) Comparative pathology of bacteria in the genus Providencia to a natural host, Drosophila melanogaster. Microbes and infection 13: 673–683.
4. Galac MR (2012) Comparisons of bacteria from the genus Providencia isolated from wild Drosophila melanogaster. Cornell University, USA.
122

5. Francis MS, Wolf-Watz H, Forsberg A (2002) Regulation of type III secretion systems. Current opinion in microbiology 5: 166–172.
6. Brutinel ED, Yahr TL (2008) Control of gene expression by type III secretory activity. Current opinion in microbiology 11: 128–133.
7. Diaz MR, King JM, Yahr TL (2011) Intrinsic and Extrinsic Regulation of Type III Secretion Gene Expression in Pseudomonas aeruginosa. Frontiers in microbiology 2: 89.
8. Juneja P, Lazzaro BP (2009) Providencia sneebia sp. nov. and Providencia burhodogranariea sp. nov., isolated from wild Drosophila melanogaster. International journal of systematic and evolutionary microbiology 59: 1108–1111.
9. Metcalf WW, Jiang W, Daniels LL, Kim S-K, Haldimann A, et al. (1996) Conditionally Replicative and Conjugative Plasmids Carrying lacZa for Cloning, Mutagenesis, and Allele Replacement in Bacteria. Plasmid 13: 1–13.
10. Link AJ, Phillips D, Church GM (1997) Methods for generating precise deletions and insertions in the genome of wild-type Escherichia coli: application to open reading frame characterization. Journal of bacteriology 179: 6228–6237.
11. Bochner BR, Huang HC, Schieven GL, Ames BN (1980) Positive selection for loss of tetracycline resistance. Journal of bacteriology 143: 926–933.
12. Maloy SR, Nunn WD (1981) Selection for loss of tetracycline resistance by Escherichia coli. Journal of bacteriology 145: 1110–1111.
123