Monte Carlo Simulation for the Structure of Polyolefins Made with Two Metallocene Catalysts in a...
12
Monte Carlo Simulation for the Structure of Polyolefins Made with Two Metallocene Catalysts in a Batch Reactor Nathanael J. Inkson, Chinmay Das, and Daniel J. Read* School of Mathematics, UniVersity of Leeds, Leeds, LS2 9JT, U.K. ReceiVed March 23, 2006; ReVised Manuscript ReceiVed May 10, 2006 ABSTRACT: The synthesis of polyolefins with two metallocene catalysts is explored via a simple Monte Carlo simulation in the two cases of a batch and a semibatch reactor. The algorithm we develop can be applied, in principle, to an arbitrary number of catalysts with different propensities toward the formation of long chain branches. We compare our model to an experimental two-catalyst system, in which one of the catalysts makes only linear chains and the ratio of the two catalysts is varied, to synthesize a series of different molar mass resins. Results from our simulations show good agreement with experimentally measured molecular weight distributions, the ratio of unsaturated to saturated chain ends (found by 13 C NMR) and the number of branches per 10000C. We also examine the effect on the amount of branching when molecular hydrogen gas is added to the system to act as a chain transfer agent. 1. Introduction Metallocene-catalyzed polyolefins are of considerable indus- trial interest due to the amount of control over the molecular weight and branching distribution that they bring. It is well- known that small amounts of branching can have a considerable effect on the rheology and hence the processability of polymers. Constrained geometry catalysts (CGCs) and other metallocene catalysts have been widely used to produce polyethylene with long chain branches (LCB). 1,2 LCB formation has been observed in solution, gas, and slurry reactors. The generally accepted mechanism of branch formation is that chains terminated with unsaturated (usually vinyl) groups can be incorporated by the CGC into a growing chain in the place of an ethylene (ethene) molecule, creating a branch. These vinyl-terminated chains are known as macromonomers and can be formed at the catalyst site via -hydride elimination or catalyst transfer to an ethylene molecule. Single site metallocene-catalyzed linear polyolefins typically have molecular weight distributions with a value of M w /M N of approximately 2.0. This tends to make the polymer suffer flow instabilities under processing conditions. A second catalyst can broaden the molecular weight distribution, since chains formed at the second site will typically have a different average molar mass. A common strategy 3-5 is for the second catalyst to form only linear chains, but with a high propensity for the formation of macromonomers: this can potentially increase the amount of branching. The choice of the molecular weight of the mac- romonomers being made by each catalyst is crucial to determine the rheological properties as the presence of a few long arms exponentially increases relaxation times of branched polymer melts. 6 Theoretical methods for determining the branching distribution and chain connectivity are useful to aid the control of such reactions, and they are essential to the subsequent prediction of the rheology of dual metallocene-catalyzed poly- olefins. The statistics of metallocene-catalyzed polymers has been extensively studied in the case of the idealized continuous stirred tank reactor (CSTR) at steady state. Soares and Hamilec studied single site metallocene-catalyzed polymers and derived analyti- cal expressions for molecular weight and long chain branching distributions. 7-9 This work was extended to characterize the branching architecture in terms of priority and seniority, statistical parameters relevant to rheological behavior. 10 Monte Carlo simulation, at the level of the monomer, has been used to determine detailed structure for single site metallocenes. 3,11 The synthesis of polyolefins with two metallocene catalysts in CSTR conditions has been studied by both Monte Carlo simulation at the monomer level 4,12,13 and analytically. 13-15 The combination of these two methods allows a full description of the distribution of molecular architectures in this idealized reaction situation. It is often the case, however, that lab-scale and pilot polymerizations are necessarily performed under batch or semibatch conditions. It is thus useful to be able to make predictions of molecular parameters under these conditions, both for the laboratory determination of catalyst reaction rate constants and for determining appropriate operating conditions to make new and potentially useful resins. It is also important to introduce new methods that have potential for application to reactors which cannot be classified according to the standard definition of a CSTR, such as reactors with stagnant zones, or temperature and concentration heterogeneities. For batch and semibatch reactors, some analytical results for averaged quantities such as number-average molecular weight and branching density exist. 16 Iedema and Hoefsloot 17 proposed a scheme based on numerical solution of population balance equations to predict molecular weight distributions and mean branching levels. Neither of these approaches is able to give direct information on the topological connectivity of the chains formed. In this paper, we describe a Monte Carlo algorithm for generating a statistical sample of molecular architectures. The algorithm is a modification of the “random sampling technique”, described by Tobita, 18 and applied by him to free- radical polymerization to form low-density polyethylene 19,20 and poly(vinyl acetate). 21,22 In particular, our simulation method for long-chain branching via terminal double bond incorporation is equivalent to that used by Tobita for vinyl acetate polymer- ization. 21,22 In common with Tobita’s algorithm, we distinguish the direction in which segments in the molecule were grown (termed “downstream” by Read and McLeish 10 ) from the opposite direction (“upstream”). This distinction is necessary when evaluating the statistics of the molecular shape. Our algorithm differs most strongly from those of Tobita 18-22 in that 10.1021/ma060654d CCC: $33.50 © xxxx American Chemical Society PAGE EST: 11.3 Published on Web 06/10/2006
Transcript of Monte Carlo Simulation for the Structure of Polyolefins Made with Two Metallocene Catalysts in a...
Monte Carlo Simulation for the Structure of Polyolefins Made withTwo Metallocene Catalysts in a Batch Reactor
Nathanael J. Inkson, Chinmay Das, and Daniel J. Read*
School of Mathematics, UniVersity of Leeds, Leeds, LS2 9JT, U.K.
ReceiVed March 23, 2006; ReVised Manuscript ReceiVed May 10, 2006
ABSTRACT: The synthesis of polyolefins with two metallocene catalysts is explored via a simple Monte Carlosimulation in the two cases of a batch and a semibatch reactor. The algorithm we develop can be applied, inprinciple, to an arbitrary number of catalysts with different propensities toward the formation of long chain branches.We compare our model to an experimental two-catalyst system, in which one of the catalysts makes only linearchains and the ratio of the two catalysts is varied, to synthesize a series of different molar mass resins. Resultsfrom our simulations show good agreement with experimentally measured molecular weight distributions, theratio of unsaturated to saturated chain ends (found by13C NMR) and the number of branches per 10000C. Wealso examine the effect on the amount of branching when molecular hydrogen gas is added to the system to actas a chain transfer agent.
1. Introduction
Metallocene-catalyzed polyolefins are of considerable indus-trial interest due to the amount of control over the molecularweight and branching distribution that they bring. It is well-known that small amounts of branching can have a considerableeffect on the rheology and hence the processability of polymers.Constrained geometry catalysts (CGCs) and other metallocenecatalysts have been widely used to produce polyethylene withlong chain branches (LCB).1,2 LCB formation has been observedin solution, gas, and slurry reactors. The generally acceptedmechanism of branch formation is that chains terminated withunsaturated (usually vinyl) groups can be incorporated by theCGC into a growing chain in the place of an ethylene (ethene)molecule, creating a branch. These vinyl-terminated chains areknown as macromonomers and can be formed at the catalystsite viaâ-hydride elimination or catalyst transfer to an ethylenemolecule.
Single site metallocene-catalyzed linear polyolefins typicallyhave molecular weight distributions with a value ofMw/MN ofapproximately 2.0. This tends to make the polymer suffer flowinstabilities under processing conditions. A second catalyst canbroaden the molecular weight distribution, since chains formedat the second site will typically have a different average molarmass. A common strategy3-5 is for the second catalyst to formonly linear chains, but with a high propensity for the formationof macromonomers: this can potentially increase the amountof branching. The choice of the molecular weight of the mac-romonomers being made by each catalyst is crucial to determinethe rheological properties as the presence of a few long armsexponentially increases relaxation times of branched polymermelts.6 Theoretical methods for determining the branchingdistribution and chain connectivity are useful to aid the controlof such reactions, and they are essential to the subsequentprediction of the rheology of dual metallocene-catalyzed poly-olefins.
The statistics of metallocene-catalyzed polymers has beenextensively studied in the case of the idealized continuous stirredtank reactor (CSTR) at steady state. Soares and Hamilec studiedsingle site metallocene-catalyzed polymers and derived analyti-cal expressions for molecular weight and long chain branchingdistributions.7-9 This work was extended to characterize the
branching architecture in terms of priority and seniority,statistical parameters relevant to rheological behavior.10 MonteCarlo simulation, at the level of the monomer, has been usedto determine detailed structure for single site metallocenes.3,11
The synthesis of polyolefins with two metallocene catalysts inCSTR conditions has been studied by both Monte Carlosimulation at the monomer level4,12,13and analytically.13-15 Thecombination of these two methods allows a full description ofthe distribution of molecular architectures in this idealizedreaction situation. It is often the case, however, that lab-scaleand pilot polymerizations are necessarily performed under batchor semibatch conditions. It is thus useful to be able to makepredictions of molecular parameters under these conditions, bothfor the laboratory determination of catalyst reaction rateconstants and for determining appropriate operating conditionsto make new and potentially useful resins. It is also importantto introduce new methods that have potential for application toreactors which cannot be classified according to the standarddefinition of a CSTR, such as reactors with stagnant zones, ortemperature and concentration heterogeneities.
For batch and semibatch reactors, some analytical results foraveraged quantities such as number-average molecular weightand branching density exist.16 Iedema and Hoefsloot17 proposeda scheme based on numerical solution of population balanceequations to predict molecular weight distributions and meanbranching levels. Neither of these approaches is able to givedirect information on the topological connectivity of the chainsformed. In this paper, we describe a Monte Carlo algorithm forgenerating a statistical sample of molecular architectures.
The algorithm is a modification of the “random samplingtechnique”, described by Tobita,18 and applied by him to free-radical polymerization to form low-density polyethylene19,20andpoly(vinyl acetate).21,22In particular, our simulation method forlong-chain branching via terminal double bond incorporationis equivalent to that used by Tobita for vinyl acetate polymer-ization.21,22In common with Tobita’s algorithm, we distinguishthe direction in which segments in the molecule were grown(termed “downstream” by Read and McLeish10) from theopposite direction (“upstream”). This distinction is necessarywhen evaluating the statistics of the molecular shape. Ouralgorithm differs most strongly from those of Tobita18-22 in that
10.1021/ma060654d CCC: $33.50 © xxxx American Chemical SocietyPAGE EST: 11.3Published on Web 06/10/2006
we do not assume our linear “primary chains” are created in-stantaneously in the reactor. Instead, we allow for the possibilitythat reactor conditions might vary during the finite time ofcreation of a single primary chain, giving rise to (for example)variations in branching density along it (see section 5).
Our algorithm differs from those commonly used for metal-locene systems,3,11-13 in that it generates molecular structureson a segment-by-segment rather than a monomer-by-monomerbasis (although ref 11 does both), and in that it does not requirethe prior generation of a pool of sample “macromonomers” forincorporation into the current chain. It does this by making useof analytically derivable results at the segment level, payingparticular attention to the direction of polymer growth. Thismeans that the algorithm is orders of magnitude faster thanmonomer-based calculations and requires significantly lowermemory because storage of a macromonomer pool is redundant,and there is no “start up time” to create representative mac-romonomers. Although we describe this algorithm for the batchand semibatch cases, a similar approach is applicable for theCSTR reaction and is described in ref 23 for the case of a singlecatalyst.
In what follows, we first present the details of the reactionwe consider, and analytical expressions for the overall concen-trations of various species in the reactor. We then present ananalysis of a number of important statistics at the segment level,which will be used in our subsequent description of the MonteCarlo algorithm itself. We then compare the results of this modelto published experimental data for a lab-scale synthesis of adual catalyst polymer, in which the ratio of the two catalysts issystematically varied.4,24 Specifically, we compare to theexperimentally measured molecular weight distributions, theratio of unsaturated to saturated chain ends and the number ofbranches per 10000C. Finally, we analyze the structuresgenerated in terms of their seniority and priority statistics.
2. Reaction Chemistry
Our starting point is the polymerization reaction kinetics asdescribed by Soares14 but used throughout the relevant literature:3-5,7-17
1. Initiation
2. Monomer addition
3. Chain transfer to form a dead chain with unsaturated end
4. Chain transfer to form a dead chain with saturated end
5. Macromonomer (LCB) incorporation
These reactions are written in terms of the total numbers ofeach object in the reactor (we deliberately avoid distinguishingbetween chains which possess different molecular weights ornumber of branches, as one would for a full population-balance
approach). The first two reactions represent initiation and growthof a polymer chain, where M is a monomer, Ci is an active butunattached catalyst of type i, and Pi is a living chain growingat a site of type i. As the catalysis proceeds the chain remainsattached to the catalyst. In the third reaction the chain detachesfrom the catalyst leaving the chain terminated with a doublebond, i.e., a macromonomer Di
d. This process of double bondtermination occurs byâ-hydride elimination or by catalysttransfer to a monomer.14 The chains terminated by double bondscan be reincorporated to a growing chain to form branches inthe polymer structure. Reaction four occurs when the chainleaves the catalyst as before but without a terminal double bond,giving a saturated “dead chain” (Di
s). Chain transfer agentssuch as hydrogen promote this reaction.
In the bulk of this paper, we have made the assumption thatthese two chain-transfer reactions obey first-order kinetics (i.e.,with fixed rate constants during the reaction). For transfer tomonomer or chain transfer agent, when the concentration ofthese species varies appreciably during the reaction, theseequations will take on a (partially) second-order nature. Ap-pendix C details how the equations developed in this paper aremodified in such cases.
The final reaction is the reincorporation of a chain with adouble bond at the end (vinyl terminated) into a growing chain,forming a long chain branch (B), which is, of course, part ofthe new chain, Pi. Although the branch is not strictly a separatechemical species, we use the (nonstandard) notation employedin reaction 5 to emphasize that branches are objects in the reactorwhich can be counted, and for which rate equations can beusefully written (see eq 13 below).
In batch and semibatch reactors, it is important to accountfor catalyst deactivation, which slows the rate of reaction asthe polymerization proceeds. In the above scheme, we havemade the assumption that deactivation occurs specifically at thethird reaction: it must occursomewherein the reaction scheme,but it is not particularly crucial where (one could, moreconventionally, write the deactivation step as simply Ci f
Cideact, but the rate constant for this process would need to be of
orderKpiM/(Kid + Ki
S) faster than the average rate of catalystdeactivation,Kd, because of the low concentration of theunattached Ci relative to Pi). We make the further assumptionthat catalyst deactivation occurs at the same rate,Kd, for all thecatalysts in the system. In what follows, this assumption allowsthe differential equations for overall concentrations in the reactorto be solved analytically. In the general case, one would needto resort to numerical solution of such equations within theoverall Monte Carlo scheme. This complicates the algorithmwe describe, without altering its overall structure; for clarity ofpresentation we restrict ourselves here to this simplest case.Fortunately, the approximation of uniform deactivation rate turnsout to be a good one for the experiments we model in thispaper,24 where (see later) there is less than a 10% difference inmeasured deactivation rate between the two catalysts.
3. Concentrations in the Reactor and DimensionlessQuantities
In what follows, we denote the concentrations of reactorspecies using italic font, and retain Roman font for the speciesthemselves. For example,Pi is the concentration of species Pi.We also denote thetotal concentration of active catalyst i asYi
) Pi + Ci, and the total active catalyst concentration as
Ci + M f Pi Kpi
Pi + M f Pi Kpi
Pi f Did + Ci Ki
d - Kd (1)
Pi f Did + Ci
deact Kd
Pi f Dis + Ci Ki
s
Pi + Djd f Pi + B KpLCBi
Y ) ∑i
Yi
B Inkson et al. Macromolecules
which has an initial valueY0. We write concentrations innondimensional form as follows:
We also assume that the reactor conditions are such thatKpiM. (Ki
d + Kis) and KpiM . Kd, in which case we are able to
make a quasi-static approximation (see Appendix A) for thedynamics of the catalyst and living chain variablespi and yi.These variables are very well approximated by
where φi ) Yi/Y is the fraction of active catalyst i (sincedeactivation rates are the same for all catalysts, theφi valuesare time-independent).
It is convenient to define a set of dimensionless quantities,which determine the progress of the polymerization and,ultimately, the structures formed. These are listed in Table 1.
It is also convenient to define a dimensionless time variable,T, chosen by noting that the rate at which monomers react isproportional to∑iKpiYi. We write
and hence
The dimensionless time,T, has a simple relationship with themonomer conversion, which we define asx ) MR/M0 where
MR is the concentration of reacted monomer andM0 is the initialmonomer concentration. We have
In a semibatch reactor, new monomer is added to keep theconcentration of unreacted monomer constant,M ) M0, so thisgives
In a batch reactor monomer is used up so thatM ) M0(1 - x)and so
In terms of these variables, the rate of change of concentrationof macromonomers formed at catalyst i is
and so
Similarly, for the dead chains
and so
The rate of change of total branch concentration is
Table 1. Dimensionless Variables
dimensionless deactivation ratekd )
Kd
Y0∑j
Kpjφj
dimensionless rate of chain transfer to form a chain with unsaturated end for catalyst i kid )
Kid
φi
Y0∑j
Kpjφj
dimensionless rate of chain transfer to form a dead chain with saturated end for catalyst i kis )
Kisφi
Y0∑j
Kpjφj
ratio of monomer and macromonomer polymerization rates for catalyst i qLCBi )KpLCBi
Kpi
relative rate of monomer reaction due to catalyst i kpi )Kpiφi
∑j
Kpjφj
dimensionless rate of macromonomer reaction rLCB )
∑i
KpLCBiφi
∑j
Kpjφj
) ∑i
kpiqLCBi
dimensionless initial monomer concentration m0 )M0
Y0
y ) YY0
, yi )Yi
Y0, ci )
Ci
Y0, pi )
Pi
Y0, m ) M
Y0, di
d )Di
d
Y0,
dis )
Dis
Y0, b ) B
Y0(2)
pi ≈ yi ≈ φi exp(-Kdt) (3)
dT
dt) ∑
i
KpiYi )Kd
kd
exp(-Kdt) (4)
exp(-Kdt) ) 1 - kdT (5)
dxdT
) MM0
(6)
x ) T (for a semibatch reactor) (7)
x ) 1 - exp(-T) (for a batch reactor) (8)
d[did]
dT) ki
d - rLCBdid (9)
did )
kid
rLCB[1 - exp(-rLCBT)] (10)
d[dis]
dT) ki
s (11)
dis ) ki
sT (12)
Macromolecules Monte Carlo Simulation C
which gives
4. Statistics at the Chain Segment Level
To define chain-segment statistics, it is useful to know therate of growth at a given catalyst site and to have informationon the rate of branching and chain termination. Provided noother processes occur, the rate of monomer addition at a catalystsite i is
The rate of monomer addition with respect to the overallconversion,x, is
It is convenient to define a normalized measure of degree ofpolymerization asNi ) Ni/m0 so that the rate of increase ofNi
in the absence of other processes is
In practice, both chain termination and macromonomer incor-poration occur, introducing chain ends and branch points,respectively. For a section of chain formed at conversionx, themean distance to the nearest chain end in the direction of growth(“downstream”) is found by comparing the relative rates ofpolymerization and termination, giving
whereM/M0 ) 1 for semibatch andM/M0 ) (1 - x) for a batchreactor.
In the opposite (“upstream”) direction, we compare the ratesof initiation and chain growth. The rate of initiation is the sameas the rate of termination, less the rate of catalyst deactivation.Hence, in the upstream direction, the mean distance to a chainend is
Similarly, the mean distance to the nearest branchpoint may beobtained by comparing the rates of monomer and macromono-mer incorporation, giving
where the quantity∑jdjd depends on the current time via eq 10.
If a chain formed at a catalyst site i terminates, it could either
form a macromonomer with probability
or a dead chain (with probabilityps ) kis/(ki
d + kis)). In the
former case, there is a possibility that the macromonomer mayat a later time be incorporated into another growing chain.Equation 9 indicates that the rate (with respect to the normalizedtime T) at which macromonomers are incorporated is given bythe parameterrLCB. Hence, the probability distribution of thetime∆T between macromonomer formation and reincorporationis
In our algorithm, described below, a macromonomer formed attimeT1 is considered to be reincorporated at timeT1 + ∆T where∆T is found from eq 22. If the re-incorporation time obtainedis later than the time of the batch reaction, the macromonomeris still present in the final product of the reaction.
If a macromonomer is incorporated into a growing chain, thenthis chain could be attached to any of the catalysts that admitbranches. The probability that it is incorporated into catalysttype i is found, from the relative rates of macromonomerincorporation into the different catalysts, as
If a macromonomer is incorporated into the current chain attime T1, forming a branch, then this macromonomer must havebeen formed at some timeT2 < T1. The conditional probabilitydistribution ofT2 given the current timeT1 is
The incorporated macromonomer could have been formed atany of the catalyst sites. The probability that it was formed atcatalyst site i is
5. Monte Carlo Molecular Growth Algorithm
The algorithm we use follows the general methodologyoutlined by Tobita for free-radical polymerization18-22 in thatwe build molecules by successively adding together linear chainsegments, accounting for the above probabilities for sidebranches and chain termination. In contrast to Tobita, we allowfor the possibility that, during the finite time between theinitiation of primary chain and its termination by chain transfer,the batch reactor conditions may change. If this is the case,quantities such as branching density may vary along the chainlength. We account for this by ensuring that the linear chainsegments we add are always “short”, in the sense that duringthe interval of conversion over which each such segment ispolymerized, the change in reactor conditions is negligibly small.It may require several such short chain sections to make up a
db
dT) rLCB∑
i
did ) ∑
i
kid(1 - exp(-rLCBT)) (13)
b ) ∑i
kid(T -
(1 - exp(-rLCBT))
rLCB) (14)
dNi
dt) KpiM (15)
dNi
dx)
kpim0
φi(1 - kdT)(16)
dNi
dx)
kpi
φi(1 - kdT)(17)
Nxid )
kpi
kid + ki
s
MM0
(18)
Nxiu )
kpi
(kid + ki
s - φikd)
MM0
(19)
Nbi )M/M0
qLCBi∑j
djd
(20)
pd )ki
d
(kid + ki
s)(21)
P(∆T) ) rLCB exp(-rLCB∆T) (22)
qikpi
∑j
qjkpj
(23)
PT1(T2) )rLCB exp(rLCBT2)
exp(rLCBT1) - 1(24)
did
∑j
djd
)ki
d
∑j
kjd
(25)
D Inkson et al. Macromolecules
single primary chain. We know, from eq 17, that for a chaingrowing at catalyst site i, during an interval of conversion∆x(and provided the chain does not terminate), the normalizednumber of monomers added iskpi∆x/φi(1 - kdT). One of theinputs to the algorithm is a number,∆xmax, which is themaximum interval in conversion used for chain segments inthe algorithm, chosen so that changes in (for example) mac-romonomer concentration are small over this interval. The choiceof a very large value of∆xmax corresponds to the limit in whichprimary chains are considered to be created “instantaneously”,as is done by Tobita for free-radical polymerization.19-22
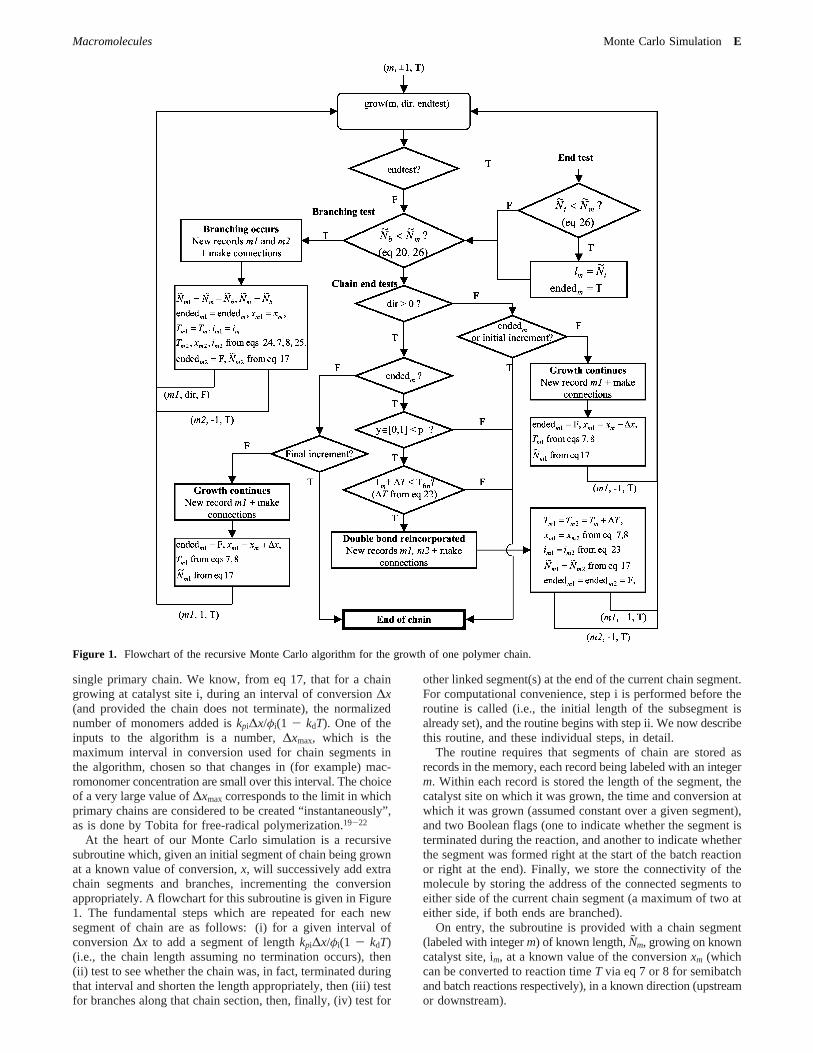
At the heart of our Monte Carlo simulation is a recursivesubroutine which, given an initial segment of chain being grownat a known value of conversion,x, will successively add extrachain segments and branches, incrementing the conversionappropriately. A flowchart for this subroutine is given in Figure1. The fundamental steps which are repeated for each newsegment of chain are as follows: (i) for a given interval ofconversion∆x to add a segment of lengthkpi∆x/φi(1 - kdT)(i.e., the chain length assuming no termination occurs), then(ii) test to see whether the chain was, in fact, terminated duringthat interval and shorten the length appropriately, then (iii) testfor branches along that chain section, then, finally, (iv) test for
other linked segment(s) at the end of the current chain segment.For computational convenience, step i is performed before theroutine is called (i.e., the initial length of the subsegment isalready set), and the routine begins with step ii. We now describethis routine, and these individual steps, in detail.
The routine requires that segments of chain are stored asrecords in the memory, each record being labeled with an integerm. Within each record is stored the length of the segment, thecatalyst site on which it was grown, the time and conversion atwhich it was grown (assumed constant over a given segment),and two Boolean flags (one to indicate whether the segment isterminated during the reaction, and another to indicate whetherthe segment was formed right at the start of the batch reactionor right at the end). Finally, we store the connectivity of themolecule by storing the address of the connected segments toeither side of the current chain segment (a maximum of two ateither side, if both ends are branched).
On entry, the subroutine is provided with a chain segment(labeled with integerm) of known length,Nm, growing on knowncatalyst site, im, at a known value of the conversionxm (whichcan be converted to reaction timeT via eq 7 or 8 for semibatchand batch reactions respectively), in a known direction (upstreamor downstream).
Figure 1. Flowchart of the recursive Monte Carlo algorithm for the growth of one polymer chain.
Macromolecules Monte Carlo Simulation E
Once created, a section of chain must be tested to see whetherthe chain terminates along that section. This test should beperformed once only on a given section of chain. It is possibleto perform this test at the time of initial creation of the segment,but since there are several places in the routine at which newsegments are created we find it computationally more convenientto place this test at the start of the routine and code for it onceonly. Whether this test is required is flagged via a Booleanvariable on entry (when the subroutine is called for the firsttime for a given segment, this variable is set as true).
If this termination test is required, then we generate a randomchain lengthNt from the Flory distribution
whereNxi is the mean distance to termination, given by eq 18or 19 depending on the growth direction. IfNt < Nm, thentermination occurs: the segment is marked as having terminatedand the current segment lengthNm is set to Nt. For thedownstream direction, the termination could either be to deadchain or macromonomer, but a decision on this is deferred untillater.
Next, a decision is made on whether branches occur withinthe segment. For this, we generate a random lengthNb from adistribution of form (26), with meanNbi given by eq 20. IfNb
< Nm then the segment is branched at least once, and the firstbranch is a distanceNb from the end of the segment. Two newsegments,m1 andm2, are created. We setNm1 ) Nm - Nb and,subsequently,Nm ) Nb so that the original segmentm issubdivided into new segmentsm and m1 either side of thebranchpoint. Segmentm1 inherits all other properties (includingwhether it is terminated or not) from segmentm.
Segmentm2 is the first segment of the incorporated side-branch. We obtain the timeTm2 at which the correspondingmacromonomer was formed from eq 24, and the catalyst typeim2 with probabilities given by eq 25. The length of this segmentis initially set tokpi∆xmax/2φi(1 - kdT), corresponding to halfthe maximum increment.25 The exception to this is when theconversionxm2 corresponding toTm2 is less than∆xmax/2, inwhich case this macromonomer was formed very near the startof the reaction. Its length is then set tokpixm2/φi(1 - kdT) andthe segment is flagged as being formed within the firstconversion increment.
Segmentsm, m1, and m2 are linked, by storing theiraddresses. The growth algorithm is called recursively forsegmentsm1 andm2. m1 is grown in the same direction assegmentm, and no termination test is required for this segmentsince it has already been performed on segmentm. Segmentm2 is grown in the upstream direction, with a flag that atermination test will be required for this segment.
Note that, since the routine is called recursively for segmentm1, a further branching test is made on this segment. It is thuspossible that, via repeated recursive calling of this routine,several branches will occur within the original segmentm forwhich the routine was initially called. The probability distribu-tion of the number of such branches follows a binomialdistribution. In this sense, the addition of branches by this routineis equivalent to that of Tobita,19-22 who calculates the totalnumber of side branches on a given primary chain from such abinomial distribution.
In the absence of branching, the algorithm proceeds to theend of the current segment to decide what subsequent segmentsmight be attached to it. Here the algorithm differs depending
on whether the segment is being “grown” in the downstreamor upstream direction.
For the downstream direction, if the segment is flagged ashaving terminated, then it will either terminate with a doublebond (with probabilityki
d/(kid + ki
s)) or with a dead chain end.In the case of a double bond, the current segment forms amacromonomer, which might be reincorporated into anothergrowing chain at some later time. To test for this, we generatea random time interval∆T from the distribution in eq 22. IfTinc ) Tm+ ∆T is less than the final time of reaction for thebatch process, then macromonomer reincorporation occurs atthe timeTinc, giving a branch-point. The probability that thenew branch is formed at a chain growing at catalyst i is givenin eq 23.
Two new segmentsm1 (for growth upstream from thebranchpoint) andm2 (for growth downstream from the branch-point) are created, labeled as growing at timeTinc, with lengthsobtained fromkpi∆xmax/2φi(1 - kdT) evaluated at this time.25
As above, an exception is made when the timeTinc lies withinthe initial or final increment of conversion for the batch process,in which case the length of (respectively)m1 or m2 isappropriately shorter, and the segment is labeled as such.Segmentsm1 or m2 are joined to each other and tom, torepresent the branchpoint. The growth routine is called recur-sively form1 orm2, in the upstream and downstream directionsrespectively, and with a flag requiring a termination test.
If the downstream segment is not terminated but was createdwithin the final conversion increment of the batch reaction, thenit would be expelled from the reactor still attached to the catalyst.We assume that this segment undergoes a termination processat some point afterward, and end the segment with a doublebond or dead chain with the same probabilities as during thereaction.
If the segment is neither terminated, nor made within the finalconversion increment, then growth of a linear chain continuesat the end of the current segment. A new segment,m1, is createdand attached to the current segment.m1 is grown at conversionxm1 ) xm + ∆xmax and has lengthkpi∆xmax/φi(1 - kdT) evaluatedat this new conversion. Again, an appropriate exception is madewhen this puts segmentm1 within the final conversion incre-ment. The growth routine is called recursively for segmentm1in the downstream direction, with a flag for a termination test.
In the upstream direction, then either a chain termination orthe segment being created within the initial conversion incrementwill result in an initiation site on the chain, and no furthergrowth. Otherwise, growth of a linear chain continues at theend of the current segment. A new segment,m1, is created anddealt with in the same way as for downstream growth, but withconversionxm1) xm - ∆xmax.
Hence, a single call to the above routine from an initial chainsegment recursively grows that part of a branched moleculewhich is attached to the segment. To create a single branchedmolecule, we select a monomer at random from the polymersexisting at the end of the batch reaction. This is equivalent toselecting a value of the conversion,x, uniformly between 0 andthe final value of the conversionxf. The probability that thismonomer was reacted by catalyst i is
Having selected this monomer, we create and link together twochain segments, upstream and downstream from the randomly
Pi(Nt) ) 1Nxi
exp(-Nt
Nxi) (26)
kpi
∑j
kpj
(27)
F Inkson et al. Macromolecules
selected monomer, each of lengthkpi∆xmax/2φi(1 - kdT) (unlessthe randomly chosen conversion is within∆xmax/2 of thebeginning or end of the batch reaction, in which case one ofthe segments is shorter and flagged as being within one of theseextreme conversion increments).25 A call to the moleculargrowth routine, for each of these two segments, in the upstreamand downstream directions respectively, results in the growthof an entire molecule.
Because the growth of a single molecule is initiated byselecting a monomer at random, the resulting distribution ofmolecules should be viewed as having been statistically chosenon a weight basis (i.e., the probability that a given moleculewas grown is proportional to its weight, because largermolecules contain more monomers). This distribution can thenbe interrogated to obtain the statistics of any molecularparameters such as molecular weight, degree of branching, orthe topological parameters of seniority and priority.
6. Comparison with Experimental Results
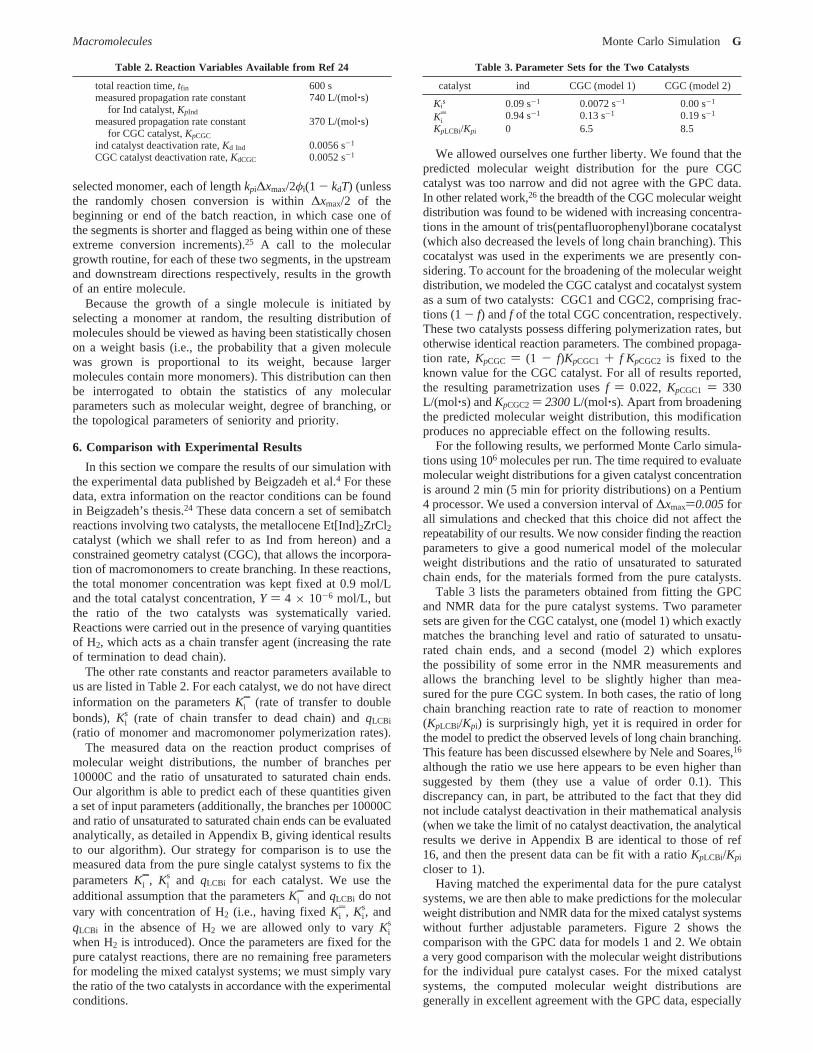
In this section we compare the results of our simulation withthe experimental data published by Beigzadeh et al.4 For thesedata, extra information on the reactor conditions can be foundin Beigzadeh’s thesis.24 These data concern a set of semibatchreactions involving two catalysts, the metallocene Et[Ind]2ZrCl2catalyst (which we shall refer to as Ind from hereon) and aconstrained geometry catalyst (CGC), that allows the incorpora-tion of macromonomers to create branching. In these reactions,the total monomer concentration was kept fixed at 0.9 mol/Land the total catalyst concentration,Y ) 4 × 10⁻⁶ mol/L, butthe ratio of the two catalysts was systematically varied.Reactions were carried out in the presence of varying quantitiesof H2, which acts as a chain transfer agent (increasing the rateof termination to dead chain).
The other rate constants and reactor parameters available tous are listed in Table 2. For each catalyst, we do not have directinformation on the parametersKi
d (rate of transfer to doublebonds),Ki
s (rate of chain transfer to dead chain) andqLCBi
(ratio of monomer and macromonomer polymerization rates).The measured data on the reaction product comprises of
molecular weight distributions, the number of branches per10000C and the ratio of unsaturated to saturated chain ends.Our algorithm is able to predict each of these quantities givena set of input parameters (additionally, the branches per 10000Cand ratio of unsaturated to saturated chain ends can be evaluatedanalytically, as detailed in Appendix B, giving identical resultsto our algorithm). Our strategy for comparison is to use themeasured data from the pure single catalyst systems to fix theparametersKi
d, Kis and qLCBi for each catalyst. We use the
additional assumption that the parametersKid andqLCBi do not
vary with concentration of H2 (i.e., having fixedKid, Ki
s, andqLCBi in the absence of H2 we are allowed only to varyKi
s
when H2 is introduced). Once the parameters are fixed for thepure catalyst reactions, there are no remaining free parametersfor modeling the mixed catalyst systems; we must simply varythe ratio of the two catalysts in accordance with the experimentalconditions.
We allowed ourselves one further liberty. We found that thepredicted molecular weight distribution for the pure CGCcatalyst was too narrow and did not agree with the GPC data.In other related work,26 the breadth of the CGC molecular weightdistribution was found to be widened with increasing concentra-tions in the amount of tris(pentafluorophenyl)borane cocatalyst(which also decreased the levels of long chain branching). Thiscocatalyst was used in the experiments we are presently con-sidering. To account for the broadening of the molecular weightdistribution, we modeled the CGC catalyst and cocatalyst systemas a sum of two catalysts: CGC1 and CGC2, comprising frac-tions (1- f) andf of the total CGC concentration, respectively.These two catalysts possess differing polymerization rates, butotherwise identical reaction parameters. The combined propaga-tion rate,KpCGC ) (1 - f)KpCGC1 + f KpCGC2 is fixed to theknown value for the CGC catalyst. For all of results reported,the resulting parametrization usesf ) 0.022, KpCGC1 ) 330L/(mol‚s) andKpCGC2) 2300L/(mol‚s). Apart from broadeningthe predicted molecular weight distribution, this modificationproduces no appreciable effect on the following results.
For the following results, we performed Monte Carlo simula-tions using 106 molecules per run. The time required to evaluatemolecular weight distributions for a given catalyst concentrationis around 2 min (5 min for priority distributions) on a Pentium4 processor. We used a conversion interval of∆xmax)0.005forall simulations and checked that this choice did not affect therepeatability of our results. We now consider finding the reactionparameters to give a good numerical model of the molecularweight distributions and the ratio of unsaturated to saturatedchain ends, for the materials formed from the pure catalysts.
Table 3 lists the parameters obtained from fitting the GPCand NMR data for the pure catalyst systems. Two parametersets are given for the CGC catalyst, one (model 1) which exactlymatches the branching level and ratio of saturated to unsatu-rated chain ends, and a second (model 2) which exploresthe possibility of some error in the NMR measurements andallows the branching level to be slightly higher than mea-sured for the pure CGC system. In both cases, the ratio of longchain branching reaction rate to rate of reaction to monomer(KpLCBi/Kpi) is surprisingly high, yet it is required in order forthe model to predict the observed levels of long chain branching.This feature has been discussed elsewhere by Nele and Soares,16
although the ratio we use here appears to be even higher thansuggested by them (they use a value of order 0.1). Thisdiscrepancy can, in part, be attributed to the fact that they didnot include catalyst deactivation in their mathematical analysis(when we take the limit of no catalyst deactivation, the analyticalresults we derive in Appendix B are identical to those of ref16, and then the present data can be fit with a ratioKpLCBi/Kpi
closer to 1).Having matched the experimental data for the pure catalyst
systems, we are then able to make predictions for the molecularweight distribution and NMR data for the mixed catalyst systemswithout further adjustable parameters. Figure 2 shows thecomparison with the GPC data for models 1 and 2. We obtaina very good comparison with the molecular weight distributionsfor the individual pure catalyst cases. For the mixed catalystsystems, the computed molecular weight distributions aregenerally in excellent agreement with the GPC data, especially
Table 2. Reaction Variables Available from Ref 24
total reaction time,tfin 600 smeasured propagation rate constant
for Ind catalyst,KpInd
740 L/(mol‚s)
measured propagation rate constantfor CGC catalyst,KpCGC
370 L/(mol‚s)
ind catalyst deactivation rate,Kd Ind 0.0056 s-1
CGC catalyst deactivation rate,KdCGC 0.0052 s-1
Table 3. Parameter Sets for the Two Catalysts
catalyst ind CGC (model 1) CGC (model 2)
Kis 0.09 s-1 0.0072 s-1 0.00 s-1
Kid 0.94 s-1 0.13 s-1 0.19 s-1
KpLCBi/Kpi 0 6.5 8.5
Macromolecules Monte Carlo Simulation G
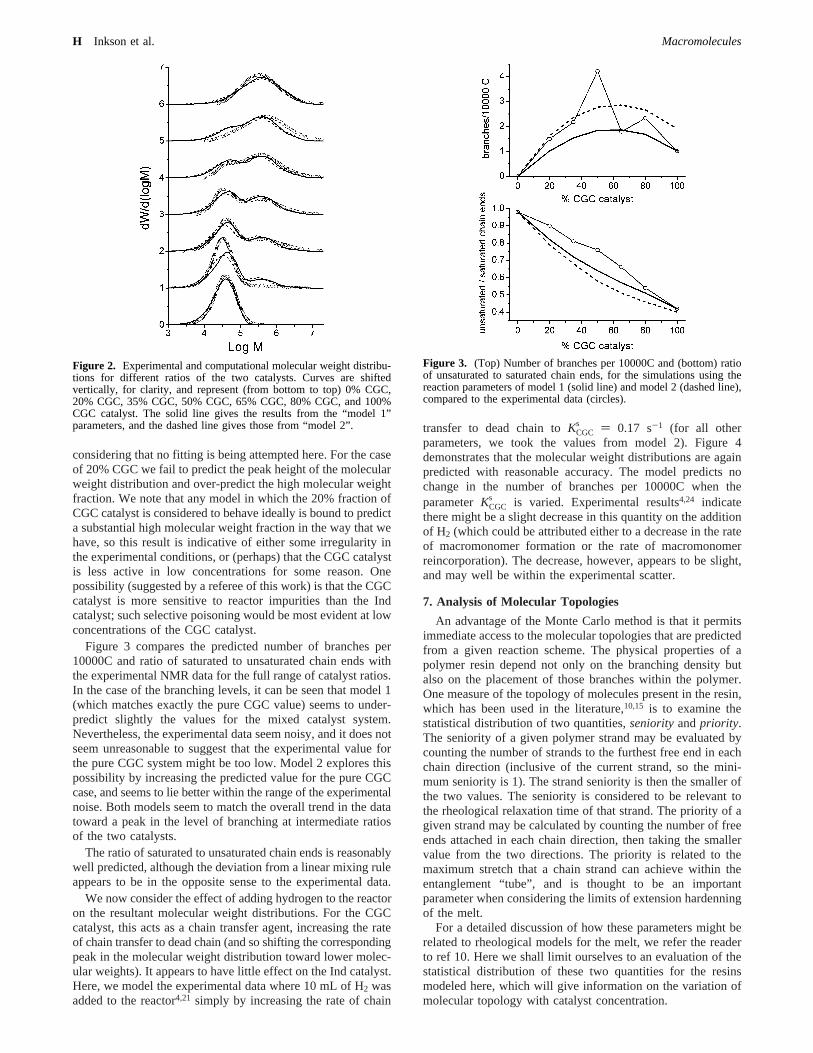
considering that no fitting is being attempted here. For the caseof 20% CGC we fail to predict the peak height of the molecularweight distribution and over-predict the high molecular weightfraction. We note that any model in which the 20% fraction ofCGC catalyst is considered to behave ideally is bound to predicta substantial high molecular weight fraction in the way that wehave, so this result is indicative of either some irregularity inthe experimental conditions, or (perhaps) that the CGC catalystis less active in low concentrations for some reason. Onepossibility (suggested by a referee of this work) is that the CGCcatalyst is more sensitive to reactor impurities than the Indcatalyst; such selective poisoning would be most evident at lowconcentrations of the CGC catalyst.
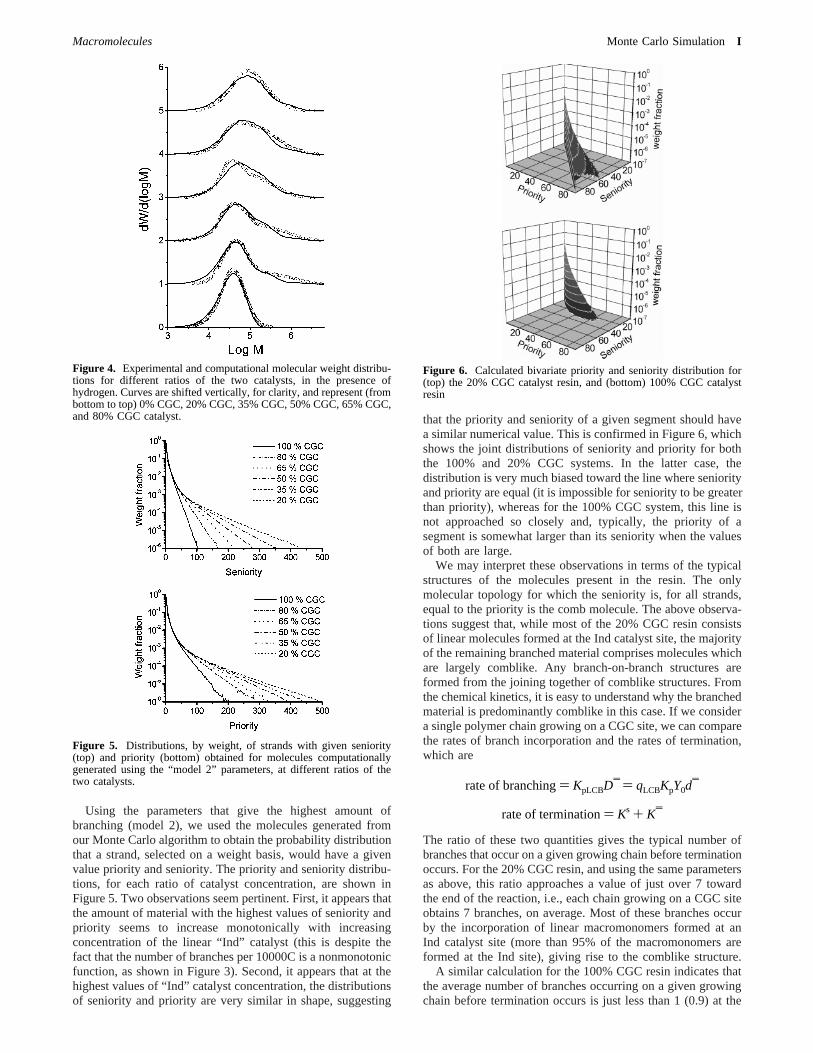
Figure 3 compares the predicted number of branches per10000C and ratio of saturated to unsaturated chain ends withthe experimental NMR data for the full range of catalyst ratios.In the case of the branching levels, it can be seen that model 1(which matches exactly the pure CGC value) seems to under-predict slightly the values for the mixed catalyst system.Nevertheless, the experimental data seem noisy, and it does notseem unreasonable to suggest that the experimental value forthe pure CGC system might be too low. Model 2 explores thispossibility by increasing the predicted value for the pure CGCcase, and seems to lie better within the range of the experimentalnoise. Both models seem to match the overall trend in the datatoward a peak in the level of branching at intermediate ratiosof the two catalysts.
The ratio of saturated to unsaturated chain ends is reasonablywell predicted, although the deviation from a linear mixing ruleappears to be in the opposite sense to the experimental data.
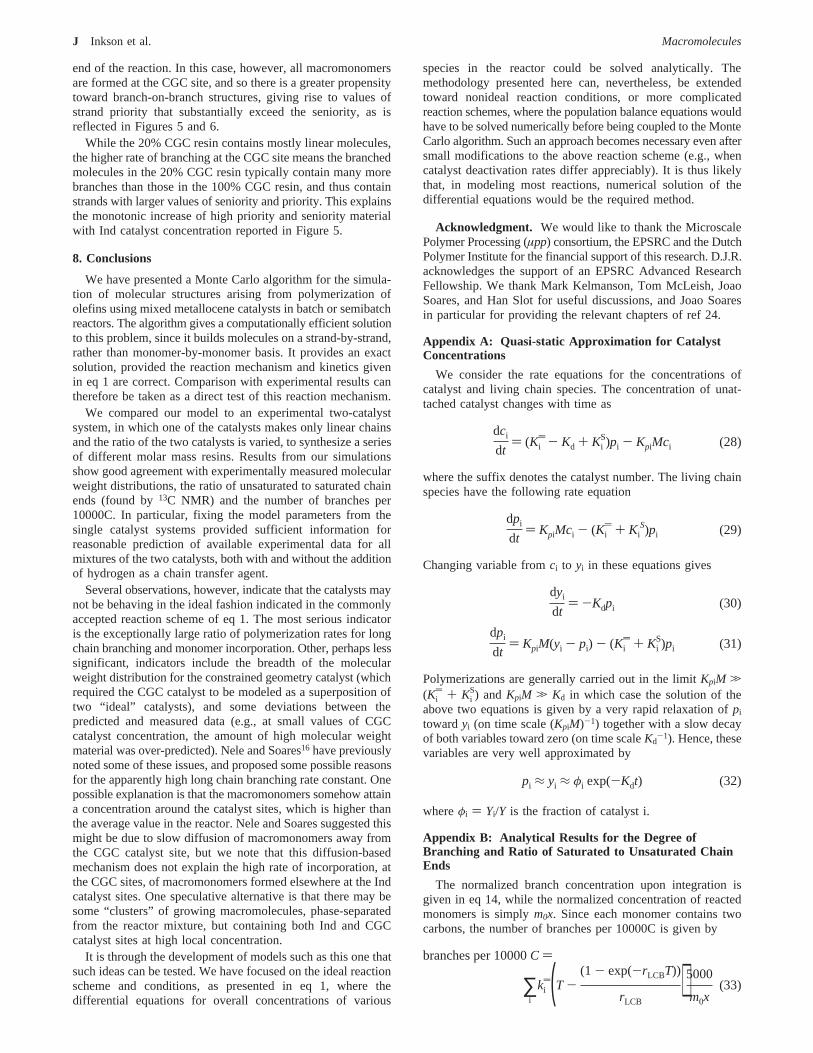
We now consider the effect of adding hydrogen to the reactoron the resultant molecular weight distributions. For the CGCcatalyst, this acts as a chain transfer agent, increasing the rateof chain transfer to dead chain (and so shifting the correspondingpeak in the molecular weight distribution toward lower molec-ular weights). It appears to have little effect on the Ind catalyst.Here, we model the experimental data where 10 mL of H2 wasadded to the reactor4,21 simply by increasing the rate of chain
transfer to dead chain toKCGCs ) 0.17 s-1 (for all other
parameters, we took the values from model 2). Figure 4demonstrates that the molecular weight distributions are againpredicted with reasonable accuracy. The model predicts nochange in the number of branches per 10000C when theparameterKCGC
s is varied. Experimental results4,24 indicatethere might be a slight decrease in this quantity on the additionof H2 (which could be attributed either to a decrease in the rateof macromonomer formation or the rate of macromonomerreincorporation). The decrease, however, appears to be slight,and may well be within the experimental scatter.
7. Analysis of Molecular Topologies
An advantage of the Monte Carlo method is that it permitsimmediate access to the molecular topologies that are predictedfrom a given reaction scheme. The physical properties of apolymer resin depend not only on the branching density butalso on the placement of those branches within the polymer.One measure of the topology of molecules present in the resin,which has been used in the literature,10,15 is to examine thestatistical distribution of two quantities,seniorityandpriority.The seniority of a given polymer strand may be evaluated bycounting the number of strands to the furthest free end in eachchain direction (inclusive of the current strand, so the mini-mum seniority is 1). The strand seniority is then the smaller ofthe two values. The seniority is considered to be relevant tothe rheological relaxation time of that strand. The priority of agiven strand may be calculated by counting the number of freeends attached in each chain direction, then taking the smallervalue from the two directions. The priority is related to themaximum stretch that a chain strand can achieve within theentanglement “tube”, and is thought to be an importantparameter when considering the limits of extension hardenningof the melt.
For a detailed discussion of how these parameters might berelated to rheological models for the melt, we refer the readerto ref 10. Here we shall limit ourselves to an evaluation of thestatistical distribution of these two quantities for the resinsmodeled here, which will give information on the variation ofmolecular topology with catalyst concentration.
Figure 2. Experimental and computational molecular weight distribu-tions for different ratios of the two catalysts. Curves are shiftedvertically, for clarity, and represent (from bottom to top) 0% CGC,20% CGC, 35% CGC, 50% CGC, 65% CGC, 80% CGC, and 100%CGC catalyst. The solid line gives the results from the “model 1”parameters, and the dashed line gives those from “model 2”.
Figure 3. (Top) Number of branches per 10000C and (bottom) ratioof unsaturated to saturated chain ends, for the simulations using thereaction parameters of model 1 (solid line) and model 2 (dashed line),compared to the experimental data (circles).
H Inkson et al. Macromolecules
Using the parameters that give the highest amount ofbranching (model 2), we used the molecules generated fromour Monte Carlo algorithm to obtain the probability distributionthat a strand, selected on a weight basis, would have a givenvalue priority and seniority. The priority and seniority distribu-tions, for each ratio of catalyst concentration, are shown inFigure 5. Two observations seem pertinent. First, it appears thatthe amount of material with the highest values of seniority andpriority seems to increase monotonically with increasingconcentration of the linear “Ind” catalyst (this is despite thefact that the number of branches per 10000C is a nonmonotonicfunction, as shown in Figure 3). Second, it appears that at thehighest values of “Ind” catalyst concentration, the distributionsof seniority and priority are very similar in shape, suggesting
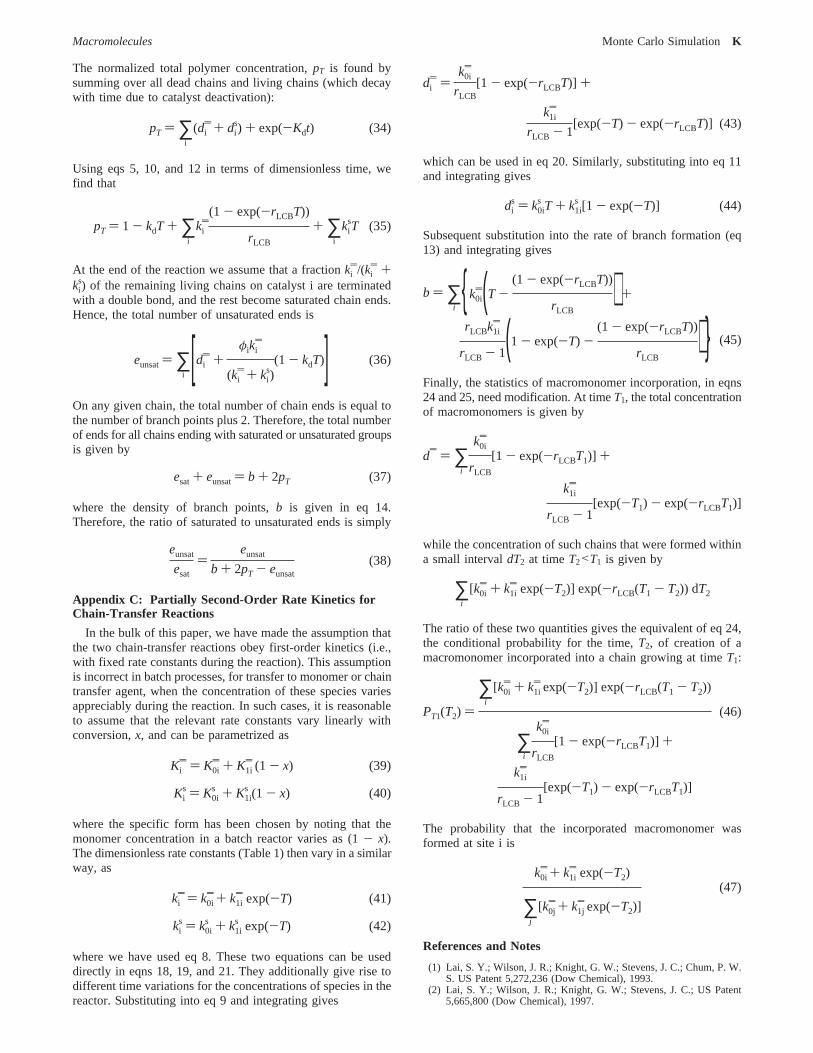
that the priority and seniority of a given segment should havea similar numerical value. This is confirmed in Figure 6, whichshows the joint distributions of seniority and priority for boththe 100% and 20% CGC systems. In the latter case, thedistribution is very much biased toward the line where seniorityand priority are equal (it is impossible for seniority to be greaterthan priority), whereas for the 100% CGC system, this line isnot approached so closely and, typically, the priority of asegment is somewhat larger than its seniority when the valuesof both are large.
We may interpret these observations in terms of the typicalstructures of the molecules present in the resin. The onlymolecular topology for which the seniority is, for all strands,equal to the priority is the comb molecule. The above observa-tions suggest that, while most of the 20% CGC resin consistsof linear molecules formed at the Ind catalyst site, the majorityof the remaining branched material comprises molecules whichare largely comblike. Any branch-on-branch structures areformed from the joining together of comblike structures. Fromthe chemical kinetics, it is easy to understand why the branchedmaterial is predominantly comblike in this case. If we considera single polymer chain growing on a CGC site, we can comparethe rates of branch incorporation and the rates of termination,which are
The ratio of these two quantities gives the typical number ofbranches that occur on a given growing chain before terminationoccurs. For the 20% CGC resin, and using the same parametersas above, this ratio approaches a value of just over 7 towardthe end of the reaction, i.e., each chain growing on a CGC siteobtains 7 branches, on average. Most of these branches occurby the incorporation of linear macromonomers formed at anInd catalyst site (more than 95% of the macromonomers areformed at the Ind site), giving rise to the comblike structure.
A similar calculation for the 100% CGC resin indicates thatthe average number of branches occurring on a given growingchain before termination occurs is just less than 1 (0.9) at the
Figure 4. Experimental and computational molecular weight distribu-tions for different ratios of the two catalysts, in the presence ofhydrogen. Curves are shifted vertically, for clarity, and represent (frombottom to top) 0% CGC, 20% CGC, 35% CGC, 50% CGC, 65% CGC,and 80% CGC catalyst.
Figure 5. Distributions, by weight, of strands with given seniority(top) and priority (bottom) obtained for molecules computationallygenerated using the “model 2” parameters, at different ratios of thetwo catalysts.
Figure 6. Calculated bivariate priority and seniority distribution for(top) the 20% CGC catalyst resin, and (bottom) 100% CGC catalystresin
rate of branching) KpLCBDd ) qLCBKpY0d
d
rate of termination) Ks + Kd
Macromolecules Monte Carlo Simulation I
end of the reaction. In this case, however, all macromonomersare formed at the CGC site, and so there is a greater propensitytoward branch-on-branch structures, giving rise to values ofstrand priority that substantially exceed the seniority, as isreflected in Figures 5 and 6.
While the 20% CGC resin contains mostly linear molecules,the higher rate of branching at the CGC site means the branchedmolecules in the 20% CGC resin typically contain many morebranches than those in the 100% CGC resin, and thus containstrands with larger values of seniority and priority. This explainsthe monotonic increase of high priority and seniority materialwith Ind catalyst concentration reported in Figure 5.
8. Conclusions
We have presented a Monte Carlo algorithm for the simula-tion of molecular structures arising from polymerization ofolefins using mixed metallocene catalysts in batch or semibatchreactors. The algorithm gives a computationally efficient solutionto this problem, since it builds molecules on a strand-by-strand,rather than monomer-by-monomer basis. It provides an exactsolution, provided the reaction mechanism and kinetics givenin eq 1 are correct. Comparison with experimental results cantherefore be taken as a direct test of this reaction mechanism.
We compared our model to an experimental two-catalystsystem, in which one of the catalysts makes only linear chainsand the ratio of the two catalysts is varied, to synthesize a seriesof different molar mass resins. Results from our simulationsshow good agreement with experimentally measured molecularweight distributions, the ratio of unsaturated to saturated chainends (found by13C NMR) and the number of branches per10000C. In particular, fixing the model parameters from thesingle catalyst systems provided sufficient information forreasonable prediction of available experimental data for allmixtures of the two catalysts, both with and without the additionof hydrogen as a chain transfer agent.
Several observations, however, indicate that the catalysts maynot be behaving in the ideal fashion indicated in the commonlyaccepted reaction scheme of eq 1. The most serious indicatoris the exceptionally large ratio of polymerization rates for longchain branching and monomer incorporation. Other, perhaps lesssignificant, indicators include the breadth of the molecularweight distribution for the constrained geometry catalyst (whichrequired the CGC catalyst to be modeled as a superposition oftwo “ideal” catalysts), and some deviations between thepredicted and measured data (e.g., at small values of CGCcatalyst concentration, the amount of high molecular weightmaterial was over-predicted). Nele and Soares16 have previouslynoted some of these issues, and proposed some possible reasonsfor the apparently high long chain branching rate constant. Onepossible explanation is that the macromonomers somehow attaina concentration around the catalyst sites, which is higher thanthe average value in the reactor. Nele and Soares suggested thismight be due to slow diffusion of macromonomers away fromthe CGC catalyst site, but we note that this diffusion-basedmechanism does not explain the high rate of incorporation, atthe CGC sites, of macromonomers formed elsewhere at the Indcatalyst sites. One speculative alternative is that there may besome “clusters” of growing macromolecules, phase-separatedfrom the reactor mixture, but containing both Ind and CGCcatalyst sites at high local concentration.
It is through the development of models such as this one thatsuch ideas can be tested. We have focused on the ideal reactionscheme and conditions, as presented in eq 1, where thedifferential equations for overall concentrations of various
species in the reactor could be solved analytically. Themethodology presented here can, nevertheless, be extendedtoward nonideal reaction conditions, or more complicatedreaction schemes, where the population balance equations wouldhave to be solved numerically before being coupled to the MonteCarlo algorithm. Such an approach becomes necessary even aftersmall modifications to the above reaction scheme (e.g., whencatalyst deactivation rates differ appreciably). It is thus likelythat, in modeling most reactions, numerical solution of thedifferential equations would be the required method.
Acknowledgment. We would like to thank the MicroscalePolymer Processing (µpp) consortium, the EPSRC and the DutchPolymer Institute for the financial support of this research. D.J.R.acknowledges the support of an EPSRC Advanced ResearchFellowship. We thank Mark Kelmanson, Tom McLeish, JoaoSoares, and Han Slot for useful discussions, and Joao Soaresin particular for providing the relevant chapters of ref 24.
Appendix A: Quasi-static Approximation for CatalystConcentrations
We consider the rate equations for the concentrations ofcatalyst and living chain species. The concentration of unat-tached catalyst changes with time as
where the suffix denotes the catalyst number. The living chainspecies have the following rate equation
Changing variable fromci to yi in these equations gives
Polymerizations are generally carried out in the limitKpiM .(Ki
d + KiS) and KpiM . Kd in which case the solution of the
above two equations is given by a very rapid relaxation ofpi
towardyi (on time scale (KpiM)-1) together with a slow decayof both variables toward zero (on time scaleKd
-1). Hence, thesevariables are very well approximated by
whereφi ) Yi/Y is the fraction of catalyst i.
Appendix B: Analytical Results for the Degree ofBranching and Ratio of Saturated to Unsaturated ChainEnds
The normalized branch concentration upon integration isgiven in eq 14, while the normalized concentration of reactedmonomers is simplym0x. Since each monomer contains twocarbons, the number of branches per 10000C is given by
dci
dt) (Ki
d - Kd + KiS)pi - KpiMci (28)
dpi
dt) KpiMci - (Ki
d + KiS)pi (29)
dyi
dt) -Kdpi (30)
dpi
dt) KpiM(yi - pi) - (Ki
d + KiS)pi (31)
pi ≈ yi ≈ φi exp(-Kdt) (32)
branches per 10000C )
∑i
kid(T -
(1 - exp(-rLCBT))
rLCB)5000
m0x(33)
J Inkson et al. Macromolecules
The normalized total polymer concentration,pT is found bysumming over all dead chains and living chains (which decaywith time due to catalyst deactivation):
Using eqs 5, 10, and 12 in terms of dimensionless time, wefind that
At the end of the reaction we assume that a fractionkid/(ki
d +ki
s) of the remaining living chains on catalyst i are terminatedwith a double bond, and the rest become saturated chain ends.Hence, the total number of unsaturated ends is
On any given chain, the total number of chain ends is equal tothe number of branch points plus 2. Therefore, the total numberof ends for all chains ending with saturated or unsaturated groupsis given by
where the density of branch points,b is given in eq 14.Therefore, the ratio of saturated to unsaturated ends is simply
Appendix C: Partially Second-Order Rate Kinetics forChain-Transfer Reactions
In the bulk of this paper, we have made the assumption thatthe two chain-transfer reactions obey first-order kinetics (i.e.,with fixed rate constants during the reaction). This assumptionis incorrect in batch processes, for transfer to monomer or chaintransfer agent, when the concentration of these species variesappreciably during the reaction. In such cases, it is reasonableto assume that the relevant rate constants vary linearly withconversion,x, and can be parametrized as
where the specific form has been chosen by noting that themonomer concentration in a batch reactor varies as (1- x).The dimensionless rate constants (Table 1) then vary in a similarway, as
where we have used eq 8. These two equations can be useddirectly in eqns 18, 19, and 21. They additionally give rise todifferent time variations for the concentrations of species in thereactor. Substituting into eq 9 and integrating gives
which can be used in eq 20. Similarly, substituting into eq 11and integrating gives
Subsequent substitution into the rate of branch formation (eq13) and integrating gives
Finally, the statistics of macromonomer incorporation, in eqns24 and 25, need modification. At timeT1, the total concentrationof macromonomers is given by
while the concentration of such chains that were formed withina small intervaldT2 at timeT2<T1 is given by
The ratio of these two quantities gives the equivalent of eq 24,the conditional probability for the time,T2, of creation of amacromonomer incorporated into a chain growing at timeT1:
The probability that the incorporated macromonomer wasformed at site i is
References and Notes
(1) Lai, S. Y.; Wilson, J. R.; Knight, G. W.; Stevens, J. C.; Chum, P. W.S. US Patent 5,272,236 (Dow Chemical), 1993.
(2) Lai, S. Y.; Wilson, J. R.; Knight, G. W.; Stevens, J. C.; US Patent5,665,800 (Dow Chemical), 1997.
pT ) ∑i
(did + di
s) + exp(-Kdt) (34)
pT ) 1 - kdT + ∑i
kid(1 - exp(-rLCBT))
rLCB
+ ∑i
kisT (35)
eunsat) ∑i [di
d +φiki
d
(kid + ki
s)(1 - kdT)] (36)
esat+ eunsat) b + 2pT (37)
eunsat
esat)
eunsat
b + 2pT - eunsat(38)
Kid ) K0i
d + K1id (1 - x) (39)
Kis ) K0i
s + K1is (1 - x) (40)
kid ) k0i
d + k1id exp(-T) (41)
kis ) k0i
s + k1is exp(-T) (42)
did )
k0id
rLCB[1 - exp(-rLCBT)] +
k1id
rLCB - 1[exp(-T) - exp(-rLCBT)] (43)
dis ) k0i
s T + k1is [1 - exp(-T)] (44)
b ) ∑i
{k0id(T -
(1 - exp(-rLCBT))
rLCB) +
rLCBk1id
rLCB - 1(1 - exp(-T) -(1 - exp(-rLCBT))
rLCB) } (45)
dd ) ∑
i
k0id
rLCB
[1 - exp(-rLCBT1)] +
k1id
rLCB - 1[exp(-T1) - exp(-rLCBT1)]
∑i
[k0id + k1i
d exp(-T2)] exp(-rLCB(T1 - T2)) dT2
PT1(T2) )
∑i
[k0id + k1i
d exp(-T2)] exp(-rLCB(T1 - T2))
∑i
k0id
rLCB
[1 - exp(-rLCBT1)] +
k1id
rLCB - 1[exp(-T1) - exp(-rLCBT1)]
(46)
k0id + k1i
d exp(-T2)
∑j
[k0jd + k1j
d exp(-T2)]
(47)
Macromolecules Monte Carlo Simulation K
(3) Beigzadeh, D.; Soares, J. B. P.; Duever, T. A.; Hamielec, A. E.Polym.React. Eng.1999, 7, 195-205.
(4) Beigzadeh, D.; Soares, J. B. P.; Duever, T. AMacromol. RapidCommun.1999, 20, 541-545.
(5) Beigzadeh, D.; Soares, J. B. P.; Duever, T. A.Macromol. Symp.2001,173, 179-194.
(6) McLeish, T. C. B.AdV. Phys.2002, 51, 1379-1527.(7) Soares, J. B. P.; Hamielec, A. E.Polymer1995, 36, 2257-2263.(8) Soares, J. B. P.; Hamielec, A. E.Macromol. Theory Simul.1996, 5,
547-572.(9) Soares, J. B. P.; Hamielec, A. E.Macromol. Theory Simul.1997, 6,
591-596.(10) Read, D. J.; McLeish, T. C. B.Macromolecules2001, 34, 1928-
1945.(11) Costeux, S.; Wood-Adams, P.; Beigzadeh, D.Macromolecules2002,
35, 2514-2528.(12) Simon, L. C.; Soares, J. B. P.Macromol. Theory Simul.2002, 11,
222-232.(13) Costeux, S.Macromolecules2003, 36, 4168-4187.(14) Soares, J. B. P.Macromol. Theory Simul.2002, 11, 184-198.(15) Read, D. J.; Soares, J. B. P.Macromolecules2003, 36, 10037-10051.(16) Nele, M.; Soares, J. B. P.Macromol. Theory Simul.2002, 11, 939-
943.(17) Iedema, P. D.; Hoefsloot, H. C. J.Macromolecules2003, 36, 6632-
6644.
(18) Tobita, H.Macromol. Theory. Simul.1996, 5, 1167-1194.(19) Tobita, H.J. Polym. Sci., Part B: Polym. Phys.2001, 39, 391-403.(20) Tobita, H.J. Polym. Sci., Part B: Polym. Phys.2001, 39, 2960-
2968.(21) Tobita, H.J. Polym. Sci., Part B: Polym. Phys.1994, 32, 901-910.(22) Tobita, H.J. Polym. Sci., Part B: Polym. Phys.1994, 32, 911-919.(23) Das, C.; Inkson, N. J.; Read, D. J.; Kelmanson, M. A.; McLeish, T.
C. B. J. Rheol.2006, 50, 207-235.(24) Beigzadeh, D. Ph.D. Thesis. Institute for Polymer research, University
of Waterloo, Waterloo, Ontario, N2L 3G1, Canada.(25) The choice of a factor of 2 here is not essential to the running of the
algorithm, but is not without justification. The algorithm is a “finitedifference” algorithm, in which the value of “conversion” attributedto a given chain segment is the average value over that segment (or,in some sense, the value at the middle of the segment). Sometimes(e.g. at branchpoints) the routine calculates an “exact” value of theconversion right at a chain end, using eq 22 or eq 26. In this case, itis appropriate initially to take only a half-increment from the chainend, so that the chain end (where the “exact” conversion is known)lies halfway along a full increment.
(26) Beigzadeh, D.; Soares, J. B. P.; Duever, T. A.J. Polym. Sci., Part A2004, 42, 3055-3061.
MA060654D
L Inkson et al. PAGE EST: 11.3 Macromolecules