Monitoring, characterization and control of chronic, symptomatic malaria infections in rural Zambia...
19
RESEARCH Open Access Monitoring, characterization and control of chronic, symptomatic malaria infections in rural Zambia through monthly household visits by paid community health workers Busiku Hamainza 1,2* , Hawela Moonga 1 , Chadwick H Sikaala 1,2 , Mulakwa Kamuliwo 1 , Adam Bennett 3 , Thomas P Eisele 3 , John Miller 4 , Aklilu Seyoum 2 and Gerry F Killeen 2,3,5 Abstract Background: Active, population-wide mass screening and treatment (MSAT) for chronic Plasmodium falciparum carriage to eliminate infectious reservoirs of malaria transmission have proven difficult to apply on large national scales through trained clinicians from central health authorities. Methodology: Fourteen population clusters of approximately 1,000 residents centred around health facilities (HF) in two rural Zambian districts were each provided with three modestly remunerated community health workers (CHWs) conducting active monthly household visits to screen and treat all consenting residents for malaria infection with rapid diagnostic tests (RDT). Both CHWs and HFs also conducted passive case detection among residents who self-reported for screening and treatment. Results: Diagnostic positivity was higher among symptomatic patients self-reporting to CHWs (42.5%) and HFs (24%) than actively screened residents (20.3%), but spatial and temporal variations of diagnostic positivity were highly consistent across all three systems. However, most malaria infections (55.6%) were identified through active home visits by CHWs rather than self-reporting to CHWs or HFs. Most (62%) malaria infections detected actively by CHWs reported one or more symptoms of illness. Most reports of fever and vomiting, plus more than a quarter of history of fever, headache and diarrhoea, were attributable to malaria infection. The minority of residents who participated >12 times had lower rates of malaria infection and associated symptoms in later contacts but most residents were tested <4 times and high malaria diagnostic positivity (32%) in active surveys, as well as incidence (1.7 detected infections per person per year) persisted in the population. Per capita cost for active service delivery by CHWs was US$5.14 but this would rise to US$10.68 with full community compliance with monthly testing at current levels of transmission, and US$6.25 if pre-elimination transmission levels and negligible treatment costs were achieved. Conclusion: Monthly active home visits by CHWs equipped with RDTs were insufficient to eliminate the human infection reservoir in this typical African setting, despite reasonably high LLIN/IRS coverage. However, dramatic impact upon infection and morbidity burden might be attainable and cost-effective if community participation in regular testing could be improved and the substantial, but not necessarily prohibitive, costs are affordable to national programmes. Keywords: Malaria, Community health worker, Surveillance, Passive and active case detection, Treatment with ACT, Rapid diagnostic tests * Correspondence: [email protected] 1 Ministry of Health, National Malaria Control Centre, Chainama Hospital College Grounds, off Great East road, P.O. Box 32509, Lusaka, Zambia 2 Liverpool School of Tropical Medicine, Vector Biology Department, Pembroke Place, Liverpool L3 5QA, UK Full list of author information is available at the end of the article © 2014 Hamainza et al.; licensee BioMed Central Ltd. This is an Open Access article distributed under the terms of the Creative Commons Attribution License (http://creativecommons.org/licenses/by/2.0), which permits unrestricted use, distribution, and reproduction in any medium, provided the original work is properly credited. The Creative Commons Public Domain Dedication waiver (http://creativecommons.org/publicdomain/zero/1.0/) applies to the data made available in this article, unless otherwise stated. Hamainza et al. Malaria Journal 2014, 13:128 http://www.malariajournal.com/content/13/1/128
-
Upload
independent -
Category
Documents
-
view
5 -
download
0
Transcript of Monitoring, characterization and control of chronic, symptomatic malaria infections in rural Zambia...

Hamainza et al. Malaria Journal 2014, 13:128http://www.malariajournal.com/content/13/1/128
RESEARCH Open Access
Monitoring, characterization and control ofchronic, symptomatic malaria infections in ruralZambia through monthly household visits bypaid community health workersBusiku Hamainza1,2*, Hawela Moonga1, Chadwick H Sikaala1,2, Mulakwa Kamuliwo1, Adam Bennett3,Thomas P Eisele3, John Miller4, Aklilu Seyoum2 and Gerry F Killeen2,3,5
Abstract
Background: Active, population-wide mass screening and treatment (MSAT) for chronic Plasmodium falciparumcarriage to eliminate infectious reservoirs of malaria transmission have proven difficult to apply on large nationalscales through trained clinicians from central health authorities.
Methodology: Fourteen population clusters of approximately 1,000 residents centred around health facilities (HF)in two rural Zambian districts were each provided with three modestly remunerated community health workers(CHWs) conducting active monthly household visits to screen and treat all consenting residents for malariainfection with rapid diagnostic tests (RDT). Both CHWs and HFs also conducted passive case detection amongresidents who self-reported for screening and treatment.
Results: Diagnostic positivity was higher among symptomatic patients self-reporting to CHWs (42.5%) and HFs (24%)than actively screened residents (20.3%), but spatial and temporal variations of diagnostic positivity were highlyconsistent across all three systems. However, most malaria infections (55.6%) were identified through active home visitsby CHWs rather than self-reporting to CHWs or HFs. Most (62%) malaria infections detected actively by CHWs reportedone or more symptoms of illness. Most reports of fever and vomiting, plus more than a quarter of history of fever,headache and diarrhoea, were attributable to malaria infection. The minority of residents who participated >12 timeshad lower rates of malaria infection and associated symptoms in later contacts but most residents were tested <4 timesand high malaria diagnostic positivity (32%) in active surveys, as well as incidence (1.7 detected infections per personper year) persisted in the population. Per capita cost for active service delivery by CHWs was US$5.14 but this wouldrise to US$10.68 with full community compliance with monthly testing at current levels of transmission, and US$6.25 ifpre-elimination transmission levels and negligible treatment costs were achieved.
Conclusion: Monthly active home visits by CHWs equipped with RDTs were insufficient to eliminate the humaninfection reservoir in this typical African setting, despite reasonably high LLIN/IRS coverage. However, dramatic impactupon infection and morbidity burden might be attainable and cost-effective if communityparticipation in regular testing could be improved and the substantial, but not necessarily prohibitive, costs areaffordable to national programmes.
Keywords: Malaria, Community health worker, Surveillance, Passive and active case detection, Treatment with ACT,Rapid diagnostic tests
* Correspondence: [email protected] of Health, National Malaria Control Centre, Chainama HospitalCollege Grounds, off Great East road, P.O. Box 32509, Lusaka, Zambia2Liverpool School of Tropical Medicine, Vector Biology Department,Pembroke Place, Liverpool L3 5QA, UKFull list of author information is available at the end of the article
© 2014 Hamainza et al.; licensee BioMed CentCommons Attribution License (http://creativecreproduction in any medium, provided the orDedication waiver (http://creativecommons.orunless otherwise stated.
ral Ltd. This is an Open Access article distributed under the terms of the Creativeommons.org/licenses/by/2.0), which permits unrestricted use, distribution, andiginal work is properly credited. The Creative Commons Public Domaing/publicdomain/zero/1.0/) applies to the data made available in this article,

Hamainza et al. Malaria Journal 2014, 13:128 Page 2 of 19http://www.malariajournal.com/content/13/1/128
BackgroundA relatively large proportion of malaria infections areonly mildly symptomatic, especially in endemic coun-tries where acquired immunity moderates both parasit-aemia and pathology [1-3]. Even in areas with onlymodest, seasonally sporadic transmission where little im-munity exists among the human populations, the manymildly symptomatic infections that persist chronically,often at sub-patent parasite densities below thresholdsof detectability, are responsible for sustained malariatransmission [4,5]. As early as the 1930s, these popula-tions have been targeted for treatment with anti-malarialdrugs as a control measure for malaria transmission, par-ticularly during the era of the Global Malaria EradicationProgramme initiated in the 1950s [6-8]. Due to theemergence of drug resistance, which was attributed tomass drug administration campaigns [9-11] and evi-dence that the impact on transmission may be limited,the use of therapeutic approaches to control transmis-sion rather than burden was not considered as effective[6,8,12,13] until recently, when interest in malaria elim-ination was rejuvenated [13-15].Currently curative drugs are predominantly targeted at
symptomatic individuals based on passive detection ofacute infections among patients seeking care for feversthrough the formal and informal health system [16-18].Strategies for control of human-to-mosquito transmissionby providing chemotherapy to chronic parasite carriers arenow being revisited as they may be complimentary tofront-line interventions for preventing mosquito-to-humantransmission, such as long-lasting insecticidal nets(LLINs) and indoor residual spraying (IRS) of houses, tofurther accelerate declines in malaria burden [19-21] inareas of low and seasonal transmission [8,13,22].However, most of the infected fraction of the human
population only exhibits sub-acute symptoms so they donot always obtain medical care, even where it is readilyavailable [23,24]. These carriers of chronic, mildly symp-tomatic malaria infection thus act as the silent reservoirof infection because even low, often sub-patent levels ofparasitaemia are sufficient to infect mosquitoes [25-27].Additionally, asymptomatic individuals risk developingchronic anaemia and symptomatic malaria [28,29]. Acrossall levels of transmission, the majority of infections andonward transmission to mosquitoes occurs in older agegroups, even though the young often harbour the highestparasite densities, because the former comprise the bulkof the human population and vector biting rates increasewith host biomass and therefore age [20,30,31]. In suchpopulations, many individuals remain parasitaemic and in-fectious for one or more years [32-34]. Thus, in order toeliminate human-to-mosquito transmission with thera-peutic drugs, all cryptic or asymptomatic infections withina human population must be successfully terminated,
necessitating comprehensive coverage of targeted commu-nities [20,21,28,35].Essentially two broad strategies for taking malaria
chemotherapy beyond routine case management havebeen described: mass drug administration (MDA) ormass screening & treatment (MSAT), historically re-ferred to as mass blood examination [20,36]. MDA en-tails administering anti-malarials to every traceableconsenting member of a population, regardless ofwhether their malaria infection status is known orwhether they exhibit symptoms [13,20,36], while MSATtargets only confirmed parasitaemic individuals afterparasitological testing for infection status [20,36]. MDAnecessitates comprehensive coverage and failure may ac-celerate the spread of drug-resistant strains selected bystrong but incomplete selection pressure on the parasitepopulations [37,38]. MSAT has been proposed as a bet-ter alternative because treatment is limited to thosediagnostically confirmed to be infected, thus loweringtreatment costs and risks of selection for resistance[39,40]. However, the major limitation of MSAT lies inthe challenge of detecting low-density infections, whichcontribute substantially to the reservoir of infection [40].With increasing availability of more sensitive, scalablemalaria rapid diagnostic tests (RDTs) that can be usedby non-specialist community based health workers inlow-resource settings, MSAT is now logistically feasible[38,39,41,42].The concept of community-based management of
malaria stems from the recognition that human resourcedeficits amongst clinically-trained professional cadresare commonplace, so extending service delivery beyondcentralized health facilities, by mobilizing through com-munity health workers (CHW) will be required to improveaccess to appropriate management of uncomplicated mal-aria [43,44]. CHWs have demonstrated the capacity toeffectively diagnose malaria with RDTs and provide treat-ment according to the locally relevant policy and guide-lines [41,42,45,46]. The community-based diagnosis andtreatment approach has also been shown to be cost-effective [47,48], improve delivery of malaria case manage-ment overall [49-51], is well accepted by communities[52-54] and also provides a potentially valuable popula-tion–wide platform for monitoring trends in human para-sitaemia [55].However, this approach remains grossly underutilized
and understudied, with only 15 million RDTs utilized atcommunity level globally, mostly in India [56]. Thisstudy therefore evaluated the effectiveness of paidCHWs providing improved access to blood screeningand treatment services to community members, notonly when they self-reported because they felt ill, butalso through regular monthly active visits to theirhomes.

Hamainza et al. Malaria Journal 2014, 13:128 Page 3 of 19http://www.malariajournal.com/content/13/1/128
MethodsStudy areasThe study was conducted in two adjacent rural districtsof Zambia, Luangwa District in Lusaka province andNyimba District in Eastern province (Figure 1) whereperennial transmission of Plasmodium falciparum ispredominantly mediated by Anopheles funestus [57,58]at an entomologic inoculation rate (EIR) of approxi-mately 70 infectious bites per unprotected person peryear (Sikaala CH, Chinula D, Chanda J, Hamainza B,Mwenda M, Mukali I, Kamuliwo M, Lobo N, Seyoum Aand Killeen GF, personal communication).
Figure 1 Map indicating location of health facilities and associated ca
Nyimba is located 350 kilometres east of the capitalcity Lusaka and covers an area of 10,943 km2 with apopulation of approximately 86,000 residents, most ofwhom are involved in agriculture as their main liveli-hood. Nyimba is drained by three perennial rivers theLuangwa and its two tributaries the Lunsemfwa and theLukusashi, as well several streams. Nyimba spans a rangeof altitudes from 400 m to 1,200 m along the Luangwavalley with temperatures averaging 30°C and mean an-nual rainfall of 1,000 mm [59]. The population ofNyimba is served by 17 health centres and one first-levelhospital located in the centre of Nyimba town.
tchment populations enrolled in the study.

Hamainza et al. Malaria Journal 2014, 13:128 Page 4 of 19http://www.malariajournal.com/content/13/1/128
Luangwa district is located at the confluence of theZambezi and Luangwa rivers, 325 kilometres south-eastof Lusaka. The population of the Luangwa is 25,000 resi-dents, most of whom are settled along the river wherethe main economic activities are fishing and agriculture.The district covers a surface area of 3,468 km2 and lies350 to 500 metres above sea level. Luangwa has an aver-age temperature in above 35°C and a mean annual rain-fall of approximately 800 mm [59]. Luangwa has ninehealth centres, of which two have inpatient services, oneof which is located in the district central business area atLuangwa Boma and another at Katondwe Mission lo-cated about 40 km further north.
Community health workersIn Zambia, community health workers (CHWs) are aformally accepted part of the health service delivery sys-tem and are selected by the communities they serve. Inorder to qualify, they must reside within the community,be literate in English, and be available and willing to pro-vide basic care to their communities. Once selected, theyare trained for a period of six weeks in basic primaryhealthcare, mainly focusing on aspects of prevention andtreatment of common ailments as part of their healthpromotion duties. The major disease focus areas are thesimple forms of malaria, pneumonia and diarrhoea.When care is sought from the CHWs, the patient’ssymptoms are assessed and the CHWs follow the guide-lines for diagnosis and treatment. The CHWs are alsotrained how to recognize clinical danger signs and facili-tate referral of these cases to the HFs for further man-agement [60]. Each CHW is attached to the HF nearestto their community and is normally responsible forapproximately 500 of the resident inhabitants. Theclinically-trained HF staff are responsible for supervisingand mentoring the CHWs, and for supplying all theirequipment and consumables. The CHWs that partici-pated in this study were selected from available CHWsin their specific catchment areas and recruited throughtheir supervising HFs. These recruited CHWs were re-munerated at a rate of 350 Zambian Kwacha (approxi-mately US$71.58) per month. A total of three CHWs percluster (42 active CHWs) were selected to participate inthe study and re-trained for a week in malaria diagnosis(use and interpretation of RDTs), treatment (prescriptionand dosage of AL), referral procedures (recognition ofdanger signs) and reporting.
Study designThis longitudinal study was conducted, from January toDecember 2011. In each study district, seven clusters ofapproximately 165 consenting households (average num-ber of resident members per household was estimated atapproximately six [61], each of which was selected and
enrolled in order of proximity to the public-sector HFthat defined the centre of the cluster. All members ofthe household were eligible to participate except preg-nant women and children below six months of age. Theexclusion of these groups was stipulated in accordancewith national guidelines that CHWs are not allowed tomanage any condition in these select groups. Each clus-ter received the standard Ministry of Health interven-tions for malaria control in Zambia, which includedlong-lasting insecticidal nets (LLINs), diagnosis by eithermicroscopy or rapid diagnostic tests (RDTs), treatmentwith artemether-lumefantrine (AL) and intermittent pre-sumptive treatment with sulphadoxine-pyrimethamine.The LLINs were distributed through mass distributioncampaigns in 2006, 2008 and again 2009 [62], followinga project-based distribution to selected villages inLuangwa in 2005 [63] and routine delivery for pregnantwomen and under five children through the antenatalclinics at each of the health facilities in the study [64,65].Intermittent presumptive therapy in pregnancy IPTp)was also routinely provided through the antenatal clinicswith a target of 3 doses during each pregnancy [64,65].
Data collectionEach CHW recorded all patient diagnoses and responsesto pre-set questions in a malaria register book which de-tailed RDT outcomes, as well as details of age, symp-toms, use of IPTp or LLINs, and treatment of theirhouse with IRS in the previous six months. Informationon access and use of interventions was collected at anindividual level among all participants for those whogave consent to participate in the study. Active case de-tection was achieved through monthly home visits bythe CHWs to each enrolled household within theirassigned catchment areas, during which all consentingand assenting members were screened for malaria infec-tion using HRP2-based RDTs from ICT Diagnostics(ICT Malaria Pf cassette test). Between these visits, pas-sive case detection was accomplished by encouragingthose who had symptoms to seek care from either theirassigned local CHW or the nearest public sector HF. In-dividuals that escorted patients who sought care werealso tested if they were identified as members of thestudy clusters. During both active and passive visits, allstudy participants found to be positive for malaria byRDT received standard AL treatment for uncomplicatedmalaria. Those found to be febrile and negative by RDTthrough either active or passive testing systems were re-ferred to the nearest healthcare facility. In both the ac-tive and passive systems, the CHWs reported weeklysummaries via mobile phone short messaging system ofthe number of patients tested, RDT test results, AL andRDT stock status and the numbers of treatments of eachpack size (6, 12, 18 or 24 tablets) they had dispensed.

Table 1 Association of symptoms of illness with RDTpositivity, age and seasonalityiii iv
Symptom Passive surveillance Active surveillance
OR [95% CI]c Pd OR [95% CI]c Pd
Fever 5.98[5.79,6.16] <0.001 14.63[14.55,14.71] <0.001
History of fever 2.16[1.93,2.40] <0.001 2.86[2.77,2.95] <0.001
Headache 2.31[2.15,2.47] <0.001 6.83[6.77,6.90] <0.001
Cough 0.74[0.58,0.90] <0.001 1.85[1.77,1.93] <0.001
Diarrhoea 1.47[1.15,1.79] 0.017 2.04[1.86,2.21] <0.001
Vomiting 3.01[2.74,3.27] <0.001 6.61[6.43,6.80] <0.001
Chest pain 0.88[0.56,1.20] 0.447 1.47[1.31,1.64] <0.001
Breathing problems 1.78[−8.61,12.16] 0.914 7.99[6.47,9.52] 0.008
Hamainza et al. Malaria Journal 2014, 13:128 Page 5 of 19http://www.malariajournal.com/content/13/1/128
Data management and statistical analysisThe principal data sources for this study were the CHWmalaria registers and health facility reports sent toNMCC through the malaria rapid reporting system plat-form [66] via the Airtel™ mobile phone network in thetwo districts. To ensure data quality and full disaggrega-tion, the line-listed data from the malaria registers weredouble-entered and verified, reconciled and then cleanedfollowing descriptive frequency analysis of the distribu-tions of values for each variable. Statistical analysis wasaccomplished using SPSS version 20 (IBM) and R ver-sion 2.14.1 augmented with the lattice, Matrix andLME4 packages.
Other symptoms 0.87[0.46,1.28] 0.510 0.98[0.81,1.15] 0.809iiic – odds ratio with 95% confidence intervals, d – p-value.ivThe association of clinical symptoms with malaria infection as determinedby RDT positivity was determined by logistic regression with GLMMscontrolling for age and seasonality as fixed effects and for date, individualnested in CHW and CHW nested in cluster location as random effects.
Association of malaria infection with age, sex, symptoms,interventions, cluster and seasonGeneralized linear mixed models (GLMM) were used toevaluate the association between observed RDT-determinedmalaria infection status as a binary dependent variable withan intercept, age category (<1, 1 to 4, 5 to 10, 11 to 14, 15to 24, 25 to 44 and >45 years of age), sex, access to anLLIN, use of an LLIN, having slept in a house that had beentreated with IRS in the previous six months, and the threeseasons (hot and wet from December to April, cool and dryfrom May to August, and hot and dry from September toNovember) as categorical independent variables. All modelsincluded household identity number nested within CHWcatchment nested within cluster, as well as date of partici-pant contact, as random effects, with the exception onemodel lacking an intercept in which cluster was treated as acategorical independent variable to determine the meandiagnostic positivity of each cluster. The final model pre-sented in Additional file 1 was selected by building themodel through adding explanatory variables to the modelone at a time, assessing improvements of the goodness offit using log-likelihood tests and retaining only those pa-rameters that either had significance in the model or whichsignificantly improved the goodness of fit as per principle ofparsimony [67].
Association of malaria infection with clinical symptomsWhile several symptoms were indeed positively associ-ated with P. falciparum infection, these were excludedfrom the final model that captures the effects of most ofthe variables presented in Additional file 1 simply be-cause they are an effect, rather than a cause, of malariaso they cannot be regarded as underlying independentdeterminants of malaria risk. Instead, the association ofthese symptoms with malaria infection was assessed asfollows, using separate GLMMs treating the presence orabsence of each symptom as the binary dependent vari-able and malaria infection diagnostic result as a binary,categorical, independent explanatory variable (Table 1).
Each model also included age, sex and season as add-itional categorical independent variables and individualstudy participants nested within CHW catchment,nested again within clusters as random effects. Eachmodel was selected to include only variables, which weresignificant or significantly improved the goodness of fit,as described above for the models of malaria infectionrisk (Additional file 1).
Cost per case diagnosed and treatedThe approximate cost of diagnosis and treatment of mal-aria parasite infection through either the CHW or healthfacility systems was calculated separately. For the CHWs,this was split into two arms: active and passive. Thecosts incorporated into our calculations were personneltime, RDTs, microscopy where available, anti-malarialdrugs and sundry maintenance, transport and consum-ables. Personnel time included an assumed 30% full timeequivalent (FTE) contribution to malaria diagnosis andtreatment by all personnel based at the HF and theCHWs were assumed to have allocated 90% and 10%FTE contributions to the active and passive service de-livery arms. The cost of diagnosis was estimated by themultiplying the unit cost (US$0.31 per RDT and US$1.30 per microscopy test) [68,69] of each diagnosticmethod by the number of tests done. The cost of drugswas estimated by multiplying the total number of treat-ments dispensed by the average Zambian malariaprogramme unit cost of US$1.38. Annual remunerationcosts for all the CHWs are calculated based on theirmonthly remuneration of US$71.58 (ZMW 350) permonth per CHW and the number of person months forwhich they were engaged over the course of the study.Annual costs of remuneration for health facility staffwere collated from the medium term expenditure

Hamainza et al. Malaria Journal 2014, 13:128 Page 6 of 19http://www.malariajournal.com/content/13/1/128
frameworks of the two district medical offices, totallingUS$281,150 (ZMW 1,377,600). Total personnel andother facility maintenance costs were calculated by div-iding the total number of times all study participants/patients were appropriately diagnosed and treated. Sub-sequent estimates of cost per case diagnosed and treatedwere made by adding personnel time, costs of diagnosisand treatment per case and facility maintenance costs. Itwas not possible to estimate capital costs for either theCHW or health facility systems, so these were excludedfrom these calculations. Calculations of directly observedcosts were based on those recorded over the six monthsfrom April to September 2011 when all the CHW andHF were fully functional but before IRS was introducedas a possible confounding effect. A projected per capitacost estimate for a year was then estimated by doublingthese six month cost estimates. Furthermore a projectedpotential cost per capita for implementing such anequivalent CHW programme but complete complianceof the catchment population with monthly testing wasalso calculated. Annual per capita cost estimates for theactual and enhanced-participation scenarios were alsocalculated for scenarios in which transmission is reducedto levels where treatment costs were negligible.
Population attributable fraction of symptoms to malariainfectionThe proportion of cases of each specific clinical symp-tom identified within the population by the CHWs thatcould be attributed to RDT-detectable malaria infectionswas estimated as follows [3]:
λ ¼ p R−1ð Þ=R
Where λ is the attributable fraction, p is the diagnosticpositivity and R is the odds ratio of symptom associatedwith malaria infection. This formula was separately ap-plied to both the active and passive surveillance data ob-tained through the CHWs.
Ethical approvalEthical approval was obtained from the University ofZambia, Biomedical Research Ethics Committee (Refer-ence 004-05-09) and the Research Ethics Committee ofthe Liverpool School of Tropical Medicine (Approval09.60). Authority to conduct the study was also obtainedfrom the Ministry of Health in Lusaka, Zambia.
ResultsRates of participation and testing through health facilitiesand community health workersFrom a combined catchment population of 77,754 forLuangwa and Nyimba, there were approximately 75,791outpatients visits attended to at the 14 enrolled HFs in
2011. Seasonal patterns of testing for malaria at HFswere roughly similar and peaked at approximately thesame time of the year in both districts, with an overallmean rate of testing for malaria infection of 56%. Meanmonthly testing rates were 36.9% (range = 0% to 100%)for patients in Luangwa and 69.3% (range =0% to 100%)in Nyimba (Figure 2A and C) so the proportion of pa-tients in which malaria was suspected and tested for wasapproximately twice as high in Nyimba as Luangwa.A total of 14 population clusters centred around these
HFs, with enrolled populations that ranged from 753 to1,243, were established and followed up over a period ofone full calendar year in 2011 from January to Decemberfor Luangwa District, and April to December for Nyimbadistrict. A total of eight and 12 monthly rounds of activehousehold visit surveys were conducted by each CHWin Nyimba and Luangwa, respectively, to test and treatall consenting residents within these population clusters.A total population of 17,543 individuals participated byconsenting to testing during the active monthly house-hold visits, of whom 20% were under the age of five.During the same period a total of 3,804 individuals, ofwhom 24% were under the age of five, sought care andwere tested when they self-reported to the CHW, the re-sults of which were then recorded as a passive surveil-lance indicator (Additional file 1). Slightly more femalesparticipated in both the active and passive visits thanmales (Additional file 1), presumably because femaleswere more accessible during the active household visits,and sought care more frequently from CHWs throughtheir passive service provision role, than males becausethey spent most of their time at home [70]. The CHWsreferred a total of 577 and 631 patients detected throughpassive and active surveillance systems, respectively, tothe health facilities for further management. The mainreasons provided for referral were the inability by theCHWs to manage some of the conditions presented tothem by the patients, RDT positive results for pregnantwomen, lack of patient improvement while on malariatreatment and insufficient AL stocks in the hands of thatCHW for him or her to provide treatment directly. Overthe same period 42,389 and 932 suspected malaria caseswere tested by RDT and microscopy, respectively, and20,794 were treated for malaria through the health facil-ities in these clusters.Introduction of CHWs for screening and treating of
residents captured a higher proportion of the popula-tions they covered than the HFs they were based nearto, overwhelmingly through active monthly visits to thehousehold rather than passive reporting (Figure 2A and C).This can be readily explained by the fact that these 14 HFscovered a total catchment population of 77,754 people,equivalent to 58.8% of the combined population of the twodistricts, while a total of 42 CHWs were assigned a total
Health Facilities
Community Health Worker
Passive testing of self reporting patients
Active testing of residents during monthly household visits
0
10
20
30
40
50
60
0
10
20
30
40
50
60
70
80
BA
UL
AT
ION
TE
ST
ED
(%)
GP
OP
UL
AT
ION
TE
ST
ED
(%)
LU
AN
GW
AD
IST
RIC
T
0
Jan
Fe
bM
arA
prM
ay Jun
Jul
Aug
Se
pO
ctN
ovD
ec
Jan
Fe
bM
arA
prM
ay Jun
Jul
Aug
Se
pO
ctN
ovD
ec
11020102
30
40
50
60
0
Jan
Fe
bM
arA
prM
ay Jun
Jul
Aug
Se
pO
ctN
ovD
ec
Jan
Fe
bM
arA
prM
ay Jun
Jul
Aug
Se
pO
ctN
ovD
ec
11020102
30
40
50
60
70
80
C D
OR
TIO
NO
FC
AT
CH
ME
NT
PO
P
DIA
GN
OS
ED
INF
EC
TE
DA
MO
N
BA
DIS
TR
ICT
0
10
20
Jan
Fe
bM
arA
prM
ay Jun
Jul
Aug
Se
pO
ctN
ovD
ec
Jan
Fe
bM
arA
prM
ay Jun
Jul
Aug
Se
pO
ctN
ovD
ec
11020102
0
10
20
30
Jan
Fe
bM
arA
prM
ay Jun
Jul
Aug
Se
pO
ctN
ovD
ec
Jan
Fe
bM
arA
prM
ay Jun
Jul
Aug
Se
pO
ctN
ovD
ec
11020102
PR
OP
PR
OP
OR
TIO
N
TIME (Calendar month)
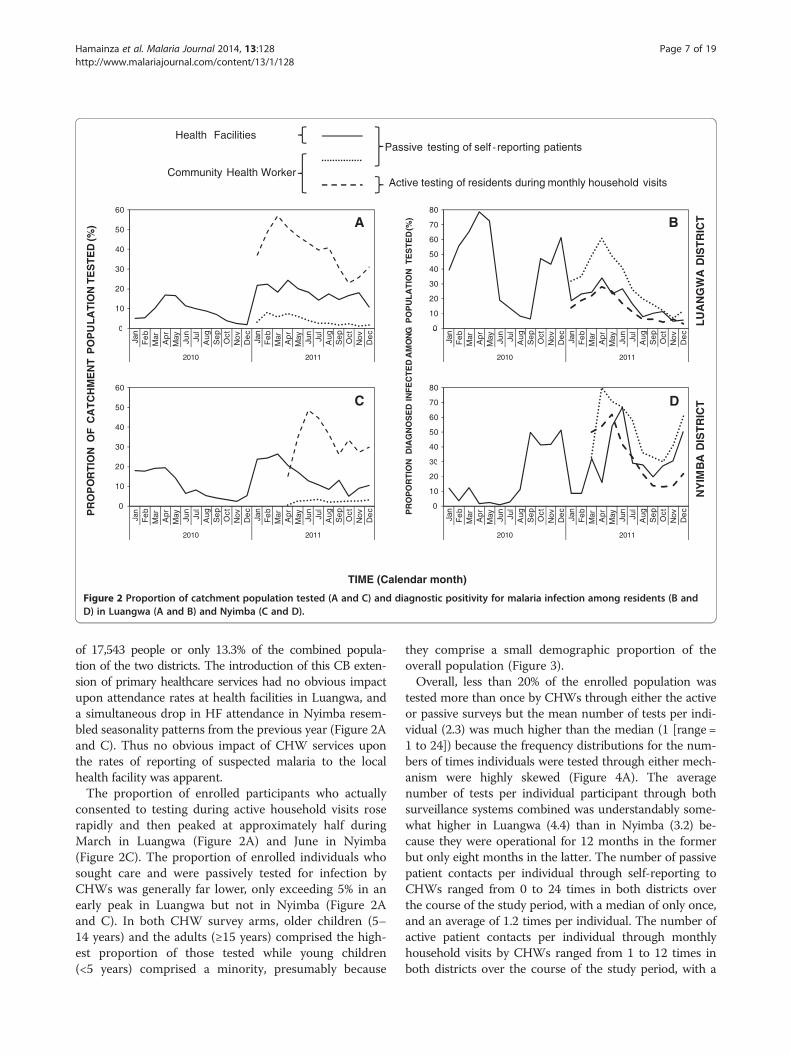
NY
IM
Figure 2 Proportion of catchment population tested (A and C) and diagnostic positivity for malaria infection among residents (B andD) in Luangwa (A and B) and Nyimba (C and D).
Hamainza et al. Malaria Journal 2014, 13:128 Page 7 of 19http://www.malariajournal.com/content/13/1/128
of 17,543 people or only 13.3% of the combined popula-tion of the two districts. The introduction of this CB exten-sion of primary healthcare services had no obvious impactupon attendance rates at health facilities in Luangwa, anda simultaneous drop in HF attendance in Nyimba resem-bled seasonality patterns from the previous year (Figure 2Aand C). Thus no obvious impact of CHW services uponthe rates of reporting of suspected malaria to the localhealth facility was apparent.The proportion of enrolled participants who actually
consented to testing during active household visits roserapidly and then peaked at approximately half duringMarch in Luangwa (Figure 2A) and June in Nyimba(Figure 2C). The proportion of enrolled individuals whosought care and were passively tested for infection byCHWs was generally far lower, only exceeding 5% in anearly peak in Luangwa but not in Nyimba (Figure 2Aand C). In both CHW survey arms, older children (5–14 years) and the adults (≥15 years) comprised the high-est proportion of those tested while young children(<5 years) comprised a minority, presumably because
they comprise a small demographic proportion of theoverall population (Figure 3).Overall, less than 20% of the enrolled population was
tested more than once by CHWs through either the activeor passive surveys but the mean number of tests per indi-vidual (2.3) was much higher than the median (1 [range =1 to 24]) because the frequency distributions for the num-bers of times individuals were tested through either mech-anism were highly skewed (Figure 4A). The averagenumber of tests per individual participant through bothsurveillance systems combined was understandably some-what higher in Luangwa (4.4) than in Nyimba (3.2) be-cause they were operational for 12 months in the formerbut only eight months in the latter. The number of passivepatient contacts per individual through self-reporting toCHWs ranged from 0 to 24 times in both districts overthe course of the study period, with a median of only once,and an average of 1.2 times per individual. The number ofactive patient contacts per individual through monthlyhousehold visits by CHWs ranged from 1 to 12 times inboth districts over the course of the study period, with a

60
70
80
90
100
60
70
80
90
100
Under 5 years of age 5 to 14 years of age 15 years of age and above
ED
(%
) BA
TE
CT
ION
LUANGWA DISTRICT NYIMBA DISTRICT
0
10
20
30
40
50
Jan Feb Mar Apr May Jun Jul Aug Sep Oct Nov Dec0
10
20
30
40
50
Jan Feb Mar Apr May Jun Jul Aug Sep Oct Nov Dec
80
90
100
80
90
100
FC
OV
ER
ED
PO
PU
LA
TIO
NT
ES
T
DC
PA
SS
IVE
DE
TN
0
10
20
30
40
50
60
70
80
Jan Feb Mar Apr May Jun Jul Aug Sep Oct Nov Dec0
10
20
30
40
50
60
70
80
Jan Feb Mar Apr May Jun Jul Aug Sep Oct Nov Dec
PR
OP
OR
TIO
NO
AC
TIV
ED
ET
EC
TIO
N
TIME (Calendar month)
Figure 3 Age and proportion of covered population tested for malaria infection each month as contacted passively (A and B) andactively (C and D) by community health workers in Luangwa (A and C) and Nyimba (B and D).
Hamainza et al. Malaria Journal 2014, 13:128 Page 8 of 19http://www.malariajournal.com/content/13/1/128
median of only once, and an average of 2.6 times perindividual.
Comparative rates of malaria infection diagnosis byhealth facilities and community health workersOverall, the majority of occasions when residents soughtcare through the passive detection systems of the HFs(44%) and CHWs (57.5%) did not have malaria parasiteinfections (Figure 2B and D). Nevertheless from the totalstudy population, more than 14,000 uncomplicatedmalaria infections were identified by CHWs over thecourse of 2011 with the vast majority (84.1%) of thesebeing detected through the active household visits ratherthan through self-reporting to a CHW for passively of-fered service (Additional file 1). While the HFs detectedeven more malaria infections over the course of thesame year (37,204), these were drawn from much largercatchment populations so the overall rate of detection ofcases of malaria infection per head of population cov-ered was highest for the active surveys of the CHWs,followed by passive surveys at the HFs and CHWs(1.16,0.40 and 0.14 diagnostically confirmed malariainfections per person per year) (Table 3). The overall
incidence rates for detected and diagnostically confirmedmalaria infections, broken down by district were 1.13and 1.51 cases per person per year for Luangwa andNyimba, respectively.The overall diagnostic positivity, or proportion of diag-
nostic tests which confirmed malaria infection, was gener-ally far higher among patients seeking diagnosis andtreatment through the routine services offered passivelyby either the HF or the CHWs than among those screenedactively through the monthly household visits of theCHWs (Additional file 1, Figure 2B and D). This waspresumably because self-reporting patients obviouslypresent a sample that is strongly biased towards thosewho are actually ill at the time. Diagnostic positivityobserved at the healthcare facilities fluctuated seasonally,peaking at the end of the rainy season in April and Mayand reaching its lowest point at the end of the dry seasonin September and October, with a mean of 17.2% inLuangwa (range 4.8% to 34.1%) and 31.0% in Nyimba(range 8% to 67%). The wide range of diagnostic positivityin these study sites is comparable to what has been ob-served in other malarious parts of Zambia [71,72] andmay be considered reasonably representative of the range

6,000
7,000
8,000 A
Mean = 2.3
0
1,000
2,000
3,000
4,000
5,000
0 1 2 3 4 5 6 7 8 9 10 11 12 13 14 15 16 17 18 19 20 21 22 23
10
15
20
25
30
35 B
0
5
10
0 1 2 3 4 5 6 7 8 9 10 11 12 13 14 15 16 17 18 19 20 21 22 23
Figure 4 Frequency histogram of the number of study participant contacts for each total number of preceding malaria infection testsby community health workers per individual study participant (A) and the relationship between the proportion of those participantsdiagnosed as being infected and the cumulative number of diagnostic tests for malaria infection per individual participant (B).
Hamainza et al. Malaria Journal 2014, 13:128 Page 9 of 19http://www.malariajournal.com/content/13/1/128
of transmission across most endemic parts of the country.Considerable geographical heterogeneity was also ob-served in the diagnostic positivity rates obtained throughthe CHWs, especially those from their active householdsurveys that were less biased towards infected individuals,with the lowest being in the two most urbanized clustersof Luangwa District (Additional file 1). Seasonal patternsof diagnostic positivity at HFs, expressed as the propor-tion of all patients tested diagnostically with RDTs or mi-croscopy who were confirmed to be infected, differedappreciably between the two districts with no particularlyconsistent similarities or dissimilarities from 2010 to 2011(Figure 2B and C). The seasonality patterns of diagnosticpositivity among residents tested by CHWs closely paral-leled those tested by HFs in Luangwa and even precededthem by a month or two in Nyimba (Figure 2) where accessto HFs was more challenging, especially during the rains.
Furthermore, the estimated mean diagnostic positivity ofboth passive and active surveillance of the CHWs werestrongly and positively correlated with those observedthrough passive surveillance at the HFs across both districts(Figure 5) and were, therefore, highly consistent with eachother as measures of malaria infection. Interestingly, diag-nostic positivity rates reported by CHWs were much moreclosely associated with those reported by HFs in Luangwathan in Nyimba (Figure 5) where access to HFs is far moredifficult for this more scattered population.
Demographic, geographic and vector controldeterminants of malaria infection burdenMalaria infection among residents tested by the CHWswas associated with age, sex, season, geographical loca-tion and coverage with vector control in the form ofLLINs and IRS, as well as the number of times each

60
70
80
A
Generalized linear mixed model fit (Table 1):
Nyimba
LuangwaObserved:
0
10
20
30
40
50
0 20 40 60 80 100
PA
SS
IVE
DE
TE
CT
ION
80
B
CO
MM
UN
ITY
BA
SE
D D
IAG
NO
ST
IC P
OS
ITIV
ITY
(%
)
AC
TIV
E D
ET
EC
TIO
N
10
20
30
40
50
60
70
HEALTH FACILITY DIAGNOSTIC POSITIVITY (%)
00 20 40 60 80 100
Figure 5 Association of diagnostic positivity for malariainfection among patients attending health facilities withdiagnostic positivity recorded by community health workersthrough passive (A) and active (B) participant contacts.
Hamainza et al. Malaria Journal 2014, 13:128 Page 10 of 19http://www.malariajournal.com/content/13/1/128
individual had been tested previously and, in most cases,treated for malaria (Additional file 1). Malaria infectionburden among patients self-reporting to the CHWthrough the passive surveys peaked in exactly the sameage category as those tested during their active monthlyhousehold visits (Additional file 1), confirming that es-sentially the same population was being monitored byboth systems. Risk of infection peaked in older childrenand was least among infants and the oldest adults andfemales were slightly at less risk than males (Additionalfile 1). Malaria infection probability was far higher in thehot and wet season, and the cool and dry season, than inthe hot and dry season (Additional file 1).The majority of study participants who reported using
an LLIN when they were tested by a CHW (72% (2,738/3,804) for passive contacts and 70.1% (12,295/17,543) foractive contacts) had lower diagnostic positivity, consist-ent with the protective effect expected. However, indi-viduals living in the 9 clusters that were treated with IRStowards the end of 2011, whose houses were actuallysprayed, had higher diagnostic positivity, even whentime, location and household effects were controlled for(Additional file 1). Rather than conclude that IRS actu-ally increases malaria risk, it may be presumed that these
estimates from best-fit models are probably a spuriousartefact arising from endogeneity caused by logically anddeliberately biased deployment of IRS to areas withineach cluster with highest disease burden by the DistrictMedical Offices tasked with implementing malaria con-trol activities. Specifically, the IRS teams in both districtsdeliberately started spraying the most isolated villages atthe fringes of the enrolled population clusters first sothat these could be completed before arrival of the rainsand associated limited access.
Association of malaria infection with clinical symptoms ofillnessA substantial proportion of all residents who reportedno symptoms whatsoever were found to carry malariaparasite infection; 12% (5,123/42,881) and 27% (286/1,062) of the active and passive contacts, respectively.Discussions with CHWs confirmed that essentially allasymptomatics who were tested through passive con-tacts were those friends, relatives and caregivers whohad escorted a patient to see the CHW and were alsotested during such a visit. The overall number and pro-portion of all patient contacts which were classified asasymptomatic malaria infection detected by CHWs wasapproximately twice as high among residents testedthrough in active surveillance [8.8% (5,123/58,500)] ra-ther than passive [5.4% (286/5,261)]. The proportion ofconfirmed malaria cases identified through activemonthly surveys by CHWs who apparently exhibited nosymptoms whatsoever was only 43% (5,123/11,851), con-firming that most detectable malaria infections arechronic, but nevertheless associated with substantial, ifnon-severe, symptoms at the time they are surveyed.Malaria infection was associated with all specificallyassessed symptoms, and even with the “other symptoms”category among residents screened during active house-hold visits by CHWs, and most of these associationscould also be detected using data collected passivelyfrom self-reporting patients (Table 1). The symptomsmost strongly associated with malaria infection werefever, a history of fever in the last month, headache andvomiting, with the former being the highest reported inboth surveillance arms (Table 1). The reverse was alsofound to be true as all symptoms were associated withRDT-detected malaria infection in both active and pas-sive CHW surveys, except for breathing problems andsundry other symptoms, using the passive surveys datawith limited sample size (Table 1). More than half of allcases of fever and vomiting, and more than a quarter ofall cases with history of fever, headache and diarrhoea,among residents tested during active CHW visits to theirhouseholds were attributable to malaria infection (Figure 6).The positive association of cough with detectable infectionin the active visits, contrasting with a negative association

A
B
Figure 6 Fractions of risk for reported clinical symptoms whichare attributable to malaria infection detected by communityhealth workers through active (A) and passive (B)contact events.
Hamainza et al. Malaria Journal 2014, 13:128 Page 11 of 19http://www.malariajournal.com/content/13/1/128
in passive surveys that is more difficult to rationalize(Table 1, Figure 6), may reflect an interactive effect uponpatient reporting rather than the manifestation of thesymptom itself, resulting in under-reporting of coughamong patients reporting to CHWs because they were in-fected with malaria.
Association of malaria infection status and clinicalsymptoms of illness with malaria testing frequencyOnly one study participant was tested 24 times by CHWsduring both active and passive visits combined. Diagnosticpositivity for malaria was negatively associated with thenumber of times that participant had been previouslytested, and in most cases, treated (Additional file 1,Figure 4B). For the small proportion of individuals whoreceived 12 tests during a single calendar year, diagnosticpositivity through active surveys was estimated to be 5.4%in their last test, compared with 32% for those tested forthe first time. Diagnostic positivity was therefore propor-tionally 83% lower for the 12th test of those who partici-pated at least that often, and this trend towards lowerdiagnostic positivity continued downward for who weretested even more frequently (Figure 4B). A similarphenomenon was observed with regard to manifestation ofsymptoms, with much lower rates of occurrence observed
for all reported clinical symptoms except cough amongindividuals who had been repeatedly tested and treated formalaria (Figure 7). Interestingly, even when RDT-diagnosedinfection status is accounted for by adding this independentvariable to the models depicted in Figure 7, the number oftimes an individual had been previously tested remainedpredictive of fever (P <0.001), history of fever (P <0.001),headache (P < 0.001), diarrhoea (P < 0.001), chest pain(P < 0.001), breathing problems, vomiting (P < 0.001) andother symptoms (P < 0.001). Taken at face value, these ob-servations appear to suggest that screening and treatmentmay not only reduce probability of infection with malaria atdetectable parasite densities (Figure 4B), but also persistentsub-patent infections that contribute to symptoms of illnessdespite parasite densities too low to be detected (Figure 7).However, testing frequency was not assigned to distincttreatment groups or experimentally controlled in any otherway so these associations are purely observational andcausality cannot be directly inferred. For example, theseobservations might also be explained by co-association oftesting frequency, malaria infection and symptoms of illnesswith unrecorded health-conscious behaviours that are notaccounted for in the model described in Additional file 1.Indeed, the test results at first active visit did seem toslightly influence of the number of subsequent tests so thetrends observed in Figures 4B and 7 should be cautiouslyinterpreted: individuals whose first test yielded a negativeresult had a slightly greater mean number of tests over thecourse of the study (4.65 ± 0.03 versus 4.11 ± 0.05, P < 0.001by GLMM).Despite the impressive negative association of repeated
testing and treatment with the probabilities of infectionand symptoms among individuals, no dramatic impactupon these parasitological and clinical outcomes wereobvious and a total incidence rate of 1.7 detected infec-tions per head of population persisted (Figure 2, Table 3).As illustrated in Figure 4A, the mean number of timesparticipants were tested was 2.3, so even if the relationshipbetween number of preceding tests and diagnostic positiv-ity is causal, rather than merely co-associated, too fewparticipants were tested regularly enough for any dramaticimpacts to be observed at population level: Those whohad the mean number of tests would be expected to main-tain a mean diagnostic positivity of 23.7% at the end of theyear, only 17.9% lower proportionally than those testedonly once (Figure 4B). Even if direct impact of testing andtreatment upon infection probability is assumed, andcomprehensive monthly testing could be achieved in thefuture, this would still be expected to leave sufficient levelsof parasitaemia at population level to maintain endemictransmission (Figure 4A and B) [73]. The intensity ofpersisting transmission reflected in the measured EIR,despite considerable levels of vector control, is alsoreflected in measured rates of re-infection among humans:

0
5
10
15
20
25
0
5
10
15
20
25
0
5
10
15
20
25
0
5
10
15
20
25A DCBFEVER HISTORY OF FEVER HEADACHE COUGH
SY
MP
TO
M(%
)
0
1
2
3
4
5
0
0 1 2 3 4 5 6 7 8 9 10
11
12
0
0 1 2 3 4 5 6 7 8 9 10
11
12
0
0 1 2 3 4 5 6 7 8 9 10
11
12
0
0 1 2 3 4 5 6 7 8 9 10
11
12
DIARRHEA VOMITTING CHEST PAIN BREATHING PROBLEMS
PR
OP
OR
TIO
NW
ITH
E HGF
0
1
2
3
4
5
0
1
2
3
4
5
0
1
2
3
4
5
0
0 1 2 3 4 5 6 7 8 9 10
11
12
NUMBER OF PRECEEDING TESTS PER INDIVIDUAL
0
0 1 2 3 4 5 6 7 8 9 10
11
12
0
0 1 2 3 4 5 6 7 8 9 10
11
12
0
0 1 2 3 4 5 6 7 8 9 10
11
12
Figure 7 Relationship between the proportion of participant contacts with community health workers in which they experienced fever(A), history of fever (B), headache (C), cough (D), diarrhea (E), vomiting (F), chest pain (G) and breathing problems (H) and thecumulative number of preceding diagnostic tests for malaria infection per individual participant.
Hamainza et al. Malaria Journal 2014, 13:128 Page 12 of 19http://www.malariajournal.com/content/13/1/128
Over the course of the study period, CHWs detected asmany as eight malaria infections in a single study participantdetected through passive surveillance, while the maximumwas nine infections in a single participant as detectedthrough active surveillance (Figure 4A).
Adherence of CHWs to diagnosis and treatmentguidelinesPatterns of diagnosis and treatment differed between pa-tients seeking care at HFs or from CHWs, as well as res-idents consenting to being tested by CHWs during their
Figure 8 Community health worker and health facility staff treatment
active household visits (Figure 8, Table 2). Adherence tonational guidelines for diagnosis and treatment weregenerally good among CHWs with 78% of all contactsthat resulted in an RDT test being followed by an appro-priate decision to treat or not (Figure 8). The remainderwas primarily accounted for by diagnostically confirmedcases of malaria infection that could not be treated be-cause the CHW had run out of the drug, and also be-cause small proportions of patients were treated in theabsence of a diagnostic result or despite a negative diag-nostic result (Figure 8, Table 2). More worryingly, only
and diagnostic practice in relation to national guidelines.

Table 2 Compliance to diagnostic and treatment policy – Community based and facility based (April to September 2011)v
Facility based Community based Community & facilitybased
Passive Passive Active Passive and active Passive and active
Al dispensed No Yes Total No Yes Total No Yes Total No Yes Total No Yes Total
Tested by Test result
Rdt Negative 11,024 3,046 14,070 1,518 16 1,534 24,878 517 25,395 26,396 533 26,929 374,20 3,579 40,999
Positive 0 15,306 15,306 111 1,260 1,371 7,012 10,149 17,161 7,123 11,409 18,532 7,123 26,715 33,838
Microscopy Pegative 204 55 259 n/a n/a n/a n/a n/a n/a n/a n/a n/a 204 55 259
Positive 0 262 262 n/a n/a n/a n/a n/a n/a n/a n/a n/a 0 262 262
Rdt or microscopy Negative 11,228 3,101 14,329 1,518 16 1,534 24,878 517 25,395 26,396 533 26,929 37,624 3,634 41,258
Positive 0 15,568 15,568 111 1,260 1,371 7,012 10,149 17,161 7,123 11,409 18,532 7,123 26,977 34,100
Not tested 17,541 3,158 20,699 185 3 188 2,845 18 2,863 3,030 21 3,051 20,571 3,179 23,750
Total 39,997 40,496 80,493 3,443 2,555 5,998 66,625 21,350 87,975 70,068 23,905 93,973 110,065 64,401 174,466vTreatment practice based on confirmatory RDT result was assessed between April and September as this was the period of time when all the CHW based active& passive surveillance and the health facility based passive system were all fully functional.
Hamainza et al. Malaria Journal 2014, 13:128 Page 13 of 19http://www.malariajournal.com/content/13/1/128
53% of patients attending HFs were tested and thentreated or not treated appropriately to the test result,primarily because a substantial proportion were neithertested nor treated but also because small proportionswere treated in the absence of a test or despite a nega-tive test (Figure 8, Table 2). So, consistent with reportsfrom other settings in Zambia [41,42,46,74] and beyond[49,75,76], the CHWs had greater adherence to policyguidelines on treatment practices in relation to diagnos-tic test results than specialist staff at HFs (Figure 8,Table 2). The proportion of patient contacts resulting ina negative RDT test result, or assessed only clinicallywithout a confirmatory diagnostic test, that were treatedwith AL were both at least six times higher at HFs thanCHWs (Figure 8). CHW provision of treatment to patientswith a negative test result was twice as high in the activecompared with passive but in both cases this occurredonly very rarely. All confirmed cases of malaria infectionreporting to health facilities received treatment with ALand the same was true for 92% of those identified passivelyby CHWs but only 59% among those identified throughactive household visits (Table 2, Figure 8). In most caseswhere CHWs did not provide treatment for RDT-positivepatients, this was because they lacked AL and those pa-tients were referred to the HFs to collect curative drugs.
Testing and treatment service delivery, cost and cost-effectivenessAs detailed in Table 3, expenses associated with personneland commodities are important components of the overallcost of providing malaria diagnosis and treatment servicesthrough either HFs (49%) or CHWs (25%). Sundry trans-port and maintenance expenses also contributed substan-tially to the overall cost of the HFs but not the CHWs.The overall cost of HFs was three-fold higher than theCHW approach but was less expensive than CHWs per
head of population covered, because the HFs were assignedto cover far larger catchment populations while the CHWssimply provided far more frequent testing and treatmentservice to each resident through the active surveys con-ducted through monthly household visits (Table 3). If thesame frequency of testing were implemented in a pre-elimination scenario [77,78] where improved vector controlreduced drug treatment requirements to negligible levels,this would save only a quarter of the overall costs of provid-ing these HF or CHW services. Because of the lowerpersonnel, transport and maintenance costs of the CHWs,combined with their better compliance with national guide-lines, both the passive and active services provided by theCHWs were almost twice as cost-effective in terms of costper diagnostically confirmed case identified and treated.If community participation could be dramatically im-
proved to ensuring the average resident is tested at leastonce per month, and the trend observed in Figure 4B isassumed to represent impact of frequent testing andtreatment upon infection status, the cost and cost-effectiveness of detecting and treating this diminishingcase load would approximately double, even in a pre-elimination scenario where improved vector controlwould negate treatment costs (Table 3).
DiscussionDespite the fact that only a quarter of the covered resi-dent population agreed to be tested in each monthlyround of household visits by the CHWs, these activesurveys by modestly remunerated paid CB staff identi-fied >11,000 malaria parasite infections in a populationof <18,000 residents in a single calendar year, of whommore than half were symptomatic in or around the timethey were visited and may not have otherwise soughtcare. The far higher sensitivity with which these activehousehold surveys by the CHWs detect cases of malaria

Table 3 Observed and potential cost-effectiveness of cases appropriately diagnosed and treatedvi vii vii ix
Health facility Community based
Directly observed process indicators over 6 months Passive Active Total
Covered community based cluster or facility catchment 77754 17543 17543 17543
Diagnostic tests carried out over six months 29897 2652 42556 45208
Diagnostically confirmed and treated cases of malaria infection over 6 months 15568 1260 10149 11409
Diagnostically confirmed and treated malaria case per head population over 6 months 0.20 0.07 0.58 0.65
Diagnostic tests per head of population over 6 months 0.38 0.15 2.43 2.58
Directly observed costs over 6 months
RDT tests conducted 29,376 2,652 42,556 45,208
Cost per test (US$) 0.31 0.31 0.31 0.31
Total RDT cost (US$) 9,113 823 13,201 14,024
Microscopy tests 521 n/a n/a n/a
Cost per test (US$) 1.30 n/a n/a n/a
Total cost of microscopy (US$) 676 n/a n/a n/a
AL treatments 21,827 1,279 10,684 11,963
Cost per treatment (US$) 1.38 1.38 1.38 1.38
Total cost of AL (US$) 30,069 1,762 14,718 16,480
Total personnel costs (US$) 281,150 18,001 18,001 18,001
Time commitment (% FTE) 30 10 90 100
Personnel costs of malaria testing and treatment 84,345 1,800 16,201 18,001
Sundry maintenance, transport and running costs for six months (US$) 43,201 103 926 1,029
Total cost for Six months (US$) 167,404 4,488 45,046 49,533
Total non-treatment costs over 6 months (US$) 137,335 2,726 30,328 33,053
Projected annual summaries at observed rates of testing & treatment
Total cost per head of population covered per year (US$) 4.31 0.51 5.14 5.65
Total non-treatment costs per head of population covered per year (US$) 3.53 0.31 3.46 3.77
Total cost per confirmed case treated (US$) 10.75 3.56 4.44 4.34
Projected potential summaries at optimized rates of active testing & treatment
Total cost per head of population covered per year (US$) 10.68
Total non-treatment costs per head of population covered per year (US$) 6.25
Total cost per confirmed case treated (US$) 8.09viUS$ 1 = ZMW 4.89, exchange rate has been rebased to fit current Zambian currency.Source: http://www.boz.zm/(S(keg4bza3j0p4fx2uixtmnibq))/FinanciaMarkestReport.aspx. Accessed 1st October 2013.viiFTE - Full Time Equivalent.viiiIn the projected annual summaries, cost per head of population was calculated by dividing the total costs by the catchment population. The cost of nontreatment is the cost of only testing such as in an elimination scenario. The cost per confirmed case if the total costs divided by the diagnostically confirmed andtreated cases of malaria infection.ixProjected potential summaries developed from assumptions that the HF and CHW passive will not change even in an optimized environment. Cost/head ofpopulation calculated by addition to observed cost of an average 9 missed active visits per person and 2 passive visits per person by the cost of RDTs andTreatment respectively. The cost per confirmed case treated is the total cost per head divided by the mean number of CHW detected infections per year of 1.3.
Hamainza et al. Malaria Journal 2014, 13:128 Page 14 of 19http://www.malariajournal.com/content/13/1/128
infection is also reflected in the observation that thissurveillance arm captured twice as high an incidencerate as the passive surveillance activities of the HFs andCHWs combined. The strong association of many symp-toms, especially fever, headache and vomiting with mal-aria infection, particularly among individuals testedduring active household visits by the CHWs, confirmsprevious reports that illustrate just how inaccurate theterm asymptomatic is in relation to widespread chronic
malaria infections [79-81] that clearly cause very largeproportions of the overall burden of clinical illness inthe community (Table 1, Figure 7). Clearly a large pro-portion of the population are infected with malaria, andsuffering from a range of mild symptoms of clinical ill-ness as a consequence, but do not feel ill enough to re-port to a HF or even to a nearby CHW to seek care. Inaddition to representing a major proportion of overallmorbidity burden among the population, these chronic

Hamainza et al. Malaria Journal 2014, 13:128 Page 15 of 19http://www.malariajournal.com/content/13/1/128
infections also act as a reservoir for continued transmis-sion [4,5,27,80,82]. Regularly scheduled household visitsby CHWs, who presumably will need to be paid for sucha full time commitment, may therefore be extremelyuseful for identifying, treating and mapping the individ-uals who harbour chronic malaria infections and consti-tute the infectious reservoir that sustain transmission[38,83,84].However, as implemented in this study, even these
monthly active household visits, repeated on a continuousmonthly survey cycle, had no obvious impact on malariainfection burden, possibly because most participants didnot consent to testing often enough to benefit from anyimpact upon malaria infection and associated symptomsthat are suggested, but not proven by, Figures 4 and 7, re-spectively. While the AL treatment used here has well-documented gametocidal properties [85-88], the limitedsensitivity of RDTs or microscopy and considerable nat-ural density fluctuations of circulating P. falciparum bloodstages mean that approximately half of all malaria infec-tions are sub-patent and escape detection by a single test-ing event [27,89,90]. Furthermore, mosquito-to-humantransmission remained remarkably high in the study area,measured as a mean EIR of approximately 70 infectiousbites per unprotected person per year [57,58]. The mostlikely explanation of the persistence of such intense trans-mission, despite reasonably high rates of LLIN use, supple-mented with IRS in selected clusters towards the end ofthis study, is probably the emergence of pyrethroid resist-ance among local populations of An. funestus [91]. Thehigh rates of re-infection suggested by these entomologicalsurveys are consistent with and confirmed by the highrates of infection incidence [92] recorded here (Table 3)despite the imperfect sensitivity of RDTs [93,94]. Giventhe imperfect detection sensitivity of RDTs [93,94] and therapid rates of re-infection that can be expected in a settingwith such a high EIR [30,95-98], it is unsurprising that atleast monthly screening and treatment is required toachieve dramatic reductions of malaria infection burden(Figure 4B), associated symptoms (Figure 7), and presum-ably transmission [27,99,100], even assuming these twofigures reflect genuine impact rather than mere associ-ation. However, it is certainly encouraging that the appar-ent impacts among residents consenting to such frequenttesting and treatment, which these associations suggest,compare very well with simulations and field data fromannual mass screen and treat programmes [40], and evensimulations and field observations of year-long mass drugadministration programmes with treatment cycles of onlyfour or even two weeks [19]. It may also be encouragingthat, despite their known limited sensitivity, RDTs appearto be sensitive enough to detect persistent malaria infec-tions if each individual is tested often enough (Figure 4B)so that the frequent sporadic surges of detectable para-
sitaemia characteristic of P. falciparum are captured[101,102]. If the observed association of parasitaemia withtesting and treatment (Figure 4B) reflects genuine impact,this also suggests patient compliance with the AL treat-ment regime used in this study was probably comparablewith high estimates (84.5%) from previous evaluations inZambia [103].Beyond extending delivery of diagnostic and thera-
peutic services to the grass roots community level, theCHWs also provided a remarkably informative source ofsurveillance data, including the overall burden and dis-tribution of malaria and associated clinical symptoms, anumber of important demographic and geographic de-terminants of risk, and the rates utilization of preventiveinterventions, such as IRS and ITNs. It is particularlyencouraging that, despite their known sensitivity limita-tions, RDTs [93,94] appear to be more than adequate formonitoring disease burden through CHW extension sys-tems that can guide programme implementation. Latentantigenaemia several weeks after successful clearance ofinfection can cause false positive results when usingHRP2 based RDTs, and therefore over-prescription ofanti-malarial drugs [104-106], so it is possible that esti-mates of cost and cost-effectiveness described in Table 3may be improved upon with better diagnostic technol-ogy. If scale up of such CHWs is affordable beyond thisresearch setting and could be scaled up across entire dis-tricts, provinces or even whole countries, such routinelycollected data reported in disaggregated form from suchsmall population subdivisions could be invaluable at alllevels of programmatic monitoring and evaluation.The costs of providing this CB extension of primary
health care services, to provide both active and passivescreening and treatment for malaria were substantive(Table 3), corresponding to 11.1% of the annual percapita health budget of Zambia in 2011 ($96) [107]. Fur-thermore, to achieve the full potential of this service byensuring community-wide engagement in screening andtreatment on at least a monthly basis (Figure 4B), thesecosts are likely to double, even if baseline levels of trans-mission were reduced to pre-elimination levels so thatthe costs of drug treatment were negated (Table 3). It ishighly unlikely, or desirable, that such a cadre of CHWswould be mobilized to deal with surveillance and controlof malaria alone so these CB personnel would also be re-quired to deal with uncomplicated forms of other com-mon illnesses like diarrhoea and pneumonia [51,54,108].Even the passively provided malaria diagnosis and treat-ment services described here would need to be aug-mented with a range of other clinical services to besupported at programmatic level [51,54]. It is thereforedifficult to envisage CHWs effectively or sustainablytaking on such substantive commitments on a purelyvoluntary basis with no remuneration whatsoever. Barely
Hamainza et al. Malaria Journal 2014, 13:128 Page 16 of 19http://www.malariajournal.com/content/13/1/128
more than a third of the overall costs of the activehousehold surveys by the CHWs were accounted for bythe cost of their meagre remuneration, and this figurewould reduce to less than a fifth if the increased com-modity costs of full compliance with monthly screeningand treatment were to be incurred through improvedcommunity participation. Paying these CHWs is there-fore not only likely to be essential to ensure their reten-tion and effectiveness as full time agents of malariainfection surveillance and control, it is also a relativelyminor fraction of the overall cost of actively deliveringextended CB primary healthcare services.Apart from its observational design, the most obvious
limitation of this study is that the majority of enrolledresidents were tested and, where appropriate, treated farless than once a month (Additional file 1, Figures 2Aand C, 3C and D, and 4A) as originally envisaged. Futureevaluations of CHWs, especially those engaged to con-duct frequent active household surveys of their entireassigned populations, should include operational re-search studies to better understand and address the limi-tations of service uptake by community membersobserved in this study.
ConclusionsThe monthly active household visits to entire communi-ties by CHWs equipped with existing field-compatiblediagnostic tools were not sufficient to eliminate thehuman reservoir of malaria infection from this ruralAfrican setting with intense transmission despite reason-ably high LLIN/IRS coverage. However, observed nega-tive associations between infection status and frequencyof testing and treatment suggest that dramatic impactupon malaria parasite infection risk and associated dis-ease burden may be achievable through far more regulartesting and treatment. Substantive alleviation of malariamay be attainable and cost-effective if the substantial,but not necessarily prohibitive, costs of implementingfrequent active CB surveys for chronic malaria infectionsare affordable to national programmes and higher levelsof community participation in regular testing opportun-ities are achievable.
Additional file
Additional file 1: Association of malaria infection with age, sex,symptoms, interventions, geographical location and season.
AbbreviationsAL: Artemether-lumefantrine; EIR: Entomological inoculation rate;CB: Community-based; CHW: Community Health Worker; HF: Health facility;IRS: Indoor residual house spraying; LLINs: Long-lasting insecticidal nets;RDT: Rapid diagnostic tests; GLMM: Generalized linear mixed model;FTE: Full time equivalent; NMCC: National Malaria Control Centre.
Competing interestsThe authors declare that they have no competing interests.
Authors’ contributionsBH, AS, CHS, HM, MK and GFK: Conceived, designed and supervised all fieldactivities of the study. AB provided the map of the study area. AB, TE andJM: Assisted in developing the data analysis plan. BH and GFK: Drafted themanuscript in consultation with the other authors, all of whom reviewed itand provided comments. All authors read and approved the final version ofthe manuscript.
AcknowledgementsWe thank the Ministry of Health, National Malaria Control Centre, Luangwaand Nyimba District Medical Offices and communities in Sinyawagora,Kasinsa, Chitope, Luangwa High School, Mphuka, Mandombe, LuangwaBoma, Kacholola, Hofmeyer, Mtilizi, Chinambi, Mkopeka and Chipembe fortheir co-operation and support. We wish to thank Dr. Peter Mwaba and Dr.Elizabeth Chizema Kawesha for their support to the successful implementa-tion of the study. The authors also wish to acknowledge the work of theMalaria Transmission Consortium Zambia project staff members. Financialsupport was provided by the Bill & Melinda Gates Foundation through theMalaria Transmission Consortium (Award number 45114) coordinated byDr. Neil Lobo and Prof Frank Collins at Notre Dame University.
Author details1Ministry of Health, National Malaria Control Centre, Chainama HospitalCollege Grounds, off Great East road, P.O. Box 32509, Lusaka, Zambia.2Liverpool School of Tropical Medicine, Vector Biology Department,Pembroke Place, Liverpool L3 5QA, UK. 3Centre for Applied Malaria Researchand Evaluation, Tulane University School of Public Health and TropicalMedicine, New Orleans, LA, USA. 4Partnership for Appropriate Technology(PATH) in Health Malaria Control and Evaluation Partnership in Africa(MACEPA), Chainama Hospital, Lusaka, Zambia. 5Ifakara Health Institute,Biomedical & Environmental Thematic Group, P.O. Box 53, Ifakara, Morogoro,United Republic of Tanzania.
Received: 24 January 2014 Accepted: 23 March 2014Published: 31 March 2014
References1. Alves FP, Durlacher RR, Menezes MJ, Krieger H, Silva LH, Camargo EP: High
prevalence of asymptomatic Plasmodium vivax and Plasmodiumfalciparum infections in native Amazonian populations. Am J Trop MedHyg 2002, 66:641–648.
2. Bottius E, Guanzirolli A, Trape JF, Rogier C, Konate L, Druilhe P: Malaria:even more chronic in nature than previously thought; evidence forsubpatent parasitaemia detectable by the polymerase chain reaction.Trans R Soc Trop Med Hyg 1996, 90:15–19.
3. Smith T, Schellenberg JA, Hayes R: Attributable fraction estimates andcase definitions for malaria in endemic areas. Stat Med 1994,13:2345–2358.
4. Babiker HA, Abdel-Muhsin AM, Ranford-Cartwright LC, Satti G, Walliker D:Characteristics of Plasmodium falciparum parasites that survive thelengthy dry season in eastern Sudan where malaria transmission is mark-edly seasonal. Am J Trop Med Hyg 1998, 59:582–590.
5. Bousema JT, Gouagna LC, Drakeley CJ, Meutstege AM, Okech BA, Akim IN,Beier JC, Githure JI, Sauerwein RW: Plasmodium falciparum gametocytecarriage in asymptomatic children in western Kenya. Malar J 2004, 3:18.
6. Jeffery GM: The role of chemotherapy in malaria control through primaryhealth care: constraints and future prospects. Bull World Health Organ1984, 62:49–53.
7. Killeen GF: A second chance to tackle african malaria vector mosquitoesthat avoid houses and don’t take drugs. Am J Trop Med Hyg 2013,88:809–816.
8. Molineaux L, Gramiccia G: The Garki project: research on the epidemiologyand control of malaria in the Sudan savanna of West Africa. Geneva,Switzerland: World Health Organization; 1980.
9. Wellems TE, Plowe CV: Chloroquine-resistant malaria. J Infect Dis 2001,184:770–776.
10. Parija SC, Praharaj I: Drug resistance in malaria. Indian J Med Microbiol 2011,29:243–248.

Hamainza et al. Malaria Journal 2014, 13:128 Page 17 of 19http://www.malariajournal.com/content/13/1/128
11. Kouznetsov R: Antimalarial Drug Requirements For National Malaria ControlProgrammes In Developing Countries, 1982–1989, Second Report. Geneva,Switzerland: World Health Organization; 1987.
12. Wernsdorfer WH: The biological and epidemiological basis of drugresistance in malaria parasites. Southeast Asian J Trop Med Public Health1992, 23(Suppl 4):123–129.
13. WHO: In Consideration Of Mass Drug Administration For The Containment OfArtemisinin-Resistant Malaria In The Greater Mekong Subregion, Report of aconsensus meeting. Edited by Heseltine E. Geneva, Switzerland: WorldHealth Organization; 2010.
14. Maude RJ, Socheat D, Nguon C, Saroth P, Dara P, Li G, Song J, Yeung S,Dondorp AM, Day NP, White NJ, White LJ: Optimising strategies forPlasmodium falciparum malaria elimination in Cambodia: primaquine, massdrug administration and artemisinin resistance. PLoS One 2012, 7:e37166.
15. Moonen B, Cohen JM, Snow RW, Slutsker L, Drakeley C, Smith DL,Abeyasinghe RR, Rodriguez MH, Maharaj R, Tanner M, Targett G:Operational strategies to achieve and maintain malaria elimination.Lancet 2010, 376:1592–1603.
16. Najera JA: Malaria control: achievements, problems and strategies.Parassitologia 2001, 43:1–89.
17. Tanner M, Vlassoff C: Treatment-seeking behaviour for malaria: a typologybased on endemicity and gender. Soc Sci Med 1998, 46:523–532.
18. McCombie SC: Treatment seeking for malaria: a review of recentresearch. Soc Sci Med 1996, 43:933–945.
19. Okell LC, Drakeley CJ, Bousema T, Whitty CJ, Ghani AC: Modelling theimpact of artemisinin combination therapy and long-acting treatmentson malaria transmission intensity. PLoS Med 2008, 5:e226. discussion e226.
20. Gosling RD, Okell L, Mosha J, Chandramohan D: The role of antimalarialtreatment in the elimination of malaria. Clin Microbiol Infect 2011,17:1617–1623.
21. Okell LC, Ghani AC, Lyons E, Drakeley CJ: Submicroscopic infection inPlasmodium falciparum-endemic populations: a systematic review andmeta-analysis. J Infect Dis 2009, 200:1509–1517.
22. von Seidlein L, Walraven G, Milligan PJ, Alexander N, Manneh F, Deen JL,Coleman R, Jawara M, Lindsay SW, Drakeley C, De Martin S, Olliaro P,Bennett S, Schim van der Loeff M, Okunoye K, Targett GA, McAdam KP,Doherty JF, Greenwood BM, Pinder M: The effect of mass administrationof sulfadoxine-pyrimethamine combined with artesunate on malariaincidence: a double-blind, community-randomized, placebo-controlledtrial in The Gambia. Trans R Soc Trop Med Hyg 2003, 97:217–225.
23. Lalchhuanawma R, Murhekar MV: Health-seeking behaviour for febrileillness in malaria-endemic Kalasib district, Mizoram, India. Int Health 2012,4:314–319.
24. Xu J-W, Xu Q-Z, Liu H, Zeng Y-R: Malaria treatment-seeking behaviour andrelated factors of Wa ethnic minority in Myanmar: a cross sectionalstudy. Malar J 2012, 11:417.
25. Bousema T, Drakeley C: Epidemiology and infectivity of Plasmodiumfalciparum and Plasmodium vivax gametocytes in relation to malariacontrol and elimination. Clin Microbiol Rev 2011, 24:377–410.
26. Dunyo S, Milligan P, Edwards T, Sutherland C, Targett G, Pinder M:Gametocytaemia after drug treatment of asymptomatic Plasmodiumfalciparum. PLoS Clin Trials 2006, 1:e20.
27. Okell LC, Bousema T, Griffin JT, Ouedraogo AL, Ghani AC, Drakeley CJ:Factors determining the occurrence of submicroscopic malaria infectionsand their relevance for control. Nat Commun 2012, 3:1237.
28. Tiono AB, Ouedraogo A, Ogutu B, Diarra A, Coulibaly S, Gansane A, SirimaSB, O’Neil G, Mukhopadhyay A, Hamed K: A controlled, parallel, cluster-randomized trial of community-wide screening and treatment ofasymptomatic carriers of Plasmodium falciparum in Burkina Faso.Malar J 2013, 12:79.
29. Prentice AM, Cox SE, Nweneka CV: Asymptomatic malaria in the etiologyof iron deficiency anemia: a nutritionist’s viewpoint. Am J Clin Nutr 2010,92:1283–1284.
30. Smith T, Killeen G, Lengeler C, Tanner M: Relationships between theoutcome of Plasmodium falciparum infection and the intensity oftransmission in Africa. Am J Trop Med Hyg 2004, 71:80–86.
31. Drakeley CJ, Akim NI, Sauerwein RW, Greenwood BM, Targett GA: Estimatesof the infectious reservoir of Plasmodium falciparum malaria in TheGambia and in Tanzania. Trans R Soc Trop Med Hyg 2000, 94:472–476.
32. Bruce-Chwatt LJ, Southgate BA, Draper CC: Malaria in the United Kingdom.Br Med J 1974, 2:707–711.
33. WHO: The Biology Of Malaria Parasites, Technical Report Series. vol. 743rdedition. Geneva: World Health Organization; 1987.
34. Bretscher MT, Maire N, Chitnis N, Felger I, Owusu-Agyei S, Smith T: The dis-tribution of Plasmodium falciparum infection durations. Epidemics 2011,3:109–118.
35. Shekalaghe SA, Drakeley C, van den Bosch S, ter Braak R, van den BijllaardtW, Mwanziva C, Semvua S, Masokoto A, Mosha F, Teelen K, Hermsen R,Okell L, Gosling R, Sauerwein R, Bousema T: A cluster-randomized trial ofmass drug administration with a gametocytocidal drug combination tointerrupt malaria transmission in a low endemic area in Tanzania. Malar J2011, 10:247.
36. WHO: Terminology Of Malaria And Of Malaria Eradication. Geneva,Switzerland: World Health Organization; 1963.
37. Greenwood B: Anti-malarial drugs and the prevention of malaria in thepopulation of malaria endemic areas. Malar J 2010, 9 Suppl 3:S2.
38. Kaneko A: A community-directed strategy for sustainable malaria eliminationon islands: short-term MDA integrated with ITNs and robust surveillance.Acta Trop 2010, 114:177–183.
39. Ogutu B, Tiono A, Makanga M, Premji Z, Gbadoe A, Ubben D, Marrast A,Gaye O: Treatment of asymptomatic carriers with artemether-lumefantrine: an opportunity to reduce the burden of malaria? Malar J2010, 9:30.
40. Crowell V, Briet OJ, Hardy D, Chitnis N, Maire N, Di Pasquale A, Smith TA:Modelling the cost-effectiveness of mass screening and treatment for re-ducing Plasmodium falciparum malaria burden. Malar J 2013, 12:4.
41. Harvey SA, Jennings L, Chinyama M, Masaninga F, Mulholland K, Bell DR:Improving community health worker use of malaria rapid diagnostictests in Zambia: package instructions, job aid and job aid-plus-training.Malar J 2008, 7:160.
42. Counihan H, Harvey SA, Sekeseke-Chinyama M, Hamainza B, Banda R,Malambo T, Masaninga F, Bell D: Community health workers use malariarapid diagnostic tests (RDTs) safely and accurately: results of a longitu-dinal study in Zambia. Am J Trop Med Hyg 2012, 87:57–63.
43. WHO: The Roll Back Malaria Strategy For Improving Access To TreatmentThrough Home Management Of Malaria. Geneva, Switzerland: World HealthOrganization; 2005.
44. WHO: In Community-Based Reduction Of Malaria Transmission, InformalconsultatIon organized by the WHO global malarIa Programme incollaboratIon wIth malarIa eradIcatIon research agenda (malERA) initiative.Edited by Heseltine E. Geneva, Switzerland: World Health Organization; 2012.
45. Hawkes M, Katsuva JP, Masumbuko CK: Use and limitations of malariarapid diagnostic testing by community health workers in war-tornDemocratic Republic of Congo. Malar J 2009, 8:308.
46. Chanda P, Hamainza B, Moonga HB, Chalwe V, Pagnoni F: Community casemanagement of malaria using ACT and RDT in two districts in Zambia:achieving high adherence to test results using community healthworkers. Malar J 2011, 10:158.
47. Chanda P, Hamainza B, Moonga HB, Chalwe V, Banda P, Pagnoni F: Relativecosts and effectiveness of treating uncomplicated malaria in two ruraldistricts in Zambia: implications for nationwide scale-up of home-basedmanagement. Malar J 2011, 10:159.
48. Pang LW, Piovesan-Alves F: Economic advantage of a community-basedmalaria management program in the Brazilian Amazon. Am J Trop MedHyg 2001, 65:883–886.
49. Yeung S, Van Damme W, Socheat D, White NJ, Mills A: Access toartemisinin combination therapy for malaria in remote areas ofCambodia. Malar J 2008, 7:96.
50. Elmardi KA, Malik EM, Abdelgadir T, Ali SH, Elsyed AH, Mudather MA,Elhassan AH, Adam I: Feasibility and acceptability of home-based man-agement of malaria strategy adapted to Sudan’s conditions usingartemisinin-based combination therapy and rapid diagnostic test. Malar J2009, 8:39.
51. Hamer DH, Brooks ET, Semrau K, Pilingana P, MacLeod WB, Siazeele K,Sabin LL, Thea DM, Yeboah-Antwi K: Quality and safety of integratedcommunity case management of malaria using rapid diagnostic testsand pneumonia by community health workers. Pathog Glob Health2012, 106:32–39.
52. Mukanga D, Tibenderana JK, Kiguli J, Pariyo GW, Waiswa P, Bajunirwe F,Mutamba B, Counihan H, Ojiambo G, Källander K: Community acceptabilityof use of rapid diagnostic tests for malaria by community healthworkers in Uganda. Malar J 2010, 9:203.

Hamainza et al. Malaria Journal 2014, 13:128 Page 18 of 19http://www.malariajournal.com/content/13/1/128
53. Ajayi IO, Falade CO, Olley BO, Yusuf B, Gbotosho S, Iyiola T, Olaniyan O,Happi C, Munguti K, Pagnoni F: A qualitative study of the feasibility andcommunity perception on the effectiveness of artemether-lumefantrineuse in the context of home management of malaria in south-westNigeria. BMC Health Serv Res 2008, 8:119.
54. Yeboah-Antwi K, Pilingana P, Macleod WB, Semrau K, Siazeele K, Kalesha P,Hamainza B, Seidenberg P, Mazimba A, Sabin L, Kamholz K, Thea DM,Hamer DH: Community case management of fever due to malaria andpneumonia in children under five in Zambia: a cluster randomizedcontrolled trial. PLoS Med 2010, 7:e1000340.
55. Rutta AS, Francis F, Mmbando B, Ishengoma D, Sembuche S, Malecela E,Sadi J, Kamugisha M, Lemnge M: Using community-owned resource personsto provide early diagnosis and treatment and estimate malaria burden atcommunity level in north-eastern Tanzania. Malar J 2012, 11:152.
56. WHO: World Malaria Report. Geneva, Switzerland: World Health Organization;2012:2013.
57. Sikaala CH, Killeen GF, Chanda J, Chinula D, Miller JM, Russell TL, Seyoum A:Evaluation of alternative mosquito sampling methods for malaria vectorsin Lowland South–East Zambia. Parasit Vectors 2013, 6:91.
58. Seyoum A, Sikaala CH, Chanda J, Chinula D, Ntamatungiro AJ, Hawela M, MillerJM, Russell TL, Briet OJ, Killeen GF: Human exposure to anophelinemosquitoes occurs primarily indoors, even for users of insecticide-treatednets in Luangwa Valley, South-east Zambia. Parasit Vectors 2012, 5:101.
59. Kasali G: Climate Change and Health in Zambia. Lusaka, Zambia: CLACCWorking Paper 2 - Capacity Strengthening in the Least Developed Countriesfor Adaptation to Climate Change: International Institute for Environmentand Development; 2008.
60. Ministry of Health: Integrated Management of Childhood Illness, Caring forNewborns and Children in the Community - A Manual for the CommunityHealth Worker. Lusaka, Zambia: Ministry of Health; 2010.
61. Central Statistical Office: 2010 Census Of Population And Housing-ZambiaPreliminary Population Figures. Lusaka, Zambia: Central Statistical Office; 2011.
62. Eisele TP, Miller JM, Moonga HB, Hamainza B, Hutchinson P, Keating J:Malaria infection and anemia prevalence in Zambia’s Luangwa District:an area of near-universal insecticide-treated mosquito net coverage. AmJ Trop Med Hyg 2011, 84:152–157.
63. Keating J, Hutchinson P, Miller JM, Bennett A, Larsen DA, Hamainza B,Changufu C, Shiliya N, Eisele TP: A quasi-experimental evaluation of aninterpersonal communication intervention to increase insecticide-treatednet use among children in Zambia. Malar J 2012, 11:313.
64. Centre NMC: Action Plan. Lusaka Zambia: National Malaria Control Centre,Ministry of Health; 2011.
65. National Malaria Control Centre: Action Plan. Lusaka, Zambia: NationalMalaria Control Centre, Ministry of Health; 2012.
66. National Malaria Control Centre: Zambia Malaria Rapid Reporting System UserManual. Lusaka, Zambia: National Malaria Control Centre, Ministry of Health; 2011.
67. Sober E: The principle of parsimony. Br J Philos Sci 1981, 32:145–156.68. Uzochukwu BS, Obikeze EN, Onwujekwe OE, Onoka CA, Griffiths UK: Cost-
effectiveness analysis of rapid diagnostic test, microscopy andsyndromic approach in the diagnosis of malaria in Nigeria: implicationsfor scaling-up deployment of ACT. Malar J 2009, 8:265.
69. United States Agenct for International Developmen: Price Analysis Of MalariaRapid Diagnostic Test Kits. Arlington, United States of America: USAID DeliverProject, U.S. Agency for International Development; 2012.
70. Diallo A, Nadam N, Moussiliou A, Dos Santos S, Ndonky A, Borderon M, Oliveau S,Lalou R, le Hesran J: Asymptomatic carriage of Plasmodium in urban Dakar: therisk of malaria should not be underestimated. PLoS One 2012, 7:e31100.
71. Ministry of Health: National Malaria Indicator Survey. Lusaka, Zambia:National Malaria Control Centre, Ministry of Health; 2010.
72. Ministry of Health: National Malaria Indicator Survey. Lusaka, Zambia:National Malaria Control Centre, Ministry of Health; 2012.
73. Smith DL, Hay SI: Endemicity response timelines for Plasmodiumfalciparum elimination. Malar J 2009, 8:87.
74. Littrell M, Gatakaa H, Evance I, Poyer S, Njogu J, Solomon T, Munroe E,Chapman S, Goodman C, Hanson K, Zinsou C, Akulayi L, Raharinjatovo J,Arogundade E, Buyungo P, Mpasela F, Adjibabi CB, Agbango JA,Ramarosandratana BF, Coker B, Rubahika D, Hamainza B, Shewchuk T,Chavasse D, O’Connell KA: Monitoring fever treatment behaviour andequitable access to effective medicines in the context of initiatives toimprove ACT access: baseline results and implications for programmingin six African countries. Malar J 2011, 10:327.
75. Pagnoni F, Convelbo N, Tiendrebeogo J, Cousens S, Esposito F: Acommunity-based programme to provide prompt and adequate treat-ment of presumptive malaria in children. Trans R Soc Trop Med Hyg 1997,91:512–517.
76. Thang ND, Erhart A, Hung le X, Thuan le K, Xa NX, Thanh NN, Ky PV,Coosemans M, Speybroeck N, D’Alessandro U: Rapid decrease of malariamorbidity following the introduction of community-based monitoring ina rural area of central Vietnam. Malar J 2009, 8:3.
77. WHO: Malaria Elimination: A field Manual For Low And Moderate EndemicCountries. Geneva: World Health Organization; 2007.
78. World Health Organization: Guidelines On The Elimination Of Residual Foci OfMalaria Transmission, EMRO Technical Publications. Cairo, Egypt: WHORegional Office for the Eastern Mediterranean; 2007.
79. Cucunuba Z, Guerra A, Rivera J, Nicholls R: Comparison of asymptomaticPlasmodium spp. infection in two malaria-endemic Colombian locations.Trans R Soc Trop Med Hyg 2013, 107:129–136.
80. Lindblade KA, Steinhardt L, Samuels A, Kachur S, Slutsker L: The silentthreat: asymptomatic parasitemia and malaria transmission. Expert RevAnti Infect Ther 2013, 11:623–639.
81. Bisoffi Z, Gobbi F, Buonfrate D, Van den Ende J: Diagnosis Of MalariaInfection With Or Without Disease. Infect Dis: Mediterr J Hematol; 2012:4.
82. Schneider P, Bousema JT, Gouagna LC, Otieno S, van de Vegte-Bolmer M,Omar SA, Sauerwein RW: Submicroscopic Plasmodium falciparum gameto-cyte densities frequently result in mosquito infection. Am J Trop Med Hyg2007, 76:470–474.
83. Sturrock H, Hsiang M, Cohen J, Smith D, Greenhouse B, Bousema J, GoslingR: Targeting asymptomatic malaria infections: active surveillance incontrol and elimination. PLoS Med 2013, 10:e1001467.
84. Campbell CC, Steketee RW: Malaria in Africa can be eliminated. Am J TropMed Hyg 2011, 85:584–585.
85. Delves M, Plouffe D, Scheurer C, Meister S, Wittlin S, Winzeler EA, Sinden RE,Leroy D: The activities of current antimalarial drugs on the life cyclestages of Plasmodium: a comparative study with human and rodentparasites. PLoS Med 2012, 9:e1001169.
86. Bruce-Chwatt LJ: Classification of antimalarial drugs in relation todifferent stages in the life-cycle of the parasite: commentary on adiagram. Bull World Health Organ 1962, 27:287–290.
87. Sutherland CJ, Ord R, Dunyo S, Jawara M, Drakeley CJ, Alexander N,Coleman R, Pinder M, Walraven G, Targett GA: Reduction of malariatransmission to Anopheles mosquitoes with a six-dose regimen ofco-artemether. PLoS Med 2005, 2:e92.
88. Drakeley CJ, Jawara M, Targett GA, Walraven G, Obisike U, Coleman R,Pinder M, Sutherland CJ: Addition of artesunate to chloroquine fortreatment of Plasmodium falciparum malaria in Gambian children causesa significant but short-lived reduction in infectiousness for mosquitoes.Trop Med Int Health 2004, 9:53–61.
89. Bousema JT, Schneider P, Gouagna LC, Drakeley CJ, Tostmann A, Houben R,Githure JI, Ord R, Sutherland CJ, Omar SA, Sauerwein RW: Moderate effectof artemisinin-based combination therapy on transmission ofPlasmodium falciparum. J Infect Dis 2006, 193:1151–1159.
90. Dietz K, Molineaux L, Thomas A: A malaria model tested in the Africansavannah. Bull World Health Organ 1974, 50:347–357.
91. Chanda E, Hemingway J, Kleinschmidt I, Rehman A, Ramdeen V, Phiri F,Coetzer S, Mthembu D, Shinondo C, Chizema-Kawesha E: Insecticide resist-ance and the future of malaria control in Zambia. PLoS One 2011,6:e24336.
92. Smith D, Drakeley C, Chiyaka C, Hay S: A quantitative analysis oftransmission efficiency versus intensity for malaria. Nat Commun2010, 1:108.
93. Abba K, Deeks JJ, Olliaro P, Naing CM, Jackson SM, Takwoingi Y, Donegan S,Garner P: Rapid diagnostic tests for diagnosing uncomplicated P.falciparum malaria in endemic countries. Cochrane Database Syst Rev2011, (7):CD008122.
94. Bisoffi Z, Sirima S, Menten J, Pattaro C, Angheben A, Gobbi F, Tinto H,Lodesani C, Neya B, Gobbo M, Van den Ende J: Accuracy of a rapiddiagnostic test on the diagnosis of malaria infection and of malaria-attributable fever during low and high transmission season in BurkinaFaso. Malar J 2010, 9:192.
95. Smith DL, Dushoff J, Snow RW, Hay SI: The entomological inoculation rateand Plasmodium falciparum infection in African children. Nature 2005,438:492–495.

Hamainza et al. Malaria Journal 2014, 13:128 Page 19 of 19http://www.malariajournal.com/content/13/1/128
96. Smith T, Maire N, Dietz K, Killeen GF, Vounatsou P, Molineaux L, Tanner M:Relationship between the entomologic inoculation rate and the force ofinfection for Plasmodium falciparum malaria. Am J Trop Med Hyg 2006,75:11–18.
97. Charlwood JD, Smith T, Lyimo E, Kitua AY, Masanja H, Booth M, Alonso PL,Tanner M: Incidence of Plasmodium falciparum infection in infants inrelation to exposure to sporozoite-infected anophelines. Am J Trop MedHyg 1998, 59:243–251.
98. Beier JC, Killeen GF, Githure JI: Short report: entomologic inoculation ratesand Plasmodium falciparum malaria prevalence in Africa. Am J Trop MedHyg 1999, 61:109–113.
99. Brenner H, Gefeller O: Variation of sensitivity, specificity, likelihood ratiosand predictive values with disease prevalence. Stat Med 1997,16:981–991.
100. Missinou M, Lell B, Kremsner P: Uncommon asymptomatic Plasmodiumfalciparum infections in Gabonese children. Clin Infect Dis 2003,36:1198–1202.
101. Eichner M, Diebner H, Molineaux L, Collins W, Jeffery G, Dietz K: Genesis,sequestration and survival of Plasmodium falciparum gametocytes:parameter estimates from fitting a model to malariatherapy data. Trans RSoc Trop Med Hyg 2001, 95:497–501.
102. Collins W, Jeffery G: A retrospective examination of sporozoite- andtrophozoite-induced infections with Plasmodium falciparum:development of parasitologic and clinical immunity during primaryinfection. Am J Trop Med Hyg 1999, 61:4–19.
103. National Malaria Control Centre: Assessment of patient compliance toartemether-lumefantrine in Zambia. Lusaka, Zambia: National Malaria ControlCentre, Ministry of Health; 2006.
104. Swarthout TD, Counihan H, Senga RK, van den Broek I: Paracheck-Pfaccuracy and recently treated Plasmodium falciparum infections: is therea risk of over-diagnosis? Malar J 2007, 6:58.
105. Baiden F, Webster J, Tivura M, Delimini R, Berko Y, Amenga-Etego S,Agyeman-Budu A, Karikari AB, Bruce J, Owusu-Agyei S, Chandramohan D:Accuracy of rapid tests for malaria and treatment outcomes for malariaand non-malaria cases among under-five children in rural Ghana. PLoSOne 2012, 7:e34073.
106. Mayxay M, Pukrittayakamee S, Chotivanich K, Looareesuwan S, White NJ:Persistence of Plasmodium falciparum HRP-2 in successfully treatedacute falciparum malaria. Trans R Soc Trop Med Hyg 2001, 95:179–182.
107. WHO: Global Health Expenditure Database. Geneva,Switzerland: World HealthOrganization; 2011.
108. Seidenberg PD, Hamer DH, Iyer H, Pilingana P, Siazeele K, Hamainza B,MacLeod WB, Yeboah-Antwi K: Impact of integrated community casemanagement on health-seeking behavior in rural Zambia. Am J Trop MedHyg 2012, 87:105–110.
doi:10.1186/1475-2875-13-128Cite this article as: Hamainza et al.: Monitoring, characterization andcontrol of chronic, symptomatic malaria infections in rural Zambiathrough monthly household visits by paid community health workers.Malaria Journal 2014 13:128.
Submit your next manuscript to BioMed Centraland take full advantage of:
• Convenient online submission
• Thorough peer review
• No space constraints or color figure charges
• Immediate publication on acceptance
• Inclusion in PubMed, CAS, Scopus and Google Scholar
• Research which is freely available for redistribution
Submit your manuscript at www.biomedcentral.com/submit