
Mikal Fitsum Alem - OsloMet
81
i MASTER’S THESIS Master of Biomedicine May 2019 Establishment of vitamin D receptor chromatin immunoprecipitation in CD8 + T cells to identify new vitamin D receptor binding sites. By Mikal Fitsum Alem OsloMet – Oslo Metropolitan University Faculty of Health Sciences Department of Neuroscience Research Unit in Multiple sclerosis (MS) research group
-
Upload
khangminh22 -
Category
Documents
-
view
4 -
download
0
Transcript of Mikal Fitsum Alem - OsloMet

i
MASTER’S THESIS
Master of Biomedicine
May 2019
Establishment of vitamin D receptor chromatin
immunoprecipitation in CD8+ T cells to identify new vitamin
D receptor binding sites.
By
Mikal Fitsum Alem
OsloMet – Oslo Metropolitan University
Faculty of Health Sciences
Department of Neuroscience Research Unit in
Multiple sclerosis (MS) research group

ii
Acknowledgements
The work that is presented in this thesis, took place in Domus Medica 4, at the Neuroscience
Research Unit in the Multiple sclerosis (MS) research group from August 2018 to May 2019.
I would like to start off by giving my biggest thanks to my supervisors Tone Berge and Ingvild
Sørum Leikfoss. They have made it possible for me to be welcomed by the Multiple Sclerosis
group and have to work with such an interesting project. The group itself, is made up of
extremely loving, caring, generous and important researchers and professors that have a mind-
blowing responsibility for the MS patients.
By biggest thanks also goes to Ina, Steffan, Margrethe, Chiara, Pilar, Zafar and so on for the
little discussion and conversations that we had along the way. I really appreciate your
encouraging advices for the thesis and the whole project.
My family have been there for me from day one. Mom (Eden) and Dad (Fitsum), thanks for
believing in me and the biggest sacrifices you had to put through in order to create such a
beautiful and bright future for me and my little siblings; Keven, Heron, Nadab and Naod. You
guys better see that this older sister of yours is much more than a crazy sister. Big thanks go to
my aunty (alemay) and uncle (Rezene) for always encouraging me.
I would like to thank my beloved colleague and friend Zakia for our crazy times together. You
have made it easier to go to Oslo every day, despite the tiresome trips. I am looking forward to
creating more memories with you in our future work together.
My last thanks go to my beautiful friends Lydia and Rahel, for putting up on me when I was
talking about my project. You guys have showed me that there is much more than university.
Let’s stay together until the end.
Hamar, May 15th, 2019
Mikal Fitsum Alem

iii
Abstract
Multiple sclerosis (MS) is an autoimmune neurodegenerative disorder of the central nervous
system (CNS). Although, the cause of MS is still unknown, some genetical and environmental
risk factor are known to be involved in the progression of MS. One of the environmental risk
factors is low levels of vitamin D in serum. Vitamin D has many biological effects, and its
action is mediated through its receptor vitamin D receptor (VDR, a nuclear receptor). This
complex associates with retinoid X receptor (RXR), by which together will recognize specific
DNA sequences, i.e. vitamin D response elements (VDREs), causing the regulation of genes
that encode proteins involved in cell proliferation and differentiation of immune cells. CD8+ T
cells, is likely to play a role in MS pathogenesis. More than 200 single nucleotide
polymorphisms (SNPs) are identified to be associated with MS. We wanted therefore, to
analyse if these MS risk variants can influence VDR binding site. But before we do so, the
technique used to study binding of VDR to DNA (VDR chromatin immunoprecipitation) as
well as activation of CD8+ T cell procedures must be optimized.
CD8+ T cells were isolated from blood from healthy donors and were activated using 5 µg/ml
anti-CD3 coated plate and 2 µg/ml soluble anti-CD28 antibodies for 40 hours to induce the
expression of VDR. After 40 hours, VDR was highly expressed, and the cells were treated with
either active form of vitamin D (calcitriol) or EtOH (vehicle control) for 3 hours. To verify the
cells responsiveness to vitamin D, the expression of vitamin D responsiveness genes, TAGAP
and CYP24A1 were measured. Furthermore, the ChIP procedure that includes (before
immunoprecipitation) protein-DNA crosslinking (incubation temperature and time), cell lysis
(one step or two step) and sonication to fragment chromatin (fragmentating for 10 or 20 min)
was optimized prior to be performed in two healthy donors using anti-VDR to pull down DNA
regions that are bound by VDR. Anti-IgG (isotype control) immunoprecipitation was performed
as negative control. PCR of regions in the VDR, MYC and TAGAP was used to analyse the DNA
fragments purified after ChIP.
DNA regions that were pulled down by IgG were the same as VDR. So, given that our findings
of ChIP are based on a limited number of experiments, the findings should be confirmed yet
again doing more experiments. Therefore, immunoprecipitation part of the ChIP procedure
needs to be optimized by including more materials and controls.

iv
Sammendrag
Multiple sklerose (MS) er en autoimmun nevrodegenerativ sykdom i sentralnervesystemet
(SNS). Selv om årsaken til MS fortsatt er ukjent, er det kjent at noen genetiske og miljømessige
risikofaktorer påvirker MS-utviklingen. En av kjente miljørisikofaktorene er redusert vitamin
D nivåer i serum. Vitamin D har mange biologiske effekter, og den virker gjennom sin reseptor,
vitamin D-reseptor (VDR, som er en kjernereseptor). Dette komplekset binder retinoid X-
reseptor (RXR), VDR/RXR gjenkjenner spesifikke DNA sekvenser, såkalt vitamin D
reseponselementer (VDREer). Dette resulterer i regulering av gener som koder for proteiner
involvert i celleproliferasjon og differensiering av immunceller. CD8+ T celler spiller en rolle i
MS-patogenesen. Mer enn 200 enkeltnukleotidpolymorfismer (såkalte SNPs=single nucleotide
polymorphisms) er identifisert å være assosiert med økt risiko for MS. Vi ønsket derfor å
analysere om disse MS-risikovariantene kan påvirke VDR binding. Men før vi gjør dette, må
teknikken som brukes til å studere bindingen av VDR til DNA (VDR-kromatin-
immunutfelling) og aktiveringen av CD8+ T-celle prosedyrene, optimaliseres.
CD8+ T celler ble isolert fra friske donorer og ble aktivert ved bruk av 5 µg/ml anti-CD3- belagt
plater, og 2 µg/ml løselig anti-CD28 antistoffer i 40 timer for å indusere ekspresjonen av VDR.
I tillegg ble celler aktivert med enten antistoffbelagt plate eller 1:4 (Dynabead til cell) forhold
for å finne egnet aktiveringsmetode for CD8+ T celle. Når VDR ble høyt uttrykt, ble cellene
behandlet med enten aktiv form av vitamin D (kalsitriol) eller EtOH (negativt-kontroll) i 3
timer. For å bekrefte cellens respons på vitamin D ble uttrykket av vitamin D responsesgener,
TAGAP og CYP24A1 målt. Videre ble ChIP-prosedyre som besto av kryssbinding
(inkubasjonstemperatur og tid), lyseringsbuffer (ett trinn eller to trinn) og sonikering
(fragmentering i 10 eller 20 minutter) ble optimalisert og utført i to friske donorer ved bruk av
anti-VDR og anti-IgG (isotype kontroll) ved å trekke ned DNA-regioner som er bundet av
VDR; MYC og TAGAP.
DNA-regioner som ble trukket ned av IgG, var de samme som VDR. Gitt at funnene våre er
basert på et begrenset antall eksperimenter, bør funnene bekreftes med flere eksperimenter.
Derfor må selve IP-delen i ChIP-protokoll også optimaliseres ved å inkludere mer materialer
og kontroller.

v
Abbreviations
Ab Antibody
APC Antigen presenting cell
bp Base pairs
CD Cluster of differentiation
cDNA Complementary DNA
ChIP Chromatin immunoprecipitation
CNS Central nervous system
CYP Cytochrome P
dH2O Distilled water
DNA Deoxyribonucleic acid
EDTA Ethylenediaminetetraacetic acid
EtOH Ethanol
FBS Fetal Bovine Serum
FCS Fetal Calf Serum
FITC Fluorescein isothiocyanate
g Gram
GWAS Genome wide association study
HRP Horseradish peroxidase
Ig Immunoglobulin
kb Kilo base
LAF bench Low air flow bench
m Milli
M Molar
MHC Major histocompability complex
ml Milliliter
mRNA Messenger RNA
MS Multiple sclerosis
n Nano
ng Nano gram
nm Nano meter
PBMS Peripheral blood mononuclear cells
PBS Phosphate buffered saline
PCR Polymerase chain reaction
PGK1 Phosphoglycerate kinase 1
PVDF Polyvinylidene fluoride
qPCR Quantitative PCR
RIPA Radioimmunoprecipitation assay
RNA Ribonucleic acid
RPMI Roswell Park Memorial Institute
RRMS Relapsing Remitting MS
RT Room temperature
RT- Reverse transcriptase negative control
RXR Retinoid X receptor
SD Standard deviation
SN Supernatant
SNP Single nucleotide polymorphism

vi
TAE buffer Tris-acetate EDTA buffer
TAGAP T cell activation Rho GTPase protein
TBS Tris buffered saline
TBS/T Tris buffered saline with Tween 20
TCR T cell receptor
Th17 T helper 12
Treg T regulatory
VDR Vitamin D receptor
VDRE Vitamin D responsive elements
i.e That is
α Anti
µ Micro

vii
Contents 1 Introduction ............................................................................................................................. 1
1.1 Multiple sclerosis .............................................................................................................. 1
1.1.1 Background ......................................................................................................... 1
1.1.2 MS as an autoimmune disease ............................................................................ 2
1.1.3 Genetic and environmental risk factors of MS ................................................... 2
1.1.4 Vitamin D and MS .............................................................................................. 3
1.2 T-lymphocytes .................................................................................................................. 3
1.2.1 T cell subsets ...................................................................................................... 5
1.2.2 T Cell activation ................................................................................................. 6
1.3 Vitamin D and vitamin D receptor (VDR) ....................................................................... 6
1.3.1 Vitamin D metabolism ........................................................................................ 6
1.3.2 Vitamin D as an immunomodulator ................................................................... 7
1.3.3 VDR as a transcription factor ............................................................................. 7
1.3.4 Chromatin Immunoprecipitation (ChIP) ............................................................ 8
1.4 Aims of the study ............................................................................................................ 10
2 Materials and methods .......................................................................................................... 12
Confidentiality and ethical considerations ........................................................................... 12
2.1 Isolation of peripheral blood mononuclear cells (PBMCs) and CD8+ T cells ............... 12
2.1.1 PBMC isolation ................................................................................................ 12
2.1.2 Isolation of CD8+ T cells ................................................................................. 14
2.2 Cell count ........................................................................................................................ 14
2.3 Stimulation of CD8+ T cells ............................................................................................ 15
2.3.1 Titration of plate bound anti-CD3 and soluble anti-CD28 for CD8+ T cell
activation ........................................................................................................................... 15
2.3.2 Testing different activation methods ................................................................ 15
2.4 Flow cytometry ............................................................................................................... 16
2.5 RNA techniques .............................................................................................................. 16
2.5.1 Extraction of total RNA .................................................................................... 17
2.5.2 Measurement of RNA concentration using Nanodrop ..................................... 17
2.5.3 Reverse transcriptase PCR (RT-PCR) .............................................................. 17
2.5.4 Quantitative Real Time PCR (qPCR) ............................................................... 18
2.6 Protein techniques ........................................................................................................... 20
2.6.1 Protein extraction .............................................................................................. 20
2.6.2 SDS-PAGE ....................................................................................................... 20
2.6.3 Western blotting ............................................................................................... 21
2.7 Vitamin D treatment of CD8+ T cells ............................................................................. 22
viii
2.8 Chromatin immunoprecipitation ..................................................................................... 23
2.8.1 Crosslinking ...................................................................................................... 23
2.8.2 Cell lysis ........................................................................................................... 23
2.8.3 Sonication of chromatin .................................................................................... 23
2.8.4 Preparation of chromatin prior to fragment analysis ........................................ 23
2.8.6 Analysing the size of fragmented DNA by agarose gel electrophoresis .......... 24
2.8.7 Immunoprecipitation ........................................................................................ 25
2.9 Polymerase chain reaction (PCR) ................................................................................... 27
2.10 Statistical analysis ......................................................................................................... 28
3 Results ................................................................................................................................... 29
3.1 Cell purity ....................................................................................................................... 29
3.2 Titration of anti-CD3/CD28 antibodies for CD8+ T cell activation ............................... 30
3.3 Cell viability before and after stimulation cells activated with antibody coated plate
versus antibody covered Dynabeads. .................................................................................... 32
3.4 Expression of Vitamin D Receptor in CD8+ T cells ....................................................... 33
3.5 Active form of vitamin D (calcitriol) affects the expression of VDR, TAGAP and
CYP24A1 in CD8+ T cells..................................................................................................... 34
3.6 Optimizing VDR-ChIP procedure .................................................................................. 36
3.6.1 Optimization of procedures for crosslinking and sonication ............................ 37
3.6.2 one step versus two lysis buffer ........................................................................ 39
3.7 Immunoprecipitation of DNA regions that are bound by VDR ..................................... 41
4 Discussion ............................................................................................................................. 45
4.1 Why does cell purity vary among donors? ..................................................................... 45
4.2 Which activation method is adequate to use: antibody covered Dynabeads or antibody
coated plate? ......................................................................................................................... 45
4.3 Cell viability before and after cell stimulation ............................................................... 46
4.4 CD8+ T cell activation using antibody coated plate to induce VDR expression ............ 46
4.5 Vitamin D responsive genes; TAGAP and CYP24A1 ..................................................... 47
4.6 Methodological contemplations ..................................................................................... 48
4.6.1 Cross-linking, cell lysis and sonication optimization ....................................... 48
4.7 Identification of precipitated DNA bound by VDR ....................................................... 50
5 Conclusions and future perspective ....................................................................................... 52
5.1 Summary - part 1 ............................................................................................................ 52
5.2 Summary - part 2 ............................................................................................................ 52
5.3 Summary - part 3 ............................................................................................................ 52
5.4 Future perspectives ......................................................................................................... 53
6 Reference list ......................................................................................................................... 54
7 Appendix ............................................................................................................................... 60

ix
Appendix 1. Materials, machines and computer software .................................................... 61
Appendix 2: Recipes ............................................................................................................. 64
Appendix 3. Standard curves of PGK1, VDR, TAGAP and CYP24A1 from three donors after
vitamin D treatment .............................................................................................................. 66
Appendix 4. Statistics ............................................................................................................ 69
Appendix 5. Result ................................................................................................................ 72

1
1 Introduction CD8+ T cells are thought to be major effectors in the progression of multiple sclerosis (MS) (1).
Activation and vitamin D receptor -chromatin immunoprecipitation (VDR-ChIP) protocols for
CD8+ T cells will be optimized in this thesis. The ultimate aim for the study is to identify new
binding sites of VDR mediated by the active form of vitamin D (1.25(OH)2D; calcitriol) and
study the impact of MS susceptibility gene variants. In this section, an overview of Multiple
sclerosis will be given first following vitamin D, other environmental and genetical risk factors
of MS and T lymphocytes will be described.
1.1 Multiple sclerosis
• 1.1.1 Background Multiple sclerosis (MS) is an autoimmune neurodegenerative disorder of the central nervous
system (CNS), affecting mainly young adults, where women are more frequently affected than
men (2, 3). The disease is characterized by damage of the fatty myelin sheath surrounding the
nerve cells axons (demyelination) which could be due to the autoreactive T cells that penetrate
through the blood-brain barrier and mediate this axonal damage in the CNS (4). Demyelination
can affect the ability of the nervous system to communicate effectively resulting in physical
and cognitive disability (5, 6). Relapsing-remitting MS (RRMS) is one of the subtypes of MS,
which is seen in 80-85% of MS patients. These patients experience acute attacks with increase
worsening of symptoms (relapses) followed by full or partial recovery (remission) and
subsequent stable phases between the exacerbations (7).
Patients with MS have been diagnosed symptomatically. However, several studies are focusing
on finding biomarkers for better diagnosis. Magnetic resonance imaging (MRI), to identify
damaged/firm scar tissues (lesions) in the brain, which are caused by demyelination, together
with neurological examination are the only tools for diagnosing MS (8, 9). Refining MRI with
spinal-cord and optic-nerve imaging is one way to improve the ability to diagnose and monitor
the progression of MS (8). Due to inflammation in the brain and spinal cord, oligoclonal
immunoglobulin bands can be detected in cerebrospinal fluid (CSF) of 90-95% of MS patients
(10, 11). These bands/antibodies arise after been released by B cells as an inflammation
response.
2
• 1.1.2 MS as an autoimmune disease Autoimmune diseases occur when the body’s immune system start attacking its own cells and
tissues. However, what triggers the immune system to attack the CNS in MS is still unknown
(12). Some speculate that CNS autoimmunity can be induced by molecular mimicry. Molecular
mimicry is defined as the sequence similarities among microbial (foreign) and self-epitopes,
that leads to the cross-reaction of autoreactive T cells to self-epitope. This process results in the
induction of several autoimmunity (13, 14).
If immune deviation, immunosuppressive cytokines (Interleukin-10 (IL-10), TGF-β) fail to
disactivate the auto-autoreactive T cells that escape negative selection in the thymus (see
section 1.2), these cells might be activated and start attacking self-tissues. IL-10 is an anti-
inflammatory, immunosuppressive cytokine, which tends to downregulate several
inflammatory messengers in the immune system, thereby maintaining normal immune response
(15). Autoreactive T cells can escape the negative selection/apoptosis and induce further T cell
development by expressing rearranged T cell receptor alpha (TCRα) genes (16). T cells are
briefly explained in section 1.2.
• 1.1.3 Genetic and environmental risk factors of MS MS is a complex disease with unknown cause. However, several studies show that both
environmental and genetic risk factors are associated with the disease (17). Population-based
twins studies have shown that MS has approximately 20-33% family recurrence rate and
approximately 10-12-fold risk increase in first degree relatives (18, 19). It has been known for
more than forty years that the HLA genetic region is an MS risk locus, but later, genome-wide
association studies (GWAS) have identified more than 200 single nucleotide polymorphisms
(SNPs) outside the HLA region that are associated with MS (20, 21). The exact location of MS
risk variants is still unclear, but studies have observed that many of these variants are located
near (non-coding genes) or at genes that have roles in the central immunological functions (20).
MS associated gene variations can disturb transcription by being present in transcription factor
binding sites and affect the folding of the chromatin.
One of the MS risk genes that overlaps with risk genes for other autoimmune diseases is
Interleukin 2- receptor alpha chain (IL2RA) gene that encodes the alpha chain of interleukin-2
receptor (IL2R). The involvement of this gene in the pathogenesis of MS is related to the role
it has in adaptive immune function; regulation of T cells (22).

3
Deficiency of vitamin D in the serum, smoking and Epstein Barr virus infection (23, 24) are
known environmental risk factors for MS (18).
• 1.1.4 Vitamin D and MS MS prevalence increases with the latitude, distance from the equator and is rare in subtropical
areas (25). Geographical distributions and seasonal change with low exposure to sunlight leads
to low levels of vitamin D (25(OH)D2) in the serum (26). This strengthen the evidence that MS
is strongly correlated with sun exposure. Increased sun exposure during childhood is associated
with the decreased risk of MS in adolescence (23, 27). MS patients have low circulating levels
of vitamin D compared to controls (28). Insufficient levels of vitamin D has a broad spectrum
of actions and can affect many parts of the body and can cause diseases like autoimmune
diseases, neurological diseases and coronary diseases, respiratory syncytial and virus infection,
underlining the necessity of vitamin D in modulation of immune system (29, 30). It is suggested
that low serum level of vitamin D is associated with the initiation of MS (31), and many studies
are currently investigating this possible relationship.
A study done by Dobson R. at el., shows that maternal vitamin D level during pregnancy and
month of birth have significant effect on MS risk (32). In addition, a study among U.S. military
personnel reveals that increased serum levels of vitamin D correlated with reduced risk of
developing MS (33). A pilot study also suggests that the relapse rate reduction is seen in MS
patients that were supplemented with active form of vitamin D (calcitriol) (34). It is suggested
that vitamin D supplements as relevant MS treatment can improve remyelinating the damaged
myelin sheath and decrease the progression of MS (28, 35, 36). Based on these considerable
physiological evidence, insufficient vitamin D is one of the main environmental risk factors
that has been successfully replicated.
Although the correlation of genetic factors and vitamin D in MS is still unclear, environmental
factors, such as lack of vitamin D and infectious agents exert VDR regulation through
epigenetic modifications, contributing in the progression to diseases like MS (37). GWAS has
identified MS risk SNP in CYP27B1 and interferes with its original function in the activation
of vitamin D (see section 1.3) (22). More about vitamin D and its metabolism is described in
section 1.3.
1.2 T-lymphocytes T lymphocytes (T cells) are cells that play major roles in cell-mediated immunity. They are
generated in the bone marrow and migrate to the thymus for maturation. In the thymus, these
cells begin to express the TCR and two co-receptors namely, cluster of differentiation 4 and 8

4
(CD4 and CD8 respectively). TCR is a transmembrane receptor that is a heterodimer,
containing one TCRα-chain and one TCRβ-chain and is present in 95% of T cells (38). The
hypervariable region of TCR has an antigen binding site.
T cells must undergo a strict quality control through a process of recognizing self-antigens
presented by a protein complex called the major histocompatibility complex (MHC). This
quality control is critical as it helps the mature T cells to distinguish between self- and invading
antigens. While MHC molecules are found in all types of animals, human leukocyte antigen
(HLA) complex are found in humans. The MHC molecules are classified into two types; MHC
class I (MHC I) is expressed on all nucleated cells while MHC class II (MHC II) is expressed
only on specific immune cells called antigen presenting cells (APCs). During the selection
process in the thymus, T cells develops to CD8+ T and CD4+ T cell. During the positive selection
process, if the TCR of one T cell recognizes MHC I complex, the cell becomes CD8+ T cell and
stops expressing CD4. If the TCR recognizes MHC II complex, the cell becomes CD4+ T cell
and stops expressing CD8 (39). If the cell does not recognize either of the complexes, it
undergoes apoptosis.
CD8+ T and CD4+ T cells are later exposed to APCs with MHC that carry autoantigens (self-
peptide) and the T cells that bind with high affinity to the self-peptide-MHC will be negatively
selected and must undergo apoptosis in order to avoid the development of autoreactive T cells
and thus autoimmunity. Cells with TCRs that have low affinity towards self-peptide MHC
complexes, are positively selected to proceed with differentiation and maintain their function
in adaptive immunity (40). When the T cells have passed these steps, they are released to the
circulation and resident in peripheral lymphoid organs such as lymph nodes, thymus, tonsils
and spleen to defend foreign antigens. CD4+ T cells are known as T helper cells (TH cells),
which secrete cytokines to regulate other immune cells to further trigger specific immune
responses. On the other hand, CD8+ T cells are cytotoxic T cells (TC cells), which can destroy
infected cells by secreting cytokines that attack the membrane of the infected cells and mediate
apoptosis.
T lymphocytes play one of the main roles in the adaptive immune response alongside B cells.
Upon infection, APCs such as B lymphocytes, dendritic cells and macrophages recognize
antibody opsonized particles (soluble antigens) as immune complexes. Cross binding of cell
surface receptors on the APCs (Fc-receptors) and an immune complex leads to internalisation
of the immune complex. Subsequently, the APC breaks down the antigen into smaller peptides

5
that are loaded onto MHC and presented on the cell surface of the APCs. T cells recognize this
MHC-antigenic complex through the TCR complexed with its coreceptor, cluster of
differentiation (CD3) and triggers its response. CD3 is a protein complex that is composed of
four chains and helps in transmembrane signalling.
• 1.2.1 T cell subsets CD4+ T cells are considered as the main effector in MS immunopathology, which is based on
evidences from experimental autoimmune encephalomyelitis (EAE) (18, 41). EAE is an animal
model for MS, an autoimmune demyelinating disease induced by injection of CNS antigens
such as myelin oligodendrocyte protein, myelin basic protein, proteolipid protein or the
adoptive transfer of autoreactive CD4+ T cells to the animals to investigate autoimmune
responses in the CNS (39). However, new evidence, especially from studies in humans,
suggests that CD8+T cells play a major role in the pathogenesis of MS since these cells are the
predominant cell population in human MS lesions and cerebrospinal fluid (CSF) (4, 42).
Increased levels of CD8+ T cells that secret proinflammatory cytokines have been observed in
peripheral blood from RRMS patients in their relapsing phase compared to healthy controls and
in cerebrospinal fluid (CSF) from patients in their early stage of MS (2, 39). Other
proinflammatory cytokines like IL-2RA and CCL5 secreted from CD8+ T are also upregulated
in CSF of MS patients (43). The activity of CD8+ T cells already exist in the early progression
of the disease and these observations suggest that demyelination and axonal damage observed
in MS lesion could be mediated by cytotoxic CD8+ T cells, since CD8+ T cells specifically
attack myelin (44, 45). However, if this attack is mediated by primarily immune mechanisms
or secondary inflammation remains unclear (9).
In addition to the CD8+ T cells pathogenic role in MS, regulatory CD8+ T cells, a subgroups of
CD8+ T cells have been observed to serve an important regulatory and a suppressive role in
demyelination diseases (41, 45-47). They might contribute in limiting the disease severity in
MS patients, as they were observed to suppress EAE via TGF-β- and IFN-γ-dependent
mechanisms (4, 48). As it is stated in previous studies, the suppressor functions of CD8+ T
regulatory cells have been defective in MS patients compared to healthy controls, however, the
function of suppressor CD8+ T cells in MS remains a topic of considerable debate (46, 49).

6
• 1.2.2 T Cell activation Upon infection, T cells require two signals in order to be activated. Signal 1 is generated when
TCR/CD3 complex and either of the two co-receptors CD4 or CD8 interacts with peptides from
pathogenic antigen presented on MHC molecules, while signal 2 is generated when the T cell’s
co-stimulator CD28 interacts with its corresponding ligands B7.1 (CD80) and B7.2 (CD86) on
the surface of APCs (50, 51). T cells require both activation signals in order to be fully activated
and initiate a signalling cascade finally leading responses necessary to combat infections and
cancer (52-54).
Figure 1.1: T cell activation. The figure illustrates the activation of CD8+ and CD4+ T cell through the
introduction of antigenic peptides from an APC. The TCR, composed of the TCR αβ and the CD3
complex, binds to the MHC-bound peptide. The figure is reproduced with the permission from
HumanCells Biosciences. Available from:https://humancellsbio.com/products/human-cord-blood-cd3-
pan-t-cells
Anti-CD3/CD28 antibodies are frequently used to activate T cells in vitro. These antibodies
interact with CD3 and CD28 on the surface of T cells, and the signalling cascade necessary for
T cell activation (52, 55).
1.3 Vitamin D and vitamin D receptor (VDR)
• 1.3.1 Vitamin D metabolism Vitamin D is a steroid hormone with two main forms, namely ergocalciferol (vitamin D2) of
plant origin and cholecalciferol (vitamin D3) of animal origin. The source of vitamin D is from
the diet, such as fish and vitamin supplements, or from UV light. The dietary sources provides
a small and limited fraction of the optimal/recommended vitamin D intake (25-100µg), while
the main source of vitamin D is from UV light absorbed by the skin (56, 57). In the skin, 7-
dehydrocholesterol is converted to the active form vitamin D3 (58).

7
Figure 1.2: The activation and inactivation pathway of vitamin D. The vitamin D metabolites are
indicated in the circles, under the arrows, we have the enzymes that activate and inactivate vitamin D
metabolites and in brackets, we have the gene names, encoding the indicated enzymes. The figure was
designed by author of the thesis.
Although, vitamin D is essential for the activation of transcriptional factors, its activation must
be limited to avoid excessive expression of vitamin D mediated genes. CYP24A1 encodes
cytochrome P450 enzyme that constitute the catalysis of vitamin D molecules (i.e. Calcitriol).
CYP24A1 is expressed in most cells including bone, kidney and other cells that expresses the
vitamin D receptor (VDR) and trigger VDR agonists activity in these tissues (59). The function
of CYP24A1 is to limit the action of vitamin D as a negative feedback loop. Thus, increasing
amount of vitamin D triggers catabolism mediated by CYP24A1 for the prevention of cellular
excessive VDR pathway response (59, 60).
• 1.3.2 Vitamin D as an immunomodulator Vitamin D has many biological effects, as its action is mediated through its receptor, the VDR,
causing regulation of several genes, including the genes that encode proteins involved in cell
proliferation and differentiation, regulation of calcium homeostasis and maintaining immune
defence’s self-tolerance (60-62). Vitamin D with its receptor supresses the transcription of
genes that encode the proinflammatory cytokines, such as IL17, IL2 and IFN-y and exerts an
anti-inflammatory effect in immune cells, among others in T-lymphocytes (63).
• 1.3.3 VDR as a transcription factor Transcription is the first stage of gene expression, which leads to the production of mRNA
generated from DNA. Protein coding genes begin with a promoter sequence and ends with
terminator region. RNA polymerase II is an enzyme that polymerizes DNA to mRNA.
Transcription factors are proteins that binds to DNA and initiate the transcription process. These
proteins have binding domains that have high affinity for specific DNA sequences, thereby
directly associates with the promoter sequence or silencer (enhancer) region of the gene leading
to regulation of gene expression (64).

8
VDR is a nuclear receptor and a transcription factor. In complex with its ligand (vitamin D),
the vitamin D-VDR complex associates with retinoid X receptor (RXR; another nuclear
receptor), which together will recognize specific DNA sequences, i.e. vitamin D response
elements (VDRE), in the regulatory regions of genes regulated by vitamin D. The complex of
vitamin D with its receptor, regulate the transcription and expression of target genes that are
involved in physiological functions as described above in section 1.3.2 (65). The VDR
expression and its activity plays an important role in the development and differentiation of T
cells. The activity of VDR has been shown to be dysregulated by microbes in order to slow
down the immune reactivity and increase their chance of survival (29, 66). Due to the function
of the VDR in T cells, delayed VDR expression and its function might contribute to T cell
dysregulation, subsequently causing the development of numerous diseases (67). The
expression of VDR in naïve T cells is low but is increased upon T cell activation (52, 68).
Figure 1.3: Vitamin D response is mediated through the nuclear receptor, VDR. Vitamin D-VDR
complex binds RXR and together recognize VDRE, leading to transcriptional regulation of
corresponding target genes. The figure is reproduced with the permission and is available from
https://selfhacked.com/blog/natural-ways-to-increase-calcitrol-and-vitamin-d-receptor-gene-
expression/
A study by Handel et al. show that the VDR binding in CD4+ T cells are strongly correlated
with the level of vitamin D in serum (69). Genes regulated by vitamin D do usually contain
one or more VDREs (70).
• 1.3.4 Chromatin Immunoprecipitation (ChIP) ChIP has been used widely for the studies of histone modifications such as methylation and
acetylation. It is also used for the purpose to identify the localization of a variety transcriptional

9
factors binding to DNA (71). One of the early steps of the ChIP method is crosslinking (see
Figure 1.4). The nucleophilic group of the base in DNA or amino acid from proteins forms a
covalent bond with formaldehyde, a crosslinking agent (72). This crosslinking maintains the
structure of chromatin. In the current thesis, VDR is the specific protein that needs to be
crosslinked to the target DNA. After crosslinking and cell lysis, the chromatin of interest is
precipitated out using specific antibodies against the protein of interest. After the
immunoprecipitation, crosslinking is reversed and the DNA fragments that were bound to the
protein of interest is purified and analysed by PCR, quantitative PCR or sequencing.
Figure 1.4: Steps of ChIP. This figure visualises the steps to follow while performing ChIP. The
figure is reproduced with the permission from creativebiomart. Available from:
https://www.creativebiomart.net/blog/principle-and-protocol-of-chromatin-
immunoprecipitation-chip/

10
1.4 Aims of the study The role of CD4+ T cells in MS has been extensively studies, however there is a general lack of
studies regarding the role of CD8+ T cells. Growing evidence support the pathogenetic role for
CD8+ T cells in MS (1). Taking into account the current knowledge of CD8+ T cells and its
correlation with MS, the overall aim of this study was to perform VDR-ChIP in CD8+ T cells
to investigate the correlation of MS risk variants with VDR binding sites. This thesis will help
to fill the gap of knowledge there is in terms of how MS genetic risk variants interact with one
environmental MS risk factor, vitamin D level. The ultimate aim is to map the VDR binding
sites in the genome of CD8+ T cells and analyse whether MS associated genetic risk variants
affect its DNA binding by the use of ChIP. In order to reach this goal, the CD8+ T cell activation
protocol and VDR ChIP protocol needed to be established. Therefore, the purpose of the current
thesis was:
‘’Establishment of VDR-ChIP protocol for CD8+ T cells to identify new VDR binding sites.’’
The sub aims were to:
• Optimize CD8+ T cell activation protocol
• Analyse VDR expression in CD8+ T cells
• Measure vitamin D response
• ChIP protocol optimizing including; crosslinking, cell lysis, sonication and
decrosslinking protocols
• VDR ChIP combined with PCR

11
Figure 1.5: Step of ChIP procedure. The flow chart illustrates the steps that are going to be tested in
the thesis, including the steps within activation of CD8 +T cell following VDR-ChIP procedure.

12
2 Materials and methods
Confidentiality and ethical considerations
Confidentiality is a key component that needs to be kept and protected in healthcare facilities
including health research studies. Researchers are obligated to have responsibility and need to
detail the plans they have for protecting confidentiality in a study protocol. This is done as
follows:
- Informed consent is obtained from all individuals recruited to this project. These
projects were approved through the approval to Hanne F. Harbo by The Norwegian
Authorities and the local Ethical Committee.
- The research project has no consequences for the environment and is not putting the
project participants at any risk. The study was performed in laboratories certified
for the type of work described.
2.1 Isolation of peripheral blood mononuclear cells (PBMCs) and CD8+ T cells
In this thesis, primary human CD8+ T cells were used. Blood samples were drawn from healthy
volunteers in Ethylenediaminetetraacetic acid (EDTA); anticoagulant coated tubes that preserve
the blood cells morphology and avoids coagulation.
To avoid infection of the immune cells in the blood samples, all the following isolation
procedures were performed in a low airflow (LAF) bench with sterile techniques. Materials that
had been in contact with blood were disposed in biohazardous waste.
• 2.1.1 PBMC isolation Procedure:
PBMC were purified from blood by density gradient centrifugation (lymphoprep; StemCELL
technologies).
First the LAF-bench was disinfected with antibacterial disinfectant prior to use. 1 ml of EDTA
was added in a 160 ml cell culture flask. Eight tubes containing 9 ml blood each were
transferred to a medium size cell culture flask (160 ml). 10 ml of cold Rosewell Park Memorial
Institute (RPMI) 1640 (Life-technologies ™) medium was used to wash off the remaining blood
in the collection tubes and transferred into the cell culture flask that already contained the blood

13
and EDTA. The collected blood was diluted to final volume of 100 ml using RPMI1640, where
it was divided in to 4 (50ml) tubes. 10ml lymphoprep (StemCell Technologies) was carefully
layered underneath the blood of each tube using a syringe. The tubes were centrifuged at 800
xg for 20 mins by turning down the brake to 0 and acceleration to 1 at room temperature (RT)
and the following centrifuges in this section were performed at RT.
Figure 2.1: Schematic overview of PBMC isolating from whole blood using lymphoprep and density
gradient centrifugation. Erythrocytes have higher density compared to mononuclear cells, which makes
the separation possible. This figure is reused with the permission from PROGEN-passion for research.
Available from: https://www.progen.com/lymphopreptm-1x250ml.html
Following density centrifugation, the mononuclear cells, which lay in the interface between
serum and lymphoprep (Figure 2.1), were carefully transferred into two new 50 ml tubes. The
PMBCs in each tube were diluted to total volume of 50 ml with PBS (Sigma Life Science) to
reduce cell density. When the cells were centrifuged at 650 xg for 10 mins, the supernatant was
removed, and the pellets were resuspended in 20 ml PBS. This step was repeated following
centrifugation at 200 xg for 10 mins. Supernatant was removed and the pellet was resuspended
completely using 20 ml PBS. 10 µl of the cell suspension was transferred to a new Eppendorf
tube for cell counting see section 2.2. The 50ml tube was centrifuged at 250 xg for 10 mins.
Proceed with isolation of CD8+ T cells.

14
• 2.1.2 Isolation of CD8+ T cells CD8+ T cells were purified from PBMC (section 2.1.1) by positive selection using EasySEP
Human CD8 positive selection kit (StemCell Technologies). Positive selection means that
specific antibody-coupled beads were used to direct selection of the target cells; CD8+ T cells,
while the other cells are removed.
Procedure:
The supernatant from the centrifuged 50 ml tube (described in 2.1.1) was removed. 1ml
isolation buffer (PBS w/2% Fetal Calf Serum (FCS) and 1mM EDTA) was added per 1 x 10⁸
cells and transferred to a 14ml flow tube. 100µl per ml positive selection cocktail (Stem cell ™
technologies) was added to the cells following incubation for 3 mins at RT. Next, 50 µl per ml
magnetic nanoparticles (RapidSphare, stem cell ™ technologies) was added to the cell
suspension following incubation for 3 mins. Isolation buffer was added to a final volume of 5
ml. The tube was placed on a magnet (EasySep™ immunomagnetic column-free magnet, stem
cell ™ technologies) for 3 mins. The suspension in the tube was transferred to new 14ml flow
tube as CD8+ T cells lay at the wall of the tube. The supernatant was used by another master
student to purify CD4+ T cells by negative selection. 5 ml of isolation buffer was added to wash
CD8+ T cells with beads and the tube was placed on the magnet for 3 mins and this was repeated
one more time. After removing the isolation buffer, 4 ml isolation buffer was added and 10 µl
was further transferred to a new Eppendorf tube for cell counting (section 2.2). The purity of
cells was measured by flowcytometry (see section 2.4).
2.2 Cell count Isolated PBMC and CD8+ T cells were counted using TC20™ (an automated cell counter; Bio
Rad) prior to further experiments. Trypan blue (BioRad) was added to the samples to
distinguish live from dead cells. Dead cells do not have intact cell membrane, enabling the dye
to penetrate and stain the cells, whereas living cells with intact cell membrane does not get
stained.
Procedure:
10 µl of cell suspension was used to count cells. The cell suspension was mixed with 10µl
trypan blue (1:1), where 10 µl was transferred to counter chamber slide (counting slides dual
chamber, Bio Rad), which calculates the number of total cells and live cells/ml.

15
2.3 Stimulation of CD8+ T cells
• 2.3.1 Titration of plate bound anti-CD3 and soluble anti-CD28 for CD8+ T
cell activation Isolated cells needed to be stimulated in order to survive and be vitamin D responsive.
Therefore, wells were used to stimulate cell suspension using different concentrations range
from 1 – 5 µg/ml of anti-CD3 and anti-CD28 antibodies in order to find an optimal
concentration for cell stimulation, (see result section 3.1).
Procedure:
Wells in a cell culturing plate were coated with 5 µg/ml anti-CD3 antibody (Invitrogen) (diluted
with PBS) for 1 hr at 37oC incubator, 5% CO2. Meanwhile, 2 µg/ml anti-CD28 antibody (BD
Bioscience) was diluted in PBS. 1 x 10⁶ cells were needed per well. The cells needed for an
experiment were transferred to a 15 ml tube and centrifuged at 12000 rpm for 8 min at RT.
Supernatant was discarded and the cells were resuspended in preheated X-VIVO (Lonza) to a
concentration of 1 x 10⁶ cells/ml. After one hour at 37oC, the PBS were removed from the wells
in the plate and washed with 500 µl PBS to remove excess anti-CD3 antibodies. 100 µl of
diluted anti-CD28 and 100 µl of cells (1 cells/ml) were added to each well. The plate was
incubated at 37oC for 17 hr and cells were harvested for flow cytometry and for RNA and
protein analyses.
• 2.3.2 Testing different activation methods The two activation methods used in this section are:
1) Plate bound (anti-CD3; OKT3 antibody) and soluble (anti-CD28) antibodies
2) Antibodies covered Dynabeads (anti-CD3/CD28)
The aim is to see which activation method give the best stimulation response, have low variation
and leads to better survival rate. For the stimulation of cells in plate, see section 2.3.1. For the
stimulation of cells using beads, the following procedure was followed:
Procedure:
Anti-CD3/CD28 coated Dynabeads (Thermo Fisher Scientific) were vortexed for 10 sec. For
cell activation, 6.25 µl of Dyna-beads per 1 million cells, bead to cell ratio (1:4) were used.
Dynabeads were transferred to new Eppendorf tube, washed with 1 ml of isolation buffer (PBS
w/2% FCS and 1mM EDTA) and subsequently placed on a DynaMag ™-2 Magnet (Thermo

16
Fisher Scientific). The supernatant was removed, and this was repeated one. The beads were
resuspended using 1x vol preheated X-VIVO. The cells necessary for the experiments were
transferred to 15 ml tube and was centrifuged at 1200 rpm for 8 mins at RT. These cells were
resuspended in preheated -VIVO (1 ml/1 million cells). Washed Dynabeads were combined
with the cell suspension and transferred to wells in a plate and incubated for 17 hours
(overnight) at 37oC 5% CO2. The activation of these cells was verified using qPCR see section
2.5.
2.4 Flow cytometry Flow cytometry is a technology used to identify and measure cells as they are passing through
a laser. It uses different scatter to identify cell size (forward scatter) and cell granularity (side
scatter). Flow cytometry can also be used to identify proteins that are expressed on the cell
surface by staining the cells with specific antibodies conjugated to a fluorochrome. The T cells
activation marker CD69 was measured in the current thesis using this method. In addition, flow
cytometry was used to measure the cell purity of CD8+ T cells purified from blood.
Procedure:
First, stimulated and non-stimulated cells were prepared by adjusting the cell suspension to a
concentration of 0.25x10⁵ cells/well. 25 µl of corresponding antibody solution; 1:10 dilutions
of CD69-APC, IgG-APC, CD8-FITC and IgG-FITC were used to stain cells in each well and
these were incubated for 30 mins on ice. Flow cytometry (Applied Biosystem by Life
Technologies) was used to measure the cell surface expression of CD69. Anti-human CD69
APC-conjugated antibody (ImmunoTools) was used to stain the CD69 activation marker
whereas, human IgG APC-conjugated (ImmunoTools) was used as negative isotype control. In
order to analyse the purity of the isolated CD8+ T, the cells were stained with FITC conjugated
with anti-CD8.
2.5 RNA techniques The cells were harvested before and after 17 and 40 hrs of stimulation and the activation
response was verified using flow cytometry by quantifying the expression of the T cell active
marker CD69. After verifying the activation, quantitative polymerase chain reaction (qPCR)
was used to measure the level of VDR expression.

17
• 2.5.1 Extraction of total RNA Procedure:
Cells that were harvested for RNA extraction were preserved in 350 µl RNA protect cell reagent
(Qiagen) for prevention of RNA degradation and were stored at -80oC. These preserved cells
were thawed prior to RNA extraction using RNeasy ® Plus Mini Kit and QIA shredder columns
(Qiagen) according to the manufacturer’s procedure.
• 2.5.2 Measurement of RNA concentration using Nanodrop Before proceeding with reverse transcriptase (RT) -PCR, the concentration of extracted RNA
was measured using NanoDrop spectophometer - 2000c (Thermo Scientific). Nanodrop is one
of the quantifiers that is used to measure the amount of extracted RNA, DNA and protein.
2 µl RNA was used to measure the concentration. RNA/DNA absorb light at 260 nm, whereas
protein and organic components containing phenol rings absorb light at 280 nm and 230 nm
respectively. By measuring the absorbance ratio between 260/280 and 260/230, the purity of
the nuclei acids can be determined, and protein contamination and carryover of components
(such as phenol) can be detected. These carryover components are known to lower the reaction
efficiency and inhibit enzymatic reactions in PCR. Nuclease-free water (RNA was eluted with)
was used as blank.
• 2.5.3 Reverse transcriptase PCR (RT-PCR) Polymerase Chain reaction (PCR) is a technique that is used in molecular studies to amplify a
specific fragment of DNA from a single copy to thousands and millions of copies. RT-PCR is
a technology that can reversely transcribe RNA to complementary DNA (cDNA) using an
enzyme known as reverse transcriptase. This is routinely done prior to real time quantitative
PCR (qPCR) analysis as RNA cannot be used as template in qPCR, due to the exposure of broad
temperature ranges required within the gene expression analysis.
Procedure:
All RNA samples were diluted in nuclease-free water to a common RNA concentration and
subjected to cDNA synthesis using cDNA Synthesis Kit for RT-PCR (Thermo Scientific) using
the following reagents:
18
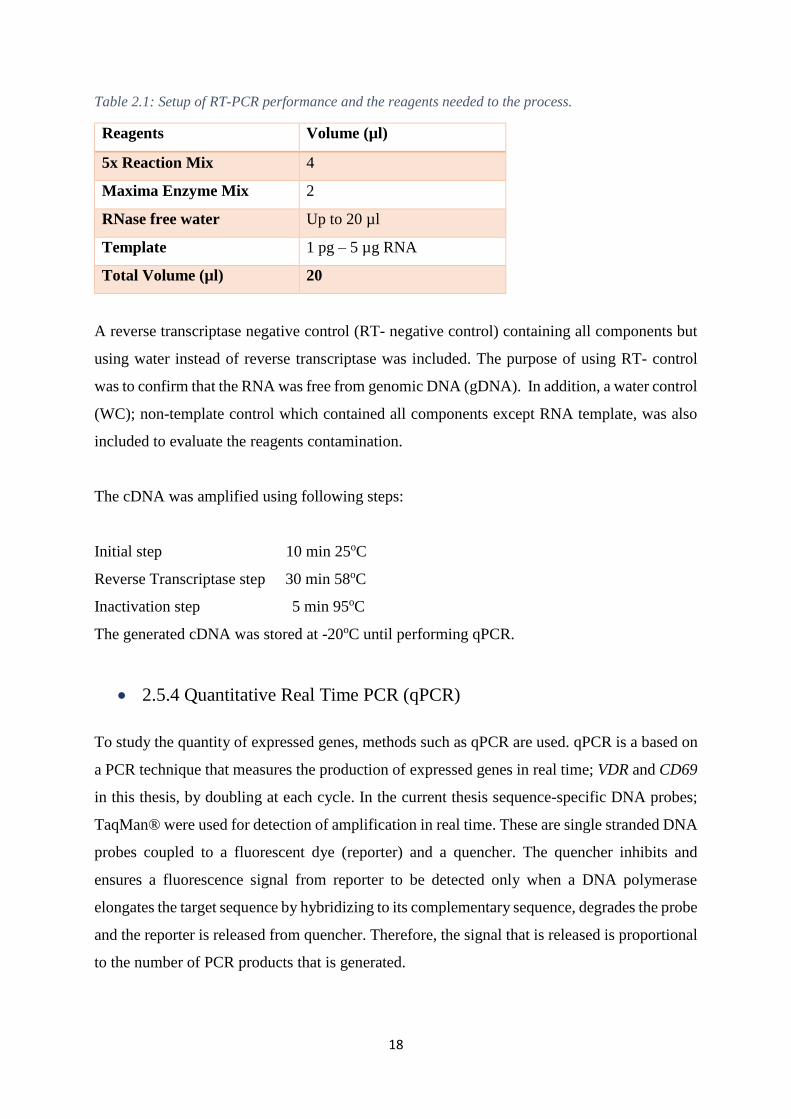
Table 2.1: Setup of RT-PCR performance and the reagents needed to the process.
Reagents Volume (µl)
5x Reaction Mix 4
Maxima Enzyme Mix 2
RNase free water Up to 20 µl
Template 1 pg – 5 µg RNA
Total Volume (µl) 20
A reverse transcriptase negative control (RT- negative control) containing all components but
using water instead of reverse transcriptase was included. The purpose of using RT- control
was to confirm that the RNA was free from genomic DNA (gDNA). In addition, a water control
(WC); non-template control which contained all components except RNA template, was also
included to evaluate the reagents contamination.
The cDNA was amplified using following steps:
Initial step 10 min 25oC
Reverse Transcriptase step 30 min 58oC
Inactivation step 5 min 95oC
The generated cDNA was stored at -20oC until performing qPCR.
• 2.5.4 Quantitative Real Time PCR (qPCR)
To study the quantity of expressed genes, methods such as qPCR are used. qPCR is a based on
a PCR technique that measures the production of expressed genes in real time; VDR and CD69
in this thesis, by doubling at each cycle. In the current thesis sequence-specific DNA probes;
TaqMan® were used for detection of amplification in real time. These are single stranded DNA
probes coupled to a fluorescent dye (reporter) and a quencher. The quencher inhibits and
ensures a fluorescence signal from reporter to be detected only when a DNA polymerase
elongates the target sequence by hybridizing to its complementary sequence, degrades the probe
and the reporter is released from quencher. Therefore, the signal that is released is proportional
to the number of PCR products that is generated.

19
Figure 2.2: Overview of TaqMan probe detection, when the florescence is released during the
extension. The figure was reused with permission and is available from:
https://www.sinobiological.com/taqman-probe-qpcr-method-cro-service.html
The qPCR standard curve method requires standard curve dilution series which contains known
concentration of RNA and is used to predict the concentration of samples by creating a standard
curve; a graph where the unknown concentrations are interpolated within. Standard solution
(S1) is the first point in the standard curve (the highest concentration) and is generated during
the RT-PCR step following a 1:2 in a 7-point dilution series (S1-S7) in advance of performing
qPCR. The standard curve is amplified together with the samples to determine their
concentration and to so do, the samples must be within the standard curve range. In addition,
the standard curve can be used to control that the cDNA synthesis is not saturated, ensure that
the reaction is approximately 90-110% efficient and that the PCR amplicon increase with every
3,3 cycles, resulting in a slope around -3.3.
Figure 2.3: Relative standard curve. A. Representative standard curves from this thesis composed of a
seven-point standard with 1:2 dilution series and including known concentration of the housekeeping
gene PGK1 (red dots) for predicting the concentration of target gene expression (blue dots) in B. PGK1

20
gene is labelled with FAM detection probe. This curve has 105% efficiency and the PCR amplicon
increases with every 3,2 cycles leading slope to be approximately -3,2.
Procedure:
These qPCR experiments were prepared according to the instruction delivered by Applied
Biosystems (Life Technologies). In one of the reactions, water was used as substitute for cDNA
and served as negative control. Duplicates of 10 µl qPCR reaction were loaded in a 384 – well
plate. The plate was centrifuged at 2000 rpm for 5 mins at RT and the PCR program used 40
cycles on Applied Biosystems Viia™ 7 Real Time PCR system (Life Technologies).
Normalized targets = Target / reference gene (PGK1)
2.6 Protein techniques
• 2.6.1 Protein extraction Western blotting was used to verify the protein expression of the VDR in CD8+ T cells before
and after activation. The cells must be lysed to expose the protein content of the cells.
Procedure:
Cells were centrifuged at 300 xg for 5 mins at 4oC. The supernatant was removed, and the cells
were washed twice with 1 ml PBS following centrfugation. Supernatant was completely
removed after the last wash and 20 µl of SDS loading buffer with β-mercaptoetanol per 1 x 10⁶
cells was added to the cells prior to sonication (UP100H Ultrasonic Processor, Hielscher).
These samples were stored at -20oC until proceeding with SDS-PAGE.
• 2.6.2 SDS-PAGE Dodecyl Sulfate - PolyAcrylamide Gel Electrophoresis (SDS-PAGE) is a method utilizes SDS;
an anionic detergent that denatures the tertiary structure of proteins by linearizing the primary
structure and adds a negative charge to the proteins, by which the protein can migrate according
to their molecular weight towards the positive pole in an electric field.
Choosing the right percentage of polyacrylamide for separation of proteins with a certain
molecular weight is an important factor to take into consideration to make sure optimal
separation of protein bands. High percentage of polyacrylamide increase the size of pores and
leads to slower migration of the proteins, whereas using lower percentage leads to faster
migration. To predict the molecular weight of migrated protein, a molecular standard that
includes proteins with known sizes was also added to the gel.

21
Procedure:
The samples (from section 2.6.1) were preheated for 5 mins at 96oC. A gel (Criterion ™ TGX™
Precast Gels, Bio-Rad) was placed in an electrode assembly and the comb of the gel were
carefully removed. The assembly was filled with 1x SDS running buffer (Sigma-Aldrich). 10
µl of a molecular standard (Precision Plus Protein ™ dual colour standard (Bio-Rad)) was
loaded to the first well and 20 µl of samples that contains lysate from 1 x10⁶ cells were loaded
in the following wells. The gel was first run at 120 V for 15 mins, followed by 150 V for
approximately 50 mins.
• 2.6.3 Western blotting Western blotting is a method used to identify a specific protein from a protein mixture. The
separated proteins (from section 2.6.2) are transferred to a Polyvinylidine fluorine (PVDF)
membrane (Immune-blot ®, BioRad). In order to prevent non-specific binding of antibodies to
protein in the membrane, the membrane is blocked by incubating it with 3% skimmed milk in
TBS/T for 2 hours or overnight at 4°C.
The membrane was subsequently incubated with primary antibody that is specific to the target
protein; VDR. A secondary antibody linked with the enzyme Horseradish Peroxidase (HRP)
was then added to the membrane and recognizes the primary antibody. The HRP produces light
when its substrate is added to the membrane. The light produced is proportional to the amount
of target protein (VDR) on the membrane. Anti-actin (produced in rabbit) was used as a loading
control, as it is stably expressed in all eukaryotic cells.
Procedure:
Protein transfer:
After SDS-PAGE (see section 2.6.2), the gel was washed with dH2O and placed in an assembled
transfer pack (Trans-Blot Turbo blotting system, Bio-Rad). The transfer was run at 25 V for 7
mins. The membrane was washed in dH2O and stained for approximately 1 min using premixed
Ponceau Red Staining (Sigma-Aldrich) to confirm that the proteins had transferred from the gel
to membrane. This staining solution was discarded, and the membrane was washed several
times using mq-H2O until the red colour from the background was completely washed away.

22
Detection with antibodies:
First, the membrane was blocked using 3% skimmed milk for 2 hours at RT. Primary antibody
(mouse anti-VDR or rabbit anti-actin) was diluted 1/350 and 1/3000 respectively in 3%
skimmed milk and was added to the membrane and incubated at 4oC overnight. Next, the
membrane was washed 4x15 mins in TBS/Tween and incubated with secondary antibody (goat
anti-mouse for VDR detection and goat anti-rabbit HRP for actin detection) both diluted 1/
5000 in 3% skimmed milk, for 1 hour at RT. The membrane was washed 4x15 mins in
TBS/Tween and placed in a plastic beaker. 2 ml of each ECL SuperSignal ® solutions
(ThermoFisher Scientific) in 1:1 ratio was mixed prior to adding the solution to the membrane
and incubated for 5 mins. The membrane was covered with plastic film by removing all bobbles
and placed in the developer cassette (ChemiDoc™ Touch Imaging System, Bio-Rad) for
developing for approximately 1 hour for VDR detection and approximately 2 mins for actin
detection.
Stripping and reprobing of membrane:
Primary and secondary antibodies from earlier section (Detection with antibodies) were washed
off from the membrane prior to reprobing the membrane with actin specific antibodies.
Procedure:
The membrane was stripped using Blot stripping buffer (Thermo Scientific) for 15 mins at RT.
The remaining steps are described above under ‘’ detection of antibodies’’.
2.7 Vitamin D treatment of CD8+ T cells Vitamin D in the form of calcitriol (active form of vitamin D) is diluted 1:100 to a final
concentration of 10 nM vitamin D in preheated X-VIVO. 1 µl of diluted vitamin D was added
per 1 ml cell suspension. Since vitamin D is very toxic in high concentration, the dilution was
generated in a fume hood. EtOH served as negative control, was also diluted 1:100 in preheated
X-VIVO, where 1 µl was added to the cells in a separated well. The activated cells treated with
either vitamin D or EtOH were incubated at 37oC for 3 hours prior to harvesting. RNA was
extracted from these harvested cells and the full protocol is stated in section 2.5.

23
2.8 Chromatin immunoprecipitation
• 2.8.1 Crosslinking Procedure:
70 µl formaldehyde (36.5 % stock, Sigma-Aldrich) was added to the 2.5 ml of cell suspension.
The samples were incubated for 5-,10- and 15 min at either 4oC or RT on a roller. 135 µl of
glycine (Sigma-Aldrich) was added to the samples following incubation for 5 min at RT to
deactivate the formaldehyde. These samples were centrifuged at 500 xg for 10 min at 4oC.
When the supernatant was discarded, the pellet was resuspended in 2 ml ice-cold PBS twice.
• 2.8.2 Cell lysis Procedure:
Cell lysis and nuclear buffers with 40 µl of 25% protease inhibitor (Pi; Roche) and 10 µl
phenylmethylsulfonyl fluoride (PMSF; Sigma-Aldrich) were first prepared. 1 ml of cell lysis
was added to the sample and incubated for 10 min on ice. The samples were centrifuged at 300
xg for 3.5 min at 4oC. The supernatant was removed following the addition of 100 µl nuclear
lysis buffer and incubation for 10 min on ice. Additional nuclear lysis buffer was added to
obtain a final volume of 300 µl. The lysate was transferred into 1.5 ml Microtube for Bioruptor
Pico (Diagenode) for DNA fragmentation using sonication.
• 2.8.3 Sonication of chromatin Procedure:
The chromatin was fragmented/sonicated for 30 sec ON/OFF for 10 min at 4oC using the
Bioruptor Pico. The samples were transferred back into 1.5 ml Eppendorf tube and was
centrifuged at 10 000 xg for 10 min at 4oC. In order to avoid the upper layer and cell debris in
the bottom of the tube, approximately 220 µl of supernatant (chromatin) was transferred into a
new Eppendorf tube to perform immunoprecipitation (see section 2.9), where 10 µl of this
sample was saved for the analysis of the fragment size on gel.
• 2.8.4 Preparation of chromatin prior to fragment analysis Procedure:
10 µl from section 2.8.3, was used to assess chromatin fragment size by agarose gel
electrophoresis before ChIP. 1 µl RNase (500 µg/ ml stock) was added to the sample and
incubated in a thermo block at 37oC for 20 min. 190 µl of elution buffer containing 1% SDS

24
was added to the sample prior to the addition of 5 µl proteinase K (from 2 mg/ml stock) and
incubation on a thermo mixer at 68oC, 500 rpm for 1 hr.
Purification of the ChIP DNA:
The fragmented DNA was purified and washed for removing any other cellar components
before fragment size analysis. It was performed as follows:
Procedure:
200 µl (1x vol) phenol-chloroform isoamylalcohol (pre-mix at 24:24:1 vol ratios; Sigma Life
Science) was added to the fragmented chromatin from section 2.8.4. The sample were mixed
thoroughly followed by centrifugation at 12900 rpm for 5 min at RT. This solution separated
DNA from other cellular components. 200 µl of the upper phase (containing the DNA) was
collected using a pipette and transferred into a new tube and 1 x vol of chloroform and
isoamylalcohol (pre-mixed at 24:1; Sigma Life Science) was added to the sample. The samples
were mixed thoroughly prior to centrifugation at 12900 rpm for 5 min at RT. 140 µl of the upper
phase was carefully collected and transferred into a new tube. 14 µl of 3M Sodium Acetate pH
7.0 (BioXtra) was added to the sample and was mixed briefly. 3.1 µl of Glycogen (20 µg/ µl;
Invitrogen) and 393 µl ice cold 96 % EtOH was added and the sample was incubated for 2 min.
This sample was placed at - 80oC overnight for the precipitation of DNA. Next, the sample was
centrifuged at 20000 xg for 15 min at 4oC. The supernatant was discarded, and the DNA pellet
was left to dry for approximately 15 min at RT by leaving the tube open. The DNA pellet was
dissolved in 20 µl MQ H2O at RT for 1-2 hr. The DNA, by this point was ready to proceed with
the fragment size analysis by agarose gel electrophoresis.
• 2.8.6 Analysing the size of fragmented DNA by agarose gel
electrophoresis Agarose gel electrophoresis is a standard method that is performed to separate, identify and
clean DNA fragment and proteins. The method is easy to use and can separate fragmented DNA
down to 50 base pairs. DNA is a negatively charged molecule and will thereby migrate to the
positive pole when it is loaded on a gel in an electric field. The gel has pores that interferes with
the migration, so that the bigger DNA fragments migrate slower and can easily be separated
from the smaller fragments that migrate faster and can be seen in the bottom layer of the
gel. The concentration of the agarose gel contributes in leading a clear separation among the
DNA fragments. The higher voltage the gels are exposed to, the faster the fragments migrate.

25
In order to visualize the DNA in the gel, ethidium bromide (EtBr) is added. EtBr intercalates
with double stranded nucleotides of DNA so that DNA can be visualized under the presence of
ultraviolet light (UV-light).
Procedure:
In this thesis, Tris-Acetate-EDTA buffer (TAE) had 50x start concentration and was diluted
into 1x before use. 1.5 % agarose gel was used. It was generated by mixing 0.75 g agarose
powder with 50 ml of 1xTAE buffer. This reaction mix was heated in the microwave until the
agarose powder is completely dissolved. This solution was cooled down to almost 55oC prior
to addition of 2.5 µl EtBr (stock 10 mg/ml) for visualization. This gel mixture is poured into a
gel-casting tray and then the comb is put in the gel to make wells where the samples can be
loaded. The gel was left to solidify for approximately 30-45 minutes. The comb was removed
and 1x TAE buffer was added to cover the gel. 3.3 µl 6x loading buffer (LB) was added to the
20 µl samples prior to loading them into the wells. Loading buffer is a buffer that contains
glycerol, which help the samples to sink into the wells of the gel. First load 10 µl DNA ladder
(Gene Ruler 100 bp and Gene Ruler Low Range (contains fragment length down to 25-700 bp
used in section 2.10)) in the first well and then load the samples in corresponding wells. DNA
ladder is a molecular weight standard with known sizes, which help to estimate the length of
target fragmented DNA.
The gel is placed in an electric field using 80 V at 240 mA for 40-45 minutes. After the gel
was run, it was placed in a gel doc (GeneGenius Gel Light Imaging system) for visualization
of migrated DNA fragments.
• 2.8.7 Immunoprecipitation Specific antibodies against VDR were used to pull out DNA fragments associated with VDR.
Four primer pairs were used as positive controls expected to cover regions bound by VDR in a
study done by Handel et al., and they recognize regions in the following genes: VDR, TAGAP
and MYC (69) . Input chromatin was used as a control. This is a control that contains chromatin
which did not undergo any selection for fragments associated with the binding of target gene,
and this is used to quantify and normalize the variation of immune precipitated target genes
from the starting material.
26
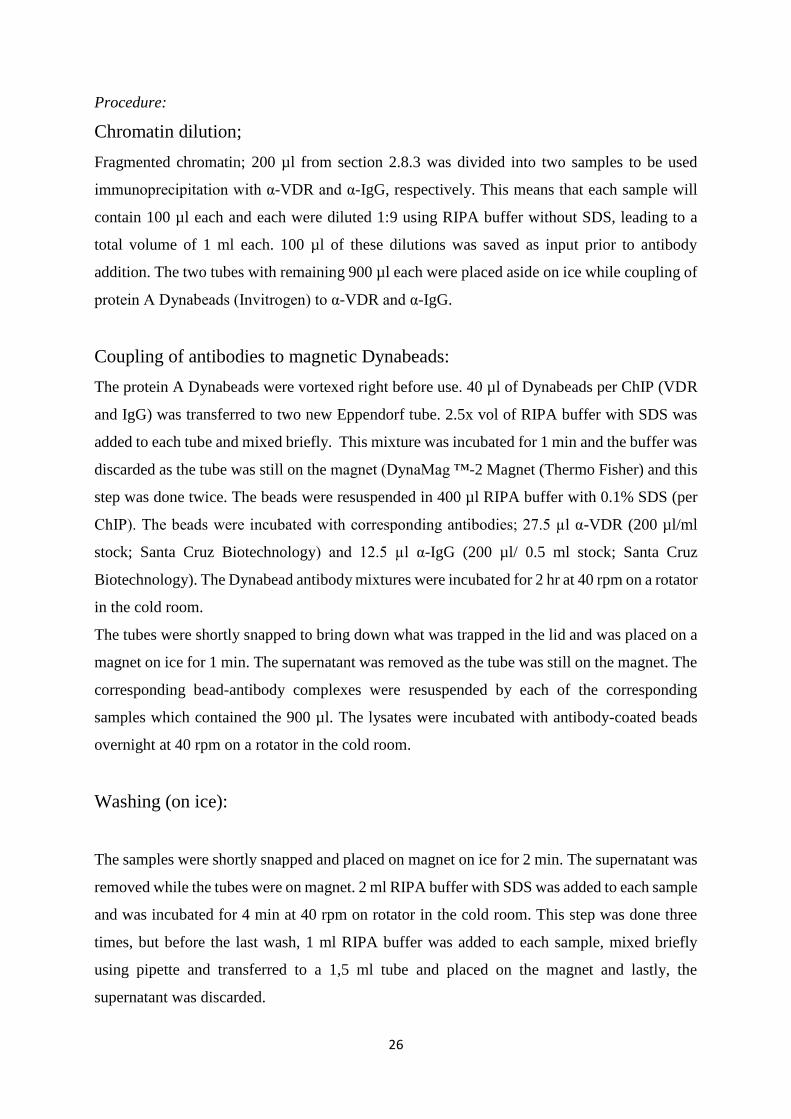
Procedure:
Chromatin dilution;
Fragmented chromatin; 200 µl from section 2.8.3 was divided into two samples to be used
immunoprecipitation with α-VDR and α-IgG, respectively. This means that each sample will
contain 100 µl each and each were diluted 1:9 using RIPA buffer without SDS, leading to a
total volume of 1 ml each. 100 µl of these dilutions was saved as input prior to antibody
addition. The two tubes with remaining 900 µl each were placed aside on ice while coupling of
protein A Dynabeads (Invitrogen) to α-VDR and α-IgG.
Coupling of antibodies to magnetic Dynabeads:
The protein A Dynabeads were vortexed right before use. 40 µl of Dynabeads per ChIP (VDR
and IgG) was transferred to two new Eppendorf tube. 2.5x vol of RIPA buffer with SDS was
added to each tube and mixed briefly. This mixture was incubated for 1 min and the buffer was
discarded as the tube was still on the magnet (DynaMag ™-2 Magnet (Thermo Fisher) and this
step was done twice. The beads were resuspended in 400 µl RIPA buffer with 0.1% SDS (per
ChIP). The beads were incubated with corresponding antibodies; 27.5 µl α-VDR (200 µl/ml
stock; Santa Cruz Biotechnology) and 12.5 µl α-IgG (200 µl/ 0.5 ml stock; Santa Cruz
Biotechnology). The Dynabead antibody mixtures were incubated for 2 hr at 40 rpm on a rotator
in the cold room.
The tubes were shortly snapped to bring down what was trapped in the lid and was placed on a
magnet on ice for 1 min. The supernatant was removed as the tube was still on the magnet. The
corresponding bead-antibody complexes were resuspended by each of the corresponding
samples which contained the 900 µl. The lysates were incubated with antibody-coated beads
overnight at 40 rpm on a rotator in the cold room.
Washing (on ice):
The samples were shortly snapped and placed on magnet on ice for 2 min. The supernatant was
removed while the tubes were on magnet. 2 ml RIPA buffer with SDS was added to each sample
and was incubated for 4 min at 40 rpm on rotator in the cold room. This step was done three
times, but before the last wash, 1 ml RIPA buffer was added to each sample, mixed briefly
using pipette and transferred to a 1,5 ml tube and placed on the magnet and lastly, the
supernatant was discarded.

27
Crosslink reversal, RNase treatment and DNA elution:
290 µl and 190 µl elution buffer containing 1% SDS was added to the ChIP samples and Input
samples respectively. 10 µl RNase (Roche) was added later to each sample. The ChIP and Input
samples were then incubated at 37oC for 20 min. 2 µl proteinase K (20 mg/ml stock) was
supplemented to each sample and the samples were incubated at 68oC, 1300 rpm for 6 hours.
Another 2 µl was added to the samples after 2 hrs during the incubation time.
Purification and elution of DNA using MicroChIP DiaPure columns (Diagenode) was done
according to the manufacturer’s instruction.
2.9 Polymerase chain reaction (PCR) The purpose of this section is to generate many copies of the immune precipitated DNA from
the eluted DNA using the 4 primers pairs covering gene region that have been shown to be
bound by VDR in CD4+ T cells.
Procedure:
Table 2.2: Reagents for the generation of master mix for PCR.
Reagents Final amount Volume per reaction Volume for 56 reations
(master mix x56,5)
Forward primer 20 µM (diluted 1:100) 4 µl
Reverse primer 0,2 µM (diluted 1:100) 4 µl
Deoxynucleotide
(dNDP)
0,2 µM (diluted 1:100) 4 µl 226 µl
10xPCR buffer -Mg
(Invitrogen)
10% 2 µl 113 µl
50 mM MgCl2 1,5 mM 0,6 µl 33,9 µl
DNA template 8, 2 and 0,5 ng 2 µl
Taq Platinum DNA
polymerase (Invitrogen)
2U /rxn 0,08 µl 4,52 µl
Autoclaved MQ water Add to 20 µl 3,32 µl 187,6 µl

28
Table 2.3: Primer sequences (5’-3’) of 4 target genes.
VDR Forward 5’-GAG AGG GAG TCG TGG GTT TC-3’
Reverse 5’-GGC TTT GCT GGT GAC ACA TC-3’
MYC Forward 5’-GGA GAT CCG GAG CGA ATA GG-3’
Reverse 5’-CGG CAA GGG TTG CGG AC-3’
TAGAP1 Forward 5’-ATG CCA GCT GTC GTA GTA GG-3’
Reverse 5’-ACT CTG GCT AGA GAC CCT CC-3'
TAGAP2 Forward 5’-CAG CTG TCG TAG TAG GTG CTT-3’
Reverse 5’-CGT GAA GGC TGC ACC TTT TT-3’
GAPDH
Intronic 2
Forward 5’-GGG ACG CTT TCT TTC CTT TC-3’
Reverse 5’-ATC CGG ACA GGG ATG CAC-3’
Water, PCR buffer, MgCl2, dNTP mix, polymerase enzyme was mixed in Eppendorf tube and
10 µl of this master mix was transferred to each PCR tube. 2 µl of template and 4 µl
of each forward and reverse primers were added to corresponding tubes leading to a final
reaction volume of 20 µl.
PCR was run in following program:
1 cycle: Denaturation 95oC for 4 minutes
40 cycles: Denaturation 95oC for 1 minute
Annealing 55oC for 30 seconds
Elongation 72oC for 1 minute
1 cycle: Elongation 72oC for 7 minutes
Agarose gel electrophoresis was performed for each sample to find out which gene from Table
3. was/were bound by VDR. The procedure is stated in section 2.8.6.
2.10 Statistical analysis Data from experiments were expressed as mean±SD and student’s paired t-test was used to
analyse whether there is any statistically significant between two groups. The level of statistical
significance was set at 0.05.

29
3 Results In a study done by Berge. T at el., freshly isolated CD4+ T cells had low or no VDR expression
(52). Therefore, we hypothesized that freshly isolated CD8+T cells also needed to be activated
in order to express VDR. The expression of VDR was assessed at mRNA and protein level in
CD8+T cells using TaqMan probes and immunoblot analysis respectively. Prior to these
experiments, the optimal concentration (section 3.2) of antibodies that gave high cell
stimulation and improved cell viability was determined. But, before that, cell purity was
examined in the following section 3.1.
3.1 Cell purity Positive selected CD8+T cells were isolated from whole blood as described in 2.1.2. Cell purity
was measured to verify if these isolated CD8+T cells were indeed CD8+T cells. Purity was
measured routinely by flow cytometry and the purity result (of all isolated CD8+T cells) is
shown in Table 3.1. One representative experiment (Donor ID, 3), out of eight is viewed in
Figure 3.1 to show the gating setup prior to performing cytometry in Figure 3.1 A and B.
Table 3.1: The purity of CD8+T cells after isolation measured by flow cytometry. CD8+T cells
isolated from different donors at different time point. The cell purity seems to vary among donors.
Donor ID Cell purity
(CD8-FITC (%))
1 82
2 84
3 80
4 64
5 56
6 84
7 75
8 75

30
Figure 3.1: Cell purity measurements of CD8+T cells using flow cytometry. After positive selection of
CD8+T cells, cells were stained with FITC-conjugated anti-CD8 antibody or an isotype control, and
cell purity was measured by flow cytometry. Forward scatter area (FSC-A) versus side scatter area
(SSC-A) are used to select live cells in A. followed by FSC-A versus FSC-H scatter used to select
singletons (single cells) from clustered cells in B. IgG-FITC staining is shown in C. and CD8-FITC
staining is shown in D. Numbers in upper quadrant indicate the percentage of cells that are live, single
and positive cells for the indicated antibody used for staining.
3.2 Titration of anti-CD3/CD28 antibodies for CD8+ T cell activation For cells to be vitamin D responsive, the VDR needs to be expressed prior to vitamin D addition.
But it has previously been reported that VDR expression is low in naïve T cells, and that it is
upregulated upon T-cell activation (52). Therefore, we wanted to examine whether that was
the case also for CD8+T cells purified from blood. In order to determine the optimal antibody
concentration to use in the downstream activation experiment, we titrated the amount of anti-
CD3 and anti-CD28 antibodies with the range concentration of 1-5 µg/ml (see Table. 3.2).

31
Table 3.2: Comparison of different anti-CD3/CD28 concentrations to optimize cell activation. CD8+T
cells were stimulated with different concentrations of plate-bound anti-CD3 and soluble anti-CD28
antibodies for 17 hours prior to flow cytometry measurements of the cell surface expression of CD69.The
concentrations of anti-CD3 are labelled in black, whereas the concentrations of anti-CD28 are written
in red. % illustrates the amount of cells that have CD69 in their surface.
1 2 3 4
A 5 µg/ml /5 µg/ml 81%
2 µg/ml /5 µg/ml 49%
1 µg/ml /5 µg/ml 41%
0.5 µg/ml /5 µg/ml 13%
B 5 µg/ml /2 µg/ml 87%
2 µg/ml /2 µg/ml 52%
1 µg/ml /2 µg/ml 43%
0.5 µg/ml /2 µg/ml 33%
C 5 µg/ml /1 µg/ml 85%
2 µg/ml /1 µg/ml 47%
1 µg/ml /1 µg/ml 42%
0.5 µg/ml /1 µg/ml 12%
D 5 µg/ml /0.5 µg/ml 84%
2 µg/ml /0.5 µg/ml 50%
1 µg/ml /0.5 µg/ml 21%
0.5 µg/ml /0.5 µg/ml 7%
After CD8+ T cells were stimulated for 17 hours using the concentration of anti-CD3/28
mentioned in figure 3.2, flow cytometry was used to confirm their activation response by
measuring the expression of cell surface activation marker CD69. It was found that the highest
level of activated cells indicated as CD69+ cells was achieved using 5 µg/ml of plate bound
anti-CD3 and 2 µg/ml soluble anti-CD28, resulting in 87% CD69+ cells (see Figure 3.2). This
concentration was used for T cell activation throughout the thesis.
A. B.
Figure 3.2: CD69 expression in CD8+ T cell activated with 5 µg/ml of plate bound anti-CD3 and 2
µg/ml soluble anti-CD28. CD8+ T cells were stained before and after activation with APC-conjugated
anti-CD69 antibody for measuring cell surface expression of CD69, an IgG-APC isotype control was
also indicated. A. Green line, shows staining by the IgG antibody, staining 1% of the cells, whereas the
purple line shows the staining of CD69-APC on activated CD8+ T cells. In this case, 87% are CD69+.
B. Green line shows the staining of nonactivated cells with CD69-APC (9% were CD69+), while purple
line illustrates the activated CD8+ T cells stained with CD69-APC (as the purple line in A, 87% are
CD69+).

32
3.3 Cell viability before and after stimulation cells activated with antibody
coated plate versus antibody covered Dynabeads. Before we went on to study VDR expression in activated CD8+T cells, we wanted to examine
the cell viability among CD8+T cells activated with plate bound antibodies and Dynabead
covered beads. Even though antibody coated plate and antibody covered Dynabeads are the two
methods used for T cell activation (52, 55, 73), we wanted to examine which activation method
leads to high cell death. Other students in the lab have experienced cell death when stimulating
with anti-CD3/CD28 covered beads (personal communication). But is this also the case for
CD8+T cells? To answer this question, we proceed with the activation of freshly isolated CD8+T
cells (from one donor) for 17 hours using:
1) 5µg/ml of plate bound anti-CD3 and 2µg/ml soluble anti-CD28 and 2) 1:4 bead to cell ratio
of anti-CD3/CD28 antibodies covered beads.
In order to verify the cell viability, the percentage of live cells were measured by an automated
cell counter (see section 2.2) before and after stimulation as viewed in the following Table 3.3.
Table 3.3: Percentage of live CD8+T cells (isolated from the same donor). The table illustrates
measured live cells before and after stimulation activated with either plate bound antibodies (experiment
number 1-3) or 1:4 Dynabead bound antibody (experiment number 4-6). 94% of freshly isolated CD8+T
cells were live cells.
Experiment
% Live cells
before stimulation
% Live cells after
stimulation
Methods used to active
cells
1 94 79 5µg/ml of plate bound anti-
CD3 and 2µg/ml soluble
anti-CD28
2 94 85
3 94 81
4 94 84
Dynabeads activated cells
(1:4) bead to cell ratio
5 94 88
6 94 89
After measuring cell live before and after cell stimulation, no variation is seen among plate
bound activation and Dynabead bound activation (p=0.08) (see appendix 4, Table 5.5)
suggesting that both activation methods do not lead to major cell death and are thus, adequate
activation methods for CD8+T cells.

33
3.4 Expression of Vitamin D Receptor in CD8+ T cells It has previously observed that VDR expression is upregulated upon CD4+ T cells activation
(52). We wanted to see if this case relies the same in CD8+ T cells. The timepoint when the
expression of VDR is the highest must be known prior to vitamin D addition. To do so, isolated
CD8+T cells from four healthy donors were stimulated using 5 µg/ml plate bound anti-CD3 and
2 µg/ml soluble anti-CD28 antibodies for 17 and 40 hours respectively. Figure 3.3 A. shows
the expression of VDR relative to PGK1 using qPCR.
There is not always a correlation between mRNA and protein, so we wanted to verify whether
we can observe VDR expression at the protein as well. Therefore, further tests were carried out
with Western blot as shown in Figure 3.3 B. The quantity of VDR was compared to the relative
protein, Actin, which also serves as a loading control.
Figure 3.3: VDR expression is the highest after 40 hours of anti-CD3/CD28 stimulation shown by
both qPCR and Western blotting. A. Bar chart showing fold change in VDR gene expression, including
error bar representing standard errors of each hours of stimulation from four donors. Values represents
fold change relative to nonactivated cells (time point 0). Paired student’s t-test was performed in VDR
expression comparing before (0 hr) and after 17 hrs of stimulation (p=0.046), between 17 and 40 hrs
of stimulation (p=0.208) and between 0 and 40 hrs of stimulation (p=0.003) (see appendix 4, Table 5.1
for statistics). p<0.05 is considered significant. B. Protein of cell lysates from nonactivated cells and
cells stimulated for 17 and 40 hours were separated by SDS-PAGE prior to Western blot using anti-
VDR and anti-Actin (loading control) antibodies for detection. This immunoblot is one experiment (D1)
out of two experiments performed.

34
As shown in Figure 3.3 A, VDR expression is statistically significant among 0 (non-stimulated)
and 40 hours of cell stimulation giving p=0.003 compared to 0 to 17 hours and 17 to 40 hours
of stimulation. Line graph in appendix 5 illustrates the change of VDR expression from non-
stimulated (0 hour) to 17 and 40 hours of stimulation in each donor. Thus, VDR expression at
both mRNA and protein level was confirmed to be at highest level after 40 hours of cell
stimulation. Therefore, this was further chosen as the time point where vitamin D was added in
the next experiments.
3.5 Active form of vitamin D (calcitriol) affects the expression of VDR, TAGAP
and CYP24A1 in CD8+ T cells. In the current thesis we wanted to evaluate whether CD8+ T cells (isolated from three healthy
donors) showed vitamin D responsiveness by adding 10 mM calcitriol to the cell culture 40
hours after cell activation. Other study (52) have shown that TAGAP expression is reduced and
CYP24A1 is increased upon vitamin D treatment. Therefore, we wanted to see if these genes
responded in a similar manner after calcitriol addition of CD8+ T cells. First, relative expression
of VDR (Figure 3.4) was measured to ensure that VDR is highly induced after 40 hours of anti-
CD3 and soluble anti-CD28 antibodies stimulation.
Figure 3.4: The expression of VDR before (0 hr) and after (40 hrs) anti-CD3/CD28 stimulation. VDR
expression is highly induced after 40 hours of stimulation in two donors, D and D2, D3 (missing data).
After T cell activation for 40 hours, cells were treated with 10 nM calcitriol or vehicle control
for three hours prior to cell harvesting. Due to limited number of CD8+ T cells from two out of
three donors, only cells from one donor (D2) were also treated with vehicle control (ethanol).
CYP24A1 is a well-established vitamin D responsive gene and is known to be upregulated upon
vitamin D treatment, whereas TAGAP has been shown to be down regulated in CD4+ T cells

35
after vitamin D treatment (52). We wanted to find out if these genes were also affected in CD8+
T cells after vitamin D addition and can be used as positive controls for vitamin D response.
After treatment with vitamin D or vehicle control for three hours, RNA was purified from the
cells and used to measure TAGAP and CYP24A1 gene expression by qPCR relative to the PGK1
reference gene. Relative expression of TAGAP (Figure. 3.5 A.) is downregulated after vitamin
D treatment. The downregulation is indicated in all three donors. However, as the same
downregulation is observed also in the ethanol treated cells, this is probably not mediated by
vitamin D. Relative expression of CYP24A1 (Figure. 3.5 B.) is upregulated after vitamin D
treatment in two donors, but surprisingly it shows slightly downregulation in the third donor
(D2) after both vitamin D and ethanol treatment. We can conclude that data from two out of
three donors indicate upregulation of CYP24A1 expression, however, whether this is a specific
effect on vitamin D treatment cannot be stated as no vehicle control was included from these
two donors.

36
Figure 3.5: Expression of TAGAP and CYP24A1 in activated CD8+ T cells after vitamin D treatment.
The relative mRNA expression of A. TAGAP and B. CYP24A1 from three donors before and after
vitamin D (VD) of activated CD8+ T cells. A vehicle control (i.e. ethanol, EtOH) is included for one of
the donors. Gene expression was quantified relative to PGK1 expression. Values represents fold change
relative to before VD/EtOH treatment. Paired student’s T-test was performed to compare TAGAP
expression (p=0.025) before and after vitamin D treatment (see appendix 4, Table 5.4). p<0.05 is
considered significant. We decided not to perform Paired t-test for the expression of CYP24A1, since
we observed slight downregulation in D2 donor.
3.6 Optimizing VDR-ChIP procedure After verifying that cells were responsive to vitamin D, they were further treated with either
anti-VDR or isotype (IgG) control antibodies covered protein A Dynabeads. Before, proceeding
with this cells, VDR-ChIP procedure including crosslinking, lysis buffer and sonication
protocols must be optimized. In this project, ChIP is a method used to precipitate DNA bound
by VDR, using specific anti-VDR antibodies. The precipitated DNA can be analysed by
sequencing, real-time PCR or by PCR using specific designed primers. The MS research group
aims to develop a ChIP-seq pipeline, however, in the current master thesis project, we aim to

37
perform the initial DNA analyses with PCR. The ChIP protocol includes many steps which are
visualized in Figure 3.6.
Figure 3.6: Different steps of the ChIP protocol. The flow chart illustrates the steps of the ChIP
protocol and the tests that were done within each step in the current thesis.
• 3.6.1 Optimization of procedures for crosslinking and sonication DNA/chromatin needs to reach an average length of 100-300 base pairs, as evaluated by agarose
electrophoresis. Chromatin is fragmented using a sonicator. Prior to sonication, the cells need
to be fixed in order to cross-link DNA and protein, following by cell lysis and sonication. The
fixative, the length and temperature used during fixation as well as the cell lysis protocol and
the length and strength of sonication affect chromatin fragmentation (74). The protocols differ
between different cells and tissues and they need to be optimized for each material used. In this
thesis, we aim to do ChIP in CD8+ T cells. However, to achieve sufficient number of cells for
testing the described conditions, we started to evaluate the protocols using PBMCs. The optimal
protocol for PBMC was thereafter confirmed in purified CD8+ T cells.
5-10 million PBMCs were fixed with formaldehyde for 5-, 10- and 15 mins at 4oC or at RT.
Cells were lysed as described in section 2.8.2. following sonication for either 10 min (30 sec

38
on/off, 10 cycles) or 20 min (30 sec on/off, 20 cycles). Sonicated chromatin was isolated using
phenol-chloroform extraction as described in section 2.8.3 and analysed by agarose gel
electrophoresis.
Figure 3.7: Optimization of crosslinking and chromatin fragmentation. Agarose gel electrophoresis
of DNA from PBMCs crosslinked at 4oC in A. and at RT in B. Well nr. 1 in both figures are 100bp gene
ruler. Well nr. 2- 4 samples from cells that were fixed for 5, 10 and 15 mins respectively and sonicated
for 10 mins. Well nr. 6, 7 and 8: samples from cells that were fixed for 5, 10 and 15 mins and sonicated
for 20 mins. Well nr. 5 is negative control, which is fixed sample that were not subjected to sonication.
In well number 4 in Figure 3.7 A, the length of fragmented DNA is 100-300 bp and there is
much more input (fragmented DNA) compared to the other fragmentation, suggesting that it
is better for fix cells at 4oC for 15 min and the length of the sonication does not seem to have
any impact on the fragmentation of the DNA isolated from cell fixed in 4oC.
We observed strong bright band at a high molecule weight in all the wells of each agarose gel
experiment. This is something that should not be there. To clarify the reason behind this, DNA
was purified using a classical purification step (Phenol-chloroform) and a DNA column kit.
The DNA was purified using DNA isolation column kit, does not have the high molecular band
in the wells, as it is shown in Figure. 3.7.

39
Figure 3.8: Analysing the size of fragmented in agarose gel electrophoresis. A. Agarose gel of purified
DNA (from PBMCs that were disrupted by one step lysis) using Phenol-chloroform method and DNA
isolation column kit. Negative control (non-sonicated) DNA was included in the upper right side of gel
in A, showing that it has barely migrated. B. Agarose gel of purified DNA from PBMC investigating
purification of DNA using phenol-chloroform with (well nr 5) and without pellet painter (well nr.3).
Bright band was observed in the well nr. 5 of DNA purified using phenol-chloroform with pellet painter.
This led us to suspected that the DNA paint is the reagent resulting in this high molecular band
in the wells. Therefore, we performed another gel electrophoresis to compare cells purified
using phenol-chloroform with and without cell pellet painter in Figure 3.8.B. No band is
observed in the cells purified phenol-chloroform without pellet painter. We have also observed
that we purified more DNA fragments after using DNA purification kit (see Figure 3.8 A.)
compared to DNA purified using phenol-chloroform.
• 3.6.2 one step versus two lysis buffer In parallel with testing crosslinking and sonication parameters, we also wanted to test two
different lysis buffers; one-step (cell lysis) and two-step (cell and nuclear lysis). VDR is a
receptor that is found in cytosol in cells that are not treated with vitamin D, whereas in cells
that are vitamin D treated, the receptor goes in the nucleus and regulate transcription of its target

40
genes. In this case, we are only interesed on VDR that are inside the nucleus. As mentioned in
section 2.8.2, PBMC were lysed using these two lysis bufferes (see Figure 3.9).
Figure 3.9: PBMC that were lysed using one and two step lysis buffers. The amount of fragmented
DNA isolated from cells is the same in both lysis buffers.
No-variation was observed in the level of fragmented DNA isolated from cells that were lysed
using either of the buffers. Although, no variation was seen among the lysis buffers, we decided
to use two-step lysis in the downstrem expermiments since we are just interessed on
investigating VDR content from mucleus. After verifying that the pellet painter is the one
causing the band in the well and testing lysi buffers in PBMC , we wanted to test the same
conditions in CD8 + T cells. CD8+ T cells were crosslinked at 4oC for 15 min, lysed using two-
step lysis buffer and sonicated for 10 min. The DNA was further purified using phenol-
chloroform without pellet painter and the result is viewed in Figure 3.10.

41
Figure 3.10: Agarose gel of chromatin from CD8+ T cells. The cells were disrupted by two step lysis,
with the fragments of the optimal size range; 100-300 bp, including a negative control that have barely
migrated.
All the cell conditions; cell activation, crosslink, lysis and sonication are by now optimized in
CD8+ T cells and we would like to proceed with ChIP procedure.
3.7 Immunoprecipitation of DNA regions that are bound by VDR Based on a ChIP study done in CD4+ T cell by Handel at al., we chose to analyse selected DNA
fragments that are bound VDR in CD4+ T cells (69) to analyse whether these DNA fragments
are occupied by VDR also in CD8+ T cells. This is not known and was tested in the current
thesis.
After optimization of chromatin fragmentation and confirming CD8+ T cell’s response to
vitamin D after cell activation (see Figure 3.5), VDR ChIP following PCR was performed in
D2 and D3 in order to identify the DNA region bound by VDR. Cells from D1 were treated
only with vitamin D, whereas cells from D2 were treated with either vitamin D or EtOH. All
chromatin except for 100 µl (designed as ‘Input’) was used in the ChIP experiments. DNA was
purified from the remaining chromatin preparation. VDR specific antibodies were used to pull
down the genes that were bound by VDR. Isotype (IgG) control was included and served as a
negative control. Four primer pairs were used for amplification of regions previously shown to
be bound by VDR in CD4+ T cells, covering regions in the MYC, TAGAP (two different regions)
and VDR genes. DNA from the ‘Input’ samples (one per ChIP) as well the ChIP samples was
purified, and PCR was performed to determine whether these genes were precipitated during
the ChIP protocol. Input DNA were diluted to 8, 2 and 0.5 ng and were used in the PCR

42
reactions. This was to compare the strength of the band from the DNA pulled down after VDR
or IgG ChIP.
Figure 3.11: PCR amplification of immunoprecipitated DNA from CD8+ T cells isolated from D1.
CD8+ T cells purified from D1 was stimulated with anti-CD3/CD28 antibodies prior to treatment with
vitamin D (VD). PCR were run on serial dilutions of the input DNA using 8, 2 and 0.5 ng as input. All
four primer pairs (as indicated in the figure) were used for the input samples as well as for the
immunoprecipitated DNA. IgG control was not included, and no band were indicated in the samples,
suggesting that all four DNA regions were not bound by VDR.

43
Figure 3.12: PCR amplification of immunoprecipitated DNA from cells isolated from D2. CD8+ T cells purified
from D2 were stimulated with anti-CD3/CD28 antibodies prior to treatment with vitamin D (VD). PCR were run on
serial dilutions of the input DNA and EtOH using 8, 2 and 0.5 ng as input. All four primer pairs (as indicated in the
figure) were used for the input samples as well as for the immunoprecipitated DNA. IgG control was included in
this analysis. Bands were indicated in both vitamin D and EtOH samples, suggesting that all four DNA regions were
bound by VDR. Weak bands were also indicated in IgG controls (in both vitamin D and EtOH samples).
After performing VDR ChIP of samples from the two donors, DNA was purified, and PCR
performed. Strong signals from all four potential VDR binding sequences were observed in
samples after VDR ChIP from D2, see Figure 3.12, both in ethanol and vitamin D treated
samples. However, we did not observe any PCR products from the DNA purified after VDR
ChIP in D1, see Figure 3.11. Surprisingly, the DNA purified in the IgG isotype controls samples
were also positive for the four PCR reactions in samples from D2. Thus, to analyse whether the

44
VDR or IgG ChIP, pulled down sequences that are also not expected to interact with VDR,
another PCR reaction with primers against a region that is previously shown to be bound by
VDR in T cells (69), serving a negative control for ChIP was also included. The gene region
chosen for this test was an intronic region from GAPDH. The result is illustrated in Figure.
3.13. However, GAPDH came out positive for both donors in cells treated with vitamin D and
ethanol.
Figure 3.13: Displays the precipitated GAPDH Intronic 2 in both D1 and D2. PCR were run on serial
dilutions of the input DNA and EtOH using 8, 2 and 0.5 ng as input. Bands was observed in all samples
and IgG controls treated with either vitamin D (VD) or EtOH.

45
4 Discussion
T cells are important players in the pathogenesis of MS. Although CD8+ T cell are more
abundant in MS lesions compared to CD4+ T cell (4), the role of CD8+ T cell in MS is still not
clear. Low level of vitamin D is shown to be involved in the progression of MS (31). However,
the mechanisms behind increased MS risk and low serum vitamin D levels are poorly
understood. To gain more knowledge about the relation of CD8+ T cells, vitamin D and MS
genetic risk factors, we wanted to establish a VDR-ChIP protocol in CD8+ T cells in order to
identify new DNA binding site for VDR. This chapter includes the discussion of the results
following methodological contemplations.
4.1 Why does cell purity vary among donors? To ensure that the isolated cells were indeed CD8+ T cells, the purity of CD8+ T cells was
confirmed by flow cytometry by staining cells with FITC conjugated mouse anti-human CD8
(HIT8α monoclonal antibody). This antibody specifically binds to CD8α, which are expressed
by CD8+T cells. Of note, natural killer (NK) cells also express low levels of CD8 receptor. As
seen in Table 3.1, the purity of isolated CD8+ T cells varied among the donors. This variation
might be because different proportions of NK cells are present in different donors, and that
these CD8low cells are not captured in the gate for CD8+ T cells. In addition, NK cells expressing
the CD8 receptor might thus appear in the gate we name CD8+ T cells and be considered as
CD8+ T cells even if they are not. By staining the cell population with antibodies specific to
NKG2D, a NK surface receptor (activation marker ) that is upregulated upon NK cell activation
(75), is one way to control for the presence of NK cells in the CD8+ T cell population.
4.2 Which activation method is adequate to use: antibody covered Dynabeads or
antibody coated plate? Stimulating cells using anti-CD3/CD28 covered beads may cause lower degree of variation
across experiments compared to stimulating cells with plate bound antibodies. This is because
the beads have a fixed amount of antibodies on the surface (made commercially), while plate
bound antibody solution is prepared by us by diluting the stock concentration of the antibodies
to 5 and 2 µg/ml before each individual experiment, and are thus more prone to variations
between the experiments. We investigated the variance of cell activation in our experiment with
both antibody coated plate and antibody covered Dynabeads (data not shown). Plate bound
activation gave high proportion of activated cells at each experiment (varying from 80-84%).
Unfortunately, we could not measure the degree of activation of CD69+ CD8+ T cells in cells

46
activated with Dynabeads by flow cytometry, but rather with qPCR to measure the mRNA
expression of CD69. As anti-CD3/CD28 covered Dynabeads are big in size, they must be
removed prior to flow cytometry. Since CD8+ T cells were isolated using positive selection
(beads are directly bound to CD8+ T cells) from whole blood as described in section 2.1.2, beads
remain bound to the cells after purification and cannot be removed.
Furthermore, it was not possible to compare the variance between the two activation
experiments as the same activation methods were not used. In addition, flow cytometry
measured CD69+ per cell, whereas qPCR measured the expression of CD69. By performing
qPCR for plate bound activated cell, the variance between the two experiments could be
compared. However, we measured cell viability before and after cell stimulation to verify the
activation method that gave the lowest cell death.
4.3 Cell viability before and after cell stimulation Previous experiments from the lab have shown that 1:1 bead to cell ratio gave high degree of
dead cells (personal communication) after activation. This is consistent with the result we got
(data not shown), resulting in the high degree of cell death after stimulation (94-60%), whereas
1:4 bead to cell ratio led to low cell death (94-92%) without affecting the activation response.
Therefore, 1:4 bead to cell was used to stimulate CD8+ T cells. As illustrated in Table 3.3, the
percentage of live cells after stimulation was reduced compared to before stimulation. This
finding is consistent to what has been observed earlier (76). These naïve cells are activated in
an environment that is different from their natural environment. Cell variability was almost the
same using both techniques as viewed in Table 3.3.
Performing qPCR to confirm cell activation is time consuming and requires more cells to be
analysed compared to flow cytometry. Antibody coated plate is more gentle activation method
that goes well with activation response of CD8+ T cells and led to better viability. Therefore,
this activation method is more adequate and suitable for the stimulation of positive selected
isolated CD8+ T cells and is chosen to be used for the downstream activation experiments.
4.4 CD8+ T cell activation using antibody coated plate to induce VDR
expression In naïve T cells, the expression of VDR is generally low and is induced by activation through
the TCR (29). In order for the cell to have sufficient amounts of VDR upon vitamin D treatment,
we titrated the amount of anti-CD3/CD28 antibodies for activation (see section 3.2) to
investigate which concentration gave the highest frequency of activated CD8+ T cells (measured
by CD69 cell surface expression). The highest level of activation was achieved using 5 µg/ml

47
plate bound anti-CD3 and 2 µg/ml soluble anti-CD28 antibodies, resulting in 87% activation.
There are many other protocols with different concentration of ani-CD3/CD28 used for T cell
activation, but the concentration that is used in this thesis is comparable with study done by
Forster at el (73).
VDR was observed to be significantly increased after 40 hours of stimulation compared non-
stimulated (0 hours) and after 17 hours of stimulation (see appendix 4, Table 5.1). Thus, cells
were stimulated for 40 hours prior to vitamin D addition.
4.5 Vitamin D responsive genes; TAGAP and CYP24A1 The level of vitamin D can vary among donors. In addition, the activation status of the purified
cells varies and might cause different results for VDR expression at baseline. However, after T
cell activation, VDR expression was induced in all experiments. When VDR expression
reached a high level, the cells were treated with 10 nM active vitamin D and EtOH (vehicle
control) and expression of selected vitamin D response genes were analysed by qPCR. Due to
limited numbers of CD8+T cells, only cells from D2 were treated with vitamin D and EtOH,
while cells from D1 and D3 were treated with vitamin D only. 10 nM calcitriol is frequent used
in vitro in other studies (52). Vitamin D was added directly to the cell suspension, which may
cause high local concentration directly to the cells and induce more regulation of target genes
in certain cells compared to physiological conditions.
CYP24A1 and TAGAP were regulated by vitamin D in CD4+ T cells (52). The downregulation
of TAGAP (p=0.025) (see appendix 4, Table 5.4) was reduced more than 0,5-fold after 3 hours
of vitamin D treatment, showing that this is likely regulated directly from VDR itself and not
through other transcriptional factors that regulates VDR. At the time of vitamin D addition, the
cells were transferred from their original activation plate (coated with anti-CD3) into new
activation plate (not coated with antibodies). Antibodies for the activation of cells were not
added to the plate as these cells were treated with vitamin D for three hours, therefore, the slight
downregulation of CYP24A1 (in vitamin D and EtOH treated cells form D2) and TAGAP (in
EtOH treated cells from D2), was probably not mediated by vitamin D, it could simply be that
the cells were no longer activated. We should have added anti-CD3/CD28 Dynabeads in parallel
to vitamin D addition to further stimulate the cells and follow how the expression of TAGAP
and CYP24A1 change.
Our results in CD8+ T cells are in agreement with previous studies showing that CYP24A1 is
upregulated in activated CD4+ T cells upon vitamin D addition (52). The role of CYP24A1 is to

48
deactivate the active vitamin D and the level of CYP24A1 is proportional with the amount of
active vitamin D. The upregulation of CYP24A1 is seen in two of three donors (D1 and D3),
while downregulation was seen in the third donor (D2). Since the expression of CYP24A1 and
TAGAP genes are induced upon activation of CD8+ T cells, they can be used as a positive
control for vitamin D response. Our results from CD8+ T cells showing downregulation of
TAGAP expression and upregulation of CYP24A1 expression after vitamin D treatment is in
line with what is observed in CD4+T cells (52). The findings indicate that the gene regulation
was induced with vitamin D addition, but since more EtOH control was not included, it is
difficult to conclude and that further studies are required in order to confirm the findings.
4.6 Methodological contemplations To our knowledge, a procedure on VDR-CHIP in CD8+ T cells has not been performed
previously. Thus, the aim of this thesis was to optimize a protocol for VDR-ChIP in CD8+ T
cells in order to identify new binding sites for VDR.
• 4.6.1 Cross-linking, cell lysis and sonication optimization Crosslinking is a step in the ChIP procedure that plays a major role in obtaining a successful
sonication. It is important to sonicate DNA into smaller fragments, since very large fragments
might contain several potential VDREs, in addition to none-relevant sequences, can make it
difficult to identify the relevant DNA binding region. In this thesis, we use formaldehyde to
crosslink DNA- bound protein. The reaction temperature (RT or 4oC) and incubation time (5-,
10- and 15 min) during crosslinking was optimized. These optimizing parameters are dependent
on the physical environment of the target protein, which varies between cytosolic and
membrane proteins (77).
After crosslinking, we proceeded with cell lysis in order to free the cellular content, testing both
one-step lysis and two-step lysis. As mentioned in section 1.7.4, choosing the right lysis buffer
is essential for achieving the best possible yield. Since VDR is a nuclear receptor found both in
the cytosol and nucleus, we wanted to confirm that it is nuclear VDR we are
immunoprecipitating. The free VDR in the cytosol needs to be removed so they do not bind to
specific VDR antibodies during the ChIP procedure. We found that the two-step lysis buffer
gave almost the same chromatin yield after sonication compared to the one-step lysis. The first
step in this procedure is cellular lysis, where the external membrane gets disrupted. The second
step is nuclear lysis that disrupts the nuclear membrane and frees the nuclear content. In this
way, we can access the VDR that is bound to target chromatin. However, due to time limitation,
we were not able to test whether the two-step lysis resulted in more specific immune

49
precipitation compared to the one-step lysis. Sonication was tested for 10- and 20 min, as
viewed in Figure 3.7. Sonicating the lysate for 10 and 20 min gave the same chromatin fragment
in the expected range (300-100 bp), so, for further fragmentation of chromatin, we decided to
sonicate the lysate for 10 min.
Furthermore, after ChIP, the DNA are purified from the precipitate. So, breaking the interaction
between protein and DNA through a process called decrosslinking, is required. Proteinase K
was used to degrade protein, while phenol-chloroform or DNA isolation kit were used to purify
DNA. These two DNA purification methods were used to investigate what caused the
signal/band viewed on the wells of agarose gel in Figure 3.8 to appear. No-band was observed
after purifying DNA using the kit, suggesting that were components within the phenol-
chloroform protocol that was causing the high molecular band on the wells of the agarose gel.
Pellet paint is composed of proteins that is precipitated together with the DNA in order to easily
visualize DNA after centrifugation. This was added to the precipitated DNA in the last step of
phenol-chloroform protocol. Later, we discovered that Pellet paint absorbs UV light, thus
causing a bright, high molecule band as agarose gels were analysing. Once the Pellet Paint was
removed from the protocol, this bright band disappeared as illustrated in Figure 3.10.

50
Figure 4.1: The pathway of optimized ChIP procedure. This flow chart includes the parameters that
gave best results within each step.
4.7 Identification of precipitated DNA bound by VDR After optimizing the cell activation and preparation of samples for ChIP, the entire VDR ChIP
procedure was performed using an anti-VDR antibody in addition to an isotype control (anti-
IgG). To confirm that the ChIP procedure was optimized, we chose DNA fragments (MYC and
TAGAP) that are shown to be pulled down by VDR-immunoprecipitation in activated CD4+ T
cells (69) to investigate whether they could also be pulled down in CD8+ T cells. After
performing the ChIP procedure and PCR amplification of selected regions,
immunoprecipitation of MYC, TAGAP and VDR was confirmed in one donor while no
immunoprecipitation was observed in the second donor. By including a negative control, a
region of DNA that does not bind VDR, we can verify unspecific binding of the VDR antibody.
In addition to the isotype control (anti-IgG) and the vehicle control (EtOH), PCR using GAPDH
primers served as a negative control for unspecific immunoprecipitated DNA was performed.
We found non-specific bands in agarose gel after performing PCR, indicating positive results
in the negative controls (IgG and EtOH) and in genes that were known to not be bound by VDR
(GAPDH).

51
Some possible explanation for obtaining these results could be that protein A/G that are
bacterial proteins that have the capacity to bind various immunoglobulins with different
affinities. Protein A/G coated Dynabeads are antibody binding beads which help to capture
DNA-Protein or protein-protein complexes. Since these Dynabeads can bind to various
antibodies and if ChIP method is not fully optimized, these beads can non-specifically pull
down some genes, which could be one of the reasons why GAPDH (negative control) were
pulled down in both donors.
Another reason for the findings could be the monoclonal anti-VDR antibody. We decided to
use this antibody as other researches in other lab use it to pull down VDR binding DNA regions
(personal communication). Unfortunately, crosslinking can cover target epitope within the cells
that monoclonal antibodies are specific to, and this could have led to negative reaction in D1.
But since the ChIP procedure was only performed once, we cannot say that this antibody has
caused the negative reaction. Thus, it might be wise to repeat the procedure using a polyclonal
anti-VDR antibody that have the affinity to different epitopes within cells, which might increase
in the immunoprecipitation of target DNAs.
An anti-IgG isotype control was included in the ChIP procedure to exclude signals from VDR-
ChIP due to non-specific binding to the antibody’s constant regions. Unfortunately, as
illustrated in Figure 3.12, the anti-IgG control in D2 gave bands, suggesting that non-specific
binding might have occurred and the results for this donor should not to be trusted. The reason
for this could be incomplete washing after IP or contamination of input in the sample leading
to pull down of other DNA regions that are not necessarily bound by VDR.

52
5 Conclusions and future perspective
In section 1, the theoretical and aim of the thesis was described following the methods used to
investigate the aim were shown in section 2. The results were illustrated in section 3 and the
discussion of these results were explained in section 4. In this final section, I will summarize
the findings and some suggestions for future perspectives.
5.1 Summary - part 1 The first aim in this thesis was to find out which concentration of anti-CD3/CD28 antibodies
should be used for plate bound cell activation, activation method (antibodies coated plate or
antibodies covered beads) is more suitable to use for CD8+ T cells and the variance among these
two activation methods.
• 5 µg/ml plate bound anti-CD3 and 2 µg/ml soluble anti-CD28 antibodies were the con-
centrations that gave the best CD8+ T cells stimulation in percentage.
• Antibody coated plate was found to be the most suitable activation method to use for
CD8+ T cells. Unfortunately, we could not test the variance among these two methods
as two different parameters (flow cytometry and qPCR) were used to verify the cell
activation.
5.2 Summary - part 2 Furthermore, the study investigated at which time point the VDR expression was highly induced
prior to vitamin D addition and to further investigate the cell response to vitamin D. The genes
that are known to be regulated by vitamin D; TAGAP and CYP24A1 were measured in CD8+ T
cells.
• VDR expression was highly induced after 40 hours compared to 17 hours of CD8+ T
cell stimulation.
• TAGAP was downregulated, whereas CYP24A1 was upregulated with the presence of
vitamin D.
5.3 Summary - part 3 The third aim of the thesis was to optimize ChIP protocol to investigate the pulldown of DNA
regions that are known to be bound by VDR in CD4+ T can also be candidate DNA regions in
CD8+ T cells.

53
• DNA regions were not pulldown by IP in D1 but all were pulled down in D2. But since
we had few donors and one EtOH control to proceed with the ChIP procedure, we cannot
fully conclude that these selected DNA regions that were presented in CD4+ T cells, also
are candidate DNA region in CD8+ T cells. Therefore, we cannot fully conclude that
ChIP procedure is fully optimized and ready to be used. Therefore, more optimization
is required.
5.4 Future perspectives The data in this thesis was exceptionally rich, however, due to time limitations we have only
managed to perform full ChIP procedure in one donor (including EtOH and IgG control). Given
that our ChIP findings are based on this donor, it should be repeated to confirm whether the
procedure are suitable for VDR-ChIP in CD8+ T cells or if is needs further optimizations by
including more cells to obtain proper controls, testing different monoclonal and polyclonal
antibodies that are specific to VDR and testing primers that can cover other DNA regions in
CD8+ T cells than mentioned in this thesis.
The next step is to perform VDR-ChIP sequence in order to investigate whether MS associated
genes influencing the binding site of VDR but also to discover and identify new binding site of
VDR in CD8+ and CD4+ T cells. It would be interesting to see if CD8+ T cells are mapped to
have different VDR binding site than CD4+ T cells and further see how much overlap there is
between CD8+ and CD4+ T cells compared to other types of immune cells.

54
6 Reference list
1. Salou M, Nicol B, Garcia A, Laplaud DA. Involvement of CD8(+) T Cells in Multiple
Sclerosis. Front Immunol. 2015;6:604.
2. Laribi B, Sahraian MA, Shekarabi M, Emamnejad R, Marzban M, Sadaghiani S, et al.
Characterization of CD4+ and CD8+ T Cell Subsets and Interferon Regulatory Factor 4 (IRF4)
in MS Patients Treated with Fingolimod (FTY-720): A Follow-up Study. Iran J Allergy Asthma
Immunol. 2018;17(4):346-60.
3. Ascherio A, Munger KL. Environmental risk factors for multiple sclerosis. Part I: the
role of infection. Ann Neurol. 2007;61(4):288-99.
4. Fletcher JM, Lalor SJ, Sweeney CM, Tubridy N, Mills KH. T cells in multiple sclerosis
and experimental autoimmune encephalomyelitis. Clin Exp Immunol. 2010;162(1):1-11.
5. Hoogs M, Kaur S, Smerbeck A, Weinstock-Guttman B, Benedict RH. Cognition and
physical disability in predicting health-related quality of life in multiple sclerosis. International
journal of MS care. 2011;13(2):57-63.
6. Popescu BF, Pirko I, Lucchinetti CF. Pathology of multiple sclerosis: where do we
stand? Continuum (Minneapolis, Minn). 2013;19(4 Multiple Sclerosis):901-21.
7. Hudgens S, Schuler R, Stokes J, Eremenco S, Hunsche E, Leist TP. Development and
Validation of the FSIQ-RMS: A New Patient-Reported Questionnaire to Assess Symptoms and
Impacts of Fatigue in Relapsing Multiple Sclerosis. Value Health. 2019;22(4):453-66.
8. Bakshi R, Thompson AJ, Rocca MA, Pelletier D, Dousset V, Barkhof F, et al. MRI in
multiple sclerosis: current status and future prospects. The Lancet Neurology. 2008;7(7):615-
25.
9. Medana I, Martinic MA, Wekerle H, Neumann H. Transection of major
histocompatibility complex class I-induced neurites by cytotoxic T lymphocytes. The American
journal of pathology. 2001;159(3):809-15.
10. Domingues RB, Fernandes GBP, Leite F, Tilbery CP, Thomaz RB, Silva GS, et al. The
cerebrospinal fluid in multiple sclerosis: far beyond the bands. Einstein (Sao Paulo).
2017;15(1):100-4.
11. Abdelhak A, Huss A, Kassubek J, Tumani H, Otto M. Serum GFAP as a biomarker for
disease severity in multiple sclerosis. Scientific reports. 2018;8(1):14798.
12. Lopez-Pedrera C, Perez-Sanchez C, Ramos-Casals M, Santos-Gonzalez M, Rodriguez-
Ariza A, Cuadrado MJ. Cardiovascular risk in systemic autoimmune diseases: epigenetic
mechanisms of immune regulatory functions. Clin Dev Immunol. 2012;2012:974648.
13. Sethi DK, Gordo S, Schubert DA, Wucherpfennig KW. Crossreactivity of a human
autoimmune TCR is dominated by a single TCR loop. Nature Communications. 2013;4(1).

55
14. Chastain EM, Miller SD. Molecular mimicry as an inducing trigger for CNS
autoimmune demyelinating disease. Immunol Rev. 2012;245(1):227-38.
15. Iyer SS, Cheng G. Role of interleukin 10 transcriptional regulation in inflammation and
autoimmune disease. Critical reviews in immunology. 2012;32(1):23-63.
16. Buch T, Rieux-Laucat F, Forster I, Rajewsky K. Failure of HY-specific thymocytes to
escape negative selection by receptor editing. Immunity. 2002;16(5):707-18.
17. O'Gorman C, Lucas R, Taylor B. Environmental risk factors for multiple sclerosis: a
review with a focus on molecular mechanisms. Int J Mol Sci. 2012;13(9):11718-52.
18. Hoglund RA, Maghazachi AA. Multiple sclerosis and the role of immune cells. World
J Exp Med. 2014;4(3):27-37.
19. Willer CJ, Dyment DA, Risch NJ, Sadovnick AD, Ebers GC. Twin concordance and
sibling recurrence rates in multiple sclerosis. Proc Natl Acad Sci U S A. 2003;100(22):12877-
82.
20. International Multiple Sclerosis Genetics C, Wellcome Trust Case Control C, Sawcer S,
Hellenthal G, Pirinen M, Spencer CC, et al. Genetic risk and a primary role for cell-mediated
immune mechanisms in multiple sclerosis. Nature. 2011;476(7359):214-9.
21. International Multiple Sclerosis Genetics C, Beecham AH, Patsopoulos NA, Xifara DK,
Davis MF, Kemppinen A, et al. Analysis of immune-related loci identifies 48 new susceptibility
variants for multiple sclerosis. Nat Genet. 2013;45(11):1353-60.
22. Hoppenbrouwers IA, Hintzen RQ. Genetics of multiple sclerosis. Biochim Biophys
Acta. 2011;1812(2):194-201.
23. Ascherio A, Munger KL. Epidemiology of Multiple Sclerosis: From Risk Factors to
Prevention-An Update. Semin Neurol. 2016;36(2):103-14.
24. Angelini DF, Serafini B, Piras E, Severa M, Coccia EM, Rosicarelli B, et al. Increased
CD8+ T cell response to Epstein-Barr virus lytic antigens in the active phase of multiple
sclerosis. PLoS Pathog. 2013;9(4):e1003220.
25. Kampman MT, Wilsgaard T, Mellgren SI. Outdoor activities and diet in childhood and
adolescence relate to MS risk above the Arctic Circle. J Neurol. 2007;254(4):471-7.
26. Tao C, Simpson S, Jr., van der Mei I, Blizzard L, Havrdova E, Horakova D, et al. Higher
latitude is significantly associated with an earlier age of disease onset in multiple sclerosis. J
Neurol Neurosurg Psychiatry. 2016;87(12):1343-9.
27. Al Wutayd O, Mohamed AG, Saeedi J, Al Otaibi H, Al Jumah M. Environmental
exposures and the risk of multiple sclerosis in Saudi Arabia. BMC Neurol. 2018;18(1):86.
28. Sintzel MB, Rametta M, Reder AT. Vitamin D and Multiple Sclerosis: A
Comprehensive Review. Neurol Ther. 2018;7(1):59-85.

56
29. Kongsbak M, Levring TB, Geisler C, von Essen MR. The Vitamin D Receptor and T
Cell Function. Frontiers in Immunology. 2013;4.
30. Karlic H, Varga F. Impact of vitamin D metabolism on clinical epigenetics. Clin
Epigenetics. 2011;2(1):55-61.
31. Rolf L, Smolders J, van den Ouweland J, Hupperts R, Damoiseaux J. Correlation of
different cellular assays to analyze T cell-related cytokine profiles in vitamin D3-supplemented
patients with multiple sclerosis. Mol Immunol. 2019;105:198-204.
32. Dobson R, Giovannoni G, Ramagopalan S. The month of birth effect in multiple
sclerosis: systematic review, meta-analysis and effect of latitude. J Neurol Neurosurg
Psychiatry. 2013;84(4):427-32.
33. Munger KL, Levin LI, Hollis BW, Howard NS, Ascherio A. Serum 25-hydroxyvitamin
D levels and risk of multiple sclerosis. Jama. 2006;296(23):2832-8.
34. Wingerchuk DM, Lesaux J, Rice GP, Kremenchutzky M, Ebers GC. A pilot study of
oral calcitriol (1,25-dihydroxyvitamin D3) for relapsing-remitting multiple sclerosis. J Neurol
Neurosurg Psychiatry. 2005;76(9):1294-6.
35. Matías-Guíu J, Oreja-Guevara C, Matias-Guiu JA, Gomez-Pinedo U. Vitamin D and
remyelination in multiple sclerosis. Neurología (English Edition). 2018;33(3):177-86.
36. Pierrot-Deseilligny C. Clinical implications of a possible role of vitamin D in multiple
sclerosis. J Neurol. 2009;256(9):1468-79.
37. Saccone D, Asani F, Bornman L. Regulation of the vitamin D receptor gene by
environment, genetics and epigenetics. Gene. 2015;561(2):171-80.
38. Wucherpfennig KW, Gagnon E, Call MJ, Huseby ES, Call ME. Structural biology of
the T-cell receptor: insights into receptor assembly, ligand recognition, and initiation of
signaling. Cold Spring Harb Perspect Biol. 2010;2(4):a005140.
39. Mars LT, Saikali P, Liblau RS, Arbour N. Contribution of CD8 T lymphocytes to the
immuno-pathogenesis of multiple sclerosis and its animal models. Biochim Biophys Acta.
2011;1812(2):151-61.
40. Xing Y, Hogquist KA. T-cell tolerance: central and peripheral. Cold Spring Harb
Perspect Biol. 2012;4(6).
41. Huseby ES, Liggitt D, Brabb T, Schnabel B, Öhlén C, Goverman J. A Pathogenic Role
for Myelin-Specific Cd8+T Cells in a Model for Multiple Sclerosis. The Journal of
Experimental Medicine. 2001;194(5):669-76.
42. Skulina C, Schmidt S, Dornmair K, Babbe H, Roers A, Rajewsky K, et al. Multiple
sclerosis: brain-infiltrating CD8+ T cells persist as clonal expansions in the cerebrospinal fluid
and blood. Proc Natl Acad Sci U S A. 2004;101(8):2428-33.

57
43. Khaibullin T, Ivanova V, Martynova E, Cherepnev G, Khabirov F, Granatov E, et al.
Elevated Levels of Proinflammatory Cytokines in Cerebrospinal Fluid of Multiple Sclerosis
Patients. Front Immunol. 2017;8:531.
44. Babbe H, Roers A, Waisman A, Lassmann H, Goebels N, Hohlfeld R, et al. Clonal
Expansions of Cd8+T Cells Dominate the T Cell Infiltrate in Active Multiple Sclerosis Lesions
as Shown by Micromanipulation and Single Cell Polymerase Chain Reaction. The Journal of
Experimental Medicine. 2000;192(3):393-404.
45. Denic A, Wootla B, Rodriguez M. CD8(+) T cells in multiple sclerosis. Expert Opin
Ther Targets. 2013;17(9):1053-66.
46. Sinha S, Boyden AW, Itani FR, Crawford MP, Karandikar NJ. CD8(+) T-Cells as
Immune Regulators of Multiple Sclerosis. Front Immunol. 2015;6:619.
47. Yu Y, Ma X, Gong R, Zhu J, Wei L, Yao J. Recent advances in CD8(+) regulatory T
cell research. Oncol Lett. 2018;15(6):8187-94.
48. Chen ML, Yan BS, Kozoriz D, Weiner HL. Novel CD8+ Treg suppress EAE by TGF-
beta- and IFN-gamma-dependent mechanisms. Eur J Immunol. 2009;39(12):3423-35.
49. Huseby ES, Huseby PG, Shah S, Smith R, Stadinski BD. Pathogenic CD8 T cells in
multiple sclerosis and its experimental models. Front Immunol. 2012;3:64.
50. Kusmartsev SA, Li Y, Chen SH. Gr-1+ Myeloid Cells Derived from Tumor-Bearing
Mice Inhibit Primary T Cell Activation Induced Through CD3/CD28 Costimulation. The
Journal of Immunology. 2000;165(2):779-85.
51. Fooksman DR, Vardhana S, Vasiliver-Shamis G, Liese J, Blair DA, Waite J, et al.
Functional Anatomy of T Cell Activation and Synapse Formation. Annual Review of
Immunology. 2010;28(1):79-105.
52. Berge T. The multiple sclerosis susceptibility genes TAGAP and IL2RA are regulated
by vitamin D in CD4+ T cells. Science. 2016:118–27.
53. Bretscher PA. A two-step, two-signal model for the primary activation of precursor
helper T cells. Proc Natl Acad Sci U S A. 1999;96(1):185-90.
54. Renner C, Jung W, Sahin U, van Lier R, Pfreundschuh M. The role of lymphocyte
subsets and adhesion molecules in T cell-dependent cytotoxicity mediated by CD3 and CD28
bispecific monoclonal antibodies. Eur J Immunol. 1995;25(7):2027-33.
55. Chen J, Bruce D, Cantorna MT. Vitamin D receptor expression controls proliferation of
naive CD8+ T cells and development of CD8 mediated gastrointestinal inflammation. BMC
Immunol. 2014;15:6.
56. Alharbi FM. Update in vitamin D and multiple sclerosis. Neurosciences (Riyadh).
2015;20(4):329-35.

58
57. Hausler D, Weber MS. Vitamin D Supplementation in Central Nervous System
Demyelinating Disease-Enough Is Enough. Int J Mol Sci. 2019;20(1).
58. Prosser DE, Jones G. Enzymes involved in the activation and inactivation of vitamin D.
Trends Biochem Sci. 2004;29(12):664-73.
59. Jones G, Prosser DE, Kaufmann M. 25-Hydroxyvitamin D-24-hydroxylase
(CYP24A1): its important role in the degradation of vitamin D. Arch Biochem Biophys.
2012;523(1):9-18.
60. Jones G. Metabolism and biomarkers of vitamin D. Scand J Clin Lab Invest Suppl.
2012;243:7-13.
61. Hu XD, Jiang SL, Liu CH, Hu YY, Liu C, Sun MY, et al. Preventive effects of 1,25-
(OH)2VD3 against ConA-induced mouse hepatitis through promoting vitamin D receptor gene
expression. Acta Pharmacol Sin. 2010;31(6):703-8.
62. Cantorna MT. Why do T cells express the vitamin D receptor? Ann N Y Acad Sci.
2011;1217:77-82.
63. Adorini L. Immunomodulatory effects of vitamin D receptor ligands in autoimmune
diseases. International immunopharmacology. 2002;2(7):1017-28.
64. Lambert SA, Jolma A, Campitelli LF, Das PK, Yin Y, Albu M, et al. The Human
Transcription Factors. Cell. 2018;172(4):650-65.
65. Haussler MR, Jurutka PW, Mizwicki M, Norman AW. Vitamin D receptor (VDR)-
mediated actions of 1alpha,25(OH)(2)vitamin D(3): genomic and non-genomic mechanisms.
Best Pract Res Clin Endocrinol Metab. 2011;25(4):543-59.
66. Carlberg C, Campbell MJ. Vitamin D receptor signaling mechanisms: integrated actions
of a well-defined transcription factor. Steroids. 2013;78(2):127-36.
67. Lu M, McComish BJ, Burdon KP, Taylor BV, Korner H. The Association Between
Vitamin D and Multiple Sclerosis Risk: 1,25(OH)2D3 Induces Super-Enhancers Bound by
VDR. Front Immunol. 2019;10:488.
68. Hwang YG, Hsu HC, Lim FC, Wu Q, Yang P, Fisher G, et al. Increased vitamin D is
associated with decline of naive, but accumulation of effector, CD8 T cells during early aging.
Adv Aging Res. 2013;2(2):72-80.
69. Handel AE, Sandve GK, Disanto G, Berlanga-Taylor AJ, Gallone G, Hanwell H, et al.
Vitamin D receptor ChIP-seq in primary CD4+ cells: relationship to serum 25-hydroxyvitamin
D levels and autoimmune disease. BMC Medicine. 2013;11:163.
70. Tavera-Mendoza LE, Mader S, White JH. Genome-wide approaches for identification
of nuclear receptor target genes. Nucl Recept Signal. 2006;4:e018.
71. Nelson JD, Denisenko O, Bomsztyk K. Protocol for the fast chromatin
immunoprecipitation (ChIP) method. Nat Protoc. 2006;1(1):179-85.

59
72. Hoffman EA, Frey BL, Smith LM, Auble DT. Formaldehyde crosslinking: a tool for the
study of chromatin complexes. J Biol Chem. 2015;290(44):26404-11.
73. Forster M, Boora RK, Petrov JC, Fodil N, Albanese I, Kim J, et al. A role for the histone
H2A deubiquitinase MYSM1 in maintenance of CD8(+) T cells. Immunology.
2017;151(1):110-21.
74. Pchelintsev NA, Adams PD, Nelson DM. Critical Parameters for Efficient Sonication
and Improved Chromatin Immunoprecipitation of High Molecular Weight Proteins. PLoS One.
2016;11(1).
75. Zhu J, Huang X, Yang Y. NKG2D is Required for NK Cell Activation and Function in
Response to E1-deleted Adenovirus. J Immunol. 2010;185(12):7480-6.
76. Aksoy BA, Aksoy P, Wyatt M, Paulos C, Hammerbacher J. Human Primary T cells: A
practical Guide. 2018.
77. Klockenbusch C, Kast J. Optimization of formaldehyde cross-linking for protein
interaction analysis of non-tagged integrin beta1. J Biomed Biotechnol. 2010;2010:927585.

60
7 Appendix
List of appendixes
Appendix 1. Materials, machines and computer software
Appendix 2. Recipes
Appendix 3. Standard curves of PGK1, VDR, TAGAP and CYP24A1 from three
donors after vitamin D treatment
Appendix 4. Statistics
Appendix 5. Result

61
Appendix 1. Materials, machines and computer software
Materials Products Cat. no
Cell culture
CD8 Isolation Kit Stem Cell™ Technologies 17853
Dynabeads™ Protein A Thermo Fisher Scientific 00564257
T-activator CD3/CD38 Dynabeads Thermo Fisher Scientific 11456D
RPMI medium 1640 (1x) Gibco® Life technologies™ 21875-034
X-VIVO ™ Lonza BE02-060F
Dulbecco’s phosphate
buffered saline (PBS)
Sigma Life Science
D8537-500ML
Lymphoprep Stem Cell™ Technologies 12IMS05
Counting slides, dual chamber for
cell counter
Bio-Rad
145-0015
Tryphan Blue Solution (0.4%) Sigma-Aldrich T8154
1α,25-Dhydroxyvitamin D3 Sigma D1530-10UG
Buffers and Standards
Foetal bovine serum (FBS) Gibco ® Thermo Scientific SV30160.03
Sodium dodecyl sulphate (SDS) Sigma-Aldrich D8537-500ML
RNA isolation
Qiashredder Qiagen 79656
RNAprotect® Cell Reagent 250ml Qiagen 74034
RNeasy Plus mini kit Qiagen 74134
RNase AWAY® VWR 7002
Gene expression
TaqMan® Gene expression
Master Mix
Applied biosystems
4369016
10x PCR Rxn Buffer Invitrogen Y02028
Platinum Taq Invitrogen 10966-034
DNase, Rnase and protein free
water
5 PRIME 2500010

62
SDS-PAGE and Western blot
Immuno-blot® PVDF membrane Bio-Rad 1704157
Precision Plus Protein™ Dual
Colour
Bio-Rad
161-0374
Restore™ PLUS Western
Blot Stripping
Thermo Scientific
46430
Anti-actin produced in rabbit Sigma A2066
Skim milk powder Sigma Aldrich 70166-500G
Clarity™Western ECL Substrate Bio-Rad 102030889
Tris buffered saline with Tween®
20 (TBS-T)
Medicago
09-7510-100
TBS-Tween™ Tablets Medicago 09-7510-100
Ponceau staining solution Sigma-Aldrich P7170-1L
ChIP
Formaldehyde Sigma Life Science F8775-25ML
Glycine Sigma-Aldrich G7126-1KG
Anti-VDR Santa Cruz Biotechnology sc-13133
Anti-IgG Santa Cruz Biotechnology sc-2025
DNA purification
Phenol Chloroform Sigma Life Science P3803-100ML
Chloroform Sigma Life Science C0549-1PT
Β-mercaptoethanol Sigma Aldrich M3148-100ML
Sodium acetate BioXtra SLBQ8253V
Glycogen Invitrogen 10814-010
MicroChIP Pure column Diagenode C03040001
Agarose gel electrophoresis
Magnesium Chloride (MgCl2) Invitrogen Y02016
Ethidium bromide (EtBr) MP- Biomedical, LLC 190202
Agarose, Seakem® LE Lonza 50004

63
GeneRuler low range Thermo Scientific SM1193
GeneRuler 100pb DNA ladder Thermo Scientific SM0241
6x DNA loading dye Thermo Scientific R0611
Chemicals
Complete, EDTA free Tablets Roche 11873580001
PMSF Sigma Aldrich P7626-5G
Machines Producer
ChemiDoc™ Touch Imaging System Bio-Rad
NanoDrop 2000c Thermo Scientific
2720 Thermal Cycler Applied Biosystem
Attune® Acoutic Focusing Cytometer Applied Biosystem
Minichiller 300 Diagenode
Ultrasonic Processor (UP)100H Hielscher Ultrasound Technology
TC20™Automated Cell Counter Bio-Rad
Software company
Image Lab 5.2.1 Bio-Rad Laboratories
NanoDrop 2000c Thermo Scientific
Viia™ 7 Software Applied Biosystem

64
Appendix 2: Recipes RIPA BUFFER Stock 100 ml 1 ml 4oC
0.1% SDS 10% 1 ml
0.1% sodium deoxycholate 0.1 g
1% Triton X-100 100% 1 ml
1 mM EDTA (pH 8) 0.5 M 200 μl
0.5 mM EGTA (pH 8) 0.5 M 100 μl
140 mM NaCl 5 M 2.8 ml
10 mM Tris-HCl (pH 8) 1 M 1 ml
dH2O 93.9 ml
Protease inhibitor cocktail 25x 40 μl Add to 1 ml of RIPA
1 mM PMSF 100 mM 10 μl buffer just before
use
ELUTION BUFFER Stock 50 ml 4oC
50 mM NaCl 5 M 500 μl
20 mM Tris-HCl (pH 7.5) 1 M 1 ml
5 mM EDTA (pH 8) 0.5 M 500 μl
dH2O 42 ml
1% SDS 10% 5 ml Add just
before use
1x Tris/Glycine/SDS running buffer
(25 mM Tris, 192 mM 0.1% SDS) 1 liter
10x Tris/Glycine/SDS running buffer 100 ml
dH2O 990 ml

65
3% skimmed milk in 1 x TBS-T
(10 mM Tris, 150 mM NaCl, Tween 20) 500 ml
Skimmed milk powder 15 g
1x TBS-T up to 500 ml

66
Appendix 3. Standard curves of PGK1, VDR, TAGAP and CYP24A1 from three
donors after vitamin D treatment
Donor 1
Figure 5.1: The standard curve of TAGAP and CYP24A1 from donor 1. Red dots are standard curve
samples, whereas the blue dots present the samples.

67
Donor 2
Figure 5.2: Standard curve of PGK1, VDR, TAGAP and CYP24A1 from donor 2. Red dots are
standard curve samples, whereas the blue dots present the samples.

68
Donor 3
Figure 5.3: Standard curve of PGK1, VDR, TAGAP and CYP24A1 from donor 3. Red dots are
standard curve samples, whereas the blue dots and green dots present the samples.

69
Appendix 4. Statistics All statistical calculations are done in Excel
Table 5.1: Paired t-test performed on VDR expression before (0 hours) and after (40 hours) anti-
CD3/CD28 antibodies stimulation. H0= µdiff = 0. The p-value is much lower than 0.05, hence the
expression of VDR before is significantly lower than VDR expression after stimulation.
Non-stimulated
(0 hours)
Stimulated
(40 hours)
Mean 1 6,930505532
Variance 0 1,956213624
Observations 4 4
Hypothesizes difference
between means 0
Degrees of freedom 3
t-Stat -8,48034599
P(T<=t) two sided 0,003442757
T-critical, two sided 3,182446305
Table 5.2 Paired t-test performed on VDR expression before (0 hours) and after (17 hours) anti-
CD3/CD28 antibodies stimulation. H0= µdiff = 0. The p-value is a bit lower than 0.05, hence the
expression of VDR before is significantly lower than VDR express after stimulation.
Non-stimulated
(0 hours)
Stimulated
(17 hours)
Mean 1 4,918467705
Variance 0 5,703996724
Observasions 4 4
Hypothesizes difference
between means
0
Degrees of freedom 3
t-Stat -3,281380808
P(T<=t) two sided 0,04637762
T-kritisk, two sided 3,182446305

70
Table 5.3 Paired t-test performed on VDR expression after (17 and 40 hours) anti-CD3/CD28
antibodies stimulation. H0= µdiff = 0. The p-value is much higher than 0.05, suggesting that there is no
significant difference of VDR expression after 17 and 40 hours of stimulation.
Stimulated
(17 hours)
Stimulated
(40 hours)
Mean 4,918467705 6,930505532
Variance 5,703996724 1,956213624
Observasions 4 4
Hypothesizes difference
between means
0
Degrees of freedom 5
t-Stat -1,453937672
P(T<=t) two sided 0,205707744
T-kritisk, two sided 2,570581836
Table 5.4: Paired t-test performed on TAGAP expression before and after vitamin D treatment. H0=
µdiff = 0. The p-value is lower than 0.05, hence the presence of TAGAP before vitamin D is significantly
higher than after vitamin D treatment.
Before vitamin D
treatment
After vitamin D
treatment
Mean 1 0,53338179
Variance 0 0,016808368
Observations 3 3
Hypothesizes difference
between means 0
Degrees of freedom 2
t-Stat 6,233895731
P(T<=t) two sided 0,024779964
T-critical, two sided 4,30265273

71
Table 5.5: The cell viability after activating using plate coated antibodies and Dynabead covered
antibodies. H0= µdiff = 0. The p-value is higher than 0.05, suggesting that there is no significant
difference of cell viability among plate and Dynabead activated cells.
Plate bound
activation
Dynabead bound
activation
Mean 81,7 87
Variance 9,33 7
Observations 3 3
Hypothesizes difference
between means
0
Degrees of freedom 4
t-Stat -2,285714286
P(T<=t) two sided 0,084254022
T-critical, two sided 2,776445105

72
Appendix 5. Result
Figure 5.4: VDR expression is highest after 40 hours of stimulation. The line graph showing fold
change in VDR gene expression from four donors at the indicated time points. Values represents fold
change relative to nonactivated cells (time point 0).