MID-TERM EVALUATION OF THE COMMUNICATION FOR ...
86
April 2020 EVALUATION REPORT MID-TERM EVALUATION OF THE COMMUNICATION FOR HEALTH PROJECT IN ETHIOPIA
-
Upload
khangminh22 -
Category
Documents
-
view
2 -
download
0
Transcript of MID-TERM EVALUATION OF THE COMMUNICATION FOR ...

April 2020
EVALUATION REPORT
MID-TERM EVALUATION OF THE COMMUNICATION FOR HEALTH PROJECT IN ETHIOPIA

This publication was produced at the request of the United States Agency for International Development. It was prepared independently by Tewabe Yilak Assaye, Woldemariam Girma Gebreegiziabher, and Alehegn Moges Tessema for ICOS Consulting PLC.
April 2020
April 2020
EVALUATION REPORT
MID-TERM EVALUATION OF THE COMMUNICATION FOR HEALTH PROJECT IN ETHIOPIA

April 2020
EVALUATION REPORT
MID-TERM EVALUATION OF THE COMMUNICATION FOR HEALTH PROJECT IN ETHIOPIA


i
Abstract
The United States Agency for International Development in Ethiopia developed Communication for Health, a 5-year (2015–2020), 22.2 million USD budget project, which was implemented by Johns Hopkins Center for Communication Programs in partnership with the Federal Ministry of Health and John Snow, Inc. In 2019, ICOS Consulting PLC conducted the mid-term evaluation of the project, which included a desk review of project documentation, a survey of 1,773 women aged 15–49, and 40 key informant interviews. Overall, about 63% of the midline respondents reported being exposed to the project intervention, among whom 25% were exposed to three or more project activities. Results show some significant improvements between baseline and midline across the six health topics, specifically for early initiation of antenatal care; knowledge of short-acting, modern methods of family planning; rates of institutional delivery; receiving timely postnatal care; HIV testing during pregnancy and knowledge about prevention of mother-to-child transmission; knowledge on the causes, signs, and symptoms of malaria; self-efficacy with regard to malaria prevention; use of bed nets reported by women aged 15–49; presence of proper handwashing facilities; comprehensive knowledge about handwashing at key times; and knowledge about tuberculosis transmission. Respondents at midline reported significantly more equitable gender norms associated with partner violence, sexual relationships, domestic chores, and daily life. Despite these improvements, some key indicators appeared to have declined over time, particularly current use of modern family planning and exclusive breastfeeding. There were also significant declines in malaria-related indicators and fewer midline respondents reporting availability of bed nets.


iii
Acronyms and Abbreviations
ANC Antenatal Care
AOR Adjusted Odds Ratio
CCP Johns Hopkins University Center for Communication Programs
CI Confidence Interval
EA Enumeration Area
EDHS Ethiopia Demographic Health Survey
FMOH Ethiopia Federal Ministry of Health
GEM Gender Equitable Men
HDA Health Development Army
HEW Health Extension Worker
HIV Human Immunodeficiency Virus
AIDS Acquired Immune Deficiency Syndrome
IUD Intrauterine Contraceptive Device
LLIN Long-Lasting Insecticidal Net
MIS Management Information System
N Number of Respondents
PHCU Primary Health Care Unit
PMTCT Prevention of Mother-to-Child Transmission
PNC Postnatal Care
RHB Regional Health Bureau
RMNCH Reproductive, Maternal, Neonatal, and Child Health
SBCC Social and Behavior Change Communication
SNNPR Southern Nations, Nationalities, and People’s Region
SOW Statement of Work
TB Tuberculosis
TWG Technical Working Group
UNICEF United Nations Children’s Fund
USAID United States Agency for International Development
WASH Water, Sanitation, and Hygiene

Contents
Abstract ........................................................................................................................................................................................................................................................................................................................................................i
Executive Summary ..........................................................................................................................................................................................................................................................................................................vi
Introduction..........................................................................................................................................................................................................................................................................................................................................1
1.1. Background ..................................................................................................................................................................................................................................................................................................................................1
1.2. Objectives of the Mid-Term Evaluation ............................................................................................................................................................................................................................................2
Evaluation Design and Methodology ...........................................................................................................................................................................................................................................4
2.1. Methodology .................................................................................................................................................................................................................................................................................................................................5
2.2. Study Limitations ................................................................................................................................................................................................................................................................................................................8
Results 9
3.1. Demographic Characteristics of Respondents .....................................................................................................................................................................................................................10
3.2. Exposure to Social and Behavior Change Communication Intervention ..................................................................................................................................10
3.3. Effectiveness ...............................................................................................................................................................................................................................................................................................................................11
3.4. Effectiveness of the Communication for Health project (Qualitative assessment) ..............................................................................................31
3.5. Relevance ..........................................................................................................................................................................................................................................................................................................................................33
3.6. Sustainability .............................................................................................................................................................................................................................................................................................................................34
3.7. Strengths, Facilitating Factors, Weaknesses, and Challenges of the Communication for Health Project ......................38
3.8. Innovative Practices and Lessons Learned ...............................................................................................................................................................................................................................40
Recommendations ..................................................................................................................................................................................................................................................................................................................41
Appendix ......................................................................................................................................................................................................................................................................................................................................................44

List of Tables
Table 1: Sample size for baseline and midline surveys .........................................................................................................................................................................6
Table 2: Percentage of respondents’ exposure to social and behavior change communication (SBCC) message, Communication for Health midline survey (April 2019) .........................................11
Table 3: Percentage of antenatal care uptake, knowledge, self-efficacy, and outcome expectancy on antenatal care among women with children under 2 years old, Communication for Health baseline (September 2016) and midline (April 2019) surveys............................................12
Table 4: Logistic regression result on antenatal care uptake, Communication for Health midline survey (April 2019), computed from 481 midline women who had a child under 2 years of age .........................14
Table 5: Percentage family planning indicators among married women aged 15–49 years, Communication for Health baseline (September 2016) and midline (April 2019) surveys, disaggregated by exposure ........15
Table 6: Percentage of institutional delivery, postnatal care, and knowledge of danger signs of pregnancy among women with children under 2 years old, Communication for Health baseline (September 2016) and midline (April 2019) surveys .............................................................................................................................17
Table 7: Logistic regression results for institutional delivery, Communication for Health baseline (September 2016) and midline (April 2019) surveys .......................................................................................................18
Table 8: Percentage prevention of mother-to-child transmission, HIV counseling and testing, Communication for Health baseline (September 2016) and midline (April 2019) surveys............................................19
Table 9: Result from logistic regression on HIV/AIDS test during recent pregnancy, Communication for Health baseline (September 2016) and midline (April 2019) surveys............................................20
Table 10: Percentage level of early initiation of breastfeeding and exclusive breastfeeding among mothers of children under 23 months old, Communication for Health baseline (September 2016) and midline (April 2019) surveys ........................................................................................................................................................21
Table 11: Result from logistic regression on early initiation of breastfeeding, Communication for Health midline survey (April 2019) ...............................................................................................................................................................................................22
Table 12: Percentage of respondents, by malaria status .......................................................................................................................................................................22
Table 13: Percentage availability and use of bed nets in households in malaria-prone areas .............................................................23
Table 14: Knowledge on malaria among respondents living in malaria-prone areas .......................................................................................25
Table 15: Self-efficacy and outcome expectancy on malaria in malaria-prone areas ......................................................................................25
Table 16: Practice, knowledge, self-efficacy, and outcome expectancy on handwashing ...........................................................................26
Table 17: Results of logistic regression on availability of proper handwashing stations, Communication for Health midline survey, April 2019 (computed from 1,773 midline women)..............................28
Table 18: Tuberculosis (TB) knowledge, self-efficacy, and outcome expectancy among all women aged 15–49 years, Communication for Health baseline (September 2016) and midline (April 2019) surveys................................................................................................................................................................................................................29
Table 19: Gender Equitable Men (GEM) scale, adapted for women aged 15–49 years, Communication for Health project baseline (September 2016) and midline (April 2019) surveys ....................31
List of Figure
Figure 1: Percentage of fever and treatment seeking for children under age 5 in malaria-prone areas ..............................24

Executive Summary

MID-TERM EVALUATION OF THE COMMUNICATION FOR HEALTH PROJECT IN ETHIOPIA
vii
BACKGROUND
Ethiopia is a country in Sub-Saharan Africa with a population of 105 million (World Bank, 2017). Despite economic growth and advancement in health policy, much work remains to be done to address gender inequalities, maternal health, and child health in Ethiopia. Communication for Health is a 5-year (2015–2020) social and behavior change communication (SBCC) project in Ethiopia that is funded by the United States Agency for International Development and managed by Johns Hopkins Center for Communication Programs in partnership with the Federal Ministry of Health and John Snow Inc. It focuses on six interconnected health areas: reproductive, maternal, neonatal, and child health; nutrition; malaria; prevention of mother-to-child transmission of HIV; tuberculosis (TB); and water, sanitation, and hygiene. Communication for Health utilizes an evidence-based approach to address these six health areas in 160 districts in four regions: Oromia; Amhara; Southern Nations, Nationalities, and People’s Region; and Tigray. Communication for Health incorporates issues of gender equality while being culturally mindful. Communication for Health has accomplished a wide variety of goals, from setting up the structure to provide SBCC-centered services at local universities, organizations, and health clinics, to implementing numerous campaigns targeting the six health areas in local communities. The key SBCC pillars of Communication for Health include community-level interventions, such as (a) provision of the Family Health Guide to the target population to guide and promote health service use, (b) facilitation of community meetings to promote healthy behaviors, and (c) four media activities consisting of a radio program, maternal and child health video, mobile application, and distribution of print materials to promote healthy behavior. Other SBCC pillars include different level capacity-
strengthening interventions in SBCC and data use practices.
PURPOSE OF THE MIDLINE EVALUATION
The Communication for Health intervention is currently in its fourth year, thus requiring a mid-term evaluation of the project. The evaluation aimed at reviewing the relevance and effectiveness of Communication for Health to inform programmatic goals for the project and to redesign strategies for the remainder of the project. This report summarizes the results from the mid-term evaluation of the intervention conducted by ICOS Consulting PLC from March to July 2019.
EVALUATION QUESTIONS
The key research questions that the mid-term evaluation was designed to answer were as follows:
1. To what extent does the project’s hypothesis describe the necessary and sufficient conditions to progress toward its ultimate goal?
2. How relevant and practical are the design and implementation approaches of Communication for Health in relation to the Government of Ethiopia’s Health Sector Transformation Plan priorities?
3. What are the early indications of the project’s effectiveness?
4. What approaches is the project using to address gender issues in Communication for Health, and what evidence shows how the project accounts for gender considerations during implementation?
5. What are the key project implementation challenges and lessons learned?

EVALUATION REPORT
viii
EVALUATION METHODOLOGY
The evaluation used a mixed (quantitative and qualitative) method to examine changes in key outcome indicators between the baseline and midline. It was also designed to assess the possible effect of project exposure on various outcome indicators. The quantitative study included women aged 15 to 49 years who were the primary beneficiaries of the Communication for Health project. The quantitative study used systematic, multistage random sampling. The baseline sample included 2,770 women from six woredas per region, and the midline sample included 1,773 women from four woredas per region. The qualitative component included 40 key informant interviews with representatives from the implementing partners, as well as government staff at national, regional, and local levels. The study received ethical approval from the Ethiopian Public Health Institute ethical review committee, Addis Ababa, Ethiopia, and from the ethical review board of the Bloomberg School of Public Health at Johns Hopkins University, Baltimore, MD, USA.
FINDINGS
Comparisons of the baseline and midline data indicate that the samples are comparable across a host of key sociodemographic and socioeconomic variables. Overall, 63% of midline respondents reported being exposed to the Communication for Health intervention activities. Among these, 25% reported having been exposed to three or more of the five different activities.
Results show some significant improvements between baseline and midline across the six health topics, specifically early initiation of antenatal care; knowledge of short-acting modern methods of family planning; rates of institutional delivery; receiving timely postnatal care; HIV testing during pregnancy; knowledge about prevention of mother-to-child HIV transmission; knowledge about the causes,
signs, and symptoms of malaria; self-efficacy on malaria prevention; use of bed nets; presence of proper handwashing facilities; comprehensive knowledge about handwashing at key times; and knowledge about TB transmission. A key underlying principle of Communication for Health is its focus on gender sensitivity. Baseline data that fed into the design of Communication for Health indicated that gender-equitable norms were the key determinants for 10 of 16 key behaviors promoted by Communication for Health. Based on this information, the project focused on a gender-centric approach in the messages and within all capacity-building efforts. This focus on gender appears to have been successful, as evident in the significant improvements across three of the four subscales of the Gender Equitable Men scale, which was adapted for women. Respondents at midline reported significantly more equitable gender norms associated with partner violence, sexual relationships, domestic chores, and daily life. The subscales relating to reproductive health and disease prevention norms also improved over time, though these increases were not significant.
Despite these improvements, some key indicators appear to have declined over time. Of specific note were lower current use of modern family planning (baseline 48%, midline 43%) and exclusive breastfeeding (baseline 64%, midline 46%). Surprisingly, significant declines occurred in malaria-related indicators, with fewer midline respondents reporting availability of bed nets, actually showing bed nets to data collectors, and reporting that all children under 5 slept under a bed net (baseline 67%, midline 59%). On TB indicators, there were significant increases in knowledge of TB transmission and symptoms, but the overall awareness of TB as an illness was lower among midline respondents (baseline 78%, midline 67%).
Additionally, marginal differences in self-efficacy and outcome expectations were found for almost all key behaviors. These marginal

MID-TERM EVALUATION OF THE COMMUNICATION FOR HEALTH PROJECT IN ETHIOPIA
ix
differences may result from ceiling effects, as both efficacy and ability to achieve expected outcomes were very high at baseline across the health topics. The only significant efficacy finding related to higher self-efficacy at midline was for women’s perceived ability to seek treatment for a child with fever. However, women displayed significantly lower self-efficacy with regard to “immediate” screening for suspected TB (from 76.7% to 70.8%) and lower expectations that early screening of TB could lead to full recovery (75.3% to 61.8%).
When disaggregated by exposure to the Communication for Health project, the midline results indicated that, despite not finding significant differences between exposed and nonexposed respondents on levels of self-efficacy, and outcome expectancies, almost all behaviors (antenatal care, current use of family planning, institutional delivery, attending postnatal care, HIV testing during pregnancy, early initiation of breastfeeding, and bed net ownership) were reported in significantly higher proportions among exposed respondents compared to the women who were not exposed to the project.
Results from the multivariate logistic regression analysis examining differences between exposed and nonexposed respondents at midline (after controlling for key background factors including age, education, prior knowledge, level of vulnerability, and scores pertaining to gender equitable norms) pointed to significantly higher odds of different behaviors among those exposed, with higher levels of education and lower levels of vulnerability emerging as factors influencing positive behaviors. Exposure to project interventions significantly increased the likelihood of a woman attending four or more antenatal care visits, testing for HIV during pregnancy, delivering at a health facility, attending postnatal care services and having a handwashing station available in their households.
Data from the key informant interviews showed widespread acknowledgment of the relevance of Communication for Health, indicating the approaches utilized by the project were technology driven and evidence-based and that the design process was participatory. Some key informants questioned the relevance of some of the technology-driven materials, such as the mobile app, because the primary beneficiaries are rural women. Views on the level of participation by local stakeholders were mixed, with most key informants reporting that local-level engagement was the key to the successes of Communication for Health. A few urged for even higher levels of engagement. Similarly, views on the potential for sustainability were mixed, with questions raised about the technical and financial resources available within the local infrastructure to sustain the intervention over time.
CONCLUSIONS
The results indicate that Communication for Health was successful in initiating changes in multiple interrelated health behaviors. These findings support the importance of integrated SBCC programming that addresses a variety of issues associated with the health of women and children, rather than working in silos to address specific health promotion and disease prevention topics. Additionally, Communication for Health supported institutionalization of capacity building and system strengthening at all levels by creating mechanisms that provide sustained access to opportunities and by documenting and disseminating project activities and lessons, among other efforts. The trends indicated room for improvement, vis-à-vis engendering local ownership and wider and more innovative dissemination of messages. Overall, the Communication for Health project is moving in the right direction.

EVALUATION REPORT
x
Introduction
MID-TERM EVALUATION OF THE COMMUNICATION FOR HEALTH PROJECT IN ETHIOPIA
1
1.1. Background
Ethiopia is a country in Sub-Saharan Africa with
a population of 105 million (World Bank, 2017).
Despite economic growth and advancement in
health policy, much work remains to be done
to address gender inequalities, maternal and
child health in Ethiopia. In the realm of maternal
health, only 32% of women go for antenatal
care visits, 28% of women undergo institutional
delivery, and 36% use modern contraceptives
(Central Statistical Agency and ICF, 2016).
Disparities exist between urban and rural
populations, with rural women utilizing maternal
health care services less than urban women
(Central Statistical Agency and ICF, 2016). For
women in Ethiopia, many health practices are
influenced by gender and cultural norms. Women
generally lack empowerment for independent
decision making in their families, such as
using family planning or whether to undergo
institutional delivery (Johns Hopkins Center for
Communication Programs [CCP], 2017). On child
health, an estimated 40% of children in Ethiopia
suffer from nutritional deficiencies during the
first critical 1,000 days of life, putting them at
risk of stunting (UNICEF, 2014). Almost 50% of
the deaths of children under 5 in the country
are caused by malnutrition (UNICEF, 2019).
Prevention of infectious diseases needs to be
addressed in Ethiopia as well. Ethiopia is one
of the 18 countries that contribute to 80% of
malaria cases and deaths globally, and a pattern
of seasonal local epidemics is present in areas
under 2,000 m in altitude (Ethiopian Public
Health Institute and Ethiopia Federal Ministry of
Health, 2016; World Health Organization, 2018).
According to the 2015 Ethiopia National Malaria
Indicator Survey, 64% of households in malaria-
prone areas owned at least one long-lasting
insecticidal net (LLIN), 32% had one LLIN per
two people, and 44% of pregnant women and
45% of children under 5 years of age slept under
an LLIN the night before the survey (Ethiopian
Public Health Institute and Ethiopia Federal
Ministry of Health, 2015). Malaria is one of the
top 10 causes of death among children less
than 5 years of age (World Health Organization,
2019).
Ethiopia also has the 10th highest tuberculosis
(TB) burden in the world, including drug-
susceptible TB, multidrug-resistant TB, and TB-
HIV co-infection (US Agency for International
Development, 2018). Countrywide surveys
between 2003 and 2006 showed that the
prevalence of multidrug-resistant TB was 1.6%
in new cases and 11.8% in previously treated
patients and that 25% of TB cases were
positive for co-infection with HIV (World Health
Organization Africa, 2018). While Ethiopia
showed a rapid decline in new HIV infections
among children, prevention of mother-to-child
transmission (PMTCT) continues to be an area
of concern, as the HIV epidemic is becoming
more generalized and the rate of comprehensive
knowledge, which is 31% among men and 18.5%
among women, is low (Central Statistical Agency
and ICF, 2012). Fear of stigma and abandonment
by husbands is high among women, and only
55% of HIV-positive pregnant women receive
PMTCT services (Central Statistical Agency and
ICF, 2012).
The water, sanitation, and hygiene situation
in Ethiopia is also very poor, with only 28%
of the population having access to improved
sanitation facilities, 29% of the population
practicing open defecation, and 57% of the
population having access to an improved water
supply (UNICEF and World Health Organization,
2015). While the prevalence of diarrhea
decreased for children under 5 years old from
2000 to 2011, handwashing is still not a norm,
with only about 12% of urban households
and 2% of rural households having access to
handwashing facilities (Addis Ababa University
School of Public Health and the Bill & Melinda

EVALUATION REPORT
2
Gates Institute for Population and Reproductive
Health at the Johns Hopkins Bloomberg School
of Public Health, 2014).
All of these health disparities require improving
the health status of the Ethiopian population
by providing accessible and high-quality
health services and by changing social norms,
individual behavior, and community practices
(CCP, 2017). An integrated social and behavior
change communication (SBCC) intervention to
inform, influence, and empower individuals and
communities to adopt evidence-based practices
to improve health was considered to be most
useful (CCP, 2017). The government of Ethiopia
places a high priority on SBCC interventions and
has already created a growing Health Extension
Program, which eventually led to the creation
of Communication for Health so that the United
States Agency for International Development
(USAID) and CCP can assist the Ethiopian
government in achieving its health goals (CCP,
2015).
It was against this background that USAID/
Ethiopia developed Communication for Health.
The Communication for Health project is a
5-year (2015–2020) SBCC project in Ethiopia
that is funded by the USAID and managed
by CCP in partnership with John Snow Inc.
(Communication for Health Project, 2016). It
focuses on six interconnected health areas:
reproductive, maternal, neonatal, and child
health; nutrition; malaria; PMTCT; TB; and
water, sanitation, and hygiene. The project
is being implemented in 160 districts in four
regions: Oromia; Amhara; Southern Nations,
Nationalities, and People’s Region; and Tigray.
Communication for Health has been implemented
for three full years now and is in its fourth year,
which necessitated a mid-term evaluation of the
project. CCP commissioned ICOS Consulting PLC
to undertake this evaluation of Communication
for Health from March to July 2019. This report
presents the findings.
1.2. Objectives of the Mid-Term Evaluation
The overall objective of this mid-term
evaluation was to assess the project’s progress
towards its goal and objectives in line with the
baseline measures of health indicators related
to health care system utilization, care-seeking,
knowledge, and other behavioral outcomes in
the six previously mentioned health areas. The
evaluation had the following specific objectives:
• To assess the extent to which the project’s
hypothesis describes the necessary and
sufficient conditions to progress toward
its ultimate goal. This objective refers to
the logical linkage between the different
results; whether sub results are necessary
for and sufficient to achieve higher results;
whether appropriate performance measures
(indicators) were identified and tracked;
and whether risks, assumptions, or external
factors were identified, monitored, and
adjusted as needed
• To assess the relevance of the design
and implementation approaches of the
Communication for Health project in relation
to the Government of Ethiopia’s Health
Sector Transformation Plan priorities, its
national communication strategy, and the
sustainability of project interventions
• To assess early indications of the project’s
effectiveness (i.e., tangible results achieved
against targets)
• To explore the project’s approaches to address
gender issues in Communication for Health
and whether the project accounts for gender
considerations during implementation
• To identify the key implementation
challenges and lessons learned

MID-TERM EVALUATION OF THE COMMUNICATION FOR HEALTH PROJECT IN ETHIOPIA
3
1.2.1. Evaluation questions
The mid-term evaluation was designed to answer
the following five key evaluation questions:
• To what extent does the project’s hypothesis
describe the necessary and sufficient
conditions to progress toward its ultimate
goal?
• How relevant and practical are the design
and implementation approaches of the
Communication for Health project in relation
to the Government of Ethiopia’s Health
Sector Transformation Plan priorities?
• What are the early indications of the project’s
effectiveness?
• What approaches is the project using to
address gender issues in Communication for
Health, and what evidence shows whether the
project accounts for gender considerations
during implementation?
• What are the key project implementation
challenges and lessons learned?

EVALUATION REPORT
4
Evaluation Design and Methodology

MID-TERM EVALUATION OF THE COMMUNICATION FOR HEALTH PROJECT IN ETHIOPIA
5
2.1. Methodology
The study used a mixed (quantitative and qualitative) method to examine changes in key outcome indicators between the baseline and midline. The quantitative survey was designed to assess the possible effect of project exposure on its various outcome indicators to answer the evaluation questions.
The qualitative tools were designed to provide insight into the project’s relevance, effectiveness, and sustainability from the perspectives of its stakeholders (local implementing partners, health facilities at the community level, woreda health bureaus, regional health bureaus, and the Federal Ministry of Health) and implementers (regional project managers and national project leaders), among others.
2.1.1. Study design
Pre- and post-intervention designs were used for the quantitative component of the evaluation. Neither the baseline nor the midline survey included a control group in non–program intervention areas. Thus, the study employed internal controls specifically for those individuals who were not exposed to any project activities, despite living in the same community with those exposed to specific activities. The study compared key project indicators, including family planning, antenatal care use, institutional delivery, postnatal care, early initiation of breastfeeding, bed net use, treatment seeking for fever, tuberculosis knowledge, gender issues, and others, at baseline and midline. The midline results then were further disaggregated between those exposed and not exposed to Communication for Health activities.
2.1.2. Study population and sampling procedure for household survey
The study population for the evaluation was women aged 15 to 49 years who were the primary beneficiaries of the project. The midline survey adopted the same sampling approach as the baseline. The study used multistage random sampling to identify the study population. The selection procedure was as follows:
1. Ten percent of the project’s target woredas (24 of 240 at baseline; 16 of 160 at midline) were selected, with an equal number of woredas from each of the four regions (Oromia; Amhara; Southern Nations, Nationalities, and People’s Region; and Tigray). At baseline, six woredas from each region were selected using probability proportional to size of population in the woredas. For comparability, at midline, four woredas from the six woredas where the baseline survey was conducted were randomly selected from each region.
2. An enumeration area (EA) list for the selected woredas was collected from the Central Statistical Agency. Three EAs were selected from each of the selected woredas using random sampling (72 at baseline and 48 at midline) and included for the study.
3. Complete household listings from all 72 EAs at baseline and 48 EAs at midline were conducted to establish a fresh sampling frame of households in each EA.
4. From these complete household listings, only households with women aged 15–49 were maintained, and 35 households were selected from each EA using systematic random sampling techniques. All eligible women in sampled households who were present during the survey were interviewed.

EVALUATION REPORT
6
2.1.3. Sample size
The sample size for the study population at midline was set at 35 households per EA,
the same as at baseline. Table 1 presents the sample size allocation by region.
Table 1: Sample size for baseline and midline surveys
Region
No. of Enumeration Areas Covered at Baseline No. of Households Selected
No. of Women Interviewed
Baseline Midline Baseline Midline Baseline Midline
Amhara 18 12 630 420 674 416
Oromia 18 12 630 420 688 448
SNNPR 18 12 630 420 760 448
Tigray 18 12 630 420 648 461
Total 72 48 2,520 1,680 2,770 1,773
Notes: SNNPR: Southern Nations, Nationalities, and People’s Region; 35 households from each enumeration area were selected at baseline and midline.
2.1.4. Data-gathering tools
Data were largely gathered using a quantitative questionnaire. However, the survey data were supported by collection of qualitative data from key informants at different administrative levels.
2.1.4.1 Questionnaire
To maintain comparability, the midline quantitative questionnaire was developed from the baseline questionnaire to include questions about program exposure. The midline questionnaire aimed to collect information on common themes, including sociodemographic; family planning; reproductive health; maternal and child health; child feeding; malaria; water sanitation and hygiene; tuberculosis; prevention of maternal-to-child HIV transmission; and gender issues.
The questionnaires were largely precoded with fixed-response categories and administered in the Amharic, Oromiffa, and Tigrigna languages. As previously noted, the midline questionnaire added a section on exposure to Communication for Health by
asking individuals about their participation in project activities, specifically their exposure to community-level interventions, such as exposure to the Family Health Guide; community meetings: health bazaars, roadshows, and media activities consisting of a radio program (e.g., Erkab in Amharic, Terkanfi in Afan Oromo, Erhab in Tigrigna, Fashoo in Sidama Afu, and Ilka in Wolitigna), maternal and child health video, mobile application (Hulu Beteina), and distribution of print materials to promote healthy behavior.
2.1.4.2 Interviews and qualitative
methods
Qualitative methods included key informant interviews with local implementing partners, primary health care units, the woreda health office, the regional health bureaus, and the program implementation office in each region. Further key informant interviews were conducted with focal persons from the Federal Ministry of Health, the John Snow Inc., and the Johns Hopkins Center for Communication Programs country office. Overall, 40 key informant interviews were

MID-TERM EVALUATION OF THE COMMUNICATION FOR HEALTH PROJECT IN ETHIOPIA
7
conducted. Informants were recruited in close consultation with the head office of the Johns Hopkins Center for Communication Programs research and monitoring and evaluation team.
2.1.5. Data management and analysis
2.1.5.1. Quantitative data
Quantitative data were collected using mobile phones with KOBO prorating language. The midline data were merged with (appended to) the baseline data set, and steps such as data verification and cleaning preceded data analysis. Data analysis for the quantitative data mainly focused on the key outcome indicators between the baseline and midline using descriptive statistics and multivariate methods. A comparison of key outcome indicators at baseline and midline was conducted to assess differences over time. Further, midline data were analyzed to identify any significant differences between exposed and nonexposed respondents. The exposure variable was derived by creating an additive measure asking respondents if they had received or used the Family Health Guide, participated in any community meeting on the six health areas covered by Communication for Health, been exposed to any media components consisting of a radio program, used the mobile application, or received or used printed project materials promoting healthy behaviors. The relationship of exposure to the project intervention (predictor) was examined against outcome variables using univariate and multivariate methods. Bivariate associations and correlations were tested for statistical significance. A multivariate logistic regression analysis was used to identify behaviors contributing to the outcome variables, after controlling for confounding factors. Statistical significance was considered at p-values <.05. The data analysis was performed using SPSS v. 20.
2.1.5.2. Qualitative data
All key informant interviews were facilitated in the Amharic language, recorded in hard copy (paper-based), and then translated into English. The interview results were coded into different issues based on the interview guide and subsequently recorded in Microsoft Excel software. Content analyses were performed in Excel, and the results were summarized. Triangulation of responses was done across the various respondents.
2.1.6. Profile of data collectors and supervisors
The data collectors had at least a bachelor’s degree in public health, nursing, or other related social science fields. Additionally, they had previous experience in similar data collection. Proficiency of data collectors in the local languages of the sample woredas was a selection criterion. Coordinators and supervisors had at least a master’s degree in health-related and other social science fields, language fluency, and experience in coordinating and supervising similar studies.
2.1.7. Training of data collectors and survey teams
Quantitative data collection training was held from March 13 to 15, 2019, in Addis Ababa. A separate training was organized for data collectors who facilitated the key informant interviews. The quantitative training was attended by 37 quantitative interviewers, 8 quantitative supervisors, and 12 qualitative interviewers, researchers, and coordinators. The training included different techniques, including presentation of key terms, standard operating procedures, item-by-item review of questionnaires, mock (pair) interviews, question-and-answer sessions, and feedback sessions. Four experienced trainers facilitated the trainings. The Johns Hopkins Center for Communication Programs team also played

EVALUATION REPORT
8
an important role in monitoring, as well as in providing technical inputs in the different sessions of the quantitative and qualitative training.
2.1.8. Pretesting
The pretest was conducted in one of the rural kebeles in the Barak district of the Oromia regional state, Finfine Special Zone, which is about 40 km from Addis Ababa. The pretest was conducted on April 2, 2019, after ethical clearance for the survey was secured from the institutional review boards. This pretesting was conducted in a kebele that was not sampled for the midline. Each team member interviewed at least one respondent, using mobile phones. Supervisors recorded and noted gaps in procedures and got a sense of how the tool is piloted in the field. Coordinators and the CCP research team supervised interviews and logistics and provided guidance and feedback at the field site. The day after pretesting, the team met at the ICOS office for a debriefing on issues related to recruiting and selecting households for the survey, obtaining informed consent, and completing the survey instrument. The research team shared experiences and discussed the challenges they had faced during the pretest, allowing the CCP research team to provide guidance on how to handle these challenges.
2.1.9. Ethical aspects of the study
The study received ethical approval from the Ethiopian Public Health Institute ethical review committee, Addis Ababa, Ethiopia, and the ethical review board of the Bloomberg School of Public Health, Johns Hopkins University, Baltimore, MD, USA.
2.2. Study Limitations
The key limitation of the midline study comes from its design. As there were no control groups, the findings presented in this report cannot be attributed directly and specifically to the project, because the baseline–midline comparison of outcome indicators could have been influenced by different confounders, although main confounding factors were controlled for during analysis. Some figures reported in the baseline survey report differ from the ones computed as part of this midline study because of the change in the weighting variable resulting from changes in the number of study woredas at baseline and midline. The evaluation team presented baseline values based on the values computed from the merged baseline dataset rather than on figures reported in the baseline survey report.

MID-TERM EVALUATION OF THE COMMUNICATION FOR HEALTH PROJECT IN ETHIOPIA
9

EVALUATION REPORT
10
Results

MID-TERM EVALUATION OF THE COMMUNICATION FOR HEALTH PROJECT IN ETHIOPIA
11
This section presents the findings of the midline study. The findings are presented under each of the key evaluation criteria of effectiveness, relevance, efficiency, and sustainability. The section starts with a brief description of the socioeconomic characteristics of survey respondents.
3.1. Demographic Characteristics of Respondents
As shown in the table presented under Annex 3, comparisons of the baseline and midline data indicate that the samples were comparable across a host of key sociodemographic and socioeconomic variables. The target population for this study included women of reproductive age (15–49 years). Most (64%) women who participated in the survey were younger than 35, and the rest were 35–49. Respondents’ age distribution between the baseline and midline was almost identical. Forty-five percent of women had a child under 5 years old (25% with a child under 2 years and 20% with a child between 3 and 5 years). Fewer than 10% of respondents were pregnant at the time of survey, which was also the case at baseline. Most (62%) had no formal education (baseline 57.9% and midline 62.3%). The remaining 38% had at least some primary education (baseline 42.1% and midline 37.7%). Most (79%) were married or cohabitating, whereas 20% were either divorced, widowed, or single. Over 46% of respondents fell in the low-income category (less than Birr 500 or less than 20 USD per month), whereas 28% and 26% belonged to middle- and high-income categories, respectively. A similar pattern was found in standards of living of respondents, with close to 46% reporting a low standard of living.
1 Exposure was computed by considering those that have heard or used the Family Health Guide, had exposure to radio program, participated in community meetings, or was exposed to the mobile application or video or print materials.
To better assess the respondents’ socioeconomic status, the study also explored their vulnerability levels based on four areas: food security, shelter, education, and access to health services. The women were asked to report their experiences in these areas in the past 12 months, and a vulnerability index was created. The proportion of respondents in the “highly vulnerable” category declined from 22% at baseline to 19% at midline, and the difference was statistically significant. There were significant differences by region, as was the case at baseline. A greater proportion of respondents (29%) from Southern Nations, Nationalities, and People’s Region (SNNPR) reported higher vulnerability than those in the three other regions. A sharp decline in highly vulnerable women was observed in Tigray, from 25% at baseline to less than 7% at midline (see Annex 3).
3.2. Exposure to Social and Behavior Change Communication Intervention
The main communication activities of the Communication for Health project are (1) provision of the Family Health Guide to the primary population to guide and promote health service use, (2) facilitation of community meetings to promote healthy behaviors, and (3) dissemination of different types of media components consisting of a radio program, maternal and child health video, a mobile application, and print materials that promote healthy behavior.
As shown in Table 2, 63% of respondents reported being exposed to one or more project activities.1 Among exposed respondents, 39.6% reported being exposed to three or

EVALUATION REPORT
12
more project activities. Among all study participants, 25% reported having been exposed to three or more Communication for Health activities, 38.4% to one or two, and 36.6% were not exposed to any Communication for Health activities. For the
2 Additional details on the computation of exposure is presented in Annex 2.
purposes of this report, a study participant is defined as exposed if she had received, participated in, or engaged with at least one project activity, and respondents who were not aware of any project activities were defined as nonexposed.2
Table 2: Percentage of respondents’ exposure to social and behavior change communication (SBCC) message, Communication for Health midline survey (April 2019)
CharacteristicsSample (N=1,773)
No. of SBCC program messages received
0 36.6
1–2 38.4
≥3 25.0
Exposure to the program (operational definition)
Nonexposed: Respondents who were not exposed to any SBCC program intervention 36.6
Exposed: Respondents who received at least one SBCC program intervention 63.4
3.3. Effectiveness
A critical evaluation question for Communication for Health relates to early indications of its effectiveness. Effectiveness was measured by comparing baseline and midline results. The evaluation team examined change over time in the target set for the Communication for Health project performance indicators. Though not found in the project document or agreements signed by the United States Agency for International Development and Johns Hopkins Center for Communication Programs (CCP), an aid tracker Excel file provided by CCP shows that the project aimed to increase overall appropriate health behaviors in targeted districts on malaria; reproductive, maternal,
neonatal, and child health; family planning; tuberculosis; water, sanitation, and hygiene; prevention of mother-to-child transmission (PMTCT), and nutrition by 15% from the baseline level by 2019–2020. Being a midline, the targets used to measure progress and achievement rates are half of the 5-year targets (7.5%) on each indicator (though the midline survey was conducted towards the end of the third year of the project). The findings are presented below under each intervention area. Annex 1 presents a summary project report card.

MID-TERM EVALUATION OF THE COMMUNICATION FOR HEALTH PROJECT IN ETHIOPIA
13
3.1.1. Mothers’ and children’s health
3.3.1.1. Antenatal care
Women in the overall sample who had a child less than 2 years of age (baseline N=745, midline N=481) were asked questions
about their antenatal care (ANC). Table 3 summarizes the results on ANC knowledge and uptake.
Table 3: Percentage of antenatal care uptake, knowledge, self-efficacy, and outcome expectancy on antenatal care among women with children under 2 years old, Communication for Health baseline (September 2016) and midline (April 2019) surveys
Indicator
Baseline Midline Exposed Nonexposed
N=745 N=481 N=312 N=169
No. of antenatal care visits None 25.3 28.3 19.7*** 40.9
1–3 32.2 30.2 32.3*** 27.2
≥ 4 42.5 41.5 48.0*** 31.9
Early initiation for antenatal care ≤ 12 weeks 29.7 34.2*** 38.0*** 28.5
Knowledge on the right number of antenatal care visits that a pregnant woman should have (Knowledge) ≥ 4 71.4 68.4 72.8** 61.9
Knowledge on the importance for pregnant women to have at least one antenatal care visit with a skilled provider (Knowledge)
Moderate/high 97.8 94.4* 95.9 92.3
Attending antenatal care at least four times during pregnancy beginning in the first trimester is possible (Self-efficacy)
Moderate/high 93.3 92.3 92.2 92.5
Pregnant women who have at least four antenatal care visits during pregnancy will have better birth outcomes (Outcome expectancy)
Moderate/high 97.6 95.1 97.4* 91.8
*p<0.05, **p<0.01, and ***p<0.001.
As shown in Table 3, about a quarter of the women at both baseline and midline reported that they had not received any ANC. At the overall level, the number of ANC visits a woman has attended did not vary between baseline and midline. However, women who were exposed to Communication for Health were more likely to have one or more ANC visits than those who were not exposed. In contrast, nonexposed women were more
likely not to receive any ANC than those who were exposed.
Knowledge about and actual practice of four or more ANC visits was significantly higher among exposed respondents than nonexposed respondents. For example, 73% of exposed respondents, compared with 62% of nonexposed respondents, correctly reported that the number of ANC visits a pregnant

EVALUATION REPORT
14
woman should have is four or more. Similarly, almost half of exposed women reported four and more ANC visits, compared with one-third of those who were nonexposed.
The proportion of respondents reporting early initiation of ANC increased significantly between baseline and midline (baseline 30%, midline 34%). At midline, 38% of exposed respondents and 29% of nonexposed respondents reported early initiation of ANC. These numbers show a significant improvement from the figure reported in the 2016 Ethiopia Demographic and Health Survey (EDHS)3 in which only 20% of women (17% for rural women) had their first ANC during the first trimester. There were significant regional variations in reporting of early initiation of ANC at midline. Early ANC initiation improved significantly in SNNPR and Amhara, whereas an insignificant decline was seen in Tigray and Oromia. Annex 4 presents the regionally disaggregated results.
ANC knowledge of women at midline showed no significant change from baseline levels. At midline, over two-thirds of women with children under 2 years old knew the right number of ANC visits. This percentage did not vary significantly between baseline and midline. Almost all respondents knew that pregnant women should have at least one ANC visit with a skilled provider, although this percentage declined significantly from 98% at baseline to 94% at midline (see Table 3).
The proportion of women who were confident (self-efficacy) about attending ANC at least four times during pregnancy beginning in the first trimester did not show any significant change from baseline, though there were regional variations. A statistically significant decline on self-efficacy, from 96.5% to 78.1%, was observed in Tigray. The expectation that pregnant women who had at least four ANC visits during pregnancy would have better birth outcomes did not change significantly between the baseline and midline. There were regional variations, with significant declines in Amhara but no other region regarding the relationship between ANC and positive birth outcomes (see Annex 4).
The results from the multivariate logistic regression show that exposed women were more likely to have four or more ANC visits than those who were not exposed to Communication for Health activities (adjusted odds ratio [AOR]=1.795, 95% confidence interval [CI]=1.149–2.804). As expected, knowledge on the correct number of ANC visits and educational qualification were significantly associated with women who had four or more ANC visits. (AOR=7.845 and 2.274, for knowledge on ANC and educational qualification, respectively). Table 4 shows the results.

MID-TERM EVALUATION OF THE COMMUNICATION FOR HEALTH PROJECT IN ETHIOPIA
15
Table 4: Logistic regression result on antenatal care uptake, Communication for Health midline survey (April 2019), computed from 481 midline women who had a child under 2 years of age
Indicator B Sig. AOR
95% CI for EXP(B)
Lower Upper
Age (15–24 is reference) 25–34 0.324 0.244 1.383 0.801 2.387
35–49 0.489 0.136 1.630 0.857 3.101
Education (Uneducated is reference) Educated 0.822 0.001 2.274 1.428 3.622
Knows the number of antenatal care visits a pregnant woman should have (<4 is reference) ≥ 4 2.060 0.000 7.845 3.791 16.235
Gender Equitable Men scale, partner violence index (Low is reference)
Moderate -0.403 0.089 0.669 0.420 1.063
High -0.185 0.696 0.831 0.328 2.104
Gender Equitable Men scale, sexual relationship index (Low is reference)
Moderate -0.483 0.111 0.617 0.340 1.118
High 0.149 0.680 1.160 0.573 2.349
Interpersonal communication on antenatal care Yes -0.448 0.089 0.639 0.382 1.070
Direct exposure, dichotomous (Nonexposed is reference) Exposed 0.585 0.010 1.795 1.149 2.804
Note: AOR=adjusted odds ratio; CI=confidence interval; EXP(B)= Exponentiation of the B coefficient.
The project targeted an overall 15% increase in adequate ANC during the Communication for Health project. At midline, the project aimed for a 7.5% increase in ANC behaviors. The results show that the project, on average, achieved more than 91% of its midline targets (see Annex 1).
3.3.1.2. Family planning
The survey questions around modern family planning methods focused on knowledge, reported confidence around using, ever use, current use, and beliefs about the benefits of using modern contraceptive methods. The results from these questions are presented in Table 5.

EVALUATION REPORT
16
Table 5: Percentage family planning indicators among married women aged 15–49 years, Communication for Health baseline (September 2016) and midline (April 2019) surveys, disaggregated by exposure
Family Planning Practice and Knowledge Baseline Midline Exposed Nonexposed
Ever use of modern family planning N=2,059 N=1,368 N=1,051 N=317
67.0 65.3 68.5*** 55.8
Current use of modern family planning N=1,830 N=1,223 N=935 N=288
47.5 42.6* 45.9*** 33.2
Knowledge on family planning N=2,770 N=1,773 N=1,343 N=430
Any family planning method 93.1 91.0*** 93.1*** 84.7
Type of family planning method known
Any modern method 75.7 73.5* 73.9*** 72.3
Any traditional method 17.4 17.5 19.1 12.3
Modern by period Any modern short-acting method 15.1 19.3*** 18.2*** 22.6
Any modern long-acting method 60.6 54.3 55.7 49.8
Family planning knowledge
1–3 methods 32.2 44.2 42.7 49.1
≥4 methods 56.9 46.8 50.4 35.6
Women who believe they are able to use modern contraceptive methods (Self-efficacy) Mod/High 83.9 87.1** 89.3*** 80.2
Women who believe their use of modern contraceptive methods improved quality of family life (Outcome expectancy) Mod/High 88.2 87.2 89.8*** 78.8
*p<0.05, **p<0.01, and ***p<0.001.
The results presented in Table 5 show that knowledge about modern contraceptive methods was very high, with over 9 of 10 women knew about modern methods. However, when the data were examined by specific methods, unexpectedly, knowledge of any modern or traditional method was significantly higher at baseline, compared to midline. Alternatively, knowledge of any short-acting method was higher at midline than at baseline. When analyzed by exposure, the midline data showed that exposed respondents were significantly more likely than their baseline counterparts to know about any method, as well as any modern method. Surprisingly, knowledge about any short-acting modern methods was significantly lower among exposed respondents than nonexposed ones.
Neither the baseline nor the midline findings were consistent with national figures. The 2016 EDHS, for example, reported that knowledge of contraceptive methods is universal in Ethiopia (99% of women in rural areas), compared to 93% and 91% at baseline and midline, respectively. Similarly, whereas about three-quarters of baseline and midline respondents knew any modern method, the 2016 EDHS reported that 98% of sexually active women knew any modern method. The same pattern was observed for knowledge of traditional family planning methods. The 2016 EDHS reported that over 34% of women knew any traditional method, compared to 17.5% at baseline and midline. The evaluation team cannot provide any credible justification to explain these differences.

MID-TERM EVALUATION OF THE COMMUNICATION FOR HEALTH PROJECT IN ETHIOPIA
17
A significant decline occurred over time in current modern family planning use, with 48% of women at baseline and 43% at midline reporting current use. This decline could be partly attributed to a decrease in the proportion of women that reported knowing about these methods. The proportion of women who knew about four or more contraceptive methods declined from 57% at baseline to 47% at midline. A significantly higher proportion of women felt confident that they would be able to use modern contraceptive methods (self-efficacy) at midline (87.1%), compared to the baseline (83.9%). However, no significant change was observed in expectations that using family planning would improve family life (see Table 5).
At midline, regional variations were observed in reported current use of modern contraceptives, which also was the case at baseline. At baseline, higher current use of modern family planning methods was reported in Amhara (59%) than in the other three regions. Tigray and SNNPR were in the 41%–55% range, and Oromia had the lowest use of modern contraceptives at 31%. Current use of modern family planning declined sharply in Amhara, from 59% at baseline to 44% at midline. A similar pattern was observed in SNNPR, where use of modern methods declined from 55% at baseline to 49% at midline. These baseline–midline differences were statistically significant. The evaluation
team was not able to explain possible reasons for these declines in the two regions. In contrast, current use of contraceptives increased in Oromia and Tigray between baseline and midline (see Annex 10).
When the project’s performance was evaluated against targets set for key family planning performance indicators, the results showed that the project’s achievement averaged about 88% of the midline target (see Annex 1).
3.3.1.3. Institutional delivery and
postnatal care
Maternal and neonatal mortality can be reduced by increasing institutional deliveries. Statistical data produced by the Ministry of Health and Central Statistical Agency showed that institutional delivery has been growing in Ethiopia over the past two decades. According to the 2016 EDHS report, 26% of live births in the 5 years before the survey took place in a health facility. In rural areas, institutional delivery reached 20% in 2016. In the 5 years before the 2016 EDHS, 28% of births were delivered by a skilled provider. The status of institutional delivery and postnatal care (PNC) among target beneficiaries in the intervention areas was assessed as part of the baseline and midline. Table 6 summarizes the results.

EVALUATION REPORT
18
Table 6: Percentage of institutional delivery, postnatal care, and knowledge of danger signs of pregnancy among women with children under 2 years old, Communication for Health baseline (September 2016) and midline (April 2019) surveys
Indicator
Baseline Midline Exposed Nonexposed
N=745 N=481 N=169 N=312
Institutional delivery 43.3 48.1*** 54.4*** 38.9
Health/vaccination card with date recorded 56.7 61.3 65.3*** 55.6
Time of first check after delivery for postnatal care
Within 2 days NA 35.3*** 39.9*** 28.5
Within 7 days 27.9 41.2*** 47.9*** 31.4
Knowledge on pregnancy danger signsa
Low 39.2 44.5 41.5* 48.9
Medium 45.0 39.0 42.4* 34.0
High 15.8 16.5 16.1 17.0
Deliveries attended by skilled health personnel 58.5 59.8 71.8*** 56.2
Notes: *p<0.05; ***p<0.001; NA: Postnatal care within 2 days was not measured at baseline. aKnowledge of pregnancy and delivery danger signs was categorized as low (knowing 0–1 danger signs), medium (knowing 2–3), or high (knowing ≥4).
The results in Table 6 show that institutional delivery increased significantly (43% at baseline to 48% at midline). As expected, women who were exposed to one or more Communication for Health activities were significantly more likely to deliver at a health facility than those who were not exposed. Both the baseline and midline figures on institutional delivery in project regions are much higher than the national figure of 26% (EDHS, 2016).
Regional variations were observed in institutional delivery. Institutional delivery increased in Tigray, SNNPR, and Amhara but declined in Oromia. Institutional delivery in Oromia was the lowest (20%), and Tigray had the highest (79%), followed by SNNPR (72%). The proportion of deliveries attended by skilled health personnel increased slightly at midline, suggesting that deliveries outside health facilities were more likely to be assisted by skilled health personnel at both baseline and midline (see Annex 6).
PNC within 7 days was measured at baseline and midline. The midline measurement also
included PNC in the first 2 days of delivery. The findings indicate a significant increase in first postnatal checks within 7 days from baseline (27.9%) to midline (41.2%). This increase is reasonable, as institutional delivery also increased since baseline and is assumed to increase the likelihood of adequate PNC. Stakeholders consulted for the midline also confirmed that there have been positive changes in institutional delivery and PNC. “There are visible changes in some program performances, such as institutional delivery and PNC after introducing maternity home videos (MHVs) in selected health facilities,” a woreda health office head said. The results may also show that the significant changes in institutional delivery and PNC since baseline might have been affected by factors other than ANC (see Table 6). For example, as shown in Table 7, early initiation of ANC rather than number of ANC visits is positively correlated with institutional delivery.
In aggregate among respondents at baseline and midline, no significant variation was observed on knowledge of pregnancy

MID-TERM EVALUATION OF THE COMMUNICATION FOR HEALTH PROJECT IN ETHIOPIA
19
danger signs.4 With regard to the regional disaggregated results, knowledge on pregnancy danger signs significantly improved in Tigray from 7.3% to 25.0, but significant changes were not observed in other regions (see Annex 6).
Multivariate analysis was conducted to examine the likelihood of behavioral outcomes after controlling for demographic factors (e.g., age, education), social factors (e.g., vulnerability, gender attitudes), interpersonal communication on delivery, and previous knowledge and behaviors related to the outcome of interest. The results on the
4 Women’s knowledge of pregnancy danger signs was calculated from the number of signs they mentioned from the list of pregnancy danger signs; those who knew at least three pregnancy danger signs were considered to have a minimum level of knowledge.
institutional delivery outcome, as presented in Table 7, show that exposed women had a higher probability of delivering in health facilities than those who were not exposed to Communication for Health intervention messages (AOR=1.746, 95% CI=1.096–2.781). Other factors that predicted institutional delivery included education (AOR=2.07) and early initiation of ANC (AOR=3.3). Being in the highly vulnerable group and displaying moderately negative attitudes on the gender inequality index on partner violence emerged as risk factors for institutional delivery.
Table 7: Logistic regression results for institutional delivery, Communication for Health baseline (September 2016) and midline (April 2019) surveys
Indicator B Sig. AOR
95% CI for EXP(B)
Lower Upper
Age (15–24 is reference) 25–34 0.076 0.802 1.078 0.597 1.947
35–49 0.641 0.071 1.899 0.946 3.814
Education (Uneducated is reference)
At least primary 1.012 0.000 2.750 1.678 4.507
Knowledge on pregnancy danger signs (No is reference) Yes -0.044 0.858 0.957 0.589 1.553
Vulnerability index by three categories (Not vulnerable is reference)
Vulnerable -0.180 0.486 0.836 0.504 1.385
Highly vulnerable -0.936 0.007 0.392 0.200 0.770
Early initiation for antenatal care (No is reference) Yes 1.195 0.000 3.303 2.014 5.417
Gender Equitable Men scale, partner violence index (Low is reference)
Moderate -0.874 0.000 0.417 0.257 0.678
High -0.876 0.089 0.416 0.151 1.144
Gender Equitable Men scale, sexual relationship index (Low is reference)
Moderate -0.909 0.009 0.403 0.203 0.799
High 0.013 0.975 1.013 0.452 2.270
Interpersonal communication on delivery with anyone (No is reference) Yes 0.241 0.394 1.273 0.731 2.217
Direct exposure, dichotomous (Nonexposed is reference) Exposed 0.557 0.019 1.746 1.096 2.781
Note: AOR=adjusted odds ratio; CI=confidence interval; EXP(B)= Exponentiation of the B coefficient.

EVALUATION REPORT
20
In evaluating the Communication for Health project’s performance against the 7.5% change at the midline target, Annex 1 shows that the project’s achievement exceeded 95% for the midline targets.
3.3.1.4. Prevention of mother-to-child HIV transmission, HIV counseling, and testing
A series of questions were included in the survey about HIV testing during pregnancy, HIV transmission, self-efficacy about taking antiretrovirals, and expectations that antiretrovirals can reduce the risk of HIV transmission to children. Table 8 shows the results.
Table 8: Percentage prevention of mother-to-child transmission, HIV counseling and testing, Communication for Health baseline (September 2016) and midline (April 2019) surveys
Indicator
Baseline Midline Exposed Nonexposed
N=745 N=481 N=169 N=312
HIV test at recent pregnancy 50.4 57.5** 67.3*** 43.0
A pregnant woman with HIV can transmit it to her baby. 74.8 80.2*** 82.7** 76.5
A pregnant woman with HIV can prevent transmitting it to her baby if she takes antiretrovirals. 73.2 76.9* 82.8*** 68.2
I am able to be tested for HIV and take antiretrovirals if needed. 88.3 85.5 91.0*** 77.5
Testing for HIV and adhering to antiretrovirals can reduce the risk of HIV transmission to my babies. 79.1 78.5 84.1*** 70.3
*p<0.05, **p<0.01, and ***p<0.001.
As depicted in Table 8, the percentage of women who were tested for HIV/AIDS at their recent pregnancy increased significantly from 50% at baseline to 58% at midline. Midline comparisons also show that women exposed to Communication for Health were more likely to have been tested for HIV/AIDS at their recent pregnancy (67%) than those who were not exposed (43%).
Women’s knowledge on mother-to-child transmission of HIV/AIDS and its prevention improved significantly from the baseline. Yet, there were no significant differences between baseline and midline respondents on self-efficacy (confidence to seek testing for HIV and take antiretroviral therapy or
knowing that testing and antiretroviral therapy adherence reduces the risk of HIV transmission to infants). However, midline respondents exposed to Communication for Health reported significantly higher levels of knowledge, self-efficacy, and outcome expectancies than their nonexposed counterparts (see Table 8).
Multivariate analysis was conducted to examine the likelihood of behavioral outcomes after controlling for demographic factors (e.g., age, education), social factors (e.g., vulnerability, gender attitudes), interpersonal communication on PMTCT, HIV counseling, and testing. Table 9 shows the results.

MID-TERM EVALUATION OF THE COMMUNICATION FOR HEALTH PROJECT IN ETHIOPIA
21
Table 9: Result from logistic regression on HIV/AIDS test during recent pregnancy, Communication for Health baseline (September 2016) and midline (April 2019) surveys
Indicator B Sig. AOR
95% CI for EXP(B)
Lower Upper
Age (15–24 years is reference)
25–34 -0.004 0.990 0.996 0.549 1.806
35–49 0.156 0.656 1.169 0.588 2.324
Education (Uneducated is reference)
At least primary 0.608 0.017 1.836 1.114 3.026
Knowledge (Low is reference)
Medium 0.630 0.018 1.877 1.117 3.156
High 0.720 0.031 2.055 1.067 3.960
Vulnerability index (Not vulnerable is reference)
Vulnerable -0.539 0.030 0.583 0.358 0.950
Highly vulnerable -0.929 0.005 0.395 0.207 0.753
Gender Equitable Men scale, partner violence index (Low is reference)
Moderate -0.638 0.008 0.528 0.329 0.848
High -1.136 0.025 0.321 0.119 0.867
Gender Equitable Men scale, sexual relationship index (Low is reference)
Moderate -0.521 0.119 0.594 0.308 1.144
High 0.427 0.309 1.532 0.673 3.486
Interpersonal communication on prevention of mother-to-child HIV transmission with anyone (No is reference) Yes -0.022 0.946 0.979 0.526 1.822
Direct exposure, dichotomous (Nonexposed is reference) Exposed 0.788 0.001 2.199 1.409 3.433
Note: AOR=adjusted odds ratio; CI=confidence interval; EXP(B)= Exponentiation of the B coefficient.
Some background characteristics were correlated with having or not having HIV/AIDS testing during pregnancy. As shown in Table 9, women who were exposed to Communication for Health messages were twice as likely (AOR=2.199, 95% CI=1.409–3.433) as their nonexposed counterparts to have had an HIV/AIDS test during their recent pregnancy. Higher levels of education and knowledge about the value of HIV testing were protective factors for women to get tested during pregnancy. Higher levels of vulnerability contributed to lower odds of being tested for HIV during pregnancy. Hence, vulnerability was a risk factor. Gender attitudes on the partner violence subscale had a significantly negative
effect on women having had an HIV/AIDS test during their recent pregnancy, indicating that women who had negative attitudes towards partner violence reported lower levels of HIV testing at their recent pregnancy.
3.3.2. Child feeding
Breastfeeding benefits are multiplied with early initiation of breastfeeding and exclusive breastfeeding for 6 months. Both the baseline and midline surveys gathered data on child-feeding practices of women with children under 2 years old. Table 10 presents the results.

EVALUATION REPORT
22
Table 10: Percentage level of early initiation of breastfeeding and exclusive breastfeeding among mothers of children under 23 months old, Communication for Health baseline (September 2016) and midline (April 2019) surveys
Indicator Baseline Midline Exposed Nonexposed
Early initiation of breastfeeding
N=745 N=481 N=169 N=312
67.5 68.5 72.8* 62
Exclusive breastfeeding
N=195 N=130 N=78 N=52
64 46.3* 46.7 45.8
N=745 N=481 N=169 N=312
Children should have at least four food groups (Knowledge) 99 98.3 97.7 99.2
Exclusive breastfeeding in first 6 months improves child health status (Outcome expectancy) 98.2 97.4 97.5 97.3
Notes: *p<0.05. Exclusive breastfeeding at midline was measured differently from baseline, hence comparison between baseline and midline may not be reliable.
Rates of early initiation of breastfeeding, as shown in Table 10, increased slightly from 67.5% at baseline to 68.5% at midline, though the difference was not statistically significant. Early initiation of breastfeeding was significantly higher (73%) among those exposed to Communication for Health intervention messages than those who were not exposed (62%). However, the results also show a sharp decline from 64% at baseline to 46% at midline in the proportion of women with children under 2 years old who practiced exclusive breastfeeding. At midline, there were no statistically significant differences between exposed and nonexposed women regarding early initiation of breastfeeding. No improvements were noted in knowledge and outcome expectancies on child feeding between baseline and midline, which may be due to ceiling effects resulting from the fact that almost all respondents had the required knowledge and outcome expectancies
associated with the importance of exclusive breastfeeding. Regional comparisons indicate significant increases in early initiation of breastfeeding among women with a child under 5 in Oromia and Tigray. However, exclusive breastfeeding of children under 6 months of age declined significantly between baseline and midline in all four regions. See Annex 12 for regionally disaggregated results.
The result of the multivariate analysis presented in Table 11 shows that early initiation of breastfeeding was not statistically significantly different between women who were exposed to health messages and those who were not. Hence, the significant variation among exposed and nonexposed groups that is reported in the bivariate analysis might be due to other confounding factors.

MID-TERM EVALUATION OF THE COMMUNICATION FOR HEALTH PROJECT IN ETHIOPIA
23
Table 11: Result from logistic regression on early initiation of breastfeeding, Communication for Health midline survey (April 2019)
Indicator B Sig. AOR
95% CI for EXP(B)
Lower Upper
Age in years (15–24 is reference)
25–34 0.228 0.447 1.256 0.697 2.263
35–49 0.029 0.932 1.030 0.524 2.025
Education (Uneducated is reference)
At least primary 0.033 0.900 1.034 0.617 1.732
Knowledge (Low is reference) High -0.855 0.485 0.425 0.038 4.699
Outcome expectancy (Low is reference) High 0.790 0.323 2.204 0.460 10.549
Vulnerability index (Not vulnerable is reference)
Vulnerable 0.042 0.877 1.043 0.614 1.771
Highly vulnerable -0.502 0.127 0.605 0.318 1.153
Gender Equitable Men scale, partner violence index (Low is reference)
Moderate -0.448 0.074 0.639 0.391 1.044
High -1.493 0.001 0.225 0.090 0.564
Gender Equitable Men scale, sexual relationship index (Low is reference)
Moderate -0.762 0.055 0.467 0.214 1.015
High -1.048 0.017 0.351 0.149 0.826
Direct exposure, dichotomous (Nonexposed is reference) Exposed 0.258 0.275 1.295 0.814 2.060
Note: AOR=adjusted odds ratio; CI=confidence interval; EXP(B)= Exponentiation of the B coefficient.
When evaluating the project’s performance against half of the 5-year targets set for key child-feeding performance indicators, project achievement exceeded 94% of the midline targets (Annex 1).
3.3.3. Malaria
The analysis presented in this section is based on a smaller sample of respondents who live in malaria-prone areas. These woredas were categorized based on the information from the Ministry of Health on malaria prevalence. The results, as presented in Table 12, showed that 62.5% of midline survey respondents lived in areas that are moderately or highly prone to malaria. The proportion of respondents at baseline was 58.5%.
Table 12: Percentage of respondents, by malaria status
Baseline N=2,770 Midline N=1,773 Total N=4,543
% % %
Malaria Free/Low 41.5 37.5 40.0
Moderate/High 58.5 62.5 60.0

EVALUATION REPORT
24
Close to half of the midline respondents (48%) living in malaria-prone areas reported owning at least one bed net, which was a statistically significant decline from the baseline report of 66%. The average bed nets per household grew from 1.3 at baseline to 2.1 at midline, and this change was statistically significant. Women who were exposed to Communication for Health were significantly more likely to belong to a household that had at least one bed net, compared to their nonexposed counterparts. Bed net use by women aged 15–49 revealed an insignificant increase from
62% at baseline to 63% at midline. However, bed net use among exposed women (66%) was statistically significantly higher than bed net use among the nonexposed (56%). Similarly, bed net use among all adults aged 35–49 was significantly higher among exposed respondents than nonexposed ones. Unfortunately, bed net use by children under 5 years of age registered significant declines from baseline (67%) to midline (59%). This decline in bed net use could be associated with the sharp decline in household availability of bed nets. Table 13 shows the results.
Table 13: Percentage availability and use of bed nets in households in malaria-prone areas
Indicator
Baseline Midline Exposed Nonexposed
N=1,620 N=1,107 N=765 N=342
Households with at least one bed net in malaria-prone areasa
N=1,057 N=538 N=402 N=136
65.8% 48.6%*** 50.3%*** 41.7%
No. of bed nets in households in malaria prone areas 2,172 1,241 919 322
Average no. of bed nets or long-lasting insecticidal nets per household in malaria-prone areas 1.3 2.1 2.1 2.2
Average family size of households with at least one bed net per household in malaria-prone areas
N=1,057 N=538 N=402 N=136
4.89 4.89 4.87 4.95
Households with at least one bed net per two persons in malaria areas 24.2% 36.0%*** 34.8% 38.9%
Households with at least one net (any type) per two persons who stayed in the household last night
N=1,107 N=765 N=342
29.6%b 32.2% 32.7%* 28.9%
Women aged 15–49 who slept under a bed netc N=1,480 N=639 N=461 N=178
62.3% 63.2% 66.3%** 55.9%
Pregnant women residing in malaria-prone areas who used bed netd
N=117 N=54 N=42 N=12
54.9% 74.5% 75.3% 73.2%
All children under 5 sleep under a bed nete N=700 N=301 N=230 N=71
67.3% 59.3%*** 61.6% 53.4%
Adults aged 35–49 who slept under long-lasting insecticidal nets the previous nightf 43%b 58.5% 61.2%** 50.9%
Population that slept under long-lasting insecticidal nets the previous night (all household members)f 38.4%b 55.4% 58.0%** 47.3%
Note: a. Calculated from households and respondents that live in malaria-prone areas. b. Malaria indicator survey (MIS), 2015. c. Calculated from women aged 15–49 who have a bed net, regardless of location. d. Calculated from pregnant women who have a bed net, regardless of location. e. Calculated from women with children under 5 who have bed nets, regardless of location. f. Calculated from malaria-prone areas, regardless of bed net possession.
*p<0.05, **p<0.01, and ***p<0.001.

MID-TERM EVALUATION OF THE COMMUNICATION FOR HEALTH PROJECT IN ETHIOPIA
25
A total of 3,394 children under 5 years old (2,093 at baseline and 1,301 at midline) lived in malaria-prone areas in the sampled households. As depicted in Figure 1, close to 14% of the baseline and 11.9% of the midline respondents reported a fever in these children in the 2 weeks before the survey. At both
baseline and midline, treatment was sought for approximately 70% of these children. Treatment-seeking behavior of exposed respondents was (49.8%) significantly higher than it was (33.5%) for those that were not exposed to Communication for Health.
Figure 1: Percentage of fever and treatment seeking for children under age 5 in malaria-prone areas
UnexposedExposedMidtermBaseline
Percentage of incidence and treatment seeking for children under 5(NB = 2,093 and ML = 3,394)
0
20
40
60
80
100
Percentage of children had fever in two weeks
(of those who live in malaria prone Woredas)
Percentage of children sought treatment for fever
(out of those who had fever in the two weeks)
Percentage of children sought timely treatment within 24 hours of fever incidence
(of those who live in malaria prone Woredas)
13.811.9 11.7 12.2
70.5
77.7
57
66.9
44.1
49.8
33.5
45.2
Women’s knowledge on the cause, symptoms, and prevention of malaria was measured using the survey data collected from women who lived in malaria-prone areas. A total of 2,727 women responded to these questions at baseline (N=1,620) and midline (N=1,107). The responses indicated that knowledge was significantly higher at midline than at baseline. Close to 3 out of 10 respondents were able to identify the cause of malaria at baseline and midline. These results indicate that knowledge levels are quite low. Knowledge about three or more signs or symptoms of malaria was significantly higher among respondents at midline (39%) than at baseline (33%). At
midline, exposed respondents displayed significantly higher levels of knowledge on the causes of malaria and naming three or more signs or symptoms of malaria, compared to nonexposed respondents. There were no significant differences between baseline and midline responses for knowing that sleeping under an insecticide-treated mosquito net protects against malaria: 24% of exposed midline respondents compared with only 13% of nonexposed respondents reported knowing about sleeping under an insecticide-treated mosquito net. Table 14 shows the results.

EVALUATION REPORT
26
Table 14: Knowledge on malaria among respondents living in malaria-prone areas
Indicator
Baseline (%) Midline (%) Exposed (%) Nonexposed (%)
N=1,620 N=1,107 N=765 N=342
Knowledge on cause of malaria 29.0 31.1*** 33.6** 25.1
Knowledge on three or more signs or symptoms 32.8 38.9*** 42.2** 32.2
Knowledge about sleeping under insecticide-treated mosquito net to prevent malaria 18.0 20.5 24.3** 12.7
*p<.05, **p<.01, and ***p<.001.
Some of the intermediate outcomes around malaria expected from the project are improving the knowledge, self-efficacy, and expectation of beneficiaries that seeking treatment for fever in their children under age 5 within 24 hours of onset will improve their health. As shown in Table 15, the self-efficacy of women on the use of long-lasting
insecticidal nets and treatment seeking for children under 5 improved at midline, compared with baseline figures. At midline, there was no statistically significant change in knowledge and expectations from the baseline. However, exposed respondents were found to have significantly higher positive expectations than nonexposed respondents.
Table 15: Self-efficacy and outcome expectancy on malaria in malaria-prone areas
Indicator Baseline (%) Midline (%) Exposed (%) Nonexposed (%)
All Respondents Living in Malaria-Prone Areas N=1,620 N=1,107 N=765 N=342
Use of bed net can prevent malaria (Outcome expectancy) (Agree/Strongly agree) 95.1 94.3 95.5* 91.8
Having my children sleep under long-lasting insecticidal nets each night will prevent malaria (Outcome expectancy) (Agree/Strongly agree) 94.5 94.2 95.2* 92.2
I am able to have children under 5 sleep under a bed net each night (Self efficacy) (Agree/Strongly agree) 84.4 87.7*** 88.9* 85.2
I am able to sleep under a long-lasting insecticidal net each night (Self-efficacy) (Agree/Strongly agree) 85.0 89.2*** 91.1** 85.2
I should seek treatment within 24 hours of fever in children under (Knowledge) (Agree/Strongly agree) 93.0 92.5 92.8* 91.8
I can take my child to treatment within 24 hours of fever onset (Self efficacy) (Agree/Strongly agree) 89.9 92.0* 92.8* 90.3
Seeking treatment within 24 hours of fever for children under age 5 can improve their health (Outcome expectancy) (Agree/Strongly agree) 96.8 95.2 95.8** 93.8
Pregnant Women Living in Malaria-prone Areas N=143 N=88 N=68 N=20
Use of a bed net can prevent malaria 92.5 95.2 98.6 87.4
Having my children sleep under long-lasting insecticidal nets each night will prevent malaria (Agree/Strongly agree) 92.1 94.6 97.7 87.4

MID-TERM EVALUATION OF THE COMMUNICATION FOR HEALTH PROJECT IN ETHIOPIA
27
Indicator Baseline (%) Midline (%) Exposed (%) Nonexposed (%)
I am able to have children under age 5 sleep under a long-lasting insecticidal net each night (Agree/Strongly agree) 75.4 86.1* 85.6 87.4
I am able to sleep under a long-lasting insecticidal net each night (Agree/Strongly agree) 77.2 88.2* 88.6 87.4
I should seek treatment for fever in children under age 5 within 24 hours (Agree/Strongly agree) 93.5 95.9 94.2 100.0
I can take my child to treatment within 24 hours of fever onset (Agree/Strongly agree) 92.6 93.8 91.2 100.0
Seeking treatment within 24 hours of fever onset will improve health outcomes in children under 5 (Agree/Strongly agree) 97.7 98.5 97.9 100.0
*p<0.05, **p<0.01, and ***p<0.001.
When the project’s performance is evaluated against half of the 5-year targets set for key malaria performance indicators, the project’s achievement averaged about 100% of the midline targets (see Annex 1).
3.3.4. Water, Hygiene, and Sanitation
Water, hygiene, and sanitation (WASH) in Ethiopia is very poor due to lack of awareness
about the benefits of clean water, lack of handwashing and latrine use, and limited access to improved sanitation and water supply facilities. Against this background, the Communication for Health project included WASH as one of the six areas of intervention. Table 16 summarizes the results of the survey data, gathered from target women at baseline and midline and by exposure at midline on some WASH indicators.
Table 16: Practice, knowledge, self-efficacy, and outcome expectancy on handwashing
Indicator Baseline (%) Midline (%) Exposed (%) Nonexposed (%)
N=2,770 N=1,773 N=1,124 N=649
Practices handwashing at all key times 62.2 65.1 66.4 63.6
Has proper handwashing facility with soap and water 13.2 19.3*** 19 13.2*
Comprehensive knowledge on handwashing at key times
Knows all 5 key times 14.3 26.7*** 27.2 27.8
Knows 3–4 key times 29 35.1*** 31.8*** 27.2
Knows <2 key times 56.7 38.2*** 41.0*** 45.0
I can practice proper handwashing (Self-efficacy) 94.2 92.1 93.6** 90.3
Proper handwashing prevents diseases such as diarrhea (Outcome expectancy) 98 97.8 98.4* 96.7
*p<0.05, **p<0.01, and ***p<0.001.

EVALUATION REPORT
28
The results presented in Table 16 show that handwashing under all key circumstances did not significantly improve from baseline, though there were some modest increases. No significant difference was observed in handwashing practices among exposed and nonexposed women at midline. The qualitative data suggest that handwashing practices improved at schools and contributed to a reduction in diseases. According to one key informant who is a primary health care unit officer, “If it wasn’t for the project, students wouldn’t be aware of important health practices, such as handwashing.” As a result of increased awareness, transmitted diseases have decreased, especially at schools. Some key informants recommended the need to capture changes happening in schools after realizing that the household survey might not fully reflect results achieved by the project.
Presence of a proper handwashing place with soap and water grew significantly over the past 3 years in project intervention areas. As shown in Table 16, over 19% survey respondents at midline reported the presence of a proper handwashing place, compared to 13% at baseline, and this difference was
statistically significant. The largest increase was observed in Amhara (from 3% to 11%), followed by SNNPR (from 36% to 41%). Presence of a proper handwashing place was lowest in Oromia, with only 3% of respondents having this basic resource (see Annex 17).
Comprehensive knowledge on handwashing at key times improved significantly at midline, compared to baseline. The percentage of women who know all five critical times of handwashing increased from 14% at baseline to 27% at mid-term. At midline, the percentage of women who knew three to four critical handwashing times was significantly higher among women exposed to Communication for Health (32%) than those who were not exposed (27%). Similarly, at midline, exposed women had statistically significantly higher levels of self-efficacy and outcome expectations than nonexposed women regarding the value of handwashing. Some regional differences were evident, with self-efficacy and outcome expectancies increasing everywhere but Amhara, where it declined (see Annex 17).

MID-TERM EVALUATION OF THE COMMUNICATION FOR HEALTH PROJECT IN ETHIOPIA
29
Table 17: Results of logistic regression on availability of proper handwashing stations, Communication for Health midline survey, April 2019 (computed from 1,773 midline women)
Indicator B Sig. Exp(B)
95% CI for Exp(B)
Lower Upper
Age in years (15–24 is reference) 25–34 0.322 0.131 1.379 0.909 2.094
35–49 0.200 0.387 1.221 0.776 1.922
Education (Uneducated is reference)
At least primary 0.315 0.079 1.370 0.964 1.946
Comprehensive knowledge on handwashing at key times (Knows <2 key times is reference)
Knows 3–4 key times 1.506 0.000 4.510 2.913 6.983
Knows all 5 key times 1.794 0.000 6.011 3.793 9.526
Self-efficacy on proper handwashing (Low and moderate is reference) High -0.463 0.117 0.629 0.353 1.122
Outcome expectancy on proper handwashing (Low and moderate is reference) High -0.320 0.212 0.726 0.439 1.201
Vulnerability index (Not vulnerable is reference)
Vulnerable 0.288 0.100 1.333 0.946 1.879
Highly vulnerable -0.584 0.016 0.558 0.347 0.897
Gender Equitable Men scale (Low is reference)
Moderate 1.411 0.021 4.102 1.234 13.638
High 0.933 0.125 2.543 0.772 8.377
Direct exposure, dichotomous (Nonexposed is reference) Exposed 0.354 0.037 1.425 1.021 1.989
Note: AOR=adjusted odds ratio; CI=confidence interval; EXP(B)= Exponentiation of the B coefficient.
The results of the multivariate analysis presented in Table 17 show that women who were exposed to the Communication for Health intervention were more likely (AOR=1.425, 95% CI=1.021–1.989) than their nonexposed counterparts to have access at home to a proper handwashing station. Respondents at midline who knew three to four (AOR=4.510) or all five (AOR=6.011) key handwashing times were more likely to have a proper handwashing station at home than those who knew fewer critical times of handwashing. Higher levels of vulnerability contributed to lower odds of having proper handwashing stations. Women at a moderate level on the Gender Equitable Men (GEM) scale, adapted for women, were
significantly more likely to have proper handwashing stations than women at a lower level on the scale.
When the project’s performance is evaluated against half of the 5-year targets set for key WASH performance indicators, the results showed that the project’s achievement averaged about 119% of the midline targets (see Annex 1).
3.3.5. Tuberculosis
Respondents who had heard of tuberculosis (TB) declined significantly from 78% at baseline to 67% at midline. However, respondents exposed to Communication for

EVALUATION REPORT
30
Health were more likely to have heard of TB than those that were not exposed. The proportion of respondents who knew about airborne transmission of TB increased from 43% at baseline to 45% at midline. Similarly, 23% of midline survey respondents knew three or more TB symptoms, compared to
15% at baseline. Women who were exposed to Communication for Health were more likely than nonexposed women to know three or more TB symptoms and to know about airborne transmission of TB. Table 18 shows the results.
Table 18: Tuberculosis (TB) knowledge, self-efficacy, and outcome expectancy among all women aged 15–49 years, Communication for Health baseline (September 2016) and midline (April 2019) surveys
Characteristics Baseline (%) Midline (%) Exposed (%) Nonexposed (%)
Sample size N=2,712 N=1,768 N=1,121 N=547
Respondents who ever heard of tuberculosis or TB 78.2 67.0*** 74.8*** 55.0
Respondents who know coughing through air is means of TB transmission 43.1 45.0** 52.1*** 39.8
Respondents who know three or more TB symptoms 14.7 22.5*** 26.7*** 15.8
Sample size N=2,681 N=1,764 N=1,120 N=644
Agrees that she can go to be immediately screened on suspected TB (Self-efficacy) 76.2 66.1*** 73.4*** 54.3
Agrees that early screening of TB may lead to full recovery (Outcome expectation) 75.4 62.1*** 70.1*** 49.5
*p<0.05, **p<0.01, and ***p<0.001.
Analysis of results between baseline and midline shows a statistically significant decline in self-efficacy and outcome expectations for knowing that early screening for TB may lead to full recovery. As shown in Table 18, the proportion of respondents who agreed that they could be immediately screened on suspected TB declined (self-efficacy) from 76% at baseline to 66% at midline. Similarly, 62% of respondents in the midline survey expected that early screening of TB may lead to full recovery from TB, compared to 75% at baseline. At midline, women who were exposed to Communication for Health were more likely to have stronger self-efficacy and positive expectations than those who were not exposed.
When the project’s performance is evaluated against half of the 5-year targets set for key TB performance indicators, the results show that the project’s achievement averaged about 100% of the midline targets (see Annex 1).
3.3.6. Gender equality norms
The Government of Ethiopia has adopted several policy and institutional measures to promote gender equality and women’s empowerment. The Ethiopian Constitution, the 1993 Ethiopian National Policy on Women, the 2005 Family Law, and the Second Growth and Transformation Plan are among the legal and policy instruments that further gender

MID-TERM EVALUATION OF THE COMMUNICATION FOR HEALTH PROJECT IN ETHIOPIA
31
equality and empowerment. The government requires all government institutions to address women’s issues in policies, laws, and development programs and projects. Gender issues influence all six health areas of the Communication for Health project.
A total of 21 questions were asked to ascertain gender equitable norms. These questions were adapted from a validated GEM scale.5 The questions were grouped into gender equality subcomponents for partner violence, sexual relationships, reproductive health, and disease prevention, as well as domestic chores and daily life. Gender equality on partner violence included questions about whether a husband can beat his wife, whether there are times when a woman deserves to be beaten, whether a woman should tolerate violence to keep family together, whether a man can hit his wife if she refuses to have sex with him, whether a man can beat his wife if she is unfaithful, whether a man using violence against his wife is a private matter that should not be shared with outsiders, and whether a man should defend his reputation with force. The sexual relationship subscale questions included questions about whether men need sex more than women, whether a man needs other women even if he is fine with his wife, whether women should talk about sex or just do it, whether it is disgusting if a man acts like a woman, whether a woman should initiate sex, and whether a woman loses respect if she has sex before marriage. Reproductive health and disease prevention questions included items asking if it is woman’s responsibility to avoid pregnancy, if a woman is only a real woman if she has a child, and if a real man produces a male child. Domestic chores and daily life questions included whether childcare and feeding is the responsibility of
5 Available at https://c-changeprogram.org/content/gender-scales-compendium/gem.html
a woman, whether caring for home and family is the responsibility of a woman, whether the husband should decide when to buy major household items, whether a man should have final word about decisions in his house, and whether a woman should obey her husband in all things.
All questions were structured using a Likert scale (agree, partially agree, and disagree). During analysis, the questions were combined to establish subscales corresponding to low, moderate, and high gender inequality. A composite measure of 21 questions on the GEM scale illustrated significant differences between baseline and midline respondents, with 17.0% at baseline and 35.5% at midline reporting low gender inequality. Further, at midline, exposed respondents were significantly more likely than nonexposed respondents to report lower levels of perceived gender inequity. Table 19 shows the results. These positive developments were observed on most subscales across the intervention regions, except for Amhara, where the change over time was smaller and nonsignificant (see Annex 21).

EVALUATION REPORT
32
Table 19: Gender Equitable Men (GEM) scale, adapted for women aged 15–49 years, Communication for Health project baseline (September 2016) and midline (April 2019) surveys
Baseline (%) Midline (%) Exposed (%) Nonexposed (%)
Sample size N=2,243 N=1,557 N=1,004 N=553
GEM scale, adapted for women (derived from 21 variables), % low inequality*** 17.0 35.5*** 37.5*** 30.6
Sample size N=2,603 N=1721 N=1,097 N=624
GEM scale, adapted for women (partner violence), % low inequality*** 46.0 57.9*** 58.2** 56.0
Sample size N=2,303 N=1,584 N=1,019 N=565
GEM scale, adapted for women (sexual relationship), % low inequality*** 4.8 15.9*** 17.4* 11.7
Sample size N=2,770 N=1,773 N=1,124 N=649
GEM scale, adapted for women (reproductive health and disease prevention), % low inequality 67.4 67.3 68.1 66
GEM scale, adapted for women (domestic chores and daily life), % low inequality*** 20.7 33.7*** 35.7*** 28.2
*p<0.05, **p<0.01, and ***p<0.001.
3.4. Effectiveness of the Communication for Health project (Qualitative assessment)
Qualitative data from key informant interviews provide different stakeholder perspectives on the Communication for Health project. The stakeholders interviewed are from regional health bureaus (RHB), woreda health offices, local implementing partners (LIPs), and primary health care units (PHCUs). Multiple views were expressed by the key informants on the challenges and successes of the project. A major issue stated by key informants is that the project addressed priority health needs of families in terms of promoting ANC check-ups, health facility deliveries and post-natal care.
Successful in initiating changes in multiple interrelated health behaviors
Several key informants mentioned improvement in adoption of maternal health and other behaviors during the course of the Communication for Health intervention. ““…women are attending antenatal care services, using family planning services, delivering in health facilities and brining their children for immunization better than it was before this project,” a key informant from a primary health care unit (PHCU) said.
Maternal health videos, the radio program, and school health programs implemented at health facilities and schools respectively are identified by some of the project woredas as the most effective approaches in improving gender norms and changing behavior of beneficiaries.

MID-TERM EVALUATION OF THE COMMUNICATION FOR HEALTH PROJECT IN ETHIOPIA
33
SBCC focus allows for intensity and integration
The Communication for Health project is an integrated SBCC project and its strategic planning from the beginning focused on how to maintain the intensity of the SBCC intervention and at the same time facilitate integration stated key informant from regional health bureau. The project’s integration strategy identified common influencing factors of behavior and the use of multiple channels from mass media to community engagement, further provided the platform for promoting multiple behaviors.
Innovative SBCC approaches
One of the challenges faced by the Communication for Health project was to develop an SBCC strategy that was attractive to the audience and at the same time addressed behavioral issues associated with the adoption of new healthy behaviors.
A woreda level functionary remarked that the program approaches “are new innovations compared with the traditionally known print materials. As they are entertaining, they are liked by the beneficiaries.” Project activities such as the Erkab radio programs, health bazaars, and maternal health videos were entertaining and liked by beneficiaries. The maternal health videos were particularly praised by all stakeholders. Similarly, the school health programs were viewed as innovative, with the potential to be disseminated in the larger community by using students to promote messages.
The project also contributed to improvements in health service delivery through compassionate and respectful caring, enhanced counseling skills of health workers, and increased capacity. These contributions have improved service quality and reduced
complaints about service delivery from the community. “Group communication through the radio listeners group [Erkab radio] helps implement creating respectful and compassionate health work force. As a result, community complaints on service quality have been addressed,” a key informant from PHCU said.
Capacity strengthening of the health system
The Communication for Health project also reportedly brought about some changes at the health system level. Capacity-building trainings and technical support helped to improve knowledge and attitudes of professionals in the health system. In this regard, the organization capacity assessment conducted by the project was mentioned as among the top achievements of the project. The assessment, as one key informant stated, was helpful in assessing available capacity of the regional health bureau in identifying existing resources for leveraging, and in highlighting the gaps that should be filled to achieve organizational goals. Another key informant noted that “the organization capacity assessment might not have been conducted with such professionalism and scientific approach with the available capacity of the RHB. Hence, the RHB might not have known its available capacity, gaps, and resources, which are necessary to fulfill its mandate to the extent it is expected in the absence of this project.”
Gender participation
The Communication for Health project has been engaging both females and males in the project activities that are deemed relevant to both groups. For the successful implementation of the gender issues as part of this project, gender integration and mainstreaming guidelines were prepared

EVALUATION REPORT
34
and put into practice by the health extension workers and woreda level SBCC experts in all the planned Communication for Health activities. The program team hired a gender specialist all through the project and she ensured that gender messaging was an integral part of program planning.
3.5. Relevance
Improving health service utilization and hence health status through the use of social behavior change communication and strengthening health system capacity are among the pillars of the Health Sector Transformation Plan of Ethiopia.6 The plan specifically identifies the need to enhance evidence-based health education and behavioral change communication as a strategic initiative to improve community participation and engagement. The Communication for Health project is well aligned with major health sector goals and the priorities of the country.
Aligned with health system priorities
In the regions and woredas where Communication for Health is being implemented, project activities were identified and designed in line with the national and local priorities. Relevance was ensured with the identification of targets and activities in each intervention area following organizational capacity assessments, formative and behavioral assessments, and root cause analyses that were conducted through a participatory process.
“All phases of the project, including the root cause analysis and planning, were based on problems at hand. In addition, regular reviews were done based on the routinely generated data and corrective actions taken,” a key
6 Federal Ministry of Health. (2015). Health Sector Transformation Plan 2015/16-2019/20 (2008-2012 EFY).
informant from Woreda Health Office said. According to many stakeholders interviewed during the midline, this approach helped align the project with Health Sector Transformation Plan priorities and the Woreda Transformation Plan while also being responsive to the health needs of primary beneficiaries. In the words of one key informant, “It [the Communication for Health project] is unquestionably relevant, and the activities are aligned with national and local priorities.”
Several study participants mentioned that the formative need assessment undertaken by the project, aligned with the HSTP priorities and the woreda transformation plan (WTP). Since the six health areas covered by the project were already being addressed at the woreda level, it resulted in synergy of health focus with the government program. The ability to contextualize woreda plans according to local needs highlighted the utility of the Communication for Health project according to a key informant from Woreda Health Office.
Generally, most Communication for Health activities were appropriate and relevant for bringing about desired changes in behaviors among target communities. Among the most relevant project activities were the radio listeners’ groups established at the community level, knowledge creation activities in schools, health messaging via mobile application, and radio spots transmitted through regional FM stations.
Improvement in the coordination capacity at different administrative levels was mentioned as another important outcome achieved by Communication for Health. This achievement was made possible through the establishment of the Technical Working Group (TWG), with the

MID-TERM EVALUATION OF THE COMMUNICATION FOR HEALTH PROJECT IN ETHIOPIA
35
support of the project. The TWG has enabled synergy and coordinated engagement among stakeholders, and it helps manage existing and emerging challenges. The formation of TWG facilitated institutionalization of SBCC in government structures and systems. Increased coordination among stakeholders also contributed to resource utilization efficiency. As a result of the project, fragmented SBCC activities in government are now better coordinated.
To many stakeholders, the project helped officials and government staff realize that communication is an important means to increase health service utilization and improve health status of the population. The project has played important roles in ensuring that SBCC gets attention from government officials and staff, though there are variations among intervention areas. “Attitudinal change of experts and managers is the bigger outcome for me, as this [SBCC] was the least priority before, which is now got attention,” a Woreda Health Office staff said. Another Woreda Health Office staff said that, “As a result of the project implementation, SBCC activities are now considered among the key issues in every woreda. Before SBCC works were additional assignment for the health extension supervisors. But now, the SBCC officer is getting assigned to work on SBCC issues only. Moreover, SBCC is becoming as one part of the planning, monitoring, and evaluation activities in the woreda.
3.6. Sustainability
Sustainability of components of the Communication for Health project is discussed under the following areas, systems strengthening, coordination, local implementation, technical working groups (TWGs), and risks to sustainability.
System Strengthening
The system strengthening activities of the Communication for Health project from the inception of the project form the basis of sustainability and continuation. These initiatives include the capacity and organizational assessments which identified the gaps in the system. Based on these assessments, capacity strengthening efforts were undertaken.
Mention of sustainability varied by project activity and results. Capacity-building activities that were implemented by the project were considered relatively more sustainable than others. Additionally, the establishment of a TWG to oversee the planning and implementation of project activities in the project woredas was considered a step toward sustainability. The capacity-building trainings given to the focal persons at all levels were helpful in providing the necessary knowledge and skills to implement the planned SBCC activities and sustain some project activities.
“Linkages have been strengthened with the local media, Schools, Women and Children Affairs Offices, and the PHCUs for sustaining project activities. The government has shown high commitment to own and sustain gains, overseeing the implementation and monitoring of the activities of the project in this region.” Key informant from Regional Health Bureau “SBCC activities are now considered among the key issues in every Woreda… SBCC is becoming a part of the planning, monitoring, and evaluation activities in the Woreda.” Key informant from Woreda Health Office.
Coordination with different stakeholder levels
Many key informants agreed that sustainability issues were considered at different stages of the project cycle. Though views varied, stakeholders were involved from the

EVALUATION REPORT
36
design stage to implementation. In specific intervention areas, the government has shown high commitment and ownership of the project, which are vital to sustaining the activities and results. Coordination mechanisms established at different administrative levels for SBCC were considered vital to enhance chances of sustainability. A Regional Health Bureau official said the following:
“The respective stakeholders were engaged throughout the key processes, such as the designing, planning, implementation, and monitoring of the project. The health system is the owner and implementer of this project. The project has been working on creating sense of ownership by the health system and the respective stakeholders through the provision of a series of capacity building trainings, which also contributed to sustenance of project results. Linkages have been created with the local media, schools at local level, women and children affairs offices at different levels, and the PHCUs for sustaining these project activities. The government has shown very high commitment and ownership in sustaining the project and has been leading/overseeing the implementation and monitoring of the activities of this project in this region.”
Designed for local implementation
Responses of key informants showed varying levels of stakeholder engagement from the design to the implementation and monitoring phases. Stakeholders at the regional level indicated that their involvement was relatively high at different stages of the project cycle. There was some regional variation in the level of their involvement. In SNNPR, for example, engagement of government bodies in selecting woredas for Communication for Health intervention, as well as planning and review of the activities in the region, were considered inadequate by some key informants.
Stakeholders in Amhara, Oromia and Tigray regions indicated that their engagement in project activities was high, which they found instrumental in promoting a sense of ownership and commitment among some officials.
Stakeholders at the PHCU level tended to have more measured opinions about the sustainability of the project which they largely attributed to their low-level engagement in the project design.
Technical Working Groups as an institutionalization platform
Technical working groups established at regional and zonal levels were important mechanisms for coordinating project activities between the respective stakeholders. Most key informants agreed that the coordination mechanisms established and used by the project were appropriate to their context. The TWGs were established after the commencement of the Communication for Health project and found to be appropriate, composed of different stakeholders with direct or indirect influence on SBCC activities. These TWGs had regular meetings to discuss the progress of planned activities, challenges, and future plans. Resources were shared, and activities were integrated between the existing partners. “The Communication for Health project was effective in coordinating the implementation and monitoring of the project activities through the TWGs established, which did not exist before the commencement of this project,” a key informant said.
Improved coordination
Coordination mechanisms or linkages that have been created among the different stakeholders at each level were considered sustainable, as one key informant reported:
MID-TERM EVALUATION OF THE COMMUNICATION FOR HEALTH PROJECT IN ETHIOPIA
37
“The government structure and system is updated by the project. Once the system is practiced and the benefit at community level is observed, the project would be sustainable. For example, this day there is no need for HDA [the Health Development Army] to make announcements for parent to vaccinate their child, as the parent understood the value and vaccinate their child on time.”
The fact that some project activities are designed so that they can be implemented with local capacity was also supported as a way to ensure sustainability of these activities. “The project is one and only that is being implemented in the region using a scientific communication and behavior change approach, which is feasible to implement with local capacity,” a Regional Health Bureau official said.
Design and distribution of SBCC print materials were considered to be sustainable, as the project has built capacity to do so at different levels. Indeed, many stakeholders found many of the project activities innovative and would like to continue implementing them even after the project ends, as long as they obtain the necessary support in the remaining implementation period. “They [project activities] could be implemented with our own capacity if proper implementation follow-up and final sustainability interventions were implemented to the end,” a Woreda Health Official said.
The maternal health videos that the project introduced were considered to be sustainable in intervention areas where they were distributed. It is important to note that according to some key informants, these videos were not provided to some intervention woredas.
Many other project activities may not be sustainable unless strong measures are taken during the remaining timeline of the
project. One of the less sustainable activities was the radio program. Many stakeholders agreed that it may not be sustainable, as the government lacks the financial capacity to buy airtime. Similarly, though they were considered successful, health bazaars, according to government officials, may not be implemented consistently due to resource and financial constraints.
SBCC materials developed during the project are considered sustainable as they can be continued to be used by the health system. According to some key informants, designing audiovisual materials for health communication requires funding that the government may not be able to afford, and hence development of new materials can be difficult. However, at the same time, stakeholders acknowledged that the project had developed the technical expertise and commitment needed to design such materials. Besides, the fact that the project is distributing some audiovisual materials, such as the maternal health videos, to PHCUs shows that these activities can be sustained with existing messages and materials.
Another activity of the project that may not be sustainable was the mobile application, mainly because “many people do not have appropriate phone [smart or JAVA-installed feature phones], and even those who had the phones were not able to use technology properly. Thus, I doubt its sustainability,” a key informant said. Some stakeholders questioned the relevance of the mobile application. These applications require smart phones or a phone with the JAVA platform, and primary beneficiaries do not often own such phones. The stakeholders recommend a simpler digital strategy that is not dependent on smart phones.

EVALUATION REPORT
38
The findings suggest an uneven implementation of project activities in intervention areas that were partly attributed limited funding. This was also confirmed by some project staff: “…the project priorities were not equally addressed due to various factors. For example, there was no funding for the nutrition project, and hence some of the targets set were not addressed as per the plan.”
One woreda official said that “In some woredas, the maternal health videos were not distributed or implemented, while in others malaria campaigns did not take place…” Differences were also observed in intensity of implementation of some project activities, such as distribution of SBCC materials. Some woredas and PHCUs complained that the project failed to provide them with adequate SBCC materials.
Risks to sustainability
Several challenges and risks to the sustainability of project activities were identified. Although the capacity-building work undertaken at different levels was seen as largely sustainable, high turnover of government staff and officials was identified as a challenge. “If I leave the woreda health office, there will be no one to implement the project,” a woreda officer said.
Many stakeholders agreed that government officials lack adequate ownership of and commitment to SBCC interventions. Ownership and commitment were particularly low at the PHCU level. Some key informants indicated that this situation was partly attributable to their inadequate understanding of the importance of SBCC, which might be due to their limited participation in monitoring and review meetings. Indeed, inadequate follow-up was consistently identified as a risk to sustainability, and it was said to be getting
worse, as local implementing partners are now excluded from project implementation. In the absence of implementing partners, most stakeholders indicated that the project would be unable to implement activities and provide necessary follow-up support.
Many stakeholders identified the lack of permanent structures for SBCC activities as a key challenge to sustainability of project results and activities. In most project areas, there was no dedicated staff or unit for health communication activities, particularly at the zonal and woreda levels. This may also be true at the regional health bureau level. These activities must be managed by the public relations unit at the RHB level in regions such as SNNPR. The experts at this level are not SBCC professionals. They are journalists or public relation experts who may not have adequate SBCC training. According to key informants, despite initiatives to establish a separate unit (i.e., health communication unit) at the regional level, it may take time to become functional.
SBCC activities do not have a dedicated budget. The government gives inadequate attention to SBCC activities. Communication activities are not often among key priorities, and government officials tend to assign competent personnel to other programs. The government also has a shortage of funding to allocate to SBCC activities. One of the key informants was quoted as saying “... there is no permanent staff assigned in majority of the cases, as it is not in their priority to allocate budget, which will definitely affect sustainability.’ Some key informants attributed these challenges to government officials’ inadequate understanding of the impact of SBCC. This could be possible because direct results from communication interventions are not

MID-TERM EVALUATION OF THE COMMUNICATION FOR HEALTH PROJECT IN ETHIOPIA
39
as tangible or observable as those from other programmatic efforts. All of these factors are risks for sustainability once the Communication for Health project is completed.
3.7. Strengths, Facilitating Factors, Weaknesses, and Challenges of the Communication for Health Project
Both internal and external factors have affected the implementation and effectiveness of the Communication for Health project. These factors include strengths and facilitating factors, as well as weaknesses and challenges.
3.7.1. Strengths and facilitating factors
Stakeholders identified the following strengths and enabling factors that facilitated implementation of the Communication for Health project:
• Need-based intervention design and implementation: the participatory and need-based approach of the project was a key strength that was cited by stakeholders across the board. The interventions were designed based on the initial gap assessment and with active involvement of stakeholders in the process. This has helped the project to address the priority needs of target beneficiaries and align them with Health Sector Transformation Plan priorities. The project was implemented in deserving areas, according to stakeholders.
• Responsiveness: the project was said to be responsive to changing circumstances and emerging issues. For instance, it was involved in developing key messages during acute watery diarrhea and scabies outbreaks.
• Focused nature of the project: being a focused intervention was seen as a strength of the project. As such, the project was able to better demonstrate its importance and bring about noticeable changes in the intervention areas. In this regard, a government official said the following: “Actually, other partners were also supporting the region in this regard though it was not a standalone like this project. By virtue of the project’s nature (focused only on SBCC), it brought major changes in the region. That means, I guess the contribution is immense, and we would not be able to achieve these with other programs as such.”
• Enabling policy environment: though this could be improved, there was some evidence of an enabling policy environment for SBCC interventions, which was considered favorable for project implementation.
3.7.2. Weaknesses and challenges
Several weaknesses and challenges were identified as constraints to project implementation and its effectiveness, such as inadequate ownership and commitment of government officials, inadequate budget and resources, lack of dedicated staff and enabling structure, government staff turnover, insecurities and displacements, weak follow-up, illiteracy, and inadequate facilities at service providers. These are briefly described below.
• Inadequate ownership and commitment of government officials: although positive changes have happened, there was a perceived lack of ownership and commitment from government officials. This was partly attributed to inadequate understanding of SBCC and its importance in improving the health status of the population. Some stakeholders also

EVALUATION REPORT
40
associated the government’s inadequate commitment to and ownership of the project and SBCC activities with the fact that the results of SBCC are not as visible and tangible as other intervention areas.
• Inadequate budget and resources: shortage of budget for some specific interventions, such as nutrition, and delays in the release of the annual budget were among the factors that hindered project implementation.
• Lack of dedicated staff and enabling structure: a lack of permanent structure for SBCC was another constraint of the project that could challenge the sustainability of some of its results. The health system in intervention areas lacks SBCC experts at different levels of the administration tier (region, zone, woreda, and PHCU). The project has focal persons, and the TWG established by the project did support and oversee the implementation of the Communication for Health project. In one of the regions, the lack of staff or a focal person dedicated to the SBCC activities, particularly at the zonal level, was identified as the reason behind weak implementation of project activities. A key informant from an RHB explained the problem and offered a recommendation:
… there is no dedicated staff at zonal and woreda levels who will be responsible for managing the Communication for Health project. Therefore, this requires a need to strengthen the existing TWG and assign focal persons at all levels to continue implementing and monitoring the Communication for Health project unless restructuring and filling the structure is possible.
• Government staff turnover: high turnover of government officials and personnel was another challenge to the project
implementation and a threat to its sustainability. In many areas, trained technical staff and officials left their positions, which hampered implementation of planned activities. According to key informants, in the last 3 years of the project period, there was high turnover of staff working in the health system at the regional, woreda, and primary health care unit levels. This turnover affected the project by requiring more trainings and additional time for newly hired staff to familiarize themselves with the project.
• Insecurities and displacements: in some Communication for Health project areas, activities could not be implemented as planned due to various conflicts, insecurities, and displacement of people. In the words of one key informant:
The security situation is now different from the one that existed before three years. Since last year, there were so many ethnic-based conflicts that happened in the regions. As a result of such insecurities, some of the woredas were not accessible, and there were times that the woredas were not having heads of health offices and other staffs too. Therefore, there had been time that the project was not even having a communication with the woredas, and Communication for Health activities were stopped, which might have contributed to the low performance in the planned project.
• Weak follow-up: the project was rated poorly on follow-up of its interventions. It was not possible to closely monitor and evaluate the activities. For example, according to a government official from a regional health bureau, “It did not adequately monitor radio programs.”
As a result of weak follow-up and shortage of materials, some project activities were

MID-TERM EVALUATION OF THE COMMUNICATION FOR HEALTH PROJECT IN ETHIOPIA
41
not implemented as planned. Review meetings also were not conducted uniformly in target woredas. One key informant summarized the problem as follows:
There are some shortages of materials. For example, memory card (for the video) was not enough. The radio program was not implemented at all. Brochures and other printouts were distributed only once. It would have been better if the materials were durable and updated at least yearly. Review meetings are sometimes skipped but I don’t know why, and this should be improved.
• Illiteracy: a low literacy level among target women was a constraint to implementation, specifically for some activities, such as the mobile application. The project tried to mitigate the challenge by advising women to get reading assistance from their children. However, the efficacy of developing mobile applications to serve illiterate women remains untested.
• Inadequate facilities at service providers: lack of availability of some basic equipment in some health facilities hampered implementation. For example, maternal home videos were not implemented in some PHCUs because televisions were not available. According to one PHCU staff member, “The maternity waiting home video has only been used in two PHCUs out of the five in our woreda. This is because the other three PHCUs doesn’t have television. I think TVs need to be given together with the video next time.”
3.8. Innovative Practices and Lessons Learned
The project started from the baseline root cause analysis and organization capacity assessment that accounts for the prevailing challenges in the local context, followed by joint implementation and monitoring of the activities that contributed to the overall capacity improvement of staff. Leaders and experts were involved in the process (particularly during the kickoff time). This process aided in the design of activities based on global best practices, while also gaining the support of government officials. Stakeholders considered this approach of the project as a key lesson learned for future programming.
Project activities such as the maternity home video were found to be very innovative and impactful by government personnel and officials. Similarly, school health programs were also viewed as innovative activities to reach the larger community by using students as a vehicle to reach health messages. Communication for Health promoted strong coordination with the education sector, such that teachers and students conveyed key health messages. This approach was considered to be effective by many stakeholders.
An important lesson learned from the project implementation also relates to the need to engage with policy makers at the federal level to ensure that SBCC gets the necessary attention in government structure and plans. The current government structure does not give the necessary attention to SBCC activities, as they are currently mainly undertaken by focal persons rather than full-time staff. These circumstances, according to many key informants, cannot be addressed by working with regional and local governments alone. Policy makers at the federal level also need to be involved in this process.

EVALUATION REPORT
42
Recommendations

MID-TERM EVALUATION OF THE COMMUNICATION FOR HEALTH PROJECT IN ETHIOPIA
43
The results in this report showcase that the Communication for Health project is moving in the right direction and has made several important gains over the past 3 years. Even in the face of infrastructural weaknesses and political instability, which at times has hindered implementation, there is evidence of improvement. In terms of recommendations, there are specific steps that can be taken by project implementing bodies, government, and donors.
Project Implementers (Johns Hopkins Center for Communication Programs and John Snow, Inc.)
• The results indicate that the intervention was successful in initiating changes in multiple interrelated health behaviors. These findings support the importance of integrated social and behavior change communication (SBCC) programming that addresses a variety of issues associated with improvements in the health of women and children, rather than efforts that work in silos to address specific health promotion and disease prevention topics. There is need for continued support for institutionalization of capacity-building and system-strengthening work at all levels by creating mechanisms that provide sustained access to capacity-building opportunities. Additionally, documenting and disseminating project activities and lessons are important, although caution should be exercised when adding multiple messages into one program to avoid information overload. Hence, the focus should be on interrelated health issues that are integral to building successful SBCC programs. Once a program is well-established, it makes sense for it to take on additional health topics. However, starting
with a variety of discrete health topics in the absence of an enabling environment and funding constraints can run the risk of diluting messages.
• A gender-focused SBCC program built on evidence that equitable gender norms influence health behaviors has shown that the gender is a cross-cutting issue that influences several health behaviors. We recommend that gender-focused SBCC should form the basis for all future development programs in Ethiopia.
• The Communication for Health project has launched its Hulu Beteina App for rural families. We recommend that this digital approach is systematically implemented by ensuring that it is used by primary beneficiaries. The last year of the project should focus on evaluating the efficacy of mobile interventions by using the Hulu Beteina App as a case study.
• Strengthen infrastructure and coordination mechanisms to improve the potential for success of SBCC efforts. More specifically, strengthen the established technical working groups for better coordination and implementation of the activities. In addition, consider using other community-based platforms, such as a one-to-five women development army, houses of religion, schools, and other existing platforms to sustain project activities, particularly in areas where these structures are effective and less politicized.
• Strengthen linkages between the structures at grass-root levels, such as the Health Development Army, schools, and woreda health offices.
• Strengthen the existing system’s capacity to closely follow and monitor implementation of activities at all levels.

EVALUATION REPORT
44
• Enhance engagement of government bodies, including regional health bureau staff and other stakeholders in joint project planning, implementation, and monitoring, so as to facilitate learning and ownership. It is also vital to strengthen joint project follow-up and review with active participation of stakeholders at all levels, including woreda cabinets.
• Engage in advocacy activities targeting officials at the regional and federal levels to ensure that SBCC gets the necessary attention in the health structure and systems and that it receives adequate ownership and commitment from senior officials at the local, regional, and national levels.
• Ensure that project support mechanisms are accessible to intervention areas by expanding project staff presence and continuing to engage local implementing partners.
• Design exit strategies considering the findings of this study and through additional consultations. Implement them as early as possible to facilitate the successful handover of the SBCC activities to government bodies.
• Strengthen and build the capacity of the SBCC focal persons and experts, particularly at the primary health care unit and woreda levels through the provision of refresher trainings and technical support.
• Conduct operations research to explore why some desired outcomes (e.g., use of modern contraceptives) have declined in some regions, such as Amhara and Southern Nations, Nationalities, and People’s Region.
Government
• Staff turnover is a key challenge for the implementation and long-term sustainability of project activities and results. The government needs to exert greater effort to reduce turnover of officials and experts while also looking for ways to institutionalize capacity and coordination mechanisms that are created or strengthened with the support of the project.
• The government needs to demonstrate its commitment to SBCC by providing permanent positions in its structure at all levels, so as to ensure that SBCC has designated personnel that are vital to sustain those activities started with the support of the project.
Donor
• Ensure that the project is funded as planned originally, so as to allow uniform implementation of project interventions across intervention areas and retain local implementing partners, which are vital for sustainability of many project activities and results.

MID-TERM EVALUATION OF THE COMMUNICATION FOR HEALTH PROJECT IN ETHIOPIA
45

APPENDIX

ANNEXES: MID-TERM EVALUATION OF THE COMMUNICATION FOR HEALTH PROJECT IN ETHIOPIA
47
5.
APP
END
IX
Anne
x 1:
Proj
ect
Achi
evem
ent
Sum
mar
y
i.
Ach
ieve
men
ts A
gai
nst
Mid
line
Tar
get
s
Pro
ject
goal
: To
incr
ease
kn
owle
dg
e an
d h
ealt
h p
ract
ices
of
ind
ivid
ual
s an
d c
om
mu
nit
ies,
wh
ile s
up
po
rtin
g s
yste
ms
to im
pro
ve t
he
qu
alit
y,
capa
city
, an
d c
oo
rdin
atio
n o
f so
cial
an
d b
ehav
ior
chan
ge
com
mu
nic
atio
n
Obje
ctiv
es a
nd I
ndic
ator
sB
asel
ine
(%)
Mid
line
Tar
get
(%
)5-Y
ear
Tar
get
(%
)P
rogre
ss t
o
Dat
e (%
)Tar
get
A
chie
vem
ent
(%)
Rep
roduct
ive,
mat
ernal
, neo
nat
al, an
d c
hild h
ealt
h
Con
trac
epti
ve p
reva
lence
(cu
rren
t use
of
mod
ern f
amily p
lannin
g)
47.
55
1.15
4.6
42
.68
3.0
Wom
en a
tten
din
g a
nte
nat
al c
are
in f
irst
12 w
eeks
of p
regnan
cy29
.731
.93
4.2
34
.210
7.0
Wom
en a
tten
din
g a
t le
ast
four
ante
nat
al c
are
visi
ts
42
.54
5.7
48
.94
1.59
1.0
Inst
ituti
onal
del
iver
y4
3.1
46
.34
9.6
48
.110
4.0
Del
iver
ies
atte
nded
by s
kille
d h
ealt
h p
erso
nnel
58
.56
2.9
67.
35
9.8
95
.0
Wom
en a
ged
15–4
9 w
ho
bel
ieve
thei
r use
of
mod
ern c
ontr
acep
tive
m
ethod
s im
pro
ved t
he
qual
ity o
f fa
mily lif
e8
8.2
94
.810
0.0
87.
29
2.0
Wom
en a
ged
15–4
9 w
ho
know
dan
ger
sig
ns
duri
ng p
regnan
cyL
ow=
39.2
36.3
33.3
44
.578
.0
Mo
der
ate=
45
.04
8.4
47.
039
.08
1.0
Hig
h=
15.8
17.0
33.9
16.5
97.
0
Wom
en w
ho
feel
that
they
can
att
end a
nte
nat
al c
are
at lea
st f
our
tim
es
duri
ng p
regnan
cy9
3.3
100
.010
0.0
92
.39
2.0
Wom
en w
ho
bel
ieve
that
at
leas
t fo
ur
ante
nat
al c
are
visi
ts d
uri
ng
pre
gnan
cy w
ill le
ad t
o goo
d b
irth
outc
omes
97.
610
0.0
100
.09
5.1
95
.0
HIV
tes
t at
rec
ent
pre
gnan
cy5
0.4
54
.25
8.0
57.
510
6.0

EVALUATION REPORT
48
Obje
ctiv
es a
nd I
ndic
ator
sB
asel
ine
(%)
Mid
line
Tar
get
(%
)5-Y
ear
Tar
get
(%
)P
rogre
ss t
o
Dat
e (%
)Tar
get
A
chie
vem
ent
(%)
Nutr
itio
n
Ear
ly init
iati
on o
f bre
astf
eedin
g in f
irst
6 m
onth
s6
7.5
72.7
77.6
68
.59
4.0
Wom
en w
ith c
hildre
n a
ged
6–2
3 m
onth
s w
ho
know
that
childre
n s
hou
ld
hav
e at
lea
st f
our
food
gro
ups
a day
9
9.0
100
.010
0.0
98
.39
8.3
Wom
en w
ith c
hildre
n a
ges
6–2
3 m
onth
s w
ho
bel
ieve
that
excl
usi
ve
bre
astf
eedin
g w
ill en
han
ce c
hild s
urv
ival
98
.210
0.0
100
.09
7.4
97.
4
Tuber
culo
sis
(TB
)
All f
orm
s of
pre
sum
pti
ve T
B r
efer
red b
y h
ealt
h e
xte
nsi
on w
orker
for
T
B d
iagnos
is
59
.0a.
63.
46
7.9
--
Pro
por
tion
of
the
pop
ula
tion
that
rec
ogniz
e key
sym
pto
ms
of T
B14
.715
.816
.922
.514
2
Pro
por
tion
of
the
pop
ula
tion
that
fee
l th
ey a
re a
ble
to
get
im
med
iate
sc
reen
ing o
n s
usp
ecti
ng T
B
76.2
81.9
87.
66
6.1
81.0
Pro
por
tion
of
the
pop
ula
tion
that
bel
ieve
ear
ly s
cree
nin
g o
f TB
lea
ds
to
full r
ecov
ery
75.4
81.1
86
.76
2.1
77.0
Mal
aria
Pre
gnan
t w
omen
who
slep
t under
LLIN
s th
e pre
viou
s nig
ht
54
.95
9.0
63.
174
.512
6.0
Childre
n u
nder
5 y
ears
old
who
slep
t under
LLIN
s th
e pre
viou
s nig
ht
67.
372
.477
.45
9.3
82
.0
Adult
s ag
ed 3
5–4
9 w
ho
slep
t under
LLIN
s th
e pre
vio
us
nig
ht
43.
0b
46
.24
9.5
58
.512
7.0
Hou
sehol
d w
her
e al
l m
ember
s sl
ept
under
LLIN
s th
e pre
viou
s nig
ht
38.4
b
41.
34
4.2
55
.413
4.0
Childre
n u
nder
5 y
ears
old
who
sought
trea
tmen
t w
ithin
pas
t 24 h
ours
fo
r fe
ver
45
.24
8.6
52
.04
4.1
91.0
Wom
en a
ged
15–4
9 w
ho
feel
they
can
tak
e th
eir
child t
o tr
eatm
ent
wit
hin
24 h
ours
of
feve
r on
set
89
.99
6.6
100
.09
2.0
95
.0
Pre
gnan
t w
omen
who
feel
they
are
able
to
hav
e th
eir
childre
n u
nder
5
slee
p u
nder
an L
LIN
eac
h n
ight
75.4
81.1
86
.78
7.4
108
.0
Wom
en w
ith c
hildre
n u
nder
5 w
ho
bel
ieve
sle
epin
g u
nder
an L
LIN
will
pre
vent
mal
aria
9
4.5
100
.010
0.0
94
.29
4.2
Pre
gnan
t w
omen
aged
15–4
9 w
ho
bel
ieve
sle
epin
g u
nder
an L
LIN
will
pre
vent
mal
aria
92
.510
0.0
100
.09
5.2
95
.2
Hou
sehol
ds
wit
h a
t le
ast
one
mos
quit
o net
65
.870
.775
.74
7.5
67.
0
Hou
sehol
ds
wit
h a
t le
ast
one
net
(an
y t
ype)
per
tw
o per
sons
who
stay
ed
in t
he
hou
sehol
d las
t nig
ht
29.6
b31
.83
4.0
32.2
101.0

ANNEXES: MID-TERM EVALUATION OF THE COMMUNICATION FOR HEALTH PROJECT IN ETHIOPIA
49
Obje
ctiv
es a
nd I
ndic
ator
sB
asel
ine
(%)
Mid
line
Tar
get
(%
)5-Y
ear
Tar
get
(%
)P
rogre
ss t
o
Dat
e (%
)Tar
get
A
chie
vem
ent
(%)
Wat
er, sa
nit
atio
n, an
d h
ygie
ne
(WA
SH
)
Hou
sehol
ds
wit
h s
oap a
nd w
ater
han
dw
ashin
g s
tati
on
13.2
14.2
15.2
19.3
136
.0
Res
pon
den
ts w
ith c
ompre
hen
sive
know
ledge
on h
andw
ashin
g (know
all
key
tim
es)
14.3
15.4
16.5
26.7
174
.0
Hou
sehol
ds
that
pra
ctic
e han
dw
ashin
g w
ith s
oap a
t cr
itic
al t
imes
62
.26
6.9
71.5
65
.19
7.0
Hou
sehol
ds
that
fee
l th
ey p
ract
ice
pro
per
han
dw
ashin
g
94
.210
0.0
100
.09
2.1
92
.1
Hou
sehol
ds
that
bel
ieve
pro
per
han
dw
ashin
g p
reve
nts
dis
ease
s su
ch a
s dia
rrhea
98
.010
0.0
100
.09
7.8
97.
8
Not
e:
LL
IN=
lon
g-l
asti
ng
inse
ctic
idal
net
. Ave
rag
e n
um
ber
of
net
s an
d L
LIN
s p
er h
ou
seh
old
(ba
selin
e 1.
3, m
idlin
e 2
.1)
Sour
ce:
a HM
IS. b M
IS (
2015
).

EVALUATION REPORT
50
ii.
Ach
ieve
men
ts A
gai
nst
Tar
get
s: E
xpos
ed V
ersu
s N
onex
pos
ed R
esponden
ts
Pro
ject
goal
: To
incr
ease
kn
owle
dg
e an
d h
ealt
h p
ract
ices
of
ind
ivid
ual
s an
d c
om
mu
nit
ies
wh
ile s
up
po
rtin
g s
yste
ms
to im
pro
ve t
he
qu
alit
y,
capa
city
, an
d c
oo
rdin
atio
n o
f so
cial
an
d b
ehav
ior
chan
ge
com
mu
nic
atio
n
Obje
ctiv
es a
nd I
ndic
ator
sB
asel
ine
(%)
Mid
line
Tar
get
(%
)M
idline
Expos
ed a
nd
Non
expos
ed (%)
Mid
line
Expos
ed (%)
Mid
line
Non
expos
ed (%)
Rep
roduct
ive,
mat
ernal
, neo
nat
al, an
d c
hild h
ealt
h
Con
trac
epti
ve p
reva
lence
(cu
rren
t use
of
mod
ern f
amily p
lannin
g
met
hod
)4
7.5
51.1
42
.64
5.9
33.2
Wom
en a
tten
din
g a
t le
ast
four
ante
nat
al c
are
visi
ts4
2.5
45
.74
1.54
8.0
32.0
Inst
ituti
onal
del
iver
y4
3.3
56
.64
8.1
54
.438
.9
Del
iver
ies
atte
nded
by s
kille
d h
ealt
h p
erso
nnel
58
.56
2.9
59
.87
1.85
6.2
Wom
en a
ged
15–4
9 w
ho
bel
ieve
thei
r use
of
mod
ern c
ontr
acep
tive
m
ethod
s im
pro
ved t
he
qual
ity o
f fa
mily lif
e8
8.2
94
.88
7.2
89
.878
.8
Wom
en a
ged
15–4
9 w
ho
know
dan
ger
sig
ns
duri
ng p
regnan
cyL
ow=
39.2
36.3
44
.54
1.54
8.9
Mo
der
ate=
45
.04
8.4
39.0
42
.43
4.0
Hig
h=
15.8
17.0
16.5
16.1
17.0
Wom
en w
ho
feel
that
they
can
att
end a
nte
nat
al c
are
at lea
st f
our
tim
es
duri
ng t
hei
r pre
gnan
cy9
3.3
100
.09
2.3
92
.29
2.5
Wom
en w
ho
bel
ieve
that
at
leas
t fo
ur
ante
nat
al c
are
visi
ts d
uri
ng
pre
gnan
cy w
ill le
ad t
o goo
d b
irth
outc
omes
97.
610
0.0
95
.19
7.4
91.8
HIV
tes
t at
rec
ent
pre
gnan
cy5
0.4
54
.25
7.5
67.
34
3.0
Nutr
itio
n
Wom
en w
ho
pra
ctic
ed e
arly
init
iati
on o
f bre
astf
eedin
g in f
irst
6 m
onth
s6
7.5
72.6
68
.572
.86
2.0
Wom
en w
ith c
hildre
n a
ged
6–2
3 m
onth
s w
ho
know
that
childre
n s
hou
ld
hav
e at
lea
st f
our
food
gro
ups
a day
9
9.0
100
.09
8.3
97.
79
9.2
Wom
en w
ith c
hildre
n a
ged
6–2
3 m
onth
s w
ho
bel
ieve
that
excl
usi
ve
bre
astf
eedin
g w
ill en
han
ce c
hild s
urv
ival
98
.210
0.0
97.
49
7.5
97.
3

ANNEXES: MID-TERM EVALUATION OF THE COMMUNICATION FOR HEALTH PROJECT IN ETHIOPIA
51
Obje
ctiv
es a
nd I
ndic
ator
sB
asel
ine
(%)
Mid
line
Tar
get
(%
)M
idline
Expos
ed a
nd
Non
expos
ed (%)
Mid
line
Expos
ed (%)
Mid
line
Non
expos
ed (%)
Tuber
culo
sis
(TB
)
All f
orm
s of
pre
sum
pti
ve T
B r
efer
red b
y h
ealt
h e
xte
nsi
on w
orker
for
T
B d
iagnos
is
59
.0a
63.
4-
--
Pro
por
tion
of
the
pop
ula
tion
that
rec
ogniz
e key
sym
pto
ms
14.7
15.8
22.5
26.7
15.8
Pro
por
tion
of
the
pop
ula
tion
that
fee
l th
ey a
re a
ble
to
get
im
med
iate
sc
reen
ing o
n s
usp
ecti
ng T
B
76.2
81.9
66
.173
.45
4.3
Pro
por
tion
of
the
pop
ula
tion
that
bel
ieve
ear
ly s
cree
nin
g o
f TB
lea
ds
to
full r
ecov
ery
75.4
81.1
62
.170
.14
9.5
Mal
aria
Pre
gnan
t w
omen
who
slep
t under
LLIN
s th
e pre
viou
s nig
ht
54
.95
9.2
74.5
75.3
73.2
Childre
n u
nder
5 w
ho
slep
t under
LLIN
s th
e pre
viou
s nig
ht
67.
372
.45
9.3
68
.26
7.3
Adult
s ag
ed 3
5–4
9 w
ho
slep
t under
LLIN
s th
e pre
viou
s nig
ht
43.
0b
46
.25
8.5
61.2
50
.9
Pro
por
tion
of
the
pop
ula
tion
that
sle
pt
under
LLIN
s th
e pre
viou
s nig
ht
38.4
b4
1.3
55
.45
8.0
47.
3
Childre
n u
nder
5 w
ho
had
tre
atm
ent
wit
hin
24 h
ours
of
fever
45
.24
8.6
44
.14
9.8
33.5
Wom
en a
ged
15–4
9 w
ho
feel
they
can
tak
e th
eir
child t
o tr
eatm
ent
wit
hin
24 h
ours
of
feve
r8
9.9
96
.69
2.0
92
.89
0.3
Pre
gnan
t w
omen
who
feel
they
are
able
to
hav
e th
eir
childre
n u
nder
5
slee
p u
nder
an L
LIN
eac
h n
ight
75.4
81.1
86
.18
5.6
87.
4
Wom
en w
ith c
hildre
n u
nder
5 w
ho
bel
ieve
that
sle
epin
g u
nder
an L
LIN
ea
ch n
ight
will pre
vent
mal
aria
94
.510
0.0
94
.29
5.8
93.
8
Pre
gnan
t w
omen
aged
15–4
9 w
ho
bel
ieve
that
sle
epin
g u
nder
an L
LIN
ea
ch n
ight
will pre
vent
mal
aria
92
.510
0.0
95
.29
8.6
87.
4
Hou
sehol
ds
wit
h a
t le
ast
one
mos
quit
o net
65
.870
.74
7.5
50
.34
1.7
Hou
sehol
ds
wit
h a
t le
ast
one
net
(an
y t
ype)
per
tw
o per
sons
who
stay
ed
in t
he
hou
sehol
d las
t nig
ht
29.6
b31
.832
.232
.7*
28.9

EVALUATION REPORT
52
Obje
ctiv
es a
nd I
ndic
ator
sB
asel
ine
(%)
Mid
line
Tar
get
(%
)M
idline
Expos
ed a
nd
Non
expos
ed (%)
Mid
line
Expos
ed (%)
Mid
line
Non
expos
ed (%)
Wat
er, sa
nit
atio
n, an
d h
ygie
ne
(WA
SH
)
Hou
sehol
ds
wit
h h
andw
ashin
g s
tati
on w
ith s
oap a
nd w
ater
13.2
14.2
19.3
19.0
13.2
Res
pon
den
ts w
ith c
ompre
hen
sive
know
ledge
on h
andw
ashin
g (know
s al
l key
tim
es)
14.3
15.4
26.7
27.2
27.8
Hou
sehol
ds
that
pra
ctic
e han
dw
ashin
g w
ith s
oap a
t cr
itic
al t
imes
62
.26
6.9
65
.16
6.4
63.
6
Hou
sehol
ds
that
rep
ort
pro
per
han
dw
ashin
g
94
.210
0.0
92
.19
3.6
90
.3
Hou
sehol
ds
that
bel
ieve
pro
per
han
dw
ashin
g p
reve
nts
dis
ease
s su
ch a
s dia
rrhea
98
.010
0.0
97.
89
8.4
96
.7
Not
e:
LL
IN=
lon
g-l
asti
ng
inse
ctic
idal
net
. Ave
rag
e n
um
ber
of
net
s p
er h
ou
seh
old
at
base
line
1.3
; at
mid
line
2.1
Sour
ce: a H
MIS
. b MIS
(20
15).
* p<0
.05,
**p<
0.01
, and
*** p
<0.0
01.
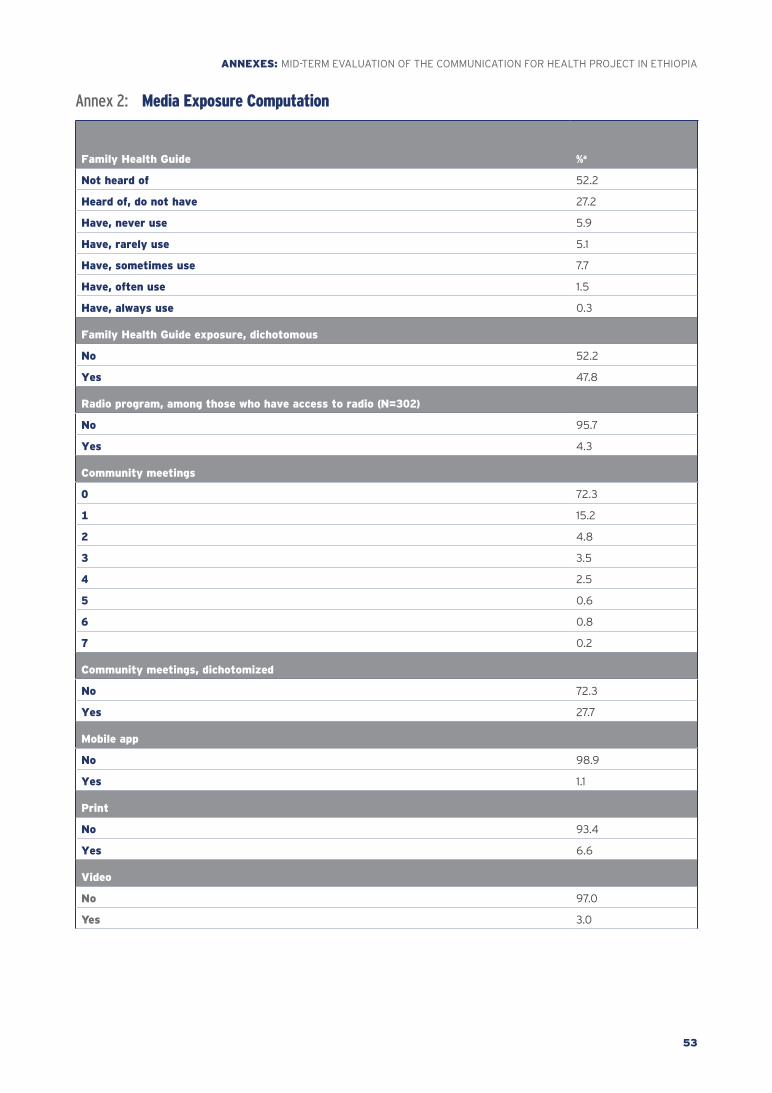
ANNEXES: MID-TERM EVALUATION OF THE COMMUNICATION FOR HEALTH PROJECT IN ETHIOPIA
53
Annex 2: Media Exposure Computation
Family Health Guide %a
Not heard of 52.2
Heard of, do not have 27.2
Have, never use 5.9
Have, rarely use 5.1
Have, sometimes use 7.7
Have, often use 1.5
Have, always use 0.3
Family Health Guide exposure, dichotomous
No 52.2
Yes 47.8
Radio program, among those who have access to radio (N=302)
No 95.7
Yes 4.3
Community meetings
0 72.3
1 15.2
2 4.8
3 3.5
4 2.5
5 0.6
6 0.8
7 0.2
Community meetings, dichotomized
No 72.3
Yes 27.7
Mobile app
No 98.9
Yes 1.1
No 93.4
Yes 6.6
Video
No 97.0
Yes 3.0

EVALUATION REPORT
54
Direct exposure, additive index
0 36.9
1 27.8
2 10.7
3 6.2
4 9.3
5 3.4
6 2.2
7 1.3
8 0.7
9 0.6
10 0.3
11 0.3
12 0.3
13 0.1
14 0.1
Direct exposure levels
None 36.9
1–2 38.5
≥3 24.7
Interpersonal communication
Spouse 37.8
Family 23.0
Neighbors 24.1
Total reporting of interpersonal communication along socio-ecologic model 45.3
Interpersonal communication
Family planning 33.2
Antenatal care 21.4
Delivery 19.6
Postnatal care 16.6
Child care 30.9
Malaria 20.6
Tuberculosis 13.4
Prevention of mother-to-child transmission 16.3
Total reporting of interpersonal communication across topics 46.9
Direct exposure and interpersonal communication
None 25.0
Interpersonal communication only 29.7
Direct exposure only 11.9
Both direct exposure and interpersonal communication 33.4
aPercentages are based on N=1,773, except where noted.

ANNEXES: MID-TERM EVALUATION OF THE COMMUNICATION FOR HEALTH PROJECT IN ETHIOPIA
55
Anne
x 3:
De
mog
raph
ic C
hara
cter
isti
cs o
f Sur
vey
Resp
onde
nts
Dem
ogra
phic
Char
acte
rist
ic
Bas
elin
eM
idte
rm
Tota
l N
=2
,770
Am
har
a N
=674
Oro
mia
N
=6
88
SN
NP
R
N=76
0Tig
ray
N=6
48
Tota
l N
=1,
773
Am
har
a N
=4
16O
rom
ia
N=4
48
SN
NP
R
N=4
48
Tig
ray
N=4
61
Age
of p
arti
cipan
t
15–2
49
33a
(35
%)
202
a
(31%
)23
0a,
b
(33%
)29
6b
(40
%)
205
a
(32
%)
473
b
(26
%)
105
a
(26
%)
135
a
(29
%)
101a
(22
%)
132
a
(30
%)
25–3
49
99
a
(36
%)
263
a
(38
%)
256
a
(37%
)25
0a
(32
%)
230
a
(36
%)
64
2a
(38
%)
147
a
(36
%)
150
a
(34
%)
198
b
(44
%)
147
a
(31%
)
35–4
98
38a
(30
%)
209
a
(31%
)20
2a
(30
%)
214
a
(28
%)
213
a
(32
%)
65
8b
(36
%)
164
a
(38
%)
163
a
(37%
)14
9a
(33%
)18
2a
(38
%)
Type
of p
arti
cipan
t
Curr
entl
y p
regnan
t23
5a
(8%
)39
a
(6%
)8
0b
(12
%)
60
a,b
(8%
)5
6a,
b
(8%
)14
8a
(8%
)33
a
(8%
)4
2a
(9%
)36
a
(8%
)37
a
(8%
)
Wit
h c
hild u
nder
2 y
ears
old
724
a
(25
%)
172
a
(26
%)
170
a
(25
%)
192
a
(24
%)
190
a
(29
%)
45
4a
(25
%)
110
a,b
(26
%)
134
a
(30
%)
89
b
(18
%)
121a,
b (2
7%)
Wit
h c
hild 3
–5 y
ears
old
64
3a
(23%
)15
8a,
b
(23%
)18
4a
(26
%)
151b
(20
%)
150
a,b
(23%
)36
4b
(20
%)
79a
(19
%)
83
a
(19
%)
96
a
(22
%)
106
a
(23%
)
Oth
er w
omen
aged
15–4
9 y
ears
1,16
8a
(43%
)30
5a,
c
(45
%)
254
b
(37%
)35
7a
(48
%)
252
b,c
(39
%)
80
7b
(46
%)
194
a
(46
%)
189
a
(42
%)
227
a
(51%
)19
7a
(43%
)
Educa
tion
No
form
al e
duca
tion
1,637
a
(58
%)
414
a
(63%
)4
81b
(72
%)
321c
(40
%)
42
1a,b
(65
%)
1,09
6a
(62
%)
283
a
(67%
)30
7a
(69
%)
226
b
(50
%)
280
a
(63%
)
Pri
mar
y
86
3a
(32
%)
191a
(28
%)
168
a
(23%
)3
44
b
(47%
)16
0a
(25
%)
516
a
(29
%)
96
a
(23%
)12
3a
(27%
)17
3b
(38
%)
124
a
(25
%)
Sec
ondar
y o
r hig
her
270
a
(9%
)6
9a
(10
%)
39b
(5%
)9
5a
(13%
)6
7a
(10
%)
161a
(9%
)37
a
(10
%)
18b
(4%
)4
9a
(12
%)
57
a
(12
%)
Rel
igio
n
Chri
stia
n (O
rthod
ox, P
rote
stan
t,
Cat
hol
ic, et
c.)
1,94
4a
(68
%)
439
a
(70
%)
214
b
(34
%)
68
7c
(94
%)
60
4c
(93%
)13
68
b
(78
%)
416
(1
00
%)
143
a
(39
%)
376
b
(90
%)
433
c
(93%
)
Musl
im8
26a
(32
%)
235
a
(30
%)
474
b
(66
%)
73c
(6%
)4
4c
(7%
)4
05
b
(22
%)
- (0%
)30
5a
(61%
)72
b
(10
%)
28c
(7%
)

EVALUATION REPORT
56
Dem
ogra
phic
Char
acte
rist
ic
Bas
elin
eM
idte
rm
Tota
l N
=2
,770
Am
har
a N
=674
Oro
mia
N
=6
88
SN
NP
R
N=76
0Tig
ray
N=6
48
Tota
l N
=1,
773
Am
har
a N
=4
16O
rom
ia
N=4
48
SN
NP
R
N=4
48
Tig
ray
N=4
61
Inco
me
(mon
thly
)
Low
(<500 b
irr)
90
7a
(37%
)10
1a
(18
%)
289
b
(49
%)
315
b
(44
%)
202
c
(33%
)6
23b
(4
6%
)8
3a
(24
%)
207
b
(61%
)28
2b
(65
%)
51c
(12
%)
Mid
dle
(501–1
,300 b
irr)
e8
36a
(33%
)31
2a
(50
%)
135
b
(21%
)18
9b
(27%
)20
0c
(35
%)
50
8a
(28
%)
153
a
(40
%)
59
b
(16
%)
100
b
(23%
)19
6a
(46
%)
Hig
h (>1
,300 b
irr)
792
a
(30
%)
210
a
(31%
)18
6a
(30
%)
206
a
(29
%)
190
a
(33%
)4
22b
(25
%)
125
a
(37%
)77
b
(23%
)6
2c
(13%
)15
8a
(42
%)
Mar
ital
sta
tus
Mar
ried
, co
hab
itat
ing
2,0
59
a
(74
%)
515
a
(76
%)
56
6b
(81%
)5
11c
(66
%)
46
7a,
c
(72
%)
1,36
8b
(79
%)
329
a,b
(79
%)
361a
(80
%)
351a,
b
(78
%)
327
b
(71%
)
Div
orce
d, w
idow
ed, si
ngle
711
a
(26
%)
159
a
(24
%)
122
b
(19
%)
249
c
(34
%)
181a,
c
(28
%)
396
b
(21%
)8
6a,
b
(21%
)8
6a
(20
%)
97
a,b
(22
%)
127
b
(29
%)
Vuln
erab
ilit
y Index
e
Low
(not
vuln
erab
le)
1,176
a
(49
%)
314
a
(49
%)
384
b
(57%
)25
6c
(42
%)
222
c
(43%
)1,0
01b
(54
%)
215
a
(52
%)
288
b
(62
%)
182
c
(42
%)
316
b
(71%
)
Mod
erat
e (v
uln
erab
le)
706
a
(29
%)
168
a
(28
%)
167
a
(27%
)20
4a
(32
%)
167
a
(31%
)4
55
b
(28
%)
116
a
(31%
)10
4a
(24
%)
126
a
(29
%)
109
a
(22
%)
Hig
h (hig
hly
vuln
erab
le)
55
2a
(22
%)
130
a
(23%
)9
8b
(16
%)
183
c
(27%
)14
1a,c
(25
%)
284
b
(19
%)
69
a
(17%
)5
1a,c
(14
%)
132
b
(29
%)
32c
(7%
)
Sta
ndar
d o
f Liv
ing Index
e
Low
1,03
4a
(38
%)
296
a
(49
%)
198
b
(33%
)17
6b
(26
%)
364
c
(68
%)
829
b
(45
%)
233
a
(55
%)
215
b
(52
%)
102
c
(23%
)27
9a
(59
%)
Mod
erat
e8
60
a
(37%
)24
8a
(39
%)
220
a
(34
%)
253
a
(40
%)
139
b
(26
%)
55
9b
(32
%)
114
a
(30
%)
129
a
(28
%)
170
b
(40
%)
146
a,b
(33%
)
Hig
h5
40
a
(25
%)
68
a
(12
%)
231b
(32
%)
214
b
(34
%)
27c
(6%
)35
1a
(23%
)5
3a
(14
%)
99
b
(20
%)
168
c
(38
%)
31d
(8%
)
Not
es:
SN
NP
R=
So
uth
ern
Nat
ion
s, N
atio
nal
itie
s, a
nd
Peo
ple
’s R
egio
n.
Sour
ce:
a Dat
a so
urc
e m
erg
ed S
PS
S d
atas
et. b W
eig
hte
d p
erce
nta
ges
. c Val
ues
in t
he
sam
e ro
w a
nd
su
bta
ble
no
t sh
arin
g t
he
sam
e su
bscr
ipt
are
sig
nif
ican
tly
dif
fere
nt
at p
<.0
5. d T
est
of s
ign
ific
ance
(tw
o-w
ay).
Acr
oss
reg
ion
s w
ith
in t
he
sam
e T
ER
M a
nd
bet
wee
n b
asel
ine
and
mid
term
val
ues
fo
r “T
ota
l” c
olu
mn
. e Val
ues
at
base
line
are
dif
fere
nt
fro
m t
ho
se r
epo
rted
in t
he
base
line
rep
ort
do
cum
ent
(du
mm
y ta
ble
s). f T
he
vuln
erab
ility
ind
ex w
as c
on
stru
cted
usi
ng
th
e fo
llow
ing
fo
ur
item
s: la
cked
en
ou
gh
fo
od
to
eat
, lac
ked
sh
elte
r/h
ou
se t
o s
tay
in, n
ot
able
to
aff
ord
to
sen
d c
hild
ren
sch
oo
l, an
d la
cked
mo
ney
to
bu
y m
edic
ines
/
med
ical
tre
atm
ent
(exp
erie
nce
d b
y th
e pa
rtic
ipan
t in
th
e pa
st 1
2 m
on
ths)
. Low
≤4; M
od
erat
e=5
–7; a
nd
Hig
h=
8–1
2. g T
he
stan
dar
d o
f liv
ing
ind
ex w
as c
on
stru
cted
fro
m h
ou
seh
old
ow
ner
ship
of
the
follo
win
g it
ems:
elec
tric
ity,
wo
rkin
g r
adio
, wo
rkin
g t
elev
isio
n, n
on
mo
bile
tel
eph
on
e, m
ob
ile t
elep
ho
ne,
iro
n, r
efri
ger
ato
r, ta
ble
, ch
air,
bed
wit
h c
ott
on
/sp
on
ge/
spri
ng
mat
tres
s, f
lush
/po
ur
flu
sh t
oile
t, p
it la
trin
e, a
nd
fo
ur
item
s of
the
vuln
erab
ility
ind
ex. L
ow≤6
; Mo
der
ate=
7–8
; an
d H
igh≥9
.

ANNEXES: MID-TERM EVALUATION OF THE COMMUNICATION FOR HEALTH PROJECT IN ETHIOPIA
57
Anne
x 4:
An
tena
tal c
are
prac
tice
, kno
wle
dge,
sel
f-ef
ficac
y, a
nd o
utco
me
expe
ctan
cy a
mon
g w
omen
wit
h ch
ildre
n un
der
2 ye
ars
old,
by
regi
on, m
idlin
e su
rvey
(Ap
ril 2
019)
(pe
rcen
tage
s)
Char
acte
rist
ic
Am
har
aO
rom
iaS
NN
PR
Tig
ray
Bas
elin
e N
=17
7M
idline
N=11
4B
asel
ine
N=17
6M
idline
N=14
7B
asel
ine
N=17
7M
idline
N=11
4B
asel
ine
N=17
6M
idline
N=14
7
Num
ber
of
ante
nat
al c
are
upta
kes
None
23.1
18.0
39.6
53.
417
.38
.39
.24
.0
1–3
31
.732
.731
.824
.030
.13
4.1
44
.839
.9
≥44
5.2
49
.328
.622
.65
2.6
57.
54
6.0
56
.0
Wom
en w
ho
Had
ante
nat
al c
are
duri
ng f
irst
12 w
eeks
of p
regnan
cy
33.1
52
.4*
30.4
48
.1**2
1.94
3.5
***
44
.538
.4
Know
the
right
num
ber
of
ante
nat
al c
are
visi
ts t
hat
a
pre
gnan
t w
oman
shou
ld h
ave
≥46
8.5
75.6
59
.65
5.5
84
.273
.7*
78.8
86
.3
Know
it
is im
por
tant
for
pre
gnan
t w
omen
to
hav
e at
le
ast
one
ante
nat
al c
are
visi
t w
ith a
skille
d p
rovi
der
(K
now
ledge)
Moder
ate/
Hig
h9
9.5
92
.0**
*9
9.0
98
.29
5.7
92
.39
4.6
92
.6
Know
att
endin
g a
nte
nat
al c
are
at lea
st 4
tim
es d
uri
ng
pre
gnan
cy b
egin
nin
g in t
he
firs
t tr
imes
ter
is p
ossi
ble
(S
elf-
effi
cacy
)M
oder
ate/
Hig
h9
5.4
89
.79
2.4
96
.99
1.29
3.4
96
.578
.1***
Know
that
pre
gnan
t w
omen
who
visi
t an
tenat
al c
are
at
leas
t fo
ur
tim
es d
uri
ng p
regnan
cy w
ill hav
e bet
ter
bir
th
outc
omes
(O
utc
ome
expec
tancy
)M
oder
ate/
Hig
h9
9.4
91.2
***
95
.49
7.2
98
.29
6.4
96
.19
9.2
* p<0
.05,
**p<
0.01
, and
*** p
<0.0
01.

EVALUATION REPORT
58
Anne
x 5:
An
tena
tal c
are
prac
tice
, kno
wle
dge,
sel
f-ef
ficac
y, a
nd o
utco
me
expe
ctan
cy a
mon
g w
omen
wit
h ch
ildre
n un
der
2 ye
ars
old,
by
age,
ed
ucat
ion
and
vuln
erab
ility
, mid
line
surv
ey (
Apri
l 201
9) (
perc
enta
ges)
Char
acte
rist
ic
Age
Educa
tion
V
uln
erab
ilit
y
15–2
4
N=10
32
5–3
4
N=2
61
35
–49
N
=11
7N
one
N=3
07
Pri
mar
y
N=14
1
Sec
ondar
y
or
abov
e N
=3
3
Not
vuln
erab
le
N=2
70
Vuln
erab
le
N=13
4
Hig
hly
vuln
erab
le
N=67
Ante
nat
al c
are
visi
ts0
25.8
25.6
36.6
35.9
***
13.3
17.9
23.5
**37
.331
.9
1–3
32.9
31.5
25.0
30.5
32.6
17.6
25.2
30.7
41.1
≥44
1.3
42
.938
.433
.65
4.1
64
.55
1.3
32.0
27.1
Ear
ly init
iati
on o
f an
tenat
al c
are
≤12
wee
ks5
4.3
47.
84
0.4
47.
94
6.9
48
.84
5.8
46
.05
5.5
Know
ledge
on t
he
right
num
ber
of
ante
nat
al c
are
visi
ts t
hat
a p
regnan
t w
oman
shou
ld h
ave
≥46
9.2
69
.06
6.4
62
.479
.679
.775
.96
0.6
64
.1
It is
impor
tant
for
pre
gnan
t w
omen
to
hav
e at
lea
st o
ne
ante
nat
al c
are
visi
t w
ith
a sk
ille
d p
rovi
der
(K
now
ledge)
Moder
ate/
hig
h9
3.4
95
.79
2.7
94
.4*
94
.69
4.4
96
.0*
93.
59
2.2
Att
endin
g a
nte
nat
al c
are
at lea
st f
our
tim
es b
egin
nin
g in t
he
firs
t tr
imes
ter
is
pos
sible
(S
elf-
effi
cacy
)M
oder
ate/
hig
h9
2.8
92
.99
0.6
92
.99
3.1
83.
99
2.3
93.
09
2.2
Pre
gnan
t w
omen
who
rece
ive
ante
nat
al
care
at
leas
t fo
ur
tim
es w
ill hav
e bet
ter
bir
th o
utc
omes
(O
utc
ome
expec
tancy
)M
oder
ate/
hig
h9
3.1
95
.89
5.4
95
.59
4.4
95
.09
5.6
97.
19
1.3
* p<0
.05,
**p<
0.01
, and
*** p
<0.0
01.

ANNEXES: MID-TERM EVALUATION OF THE COMMUNICATION FOR HEALTH PROJECT IN ETHIOPIA
59
Anne
x 6:
In
stit
utio
nal d
eliv
ery,
pos
tnat
al c
are
prac
tice
, kno
wle
dge,
sel
f-ef
ficac
y, a
nd o
utco
me
expe
ctan
cy a
mon
g w
omen
wit
h ch
ildre
n un
der
2 ye
ars
old,
by
regi
on, m
idlin
e su
rvey
(Ap
ril 2
019)
(pe
rcen
tage
s)
Char
acte
rist
ic
Am
har
aO
rom
iaS
NN
PR
Tig
ray
Bas
elin
e
N=17
7M
idline
N
=11
4B
asel
ine
N=17
6M
idline
N
=14
7B
asel
ine
N=19
6M
idline
N
=9
5B
asel
ine
N=19
6M
idline
N
=12
5
Inst
ituti
onal
del
iver
yYes
49
.15
8.4
27.8
19.6
50
.57
1.8**
*5
1.979
.0**
*
Hea
lth/va
ccin
atio
n c
ard w
ith d
ate
reco
rded
Yes
63.
772
.430
.737
.97
1.3
76.0
72.8
89
.1***
Pos
tnat
al c
are
wit
hin
7 d
ays
afte
r del
iver
yN
o
72.0
57.
48
3.0
79.3
65
.33
4.2
56
.130
.3
Yes
28.0
42
.617
.020
.7*
34
.76
5.8
***
43.
96
9.7
***
Know
ledge
on p
regnan
cy d
anger
sig
ns
Low
42
.2**
*4
7.3
31.9
49
.54
1.139
.24
8.9
***
20.2
Med
ium
49
.74
0.6
41.7
32.1
43.
54
3.5
43.
85
4.7
Hig
h8
.112
.126
.418
.415
.417
.37.
325
.0
Tim
e of
fir
st c
hec
kup a
fter
del
iver
y f
or p
ostn
atal
car
eW
ithin
2 d
ays
5.3
40
.6**
*5
.918
.1***
4.7
48
.6**
*5
.66
1.3
***
Wit
hin
7 d
ays
22.7
42
.6**
*11
.120
.8**
*30
.16
5.8
***
38.3
69
.8**
*
≥8 d
ays
afte
r11
.011
.3**
*13
.76
.4**
*19
.08
.6**
*13
.711
.7**
*
* p<0
.05,
**p<
0.01
, and
*** p
<0.0
01.

EVALUATION REPORT
60
Anne
x 7:
In
stit
utio
nal d
eliv
ery,
pos
tnat
al c
are,
kno
wle
dge,
sel
f-ef
ficac
y, a
nd o
utco
me
expe
ctan
cy a
mon
g w
omen
wit
h ch
ildre
n un
der
2 ye
ars
old,
by
age,
edu
cati
on, a
nd v
ulne
rabi
lity,
mid
line
surv
ey (
Apri
l 201
9) (
perc
enta
ges)
Char
acte
rist
ic
Age
Educa
tion
V
uln
erab
ilit
y Index
15–2
4
N=
103
25–3
4
N=
261
35–4
9
N=
117
No
ne
N=
307
Pri
mar
y
N=
141
Sec
on
dar
y
or
abov
e
N=
33
No
t
vuln
erab
le
N=
270
Vu
lner
able
N=
134
Hig
hly
vuln
erab
le
N=
67
Inst
ituti
onal
del
iver
y5
6.4
45
.64
6.4
37.7
***
64
.778
.35
2.6
**4
2.0
37.3
Hea
lth/va
ccin
atio
n c
ard w
ith d
ate
reco
rded
66
.36
2.8
53.
95
9.1
62
.279
.26
5.3
57.
25
3.6
Pos
tnat
al c
are
wit
hin
7 d
ays
afte
r del
iver
y
No
51.0
61.6
59
.56
6.6
47.
630
.65
7.1
62
.26
5.7
Yes
49
.038
.44
0.5
33.4
52
.4**
69
.4**
*4
2.9
37.8
34
.3
Know
ledge
on p
regnan
cy d
anger
sig
ns
Hig
h20
.531
.53
4.3
29.1
29.3
38.4
29.0
32.6
29.9
* p<0
.05,
**p<
0.01
, and
*** p
<0.0
01.
Anne
x 8:
Pr
even
tion
of m
othe
r-to
-chi
ld H
IV t
rans
mis
sion
, HIV
cou
nsel
ing
and
test
ing,
kno
wle
dge,
sel
f-ef
ficac
y, a
nd o
utco
me
expe
ctan
cy
amon
g w
omen
wit
h ch
ildre
n un
der
2 ye
ars
old,
by
regi
on, m
idlin
e su
rvey
(Ap
ril 2
019)
(pe
rcen
tage
s)
Char
acte
rist
ic
Am
har
aO
rom
iaS
NN
PR
Tig
ray
Bas
elin
e
N=
177
Mid
line
N=
114
Bas
elin
e
N=
176
Mid
line
N=
147
Bas
elin
e
N=
196
Mid
line
N=
95
Bas
elin
e
N=
196
Mid
line
N=
125
HIV
tes
t at
rec
ent
pre
gnan
cy5
8.9
69
.329
.838
.65
3.9
61.5
83.
98
8.2
A p
regnan
t w
oman
wit
h H
IV c
an t
ransm
it it
to h
er b
aby
80
.577
.16
0.5
***
76.2
83.
18
7.1
73.8
***
96
.0
A p
regnan
t w
oman
wit
h H
IV c
an p
reve
nt
tran
smit
ting it
to h
er b
aby if
she
takes
anti
retr
ovir
als
74.4
73.8
71.8
71.9
71.4
**8
5.6
81.
3**
91.6
Sel
f-ef
fica
cy o
n H
IV/A
IDS
86
.08
2.5
83.
18
2.7
94
.59
1.29
4.2
98
.2
Outc
ome
expec
tancy
79
.276
.678
.670
.876
.8*
89
.49
0.4
96
.0
* p<0
.05,
**p<
0.01
, and
*** p
<0.0
01.

ANNEXES: MID-TERM EVALUATION OF THE COMMUNICATION FOR HEALTH PROJECT IN ETHIOPIA
61
Anne
x 9:
Pr
even
tion
of m
othe
r-to
-chi
ld H
IV t
rans
mis
sion
, HIV
cou
nsel
ing
and
test
ing,
kno
wle
dge,
sel
f-ef
ficac
y, a
nd o
utco
me
expe
ctan
cy
amon
g w
omen
wit
h ch
ildre
n un
der
2 ye
ars
old,
by
age,
edu
cati
on, a
nd v
ulne
rabi
lity,
mid
line
surv
ey (
Apri
l 201
9) (
perc
enta
ges)
Char
acte
rist
ics
Age
Educa
tion
V
uln
erab
ilit
y Index
15–2
4
N=10
32
5–3
4
N=2
61
35
–49
N
=11
7N
one
N=3
07
Pri
mar
y
N=14
1
Sec
ondar
y
and a
bov
e N
=3
3
Not
vuln
erab
le
N=2
70
Vuln
erab
le
N=13
4
Hig
hly
vuln
erab
le
N=67
HIV
tes
t at
rec
ent
pre
gnan
cy70
.96
2.1
59
.05
5.7
***
74.5
84
.870
.7**
*5
5.2
46
.3
A p
regnan
t w
oman
wit
h H
IV c
an t
ransm
it it
to h
er b
aby
80
.68
3.5
84
.68
1.18
6.5
87.
98
3.3
85
.176
.1
A p
regnan
t w
oman
wit
h H
IV c
an p
reve
nt
tran
smit
ting it
to h
er b
aby if
she
takes
anti
retr
ovir
als
77.7
80
.88
1.276
.5**
84
.49
7.0
82
.2*
82
.16
8.7
Sel
f-ef
fica
cy o
n H
IV/A
IDS
87.
48
9.3
88
.08
6.6
90
.89
7.0
89
.38
8.8
86
.6
Outc
ome
expec
tancy
76
.78
2.8
86
.38
0.8
83.
09
3.9
83.
38
4.3
74.6
* p<0
.05,
**p<
0.01
, and
*** p
<0.0
01.
Anne
x 10
: M
oder
n fa
mily
pla
nnin
g us
e, k
now
ledg
e, s
elf-
effic
acy,
and
out
com
e ex
pect
ancy
am
ong
mar
ried
wom
en a
ged
15–4
9 ye
ars,
bas
elin
e (S
epte
mbe
r 20
16)
and
mid
line
(Apr
il 20
18)
surv
eys
Char
acte
rist
ic
Am
har
a (%
)O
rom
ia (%)
SN
NP
R (%)
Tig
ray (%)
Bas
elin
e N
=4
69
Mid
line
N=2
90
Bas
elin
e N
=4
80
Mid
line
N=3
19B
asel
ine
N=4
45
Mid
line
N=3
08
Bas
elin
e N
=4
45
Mid
line
N=2
89
Ever
use
d m
oder
n c
ontr
acep
tive
met
hod
(m
arri
ed w
omen
)79
.776
.75
3.8
52
.673
.96
7.4
66
.575
.7**
Curr
ent
mod
ern f
amily p
lannin
g u
se r
ate
(mar
ried
wom
en)
58
.6**
*4
3.6
31.3
33.0
55
.4*
49
.04
1.4**
52
.6
N=
674
N=
416
N=
68
8N
=4
48
N=7
60
N=
44
8N
=6
48
N=
46
1
Wom
en w
ho
know
any m
oder
n c
ontr
acep
tive
met
hod
s9
3.9
93.
09
0.8
90
.68
8.5
89
.99
8.5
96
.9
Wom
en w
ho
know
abou
t m
oder
n lon
g-ac
ting c
ontr
acep
tive
met
hod
s***
74.1
77.4
74.7
***
54
.26
9.9
69
.48
4.5
82
.5
Wom
en w
ho
know
abou
t m
oder
n s
hor
t-ac
ting c
ontr
acep
tive
met
hod
s***
87.
99
2.4
87.
3**
83.
68
7.4
***
81.
39
8.0
**9
4.1
N=
674
N=
378
N=
68
8N
=37
8N
=76
0N
=39
3N
=6
48
N=
44
5
Wom
en w
ho
bel
ieve
they
are
able
to
use
mod
ern c
ontr
acep
tive
m
ethod
s (S
elf-
effi
cacy
)9
2.0
94
.56
0.9
97.
9**
*8
3.9
96
.4**
*9
7.4
99
.1*
Wom
en w
ho
bel
ieve
thei
r use
of
mod
ern c
ontr
acep
tive
met
hod
s im
pro
ved q
ual
ity o
f fa
mily lif
e (O
utc
ome
expec
tati
on)
93.
39
4.3
77.0
98
.4**
*8
4.0
96
.6**
*9
8.0
99
.0
* p<0
.05,
**p<
0.01
, and
*** p
<0.0
01.

EVALUATION REPORT
62
Anne
x 11:
Cu
rren
t m
oder
n fa
mily
pla
nnin
g us
e, k
now
ledg
e, s
elf-
effic
acy,
and
out
com
e ex
pect
ancy
am
ong
mar
ried
wom
en a
ged
15–4
9 ye
ars,
m
idlin
e su
rvey
, 201
9 (p
erce
ntag
es)
Char
acte
rist
ic
Age
Educa
tion
Vuln
erab
ilit
y
15–2
4
N=2
20
25
–34
N
=5
84
35
–49
N
=3
64
None
N=9
46
Pri
mar
y
N=35
0
Sec
ondar
y
and a
bov
e N
=72
Not
Vuln
erab
le
N=7
74
Vuln
erab
le
N=35
6
Hig
hly
V
uln
erab
le
N=2
19
Ever
use
d m
oder
n f
amily p
lannin
g m
ethod
6
3.2
**7
1.15
9.8
61.8
***
71.5
82
.770
.9**
*5
8.2
58
.9
N=
185
N=
515
N=
513
N=
85
3N
=30
8N
=6
2N
=6
91
N=
312
N=
202
Curr
ent
use
of
mod
ern f
amily p
lannin
g m
ethod
4
8.7
***
54
.827
.938
.6**
*5
2.5
51.7
48
.0**
*38
.335
.0
N=
473
N=
64
2N
=6
58
N=
1,09
6N
=5
16N
=16
1N
=1,0
91
N=
45
5N
=28
4
Any f
amily p
lannin
g m
ethod
8
0.5
***
96
.59
2.4
92
.08
8.6
87.
98
8.9
**9
4.4
92
.2
Any m
oder
n m
ethod
65
.1**79
.970
.778
.6**
*74
.66
1.773
.5**
*76
.48
3.6
Any t
radit
ional
met
hod
15.4
16.7
12.7
13.4
14.0
28.1
15.4
18.0
8.6
Any m
oder
n s
hor
t-ac
ting m
ethod
18.2
**17
.223
.22
1.5**
*17
.613
.116
.2**
23.8
23.1
Any m
oder
n lon
g-ac
ting m
ethod
46
.96
2.5
56
.55
7.1
56
.94
8.5
57.
25
2.6
60
.5
One
to t
hre
e m
ethod
s4
1.3
**5
0.9
51.5
53.
8**
44
.128
.94
3.9
**4
7.7
63.
1
Fou
r or
mor
e m
ethod
s39
.24
5.6
40
.938
.24
4.4
62
.94
5.0
46
.729
.1
Bel
ieve
s th
ey a
re a
ble
to
use
mod
ern c
ontr
acep
tive
m
ethod
s (S
elf-
effi
cacy
)75
.29
2.3
***
86
.78
7.0
83.
88
4.1
84
.38
8.0
88
.4
Bel
ieve
s th
eir
use
of
mod
ern c
ontr
acep
tive
m
ethod
s im
pro
ved q
ual
ity o
f fa
mily lif
e (O
utc
ome
expec
tati
on)
77.1
92
.5**
*8
5.3
86
.18
4.8
87.
68
4.5
89
.08
6.6
* p<0
.05,
**p<
0.01
, and
*** p
<0.0
01.

ANNEXES: MID-TERM EVALUATION OF THE COMMUNICATION FOR HEALTH PROJECT IN ETHIOPIA
63
Anne
x 12
: Le
vel o
f ear
ly in
itia
tion
of b
reas
tfee
ding
and
exc
lusi
ve b
reas
tfee
ding
am
ong
mot
hers
of c
hild
ren
unde
r 23
mon
ths,
by
regi
on,
Com
mun
icat
ion
for
Hea
lth
proj
ect
base
line
(Sep
tem
ber
2016
) an
d m
idlin
e (A
pril
2019
) su
rvey
s
Char
acte
rist
ic
Am
har
a (%
)O
rom
ia (%)
SN
NP
R (%)
Tig
ray (%)
Bas
elin
e N
=17
1M
idline
N=10
6B
asel
ine
N=17
0M
idline
N=13
0B
asel
ine
N=19
1M
idline
N=8
2B
asel
ine
N=18
5M
idline
N=11
4
Ear
ly init
iati
on o
f bre
astf
eedin
g a
mon
g c
hildre
n u
nder
5 y
ears
*
69
.36
5.7
61.8
*73
.375
.78
3.5
71.9
*79
.4
N=
43
N=
39N
=5
2N
=28
N=
42
N=
32N
=4
5N
=28
Excl
usi
ve b
reas
tfee
din
g a
mon
g c
hildre
n u
nder
6 m
onth
s
95
.06
2.0
**8
5.6
68
.88
6.5
59
.0**
57.
624
.9*
N=
674
N=
414
N=
68
2N
=4
44
N=7
57
N=
44
5N
=6
45
N=
45
6
Str
ongly
agre
e th
at c
hildre
n s
hou
ld h
ave
at lea
st f
our
food
gro
ups
a day
(S
elf-
effi
cacy
)9
9.5
**9
7.4
97.
29
8.7
99
.09
9.4
99
.9*
98
.9
Str
ongly
bel
ieve
that
excl
usi
ve b
reas
tfee
din
g in f
irst
6 m
onth
s w
ill
lead
to
hea
lthy n
eonat
al o
utc
omes
(O
utc
ome
expec
tati
on)
95
.19
6.7
97.
39
8.2
96
.4*
98
.79
5.6
96
.3
* p<0
.05,
**p<
0.01
, and
*** p
<0.0
01.
Anne
x 13
: Ea
rly
init
iati
on o
f bre
astf
eedi
ng, e
xclu
sive
bre
astf
eedi
ng, f
amily
pla
nnin
g se
lf-ef
ficac
y, a
nd fa
mily
pla
nnin
g ou
tcom
e ex
pect
ancy
am
ong
mar
ried
wom
en a
ged
15–4
9 ye
ars,
mid
line
surv
ey (
Apri
l 201
9) (
perc
enta
ges)
Char
acte
rist
ic
Age
Educa
tion
Vuln
erab
ilit
y
15–2
4
N=10
32
5–3
4
N=2
61
35
–49
N
=11
7N
one
N=3
07
Pri
mar
y
N=14
1
Sec
ondar
y
and a
bov
e N
=3
3
Not
Vuln
erab
le
N=2
70
Vuln
erab
le
N=13
4
Hig
hly
V
uln
erab
le
N=67
Ear
ly init
iati
on o
f bre
astf
eedin
g a
mon
g c
hildre
n u
nder
5 y
ears
71.0
70.1
62
.56
5.4
73.4
77.4
71.2
68
.15
6.9
N=
36N
=77
N=
31N
=8
5N
=4
5N
=12
N=
88
N=
28N
=22
Excl
usi
ve b
reas
tfee
din
g a
mon
g c
hildre
n u
nder
6 m
onth
s6
0.2
47.
64
5.7
50
.25
0.2
52
.55
2.4
39.1
54
.1
N=
103
N=
261
N=
117
N=
307
N=
141
N=
33N
=27
0N
=13
4N
=6
7
Agre
e th
at c
hildre
n s
hou
ld h
ave
at lea
st f
our
food
gro
ups
a day
(S
elf-
effi
cacy
)9
8.4
98
.49
8.0
98
.8*
98
.19
4.4
99
.79
6.2
99
.3
Bel
ieve
that
excl
usi
ve b
reas
tfee
din
g in t
he
firs
t 6 m
onth
s w
ill le
ad t
o hea
lthy n
eonat
al o
utc
omes
(O
utc
ome
expec
tati
on)
93.
79
8.0
99
.59
8.6
95
.39
5.0
98
.79
8.1
93.
8
* p<0
.05.

EVALUATION REPORT
64
Anne
x 14
: Sa
mpl
e w
ored
a cl
assi
ficat
ion
base
d on
mal
aria
inci
denc
e, r
egio
nal d
isag
greg
atio
n
Char
acte
rist
ic
Am
har
aO
rom
iaS
NN
PR
Tig
ray
Bas
elin
eM
idline
Bas
elin
eM
idline
Bas
elin
eM
idline
Bas
elin
eM
idline
Mal
aria
inci
den
ceFre
e/Low
40
%20
%8
0%
100
%2
1%0
%18
%27
%
Moder
ate/
Hig
h6
0%
80
%20
%0
%79
%10
0%
82
%73
%
Anne
x 15
: Kn
owle
dge,
sel
f-ef
ficac
y, a
nd o
utco
me
expe
ctan
cy o
n m
alar
ia a
mon
g w
omen
age
d 15
–49
year
s w
ho li
ve in
mal
aria
-pro
ne a
reas
, by
reg
ion,
Com
mun
icat
ion
for
Hea
lth
proj
ect
base
line
(Sep
tem
ber
2016
) an
d m
idlin
e (A
pril
2019
) su
rvey
s (p
erce
ntag
es)
Char
acte
rist
ic
Am
har
aS
NN
PR
Tig
ray
Bas
elin
e N
=3
48
Mid
line
N=3
15B
asel
ine
N=6
21
Mid
line
N=4
48
Bas
elin
e N
=5
43
Mid
line
N=3
44
Know
s th
ree
or m
ore
signs
or s
ym
pto
ms
29.7
31.7
37.6
**4
4.8
27.9
***
43.
0
Know
s ca
use
of
mal
aria
27.4
***
10.6
28.1**
*5
0.7
24.9
***
35.9
Know
s th
at b
ed n
ets
can p
reve
nt
mal
aria
(O
utc
ome
expec
tancy
; ag
ree/
stro
ngly
ag
ree)
94
.9*
92
.19
3.9
95
.59
8.4
98
.9
Hav
ing m
y c
hildre
n s
leep
under
lon
g-la
stin
g inse
ctic
idal
net
s ea
ch n
ight
will
pre
vent
mal
aria
94
.49
2.4
93.
79
5.1
95
.7**
98
.9
I am
able
to
hav
e ch
ildre
n u
nder
5 s
leep
under
bed
net
eac
h n
ight
(Sel
f ef
fica
cy;
agre
e/st
rongly
agre
e)9
2.3
***
81.4
83.
2**
*9
2.3
85
.2**
*9
4.9
I am
able
to
slee
p u
nder
a lon
g-la
stin
g inse
ctic
idal
net
eac
h n
ight
(Sel
f-ef
fica
cy;
agre
e/st
rongly
agre
e)9
0.0
85
.08
5.1**
*9
2.2
88
.0**
94
.2
I sh
ould
see
k t
reat
men
t fo
r ch
ildre
n u
nder
5 w
ithin
24 h
ours
of
feve
r (K
now
ledge;
ag
ree/
stro
ngly
agre
e)9
5.5
***
90
.39
1.3
94
.19
3.2
95
.1
I ca
n t
ake
my c
hild t
o tr
eatm
ent
wit
hin
24 h
ours
of
feve
r on
set
(Sel
f-ef
fica
cy;
agre
e/st
rongly
agre
e)9
6.0
***
89
.98
6.0
***
93.
49
0.5
*9
5.3
See
kin
g t
reat
men
t w
ithin
24 h
ours
of
feve
r fo
r m
y c
hildre
n u
nder
age
5 w
ill im
pro
ve
thei
r hea
lth
96
.6*
94
.49
7.3
95
.79
3.9
*9
6.3
* p<0
.05,
**p<
0.01
, and
*** p
<0.0
01.

ANNEXES: MID-TERM EVALUATION OF THE COMMUNICATION FOR HEALTH PROJECT IN ETHIOPIA
65
Anne
x 16
: Kn
owle
dge,
sel
f-ef
ficac
y, a
nd o
utco
me
expe
ctan
cy o
n m
alar
ia a
mon
g w
omen
age
d 15
–49
year
s w
ho li
ve in
mal
aria
-pro
ne a
reas
, by
age
, edu
cati
on, a
nd v
ulne
rabi
lity,
Com
mun
icat
ion
for
Hea
lth
mid
line
surv
ey (
Apri
l 201
9) (
perc
enta
ges)
Char
acte
rist
ic
Age
Educa
tion
V
uln
erab
ilit
y Index
15–2
4
N=2
78
25
–34
N
=4
20
35
–49
N
=4
09
None
N=6
41
Pri
mar
y
N=3
47
Sec
ondar
y
or
abov
e N
=11
9
Not
vuln
erab
le
N=5
91
Vuln
erab
le
N=3
00
Hig
hly
vuln
erab
le
N=19
8
Know
s th
ree
or m
ore
mal
aria
sig
ns
or s
ym
pto
ms
34
.14
2.2
38.6
38.0
38.7
44
.04
1.130
.74
8.2
Know
s ca
use
of
mal
aria
31.2
34
.926
.926
.237
.139
.239
.023
.522
.0
Know
s bed
net
s ca
n p
reve
nt
mal
aria
(O
utc
ome
expec
tancy
; ag
ree/
stro
ngly
agre
e)9
2.6
94
.49
5.3
93.
89
4.6
96
.29
4.7
93.
39
5.5
Hav
ing m
y c
hildre
n s
leep
under
lon
g-la
stin
g
inse
ctic
idal
net
s ea
ch n
ight
will pre
vent
mal
aria
92
.29
4.4
95
.39
3.9
94
.09
6.2
94
.99
2.5
95
.8
I am
able
to
hav
e m
y c
hildre
n u
nder
5 s
leep
under
a
bed
net
eac
h n
ight
(Sel
f-ef
fica
cy; ag
ree/
stro
ngly
ag
ree)
84
.18
9.6
88
.28
9.0
84
.98
8.5
88
.58
6.7
90
.2
I am
able
to
slee
p u
nder
a lon
g-la
stin
g inse
ctic
idal
net
ea
ch n
ight
(Sel
f-ef
fica
cy; ag
ree/
stro
ngly
agre
e)8
8.4
90
.58
8.3
89
.68
8.4
89
.69
0.8
86
.99
1.8
I sh
ould
see
k t
reat
men
t w
ithin
24 h
ours
of
fever
onse
t fo
r ch
ildre
n u
nder
age
5 (K
now
ledge;
agre
e/st
rongly
ag
ree)
85
.89
5.5
93.
79
3.6
90
.09
3.9
92
.69
3.0
92
.7
I ca
n t
ake
my c
hild t
o tr
eatm
ent
wit
hin
24 h
ours
of
feve
r on
set
(Sel
f-ef
fica
cy; ag
ree/
stro
ngly
agre
e)8
5.6
95
.49
2.7
93.
38
9.4
92
.49
2.3
91.4
93.
1
See
kin
g t
reat
men
t fo
r m
y c
hildre
n u
nder
age
5 w
ithin
24 h
ours
of
feve
r on
set
will im
pro
ve t
hei
r hea
lth
89
.79
8.7
95
.19
5.9
94
.09
4.8
95
.49
5.1
96
.1

EVALUATION REPORT
66
Anne
x 17
: Pr
acti
ce, k
now
ledg
e, s
elf-
effic
acy,
and
out
com
e ex
pect
ancy
on
hand
was
hing
am
ong
mar
ried
wom
en a
ged
15–4
9 ye
ars,
by
regi
on
(per
cent
ages
)
Char
acte
rist
ic
Am
har
aO
rom
iaS
NN
PR
Tig
ray
Bas
elin
e N
=674
Mid
line
N=4
16B
asel
ine
N
=6
88
Mid
line
N=4
48
Bas
elin
e N
=76
0M
idline
N=4
48
Bas
elin
e N
=6
48
Mid
line
N=4
61
Pra
ctic
es h
andw
ashin
g a
t al
l key
cir
cum
stan
ces
54
.4**
*37
.872
.6**
*79
.56
0.0
***
84
.66
5.9
***
47.
2
Pre
sence
of
pro
per
han
dw
ashin
g p
lace
wit
h s
oap a
nd w
ater
1.8**
*10
.82
.33.
035
.5*
40
.71.2
***
5.0
Com
pre
hen
sive
know
ledge
on h
andw
ashin
g a
t key
tim
esK
now
s al
l 5
key
tim
es8
.49
.522
.623
.212
.25
7.1
4.9
0.9
Know
s 3
–4 k
ey t
imes
27.9
29.7
19.8
37.6
41.8
29.3
18.8
34
.9
Know
s <2
key
tim
es6
3.7
60
.75
7.6
39.1**
*4
6.0
13.7
***
76.3
64
.2**
*
I ca
n p
ract
ice
pro
per
han
dw
ashin
g9
3.3
***
80
.39
5.0
***
99
.39
2.6
***
97.
29
5.8
**9
9.0
Pro
per
han
dw
ashin
g p
reve
nts
dis
ease
s su
ch a
s dia
rrhea
98
.6**
*9
4.6
97.
1***
100
.09
9.1
98
.59
9.5
100
.0
* p<0
.05,
**p<
0.01
, and
*** p
<0.0
01.
Anne
x 18
: Pr
acti
ce, k
now
ledg
e, s
elf-
effic
acy,
and
out
com
e ex
pect
ancy
on
hand
was
hing
am
ong
mar
ried
wom
en a
ged
15–4
9 ye
ars,
by
age,
ed
ucat
ion,
and
vul
nera
bilit
y (p
erce
ntag
es)
Char
acte
rist
ic
Age
Educa
tion
V
uln
erab
ilit
y Index
15–2
4
N=4
73
25
–34
N
=6
42
35
–49
N
=6
58
None
N=1,
09
6P
rim
ary
N=5
16
Sec
ondar
y
or
Abov
e N
=16
1
Not
Vuln
erab
le
N=1,
00
1V
uln
erab
le
N=4
55
Hig
hly
V
uln
erab
le
N=2
84
Pra
ctic
es h
andw
ashin
g a
t al
l key
cir
cum
stan
ces
61.7
69
.26
2.4
63.
96
7.0
63.
26
5.4
60
.270
.9
Pre
sence
of
pro
per
han
dw
ashin
g p
lace
wit
h s
oap a
nd
wat
er16
.418
.515
.314
.418
.826
.917
.120
.612
.0
Com
pre
hen
sive
know
ledge
on
han
dw
ashin
g a
t key
tim
esK
now
s al
l 5
key
tim
es2
1.233
.025
.025
.531
.124
.426
.622
.937
.1
Know
s 3
–4 k
ey t
imes
37.6
29.1
31.9
31.2
30.8
45
.829
.64
2.6
24.1
Know
s <2
key
tim
es4
1.237
.94
3.1
43.
438
.229
.84
3.9
34
.538
.9
I ca
n p
ract
ice
pro
per
han
dw
ashin
g9
1.99
3.2
91.7
91.9
92
.29
5.3
91.9
92
.99
3.5
Pro
per
han
dw
ashin
g p
reve
nts
dis
ease
s su
ch a
s dia
rrhea
97.
09
7.9
98
.19
8.1
96
.99
7.9
98
.29
7.6
97.
7

ANNEXES: MID-TERM EVALUATION OF THE COMMUNICATION FOR HEALTH PROJECT IN ETHIOPIA
67
Anne
x 19
: Tu
berc
ulos
is (
TB)
know
ledg
e, s
elf-
effic
acy,
and
out
com
e ex
pect
ancy
am
ong
all w
omen
age
d 15
–49
year
s, C
omm
unic
atio
n fo
r H
ealt
h pr
ojec
t ba
selin
e (S
epte
mbe
r 20
16)
and
mid
line
(Apr
il 20
19)
surv
eys
(per
cent
ages
)
Char
acte
rist
ics
Am
har
a (%
)O
rom
ia (%)
SN
NP
R (%)
Tig
ray (%)
Bas
elin
e N
=6
60
Mid
line
N=4
14B
asel
ine
N=674
Mid
line
N=4
45
Bas
elin
e N
=75
2M
idline
N=4
48
Bas
elin
e N
=6
26
Mid
line
N=4
61
Has
hea
rd o
f an
illnes
s ca
lled
tuber
culo
sis
or T
B77
.472
.0*
72.3
52
.6**
*8
3.2
70.8
***
85
.18
9.2
*
Know
cou
ghin
g t
hro
ugh a
ir is
mea
ns
of T
B t
ransm
issi
on36
.931
.0*
37.7
37.1
53.
16
6.4
***
47.
75
6.3
**
Know
thre
e or
mor
e T
B s
ym
pto
ms
13.9
12.8
13.9
9.1*
16.8
47.
9**
*12
.7*
19.6
Str
ongly
agre
e th
at t
hey
can
be
imm
edia
tely
scr
eened
on
susp
ecte
d T
B (S
elf-
effi
cacy
)76
.770
.8**
70.1
52
.1***
79.7
69
.5**
*8
4.0
89
.1*
Str
ongly
bel
ieve
that
ear
ly s
cree
nin
g o
f T
B m
ay lea
d t
o fu
ll
reco
very
(O
utc
ome
expec
tati
on)
75.3
61.8
***
69
.35
0.2
***
79.6
68
.3**
*8
3.3
88
.7*
* p<0
.05,
**p<
0.01
, and
*** p
<0.0
01.
Anne
x 20
: Tub
ercu
losi
s (T
B) k
now
ledg
e, s
elf-
effic
acy,
and
out
com
e ex
pect
ancy
am
ong
all w
omen
age
d 15
–49
year
s, m
idlin
e su
rvey
(Ap
ril
2019
) (p
erce
ntag
es)
Char
acte
rist
ic
Age
Educa
tion
Vuln
erab
ilit
y
15–2
4
N=4
72
25
–34
N
=6
39
35
–49
N
=6
57
None
N=1,
09
1P
rim
ary
N=5
16
Sec
ondar
y
and A
bov
e N
=16
1
Not
Vuln
erab
le
N=9
98
Vuln
erab
le
N=4
53
Hig
hly
V
uln
erab
le
N=2
84
Hav
e hea
rd o
f an
illnes
s ca
lled
tuber
culo
sis
or T
B6
6.2
69
.86
4.8
62
.2**
*7
1.78
5.2
67.
46
3.1
72.7
Know
cou
ghin
g t
hro
ugh a
ir is
mea
ns
of T
B
tran
smis
sion
45
.5**
*4
7.9
41.8
38.5
***
53.
06
4.8
43.
94
3.0
51.2
Know
thre
e or
mor
e T
B s
ym
pto
ms
19.7
23.5
23.4
18.7
***
26.1
37.0
18.8
***
25.7
29.5
Str
ongly
agre
e th
at t
hey
can
be
imm
edia
tely
sc
reen
ed o
n s
usp
ecte
d T
B (S
elf-
effi
cacy
)6
5.1
69
.16
3.6
61.7
***
70.0
84
.06
6.4
61.9
72.5
Str
ongly
bel
ieve
s th
at e
arly
scr
eenin
g o
f T
B m
ay
lead
to
full r
ecov
ery (O
utc
ome
expec
tati
on)
61.8
64
.06
0.4
57.
8**
*6
6.0
80
.06
3.1
57.
36
7.9
* p<0
.05,
**p<
0.01
, and
*** p
<0.0
01.

EVALUATION REPORT
68
Anne
x 21
: Ge
nder
Equ
itab
le M
en (
GEM
) sc
ale,
adj
uste
d fo
r w
omen
age
d 15
–49
year
s, C
omm
unic
atio
n fo
r H
ealt
h pr
ojec
t ba
selin
e (S
epte
mbe
r 20
16)
and
mid
line
(Apr
il 20
19)
surv
eys
GEM
sca
le ite
m, ad
apte
d f
or w
omen
(% low
ineq
ual
ity
*** )
Am
har
a (%
)O
rom
ia (%)
SN
NP
R (%)
Tig
ray (%)
Bas
elin
e N
=674
Mid
line
N=4
16B
asel
ine
N=6
88
Mid
line
N=4
48
Bas
elin
e N
=76
0M
idline
N=4
48
Bas
elin
e N
=6
48
Mid
line
N=4
61
Sca
le d
eriv
ed f
rom
21 v
aria
ble
s20
.522
.1***
24.6
25.1**
*6
.25
6.2
***
17.2
40
.5**
*
Par
tner
vio
lence
47.
44
7.5
47.
25
6.3
***
41.5
67.
1***
54
.577
.9**
*
Sex
ual
rel
atio
nsh
ip
5.2
6.6
)9
.07.
3**
*0
.838
.9**
*2
.813
.6**
*
Rep
roduct
ive
hea
lth a
nd d
isea
se p
reve
nti
on index
69
.7**
*6
8.3
60
.270
.6**
*70
.96
1.56
7.9
73.7
***
Dom
esti
c ch
ores
and d
aily
lif
e in
dex
***
26.2
33.6
***
26.2
31.2
***
10.2
33.6
***
17.2
37.0
***
* p<0
.05,
**p<
0.01
, and
*** p
<0.0
01.
Anne
x 22
: Pe
rcen
tage
of l
ow in
equa
lity,
Gen
der
Equi
tabl
e M
en (
GEM
) sc
ale,
adj
uste
d fo
r w
omen
age
d 15
–49
year
s, m
idlin
e su
rvey
(Ap
ril
2019
)
GEM
Sca
le, A
dap
ted f
or W
omen
, % low
ineq
ual
ity
***
Age
Educa
tion
Vuln
erab
ilit
y
15–2
4
N=3
62
25
–34
N
=5
88
35
–49
N
=6
07
None
N=1,
00
9P
rim
ary
N=4
14
Sec
ondar
y
and a
bov
e N
=13
4
Not
Vuln
erab
le
N=8
77
Vuln
erab
le
N=4
17
Hig
hly
V
uln
erab
le
N=24
1
Der
ived
fro
m 2
1 v
aria
ble
s4
5.2
***
36.7
23.4
24.1**
*4
8.3
60
.335
.9**
*25
.94
2.2
N=
439
N=
635
N=
64
7N
=1,0
76N
=4
94
N=
151
N=
972
N=
45
0N
=27
0
Der
ived
fro
m 2
1 v
aria
ble
s6
8.9
***
60
.74
7.4
50
.4**
*6
7.2
82
.05
8.1**
*5
0.7
67.
7
N=
367
N=
59
7N
=6
20N
=1,0
23N
=4
25N
=13
6N
=8
93
N=
42
1N
=24
8
* p<0
.05,
**p<
0.01
, and
*** p
<0.0
01.

Notes

Notes