MHC evolution in three salmonid species: a comparison between class II alpha and beta genes
12
ORIGINAL PAPER MHC evolution in three salmonid species: a comparison between class II alpha and beta genes Daniela Gómez & Pablo Conejeros & Sergio H. Marshall & Sofia Consuegra Received: 12 February 2010 / Accepted: 15 May 2010 / Published online: 3 June 2010 # Springer-Verlag 2010 Abstract The genes of the major histocompatibility com- plex (MHC) are amongst the most variable in vertebrates and represent some of the best candidates to study processes of adaptive evolution. However, despite the number of studies available, most of the information on the structure and function of these genes come from studies in mammals and birds in which the MHC class I and II genes are tightly linked and class II alpha exhibits low variability in many cases. Teleost fishes are among the most primitive vertebrates with MHC and represent good organisms for the study of MHC evolution because their class I and class II loci are not physically linked, allowing for independent evolution of both classes of genes. We have compared the diversity and molecular mechanisms of evolution of classical MH class II α and class II β loci in farm populations of three salmonid species: Oncorhynchus kisutch, Oncorhynchus mykiss and Salmo salar . We found single classical class II loci and high polymorphism at both class II α and β genes in the three species. Mechanisms of evolution were common for both class II genes, with recombination and point mutation involved in generating diversity and positive selection acting on the peptide- binding residues. These results suggest that the mainte- nance of variability at the class IIα gene could be a mechanism to increase diversity in the MHC class II in salmonids in order to compensate for the expression of one single classical locus and to respond to a wider array of parasites. Keywords MHC class II . Adaptive evolution . Oncorhynchus mykiss . Oncorhynchus kisutch . Salmo salar Introduction The genes of the major histocompatibility complex (MHC) represent some of the most polymorphic genes known in nature (Trowsdale and Parham 2004) and provide one of the best examples of balancing selection in vertebrates (Garrigan and Hedrick 2003; Hughes and Nei 1988; Takahata 1990). Class I and class II classical MHC genes encode proteins responsible for recognising self- and not self-peptides and present them to the T lymphocytes, triggering the immune response in verte- brates (Klein 1986). Despite their common origin (Flajnik et al. 1999), class I and class II genes evolve at different rates in primates (Boyson et al. 1996), birds (Bonneaud et al. 2004) and fish (Consuegra et al. 2005a, b; Kruiswijk et al. 2005), possibly as a consequence of their divergence in function and structure. Class I molecules consist of two different subunits with only one of them, the alpha chain, involved in the antigen presentation. Class II molecules consist of two subunits, alpha and beta, encoded by different genes but both participating in the peptide presentation (Bernatchez and Landry 2003; Reche and Reinherz 2003). Most of the polymorphism of the MHC genes is concentrated in the amino acids responsible for antigen presentation (the peptide-binding residues (PBRs); Hughes D. Gómez : P. Conejeros : S. H. Marshall Laboratorio de Genética e Inmunología Molecular, Instituto de Biología, Facultad de Ciencias Básicas y Matemáticas, Pontificia Universidad Católica de Valparaíso, Valparaíso, Chile S. Consuegra (*) Institute of Biological, Environmental and Rural Sciences, Aberystwyth University, Edward Llwyd Building Penglais Campus, Ceredigion SY23 3DA Wales, UK e-mail: [email protected] Immunogenetics (2010) 62:531–542 DOI 10.1007/s00251-010-0456-x
Transcript of MHC evolution in three salmonid species: a comparison between class II alpha and beta genes
ORIGINAL PAPER
MHC evolution in three salmonid species:a comparison between class II alpha and beta genes
Daniela Gómez & Pablo Conejeros & Sergio H. Marshall &Sofia Consuegra
Received: 12 February 2010 /Accepted: 15 May 2010 /Published online: 3 June 2010# Springer-Verlag 2010
Abstract The genes of the major histocompatibility com-plex (MHC) are amongst the most variable in vertebratesand represent some of the best candidates to studyprocesses of adaptive evolution. However, despite thenumber of studies available, most of the information onthe structure and function of these genes come from studiesin mammals and birds in which the MHC class I and IIgenes are tightly linked and class II alpha exhibits lowvariability in many cases. Teleost fishes are among the mostprimitive vertebrates with MHC and represent goodorganisms for the study of MHC evolution because theirclass I and class II loci are not physically linked, allowingfor independent evolution of both classes of genes. We havecompared the diversity and molecular mechanisms ofevolution of classical MH class II α and class II β loci infarm populations of three salmonid species: Oncorhynchuskisutch, Oncorhynchus mykiss and Salmo salar. We foundsingle classical class II loci and high polymorphism at bothclass II α and β genes in the three species. Mechanisms ofevolution were common for both class II genes, withrecombination and point mutation involved in generatingdiversity and positive selection acting on the peptide-binding residues. These results suggest that the mainte-nance of variability at the class IIα gene could be a
mechanism to increase diversity in the MHC class II insalmonids in order to compensate for the expression of onesingle classical locus and to respond to a wider array ofparasites.
Keywords MHC class II . Adaptive evolution .
Oncorhynchus mykiss .Oncorhynchus kisutch . Salmo salar
Introduction
The genes of the major histocompatibility complex(MHC) represent some of the most polymorphic genesknown in nature (Trowsdale and Parham 2004) andprovide one of the best examples of balancing selectionin vertebrates (Garrigan and Hedrick 2003; Hughes andNei 1988; Takahata 1990). Class I and class II classicalMHC genes encode proteins responsible for recognisingself- and not self-peptides and present them to the Tlymphocytes, triggering the immune response in verte-brates (Klein 1986). Despite their common origin (Flajniket al. 1999), class I and class II genes evolve at differentrates in primates (Boyson et al. 1996), birds (Bonneaud etal. 2004) and fish (Consuegra et al. 2005a, b; Kruiswijk etal. 2005), possibly as a consequence of their divergence infunction and structure. Class I molecules consist of twodifferent subunits with only one of them, the alpha chain,involved in the antigen presentation. Class II moleculesconsist of two subunits, alpha and beta, encoded bydifferent genes but both participating in the peptidepresentation (Bernatchez and Landry 2003; Reche andReinherz 2003).
Most of the polymorphism of the MHC genes isconcentrated in the amino acids responsible for antigenpresentation (the peptide-binding residues (PBRs); Hughes
D. Gómez : P. Conejeros : S. H. MarshallLaboratorio de Genética e Inmunología Molecular,Instituto de Biología, Facultad de Ciencias Básicas y Matemáticas,Pontificia Universidad Católica de Valparaíso,Valparaíso, Chile
S. Consuegra (*)Institute of Biological, Environmental and Rural Sciences,Aberystwyth University,Edward Llwyd Building Penglais Campus,Ceredigion SY23 3DA Wales, UKe-mail: [email protected]
Immunogenetics (2010) 62:531–542DOI 10.1007/s00251-010-0456-x
and Nei 1988, 1989). MHC variability is mainly generatedby point mutation in conjunction with recombination andgene conversion (Belich et al. 1992; Martinsohn et al. 1999;Parham and Ohta 1996; Watkins et al. 1992) andmaintained by balancing selection (Edwards and Hedrick1998; Hedrick 2002; Penn et al. 2002). The products ofboth class I and class II are highly polymorphic in mostspecies (Bernatchez and Landry 2003; Horton et al. 2004;Piertney and Oliver 2006), class IIα can display verydifferent levels of variability among species (Bontrop et al.1999; Stet et al. 2003).
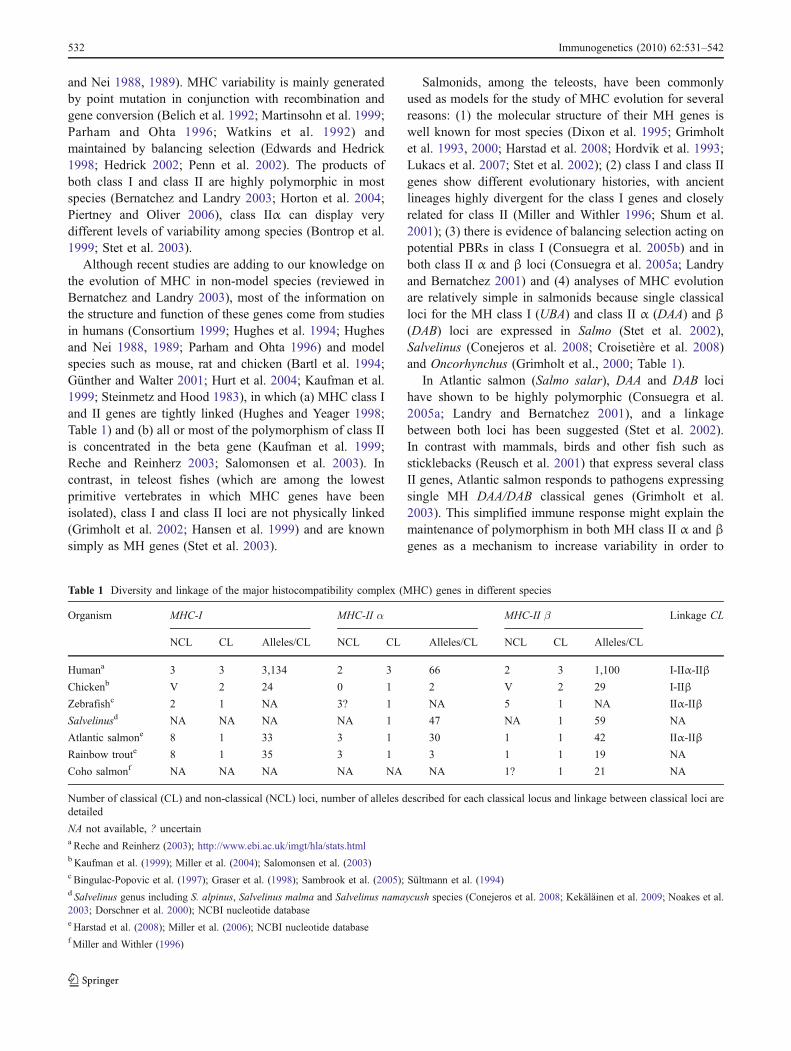
Although recent studies are adding to our knowledge onthe evolution of MHC in non-model species (reviewed inBernatchez and Landry 2003), most of the information onthe structure and function of these genes come from studiesin humans (Consortium 1999; Hughes et al. 1994; Hughesand Nei 1988, 1989; Parham and Ohta 1996) and modelspecies such as mouse, rat and chicken (Bartl et al. 1994;Günther and Walter 2001; Hurt et al. 2004; Kaufman et al.1999; Steinmetz and Hood 1983), in which (a) MHC class Iand II genes are tightly linked (Hughes and Yeager 1998;Table 1) and (b) all or most of the polymorphism of class IIis concentrated in the beta gene (Kaufman et al. 1999;Reche and Reinherz 2003; Salomonsen et al. 2003). Incontrast, in teleost fishes (which are among the lowestprimitive vertebrates in which MHC genes have beenisolated), class I and class II loci are not physically linked(Grimholt et al. 2002; Hansen et al. 1999) and are knownsimply as MH genes (Stet et al. 2003).
Salmonids, among the teleosts, have been commonlyused as models for the study of MHC evolution for severalreasons: (1) the molecular structure of their MH genes iswell known for most species (Dixon et al. 1995; Grimholtet al. 1993, 2000; Harstad et al. 2008; Hordvik et al. 1993;Lukacs et al. 2007; Stet et al. 2002); (2) class I and class IIgenes show different evolutionary histories, with ancientlineages highly divergent for the class I genes and closelyrelated for class II (Miller and Withler 1996; Shum et al.2001); (3) there is evidence of balancing selection acting onpotential PBRs in class I (Consuegra et al. 2005b) and inboth class II α and β loci (Consuegra et al. 2005a; Landryand Bernatchez 2001) and (4) analyses of MHC evolutionare relatively simple in salmonids because single classicalloci for the MH class I (UBA) and class II α (DAA) and β(DAB) loci are expressed in Salmo (Stet et al. 2002),Salvelinus (Conejeros et al. 2008; Croisetière et al. 2008)and Oncorhynchus (Grimholt et al., 2000; Table 1).
In Atlantic salmon (Salmo salar), DAA and DAB locihave shown to be highly polymorphic (Consuegra et al.2005a; Landry and Bernatchez 2001), and a linkagebetween both loci has been suggested (Stet et al. 2002).In contrast with mammals, birds and other fish such assticklebacks (Reusch et al. 2001) that express several classII genes, Atlantic salmon responds to pathogens expressingsingle MH DAA/DAB classical genes (Grimholt et al.2003). This simplified immune response might explain themaintenance of polymorphism in both MH class II α and βgenes as a mechanism to increase variability in order to
Table 1 Diversity and linkage of the major histocompatibility complex (MHC) genes in different species
Organism MHC-I MHC-II α MHC-II β Linkage CL
NCL CL Alleles/CL NCL CL Alleles/CL NCL CL Alleles/CL
Humana 3 3 3,134 2 3 66 2 3 1,100 I-IIα-IIβ
Chickenb V 2 24 0 1 2 V 2 29 I-IIβ
Zebrafishc 2 1 NA 3? 1 NA 5 1 NA IIα-IIβ
Salvelinusd NA NA NA NA 1 47 NA 1 59 NA
Atlantic salmone 8 1 33 3 1 30 1 1 42 IIα-IIβ
Rainbow troute 8 1 35 3 1 3 1 1 19 NA
Coho salmonf NA NA NA NA NA NA 1? 1 21 NA
Number of classical (CL) and non-classical (NCL) loci, number of alleles described for each classical locus and linkage between classical loci aredetailed
NA not available, ? uncertaina Reche and Reinherz (2003); http://www.ebi.ac.uk/imgt/hla/stats.htmlb Kaufman et al. (1999); Miller et al. (2004); Salomonsen et al. (2003)c Bingulac-Popovic et al. (1997); Graser et al. (1998); Sambrook et al. (2005); Sültmann et al. (1994)d Salvelinus genus including S. alpinus, Salvelinus malma and Salvelinus namaycush species (Conejeros et al. 2008; Kekäläinen et al. 2009; Noakes et al.2003; Dorschner et al. 2000); NCBI nucleotide databasee Harstad et al. (2008); Miller et al. (2006); NCBI nucleotide databasef Miller and Withler (1996)
532 Immunogenetics (2010) 62:531–542
respond to a wider array of parasites. High levelsof polymorphism have also been shown for the DABlocus in Oncorhynchus mykiss (Aguilar and Garza 2006)and DAA locus in Salvelinus alpinus (Conejeros et al.2008; Table 1).
Here, we test the hypothesis that polymorphism in theMH class II alpha locus is widespread in salmonids,possibly as a consequence of the expression of single MHclass II classical genes. To do so, we have compared thediversity and molecular mechanisms of evolution of MHclass II α and β loci in farm populations of three salmonidsspecies, two from the genus Oncorhynchus (Oncorhynchuskisutch and O. mykiss) and one from Salmo (S. salar),focusing in the region involved in antigen presentation(PBR). To our knowledge, this is the first study thatsimultaneously compares the diversity and maintenanceof MHC class II α and β polymorphism in the sameorganism.
Materials and methods
Origin of the samples and DNA extraction
Juveniles from three salmonid species were randomlysampled from different hatcheries in Southern Chile: O.kisutch (76 individuals from eight hatcheries), O. mykiss(40 individuals from two hatcheries) and S. salar (27individuals from three hatcheries). The three study speciesare non-native from Chile: O. mykiss was introduced inChile at the end of the nineteenth century mainly forangling purposes, while S. salar and O. kisutch wereintroduced for aquaculture purposes in the late 1970s.Although all salmon stocks in Chile are of foreign origin,most of the eggs currently used for farming are currentlyproduced within the country, with only 12% of stocksimported from northern countries, primarily from Norway(http://www.fao.org/fishery/countrysector/naso_chile/es).
Liver tissue was collected from all the juveniles and keptin 95% ethanol at −20°C until DNA extraction was
performed. DNA from 20 mg of tissue was extracted usingChelex-100 resin (Bio-Rad Laboratories, Hercules, CA,USA) according to the manufacturer’s instructions.
Amplification and identification of MH class II genes
The second exon of the MH class II genes was amplified bypolymerase chain reaction (PCR). For primer design,sequences of the MH class II α (DAA locus) and β (DABlocus), from the Immunological Polymorphism Databasefrom EBI (http://www.ebi.ac.uk), were aligned, and specificprimers were designed based on conserved regions (Table 2).The primers used to amplify O. kisutch and O. mykiss werethe same for both loci spanning a region of 213 bp for theDAA locus and 241 bp for the DAB locus. The regionsamplified in S. salar for the DAA and DAB loci were 303and 311 bp in length, respectively. In every case, a GC clamptail (5′-GCCGCGCCCCGCGCCCGTCCCGCCGCCCCC-3′) was added to the forward or reverse primer to improvethe denaturing gradient gel electrophoresis (DGGE) resolu-tion (Sheffield et al. 1989).
DNA amplifications were carried out in a 40 μL PCRreaction containing 1× PCR reaction buffer, 2 mM MgCl2,250 μM dNTPs, 0.1 μM of each primer, 0.3 units of Taqpolymerase (Invitrogen, Carlsbad, CA, USA) and 400 ng ofDNA, under standard conditions. Results of the amplificationswere visualised in 2% agarose gels and resulted in a singleband of 250–350 bp.
Different alleles of MH class II α and β wereresolved by DGGE using the Dcode™ Universal Muta-tion Detection System (Bio-Rad Laboratories, Hercules,CA, USA). DGGE was performed at 56°C using8% acrylamide/bisacrylamide (37.5:1) parallel gelscontaining 1× TAE buffer and a gradient of urea andformamide (Myers et al. 1987). Gradients of ureaand formamide for each locus were 30–35% for SalmoDAA, 40–50% for Oncorhynchus DAA and 30–40% forOncorhynchus and Salmo DAB. For each sample, 35–40 μL of PCR product were run on the gel for 2–3 h at130 V. Gels were stained with ethidium bromide, and
Table 2 Primer sets used for the amplification of the exon 2 of the major histocompatibility complex class II alpha (DAA) and beta (DAB) genesof Salmo salar, Oncorhynchus kisutch and Oncorhynchus mykiss
Species Locus Forward primer Reverse primer
S. Salar DAA GTGTTTTATTGGGTTTCTTTTCTC CTCTAAATTACTTCTCTCTCTTAC
DAB TCTGTATTATGTTTTCCTTCCa CACCTGTCTTGTCCAGTATGb
O. kisutch and O. mykiss DAA GGATGCAGTGATTCAGATGGAG CTCTGGTGGGTTCTTGTAAG
DAB AGGACCTGCATGGTATAGAG CTTGTCCAGTATGGCGCTGATG
a Primer (3′‐5′) TVS4501 in Langefors et al. (2000)b Primer (3′‐5′) AL1002 in Langefors et al. (2000)
Immunogenetics (2010) 62:531–542 533
DNA was visualised under UV. A maximum of twoalleles were distinguished per each individual, andcharacteristic bands from each different migration speedwere chosen for sequence analysis. The selected fragmentswere excised from the gel, grinded in 100 μL of MilliQwater, and left at 4°C overnight. Ten microlitres ofsupernatant were used as template in a 50 μL PCR withthe same primers used for the first amplification. PCRproducts were purified using the MSB PCRapase kit(Invitek, Berlin, Germany) and resuspended in 15 μL fordirect sequencing using the forward and reverse primers.Sequencing was performed by Macrogen Corporation(Seoul, Korea).
Variability and phylogenetic analysis
Sequences of both MH class II loci for each species weremanually edited and aligned using the ClustalW sub-routineof Bioedit (Hall 1999). Only nucleotide changes found inmore than one individual were considered. The section ofthe sequences binding the primers was not considered in theanalysis, and sequences from S. salar were reduced inlength for inter-specific comparisons, the final length ofthe sequences analysed was 171 bp for the DAA locusand 183 bp for the DAB locus. As in previous studies(Consuegra et al. 2005b), alleles were defined on the basisof deduced amino acid sequence.
Phylogenetic trees for the selection analyses were carriedout using MEGA 4.0 (Tamura et al. 2007). Neighbour-joining trees were constructed using p-distance including allthe amino acids, with bootstrap values obtained after 1,000iterations. Polymorphism and diversity analyses (i.e. numberof segregating sites (S), average non-synonymous andsynonymous distances between alleles (dN & dS), nucleotidediversity (π) and amino acid diversity (AD)) were performedusing MEGA 4.0 (Tamura et al. 2007) and DnaSP v5(Librado and Rozas 2009).
We used the Genetic Algorithm RecombinationDetection (GARD method) from the HYPHY v 0.99+beta package (Kosakovsky Pond et al. 2005) to test forevidence of recombination and DnaSP v5 to estimate theminimum number of recombination events (Rm) in thehistory of the sample (Hudson and Kaplan 1985). Wealso employed LDhat (McVean et al. 2002) to assess theimportance of recombination relative to point mutationin each set of sequences. The Watterson estimate ofpopulation mutation rate per site (θ=4Neμ) and theestimate of population recombination rate for the entiresequence (ρ=4Ner) were calculated for each locus andspecies. A likelihood permutation test for recombinationwas implemented based on the effect of losing theinterchangeable character when recombination occurs(McVean et al. 2002).
Analysis testing for selection
Neutrality test were performed using Fu & Li’s D* and F*test, Tajima’s D test and McDonald and Kreitman testcompiled in the DnaSP v5 Software (Librado and Rozas2009). The three tests were used to test the hypothesis thatall mutations were selectively neutral (Kimura 1983).Tajima’s (1989) test compares the average number ofmutations between pairs of samples against a standardisedmeasure of the number of polymorphic sites in the sample.Fu and Li’s (1993) tests are based on the differencesbetween the numbers of singletons against the total numberof mutations (D* test) or against the average number ofnucleotides differences between pairs of sequences (F*test). McDonald and Kreitman’s (1991) test compares thevariation at synonymous and non-synonymous sites withina species with respect to the divergence between species.
Evidence of positive selection was tested by usingseveral codon-based models in PAML v4.2 (PhylogeneticAnalysis by Maximum Likelihood; Yang 2007). Fivemodels allowing for different levels of selection amongsites were tested: M0 considers a constant substitution rate(w) among all sites, M1 assumes two categories of sites(conserved (w=0) and neutral (w=1)), M2 includes a newcategory of selected sites (w>1) and M7 and M8 assume aheterogeneous w ratio with a continuous beta distributionamong sites, where only the M8 model allows for positivelyselected sites (w>1). Using a likelihood ratio test (LTR=2ΔLnl), we compared the neutral models (M1 and M7)against its nested models allowing for positive selection(M2 and M8). The LRT values were then compared againsta χ2 distribution with degrees of freedom equal to thedifferences in the number of parameters between the twomodels. After that, non-nested selected models werecompared using the Akaike information criteria (AIC=−2(Lnl)+2(number of free parameters of the model) (Akaike1974), and the model minimising this value was consideredthe most appropriate. Finally, the Bayes empirical Bayes(BEB) approach implemented in CODEML was used toidentify the sites under positive selection (p>0.99) definedfor the selected model (Yang et al. 2005).
Two additional codon-based maximum likelihood meth-ods, random effects likelihood (REL) and fixed effectslikelihood (FEL) from the HYPHY v0.99+ beta package(Kosakovsky Pond et al. 2005), were used to identify sitesunder positive or negative selection. The REL method(Nielsen and Yang 1998) uses a fixed distribution ofsubstitution rates across the sequence and then estimatesthe dN/dS values for each site using a Bayes empiricalapproach, while the FEL method (Yang and Swanson 2002)estimates the dN/dS ratios site by site without making anyprevious assumption. A preliminary analysis of nucleotidesubstitution model performed in HYPHY suggested that the
534 Immunogenetics (2010) 62:531–542

F81 model was the one that best fitted all our data, and itwas used for all the selection analyses.
Results and discussion
MH class II α and class II β diversity
A region covering most of the second exon of the MH classII α and β genes was analysed for three salmonid speciesfrom two genera: O. kisutch, O. mykiss and S. salar. Ourresults showed that both class II α and β loci exhibitedhigh polymorphism, in contrast with mammals and birdswhere most or all of the variability is found in class II β(Hughes and Nei 1989; Hughes et al. 2008; Reche andReinherz 2003).
For the alpha gene (DAA locus), we found four differentsequences in O. kisutch, ten in O. mykiss and nine in S. salar,while for the beta gene (DAB locus), the number ofsequences for each species was 8, 11 and 9, respectively.For the DAB locus and Sasa-DAA, most of the alleles foundhad been previously described (Consuegra et al. 2005a;Grimholt et al. 2000; Hordvik et al. 1993; Landry andBernatchez 2001; Langefors et al. 2001; Shum et al. 2001;Stet et al. 2002). In contrast, all the sequences for the O.kisutch and O. mykiss DAA locus were novel, with theexception of Onmy-DAA*0301. The number of alleles foundin S. salar was the same for both MH class II loci, as reportedin previous work (Stet et al. 2002), while O. mykiss and O.kisutch had a higher number of alleles in DAB than in DAA.
We amplified a maximum of two alleles per individual inboth MH class II α and β in the three species analysed,suggesting that the presence of single classical MH class IIα and β genes might not be an exception of the Salmogenus, but could be a common feature in the Salmonidaefamily (Conejeros et al. 2008; Croisetière et al. 2008;Grimholt et al. 2000).
Diversity values estimated for each species and locus(Table 3) displayed higher values for DAB than for DAA inS. salar and O. kisutch, but not in O. mykiss where valueswere higher for DAA. O. kisutch had the lowest diversity ofthe three species for both loci despite having the highestnumber of segregating sites (30 vs. 28) in the DAB locus.Mean amino acid diversity (AD) was higher for DAB thanfor DAA considering all sequences for each locus. ADwithin population (0.097 for DAA and 0.128 for DAB) washigher than AD among populations (0.060 for DAA and0.075 for DAB).
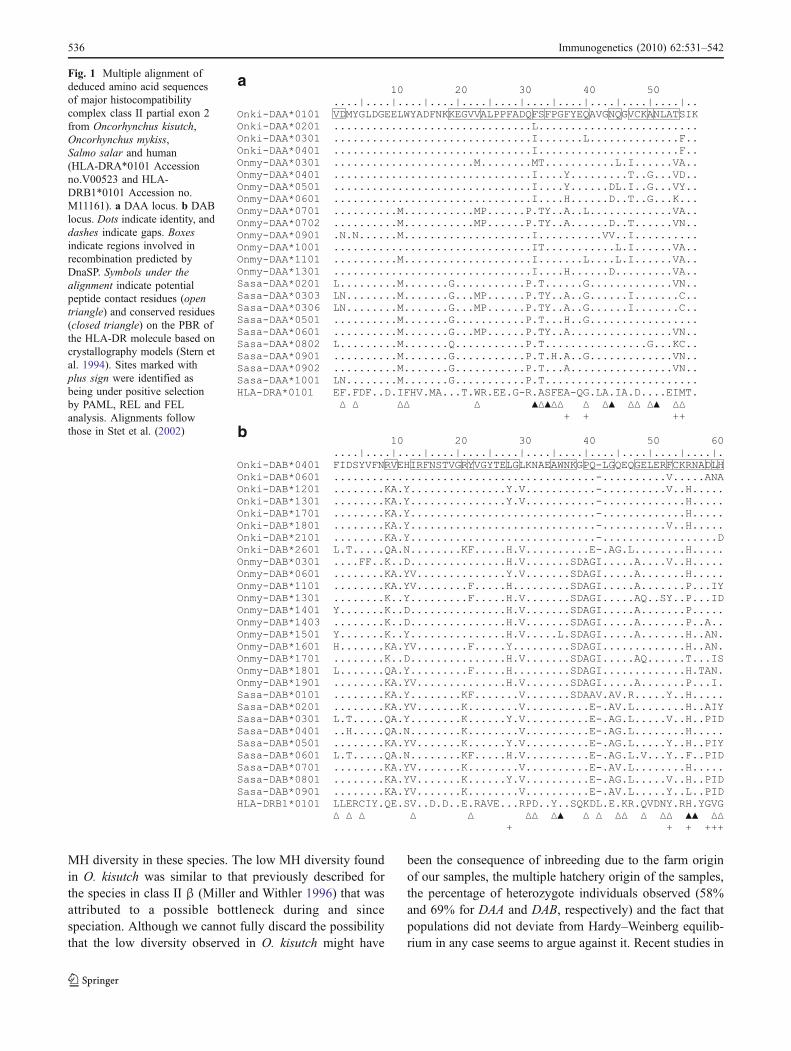
The deduced amino acid sequence alignment of thealleles for each locus (Fig. 1) showed a high level ofpolymorphism for all species and loci with most of thevariable and conserved sites concurrent between the threespecies. Comparative analyses against the human HLA-DR
antigens (Bell et al. 1985; Larhammar et al. 1982) revealedthat many of the salmonids variable sites coincided withamino acid sites previously described to be in direct contactwith presented antigens as part of the PBR (Stern et al.1994), while some putative PBR conserved amino acidsalso seem to agree. This sequence alignment with humanMHC was identical to previously reported by (Stet et al.2002) for the beta chain but has slight differences withrespect to the alpha chain, where salmonids polymorphicsites seem to coincide more with human polymorphisms.
The presence of polymorphic class IIα and class IIβ locusin both Oncorhynchus and Salmo suggests a commonmechanism for maintaining variability at these particularloci. In fact, previous studies in salmonids suggest that mostof the divergence observed in MH class II in presentpopulations could predate the speciation within salmonids(e.g. Conejeros et al. 2008). We found a similar number ofalleles for both DAA and DAB in Atlantic salmon, reflectingthe linkage between both loci previously suggested for thisspecies (Stet et al. 2002). In contrast, there was highernumber of DAB than DAA alleles in O. mykiss and O.kisutch. The presence of more than one DAB locus inOncorhynchus had been previously suggested (Miller andWithler 1996); however, although we could not completelydiscard that our primers did not amplify a second locus, thehigh similarity of the DAB alleles within each species (exceptfor Onki-DAB*2601; Fig. 1) and their grouping in specificclusters (data not shown) does not suggest the presence ofmore than one classical DAB locus in our data.
The levels of polymorphism we found for S. salar andO. mykiss (Table 3) were similar to those from previouslydescribed wild populations (Aguilar and Garza 2006;Consuegra et al. 2005a; Grimholt et al. 2000; Landry andBernatchez 2001; Miller and Withler 1996; Shum et al.2001), suggesting that our database is representative of the
Table 3 Sequence variability at the major histocompatibility complexclass II alpha (DAA) and beta (DAB) loci in Salmo salar (Sasa),Oncorhynchus kisutch (Onki) and Oncorhynchus mykiss (Onmy)
Locus N A S dN dS π AD
Onki-DAA 75 4 4 0.018 0.009 0.016 0.035
Onmy-DAA 40 10 31 0.076 0.048 0.069 0.146
Sasa-DAA 27 9 20 0.067 0.023 0.057 0.109
All DAA* 142 23 41 0.091 0.103 0.094 0.157
Onki-DAB 75 8 30 0.061 0.044 0.057 0.114
Onmy-DAB 40 11 28 0.061 0.016 0.051 0.132
Sasa-DAB 27 9 28 0.075 0.027 0.064 0.138
All DAB* 142 28 51 0.107 0.065 0.097 0.203
N number of individuals, A number of alleles, S number of segregatingsites, dN average non-synonymous distance between alleles, dSaverage synonymous distance between alleles, π nucleotide diversity,AD amino acid diversity
Immunogenetics (2010) 62:531–542 535
MH diversity in these species. The low MH diversity foundin O. kisutch was similar to that previously described forthe species in class II β (Miller and Withler 1996) that wasattributed to a possible bottleneck during and sincespeciation. Although we cannot fully discard the possibilitythat the low diversity observed in O. kisutch might have
been the consequence of inbreeding due to the farm originof our samples, the multiple hatchery origin of the samples,the percentage of heterozygote individuals observed (58%and 69% for DAA and DAB, respectively) and the fact thatpopulations did not deviate from Hardy–Weinberg equilib-rium in any case seems to argue against it. Recent studies in
a
b
Fig. 1 Multiple alignment ofdeduced amino acid sequencesof major histocompatibilitycomplex class II partial exon 2from Oncorhynchus kisutch,Oncorhynchus mykiss,Salmo salar and human(HLA-DRA*0101 Accessionno.V00523 and HLA-DRB1*0101 Accession no.M11161). a DAA locus. b DABlocus. Dots indicate identity, anddashes indicate gaps. Boxesindicate regions involved inrecombination predicted byDnaSP. Symbols under thealignment indicate potentialpeptide contact residues (opentriangle) and conserved residues(closed triangle) on the PBR ofthe HLA-DR molecule based oncrystallography models (Stern etal. 1994). Sites marked withplus sign were identified asbeing under positive selectionby PAML, REL and FELanalysis. Alignments followthose in Stet et al. (2002)
536 Immunogenetics (2010) 62:531–542

Oncorhynchus gilae (Peters and Turner 2008) also showedextremely low levels of polymorphism at the MH class II β(five alleles in 142 individuals), suggesting that specieswith narrow distribution (as it is the case for O. gilae andO. kisutch) may not need to display high diversity as aconsequence of its reduced ecological niche (Van denBerghe and Gross 1989).
Patterns of recombination and selection
We found evidence of recombination in both MH class II αand class II β using three different methods, with theexception of Onki-DAA, where the low number of sequen-ces precluded most analyses (Table 4). The LDhat analysisshowed in all cases that the recombination rate (ρ) in eachspecies and locus exceed the Watterson estimation rate ofmutation (θ), suggesting that recombination is the majorforce shaping the MH class II polymorphism in salmonids,coinciding with previous results in S. salar (Consuegra etal. 2005a). For Onki-DAB, LDhat did not show evidence ofrecombination. These results contrast with the results forthe MH class I in salmonids where mutation is the mainevolutionary force (Consuegra et al. 2005b), suggestingdifferent evolutionary mechanisms for class I and class IIgenes, but similar for both class II α and β. The highoverlap between sites involved in recombination andpositive selected sites (Fig. 1) is consistent with a modelof gene conversion and point mutation acting together inthe generation of polymorphism (Ohta 1995). The mini-mum number of recombination events estimated by theDnaSP software was always greater for the DAB than theDAA locus (Table 4). When all species were analysedtogether, at least seven recombination sites were identifiedin each loci (>60%), all coincident or surrounding sitesunder positive selection (Fig. 1). The GARD analysisidentified only one recombination break point for each
individual set of sequences, except when all sequenceswere pooled together (Table 4). Some of these break pointswere similar between species for the same locus, and allcoincided with recombinant regions detected by DnaSPand/or some with positive selected sites. The estimatednumber of break points was always lower than the numberof minimum recombination events for both loci, possibly asa result of an underestimation by GARD in detectingrecombination based on phylogenetic discordance when thenumber of sequences is low (Kosakovsky Pond et al. 2006).
Tajima’s (1989) D test and Fu & Li’s (1993) D* and F*tests did not reject the null hypothesis of neutrality in anycase. In contrast, the McDonald and Kreitman (1991) test,which compares variation within and between species,rejected the neutral hypothesis for some of our data sets andidentified fixed differences between the Oncorhynchusspecies and S. salar for the DAA locus (Fisher exact testp values, 0.007 and 0.019) but not for the DAB locus(Fisher exact test p values, 0.581 and 0.084). Tajima’s Dand Fu and Li’s tests were not able to reject the hypothesisof neutrality, possibly because they do not considerrecombination as a source of polymorphism (Fu and Li1993; Li et al. 2003). However, results from the McDonaldand Kreitman (1991) test indicated that some of thesequences were not evolving in a neutral fashion. TheMcDonald and Kreitman test compares the numbers ofpolymorphisms (substitutions within species) and fixeddifferences (substitutions between species) as indicators ofevolutionary rates and assumes that mutations occur atdifferent sites in different lineages (Egea et al. 2008). Ourdata suggest that there are significant differences betweenthe Salmo and the Oncorhynchus genera for the DAA locus,but not for the DAB, perhaps due to the similarity betweenthe Onki-DAB*2601 allele and the S. salar sequences.
Positive selection analyses were performed by poolingall the sequences from each locus to increase the power of
Table 4 Results of the recombination analysis using three different programs: DnaSP, GARD and Ldhat
Locus DnaSP Rm GARD BP sites LDhat
θ ρ Lk p Lkmax
Onmy-DAA 5 37 10.96 90 −5,310.70 0.000
Sasa-DAA 3 37 7.36 66 −1,955.19 0.000
All DAA* 9 No 11.11 20 −12,801.72 0.008
Onki-DAB 3 47 11.57 0 −4,944.17 0.647
Onmy-DAB 7 36 9.56 100 −5,562.06 0.001
Sasa-DAB 5 22, 47 10.30 33 −4,859.42 0.000
All DAB* 11 No 13.11 33 −28,611.52 0.000
DnaSP Rm minimum number of recombination events calculated by DnaSp, GARD BP sites breaking point amino acid sites estimated by GARD
Parameters calculated by LDhat are θ=Watterson mutation rate, ρ=population recombination rate, Lk & pLkmax=probabilities resulting fromtesting the null hypothesis of no recombination with a likelihood permutation test (McVean et al. 2002)
Immunogenetics (2010) 62:531–542 537

the tests (Kosakovsky Pond and Frost 2005). A testcomparing different models in PAML (Yang 2007) indicatedthat models that considered selection fitted the data betterthan those considering neutral evolution for both MH class IIα and β loci (Table 5). A further comparison between themodels including positive selection (M2 vs. M8) using theAIC index indicated that M2 is the best model to representthe data in both cases. The M2 model considers three typesof sites: conserved, neutral and under positive selection,consistent with the several interactions that MHC residuesare involved within the MHC molecules, the bindingpeptides and the cell surface receptors (Van den Berg et al.2004). The results from this model suggest that 16% and14% of the sites were under positive selection in DAA (w=7.9) and DAB (w=6.9), respectively. When the analyses wereperformed separated for each species, most of the data fittedto an M2 model as well. The exception was the DAB locusfor O. kisutch for which the test did not show significantevidence of positive selection. The FEL and REL methodsfrom HyPhy software found evidence of positive selection inboth loci when all the sequences for each particular locuswere pooled together (Table 6).
The sites found to be positively selected by the BEBmethod implemented in PAML and the FEL and REL
analysis from HYPHY agree in most cases, showingevidence of positive selection in both MH class II α andβ loci (Table 6). Using the BEB method under the M2model, seven and five sites were identified as being underpositive selection in DAA and DAB, respectively. Fromthese, three and two sites were also identified by the othertwo methods employed. Although the likelihood ratio testcan be affected by high levels of sequence recombinationand M2 model is potentially the most affected, results fromLRT tests are still accurate when less than three recombi-nation events are present in a sample of ten sequences(Anisimova et al. 2003), conditions fulfilled by our datasets. In addition, we used the BEB prediction of selectedsites in PAML, which has proved being more accurate withhigh levels of positive selection (Kosakovsky Pond andFrost 2005), and the concordance between the threemethods of detecting positive selection suggested that ourresults on positive selection are correct and not biassed bylevels of recombination.
Moreover, more than 60% of the identified sites as beingunder positive selection coincided with residues being partof the HLA-DR sequences based on crystallography assays(Stern et al. 1994) or were very close to them (Fig. 1).Comparisons with crystallographic models and high level
Table 5 Random sites model estimates for major histocompatibility complex class II alpha and beta loci
Model All DAA* All DAB*
M0 L=835.338 L=−978.841w=1.239 w=2.579
M1 L=−788.004 L=−953.447p0=0.608 (w0=0.002); p1=0.393; (w1=1) p0=0.561 (w0=0.056); p1=0.439; (w1=1)
M2 L=−754.853 L=−921.953p0=0.552; p1=0.284; p2=0.164; (w2=7.9) p0=0.375; p1=0.483; p2=0.142 (w2=6.9)
M7 L=−787.909 L=−953.565p=0.003 (w=1); q=0.005 p=0.022 (w=1); q=0.027
M8 L=−754.918 L=−921.999p0=0.835; p1=0.166 (w=7.8); p=0.002; q=0.005 p0=0.857; p1=0.143 (w=7.1); p=0.007; q=0.005
Log-likelihood values (L) and estimated parameters for each model were calculated using the CODEML program from PAML v4.2 package
w=dN/dS ratio; p1=fraction of the amino acids following a w distribution; p and q=statistical parameters of the beta distribution
Table 6 Sites under positive selection (p>0.95) identified using three different methods: PAML v 4.2, REL and FEL from the Hyphy v 0.99+beta package
PAML REL FEL
All DAA* 19, 37, 40, 44, 47, 54, 55 37, 54, 55 1*, 23*, 37, 40*, 50*, 54, 55
All DAB* 28, 53, 56, 60, 61 1, 12, 22, 28, 45, 53, 56, 59, 60, 61 53, 59*, 61
Site numbers correspond with those in Fig. 1. Sites in italic were identified by at least two method, while sites in bold were identified by the threeof them
PAML=Bayes empirical Bayes test, p>0.99; REL=Bayes factor>1,000; FEL=p>0.95
*p>0.9
538 Immunogenetics (2010) 62:531–542

of variability have been used as a criterion for identifyingthese critical residues (Reche and Reinherz 2003), butcurrently, models of MH class II proteins for teleost havenot been developed, and most of the predictions are basedon human or mouse 3D structures available in PDBdatabase (www.pdb.org). Our amino acid sequence align-ments (Fig. 1) showed high concordance of conserved andpolymorphic sites between species, reflecting a preservedstructure for the MH peptide-binding region in salmonids.Previous comparisons with human MHC (Bjorkman et al.1987; Stern et al. 1994; Stet et al. 2002) also showed someagreement between polymorphic sites, although thegenetic distance between teleost and humans precludesfirm conclusions regarding the location of functionalPBR sites.
In summary, our results suggest that the observed diversityin the class II α and β sequences may have been to someextent generated by positive selection on the PBR. We alsofound evidence of positive selection when S. salar and O.mykiss were analysed separately but, due to the low numberof sequences, we only considered those results from allspecies pooled and those sites that were identified by allthree methods used (Fig. 1). Sites identified as being underpositive selection when the analysis was performed sepa-rately for each species were similar between species for theDAB locus, while for the DAA locus, the analysis for O.kisutch could not be performed because of the reducednumber of sequences.
Genetic drift as a consequence of population bottleneckscould result in a pattern similar to that of positive selectionboth in the McDonald and Kreitman (1991) test and in themaximum likelihood (Yang 2007) tests that compare theratios between synonymous and non-synonymous substitu-tions. This pattern could explain the absence of significantresults for the DAB locus in the McDonald and Kreitmantest. However, the concordance between the results fromdifferent methodologies and the well-known history ofselection in the MHC genes suggested that the patterns ofpositive selection that we found here are not an artefact andthat the differences between the McDonald and Kreitmanand the maximum likelihood test are only the result ofdifferences in the methodologies. For example, higherratios of non-synonymous to synonymous polymorphismare used by maximum likelihood methods to detect positiveselection, but not by the McDonald and Kreitman test, forwhich the conditions to detect balancing selection are morerestrictive (Li et al. 2008).
Conclusion
This is the first study comparing the variability andmechanisms of molecular evolution of class II α and β
between different genera. We used salmonids as a model forthis study because of the simplicity and ancestry of theirMH structure. We found single classical class II loci in allthe three species of salmonids studied and we also foundhigh polymorphism at both class II α and β genes. Themechanisms of evolution of both class II genes weresimilar, with recombination and point mutation involvedin creating diversity at the PBR and positive selectionmaintaining this diversity, but different from those in classI. These results suggest that the maintenance of variabilityat the class II alpha could be a mechanism to increasediversity in MH class II in salmonids in order tocompensate for the expression of single classical class IIα and β genes.
The nucleotide sequences reported in this paper were registered in theNCBI database under GenBank accession numbers FJ597489-FJ597492, FJ597494, FJ597495, FJ597498, FJ597500, FJ597501,FJ597504, FJ597509, FJ597510, FJ597512, FJ597514, FJ597515,FJ597517- FJ597519, FJ597521-FJ597530, FJ597532- FJ597538,FJ943245-FJ943255 and GQ375895-GQ375899.
Acknowledgments We would like to thank Constanza Cárdenas forher help in the comparative analysis with human MHC. We wouldalso like to thank El Golfo fisheries and ADL Dignostics S.A. forproviding reliable fish samples.
Funding This work was supported by CORFO-Innova (grantnumber PBT-165 to S.M.); D.G. holds a pre-doctoral scholarshipfrom CONICYT, Chile.
References
Aguilar A, Garza JC (2006) A comparison of variability andpopulation structure for major histocompatibility complex andmicrosatellite loci in California coastal steelhead (Oncorhynchusmykiss Walbaum). Mol Ecol 15:923–937
Akaike H (1974) A new look at the statistical model identification.IEEE Trans Automat Contr 19:716–723
Anisimova M, Nielsen R, Yang Z (2003) Effect of recombination onthe accuracy of the likelihood method for detecting positiveselection at amino acid sites. Genetics 164:1229–1236
Bartl S, Baltimore D, Weissman IL (1994) Molecular evolution of thevertebrate immune system. Proc Natl Acad Sci USA 91:10769–10770
Belich M, Madrigal J, Hildebrand W, Zemmour J, Williams R, Luz R,Petzl-Erler M, Parham P (1992) Unusual HLA-B alleles in twotribes of Brazilian Indians. Nature 357:326–329
Bell J, Estess P, John T, Saiki R, Watling D, Erlich H, McDevitt H(1985) DNA sequence and characterization of human class IImajor histocompatibility complex ss chains from the DR1haplotype. Proc Natl Acad Sci USA 82:3405–3409
Bernatchez L, Landry C (2003) MHC studies in nonmodel vertebrates:what have we learned about natural selection in 15 years? J EvolBiol 16:363–377
Bingulac-Popovic J, Figueroa F, Sato A, Talbot W, Johnson S, GatesM, Postlethwait J, Klein J (1997) Mapping of Mhc class I andclass II regions to different linkage groups in the zebrafish, Daniorerio. Immunogenetics 46:129–134
Immunogenetics (2010) 62:531–542 539
Bjorkman PJ, Saper MA, Samraoui B, Bennett WS, Strominger JL,Wiley DC (1987) Structure of the human class I histocompati-bility antigen, HLA-A2. Nature 329:506–512
Bonneaud C, Mazuc J, Chastel O, Westerdahl H, Sorci G (2004)Terminal investment induced by immune challenge and fitnesstraits associated with major histocompatibility complex in thehouse sparrow. Evolution 58:2823–2830
Bontrop RE, Otting N, de Groot NG, Doxiadis GGM (1999) Majorhistocompatibility complex class II polymorphisms in primates.Immunol Rev 167:339–350
Boyson J, Shufflebotham C, Cadavid L, Urvater J, Knapp L, HughesA, Watkins D (1996) The MHC class I genes of the rhesusmonkey. Different evolutionary histories of MHC class I and IIgenes in primates. J Immunol 156:4656–4665
Conejeros P, Phan A, Power M, Alekseyev S, O’Connell M, DempsonB, Dixon B (2008) MH class IIα polymorphism in local andglobal adaptation of Arctic charr (Salvelinus alpinus L.).Immunogenetics 60:325–337
Consortium TMS (1999) Complete sequence and gene map of ahuman major histocompatibility complex. Nature 401:921–923
Consuegra S, Megens HJ, Leon K, Stet RJM, Jordan WC (2005a)Patterns of variability at the major histocompatibility class IIalpha locus in Atlantic salmon contrast with those at the class Ilocus. Immunogenetics 57:16–24
Consuegra S, Megens HJ, Schaschl H, Leon K, Stet RJM, Jordan WC(2005b) Rapid evolution of the MH class I locus results indifferent allelic compositions in recently diverged populations ofatlantic salmon. Mol Biol Evol 22:1095–1106
Croisetière S, Tarte P, Bernatchez L, Belhumeur P (2008) Identifica-tion of MHC class II resistance/susceptibility alleles to Aero-monas salmonicida in brook charr (Salvelinus fontinalis). MolImmunol 45:3107–3116
Dixon B, van Erp S, Rodrigues P, Egberts E, Stet R (1995) Fish majorhistocompatibility complex genes: an expansion. Dev CompImmunol 19:109–133
Dorschner M, Duris T, Bronte C, Burnham Curtis M, Phillips R(2000) High levels of MHC class II allelic diversity in lake troutfrom Lake Superior. J Hered 91:359
Edwards SV, Hedrick PW (1998) Evolution and ecology of MHCmolecules: from genomics to sexual selection. Trends Ecol Evol13:305–311
Egea R, Casillas S, Barbadilla A (2008) Standard and generalizedMcDonald-Kreitman test: a website to detect selection bycomparing different classes of DNA sites. Nucleic Acids Res36:W157–W162
Flajnik M, Ohta Y, Namikawa-Yamada C, Nonaka M (1999) Insightinto the primordial MHC from studies in ectothermic vertebrates.Immunol Rev 167:59
Fu Y, Li W (1993) Statistical tests of neutrality of mutations. Genetics133:693–709
Garrigan D, Hedrick PW (2003) Perspective: detecting adaptivemolecular polymorphism: lessons from the MHC. Evolution57:1707–1722
Graser R, Vincek V, Takami K, Klein J (1998) Analysis of zebrafishMhc using BAC clones. Immunogenetics 47:318–325
Grimholt U, Hordvik I, Fosse VM, Olsaker I, Endresen C, Lie Ø(1993) Molecular cloning of major histocompatibility complexclass I cDNAs from Atlantic salmon (Salmo salar). Immunogenetics37:469–473
Grimholt U, Getahun A, Hermsen T, Stet RJM (2000) The majorhistocompatibility class II alpha chain in salmonid fishes. DevComp Immunol 24:751–763
Grimholt U, Drabløs F, Jørgensen S, Høyheim B, Stet R (2002) Themajor histocompatibility class I locus in Atlantic salmon (Salmosalar L.): polymorphism, linkage analysis and protein modelling.Immunogenetics 54:570–581
Grimholt U, Larsen S, Nordmo R, Midtlyng P, Kjoeglum S, Storset A,Saebo S, Stet RJM (2003) MHC polymorphism and diseaseresistance in Atlantic salmon (Salmo salar); facing pathogenswith single expressed major histocompatibility class I and class IIloci. Immunogenetics 55:210–219
Günther E, Walter L (2001) The major histocompatibility complex ofthe rat (Rattus norvegicus). Immunogenetics 53:520–542
Hall T (1999) BioEdit: a user-friendly biological sequence alignmenteditor and analysis program for Windows 95/98/NT. NucleicAcids Symp Ser 41:95–98
Hansen J, Strassburger P, Thorgaard G, Young W, Du Pasquier L(1999) Expression, linkage, and polymorphism of MHC-relatedgenes in rainbow trout, Oncorhynchus mykiss. J Immunol163:774
Harstad H, Lukacs M, Bakke H, Grimholt U (2008) Multiple expressedMHC class II loci in salmonids; details of one non-classical region inAtlantic salmon (Salmo salar). BMC Genomics 9:193
Hedrick PW (2002) Pathogen resistance and genetic variation at MHCloci. Evolution 56:1902–1908
Hordvik I, Grimholt U, Fosse VM, Lie Ø, Endresen C (1993) Cloningand sequence analysis of cDNAs encoding the MHC class II βchain in Atlantic salmon (Salmo salar). Immunogenetics 37:437–441
Horton R, Wilming L, Rand V, Lovering R, Bruford E, Khodiyar V,Lush M, Povey S, Talbot C, Wright M (2004) Gene map of theextended human MHC. Nat Rev Genet 5:889–899
Hudson R, Kaplan N (1985) Statistical properties of the number ofrecombination events in the history of a sample of DNA sequences.Genetics 111:147–164
Hughes AL, Nei M (1988) Pattern of nucleotide substitution at majorhistocompatibility complex class I loci reveals overdominantselection. Nature 335:167–170
Hughes AL, Nei M (1989) Nucleotide substitution at majorhistocompatibility complex class II loci: evidence for overdominantselection. Proc Natl Acad Sci USA 86:958–962
Hughes AL, Yeager M (1998) Natural selection at the majorhistocompatibility complex loci of vertebrates. Annu Rev Genet32:415–435
Hughes AL, Hughes MK, Howell CY, Nei M (1994) Natural selectionat the class II major histocompatibility complex loci of mammals.Philos Trans R Soc Lond 345:359–367
Hughes C, Miles S, Walbroehl J (2008) Support for the minimalessential MHC hypothesis: a parrot with a single, highlypolymorphic MHC class II B gene. Immunogenetics 60:219–231
Hurt P, Walter L, Sudbrak R, Klages S, Muller I, Shiina T, Inoko H,Lehrach H, Günther E, Reinhardt R, Himmelbauer H (2004) Thegenomic sequence and comparative analysis of the rat majorhistocompatibility complex. Genome Res 14:631–639
Kaufman J, Milne S, Göbel T, Walker B, Jacob J, Auffray C, ZoorobR, Beck S (1999) The chicken B locus is a minimal essentialmajor histocompatibility complex. Nature 401:923–925
Kekäläinen J, Vallunen J, Primmer C, Rättyä J, Taskinen J (2009)Signals of major histocompatibility complex overdominance in awild salmonid population. Proc Biol Sci 276:3133–3140
Kimura M (1983) The neutral theory of molecular evolution.Cambridge University Press, Cambridge
Klein J (1986) Natural history of the major histocompatibilitycomplex. Wiley, New York
Kosakovsky Pond S, Frost S (2005) Not so different after all: acomparison of methods for detecting amino acid sites underselection. Mol Biol Evol 22:1208–1222
Kosakovsky Pond S, Frost S, Muse S (2005) HyPhy: hypothesistesting using phylogenies. Bioinformatics 21:676–679
Kosakovsky Pond SL, Posada D, Gravenor MB, Woelk CH, FrostSDW (2006) GARD: a genetic algorithm for recombinationdetection. Bioinformatics 22:3096–3098
540 Immunogenetics (2010) 62:531–542
Kruiswijk CP, Hermsen T, van Heerwaarden J, Dixon B, SavelkoulHFJ, Stet RJM (2005) Major histocompatibility genes in the LakeTana African large barb species flock: evidence for completepartitioning of class II B, but not class I, genes among differentspecies. Immunogenetics 56:894–908
Landry C, Bernatchez L (2001) Comparative analysis of populationstructure across environments and geographical scales at majorhistocompatibility complex and microsatellite loci in Atlanticsalmon (Salmo salar). Mol Ecol 10:2525–2539
Langefors Å, Lohm J, Von Schantz T, Grahn M (2000) Screening ofMhc variation in Atlantic salmon (Salmo salar): a comparison ofrestriction fragment length polymorphism (RFLP), denaturinggradient gel electrophoresis (DGGE) and sequencing. Mol Ecol9:215–219
Langefors Å, Lohm J, Grahn M, Andersen O, Von Schantz T (2001)Association between major histocompatibility complex class IIBalleles and resistance to Aeromonas salmonicida in Atlanticsalmon. Philos Trans R Soc Lond 268:479–485
Larhammar D, Schenning L, Gustafsson K, Wiman K, Claesson L,Rask L, Peterson P (1982) Complete amino acid sequence of anHLA-DR antigen-like ss chain as predicted from the nucleotidesequence: similarities with immunoglobulins and HLA-A,-B,and-C antigens. Proc Natl Acad Sci USA 79:3687–3691
Li H, Zhang Y, Zhang Y, Fu Y (2003) Neutrality tests using DNApolymorphism from multiple samples. Genetics 163:1147–1151
Li Y, Costello J, Holloway A, Hahn M, Rausher M (2008) “Reverseecology” and the power of population genomics. Evolution62:2984–2994
Librado P, Rozas J (2009) DnaSP v5: a software for comprehensiveanalysis of DNA polymorphism data. Bioinformatics 25:1451
Lukacs M, Harstad H, Grimholt U, Beetz-Sargent M, Cooper G, ReidL, Bakke H, Phillips R, Miller K, Davidson W, Koop B (2007)Genomic organization of duplicated major histocompatibilitycomplex class I regions in Atlantic salmon (Salmo salar). BMCGenomics 8:251–267
Martinsohn J, Sousa A, Guethlein L, Howard J (1999) The geneconversion hypothesis of MHC evolution: a review. Immunogenetics50:168–200
McDonald J, Kreitman M (1991) Adaptive protein evolution at theAdh locus in Drosophila. Nature 351:652–654
McVean G, Awadalla P, Fearnhead P (2002) A coalescent-basedmethod for detecting and estimating recombination from genesequences. Genetics 160:1231–1241
Miller K, Withler R (1996) Sequence analysis of a polymorphic Mhcclass II gene in Pacific salmon. Immunogenetics 43:337–351
Miller M, Bacon L, Hala K, Hunt H, Ewald S, Kaufman J, Zoorob R,Briles W (2004) Nomenclature for the chicken major histocom-patibility (B and Y) complex. Immunogenetics 56:261–279
Miller K, Li S, Ming T, Kaukinen K, Schulze A (2006) The salmonidMHC class I: more ancient loci uncovered. Immunogenetics58:571–589
Myers R, Maniatis T, Lerman L (1987) Detection and localization ofsingle base changes by denaturing gradient gel electrophoresis.Meth Enzymol 155:501–527
Nielsen R, Yang Z (1998) Likelihood models for detecting positivelyselected amino acid sites and applications to the HIV-1 envelopegene. Genetics 148:929–936
Noakes M, Reimer T, Phillips R (2003) Genotypic characterization of anMHC class II locus in Lake Trout (Salvelinus namaycush) from lakesuperior by single-stranded conformational polymorphism analysisand reference strand–mediated conformational analysis. MarBiotechnol 5:270–278
Ohta T (1995) Gene conversion vs point mutation in generatingvariability at the antigen recognition site of major histocompat-ibility complex loci. J Mol Evol 41:115–119
Parham P, Ohta T (1996) Population biology of antigen presentationby MHC Class I molecules. Science 272:67–74
Penn DJ, Damjanovich K, Potts WK (2002) MHC heterozygosityconfers a selective advantage against multiple-strain infections.Proc Natl Acad Sci USA 99:11260–11264
Peters M, Turner T (2008) Genetic variation of the major histocom-patibility complex (MHC class II β gene) in the threatenedGila trout. Oncorhynchus gilae gilae. Conserv Genet 9:257–270
Piertney SB, Oliver MK (2006) The evolutionary ecology of the majorhistocompatibility complex. Heredity 96:7–21
Reche P, Reinherz E (2003) Sequence variability analysis of humanclass I and class II MHC molecules: functional and structuralcorrelates of amino acid polymorphisms. J Mol Biol 331:623–641
Reusch TBH, Wegner KM, Kalbe M (2001) Rapid genetic divergencein postglacial populations of threespine stickleback (Gasterosteusaculeatus): the role of habitat type, drainage, and geographicproximity. Mol Ecol 10:2435–2446
Salomonsen J, Marston D, Avila D, Bumstead N, Johansson B, Juul-Madsen H, Olesen G, Riegert P, Skjødt K, Vainio O (2003) Theproperties of the single chicken MHC classical class II a chain(B-LA) gene indicate an ancient origin for the DR/E-like isotypeof class II molecules. Immunogenetics 55:605–614
Sambrook J, Figueroa F, Beck S (2005) A genome-wide survey ofmajor histocompatibility complex (MHC) genes and theirparalogues in zebrafish. BMC Genomics 6:152
Sheffield V, Cox D, Lerman L, Myers R (1989) Attachment of a40-base-pair G+C-rich sequence (GC-clamp) to genomic DNAfragments by the polymerase chain reaction results in improveddetection of single-base changes. Proc Natl Acad Sci USA86:232–236
Shum B, Guethlein L, Flodin L, Adkison M, Hedrick R, Nehring R,Stet R, Secombes C, Parham P (2001) Modes of salmonid MHCClass I and II evolution differ from the primate paradigm 1. JImmunol 166:3297–3308
Steinmetz M, Hood L (1983) Genes of the major histocompatibilitycomplex in mouse and man. Science 222:727–733
Stern LJ, Brown JH, Jardetzky TS, Gorga JC, Urban RG, StromingerJL, Wiley DC (1994) Crystal structure of the human class IIMHC protein HLA-DR1 complexed with an influenza viruspeptide. Nature 368:215–221
Stet R, de Vries B, Mudde K, Hermsen T, van Heerwaarden J, ShumB, Grimholt U (2002) Unique haplotypes of co-segregating majorhistocompatibility class II A and class II B alleles in Atlanticsalmon (Salmo salar) give rise to diverse class II genotypes.Immunogenetics 54:320–331
Stet R, Kruiswijk C, Dixon B (2003) Major histocompatibilitylineages and immune gene function in teleost fishes: the roadnot taken. Crit Rev Immunol 23:441–471
Sültmann H, Mayer W, Figueroa F, O’hUigin C, Klein J (1994)Organization of Mhc class II B genes in the zebrafish(Brachydanio rerio). Genomics 23:1–14
Tajima F (1989) Statistical method for testing the neutral mutationhypothesis by DNA polymorphism. Genetics 123:585–595
Takahata N (1990) A simple genealogical structure of stronglybalanced allelic lines and trans-species evolution of polymorphism.Proc Natl Acad Sci USA 87:2419–2423
Tamura K, Dudley J, Nei M, Kumar S (2007) MEGA4: molecularevolutionary genetics analysis (MEGA) software version 4.0.Mol Biol Evol 24:1596–1599
Trowsdale J, Parham P (2004) Mini-review: defense strategies andimmunity-related genes. Eur J Immunol 34:7–17
Van den Berg T, Yoder J, Litman G (2004) On the origins of adaptiveimmunity: innate immune receptors join the tale. TrendsImmunol 25:11–16
Immunogenetics (2010) 62:531–542 541

Van den Berghe E, Gross M (1989) Natural selection resulting fromfemale breeding competition in a Pacific salmon (coho: Oncorhyn-chus kisutch). Evolution 43:125–140
Watkins D, McAdam S, Liu X, Strang C, Milford E, Levine C,Garber T, Dogon A, Lord C, Ghim S (1992) New recombinantHLA-B alleles in a tribe of South American Amerindiansindicate rapid evolution of MHC class I loci. Nature 357:329–333
Yang Z (2007) PAML 4: phylogenetic analysis by maximumlikelihood. Mol Biol Evol 24:1586–1591
Yang Z, Swanson W (2002) Codon-substitution models to detectadaptive evolution that account for heterogeneous selectivepressures among site classes. Mol Biol Evol 19:49–57
Yang Z, Wong W, Nielsen R (2005) Bayes empirical bayes inferenceof amino acid sites under positive selection. Mol Biol Evol22:1107–1118
542 Immunogenetics (2010) 62:531–542