Measurement of the B0 Production Cross Section in pp Collisions at s=7TeV
arX
iv:h
ep-e
x/05
0600
1v2
10
Aug
200
5
FERMILAB-PUB-05-220-E
Measurement of the tt Production Cross Section in pp Collisions at√
s = 1.96 TeV
Using Lepton Plus Jets Events with Semileptonic B Decays to Muons
D. Acosta,16 J. Adelman,12 T. Affolder,9 T. Akimoto,54 M.G. Albrow,15 D. Ambrose,15 S. Amerio,42 D. Amidei,33
A. Anastassov,50 K. Anikeev,15 A. Annovi,44 J. Antos,1 M. Aoki,54 G. Apollinari,15 T. Arisawa,56 J-F. Arguin,32
A. Artikov,13 W. Ashmanskas,15 A. Attal,7 F. Azfar,41 P. Azzi-Bacchetta,42 N. Bacchetta,42 H. Bachacou,28
W. Badgett,15 A. Barbaro-Galtieri,28 G.J. Barker,25 V.E. Barnes,46 B.A. Barnett,24 S. Baroiant,6 G. Bauer,31
F. Bedeschi,44 S. Behari,24 S. Belforte,53 G. Bellettini,44 J. Bellinger,58 A. Belloni,31 E. Ben-Haim,15 D. Benjamin,14
A. Beretvas,15 T. Berry,29 A. Bhatti,48 M. Binkley,15 D. Bisello,42 M. Bishai,15 R.E. Blair,2 C. Blocker,5
K. Bloom,33 B. Blumenfeld,24 A. Bocci,48 A. Bodek,47 G. Bolla,46 A. Bolshov,31 D. Bortoletto,46 J. Boudreau,45
S. Bourov,15 B. Brau,9 C. Bromberg,34 E. Brubaker,12 J. Budagov,13 H.S. Budd,47 K. Burkett,15 G. Busetto,42
P. Bussey,19 K.L. Byrum,2 S. Cabrera,14 M. Campanelli,18 M. Campbell,33 F. Canelli,7 A. Canepa,46 M. Casarsa,53
D. Carlsmith,58 R. Carosi,44 S. Carron,14 M. Cavalli-Sforza,3 A. Castro,4 P. Catastini,44 D. Cauz,53 A. Cerri,28
L. Cerrito,41 J. Chapman,33 Y.C. Chen,1 M. Chertok,6 G. Chiarelli,44 G. Chlachidze,13 F. Chlebana,15 I. Cho,27
K. Cho,27 D. Chokheli,13 J.P. Chou,20 S. Chuang,58 K. Chung,11 W-H. Chung,58 Y.S. Chung,47 M. Cijliak,44
C.I. Ciobanu,23 M.A. Ciocci,44 A.G. Clark,18 D. Clark,5 M. Coca,14 A. Connolly,28 M. Convery,48 J. Conway,6
B. Cooper,30 K. Copic,33 M. Cordelli,17 G. Cortiana,42 J. Cranshaw,52 J. Cuevas,10 A. Cruz,16 R. Culbertson,15
C. Currat,28 D. Cyr,58 D. Dagenhart,5 S. Da Ronco,42 S. D’Auria,19 P. de Barbaro,47 S. De Cecco,49 A. Deisher,28
G. De Lentdecker,47 M. Dell’Orso,44 S. Demers,47 L. Demortier,48 M. Deninno,4 D. De Pedis,49 P.F. Derwent,15
C. Dionisi,49 J.R. Dittmann,15 P. DiTuro,50 C. Dorr,25 A. Dominguez,28 S. Donati,44 M. Donega,18 J. Donini,42
M. D’Onofrio,18 T. Dorigo,42 K. Ebina,56 J. Efron,38 J. Ehlers,18 R. Erbacher,6 M. Erdmann,25 D. Errede,23
S. Errede,23 R. Eusebi,47 H-C. Fang,28 S. Farrington,29 I. Fedorko,44 W.T. Fedorko,12 R.G. Feild,59
M. Feindt,25 J.P. Fernandez,46 R.D. Field,16 G. Flanagan,34 L.R. Flores-Castillo,45 A. Foland,20 S. Forrester,6
G.W. Foster,15 M. Franklin,20 J.C. Freeman,28 Y. Fujii,26 I. Furic,12 A. Gajjar,29 M. Gallinaro,48 J. Galyardt,11
M. Garcia-Sciveres,28 A.F. Garfinkel,46 C. Gay,59 H. Gerberich,14 D.W. Gerdes,33 E. Gerchtein,11 S. Giagu,49
P. Giannetti,44 A. Gibson,28 K. Gibson,11 C. Ginsburg,15 K. Giolo,46 M. Giordani,53 M. Giunta,44
G. Giurgiu,11 V. Glagolev,13 D. Glenzinski,15 M. Gold,36 N. Goldschmidt,33 D. Goldstein,7 J. Goldstein,41
G. Gomez,10 G. Gomez-Ceballos,10 M. Goncharov,51 O. Gonzalez,46 I. Gorelov,36 A.T. Goshaw,14 Y. Gotra,45
K. Goulianos,48 A. Gresele,42 M. Griffiths,29 C. Grosso-Pilcher,12 U. Grundler,23 J. Guimaraes da Costa,20
C. Haber,28 K. Hahn,43 S.R. Hahn,15 E. Halkiadakis,47 A. Hamilton,32 B-Y. Han,47 R. Handler,58 F. Happacher,17
K. Hara,54 M. Hare,55 R.F. Harr,57 R.M. Harris,15 F. Hartmann,25 K. Hatakeyama,48 J. Hauser,7 C. Hays,14
H. Hayward,29 B. Heinemann,29 J. Heinrich,43 M. Hennecke,25 M. Herndon,24 C. Hill,9 D. Hirschbuehl,25
A. Hocker,15 K.D. Hoffman,12 A. Holloway,20 S. Hou,1 M.A. Houlden,29 B.T. Huffman,41 Y. Huang,14
R.E. Hughes,38 J. Huston,34 K. Ikado,56 J. Incandela,9 G. Introzzi,44 M. Iori,49 Y. Ishizawa,54 C. Issever,9
A. Ivanov,6 Y. Iwata,22 B. Iyutin,31 E. James,15 D. Jang,50 B. Jayatilaka,33 D. Jeans,49 H. Jensen,15 E.J. Jeon,27
M. Jones,46 K.K. Joo,27 S.Y. Jun,11 T. Junk,23 T. Kamon,51 J. Kang,33 M. Karagoz Unel,37 P.E. Karchin,57
Y. Kato,40 Y. Kemp,25 R. Kephart,15 U. Kerzel,25 V. Khotilovich,51 B. Kilminster,38 D.H. Kim,27 H.S. Kim,23
J.E. Kim,27 M.J. Kim,11 M.S. Kim,27 S.B. Kim,27 S.H. Kim,54 Y.K. Kim,12 M. Kirby,14 L. Kirsch,5 S. Klimenko,16
M. Klute,31 B. Knuteson,31 B.R. Ko,14 H. Kobayashi,54 D.J. Kong,27 K. Kondo,56 J. Konigsberg,16 K. Kordas,32
A. Korn,31 A. Korytov,16 A.V. Kotwal,14 A. Kovalev,43 J. Kraus,23 I. Kravchenko,31 A. Kreymer,15 J. Kroll,43
M. Kruse,14 V. Krutelyov,51 S.E. Kuhlmann,2 S. Kwang,12 A.T. Laasanen,46 S. Lai,32 S. Lami,44 S. Lammel,15
M. Lancaster,30 R. Lander,6 K. Lannon,38 A. Lath,50 G. Latino,44 I. Lazzizzera,42 C. Lecci,25 T. LeCompte,2
J. Lee,27 J. Lee,47 S.W. Lee,51 R. Lefevre,3 N. Leonardo,31 S. Leone,44 S. Levy,12 J.D. Lewis,15 K. Li,59
C. Lin,59 C.S. Lin,15 M. Lindgren,15 E. Lipeles,8 T.M. Liss,23 A. Lister,18 D.O. Litvintsev,15 T. Liu,15 Y. Liu,18
N.S. Lockyer,43 A. Loginov,35 M. Loreti,42 P. Loverre,49 R-S. Lu,1 D. Lucchesi,42 P. Lujan,28 P. Lukens,15
G. Lungu,16 L. Lyons,41 J. Lys,28 R. Lysak,1 E. Lytken,46 D. MacQueen,32 R. Madrak,15 K. Maeshima,15
P. Maksimovic,24 G. Manca,29 Margaroli,4 R. Marginean,15 C. Marino,23 A. Martin,59 M. Martin,24 V. Martin,37
M. Martınez,3 T. Maruyama,54 H. Matsunaga,54 M. Mattson,57 P. Mazzanti,4 K.S. McFarland,47 D. McGivern,30
P.M. McIntyre,51 P. McNamara,50 McNulty,29 A. Mehta,29 S. Menzemer,31 A. Menzione,44 P. Merkel,46
2
C. Mesropian,48 A. Messina,49 T. Miao,15 N. Miladinovic,5 J. Miles,31 L. Miller,20 R. Miller,34 J.S. Miller,33
C. Mills,9 R. Miquel,28 S. Miscetti,17 G. Mitselmakher,16 A. Miyamoto,26 N. Moggi,4 B. Mohr,7 R. Moore,15
M. Morello,44 P.A. Movilla Fernandez,28 J. Muelmenstaedt,28 A. Mukherjee,15 M. Mulhearn,31 T. Muller,25
R. Mumford,24 A. Munar,43 P. Murat,15 J. Nachtman,15 S. Nahn,59 I. Nakano,39 A. Napier,55 R. Napora,24
D. Naumov,36 V. Necula,16 T. Nelson,15 C. Neu,43 M.S. Neubauer,8 J. Nielsen,28 T. Nigmanov,45 L. Nodulman,2
O. Norniella,3 T. Ogawa,56 S.H. Oh,14 Y.D. Oh,27 T. Ohsugi,22 T. Okusawa,40 R. Oldeman,29 R. Orava,21
W. Orejudos,28 K. Osterberg,21 C. Pagliarone,44 E. Palencia,10 R. Paoletti,44 V. Papadimitriou,15
A.A. Paramonov,12 S. Pashapour,32 J. Patrick,15 G. Pauletta,53 M. Paulini,11 C. Paus,31 D. Pellett,6 A. Penzo,53
T.J. Phillips,14 G. Piacentino,44 J. Piedra,10 K.T. Pitts,23 C. Plager,7 L. Pondrom,58 G. Pope,45 X. Portell,3
O. Poukhov,13 N. Pounder,41 F. Prakoshyn,13 A. Pronko,16 J. Proudfoot,2 F. Ptohos,17 G. Punzi,44
J. Rademacker,41 M.A. Rahaman,45 A. Rakitine,31 S. Rappoccio,20 F. Ratnikov,50 H. Ray,33 B. Reisert,15
V. Rekovic,36 P. Renton,41 M. Rescigno,49 F. Rimondi,4 K. Rinnert,25 L. Ristori,44 W.J. Robertson,14 A. Robson,19
T. Rodrigo,10 S. Rolli,55 R. Roser,15 R. Rossin,16 C. Rott,46 J. Russ,11 V. Rusu,12 A. Ruiz,10 D. Ryan,55
H. Saarikko,21 S. Sabik,32 A. Safonov,6 R. St. Denis,19 W.K. Sakumoto,47 G. Salamanna,49 D. Saltzberg,7
C. Sanchez,3 L. Santi,53 S. Sarkar,49 K. Sato,54 P. Savard,32 A. Savoy-Navarro,15 P. Schlabach,15 E.E. Schmidt,15
M.P. Schmidt,59 M. Schmitt,37 T. Schwarz,33 L. Scodellaro,10 A.L. Scott,9 A. Scribano,44 F. Scuri,44 A. Sedov,46
S. Seidel,36 Y. Seiya,40 A. Semenov,13 F. Semeria,4 L. Sexton-Kennedy,15 I. Sfiligoi,17 M.D. Shapiro,28 T. Shears,29
P.F. Shepard,45 D. Sherman,20 M. Shimojima,54 M. Shochet,12 Y. Shon,58 I. Shreyber,35 A. Sidoti,44 A. Sill,52
P. Sinervo,32 A. Sisakyan,13 J. Sjolin,41 A. Skiba,25 A.J. Slaughter,15 K. Sliwa,55 D. Smirnov,36 J.R. Smith,6
F.D. Snider,15 R. Snihur,32 M. Soderberg,33 A. Soha,6 S.V. Somalwar,50 J. Spalding,15 M. Spezziga,52 F. Spinella,44
P. Squillacioti,44 H. Stadie,25 M. Stanitzki,59 B. Stelzer,32 O. Stelzer-Chilton,32 D. Stentz,37 J. Strologas,36
D. Stuart,9 J. S. Suh,27 A. Sukhanov,16 K. Sumorok,31 H. Sun,55 T. Suzuki,54 A. Taffard,23 R. Tafirout,32
H. Takano,54 R. Takashima,39 Y. Takeuchi,54 K. Takikawa,54 M. Tanaka,2 R. Tanaka,39 N. Tanimoto,39
M. Tecchio,33 P.K. Teng,1 K. Terashi,48 R.J. Tesarek,15 S. Tether,31 J. Thom,15 A.S. Thompson,19 E. Thomson,43
P. Tipton,47 V. Tiwari,11 S. Tkaczyk,15 D. Toback,51 K. Tollefson,34 T. Tomura,54 D. Tonelli,44 M. Tonnesmann,34
S. Torre,44 D. Torretta,15 S. Tourneur,15 W. Trischuk,32 R. Tsuchiya,56 S. Tsuno,39 D. Tsybychev,16 N. Turini,44
F. Ukegawa,54 T. Unverhau,19 S. Uozumi,54 D. Usynin,43 L. Vacavant,28 A. Vaiciulis,47 A. Varganov,33
S. Vejcik III,15 G. Velev,15 V. Veszpremi,46 G. Veramendi,23 T. Vickey,23 R. Vidal,15 I. Vila,10 R. Vilar,10
I. Vollrath,32 I. Volobouev,28 M. von der Mey,7 P. Wagner,51 R.G. Wagner,2 R.L. Wagner,15 W. Wagner,25
R. Wallny,7 T. Walter,25 Z. Wan,50 M.J. Wang,1 S.M. Wang,16 A. Warburton,32 B. Ward,19 S. Waschke,19
D. Waters,30 T. Watts,50 M. Weber,28 W.C. Wester III,15 B. Whitehouse,55 D. Whiteson,43 A.B. Wicklund,2
E. Wicklund,15 H.H. Williams,43 P. Wilson,15 B.L. Winer,38 P. Wittich,43 S. Wolbers,15 C. Wolfe,12 M. Wolter,55
M. Worcester,7 S. Worm,50 T. Wright,33 X. Wu,18 F. Wurthwein,8 A. Wyatt,30 A. Yagil,15 T. Yamashita,39
K. Yamamoto,40 J. Yamaoka,50 C. Yang,59 U.K. Yang,12 W. Yao,28 G.P. Yeh,15 J. Yoh,15 K. Yorita,56 T. Yoshida,40
I. Yu,27 S. Yu,43 J.C. Yun,15 L. Zanello,49 A. Zanetti,53 I. Zaw,20 F. Zetti,44 J. Zhou,50 and S. Zucchelli4
(CDF Collaboration)1Institute of Physics, Academia Sinica, Taipei, Taiwan 11529,Republic of China
2Argonne National Laboratory, Argonne, Illinois 604393Institut de Fisica d’Altes Energies, Universitat Autonoma de Barcelona, E-08193, Bellaterra (Barcelona), Spain
4Istituto Nazionale di Fisica Nucleare, University of Bologna, I-40127 Bologna, Italy5Brandeis University, Waltham, Massachusetts 02254
6University of California, Davis, Davis, California 956167University of California, Los Angeles, Los Angeles, California 90024
8University of California, San Diego, La Jolla, California 920939University of California, Santa Barbara, Santa Barbara, California 93106
10Instituto de Fisica de Cantabria, CSIC-University of Cantabria, 39005 Santander, Spain11Carnegie Mellon University, Pittsburgh, PA 15213
12Enrico Fermi Institute, University of Chicago, Chicago, Illinois 6063713Joint Institute for Nuclear Research, RU-141980 Dubna, Russia
14Duke University, Durham, North Carolina 2770815Fermi National Accelerator Laboratory, Batavia, Illinois 60510
16University of Florida, Gainesville, Florida 3261117Laboratori Nazionali di Frascati, Istituto Nazionale di Fisica Nucleare, I-00044 Frascati, Italy
18University of Geneva, CH-1211 Geneva 4, Switzerland19Glasgow University, Glasgow G12 8QQ, United Kingdom
20Harvard University, Cambridge, Massachusetts 02138
3
21Division of High Energy Physics, Department of Physics,University of Helsinki and Helsinki Institute of Physics, FIN-00014, Helsinki, Finland
22Hiroshima University, Higashi-Hiroshima 724, Japan23University of Illinois, Urbana, Illinois 61801
24The Johns Hopkins University, Baltimore, Maryland 2121825Institut fur Experimentelle Kernphysik, Universitat Karlsruhe, 76128 Karlsruhe, Germany
26High Energy Accelerator Research Organization (KEK), Tsukuba, Ibaraki 305, Japan27Center for High Energy Physics: Kyungpook National University, Taegu 702-701; Seoul National University,
Seoul 151-742; and SungKyunKwan University, Suwon 440-746; Korea28Ernest Orlando Lawrence Berkeley National Laboratory, Berkeley, California 94720
29University of Liverpool, Liverpool L69 7ZE, United Kingdom30University College London, London WC1E 6BT, United Kingdom
31Massachusetts Institute of Technology, Cambridge, Massachusetts 0213932Institute of Particle Physics: McGill University, Montreal,
Canada H3A 2T8; and University of Toronto, Toronto, Canada M5S 1A733University of Michigan, Ann Arbor, Michigan 48109
34Michigan State University, East Lansing, Michigan 4882435Institution for Theoretical and Experimental Physics, ITEP, Moscow 117259, Russia
36University of New Mexico, Albuquerque, New Mexico 8713137Northwestern University, Evanston, Illinois 6020838The Ohio State University, Columbus, Ohio 43210
39Okayama University, Okayama 700-8530, Japan40Osaka City University, Osaka 588, Japan
41University of Oxford, Oxford OX1 3RH, United Kingdom42University of Padova, Istituto Nazionale di Fisica Nucleare,
Sezione di Padova-Trento, I-35131 Padova, Italy43University of Pennsylvania, Philadelphia, Pennsylvania 19104
44Istituto Nazionale di Fisica Nucleare Pisa, Universities of Pisa,Siena and Scuola Normale Superiore, I-56127 Pisa, Italy45University of Pittsburgh, Pittsburgh, Pennsylvania 15260
46Purdue University, West Lafayette, Indiana 4790747University of Rochester, Rochester, New York 14627
48The Rockefeller University, New York, New York 1002149Istituto Nazionale di Fisica Nucleare, Sezione di Roma 1,
University di Roma “La Sapienza,” I-00185 Roma, Italy50Rutgers University, Piscataway, New Jersey 08855
51Texas A&M University, College Station, Texas 7784352Texas Tech University, Lubbock, Texas 79409
53Istituto Nazionale di Fisica Nucleare, University of Trieste/ Udine, Italy54University of Tsukuba, Tsukuba, Ibaraki 305, Japan
55Tufts University, Medford, Massachusetts 0215556Waseda University, Tokyo 169, Japan
57Wayne State University, Detroit, Michigan 4820158University of Wisconsin, Madison, Wisconsin 53706
59Yale University, New Haven, Connecticut 06520(Dated: February 7, 2008)
We present a measurement of the tt production cross section using 194 pb−1 of CDF II datausing events with a high transverse momentum electron or muon, three or more jets, and missingtransverse energy. The measurement assumes 100% t → Wb branching fraction. Events consistentwith tt decay are found by identifying jets containing heavy flavor semileptonic decays to muons.The dominant backgrounds are evaluated directly from the data. Based on 20 candidate events andan expected background of 9.5±1.1 events, we measure a production cross section of 5.3±3.3+1.3
−1.0 pb,in agreement with the standard model.
PACS numbers: 13.85Ni, 13.85Qk, 14.65Ha
I. INTRODUCTION
Top quark pair production in the standard model proceeds via either quark-antiquark annihilation or gluon-gluonfusion. At the Fermilab Tevatron collider, with a center-of-mass energy of 1.96 TeV, quark-antiquark annihilation is
4
expected to dominate. For a top mass of 175 GeV/c2, the calculated cross section is 6.7+0.7−0.9 pb [1], and is approximately
0.2 pb smaller for each 1 GeV/c2 increase in the value of the top mass over the range 170 GeV/c2 < Mtop < 190 GeV/c2.Measurements of the cross section for top quark pair production provide a test of QCD, as well as the standard
model decay t → Wb. Non-standard model production mechanisms, such as the production and decay of a heavyresonance into tt pairs [2], could enhance the measured cross section. Non-standard model top quark decays, suchas the decay into supersymmetric particles [3], could suppress the measured value, for which a t → Wb branchingfraction of nearly 100% is assumed.
In this paper we report a measurement of the tt production cross section in pp collisions at√s = 1.96 TeV with
the CDF II detector at the Fermilab Tevatron. The standard model decay t → Wb of the top quark results in afinal state from tt production of two W bosons and two bottom quarks. We select events consistent with a decayof one of the W bosons to an electron or muon plus a neutrino, both of which have large momentum transverse tothe beam direction (PT). We refer to these high PT electrons or muons as the “primary lepton”. The neutrino isundetected and results in an imbalance in transverse momentum. The imbalance is labeled “missing ET” (E/T ) sinceit is reconstructed based on the flow of energy in the calorimeter [4]. The other W boson in the event decays to a pairof quarks. The two quarks from the W boson and the two b quarks from the top decays hadronize and are observedas jets of charged and neutral particles. This mode is referred as W plus jets. We take advantage of the semileptonicdecay of b hadrons to muons to identify final-state jets that result from hadronization of the bottom quarks. Such atechnique, called “soft-lepton tagging” (SLT), is effective in reducing the background to the tt signal from W bosonproduced in association with several hadronic jets with large transverse momentum. The production cross section ismeasured in events with three or more jets and at least one SLT tagged jet.
This measurement is complementary to other measurements from CDF II, which use secondary vertex tagging,kinematic fitting, or a combination of the two [5] [6] [7]. A forthcoming paper [8] will present a combined cross sectionmeasurement based on the result of these four analyses.
Previous measurements [9] from Run I at the Tevatron have measured production cross sections statistically con-sistent with the standard model prediction. This and other Run II measurements are made at a slightly higher centerof mass energy (1.96 TeV vs. 1.8 TeV) and with nearly twice as much integrated luminosity.
The organization of this paper is as follows: Section II reviews the detector systems relevant to this analysis. Thetrigger and event selection, the data and the Monte Carlo samples and the SLT tagging algorithm are described inSection III. The estimate of the background is presented in Section IV. The acceptance and the tt event taggingefficiency are described in Section V. The evaluation of the systematic uncertainties on the measurement is presentedin Section VI. The tt production cross section measurement and the conclusions are presented in Section VII andSection VIII.
II. THE CDF II DETECTOR
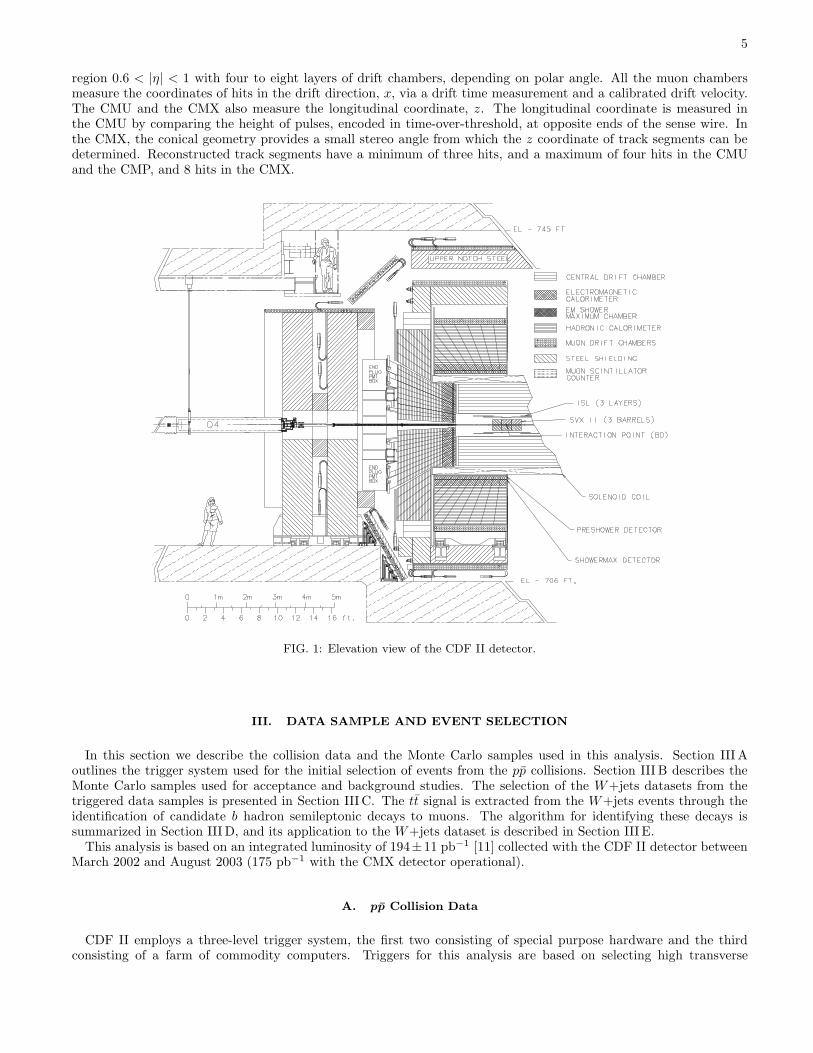
The CDF II detector is described in detail in [10], only the components relevant to this measurement are summarizedhere. The CDF II detector is a nearly azimuthally and forward-backward symmetric detector designed to study ppinteractions at the Fermilab Tevatron. It consists of a magnetic spectrometer surrounded by calorimeters and muonchambers. An elevation view of the CDF II detector is shown in Figure 1.
Charged particles are tracked inside a 1.4 T solenoidal magnetic field by an 8-layer silicon strip detector coveringradii from 1.5 cm to 28 cm, followed by the central outer tracker (COT), an open-cell drift chamber that providesup to 96 measurements of charged particle position over the radial region from 40 cm to 137 cm. The 96 COTmeasurements are arranged in 8 “superlayers” of 12 sense wires each alternating between axial and 2◦ stereo. TheCOT and the silicon detectors track charged particles for |η| < 1 and |η| < 2, respectively.
Surrounding the tracking system are electromagnetic and hadronic calorimeters, used to measure charged andneutral particle energies. The electromagnetic calorimeter is a lead-scintillator sandwich and the hadronic calorimeteris an iron-scintillator sandwich. Both calorimeters are segmented in azimuth and polar angle to provide directionalinformation for the energy deposition. The segmentation varies with position on the detector and is 15◦ in azimuth by0.1 units of η in the central region (|η| < 1.1). Segmentation in the plug region (1.1 < |η| < 3.6) is 7.5◦ up to |η| < 2.1,and 15◦ for |η| > 2.1 in azimuth, while ranging from 0.1 to 0.64 units of η in pseudo-rapidity (a nearly constant 2.7◦
change in polar angle). The electromagnetic calorimeters are instrumented with proportional and scintillating stripdetectors that measure the transverse profile of electromagnetic showers at a depth corresponding to the showermaximum.
Outside the central calorimeter are four layers of muon drift chambers covering |η| < 0.6 (CMU). The calorimeterprovides approximately 1 meter of steel shielding. Behind an additional 60 cm of steel in the central region sit anadditional four layers of muon drift chambers (CMP) arranged in a box-shaped layout around the central detector.Central muon extension (CMX) chambers, which are arrayed in a conical geometry, provide muon detection for the
5
region 0.6 < |η| < 1 with four to eight layers of drift chambers, depending on polar angle. All the muon chambersmeasure the coordinates of hits in the drift direction, x, via a drift time measurement and a calibrated drift velocity.The CMU and the CMX also measure the longitudinal coordinate, z. The longitudinal coordinate is measured inthe CMU by comparing the height of pulses, encoded in time-over-threshold, at opposite ends of the sense wire. Inthe CMX, the conical geometry provides a small stereo angle from which the z coordinate of track segments can bedetermined. Reconstructed track segments have a minimum of three hits, and a maximum of four hits in the CMUand the CMP, and 8 hits in the CMX.
FIG. 1: Elevation view of the CDF II detector.
III. DATA SAMPLE AND EVENT SELECTION
In this section we describe the collision data and the Monte Carlo samples used in this analysis. Section III Aoutlines the trigger system used for the initial selection of events from the pp collisions. Section III B describes theMonte Carlo samples used for acceptance and background studies. The selection of the W+jets datasets from thetriggered data samples is presented in Section III C. The tt signal is extracted from the W+jets events through theidentification of candidate b hadron semileptonic decays to muons. The algorithm for identifying these decays issummarized in Section III D, and its application to the W+jets dataset is described in Section III E.
This analysis is based on an integrated luminosity of 194±11 pb−1 [11] collected with the CDF II detector betweenMarch 2002 and August 2003 (175 pb−1 with the CMX detector operational).
A. pp Collision Data
CDF II employs a three-level trigger system, the first two consisting of special purpose hardware and the thirdconsisting of a farm of commodity computers. Triggers for this analysis are based on selecting high transverse
6
momentum electrons and muons. The electron sample is triggered as follows: At the first trigger level events areselected by requiring a track with PT > 8 GeV/c matched to an electromagnetic calorimeter tower with ET > 8 GeVand little energy in the hadronic calorimeter behind it. At the second trigger level, calorimeter energy clusters areassembled and the track found at the first level is matched to an electromagnetic cluster with ET > 16 GeV. At thethird level, offline reconstruction is performed and an electron candidate with ET > 18 GeV is required. The efficiencyof the electron trigger is measured from Z → ee data and found to be (96.2 ± 0.6)% [12]. The selection of the muonsample begins at the first trigger level with a track with PT > 4 GeV/c matched to hits in the CMU and the CMPchambers or a track with PT > 8 GeV/c matched to hits in the CMX chambers. At the second level, a track withPT > 8 GeV/c is required in the event for about 70% of the integrated luminosity, while for the remainder, triggers atthe first level are fed directly to the third level. At the third trigger level, a reconstructed track with PT > 18 GeV/cis required to be matched to the muon chamber hits. The efficiency of the muon trigger, measured from Z → µµdata, is (88.7 ± 0.7)% for CMU/CMP muons and (95.4 ± 0.4)% for CMX muons [12].
B. Monte Carlo Datasets
The detector acceptance of tt events is modeled using PYTHIA v6.2 [13] and HERWIG v6.4 [14]. These are leading-order event generators with parton showering to simulate radiation and fragmentation effects. The generators areused with the CTEQ5L parton distribution functions [15]. Decays of b and c hadrons are modeled using QQ v9.1 [16].Estimates of backgrounds from diboson production (WW , WZ, ZZ) are derived using the ALPGEN generator [17] withparton showering provided by HERWIG. The background from single top production (eg. W ∗ → tb) is simulated usingPYTHIA. Samples of the remaining backgrounds are derived directly from the data as described in Section IV.
The detector simulation reproduces the response of the detector to particles produced in pp collisions. The samedetector geometry database is used in both the simulation and the reconstruction, and tracking of particles throughmatter is performed with GEANT3 [18]. The drift model for the COT uses a parametrization of a GARFIELD sim-ulation [19] with parameters tuned to match COT collider data. The calorimeter simulation uses the GFLASH [20]parametrization package interfaced with GEANT3. The GFLASH parameters are tuned to test beam data for electronsand high-PT pions and checked by comparing the calorimeter energy of isolated tracks in the collision data to theirmomenta as measured in the COT. Further details of the CDF II simulation can be found in [21].
C. W +Jets Dataset
From the inclusive lepton dataset produced by the electron and muon triggers described in Section III A, we selectevents with an isolated electron ET (muon PT) greater than 20 GeV and E/T > 20 GeV. The isolation I of the electron
or muon is defined as the calorimeter transverse energy in a cone of ∆R ≡√
∆η2 + ∆φ2 < 0.4 around the lepton (notincluding the lepton energy itself) divided by the ET (PT) of the lepton. We require I < 0.1. The W+jets datasetis categorized according to the number of jets with ET > 15 GeV and |η| < 2.0. The decay of tt pairs gives rise toevents with typically at least three such jets, while the W plus one or two jet samples provide a control dataset withlittle signal contamination. Jets are identified using a fixed-cone algorithm with a cone size of 0.4 and are constrainedto originate from the pp collision vertex. Their energies are corrected to account for detector response variations in η,calorimeter gain instability, and multiple interactions in an event. A complete description of W+jets event selectionis given in [6].
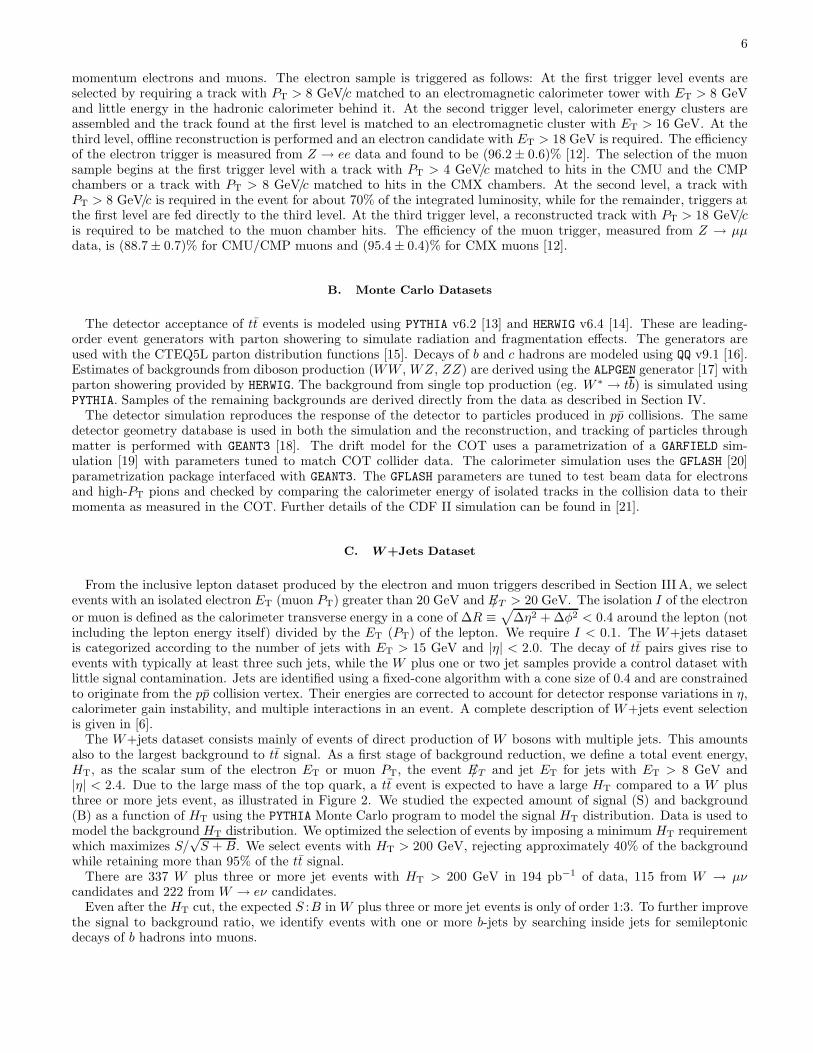
The W+jets dataset consists mainly of events of direct production of W bosons with multiple jets. This amountsalso to the largest background to tt signal. As a first stage of background reduction, we define a total event energy,HT, as the scalar sum of the electron ET or muon PT, the event E/T and jet ET for jets with ET > 8 GeV and|η| < 2.4. Due to the large mass of the top quark, a tt event is expected to have a large HT compared to a W plusthree or more jets event, as illustrated in Figure 2. We studied the expected amount of signal (S) and background(B) as a function of HT using the PYTHIA Monte Carlo program to model the signal HT distribution. Data is used tomodel the background HT distribution. We optimized the selection of events by imposing a minimum HT requirementwhich maximizes S/
√S +B. We select events with HT > 200 GeV, rejecting approximately 40% of the background
while retaining more than 95% of the tt signal.There are 337 W plus three or more jet events with HT > 200 GeV in 194 pb−1 of data, 115 from W → µν
candidates and 222 from W → eν candidates.Even after the HT cut, the expected S :B in W plus three or more jet events is only of order 1:3. To further improve
the signal to background ratio, we identify events with one or more b-jets by searching inside jets for semileptonicdecays of b hadrons into muons.
7
[GeV]TH0 50 100 150 200 250 300 350 400 450 500
Arb
itrar
y U
nits
ttW+jets
Ove
rflo
w B
in
FIG. 2: HT distributions, normalized to unity, for tt (solid line) and W+jets (dotted line) PYTHIA Monte Carlo events withthree or more jets after the event selection described in the text.
D. Soft Lepton Tagging Algorithm
Muon identification at CDF proceeds by extrapolating tracks found in the central tracker, through the calorimeterto the muon chambers, and matching them to track segments reconstructed in the muon chambers. Matching isdone in the following observables: extrapolated position along the muon chamber drift direction (x), the longitudinalcoordinate along the chamber wires (z) when such information is available, and the extrapolated slope comparedto the slope of the reconstructed muon chamber track segment (φL). Tracks are paired with muon chamber tracksegments based on the best match in x for those track segments that are within 50 cm of an extrapolated COTtrack. In what follows we refer to the difference between the extrapolated and measured positions in x and z as dxand dz, respectively, and the extrapolated and measured slope as dφL. The distributions of these variables over anensemble of events are referred to as the matching distributions. In addition to selection based on dx and dz, thestandard muon identification also requires consistency with minimum ionizing energy deposition in the calorimeters.However, in order to retain sensitivity for muons embedded in jets, the muon SLT algorithm makes full usage of themuon matching information without any requirement on the calorimeter information. The algorithm starts with high-quality reconstructed tracks in the COT, selected by requiring at least 24 axial and 24 stereo hits on the track. Somerejection for pion and kaon decays in flight is achieved by requiring that the impact parameter of the reconstructedtrack be less than 3 mm with respect to the beamline. The track is also required to originate within 60 cm in zof the center of the detector. Only tracks passing these cuts and extrapolating within 3σ(PT) in x outside of themuon chambers, where σ(PT) is the multiple scattering width, are considered as muon candidates. Also, when a trackextrapolates to greater than 3σ(PT) in x inside the muon chambers, but no muon chamber track segment is found,the track is rejected and not allowed to be paired to other muon chamber track segments.
Candidate muons are selected with the SLT algorithm by constructing a quantity L, based on a comparison ofthe measured matching variables with their expectations. To construct L we first form a sum, Q, of individual χ2
variables
Q =
n∑
i=1
(Xi − µi)2
σ2i
, (1)
where µi and σi are the expected mean and width of the distribution of matching variable Xi. The sum is taken overn selected variables, as described below. L is then constructed by normalizing Q according to
8
L =(Q− n)√
var(Q), (2)
where the variance var(Q) is calculated using the full covariance matrix for the selected variables. The normalizationis chosen to make L independent of the number of variables n; note that the distribution of L tends to a Gaussiancentered at zero and with unitary width, for n sufficiently large. The correlation coefficients between each pair ofvariables are measured from J/ψ → µµ data. The calculation proceeds by comparing the variance of the sum with thesum of the variances of each pair of χ2 variables in Equation 1. Since the values of the matching variables are eitherpositive or negative, according to the local coordinate system, separate correlation coefficients are used for pairs thathave same-sign and opposite-sign values.
The selected variables are the full set of matching variables, x, z, φL in the CMU, CMP and CMX with thefollowing two exceptions: The CMP chambers do not provide a measurement of the longitudinal coordinate z, andmatching in φL is not included for track segments in the muon chambers that have only three hits. Because of theirsignificantly poorer resolution, track segments reconstructed in the CMU chambers with three hits are not used. Notethat a muon that traverses both the CMU and the CMP chambers yields two sets of matching measurements in x andφL and one z matching measurement, and are referred as CMUP muons. All available matching variables are usedin the calculation of L for a given muon candidate. By placing an appropriate cut on L, background is preferentiallyrejected because hadrons have broader matching distributions than muons since the track segments in the muonchambers from hadrons are generally a result of leakage of the hadronic shower.
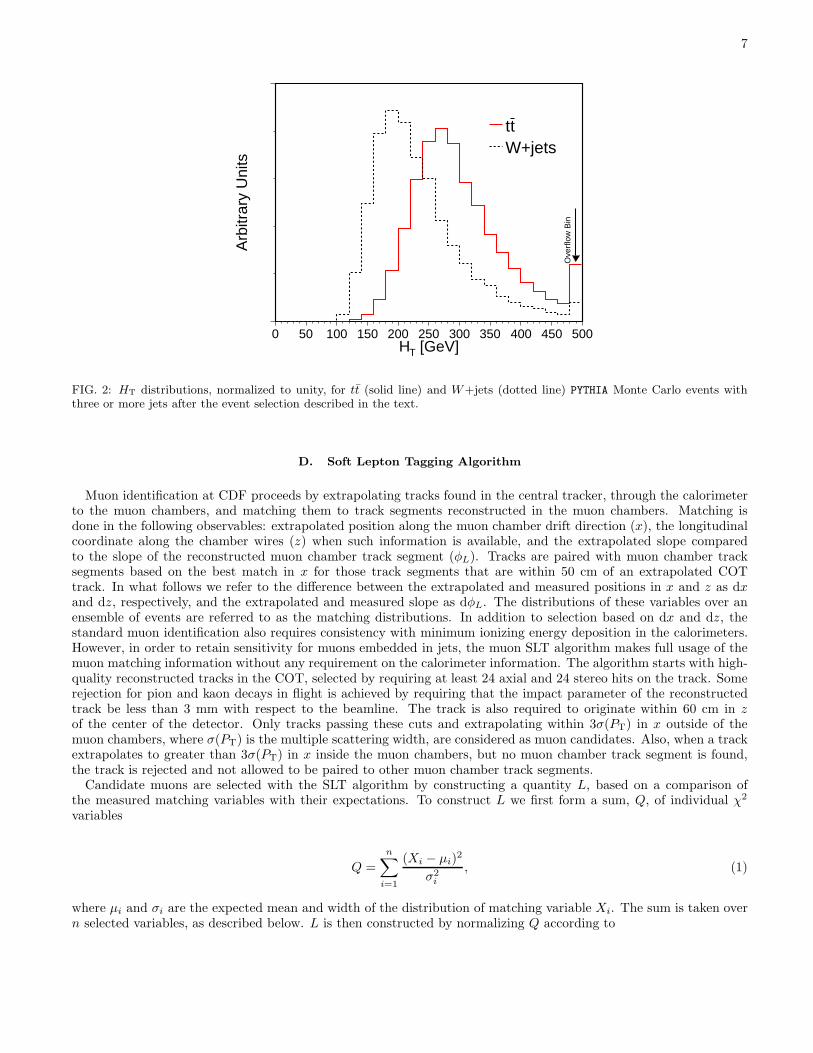
The widths of the matching distributions that enter into L are a combination of intrinsic resolution of the muonchambers and multiple scattering. The multiple scattering term varies inversely with PT and is dominant at low PT.The expected widths of the matching distributions are based on measurements of muons from J/ψ decays at low PT
(see Figure 3) and W and Z boson decays at high PT.
dx [cm]-20 -15 -10 -5 0 5 10 15 20
Arb
itrar
y U
nits
3.0≤ T P≤2.5 6.0≤ T P≤5.0
dx [cm]-20 -15 -10 -5 0 5 10 15 20
Arb
itrar
y U
nits
) [cm]θdz sin(-30 -20 -10 0 10 20 30
Arb
itrar
y U
nits
3.0≤ T P≤2.5 6.0≤ T P≤5.0
) [cm]θdz sin(-30 -20 -10 0 10 20 30
Arb
itrar
y U
nits
[rad]Lφd-0.2 -0.1 0 0.1 0.2
Arb
itrar
y U
nits
3.0≤ T P≤2.5 6.0≤ T P≤5.0
[rad]Lφd-0.2 -0.1 0 0.1 0.2
Arb
itrar
y U
nits
FIG. 3: Examples of muon matching distributions for the CMU in (left to right) drift direction, x, the longitudinal coordinate,z, and angle, φL. For each variable we show two PT ranges, 2.5 ≤ PT ≤ 3 GeV/c (wide distribution) and 5 ≤ PT ≤ 6 GeV/c(narrow distribution). For the longitudinal coordinate z, we plot the product of dz by sin θ, which is the projection orthogonalto the direction of flight.
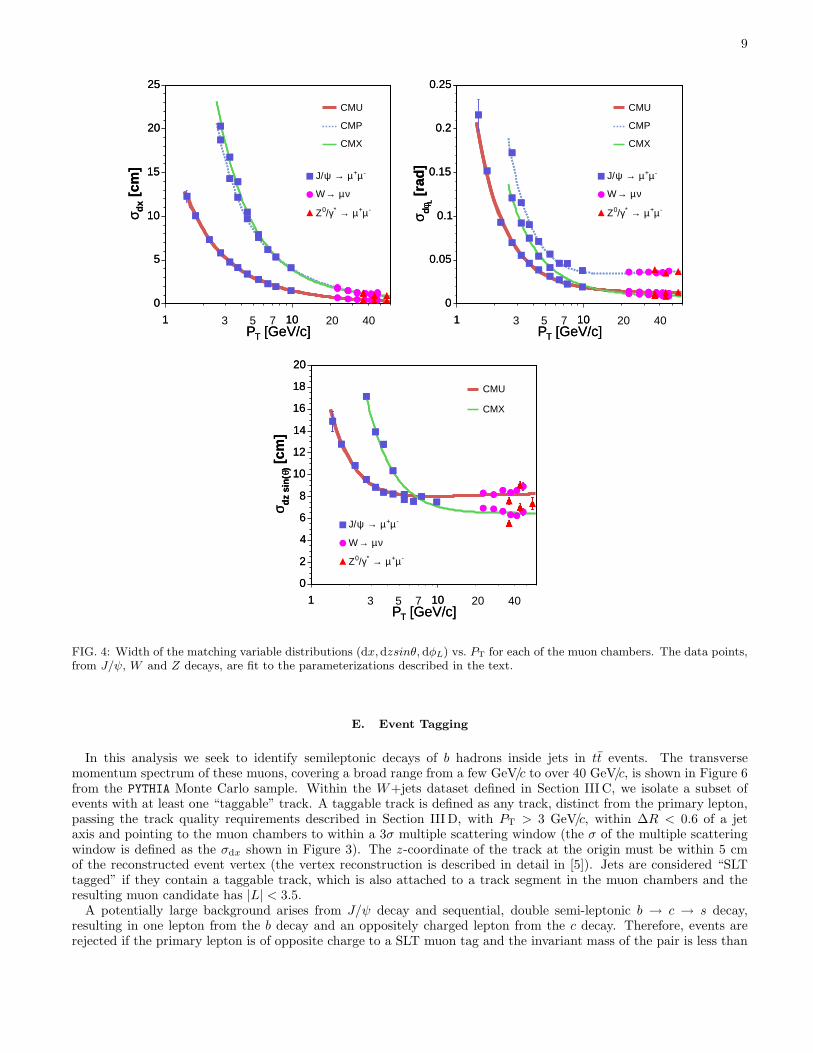
The mean values (µi in Equation 1) are typically zero, except for a small offset in the CMU dz. We parameterizethe widths as a function of up to three variables: PT, η and φ. These variables describe to first order the effects ofmultiple scattering in the detector. For the CMU detector, PT is sufficient since the material traversed by a muoncandidate is approximately homogenous in η and φ. The widths are parameterized with a second-order polynomial in1/PT with an exponential term that describes the PT range below 3 GeV/c. For the CMP detector we parameterizethe widths as functions of PT and φ to take into account the rectangular shape of the absorber outside the centralcalorimeter. For the CMX detector we use PT, η and φ to account for a number of irregularities in the amount ofabsorber between η = 0.6 and η = 1.0. The measurement of the widths of the matching distributions as functions ofPT, overlayed with their fits, are shown in Figure 4.
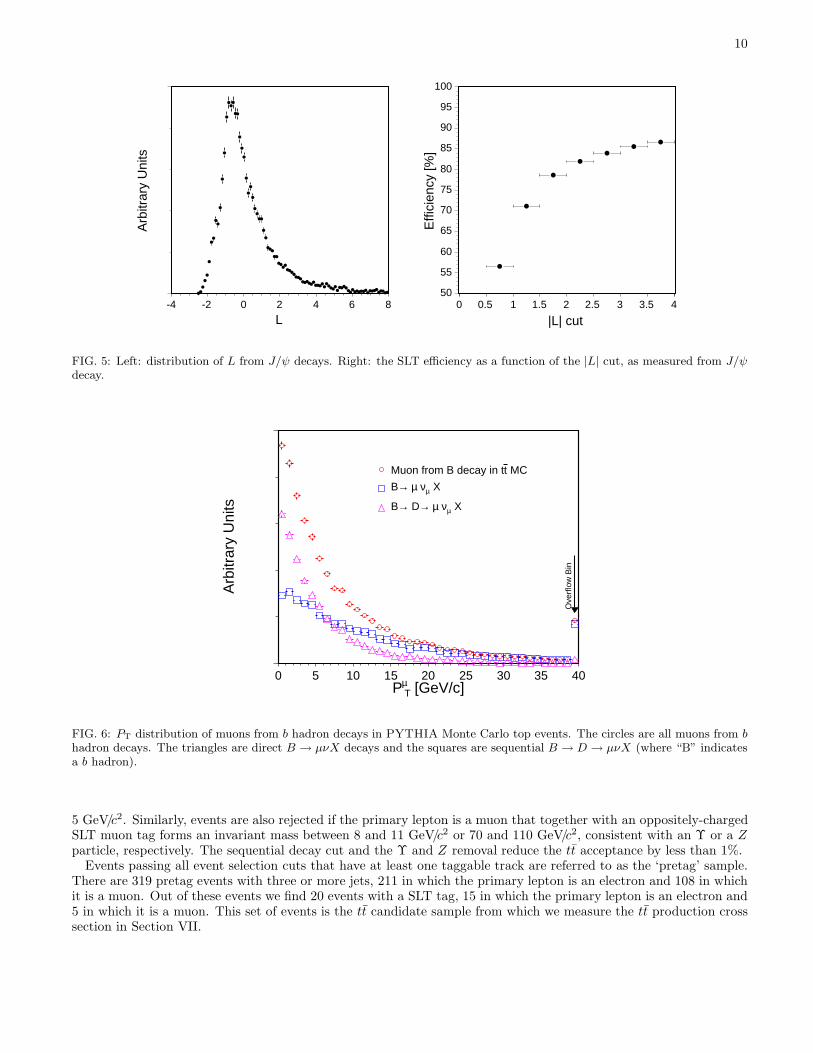
Figure 5 (left) shows an example of the distribution of L from J/ψ decays. The number of variables used variesfrom two to five. Figure 5 (right) shows the efficiency of the SLT algorithm as a function of L from J/ψ data. Theefficiency plateaus at about 85% for |L| ≥ 3.5.
9
[GeV/c]TP1 10
[cm
]d
xσ
0
5
10
15
20
25
[GeV/c]TP1 10
[cm
]d
xσ
0
5
10
15
20
25
CMU
CMP
CMX
-µ+µ → ψ J/
νµ → W
-µ+µ → *γ/0 Z
3 5 7 20 40 [GeV/c]TP
1 10
[ra
d]
Lφdσ
0
0.05
0.1
0.15
0.2
0.25
[GeV/c]TP1 10
[ra
d]
Lφdσ
0
0.05
0.1
0.15
0.2
0.25
CMU
CMP
CMX
-µ+µ → ψ J/
νµ → W
-µ+µ → *γ/0 Z
3 5 7 20 40
[GeV/c]TP1 10
[cm
])θ
dz
sin
(σ
0
2
4
6
8
10
12
14
16
18
20
[GeV/c]TP1 10
[cm
])θ
dz
sin
(σ
0
2
4
6
8
10
12
14
16
18
20
CMU
CMX
-µ+µ → ψ J/
νµ → W
-µ+µ → *γ/0 Z
3 5 7 20 40
FIG. 4: Width of the matching variable distributions (dx,dzsinθ, dφL) vs. PT for each of the muon chambers. The data points,from J/ψ, W and Z decays, are fit to the parameterizations described in the text.
E. Event Tagging
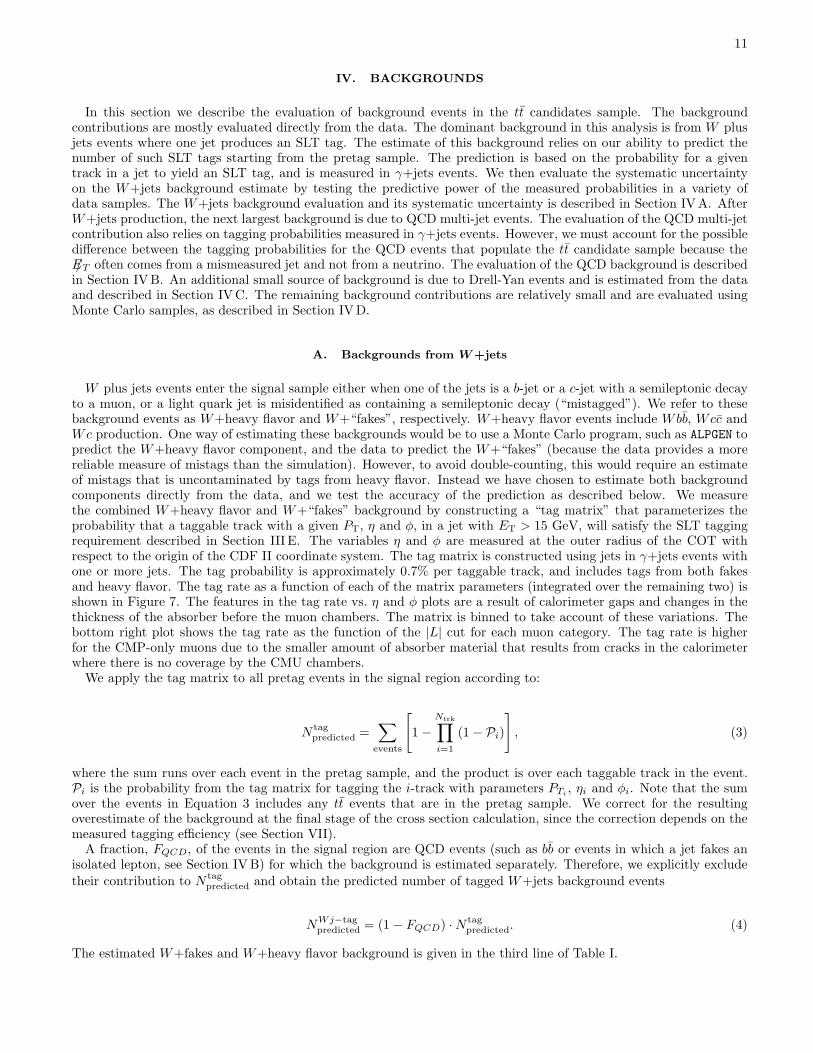
In this analysis we seek to identify semileptonic decays of b hadrons inside jets in tt events. The transversemomentum spectrum of these muons, covering a broad range from a few GeV/c to over 40 GeV/c, is shown in Figure 6from the PYTHIA Monte Carlo sample. Within the W+jets dataset defined in Section III C, we isolate a subset ofevents with at least one “taggable” track. A taggable track is defined as any track, distinct from the primary lepton,passing the track quality requirements described in Section III D, with PT > 3 GeV/c, within ∆R < 0.6 of a jetaxis and pointing to the muon chambers to within a 3σ multiple scattering window (the σ of the multiple scatteringwindow is defined as the σdx shown in Figure 3). The z-coordinate of the track at the origin must be within 5 cmof the reconstructed event vertex (the vertex reconstruction is described in detail in [5]). Jets are considered “SLTtagged” if they contain a taggable track, which is also attached to a track segment in the muon chambers and theresulting muon candidate has |L| < 3.5.
A potentially large background arises from J/ψ decay and sequential, double semi-leptonic b → c → s decay,resulting in one lepton from the b decay and an oppositely charged lepton from the c decay. Therefore, events arerejected if the primary lepton is of opposite charge to a SLT muon tag and the invariant mass of the pair is less than
10
L-4 -2 0 2 4 6 8
Arb
itrar
y U
nits
|L| cut0 0.5 1 1.5 2 2.5 3 3.5 4
Effi
cien
cy [%
]
50
55
60
65
70
75
80
85
90
95
100
FIG. 5: Left: distribution of L from J/ψ decays. Right: the SLT efficiency as a function of the |L| cut, as measured from J/ψdecay.
[GeV/c]µ TP
0 5 10 15 20 25 30 35 40
Arb
itrar
y U
nits
Ove
rflo
w B
in
MCtMuon from B decay in t
Xµν µ →B
Xµν µ → D→B
FIG. 6: PT distribution of muons from b hadron decays in PYTHIA Monte Carlo top events. The circles are all muons from bhadron decays. The triangles are direct B → µνX decays and the squares are sequential B → D → µνX (where “B” indicatesa b hadron).
5 GeV/c2. Similarly, events are also rejected if the primary lepton is a muon that together with an oppositely-chargedSLT muon tag forms an invariant mass between 8 and 11 GeV/c2 or 70 and 110 GeV/c2, consistent with an Υ or a Zparticle, respectively. The sequential decay cut and the Υ and Z removal reduce the tt acceptance by less than 1%.
Events passing all event selection cuts that have at least one taggable track are referred to as the ‘pretag’ sample.There are 319 pretag events with three or more jets, 211 in which the primary lepton is an electron and 108 in whichit is a muon. Out of these events we find 20 events with a SLT tag, 15 in which the primary lepton is an electron and5 in which it is a muon. This set of events is the tt candidate sample from which we measure the tt production crosssection in Section VII.
11
IV. BACKGROUNDS
In this section we describe the evaluation of background events in the tt candidates sample. The backgroundcontributions are mostly evaluated directly from the data. The dominant background in this analysis is from W plusjets events where one jet produces an SLT tag. The estimate of this background relies on our ability to predict thenumber of such SLT tags starting from the pretag sample. The prediction is based on the probability for a giventrack in a jet to yield an SLT tag, and is measured in γ+jets events. We then evaluate the systematic uncertaintyon the W+jets background estimate by testing the predictive power of the measured probabilities in a variety ofdata samples. The W+jets background evaluation and its systematic uncertainty is described in Section IVA. AfterW+jets production, the next largest background is due to QCD multi-jet events. The evaluation of the QCD multi-jetcontribution also relies on tagging probabilities measured in γ+jets events. However, we must account for the possibledifference between the tagging probabilities for the QCD events that populate the tt candidate sample because theE/T often comes from a mismeasured jet and not from a neutrino. The evaluation of the QCD background is describedin Section IVB. An additional small source of background is due to Drell-Yan events and is estimated from the dataand described in Section IVC. The remaining background contributions are relatively small and are evaluated usingMonte Carlo samples, as described in Section IVD.
A. Backgrounds from W +jets
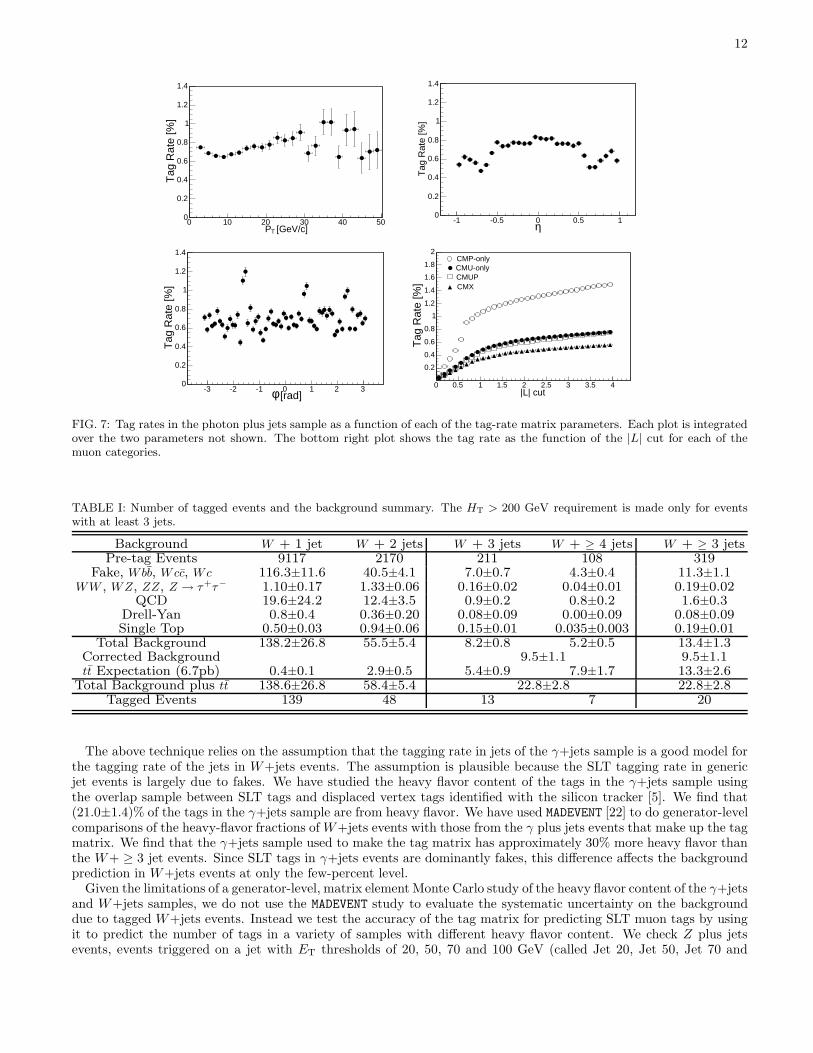
W plus jets events enter the signal sample either when one of the jets is a b-jet or a c-jet with a semileptonic decayto a muon, or a light quark jet is misidentified as containing a semileptonic decay (“mistagged”). We refer to thesebackground events as W+heavy flavor and W+“fakes”, respectively. W+heavy flavor events include Wbb, Wcc andWc production. One way of estimating these backgrounds would be to use a Monte Carlo program, such as ALPGEN topredict the W+heavy flavor component, and the data to predict the W+“fakes” (because the data provides a morereliable measure of mistags than the simulation). However, to avoid double-counting, this would require an estimateof mistags that is uncontaminated by tags from heavy flavor. Instead we have chosen to estimate both backgroundcomponents directly from the data, and we test the accuracy of the prediction as described below. We measurethe combined W+heavy flavor and W+“fakes” background by constructing a “tag matrix” that parameterizes theprobability that a taggable track with a given PT, η and φ, in a jet with ET > 15 GeV, will satisfy the SLT taggingrequirement described in Section III E. The variables η and φ are measured at the outer radius of the COT withrespect to the origin of the CDF II coordinate system. The tag matrix is constructed using jets in γ+jets events withone or more jets. The tag probability is approximately 0.7% per taggable track, and includes tags from both fakesand heavy flavor. The tag rate as a function of each of the matrix parameters (integrated over the remaining two) isshown in Figure 7. The features in the tag rate vs. η and φ plots are a result of calorimeter gaps and changes in thethickness of the absorber before the muon chambers. The matrix is binned to take account of these variations. Thebottom right plot shows the tag rate as the function of the |L| cut for each muon category. The tag rate is higherfor the CMP-only muons due to the smaller amount of absorber material that results from cracks in the calorimeterwhere there is no coverage by the CMU chambers.
We apply the tag matrix to all pretag events in the signal region according to:
N tagpredicted =
∑
events
[
1 −Ntrk∏
i=1
(1 − Pi)
]
, (3)
where the sum runs over each event in the pretag sample, and the product is over each taggable track in the event.Pi is the probability from the tag matrix for tagging the i-track with parameters PTi
, ηi and φi. Note that the sumover the events in Equation 3 includes any tt events that are in the pretag sample. We correct for the resultingoverestimate of the background at the final stage of the cross section calculation, since the correction depends on themeasured tagging efficiency (see Section VII).
A fraction, FQCD, of the events in the signal region are QCD events (such as bb or events in which a jet fakes anisolated lepton, see Section IVB) for which the background is estimated separately. Therefore, we explicitly exclude
their contribution to N tagpredicted and obtain the predicted number of tagged W+jets background events
NWj−tagpredicted = (1 − FQCD) ·N tag
predicted. (4)
The estimated W+fakes and W+heavy flavor background is given in the third line of Table I.
12
P [GeV/c]0 10 20 30 40 50
Tag
Rat
e [%
]
0
0.2
0.4
0.6
0.8
1
1.2
1.4
T
-1 -0.5 0 0.5 1
Tag
Rat
e [%
]
0
0.2
0.4
0.6
0.8
1
1.2
1.4
η
[rad]-3 -2 -1 0 1 2 3
Tag
Rat
e [%
]
0
0.2
0.4
0.6
0.8
1
1.2
1.4
φ |L| cut0 0.5 1 1.5 2 2.5 3 3.5 4
Tag
Rat
e [%
]
0.2
0.4
0.6
0.8
1
1.2
1.4
1.6
1.8
2CMP-onlyCMU-onlyCMUPCMX
FIG. 7: Tag rates in the photon plus jets sample as a function of each of the tag-rate matrix parameters. Each plot is integratedover the two parameters not shown. The bottom right plot shows the tag rate as the function of the |L| cut for each of themuon categories.
TABLE I: Number of tagged events and the background summary. The HT > 200 GeV requirement is made only for eventswith at least 3 jets.
Background W + 1 jet W + 2 jets W + 3 jets W + ≥ 4 jets W + ≥ 3 jetsPre-tag Events 9117 2170 211 108 319
Fake, Wbb, Wcc, Wc 116.3±11.6 40.5±4.1 7.0±0.7 4.3±0.4 11.3±1.1WW , WZ, ZZ, Z → τ+τ− 1.10±0.17 1.33±0.06 0.16±0.02 0.04±0.01 0.19±0.02
QCD 19.6±24.2 12.4±3.5 0.9±0.2 0.8±0.2 1.6±0.3Drell-Yan 0.8±0.4 0.36±0.20 0.08±0.09 0.00±0.09 0.08±0.09Single Top 0.50±0.03 0.94±0.06 0.15±0.01 0.035±0.003 0.19±0.01
Total Background 138.2±26.8 55.5±5.4 8.2±0.8 5.2±0.5 13.4±1.3Corrected Background 9.5±1.1 9.5±1.1tt Expectation (6.7pb) 0.4±0.1 2.9±0.5 5.4±0.9 7.9±1.7 13.3±2.6
Total Background plus tt 138.6±26.8 58.4±5.4 22.8±2.8 22.8±2.8Tagged Events 139 48 13 7 20
The above technique relies on the assumption that the tagging rate in jets of the γ+jets sample is a good model forthe tagging rate of the jets in W+jets events. The assumption is plausible because the SLT tagging rate in genericjet events is largely due to fakes. We have studied the heavy flavor content of the tags in the γ+jets sample usingthe overlap sample between SLT tags and displaced vertex tags identified with the silicon tracker [5]. We find that(21.0±1.4)% of the tags in the γ+jets sample are from heavy flavor. We have used MADEVENT [22] to do generator-levelcomparisons of the heavy-flavor fractions of W+jets events with those from the γ plus jets events that make up the tagmatrix. We find that the γ+jets sample used to make the tag matrix has approximately 30% more heavy flavor thanthe W+ ≥ 3 jet events. Since SLT tags in γ+jets events are dominantly fakes, this difference affects the backgroundprediction in W+jets events at only the few-percent level.
Given the limitations of a generator-level, matrix element Monte Carlo study of the heavy flavor content of the γ+jetsand W+jets samples, we do not use the MADEVENT study to evaluate the systematic uncertainty on the backgrounddue to tagged W+jets events. Instead we test the accuracy of the tag matrix for predicting SLT muon tags by usingit to predict the number of tags in a variety of samples with different heavy flavor content. We check Z plus jetsevents, events triggered on a jet with ET thresholds of 20, 50, 70 and 100 GeV (called Jet 20, Jet 50, Jet 70 and
13
(Predicted-Observed)/Predicted [%]-30 -20 -10 0 10 20 30 40 50
Photon
Jet 20
Jet 50
Jet 70
Jet 100
SumEt
Z+jets
1 jet2 jets>=3 jets>=1 jets
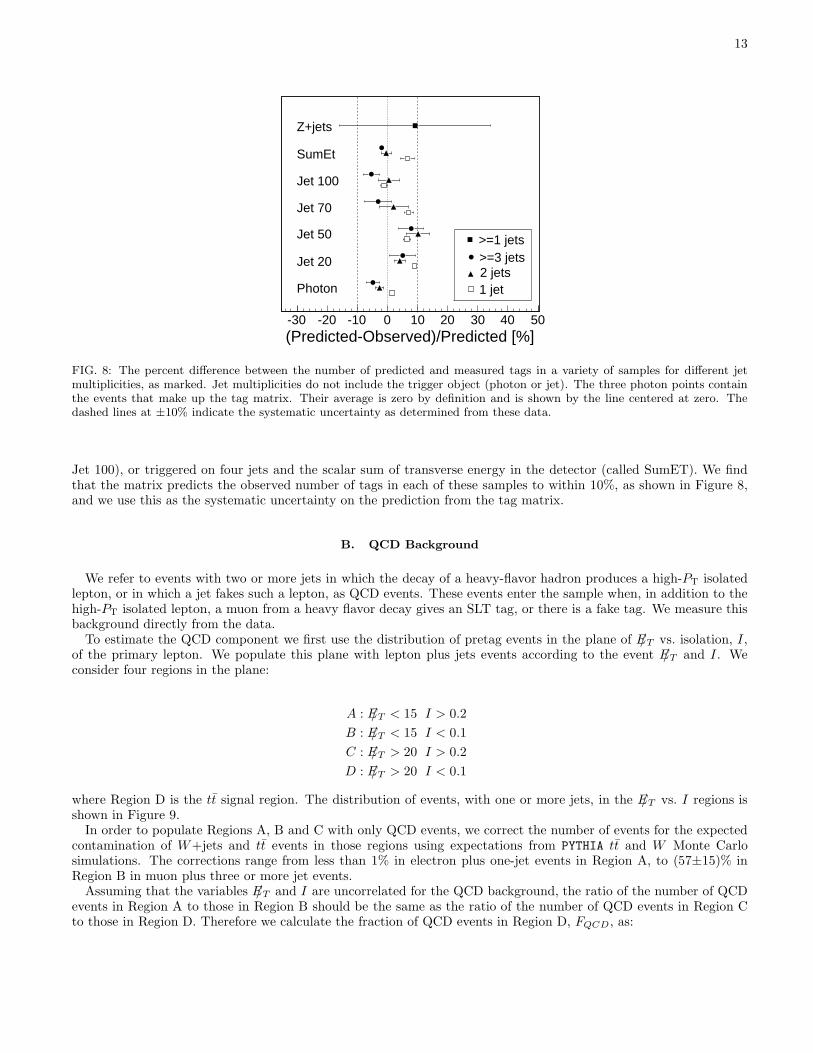
FIG. 8: The percent difference between the number of predicted and measured tags in a variety of samples for different jetmultiplicities, as marked. Jet multiplicities do not include the trigger object (photon or jet). The three photon points containthe events that make up the tag matrix. Their average is zero by definition and is shown by the line centered at zero. Thedashed lines at ±10% indicate the systematic uncertainty as determined from these data.
Jet 100), or triggered on four jets and the scalar sum of transverse energy in the detector (called SumET). We findthat the matrix predicts the observed number of tags in each of these samples to within 10%, as shown in Figure 8,and we use this as the systematic uncertainty on the prediction from the tag matrix.
B. QCD Background
We refer to events with two or more jets in which the decay of a heavy-flavor hadron produces a high-PT isolatedlepton, or in which a jet fakes such a lepton, as QCD events. These events enter the sample when, in addition to thehigh-PT isolated lepton, a muon from a heavy flavor decay gives an SLT tag, or there is a fake tag. We measure thisbackground directly from the data.
To estimate the QCD component we first use the distribution of pretag events in the plane of E/T vs. isolation, I,of the primary lepton. We populate this plane with lepton plus jets events according to the event E/T and I. Weconsider four regions in the plane:
A : E/T < 15 I > 0.2
B : E/T < 15 I < 0.1
C : E/T > 20 I > 0.2
D : E/T > 20 I < 0.1
where Region D is the tt signal region. The distribution of events, with one or more jets, in the E/T vs. I regions isshown in Figure 9.
In order to populate Regions A, B and C with only QCD events, we correct the number of events for the expectedcontamination of W+jets and tt events in those regions using expectations from PYTHIA tt and W Monte Carlosimulations. The corrections range from less than 1% in electron plus one-jet events in Region A, to (57±15)% inRegion B in muon plus three or more jet events.
Assuming that the variables E/T and I are uncorrelated for the QCD background, the ratio of the number of QCDevents in Region A to those in Region B should be the same as the ratio of the number of QCD events in Region Cto those in Region D. Therefore we calculate the fraction of QCD events in Region D, FQCD, as:

14
FIG. 9: Distribution of events with ≥1 jet in E/T vs. I . Regions A,B,C are defined in the text and are used to calculate thefraction of QCD events in region D (the signal region) according to Equation 5.
FQCD =NQCD
D
ND
∣
∣
∣
∣
∣
pretag
=NB ·NC
NA ·ND
∣
∣
∣
∣
pretag
, (5)
where NQCDD is the total number of pretag QCD events in the signal region, and Ni represent the number of events
in region i. The measured fractions are shown in Table II.To estimate the number of tagged QCD events in the signal region, we multiply FQCD by the tagging probability
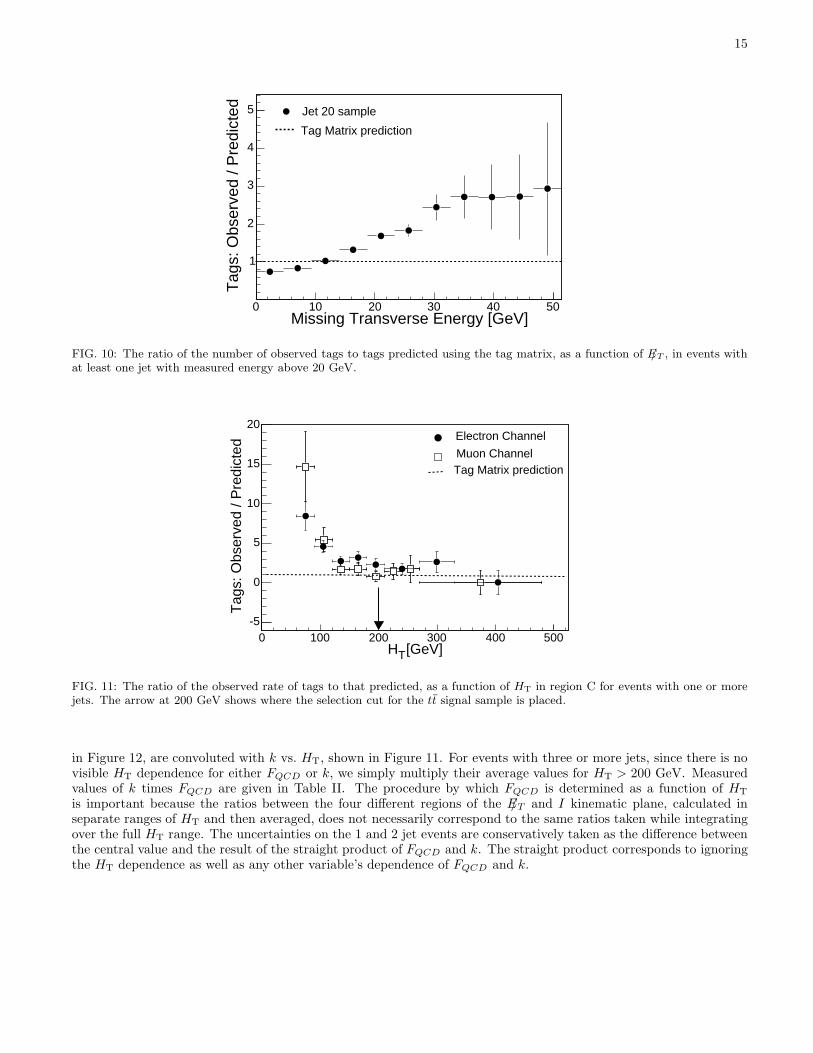
for QCD events. However, this tagging probability is not necessarily given by the tag matrix probabilities which aredesigned for jets in W+jets events. Mismeasurement in the jet energies and differences in kinematics between W+jetsand QCD events may affect the tagging probabilities. W+jets events have E/T from the undetected neutrino, whereasQCD events have E/T primarily from jet mismeasurement. Jet mismeasurement is correlated with fake tags due toenergy leakage from the calorimeter through calorimeter gaps or incomplete absorption of the hadronic shower, bothof which can result in track segments in the muon chambers. W+jets events have a primary lepton from the W decay,whereas QCD events have a primary lepton that is either a fake or a result of a semileptonic decay of heavy flavor.The presence of a lepton from heavy flavor decay typically enhances the tag rate. Figure 10 shows the ratio of thenumber of measured tags in the Jet 20 sample to the number of tags predicted by the tag matrix as a function ofE/T . As expected, in QCD events with large E/T we find a tag rate significantly larger than that described by the tagmatrix.
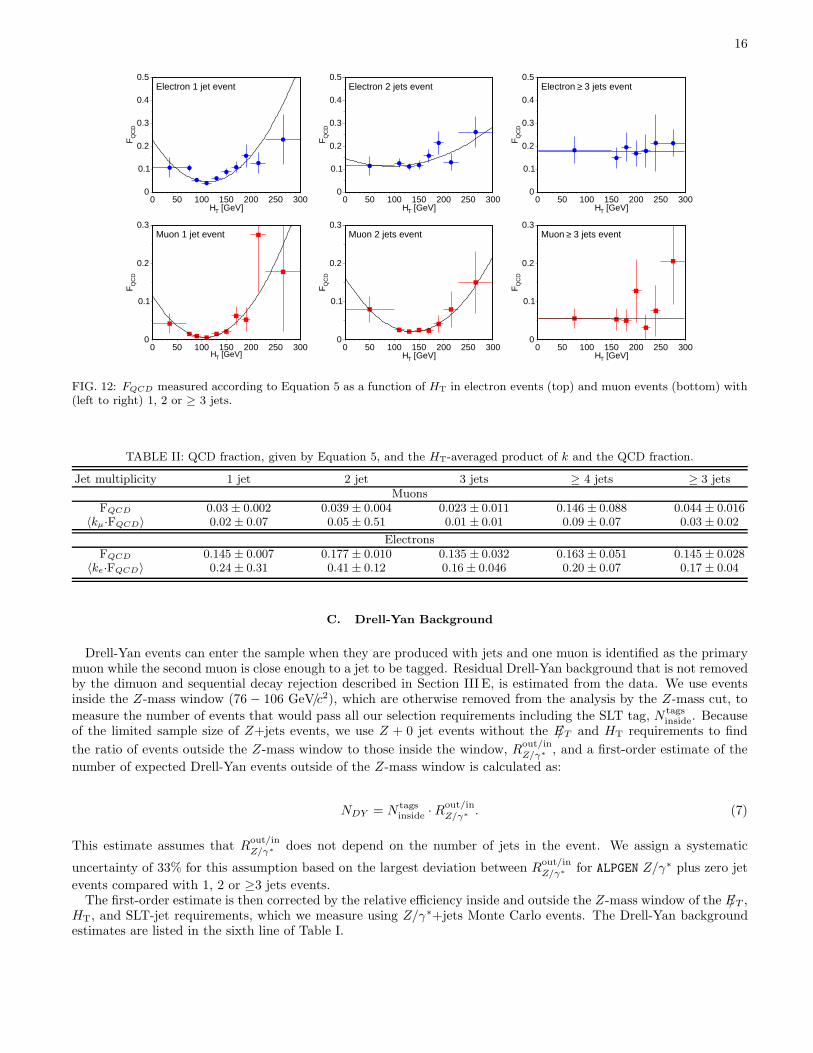
We find that the prediction of the tag matrix can be renormalized to properly account for the tag rates in QCDevents with a single multiplicative factor, which we call k. We measure k using events in region C by comparing thenumber of SLT tags found to the number predicted by the tag matrix. Since the signal region contains only isolated(I < 0.1) primary leptons, we reject events in the measurement of k in which the SLT tag is within ∆R < 0.5 of theprimary lepton. After this requirement we do not find any dependence of k on the isolation of the primary lepton.Figure 11 shows the ratio of measured to predicted tags in events in region C as a function of HT. The tag rate aboveHT = 200 GeV is approximately flat and is not much different from the prediction of the tag matrix (dashed line inFigure 11). However, QCD events at lower HT have a significantly different tag rate than that predicted by the tagmatrix. As shown in Figure 12, FQCD also has an HT dependence for events with 1 or 2 jets, but is flat within thestatistical uncertainty for three or more jets.
The number of QCD background events is calculated as:
NQCD = 〈FQCD · k〉 ·N tagpredicted, (6)
where N tagpredicted is given in Equation 3 and the brackets represent the product of FQCD and k convoluted with the
HT distribution of QCD events from region C. In the control region (1 and 2 jets), the fits of FQCD vs. HT, shown
15
Missing Transverse Energy [GeV]0 10 20 30 40 50
Tag
s: O
bser
ved
/ Pre
dict
ed
1
2
3
4
5 Jet 20 sample
Tag Matrix prediction
FIG. 10: The ratio of the number of observed tags to tags predicted using the tag matrix, as a function of E/T , in events withat least one jet with measured energy above 20 GeV.
H [GeV]0 100 200 300 400 500
Tag
s: O
bser
ved
/ Pre
dict
ed
-5
0
5
10
15
20Electron Channel
Muon ChannelTag Matrix prediction
T
FIG. 11: The ratio of the observed rate of tags to that predicted, as a function of HT in region C for events with one or morejets. The arrow at 200 GeV shows where the selection cut for the tt signal sample is placed.
in Figure 12, are convoluted with k vs. HT, shown in Figure 11. For events with three or more jets, since there is novisible HT dependence for either FQCD or k, we simply multiply their average values for HT > 200 GeV. Measuredvalues of k times FQCD are given in Table II. The procedure by which FQCD is determined as a function of HT
is important because the ratios between the four different regions of the E/T and I kinematic plane, calculated inseparate ranges of HT and then averaged, does not necessarily correspond to the same ratios taken while integratingover the full HT range. The uncertainties on the 1 and 2 jet events are conservatively taken as the difference betweenthe central value and the result of the straight product of FQCD and k. The straight product corresponds to ignoringthe HT dependence as well as any other variable’s dependence of FQCD and k.
16
[GeV]TH0 50 100 150 200 250 300
QC
DF
0
0.1
0.2
0.3
0.4
0.5Electron 1 jet event
[GeV]TH0 50 100 150 200 250 300
QC
DF
0
0.1
0.2
0.3
0.4
0.5Electron 2 jets event
[GeV]TH0 50 100 150 200 250 300
QC
DF
0
0.1
0.2
0.3
0.4
0.5 3 jets event≥Electron
[GeV]TH0 50 100 150 200 250 300
QC
DF
0
0.1
0.2
0.3Muon 1 jet event
[GeV]TH0 50 100 150 200 250 300
QC
DF
0
0.1
0.2
0.3Muon 2 jets event
[GeV]TH0 50 100 150 200 250 300
QC
DF
0
0.1
0.2
0.3 3 jets event≥Muon
FIG. 12: FQCD measured according to Equation 5 as a function of HT in electron events (top) and muon events (bottom) with(left to right) 1, 2 or ≥ 3 jets.
TABLE II: QCD fraction, given by Equation 5, and the HT-averaged product of k and the QCD fraction.
Jet multiplicity 1 jet 2 jet 3 jets ≥ 4 jets ≥ 3 jetsMuons
FQCD 0.03 ± 0.002 0.039 ± 0.004 0.023 ± 0.011 0.146 ± 0.088 0.044 ± 0.016〈kµ·FQCD〉 0.02 ± 0.07 0.05 ± 0.51 0.01 ± 0.01 0.09 ± 0.07 0.03 ± 0.02
ElectronsFQCD 0.145 ± 0.007 0.177 ± 0.010 0.135 ± 0.032 0.163 ± 0.051 0.145 ± 0.028
〈ke·FQCD〉 0.24 ± 0.31 0.41 ± 0.12 0.16 ± 0.046 0.20 ± 0.07 0.17 ± 0.04
C. Drell-Yan Background
Drell-Yan events can enter the sample when they are produced with jets and one muon is identified as the primarymuon while the second muon is close enough to a jet to be tagged. Residual Drell-Yan background that is not removedby the dimuon and sequential decay rejection described in Section III E, is estimated from the data. We use eventsinside the Z-mass window (76 − 106 GeV/c2), which are otherwise removed from the analysis by the Z-mass cut, to
measure the number of events that would pass all our selection requirements including the SLT tag, N tagsinside. Because
of the limited sample size of Z+jets events, we use Z + 0 jet events without the E/T and HT requirements to find
the ratio of events outside the Z-mass window to those inside the window, Rout/in
Z/γ∗, and a first-order estimate of the
number of expected Drell-Yan events outside of the Z-mass window is calculated as:
NDY = N tagsinside ·R
out/in
Z/γ∗. (7)
This estimate assumes that Rout/in
Z/γ∗does not depend on the number of jets in the event. We assign a systematic
uncertainty of 33% for this assumption based on the largest deviation between Rout/in
Z/γ∗for ALPGEN Z/γ∗ plus zero jet
events compared with 1, 2 or ≥3 jets events.The first-order estimate is then corrected by the relative efficiency inside and outside the Z-mass window of the E/T ,
HT, and SLT-jet requirements, which we measure using Z/γ∗+jets Monte Carlo events. The Drell-Yan backgroundestimates are listed in the sixth line of Table I.
17
D. Other Backgrounds
Remaining background sources are due to WW , WZ, ZZ, Z → ττ and single top production. Diboson events canenter the sample when there are two leptons from a Z and/or a W decay and jets. One lepton passes the primarylepton requirements while the second is available to pass the SLT requirement if it is close to a jet. The E/T in theseevents can either come from a W -boson decay or from an undetected lepton in a Z-boson decay. Z → ττ events canenter the sample when the Z is produced in association with jets and one τ decays to a high-PT isolated electronor muon, while the second τ produces an SLT muon in its decay. Electroweak single top production gives rise to anevent signature nearly identical to tt when there are additional jets from gluon radiation.
TABLE III: Summary of the expected number of background events for those sources derived from Monte Carlo simulations,and the cross sections used in Equation 8. The quoted uncertainties come from the respective Monte Carlo sample sizes andthe uncertainty on the theoretical cross sections.
1 jet 2 jets 3 jets ≥ 4 jets ≥ 3 jetsWW [23] 0.64±0.15 0.99±0.18 0.12±0.07 0.029±0.033 0.15±0.08WZ [23] 0.11±0.07 0.22±0.09 0.03±0.04 0.003±0.006 0.03±0.04ZZ [23] 0.013±0.010 0.025±0.015 0.007±0.007 0.004±0.004 0.010±0.010
Z → τ+τ− [24] 0.34±0.16 0.10±0.05 0.006±0.003 0.002±0.001 0.008±0.004Single top [25] 0.50 ± 0.03 0.94 ± 0.06 0.15 ± 0.01 0.035 ± 0.003 0.19 ± 0.01
None of the above background sources are completely accounted for by the application of the tag matrix to thepretag event sample because these backgrounds have a significant source of muons from, for instance, W and Z decay.Therefore, we independently estimate their contributions to the background using Monte Carlo samples normalizedto the cross sections referenced in Table III. In modeling the SLT tagging of such events in the Monte Carlo samples,we explicitly exclude the mistag contribution which is taken in to account in the application of the tag matrix to thepretag sample. The background for each source is estimated as:
Ni = σi ·Ai · ǫtag,i ·∫
Ldt, (8)
where σi is the theoretical cross section for the particular background source, Ai is the acceptance for passing thepretag event selection, ǫtag,i is the SLT tagging efficiency and
∫
Ldt is the integrated luminosity of the overall datasample. The expected background contributions are shown, as a function of jet multiplicity, in Table III.
V. TOTAL tt ACCEPTANCE
We factorize the efficiency for identifying tt events into the geometric times kinematic acceptance and the SLTtagging efficiency. The acceptance includes all the cuts described in Sections III C as well as the invariant mass cutdescribed in Section III E, and is evaluated assuming a top mass of 175 GeV/c2. The tagging efficiency is the efficiencyfor SLT-tagging at least one jet in events that pass the geometric and kinematic selection. We describe each piecebelow.
A. Geometric and Kinematic Acceptance
The acceptance is measured in a combination of data and Monte Carlo simulations. Simulations are done usingthe PYTHIA Monte Carlo program [13]. The primary lepton identification efficiency is measured in Z-boson decaysacquired with a trigger that requires a single high-PT electron or muon. The efficiency is measured using the leptonfrom the Z-boson decay that is unbiased by the trigger, and the identification efficiency in the Monte Carlo sample isscaled to that measured in the data [6]. The acceptance, as a function of the number of identified jets above 15 GeV,is shown in Table IV. These numbers include the measured efficiencies of the high-PT lepton triggers.
18
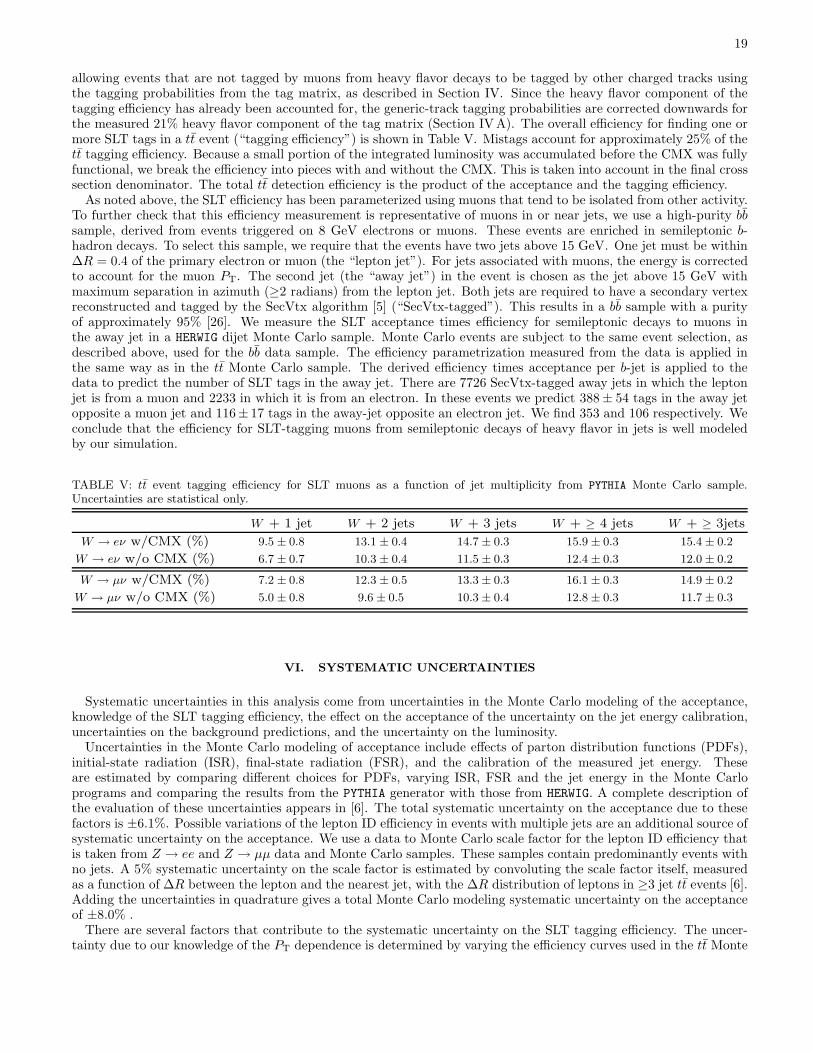
TABLE IV: Acceptance for tt events as a function of jet multiplicity from PYTHIA Monte Carlo sample, corrected for thedata/MC ratio for tight lepton ID efficiencies and the primary lepton trigger efficiency. The uncertainties listed are statisticalonly.
W+ 1 jet W + 2 jets W + 3 jets W + ≥ 4 jets W + ≥ 3 jetsW → eν (%) 0.204±0.005 1.05±0.01 1.79±0.02 2.27±0.02 4.06±0.02
W → µν (CMUP) (%) 0.095±0.003 0.501±0.007 0.861±0.007 1.12±0.01 1.98±0.01W → µν (CMX) (%) 0.045±0.002 0.235±0.006 0.388±0.007 0.507±0.008 0.90±0.01
B. SLT Efficiency
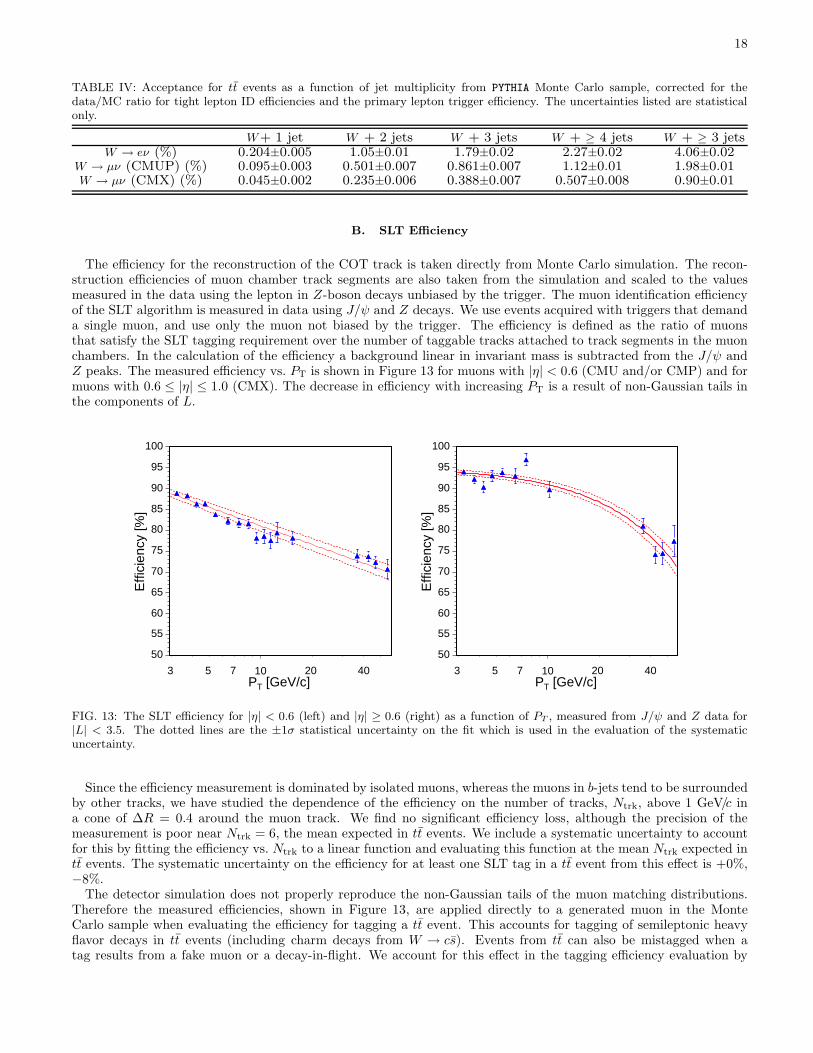
The efficiency for the reconstruction of the COT track is taken directly from Monte Carlo simulation. The recon-struction efficiencies of muon chamber track segments are also taken from the simulation and scaled to the valuesmeasured in the data using the lepton in Z-boson decays unbiased by the trigger. The muon identification efficiencyof the SLT algorithm is measured in data using J/ψ and Z decays. We use events acquired with triggers that demanda single muon, and use only the muon not biased by the trigger. The efficiency is defined as the ratio of muonsthat satisfy the SLT tagging requirement over the number of taggable tracks attached to track segments in the muonchambers. In the calculation of the efficiency a background linear in invariant mass is subtracted from the J/ψ andZ peaks. The measured efficiency vs. PT is shown in Figure 13 for muons with |η| < 0.6 (CMU and/or CMP) and formuons with 0.6 ≤ |η| ≤ 1.0 (CMX). The decrease in efficiency with increasing PT is a result of non-Gaussian tails inthe components of L.
[GeV/c]TP10
Effi
cien
cy [%
]
50
55
60
65
70
75
80
85
90
95
100
3 5 7 20 40 [GeV/c]TP
10
Effi
cien
cy [%
]
50
55
60
65
70
75
80
85
90
95
100
3 5 7 20 40
FIG. 13: The SLT efficiency for |η| < 0.6 (left) and |η| ≥ 0.6 (right) as a function of PT , measured from J/ψ and Z data for|L| < 3.5. The dotted lines are the ±1σ statistical uncertainty on the fit which is used in the evaluation of the systematicuncertainty.
Since the efficiency measurement is dominated by isolated muons, whereas the muons in b-jets tend to be surroundedby other tracks, we have studied the dependence of the efficiency on the number of tracks, Ntrk, above 1 GeV/c ina cone of ∆R = 0.4 around the muon track. We find no significant efficiency loss, although the precision of themeasurement is poor near Ntrk = 6, the mean expected in tt events. We include a systematic uncertainty to accountfor this by fitting the efficiency vs. Ntrk to a linear function and evaluating this function at the mean Ntrk expected intt events. The systematic uncertainty on the efficiency for at least one SLT tag in a tt event from this effect is +0%,−8%.
The detector simulation does not properly reproduce the non-Gaussian tails of the muon matching distributions.Therefore the measured efficiencies, shown in Figure 13, are applied directly to a generated muon in the MonteCarlo sample when evaluating the efficiency for tagging a tt event. This accounts for tagging of semileptonic heavyflavor decays in tt events (including charm decays from W → cs). Events from tt can also be mistagged when atag results from a fake muon or a decay-in-flight. We account for this effect in the tagging efficiency evaluation by
19
allowing events that are not tagged by muons from heavy flavor decays to be tagged by other charged tracks usingthe tagging probabilities from the tag matrix, as described in Section IV. Since the heavy flavor component of thetagging efficiency has already been accounted for, the generic-track tagging probabilities are corrected downwards forthe measured 21% heavy flavor component of the tag matrix (Section IVA). The overall efficiency for finding one ormore SLT tags in a tt event (“tagging efficiency”) is shown in Table V. Mistags account for approximately 25% of thett tagging efficiency. Because a small portion of the integrated luminosity was accumulated before the CMX was fullyfunctional, we break the efficiency into pieces with and without the CMX. This is taken into account in the final crosssection denominator. The total tt detection efficiency is the product of the acceptance and the tagging efficiency.
As noted above, the SLT efficiency has been parameterized using muons that tend to be isolated from other activity.To further check that this efficiency measurement is representative of muons in or near jets, we use a high-purity bbsample, derived from events triggered on 8 GeV electrons or muons. These events are enriched in semileptonic b-hadron decays. To select this sample, we require that the events have two jets above 15 GeV. One jet must be within∆R = 0.4 of the primary electron or muon (the “lepton jet”). For jets associated with muons, the energy is correctedto account for the muon PT. The second jet (the “away jet”) in the event is chosen as the jet above 15 GeV withmaximum separation in azimuth (≥2 radians) from the lepton jet. Both jets are required to have a secondary vertexreconstructed and tagged by the SecVtx algorithm [5] (“SecVtx-tagged”). This results in a bb sample with a purityof approximately 95% [26]. We measure the SLT acceptance times efficiency for semileptonic decays to muons inthe away jet in a HERWIG dijet Monte Carlo sample. Monte Carlo events are subject to the same event selection, asdescribed above, used for the bb data sample. The efficiency parametrization measured from the data is applied inthe same way as in the tt Monte Carlo sample. The derived efficiency times acceptance per b-jet is applied to thedata to predict the number of SLT tags in the away jet. There are 7726 SecVtx-tagged away jets in which the leptonjet is from a muon and 2233 in which it is from an electron. In these events we predict 388± 54 tags in the away jetopposite a muon jet and 116± 17 tags in the away-jet opposite an electron jet. We find 353 and 106 respectively. Weconclude that the efficiency for SLT-tagging muons from semileptonic decays of heavy flavor in jets is well modeledby our simulation.
TABLE V: tt event tagging efficiency for SLT muons as a function of jet multiplicity from PYTHIA Monte Carlo sample.Uncertainties are statistical only.
W + 1 jet W + 2 jets W + 3 jets W + ≥ 4 jets W + ≥ 3jets
W → eν w/CMX (%) 9.5 ± 0.8 13.1 ± 0.4 14.7 ± 0.3 15.9 ± 0.3 15.4 ± 0.2
W → eν w/o CMX (%) 6.7 ± 0.7 10.3 ± 0.4 11.5 ± 0.3 12.4 ± 0.3 12.0 ± 0.2
W → µν w/CMX (%) 7.2 ± 0.8 12.3 ± 0.5 13.3 ± 0.3 16.1 ± 0.3 14.9 ± 0.2
W → µν w/o CMX (%) 5.0 ± 0.8 9.6 ± 0.5 10.3 ± 0.4 12.8 ± 0.3 11.7 ± 0.3
VI. SYSTEMATIC UNCERTAINTIES
Systematic uncertainties in this analysis come from uncertainties in the Monte Carlo modeling of the acceptance,knowledge of the SLT tagging efficiency, the effect on the acceptance of the uncertainty on the jet energy calibration,uncertainties on the background predictions, and the uncertainty on the luminosity.
Uncertainties in the Monte Carlo modeling of acceptance include effects of parton distribution functions (PDFs),initial-state radiation (ISR), final-state radiation (FSR), and the calibration of the measured jet energy. Theseare estimated by comparing different choices for PDFs, varying ISR, FSR and the jet energy in the Monte Carloprograms and comparing the results from the PYTHIA generator with those from HERWIG. A complete description ofthe evaluation of these uncertainties appears in [6]. The total systematic uncertainty on the acceptance due to thesefactors is ±6.1%. Possible variations of the lepton ID efficiency in events with multiple jets are an additional source ofsystematic uncertainty on the acceptance. We use a data to Monte Carlo scale factor for the lepton ID efficiency thatis taken from Z → ee and Z → µµ data and Monte Carlo samples. These samples contain predominantly events withno jets. A 5% systematic uncertainty on the scale factor is estimated by convoluting the scale factor itself, measuredas a function of ∆R between the lepton and the nearest jet, with the ∆R distribution of leptons in ≥3 jet tt events [6].Adding the uncertainties in quadrature gives a total Monte Carlo modeling systematic uncertainty on the acceptanceof ±8.0% .
There are several factors that contribute to the systematic uncertainty on the SLT tagging efficiency. The uncer-tainty due to our knowledge of the PT dependence is determined by varying the efficiency curves used in the tt Monte
20
Carlo sample according to the upper and lower bands in Figures 13. We find that the tagging efficiency for tt changesby ±1% from its central value. An additional source of systematic uncertainty for the tagging efficiency comes fromthe fact that we implicitly use the Monte Carlo tracking efficiency for taggable tracks. As these tracks can be in denseenvironments in or near jets, we expect the efficiency to be somewhat less than for isolated tracks. Studies done byembedding Monte Carlo tracks in jets in both data and Monte Carlo events indicate that the Monte Carlo trackingefficiency in dense environments is a few percent higher than in data. We assign a ±5% systematic uncertainty to thetagging efficiency for this effect. As described in Section VB the systematic uncertainty due to the modeling of theisolation dependence of the tagging efficiency is +0%, −8%. Finally, the statistical uncertainty on the measurementof the SLT tagging efficiency in tt events, differences between PYTHIA and HERWIG, the uncertainty on the semileptonicbranching fraction for B mesons and the estimation of the heavy flavor content of the mistag matrix also contributeto the systematic uncertainties. Adding these contributions in quadrature gives an overall systematic uncertainty forthe tagging efficiency of +8%, −11%. Note that the uncertainty on the tagging efficiency affects also the backgroundsdetermination. The reason is that tt events need to be subtracted from the pretag sample which is used in Equation 3to determine the W+jets background. We take this effect into account when calculating the uncertainty on the crosssection.
Uncertainties on the tag matrix are determined by the level of agreement between observed tags and predictions ina variety of samples, as described in Section IV. The uncertainty on the W+fakes and Wbb+Wcc+Wc predictionis ±10%.
To determine the uncertainties on the QCD background prediction in events with three or more jets, we define acontrol sample from the E/T vs. lepton isolation plane, where the primary lepton isolation parameter I is between0.1 and 0.2 and the event has E/T > 20 GeV. After subtracting expected contributions from W and tt events, allevents in this region are expected to be QCD. We determine the systematic uncertainty on the QCD backgroundusing the ratio of the observed over predicted number of events in this control region, which should be 1.0. In thesample where the primary lepton is a muon, we measure 0.5±0.4. In the sample where the primary lepton is anelectron, we measure 0.8±0.2. A 50% systematic uncertainty is assigned to the FQCD measurement for muons and20% for electrons. We combine this with the statistical uncertainty on FQCD, the uncertainty on the correction factork, both given in Table II and the 10% systematic uncertainty due to the application of the tag matrix. The totalQCD background uncertainty is ±67% and ±19% for muons and electrons, respectively. These values are determinedtaking into account the correlation between the estimate of the QCD background and the estimate of the W+fakesand W+heavy flavor backgrounds (Equations 4 and 6). We add in quadrature the separate effects on the cross sectionof the QCD uncertainties for electrons and muons.
The systematic uncertainty on the small Drell-Yan background is dominated by its statistical uncertainty. We alsoinclude a 33% relative uncertainty to account for changes in the shape of the Drell-Yan spectrum with the number ofjets in the event, as described in Section IVC. Uncertainties on the Monte Carlo background predictions come fromuncertainties in the cross sections for the various processes and from the event sizes of the Monte Carlo samples.
The systematic uncertainties and the corresponding shift of the measured cross section value are summarized inTable VI.
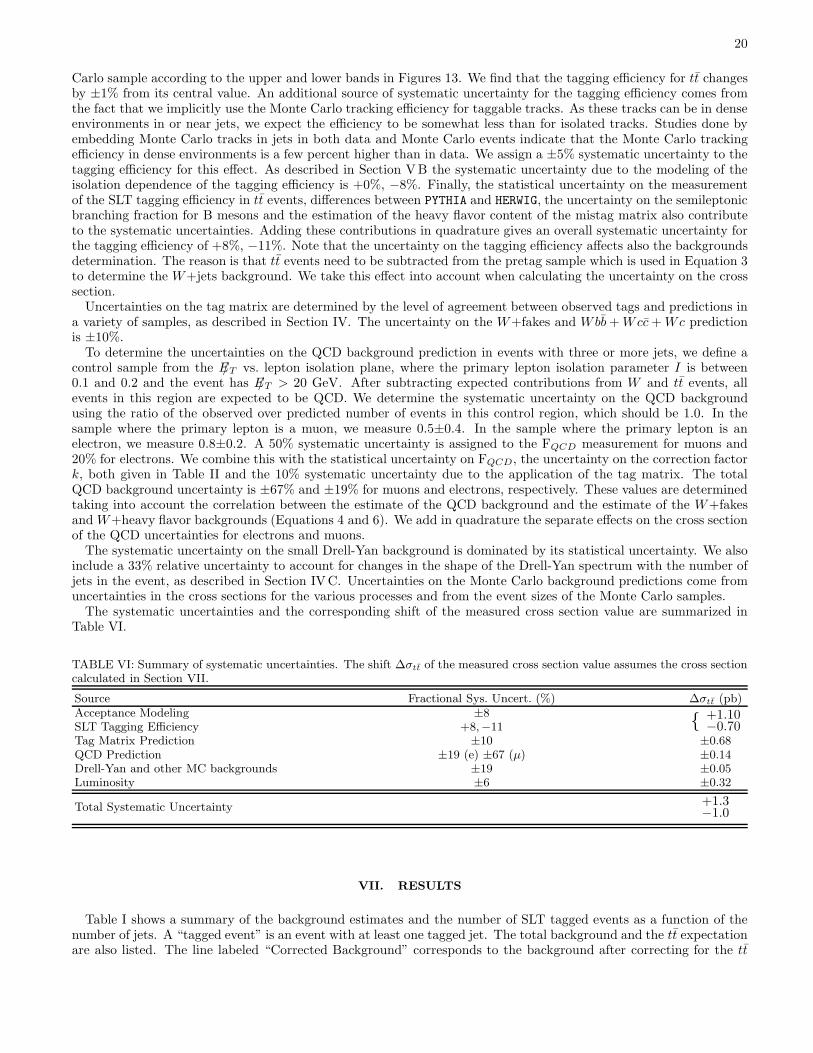
TABLE VI: Summary of systematic uncertainties. The shift ∆σtt of the measured cross section value assumes the cross sectioncalculated in Section VII.
Source Fractional Sys. Uncert. (%) ∆σtt (pb)Acceptance Modeling ±8 { +1.10
−0.70SLT Tagging Efficiency +8,−11Tag Matrix Prediction ±10 ±0.68QCD Prediction ±19 (e) ±67 (µ) ±0.14Drell-Yan and other MC backgrounds ±19 ±0.05Luminosity ±6 ±0.32
Total Systematic Uncertainty +1.3−1.0
VII. RESULTS
Table I shows a summary of the background estimates and the number of SLT tagged events as a function of thenumber of jets. A “tagged event” is an event with at least one tagged jet. The total background and the tt expectationare also listed. The line labeled “Corrected Background” corresponds to the background after correcting for the tt
21
content of the pretag sample, as described in Section IVA.We calculate the cross section as:
σtt =Nobs −Nbgnd
Att ·∫
Ldt , (9)
whereNobs is the number of events with ≥ 3 jets that are tagged with at least 1 SLT,Nbgnd is the corrected backgroundand Att is the total acceptance (geometrical acceptance times kinematic acceptance times tagging efficiency), takenfrom Tables IV and V. For events with three or more jets, the total denominator is 1.98 ± 0.28 pb−1.
From the number of candidate events with three or more jets, we find a total tt production cross section of
σ(pp→ tt) = 5.3 ± 3.3 +1.3−1.0 pb,
where the first uncertainty is statistical and the second is systematic. This cross section value uses acceptances andtagging efficiencies appropriate for a top mass of 175 GeV/c2. The acceptances and efficiencies, and therefore thecalculated cross section, change slightly for other assumed top masses. The calculated cross section is 1% higherassuming a top mass of 170 GeV/c2, and 5% lower assuming a top mass of 180 GeV/c2.
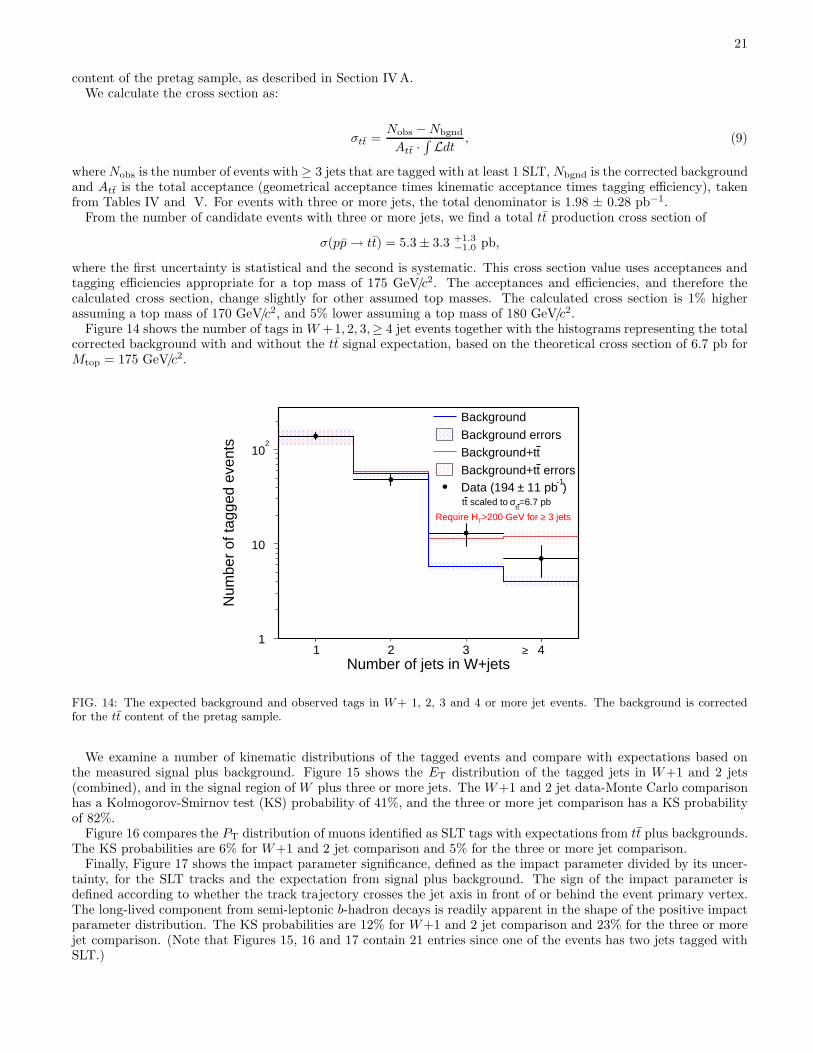
Figure 14 shows the number of tags in W +1, 2, 3,≥ 4 jet events together with the histograms representing the totalcorrected background with and without the tt signal expectation, based on the theoretical cross section of 6.7 pb forMtop = 175 GeV/c2.
Number of jets in W+jets1 2 3 4
Num
ber
of ta
gged
eve
nts
1
10
102
Background
Background errorstBackground+t
errorstBackground+t)
-1 11 pb±Data (194
=6.7 pbtt
σ scaled to tt
≥
3 jets≥>200 GeV for TRequire H
FIG. 14: The expected background and observed tags in W+ 1, 2, 3 and 4 or more jet events. The background is correctedfor the tt content of the pretag sample.
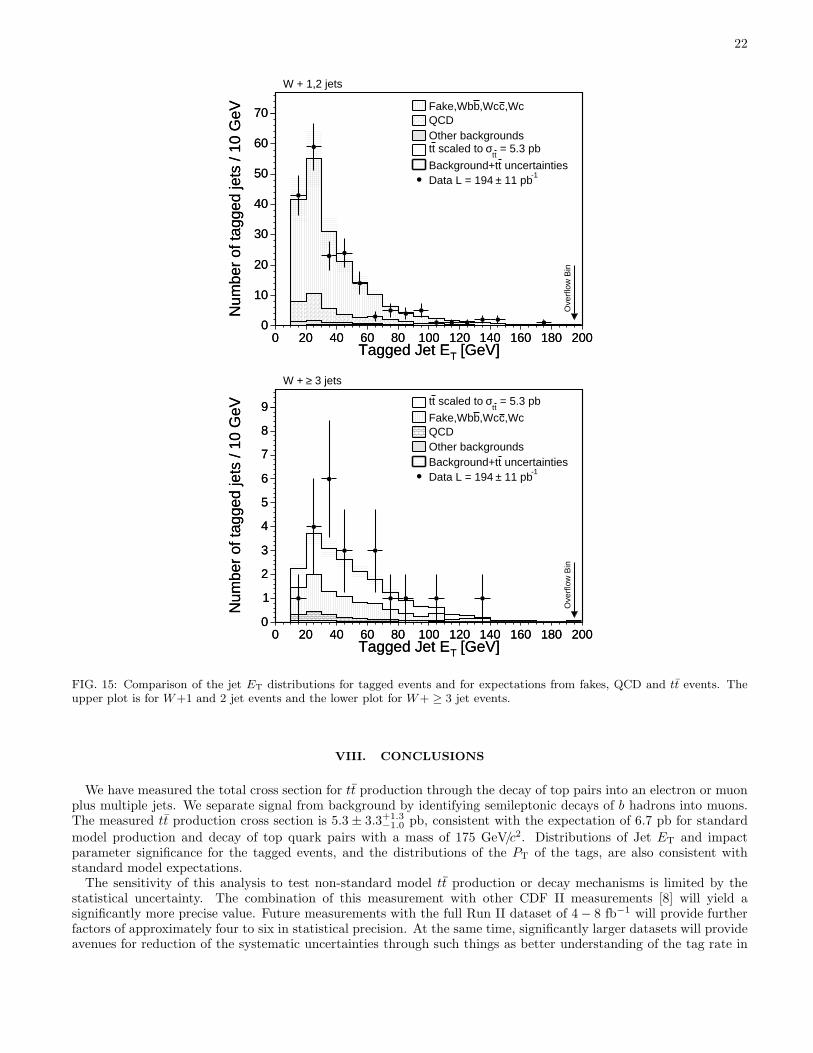
We examine a number of kinematic distributions of the tagged events and compare with expectations based onthe measured signal plus background. Figure 15 shows the ET distribution of the tagged jets in W+1 and 2 jets(combined), and in the signal region of W plus three or more jets. The W+1 and 2 jet data-Monte Carlo comparisonhas a Kolmogorov-Smirnov test (KS) probability of 41%, and the three or more jet comparison has a KS probabilityof 82%.
Figure 16 compares the PT distribution of muons identified as SLT tags with expectations from tt plus backgrounds.The KS probabilities are 6% for W+1 and 2 jet comparison and 5% for the three or more jet comparison.
Finally, Figure 17 shows the impact parameter significance, defined as the impact parameter divided by its uncer-tainty, for the SLT tracks and the expectation from signal plus background. The sign of the impact parameter isdefined according to whether the track trajectory crosses the jet axis in front of or behind the event primary vertex.The long-lived component from semi-leptonic b-hadron decays is readily apparent in the shape of the positive impactparameter distribution. The KS probabilities are 12% for W+1 and 2 jet comparison and 23% for the three or morejet comparison. (Note that Figures 15, 16 and 17 contain 21 entries since one of the events has two jets tagged withSLT.)
22
[GeV] TTagged Jet E0 20 40 60 80 100 120 140 160 180 200
Num
ber
of ta
gged
jets
/ 10
GeV
0
10
20
30
40
50
60
70
[GeV] TTagged Jet E0 20 40 60 80 100 120 140 160 180 200
Num
ber
of ta
gged
jets
/ 10
GeV
0
10
20
30
40
50
60
70 ,Wcc,WcbFake,WbQCDOther backgrounds
= 5.3 pbtt
σ scaled to tt
uncertaintiestBackground+t-1
11 pb±Data L = 194
W + 1,2 jets
Ove
rflo
w B
in
[GeV] TTagged Jet E0 20 40 60 80 100 120 140 160 180 200
Num
ber
of ta
gged
jets
/ 10
GeV
0
1
2
3
4
5
6
7
8
9
[GeV] TTagged Jet E0 20 40 60 80 100 120 140 160 180 200
Num
ber
of ta
gged
jets
/ 10
GeV
0
1
2
3
4
5
6
7
8
9 = 5.3 pbtt
σ scaled to tt
,Wcc,WcbFake,WbQCDOther backgrounds
uncertaintiestBackground+t-1
11 pb±Data L = 194
3 jets≥W +
Ove
rflo
w B
in
FIG. 15: Comparison of the jet ET distributions for tagged events and for expectations from fakes, QCD and tt events. Theupper plot is for W+1 and 2 jet events and the lower plot for W+ ≥ 3 jet events.
VIII. CONCLUSIONS
We have measured the total cross section for tt production through the decay of top pairs into an electron or muonplus multiple jets. We separate signal from background by identifying semileptonic decays of b hadrons into muons.The measured tt production cross section is 5.3 ± 3.3+1.3
−1.0 pb, consistent with the expectation of 6.7 pb for standard
model production and decay of top quark pairs with a mass of 175 GeV/c2. Distributions of Jet ET and impactparameter significance for the tagged events, and the distributions of the PT of the tags, are also consistent withstandard model expectations.
The sensitivity of this analysis to test non-standard model tt production or decay mechanisms is limited by thestatistical uncertainty. The combination of this measurement with other CDF II measurements [8] will yield asignificantly more precise value. Future measurements with the full Run II dataset of 4 − 8 fb−1 will provide furtherfactors of approximately four to six in statistical precision. At the same time, significantly larger datasets will provideavenues for reduction of the systematic uncertainties through such things as better understanding of the tag rate in
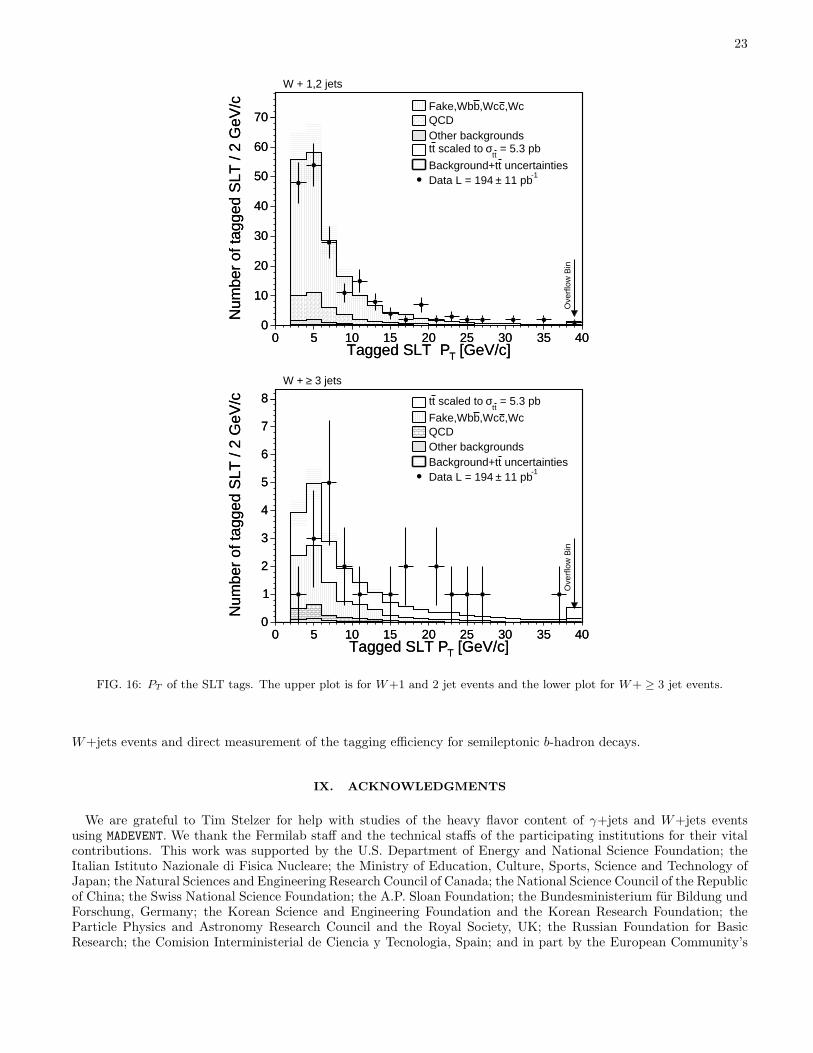
23
[GeV/c] TTagged SLT P0 5 10 15 20 25 30 35 40
Num
ber
of ta
gged
SLT
/ 2
GeV
/c
0
10
20
30
40
50
60
70
[GeV/c] TTagged SLT P0 5 10 15 20 25 30 35 40
Num
ber
of ta
gged
SLT
/ 2
GeV
/c
0
10
20
30
40
50
60
70,Wcc,WcbFake,Wb
QCDOther backgrounds
= 5.3 pbtt
σ scaled to tt
uncertaintiestBackground+t-1
11 pb±Data L = 194
W + 1,2 jets
Ove
rflo
w B
in
[GeV/c] TTagged SLT P0 5 10 15 20 25 30 35 40
Num
ber
of ta
gged
SLT
/ 2
GeV
/c
0
1
2
3
4
5
6
7
8
[GeV/c] TTagged SLT P0 5 10 15 20 25 30 35 40
Num
ber
of ta
gged
SLT
/ 2
GeV
/c
0
1
2
3
4
5
6
7
8 = 5.3 pbtt
σ scaled to tt
,Wcc,WcbFake,WbQCDOther backgrounds
uncertaintiestBackground+t-1
11 pb±Data L = 194
3 jets≥W +
Ove
rflo
w B
in
FIG. 16: PT of the SLT tags. The upper plot is for W+1 and 2 jet events and the lower plot for W+ ≥ 3 jet events.
W+jets events and direct measurement of the tagging efficiency for semileptonic b-hadron decays.
IX. ACKNOWLEDGMENTS
We are grateful to Tim Stelzer for help with studies of the heavy flavor content of γ+jets and W+jets eventsusing MADEVENT. We thank the Fermilab staff and the technical staffs of the participating institutions for their vitalcontributions. This work was supported by the U.S. Department of Energy and National Science Foundation; theItalian Istituto Nazionale di Fisica Nucleare; the Ministry of Education, Culture, Sports, Science and Technology ofJapan; the Natural Sciences and Engineering Research Council of Canada; the National Science Council of the Republicof China; the Swiss National Science Foundation; the A.P. Sloan Foundation; the Bundesministerium fur Bildung undForschung, Germany; the Korean Science and Engineering Foundation and the Korean Research Foundation; theParticle Physics and Astronomy Research Council and the Royal Society, UK; the Russian Foundation for BasicResearch; the Comision Interministerial de Ciencia y Tecnologia, Spain; and in part by the European Community’s
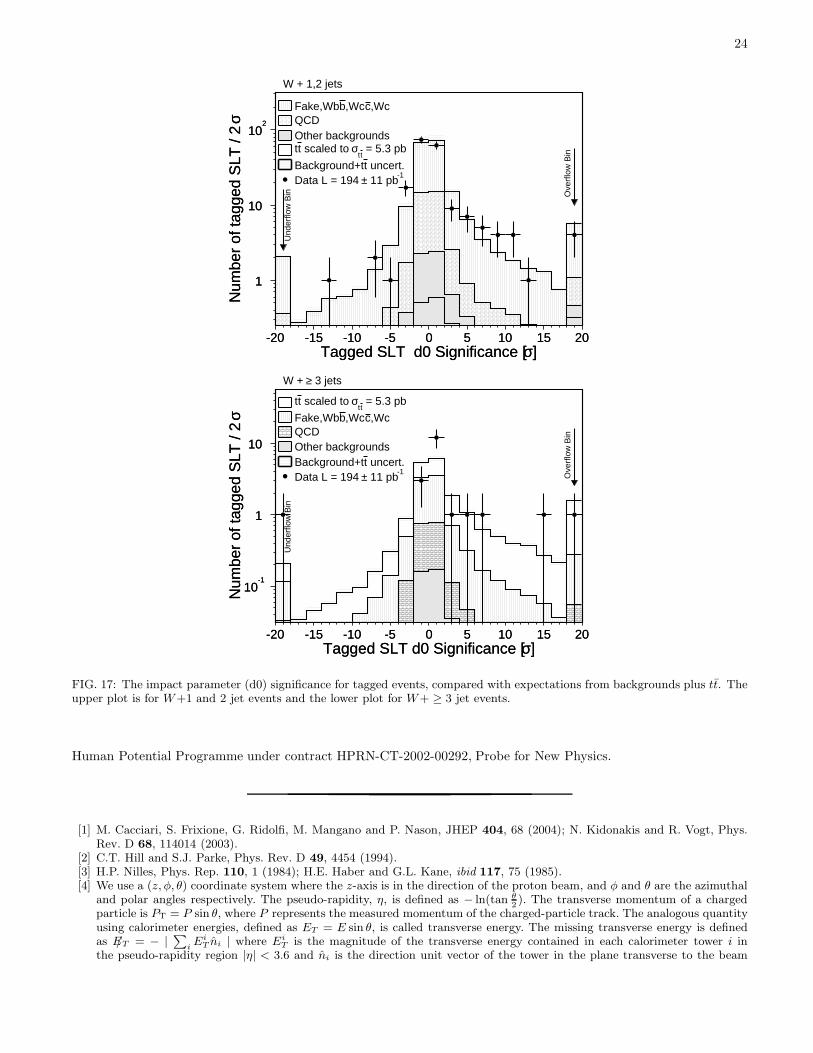
24
]σTagged SLT d0 Significance [-20 -15 -10 -5 0 5 10 15 20
σN
umbe
r of
tagg
ed S
LT /
2
1
10
102
]σTagged SLT d0 Significance [-20 -15 -10 -5 0 5 10 15 20
σN
umbe
r of
tagg
ed S
LT /
2
1
10
102
,Wcc,WcbFake,WbQCDOther backgrounds
= 5.3 pbtt
σ scaled to tt
uncert.tBackground+t-1
11 pb±Data L = 194
W + 1,2 jets
Und
erflo
w B
in Ove
rflo
w B
in
]σTagged SLT d0 Significance [-20 -15 -10 -5 0 5 10 15 20
σN
umbe
r of
tagg
ed S
LT /
2
10-1
1
10
]σTagged SLT d0 Significance [-20 -15 -10 -5 0 5 10 15 20
σN
umbe
r of
tagg
ed S
LT /
2
10-1
1
10
= 5.3 pbtt
σ scaled to tt
,Wcc,WcbFake,WbQCDOther backgrounds
uncert.tBackground+t-1
11 pb±Data L = 194
3 jets≥W +
Und
erflo
w B
in
Ove
rflo
w B
in
FIG. 17: The impact parameter (d0) significance for tagged events, compared with expectations from backgrounds plus tt. Theupper plot is for W+1 and 2 jet events and the lower plot for W+ ≥ 3 jet events.
Human Potential Programme under contract HPRN-CT-2002-00292, Probe for New Physics.
[1] M. Cacciari, S. Frixione, G. Ridolfi, M. Mangano and P. Nason, JHEP 404, 68 (2004); N. Kidonakis and R. Vogt, Phys.Rev. D 68, 114014 (2003).
[2] C.T. Hill and S.J. Parke, Phys. Rev. D 49, 4454 (1994).[3] H.P. Nilles, Phys. Rep. 110, 1 (1984); H.E. Haber and G.L. Kane, ibid 117, 75 (1985).[4] We use a (z, φ, θ) coordinate system where the z-axis is in the direction of the proton beam, and φ and θ are the azimuthal
and polar angles respectively. The pseudo-rapidity, η, is defined as − ln(tan θ2). The transverse momentum of a charged
particle is PT = P sin θ, where P represents the measured momentum of the charged-particle track. The analogous quantityusing calorimeter energies, defined as ET = E sin θ, is called transverse energy. The missing transverse energy is definedas E/T = − |
∑
iEi
T ni | where EiT is the magnitude of the transverse energy contained in each calorimeter tower i in
the pseudo-rapidity region |η| < 3.6 and ni is the direction unit vector of the tower in the plane transverse to the beam
25
direction.[5] D. Acosta et al., Phys. Rev. D 71, 052003 (2005).[6] D. Acosta et al., arXiv:hep-ex/0504053. Submitted to Phys. Rev. D.[7] D. Acosta et al. Phys. Rev. D 71 072005 (2005).[8] D. Acosta et al. To be submitted to Phys. Rev. Lett.[9] T. Affolder et al., Phys. Rev. D 64, 032002 (2001); V.M. Abazov et al., Phys. Rev. D 67, 012004 (2003).
[10] The CDF II Detector Technical Design Report, Fermilab-Pub-96/390-E ; D. Acosta et al., Phys. Rev. D71, 032001 (2005).[11] S. Klimenko, J. Konigsberg and T.M. Liss, Fermilab-FN-0741.[12] D. Acosta et al., Inclusive W and Z Cross Sections from Run II of the Tevatron Collider, to be submitted to Phys. Rev.
D .[13] T. Sjostrand et al., Comput. Phys. Commun. 135, 238 (2001).[14] G. Corcella et al., JHEP 01, 10 (2001).[15] J. Pumplin, et al., Eur. Phys. J. C12, 375 (2000).[16] P. Avery, K. Read and G. Trahern, CLEO Report CSN-212 (1985). Unpublished.[17] M. Mangano et al., JHEP 07, 001 (2003).[18] R. Brun and F. Carminati, CERN Programming Library Long Writeup W5013 (1993).[19] T. Affolder et al., Nucl. Instrum. and Methods A 526, 249 (2004).[20] G. Grindhammer, M. Rudowicz and S. Peters, Nucl. Instrum. and Methods A 290, 469 (1990).[21] E. Gerchtein and M. Paulini, ECONF C0303241, TUMT005 (2003), arXiv:physics/0306031.[22] F. Maltoni and T. Stelzer, MADEVENT: Automatic Event Generation with MADGRAPH, JHEP 0302:027 (2003).[23] J. Campbell and R. Ellis, Phys. Rev. D 60, 113006 (1999).[24] D. Acosta et al., Phys. Rev. Lett. 94, 091803 (2005).[25] B. Harris, E. Laenen, L. Phaf, Z. Sullivan and S. Weinzierl, Phys. Rev. D 66, 054024 (2002).[26] D. Acosta et al., FERMILAB-PUB-04-370-E. Submitted to Phys. Rev. D.
Copyright © 2022 FDOKUMEN