Measurement of particle velocity and characterization of deposition in aluminum alloy kinetic...
10
Measurement of particle velocity and characterization of deposition in aluminum alloy kinetic spraying process Jingwei Wu a , Hongyuan Fang a , Sanghoon Yoon b , HyungJun Kim c , Changhee Lee b, * a State Key Lab of Advanced Welding Production Technology, Harbin Institute of Technology, 150001 Harbin, Heilongjiang, PR China b Division of Materials Science and Engineering, Hanyang University, 17 Haengdang-dong, Seongdong-ku, Seoul 133-791, South Korea c Welding Research Center, Research Institute of Industrial Science and Technology, Pohang, South Korea Received 9 November 2004; received in revised form 17 February 2005; accepted 17 February 2005 Available online 2 April 2005 Abstract Particle velocity is a very important parameter in kinetic spraying (or cold gas dynamic spraying). It is difficult to measure the velocity of a particle with supersonic speed at low temperature (lower than 500 8C). Thus, in many investigations only estimated values are used for evaluating coating processes. In this paper, the modeling of particle acceleration was reviewed, and the measurement of in-flight particle velocity in a kinetic spraying process was performed. Particle velocity and flux distributions from different process gas temperatures and pressures were investigated. The influences of process gas temperature and pressure on particle velocity were discussed. Characteristic of Al–Si feedstock deposition onto a mild steel substrate was described by comparing coatings structures with the in-flight particle conditions. The deposition behavior showed two critical particle velocities for Al–Si powder deposition onto a substrate and for particle–particle bonding. # 2005 Elsevier B.V. All rights reserved. PACS: 104570 Keywords: Kinetic spraying; Cold gas dynamic spraying; Particle velocity; Deposition; Critical velocity 1. Introduction During kinetic spraying processes, small solid particles are accelerated to supersonic velocity and impinged onto a substrate. The kinetic energy of high velocity particles is a major factor in impinging and deformation behaviors. Critical particle velocity is accepted for characterizing this spray technique [1–3]. Numerous experimental studies have shown that particles require a minimum critical velocity in order to deposit onto a substrate. The data suggested that higher impact velocities yield better coating bond strength, and lower porosity in the coatings [4,5]. www.elsevier.com/locate/apsusc Applied Surface Science 252 (2005) 1368–1377 * Corresponding author. Tel.: +82 2 2290 0388. E-mail address: [email protected] (C. Lee). 0169-4332/$ – see front matter # 2005 Elsevier B.V. All rights reserved. doi:10.1016/j.apsusc.2005.02.108
-
Upload
independent -
Category
Documents
-
view
3 -
download
0
Transcript of Measurement of particle velocity and characterization of deposition in aluminum alloy kinetic...

www.elsevier.com/locate/apsusc
Applied Surface Science 252 (2005) 1368–1377
Measurement of particle velocity and characterization of
deposition in aluminum alloy kinetic spraying process
Jingwei Wu a, Hongyuan Fang a, Sanghoon Yoon b,HyungJun Kim c, Changhee Lee b,*
a State Key Lab of Advanced Welding Production Technology, Harbin Institute of Technology, 150001 Harbin, Heilongjiang, PR ChinabDivision of Materials Science and Engineering, Hanyang University, 17 Haengdang-dong,
Seongdong-ku, Seoul 133-791, South KoreacWelding Research Center, Research Institute of Industrial Science and Technology, Pohang, South Korea
Received 9 November 2004; received in revised form 17 February 2005; accepted 17 February 2005
Available online 2 April 2005
Abstract
Particle velocity is a very important parameter in kinetic spraying (or cold gas dynamic spraying). It is difficult to measure the
velocity of a particle with supersonic speed at low temperature (lower than 500 8C). Thus, in many investigations only estimated
values are used for evaluating coating processes. In this paper, the modeling of particle acceleration was reviewed, and the
measurement of in-flight particle velocity in a kinetic spraying process was performed. Particle velocity and flux distributions
from different process gas temperatures and pressures were investigated. The influences of process gas temperature and pressure
on particle velocity were discussed. Characteristic of Al–Si feedstock deposition onto a mild steel substrate was described by
comparing coatings structures with the in-flight particle conditions. The deposition behavior showed two critical particle
velocities for Al–Si powder deposition onto a substrate and for particle–particle bonding.
# 2005 Elsevier B.V. All rights reserved.
PACS: 104570
Keywords: Kinetic spraying; Cold gas dynamic spraying; Particle velocity; Deposition; Critical velocity
1. Introduction
During kinetic spraying processes, small solid
particles are accelerated to supersonic velocity and
impinged onto a substrate. The kinetic energy of high
* Corresponding author. Tel.: +82 2 2290 0388.
E-mail address: [email protected] (C. Lee).
0169-4332/$ – see front matter # 2005 Elsevier B.V. All rights reserved
doi:10.1016/j.apsusc.2005.02.108
velocity particles is a major factor in impinging and
deformation behaviors. Critical particle velocity is
accepted for characterizing this spray technique [1–3].
Numerous experimental studies have shown that
particles require a minimum critical velocity in order
to deposit onto a substrate. The data suggested that
higher impact velocities yield better coating bond
strength, and lower porosity in the coatings [4,5].
.

J. Wu et al. / Applied Surface Science 252 (2005) 1368–1377 1369
For system optimization and nozzle design, many
studies have focused on flying particle behaviors. In
the early work of Dykhuizen et al. [6], the effect of
Mach number (speed of sound) on particle velocity
was investigated based on an isentropic gas flow
model. In another study by Dykhuizen [4], particle
acceleration and deceleration models were discussed.
Van Steenkiste et al. [5,7] built a simple one-
dimensional model for particle velocity and tempera-
ture computations. Another numerical simulation of
gas and particles flow of the kinetic spraying process
was done by Voyer et al. [8].
During the kinetic spraying process, high-pressure
and pre-heated gas obtains a supersonic velocity by
passing through the throat region of de Laval type
nozzle. In the isentropic gas flow model, sonic
conditions of flow gas were only obtained for
sufficient stagnation gas pressures [6]. After the sonic
condition is obtained, increasing the pressure does not
result in an increase in gas velocity upstream of the
throat [7]. In this model, the gas velocity ng can be
expressed as:
ng ¼ Mns ¼ M
ffiffiffiffiffiffiffiffiffigRT
Mw
r(1)
where M is local Mach number, ns is the speed of
sound, g is the ratio of specific heats. For monatomic
gases g is 1.66, and for diatomic gases g is typically
1.4. R is the gas constant (8314 J/kmol K). T is gas
temperature andMw is the molecular weight of the gas.
Local Mach numberM only depends on the inner form
of the nozzle, the calculation of which is presented by
Dykhuizen [4,6] in detail.
In one-dimensional numerical models about par-
ticle acceleration the by high speed gas [4,8], particle
velocity can be calculated by a drag force on a single
particle in a fluid flow. When nitrogen is used as the
process gas, Alkhimov et al. [9] obtained an empirical
equation which includes the particle velocity, the gas
velocity and the gas pressure:
np ¼ng
1þ 0:85ffiffiffiDx
q ffiffiffiffiffiffiffirpn
2g
P0
q (2)
Here np is the particle velocity, P0 is the nitrogen
supply pressure measured at entrance of the nozzle, rpis the particle density, D is the particle diameter, and x
is the axial position. When we replace the gas velocity
with Eq. (1), the simple empirical correlation of the
particle velocity, the gas temperature and pressure can
be rewritten as:
np ¼1
1M
ffiffiffiffiffiffiffiMN2
gRT
qþ 0:85
ffiffiffiDx
q ffiffiffiffirpP0
q (3)
whereMN2is the molecular weight of the nitrogen gas.
Particle acceleration and particle velocity can be
obtained from the isentropic gas flow model and one-
dimensional numerical particle acceleration model.
However, there has never been detailed investigation
about the velocity distribution of in-flight particles.
Even more, there is little experimental data available
about the velocity distribution of in-flight particles. In
current study, a professional velocity measuring
device is used, and experimental velocity measure-
ment results are shown. Aluminum alloy feedstock
deposition behaviors are observed, and an analysis of
deposition characteristic to in-flight particle condition
is conducted.
2. Experimental procedures
2.1. Spraying system
In this study, a commercially available CGT kinetic
spraying system was used. The system and the coating
process have been described in detail in other studies
[10–12]. A de Laval type nozzle with a round shape
exit was used. Nitrogen gas was used for both the
process gas and the carrier gas. The process gas
pressures used were 21, 25 and 29 MPa. The process
gas temperatures used were 300, 400 and 500 8C. Theflow quantity of carrier gas was set at 10% of the
process gas.
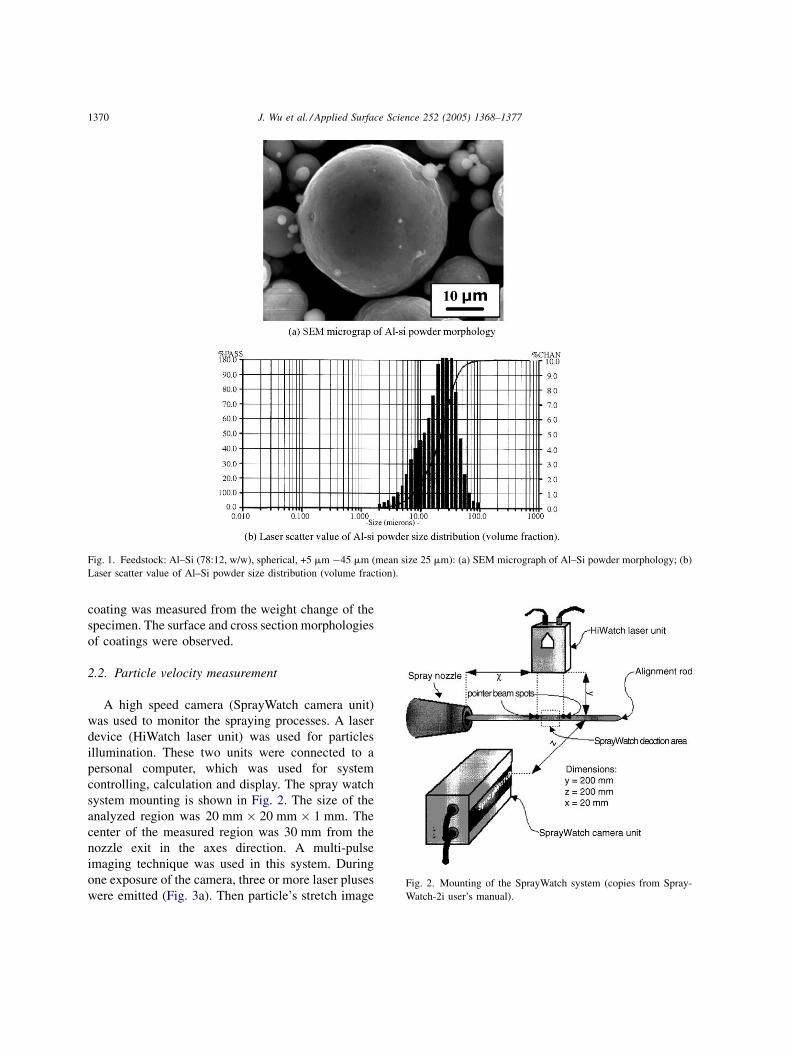
Al–12Si powder with a mean particle size of 25 mm
and a density of 2.66 g/cm3 was used as feedstock. A
micrograph and the size distribution of the feedstock
are shown in Fig. 1. The feeding rate was 8.0 g/min.
Mild steel was used as the substrate. Two kinds of
surface conditions were prepared by polishing and
grit-blasting. The roughness of as-polished surface
and grit-blasted surface were Ra 1.52 and 17.98,
which were measured with a laser scan microscope.
Optical microscopy, X-ray diffraction (XRD) and
scanning electron microscope (SEM) were used for
normal analysis. The deposition efficiency (DE) of the
J. Wu et al. / Applied Surface Science 252 (2005) 1368–13771370
Fig. 1. Feedstock: Al–Si (78:12, w/w), spherical, +5 mm �45 mm (mean size 25 mm): (a) SEM micrograph of Al–Si powder morphology; (b)
Laser scatter value of Al–Si powder size distribution (volume fraction).
Fig. 2. Mounting of the SprayWatch system (copies from Spray-
Watch-2i user’s manual).
coating was measured from the weight change of the
specimen. The surface and cross section morphologies
of coatings were observed.
2.2. Particle velocity measurement
A high speed camera (SprayWatch camera unit)
was used to monitor the spraying processes. A laser
device (HiWatch laser unit) was used for particles
illumination. These two units were connected to a
personal computer, which was used for system
controlling, calculation and display. The spray watch
system mounting is shown in Fig. 2. The size of the
analyzed region was 20 mm � 20 mm � 1 mm. The
center of the measured region was 30 mm from the
nozzle exit in the axes direction. A multi-pulse
imaging technique was used in this system. During
one exposure of the camera, three or more laser pluses
were emitted (Fig. 3a). Then particle’s stretch image
J. Wu et al. / Applied Surface Science 252 (2005) 1368–1377 1371
Fig. 3. Measurement of in-flight particle velocity; (a) corresponding
action of camera and laser; (b) sketch image of flying particles; (c)
calculation of particle velocity.
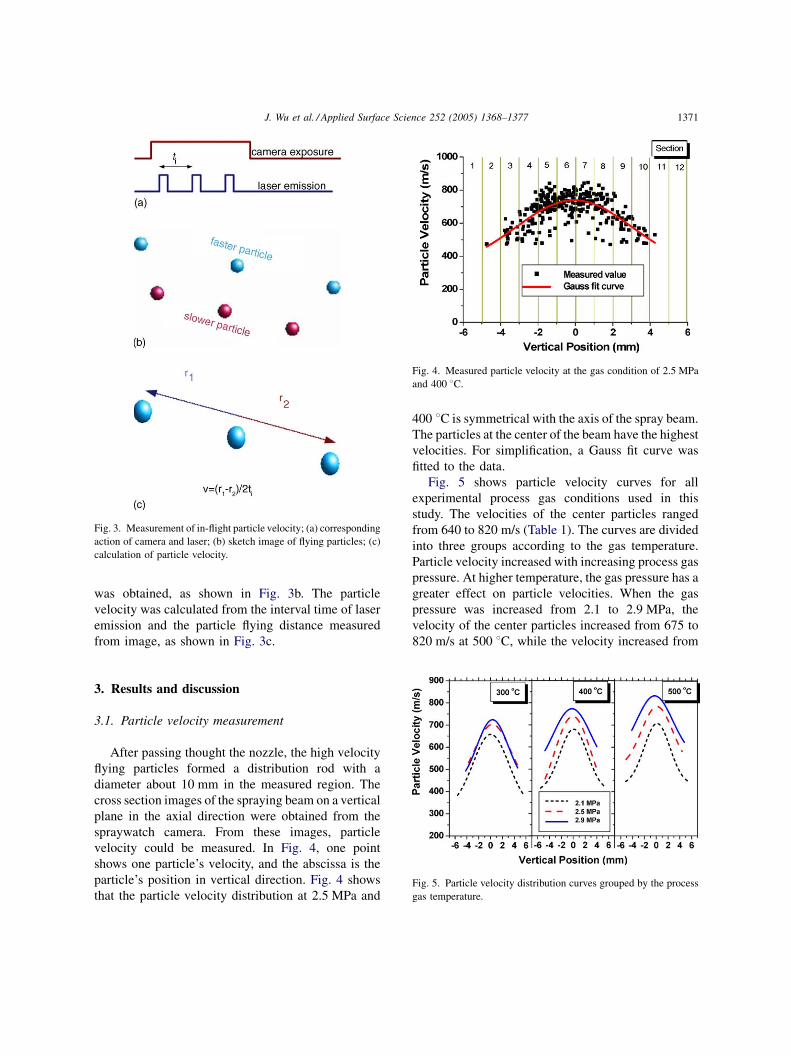
Fig. 4. Measured particle velocity at the gas condition of 2.5 MPa
and 400 8C.
was obtained, as shown in Fig. 3b. The particle
velocity was calculated from the interval time of laser
emission and the particle flying distance measured
from image, as shown in Fig. 3c.
Fig. 5. Particle velocity distribution curves grouped by the process
gas temperature.
3. Results and discussion
3.1. Particle velocity measurement
After passing thought the nozzle, the high velocity
flying particles formed a distribution rod with a
diameter about 10 mm in the measured region. The
cross section images of the spraying beam on a vertical
plane in the axial direction were obtained from the
spraywatch camera. From these images, particle
velocity could be measured. In Fig. 4, one point
shows one particle’s velocity, and the abscissa is the
particle’s position in vertical direction. Fig. 4 shows
that the particle velocity distribution at 2.5 MPa and
400 8C is symmetrical with the axis of the spray beam.
The particles at the center of the beam have the highest
velocities. For simplification, a Gauss fit curve was
fitted to the data.
Fig. 5 shows particle velocity curves for all
experimental process gas conditions used in this
study. The velocities of the center particles ranged
from 640 to 820 m/s (Table 1). The curves are divided
into three groups according to the gas temperature.
Particle velocity increased with increasing process gas
pressure. At higher temperature, the gas pressure has a
greater effect on particle velocities. When the gas
pressure was increased from 2.1 to 2.9 MPa, the
velocity of the center particles increased from 675 to
820 m/s at 500 8C, while the velocity increased from

J. Wu et al. / Applied Surface Science 252 (2005) 1368–13771372
Fig. 7. Comparisons of the experimental results to Alkhimov’s
correlation.
Table 1
The velocity of center particles at all process gas conditions
Particle velocity (m/s) Process gas temperature
300 (8C) 400 (8C) 500 (8C)
Process gas pressure (MPa) 2.1 640 655 675
2.5 680 715 760
2.9 705 760 820
640 to 705 m/s at 300 8C. For all gas conditions, thevelocity distributions are symmetrical and the
particles in center have the highest velocity. A very
similar result is found in Fig. 6, where the curves are
grouped according to the gas pressure. Fig. 6 shows
that increasing the gas temperature causes faster rising
of particle velocities at high pressure.
During the spraying process, gas pressure and
temperature are used to control the particle velocity.
Fig. 7 shows the comparisons of the experimental
results to Alkhimov’s correlation (Eq. (3)), where the
local Mach number at the nozzle exit for our experi-
mental nozzle was calculated as 3.91. The numerical
particle velocity ofAlkhimov’s correlation is calculated
considering the particle size distribution. That is say, in
each gas condition the velocities of all particles with
different sizes are computed, andmean particle velocity
is the sum of each velocity times its volume fraction in
Fig. 1b. The results show that the calculated values well
match with the experimental results.
Further more, the flux distribution of flying
particles can also be obtained from the spraying
images. The measured region is divided into many
sections in the radial direction (Fig. 4). The particles
Fig. 6. Particle velocity distribution curves grouped by the process
gas pressure.
number through each section is counted, and then the
particle flux distributions can be determined. Fig. 8
shows the relative flux at all gas conditions. There are
small differences among these curves. The gas
temperature and pressure have a little influence on
flux distribution of flying particles. Most particles are
aligned at a cylinder around nozzle centre with a
diameter of about 10 mm. These curves can be
regarded having a normal distributions, which is
affected by the nozzle type, powder feeding rate and
the distance from the nozzle exit.
3.2. Spraying trace deposition characteristics
The distribution rod of Al–Si particles with a
diameter about 10 mm spraying onto the mild steel
substrate were investigated by single, double and multi
Fig. 8. Particle flux distribution.
J. Wu et al. / Applied Surface Science 252 (2005) 1368–1377 1373
pass spraying. An understanding how the coating
builds up can be obtained by dividing the spraying
process into four basic phenomena [13]:
Stage 1: Substrate cratering and first layer build up of
particles (initial cratering, deformation of substrate,
trace formation, fracturing of surface oxides on metal
particles and substrate, and first particle layer
formation).
Stage 2: Particle deformation and realignment (multi-
layer coating build-up).
Stage 3: Metallic bond formation between particles
(particle–particle bonding) and void reduction.
State 4: Further densification and compaction of the
coating.
The deposition and bonding mechanisms of the
coating layer build up were not well known until now.
A critical particle velocity was accepted for char-
acterizing particle deposition. A function and some
data about critical velocity were given by Assadi et al.
[1]. In their investigation, the critical velocity was
determined by computer simulation, and it was proven
that the critical velocity is a function of the feedstock
materials properties and experimental conditions. This
function is very simple because many parameters are
not involved, such as substrate material properties,
impact surface conditions, and so on.
Characterization of Ni-base alloy deposition by
kinetic spraying was discussed in a previous work
[14], where the particle impact angle of a single or
multi pass spraying trace was considered, as shown in
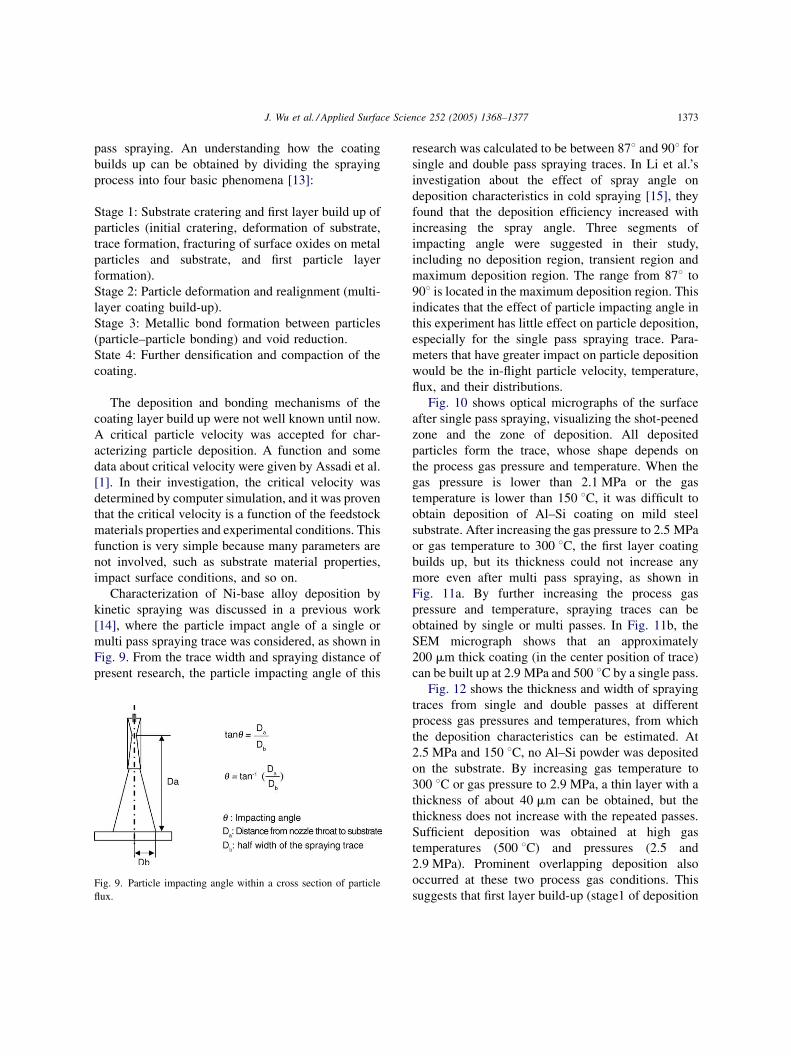
Fig. 9. From the trace width and spraying distance of
present research, the particle impacting angle of this
Fig. 9. Particle impacting angle within a cross section of particle
flux.
research was calculated to be between 878 and 908 forsingle and double pass spraying traces. In Li et al.’s
investigation about the effect of spray angle on
deposition characteristics in cold spraying [15], they
found that the deposition efficiency increased with
increasing the spray angle. Three segments of
impacting angle were suggested in their study,
including no deposition region, transient region and
maximum deposition region. The range from 878 to
908 is located in the maximum deposition region. This
indicates that the effect of particle impacting angle in
this experiment has little effect on particle deposition,
especially for the single pass spraying trace. Para-
meters that have greater impact on particle deposition
would be the in-flight particle velocity, temperature,
flux, and their distributions.
Fig. 10 shows optical micrographs of the surface
after single pass spraying, visualizing the shot-peened
zone and the zone of deposition. All deposited
particles form the trace, whose shape depends on
the process gas pressure and temperature. When the
gas pressure is lower than 2.1 MPa or the gas
temperature is lower than 150 8C, it was difficult to
obtain deposition of Al–Si coating on mild steel
substrate. After increasing the gas pressure to 2.5 MPa
or gas temperature to 300 8C, the first layer coating
builds up, but its thickness could not increase any
more even after multi pass spraying, as shown in
Fig. 11a. By further increasing the process gas
pressure and temperature, spraying traces can be
obtained by single or multi passes. In Fig. 11b, the
SEM micrograph shows that an approximately
200 mm thick coating (in the center position of trace)
can be built up at 2.9 MPa and 500 8C by a single pass.
Fig. 12 shows the thickness and width of spraying
traces from single and double passes at different
process gas pressures and temperatures, from which
the deposition characteristics can be estimated. At
2.5 MPa and 150 8C, no Al–Si powder was deposited
on the substrate. By increasing gas temperature to
300 8C or gas pressure to 2.9 MPa, a thin layer with a
thickness of about 40 mm can be obtained, but the
thickness does not increase with the repeated passes.
Sufficient deposition was obtained at high gas
temperatures (500 8C) and pressures (2.5 and
2.9 MPa). Prominent overlapping deposition also
occurred at these two process gas conditions. This
suggests that first layer build-up (stage1 of deposition

J. Wu et al. / Applied Surface Science 252 (2005) 1368–13771374
Fig. 10. Optical graphs of spraying traces; (a) single pass spraying
trace at 2.9 MPa, 300 8C; (b) single pass spraying trace at 2.9 MPa,
500 8C.
Fig. 11. SEM micrograph of cross section of spraying traces; (a)
multi pass spraying trace at 2.9 MPa, 300 8C; (b) single pass
spraying trace at 2.9 MPa, 500 8C.
process) and particle–particle bonding (stage 3 of
deposition process) require different particle velo-
cities. The velocity for Al–Si particle deposition onto
the mild steel substrate is lower than that for Al–Si
particle bonding with Al–Si.
Fig. 13 compares the spraying trace form to in-
flight particle velocity and flux distribution at same gas
pressure and temperature. In this figure, it can be
observed that only when the particle velocity exceeds
a certain value deposition is obtained and that a critical
velocity is needed for overlapping. Here two critical
velocities are indicated: one is for first layer build-up
and another is for overlapping deposition. In order to
evaluate the deposition characteristics by thickness of
trace, the threshold for overlapping deposition is set to
36 mm, which comes from Fig. 12 with considering
the particle deformation during spraying process. Note
that in the case of monolayer coatings the deposited
layer is compacted by the particles which can not
overlapping deposit but rebound. So the threshold for
first layer building up is difficult to be set as a certain
value. Here zero is used for this threshold. After
marking the velocities on these two thresholds of
single pass trace thickness in Fig. 13, we can know that
the critical velocity for first layer Al–Si feedstock
deposition onto mild steel substrate is about 580 and
700 m/s is the critical velocity for Al–Si feedstock
bonding with its coatings. The coating of Al or Al

J. Wu et al. / Applied Surface Science 252 (2005) 1368–1377 1375
Fig. 12. Forms of spraying traces; (a) single pass at 2.5 MPa; (b) Double pass at 2.5 MPa; (c) single pass at 2.9 MPa; (d) double pass at 2.9 MPa.
alloys needs high particle velocity. The results of
Assadi et al.’s research [1] showed that the critical
velocity of pure Al lied within a region between 650
and 700 m/s. Considering similar physical and
mechanical properties of pure Al and Al–Si powder,
the function of Assadi was used for estimating the
velocity for particle–particle bonding.
The deposition efficiency (DE) of the coating was
measured from the weight change of the specimen. In
Fig. 14, the DE value increases with the mean particle
velocity and the maximum DE is about 37% at the
mean particle velocity of 800 m/s. Compared to the
DE of other metal feedstock such as Cu, Ni, and so on
[6,7,13,14], the DE of Al or Al alloys is very low. To
increase the DE of Al alloy coating, high gas
temperature and pressure are needed. The available
operating pressure and temperature for most com-
mercial equipment using N2 gas is under 3.0 MPa and
650 8C. However, at severe gas conditions, other
problems do occur, such as nozzle clogging. Actually,
the Al–Si plugged the nozzle after long time (20 min)
spraying at 500 8C. The other methods for increasing
particle velocity are using He as the process gas or
some special spraying nozzle. The DE-velocity curves
also show two marked increases of the DE with
increasing particle velocity that comes from the first
layer build-up and overlapping. It is noticed that the
DE didn’t change observably with the substrate
surface conditions. The effect of roughness on DE
did not show any crucial importance, because after
first layer built up, the substrate surface condition can
not affect the deposition of overlapping.

J. Wu et al. / Applied Surface Science 252 (2005) 1368–13771376
Fig. 13. Comparison of spraying trace form to in-flight particle
condition at 2.5 MPa, 500 8C.
Fig. 14. Deposition efficiency of single and double pass traces on
mean particle velocity.
4. Conclusions
The kinetic spraying process in this study was
monitored by a professional device. From in-flight
particles images, particle velocity and flux distribu-
tions of different process gas pressures and tempera-
tures are measured. Particle velocity increases with
increasing the process gas pressure and temperature.
At higher temperature (or pressure), gas pressure (or
temperature) do more effect particle velocities. The
maximum particle velocity is obtained from optimum
gas conditions of 2.9 MPa and 500 8C. The particle
velocity distribution was symmetrical with the axis of
the spray beam. The particles in the center of the spray
beam had the highest velocities. A flux with normal
distribution is measured for all gas conditions. It is
believed that gas pressure and temperature have little
effect on the flux distribution of flying particles.
Particle deposition behaviors depend on process
gas pressure and temperature. The width and thickness
of spraying traces increase with process gas pressure
and temperature. With increasing particle velocity,
two critical velocities are observed: one is for particle
deposition onto the substrate and the other for
particle–particle bonding. For Al–Si feedstock coating
onto the mild steel substrate, the particles more easily
bond to the substrate than to the coatings. 580 and
700 m/s are measured as these two critical velocities
when the mean particle size is 25 mm. The deposition
efficiency (DE) value increases with the mean particle
velocity and the maximum DE is about 37% at a mean
particle velocity of 800 m/s. The substrate surface
roughness has not great effect on DE.
In this research, parameters such as particle and
substrate temperatures effect were not studied. Further
investigation is needed for a better understanding of
the deposition and bonding mechanisms of kinetic
spraying.
Acknowledgements
This work was financially supported by Ministry of
Commerce Industry and Energy (MOCIE) under the
project: Development of Advanced Surface Modifica-
tion Technologies Based on Welding.
References
[1] H. Assadi, F. Gartner, T. Stoltenhoff, H. Kreye, Bonding
mechanism in cold gas spraying, Acta Mater. 51 (2003)
4379–4394.
[2] A.N. Paryrin, S.V. Klinkov, V.F. Kosarev, Modeling of parti-
cle–substrate adhesive interaction under the cold spray pro-
cess, in: Proceedings of the International Thermal Spray
Conference, ASM Int., Materials Park, OH, USA, Orlando,
5–8 May 2, 2003, pp. 27–35.
[3] R.C. Dykhuizen, M.F. Smith, D.L. Gilmore, R.A. Neiser, X.
Jiang, S. Sampath, Impact of high velocity cold spray particles,
J. Therm. Spray Technol. 8 (4) (1999) 559–564.

J. Wu et al. / Applied Surface Science 252 (2005) 1368–1377 1377
[4] R.C. Dykhuizen, R.A. Neiser, Optimizing the cold spray
process, in: Proceedings of the International Thermal Spray
Conference, ASM Int., Materials Park, OH, USA, Orlando, 5–
8 May 2, 2003, pp. 19–26.
[5] T.H. Van Steenkiste, J.R. Smith, Kinetic spray coatings, Surf.
Coat. Technol. 111 (1999) 62–71.
[6] R.C. Dykhuizen, M.F. Smith, Gas dynamic principles of cold
spray, J. Therm. Spray Technol. 7 (2) (June 1998) 205–212.
[7] T. Van Steenkiste, J.R. Smith, Evaluation of coatings produced
via kinetic and cold spray processes, in: Proceedings of the
International Thermal Spray Conference, ASM Int., Materials
Park, OH, USA, Orlando, 5–8 May, 2003, pp. 53–61.
[8] J. Voyer, T. Stoltenhoff, H. Kreye, Developement of cold gas
sprayed coatings, in: Proceedings of the International Thermal
Spray Conference, ASM Int., Materials Park, OH, USA,
Orlando, 5–8 May, 2003, pp. 71–78.
[9] A.P. Alkhimow, V.F. Kosarey, S.V. Klinkow, The features of
cold spray nozzle design, J. Therm. Spray Technol. 10 (2001)
375–381.
[10] W. Kroemmer, P. Heinrich, P. Richter, Cold spraying-equip-
ment and application trends, in: Proceedings of the Interna-
tional Thermal Spray Conference, ASM Int., Materials Park,
OH, USA, Orlando, 5–8 May, 2003, pp. 97–102.
[11] R.E. Blose, T.J. Roemer, A.J. Mayer, D.E. Beatty, A.N.
Papyrin, Automated cold spray system: description of equip-
ment and performance data, in: Proceedings of the Interna-
tional Thermal Spray Conference, ASM Int., Materials Park,
OH, USA Orlando, 5–8 May, 2003, pp. 103–110.
[12] J. Karthikeyan, C.M. Kay, Cold spray technology: an industrial
perspective, in: Proceedings of the International Thermal
Spray Conference, ASM Int., Materials Park, OH, USA,
Orlando, 5–8 May, 2003, pp. 117–121.
[13] T.H. Van Steenkiste, J.R. Smith, R.E. Teets, Aluminum coat-
ings via kinetic spray with relatively large powder particles,
Surf. Coat. Technol. 154 (2002) 237–252.
[14] H. Choi, S. Yoon, S. Uhm, C. Lee, Characterization of the
spraying beads deposited by the kinetic spraying process, Surf.
Coat. Technol. 192 (2005) 374–381.
[15] C.-J. Li, W.-Y. Li, Y.-Y. Wang, Effect of spray angle on
deposition characteristics in cold spraying, in: Proceedings
of the International Thermal Spray Conference, ASM Int.,
Materials Park, OH, USA, Orlando, 5–8May, 2003, pp. 91–96.