Mauritius-toward-the-21st-century.pdf - World Bank Documents
154
UNDP-WORLD BANK TRADE EIPASION IPOGRAM COUNTRY REPORT 12 MAURITIUS Toward the 21st Century This country report is a product of the joint UNDP/World Bank Trade Expansion Program which provides technical and policy advice to countries intending to reform their trade regimes. The views contained herein are those of the authors and do not necessarily reflect those of the United Nations Development Program or the World Bank. Public Disclosure Authorized Public Disclosure Authorized Public Disclosure Authorized Public Disclosure Authorized
-
Upload
khangminh22 -
Category
Documents
-
view
0 -
download
0
Transcript of Mauritius-toward-the-21st-century.pdf - World Bank Documents

UNDP-WORLD BANK TRADE EIPASION IPOGRAM
COUNTRY REPORT 12
MAURITIUS
Toward the 21st Century
This country report is a product of the joint UNDP/World Bank Trade Expansion Program whichprovides technical and policy advice to countries intending to reform their trade regimes. The viewscontained herein are those of the authors and do not necessarily reflect those of the United NationsDevelopment Program or the World Bank.
Pub
lic D
iscl
osur
e A
utho
rized
Pub
lic D
iscl
osur
e A
utho
rized
Pub
lic D
iscl
osur
e A
utho
rized
Pub
lic D
iscl
osur
e A
utho
rized

MAURITIUS
Toward the 21st Century
Trade Policy Division
Policy Research DepartmentWorld Bank
December 1993Wasbington, D.C.

This report was prepared for the Mauritian government in response to itsrequest for assistance from the joint United Natiocs Development Program/WorldBank Trade Expansion Program. The report was directed by Dominique Hachette(consultant, Universidad Catolica de Chile), with the participation of Mona Haddad(World Bank), Ron Hood (consultant, Louis Berger International), Ramon Lopez(consultant, University of Maryland). Patrick Messerlin (consultant, FondationNationale des Sciences Politiques), John Nash (World Bank), and Maurice Schiff(World Bank). The mission also received valuable input and assistance fromKapil Kapoor, Oey Astra Meesook and Brendan Horton (World Bank).
The mission visited Mauritius from 5 February - 21 February, 1992. Whilein Mauritius, the UNDP resident mission under the direction of Olubanke King-Ak6r616 provided both logistical support and valuable substantive input. Themission acknowledges with thanks the help of the many members of the public andprivate sectors who provided assistance and advice, particularly our counterpartsin the Ministry of Economic Planning and Development, Messrs. R. Bheenick(Director), D. Dusornth (Principal Economist) and their staff and Mr. P.Chundunsing and his staff in the Customs Service. This report was edited by Metade Coquereaumont and produced by Leonila Castillo (World Bank).
The report was discussed with the Mauritian authorities in March 1993 byMessrs. John Nash and Dominique Hachette.
The views and recommendations of the report are those of the authors anddo not necessarily reflect those of the United Nations Development Program or theWorld Bank.

Table of Contents
Page No.
Executive Sunnmary i
Chapter 1. Growth and Economic Development of the 1980s 1Growth in the 1980s 1Growth in the 1990s and beyond 6
Chapter 2. Exports and the External Environment 9Sugar 11Evolution and structure of export processing zones 23Textiles and apparel 31Trends in patterns of trade 39Regional agreements 40
Chapter 3. Regulations and Incentives in the Output Markets 45Trade policy 45Sales tax 56Hotel and restaurant tax 59Price controls 59Subsidies 62
Chapter 4. Factor Market Policies and Incentives 63Land 63Financial markets 66Investment incentives 71Labor markets 75Technical note: land use controls 87Technical note: tax credit for stock purchases 92
Chapter 5. Sectoral Summary of the Impact of Regulations and Incentives 93Export processing zones 98Emerging pioneer exports 100Sugar 104
Chapter 6. Conclusions and Recommendations 107Implications of the external environment for economic policy 108Goods and services markets and relative prices 109Sugar 117Price controls 122Recommendations for improving factor markets 122
Chapter 7. Timing, Sequencing and Quantitative Impact of Recommendations 129Impact on GDP 129Impact on the government budget 130Timing and sequencing 133
Appendix A. The Foreign Exchange 135Appendix B. The Impact of the Tariff Level on Exports 145

List of TablesPage No.
1.1 Some macroeconomic aggregates, 1970-90 21.2 Merchandise exports at current prices (f.o.b.), 1982-91 31.3 Merchandise imports at current prices (c.i.f.), 1982-91 41.4 Balance of payments 52.1 Main exports by product of Mauritius 1989-91 102.2 Main exports of Mauritius by country, 1989-91 112.3 Main exports of Mauritius by product and country, 1989-91 122.4 Production, exports, and prices for Mauritian sugar, 1985-90 132.5 Protection and world price volatility, 1979-89 averages 152.6 Effects of multilateral policy reform on world sugar prices 152.7 Indicators of internal forces working toward the
dismantling of the EC common sugar policy, 1985-91 182.8 Simulations of changes in the EC sugar policy 192.9 Basic statistics on export processing zones in Mauritius, 1983-90 242.10 Imports and exports of EPZ firms, 1977-90 242.11 EPZ imports and exports of Mauritius, by country, 1990 272.12 EPZ imports and exports by main commodity 282.13 Intermediate consumption of EPZ firms by industry group, 1985-1986 292.14 Production account of EPZ by product, 1989 302.15 The U.S. MFA quotas on Mauritian exports, 1985-89 342.16 Mauritian exports subject to the U.S. MFA, 1985-1990 372.17 The evolution of the Mauritian exports under U.S. MFA quotas, 1985-89 382.18 The existence of rents in Mauritian Apparel Exports to the U.S., 1991 39
3.1 Value of exports and import taxes, 1991 473.2 Customs collections and exemptions, 1991 493.3 Effective and statutory tariff rates, 1991 . 503.4 Protection in 1990 523.5 Customs collections and exemptions by class of goods 523.6 Customs tariff rates by class of goods 523.7 Sales tax revenues by category 583.8 Products subject to price controls in Mauritius 61
4.1 Land use in Mauritius 644.2 Sectoral distribution and interest rates of commercial
bank credit to the private sector, 1988-91 704.3 Employment in Mauritius, 1983, 1988, 1990 754.4 Wages and inflation, 1983, 1988, 1990 754.5 Sectoral employment in large firms; selected years 764.6 Job vacancy and employment growth 794.7 Real wages change by sector, 1984-90 804.8 Labor productivity and unit labor costs indexes in manufacturing, 1982-90 804.9 Public sector employment, 1989-91 854.10 Gross top salaries of certain grades in public sector/private sector 85

5.1- Sectoral incentive sStructure 945.2 A taxonomy of Mauritian 'other' exports 101
6.1 Composition of fiscal revenues, Mauritius and other selected countries,1972 and 1990 116
6.2 Personal income payable by employees and self-employed 1166.3 Estimates of production costs of sugar, 1974, 1981, 1989 118
7.1 Estimated revenue loss from import taxes reform 1307.2 Estimates of fiscal impacts of reform measures 131
. 7.3 Changes in taxes to generate or save Rs 100 million 132
A. I Real exchange rates 136A.2 Mauritius: bilateral real exchange rate 138A.3 Regression for the RER 141
List of Figures
2.1 Effects of making EC sugar quotas transferable 22
4.1 Vacancy rate and employment growth in Mauritius 794.2 Land use: demand and marginal value 904.3 Land use: optimal allocation 904.4 Land use: efficiency cost of restrictions . 914.5 Land use: increasing cost of restrictions over time 91
List of Boxes
3.1 Import taxes in Mauritius 456.1 The sugar sector in a rapidly growing economy 121

Executive Sumcary
Mauritius fared well during the 1980s. The economy grew at a rapid rate, and inflation and thefiscal and current account deficits were brought under control. Aided by a relatively well-developedhuman capital base, full employment and significant real wage increases improved the welfare of
much of the population. Mauritius maintained its exchange rate at a level attractive to exporters and
accumulated a comfortable volume of foreign exchange reserves. Trade taxes and restrictions were
relaxed and rationalized, price controls and subsidies diminished in importar . and incentives were
simplified. Exporters, especially firms in the export processing zones (EPZ -ook advantage of afavorable external and internal environment to propell exports into the forefront of economic growth.
The issues
Recently, however, clouds have begun to form above this rosy picture of strong, steady growth.
Full employment, while it has clearly brought many advantages, has in recent years become an
impediment to continued easy growth. Land and capital also seem to be fully employed. Natural
resources are scarce as well, and the country is already using them fully. The competitiveness of
Mauritian exports is diminishing with the rapid growth of real wages. And the export base remains
weak, with its heavy concentration on sugar and textiles and on particular markets.
It seems likely that Mauritius's comparative advantage no longer favors labor-intensive activities
as strongly as in the past. Consequently, growth will be tied to the development of sectors with
heavier requirements for education and training and based on more advanced technologies. Successful
development of these activities hinges on large investments in human capital, on the right market
. signals to direct productive factors to activities in which their productivity is highest, and on ease of
movement among sectors, activities, firms, and regions. Bringing idle factors into production will
contribute much less to growth than in the past. Growth will have to come instead from improvements
in the quality of productive factors and from a new framework of incentives and regulations for
encouraging better use of them.
Export-led growth depends crucially on the external environment as well. The 1990s are likely to
be much less predictable than the 1980s. Uncertainty is everywhere: in the results of the Uruguay
Round, revisions of the Common Agricultural Policy and of the Lom6 Convention in Europe,
modification or elimination of the Multifiber Agreement, changes in relative preferences granted to
Mauriius's two principal exports, increasing reliance on antidumping and safeguards-based protection
of textiles by industrial countries, and the emergence of new competitors. Whatever the outcomes,
one thing seems clear: diversification and flexibility will be required to meet the challenges of
unpredictable external markets. The days are numbered for a strategy of exportled development
based solely on sugar and textiles.

Availabiiy ofproducrive resources
The availability of productive factors will grow with the population and with savings and
investment. Labor and human capital remain the main source of growth. Population and human
development policies and improvements in the capital market are of paramount importance. Quality
improvements are equally critical. Human capital may become the binding factor in economic growth.
The experience of some East Asian countries is telling in this respect.
Beuner use of resources
These sources of growth have to be directed to the leading sectors of the economy as rapidly as
possible to take advantage of the benefits of factor availability and the external environment. What isneeded is a framework of incentives and regulations that will stimulate sectors with the highest
comparative advantage and increase the flexibility of the economy, improving economic performance
and reducing the costs of adjustment to fluctuations in the external environment.
The strateg
Amidst the chaos of signals created by a multitude of incentives and regulations, often working at
cross-purposes, the signals that reflect true relative prices and social costs and benefits of various
activities are nearly impossibLe to pick out. The thicket of regulations also impedes the movement of
factors of production. Under these conditions, switching resources to new areas of production is bothdifficult and costly.
A comprehensive review of incentives and regulations is required. Reforms should be directed at
reducing antiexport bias and removing the direct and indirect barriers to the development of the mostproductive sectors. A major overhaul of regulations is needed to improve the working of factor
markets (labor, land, and capital) so that resources are directed toward the best alternative uses, given
continuously changing external conditions.
Recommendations
The main recommendations of the report concern changes in overall incentives and taxes and
changes in factor markets.
Overall incemies and aes
a The composition of tax revenues needs to change so there is less reliance on trade taxes and
more reliance on taxes on domestic consumption. Harmonization of incentives is also needed, along
with greater simplicity, to reduce their bias. Eventually, if the proposals in this report are adopted,
there will be no more justification for special preferences and incentives.
-^n-

s Rationalizing and reducing import taxes would reduce the amiexport bias and other
distortions in the economy and lessen the need for special exemptions. A 10 percent flat tariff is
strongly recommended as a medium-term goal.
a Distributive and efficiency considerations call for a careful review of the level of the export
tax.
E For efficiency reasons, sugar cane growers should be paid the EC price (net of export tax
and other deductions) for the share of their output equivalent to the EC quota share of total output,and the world price (equal to the domestic price) for the rest of their production. This could be done
through a quota system. In the medium-to-long term, an auction system for the quotas could be
phased in.
* A broadening of the sales tax base should be undertaken to relieve the burden on tariffs, toreduce production distortions, and to strengthen linkages among different types of firms. This change
should not be expected to generate significant additional revenue without an increase in the rate. A
medium-term objective would be to move from the sales tax to a full value added tax with no more
than two to three rate levels. Whether a value added tax or a sales tax, this tax should become the
major tax base of the economy. High priority should be given to developing a workable scheme toallow direct and indirect exporters to get rebates of sales or value added taxes-on their exports.
a Any taxes on luxury items levied for distributive reasons should be excise, not import,
taxes.
a Tle corporate income tax rate needs to be uniform across all sectors. EPZs should not be
favored over other types of firms. Conditions have changed in Mauritins, making export
diversification an important priority. Also, tax rate setting should be considered from a fiscal revenue
perspective-rate reductions might increase tax revenues. Current income tax revenues are very low.
w Administrative improvements could also improve yields, but at least a year or two would be
required before results become noticeable.
* Administration of the duty drawback scheme needs to be considerably improved, to reduce
antiexport bias and stimulate domestic linkages with EPZs.
m Exemptions through the certificate programs could be phased out in a coordinated fashion as
rates are reduced and bases broadened.
a More general tax incentives (investment allowances, credit for stock purchases, etc.) should
be reformed along the lines described in this report.
i The economic and social conditions that may once have justified price controls and subsidies
have passed. Replacing them with targeted support programs would better meet distributive objectives
and could reap substantial efficiency gains.
- iii -

Factor markers
a Eliminating the land conversion tax and permit system for transfering land from one use
(primarily agriculture) to another would greatly expand the options for land use. Reducing registration
duties, fees, and taxes could also make a useful contribution to more flexible land use. Land titles
need to be made more secure. If land conversion permits continue to be required, institutional
responsibility should be assigned to an agency with an economywide perspective that weighs all
alternative uses of land. The objective of the permit process should be to prevent environmental
degradation or other negative externalities, not to obstruct the transfer of land out of agriculture.
a Eliminating credit allocations by sector, informal interest rate controls, and credit ceilings
would improve the flexibility and efficiency cf the capital market.
a Policy revisions in several areas-especially for the sugar industry-would make the labor
market more responsive to changing conditions: hiring and firing, sick leave, overtime pay, and the
attendance bonus.
a The banking sector should be made more competitive and efficient and long-term capital
made more readily available by allowing foreign banks to compete in domestic markets and locals to
deal with banks abroad.
a Wages and other incentives for public employees should be consistent with the goal of
reallocating labor to higher-productivity sectors.a Human development issues, such as technical and vocational training, need to be a top
priority. This issue assumes even greater than usual importance during a period of structural change
in the economy, such as Mauritius is likely to pass through in the near future. Improvements in
secondary education and greater private sector participation in training are advisable.
a Integration efforts based on regional trade policy coordination within the Preferential Trade
Area for Eastern and Southern African States (ETA) and the Indian Ocean Commission (IOC) should
not be given top priority, given the small size of the economies involved and their limited
differentiation. Attention within these regional arrangements should instead be directed toward ways
to eliminate barriers to the movement of labor and capital between Mauritius and neighboring
countries, which could be of great mutual benefit.
Exchange rate
a Mauritius' conservative fiscal and monetary policy has allowed it to maintain the real
exchange rate at a realistic and relatively stable level; these should remain high-priority goals.
* Exporters should be allowed to retain their foreign exchange earnings.
- iv -

Impacts and sequencng
Production in the economy could rise by 8 to 10 percent over a period of two to three years if
the proposed reforms in the labor market are carried out. Overall, the reforms recommended in the
report could bring about an increase in government revenue in the medium term-although that is not
their primary inten-but the composition of tax revenues will have to change significantly. In the
. short run, the reforms pose a r --blem of sequencing.
a With respect to sequencing, the first priority should be to improve the flexibility of factor
. markets. Administrative reforms to strengthen the weaker parts of the revenue generating machinery
should also be undertaken before any major shifting between taxes.
w Tariffs could be moved in stages toward the goal of a uniform rate of 10 percent. At each
stage, the highest tariffs would be reduced, the lowest ones raised, and exemptions eliminated (except
for inputs used in export production). The tariff reforms should be part &s a package of measures
designed to work together to avoid destabilizing the government's fiscal position. This could involve
reducing relatively unproductive public sector expenditures, increasing the coverage and rate of the
sales tax, cutting back investment incentives, eliminating subsidies, and making the income tax rate
more uniform, especially for enterprises. Earlier improvements in tax administration should also
improve the revenue picture.
-

Chapter 1. Growth and Economic Developments of the 1980s
Mauritius was a bright spot in the bleak landscape of developing countries during the 1980s.
After a difficult economic period at the beginning of the decade, Mauritius introduced a strong and
coherent package of policies that greatly improved the macroeconomic environment. Growth surged,fueled in part by appropriate monetary, fiscal, and wage policies. That period is over sw, however,and many of the policies of the 1980s, justified by the considerable idle capacity of the time, are no
longer appropriate. Labor, land, and capital seem to be fully employed, and growth will no longer
spring easily from idle resources. In the coming years, Mauritius will need to restrain demand and
seek new growth stimuli on the supply side.
Growth in the 1980s
Mauritius made many of the right policy choices in the 1980s. Inflation and the fiscal and current
account deficits were substantially reduced (table 1-1). International trade policies were rationalized,
price controls and subsidies reduced, and incentives simplified. Institutions became more efficient,
especially those involved in trade promotion (e.g., the Mauritius Export Development and Investmea
Authority, MEDIA). Sugar, the country's main export, retained its buoyancy in export markets.
Favorable external conditions helped, as did the burgeoning growth of export processing zones
(EPZs), spurred on by political and economic stability, relatively cheap and skilled labor, and easy
access to world markets. Investment and savings, particularly foreign, were stimulated by credible
policies and attractive conditions, thus expanding the country's growth capacity for the near future-
gross fixed capital formation grew from 182 percent of GDP in 1984 to 29.4 percent in 1990, two-
thirds of it in the private sector.
As a result of these factors, the country enjoyed a reasonably high and steady rate of growth.GDP grew at an average annual rate of 6.5 percent between 1986 and 1991. The share of
manufactures in GDP expanded substantially, reaching 25 percent in 1991 thanks largely to the
development of EPZs. The economy reached full employment, and steady real wage increases have
improved the welfare of a substantial portion of the population. While employment growth averaged
4.9 percent a year between 1986 and 1991, growth of the working age population never exceeded 1.4
percent a year.
Thus unemployment, which had been as high as 17.1 percent of the economically active
pcpulation in 1984, steadily declined, falling to 2.3 percent in 1990, which is probably below the
natural rate of unemployment'
1. Preliminay information indicates unWmployment figures for 1991 similar to that of I0-
-1-

Table 1.1 Some macronomi agregates, 1970-90
Year Irad. Trad Cas. Frcal Frdn. rn of GD? Readeict accm defdsr - lde p ak axdu-ge
deflca aes...Inda. me
WfMr.wu ssa 983-1J (pere) (1985-M)aGDP) f GD P GOP go GMP)I
1970 1.6 2.7 4.1 -53 13.5 105.9 -0.9 81.2
1971 0.3 -4.1 -2.5 -6.5 -2.1 104.6 4.5 83.4
1972 5.4 3.6 5.3 -5.2 21.4 117.5 3.0 30.5
1973 13.5 -1.4 0.1 -3.9 -3.2 105.3 11.2 30.5
1974 29.1 8.4 9.6 -6.5 633 161.2 3.0 30.2
1975 14.8 4.3 3.1 -4.2 5.0 187.4 1.3 73.3
1976 129 -7.1 -5.9 -3.9 -75.8 137.0 16.7 8339
1977 9.2 -7.3 -9.5 -7.4 -37.7 123.4 6.6 82.5
1978 8.5 -9.6 -11.5 -3.8 -69.3 113.9 3.8 74.6
1979 14.5 -8.3 -12.2 -9.4 -95.2 107.2 3.5 73.9
1930 42.0 -7.3 -10.5 -6.4 .27.9 101.3 -10.1 71.4
1981 14.5 -13.2 -13.7 -8.3 -133.4 102.4 5.9 79.3
1932 11.4 -2.3 -4.0 -9.5 460.6 91.7 5.5 92.9
1933 5.6 -1.6 -2.2 -6.1 -31.0 100.0 0.4 100.0
1934 7.4 -4.0 -5.4 -4.7 .40.2 99.2 4.3 117.5
1985 6.7 -2.4 -2.7 -5.3 -2.0 102.9 6.9 123.2
1986 1.6 4.0 6.4 -2.3 122.5 134.4 9. 30.9
1987 0.5 -0.9 3.4 0.5 213.8 145.3 10.2 79.9
198 9.2 -. 1 -3.1 -2.9 135.4 1413 6.8 30.2
1989 12.7 -10.1 -5.0 -20' 145.1 141.6 4.2 81.0
1990 13. -10.3 -3.6 -1.6 240.3 150.3 6.6 78.3
1991 7.0 -9.4 -5.2 -1.9" 199.4 151.3 4.7 79.9
Source: Inftrnatinal Faci Sbastics 1991; Governieqm Financial S tus Yarbool, 1989.
a. RER - (Nominal Excange/CPI) WPI- sgn means deficik
b. estimaesc. Bank of Mauritius. Annual Reparet
L. sa available
Foreign exchange reserves mounted to a comfortable level, and at the end of June 1992 reserves
were sufficient to meet import needs for about six months. At the same time, the exchange rate
remained favorable for exporters. External debt and debt service, which had been a major constaint
on economic recovery and external balance in the first half of the 1980s, were significantly reduced
through a combination of prudent management and international support.
-2-

Exports led the growth surge, expanding from 48 percent of GDP in 1978-80 to 67 percent in199(, at an average annual growth rate of 10 percent during the decade (table 1.2). Sugar, EPZproducts and tourism have been the main exports. Although EPZ exports exceeded sugar exports in
value terms, the high import content of EPZ exports (about 30 percent) meant that sugar including theEC aid, remained the largest net earner of foreign exchange. In 1991, sugar represented about 50
percent of goods exports (net of EPZ imports), EPZs about 40 percent.
* Table 1.2 Merchandise eq brts at current prices (f.o.b.), 19 91(millions of rupees)
1982 193 1984 INS 1986 1987 1988 1989 1990 199{
Sugar 2,463 2.679 2,523 2.367 3,553 4.310 4,467 4.946 5,104 5,133Molasses 67 63 62 89 90 73 92 66 102 29
Tea 67 97 249 173 104 90 U 87 34 67
Fish and 56 76 106 143 133 132 210 217 161 235Preparadons
Textila 91 67 79 90 123 169 239 433 594 630
Processed 52 49 39 127 176 192 317 335 363 395diamonds
Clothing 882 928 1,592 2.543 4,056 5.593 6.5382 7,205 9,192 9,793
Oracr 166 224 317 430 435 576 828 831 1163 n..manufacured
Odhr 53 40 so 61 188 200 397 417 421 n.a.
Toral 3,902 4.223 5,067 6.533 3,913 11,335 13,220 14,542 17,134 a.s.domesticexports
Re-port 85 123 134 106 145 162 245 507 384 U.a.
Total expors 3,987 4,346 5,201 6.639 9,063 11,497 13.465 15,049 17,56 8 13614
Source: Mauridus: Expanding Horinno and lauruauional Monetary Fund (1991).n.a. ot available
Export growth was not only rapid but steady. Fluctuations in sugar production were, to some
extent, compensated for by the high and stable prices for sugar (in ECU) in the European Community
(EQ. by far the country's largest export market. EPZ exports showed spectacular growth during mostof the period, rising at an average annual rate of 28.9 percent between 1982 and 1991. Increasing
concentration of production and markets accompanied the growth in EPZ exports. The share of
clothing jumped 8 percentage points between 1982 and 1991, and the EC absorbed an ever-larger
share of exports.
Imports followed the trends set by EPZ exports and aggregate consumption and investment
behavior, growing at an average annual rate of 11 percent during the 1980s. Inputs for EPZ
2. No comparaMble figure is avaiabic for 1991.
-3-

production accounted for 60 percent of imports. Other imports were influenced by the overheating of
the economy that accompanied the virtual elimination of unemployment and excessively expamsionaryfiscal, monetary, and wage policies. Appreciation of the rupee after 1985 induced a further surge in
imports. Imports also responded positively to changes in import duties designed to encouragediversification of exports beyond the EPZ firms, to improve living standards, to check inflationary
pressures, and to encourage housing construction. Imports of consumer goods, other than food and
beverages, grew at an annual rate of 28.9 percent between 1982 and 1991; imports of capital goods
grew at an even faster 32.8 percent (table 1.3).
Table 1.3 Merchandise iports at current price (c..f., 1982-91(milins of rupees)
1982 1983 1984 1985 198W 1987 1988 1989 1990 1991
Food and beverages 1,412 1,28 1,543 1.636 1,375 1,675 1,974 2.642 2916 2.921
Othcr conauer goods 322 343 429 Ot 733 1.040 1.30 1.684 1,864 2,262
Petroleum produce 907 954 1.024 1.096 707 978 1,009 1,509 1,939 893
Intermediarc goods 1.908 1,946 2.749 3.643 4,794 6.450 7,736 9.648 10.683 13.229
Capital goods 500 624 750 1.114 1,591 2,871 5,165 4,734 6,436 6.406
Total imports 5.049 5.155 6.495 81.20 9.200 13,014 17,247 20.217 23.843 25,716
Source: Mauriius: Expanding Horizns and lnutranional Monedary Fund.1991.
Tourism was exceptionally buoyant during most of the decade. Tourist arrivals rose by half
between 1987 and 1990, and receipts increased by more than 30 percent a year after 1985. Net
income from tourism was about half of export revenues for sugar.
Improving terms of trade and a favorable real exchange rate' helped fuel the export drive and
comributed to the accumulation of reserves and rising domestic investment. By the end of the decade,terms of trade were a third higher than at the beginning, while the real exchange rate was some 22percent higher in the 1980s than in the 1970s.
3. The echange ram is defined in iis report as the price of foreign currency cwpressd in units of domeic currency per unit offoreign currency.
-4-

/ � , � , � , �
ТеЫе 1. �1 Reance о[ peymeats � 1970�90(millions о( доll его )
l970 1971 /972 /97 Э /97 � 1975 /976 /977 197д 1979 19д0 /981 19 д? 19dJ 19 В� 19dS 19 дб l �д7 /98 д l98D /QA0
Oxparte 93 94 142 181 372 369 32S 401 440 512 S78 S01 307 301 S04 379 887 1209 1376 139 б 1668М егсhеп4l к 70 6¢ 108 139 31S ЭОЭ 261 306 312 383 438 317 366 369 371 4з3 673 891 998 993 1179Non �fecWr �,есг� �сее xs 28 э4 4t s7 бв 61 9э 11 е 1зо 14 о 174 141 1з8 1э0 146 21 г з1s з7в 4 оэ 489lгораае 9г 1а 1зs 189 ээ� збб 37s 489 s63 6s6 69 о в2а s38 s13 s4 г s99 7в8 1173 14 вв 1ss б 1869Merchandi к 6s 71 99 143� ?68 379 зо8 з68 419 4а3 s16 47а з97 3еб 41s 4s9 617 909 1166 12а 14s9Non �hctorк rvicee 27 30 36 46 бб 87 67 121 (/4 17Э 174 1S0 141 (27 127 (40 (71 264 322 352 401Reeourcaьыи се з � 1о 7 �8 з8 э -ю �Ве � 123 -144 -112 � 127 �з1 �б -з8 -20 99 эа .112 � 16о 19sNet Гасt осlпсоте 1 0 0 2 � 1 2 6 �3 �8 -16 -23 -46 �46 -41 -4S -4S �S4 �4l �44 �20 �31FвЧоггесеlрl а 3 3 3 S S 10 15 S 6 4 S 7 4 3 3 2 6 14 � 7 S 1 7р. сгогр. утЕаа 2 з 3 3 4 8 9 е 14 2о 28 sз so 44 4е 47 бо ss 71 71 э8Сипепt prlvetetгм даге 1 2 4 s s 6 4 4 s s 1о 12 14 16 19 гг 3о 4t 72 68 э8Сипепt ассоид!ьаlм се s �8 11 -1 44 11 -1о .е4 -126 � 1ss .12s -16t �бэ -э1 -б4 -43 7s зб �84 -111 �1е8
Direotlnveetment 2 1 1 0 4 б 4 э 3 4 1 1 2 2 3 8 7 17 24 ]6 33Oth п captW 9 2 S � t �2 32 �4а 27 31 47 6S 8 � 1? � 18 .1Э .72 � 12 12 101 16 31Епогем дот lи lом г о 1 �г 7 -э s 1t 11 2 24 1s -7 1д г4 s1 зз 96 122 199 � 19C+vE[dIЬеlм са 1� �2 21 �3 б4 SZ �76 �38 �70 �93 �26 � 133 �61 �31 ;40 -2 l23 219 186 14S 69
Ch и go 1n aetгекгvее' � !4 2 -21 Э -64 -S2 76 38 70 95 28 133 61 31 ,0 ? -!2 Э -219 -186 � 145 �69
Uw ofFund oredlt .4 .» ... ._ ... -- ... 13 12 37 4! 69 ц 13 �8 � 13 � =22 �33 ' -4l �37 32Olher reeervoсьеп8а. -1о г -г1 э �ы �s2 76 ц s8 s8 .1э ы эб 16 48 17 .1о1 � 18в .14s -108 -1 о 1
3 оигсе: lnk гnatlond FinancW SWiЧ1ce, Аппиаl Repo гt, ('.191.е. А т l пиееlргlndlceca и i дсга к ,Infonnatioa far 1991 i8 nat yet availa Ыв,
-5-

The capital account balance was positive but highly variable (table 1.4). Private direct investment,quite small before 1994, surged afkar diat, auracted by the potential of the EPZ . Today, private
investment accounts for a third of the capital account balance.
Growth in the 1990s and beyond
Following all this good news of the past decade are recent developments that can some doubt on
the economy's ability to maintain its rapid progress along The same growth path. Labor, land, and
capital seem to be fully employed. Consequently, growth cannot continue to flow from putting idle
resources to work. Full employment has yielded most of its positive benefits and now constitutes a
constraint to easy growth. Labor force participation is an already high 80 percent or more for men
and 43 percent for women- Natural resources are scarce, and the country is malrin fun use of dXW
it has. The rapid growth of real wages is reducing the competitiveness of Mauritim exports. Una
labor costs grew at an average annual rate of 10 percent between 1992 and 1991, while the real
exchange rate appreciated 14 percent (table 1.1).
The export base remains weak and too heavily concentrated on sugar and textiles, which accom3t
fbr some 80 percent of goods exports. International trade in these two commodities is highly
controlled and managed, and Mauritius remains constrained by the special feattizes of its major
foreign markets. Export market concentration is also undesirably high: 80 percent of sugar goes to
EC markets and 80 percent of EPZ exporm go to U.S. and EC markets. Furthermore, external
conditions in the 1990s are likely to be much less predictable than in the 1980s. Demand for textiles
is failing and internation2l competition is growing fierce, while the future of the Sugar Protocol is
uncertain. Tourism, another success story of the 1980s for Mauritius, which has earned a welL-
justified image as a luxury beach holiday destination, is creating unacceptable environmental and
social pressures that are damaging the potential far further growth.
The Mauritian authondes and the private sector are both aware of the constraints to fu*er
growth. Both are eager to find a strategy fbr casing those constraim or adapting efficiently to them
Growth will require some combination of increased availability and improved quality of productive
factors and a frainework of incentives and regulations for inducing a more efficient allocation of
productive factors and other resources.
The availability of productive factors will grow with the population and with savings and
investment. Improvements in capital markets will be important in that regard. Even more import;mt
will be humn resources development. The main source of growth in a natural resources and capital
scarce country is labor and human capital. Inadeqmdy developed humm capital may be the binding
factor on growdi in Mauritius. To have a substantial impact, these sources of growth need to support
the potentially leading sectors of the economy as fully and rapidly as possible. To help them to do
that requires a framework of incenaves that stimulates movement toward sectors with the gnm=
-6-

comparative advantage. And it requires an economy flexible enough to allow economic performance
to improve and to reduce the costs of adjusting to fluctuations in the external environment.
The main concern here is to eliminate all obstacles to the allocation of resources to their most
efficient uses, be that in activities directed to the domestic market or to foreign markets. To allow a
diversified export sector to emerge in Mauritius, it is important that the same regulations and
incentives apply to all export activities. In this context, the integration of EPZs with the local
economy is but one of many issues. Segregation of EPZs from the domestic economy is the result
either of natural economic causes or of artificial barriers. To the extent that artificial barriers are the
main cause, their elimination will not necessarily strengthen EPZs. It may rather be that new types of
firms will develop and attract resources away from EPZs. The result could be a healthier economy.
Efficient import substitution is as important as additional exports.
Mauritius's comparative advantages seem to be shifting toward less low-skilled labor-intensive
activities. Consequently, the economy's growth will be tied to the development of sectors in which.
technology, education, and training are far more important than they have been in the past. Again,
development of these activities will depend on large investments in human capital, on the right market
signals, and on easy movement between sectors, activities, firms, and regions.
Right now, however, the economy is not sending out the right signals to direct resources to
higher-productivity activities. A tangle of incentives and regulations has created numerous distortions,while many of the regulations constitute obstacles to the free movement of factors of production.
Incentives and regulations need to be thoroughly reviewed, with an eye toward identifying and
removing those that continue to create a bias against exports. Eliminating other direct and indirect
barriers to the development of the most productive sectors of the economy will require comprehensive
harmonization of incentives and major changes in regulations to significantly improve the working of
factor markets.
The rest of this report thus highlights the external environment, which constitutes the basic
framework for any export-led development of the Mauritian economy. The future of sugar and EPZ
markets receive special attention in light of proposals for major changes proposed in the ongoing
GATT negotiations and within the EC. The main domestic constraints to development are also
examined-first regulations, incentives, and sources of distortions affecting relative prices and then
regulations and sources of distortions related to factor markets. An attempt is made to classify relative
incentives by sectors of production and types of firms. The last part of the report presents
recommendations and some of their likely impacts.
-7-

Chapter 2. Exports and the External Environment
This chapter examines Mauritius's major exports-sugar, and textiles and apparel manufactured
in export processing zones (EPZs)--and the way the external environment affects them. It looks inparticular detail at the effect of European Community (EC) policies on Mauritian sugar productionand exports and at the development of EPZs, highlighting their strengths and weaknesses.
Muiritian exports are concentrated on a few products and countries. Sugar and apparel represent
roughly 80 percent of the value of Mauritian goods exports between 1989 a '91 (table 2.1).4 Few
other products have more than a 1 percent share of exports: fish, textile ya- ;earls and precious
stones, watches, and jewelry. The EC is by far the largest market for Mauritian products (table 2.2),with France and the United Kingdom dominating, although Germany has also become an important
market over the last few years. Outside the EC, the United States is the only other major market for
Mauritian exports.
This pattern has given rise to some concern about concentration and the need for greater
diversification. Indeed, 90 percent of Mauritian exports are concentrated on six well-defined products;
those products also represent 94 percent of Mauritius's exports to the EC (table 2.3). Ie only other
significant Mauritian exports were apparel exports to the United States, representing some 17 percentof exports. While concentration is clearly high, the argument for diversification must be weighed
against the fundamental economic principle of international specialization based on comparative
advantage.
Furthermore, the pattern of Mauritian exports (tables 2.1 to 2.3) is biased by several powerful
nonmarket phenomena. Prices paid for Mauritian sugar exports to the EC are 150 percent (on
average) higher than world prices would be if sugar prices were determined by free markets
worldwide. Thus if Mauritian exports of sugar to the EC were adjusted to accum for the effects of
the EC sugar policy on prices, the share of sugar in Mauritius's total exports and the share of export
markets represented by the EC would drop substantially and that of other products and markets would
rise accordingly. Apparel exports to the United States, and indirectly to the EC, are similarly
distorted by the Multifiber AgreementWhat this suggests is that foreign policy risks rather than concentration versus diversification is
the key issue for the future of Mauritian exports. It thus becomes important to consider to what extent
the structure of Mauritian exports depends on the trade policies of Mauritius's major trade partners.Risks related to large swings in foreign trade policies are less easy to forecast and protect against than
4. Esimars for 1991 are extrapolacd from the firk half of 1991.
-9-

Table 2.1 Main erports by product of Mauritius, 1989-91
19 1990 1991
Vatle SharC Valu .Shar Varm s1am(ft mia) (%) (ar mil0 (%) (Rs MilA (S)
0 Food&live animals 5413 36.0 5565 31.7 S76 31.0
03 fish 217 1-4 161 0.9 235 1.506 sugar 4946 32.9 5104 29.1 5133 27.606 molasses 66 0.4 102 0.6 39 0.507 tea 87 0.6 34 0.5 67 0.4
I Bcvmgcs & tobacco 2 0.0 12 0.1 20 0.1
2 Crud materisis 115 0.3 127 0.7 114 0.629 cut flowers 52 0.3 71 0.4 79 0.4
3 Miaca fuels 1 0.0 1 0.0 75 0.44 Oils& fat 1 0.0 2 0.0 2 0.0s Chemicals 135 0.9 161 0.9 206 1.1
6 Manufacurd goods 929 6.2 1063 6.1 1114 6.063 cork ad woodManuf 32 0.2 41 0.2 27 0.1
65 teunilc yam 433 2.9 594 3.4 630 3.4
andscnes 335 2.2 363 2.1 395 2.1
7 Machineryuansport 272 1.3 187 1.1 374 2.0
8 Miscellaneousmanuf. 3130 54.4 10444 59.4 10945 S3.383 travl bagsp 39 0.3 33 0.3 33 0.284 appazd 7205 47.9 9192 52.3 9793 52.688 Varchem 511 3.4 634 3.6 613 3.389 Toys A gane 92 0.6 129 0.7 136 0.78g jewllery 94 0.6 165 0.9 251 1.4
9 Others 3 0.0 2 0.0 0 0.0TaM! 15050 100.0 17563 100.0 13614 100.0
Source: Ministry of Economic P.anning ad Developmr, Central Stauisical Office-
risks associated with markets risks are also likely to be greater than market risks in the 1990s, whichalready seem to be marked byincreasing acrimony in international trade relations and the languishing
Uruguay Round negotiations. Flexibility is critical if Mauritius is to be prepared to respond to majorchanges in foreign trade policies. The rigid EC sugar policy has generated rigidities in the Mauritian
sugar sector, and the rigid U.S. quotas on apparel have had similar effects on Mauritian apparel
exporters. Assessing the extent of these rigidities and limiting their adverse effects on the economy as
a whole is a crucial goal for the Mauritian authorities in the years to come.
-10-

Table 21 Main exports of Mauritius by country, 1989-91
1919 1901991
VerA Shar Vde mbfre iVane Miare(RS JmI) (%) (Rr HM) () (r M) (%)
Prcfcrenial tariff 13.714 91.1 16,304 92.8 16.751 90.0countriec
European Community 11.583 77.0 13.997 79.7 14.438 73.3Bel.ium 307 2.0 396 2.3 323 1.6Britain 5,384 35.3 6,239 35.9 6,630 37.7France 2.9M6 19.8 3,981 22.7 3,727 18.6Gertmay 1.391 9.2 1,528 9.7 2.055 12.5Italy 570 3.8 793 4.5 916 4.9Nethdrlandn 349 3.3 298 1.7 363 1.Portugal 174 1-2 216 1-2 0 0.0Reunion 292 1.9 324 1.8 364 1.9
Other prefereanial countries 2,131 14.2 2.307 13.1 2,313 12.0United States of America 2.076 13.8 2,307 13.1 2,207 11.4
P.T.A.b 55 0.4 nO Rn 106 0.6
G=ncral tariff countries 1.336 3.9 1.274 7.3 1.863 10.0Total 15,050 100.0 17.S68 100.0 13.614 100.0
a. Estimared on the basis of firt half of 1991.b. Preferential Trade Area for Easterm and Sourhrn African States; caimared from von ICirchbach [1991].Source Ministry of Economic Planning & Development. Central Staistical Office.
Sugar
With roughly 80 percent of Mauritius's sugar production exported to EC markets, Mauritian sugar
production is highly dependent on EC sugar policy (table 2.4). As a signatory to the Lom6 Sugar
Protocol annexed to the African, Caribbean, and Pacific Accord (ACP), Mauritius benefits from the
largest EC sugar import quota and high prices for its sugar exports-nearly as high as subsidized ECdomestic prices, which averaged 150 percent above world prices during 1985-90. The future of
Mauritian sugar production will be affected by the outcome of the Uruguay Round of multilateraltrade negotiations. Successful conclusion of the round along the lines suggested by Arthur Dunkel's
proposal to the GATT negotiating parties will pave the road for liberalization of international trade in
agriculture. The effect is likely to be lower prices for sugar in OECD markets and higher prices in
world markets and a reduction in support to sugar production sufficient to generate noticeable price
changes in OECD importing markets (lower prices) and in other world markets (higher prices)
generally. Even failure of the Round will not mean business as usual, however. Strong forces are at
work that will inevitably bring about changes in the EC Common Agricultural :'olicy (CAP) and so in
EC prices and production quotas. However, in that case, reforms will not be supported by
international discipline under the GATT, so changes in sugar policy are likely to rely on a variety of
mechanisms-changes in production quotas as well as in prices.
- II -

Thus both outcomes for the Uruguay Round share common elements. Both will require fundamental
changes in Mauritius's sugar policy, to improve flexibility in sugar production. As in the EC, sugar
policy in Mauritius has significantly increased the value of land (and other inputs) used in sugar
production, and changes are needed that will make it easier to shift land from sugar production to
other productive activities.
Table 23 Main eKirt of auritius by product and country, 1989-91 (millions of rupees)
1989 190M9
SugarWorld 4,946 5.104 5.138European Community 4,961United States 115Rear of the world 63
FishWorld 217 161 25European Communiy 272United Stares 0Res of tbe world 13
Textile yarnWorld 438 594 630European Community 604United Stats 0Res of the world 26
Pearls and stoeWorld 335 363 395European Community 279United States 14Rest of the world 102
ApparelWorld 7.205 9,192 - 9,793European Community 7,348United Staies 1,721Rest of the world 723
WatchesWorld 511 634 613European Comunity 487United Stats 0Rea of the world 126
Total for the products concernedWorld 13.652 16,048 16.853European Community 13,950United statns 1,850Rest of the world 1,053
Total Mauritian export.World 15.050 17.568 18.614European Community 14.785United Stanes 2.151Rest of the world 1,671
Export shares of the products concerned (%)World 90.7 91.3 90.5European Community 944United States 86.0Rest of the world i2.8
Source- Minisry of Economic Planning and Development Cenral Statissical Oftws.
- 12 -

Table 2.4 Production, exports, and prices for Maurillan sugar, 1985-90
Thaw Donvelde &WL ~ EP Epo a EC-ACPkw QMVd £douImpo aggaL toIL th .onoit-EC d n-mo imal Offm "POAS) (Ots) M) (om) % of (o) ade adW Inserwnd i
tsal"xports
1980 34.0 27.3 22.1 10.2 64.91981 34,312 16.0 23.3 18.9 148,7 I1.31982 636,550 39,720 596,830 540,121 90.5 56709 11.2 22.9 11.1 205.1 162.51983 600,902 35,595 565,307 509,191 .00.1 S63l6 I.0 21.6 17.6 196.4 159.71984 576,203 38,663 537,54S Si1,997 95.2 25548 7.1 19.4 16.0 272.7 225.61985 639,713 36,379 602,839 SOS.656 83.9 96983 6.7 11.7 16.1 279.6 240.71986 669,713 44,834 624,949 504,803 30.1 120146 7.5 24.1 18.6 321.3 248.21987 68,721 32,404 656,317 507,200 77.3 149117 10.6 21.4 21.4 266.4 201.31988 687,145 34,693 652,452 505,000 77.4 147452 14.3 29.1 23.8 203.4 166.41989 672,203 36,003 636,200 505,357 79.4 130843 16.2 26.6 23.0 164.1 142.11990 616,420 38,420 578,000 11.7 30.6 26.7 261.0 227.81991 n1a. 1a. 584,000 n.s. Au.. n1. 0a.. al.1930-85 613,345 37,034 575,630 516,791 19.9 58839 14.3 22.3 18.2 197.1 162.01986.90 666,854 37,271 629,5384 505,590 78.7 136890 12.1 27.7 22.7 243.3 197.2
Source: Mauritius Ministry of Industry; Chamber of Agriculture; Sugar Syndicate; EC Commission; and Internalional Monetary Fund; authors' calculations.a. Sum of domestic consumption and total exports.b. World (o.I.f. Rotterdam) and Intervention prices were Initially expressed in European currency units (BCU) per ton, and then changed to US cents per pound by using averageaverage exchange rates.c. EC Import prices (In US cents per pound) as reported by the IMP.d. Respectively EC lntervertion and ACP Import prices In percent of world price.
-.1I3 -

SuccEss of the Uruguay Round
The European Community and the United States have high levels of protection for sugar in domestic
markets (table 2.5).s Sugar has the highest levels of protection on average in terms of producer
subsidy equivalents among the five most protected agricultural products in those markets-sugar,wheat, meat, soybeans, and rice. The comparatively large size of the world sugar market (asillustrated by a relatively high ratio of world imports to world consumption) has not been a strong
counterbalance to this high protection level. Prices in this protected market are relatively stable, as
are the quantities sold. Thus, any major shocks to supply are absorbed by the relatively small
unprotected market., with the result that sugar prices exhibit-by far-the highest degree of volatility
among the five products considered.
The high levels of protection have imposed high domestic prices in the protected markets The high
prices have induced high levels of production, as exemplified by the transformation of the EC from a
net importer of sugar before 1975 to a net exporter (17 to 19 percent of the world exports) in the late
1980s.' In turn, gluts of sugar exports from these protected markets have depressed sugar prices in
the world markets.
Trade liberalization is expected to reverse the evolution of domestic and world prices, lowering
prices in OECD countries and increasing world sugar prices. Econometric simulations of the impact
of trade liberalization on sugar prices suggest that world sugar prices are likely to rise only
moderately-most likely about 10 to 15 percent-even in the case of full liberalization (table 2.6).
Price volatility is expected to fall by one-third once the deep world price depressions associated with
interventionist sugar policies are eliminated
Several qualifications ought to be made about the projection of moderate price increases for sugar.
Not all the models project a moderate price increase. Some show a smaller increase (OECD) or a
larger increase (Borrell and Duncan, 1992). As Borrell and Duncan (1992) point out, the models are
based on data for initial periods that may underestimate price changes if world sugar prices were
relatively high during those base years, which would make measured levels of producer assistance
relatively low. Dynamic simulations that try to eliminate problems related to base periods tend to
suggest higher increases in the world price, at the upper level of the range of 10 to 15 percent and
even higher.
5. Producer subsidy equivalents measure the size of direct subsidy tiM vmuld be necesay to compensm producers for dhmiatioof Some ocher policy.
6. The EC Common Sugar Policy was introduced in 1968. However, it was not until 1975-76 tham he EC became a nt exporter, assupport prices were raised and production quotas increased to a level well above self-sufficiency (Borrell and Duncan 1990).
- 14-

Table 2.5 Pruminn and world price volatility, 1979-9 averag
(petentages)
Auripe prducern~di~ eamivalen~*'
Erope Un~rd Jp Canadn Au~wÅ k Vain f ramgfC4muiady Ar
Sugar 59 51 68 24 12 0.13 26.5Soybeana 51 8 98 10 13 0.26 25.4What 35 31 96 30 11 0.31 20.4
M~ai' 50 33 63 40 10 0.11 9.9Ricc 44 35 81 - 27 0.42 3.9Nom:a/ Ptocmion level am amnaed by OECD produczrubuidyequiva~nt (PSEs).b/ Enimend by m afwie= ofvaåis of(odd pgsggsi WMdd is~port m pernig of worl C0m00d~ Bef for thm PSEI.
S~urce: OECD (1991)
Table 2.6 Effectu of mUiMlerul polcy reform on world :.gar prcs
23pe of D~ag nerr..bea ~ i n
OECD(1991) partial" 1979.81 0.9 -Borl and Dunean (1990) p bria • 33.0 -28Vade & Zietz parial' 197941 6.7 -Wong. Sturgis. and Borell p - 7.6 -33Lord and Bay f 10-30 -Mahe and Traver partial' 1986 7.9 -
a. Ten perc~n reduc=ion in •••m-~e in OECD coumries.b. For the U.S.. EC ad apan only.c. Dynm~ic zimuanim ovr the period 1985-2004.d. Te= percmt minimum import ~wih domesic cling .. aaed.r. OECD con~me~ pny world pric~; som liberairia of marginalproductim -mang major exporæ.f. No foral economeiemdE.g. Support reduccion Iading to 40% (EC) and 30% (US) sugr pric= cut.
Source: OECD (1991)
- 15 -

Another concern is that economic forces that are difficult to take fully into account in
econometric models may make sugar substitutes more attractive. Alternate sweeteners have benefited
from the high domestic sugar prices in OECD markets imposed by OECD sugar policies (OECD,1991). For instance, the share of high fructose corn syrup in the U.S. caloric sweetener market grew
from virtually nothing in 1970 to 36 percent in the late 1980s. The large jumps in the growth path of
these alternate sweeteners have been clearly associated with the two world sugar price peaks of the
mid-1970s and early 1980s. The expiration of patents (aspartame) and the emergence of new
technologies and better sweeteners, such as acesulfame-k and sucralose, are likely to place a cap on
sugar price increases resulting 4om a freeing of trade.
Thus the upper range of the moderate price increases is the most likely in the long run, after the
full impact of a complete trade liberalization. However, trade liberalization is very likely to be
implemented through successive steps since OECD governments will have to counter opposition from
sugar interests. With the 15 percent reduction in support prices over 1991-96 proposed in GATT
negotiations, an increase of 7 to 10 percent in world sugar prices would be the most that could be
expected for the years to come.
Faiure of the Uruguay Round
Should the Uruguay Round fail, the EC sugar policy might remain unchanged. And, indeed, as
of April 1992 the latest Commission documents contained no official plan for the reform of the
common sugar policy. However, this outcome seems unlikely. The Common Agricultural Policy has
imposed such strong pressures on the EC and such high costs on national budgets that fundamental
reform is inevitable. It may be argued that sugar is a different case because the common sugar policy
imposes no direct budgetary costs since taxes on sugar production finance subsidies on sugar
exports.7 Yet that very self-financing mechanism leads to another argument for modifying the sugar
policy; the self-financing constraint tends to erode the benefits of the policy for farmers, who might
find a return to freer markets more beneficial, as shown below.
While the exact details of a reform of the common sugar policy cannot be predicted, there are
two crucial elements that will be part of any reform of the policy in the years to come. First, past
reforms of the EC sugar policy have exhausted all changes at the margin. Any further reform will
thus concern the core of the EC sugar system-that is, it will deal with both prices and production
quotas. And thus Mauritius and the other ACP countries will have to deal with changes in both prices
and import quotas.
7. However, this argument is only partially coect. Excluded from this self-inancig sysm is the suppor of the ACP sugar tha isconsidered by EC authorities as impored (under the high EC intervenzion prices) and exportd (under the low world prices). Inother words, the export subsidies associared with the ACP sugar are rnced by the EC budget
- 16 -

Second, improving the functioning of the quota system itself rather than merely reducing prices
and quotas is likely to be part of the reform. Allowing sugar production quotas to be transferred
among EC producers could improve the situation in the EC almost immediately, even without changes
in prices and global quotas. Were that to happen, markes for transferable sugar export quotas would
be likely to spring up in Mauritius and the other ACP countries.
Further reforms under nontransferable quotas. The ACP countries argue that the Lomd
Convention guarantees access for a certain duration to ACP sugar exporters. It is hard to believe,however, that EC governments will introduce drastic changes for their own sugar producers while
continuing to protect foreign producers. A sign of things to come: the reduc Jn of the EC
intervention price in 1989/90 applied to ACP sugar production as well.s A -cial concern for
Mauritius is forecasting how deep the sugar policy reform will bitm, since it seems likely that the
changes introduced since 1981 (under the pressures of GATr petitions and market evolution) have
exhausted the possibilities for painless changes.
EC sugar policy distinguishes three types of domestic sugar, A, B, and C. Type A sugar benefits
from both a large production quota (representing 70 to 75 percent of EC production between 1985
and 1990) and guaranteed intervention prices (table 2.7).9 Type B sugar also benefits from a
production quota and guaranteed prices, but the quotas are much smaller (15 to 18 percent of EC
production) and the intervention prices can be reduced by production levies used to finance export
subsidies, when necessary. Type C sugar has no quotas and is sold at world prices.Quotas for type A and B sugars are set at levels sufficient to guarantee self-sufficiency with a
large margin of safety; the self-sufficiency ratio (production/consumption, exciding stocks) averaged
129 percent between 1985 and 1990 (table 2.7). Any production of type A or B sugars over EC
consumption needs is exported. Export subsidies (export "restiutions") compensate for the differences
between the EC intervention prices and world prices. The high domestic prices have boosted
production levels, making the EC a large net exporter of all three types of sugar. The common sugar
policy's financial rule-levies on type B quotas finance subsidies on type A and B exports-reduce the
difference between the world price and the intervention price for the B sugar. If large amounts of type
A and B sugars are exported, the ner price (the intervention price minus the production levy) received
on the B sugar can equal the world price.' 0 Rough calculations show that the net price received for
8. The EC intervention price was reduced by 2 percent in 1989/90, and the ACP sugar price was reduced by the same amour. Therevenue loss for the ACP countries has been compenamed for by a direct transfer from the EC to the ACP countries. making Clear ashift from a sugsr policy to a direct id policy.
9. They are subject to a small corceponsibility tax of 2 percent, however.
10. As summarized by Lcuck and Neff (1991). the financial balance of the EC sugar symes can be written as:(1) IA(aPjl + [B(PrPb)] - (AZPrP.)lwhere the first expression in brackes represents the fiscal revenue from the type A quotas (based on the quota quantity A. acorcsponuibility lcvy of a percent. and intervention price Pj and the second expression the fiscal revenue from the B quotas (where
- 17-

Table 2.7 Indiesons of internal forces working toward the dimentling of the EC comnmn sar policy, 1985-91(thousamds of tens)
198546 1986-57 198745 195549 1959.0 1990-91 Avuge 85-91
EC ro2~
Toual 12.720 14,156 13.212 13,915 14.272 15.582 13,976C sugar 1.222 1.312 t19 1.591 2,273 2,138 1,559EC otherproduction 11.498 12.784 12.393 12,324 11.999 13.744 12.457
" ECeanm~ Mt
Variations of stock 223 89 -458 -374 -459 445 -8
Isoport 1.469 1.769 1,866 1,904 1.928 1.860 1.799Exports~ 3.348 3.557 3,870 3.716 3.115 3.310 3,486EC internl
consumption" 9.391 10.907 10.847 10.885 11,271 11.849 10.85
Mlafqr indicarors
Self-sufficiency rarté 135.4 129.8 121.8 127.8 126.6 131.5 128.8Toad expan~' 4.570 4,869 4.689 5,307 5,388 5.448 5,045EC xces prod.' 2,107 1,877 1.546 1.439 728 1.895 1.599A quota sugar 9,516 10.540 10,540 10.540 10.540 10.540 10,369B quom ugar 2.242 2.288 2.288 2.288 2,288 2.288 2,280
World prico (EcuPton)1 193.8 168.5 203.4 266.4 323.5 203.1 226.4Lx-y on A quota (%) 0.00 0.02 0.02 0.02 0.02 0.02 0.02Inurvendonpric= (Ecl~n) 541.8 541.8 541.8 541.8 531.0 530.1 538.1Exportrgiurins (Ecu mill.) 733.2 700.7 523.2 396.4 151.1 619.6 520.7
Exportrerimi(n. (Ecu mll.)' . 780.7 821.6 678.6 732.8 n.a. D.a. 753.4
Net price of
B ugar (Ecurony 193.6 182.7 245.2 221.5 n.a. a.a. 210.8an % worldprice 99.9 108.4 120.6 33.2 n.a. n.a. 103.0
a. Total produ~io mn C ugar aports.b. Exeluding C suger exporm.c. EC å~temna producon minus tocka and exprts plus impas.d. Total prdn~cin in permnt of EC imernal conum~ics.r. C suger prodction plus xports.f. EC intrnal production minm EC in~omal consumpion.g. (Cii) Ro~erdam ntil 1988. Pari and London uince then.h. EC ces producion im the difference be.en: rc world and intervention prices.i. As given by t-EC Cour den Comp~as (1991. pag 36).j. Intervenfion price minas xpo renwionm per t= of B sugar.Source: EC A~ma! Rpor on Agriculture EC Cour des Compes (1991); author' compu.inf.
P,, is the world price and P the ner prce received by producer of type B zugar). The right ide of the eq=ution gives th5 ea= ofthe export subsidies (PrP,, tioe X. the quaniy xpored) when the quan~riesproduced under type A and B qoarhs ueced ECcnemniptin. Equai I can be slved for P&:
(2) P, . (X/)P, + [I-( ]P, + (A~P,.

Table 2.8 Simulations of changes In the EC sugar policy (million tons)
EC oroduct EC consumption EC exports
EC Member 'US'Slais *A* Bare EMS EC-wide Free Base & Fre Bae EGIS EC-nie Free(EOES) queaso period quotq quota marei quota markets pedod quoe quote mareU
(a) markets marso [a) maaesb [al 1 moabs markef [a
Belgium-Luxembourg 680 893 752 764 773 380 233 513 372 384 540Denmark 328 484 328 331 337 202 231 282 126 129 106Germany (West) 1,990 3.128 2,40i 2,503 2,533 2,208 2.411 920 257 295 122France 2,996 4,452 3,932 3,971 4,003 2.017 2,394 2.435 1,915 1,954 1,609Ireland 182 195 182 92 99 .146 ISO 49 36 -54 -51Italy 1,320 1,372 1,320 192 233 1,547 1,722 .175 .227 .1,355 -1.489Netherlands 690 993 756 769 779 574 679 419 182 195 100United Kingdom 1,040 1,285 1,040 680 712 2,042 2,593 -757 -1,002 .1,362 -1,881Tho Community 9,226 12,802 10,775 9,302 9,469 9,116 10,413 3,686 1,659 186 -944
a. Case of complete world trade lIberalization.b. The base period chosen was 1982.86.
Source: Louck and Neff (1991).
- 19 -

B sugar (intervention price minus the export restitution levy per ton of B sugar produced) averaged
only a few percentage points above the world price between 1985 and 1988 (table 2.7).
Under these conditions and if net exports of type A and B sugars increase further, only two
solutions are possible (an unlikely third would be to finance export subsidies directly from the
budget): eliminating type B quotas, which are fast becoming meaningless as net prices paid for type B
sugar tend to equal world prices, and extending the levy mechanism to the A quotas-the core of the
EC system. In other words, any further reform of sugar policy means a reduction in the intervention
prices paid for type A sugar, further reducing the benefits of the policy for EC sugar producers.
Alternative solutions have the same impact. Reducing the quantities instead of the intervention price
for type A sugar quotas will have the same revenue-reducing effect on EC farmers as reducing the
export subsidies.
The import quotas granted to the ACP countries under the Lom4 Protocol have approximately the
same legal stams as the type A quotas. The ACP countries should thus be prepared for changes in
prices and import quotas that match the price and quantity changes imposed on type A sugar by any
further reform of the sugar policy.
Inroduction of transferable quotas. Cutting the intervention prices or quantities for type A
production quotas Ls a politically costly solution. A failure of the Uruguay Round, and the consequent
absence of international discipline, would make such changes even more difficult (and could increase
the danger that more of the burden would be shifted to the non-EC producers, a potential outcome
that should make the ACP countries and Mauritius active supporters of trade liberalization in
agriculture). Introducing transferable production quotas could avert such political pressures. Under the
current sugar policy, production quotas for type A and B sugars are granted to individual producers
and are not transferable." Making quotas transferable would improve the efficiency of EC sugar
producers and would tend to reduce net exports, thereby providing some relief for the EC's problems.
Type A sugar quotas are granted to efficient and inefficient producers alike. As diagrammed in figure
2.1 (from Leuck and Neff 1991), the situation of inefficient producers would improve if they could
sell their quotas (their rights to produce quantity MN) for a sum larger than the area enclosed by
points 1, 2, 3, and 4. This area demarcates the difference between the revenues received by Type A
producers based on the intervention price P, and their production costs. Efficient producers are likely
to be willing to buy quota rights in order to be allowed to produce more-as long as the amount they
pay to inefficient producers (area 1234) is less than the gain from producing and selling the quantity
OC (= MN) of additional sugar (area 56789).
11. As shown later, type C sugar is not subject to quotm. Since it does nor convey any special right with respect to wold prices, ithas no value beyond its rnarket value.
-20-

The sale of quota rights has the crucial advantage that it will reduce the EC exports. The
production abandoned by the inefficient producers (MN) is not totally made up by the efficient
producers. A world sugar price of P., would make it more profitable for efficient producers to divert
to EC markets the quantity they had been exporting (OX) before they purchased additional quota
rights-a welcome move since it means lower export subsidies.12
Markets for transferable quotas could be organized within each EC member state or for the EC
as a whole.13 Leack and Neff (1991) have estimated the impact of these two arrangements on EC
production and exports (table 2.8). As expected, quota markets have a much more powerful impact at
the EC level than at the national level, reducing production to the point at which the EC would no
longer be a net exporter of sugar. Leack and Neffs estimates suggest that the world price would
increase from a base rate of 11.6 US cents a pound to 12-5 cents a pound in the case of national
quota markets, 13.1 cents a pound in the case of an EC-wide quota market, and 13.5 cents a pound in
the case of global trade liberalization In sum, EC-wide quota markets would have almost the same
impact on world prices as a full-fledged llberalizationI
If markets for quota rights are organized on an EC basis, they are likely to cover imports from
ACP countries as well. These markets could be organized on a national basis (Mauritian quotas would
be sold only among Mauritian producers) among all ACP countries, or among EC and ACP
countries.
12. Note that since the quantity MN-OC (the quota ansferred). she quantity OX also measures the reduction in EC production.
13. There is a weil-known rc!a_ance ia the EC to introduce markets for transferable production quota. A strong argumer agaiRthat position is the fact thar, in the absence of mams in quom rights, the value af sugar quotas will merge in the increased valueof the land used for sugar production. In other words, quotas distar markets for land-with the additional disadvamageratransctions are much less numerous and their effccs last for longer periods, making mistakes much Irger and thus much more
PainfUL
14. Markets for quota rights will face two difficulties. The political argument has beca weaknd since coming up against the self-financing constraint, so that only the EC-wide versus national-level markets for quota rights remains as pounds for the politicalargumu. Another problem is that ncgotiable quotas could crease problems in matching processors with their suppliers, given theregional namure of production (BAE, 1985).
-21 -

vr,
� � � ��
�
оV и
N� ............................ Ф 1r
. л ................................. ......................................... s ��
�п_� '`т
�, N
� ; . а �`�С .........................».......».................»....» � ........_ � �
Z ............................................................»...........у р
�.
�.
�
D
.
�. . �
� 1

Evolution and shw1ure of aqxwt processing zmm
The EPZ sector in Mauritius has evolved through roughly four periods. Mw legislation
establishing the EPZ program was passed in 1969 and ushered in a period of rapid expansion of
manufactured exports, mostly textiles and garments. Investment was heavy baween 1970 and 1976,and the number of firms rose from 4 to 84. the mun er of employees from 640 to 17,400. In the next
period, from 1977 to 1982, investment and employment growth slowed, and the number of firms W1before picking up again- Between 1983 and 1999, there was a resurgence of investment and growth in
employment and output (table 2.9). Iben, affm 1998, growth tqxu-ed off again. -
Ihese four periods reflect changes in a number of underlying ftctors. Miere were shift in the
relative amou of foreign and domestic investment, the composition of outpm plant shm, labor
market conditions, export marixts, and dw exchange regime.
In the first paiod, domestic investors played a greater role in the development of EPZ Wastry
than in subsequent periods. Much of the financing for equity investments came from the sugar
industry, which had benefited from the sugar price boom of 1973-75. This som= of domestic
financing began to shrin'r however, with the end of the boom and the increase in the sugar cqxnt tax
after 1977. For a time, the sugar sector, once a traditional source of domestic finance, even became a
net borrower. The slowdown in EPZ growth during 1977-82 (Table 2.10) can also be attributed to the
gressive appreciation of the rupee, which tracked the rising doll= more closely than it did the
cmT=cies of Mauritius's more important trading partners.
Foreign investment played a more important role m die second surge of Jurvestment from 1983 to
1988. A recent survey (Lamusse) of firms operating in March 1987 finind that the foreign sham of
equity was 73 percent for firms established in 1984 and 1995; for firms established between 1970 and
1983, that share was only 53 percent.
The surge in investment after 1983 was dominated by Hong Kong interests. These investors put
their money almost exclusively into knitwear and garments. Fully 95 percent of the enterprises
established between 1983 and 1985 produced gloves, garments, and knitwear. French investors were a
distant second, and their investments were spread over a wider range of products, including toys and
leather goods as well as garments.
Ibe new firms established by the Hong Kong mvestors tend to be bigger than previously casting
firms. They are generally extensions of larger inwgrated production and marketing operations of dwk
Hong Kong p . 71hey focus on lower-end products that are simple and standardized and w.
labor- Wtensive production processes requiring little skill. 71he Mauritian portion of their operations is
usually restricted to the cut, sew, and trim activities. (Me AfWa po is an exception to this
pattern, with activities in spinning, weaving, and dyeing as well as assembly.) Design, finance, and
marketing decisions are made in Hong Kong. W-Rh the influx of these firms there has been a marked
increase in imports of inputs from Far Easteru sources.
-23-

Table 2.9 Basic stts on export procMsing zones ka Mauritius, 1983-90
1983 1954 1915 195 1957 195 198 9 1991
Number of nabli.mx,.r 129 179 244 365 469 559 571 528 586Number of employeea 23.424 33.751 47.842 67.938 82.554 37.392 87.035 89.906 90,361Average employme~tper eablii-n 182 189 196 136 176 156 153 170 155Valuc added (R. million) 543 365 1,333 1,900 2.515 3.125 3.450 3,975 4,400Valuc added per employce (rup~na) 23.395 25.629 27.363 27.967 31,313 35.758 39.616 44.213 43.425Companmrian of employeeu(Ra million) 263 406 661 975 1.275 1,580 1.765 2.075 D-a.Compmnrikn per empkys(rupeeM) 936 1.002 1.151 1.196 1,237 1,507 1.689 2,056 E.a.Exporu(Rs millon) 1,307 2,151 3.23 4,951 6.567 8.176 9.057 11.442 12,36Imporm(us milion) 847 1,651 1.530 3.863 4,801 5.890 7,502 7,389 7,067Net export. 460 500 1.753 1.08 1.766 2.286 1.555 4,053 5,069Nt expor0/expor(%) 35.2 23.2 53.4 22.0 26.9 28.0 17.2 35.4 42.0Iavemem(Rs million) 74 210 340 560 655 370 900 690 630Valuc adddexport(%) 41.9 40.2 40.6 38.4 39.4 38.2 38.1 34.7 36.3
rorh Rar
Number of ctablithm~mm 38.3 36.3 49.6 28.5 19.2 2.1 -7.5 11.0Numbr ofemploye 44.1 41.7 42.0 21.5 5.9 -0.4 3.2 1.1Aveage employmentper c=sablishuent 3.6 4.0 -5.1 -5.4 -11.2 -2.4 11.1 -8.8Valuo addd 57.8 54.1 42.5 36.1 20.9 10.4 15.2 10.7Compeminofemploye 54.4 62. 47.5 30.8 23.9 11.7 17.6 G..comnvu..ian per employe 7.1 144 3.9 7.6 17.1 12.1 21.7 EA..Export 64.6 52.6 50.8 32.6 24.5 10.8 26.3 6.1Impr 94.9 -7.3 152.5 24.3 22.7 27.4 -1.5 -4.4Invenment 183.8 61.9 64.7 17.0 32.8 3.4 -16.7 -3.7
Sourc: Diges of Industrial Stei.i~ Cenåral Suaiini Office.n.a. no available
Table 2,10 Imports and e~port of EPZ frm, 1977-90
1977 1978 199 1980 191 1982 1983 1984 195 195 1987 195 19 19 1991
Rsr miion
Totad export .(f.o.b.) 433 484 620 349 1,087 1.235 1,306 2.150 3.272 4,960 6.700 8.179 9,057 11.442 12,136Total import(e.i.f.) 301 340 395 658 681 742 846 1.650 2.524 3.337 4.801 5.390 7,502 7,389 7.067Net exports 132 144 225 191 406 493 460 500 748 1123 1.899 2.289 1.555 4.053 5.069
Exportas % ef GDP 8.0 7.7 8.1 9.3 10.6 10.5 10.2 15.0 19.7 25.2 28.4 29.4 28.6 31.3 28.4
Nec export.as % of GDP 2.4 2.3 2.9 2.2 4.0 4.2 3.6 3.5 4.5 5.7 8.1 3.2 4.9 11.1 11.9Nc export.as % oftotal export 30.5 29.3 36.3 22.5 37.4 39.9 35.2 23.3 22.9 22.6 23.3 28.0 17.2 35.4 27.2
Source: Quarriy Exrnal Trade Smrriem. Central Sra~rimi Office.
- 24 -

There is an important locally owned segment of the industry as well. Locally owned firms fall
into two groups. One includes a large number of small and medium-size firms with fairly low levels
of technical know-how, management, and marketing skills. They fill delivery orders for foreign
buyers in which the terms of the delivery (timing, volume, design) are tightly set by the buyer.
The second group consists of local firms that are similar in size to the Hong Kong firms.
However, their operations are different in scope. They produce some of the same low-end products,but they produce more sophisticated upmarket products as well. Bonair Knitwear, for instance, has its
ows iesigners and creates its own models, and these h.vc achieved some recognition in Europe.
Firms such as Floreal have developed their own marketing channels by keeping in close contact with
clients and minimizing the use of intermediaries. The larger local firms tend to be more verticallyintegrated than their Hong Kong counterparts. Spinning, weaving, dyeing, and garment production are
part of an overall process, although factory facilities are often separate.
Since 1988, all EPZ firms have experienced the effects of a tightening labor market and otherchanges whose influences are likely to persist for some time. There are complaints that firms are
raiding employees from other firms. Wages are rising, making the lower-value-added productsvulnerable to competition from lower-cost countries. The scope for contract production of standard
products for foreign buyers is being reduced. Firms that will be able to compete best are those that
can move upmarket, react quickly to delivery orders, and shift smoothly to new patterns and designs
as new fashion trends emerge and seasonal demand change. Staying ahead of the wave of change will
require investment in design, training, marketing, and more sophisticated automated production
technology.
Influence of vrade agrewnes
Trade agreements and regulations in importing countries have also influenced the development of
the export industry in Mauritius and the patterns that are likely to emerge in the future.
In the 1950s and 1960s, the newly industrializing countries of the Far East expanded rapidly into
the textile and garment industries. As trade-restricting measures such as the Multifiber Agreement
(MFA) and various voluntary export restraints began to proliferate, a second generation of producersemerged. These trade restrictions instituted by industrial countries were particularly confining for
knitwear and garments, especially for Hong Kong and Korea. Hong Kong had the additional difficulty
of the uncertainty created by the agreement to become part of China by 1997.
Mauritius was an appealing investment site for some of the Hong Kong firms because of its
coverage by the Lomd Convention. The convention allows goods manufactured in Mauritius, among
other developing countries, to enter EC markets without quota restraints. If the goods satisfy certain
content requirements, they are also relieved of import duties. Thus some Hong Kong firms found it
worthwhile to transfer the labor-intensive portions of their production to Mauritius. Even firms thatfail the domestic origin test (because they receive cloth and raw materials from Far Eastern sources)
and have to pay duties still find the arrangement attractive because they can avoid quotas.
France is now the largest importer of Mauritian-made garments, although other European
countries such as Germany and the UK are also large importers (table 2.11). The second largest
-25-

market for Mauritian clothing is the United States. The U.S. market is qualitatively different from the
European one. It consists largely of standard mass-produced articles, primarily woollen knitwear. The
U.S. imposition of quotas on Hong Kong producers made it attractive for them to transfer production
to Mauritius, and exports increased rapidly. But once Mauritian exports reached I percent of U.S.
imports of these goods, an annually renegotiated import quota mechanism was triggered. Now
Mauritius faces for some items essentially the same problems expanding in the U.S. market as Hong
Kong does. Moreover, Mauritius is not covered by the Generalized System of Preferences (GSP) in
the U.S. market. That means the exports of certain Mauritian goods bear duties in the United States
that comparable goods from other producers do not.
Compositon and strure ofproducdon
The garment industry accounted for 79 percent of EPZ exports in 1990 (table 2.12). The neat
largest EPZ export was watches and clocks (5 percent). followed by textiles (4 percent) and precious
stones (3 percent). Growth was greatest in the watch and clock assembly subsector, which expanded
sixteenfold between 1982 and 1990, although from a low base. Clothing was second with a tenfold
increase. Growth in the other subsectors has been considerably slower.
The EPZs are very heavily import dependent (table 2.13). Local materials and supplies account
for only 17 percent of gross output value for EPZs as a group. With the exception of the small
*other" caregory, wearing apparel has the highest rate of use of local intermediates (21.4 percent).
Most of this is accounted for by the local purchase of textile products that have a very high import
content. The other local consumption by the EPZs is for labor and for services such as water,
electricity, rentals, transportation, and repairs. These services account for just over 10 percent of
intermediate consumption and have significant import components as well. If all indirect imports were
taken into account, the true local share of intermediate consumption by the EPZ would be
significantly less than 17 percent.The single largest category of imports among EPZs is textile yarn and fabric, which accounts for
57 percent of the total. Next is machinery followed by optical goods, watches, clocks, pearls, and
precious stones (table 2.12).
Overall, domestic value added in the EPZ sector was 32 percent of gross output in 1989 (table
2.14). For a small open economy, a one-third share of local value added n the output of export
industries may be reasonable. It is important to be clear about what this means, however. Local value
added is split roughly in half between operating surplus and wages. Included in the operating surplus
are capital consumption and profits. Capital consumption reflects the cost of using (largely imported)
machinery and equipment. In foreign-owned firms, the profits accrue t foreigners. Wages, which
account for only 16 percent of gross output, do accrue to Mauritians. The wage share is highest in the
wood and furniture subsector (29 percent), followed by paper products (20 percent) and leather
products (18 percent). These are tiny sectors, however. In wearing apparel, the share is 17 percent.
-26 -

ТаЪ1! 211 EPI. i Ф р0!!i aRd OcpOeb OI М аш Ф � вЬ7 оот � Тв1990
оггs � �ллг г!тСа�огоу 1�т s �illlaw periY н 1� r � fBae р�ет д �t
Аивtсв[й 22 02 65 0.9Аиsй а iS 0.1Hdgiam 321 2.Е Zц Э. О
' НсагSl 31 D.4С� овда 83 0.7t � ia. збз в.9 - '
- Dептедс 42 0.4Fги ь� 3.7 Е0 32.9 1.390 [Е.9 ,Gamвкhr 1.456 12.7 665 9АGmeee 13 OZ
� НоиЕ Кдn` S2 Os Е14 1[. [ ,ladia 311 42Iadonesia ЗЕ 031reland 34 0Э -Iaad 33 03 6S 0.9lиуг 670 S.E 264 3_ б7арва 13 O.L 350 42Коп а 152 i1М всаи [7 0.2М вда� кдг SO 0.4 Ф 0_9М вl аувй Е1 1_1 �Ncthal вnds ц 9 Z3 4 OSNeav Znland 1б2 2.2Noгaq ?3 0.2pstiwn 169 2ЭRemio п 149 1Э �SinEepoea s3 0.4 2Е2 З.Е �Souch Aй iea 31 0Э ?Аб 3.3Spaio Z3 ОЭSw�edea 74 О. б
- Sa пaaland 139 1.Z . Z65 3.6Tвiwao 790 10_71Ъвдеод бб 0.9
_ Uaited 1Cmgdom 1.914 16_7 Z00 2.7Uuimd Snoea 2А 24 17.б 95 1ЭТ� т ЬвЬwо 30 0ЭOther 197 1.7 107 13Tant 11,474 100А 7.351 100А
Sоnгта Qnaeoerlp F� гл вl Тл деS� a. Ст и l Sо�пт са! 01 Г�се
- rT -

� � � � �.� � � � � � а � � !! ��.� � � � � .� � � � � � � � g� � � �� 'i у � � ЧС�С � � � ~(� � � � � � и � ~ ~ts�L ~ Е�С � 0 ~ ~ � н�. � Б � �� й� � = � +г М а 'д '! М . �� � � i � � � N
а�
� � � � � � � � � � � � . � ��
� � � � . �� � � � � �g � � 5 � 6
��� . � � � � � � � �� � � . � � � � � , � �� � � �. � �� �� � �� �.� � �� � � �� � ��� �� � � �: �. � � ��, � R � � � � � � �� � � � . � а
BwN ;.� �.1 w � . � � Н О О � . � л � � л й а �" N р�С� у�С� N ц� 1� �N,, м �р�С� у�С� � ' �b � 1 �J в+lJA0в N � 0 о О О О � I в1 С1000� г+ Ч в� 1/ � � 'j � Ow010 � JN�0 � � �О # G � C01J Ч W W � �Q
8 WlJ1A1J � .1 И Wи � OONJ �O W О � lJ �Jo-~" W W � ' Vо : � л о И и i л � blw о И а tо :.. � �о ... � ..... � S.`''. й � �̀ .'Sё � й � � � i: °+i � .W$aI3iS'i � � '.. .. я8 � + � w � N«..w и� 8v �.+a � W �З ..N � N т' � .. �o � i toai.� o� ...o � : � b И ..L'abat � л i. � . � $` а' .лi3.'$` д"�SBoi � .' � '�4 а B � Pл� NлS% �i � .
00 w ... ..N � 8 ... л и м� r � 8-i � � � 'i л L'i.. +� .. � � tBa� � i к � � � � й � иb Й b. л �л Wlw�ca � oa � i� oir � И � iab � � g еие� ; й � G � �'
~ N �J ffi Н . � ... а� N л а ... � л .. "' н .... л `r ''О О Ч �О а {� i � Iwb �O О О а С а С s. И o � F� O� � з %iiai+ � oиoJ1� .8 Й л ~ � �� � S й :° � ' � � BS �
� q "' л.. и ...... е... а � 'iW й ^ л .. ° � и � � �b Й bbi в i �+ И aN.� i '8oiwoiwл tn и i� � ibo � й й � $ о� 8 й а � "" й'i � в ь� м :� а � � �"' "' и w$wo � ,.....NwN о� S �oo. � i. л � «.w л о :: .. � + °'
. � ...N `'oira �o:..o. �� L.Fi ь. bi.at л N:.ioi �+: � i.,b �� � � $ � 18: й � й 8 � ' � w � 'i � � � � g: й Z�a" � �.. .с. л8 � + О и .- � .-N и 1. � о �р о и "!� и й .-w л 0 � v ` � ' р�С _ �bb+bt л И b � b � o: � ot л b,ao:�..'0 � 4,:.1n. � � � 8 � 4� 'i:°8wG'Q � � � й .�и.Gt ь� й '� � �̀"� t й �n+ н в+
8w.. и ...... и а. � 8: о р� о в. �"..WWO ~w а .. �о . � w �ia:.i � i.:-.:.f �+:.l и iл oir �o �-i � b� �oY.bи : � w8ь�''оо� �'' � � i � ' � � � � 0 � � � й � �Е о�'i �S �.. ..8+- и l� b л i,wi � � 8: .. и о л � .. в. и л � "'`' �о w .. .1р�С.vIA � � (J О Ов М V � �AGiAiw{J �rJ � � � � � ы+ � N1д � � 41 �р + � 0 � � W ^
�
� � 1 ' �

т�ьk 2.i3 т� ао� роо� or т� гс� ь7 toan � � .19ss- �я апе,+ аrгт д ятоlи ялvаls of
оо� т� .. ь.аrлиi �д� w� Fo� r� a rл� с ra � c wo.�r � s� � лrr� г
�- w �Teuile уаеааод ЕвЬгi п 16.4 0.9 6.1 392.3 8А 4003 3.2 2.8 8.4 ОЭ 438.6
_' Wacing вррвсд 29.6 3.1 26.0 1.336.5 434Э 1.790.8 83.1 21.3 49.7 ц .3 2.027.9IгвгАегprodueo 0.7 0.1 233 0.7 ц .2 32 03 33 0Э Э2.3 �Wood вод
- furniwoe 0.2 0.2 4.2 03 4.7 0.8 0_7 0.4 02 72WвоеЬа . дод0 :видартiа l8 оодв 26 0.1 02 1233 123Э 13 0Э Z3 03 1Э0.8
Je+Yelcy 1.0 0.1 0.2 96.7 0.1 9б.8 11.4 13 4.2 О. б 1 ц .8О t Ьс 2А 0.7 3.8 iS.O S33 1403 3.4 2Э 9.3 1 � ! бЭ_бToW S?3 4.9 36. б 2,081.7 499.1 2.580.8 106. б 29.2 77.8 27.8 29162
ра 'сгдсТаа8еупавод tвbrics 3.7 02 1.4 89.5 1_а 913 0.7 0.6 19 0_1 100 АWев й � вррвед I3 0.2 1Э бб.9 21_ � а83 4. [ 1.1 23 1.2 100 АLeatbcr prodneca 2.2 0. � 0Э 72. Е 2.2 74.9 9.9 0.9 10.8 0.9 100АWood аад .fiaaidue 2.Е ОА 2.8 3i.3 b.9 6S3 11.1 9.7 S.6 2.Е 100 АWmЬes,clocb водорба l soods 2.0 0.1 02 94 Э ОА 9� Э 1.1 OZ 1.8 0.4 100.07e� dry 0.9 0.! 02 833 0.1 ffi.б 9.8 1Э 3.6 OS 100АOt1.ei I2 0_4 2Э QO 33S Е3.9 2.1 1_4 5.7 i_0 100АTaat 1.8 0.2 1 Э 71.4 17.1 883 3.7 1.0 2.7 1_0 100А �
Sоаге� Colleetio � of Soп iвics of FoooomGc ActiviR�cвVo1� i l98S-1986. Сеасеаl St вdfodL О tГ�
-29-

. � ��� � � ��Q g� �� �� ��� � �� � �� ���� ��� �� �� � � � i � �v ё� W � � � � � � ,� os �е N�. �. ., � � .� � g $ р� � � � � . � � � �' � �.А � �. � ��. �. . ��. �.. �� � � � � � ., �8 � � �� �. � �.. � � q ��. - .. �
� , О р� в� «. r ль.. .. ь. р�С ыр�С. ... � .. rр�С ьр�С. � j .. � � J �р�С N ьJ. ь . F�
� SSfi $ 800 SS$00 J н 00 а 01 И � Ч Оиi � � � �� _s _ �и N ^ � � s.
01 � О 0 � N � �О 1. 0 � М J 1в1 V 0 � 0� Й � И п̂. W J р � О ьи� . � i i. �, N р
о � �" �� и wg �а v и .-
� Я ~ � Ь' �Sii` �" aSi � � � a � о � й � й � i � � а � $$ й �� °� � �°
1 � �
� 'iOив � Si°:n' � Оиf.� .Q � й � � Оwв � � � �± й а а + � i � й � �
� . � ,�
J ea� � NO� io � � � a м C'iC Рл k' �5 �3 и р� и о г.`''� й б � qt �
� �
Й � Ч �N-� O� 1ii 1Nв � � А н 0 � WОв 0� О N О � О {A1�p � i � � �
. � �W
1�+ N � � ` о � � : й � � й � � � й ig и � : Р3 й � � � 's � �
� .. , , � . �

Textiles and apparel
Textiles and apparel are by far Mauritius's largest industrial exports (table 2.12). Thus the
international environment in the trade of textiles and apparel products wiH be crucial fbr the country's
economic development. In the years to come, this environment is lUely to impose two major
constraints on Mauritius.
First, it will require a high degree of flexibility from Mauritius because it will introduce more
uncertainq thin previously, for a long period, whatever the outcome of the Uruguay Round. Vðer
the Uruguay Round succeed or fhils, international trade in textiles and apparel wM contim, to
depend on decisions made on a year-by-year basis. The commitments of the trading parmers wM not
be dam-mined once: and for all by the results of the Uruguay Round negotiations but wM be based on
progressive -: -i of very general decisions made during the Round.
Second, increased Libor market flexibility will be required. Mauritius's primary competitors are still
low-wage economies, such as Bangladesh or Cbina rather than the newly indu=Wized counuies,
such as Hong Kong. 'Mat makes a flexible labor market a crucial prerequisite for a smooth upgrading
of textile and apparel exports and of the skills of the labor fbrce (see chapter 4).
7Wo basic componeza of any scenario
If the Uruguay Round fails, the result is I&dy to be a more or less liberal contimiation of the UFA;
if it is suc=sK some form of progressive elimimadon of the arrangement wffl occur. Altimugh k
might appear that the environment faced by Mauritian exports of textiles and apparel depends heavfly
on the final outcome of the Round, arguments couched in terms of "failure or success= greatly
overstate the real differences that would occur in the international. environment for trade in textHes
and apparel in the years to come. A more usefid way of assessing firture prospects is to focus on the
two basic components of any scenario for textiles and apparel: how tight the bilateral. quotas (the level
of ex ante protection) and bow loose the antidumping and safeguard rules (the level of the ex post
protection). With the focus sliffied there, it becomes clear that whether the round succeeds or faft,
the outcome wM not be that different in some respects: in either case there is likely to be a decline in
the ex. ante protection and an 'increase in Ihe ex post protection.
A hkely dedme in quota protection. A successful conclusion of the Uruguay Round along tim hne&
suggested in the proposal of Arthur Dunkel is likely to lead to the prvgressive dismantling of the
bilateral quota system of the MFA. However, even if this occurs, elimination of the MFA
quotas-scheduled to be completed over a ten-year transition period-cannot really be taken for
granted. Failure of the Round is likely to lead to the adoption of the fifth application of the MFA
(MFA V) by January 1994. But it is nonetheless likely that the slow process of market opening begun
under the MIFA IV wili continue under MFA V, particularly in the European Community, the main
market for Mauritian exports.
-31-

The similarity between the two outcomes is reinforced by the fact that the Dunkel Uruguayliberalization draft for textiles and apparel is heavily "back-end loaded. In the current draft,
importing countries must lift quotas on 4 percent of total imports (by volume) before January 1993,
an additional 12 percent by January 1993, 17 percent by January 1996, 18 percent by January 2000,
and the remaining 49 percent by January 2003. The crucial point is that these percentages are based
on all imports of textiles and apparel-whether currently restricted or not Since roughly one-third ofU.S. and EC imports of textiles and apparel are n currently restricted, the qiotas could be phasedout in a way that results in no change at all in the degree of trade liberalization until December 1999
(that is, 4% + 12% + 17% = 33%).
Thus the pattern of ex ante protection in the years to come could be quite similar whether it takes
place as a result of a cautious implementation of the Uruguay liberalization plan or through an MFA
V general protocol that allows more liberal bilateral quotas between OECD countries and exporting
countries. That outcome would be a very slow relaxation of quotas between 1993 and 1996 to 1999.
What does this mean for Mauritius? On the one hand, Mauritius clearly has little to gain in terms of
access to new markets from a relaxation in quotas. The bilateral system of MFA quotas affects
Mauritius only marginally-in the IJ.S. market, which receives only 17 percent of Mauritian exports
of textiles and apparel to OECD countries. By contrast, Mauritius has benefited greatly from its
membership in the Lom6 Convention, which has protected it against more efficient competitors, such
as Hong Kong or China, which are constrained by the EC's MFA quotas.15
On the other hand, Mauritius's exports to OECD cou-ies will be under increasing pressures from.
new competitors if quota protection lessens. A more liberal MFA V will reduce the currently high
degree of discrimination simply by making all bilateral quotas more generous. Under a cautiously
liberal strategy, MFA V is likely to relax quotas .rj. small exporters more rapidly than for others to
minimize the risks of import surges. And the Uruguay liberalization plan could lead to a similar
outcome: the draft states that annual quota growth rates in effect in 1992 will be raised gradually
during the transition, in a way that is likely to favor countries with high quota growth rates in
1992-that is, mostly medium-size and small exporters.In sum, relaxing quotas, whether through a more liberal MFA V or a progressive and heavily back-
end loaded Uruguay Round liberalization scheme, is likely to bring few new export markets to
Mauritius while, increasing competition in Mauritius's traditional markets. This general trend is likely
to be stronger in Mauritius's major export market, the EC, because of the special relations between
the EC and certain Central European countries. Czechoslovakia, Hungary, and Poland, small to
medium-size exporters of average-quality textile and apparel products, have signed an Association
Agreement with the EC. The three countries represent a considerable challenge for Mauritins in the
15. However. the ACP saw did not amly climinate significan cases of z post proection against Mauritius. as illusrad in thlses 1980s by various obstades faced by Mauritian cports of textiles and appard to cousain EC Mcmber Staes.
-32 -

short run-in terms of quality upgrading, privileged relations with EC firms, relatively low-wages ofsemi-skilled labor-even if they offer additional opportunities for exports in the long run.
A likely increase in ex post proteaion. Under either the MFA V or the Dunket liberalization plan,reliance on various types of ex post protection-antidumping, antisubsidy, or safeguard measures-islikely to increase. When applied to counter import surges, these measures are likely to target efficientexporters. When loosely applied or interpreted, antidumping and antisubsidy may be particularlyharmful to exporters such as Mauritius, with certain specific domestic structures of production.
Mauritius may be hurt for two reasons: its labor market is fragmented and most of its exports oftextiles and apparel come from EPZ firms. A fragmented labor market (that is, a.market where exportfirms receive special treatment in labor legislation) may be judged an indirect form of subsidy tospecific sectors, while the EPZ system is likely to be viewed as a system of direct subsidies to
exports.
What this will mean for Mauritius will depend on two factors. First, it will depend to some extenton what kind of dispensation for export subsidies developing countries receive under the Uruguay
Round and the Lomd Convention. However, since dumping charges can often be substituted for
subsidy charges-and developing countries have no dispensation from dumping complaints-this factor
is not likely to have much of a role.
Second, ex post protection is likely to be less active against exports under outward processing trafficrulesl6, which establish a direct link between developing country imports and re-exports of textiles
and apparel and the welfare of their trading partners in the OECD. Outward processing traffic rules
represent a form of trade organization by firms in OECD countries that is crucial for their survival.They are thus unlikely to protest against expansion of this type of trade, although some complaints
may be lodged against other OECD firms. The share of outward processing traffic in total imports for
the OECD countries is thus a good indication of the reduction in risk represented by increases in
safeguard or antidumping protection. For France, the most important market for Mauritian textiles
and apparel exports, outward processing traffic represented 35.5 percent of total French imports from
Mauritius in 1989 and 24.8 percent in 1990 (Union des Industries de l'Habilement, 1991). In other
words, one-fourth to one-third of Mauritian exports of textiles and apparel is likely to be relatively
immune to ex post protection.
Mauritn perforera ce in U.S. marketr
By many standards, Mauritius's exports of textiles and apparel products are a success story. This
judgment is often made on the basis of booming exports to the major OECD markets, particularly toEC markets which expanded almost sixfold between 1980 and 1989 (in current rupees). However,
16. That is, rules governing tradc by which developing country firms buy intermediasc inputs from OECD firms and them cxpon thefinished products back to the country of origin of the inputs. Such exports are me under specia rules thast exempt them fEom soebarriers to other imports to OECD markes.
-33 -

Mauritius's performance in EC markets probably does not provide an accurate indication of
Mauritius's competitiveness. Mauritius's ACP status has protected it from the MFA quota limitations
that have impeded the export growth of its major competitors, such as Bangladesh, China, and Hong
Kong, and Mauritius has benefited from outward processing traffic rules while its competitors have
not.In the U.S. market, however, Mauritian textile and apparel exporters face bilateral MFA quotas just
as its major competitors do. So what does Mauritius's experience in that market show (see table
2.15)? During the second half of the 1980s. Mauritian exports faced increasingly more quotas as moreof its exports gained a market share larger than 1 percent in several MFA categories-from exports in
three MFA categories in 1985 to thirteen in 1989. Roughly 75 percent of Mauritian exports of textiles
and apparel to the United States are subject to U.S. quotas, a higher percentage than for China and
Hong Kong.
Table 215 The U.S. MFA quotas on Mauritian exports, 198549
195 15 1987 1988 199
Number of categorics under U.S. MFA quotas
Mauritius 3 5 7 11 13Chinae 1 2 4 7 8
333% 40.0% 57.15 63.65 61.5%Hong Kone 2 3 4 6 7
66.75 6D.0% 57.1% 54.5% 53.3%
Trade coverage of the casegaries concerned
Mauritius - - - - 76.1China 50.5 63.8 50.5 514 61.0Hong Kong 56.9 58.6 63.6 67.0 683
Relative utilization caes in the categories concerned-
Mauritius 7.2 113.7 98.9 92.2 105.2Bangladesh - 115.9 117.4 123.8 127.4China 119.8 123.2 119.8 121.5 131.5Hong Kong 121.9 I18A 113.7 133.1 125.3
Relative unit values in the categories concerned
Mauritius ISD.4 122.2 136.7 139.7 985Bangladesh - 67.9 90.4 77-9 733China 63.1 96.1 30.8 74.0 92.3Hong Kong 139.0 123.9 140.3 129.2 134.6- Number of MA catgores or which both .M.m and Maurtn eporsm face quotas (Percentage shows tracmon of caragoresfor which Mauiian exporrers face quotas, for which Chinese exporrs face quotas also.)
Same as fabio:a. eept using Hong Kong in place of Chinese exporters.Utilization rarse (shipmentWfquoas. in volume) normalized by the rate. for all the cxpores subject a the U.S. MFA.Unit rans (shipments in valuc/shipmcnts in volume) normalized by the rates for all the exporcers under the U.S. M6FA.
Sourc- World Bank Database. COMTRADE. Authors computations.
- 34.-

Mauritius has been increasingly involved in quotas that also affect China and less involved in
quotas that also affect Hong Kong. This pattern implies that Mauritius is increasingly supplying
apparel products that compete with low-wage economies. What this suggests is that the functioning of
Mauritius's labor markets will crucially affect the future of its apparel industry, particularly with
respect to product and quality upgrading.
A-comparison of the performance of Mauritius with that of Bangladesh, China, and Hong Kong in
terms of annual utilization rates (the ratios of shipments to quotas, in volume) shows Mauritius faringpoorly.' 7 In sharp contrast to the increase in relative utilization rates observed for Bangladesh and
China, the low-wage exporting countries, rates for Mauritius stagnated and in 1987 and 1988 they
were even lower than the world average.
A comparison of changes in the utilization rates with changes in unit values (normalized by the
performances for the whole set of countries subject to the U.S. MFA quotas) shows a clear inverserelation between them for Mauritius: increases in relative unit values are accompanied by decreases in
relative utilization rates. The same type of relation seems to apply in 1987-89 for iong Kong, but it
does not appear clearly for the two low-wage economies. Once again this finding relates to the
capacity of Mauritian producers to upgrade production, and the relation that bears to pricing behavior.
Data provided by the Mauritian government sheds some light on the recent performance of
Mauritian producers of textiles and apparel (table 2.16). All the categories in which Mauritian exports
are subject to U.S. quotas are in the apparel sector, again underlining the importance of labor markets
in this labor-intensive industry. There is a marked decline in the export utilization rates in 1990-91
compared to 1989-90. Table 2.16 compares utilization rates using Mauritian government data and
World Bank data. Despite important discrepancies between the two sources of data for three groups of
categories (dresses, woven shirts for men and boys and for women and girls), the same global figures
are obtained for 1989, the common year for the two sets of data.
An examination of changes in Mauritian exports under U.S. MFA quotas from 1985 to 1989 shows
that half of Mauritius's exports (shipments) of apparel were concentrated in three stable categories:
shirts for men and boys (340) and trousers for both men and women (347.348) (table 2.17). During
that same time Mauritian producers seem to have lost the U.S. market for woven shirts for women
and girls (341.641) and to have entered the market for underwear (352.652) in a significant way.
Mauritius's three major exports to the United States constitute a very small share of total U.S.
quotas for those products-a little more than 3 percent for shirts and roughly 2.5 percent for trousers.
Its quota shares are higher in its declining market of woven shirts for women and girls and much
17. To ciinsiv- facnrs related to the general MA policy of the United States, the utiliarion ratio. shown in table 2-15 Iha beennornalized by the annual ratios for aH countries exporting tomiles and apparel to the United Stares and aubject to MFA rsuisions.For the other three countries, relative uilamion rates have been higher than the reference rae. (that is, utilization wase. exceed 100
-35-

higher for underwear. Since utilization rates are similar for the major products, relative shipmentsshow that Mauritian txports are much smaller than exports from China (one-third) and Hong Kong
(one-twelfth). Utilization rates for the major items are very close to 100 percent.
Has this situation generated quota rents for Mauritian products? It is hard to say, although it seems
likely (table 2.18). For the three products with maximum utilization rates, the unit values of
Mauritius's expoLs to the United States are higher than the corresponding unit values of its exports to
the EC. The same is not true for the other products examined. However, while the differentials canbe said to reflect the quota rents, the identification of the recipient of the rents remains unknown*
Mauritian producers receiving higher prices, Mauritian or U.S. intermediaries receiving higher
margins, or U.S. consumers receiving higher quality (upgrading related to quotas), or a combination.
Trends in patterns of trade
Key forces that will determine the pattern of trade for Mauritius over the medium term can be
discerned now, despite the uncertainty of potential changes in the GATE and in other international
trading arrangements. The imposition of U.S. quotas on a piece rather than value basis creates a
strong incentive to upgrade production to maximize the value of exports. The US Caribbean Basin
Initiative creates an incentive for producers to shift operations to countries such as Jamaica and theDominican Republic, which are not only closer to the United States but are also largely unaffected byMFA restrictions. The Hong Kong firms that specialize in the lower-end products and have less
vertically integrated production processes are more likely to leave Mauritius while the domestically
owned firms that have invested in upstream production facilities as well as design and marketing will
be more likely to stay in business. Even now, the Hong Kong firms have been more active in serving
the U.S. market while Mauritian firms focus more on the European market.
Wage pressures in Mauritius will force producers to abandon lower-end products and move towardhigher-value products for export to the European market and, even more so, the U.S. market. Worker
productivity will have to increase through a combination of higher-quality fabrication and design,
lower rejection rates, and faster, more adaptable production technologies. Mauritius will not be able
to compete with low-wage entrants into the garment industry, and it should not try to. There might be
some potential for Mauritian entrepreneurs to transfer some of the lower-end production to lower-
wage countries in Africa, as Hong Kong did earlier with Mauritins. This process is already
beginning. There may also be some potential for Mauritian textile producers to supply textiles to
offshore subsidiary garment manufacturers. If the subsidiaries are in Africa, the products meet rule-of-origin conditions under the Lom Convention.
New investment will have to accompany any move toward upmarket production. There are certain
scale factors to consider. Spinning and weaving are divisible processes. Increases in capacity can be
accomplished by adding new lines. Finishing, however, is different, and it makes sense to install
-36 -

Table 2.16 Maritian epor ubject to the U.S. MFA, 1985-I99
GrMIA~r wif" u~ r um- Hr rMwim a* ( sfMa-ur y(ar On
d= d=k - - WvDgwÉ f zggjur kSM90W 199P-91 Mg A~ DSun
Quotaa for 1989-1990
237.637 play~uim. muim X X* 13.0 16.5 24.6 .1989 China. Hangimg331 glovs&~mian * I n 1988 China, Hongkon335.835 con.. women and girl X X 33.9 23.9 11.6 1988336 dre~ses X x 121.5 10.4 28.4 1989 China. Hongleng337.637 n.a. X 31.3 1988338.339 shit., knit mm and boys.
women and girl X X 91.8 73.7 87.3 1985 China340.640 shirt, woven. ma and boy@ X X" 75.6 50.8 91.4 1985 China, Hngkong341.641 sbin, wov~n. wom=n and girls X X 35.0 10.5 81.5 1986342.642 scr X X 35.8 13.6 46.2 1988345.445 swcrr X 75.6 19.3347.348 &rous, shoru. me and boys
women and girls X 93.1 82.7 100.0 1986 China351.651 nightwp~ra X 0.0 42.2352.652 undewear X x 121.5 41.3 .. 9 1989442 skirm X x 4.1 0.0 0.6 1988 China, Hongimag604-A n.a. X 100.0 1989604-Z :.a. X 100.0 1987 China638.639 zbira knir me~ and boy.
wom~n and gida X X 80.5 89.1 100.5 1985 China., onong647.648 rou~es shorn, mn and boys
womn and girl X 63.4 60.2
Quoas for 1990-1991
652 undcrw~ur X 8.8 1990
All amgorianweighed avrage 65.0 38.2 60.6weig~red averagc 80.1 49.4 81.6
. Weighted by shipmnu (o piece for GoM data, in squarem = for World Bank data).Source: Govern«Ce~ of Mauriti and World Ban daeaa- for Textic and Apparl (1992); amis' ca[cultian
-37-

Tabk 2д7 ТЬеевоЫ доn о[ the 1VLuritian crporb under U.S. 1VII'' А qaotis,1985.89
U� w Sh4mt Q�+ м . � е1'� лоа� . � аг � уойv. м а п fl. т . �е 1� . й �' �Yur с� огi � в .Ьи д � и ' ' �cs) cs1 съ;.. ка. гr� м... �т. сът. нац�г� s лгr д;оv съь. >� ra � аz; � ... л�
� ...wo � :1 яат
19ц ]33.339 0.2 2.2 1,4 19334 1р ,р193 б ' 4.3 3.] 44,2 S.OS4 2, б71,з
�
l9Ь7 ' S.4 3.1 71.4 3.127 33907 -
193i ' S.b 1.3 96.6 99.5 5. я19 7. � 93 10.f 10, ц {,419б9 ' 3.3 2.0 4s.б i13 10.99! 10.2St 10.0 11.Ч 0. б19ц 330 б0.3 2.3 95.6 99.i 7R1 Z339 3.332 2.330 26.1 7.S 6,W4.719� б ' 29 9 Z6 100.0 101.6 3б.7 2509 3.371< 3.079 3Z2 � f.2 1.156l.419 �3? ' 243 3.3 100.0 10Z4 100.0 3.292 4. ОТ7 2.715 33.3 9.2 . 12,9 я7.S19l3 ' Z02 3.2 L00.0 100.2 100.0 2101 4.2ZD 3.737 ц .7 9.1 17,t90i.01935 б3i. й19 0.0 0.3 37. б .. i710 ._ 3_4 30.919 бб ' S.T l.3 102 А ?Z2 3_04t 1_154 5.4 3ц .i19i7 ' 103 l.6 100.0 TL3 4.043 1.7/0 4.t 3.61L71936 ' 33 l.i 100.0 90.7 36.? 2 ц S 3.401 �242'! 1Т.7 6.4 3.1QN.71989 ' 32 1.4 100.0 100.5 l2.1 3. бц 3. ц 3 2.2511 113 5.7 3.377.7
(�uow во�ет q � l9 бб1936 ц 1. бt1 30.9 9.2 2 � 0.3 i б79 10, � ц . у1937 ' 11.1 7.3 63.0 6.Oi3 13,Z яS. б19ц ' 9.1 3.7 70.4 3306 7,134.11939 ' 7.0 1.t � 13 3.133 7,R14_ Т1936 Зр .3Ч 29.1 1. � 10D.0 100.4 105.3 5.103 5.1 ц 3.032 10.6 3.7 11 АТ13i937 ' 34.6 L6 100.0 1029 94.0 5.992 6.19i 3.26t ц 3 7_9 22335.719Rt ' 30.6 24 100.0 10.1.4 100.0 3.33! 5.31N 1.156 213 7.3 30. � 719«9 ' 22.6 Z4 100.0 100.0 10DA 6.11б 6.694 4302 233 3.2 32,750,4
Q � or вд t ов< а 193Т � '
l9q 6W 93 1.7 99.3 35.9 3L4 L9iI 26% 2235 9.1 16.1 4,ZDб.7193i ' 20 1.3 927 73.2 [9.1 L9W 3.114 3. С)0 10.7 16.i 1.i10319 а7 604-Z 1� 17.1 27.2 100.0 9.116 0.239 1193 3LLS.9
Qиаоввоепе� i 193i19if 33L 0.0 23 100.0 100.0 .. 1. Зб0 1.357 .. 7.4 3_9 15.4 �1939 ' 0.0 1.0 100.0 97. б _ 1.333 1.5 ц ., 2 я 3_6 2lJi19 �i6 335.1Т5 3.t 14.3 ц .g г :63 2, ц у.01939 ' O.S 31.0 11.6 4_OZ6 7Zl.g _198d 337.637 3S Т. З Э13 0.709 S97A19б{ ЗСL б4ц 9.0 Zl.4 743 4.Z34 3,9 ц _s19д9 ' 33 37 7 � 6.2 4_314 3,?10,�1963 ц 2 0.2 1.4 43 д 39.7 322 14.345 16.103 3.900 ц .7 7 164.419t9 ' 0.0 33 329. 90.4 0.6 10.701 16.736 117.7Т1 29.7 14.1 1113
Quos ва � т 19191939 737 1.6 24 100.0 3б.9 ц . б 1Э54 1.393 L494 9S 13_0 301.91959 936 1.2 33 93.1 100.0 2i.4 2.135 5.{12 1.436 30.1 21.б 590.71939 3W.6W 2Z9 i.0 91.4 2, бц =0.39 б,31939 332.632 2f.f 2fJ 9 � .9 0.6t5 5.1 ба_1193 я во1- А б.0 3.] 100.0 a2S7 310.9
' Uirui бвваЬГрт т в � рвоовц вд �иы вЪ� ав а or � m7s aw1 врувевl Ра двсь Га +roi � e).� 1 �1{f[ � l � УОд вУ рГJ0 � � ОЕ bd1 VS � О � i0[ 1!!6 ООООУ О� � Ory Га � 1.
'Ft равоеl оwвегr �� аЪ� вв свврв ов ьб� О[ ь 4 УУв доГlb аовов ь i аа �i а7 Га � 1-� 1lfr в о вавЬiра Ф S ввяа{� +вр 0[ СSа в' � Q А ав<l; УОЬ'� вЬq о в ь Га ьеl � вi-5а цос wагl дНвоk DвоЪввв lfor тет 7в а�д /1 ур � д I19921. Ал Ьт � аат q е бао�
- 3S -

Table 7-18. The ccis of in f4suritian apparel CqNWft to the US., IM
WC-3 W qum Udfiradon Rdadve urdr values 1d]imat &MIS Fares[a] 1h] [c] U-S. EC BAmin FrAwe Raw[q
341.402D 3473U 91.9 102.2 98.1 76.0 L16.7 97.6342.6020 347.348 91.9 103.3 98.6 30.3 100.5 93.4343.2420 347.342 91.9 109.0 94.1 111.6 90.3 9&4943.7100 33SM9 94-3 94-3 Ins-5 111.7 102-7 171.2242.5020 342 31.9 86.7 115.6 113.1 101.3 123.1944.2310 351 21.1 77.1 142.2 V] U) 60-5
Sourew CSO. Extm-1 Trade Statinticz. 1991; Table T2. Author's computations.
Noten: [a] SITC W= from the blaundazi ttsda statutics.[b] The con=pudsum barwacs SrrC i-ma and US qum b= has been an do basis of the labels of the items.[c) Average utilization nams provided by Table 44[d] The world unit value for the concermW item is the rcfercum (100).(a] Raw- Rest a f the vmclcL[f] No notiorableim rw this km.
capacity that will match longer-term needs. Thus there may be an issue of cccess capacity in the short
term. Development of offshore subsidimies could fill the demand gap by using Mauntim bbnc in
high-volume, low-margin clodiing productim ths is fast becoming unprofitable as wages rise in
Mauritius.
One firm has already established a sweof-the-art textile will nea Triolet. Ibis operation has
experienced a number of techniml difficulties, and the cost overruns; have put the venture in financial
trouble. Moving upmarket is not as easy as adopting simpler older ted logies from parent firms
abroad to take advantage of low local wages. Trhimg requiremews are more demanding, and worker
altitudes toward absenteeisra, quality standards, and the like become more important becmm of the
higher degree of interdependenice and the contumous; nature of production processes. As the
tedinology becDmes; more complex, the potential grows for simple human error to snowball into
major material wastage and cosdy delays.
Trends for the rest of the EPZ sector will be similar to those for textiles and garments. Wage
pressures will force &= to improve productive efficiencies and to shift to product Imes that will
raise the value of output per worker. Representadves of some of the EPZ firms interviewed fmr this
study believe that government regulations andadministradon make it difficult for firms. to shift to
higher value-added products- Customs, the Bank of Mauritim, ard the need for approvals from a
series of government ministries were cited as problem areas. Delays are costly not only because
resources are left idle, but also because the failure to meet delivery schedules can mean that
cuslomers refuse to accept goods and cancel future ordem. There have been very substantial
miprovements; ut die efficiency of government regulations in recent years, however, espec=Uy those
-39-

of customs and the central bank. Telecommunications have also improved markedly with the
introduction of international direct dialing.
Regional agreements
Mauritius is a member of three regional agreements: the African, Carribean, and Pacific Accord
(ACP, which includes the EC), the Preferential Trade Area for Eastern and Southern African States
(PTA). and the Indian Ocean Commission (IOC). Trade with the ACP-EC zone constitutes 75 percent
of Mauritius's exports. Trade with the PTA and IOC constitutes barely 1 percent, largely because the
economies involved are so small. The PTA zone has more than 200 million inhabitants, but a
combined GDP of only 548 billion-less than the GDP of Hong Kong alone and about that of
Portugal. Thus the PTA and IOC are likely to play a rather marginal.role in the development of
Mauritius's trade for a long time to come.
Gains from trade flow from differences between trading partners: the greater the differences, the
greater the gains. Thus Mauritius will gain more by trading with the EC and the newly ;ndustrializing
Asian economies than by trading with the PTA and IOC countries.
Arguments in favor of a large role for the PTA and IOC focus on joint exploitaton (in arable land,mining, energy), a derivative of the concept of scale economies. The approach makes good economic
sense under one condition: that the external tariff (between PTA or IOC countries and the rest of theworld) is low enough to enable expansion of the scale economies developed in the trade group to
worldwide dimensions through appropriate exports (and to benefit from the increased exports through
increased imports). If the external tariffs are high, then joint exploitation of scale economies within
the PTA or IOC zones would be limited to the benefits of scale economies within, say, a country the
size of Portugal or Hong Kong. They will certainly be much less profitable than direct trade with the
EC or the newly industrialized Asian countries, with their much larger GDPs and thus the immensely
greater possibilities for scale economies.
This condition-the only one on which Mauritius and its trade partners in the two regional
agreements can act-does not seem to be met. The partners have no common external tariff so the
national tariffs of members must apply, and these tariffs are generally very high. Preferential intra-
PTA tariffs cover only a small list of 700 products. Unless the PTA and IOC agreements come to
include large reductions in the tariffs between member countries and the rest of the world (as well as
within the zones), the agreements will represent only a limited interest for Mauritius.
Other avenues for regional cooperation may be more fruitful than trade in goods. Increased mobility
of capital and labor between Mauritius and its neighbors could be of great mutual benefit. Mauritius is
high-wage and labor-short relative to neighboring economies. A union of know-how and capital h-o n
Mauritius and cheap labor from these countries would make everyone better off-and increasingly so
as Mauritian manufacturers move upscale in types of product and product lines. There has already
-40-
been some Mauritian investment in other African countries in relatively low-skilled garment
production, and there may be further potential for Mauritian textile producers to supply independent
or subsidiary garment producers in these countries. Such arrangements could serve as an excellent
vehicle for technology transfer between developing countries and could also help to circumvent quota
restrictions under the MFA.
Mauritius is also short of land. Virtually all land on the island is in use. While some gains may be
possible through reallocation to higher-valued uses, land will always be more of a constraint in
Mauritius than in other African countries. In addition, high and increasing wages tend to make
Mauritius uncompetitive in crops that require labor-intensive cultivation or harvesting. This creates
opportunities for profitable exchange of labor and capital, either through investment by Mauritianagricultural producers in other countries or through the use of immigrant labor on Mauritian farms.
All of the PTA and IOC countries should cooperatively seek ways to facilitate flows of investment,
labor, and technology.
-41-

References
Abbott, George C., 1990 , SEMga, Routledge, London.
Borrell, Brent, and Ronald C. Duncan, 1990, "A Survey of the Costs of World Sugar Policies," TheWorld Bank, October, Policy and Research Working Paper Series 522.
EC Commission, The Situation of the European Agriculture in 198* various years.
EC Cour des Comptes, 1991, "Special Report on the Functioning of the Common Organization of theSugar and Isoglucose Markets," EC Official Journal 7 November, C 290, pp.1-56.
Leuck, David and Steve Neff, 1991, Potential Effects of the Policy Reform on the EC Sugar Marketand World Sugar Prices,' August, U.S. Department of Agriculture.
The Mauritius Chamber of Agriculture, 1991, The Sugar Industry: Situation and Outlook, November,mimeo.
Ministry of Economic Planning and Development, Central Statistical Office, Exterjial Trade Statisticsvarious years.
Ministry of Industry & Industrial Technology, 1991, Mauritius at Crossroads: The IndustrialChallenges Ahead. February, E. Bapoo.
OECD, 1991. The Imoact of Policies on the Structure and Functioning of the World Sugar MarketOECD, Directorate for Food, Agriculture & Fisheries.
von Kirchback, Friedrich, 1991, 'Mauritius Trade with Member Countries of the Preferential TradeArea for Eastern and Southern African States," October, UNCTADIGATT.
World Bank, 1989, Mauritius: Managing Success. World Bank Country Study (red cover), WorldBank, Washington.
World Bank, 1991, Mauritius: Exnanding Horizons: World Bank Report No. 9685-MAS (grey cover)World Bank, Washington.
-42-

Chapter 3. Regulations and Incentives in the Output Markets
This chapter examines government interventions affecting relative output prices, especially trade
policies, price controls, and subsidies. These policies affect the relative prices of goods and services
(produced and consumed) and, therefore, the allocation of resources among sectors and to some extent
among firms, the composition of consumption, and the destination of sales. The exchange rate, which
affects decisions to invest and produce between tradables and nontradables, is analyzed in detail in
appendix A, which also discusses foreign exchange policy.
Trade policy
ImportrMauritius has three sets of import taxes: fiscal duties, customs duties, and import levies (box
3.1), referred to collectively as import taxes. A 5 percent sales tax applies to imports and
domestically produced goods (6 percent for unregistered imports). Imports in some categories pay no
import taxes, which creates distortions in the allocation of resources across categories, and some firms
within categories ar. exempt from import taxes.
Box 3.1 Import taxe in Mauritius
Cunma duty - 0-0 percent for noaupreferesil counies; smo for prefiutial counter.Fisca. duty - 0400 pelt for an caumricsImzt levy - 17 paceut; a for exUps goodsSales - 5 pescet. levied as the c.i.f value plus the import levy, cusms, and fiscal
dutims to 6 percent for nouregistewd producers.
Data on import value, import taxes, exemptions, and legal or statutory tax rates for 1991 are
shown in table 3.1 for ninety-eight categories of imports. The legal import tax rate includes taxes
actually paid and exemptions. Sales taxes are not included in the import value or import tax reported
in table 3.1 since they are not specific to imports.
-43-

The total value of imports in 1991 was 24.2 billion rupees (Rs). Total import taxes were Rs 4.0billion, for an average import tax rate of 16.7 percent. The total value of tax exemptions was Rs 3.4
billion. Excluding imports that benefited from exemptions (45 percent) the import tax rate nearly
doubles on those that were not exempt to 30.6 percent or to 42.8 percent of the c.i.f. value of imports
other than those used in EPZ production and goods transhipped, warehoused, or temporarily
admitted. That means that had there been no exemptions, import tax revenues would have been about
83 percent higher or, alternatively, that the government could have collected the same revenue at a
significantly lower tax rate (16.7'" percent instead of 30.6 percent).
The overall average import tax level was calculated using weighted import shares. But to
measure the impact of nominal protection on the average price of import substitutes, nominal
protection rates need to be weighted by production shares and not by import shares. This was done
only for manufactures as a whole since production data were not available below the four-digit
classification level. When weighted by production shares, average tariffs are about 35 percent higher
than when weighted by imports. Evidence from a large number of developing countries indicates that
the average rate is significantly larger (often more than double) when weighted by shares in output
instead of import shares. This is because high tariffs are used to limit imports; for some products dutyrates are so high that there are no imports. Thus the product does not enter the import-weighted
average even though thae degree of protection is very high.
In 1991, import levy collections were 5.4 percent of the value of imports, import levyexemptions were Rs 824 million, and total import levies (including exemptions) were 8.9 percent of
total imports.Customs duty collections averaged 1.3 percent of total imports, ranging from 0 to 60
percent on individual items. The fiscal duty (the largest component of the import tax) averaged 9.9
percent of total imports and varied from 0 to 600 percent on individual items. The legal import tax
varied from 0 to 237 percent in 1991, with an average of 30.6 percent and a standard deviation of 44
ptrcent. Thus the coefficient of variation of the legal tax rate was over 1.4, implying an extremely
high degree of variability.
Import Levy collections amounted to roughly one-third of total import tax collections (RIs 1.4 of
Rs 4.0 billion), customs duty collections to 7.9 percent, and fiscal duty collections to 59.4 percent.
Four of the ninery-eight categories accounted for 40 percent of inport levy collections, 63 percent of
customs duty collections, and 59 percent of fiscal duty collectic ns (27, mineral fuels and oils; 84,
nuclear reactors, boilers, machinery, and mechanical appliances; 85, electrical machinery and
equipment; and 87, vehicles other than railway or tramway). Import taxes collected from these four
categories constituted 52.8 percent of total import tax collections for the ninety-eight categories,
although their share in total imports was only 29.6 percent.
18. This figure is calculated on the assumption all zisfing emuptions would be climineaed. Maintining exemptions for the EPZa,temporary admison. warehouses, c., while iminabting other xAmpionus would allow the rare to be reduced to 27.5%.
-44-

Table 3.1 Value of exports and import taxes, 1991(millions or rupees)
ImpeIr f"pr Ex-pd-r Tax no.s4ze hm-rWIcding crampd-m
S
01 Live animals 63.5 3.3 0.3 6.502 Mcat 285.0 13.3 78.6 .32203 Fish and crustaccans. molluscs and 333.0 12.0 0.4 3.704 Dairy produce; birds' eggs; natural 554.0 7.6 0.0 1.405 Products of animal origin. not dsa 14.8 0. 1.4 11.506 Live tres and other plants; bulbs 2.9 0. 0.2 - 17.207 Edible vegerables and certain roots 174.2 10.-. 6.1 9.408 Edible fruit and nuts: peel of citrus 115.5 41.6 0.5 36.509 Coffc. rta. mate and spice. 27.1 5.6 0.0 20.710 Cereals 502.2 7.0 51-3 11.611 Products of the milling industry; MA 104.3 7.9 8.6 15.312 Oil sods and olcaginous frits MIS 21.6 4.9 2.1 32.413 LAC; gums. resins and other vegetab 15.0 2.5 0.1 17.314 Vegetable plaiting materials; vegeta 11.5 1.9 0.1 16.915 Animal or vegetable fas and oils A 284.7 30.4 17.2 16.716 Prepared foodstuffs; beverages, SPI 161.3 13.8 0.0 8.517 Sugar. and sugar confectionery 41.3 15.9 0.1 38.718 Cocoa and cocoa preparations 34.0 19.2 0.0 56.519 Preparations of cereals. flow, srm 114.8 40.9 0.0 35.620 Preparations of vegetables. fruit. N 78.4 34.0 2.5 46.621 Miscellaneous edible preparation. 133.6 47.8 1.6 37.022 Beverage., spirits and vinegar 52.0 119.7 2.9 236.823 Residues & waste from the food indu 91.4 2.1 0.0 2.324 Tobacco and manufactured tobacco 5.0 7.7 0.1 156.025 Salt; sulphur; carths and satonc; ph& 569.5 91.6 4.3 16.326 Ores, slag and ash 0.0 0.0 0.027 Mineral fuels, mineral oils and prod 1.807.5 649.6 102.5 41.623 Inorganic chemicals; organic or ino 178.7 17.f 13.8 20.129 Organic chemicals 137.0 18.2 8.6 19.630 Pharmaceuticals products 330.0 15.2 1.1 4.931 Fetilizers 121.5 5.3 11.5 13.832 Tanning or dycing extracts; annins 207.8 15.2 10.9 12.633 Essential oils and resinoids; pcrfum 48.8 43.9 1.5 93.034 Soap, organic susfaceAcxive agent 48.1 19.8 17.3 78.235 Albuminoidal substances; modified S 19.7 5.9 2.3 41.636 Explosives; pyrotechnic products 5.2 8.7 0.0 167.337 Photographic or cineaatographicG . 48.4 23.1 2.0 53.038 Miscellaneous chemical products 238.7 19.3 27.4 19.639 Plastics and articles throf 613.3 132.7 109.2 39.440 Rubber and articles thereof 222.8 83. 36.8 56.441 Raw hides and skins (other than fur) 102.6 0.0 0.0 0.042 Articles of lesher, saddlery and H 40.6 10.3 36.6 115.543 Furskins and artificial fur; manufac 0.0 0.0 0.0 -44 Wood and articles of wood; wood C 311.7 44.2 7.6 16.645 Cork and articles of cork 3.7 0.7 1.9 70.346 Manufacuresof straw, of caparo 4.1 13 0.6 46347 Pulp of wood or of other fibrous ce 0.6 0.0 0.0 0.045 Paper and paperboard; articles of P 4013 44.9 115.1 39.949 Printed books. newspapers. picare 165.1 10.9 3.1 5.850 Silk 820 0.0 0.0 0.051 Wool. fine or coarse animal hair; Ho 642.7 0.0 0.0 0.0
-45-

Table 3.1 Value of exports and import taxes. 1991(millions or rupees) (continued)
Impors Exampdovr Tar sure,.IApor zera (vale) Including crangpda
(5)51 Coan 2.126.4 0.0 0.0 0.053 Other vegetable textile fibret; pape 5.5 0.0 0.0 0.054 Man-made filaments 471.0 0.5 0.0 0.155 Man-made staple fibrs 600.9 0.0 0.0 0.056 Wadding. felt & fonwovens; special 30.2 2.1 5.9 36.457 Carpets and oder textile floor cov 11.2 10.1 4.1 126.3SB Special woven fabris; tufted textile 296.4 0.0 0.0 0.059 Impregnated. coated. covered or Ia 110.8 1.6 2.4 3.660 ICnined or crocheted krics 510.8 0.0 0.0 0.061 Art of apparel and clothing ac 132.7 31.0 11.3 23.262 Articles of apparel and clothing s 182.7 31.0 11.3 23.263 Other made up eile articles; acts; 22.4 8.9 7.1 71.464 Footwear. gaizrs and the lik: part 74.0 33.6 7.2 55.165 Headgear and parts thereof 9.9 S.5 0.7 62.666 Umbrellas. sun umbrellas, waking- 2.7 1.9 0.4 55.067 Prepared feathers and down and at 4.9 4.3 1.6 130.66 Articles of atone. plasrer, cement, 713 22.7 12.1 48.369 Ceramic producca 194.6 82.7 3.1 46.770 Glass and glassware 169.8 74.7 7.3 43.371 Natural or cultured pearls. precio 693.6 9.4 232.0 34.672 Iron and steel 542.0 94.9 19.0 21.073 Articles of iron or steel 541.0 121.3 213.1 61.374 Copper and articles theretof 39.5 9.1 2.7 29.675 Nickel and articles thereof 0.6 0.1 0.6 116.776 Aluminum and articles thereof 92.7 22.5 7.2 32.073 Lead and articles thereof 3.1 0.5 0.4 29.079 Zinc and articles thereof 18.2 3-2 0.0 17.630 Tin and articles thereof 7.8 0.7 0.9 20.581 Other bease metal; ccarmt; article 1.0 0.1 0.1 20.082 Tools, implements. cutlery. spoons 37.6 21.6 10.7 36.983 Miscellaneous articles of base mets 138.4 58.0 19.2 55.384 Nuclear reactors, boilers, machins 3,0923 472.1 758.0 39.335 Elrical machinery and equipmewr 1.0521 338.3 362.4 66.686 Railway or tramway locomotives. ro 20.1 0.0 3.2 15.937 Vehicles other than railway or tram 1,137.2 667.4 266.6 73.788 Aircraft, spacecraft. and pa the 401. 2.5 270.4 68.039 Ships, boa sand floating strucare 18.1 7.6 3.1 31.590 Optical, photographic. ciamgtogm 305.4 56.3 105.3 52.991 GCode and watches and parts iher 329.1 10.6 195.6 62.792 Musical instrumncs: parts and mcce 12.9 2.1 0.6 20.993 Arms and ammunition; parts and acco 3.7 12.9 0.3 151.794 Furniurs; bedding, m oe ess, ma 96.9 51-3 53.3 103.595 Toys, gaess & sports requisites par 69.7 30.2 3.2 55.196 Miscellaneous manufactured artid 159.3 33.3 5.0 24.097 Warks of art, collocuors' pieces and 3.4 0.3 5.0 155.99 Miscellancous 103.0 C. 0.0 0.0
Total 24.162.4 4.030.0 3.3553 30.6
a. Import tax - fiscal duty + customs duty + import levy
-46-

. Table 3.2 Customs collections and exemptions, 1991(millions of rupees)
Dudres Pawd Dulkyc"rwre
CSUSms Sals Saler Semy and and Ermregime Value Pho_t Oamr Lew ncse Toral Fiscal WOm Levy Emdse Terab %)
Normal 11.782 1.786 304 1.198 516 3.103 120 9 14 6 149 3.3Donations 14 0 0 0 0 0 1 1 1 1 4 1Sports/cultural 9 1 0 0 0 1 3 1 1 0 5 833.3Ag.. Fish, Air 87. 0 0 1 16 17 226 120 113 29 43 96.6Embassy 75 0 0 0 0 0 41 7 3 5 61 1Ind. raw aerial 936 549 0 0 5 554 16 6 122 2 146 20.9Ind. raw assembly 175 5 0 27 10 42 69 21 3 6 99 70.2Ind. machine 39 4 0 6 3 13 10 2 1 0 13 50.0hMin. cxcmpt 2.436 13 1 52 43 110 724 279 325 90 1.418 92.8Other excmpt 427 33 13 29 14 89 99 34 21 11 165 65.0Otherb 156 4 0 5 2 11 21 4 7 3 35 76.1Total 16.861 2.395 313 1.313 609 4.640 1.330 484 616 153 2,583 35.8
Transhipmea 64 0 0 0 0 0 *0 0 0 0 C 0.0Warehousing 2,877 0 0 142 0 142 0 0 0 0 ( 0.0Temp admission 116 0 0 1 1 2 0 0 0 0 0 0.0EPZ-ESZ 7,423 0 0 0 0 0 534 209 215 136 1.093 I
Total 27.341 2,395 318 1.461 610 4.784 1,864 693 331 289 3,676 43.3Total lesstrans., warc 24.284 2,395 318 1.318 609 4,640 1,864 693 831 289 3,676 44.2
a. Consios mosly of petroleum on which there are deferred fiscal duties.b. Includes exampions on flows of goods diverted from EPZ. Temporary Admiss., Drawback sysems, cat. to domesbic cosuamion.c. Net of inrcr-firm transfers.
Source: Cusroms Administration special tabulations.
Ekempions. The exemption system is complex, with more than 400 exemption categories of
which more than 200 are commonly used (tables 3.2 and 3.3). Of the Rs 27 billion (c.i.f.) in imports
in 1991, Rs 11.7 billion met "normal" exemption criteria that permit minimal exemptions. About Rs
10.4 billion entered under the EPZ, temporary admission, and transhipment programs, and werevirtually completely exempt The remaining exemptions, roughly a third, were subject to morecomplicated rules. Special ministerial exemptions accounted for Rs 2.4 billion of imports. Some of
these exemptions were granted to domestic producers for imported inputs or because the producers
faced overwhelming competition from imported final goods. But other reasons also came into play,
and it is clear that if the system is to be regularized and made more transparent, simplification will be
needed. Ministerial exemptions accounted for Rs 1.4 billion, or over half of the total amount of
exemptions.
The next largest exemption category is agriculture, fisher;es, and airlines, with Rs 488 million in
import tax exemptions. As with the much larger category of ministerial exemptions, these ezemptions
are needed because the tariffs are so high. If rates were lower, exemptions would not be needed.
Other exemption programs are relatively small.
- 47 -

Table 3.3 EIrective and statuiory tariff rates, 1991
Awmm effectw r ff% Awrae sranory rmIff t%S
Cknom Sale saesanry Impr and mad
regfmfe Valre 1tcal ouasm Levy cs Toa Fihd Onae... LaV dEdM TOAWNormal I1.72 152 2.6 10.2 4.4 32.3 16. 2.7 10.3 4.4 33.6Donations 14 0 0 0 0 0 7.1 7.1 7.1 7.1 23.6Spotswcultural 9 11.1 0 0 0 11.1 44.4 11.1 11.1 0.0 66.0AS.. Fish, Air 812 0.0 0.0 0.1 2.0 2.1 27.3 14.3 14.0 S.5 C.2Embassy 75 0.0 0.0 0.0 0.0 0.0 54.7 9.3 10.7 6.7 31.3Ind. rawmaterial 936 58.7 0.0 0.0 0.5 59.2 60.4 0.6 13.0 0.7 74.8lad. rawassembly 175 2.9 0.0 15.4 5.7 24.0 42.3 12.0 17.1 9.A 10.6Ind. machine 39 10.3 0.0 15.4 7.7 33.3 35.9 5.1 17.9 7.7 66.7Min. exempt 2,436 0.5 0.0 2.1 1.1 4.5 30.3 1 L.5 15.5 5.5 t2.7Other exempt 427 7.7 3.0 6.8 3.3 20.1 30.9 . 11.0 11.7 5.9 59.5Other 156 2.6 0.2 3.2 1.3 7.2 16.0 2-7 7.7 3. 29.7Total 16,861 14.2 1.9 7.8 3.6 27.5 22.1 4.8 11.5 4.5 42.3Transhipment 64 0.0 0.0 0.0 0.0 0.0 0.0 0.0 0.0 0.0 0.0Warehousing 2,377 0.0 0.0 4.9 0.0 4.9 0.0 0.0 4.9 0.0 4.9Temp admission 116 0.0 0.0 1.1 1.0 2.1 0.0 0.0 1.1 1.0 2.1EPZ-ESZ 7,423 0.0 0.0 0.0 0.0 0.0 7.2 2.1 2.9 1.8 14.7Total 27.341 3.8 1.2 5.3 2.2 17.5 15.6 3.7 1.4 3-3 30.9Total lesstrans.. ware 24.284 9.9 1.3 5.4 2.5 19.1 17.5 4.2 8.8 3.7 34.2
a. Consisma mosly of petroleum on which there am deferred fiscal duties.
b. Includes cwmptions on flows of goods divectd from EPZ. Topmorary Admiss., Drawback systems, etc. to domesticcoenpton.c. Net of inter-firm transts.
AVERAGE EFFECTIVE TARIFF - DUTIES PAIDICIF VALUEAVERAGE STATUTORY TARIFF - (DUTIES PAID + EXEMGP /EDCIF VALUE
Source- Customs Adminisuation special tabulations.
Imports in some categories pay no import taxes. Among them are categories 50 to 55 (silk, wool,
conon, synthetic filanments, and staple fibers), 58 and 60 (fabrics, lace, tapestries), and 98(miscellaneous). The value of imports in these categories, destined primarily for the garment industry
in EPZs, amounted to Rs 5.4 billion or 22.5 percent of total imports in 1991.
Fourteen categories benefit from exemptions of Rs 50 million or more, or 87 percent of total
exemptions." These categories include basic food products, energy products, raw materials,
machinery and eqnipment, air and ground vehicles, jewels, and watches. Except for food, for which
19. These cwAgc.ries are 02 (ame. with exemptions of 591 percent of the import tax paid). 10 (cereals. 733 percae), 27 (mineralfads and oil, 15.2 percen). 39 (plastics. 82.3 percent). 43 (paper. 256.3 percent). 71 (pearls and precious and samaprni es
and nals. 2463.1 parcent), 73 (iman or stcl articles. 175.7 percent). 84 (unclear reactor. boilers. machinery and mechanical
appliances. 160.9 peccut). 35 (electrical machinery and equipment. 107.1 percent), 87 (vehicles other than tailway or tramway.39.9 percent). 38 (aircraft and spacecraft. 10816.0 paceno). 90 (optical, 187.0 percent), 91 (clocks and walches, 18453 pacent).and 94 (furniture, 104.9 percent).
-48 -

exemptions are granted primarily for distributional reasons, most categories with significant
exemptions are inputs.
Not only do some categories of imports receive special treatment, but there is also discrimination
within some categories. Some companies in an industry may get duty concessions on inputs while
others do not, or some may pay more duties than others (Orangina versus other soft drinks).
Another undesirable anomaly in the trade regime protects foreign producers relative to domestic
industries. Assembled buses, for example, are imported almost duty-free, while parts for local
assembly pay higher duties. Imported preserved food in tins, cans, or boxes enters duty-free, while
packaging materials are assessed import duties. Thus both bus assembly and food packaging suffer
from negative effective protection. Domestic canned fruit has also been subject to price controls while
imports have not. It may make sense not to provide these products with positive protection, but itmakes little sense to tax them through negative effective protection. -
Finally, there is also discr'mination by origin. Some imports originating in the United States and
the EC pay lower tariffs than similar goods originatiug in Japan. Customs duties, then, induce trade
diversion from dutiable to nondutiable sources. To the extent that diversion occurs, Mauritian
consumers and firms pay higher prices without any corresponding benefit to the government in higher
revenues. This practice may also be inconsistent with GATT regulations.
Impact on incentives. Nominal protection rates do not give an accurate picture of the full
distortionary impact trade policies can have on the allocation of resources. For thirty-five product
categories examined, the average nominal protection rate in 1990 was 24 percent while the average
effective protection rate was 59 percent (table 3.4). For food, the nominal rate was 28 percent, the
effective rate 89 percent. Similarly, the rates were 20 and 53 percent for wearing apparel, 11 and 27
percent for leather products, 48 and 96 percent for footwear, 38 and 78 percent for wood products,
85 and 259 percent for furniture, and 58 and 218 percent for electrical machinery. On average,
effective protection for these thirty-five product categories was about two and a half times the nominal
protection rate-or even higher if weighted for output shares rather than import shares.
Further, there is relatively little difference in tax burden for consumer goods, intermediate goods,
and capital goods, according to the results of the SINTIA mode 20 (tables 3.5 and 3.6). This is a
surprising finding since higher protection would be expected for final goods than for other types of
goods. Classification problems may explain this result to some extent, although the complexity of
existing regulations may be responsible as well.
20. SINTIA is Software for Indusurial and Trade lacenivc Analysis, a package dcveloped at d World Bank.
-49-

Table 3.4 Protection in 1990
precUain pcffeon
Food 23 89Weaving appard 20 53
cather products II 27Footwear 43 96Wood products 33 71Fursurc 89 259Electrical macuinay 53 218Overallr 24 59a. Based on dutry-fove product categorics.
Import tax exemptions are highly variable, discriminatory, and concentrated. Low import taxation
of inputs implies an effective protection rate higher than the nominal protection rate. 1he average rate
of exemption (relative to import value) for all ninety-eight categories of the tariff code is 13.9
percent. But it is 25.8 percent for the tourteen categories-mostly inputs-in which exemptions are
concentrated (and which constitute 47 percent of total imports) and only 3.4 percent for the remaining
categories (which constitute 53 perceaL of imports).
Table 3.5 Custams colle ns and ampions by cas of goods(millions of rupees)
Goodr Sala Sr .Marcdaszf1cad=n Vahm A.cwe aromm LrW ar Toa ascal ourzolr Los aa Td = rd
Consumer 8,710 1,021 197 433 214 1.365 694 165 129 74 1062 36Intermediate 8.785 393 24 495 200 1.613 367 112 297 79 8US 35Capirl 5.247 449 96 336 136 1.067 780 409 372 131 1.692 61Uncoded 1.410 30 2 53 8 93 1 0 26 2 29 24
Total 24,151 2.393 319 1.317 609 4.638 1,343 687 824 235 3,639 44
Source: Csroms Administration and amo' estimates.
Table 3.6 Customs tariff rates by das of oodscoucluen FMC Arao rar
Sas a
Goodr Value Fiscal Casm Levy r= Mta astal Cattow Levy r ToWe
Consumer 8710 11.7 2.3 5.0 2.5 21 19.7 4.2 6.5 3.3 34Intermediate 3,785 10.2 0.3 5.6 2.3 18 14.3 1.6 9.0 3.2 28Capital 5.247 8.6 1.8 6.4 3.6 20 23.4 9.6 13.5 6.0 53Uncoded 1.410 2.2 0.1 3.3 0.6 7 2.2 0-2 5.6 0.7 9Total 24,151 9.9 1.3 5.5 2.5 19 7.6 2.8 3.4 1.2 15
-' Collection rae is value of the collaction divided by the value of imports.Source: Customs Administration special tabulations and authors' etimat.
-50-

ExpoI&t
Mauritius has three major categories of exports. Sugar has been its traditional export. Textiles
and apparel from EPZ firms and tourism are more recent exports. The two principal direct export
interventions-export taxes and quota allocations-affect the sugar sector and EPZs, although tariff
on imports represent an indirect tax on all Mauritian exports. (Trhe issue is discussed in more detail in
appendix B.)
Sugar. Export and domestic markets for sugar are linked through a unified marketing channel,the Mauritius Sugar Syndicate (MSS). The MSS sells to three distinct markets: the EC quota market
(around 80 percent of total sales by volume in recent years), the world market (including a small U.S.quota, about 14 percent of sales), and the domestic market (about 6 percent). The price of domestic
sugar is controlled by the government at a level far below the export sales price.21 The EC price is
far above the free market price (Chapter 2).
The price received by producers (millers and planters) is essentially a weighted average of all
these prices (minus the export tax, which is paid by the MSS) after deducting the expenses of the
MSS and payment of the mandatory Sugar Insurance Fund premium, adding in certain proceeds (from
bagasse sales and dividends of the Sugar Terminal Corporation), and adjusting for the exemption from
the export tax of the first 3,000 tons of each producer.2 The proceeds are then divided in a fixed
ratio between the millers and the farmers who supply the cane: currently 24 percent goes to the
miller, 76 percent to the grower. Thus, except for the first 3,000 tons (see footote) producers
receive the same price for each ton of sugar, a price that is a weighted average of the EC, world, and
domestic prices, with the average dominated by the EC price.
This system of paying a uniform price for all sugar delivered has a major defect. It encourages
producers (growers and millers) to produce more sugar using marginal land, inefficient techniques,
and outdated machinery as long as the cost of producing the highest-cost (marginal) ton is less than
this average price. Since some of this sugar is destined for the world market, it will be sold at a price
far below the true cost of producing it. In this sense, the pricing system causes too many resources to
go into producing sugar instead of producing other goods and services.
For a quantity of exports set according to EC quotas, which have varied little from year to year,the MSS (and other participants in the Lom6 Sugar Protocol) is paid a price that is linked to the
internal EC price (Chapter 2). In essence, this represents a transfer from EC taxpayers and consumers
to Mauritius. This transfer is divided among Mauritians through several mechanisms.
21. There are accunfly several prices. depending an the type of sugar and the type of buyer. In rac years. the average level wasabout Rs 2.700 a ran. This level has not been changed since 1984, and before that. had not been changed for 30 years.
22. This exemption has been lifted recently when the tax on sugar was reduced by balf.
-51 -

One mechanism is the export tax, which captures some of the transfer for the government. Thistax had its origin in the recommendations of the Meade Report, which advocated taxing the largely
untaxed sugar industry to encourage diversification out of sugar, among other reasons. The tax was
originally set at a low level (5 percent between 1961-69) but was subsequently increased and
graduated according to export levels of individual producers. In 1978 it was increased substantially to
capture for the government windfall profits from a devaluation. Until 1989, its level varied, but
following exhaustive study and debate, the Sugar Industry Efficiency Act set the tax at 18.75 percent
(exempting the first 3,000 tons of production of each mill). It has been halved recently.
One effect of the export tax has been, as intended, to reduce the profitability of producing sugar.
The export tax does not reduce the relative incentive to produce sugar (the net price to the producer)
by the full amount of the tax, however, since the tax is not charged on all production. Nonetheless,
the effect is significant export duties of Rs 432 million were deducted in 1991 from revenue of Rs3,715 million, reducing the net price to producers by about 11.6 percent. To what extent this affects
the actual production of sugar depends on the relative cost structure of the industry. Another effect of
the export tax on the incentives for sugar production comes through the exemption of the first 3,000
tons. The exemption was presumably incorporated into the system for distributional reasons, but it has
had the (presumably unintended) effect of encouraging fragmentation of production units. The latter
effect will fade with the recent lifting of this exemption.
In addition to the export tax, the sugar industry is subject to a plethora of other regulations and
interventions. Those related to labor are discussed in some detail in chapter 4, and the interactions
among the policies, the external environment, and their net effects in chapter 5. Chapter 6 contains
recommendations for a package of reforms involving all of these.
Export processing zone. This section touches on issues of efficiency within the EPZ sector. One
source of distortions is the system of quota allocations for some EPZ exports. Quotas for garment
exports to the United States are allocated annually by the ministry of trade on the basis of past
performance. Ninety percent of the negotiated quota is distributed to exporters that supplied the
market before the quota was imposed. In each successive year, exporters that fill at least 90 percent
of their quota retain it for the next year. Those that fill 51 to 90 percent get a quota equal to their
actual exports. Those that export less than 50 percent lose their quota. Leftover quota amounts are
distributed to firms without quota allocations on the basis of firm orders and letters of crediL
Quotas are not currently a very pressing issue since, except in the case of pure cotton goods,
quotas are generally underfilled. Thus if quotas were auctioned or made transferrable the auction or
resale price would likely be zero. Several factors help explain this situation: the high duty rates on
products made with synthetic fibers (higher than for some competitors who, unlike Mauritius, receive
GSP treatment in U.S. markets); high freight charges (again, relative to other suppliers); and rising
wage costs.
-52-

If the market-clearing price of quotas is in fact low or zero, the pattern of production and
producer profits resulting from the current quota allocation system and market conditions probably
looks much as it would under an auction or transferable quota system. However, this could change if
the demand for quota allocations rises. The current system provides a way for more efficient
exporters to increase their share, and to this extent it may mimic a price-rationed system. However,the system also seems to embody a certain element of quota-spreading by reserving 10 percent for
nonquota holders and by discontinuing allocations for firms that fill less than 50 percent of their
quotas. To the extent that the system encourages more and smaller producers rather than fewer and
larger producers, there may be an efficiency cost to the formal allocation scheme that could be
avoided by a shift to a transferable quota system. The time is right to make that transfer, now that
quotas are slack and prices low.
For the fiscal year ending September 1990, some goods for which quotas were trading at highprices in the Hong Kong quota transfer markets were less than half filled in Mauritius. This clearly
suggests that Mauritius may have been missing opportunities and ought to consider adapting Hong
Kong's quota transfer system to the Mauritian market. Quotas might become concentrated in the
hands of a few relatively large producers, but small producers might remain as suppliers to the large
firms. A number of small specialty markets are likely to remain in any case.
A free port. Mauritius is contemplating the establishment of a free port, with facilities for
storage, warehousing, and repackaging. While there might be some limited processing, the plan is toprovide breakdown services for bulk shipments, transhipment, and re-export services. The free port
would complement EPZ policies, which focus on creating an enabling environment for
for export. Mauritius would seem to be in a natural position for a free port to handle trade between
the Far East, the Indian Ocean countries, and East Africa.
A bill for the free port has been enacted and provides for the establishment of the Mauritius
Freeport Authority, a statutory body administered by a board with both public and private
representation. The board would issue licenses for activities including warehousing and storage,
breaking bulk, grading, cleaning, mixing, labeling, packing, repacking, and simple processing. Aplan for port improvements and additions has been approved by the Mauritius Marine Authority, and
contract tenders were requested in March 1991.
A package of incentives for firms in the free port has also been put together. It includes duty
exemptions on machinery and equipment, fast-track customs processing, offshore banking facilities,
reduced income tax rates, and preferential charges for handling, warehousing, and storage of goods
for re-export and transshipment.
The planning seems to have covered the operational needs of a free port functioning at
international standards. The quesiion remains, however, whether an adequate volume of traffic can be
attracted to the facility, and that question can be answered only by a full feasibility study. Generally,
free ports that deal in transshipment and re-export are of two types. One is the major regional hub
-. 53 -

serving the needs of large long-distance carriers. Hong Kong, Khaosiung, and Singapore are
examples. The other is the second-rank port serving feeder lines. Such ports are found in Indonesia,Malaysia, the Philippines, and Thailand. This type of port seems the most likely model for Mauritian
trade, at least in the short run, to serve the growing East African markets. However, there will be
significant competition from certain East African ports. Durban already handles traffic for Swaziland
and Lesotho and has rail links with the major centers in South African, Botswana, and Zimbabwe.
Other ports, such as those in Beira, Dar-es-Salaam, and Mombassa, are unlikely to offer much
competition in the near future.
Sales tax
Operation
A sales tax of 5 percent is charged on the wholesale value of all goods sold in Maurius, both
domestic production and imports. Imports pay the tax at customs. Because of the way it is structured,the sales tax falls on final consumer expenditure.
Registraton. Businesses with less than Rs 100,000 a year in turnover of taxable goods are not
required to register for sales tax, although they may do so voluntarily. Since the tax is charged on the
wholesale value of goods sold in Mauritius, only wholesalers and manufacturers are required to
register. Retailers who import their taxable goods or purchase them from registered firms and pay the
tax then are not required to register. The sales tax is chargeable on goods imported into Mauritius
whether the importer is registered or not. If the importer is registered, the tax is computed on the
basis of the customs value of die goods plus any customs duty and the import levy payable at that
time. If the importer is not registered, he essentially pays a tax rate of 6 percent instead of 5 percent.
Input and output rares. Registered firms charge the sales tax on all goods they sell to other
taxable entities (those that are registered or required to be registered). If the goods are for resale or
for the manufacture of other taxable goods, they are considered inputs of the purchaser. In calculating
the final tax owed monthly to the sales tax office, the purchaser subtracts the input tax already paid
from the output tax owed. If input taxes paid exceed output tax owed, the excess is generally carried
forward to the next return. The sales tax in Mauritius thus resembles a value added tax.
Exemptions. At first, the sales tax covered virtually all goods, with a few exmaptions for
foodstuffs of local origin (plus rice and flour), agricultural machinery, fertilizers, fh&'A, and
pharmaceutical products. A few social, religious, and charitable organizations, Overseas
Telecommunications Services Ltd., and Air Mauritius (for specific goods) were also exempted. Since
-54-

then exemptions have proliferated and now cover forty-six categories. 3 The relevant ministry hasthe power to remit or refund sales taxes in particular cases. There is no sales tax on services. EPZ
firms are exempt from sales taxes at both the input and output stages unless the goods (other than
textiles) are sold in Mauritius. Goods exported from Mauritius under customs control are also
exempt; any sales tax paid by the exporter on these goods is refunded through the deduction for inputtaxes in the case of registered tax entities or through special claims if the exporter is not registered for
the sales tax.
Impact on incenaves
The sales tax thus varies according to the type of certificate a firm holds, where the inputs are
purchased, and where the output is sold (sales revenues per category are detailed in table 3.7).
Overall, the sales tax has little effect on the EPZ sector, and a substantial impact on other firms,
which suffer from the bias inherent in the tax system.
Local producers may be at a disadvantage in domestic markets for finished goods. Some products
are imported duty-free, while raw materials used to produce similar products locally are taxed at
various stages. Although sales tax rebates are uuaUly available at each stage, that is not the case with
imported capital goods-and even where producers are entitled to them, rebates are often left
unclaimed because of the long time involved.
An element of unfair competition can also arise in sales to EPZ companies. Products sold by a
local company to an EPZ firm include the cost of sales taxes paid at the manacturing or processing
stage while foreign products can be imported directly by the EPZ free of all duties. Although the
local firms can claim drawbacks on the sales to EPZs, the associated uncertainties (see below) may
discourage such practices. Thus locally manufactured plywood and chipboard incorporate the sales
taxes paid on their raw materials, while EPZ firms can import such products free of duty.
All non-EPZ firms have to pay sales taxes on machinery and equipment (except firms certified as
agricultural development firms). The taxes are nonrebatable, even if the output is exported, and
constitute an additional cost to capital investment-which may be particularly undesirable in a country
with virtually full employment that ought to be shifting toward more capital-intensive production.
The structure of the sales tax creates other distortions that discourage exports by firms outside of
EPZs. Firms that export their output get a rebate on the sales tax for imported inputs but not on
inputs produced domestically, which not only puts domestic inputs at a disadvantage but may increase
23. Exempions include basic foodstuffs (such a rice, flour, sugar and molasoes, raw and dried vegetablcs. rea, coffee, met adfish, bread. fruits. common salt, edible oils and ftts, milk and crem, bumrcr, egg, honey). fuels of all kinds, medicine andmedicinal preparations, water and ice, live animals, agricultural machincry, containers, fertilizers, live plants. flowers, and seeda,textiles and textile articles machincry and machines for use in texile industry, clothing manufactured in Mauritius, books adperiodicals, and animal feed.
-55 -

the cost to the producer? Producers of goods whose outputs are exempt from the sales tax get nosales tax deduction on their inputs even when they export, so they have much less incentive to exportthan producers of nonexempt goods who get a rebate on their sales tax. Discouraging exports maymean a loss of the economies of scale that are often atainable only through w pansion into exportmarkets, resulting in efficiency losses.
Table 3.7 Sales tax revenues by category(rupees, thousand)
Yaw mKdWrJA 30
1990 1991
Tax collrcted at importation 513.790 571,486Tax collected from ULxabi 197,568 246.784persons on deliveries
Public company 86.941 105,792Private company 90.385 119.230Socicrw 8,292 9.082Sole propriewr 10,630 11.035Succession 606 821Oter 714 824
Total tax collectnd 711.358 825.270Tax refunded 925 2.293Net tax collected 710.433 822.972
Source: Minimry of Finance, Sales Tax Division (June 30. 1991).
The drawback system, the only export incentive for local industries that supply exporters, seemsto work so poorly that it constitutes more of a disincentive than an incentive. The drawback system isintended to enable exporting firms or firms selling to EPZs to claim back import duties and sales tax
paid on raw materials and other intermediate goods used in the production of final goods. The process
reportedly takes too long (up to two to three years) and does not always result in an actual refund.
Consequently, some companies prefer to absorb the sales tax themselves rather than undergo the
rigors of the drawback system. Because of the delays and uncertainties, many entrepreneurs dare not
risk selling their products at the lower, rebate-implicit price, which would make them more
competitive on the international market. Further distortions result because some companies that sell
their products in both local and export markets create different entities to benefit from the two
different sets of incentives. The result is increased administrative costs and a loss of economies of
scale.
24. If local inputs arc choer than similar impoEted inputs before the sales tmx. but become more expensive with the als tm, theproducer incurs a higher cost than otherwise whether using the more expensive imports or the local inputs with no sales tax rebate.
- 56 -

Hotel and restaurant tax
A 10 percent hotel and restaurant tax was introduced in 1974, levied on the gross receipts of
designated hotels and restaurants. A special surcharge of 50 percent of the tax was also levied on
hotels, bringing the total to 15 percent.m In March 1988 the tax was extended to boarding houses
with five to eight rooms. In June 30, 1991, there were 296 designated establishments, up from 276 inJune 30, 1990.
Tne tax is paid each month on the taxable receipts of the previous month. The 10 percent tax isrecoverable from customers, but the hotel surcharge is paid by the establishment, which may or may
not pass the cost on to customers through higher prices. 6 Receipts from the hotel and restaurant tax
totaled Rs 258.2 million in fiscal 1991, an increase of 30.3 percent from fiscal 1990 and Rs 28.2
million more than the estimated amount.
Price controls
OperatozPrice controls on imported and locally produced goods take the form of price ceilings and
maximum markups. Ceilings are set by the relevant ministry on the basis of total costs includingduties and levies, storage and distribution costs, and financial charges, as well as profit margins at
each level of exchange-importer or manufacturer, wholesaler, and retailer. With the maximum
markup system, the ministry sets the maximum retail markup as a percentage of the cost, with
appropriate discounts at the upstream stages. This second method is less administratively burdensome
because the traders do their own calculations and prices are checked later, thus reducing bureaucratic
delays.
Different procedures apply to controlled imports and local goods, but all of them create rigidities
and uncertainty for the importer or producer and invite corruption. For imports subject to price
ceilings (prices are fixed for every consignment), importers must submit several documents-invoice,
import permit, bank documents, bill of entry-within ten days of entry through customs, as well as
data on returns on cost for the current shipment and the previous one. No sale can take place until the
ministry issues a permit. The minister can also reduce the c.if. price to a "fair and reasonable" value
if the price is judged too high relative to imports of similar commodities by another trader.
For locally manufactured goods, maximum price regulations are issued individually for each
product. This system reduces subjective treatment of similar commodities produced by different firms,
but it does not consider diferences in quality, thereby encouraging low-quality production. Quarterly
25. This special surcharge was reduced by half as of July 1992.
26. The lldmate incidence of the tax depends on economic factors such as supply and demand clasficidm
-57-

statements must be presented to the ministry showing monthly production and sales, and data on
returns on costs must be submitted in detail.
Price controls have been a feature of the Mauritian economy for decades, proliferating at a
prodigious rate during the late 1970s. In 1978, some 1,000 articles were subject to price fixing andanother 7,000 to markup fixing. In 1983, a gradual movement toward decontrol began, and between
July 1984 and June 1985, the number of locally produced commodities subject to control fell fromtwenty-eight to five. Imports subject to maximum markups dropped from thirty-five in December
1980 to two in October 1987, and all imported commodities subject to price fixing (thirty-two inDecember 1983) were decontrolled by June 1985. The deregulation lasted only until 1989, when price
fixing began to spread again.
Price controls have been a feature of the Mauritian economy for decades, proliferating at aprodigious rate during the late 1970s. In 1978, some 1,000 articles were subject to price fixing anf
another 7,000 to markup fixing. In 1983, a gradual movement toward decontrol began, and between
July 1984 and June 1985, the number of locally produced commodities subject to control fell from
twenty-eight to five. Imports subject to maximum markups dropped from thirty-five in December
1980 to two in October 1987, and all imported commodities subject to price fixing (thirty-two in
December 1983) were decontrolled by June 1985. The deregulation lasted only until 1989, when price
fixing began to spread again.
Impact on incendi
The revival of price controls has been sharply criticized, especially by firms outside the EPZ
sector. Price controls can distort incentives by artificially raising costs and lowering Yevenues of local
producers. Domestic firms may be forced either to maintain a noneconomic level of production or to
switch to a relatively more profitable sector. Production does not take place based on criteria ofeconomic efficiency and comparative advantage but is channeled to sectors without price controls.
Managers in the private sector complain that the use of price restrictions prevents them fromincreasing output in the face of growing demand. Financial institutions are unwilling to lend to
affected firms since without control over prices companies cannot be counted on to meet their
financial commitments. Managers claim that price determination is often arbitrary and that companies
are not consulted about costs. There is no formal system of price review within industries and across
firms, so such key factors as location, availability of raw materiais, and size of the company are often
ignored when prices are set.
Price controls not only constrain production within an industry but they distort incentives across
the economy, often favoring imports at the expense of local production. Because price controls consist
of a fixed markup for imports and a maximum price for most controlled domestic goods, localproducers may be worse off than importers who are at least entitled to a proportional profit margin on
landed costs.
-58 -

Table 3.8 Producta subject to price co~truh in Maurigius"Mann~ prer aynsa Manmnm aage aynen
locauy-produed goods Imporrd comwndder IMpord pr~d iuu(an of 197) (ar of Apni 196) (ar of1987)l ronsm ic 1 ichoo1 te book2 Pota~i 2 Roor 2 Timbcr3 Supr 3 Cnc= 3 Sporting goods and
gaming(added in 1989) 4 Ptrolvum (including keroacn~) 4 Medicine and ziplo
drugAggregae Fish (cannad and tinnad) (added in Auguic 1990)
4 Acoarmd beveruge 6 Safted ~nook 5 Tires5 BEad (added in Ocober 1988) (~dded in May 1991)6 Canned fofd 7 Buer 6 Cerumic tles7 Concrotc block 8 Fresh fruik 7 Glas pancc8 Crubd= rn Frona fish 8 Plywood9 Edible oil 9 Frozen mm including livr 9 Sanitury w
10 F~ =iizeru 10 Powdcrcd m-D (fan milk powder) 10 Vinyl ie.Frozen chicke Mcat (mianöd and inn~ (add in July 1991)
11 Frowzen fish 11 Cheese 11 Domric wahiagmchinen
12 Iroc/Stee barn Pulsen 12 Becric floor polisheru13 Lnadry oap in bar and corks (added in May 1989) 13 Beclric iros14 Liveoc~c f3d Biscut 14 Ectric juiff n15 Margarin 12 Bombias 15 ecric komics16 LCknIGand C^der 16 EIcetric miu17 Toilc woap Coking gas (LPG) 17 Rcfrigcrr andfre r18 Toaapauto 13 Ps~icid-- fungicide,rbicides 18 Rico caou.19 Wholc wbca flour Dried pra~ 19 Vacunn Cnkm
14 Edible oil15 Futilizem
Froznc chicenLumdry soap (bar. and cakes)
Maaoni* Margarine
Påanrizod makToilet boapToopast(addd in July 1989)
16 Iron/uted bar(added in Decmbe 1990)
17 Caned fish(added in February 1991)
18 Corned beef19 Cornad nnn20 Frona fish21 Homo~nizcd fruit, vcge~bles. and mixed preparaiions22 Lunchen" zoen23 Prepared c mre.s nd ccreal mdk for infan use
(added in Ocibr 1991)24 Careiz. grots. meal. and peliems25 Food supplement26 Pranred food from c=eas
27. Only the nuatbcrd producm am currcn~ly under controla; otheri have been dccotrolled.
-59-

Another problem is that there is little correspondence between local and imported products withfixed prices. Some local products are subject to price fixing, while competing imports are not. Local
manufacturers are unable to offer competitive margins to distributors and retailers, who thus have a
greater incentive to sell imported products. Certain canned goods, edible oil, margarine, laundry andtoilet soap, tea beverages, and livestock feed are cases in point.
For some inputs, the problem is not controls on maximum price levels, but rather minimum
controlled prices. Producers are forced to purchase high-priced products produced by monopoly state
enterprises even though the inputs could be imported at : much lower price, were imports not
prohibited or hevaily taxed to ensure the market for the parastatal. Local maize for feedgrain, for
example, costs twice as much as imported maize. Imposing minimum prices on intermediate goods
used in local production puts domestic producers that use these inputs at a disadvantage relative to
competing imports.
Subsidies
Staple rice and wheat flour have long been subsidized because of their significant weight in the
food basket of the population.2 The State Trading Corporation is responsible for their import and
sale at fixed prices in the domestic market. The subsidies grew significantly in the late 1980s but fell
thereafter, although in 1991 they were still a substantial 0.5 percent of GDP'and 2.2 percent of
central government expenditures.
The subsidy has helped stabilize the p!ice of both rice and wheat flour, but reform is needed. The
well-to-do benefit from the subsidy more in absolute value of subsidized consumption than do the
poor, although it constitutes a smaller proportion of their expenditures. Also, the subsidy has lost
much of its distributive justification, with rapidly rising real wages and low unemployment
contributing more to improved income distribution and enhanced purchasing power of all income
stratas. The subsidy also takes a not insubstantial bite out of the government budget, using resources
that might be better put to alternative uses. Eliminating the subsidy would offer a savirg of 2.2
percent of central government expenditures and contribute to needed overall fiscal reform.
28. Poaocs ae also subsiized.
-60-

Chapter 4. Factor Market Policies and Incentives
This chapter examines land, capital, and labor markets. It also considers certain aspects of the
income tax system that relate to savings and investment and, consequently, to the capital market.
Finally, since the goal of human development is one of paramount concern, policies relating to human
resources are considered here, as well.
Land
Insmiuionalframework
The current system of land use planning has been in place since 1954. Land use plans are
developed locally for each of five urban and four rural areas. (Actual land use is shown in table 4.1.)
Land is zoned for particular uses (agricultural, industrial, residential), and transferring land from one
use to another requires approval of local authorities or, in exceptional cases, the central government.
A 10 percent tax (raised from 5 percent in 1991) is assessed if the land has been owned for fewer
than five years. Despite various attempts since the 1970s, a comprehensive land use plan has never
been developed. Efforts to develop a National Physical Development Plan (NPDP) were reinvigorated
in 1990, and the plan appears to be nearing completion with support from the World Bank
Environmental Monitoring and Development Project.
One purpose of the NPDP is for use in forecasting growth in different parts of the island, to guide
decisions on public investments in infrastructure. Another is to identify environmentally sensitive
areas that need to be protected and to confine high-pollution industries to areas where their pollution
can be contained and detoxified without causing environmental degradation. There is a proposal to set
up an industrial park for polluting industries, with its own sewage treatment plant. Under the
Environmental Protection Act of 1991, most new economic activities must file an environmental
impact assessment for approval by an environmental tribunal upon recommendation of the ministry of
environment. Among the activities generally requiring an impact assessment are those involving a
change in zoning classification, forestry and livestock projects, sewage works, transportation
infrastructure projects, waste management activities, most construction (including hotels and major
housing projects), virtually any manufacturing industry that is likely to generate significant pollution,and all coastal, port, or harbor development projects.
There is also some interest in using the NPDP to restrict transfers of land from one use to
another. The transfer of agricultural land to other uses, especially residential, seems to occasion the
greatest concern. The Sugar Industry Efficiency Act of 1988 bans the use of agricultural land for
nonagricultural purposes except with the written consent of the minister of agriculture and the
- 61 -

Table 4.1 Land use in MauritiusArea Mmber
Total area of island 186.500Crown and public land 42,200private land 144.300
Agriculunral land 104,000Sugar 82.350Tea 2.910Tobacco 20 -Fruits 440 -Other food crops 5.260 -
Forest. scrub. grassland 64.000 -Built-up arcas 14.000 -Other 4,000 -
Sugar land -Sugar cares 39.057 20Owner-planters and tenant-plantcra 37.247 35.010less than 2.0 16.410 23,109
2-5 6,389 2.2055-10 3,063 44710-26 2,104 14525-50 1.618. 4650-100 2.434 37100200 1.258 9nore than 200 3.970 12
Not: Arcas are approxuMr and may not be consnt, snce they come fromu dailcre scSource. World Bank dam; Mauritius Chamber of Agricuure AIWal Report 1990-91.
payment of a land conversion tax. Nonetheless, it is estimated that agricultural land is still being
turned over to other uses at a rate of 300 to 500 hectares a year. 11e sale of land from one
agricultural user to another does not require payment of a conversion tax, but there are high
registration and transfer fees and transfer of title is uncertain because registration of the land does not
validate the tide.
Effects on incentives
One of the most important government policies affecting land use was the decision to encourage
decentralization of export processing zones (EPZs) after 1983. Most of the first generation of EPZs
had located in areas with sewage systems for treating and disposing of liquid effluents, but the second
generation was encouraged to locate in areas without public sewage systems. Many of these EPZs
discharged wastes into their own septic systems (and indirectly into the underground aquifer) or
directly into surface water, a matter of increasing concern, especially in the case of factories with
dyeing facilities.
More stringent requirements are now imposed on such activiies. Zoning and environmental
regulations are designed to force industries and hotels to locate where they can discharge waste into a
-62 -

public sewage system or to use their own system to remove pollutants. In principle, this newstringency will increase the cost of setting up certain types of EPZ firms and hotels, although the
extra costs are intended only to internalize the social costs of the activity. (Whether this really
happens, of course, depends on how the regulations are administered.) The establishment of an
industrial park for polluting industries is also intended to minimize the negative impact of these
requirements. On balance it seems unlikely that the new land use management policies will hurt EPZs
very much-or other industries or hotels.
More fikely to feel a strong, direct impact from these policies are agriculture, residential housing,and perhaps tourism, all land-intensive activities in natural competition for available land. Both the
specific provisions of the Sugar Industry Efficiency Act and general government land use policies
seek to prevent the transfer of agricultural land to residential use or, though less strongly, tocommercial or tourism uses. A particular fear seems to be that the most productive land will be lost
to farming, and the government seems intent on keeping that from occurring.
In the absence of controls, the parcels of land most likely to shift from agricultural to residential
use would be those for which the value to agricultural owners is the lowest and the value to
residential buyers the highest. The most productive land with the highest value to agricultural ownerswould not generally be sold for residential purposes unless it also happened to have a high value to
prospective house buyers, say because it was close to work centers or parks or other amenities.
To the extent that the government's land use policies keep some land parcels in agriculture eventhough developers would pay more than the minimumn price that landowners would accept for the
land, the policies will have two direct effects, one on house buyers and one on landowners.
Consumers of housing services will be made worse off, and the existing housing shortage will be
exacerbated. Reducing the supply of land (or forcing housing development in parcels viewed as
inferior) will increase the price of housing or lower its quality. In many cases, what this means is that
instead of developing land close to work centers, which is where developers normally prefer to buy,
land further away will be developed. Many people will be forced to live in smaller, older housing or
with relatives. Some people may even be made homeless. All these effects seem to run counter to thegovernment's announced interest in keeping housing affordable.
For landowners, the restrictions have the effect of increasing the supply of agricultural land and
thus reducing its market-learing price, while decreasing the supply of nonagricultural land and thus
raising its price (see technical note 1 at the end of this chapter). The restrictions on the sale of
agricultural land thus increase the wealth of owners of nonagricultural land,' while reducing that of
owners of agricultural land. Reducing agricultural land values wi generally encourage the production
of land-intensive crops such as sugar, crops whose value of production per hectare is relatively low.
29. If rcurictions include a tranufer tax. any or all of the exces of the selling price over the minimum acceptable price to thelandowner may g taxed away.
-63 -

By encouraging the production of sugar over other crops, land restrictions work against thegovernment's diversification goals."
Indirect effects on factor and other markets are also worth noting. By keeping land in farming, therestrictions propel demand for agricultural labor above the level it would reach in the absence ofrestrictions-although this effect is minimized by the high mechanization rate on the most productiveland (especially that of miller-planters). By pushing residential development farther away from work
centers, land use restrictions increase the demand for transportation infrastructure, equipment, fuel,
and services. By increasing the price of housing, restrictions reduce its demand and thus the demand
for construction services. The effect on the demand for construction (infrastructure and housing) is
mostly a one-time effect, but use of transport equipment and services will remain at the higher levelpermanently as a result of restrictions.
Land tiding procedures are cumbersome, time-consuming, and costly, requiring the hiring ofsurveyors, notaries, and solicitors. The Registrar General maintains a registry of ownership, but not
title. These factors inhibit the development of a fluid land market. Other policies also discourage land
sales to consolidate the small parcels of sugar land. Exemption of the first 3,000 tons of productionfrom the sugar export tax and the first 40 tons from income tax means that a given hectare of land is
worth more when it is not producing as part of a larger parcel. In addition, landholders whose parcels
can be worked with family labor are not affected by the labor regulations that increase the production
costs of larger estates. Division of the plots through inheritance continues to increase the number of
inefficiently small farms.
Financial markets
Institutional frmneworkThe major institutions providing direct financing for businesses in Mauritius are the domestic
commercial banks, the Development Bank of Mauritius, the State Investment Corporation, theMauritius Leasing Company, offshore banks, and the stock market.
Commercial banks hold a portfolio of about Rs 14 billion (as of mid-1991), 17.5 percent of it in
loans to public institutions, housing loans, or personal and professional loans and the rest in loans to
30. Valued added for sugar growing in Mauritius is about Rs 34,600 per hectars (1990 am and value added from Central StathicalOffice and Mauritius Chamber of Agriculure Annual Report 1990-91), while it is Rs 38.90D per hecto for tobacco aed Rs161,700 per bectare for food crops, and even higher for high-valued products such as fruits and flowers. Hypothetical astinmes ofprofiability for some eports range from Rs 313,000 per heetare for athuriun to Rs 960,000 per becture for pineapples.
31 he National Pension Fund also has investibe reserves of about Rs 3.76 billion (as of June 30. 1991). Of this. 96 percent isinvested in governmeu bonds and securities. The rent (about Rs 140 million) is invested in the Development Bank of Mauritius. theState Commercial Bank. and the Mauriius Housing Corporation (MHC). The National Welfars Fund is another sourc of funds, butall of its funds are invented in the MHC.
-64-

businesses. The portfolios of the other types of institutions are much smaller: about Rs 1.4 billion forthe Development Bank of Mauritius; Rs 165 million (valued at the cost of the stock, or Rs 577
million at net asset prices of shares traded on the stock exchange in June 1990) for the State
Investment Corporation; Rs 120 million for the Mauritius Leasing Company; and Rs 4.4 billion in thetotal value of capitalization for the stock exchange. Other sources of financing exist, but they are
rarely used.
The government recently established two mutual finds, with a tax credit incentive for inveing in
them (10 percent of the amount invested up to Rs 8,000), but the response has been limited. Thesecurities fund now holds Rs 63 million in investments (June 1991) and the real estate fund Rs 50
million. The government also announced its intention to allow foreign investment through closed-end
country funds. There is no legal restriction on the issuance of bonds, but there is virtually nosecondary market (only one is traded on the stock exchange) and they are seldom used.
The commercial banks make both long- and short-term loans, few with term= over five years. The
Development Bank of Mauritius makes only longer-term loans (up to ten years) for capital
investment. It also runs export credit guarantee programs (pre- and post-shipment) for credit from
commercial banks, though there is little activity in them now. The Development Bank does not make
loans over Rs 25 million. Its rates for long-term loans are generally lower than those of commercial
banks. Rates are about 15 percent, compared with commercial bank rates of 16.5 to 19 percent ormore, depending on the category of borrower; rates are as low as 10 percent for some lines of creditfinanced at concessional terms by aid agencies or subsidized by the government to meet certain
objectives such as modernization or pollution control for EPZs. The lending policies of theDevelopment Bank are guided by general government policy; thus it no longer makes loans for new
hotels or textile factories, for example, or to nonpriority sectors.
The State Investment Corporation is a parastatal agency (set up as a private company) intended to
help finance private enterprises in industry, tourism, and agriculture by taking equity positions in the
companies. So far, however, it has helped neither to establish new businesses nor to expand existingones. It holds shares in the State Stockbroking Company, all casinos in the country, and a number of
financial institutions. It also owns controlling interests in some EPZ companies that were facing
bankruptcy under previous owners. These firms are to be rehabilitated and reprivatized.
The Mauritius Leasing Company is a joint public-private corporation set up in 1987 to provide
financial leases for machinery and equipment purchases. The leases are on terms of three to seven
years, with an option to purchase. Interest rates are 18 to 20 percent. Businesses in sugar and other
agricultural industries, EPZ and other industries, tourism, civil engineering, printing, services, and
self-employed professionals are eligible for lease services. Leasing is an attractive option in Mauritius
because the tax benefits of the investment accrue to the lessor, not the lessee as in some countries.
Offshore businesses, including banks, are eligible for a package of incentives but are in general
prohibited from dealing with local residents and from transacting business in Mauritian rupees. The
-65-

government seems to view them more as a potential source of jobs than as a source of financialservices. Since January 1989, EPZ companies have been allowed to borrow from offshore banks, and
in December 1990 domestic firms were also given this right, subject to approval by the Bank of
Mauritius. So far, very few firms have taken advantage of this opportunity, partially because the Bank
of Mauritius allows only short-term (90 days or less) financing by offshore banks. These banks are
thus a relatively minor source of financing for EPZ and domestic firms.
The Stock Exchange of Mauritius was established by the government in July 1989. The exchange is
privately owned by the brokerage houses and regulated by the Stock Exchange Commission. In two
years its grew from five companies with a total market capitalization of Rs 1.1 billion to twelvecompanies with a total capitalization of Rs 4.4 billion. The exchange includes an official (public) list
and an over-the-counter (OTC) market. To qualify for the official list, companies must have at least200 shareholders, at least 25 percent of their shares must be publicly held, and they must have at least
five years of profitable operation. Qualifying companies that choose to be listed receive a reduction incorporate income tax from 35 percent to 25 percent. (This is not an incentive for certificate-holding
companies, which are taxed at 15 percent.) The requirements for trading in the OTC market are less
stringent. About eighty companies are eligible, but only about forty actively trade their shares. Sharescan also be traded outside the stock exchange, but such transactions are subject to a 13.2 percent
transfer tax.
Effects on incentives
A major mechanism of industrial policy in Mauritius is the system of credit and interest rate
controls on commercial banks administered by the Bank of Mauritius. The system operates through
three types of regulatory controls directed by the Bank of Mauritius: on the maximum amount of
credit each bank can extend, on the proportion of each bank's portfolio that can be held in loans to
the three categories of borrowers, and on the rate of interest that can be charged on loans to firms in
each of the three categories. In principle, at least, the allocation of loans within categories is not
determined by the government..
In general, the share of Category I borrowers has decreased in recent years, that of Category H
has increased, and that of Category III has been relatively stable (table 4.2). Among Category I firms,
the losers were primarily the sugar syndicate, the sugar industry, and EPZ firms, with hotel
management certificate holders' shares increasing. In Category II, the largest increases were in
housing, 'other" industries, and parastatals (table 4.2).
Interest rates were liberalized in 1992, but the Prime Minister formally requested that banks
continue to lend to EPZs at the concessional rate of 13.5 percent, and banks have complied. Banks
32. The Bank of Mauritins acm the minimum proportion for Category K and he maxinun proportion for Category MR. Since bankswould generally prefer to lend lcas to Category I (the insureate is fixed at a low rats) and more to Category III, they geassllyadhere to the floor and ceiling for these and leand de remainder to Caregory I fims.
-66-

have also conined to charge other Category I borrowers the 13.5 percent rate, even though theywere not specifically asked to do so, but they are reportedly reconsidering this policy.
These policies obviously imply a cross-subsidy from Category M to Category I borrowers. Theeffect on Category II borrowers is not obvious, but it seems to be a tax on those firms. Category Ifirms receive an estimated subsidy of about Rs 166 million, Rs 65 million of it from an implicit taxon Category II borrowers and Rs 101 million from an implicit tax on Category M borrowers. Thesubsidy was calculated as follows. First, a weighted average of short-term interest rates (weighted bythe share of each category in total credit; rates and credit allocations are from table 4.2) was used toapproximate a unified interest rate in the absence of controls-15.6 percent in this calculation. Thedifference between this hypothetical market rate and the actual rates was then applied to the quantityof credit to get the tax or subsidy.
These calculations assume that the quantity of credit to each sector would not change, only theinterest rates. They understate the actual tax on Categories H and M and overstate the subsidy toCategory I. When interest rates to otherwise comparable borrowers differ from one sector to another,credit's marginal value to borrowers will be highest in sectors where the interest rate is highest. Ifrates are allowed to become unified, these sectors will use more credit and other sectors less. Eachrupee of credit redistributed from sectors where the rate is low to sectors where it is high will beworth more to the new borrowers. Gaining sectors gain more than losing sectors lose from thereallocation, an effect not captured in the estimates above.
Banks tend to compensate for the subsidies and credit ceilings by reducing deposit rates oreliminating services they would otherwise provide to depositors and by charging more for otherbanking services. Banks also have less incentive to attract deposits since they may not be able to leadthe funds. Thus between 1990 and 1991, the rate of growth of both time and savings depositsdeclined. The effect of these policies is to discourage financial intermediation. Since spreads onforeign currency buying and selling tend to be large, this also creates an antitrade bias.3
Another potentially important effect of the controls that is not captured in the calculations above isthe effect on credit allocation within sectors. Without controls, rates for firms of a particular typewithin a sector would not all be the same but would vary according to a firm's perceived riskiness,collateral, and similar fActors. When banks cannot charge high-risk firms rates commensurate with therisk, they deny them credit instead. The problem is apparently particularly acute for some EPZ firmsbecause of the high risk and low rate ceiling. Some can get credit only through personal loans (atvery high interest rates) taken out by their owners. In a system free of controls, there would clearlybe fewer firms that could not get credit; rates would simply be higher for some firms than for othersto reflect the degree of risk.
33. This problcm is ecwchAd by roquiracau tls cxporra suzrcuder tbcir cxchange cunings, thca roparcmo cachage theyneed for imports, cffectively doubling the acgative impac of the spread.
-67-

Table 4.2 Sectoral distributia and interest rates of comercial bank credit to the private sector, 1988-91(percentages)
ANocau. l-aJAse Jam ism March (RS allan) nras
Borrower cargory 1988 1989 1990 1991 (March 1991) (March 1991)
Caregory 1 52-2 51.0 42.5 44.8 6.2953 13/18Mauritius sugar syndicare 194.7Sugar industry 816.2Other agricultural interests 455.2Export procesing zone 3,248.7Development certificate 622.3Agricultural development certificate 13.7Export service certificato 33.0Hoald management certifican 558.1Smau-scale industries 233.4Rodrigucz-Houning 54.6
Category I 26.8 25.9 30.7 34-0 4.779.2 17/21Ex-DC industries 505.2Other inductrica and manufaciurers 2,185.6Transport 281.7Hotels 455.1Parastatal bodia? 318.1Housing 1,033.S
Category M 20.9 23.1 21.3 21.3 2,939.3 19/21Traders 1,6=1.6Stack brokers 2.0Picsonal and profcsional 900.3Financial institutions 51.6Investment in privar sector 292.0Other cussman 121.3
Total (%) 100.0 100.0 100.0 100.0
(Rs million) 3,284.1 9,763.1 11,389.3 14,063.8 14,063.3
Source- Bank of Mauritius Quarterly Review, January-March 1991a. Lower rate is ahort-arm; higher is long-term. Within caregories rates may vary by up to 0.5. In the period March 1990-March
1991, the consumer price index (CPI) rose by approximately 10 percent. However, the CPI was morm or less stable fiomSeptember 1990-March 1991. To the altnt that inflation was expected to remain low or negligible, the nominal imeacshown may approximsm the real rats.
b. Some receive aborterm rate of 12.5 perceat.
Other elements of the credit system discriminate against or in favor of certain types of firms or
credit. Industry, especially in EPZs, and tourism have been favored by the Development Bank'sbelow-market rates for capital loans, despite the exchange risk and apparent default risk- The
Development Bank offers even more highly concessional rates on loans subsidized by donors or the
34. As of mid-1991. 40 percent of the portfolio wcz more than six months in arrears. However, 1990 and 1991, only about 2percent of the portfolio was wriaen off each year management believes mot of the loans in arrears are covered by collateral andcollectible.
-68 -

government for EPZ modernmization, agricultural diversification, and small industries, but these loansare a relatively minor part of its lending. Capital markets are biased against small or new firms.Firms cannot raise capital in the OTC market until they have more than Rs 1 million in revenue, with
two years of financial statements or five years of profits required for "official" listing.
Investment incentives
* Institutionalframework
While virtually anything that affects the profitability of a company can be considered an
investment incentive or disincentive, the discussion here focuses on various investment incentive
("certificate") schemes established under Mauritian law. Each scheme has a framework establishing its
incentives: EPZ, pioneer industries, agricultural development companies, industrial buildings, export
service zones (ESZs), hotel management, offshore companies, and offshore banking. A development
certificate scheme for import substitution industries was once an important instrument of policy, but itis no longer actively used. Current certificate holders continue to enjoy tax benefits similar to those
under other schemes, but no other benefits except exemption from import duties on imported inputs
used to produce exports.
Except for the offshore commercial bank scheme (which offers a five percent rate), all the
schemes offer certain common tax breaks. Beneficiary firms pay a lower corporate tax rat-15
percert instead of 35 percent-for the life of the firm and dividends are exempt from income tax for
the first ten years. Nonresident investors are allowed free repatriation of capital (except for capital
gains, which are subject to a 15 percent stamp tax), profits, and dividends. All firms benefiting fromthese schemes receive access to credit at preferential rates.
EPZ firms also benefit from a wide variety of other incentives, such as duty-free imports of most
capital equipment, raw material, and intermediate imports; investment tax allowances; exemptionfrom many labor rules; a 50 percent reduction in registration fees; and special treatment of
nonresident workers. EPZ firms can also sell some of thei production in the domestic market
(usually 10-15 percent), with the permission of the ministry of trade.Pioneer firms in electronics, jewelry, and engineering share many of the same benefits and are
also allowed to sell unlimited quantities in the domestic market. Other incentives schemes are less
comprehensive. Holders of agricultural development certificates are exempt from customs, stamp, and
sales taxes on machinery, equipment, and spare parts, and on office equipment as approved by the
minister of agriculture. They also receive a 50 percent reduction in registration fees on land and
buildings. Export services on a fairly comprehensive list are exempt from import duties on capital
goods and goods for re-export. The hotel management scheme exempts certificate holders on a one-
time basis from sustoms duty on certain types of imported equipment and reduces fees by half.
-69-

Offshore businesses, which deal only with nonresidents and in foreign currencies, are eligible for
taxation at a concessionary rate of 5 percent on all offshore profits, free repatriation of profits,freedom from foreign exchange controls, exemption from income tax on interest or dividends paid out
to nonresidents by offshore banks, exemption from stamp duties on documents, a tax credit of 50
percent of the income tax payable by the expatriate staff, and exemption from customs duty on office
equipment, cars, and household equipment for up to two expatriate staff per company.
Other types of investment and saving incentives operate through the personal or corporate income
tax codes.
In computing chargeable personal income, taxpayers are entitled to the followhng exemptions:
a Net income derived from a sugar growing unit on the first 40 tons of sugar.
* A maximum of Rs 40,000 of interest on fixed deposit or savings accounts in Mauritius or ondividenes received from resident companies.
" Thirty-five percent of dividends received on securities quoted on the official list of the stock
exchange and on shares in an authorized mutual fund.
* Interest paid by an offshore bank (for nonresidents of Mauritius) and dividends paid out of
income from offshore banking.
" The first Rs 100,000 of income derived in an income year from the sale of securities or units.
* Dividends received during the first ten years of operation of special types of companies holdingdevelopment certificates, export enterprise certificates, export service enterprise certificates, hotel
management service certificates, pioneer certificates, or industrial building certificates.
a Dividends received during the first eight years of operation of housing development companies or
housing construction companies holding housing development certificates.
Several deductions apply to the chargeable income, relating primarily to personal relief, ouse
and dependent children, medical expenses, medical and life insurance, and interest on loans.
Taxpayers who subscribe to the share capital of a company engaged in nonsugar agricultural,
shipping, industrial, manufacturing, or tourist activities are allowed a Ia MMi& in the form of a tax
deduction of 30 percent spread over three consecutive years and exclusive of any amo, tnt paid as
premiums on shares. Maximum deductions are Es 40,000 for individuals and Rs 100,000 for firms in
any one income year.
For corporations, tax rates payable on net profits are as follows:
* 5 percent for offshore banking
* 15 percent for special certificate companies
* 25 percent for companies listed on the official list of the stock exchange, including certain
subsidiaries
* 35 percent for other noncertificate companies.
-70-

The treatment of dividends declared and paid by companies operating in Mauritius varies
according to the type of firm. For special certificate companies, dividends are exempt from tax during
the first ten consecutive years." After the tax holiday, dividends are taxed at normal rates.Dividends from noncertificate companies are taxed at the normal rates. he previous year's losses and
expenditures on repair of premises are deductible.
A company that does not hold an export enterprise certificate, a development certificate, or an
export service certificate is allowed a tax benefit for its exports. The income tax rate is 25 percent ifthe company exports 10 to 30 percent of its production, 20 percent if it exports 30 to 50 percent, and
15 percent if it exports more than 50 percenL
Companies receive generous investment allowances: an initial allowance for plant (excluding
buildings), machinery, and equipment of 50 percent plus an additional 20 percent investmentallowance. Both allowances are given in the year in which the expenditure is incurred. From the first
year of operations a straightline depreciation amount of 10 to 20 percent is allowed, depending on the
type of equipment. Thus the total allowance in the first year could be as much as 80 to 90 percent ofthe purzhase price, followed by straightline depreciation at 10 to 20 percent of the fall asset value per
year: for five to ten years. Vehicles are depreciated at 10 to 20 percent a year without an initialallowance. Buildings (including hotels) receive an initial allowance of 30 percent and an investment
allowance of 20 percent and are depreciated at 5 percent a year. Other provisions of the tax code give
allowances for the purchase or improvement of agricultural land.A final type of investment incentive that should be mentioned is institutional support. The most
important agency in this area is the Mauritius Export Development and Investment Authority
(MEDIA), which-apparently with considerable success-seeks to attract foreign investors in exportactivities and to promote export activities. MEDIA maintains offices in France, Japan, Taiwan, and
the United Kingdom. MEDIA guides potential investors, both foreign and Mauritian, throughbureaucratic requirements and provides information on Mauritius and on foreign markets. An
industrial estate division of MEDIA constructs buildings, primarily for the use of EPZ firms, to
enable foreign firms to start up operations quickly in Mauritius. MEDIA charges close to market
rental rates for its buildings and approximately breaks even, so there is little or no subsidy element in
this activity.
Effects on incentive struae
The multiplicity of incentive regimes creates numerous distortions. An examination of effectivetax rates for roacertificate firms and EPZ firms gives an indication of the effect of the tax system on
incentives (World Bank 1991). A noncertificate company with pre-tax profits of Rs 100 millions
would have to pay a 35 percent corporate tax, ending up with Rs 65 million to distribute as dividends
35. The nax boliday period is eight ycars for housing dvdopment companies and housing consmuctioacompanies.
-71-

(assuming all profits are distributed). Individuals receiving these dividends have to pay an additional
35 percent income tax on them (there are some exemptions), leaving Rs 42.3 million. The effectivetax rate is therefore 57.75 percent. If the firm were an EPZ in its first ten years of operations (when
dividends are tax exempt), the firm would have paid a corporate tax of 15 percent on profits, and thedividends received by individuals would have been exempt from income tax. Therefore, individuals
would have received Rs 65 million in dividends from investing in an EPZ, as opposed to Rs 42.3
million investing in a noncertificate firm. If the other exemptions and deductions for EPZs (such ason machinery and equipment) are also factored in, the difference is even more pronounced. Clearly,there is a disincentive to investing in noncertificate firms.
There are other examples of unequal tax treatment. On July 1, 1985, a new tax regime was
introduced for development certificate companies (and some other types of companies) whose taxholidays had not yet expired, offering them the option of giving up their tax-free status for the
remainder of their holiday and instead paying 15 percent income taxes on profits for the life of thefirm. Companies receiving certificates after July 1, 1985 were also entitled to reduced tax rates for
life. But companies whose tax-free status had run out by June 30, 1985 were not eligible for the newprovisions and are now being taxed at the full corporate rate of 35 percent.
The treatment of savings and investment in the general tax code also has incentive effects.' All
types of firms are eligible for these benefits, so they may appear to be neutral. However, certaintypes of economic activities can take greater advantage of these tax breaks, improving their position
relative to others. One example is the large initial allowances and investment allowances granted for
investment in buildings, machinery, and equipment. The subsidy to capital investment creates a bias
toward labor-saving technology and a bias against investment in land (except agricultural land, which
has a separate allowance) and therefore in land-intensive activities such as tourism and housing. It
creates a further bias within these activities toward activities that use relatively less land and more
fixed capital (high-rise apartments and hotels). Services and other labor-intensive activities that
benefit less from these incentives are thus discriminated against.
Discrimination is also considerable among firms that are taxed at different rates. Thus an
allowance of 70 percent of the investment is, in essence, a direct subsidy of 10.5 percent of the
investment for a firm taxed at 15 percent (most certificate holders) but a subsidy of 24.5 percent for a
firm taxed at 35 percent. The effective subsidy also depends on whether the firm has a taxable profit
in a given year and on carry-forward provisions in the tax code.
Another bias comes from the 30 percent tax credit on the purchase of stocks of certain
companies, which favors some types of firms over others and equity finance over debt or retained
36. It should be noted, however, at dthe exclusion from taxable income of dividends and interest. subject to somse limits, reducesdouble taxation of savings, a distortion in its own right.
-72-

earnings finance.3 For example, firms with little collateral or new firms without an establishedcredit record are poor candidates for loans and benefit the most from this bias toward equity finance.
Labor markets
As the economy of Mauritius grew rapidly over the last ten years, employment and real wagessoared as well, distributing the fruits of this prosperity widely. Total employment rose by almost 60percent between 1983 and 1990 (table 4.3), absorbing the large increase in job seekers as morewomen joined the labor force and reducing unemployment from more than 20 percent in the late
1970s to about 4.5 percent in 1991 (the estimated natural rate of unemployment). More important,
this astonishing growth in jobs has been accompanied by a rapid increase in real wages. Average real
wages in large firms (iore than ten employees) increased more than.28 percent b-tween 1983 and
1990 (table 4.4).
Table 4.3 Employmnut in Mauriis, 19M3, 198, 1990
195 1981 che 190 duseFrms with more than Ia employees 194.000 271.000 40 280,000 33Small firms and adf-anployed 8.000 153,000 74 160,000 4.6Toad caployman 212,000 424,000 50 440,000 3.8Participation rate (S) 36 43 44Source- Ministry of conomic Planning sad Dovelpmcmand Cenral aut Office.
Table 4.4 Wages and Inflation, 193, 198, 199
MRrAne) CNL%d= Red wage but=
1983 955.3 619.7 100.01988 1,529.0 793.2 125.31990 2,003.6 1,012.7 128.6
Source: CCOral Satigical Office.
A primary reason for the rapid growth has been the expansion of relatively large, labor-intensive
export-oriented manufacturing firms, particularly in the EPZs. Until recently, fast output growthamong these firms was accompanied by even fister employment growth (table 4.5). These industries
were able to expand by drawing first from the large pool of unemployed and then by hiring more
women, who bave been entering the labor force at a rapidly increasing rate.
37. This bias does no depend on dbo rate of taxeion of the firm (so the eranple in tho technical nolc), ba o. te equilibrium rateof intercu= tbo firm mu pay. The bias is greler the higher the rae of intercar, which dcpends, among otbe things. on perceivedriskiness. Thus the bias is greatest for risidcr firm.
-73-

Table 4 Sechnral employment i large rm; selected yean(Number of people aployed. September of each year)
Can-ge hange (ange1983 1988 (%) 1990 (%) 1991 (%)
Total aufacturing 38,310 106,255 177 107,755 1.4 108.525 0.7EPZ 27.900 87.396 213 U.4110 -3.8 36.391 2.7Non-EPZ 10,410 13.859 31 23,645 25.4 22.137 -6.4
Construction 4,141 9.397 127 11.100 13.1 10,166 -8.4Agriculturo 55.326 49,600 -11 46.800 -5.6 46.885 0.2Wholcale, retail, tourism 8.923 13.410 50 17,350 29.4 18.260 5.2Financial services 4.625 7,383 60 9.530 29.3 9.672 1.0
Source: Surve; of employment and carnings. CSPD. 1991.
Employment among small firms (fewer than ten employees) has also increased rapidly, growingby more than 70 percent since 1983, a rate of job creation faster thain for all large firms except those
in the manufacmring sector. There is even some indirect evidence that during the last two years their
rate of employment creation has outpaced that of the large manufacturing firms as well. That thisgrowth has occurred at a time of increasing real wages and employment in large firms-and frequent
complaints that they are unable to fill positions-suggests that productivity levels are comparable in
small and large firms. If true, that would mean that small firms are not, as they are in many
developing countries, the marginal, low-productivity firms of an informal sector that absorbs the
overflow of workers from more productive formal sector activities.
Now that unemployment has been virtually eliminated and expansion of the labor force is slowing
down, labor-led growth can continue only tirough a rapid reallocation of the labor force from low-
productivity activities to higher-productivity ones. Another option is to seek growth through more
capital-intensive activities. Introducing such a fundamental change in the growth model, however,
would require a long transition period during which growth would continue to depend on existing
industries. Moreover, a failure to shift labor from low- to high-productivity activities is likely to
seriously reduce growth potential in the short and medium runs, resulting in slower growth in the next
few years and making a transition to capital-intensive activities more difficult. The large investments
required for a shift to capital-intensive growth may not take place if investors lose confidence in the
economy, as is likely to happen if growth deteriorates significantly in the next few years.
Reallocating labor to higher-productivity activities will require a fluid labor market, adequate
investment in human capital to avoid skills bottlenecks or mismatching, and efficient use of manpower
resources now tied up in the public sector. Flexibly functioning labor markets require a regulatory
framework that does not interfere unduly with the job creation and job destruction that characterize a
growing economy. Ensuring the level and composition of the work force consistent with the proper
reallocation of labor will require public investment in human capital development and a new system of
incentives to reduce public sector employment (a low-productivity sector) and increase the supply of
labor to the private sector.
-74-

Labor market performanceGovermment officials and employers in various manufacturing industries have - oiced concern
about labor scarcities and about increasing difficulties in filling vacancies at currad wage rates-in
other words, they are experiencing labor rationing. That only certain industries seem to be affected
suggests a lack of specific skills. But apart from a possible shortage of certain skills, the apparentscarcity of labor could be interpreted as evidence that the labor market does not operate efficiently. Itmight be argued that labor rationing would not occur if real wager were responsive to excess demandfor labor in some industries. If the labor market operated efficiently, real wages for the scarce skillswould rise and there would be no quantity rationing. If wages fail to respond to a scarcity of skills,
that implies a failure of the basic market signalling required to induce workers to acquire the skills inshort supply.
There are indications, however, that the labor market (at least, in the sector) does
operate efficiently and does provide the right signals. The perceived labor rationing affecting certainindustries seems to reflect the declining capacity of those industries to compete for labor resourcesrather than labor market inefficiencies. If that is the case, the large number of unfilled positions in
some industries is being caused by relatively low wages and the inability to raise them.Certain industries tend to exhibit high vacancy rates, defined as the nmber of unfilled positions
as a share of total industry employment. The average vacancy rate for a industries sampled in a
March 1991 survey (more than 60 percent of large firms) was 3.7 percent. This vacancy rate ishigher than the average for industrial countries, which is generally about 1 to 2 percent. (Vacancy
rate data are not available for other developing countries.) Thus, the vacancy data do reflect a very
tight labor market, but that does not necessarily imply widespread labor market inefficiencies. Thevacancy rates vary substantially from one industry to another, with high rates in the metal produa,
printing, plastic, and apparel industries and low rates (less than 1 percent) in agriculture, textiles,
wholesale and retail trade, restaurants, hotels, construction, and banking. In general, m
firms appear to have more recruiting problems than the rest of the economy.
The key question is whether measured vacancy rates reflect long time lags in filling available
positions. The fact that vacancy rates are high at some particular time does not mean that firmsnecessarily encounter serious difficulties hiring the people they need. It may simply reflect rapid
expansion of employment in a growing economy, in which case firms or industries that currently have
the highest vacancy rates would not necessarily have had high rates the previous year. That is, thecorrelation between current and past vacancy rates should be small. Firms able to fill all their
vacancies in one year are less likely to have a lot of vacancies the next. Firms able to fill only a small
percentage of their vacancies within a year will tend to have high vacancy rates the following year aswell. So a high correlation of vacancy rates through time would reflect an inefficient labor market
(labor rationing), while a zero (or negative) correlation would reflect little of no difficulty filling
vacancies within a year.
-75-

Unfortunately, we have data on vacancy rates by industry for only one year, so we cannot test
this correlation over time directly. However, since the rate of employment growth in an industry is
positively related to the vacancy rate we can use the former as a proxy for the vacancy rate in earlier
years. If the labor market is operating efficiently, vacancy rates in one period will not be correlated
with the rate of employment growth in the previous period.1' An analysis of the relationshipbetween vacancy rates in March 1991 and the rate of employment growtA in the previous year for
sixteen industries shows a very weak relationship between the two variables (figure 4.1). If anything,
figure 4.1 suggests a weak negative correlation, but certainly not a positive one. And in tact,
regression analysis shows a negative although not significant correlation between vacancy rates and
the rate of employment growth the previous year. Restricting the sample to manufacturing industries
confirms the weak negative correlation.
The lack of a positive correlation between vacancy rates and past-period employment growthsuggests that positions tend to be filled within a year and, therefore, that labor markets clear
rapidly-a sign of efficient operation." What, then, explains the high vacancy rates in certain
industries, particulariy apparel firms (table 4.6)? Employment in the apparel industry fell more than 3percent in the year preceding the vacancy survey. This suggests either that the industry had a low
vacancy rate in the previous period or that the wages offered for the available positions were notcompetitive and the industry was in the process of adjusting its wages to market levels.
Tbus if vacancy rates in the apparel industry were low the previous year, the high vacancy rates
in March 1991 would reflect simply a temporary increase in labor demand in a particular industry that
would be satisfied fairly quickly, a situRion fully consistent with the hypothesis of efficient operation
of the labor marke? The second explanation-that the apparel industry was unable to fill itsvacancies because it was still adjusting its wages to competitive levels-is consistent with the large
increase in real wages in the industry on the order of 15 percent. The apparel industry is still one of
the lowest paying industries in the country, but the wage gap is rapidly narrowing, again
demonstrating efficient operation.of the labor market.
38. Thin assumes that the generation of new jobs is not correlated through tie. If such auto-corrastion exiu, then vacancy raftscould be positively correlated with employamt growth even if the labor markrt operated efficically.
39. According to statistical analysis. k takes less than ten months to fill a position.
40. This hypothesis i supported by prelimiary data showing that employment in the apparel industry in the six months followingthe vacancy survey (March 1991 to Scptember 1991) increased faster than in most other industrics.
-76-

Figure 4.1 Vacancy rate and employment growth in Maurikius(a percentage)
MAURITIUS: VACANCY RATE AND EMPLOYMENTCin percentage)
7
5 a *
m5
4.
3
2
-3.1-0.2 0 2 2.9 3 5 5.9 7 9 10 10 13
EMPLOYMENT GROWTH
Table 4.6 Job vacancy and c ployment growth
VaCOMy mfa (March 1990o March1991)Bamber ofamcners5)4
Food, beverage. tobacco 85 1.1 2.3Testile 50 0.9 10.0Wearing appard 5.779 7.0 -3.1Lcather 40 3.0 -0.2Wood products 37 2.0 0.0Mcal products 57 6.0 0.0Paper proucts 20 3.0 7.0Printing(publishing 72 6.0 3.0Chemicals 25 2.0 13.0Rubber 20 2.0 5.0Plastic products 37 4.0 10.0Agriculture 160 0.4 0.0Wboleadcail tuk remmanrisiwcls 115 0.8 9.0Construction 74 0.6 2.0Financeisurancereml amibuasnessfacrvices 47 0.5 5.9
Source Survey of cmployment and earnings. Central Statistical Office 1991.
-77-

Another important issue concerns the reason for the rapid increase in real wages since 1987. Is
the rise a natural consequence of past economic growth or a response to direct and indirect
government interventions? The very low rate of unemployment suggests that market forces are at
work rather than direct government interventions. The large adjustment in public sector wages in
1987 appears to have had an impact on the rest of economy, as reflected in the large and
homogeneous (across sectors) real wage increases that year (table 4.7). But in the following years
growth in real wages decelerated considerably and greater differentiation appeared across sectors.
This pattern suggestm that the large real wage increases of 1987 were probably compensated for by no
growth the following year. It also suggests that certain sectors, particularly manufacturing, werefacing stiffer competition for labor from emerging sectors (tourism, financial services, construction),
forcing rapid wage adjustments in those sectors. There are indications that the 26 percent rise in real
manufacturing wages in 1990 was followed by another large increase in 1991. These increases do not
appear to have been caused by government interventions.
Table 4.7 Real wage cbange by sector, 1984-90(percentages)
Aricsdanrr Manufacauint &conomy1984 -7 0 -51985 2 -3 01986 10 7 31987 17 19 191988 -2 0 01989 11 3 71990 2 26 13
Source: c a saitical Ofice.
Despite the accelerating rate of real wage growth observed since 1987, real unit labor costs in the
manufacturing sector began to fall in 1988. After a steady decline between 1982 and 1986, labor
productivity in manufacturing recovered somewhat between 1987 and 1990 (table 4.8). That is, the
real wage increases of the late 1980s have been accompanied by a more than proportional rise in
labor productivity.
Table 4.8 Labor pmductivity and unit labor costs indee in sanufacturing, 1982-90(1982=100)
PAoducatw:y Udr labor cost1992 100 tdd1983 98 1021984 a8 1091985 77 1181986 75 1271937 78 1331983 31 1381989 84 1321990 91 1271991 98 125
Source: Digest of industrial Statistics, Ccntral Statistical Office. 1990.
-78 -

Although the rare of growth of real wages does not appea to be the result of government
intervention, the level of real wages in the private sector may be related to some extent to excessive
government employment and to labor market regulations. Thus if labor were released from the public
sector and if regulations were relaxed, real wages in the private sector would likely decline in the
short run, or, at least, not rise as fast as recently. This would make the economy more competitive.
Thus while direct intervention by the government in private sector wages has probably not been
responsible for the rapid growth in real wages over the last five years, the indirect influences of other
government interventions may have pushed the level of real wages up too high in the private sector.
Regrdatoryfranework
With unemployment so low in Mauritius, government regulations affecting wages are likely to be
less important than regulations affecting employment practices. Different regulations apply in the
sugar sector, the EPZ sector, and the rest of the economy.
The most restrictive regulations apply to the sugar sector, which employs more than 40,000
workers, or almost 15 percent of the labor force employed in large firms. All sugar industry workers
hired before 1967 (the "regular" labor force) must be guaranteed employment during the intercrop
season. Employers must also retain at least 15 percent of all other workers employed during the
preceding harvest season (the "supplementary" labor force) throughout the rest of the year. Even
natural attrition in the regular labor force is regulated. When the level of attrition in the regular labor
force (current regular labor force less the regular labor force in 1967) exceeds the supplementarylabor force the employer is required to hire additional workers to make up the difference. That means
that the total labor force in the sugar industry cannot be reduced below 1967 levels even by attrition,
not even if the firms introduce new techniques and equipment requiring less labor.
The requirement of year-round employment for some workers in the sugar industry effectively
raises wages in the industry. Workers get the same wage in the off-season as during the harvest
season, but for much less effort The fact that sugar workers receive relatively high wages while
firms are unable to reduce employment even through attrition is likely to induce overemployment in
the industry. And that implies a smaller labor supply for the rest of the economy, putting upward
pressure on real wages.
The overemployment in the sugar industry that results from government regulations can be
estimated by comparing sugar production in Mauritius with production in other developing countries
at similar stages of development. More than 40,000 workers were employed in the sugar industry
(sugarcan plantations with 10 hectares or more plus sugar processing plants employing more than ten
workers! in Mauritius during 1988-90.4 Sugarcane production for the period averaged 630,000 tons
a year a about 50,000 hectares. By comparison, sugar cane production in Belize averaged about
41. Including smaller producers would Frobably bring the number of workers involved in sugar production up to 50,000 or more.
-79 -
700,000 tons a year during that period on about 25,000 hectares with a total work force (including
sugar processing) of about 12,000 people.' And in Barbados, another middle-income sugarcanegrower, production in 1986-89 averaged about 715,000 tons a year on 12,000 hectares with fewer
than 3,000 workers!3
Thus Mauritius produces less sugar than Belize using twice as much land and four times as many
workers. If producers in Mauritius were about as efficient as producers in Belize and if the
government allowed them to reduce their work force, the Mauritian sugar industry could produce the
same .uantity of sugar with a quarter of the workers (9,000 instead of 40,000). Even if production in
Mauritius were only half as efficient as in Belize (say, because of differences in natural endowments,
or difficulties of mechanization), Mauritius could still achieve its same level of production with halfthe workers. Government regulations, then, have forced the sugar industry to use at least 20,000
more workers than necessary." If those workers were released by the sugar industry, other sectors
would be likely to absorb them rapidly. Adding 20,000 workers to the economy implies a 7 percent
increase in employment in other sectors, which would boost GDP by at least 3 or 4 percent.
A different set of regulations affects EPZ firms. They are exempt from most of the conditions of
the Labor Act governing termination of employment. EPZ firms are not required to give advance
notice of individual or group layoffs and are exempt from the last-in, first-out rule. The firms do not
have to pay a severance allowance to workers with less than three years of continuous service;
workers with more than three years of service must receive two weeks of severance pay for each year
of service. Employees may be asked to work as many as sixty hours a week, compared with a
maximum of forty-eight hours in other sectors.
Firms outside the sugar and EPZ sectors also face certain restrictions if they want to reduce their
work force. Firms must explain in writing to the ministry of labor the reasons for a proposed work
force reduction. Also, firms must follow the last-in, first-out rule, and no layoff can begin until 120
days after notification of the ministry. Firms are required to give individual discharged employees two
weeks' notice of dismissal for those employed for less than three years and three months' notice for
those employed for more than three years. Workers who have been employed for at least one year
must receive two weeks of severance pay per year of continuous service. (Employers may deduct
from the severance payments any contributions made to the employee's pension plan.)
42. Bize* Couptry F=reomic Mernoandum, World Bank Report No. 10401-BE, Ap. 14, 1992. Figures from li:nimty ofAgriukaure, Cantal Statifcal Ofrice, and mission estinistes.
43. Barbados: Spvecil Economic Report. World Bank Report No. 9545-LAR. May 22,1991. Figures from Barbadt SugarProduccrs' Association
44. The direct cffact include the requirement for year-round employment and the abscecism (capecially during . cak a m )promoted in part by the regulatious. Indirect effects include the slow rarw of mcchanization in reapomm t the negauve incentivesgenerated by the scgulasions.
- 80 -

Firms in all sectors of the economy are required to provide fourteen days of annual leave and
eighteen days of sick leave at full pay (with another twelve days of sick leave at full pay granted for
prolonged illness) for workers employed five days a week. For workers employed six days a week,
these allowances increase to sixteen days of annual leave and twenty-one days of sick leave (plus
fourteen days for prolonged illness). Furthermore, workers need not inform their employer until the
second day of an absence for illness, and a medical certificate is required only for absences of more
than two consecutive days. The law also provides for an attendance bonus of 5 percent of the monthly
wage for workers who miss no work because of illness.
Required overtime supplements are very high. For overtime work on regular work days, the
supplement is 50 percent above the basic rate for the first ten hours over the regul&: forty-five hour
workweek. For the next five hours the legislated wage is twice the basic rate; for any hours
thereafter, the rate is three times the basic rate. For work on public holidays, firms are required to
pay twice the basic rate for the first eight hours and three times the basic rate thereafter.What are the implications of these labor regulations? Because they do not affect all sectors
equally the regulations generate economic inefficiencies. Legislation forces variations in the cost of
identically skilled workers in different sectors and therefore causes variations in the marginal value
product of identical workers in different sectors. Consequently, both factor proportions within sectors
and sectoral allocation of factors are Degatively affected. The social gains that could be attained by
redeploying workers from low- to high-labor-productivity sectors ar, 'us lost. The sugar sector, for
example, is forced to maintain a larger than needed work force and a productivity level below that in
other sectors of the economy. Lifting these employment restrictions would enable the sugar industry
to reduce its work force during the off-season for a short-run gain in productivity and would allow
even greater work force reductions in the longer run, as improved incentives increased the pace of
mechanization. As mentioned, the industry could reduce its work force by 20,000 workers without
significantly affecting production, for a gain in national income -in the long-run-- of 3 to 4 percent
as these workers were hired by other industries.
By inflating the cost of dismissing individual employees or reducing the work force, especially
for firms outside the EPZs, labor legislation reduces the flexibility of the labor market and increases
the adjustment costs associated with exogenous economic shocks. Changes in relative prices, for
example, will cause greater short-term losses because the economy will be slower to adjust. The labor
legislation impedes the movement of workers from the now relatively lower-price industries to the
relatively higher-price industries, reducing national income. Since relative prices are continuously
changing, economies unable to respond quickly because of labor market rigidities experience
permanent losses in income. In a full-employment economy like Mauritius's, any delay in laying off
workers from an industry that should be shrinking implies an equivalent delay in filling vacancies in
industries that should be expanding.
- 81 -

Certain aspects of the labor legislation tend to promote absenteeism and to reduce incentives towork longer hours. At a time when growth in the labor force has slowed dramatically, incentives are
needed to motivate workErs to increase their individual contributions to the labor supply. Yet sick
leave regulations are particularly lenient: workers can use up their entire paid sick leave allowance
without actually being sick simply by skipping work for periods of fewer than three days at a time (nomedical certificate is needed). Interviews with government and business executives suggest that this
practice is widespread. At an estimated 10 to 13 percent, the absenteeism rate in Mauritius is very
high, and the rate has more than doubled over the last ten years. In the sugar industry, the very
generous legislatively mandated attendance bonus gives an employee who works only 62 percent of
the total number of work days a bonus equivalent to 18 percent of annual salary. An 8 percent bonus
is available for less then 62 percent attendance. In a tight labor market, the rationale for legislatingsuch a steep wage increase for overtime work is not clear. It discourages firms from using overtime
and drives them to try instead to hire new workers.
Public employmet policles
The public sector employs a large share of the labor force-almost 82,000 workers in 1991,equivalent to 30 percent of employment in the country's large firms (table 4.9). Like sugar sector
employment policies, public sector overemployment apparently had its roots in the labor surplusconditions of the 1970s. Central and local government employment increased rapidly from 32,000 in
1972 to 55,000 in 1983, a growth of 72 percent.5 Although public employment remained fairly
stable between 1982 and 1989, an upward trend has recently emerged, with public employment rising
by almost 2 percent between September 1989 and September 1990 and another 0.7 percent through
March 1991 (almost 1.5 percent on annualized terms).
Wages for low skills seem to be substantially higher in the public sector than in the private
sector. Aggregate wage data suggest that wages are significantly higher for employees in the central
government than in the private sector. 1mhus in March 1991, public employees earned an average of
17 percent more (those paid on a daily basis) to 20 percent more (those paid on a monthly basis) than
employees in the private manufacturing sector.
45. Maurius: Manarine Success. Word Bank Counnuy Sady, 1989. Table X.1.
-82-

Table 4.9 Public saor employment, 1 -91(number of employees)
Sonaber SCpRber hae Adard191 199 (SI) 1991 (%)
Central an local government 54.919 55.790 1.6 56,039 0.5Parastatals 24.988 25.577 2.4 25.840 1.0Toral 79.907 81367 1.3 81,929 0.7
Source: Biannual survey of employment and earnings. Central Statistical Office, March 1991
Aggregate comparisons may be misleading because they fail to take into account differences in
skills between government and private sector employees. However, comparisons of public and private
wages by specific categories of skills in July 1990 and July 1991 show wage gaps of 17 to 20 percent
in favor of the public sector (table 4.10)," differences remarkably similar to those found using
aggregate data. If the greater stability of government jobs is taken into account, the true wage
differential is even larger.
Table 4.10 Gross top salaries of certain grades in public sector/privat seor(rupees)
7a6m secar Psd. ssmr Sgar .d"ay)
Grader Jy 1992 July 1991 Gras 9s
Laborer 2,620 2.330 2.316 2.346Plumber and pipe-tier 4,075 4,340 3.542 3.707
Carpenter 4.075 4.340 3.410 3,675Mason 7,075 4,340 3.410 3,675
Source: Mission estime-- based on data provided by the Ministry of Labour
Informal evidence and observations by government and private sector officials indicate high
levels of overemployment in the public sector. Most observers agree that the government could
reduce employment by 20 to 25 percent without any loss in services. One factor that keeps
employment levels higher than they need to be is the structure of pension benefits for government
workers. Employees who resign after less than twenty years of service lose virtually all their pension
benefits.
Several conclusions emerge from this picture of public sector employment: the public sector
absorbs a high propcrtion of the labor force. Employment in the public sector is rising again after
46. The private sector wages used for comparison correspond to those in the sugar industry, 0ne of the highest wage saers insanufacturing.
- 83 -

several stable years. Wages for similar skills are higher in the public sector than in the private sector.Labor redundancy in the public sector is high at about 20 to 25 percent of total employment.
Hwnan developmenr
With a primar. enrollment rate of 100 percent, Mauritius has a higher level of basic education
than do most couantries with similar levels of per capita income. The adult literacy rate is estimated at93 percent. It is generally acknowledged that a well-educated population has played an important rolein Mauritius' success. And these achievements have been accomplished at relatively low cost, partially
through reliance on private sector education. Comparative enrollment levels drop off considerably at
the secondary and tertiary levels, however. At about 45-50 percent, enrollment in secondary
education is below the rates of many countries at Mauritius's level of development. To name a few,Chile has a rate of 65 percent, Malaysia and Mexico 55 percent, and Uruguay 67 percent.
At the college and university levels, enrollment in Mauritius was only about 2 percent, lower
than in all other countries with a per capita income higher than S1,000. For example, enrollment atthat level was 24 percent in Costa Rica, 19 percent in Chile, 15 percent in Mexico, and 7 percent in
Malaysia. It is true that many developing countries have overinvested in higher education, but
Mauritius's dramatically low enrollment rate suggests an underinvestment in higher education that
may become an increasingly incapacitating constraint to the development of such potentially dynamic
sectors as banking and finance and high technology industries. An important question is whether
inadequate supply or weak demand account for the low enrollment rate for university education.
Substantial unmet demand for higher education would justify investing in new university facilities.
These issues are being addressed in the ongoing Education Sector Master Plan.
The University of Mauritius is the most important higher-level educational institution. It offers a
wide range of degree and certificate courses to some 850 students. The Mauritius Institute ofEducation offers postgraduate training in education, and the Mahatma Gandhi Institute offers training
in the arts. A proposal to upgrade the Lycee Polytechnique to an institute of technology within the
University of Mauritius has recently been accepted by the government.
The low levels of secondary and higher-level education in Mauritius may not affect workers'
ability to master the skills required for traditional industries in the country. But the relatively
widespread lack of such training will certainly affect their ability to become proficient in the more
sophisticated skills required in the emerging higher-technology industries.
Government institutions provide nearly all the technical training offered in Mauritius. The
Industrial Training Center, now part of the centralized government training bureau Industrial
Vocational Training Broad (IVTB), provides basic vocational training in several fields. Students who
have completed training programs at the center have had difficulty finding jobs, and a 1991 internal
Word Bank assessment report judged the center's standards to be too low. The Lycee Polytechnique,
-84-

another government training center, appears to offer higher quality training, but its remoteness from
centers of activity discourages applicants.
Government technical training programs are severely lacking in trained teachers, equipment, and
teaching materials. The government has prepared a $71 million investment proposal for the IVTB to
remedy these defects and has presented the proposal to international donors. Centralization of training
programs within IVTB may weaken their responsiveness to demand factors, while layers of
bureaucracy reduce their cost-effectiveness. The private sector's response to IVTB programs is mixed.
Some firms have taken advantage of its services, but many firms show little interest in the programs,
preferring to rely on in-house training. Several companies have complained that IVTB training is too
generic and too heavily oriented to small-scale, artisanal activities.
Private training schools are very small, and their programs are generally of poor quality.
Approved in-house training programs receive government grant support of up to 75 percent of the
costs, but eligibility criteria are not clearly defined. Training, if it is not geared too specifically to the
firm that provides it, generates benefits that go beyond the firm. Thus there may be a public-goods
argument for subsidizing part of the training costs of firms. It is important, however, that the subsidy
be available to all firms providing such training and that it be allocated according to clearly specifiedcriteria.
One type of training that has not received the attention it deserves is training to prepare
government employees for work in the private sector. Reducing the government work force andexpanding the private w -rk force are clear prioritics for the near to medium term, and providing
training in skills in high demand in the private sector would ease the transformation of the work
force. Such training would not only accelerate absorption of government workers into the private
sector, but it would also make the reduction of the public sector work force politically more feasible.
Technical note 1: land use controls
Suppose that there is a fixed volume of land'7 ( in figure 4.2) to be divided between
agricultural and nonagricultural uses. How would the amount allocated to each use be determined?
What are the economic effects of alternative policies, and how will these effects change over time?
Figure 4.2 depicts a conceptually simplified way of analyzing issues related to land use. The
vertical axis measures the price of agricultural land (PA) and nonagricultural land (Pv). The horixontal
axis measures the amount of land in each use. The amount of agricultural land increases from left to
right; the amount of nonagricultural land increases from right to left. The curves DA and DN ar the
demand schedules for the two land uses. Each is downward sloping, indicating that the lower the
47. For the purposes of this analysis, 'land" in defined as cither a flow of services from the stock of land (its 'price' is tims asimplicit rental race per year) or the sock of land itself (its price is t= the purchase price). The concepts of tax and economic lossmust be interpreted consistently with the other variables, either as an annual flow or a net present value (sMock).
- 85 -

price, the greater the demand for land in each use. The curves can also be thought of as showing themarginal value of land. That is, each vertical axis shows the value of allocating one extra hectare to
the relevant use, given that the quantity of land shown on the horizontal axis is already allocated to
that use. For example, if LA hectares of land are in agricultural use, the value of adding one morehectare is MVA . Or conversely, if the price of agricultural land is set at PA , the amount of landthat would be purchased for agricultural use is LA hectares. Each point on each curve has an
analogous interpretation.
These marginal value or demand curves are, of course, dependent on other economic variables.One determinant of DA is the price of sugar. If sugar growing were the only possible agricultural land
use, DA would be the marginal production curve of land in sugar production multiplied by the price ofsugar to growers, net of other costs. The curve is downward sloping, indicating that as more land is
cultivated, production on the marginal hectare declines. This reflectr the fact that the most productiveland is the first to be cultivated or-even if all land is the same quality-that using a given total
amount of other resources with more and more land will produce diminishing marginal returns. The
demand for land in nonagricultural use is derived from, among other things, the demand for housing.This, in turn, is influenced by other factors, such as the price of gasoline and wage levels (which
affect housing buyers' willingness to pay high prices for locations near workplaces), as well as by
site-specific amenities, such as a good view, nearness to beaches, parks, and so on.
Figure 4.3 shows an equilibrium in the land market with no restrictions. The total amount of
land is used, with no excess demand in either use and equal prices of land in each use.Figure 4.4 shows a situation similar to the current one, where restrictions prevent agricultural
land from being shifted to nnagricultural use. Thus, the allocation is £A (greater than L; ) toagriculture and L, (less than L; ) to nonagriculture. The price of agricultural land is 'A (less
than P; ) and that of nonagricultural land is P, (greater than P ). The difference betweenPr and Ps is the premium (or Orent") for any owner of agricultural land who can get permission
to convert the land to nonagricultural use. The more restrictive the policy-that is, the more it
changes the allocation from the equilibrium in figure 4.3-the greater the rent. The allocation of landshown in figure 4.3 could also be achieved by imposing a tax of size Ton nonagricultural land use,
with no other restrictions. This would eliminate rents from land transfers.
The shaded area in figure 4.4 represents the economic cost of the land use restrictions. For each
hectare of land over L; hectares that is used for agriculture instead of nonagriculture, the marginalvalue in agriculture (measured by D,) is less than its value would have been in nnagricultural use.
Thus, the difference between the two curves between L; and 4 measures the total value lost.
How will this situation evolve in the future? One thing is very clear: as Mauritius develops,
incomes rise, and population increases, the demand for land for housing will increase, shifting Dv up
-86 -

(to DN in figure 4.5). What will happen to DA is less certain. However, one of its majordeterminants is the price that Mauritius receives for its sugar. This price is likely to declineeven- aally, shifting the demand for agricultural land to DA . (The curve DA could be thought of as
representing the demand for land when Mauritius receives the EC price for sugar, and DA thedemand when it does not get this preferential reatment.) Figure 4.5 indicates a fall in the price of
sugar would cause a faIl in land prices. It also shows that if the land use controls prevent the land
market from responding flexibly to these changes, the economic losses will increase (to the largeshaded triangle) and the size of the rents to those who can get permission to use land in
nonagricultural uses will increase.
In a growing economy, use of a tax (maintained at the same level from year to year) instead of a
rigid regulatory allocation would contain the size of the annual economic loss to its original level. The
changes in land allocation would be the same as they would be if there were neither restrictions nor a
tax. However, *he amount allocated to nonagriculture would be less than it would be without the tax,producing an annual economic loss equivalent to the area of the triangle.
-87-

Fågure 4.2 Land use: demand and marginal value
UWA, PÅ Da p.
-
Fignre 4.3 Irandéuse: optimal allocation.
M pk Da MV» pm
40
- 88 -

Hlgure 4.4 Land use: efficiency cost of estrictions
Wal PA MVMP.
T}-C
I
I
igure 4.5 Land use increasing cost of restrictions over dime
mva- 89 -a pa
- 89 -

Technical note 2: tax credit for stock purchases
Allowing purchasers of stocks to deduct 30 percent of the cost of the purchase from their taxes
as a credit creates a bias that pushes firms to choose equity finance over borrowing to satisfy their
capital needs (example 1). The size of this bias does not depend on the rate of tax the firm pays on its
income (example 2), but it is greater the higher the rate of interest (and return on dividends) the firm
must pay (example 3).
Ecample I
Suppose firm A has an opportunity to invest Rs 100 and receive a return of Rs 20 per year into
the indefinite fumre. k can raise the Rs 100 by selling stock or by borrowing. If it borrows, it must
pay 10 percent interest per year. If it sells stock, it must give investors at least 10 percent per year
return on their investment. On the Rs 20 extra incomne, it will pay Rs 7 in taxes if it is subject to a 35
percent rate; thus it will have an after-tax return of Rs 13.
If firm A borrows the money for the invesunent, it must pay Rs 10 interest or the loan, leaving
it with Rs 3 of the Rs 13 as "profito to be distributed or retained.
Suppose now that it raises the money by selling stocks. Since investors get a tax credit for 30
percent of their stock purchases, they in essence pay only Rs 70 for the Rs 100 worth of stock. Thus,
of the Rs 13, the firm must distribute Rs 7 to these stockholders (10 percent return on Rs 761, leaving
Rs 6 as profit to be distributed or retained. By selling stock rather than borrowing, the firm has Rs 3
of additional profit.
Example 2
Now, suppose the firm's tax rate is 15 percent rather than 35 percent. Its after-tax income is Rs
17 (85 percent of Rs 20). If it borrows, it must pay Rs 10 in interest, leaving a profit of Rs 7. If it
sells stock, it must pay investors Rs 7, leaving a profit of Rs 10. The difference in profits between the
borrowing and stock-selling options is Rs 3, the same as when the tax rate is 35 percent.
Eample 3
Now, suppose the firm's tax rate is 35 percent, but the interest rate it must pay (and the required
return on stock) is 5 percent, rather than 10 percent. Its after-tax return is still Rs 13. If it borrows at
5 percent, it must pay Rs 5 in interest, leaving it with Rs 8 in profit. If it sells stock, it must repay
investors Rs 3.50 (5 percent of Rs 70), leaving it with Rs 9.50. Whereas with an intere -ate of 10
percent, the difference in profits between borrowing and stock-selling was Rs 3, now the fference is
only Rs 1.50. Thus the bias toward choosing equity over debt is greater for Category M ms, which
must pay higher interest rates, than for Category I firms.
-90-
Chapter 5. Sectoral Summary of the Impact of Regulations and Incentives
This chapter examines the effects of differences in incentives for various types of firms and across
sectors of production. In particular, it considers the effects of tariffs and nontariff barriers, price
controls and subsidies, sales and income taxes, investment incentives, and land, capital, and labor
regulations. The impacts on certain critical sectors are examined in detail, particularly on sugar,emerging exports and export-related services, as are the impediments created to the integration ofexport processing zones (EPZs) with the rest of the economy.
Regulations and incentives related to tariffs, taxes, and factor markets differ for various types of
firms in Mauritius (table 5.1). A tangled thicket of regulations and incentives makes it virtually
impossible to judge even the direction-much less the importance-of their impacts in many cases.
Many incentives and regulations appear to be working at cross-purposes- While some incentives are
clearly intended to benefit specific firms or activities, regulations in other areas mute their impact,often unintentionally. Especially in a small economy, any regulation or incentive affecting one group
of firms indirectly affects the rest of the economy. Such effects are particularly evident in the case of
regulations in factor markets under conditions of scarcity.
It is difficult to justify differential treatment of factors of production according to type of firm,
particularly within a single productive sector, since such treatment almost invariably leads to
inefficient resource allocation. For example, the textile sector in Mauritius includes EPZ firms,
development certificate-holding firms, and other types of firms, each receiving different signals about.
what combination of factors to use (imported versus domestic inputs, labor versus capital).
EPZs have certainly done remarkably well. To what extent their success can be tied to incentives is
unclear, however. Other factors have had some impact on the outcome as well, such as buoyant world
markets and preferential access to them; cheap, efficient, and available labor, and an environment of
political and economic stability.
Even if incentives can be demonstrated to have affected a particular sector of the economy, it does
not necessarily follow that the incentives have positively affected the growth rate of the economy
overall. To the contrary, experience and research has repeatedly revealed the importance of neutrality
of incentives for stimulating growth, especially when factors of production are scarce and efficiency
in their use assumes greater importance.
Services, especially in the domestic market, suffer the greatest discrimination from the system of
incentives and regulations. There is no economic justification for this discrimination. Mauritius needs
to develop its services secors to support export activities--the EPZ linkage issue-and it may even
have a comparative advantage in some services.
Some interventions, such as food subsidies, labor regulations, discriminatory tariffs, and the like,
are justified on redistributive grounds. Yet most of these interventions have pervasive effects
-91-

Table 5.1 Sectoral Incentive structure
EPZ Pioneer EJZ Dd' ADC Hotel Offshor Other Sugar
Trade
Tariffs neasive nestive negative polliveor neative noxative 9.38% tax one e ofrctive protection but negative ef e ctive exports
proteciony protection protection' ighly protection of protectiony protectlor'dispersed imot
alstituto or
Exemption/ Exemption same as EPZ exemption drawback, but exenmpton on exem ion of exemption of depends exemption ondrawback of all Inputs, on delays In machinery, certan types office on Item capl goodsfor tariffs capital machinery. payments; equipment of equipment equipment.on Inmowts goods spare equipment, bonded spare parts, on a on&time cars,used in pats Uew spare parts, warehousing; office basis householdproduction exceptions) and goods does not cover equipment equipment
for re- capital goods for maximumexport. or local of two
purchases expatriuae
Lacal sales max. 15% unlImited max. 15% unlimited unlimited unlimited none unlimited local salesallowed enforced at
below worldprice
U No more certificates are being Issued
' Effective protection includes negative indirect effect on exports from barriers to imports (tariffs and non-tariff barriers). This Indirect effect operates through anovervalued exchange rate and atraction of resources from exportables to other sectors (see Appendixes A and B):
e Ma; . 8n a c a 1 hazal du ae (for Mauritius Chamber of Commerce and Industry) Towards an Integration of the
-92-
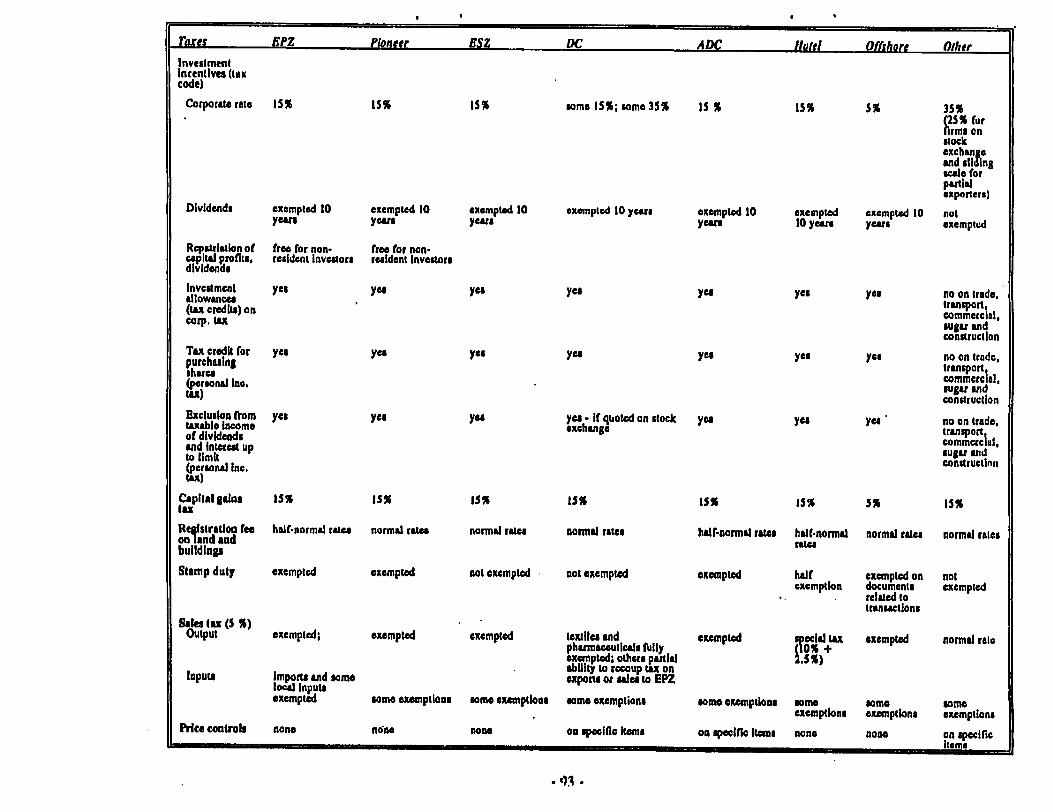
res EPZ Pioneer ESZ DC ADC Hoftel Offshore OtherInvestmentIncentives (taxcode)
Corporate rate 15% 15% 15% some 15%; some 35% is % 15% 5% 35%(25% fur
stockexchangeand slidingscale forpartialexporters)
Dividends exempted 10 exempted 10 exempted 10 exempted 10 yeus exempted 10 exempted exempted 10 notyears years years years 10 yests years exempted
Resulation of free for non. free for non.capital profits, resident investors resident investorsdividends
Investment yes yee yes yes yea yes yes no an trade,allowances ttansport,(tax credits) on commercial,Corp. tax sugar andconstruction
Tax credit for yes yes yes yes yes yes yes no on trade,purchasing transportshare l commercial.(personAl Inc. sugar andtax) construction
Exclusion rom yes yes yes yes - If quoted on stock yea yes yes no on trade,taxablIe Income exchange transportof dividends commercialand Interest up sugar andto limit constructinni(personal Inc.
tax)
Capital galns 15% 15% Is% I5% I1 15% 5% 15%lax
Retlstrallon fee halfnoarmal rate nmal rsa normal ratea normal rateL halor-omal rates halt.normal normal rates normal rateson land and rat"sbuildings
Stamp duty exempted exempted not exempted not exempted exempted half exempted on notexemption documents exempted
related totransactions
Sales las (S %)Output exempted; exempted exempted paeantlexespted flecial tax mpted normal rate
pharmaceuticals fully (0% +exempted, others partial 2S)ability to recoup tax onoputs import and somt exporsor sales to EPZ
Iocal Inputsexempted some exemptions some exemptions some exemptions some exemptions ome some some
exemptions exemptions exemptionsPrice controb none ndne none on specific Items on specific Itans none none on specic
Items

Sm Ptaneer ESE DC AD Ioel Offshore Other Sufar
Land use file an ElA file an EIA NA fie an ElIA file an EIA file an EIA NIA land use land useif required required if required; if required; If required; regulated lated toland land land land land Fie an EIA If i deconversion conversion conversion conversion conversion required; land transfer totax If sold tax If sold tax If sold tax If sold tax If sold conversion tax other uses;for non- for non- for non- for non- for non- If sold for landagricultural agricultural agricultural agricultural agricultural non- conversionuses usco useA uses uses agricultural tax If for non.uses agricultural
usesCaplial.Credit rationing and Interest rate favored favored favored favored favored favored neutral neutral if favored(but
Industries andcomplaints manufactures;of disfavored ifshortages) services
Guaani" against yes no no no no no no no nonationalization
-94 -

EPZ P&aqw ESZ DC ADC IIp Offfh&f' Other SaurarLabor
HAge yes yes ye yes yea ye yeyregulations Ydiotedyem[nimum wageswage structure In
public sectorTermination, lax restrictive restrictive rearictive restrdctive restrictive restrictive restrictive very restrictive;severance regulationsregulations
Contract minimal resrictive reArictive restictive restrctive rearictive restrictive restrictive very restrictive;requirements generous attendanceonus favors
absenteeismExpatriates special delays in restrictive restrictive restrictive rerictive restrictive; restrictive restrictive
treatment approval but tax credit(50%) onlMOcm tax
Quantitative none none none none none none none none very restrictive; assurerestrictions employment duringintercrop season if hiredprior 1967; must retainat least Is % of forceemployed duringprevious harvest
.-95-

throughout the economy, many of them undesirable. Mauritius needs to review carefully its
redistributive policies and the means it uses to implement them. Cost-efficient interventions should be
identified and introduced as part of a general overhaul of the economy. Targeted interventions should
be preferred to general programs.
Export processing zones
Linkages with the local economy
Many countries considering the establishment of EPZs are concerned that firms will operate as an
enclave, with little connection to the rest of the economy. They also worry that substantial
infrastructure support will be needed and that public resources will be used to pay for it There is
often concern that firms will leave once special temporary inceotives.expire or move on to other
countries with lower wages. There is a sense that it is difficult to attract foreign investors if they are
required to pay any taxes at all.
In short, governments wish to avoid a situation in which firms source little of their supplies locally,
contribute nothing to tax revenues, impose a public expenditure burden, and benefit the local
economy only to the extent of wages paid at very low rates. Finally, there is the difficulty of dealing
with defaults on loans from local banks to nonresident investors. There is a sorry history in some
African countries of unscrupulous business people using loans from local banks to buy used
equipment at inflated prices from outside partners and then operating under special concessionalprograms, transferring profits abroad by fiddling the books, and ultimately going bankrupt, leaving an
unpursuable trail of bad debts behind.Mauritius's experience with EPZs has been largely positive. The EPZs have undoubtedly made a
positive contribution to the economy and are the single most important reason for the virtual
disappearance of unemployment. EPZ employment has grown from nothing in the late 1960s to
86,123 people in March 1991-about 30 percent of employment in large industrial establishments (see
chapter 2). Value added in the EPZ sector has also grown rapidly, reaching 14 percent of GDP at
factor cost in 1990.
EPZ's are linked to the local economy through their demand for labor and for local goods and
services. Other linkages are formed through sales to the domestic market. Net exports of the EPZ
sector have ranged from less than 20 percent of exports to over 35 percent since 1983. While this
variation would seem to indicate a shift in the structure of the sector, much of it was due to changes
in investment. During periods of rapid growth, investment (and therefore imports of machinery and
equipment) is high, while during slower periods net exports increase relative to total exports.
Value added in the sector as a percentage of exports shows a more steady pattern, declining
between 1983 and 1990 from about 42 percent to 36 percent. Some of this decline reflects an increase
in the share of output sold locally, although this share is still well under 10 percent of total EPZ
-96-

sales. To the extent that value added has actually fallen, it is probably the result of the increased
proportion of investment by Hong Kong firms, whose operations tend to be less vertically integrated
than those of Mauritian investors in the textile and garment sector. But the magnitudes are small.
Putting aside the spurts and hesitations in overall EPZ growth, the data suggest that the underlying
structure of the EPZ sector and its degree of integration with the local economy have remained steadyover the last decade.
Value added as a share of total gross output for the EPZ sector in 1989 was 32 percent, split
roughly in half between wages and operating surplus (Chapter 2). The share of local intermediate
consumption was 20 percent. According to the detailed 1986-86 census, 89 percent of intermediate
consumption was materials and supplies, about a fifth of it local. Outside services accounted for about
4 percent of intermediate consumption. The rest was scattered across electricity, water, fuel,transportation, building rental, and services. Clearly, the greatest opportunity for creating an
appropriate incentive structure to deepen the overall domestic content is in the sourcing of materials
and supplies.
Obstacer to itegfaonThe special certificate programs together with various ad hoc exemptions have resulted in uneven
tax treatment across sectors and even across firms in the same industry. One effect has been to
weaken linkages between EPZ and domestic firms. Firms with EPZ certificates are favorably treated,
while firms that sell too much domestically to qualify for EPZ certificates get only partial relief oftaxes on inputs used for export production, putting them at a disadvantage in international markets.
Similarly, these firms find it difficult to establish themselves as suppliers to EPZ firms because of
competition from duty-free imports of inputs directly into the EPZ. Thus linkages between the EPZfirms and other local industries are weak and difficult to establish.
A number of firms sell inputs to the domestic market as well as to EPZ firms. These firms receive
duty drawbacks on the share of their imported inputs sold to EPZs so that they can in principlecompete on equal footing with foreign firms selling to EPZs on a duty-free basis. The domestic firms
complain, however, that the duty drawback system is administered inefficiently, that it does not apply
to capital goods imports, and that reimbursement can take years. Consequently, few firms take
advantage of the drawback system. Such disincentives for domestic firms help maintain EPZs as an
enclave and prevent their full integration in the domestic economy.
For these reasons, it has been suggested that the tariff system should be rationalized and rates
lowered. This would certainly help. Reductions in the number of exemptions could offset some of the
resulting revenue loss for the government. But to the extent sales and income taxes are raised to help
offset these losses, linkage problems will not be resolved. In essence the problem is simply
transformed from one of compensating local suppliers for tariffs incurred on imported inputs to one of
compensating them for other taxes. More effective drawback or other compensating mechanisms are
-97-

still needed. The main problems involve taxes on imported machinery and equipment and taxes
embodied in local purchases of inputs by non-EPZ suppliers to the EPZ.
A recent publication supported by the Mauritius Chamber of Commerce (Towards an Integradon of
the Development Swaregy in MAuriius) expresses the commonly held view that the export sector
receives generous -anent to the detriment of the rest of the economy. There do appear to be someinequities in the current setup. The system is too complex, with wide variations in overall tax burden
between sectors and even within sectors. These distortions may involve significant efficiency costs.The actual incidence of taxation is fragmented and difficult to assess because of weaknesses inadministration and enforcement and because of the complex exemption system Nonetheless, it seems
likely that instances of excessive burden are concentrated in the nontradable goods sector and among
certain import-substituting industries that, because of anomalies in the tariff system, have low or
negative protection despite a generally high level of import duties. -In general, it seems that in trying to guide economic activity and to respond to pressures from
individual firms, the authorities have opted for exemptions from the tax system rather than refinement
of the system. The result has been a significant erosion of the tax base and an overall lack of
coherence and consistency. As with tariffs, the effect has been to isolate the EPZ sector from the
domestic economy.
Isolation of the sector is also evident in the management of the financial sector primarily through
aggregate credit ceilings and sectoral allocation guidelines that reserve 75 percent of credit for priority
sectors-EPZ firms, sugar industry, hotels, and various import-substituting manuifcturers. The
remaining 25 percent is distributed among nonpriority sectors including traders, stockbrokers,
statutory and parastatal bodies, personal and professional bodies, and others. Thus interest rates and
other loan terms vary across sectors. There has been a wave of financial difficulties in the EPZ sectorrecenty, and bankers seem to believe that risks here are out of line with returns, largely because of
the sector allocation limits.
Emerging pioneer exports
Effects of internal envirnment
A classification of Mauritius's emerging exports according to the intensity of competitive and
protectionist pressures, while admittedly a delicate exercise since it tries to take into account both
existing protection and the threat of protection, offers some interesting insights (see table 5.2). For
instance, Mauritins's exports of cut flowers face markets where there is high competition but low
protection. Other types of cut flowers, however, could face strong protection-as the many U.S.
antidumping cases against cut flowers exported from Latin America and Africa atte, .
The classification also shows that there will be increasing exposure of Mauritius's emerging exports
to foreign protection. What this pattern suggests is an increasing exposure of the Mauritian economy
- 98 -

to foreign policy risks. It does not mean that Mauritius should stick exclusively to its traditionalexports, such as sugar and the current range of apparel products, which in any case also face foreignpolicy risks. It does, however, suggest two other considerations.
Table 5.2 A taxonomy of Mauritian 'other' tportsCompaedons
LOW Igh
paius gon wahesLaw jewehy cut fioWM
tavel bagpsign tays
First, taere is a trade-off with new exports between higher returns and higher risks. New exports
with soinewhat lower returms should not be dismissed if they are associated with low risks. But
because public authorities are not well placed for making accurate risk evaluations-public money is"certain" (at least up to a point)-new export industries should be funded by private capital. This
requirement creates an additional incentive for eliminating the artificial obstacles impeding the
reallocation of capital between traditional and new activities.Second, as the experience of EPZ firms has shown, a key reason for the Mauritius's export
success with apparel has been the combination of Mauritian capital with foreign management skills
that brought to Mauritius the necessary technology and knowledge of the foreign markets. Such links
with foreign firms have also proved to be a good shield against protection-an important consideration
for the pioneer industries.
Effects of domestic policies
A limited base exists in Mauritius in light engineering products, jewelry, plastics, and
electronics. Sunglasses, watch straps, worked diamonds, umbrellas, and watch movements are already
being produced in Mauritius. There is a natural progression from these products to more complex
products such as mechanical equipment, laboratory instruments, electronic toys, and optical devices,but there -*re also some obstacles to this transition in Mauritius. A higher degree of specialization is
required. and inputs tend to be highly processed goods in their own right. Production is more capital
intensive and requires more complex equipment. For "pioneer" (and EPZ) firms, importing these
inputs presents no serious difficulties. But direct imports are not always the most efficient
procurement channel. Smaller, more specialized firms are often not vertically integrated operations
-99-

and may find it more convenient to rely on local distributors to stock a wide range of specialty items
and spares. But current tariff and credit polices work against the establishment of such firms.The new export manufacturing industries that are emerging may have different local-import
patterns in sourcing inputs and different propensities to use local labor than existing ones, which may
affect the linkages and the level of domestic value added in exports. Some insight is provided by an
examination of the labor and local material content of sectors other than textiles and garments, such
as metal products, machinery, watches, optical goods, and jewelry. These sectors, which may be
indicative of the structure of yet to be established light engineering industries, have significantly less
than average labor content. Rubber, plastic, and chemical products have a higher than average labor
content.
According to data from the Central Statistical Office of Mauritius, the share of gross output
attributable to local intermediate consumption is higher than average for food and paper products;
rubber, plastics, and chemical products; metal products and machinery; and "other" products (see
table 2.13 in chapter 2). One problem with these data, however, is that the local-import product split
was derived from detailed intermediate consumption data from the 1985-86 survey of large
establishments, which lumped data for these activities with those for food products, a relatively large
category that almost certainly has a high level of local intermediate consumption. Thus the data are
not especially suitable for judging the likely impact of future developments on the degree of localsourcing. On balance though, there seems to be no strong evidence that diversification into light
engineering products and otber new export manufactring industries is likely to increase the domestic
value added content of exports through increases in locally sourced intermediate consumption.
There may be some other services, however, for which opportunities are greater and which may,
if provided locally, strengthen the competitiveness of exports. Local tool makers, die casters, and
metal and plastic molding and extrusion equipment makers could contribute in a similar fashion andcould be more responsive to local needs. Such services are essential to the development of
competitiveness in the higher valued added product lines needed to support rising real wages in
Mauritius. Backward linkages of this type will contribute to domestic value added and to the
development of the export sector. Banking and professional services such as accounting, marketing,
and financial services will play a similar role. Diversification away from textiles and garments islikely to increase the use of such domestic serices, whose share in intermediate consumption is lowerin textiles and garments than in all other subsectors except watches and docks (see table 2.13 in
chapter 2). -Physical proximity enables local suppliers to better understand client needs and red. 3s the
transportation costs and delays involved in ordering from offshore suppliers. Thus it is L ortant that
the development of such support service and distribution industries not be thwarted by is. propriate
incentive systems. If tax, tariff, credit, or other policies promote direct exporters while - oring or
-100-

even hampering the establishment of necessary support industries, the growth of new export industries
will be stunted.
The human capital requirements of the new export industries are also more demanding than those
of the traditional sugar and basic garment industries, and thus the incentive issues related to labor
markets, training, and human development (chapter 4) are more important. There must be not only
better training of locals, but also a willingness to use foreign experts to introduce new processes and
new product lines. Domestic firms should realize that although the costs of seeking outside expertise
may appear high, the long-run benefits can be substantial. Similarly, regulatory authorities shouldrecognize that work permits must be granted for foreign experts in certain new industries if the
industries are to develop.
One pioneer industry that differs from the others is informatics, which covers service industries
rather than manufacturing. Issues relating directly to customs, tariffs, and the flow of physical productare therefore less critical. Major incentive issues here relate to policies regarding training and human
development; telecommunications; infras cture; and the real exchange rate. Maintaining
competitiveness will be increasingly important as more developing economies enter these markets.Particularly detrimental is the indirect tax on exports through exchange rate overvaluation brought
about by import tariff (Appendix B).
In this industry, there is a natural progression from basic services to more complex and higher
value services. The following list demonstrates the range of activities in increasing order of
complexity:
" Slow turnaround text and data entry
" Fast turnaround text and data entry
a Digitization of engineering and architectural drawings, maps, and the likea Remote office services and telephone services
a Translation services
a Desktop publishing graphics and video
" Software development.
There are two key factors conditioning the potential for these industries: the cost of
telecommunications and competition from other sources, particularly those serving the U.S. market
from the Caribbean.
Mauritian operations in services such as remote office and telephone services (telemarketing,
telephone answering) are not competitive with Caribbean operations because of the telecommnication
charges. Slow-turnaround data entry operations usually involve shipping documents by air, which
makes it difficult for Mauritius to compete in the U.S. market, although Europe offers a potential
market.
Digitization (computer-aided design) was identified in an earlier study as a good prospect for
Mauritius. It is a labor-intensive operation, and wages are lower in Mauritius than in competing
- 101 -

countries, especially wages for skilled and managerial workers. This wage advantage may erode over
time, however, and new scanning technologies are introducing substantial automation to the
digitization process. There may at best be only a temporary window of opportunity here.
Fast turnaround data processing requires electronic transmission both coming and going-
facsimile or audio transmission of incoming data, and digital transmission of computer files on retun.
Again, the telecommunication costs are critical, and transmission to Europe is cheaper than to the
United States.
Mauritius will need to enter the digitization and slow turnaround data entry activities first. The
desktop publishing and fast turnaround market segments will follow. Eventually, cost conditions
permitting, enough experience will be gained to put the more advanced activities within reach. These
are fast growing markets, and wage and telecommunication costs may change significantly in the
future. Software development, which is the most advanced segment of the market, is already well
established in India.
The new industries are relatively clean. There has been concern that poorly planned industrial
development could compromise the tourism industry, which is highly sensitive to enviromental
conditions. Diversification into these new areas presents less of an environmental threat than does
expansion of existing EPZ activities. Likewise, land use and environmental regulations have less
impact on them than on many other activities.
Mauritius should be able to meet the infrastructure requirements of the new industries. The
country's infrastructure is relatively good. Roads are adequate although somewhat congested duringdaily rush hours, especially in Port Louis and around the porL Distances on the island are short,
however, and guods can be moved virtually anywhere within half a day. The airport has a modern
passenger terminal, which was recently expanded to handle the increased tourist traffic. A new road
has been constructed to the airport.
The port facilities are being upgraded. New wharves and sheds are being constructed. Facilities
are adequate for the flow of goods in and out of EPZs, although there have been complaints about
shortages of warehouse space in the port zone. Power outages were a problem in the past, but the
situation has improved. The cyclones that periodically hit the island do, of course, cause
interruptions. Telecommunications used to be a serious problem as well. It used to take as long as a
year to get a line installed, and international calls had to be placed hours in advance. Now there is
international direct dialing, with immediate access and good line quality. Charges are in line with
those in industrial countries.
Sugar
The sugar industry in Mauritius has benefited substantially from the external factors directly
affecting the industry. It has been the largest beneficiary (relative to its size) of all exporting countries
-102-

under the Sugar Protocol of the EC. Some of the transfers from the EC under these preferential priceand quota arrangements are captured by the export tax on sugar.4 In 1991, this amounted to aboutUSS27.64 million (Rs 432 million) and lowered the marginal price to producers by about 11 to 12
percent. The rest of the transfer goes to the sugar industry. From 1985 to 1990 this part (net of the
export tax) amounted to about US$148 million (Rs 2.1 billion) per year-or to USS135-140 million if
the depressing effect of the EC sugar policy on world prices is taken into account.O9
Some part of the transfer that goes initially to the sugar industry is then distributed to other
sectors of the economy through various incentive mechanisms. One is the controlled price and
mandatory sales to the domestic market, which create an implicit transfer from the- industry to local
;onsumers of about US$2.3 million. Another is the set of labor regulations with special
applications to the sugar industry. Direct costs include a mandatory contribution to the National
Pension Scheme of 10.5 percent of wages, 4 percentage points higher than for other industries. This
transfer accounted for roughly US$4.4 million in 1990.51 Indirect costs are imposed through the
constraints on laying off redundant workers and dosing mills. It is estimated that in the absence of
these constraints, the sugar industry could produce at current levels with half the number of
employees (see chapter 4). That would make the implicit tax on the industry US$54.6 million.
These regulations also boost production costs by forcing many factories to operate at inefficiently low
levels of production. Exempting family labor from the labor regulation gives rise to further
inefficiencies by discouraging the consolidation of farms into larger more efficient units.
In addition to the export duty, sugar sales are subject to a series of assessments, which totaledUS$19.3 million (Rs 287 million) in 1990. These assesnents are in principal a type of users fee
intended to support organizations and activities that benefit the sugar industry. In reality, however,
some of these organizations seem to perform functions more social than productive, making at least
48. About 80 percent of Mauriius's sugar production bcoeits from the EC sugar policy (compared to 30 percent for the ahe ACPcountries). Borrell and Duncan (1992) show that the act beatits for Mauritius ar by far the highest among the ACPcountries-4hreetimes larger than the three closest ACP competitors (F-ji. Guyana. and Jamaica). Since Mauritius's GDP per capiais at least 60 percent higher than that of thee chrac other ACP countrics, political problems may arise for Mauritius.
49. This estimate is close to Borrell and Duncan's (1992) csmates of the nt beneissof the EC sugar policy for Mauritims.
50. The amount of the subsidy can be estimased as the differmocc between the domestic price and the free mar world prim, timesthe quantity of domestic sales. At an average world price in the late 1980s of Rs 3.600 a ton (about 11 cents a pound at 1990 prcesand exch=age rare), an average domestic price of about Rs 2.700 a ton, and domestic sales of about 38,000 tons, the subsidyiabout Rs 22.3 million ([3.600 - 2.7001 x 38.000). or USS2.3 million.
5 1. Total production costs in 1991 are estimated at Rs 3,421 million, 50 percent of thems wages (Mauritian Chamber of Agricultue.The Sugar Indumry: Stuaios and Oufook). The diferential between the required payment for the sugar industry and that for theother accors is 4 percent of this amount or Rs 68.42 million ([3.4211[0.5][0.04])or USS4.4 million.
52. The total production costs are estimated as RIs 3.421, with half of that labor cost. If the labor cost could be reduced by half thetotal saving would be Rs 855 million ([3,4211[0.51[0.5D or USS54.6 million.
-103-

some of the assessments more of a tax and transfer than a users fee (Mauritius Chamber of
Agriculture 1991). About USS9 million is estimated as a tax."
The sugar industry is considered a priority sector (Category I) under the credit allocation scheme
and thus is able to borrow at a somewhat reduced rate. The implicit subsidy to the industry from this
program is about US$1.7 million (Rs 26.3 million) a year (chapter 2).
A rough estimate of the net impact on the industry of all the interventions mentioned above (theestimate excludes the indirect tax resulting from import tariffs) can be summarized as follows (in
millions of U.S. dollars).
Transfer to industry from EC Sugar Protocol(net of export tax) 137.55 . (152.9)
Price-controlled sales to local market -2.3"Extra National Pension Schemecontributions -4.4
Effects of labor regulations -54.6Effects of assessments -9.0Credit allocation/subsidy J.L7Net impact 68.9 (84.3)
53. Total sumnnents wre about USS19 million. Part of this is a user charge. It is assumed. somewhat arbitrarily. that about Ialf isa user charge and half a tax.
54. This is the mid-point of the range of USS 135-140 million in nct of tax transfers. To the on the export tax reens isreduced by the new tax policy (climination of the 3.000-ton exemption, and lowering the rae to 9.38 perct), this transfcr willincreasc. A rough atimate based on 1991 cxports of 534.000 tons (table 2.4) would indicate a decrea in the tax revenua fromRs.432 million to Rs.241 million (USS 15.4 million). On this basis, the 'Transfer to Indusatry would be USSIS2.9 million ad the-Nct Impact would be USS 34.3 million.
-104-

Chapter 6. Conclusions and Recommendations
Given limited natural resources and full employment of factors of production, the potential forgrowth lies in redoubling savings efforts, human resource development, and last but not least
increasing the efficiency of the system in the use of existing resources.
Making the best of foreign markets, as in the recent past, is also a path to growth. However,external conditions may not be in the medium to long term as propitious to Mauritius as they were in
the recent past. Consequently, it is important to start today die adaptation to expected changes in theforeign environment. Tlhis is another powerful reason to increase the flexibility and efficiency of the
overall economic system.
However, actions to improve efficiency are not without undesirable equity and fiscal impacts,
considerations at the center of Mauritian concerns. The recommendations of this report take these
considerations into account. Fiscal neutrality should be respected. Income distribution has become
more equal in Mauritius during the last decade, which reduces the justification of some of thegovernment interventions of the 70s. But, more important, the time may have come to improve the
efficiency of redistribution policies. Proper targeting may be consistent with both efficiency and fiscalconsiderations. If not, given the growing scarcity of resources, actions based on equity considerations
will require ever more cost minimization, that is, considerations of efficiency. In addition,
international experience has shown that efficient growth is the most powerful tool for income
redistribution.
The time dimension of actions is also important. The report is focused on a desired outcome and
the recommended measures to reach it. Political and institutional considerations will be greatly
influential in the determination of the path towards the recommended outcome. Given the
characteristics of these variables, the report will not suggest any necessary adjustment time path.
Nevertheless, chapter 7 suggests how reforms could be sequenced to maximize effectiveness andminimize costs. But, this exercise should be taken only as one alternative among several. The final
choice should be influenced by the other considerations mentioned here some of which are outside thescope of the report.
Finally, there are no scientific or optimum size of taxes (subsidies). Only orders of magnitude will
be proposed here based on the final objective, and considerations based on the actual working of theMauritian economy. The evolution of the economy will require successive revisions of the proposals
made in this chapter.
- 105 -

Implications of the external environment for economic policy
Sugar
Despite significant diversification of exports, sugar remains Mauritius's most important export, in
large part because of its preferential treaunent in the EC market. For a number of reasons, this
arrangement is unlikely to last in the long run, at least not in its current form. Regardless of what
happens at the Uruguay Round of the GA'r negotiations, the preference accorded Mauritian sugar is
likely to diminish (chapter 2). Adjustments, probably including mechanization, further diversification
out of sugar, substantial contraction of sugar production, and certainly including transfer of significant
productive resources from the sector, will be needed" Thus Mauritius ought to direct its policies
for the sector toward easing this adjustmer, by increasing the efficiency of sugar production and the
flexibility of factor markets. This amplifes the urgency of the factor market reforms discussed below.
Export proessing zones
A high degree of economic flexibility will be needed if Mauritius is to successfully respond to the
significant changes in its traditional export markets as OECD countries' explicit protection declines.
The relative preferences granted to Mauritius will be eroded, and the emergence of new competitors
will be favored by a more level playing field. Furthermore, the risks associated with a likely increasein ex post protection by the OECD countries through the use oi safeguard, anti-dumping and and-
subsidy procedures could be high for Mauritius if its economy continues to run on the basis of
fragmented labor markets and segmented EPZ and non-EPZ export sectors.Greater flexibility and less fragmentation will work t reinforce each other. Greater flexibility
means that it will be easier for workers and capital to shift from EPZ to non-EPZ activities-labor
and capital markets will be less fragmented. Greater flexibility reduces the risks of being hurt byincreasing pressures from ex post protection.
Other exports
Exposure to foreign protection is greater for many of the emerging exports than for traditional
exports, which increases the economy's sensitivity to foreign policy risks. But there is also a trade-off
between higher returns and higher risks with new exports. Links with foreign firms should be
encouraged-such links have been a key to the success of the Mauritian apparel industr-. Links in the
form of foreign investment and processing traffic have proved to be a good shield against protection,
an especially important consideration for the pioneer industries.
55. Altnative nue of land have becn analyzed in World Bank (1991) Epanding Horims.
-106-

Regional agMementr
Trade with the Preferential Trade Area for Eastern and Southern African States (PTA) and the
Indian Ocean Commission (IOC) represents barely 1 percent of Mauritius's exports. Negotiations on
lowering tariff barriers within the PTA have long been bogged down and the goal for effective
liberalization has been postponed to the year 2000. For a long time to come, trade with the small
economies that constitute these two trade groups is likely to play no more than a marginal role in the
development of Mauritius's exports and imports. And, since gains from trade depend on differences
between trade partners, Mauritius will benefit more from trade with the EC and the newly
industrialized economies of Asia than with the PTA and IOC zones.
If scale economies could be attained in the PrA behind an external tariff low enough to expand
appropriate exports to worldwide dimensions, the integration efforts could be worthwhile. However,with external tariffs as high as they are today, the joint exploitation of scale economies within the
PTA or IOC zones would be limited and much less profitable than direct trade with the EC or Asian
economies. Consequently, integration efforts based on trade policy should be secondary to regionally
coordinated measures to facilitate the flow of capital and labor. These measures-particularly
encouragement of Mauritian investment in neighboring countries and use of unskilled labor from these
countries in Mauritius-would be mutually beneficial in the short run and could be a source oftechnology transfer among developing countries in the longer run. Attention should also be focused
on regional initiatives to address common problems--the Regional Sugar Cane Training Center forAfrica is one potentially useful example.
Goods and services markets and relative prices
To reduce the need for a wide array of special exemption programs and to foster integration of
EPZ and non-EPZ sectors, reforms should move to reduce tariffs, rely more on sales and incometaxes, and eliminate exemptions. This would reduce distortions and set the stage for establishment in
the medium term of a countrywide free port that would effectively eliminate all tariff-related linkageissues. Reform measures would need to be compatible with a low fiscal deficit, reduction in the real
exchange rate, and enhanced international competitiveness
Trade policy
Imporrable. Variability in import taxes is high (a coefficient of variation across import categories
of more than 1.4). This high variability-across imports and in exemptions across sectors, certificate
categories, and firms within sectors-creates large distortions in the allocation of resources among
import-substitute sectors. Effective protection from the tariff regime and exemptions is high and also
highly dispersed across sectors (Chapter 3), creating a high and-export bias that can be only partially
offset by the various compensatory measures.
-107-

Several developing countries have reduced and harmonized their tariffs. The opening up of their
economies has resulted in export expansion for many of them. In Latin America and East Asia, tariffs
have been reduced to a maximum of 20 percent or less in many coumries, and other countries are
moving in that direction. To expand exports and remain competitive in international markets,Mauritius needs to harmonize and reduce its tariffs as well.
Authorities are aware of many of the analyzed shortcomings of import taxes. They have been
undertaking a rationalization and harmonization exercise with the collaboration of the private sector to
correct anomalies and simplify exemption. However, further measures may be required to reach a
desirable goal.
Mauritius's import tax revenues in 1991 totaled Rs 4,030 million, a high proportion of government
revenues. An essential part of import tax reform should be to drop exemptions except for inputs used
in the production of goods and services for export. In addition, a low import tax could be imposed on
the 22.5 percent of imports not currently taxed. Both these measures would facilitate the reduction of
high rates without exacerbating the fiscal deficit.
Several policy changes are suggested to carry out the tariff reform. First, the three import
taxes--the import levy, the fiscal duty, and the customs duty-should be consolidated. The averagerate of revenue collection from import taxes could be held at its current level of 15 to 17 percent in
the short run (implying an import tax rate of about 25-27 percent since inputs used in export
production would be exempt) to keep total revenue from import taxation unchanged.' In the slightly
longer term, all exemptions should be removed (except for inputs used for exports), zero rates shouA
be raised to the average rate, and all rates should be made uniform. Even basic foods should have the
same tariff rate as other products. To meet distributive objectives, the government could use targeted
food programs rather than trade policies that lower food prices for everyone. There would then be
two tariff rates: a zero rate for imported inputs used in export production, and a positive tariff rate
(around 25 percent) that brings the overall average rate to 15 percent. (The sequencing of these
reforms is discussed in chapter 7.) This 25 percent rate could then be reduced to say, 10 percent in
the longer term in coordination with an overall tax and expenditure reform that would not exacerbate
the budget deficit (more details below in the section on Fiscal Policy in this chapter and in chapter 7.)
The new system will be simpler and less discretionary, which should improve its administration.
Harmonization of tariffs will remove the bias against certain import-substitution activities, which
currently have a relatively low rate of protection. Reducing and harmonizing the effective rate of
protection will remove the enormous distortions in incentives for various import-substitution activities
(effective protection rates for 1990 ranged from 27 percent for leather products to 89 percent for food
and well over 200 percent for furniture and electrical machinery).
56. The proposed average rare implies sligbdy lower revenues from imporr taxes however. imiporm increase with GDP.Consequently, by 1992, tbe proposed race, applied on a higher value of imporm. will achieve the same revenue as in 1990.
- 108 -

Even though export production benefits from import duty exemptions or drawbacks, exportables(and nontradables) are taxed relative to importables. Import taxes raise the price and effectiveprotection of import substitutes and draw resources from exportables (and nontradables) toimportables. This indirect tax on all exports is estimated to be on the order of 0.7 to 0.9 of theaverage level of tariffs. Depending on how the naveragew level is estimated, the indirect tax appears
to be at least 30 percent (see appendix B for more detail). Tariff reduction and harmonization will
also improve the linkages between EPZ firms and domestic firms by favoring the development ofdomestic industries for subassembly and of wholesale importer-distributors for handling inputs for
export industries. The strongest recommendation of this report, therefore, is to reduce the average
tariff to a very low level over the long run, say to 10 percent.
Finally, tariffs should not confer preferences on products according to origin. Some goodsoriginating in the United States pay lower tariffs than similar goods originating in Japan. Customs
duties apply only to imports from nonpreferential countries-generally markets other than the EC, the
United Kingdom, and the United States. Consolidating the three types of import taxes would make it
easier to eliminate preferences since the customs duty would officially isappear and could no longer
be used as an instrument for preferential treatment.
Similarly, if the government wishes to tax the consumption of luxuries at a higher rate than other
goods, it should do so through an excise tax on domestic and imported production alike, not through
higher tariff on imported luxury goods.Exportables. Preferential treatment of EPZr has been very successful in the past, but the resultant
negative effective protection of non-EPZ exports is likely to have a detrimental effect on export
diversification- And all exports-and nontradable activities-suffer from the high rate of effective
protection of import-substituting activities. A drastic reduction in the preferential treament of
protected sectors and more uniform treatment across all sectors is recommended to stimulate exportdiversification and growth. For these policy changes to achieve their intended effects on resource
allocation, however, requires that resources be allowed to move freely across sectors in response to
the new incentive structure.
Administration of the duty-drawback scheme needs to be substantially improved so that domestic
firms have an incentive to do business with EPZ firms, and vice versa. Such reform would enable
domestic firms to compete with foreign suppliers and to take advantage of the growth in EPZ activity.
Small and part-time (non-EPZ) exporters would benefit as well. (See also the discussion below on the
sales tax.) Re:orm of the drawback system and selective reduction of tariffs would allow fuller
integration ( local firms with EPZs. There are practical limits, however, to allowing the free flow of
goods in and out of EPZs as long as relatively high tariff rates and other border taxes are in ph e.
Establishment of a countrywide free port is the long-run answer, but alternative revenue-generating
systems must first be strengthened.
-109-

Exchange rate. Another area where reforms should be pursued immediately is exchangeregulations. Through formal or informal means, exporting firms are forced to surrender foreign
exchange earnings, then re-purchase exchange when they need it to import inputs. This acts as a tax,especially since fees to buy exchange are relatively high. Exporters should be allowed to keep
deposits of foreign currency in foreign or domestic banks while local banks should be able to offer all
foreign exchange services to exporters. Retention of their foreign exchange earnings would reduce
exporters' costs for importing needed inputs and increase their flexibility.
The level and variability of the real exchange rate will keep playing an important role in the
competitivity of Mauritian exports. Although in the medium run only real variables impact the real
exchange rate, monetary and fiscal managements could have some influence in its short term
behavior. Following a prudent and stable monetary policy while keeping at bay even moderate fiscaldeficit, as has been the case recently, will be the best insurance against large and undesirable
fluctuations in the real exciuge rate.
On the other hand, some developments could favor a rise in the RER and then, a greater opening
of the Mauritian economy: the reduction of obstacles to trade suggested in th;. Report, the expected
fall in terms of trade to the extent that the EC sugar price is reduced, or the elimination of fiscal
deficit. However, the actual trend in domestic expenditures may partly or fully compensate the
expected rise in RER. Careful macro management is consequently strongly recommended.
FTcal policy
Sales and value added rares. Recommendations for changes in the sales tax need to take into
account the tax's effect on production incentives and government revenue. An increase in sales tax
revenue is needed to reduce the burden on tariffs, and more uniform treatment across sectors is
needed to reduce production distortions. Simply increasing the sales tax rate without making treatment
uniform will exacerbate the distortions created by the existing system.
In trying to guide economic activity and to respond to pressures from individual firms, the
authorities have introduced exemptions from sales taxes rather than refining the system, oringing
about significant erosion of the tax base. Since the tax rate is low as well, sales tax revenue is wellbelow its potential, forcing too much reliance on other indirect taxes. Customs dcies constitute about
50 percent of the total government tax revenue, sales taxes only about 10 percent
Increasing the sales tax rate and widening its coverage would boost revenue from the sales tax and
compensate for revenue losses from lowering trade taxes. The sales tax rate of 5 per,- ent is low by
international standards. Morocco's value added tax, for example, varies from 7 perc to 19 percent
If Mauritius raised its sales tax rate to 10 percent, sales tax revenue on goods would L -ea. a by Rs
680 million to Rs 769 million," equivalent to around 17 percent of import tax revenue. Exemptions
57. The secand agam (769) is a missn esimas the frs (680) is from Mauritius: Expandint Horizons, for 1989.
-110-

need to be cut way back, and services need to be included in the tax (except for hotels andrestaurants, which are already taxed). Overall, however, although extension of the sales tax baseshould be explored, it should not be expected to generate significant additional revenue without an
increase in rates. Retail and distribution services already bear some of the burden of the sales taxbecause of tax shifting, while taxes on professional services are typically hard to capture. Even with arate increase, sales tax revenue will not rise enough to take the pressure off customs duties. More
comprehensive tax reform would be needed.
Shifting some of the tax burden from trade taxes to domestic taxes will not by itself eliminate
distortions. Other taxes are also distortionary (though not as inefficient as trade taxes); they simply
have not been exploited as heavily for revenue purposes as have trade taxes. Nor will such switching
do anything about the distortions caused by the malfunctioning drawback system and the exclusion
from the rebate system of capital purchases, local resales of capital goods, and domestic purchases.Ultimately, the solution may be to switch from a sales tax to a value added tax (VAT), a more
generalized sales tax that does not distort the choice between foreign and domestic goods and between
tradables and nontradables.
In deciding whether to increase the sales tax or move to a full value added tax, several
considerations are in order.
" A full value added system is more complicated and costly to administer than a sales tax. Theaccounting skills required and the paper burden may be beyond the capacity of some businesses,
especially smaller ones.* Under the current system, the whole burden of the sales tax falls on manufacturing. The broader
base of the value added tax would allow lower rates and would be more equitable and less
distorting.
" The current sales tax system has the same type (though not degree) of aniexport bias and creates
some of the same obstacles to integrating EPZs with the domestic economy as the high-tariff
regime since non-EPZ fir.z that export or sell to exporters are unable to fully recapture sales taxes
paid on inputs, including capital goods. A value added tax system would have the same problems
unless administration were improved.
The problem of incomplete recapture of sales taxes is not that difficult to overcome. The tax
authorities must link rebates of sales tax at the time of export to the corresponding imports used in the
production of the exports. Making this connection requires some knowledge of the production process
(for example, how many yards of cloth per shirt). The need for precision is not criti:al in the case of
firms producing only for export. But typically the firm has local sales as well (firms that serve exportmarkets exclusively have EPZ status and the issue does not arise). The tax authorities must then
decide what share of the sales tax on inputs can be attributed to export products, since only that
portion can be rebated. Sales taxes paid on locally purchased inputs could be handled the same way as
- 111 -

taxes paid on imported inputs. Sales tax documentation generated on local purchases can be used to
support sales tax rebates for local purchases just as similar documentation is used for imported inputs.
The issue of recapturing the sales tax on imported machinery is slightly more complicated. Adepreciation rate must be established for the machinery, and the sales tax must then be rebated in line
with depreciation and in proportion to the exported share of production. In addition, there must be
some way of handling the resale of capital equipment in the local market. Both these issues could be
accommodated, although somewhat imperfectly. Depreciation schedules are already used for income
tax purposes, and domestic salelexport proportions are already used in the sales tax calculation.
Resales of capital equipment are more complicated. Asset dispositions must be recorded in a firm's
balance sheets, but these are usually on an ammal basis whereas sales tax returns are required
monthly. Moreover, the resale price would not typically match the depreciated value. Some sort of
simplifying approximation would have to be devised to keep administration and compliance costs
reasonable. The basic point here is that for non-EPZ exporters, the recapture of sales taxes, tariffs, orvalue added taxes paid on local purchases of material inputs could be made relatively simple.
The assertion above that a value added tax might be superior to a sales tax because it is broader
and fairer needs some qualification. Consider a very simple case of only one good of which 50
percent of the value added is in manufactring and 50 percent in distribution. A 10 percent Mauritian-
style sales tax would yield the same revenue as a 5 percent value added tax or retail sales tax.
Manufacturers, distributors, and consumers would share the true burden of the tax in a way that
reflects underlying elasticities of supply and demand but is independent of the type of tax chosen.
If there are several different goods, however. and if the percentages of manufacturing-and distribution
value added vary, moving from a sales tax to a value added tax (with the rate set so as to generate
equal revenue) will favor goods with relatively high manufacturing value added and low distribution
costs, since distribution costs escape taxation under the sales tax regime.
Distribution is not the only activity in the service sector. But a number of other services such as
hotels and restaurants are already covered by special taxes, which weakens the equity argument for a
shift from a sales tax to a value added tax. Many other services such as hairdressers, repair shops,and the like are very small. As a practical matter, a value added tax would probably have to have
some minimum threshold that would exclude these groups. Professionals such as lawyers, doctors.
and accountants would be included. But they could also be brought under an extended sales tax
system.
All these considerations argue for first improving administration of the sales tax, to allow
exemptions or rebates for exporters (including non-EPZ) and their suppliers, and expanding coverage.
If necessary to offset tariff reductions, rates could be raised as well. These actions would prepare the
53. This is noc aricdy tu in tha the padkge of scrvices embodied in a good (the physical vaess distrbutional) may shi BlighWydepcnding on the uatwe of the ax. But this is a second-order considcration.
- 112 -

ground for a value added tax in the long run. Also, eliminating bureaucratic delays should beconsidered a main priority. When drawback and tax rebate schemes work poorly, producers bypass
the administrative headaches by passing on the additional costs to consumers, reducing their profits or
bypassing export opportunities.
Hotel and restaurant ra Recommendations on the hotel and restaurant tax are linked to the issues
raised above about sales and value added taxes. If the government's objective is to raise revenue and
to control negative externalities, the special regulations affecting hotels should be eliminated, in line
with the overall simplification of incentives; the hotel and restaurant sales tax should be held at 15
percent; and a value added tax should be applied in the long run, replacing the sales tax. The value
added rate should be the top rate, if the rates are differentiated.Income ra The main issue with respect to the income tax is to avoid favoring EPZs over other
types of firms, given the changing conditions in the Mauritian economy (full employment, need for
export diversification). A uniform rate of about 15 percent should be applied across all sectors andtypes of firms, aligned with the lifetime preferential rate received by development certificate firms
when the law was changed in July 1985.
In fact, in other developing countries successful in attracting foreign investment, such as Chile and
Mexico, the rate applied to the latter is higher than the one applied to the domestic firms. This
discrimination is usually justified by the following argument lower income tax rates are preferred to
higher ones to stimulate investment. As a consequence, rates are set at levels lower than those
prevailing in industrialized economies. But, to the extent that double-taxation agreements are in
existence between the less developed country and the industrialized ones, a transfer of real resources
may take place from the former to the latter. The response usually has been to set or to set a tax rate
more similar to the one of the country of origin of foreign investment. In the case of Mauritius,
however, given (1) the "footloose* nature of EPZ firms, 2) the fact that double taxation agreements
have been signed by Mauritius with most of the countries of origin of foreign investment, and (3) thelikely competition in terms of low tax rates of several developing countries, the most desirable tax
policy would require retaining the low rate for EPZ and adjusting the other existing rates to that
level, or at least to a level not too different from the 15 percent.A tax system that is efficient in theory from a resource allocation point of view will not be so in
practice if tax administration is inadequate. The income tax collection rate is quite low in Mauritius
(about 18 percent of total tax revenue, compared with 50 percent from international transactions) not
because of low rates but because of widespread tax evasion. Tax administration at the Income Tax
Department is being improved; an Action Plan is being implemented, which will, it is hoped, improve
collection rates.
Other countries with similar levels of per capita income derive a higher share of fiscal revenues
from income taxes than does Mauritius (table 6.1). That does not mean, however, that Mauritius
needs to raise income tax rates. Income tax revenue seems to follow a Laffer curve: as the tax rate
- 113 -

falls, there is more incentive to work and less incentive to cheat, so tax revenues rise. Between fiscal
1984 and fiscal 1986, income tax revenue in Mauritius declined steadily both in level and as a share
of total tax revenue; after fiscal 1986, when the tax rate was reduced, both the level and the share of
income tax revenue increased.9 Another reason not to increase income tax rates is to avoid
discouraging foreign investment. Many foreign firms are attracted to Mauritius precisely because the
corporate tax rate is not too high. Rather than level, the problem is coverage. Employees, especially
public employees, bear the largest burden of the income tax since they cannot escape it, while others
can hide behind tax breaks or fail to register. Table 6.2 shows that most of the personal income taxrevenue in Mauritius comes from employees. What this argues for is not higher rates, but better
enforcement, particularly for those groups with high evasion rates currently.
Table 6.1 Compositon of fisca revenues, Mauieds and ohe selected countries, 1972 and 1990
Tae onTas am h5come Domeue arw aemsadomn
proiwr and Scia eutly on goodr mnd =nde and Nonrareapftat ff in consibudem ay Mraddns mhza an om1972 1990 1972 1990 1972 1990 1972 1990 1972 1990 192 1990
Cost- Rica 18.0 9.8 13.9 28.3 37.7 27.4 13.9 23.0 1.6 -3.S 9.3 14.4Chile 14.3 23.3 23.6 6.0 28.6 37.1 14.3 9.3 0.0 -0.2 14.3 24.1Botswana 20.1 38.6 0.0 0.0 1.4 1.5 47.7 13.2 0.4 0.1 30.3 46.6Maurinis 22.7 13.9 0.0 4.1 23.3 20.9 40.2 46.4 5.5 6.1 3.2 8.7Malaysia 25.2 30.5 0.1 0.8 24.2 24.3 27.9 16.7 1.4 2.5 21.2 25.2
Source Word Development Report 1992.,
Table 6.2 Personal income payable by employees and self-employed(Its. Million)
Mabar 1990/91 mber 191/92
Employees 59.281 - 406.2 57,167 425.4Self-employed 5.767 101.0 5,405 103.6Total 65.048 507.2 62,572 529.0Total personal income tax a.. 615.0 o.a. a.a.
n.a. Not available.Source: Minstry of Finance
59. Total collections ee firom Rs 355 million in 1935/86 to Rs 519 million in 1986/87 and mchad Rs 1.465 million in 199091.These figures represented 10. 12. and 16 perceu of total tax revenue in thoaw ycars.
-114-

Administraive issues. Administrative issues also have a bearing on revenue collection,
particularly for direct taxes. Administrative shortcomings need to be addressed before instituting anyshift in emphasis between various taxes.
Import taxes and sales taxes are relatively well administered: those who should be paying
generally are. There is little scope for increasing revenues through these taxes without raising rates or
eliminating exemptions. The sales tax yield is not falling despite exemptions (especially textiles),reflecting improved tax administration and better verification of registrations. Although tax evasion is
not extensive for the sales tax, especially compared to the income tax, the registration problem may
be important in the sense that some firms use frontmen to import for them without registering for the
sales tax themselves.
Not only should administration of the income tax be strengthenad, but the tax collection base
should be changed to current year incom. The intention of government to introduce the Pay as youEarn (PAYE) system for salary and wage earners and a current payment system (CPS) for the self-
employed has been announced with this goal. Reducing deductions should also be considered, and the
personal and corporate income taxes should be cordinated to eliminate double taxation of dividends.
One way to do this would be to make dividend income fully deductible on personal income tax
returns. Finally, do-ble taxation conventions with other countries need to be explored, especially with
countries that invest heavily in Mauritius, such as Singapore and Taiwan.
Sugar
A multitude of interventions affect the sugar industry, all of them intended to support the
industry and to ensure that the rents from preferential sales to the EC market are distributed
throughout Mauritius.6 However, the effect of these additional costs and regulations is not only to
redistribute income but also to greatly reduce the efficiency of the industry and raise the cost of
producing sugar. The higher costs are borne by the entire economy as well, since the redundant labor
and other factors currently tied up in producing sugar could instead be producing other goods and
services.
These regulations reduce the economy's ability to respond flexibly to shocks, an especially
serious problem if preferential treatment under the Sugar Protocol is reduced or eliminated, as seems
likely. Sugar output will need to contract, and some of the factors now devoted to sugar production
will need to be released for other uses. How severe the contraction and how painful the adjustment
depends, in part, on the efficiency of Mauritian production relative to its competitors in world
markets. If Mauritius's marginal production costs are relatively low, the contraction could be modest,
6i. EC officials have oftca rnaked that the policy is latended to aid the development of ACP countries. (See, for example, Courdes Compres. Journal Officiel des Communitds Europiennes, no. C2901. p. 32).
-115-

with only the least efficient producers dosing down. But if the production costs of much of
Mauritius's marginal (highest cost) production are above competitors' marginal costs, the contraction
will be severe.
Table 6.3 Esimat of production sb of sugar, 1974, 1981, 1989
2Ypr Can Indc
of (U.S. camu per lb.) (Waufdus - 1W)COrsy age*W 1974 1981 199 1974 19m1 . 1919
ECb 16.2 19 26.1 162 132141Belgium white 14.5 18 21.3 145 129 115
France white 14.0 13 20.3 140 93 109West Germany white 16.0 18 25.8 160 129 139
Italy whire 15.0 22 43.9 150 157 237Nederands white 15.5 22 21.7 155 157 117
United Kingdom refsined 21.9 18 23.S 219 129 127United States refined 183 22 20.7 135 157 112Ausralia raw 16.3 14 16.4 163 100 89Mauritins white 10.0 14 18.5 100 100 100
Argpsina white 10.1 18 18.9 101 129 102Barbados saw 17.6 22 37.4 176 157 202Belize raw 19.8 22 25.5 193 157 138Brazil crystals 10.1 10 13.0 101 71 97Cuba n.a. n.m. 17.4 94Dominican Rep. raw 12.9 10 19.6 129 71 106Guyana white 13.4 18 26.2 134 129 141
Jamaica raw 19.5 14 23.0 195 100 124
Trinidad & Tab. raw 19.5 22 30.1 195 157 162
[vory Coast n.. 22 27.2 n.s. 157 147
Kenya white 8.0 18 16.3 80 129 88
Malai .A. 18 13.5 n.m. 129 73
South Africa whir 10.3 14 16.1 103 100 87Sudan n.a. 22 18.6 n.m. 157 100Swaziland n.m. 10 15.4 R.. 71 33
Zimbabwe n.. 10 13.2 n.. 71 71
Fiji raw 10.7 10 16.3 107 71 91India white 11.5 14 18.3 115 100 102
Philippines raw 12.5 10 20.3 125 71 109
Taiwan .R 14 31.0 R.m. 100 167Thailand refined 12.1 14 16.0 181 100 86
All countries (average) n.m. a.A. S.a. 146 117 117
n.. Noc available.a. Raw sugar costs for 1974 have been adjusted by using coeftic 4M for 1939 available in the Landell Millsstudy (on a country basis).b. For the EC. unwuighted averages of the EC Member States mentioned.
Source Cornell. Rice and Suar (for 1974), ISO (for 191) quoted in Abbott (1990).and l andell Mills Commodities Studies (1991) (for 1989).
- 116 -

Mauritius seems to have lost ground in competitiveness in sugar production over the last decade,according to a comparison of estimated average production costs for major world producers (see table
6.3). Although average costs may not be indicative of marginal costs, these figures are telling. In1974, average production costs in Mauritius were one-third below the world average. In the 1980s,
they were only 17 pexcent lower. Some estimates even suggest that the most efficient of EC sugar
beet producers are as efficient as Mauritian sugarcane producers. The variance in production costs
across major producers has also declined over time, pointing toward increasing worldwide
competition in the sugar market. What all this implies for Mauritius is that liberalization of world
sugar markets is likely to require a very costly contraction of the domestic sugar industry, unless
domestic policies are changed to allow the industry to become more efficient and respond more
flexibly to changes.
What Mauritius needs is a sugar policy that takes advantage of the EC transfers and spreads their
benefits broadly throughout the economy, maximizes the efficiency and profitability of the industry,
frees resources from the sector for other uses, and makes the economy more flexible. The elements of
this policy need to be considered as a package rather than individually. Some of the details require
further study, but the outlines are clear.
The special regulations affecting factor use in the sugar industry should be phased out. The labor
rules applied to the industry impose heavy costs and create large inefficiencies (chapter 4). De facto
prohibitions against closing factories have created a productive structure of numerous, uneconomicallysmall mills, some with excess capacity (Mauritian Chamber of Agriculture). Land use policies imply
some costs and some benefits for the sector, while credit policies provide a slight subsidy. Many
policies work at cross-purposes. For example, the credit subsidy artificially reduces capital costs
* encouraging the purchase of labor-saving machinery, while labor regulations prohibit the shedding of
redundant labor. In all cases, this tangle of rules severely impedes the industry's ability to become
more efficient and flexible. Labor reforms, while critical, would need to be carefully coordinated with
auxiliary human development measures to provide retraining and job placement assistance for released
workers.
Price controls and mandatory domestic sales requirements should be abolished. Eliminating this
untargeted subsidy would improve the industry's profitability and increase the marginal production
incentive, both important objectives in the context of reform of the export tax. The exemption of the
first 3,000 tons of production on the export tax has been recently eliminated. This change, if
accompanied by abolition of the requirement for prior approval of factory closures, would encourage
the conscadation of small, uneconomic producers. Small growers might need to be temporarily
compensated, for example, to make up for increased transport costs as small, uneconomic mills shut
down.
-117-

An improvement in the allocative efficiency within the sugar sector and in the use of land require
a revision of the system for determining producer prices. The current average price system causes too
many productive resources to be diverted from other uses. The problem could be resolved through an
internal quota system.
One option would be to distribute internal quotas to current domestic producers free of charge.
Each quota would entitle holders to receive the EC preferential price (minus the export tax and oder
deductions) for a part of their production. The quantity would be determined each year as the volume
(in tons) of the EC quota for the year times each producer's share in total production of some baseyear (or years). In effect, the internal quota would be an entitlement to sell a prorated share of the
current EC quota at the EC preferential price. For any exports over the internal quota, producers
would receive the free market world price. Producers would decide what quantities they would market
domestically, either directly or through an agent of their choice. Quotas wcild be transferable, which
would help promote the establishment of efficiently sized production units and not place obstacles inthe way of shuting down inefficient production units. Under this system, producers would no longer
have an incentive to expand production to the point where the marginal cost exceeds the true marginal
value to Mauritius (the world export price).
In the Long run, the optimal solution would be that internal quotas could be auctioned by the
government. The auction would capture the rents from the preferential treatment, so there would be
no need for an export tax." This option has the advantage of avoiding the difficulty of estimating
an mappropriate" level of export tax. It would also recognize that the transfer derived from the
preferential treatment to Mauritius is made to the country rather to specific producers.a Further, the
rents from the EC policy obtained through the quota auction could be distributed in more direct ways
with fewer undesirable side-effects. Proceeds could be used to finance retraining for released workersand to offset reductions in import tariff revenues, thereby avoiding the need to increase other more
distortionary taxes.
The experience of other countries could also have useful lessons for Mauritian sugar policy. The
experience of Barbados is particularly telling and is succinctly described in Box 6.1
61. This option would be equivalent, fron the points of view of cfrciency and rodisritnvive impacts, to an xpor -ax equal to thedifference betwen. the price for EC quota sugar and some long-run average world price (or internal producer pri nflcieetosupport enough production to fill the EC quota). Then. the recent lowering of the xport tax, without scting a quc *ystm, tendsto move sugar production and land allocation away from the desirable solution.
62. High prices of sugar in Europe wre basically set up to stimulate sugar production to reach self-suffciency. As -en in Chapter3, the EC could have reached self-sufficincy at a very low cost by buying cheap in the intenational market rather a -us by paying ahigh price to eficient producers like Mauritius and other African countries. But the EC chose to pay these ACP proancersa highprice as a farm of aid.
- 118 -

Box 6.1 'Ie sugar sector in a rapidly grwing econoäy lessos from Barbados
Although each coury is in mny waya unique, with its own diatinctive hiunmy end cultural characteiticu. there is mach tha each can ~ern byobaerving the hitory of similar countries in å•milar circumIancen. la particular, there may be uom~ lemone-both poitive and negativ-a Maunritican take from the hiatory of the eäger mtor of Barban~ a nall inInl in the cern Caribban Sa.
The Barbadian ecanomy of today is not e~r-.ial-y imiar to that of Maritia. The couatry ha a GNP per capita of about U^56,900 (1989), placinit in the low rank of the high-i - countries. Thec-nnmy is domina-d by the urvice setor. which 9eenma for about 76 per~t of val. addedand 70 percnt of employment. The avice ecor is baisd largely on touriam. 1Ie etgar u~ctor mkes a very minr contributio-oanly about 1.5percens-to GDP.
But if oam look beck 20 to 30 years. the Barbanli -- mnmay of that time wa in wme respect ach mor uimilmr to that of taya Muitiua. GNper capita in the ady 1970a wan around rS5tr= 0 (i 1989 SUS), clom to iti nut evel in Mamritius. Though the cconomy wm bemi~ mdiverifled than in the pas it eil nded heavily on the nagar u~cto. which wc~ond for en average of 12 percent of GDP and 62 p=~et of ¯
merchandias xpta bet~n 1966 and I72. As of 196&, aout 28 penC of the Jabor fore wm in ägicultufe (ur astyuger>, thanigh »b~ hd d ad w=to 16.5 pereene by 1970. The ~tory of how Barbado marched ~long the pah of rapid development-nd part~cntady the story of the äuger mector-imhighly ralevant to cunt policy-maki in Mfuritiua, since a 8nher of imem Maitima is now facing wer faced byBarbdos in the pEE.
From colonial times, Barbados was alwaym a Ugar.growing iland. The din~a and uil cover made it mome suitable for ~ugar than for mat ochercrop. ln the period 1950-67. ager covered an averag of19.3 thonmand hectares, around 73 percent of the ilanda arable land. Suger growing was aprofitabl en~erprise with relatively buoyan intennanul markets and low labor coate far harveating and procesig. Wage rt~s w~re qei important tthe indeaty. aince they wcunt for avound half of total proa cost . The govermnmen of Barbadoe attemped to ere that the walth from theaugar i~htery was w ideiyib~al--td I did thia in everal way. Ona was by impoaing a variety of dv~i te~mo the indusy begi~ing in the lata1940a. which wre paid into everal fund, ink.ing the Sugr industry Price SahTktinm Fund, the Sugar Indusry Capital and R-hehahiinn Pund, tSugar hndusry Labor Welfar, Faind and the Sugar Workr Provident Fund. 'Ib Grat tv o of theas wer= ia principal to be made availai ta thein~dtry in timca of ead, hus they ded up bing uewd by da public trmaury. In addition. thure wa a significaat expot levy in timme of highinternational prices, m in 1975-1976. The goverument aleo f~rced the tanger ind~ntry to act au a gurmntor of employment, though tho Suger WorMinimum Wage and Guaranteed Employment Act. Th goverment alao aome~imc intervenod in the labor negotiations to forea inutry to pay higwages, as in 1981. Land use plnning end zaning was uaed as ma instrumentof egricutnral policy, mainly to prevent the male of ugar land for ote
The industry ma.nsain~ a mor or le= atable positio ntil the mid-1960s. la that period. ecanomic findam~enral in Barbados bgan to change. Thmoat important chage wa= the rapid apanmin of tourism. Total tous day. Tpent in Barbado in 1966 ~ere 566,000 per y"ar. im 10 ya^, this anm squadrupled, and by 1989 it reached 3.62 miflai Tourist kendimre from a bs= of USS40.4 eillia in 1970 (the carlist year data in aviäe grrto US36.9 milion I 1980, and US 527.8 milliu in 1989.
An the ector' profltabilitywa= erded, i changd from a nt supplier of fna to the public (via the ltvie and taxes) to a zig ficant drain. Thi4ndtry bega to borrow large ume in 1977 immedimtely folowing the ~boom" y~) it was raported that ugar wctor borawing hd ute~d upalmot all nt credit expanfon to the private aector. In the 1980z the levie wera largely ""ael "u~ (with eo ~mala caceptions) and the governmetwas forced to guaranto bonde ized to Enance the inutry. asawl au make - utrighr gant. lt the period 1981-198, indtri eancninn
- re.ed~ the equivalen of US592 million. Cusreny, om of the major macroeconomic imm faing Barbedoe is how to kep the Barbedos Nationa~ Ban(the major lending inuitution o the .ector) from colläping under the weight of thee loan, which arm virtually in default. And all of this debt nd thogovernacet gram wre in addition to dmeute pricing policiem which -nn~ts to a forced transfr of about USS3 millan per ycar from Barbedianco-m eru to the agar ina~y.
The atnempt to swim againt the economic tide haa ultimaely bom n-acec-rnz; the induatry hus be= kept alive, bet hu been changed fram m -to a liability tohe ecentamy. Seger prwducion casa of about USSD.35/pound ar amo g the highet in the world wo the induatry (and the onomy awhole) locen money, eve o aparta in the prefe=tial EC wnrk~t. Whil it is quite ponn-alo that thia would hav oecnered in any c , th rola ofgovernnt land åad labor policie made the paucce of contraction mor painful than it had to be, both for tho industty and the rt of the -o~-y.Labor puliciem impe-~d tho u~ doweizing (though in r~cet year, the Guaratnd~ Employnet Act ha been ignored) and in at best om c~tealjuncaur~ (1981) impoed a large wage increaae the indusry could i afflrd.
Land u» policie. that tried to kep land in griculteral pr~ man did not mceed in etopping the tranfers to alternative unas, thugi they didprobably slow it d^. Bu this came at a high pi. Fir om. thng, it hs meet that amdcien land h been devtd to re-d=tiå l , u etingconditions of overerowding and a omag of h'nae& which by 1973 w= reportd to have reah~ seriaen proportiona- By bloching ter ability to aland. the reutrietiona preventad tho sugar -a~e-- from raiuing i apital in this way to pay for naeded rest-ucning and modennizeion Thir only ruwn==wa ta to the baking åys. resulting in he major debt problems dencribed above. The restrictiona have also creand me proa~n for the tourismindtnry, for =ample, by --- ng it more difficult tomt up in a convecient locetion a golf coara~, which aome believe to be very important in attraeinhigh-end touriats.
In reftvmped it is clear that the traneitian from a low-wa to a rela~iveby high.wge aconumic environment would not have been ea fr theBarbadian sugar b~intry in any cane. But it apper that the process could have been facite.t bad the goverument Allowed the inyty moreflexibility, parteulmrly with rempeet to labor end land u~e policie, instead of giving it atsaalen. The end result would pr~bably have been a much.contractwd indaary (which is the cae ayway), but om which wold have continued for much longer to be a set aaet to the economy.

Price controls
Price controls are imposed sporadically in Mauritius to combat inflation and to protect consumers
against abuses by some producers. But price controls have never proved to be an efficient tool to
contain inflation that is generated by an increase in the money supply, depreciation of the rupee, or
increases in the prices of imported goods or the costs of locally produced goods. And healthy
competition is a more efficient way to protect consumers against a few unscrupulous traders. Where a
monopoly or a cartel exists, decontrolling prices and liberalizing trade in competing imports will
bring prices down and prevent firms from making excess profits. If import monopolies arise, which
can happen in a small economy like Mauritius where a single importer can flood the market, the
solution is to tax monopoly rents.
Price controls are also sometimes justified on income distribution grounds. But price controlsbenefit better-off consumers as well as the poor. More efficient ways of helping the disadvantaged
include targeted support programs that meet both distributive and cost-saving objectives.
Price and margin controls will become increasingly irrelevant as import barriers are reduced, since
competition from imports will restrict the ability of local monopolists to inflate prices. And price
controls have considerable potential to cause harm. Flexibility in resource allocation requires that
prices and profit margins rise in some sectors and fall in others in accordance with relative scarcities.
Price and margin controls prevent this from happening, thereby distorting incentives, resource
allocation, and consumer choices. Those that are associated with subsidies also constitute an
unnecessary fiscal burden for the government.
Controls should be eliminated quickly on most products and gradually on politically sensitive goods
by increasing them until they become nonbinding. Any controlled prices that are nonbinding should
be eliminated. The economic and social justifications for price controls have faded, and authorities
can reduce pressures to reinstate cuntrols by making them legally difficult to impose.
Recommendations for improving factor markets
Land
The land use study (due in 1992) that is part of the ongoing work for preparation of the National
Physical Development Plan provides a good opportunity to reflect on current practices in land usemanagement. Current policies go far beyond the government's legitimate interest in ensuring that
polluting activities are not located in areas where they will endanger public health or welfare. Tax and
regulatory policies are designed to keep agricultural lands from being transferred to other uses,
especially residential or tourist.
These policies have a number of harmful effects. They intensify the housing shortage, discouragediversification from sugar into other crops, boost demand for transportation services and for imports
of gasoline and equipment, and generate large rents for landowners who succeed in transferring land
- 120 -

to other uses, thereby inviting corruption. These policies also make the economy less responsive to
change. These harmful effects are likely to worsen over time, since controls will have to be made
increasingly restrictive to withstand the economic forces brewing in Mauritius and abroad.
While forcing land to remain in agricultural use does keep agricultural production higher than it
would otherwise be, low-value crops (per hectare) are the most likely to be favorably affected, whichdiscourages diversification out of sugar. And even if these policies increased the production of food
crops, as intended, they would do so only at high cost. Increasing self-sufficiency may be worthwhileif it makes economic sense; if it does not, the effort can be extremely costly, as many countries have
discovered. This has certainly been the case with rice and maize in Mauritius.
Land use policies require greater flexibility. The Sugar Industry Efficiency Act should be amended
to eliminate the land conversion tax and to rescind the authority of the ministry of agriculture to issue
land conversion permits. This system of permits and taxes is no longer needed to handle pollution-
related issues since the Environmental Protection Act of 1991 incorporates safeguards against the use
of land in ways that impose costs on others. If a permit system is to be maintained for controlling
land conversion, authority should at least be vested in an agency with a more objective permpective on
land use than the Ministry of Agriculture.
To strengthen land markets and simplify land transfers, registration duties, fees, and taxes should
be reduced. The land registration system also needs to be improved to make it more efficient and to
make land titles more secure. For example, registering a deed does not currently validate title to the
land. These changes would encourage consolidation of plots, which have become smaller and more
numerous over the years. Security of title would also encourage investment in land and the production
of high-value crops that require large, long-term investments.
Capital market
Interest rate controls have been formally eliminated, though in 1991 banks were requested to
continue lending to EPZs at below-market rates. Sectoral credit allocations need to be eliminated as
well to get the full benefit of a flexible, efficient capital market. Authorities are aware of the
distortions created by credit ceilings and have announced the goal of abolishing them in stages.
Sectoral allocations are being phased out gradually during the conversion from a monetary policy
based on credit control to one based on open market operations. But the allocations are not a
necessary part of the system of overall credit ceilings, and delay in getting rid of them seems to call
into question the government's intentions to follow through on its plans to liberalize the system.
The government ought to move immediately to abolish the sectoral allocations, while continuing to
phase out the overall credit ceilings. Interest rates to Caegory I borrowers will rise, increasing costs
for some EPZs, but any negative impact on incentives for exports in general will not be as great as
might at first appear. For one thing, abolishing sectoral allocations will encourage banks to offer
credit to some EPZs that are now rationed out of the credit market entirely or that must rely on
- 121 -

personal loans to their owners. For another, lowering interest rates to traders-currently in Category
I-would reduce import costs, benefiting consumers and indirectly improving incentives for export
production as well.6 And by reducing costs for firms in Categories II and I, eliminating sectoral
allocations may stimulate exports from some of these firms.
The government should also consider rapid rather than gradual elimination of credit ceilings.
Monetary policy could rely on control of reserve ratios until open market operations are phased in. At
the very least, long-term loans should immediately be exempted from credit ceilings and long-term
deposits from reserve requirements, to encourage the development of the long-term capital market.
Long-term loans have been exempted recently from credit ceilings provided they are matched by
deposits of 3 years and above.
The government should also consider phasing out the directed credit activities of the DevelopmentBank of Mauritius. International experience shows that directed credit programs-channeling
international funds to local firms and low-cost credit (especially Long-term) to selected
sectors-generally creates more problems than it solves. These activities of the Development Bank
are, to some extent, viewed as a means of filling a gap in the market for long-term credit, but this
gap could be filled in other ways, say, by offshore banks or by exempting long-term loans from credit
ceilings. The directed credit role of the Development Bank could be phased out by first raising rates
to market levels and opening long-term credit lines to all creditworthy borrowers and then, as the
private market for long-term credit develops, dropping these lines altogether.
A more immediate concern is the arrearage problem in the Development Bank's portfolio. Over 40percent of the portfolio has been nonperforming in recent years. The loans are purportedly well-
secured, but the bank's reluctance to collect or foreclose on them has undesirable consequences. It
reduces the financial resources available for start-up or expansion investments, a serious problem
since the Development Bank is a major source of long-term credit, and it keeps nonfinancial resources
tied up in nonviable businesses instead of releasing them to more efficient uses. The Development
Bank has reportedly taken some steps to clear up this problem, and it should be encouraged toaccelerate this process.
Competition in local financial markets could be increased considerably by allowing offshore banks
to compete in markets reserved for local banks and vice versa. Allowing offshore banks to make long-term loans would alleviate the shortage of funds in this market. And allowing domestic firms greater
access to short-term funds from these banks (without prior approval) would also promote competition.
As foreign exchange restrictions are eliminated, there will be little reason to prohibit domestic banks
from taking deposits and making loans in foreign exchange. Eventually, complete integration of
domestic and international financial markets would require allowing equal access to domestic and
63. Anything tha incraes demand for imports aim mncreases demand for foreign exchange, depreciating th real exchangte andhercby cocouraging cxports, the rvacrac of the indirect export tax from policies that discourage imports (Appendix B).
-122-

foreign deposits and eliminating special privileges for offshore institutions-policies long followed byHong Kong and more recently introduced in Singapore, with good results.
Humn development and labor markets
When broad policy reforms are initiated during a period of stabilization precipitated by
macroeconomic crisis, the required deep cuts in expenditure sometimes fall disproportionately on
social programs or programs of investment in human capital. High unemployment often accompanies
such crises as well- Mauritius has an oppornmity to initiate reforms now, when there is no crisis,
which gives the government many more options. The economy is essentially at full employment.
Social indicators-including life expectancy, infant and maternal mortality rates, and nutrition
indicators-are good for a country of Mauritius's level of development. Women are well-educated and
well-integrated into the work force. Thus, the major challenge for the safety net will be to ensure
adequate attention to vulnerable groups, through, for example well-targeted food programs instead of
the general food subsidies.
Labor policies. Labor policy reforms are clearly needed in several areas. Regulations that prevent
the sugar industry from cutting back on its work force and controlling seasonal employment should be
eliminated. The required attendance bonus in that industry should be made to conform to the policy
applied to the rest of the economy. The industry should be allowed to require medical certificates for
any paid sick leave, regardless of length. Payment requirements for overtime and holiday work should
be relaxed and lowered-a single overtime premium of 50 percent of the basic wage should be
adequate for overtime of all kinds.
Reform is also needed in the public sector work force. The government needs to reduce the gap
between public and private sector wages, particularly for the least skilled part of the labor force. The
government should provide incentives to encourage public employees to move into the private sector,
where they are needed to produce goods and services. Especially important will be training public
sector employees in the skills in high demand in the private sector. Such training would encourage the
voluntary redeployment of part of the public sector work force, thereby avoiding the hardships and
political difficulties associated with large-scale layoffs. If 20 percent of the public work force were to
shift to the private sector, GDP would grow by an estimated 2.5 to 3.5 percent. Wage pressmes
would also drop in the short rum as the labor market becomes less tight, improving the international
competitiveness of the economy, and setting the stage for long-term wage growth based on
productivity improvements. Reform of the system of entitlements for the pension plan and other
benefits is another important step. Workers should be able to collect their accumulated pension
benefits at any age or length of service when they leave public service.
Human development. The government has rightly identified technical and vocational training as a
top priority. Low levels of secondary education may, however, make it more difficult to introduce
technical training for technologically complex activities. The government may need to devote more
-123-

attention to secondary and tertiary education while also promoting private development of vocationaland technical training.
The government also needs to strengthen its support for in-house training programs, which aremore likely than the IVTB to provide training that is responsive to the needs of businesses. The IVTBcould instead devote its efforts to administering an improved cost-sharing system. Under such asystem firms (or workers directly) could be partially reimbursed for worker training given in-house orby providers of their choice. Other policies that discourage in-house training should be reexamined aswell, in particular tax policies favoring capital investment in machines and buildings rather than inpeople.
More emphasis on training is particularly important for the sugar industry. Greater mechanization
of harvesting and loading activities, automation of factories, and implementation of the Bagasse
Energy Development Program require a more sophisticated work force. Retraining will also beneeded for the many sugar industry workers who will have to move into other activities as the sugarindustry restructures.
Two distinct training strategies are called for in the sugar sector. The first, an industry-specific type
of training, should be left largely to the firms, with general guidance and modest budgetary supportfrom the government. Such support ought to be provided for both equity reasons-the sugar sector is
a major contributor to the tax-financed training fund-and efficiency reasons-the benefits of trainingare not captured exclusively by the firm that invests in upgrading its workers' skills. The LycedPolytechnique and the Regional Sugar Cane Training Center for Africa currently provide some
training of this kind. A second, more general strategy (outlined above) is required for the type oftraining needed to facilitate the movement of labor out of the sector since the benefits of this traininggo to the economy as a whole.
Investment incentivesAlthough the system of investment incentives was simplified in 1985, it remains convoluted and
creates so many biases in so many different directions that it is impossible to determine who gains andwho loses. Incentives are relative since not all activities can be simultaneously encouraged. Activitiesreceiving the weakest incentives are thus actually discouraged even though the government's intention
may be to subsidize the activities. The system's complexity makes it difficult o judge the net effecton a given activity. Different firms engaging in the same activity may receive different incentives,depending on what incentive regime they fall under-expired development certificate, current
development certificate, EPZ, agricultural development certificate, and so on. The system ofinvestments and initial allowances-which differ greatly by type of investment but bear little relationto true depreciation-adds an additional layer of complexity. Provisions in the tax code for individual
income tax produce further bias.
- 124 -

Some changes in how the tax code handles investments would also be advisable. Probably the most
serious source of discrimination is the "allowances" system. The amount of these subsidies varies by
type of investment and tax rate. There seems to be little justification for encouraging investments for
some firms and in certain machines and buildings rather than, say, in people or land for reasons other
than expected economic return from the investmem. Eliminating these allowances would create a
more neutral incentive structure, encouraging all firms to make appropriate choices about spending on
physical assets or hiring or training labor.
First, for all the reasons laid out in Chapter 3, the whole structure of the certificate schemes should
be drastically simplified. As a medium-term strategy, this should aim to phase out the special
treatment altogether. This will be facilitated by the other reforms recommended in this report. Asincome tax rates are unified and labor and credit regulations amended to eliminate discriminatin
against certain sectors, guarantees of special treatment for EPZ and other priority sectors will no
longer be necessary. Special incentives to attract foreign investment should be general, not sector-
specific (with the exception of heavily protected import-substitute sectors, which should not have any
investment incentives). Should the government wish to continue to subsidize investment, a tax credit
(transferable or with indefinite carry-forward) rather than an allowance for all durable assets would bemore nearly neutral since it would not depend on a particular firm's tax circumstances or type of
investment. The tax credit for stock purchases, which now creates a pro-equity bias in financing
investment, should also be eliminated. And, to encourage saving and eliminate double taxation of
savings for all taxpayers, the ceiling on deductions of dividends and interest should be removed.
It has been shown in previous chapters that (i) incentives are numerous, cumbersome and expensive
to manage, while (ii) there is no assurance of the direction of their impact, and consequently of their
efficiency. Although some may imply biases, in theory, in a reasonable direction, it is difficult to
ascertain their real impact, which can be distorted by management difficulties and especially by the
existence of many other incentives working in contrary directions. The view taken in this report is
based on the benefits of drastically simplifying all of them. The main reason is that incentives
represent, exceptions aside, an obstacle to efficient allocation needed to get the most of existingresources, even if the direction of their impact can be fully anticipated. The multiplication of
incentives also reduces the efficiency of any single one-even if desirable. Management cost
represents another important consideration. The question then should not be whether the system could
be improved without significant changes but rather how it should be dismamled efficiently. An
Industrial Expansion Act has been recently enacted. But it does not change the essence of incentives.
It merely consolidates the existing ones, and may even increase discretion in their handling,
particularly those related to pioneer industries.
-125-

Chapter 7. Timing, Sequencing and Quantitative Impact of Recommendations
The iecommendations in this report are intended to increase the efficiency and flexibility of the
Mauritian economy, stimulate productivity improvements, and strengthen links among all sectors of
the domestic economy and between domestic and international markets. The objectives, in turn, will
raise the living standards of all Mauritians and increase their options for responding to external and
domestic circumstances in ways that will improve their welfare. Thus, the ultimate goal is to enhance
the human development of Mauritius."
For many of the recommendations, it is difficult or impossible to quantify the impact on such
objectives as human development or a flexible economy. Even the effects on such theoretically
quantifiable concepts as economic efficiency are difficuIt to gauge. Nevertheless, it is possible to
make some quantitative estimates of the impact of some recommendations on important economic
variables.
This chapter looks particularly at the effect on GDP of some of the recommendations for reform of
labor market policies. It also considers how several other recommendations could be expected to
affect government revenue and spending and shows how other measures could be used to offset
undesirable effects. Finally, it discusses how the reforms could be sequenced to maximize
effectiveness and minimize costs.
Impact on GDP
Measures to improve the intersectoral allocation of labor are expected to generate an estimated 8 to
10 percent increase in GDP (Chapter 3). Of that growth, 2.5 to 3.5 percent would come from the
reallocation of 20 to 25 percent of government workers to the private sector, 3 to 4 percent from the
reallocation of half the work force in the sugar industry, and another 3 to 4 percent from increased
labor supply, reduced absenteeism, and lower adjustment costs in a more flexible labor market- The 8
to 10 percent growth will probably be spread out over three to four years, with the economy growing
by 2 to 3 percentage points a year. These are once-and-for-all gains that could allow the economy's
growth rate to remain above 4 percent over the next three years, providing enough breathing room for
industries to develop that are more intensive in technology, human and physical capital. Financial and
investment-related reforms will be critical for enabling firms in the export sector to adopt more
capital-intensive production techniques with higher output per worker and for encouraging them to
invest :n worker training.
64. The UNDP's 1990 Human Deyclopment Report deiued human development as a process of calmrging peopics choices.
- 127 -

Impact on the government budget
Estimates of the fiscal impact of reforms are important for ensuring that the reforms do notcompromise macroeconomic stability. A clear lesson from the experience of many developing
countries is that large budget deficits are a serious threat to liberal trade policies since they invariably
lead to accelerating inflation and balance of payments difficulties. Any losses in revenue resulting
from reform measures should be offset by equal reductions in government spending or increased
revenue from other sources. In selecting offsetting measures, priority should be given to measures
with other intrinsically beneficial effects or, at least, without any negative effects on economic
efficiency. Since most taxes have some adverse impact on efficiency," expenditure reductions that
seem unlikely to create economic problems should be favored.
Estimates of the revenue impact of recommendations made in this report do not take into account
either time horizons nor adjustments over time. Impacts are measured in constant 1990 prices, based
on import and tax composit-on for 1990.
Reduction and harmonization of import taxes
Estimates in table 7.1 of the fiscal implications of import reforms are based on the following
assumptions:
" One basic tariff rate of 10 percent, with no other taxes on imports.
a Elimination of all exemptions except on inputs for EPZs, bonded warehouses, temporary admission
regime, etc. (about Rs 10 billion of imports) and other export production (about Rs 1,500 million).
Table 7.1 Estimated revenue loss from import tax reform(millions of rupees)
Import tax revenue Amont
Current revenue 4,640
Expced rcycous 1,536
Change in recau.-3,104
Other suggested measurs from this report
The recommendations presented in table 7.2 (listed in no order of priority) can be expected to have
some significant impact on fiscal revenue. These estimates imply that the measures suggested in this
report would even increase fiscal reverne in the short to medium term, although that is not their
intent. If the tariff rate is set at 10 percent and all measures in Table 7.2 adopted as well, the net
65. There are some exceptions, most basal in socnd-bcsttheory. One relevant example is raising tariffs on importod imposs (orcliminating exemptions) for production of goods tht are dmnselves heavily protected.
- 128 -

revenue gain could be Rs 1,115 million." This means that there would be substantial room to, for
example, raise the sales tax rate to less than 10 percent or phase in the improvements in tax
administration. Further, eliminating the export tax on sugar does not imply losing revenues from
sugar exports if an auction of internal quotas is set up to replace the existing system.
Two important conclusions are worth underlining, while also noting that the results presented in
table 7.2 are rough estimates:
m Reducing tariffs does not necessarily lead to fiscal ruin if the measure is part of a package of
measures, even for an economy as heavily dependent on trade taxes as Mauritius.
a The positive revenue balance obtained with these measures implies that there is room to maneuver
as the authorities move toward the goal of improving both the efficiency and the flexibility of the
system.
Table 7.2 Estimates of rial impacts of reform measures(millions of rupees)
Polry refor meansei re W
Elimnination of subsidies on rice and wheat flour (CSO. Digest of Public Finance Saitrrier, 1991) 196
Shilt of 20 percent of public sector labor force to privase sectorReduction in public expenditures (CSO. Digest ofPxblic Finance Saisder, 1991) 6S
Increased tax revenue from increase of GDP. given buoyancy of taxes of 1.21 (IMF. RecentEconomic Developmener. 1991) 890
Auctioning quotas on sugar exports to preferential EC muaket 930P
Sales tax rare increase (with broader coverage)b 20
Improved income tax administration 435
Total revenue gain
Without sugar export quoa ction 4.219
With sugar export quote auction 5.149
a. This is the estimatod increase in revenue compared to the previous cxport tax of 18.75 perccat. h is based on a price for thequotas equal to the difference beaween the EC price and a long-run world price 20 percent above the current world price. Since thetax rate is now half the previous ram, the figure of 930 should be considered a conservative estima .s. Eased on dhe new rate of 938percent, a more realistic estimate of the increased revenue from auctioning quotas would be Rs 1,111 million.
b. Here, it is assumed the rae is raised from 5 percent to 10 percent, generating about an extra 1 dOD million on the existing taxbase (see Table 7.3). Services, which account for close to half of GDP. are currently exempt from the tax. as are a sizable list ofgoods- Thus. it is assumed that eliminating exemptions would generate a substantial increase in revenue. Expanding coverage byover half of GDP should in principle double the yield, but since some exemptions would likely rem-in for practical reasons. weestimate an increase less than double the yield on the xisting base. Thus, we estimate Rs 1.200 million for the increase fromexpansion of the base.
66. This is the difference between the loss from import tax reform (Table 7.1) and the net gain from the measures in Table 7.2.
- 129 -

Buoyancy of different insrumens
Table 7.3 presents variation.; in tax and expenditure parameters that will increase the budget surplus
or reduce Ehe deficit by Rs 100 million. It provides some notion of the options available for adjusting
revenues and expenditures as part of a package of reforms that will not increase the budget deficit.
With respect to income taxes, the table shows that incomplete registration, filing failures, backlogs.
court congestion, and other administrative problems are reducing yields on both personal and
corporate incomes taxes. Steps are being taken to address these problems. Improving administration
of the tax system to increase the personal income tax yield by some 15 percent or the corporate
income tax yield by 12.5 percent would generate Rs 100 million. Both these improvements are well
within reach under the exlzting structure of rates, deductions, and other provisions.
Raising the sales tax rate from 5 percent to 5.65 percent (on the 1991 sales tax base) could also
generate Rs 100 million. Despite some recent erosion of the sales tax base through the introduction of
more exemptions, the base remains broad. There might be public opposition to a hike in rates, but the
rate changes required here are small precisely because the base is broad.
Several World Bank and IMF studies have identified the public sector wage bi as a promising area
for economizing measures-both wage restraints and staff retrenchments. A 2.86 percent reduction in
the wage bill would free up Rs 100 million.
Reductions in ministerial exemptions as customs duties, alone or in combination with othermeasures to reduce statutory tariff rates, could also increase revenue. Cutting ministerial exemptions
by 7.1 percent of their total value or trimming exemptions on consumer goods by 9.4 percent would
each generate Rs 100 million. Table 7.3 also shows proportionate increases in other major taxes
needed to generate Rs 100 million.
Table 7.3 Changes in taxe to generate or save Rs 100 millon
Measmra ReAdrd dage
improve administration of income taxIndividual income tax 15.4% incr=e in yieldCorporerm income tax 12.5% increase in yield
Raise sales tax from 5% to 5.65% new tax rainReduce public wage bill 2.86% reductionEliminue some customs exemptions
Minisacrial exemptions 7.1% fewer exemptionsConsumer goods 9.4% fewar exemptions
Increase other tax rawExcise duties 12.7% proportionate increaseExport duties or quota auction revenue 23.0% proportionate increaseHotel taxes 43.5% proportionate increase
a. For example. 12.7 percent proportionse increase means multylying existing rates by 1.127 percent.
- 130 -

Timing and sequencing
Although the mearures proposed here will have a neutral or salutary effect on the fiscal deficit in the
long run, the ordec in which they are introduced could increase the deficit in the short run.
Experience in o!ner countries indicates that appropriate sequencing of reforms can make them
mutually reinforcing, an important consideration. Some suggestions for establishing a timetable and
priorities are presented below in simplified form. An in-depth study on these issues could lead to a
more specific proposal on the tax side.
R In general terms, the first priority should be greater flexibility of factor markets. Any changes in
relative prices (and relative sectoral profits), whether stemming from external sources (world
markets) or internal sources (policy changes) will call for adjustments and, consequently, for factor
movements within firms, among firms of the same sector, and among sectors. The more flexible
the factor markets, the speedier the adjustment and the lower the.attendant costs. Also, the
sensitivity of land and labor regulations and legal requirements involved in changing them imply
that the first steps toward modifying them should Uot be delayed.
a Some measures to improve efficiency could be taken simultaneously, in the short term.
a The drawback system should be improved immediately. Also as a high priority, the sales tax
should be adjusted to accommodate the exemption of input sales to export firms.
a Also immediately, requirements that prevent exporters from retaining their foreign exchange
earnings should be removed.
I Spending cuts and tax reforms will have to make up for any loss in import tax revenue to preserve
the budgetary position. Administrative reforms to strengthen weak parts of the revenue system
should be undertaken before any major shifts between systems.
a Increases in income tax yields stemming from admin' .-ative improvements are probably one to
two years away, at best.
a Tariff rationalization should be ongoing and could include the following measures:
- in the first stage (immediately) reducing the top rate of the combined three-part import tax to
50 percent, increasing the 0 percent rate on some goods to 5 percent, and eliminating all
exemptions other than inputs for exports;
- in the second stage, reducing import taxes to a maximum of 30 percent;
- in the third stage, reducing import taxes to a maximum of 15 percent;
- reducing import taxes to a maximum of 10 percent (15 percent) and increase import taxes on
nonessential goods from 5 percent to 10 percent (15 percent).
N Broadening the sales tax base should be explored, but no significant additions to revenue should be
expected without increases in rates.
a Changes in financial markets should be undertaken as part of the financial sector reform initiative.
* Sectoral reforms could include the following:
- 131 -

- changes to the textile quota allocation system, which should be undertaken now, while there is
enough slack in the system to mute the impact on producer costs
- immediate review of sugar sector policy, with changes in factor use regulations (land and labor)
phased in simultaneously with a qucta and auction system.
The following is a summary of the approximate revenue impacts of tariff reductions at various
stages:
a 50 percent maximum tariff and elimination of exemptions in that range Rs 500 million.
a 30 percent maximum tariff and elimination of exemptions in that range Rs 365 million
a 15 percent maximum tariff and elimination of exemptions in that range -Rs 1,555 million
N 10 percent maximum tariff and elimination of exemptions in that range - Rs 2,470 million
Total effects -Rs 3,160 million
The reductions refer to wtaturory tariff rates. Estimates of revenue impacts assume that the new
maximum level is binding (no slack, no exemptions). Consequently, some exemptions disappear at
each step. In practice, exemptions cut across sectors, categories of imported goods, and categories of
tariff rates. Estimates are based on the data presented in table 3.1 (chapter 3), with some adjustments.Added to the total was some Rs 568 million in tariff revenue, which was then assumed to be lost
when tariffs were adjusted to a maximum of 30 percent. Also, the estimates do not assume that items
with statutory tariff rates below 10 percent should not be taxed. If all imports in that category were
taxed at the rate of 10 percent, government revenue could increase by Rs 1,022 million. However,
this category is a composite of inputs to EPZ firms and of other products such as foodstuff. Although
the first category should be freed from taxes, the second one should not
67. This rotal is slighdy differcut frorm the 'change in revenue in Table 7.1 because the sources of data for the calculations werenecessarily different.
- 132 -

Appendix A. The Foreign Exchange
This appendix will present, first, the existing foreign exchange rules in Mauritius and, in the
second place, a discussion of the system to suggest possibilities of improvement.
Access and requirements
* The Bank of Mauritius fixes a daily buying and selling rate for the Mauritian rupee. The formula,
not disclosed, is based on a weighted basket of currencies significant in Mauritian trade.
Foreign exchange controls for exports are minimal although the full value of exports must be
returned to Mauritius. To the extent that the exchange rate is an "equilibrium' one and that capital is
almost free to move in and out, the latter condition is not binding, so no significant under or
overvaluation of exports is expected.
No prior approval is required for current account transactions. Specific approval of .he Bank of
Mauritius is required for: (i) the export of goods in respect of which no payment is to be received;
(ii) the export of goods from ex-bond; (iii) the supply of goods , including petroleum products, toforeign-owned vessels; and (iv) the export of goods manufactured on a Cut, Make, Trim (CMT)
basis."
Forward exchange facilities for companies holding an Export Enterprise Certificate are available.
However, the margin of 3 percent charged by the commercial banks is considered high.Although the official policy in principle allows exporters to keep export receipts in foreign
currency to pay for imports and other expenses, the practice is different exporters must convert all
their receipts immediately into Mauritian rupees and then have to convert them back to foreign
currency when paying for imports. Direct conversion between foreign currencies is prohibited.
Exporters are prohibited to keep deposits with foreign banks and local banks are prohibited from
paying interest on the exporters'foreign currency deposits. It would be advisable that exporters be
allowed to keep deposits of foreign currency in foreign banks, and to make direct conversionsbetween foreign currencies without converting first into the local currency. Local banks should also
be able to offer all foreign exchange services to exporters.
Performance or the exchange rate
The nominal erchange rate
Graph B-I shows the behavior of the nominal exchange rate since 1970. Having followed a trend
similar to the CPI, it has departed significantly from it since 1985. The reasons for this seem to lie in
68. AID. 1990. Critical Iuses for American Invemors in Mmritius. Business Internatioal. Loando
- 133 -

substantial foreign capital inflows in the form of foreign investment and loans. Other fbctors,summarized in the balance of payments as Errors and Omissions, may have bad an additional
influence on the fall in the nominal exchange rate. However, their meaning is ambiguous.
The real exhwage rate
More important than the nominal exchange rate for the opening of the country is the behavior of
the real exchange rate (RER). 'Me RER influences the resource allocation between tradables and non-
tradables. A rising RER stimulates both exports and import substitution. A high RER is also
equivalent to a high nominal protection for import substitutes, although it stimulates- import
substitution in an efficient way since it does not discriminate among sectors. Consequently, its
behavior is extremely important in a process of adjustment and of wider opening of the economy.
When reducing tariffs, an increase in the RER is desirable, either before, simultaneously or after,
since it makes easier the process of adjustment by reducing its costs.
Table 2-1 presents the behavior of the RER, which shows a trend similar to the nominal exchange
rate. This trend is certainly worrisome since it would indicate, everything else given, a reduction in
the competitiveness of Mauritian exports. Of course, competitiveness will depend also on changes in
labor productivity in Mauritius as well as in other countries which compete in third markets in exports
of similar goods.
An index of competitiveness is estimated for Mauritius. It consists of a nominal exchange rate
deflated by the relation between an index of unit labor costs in Mauritius (Table 4.8) and the WPI in
the 7 main trade partners. The unit labor cost index is obtained from the multiplication of an index of
nominal wages (Bi-Annual Survey of Employment and Earnings in Large Establishments) by an
index of productivity. The trend is certainly disquieting since the RER, as measured by deflating the
NER by the Unit Labor Cost Index, fell significantly between 1983 and 1990 (Table A-1). Thus, the
situation, as analyzed in the main text, calls for a major overhaul of the economy if the export-
oriented development strategy is to maintain its successful path of the last decade.
Table A-1: Real exchange rates
1982 10D.01983 107.61954 126.51985 137.91986 37.11987 35.91938 8631989 37.21990 343
Note: RER =(NERJUNIT LABOR COSTS)WPI (7 trade partners)
-134-

Indexes of competitiveness for several countries, likely competitors with Mauritius at least in
textiles, are compared below. They are based only on the bilateral RERs. as measured traditionally,
since no unit labor costs index could be obtained for other countries (Table A-2). Over the long term,
trends have been favorable for Mauritius in the cases of Singapore, Korea, and Thailand, and
unfavorable in the cases of Morocco, Turkey, Sri Lanka, and China. However, definite conclusions
cannot be obtained fr-m these indexes in the absence of correction for factor productivity.
At any rate, competitiveness and RER are intimately related. Consequently, it may be timely to
review the main determinants of the RER. No doubt, unit labor costs have a significant influence on
it; however, other forces do influence the RER directly or indirectly through unit labor costs, and
they should be taken into account in the design of economic policy to ensure a successful export
drive.
Determinants of the real exchange rate
The analysis of the determinants of the RER will help to understand its past behavior, and
principally, could help in the design of a process of greater opening. These determinants, as will be
appreciated, have been, are, and will be, present in the performance of the Mauritian economy. Their
relative weight is unknown at this stage, but, certainly, they should be borne in mind within the
chosen development strategy.The main determinants of the real exchange rate belong to the realm of what could be considered
as real variables and, consequently, are normally long term in character. Monetary variables could
have some effect, but essentially of short term nature and not a lasting one. They are succinctly
described below.Tariffs and other taxes and obstacles to trade (e.g. QRs), by reducing the demand for imports
and foreign currency, tend to reduce the RER6. This is an extremely important relation since it
implies that a reduction of tariffs (and other non-tariff barriers, if they exist) would tend to increase
the value of the RER. Consequently, if tariffs are reduced to open more the economy, the RER would
increase, all other things equal. The rise in RER would improve the attractiveness of exports and
compensate partly for the reduction in the protection (subsid-es) of importables; costs of adjustment
would then be lower than otherwise. This is another way to say that in the past, high tariffs have
hindered exports.
2. Strictly speaking. a reduction in tariffs can either depreciate or appreciate the exchange rate (Edwards. 1988). In plansibleconditions, a depreciation will cnsue, the suffikicr condition being that there is net subsitutabiliy among X. M. and no-tradables.Edwards (1988) empirical analysis for 10 developing countries reaffirm the laIner hypothesis.
- 135 -

Table A.2 Mauriiir bateral real o ~han r rate(1983=100)
Sinapore Thailand CYina Morocco Turkev SrI Lanka Korea France US1
1970 75.86 87.46 115.78 129.36 283-84 101.33 97.07 96.16
lsj 76.44 86.67 119.18 113.45 288.70 101.35 101.21 98.84
1972 78.32 84.04 125.55 125.40 282.24 92.59 109.07 94.46
1973 101.53 87.89 131.41 132.42 259.03 84.86 119.02 89.95
1974 101.50 89.57 117.60 125.32 226.68 34.14 101.55 81.001975 98.70 86.97 126.19 130.85 211.58 81.04 117.54 81.52
1976 91.39 8.99 125.02 123.45 137.20 175.75 91.89 113.65 84.75
1977 86.47 86.67 121.22 123.49 141.89 .52.52 91.75 109.43 81.701978 83.36 80.51 115.78 125.63 129.87 83.42 90.13 111.48 75.45
1979 81.04 78.74 114.23 129.98 144.45 12.65 95.24 117.06 75.03
1980 76.74 80.76 109.38 121.00 106.84 84.44 83.88 114.75 73.16
1981 85.47 36.72 100.11 105.22 101.17 86.94 92.29 102.77 11.97
1982 95.84 94.64 100.57 109.16 99.19 97.32 100.61 103.84 95.10
1983 100.00 10 100.00 100.0100.00 100.00 100.00
1984 111.62 107.80 96.08 99.72 95.90 118.42 108.09 102.88 114.57
1985 114.02 100.76 89.03 98.61 102.37 118.05 107.57 .... 96 124.40
1986 97.39 90.82 69.45 101.56 91.38 105.94 93.54 126.51 108.60
1987 96.33 90.59 66.73 108.17 95.07 103.35 98.32 143.37 107.27
1988 97.90 91.52 77.02 107.84 96.11 104.34 113.34 142.10 106.72
1989 104.19 95.60 89.24 108.37 110.10 103.45 131.40 138.32 112.69
1990 99.54 87.33 102.43 125.74 97.08 116.21 143.14 101.96
Averag 93.03 89.72 98.13 114.30 115.91 150.75 98.07 115.54 94.54
Stndarddeviation 11.47 7.03 18.37 10.89 17.28 75.02 12.20 15.00 14.45
Source: Inrernaional Finane Sraie. 1991. IMF
- 136 -

The capital account (or current) balance is also an important determinant of movements in RER.
Capital inflows (large deficit in the current account or surplus in the capital account) reduce RER,
while the reverse occurs with capital outflows (for example for debt service)". One interesting
implication of this relationship is that large inflows, which sometimes are strongly desired, have a
negative short-run effect on trade.
The terms of trade (price of export products relative to import products, in international markets)
play also a role in the determination of the RER. Usually, an improvement in terms of trade result
in an appreciation of the RER, although the impact is not as clear-cut as for the other determinants of
the RER. Highly fluctuating terms of trade for Mauritius are certainly a source of instability in its
RER and, indirectly an hindrance to the development of new exports (Graph A-2). This is true even if
the external prices of new exports are stable.
Another determinant of the RER is related to the level and composition of public expenditures.
An increase in the level of public expenditures financed by taxes will reduce the RER to the extent
that the marginal propensity to spend on nontradable domestic goods of the government is higher than
the one of the private sector. Given the composition of public expenditures, a permanent increase in
the level of public expenditures financed with foreign resources will reduce the RER in a permanent
way. Similarly, an increase in aggregate expenditures as a share of production would lower the RER
by pressuring the prices of non-tradables, while an increase !n production relative to expenditure,
everything else constant, would produce the reverse impact.
Further, a change in the composition of public expenditures towards domestic goods will reduce
the RER while a reduction in taxes financed with an increase in public indebtedness will normally
reduce the RER7.
Finally, with flexible exchange rate, it is possible that the fiscal deficit may be financed with
Central Bank credit. In such a case, only the level and composition of public expenditures will
influence the RER as described above.
3. Again. strictly speaking. the results will depend on how inflows will be spent if fully on tradables. the RER would not change.if fully on non-teadables, the RER would fall. Normally. expenditures will fall on both categories of goods and services.
4. An imarovement of trmns of trade may esult cither in an appreciation or in a depreciation of RER: if the income effctdominat. the substiuion effect, the RER would appreciate (Edwards. 1988 and 1989). His recent research gives for 10 developingcountric. a negative relation between terms of trade and RER; the results are consizzent with those of Edwards and Wijobergan,1987. Aiyway, a rise in export prices will reduce the RER while a rise in import prices may increase or reduce the RER according
to the demand elasticity of import (if it is inelastic the RER increases; if it is elastic, the RER decreases).
S. If the Ricardian equivalence does not hold.
- 137 -

Graph A.2 Terms of Trade and Real Exchange Rate
192~I-M
tCC
1901S t0
110 -
Other real variables may also influence the RER. Some of these are technological changei";and interventions in the markets of nontradables, and changes in the world markets for exports. In theshorn ran macroeconomic policies can influence the RER- Expansive macroeconomic policies will beassociated with a loss in international reserves, a current account deficit, an increase in spread
between the free and the fixed rame during the initial period, and a real exchange rare overvaluadion(appreciation). Exchange rate p olicy (e.g., nominal devalu2tion) can affect HER only to the extent ofthe need to mreestablish real exchange rate equilibriumo. On the contrary, stabilization policies whichreduce income ( or its rate of growth) will most probably be associated with increases in REIL Again,the latte may aiso help to explain the behavior of the HER since 1986.
A simple econometric test was ran to explain the fluctuations of the RER since 1 T. Theexplanatory variables were the terms of trade, GDP rate of growth, aggregate expendittues, aspercentage of GDP, and the government expenditures as percentage of GDP. The RERi -t defined as
6. Edwards (1911) has found a positive cocficient between technologicaL prog.ee and PML Hfowever. its ptoxy 'OchbdOgkdprogress -GDP growth- is deboubie. Improved efficiency in the production of export goods reduces the RER. and. unprovWdefficiency in the production of importabim. reduce the dernand for imports and REL
- 138-

the nominal exchange rate deflated by the relatiou between the Mauritian CPI and an average of WPIof its 7 major trade partners.
The equation utilized was:
LNRER =C+PLNTT+1LNGDP+2AGREXPIGDP+03GOBEXPIGDP +Iwhere:
LNIT = logarithm of terms of trade
LNGDP = log2rithm of GDP
AGR.EXPIGDP = aggregate expenditures as percentage of GDPGOB.EXPIGDP = government expenditures as percentage of GDP
Standard least squares were utilized. Results are presented in Table A-3. All coefficients are
statistically significant and signs are the expected ones with the exception of the variable government
expenditures which shows unexpectedly a positive sign; however, the t statistic suggests that the
variable has a low value of significance.
Results would indicate that: (i) the terms of trade will have a definite impact on the future RER
and since according to the analysis presented in Part II of this Report, they are expected to fail, they
should have a positive impact on the RER- (ii) high growth rates of GDP and reduced aggregate
expenditures would certainly favor higher RER in the future; an increase in the saving rate ( and
investment) would go a long way to fulfill both objectives.
Table A.3 Regression for the RER
Data file: Real excbange rate Dependent Variable:gINRER
VariableName Coefficiea Std. err. t Stanistic Prob>tConstant 6.5383 0.922360 7.088733 0.000GOV.ECPIGDP 1.9225 1310281 1.467242 0.159AGR.EXPIGDP -1.5490 0.612934 -2.514023 0.021LNGDP 0.0525 0.026962 1.948640 0.066LN TERMS offrade -03053 0.162423 -1.80032 0.076
Data File Real exchange rae
Sum of Deg of MeanSource Squares Freedom Squares F-Ratio Prob>b
Model 0.180325 4 0.04508 3.0644 0.047Error 0.235376 16 0.01471
Total 0.415701 20Coefficicaof dermination(R) 0.433784Adjusted coffik. -t (R2) 0.292230Coefficieat of corrclation (R) 0.658623Scandard cror of astiuum 0.121289Durbin-Wason staiic 1.508921
- 139 -

Foreign exchange regime efficiency
The Mauritian foreign exchange regime is based on a peg to a basket of currencies. Should itremain on its actual peg or perhaps be pegged to a single currency? If the latter, what would be the
best combination of currencies in the basket? Should Mauritius tie its currency to the European
Monetary System (EMS) or to an average of its major trade partners currencies- the actual situation?
The exchange rate can assist macroeconomic policy in achieving and maintaining international
competitiveness and ensuring a viable balance of payments, objectives which should be given priority
over using the exchange rate to anchor domestic prices. These objectives require minimizing the
variance of and allowing the RER to be close to its equilibrium value. Other policies must be used to
ensure that this equilibrium rate is one that will make Mauritius tradable production competitive.
The choice made by the Mauritian authorities is more likely one that the IMF would call a"flexible arrangement". Although according the Central Bank, the Mauritian Rupee is pegged to a
currency basket, with the most relevant partners in trade of Mauritius, the undisclosed nature of the
precise formula of pegging enables the authorities to camouflage an effective depreciation of their
exchange rate. The choice of exchange rate arrangement also intends to avoid frequent adjustments of
the exchange rate, thereby limiting the uncertainty associated with the fluctuations of the echange
rates of the major currencies. About 30 percent of developing countries are using this arrangement,
or similar ones, nowadays (IMF, 1991) m.
The main advantages of the exchange rule based on the RER( a constant one):
(i) it removes the issue of devaluation from the political arena;
(ii) it is an anchor for expectations since it provides information on the evolution of relative prices.
However, there are also some disadvantages such as:(i) It is difficult to determine the equilibrium RER given the many factors influencing it and the
characteristics of shocks: (temporary or permanent).
(ii) If the nominal exchange rate (a nominal variable) is used to achieve a real devaluation, it mayleave a small open economy without a nominal anchor for domestic prices. This danger7 implies
that authorities may lose control of inflation. In addition, over-depreciation relative to the equilibrium
RER is likely to make inflation higher than otherwise; consequendy, macroinstability may increase.
(iii) Exchange rate policies affect wages which may affect output according the type of disturbance.
If there is a supply shock, the variability of output will increase by indexing the exchange rate.
Nonetheless, it is important to assure potential investors in tradables that the RER will not get too
far out of line. Other nominal anchors could be available such as strict fiscal and monetary policies:
7. Agbcvli B.. M. Khan. and P. Mondl, 1991. Exchange Rawe Policy in Developing Countries Some Analytical Isau, OccasionalPaper 78. March
75. The recnt Chilean experience indicames that this danger is real.
-140-

for example, targets for money supply or low fiscal deficits. Given uncertainties about the
equilibrium value of RER, it may then be advisable not to adhere rigidly to an RER target and to
accept that the burden of external adjustments should be borne mainly by restrictive fiscal and
monetary policies.
Should the desirable peg be a single currency peg or a basket currency peg? Some considerations
are:
(i) Fixing to a basket of currencies has the advantage of reducing the average fluctuation of the
domestic currency vis-1-vis other currencies, but all traders bear the exchange rate risk.
(ii) A basket peg may even be more efficient to reduce internal inflation when the low inflation
trade partner experiences large real exchange rate movements against other major currency countries.
In absence of these latter movements and of a developed capital market, it would be preferable tD pegto a single currency : that of the major trade partner with low inflation.
However, as long as strict financial policies are followed, the choice between single or basketcurrency peg is of secondary importance from the point of view of financial stability.
The main conclusion is that the basket currency peg, in the Mauritius way, is a good solution, as
long as it is transparent and does not represent a substitute for a prudent set of financial policies.
- 141 -

Appendix B. The Impact of the Tariff Level on Exports
This appendix intends to show, in a simple way though with a slightly technical language, thattariffs may represent a tax on exports. It underlines the hidden characteristic of that tax, and add a
few consideration: on some forgotten aspects of tariffs.
Tariffs: only a blessing to importables?
Tariffs on imports erode the competitiveness of exports. In the first place, by lowering the
demand for imports (and foreign exchange) tariffs also lower the real exchange rate (RER) which is a
significant determinant of competitiveness. In the second place, tariffs increase the cost of inputs usedin the production of exports. This can be only partially offset by drawbacks, exemptions, and special
status regimes for exporters. In the third place, tariffs generate different (and often unexpected or
uncontrollable) impacts on effective protection across sectors, producing either exportables or
importables (substitutes of imports)76, generally to the detriment of exports in general. Finally,
tariffs make sales of the same good in the domestic market more attractive than exports.
The concept of effective protection Mustrates the relationship between trade instruments and their
likely impact on resource allocation. The higher the rate of effective protection of a sector, the more
attractive it would be to invest in it; and, vice-versa. But, at best, the concept measures only the
relatively direct effects on each sector. Consequently it is quite imperfect since the impacts of trade
instruments are pervasive throughout the economy and have feedback and indirect effects as well. If
only one tariff would apply to the import of one inconsequential good, the effective protection would
give a good measure of the impact. When, as in Mauritius, tariffs are applied across the board to
products which represent more than 40 percent of GDP, then macro impacts may be different than
micro ones. In a nutshell, although a more detailed explanation is presented below (see Box), tariffs
(as well as subsidies, and quantitative restrictions) affect the real exchange rate not only through their
direct impact on the nominal prices of importables and exportables but also, as they affect indirectlythe nominal prices of the domestic or home goods (non-tradables), that is, the real exchange rate.
Consequently, the protective impact will be fully or partially attenuated by that impact on the real
exchange rate.
I. Nominal protection' relates to the higher ( lower) price that a domestic producer can charge on its product in relation So theprice of: -c sae product in unprotected markets. *Effective protection" depends not only an the nominal protection but alo on thehigher (' - er) prices the producer has to pay on its raw nmterials and intermediate goods used in the production of its oupM. Thehigher u * nominal protection on its product, all other things given, the higher will be the effective protection. But the higher thenominal rotection on its inputs, an other things given, the lower the effective protection on its product. Effective protection is. inother woras, a mesure of protection given to the domestic value added in the production activity.
- 143 -

If tariffs lower the real exchange rate, as is generally the case, then the "true" level of protection
to the production of importables will be less than the one indicated by the trade instruments, while the
production of exportables will be taxed more than would be indicated by these instruments alone.
The mentioned "unexpected" or "unintended" impacts will depend on the characteristics of the supplyof exports and the demand for imports, conditions which cannot be controlled by the authorities. So
an important implication of this analysis is that "it is not totally within the capacity of policy-makers
to choose which situation they would like to be in". A more technical discussion of these issues is
exhibited in the box.
Parameters have been estimated for Mauritius (World Bank, 1987, and our own) to quantify theimpact of tariffs on exports: the so called "shift parameter". They show values between 70 percent
and 97 percent. Even taking the lowest value, more likely after the significant change in the
composition of exports as a result of the rapid increase in the importance of EPZ, this would meanthat 70 percent of the present tariff level represents a tax on exports; and only 30 percent of the tariff
actually increases the incentives for production of importables. Assuming the level of tariffs is around
43 percent (Chapter 3) today", this indirect tax on exports would be a minimum of 30 percent and
could reach up to 42 percent according the choice of assumptions.
This result is not essentially altered by the presence of drawback- the latter does not eliminate
this tax, it only reduces marginally the height of the tariff level. The results could nevertheless be
altered if the average tariff on effectively taxed non-EPZ imports was taken as the relevant reference
tariff: 62.8 percent in 1989190. This latter level would imply that the actual tariff schedule imposes37 percent tax on exports (if the lowest value for the shift parameter is chosen), a very high level
indeed. However, that reference tariff chosen may be on the high side given that it does not represent
the average tariff on all imports. But, it is not represented either by the 19.8 percent average noted
above gi;en that QRs and NTBs are. still imposed on some imports. It is likely that the average tariff
is roughly 35 to 40 percent which would imply a "true" minimum export tax of 20 percent. This tax
is additional to the existing tax on sugar exports.
Non-traitional export activities are more vulnerable to the effects of either explicit or implicit
taxation than are traditional exports ( sugar and tea). Non-traditional exports - such as EPZs or other-are usually produced by industrial processes using factors of production quite mobile across sectors
with a consequence that their cost cannot be depressed if the exportable is subject to a tax, be it
explicit or implicit. Then, non-traditional exports can disappear -or, their development impeded- with
tariffs on imports , unless a compensating subsidy applies to exportables. And the higher the tariffs on
importables, the higher the obstacle for exportables.
2. Since this value is obtained by an import-weighted average of tariffs on the goods which bear som tariff (La.. x!udin.eexempted imports and those with a rate of 0). it is an undervaluation of the true protection lvel: high tariffs are mo:- likely thosewith the highest weight in terms of domestic production. So. it would not be surprising that a more realistic protection levelweighted by production shares would be much higher.
-144-

Maritius estimates of the shift paramew
Ecu0"Mwn I Eguanon
C-ff r-Ska Ce-ff ISkwa C-CffU
Cons"MS 1.43 1.42 1.6 1.91 2-62 1.25PI 0.97 535 0.91 7.7 -0.26 -2.23Bfr -0.02 0.05 0.11 -0.17HTX 0.07 0.54 0.22 0.75
Slandarddeviation 0.16 0.16 030R-Squared 0.79 0.79 -0.51Adjussad Codff 0.75 0.77 0.42Number observatim 26 26 26
Co-ff ASM. Co-cf sour COff §420
Coait 33 1.9 4.4 1.9 4.4 1.9PI 0.8 3.4 0.3 2.2 0.7 2.2Y 03 -2.3 03 -2.3 03 -2.3
BrX - - - - - - -
Slandarld dviatim 031 0.23 0.27R-Squad 0.50 0.40 038Adjutd coeff 0.45 038 033Number observadion 26 2i 26
Traditional exporters face a different situation. Their product is intensive in the use of natural
resources, whose price is determined mainly by demand rather than by its supply conditions, since the
supply is relatively inelastic A tariff on imports or a tax on exports would only reduce the rentreceived by the owner or user of the natural resource. The consequent capital loss may not strongly
affect the production of the sector, even though the complementary factors are mobile. Consequently,
complaint by owners of natural resources in relation to the likely impacts of tariffs on their production
are not usually valid.
One interesting implication of the previous analysis, and the one developed in the Box, is that
tariffs, which has been shown to represent a tax on exports, may be a protective device on
importables, but, it is a slippery one. No doubt, it is actually lower than the paper indicates.
Finally, whatever the overall level and structure of tariffs, k results in a difference between the
cost of producing one dollar with domestic resources with the cost of saving one dollar also using
domestic resources, with consequent economic costs.
- 145 -