Mauda Final.xlsx - CERC
10
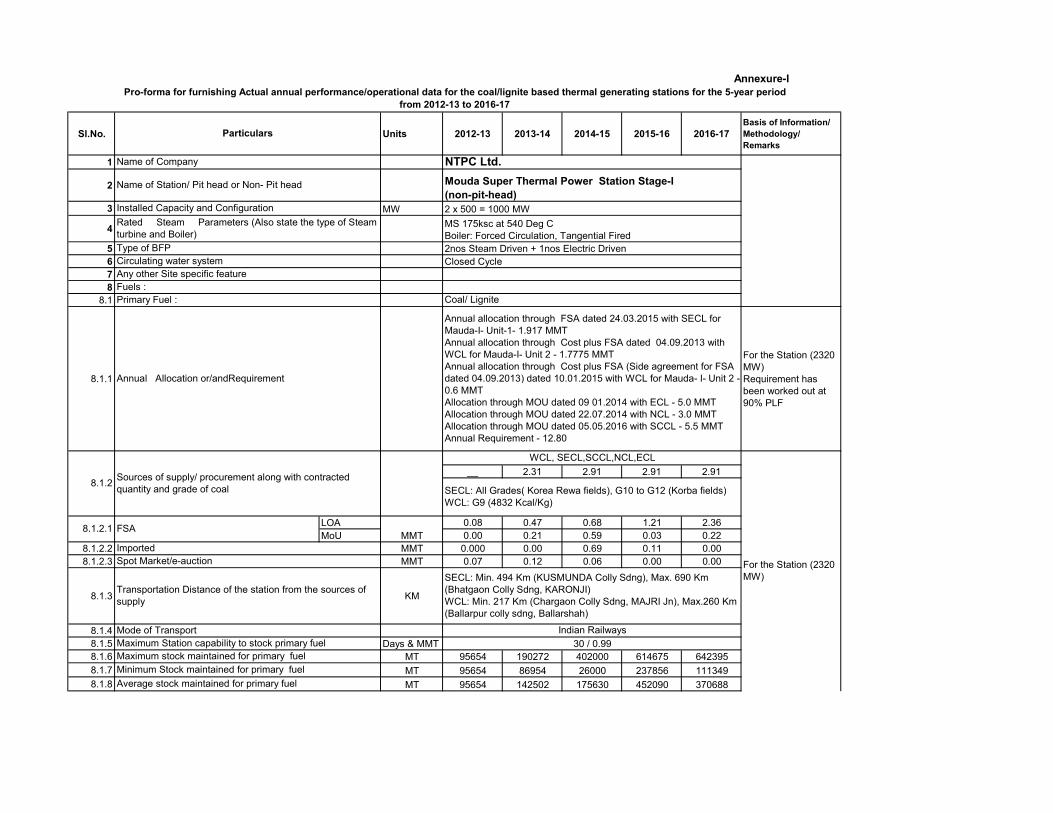
Sl.No. Units 2012-13 2013-14 2014-15 2015-16 2016-17 Basis of Information/ Methodology/ Remarks 1 2 3 MW 4 5 6 7 8 8.1 8.1.1 For the Station (2320 MW) Requirement has been worked out at 90% PLF __ 2.31 2.91 2.91 2.91 LOA 0.08 0.47 0.68 1.21 2.36 MoU 0.00 0.21 0.59 0.03 0.22 8.1.2.2 MMT 0.000 0.00 0.69 0.11 0.00 8.1.2.3 MMT 0.07 0.12 0.06 0.00 0.00 8.1.3 KM 8.1.4 8.1.5 Days & MMT 8.1.6 MT 95654 190272 402000 614675 642395 8.1.7 MT 95654 86954 26000 237856 111349 8.1.8 MT 95654 142502 175630 452090 370688 Annexure-I Imported Spot Market/e-auction Transportation Distance of the station from the sources of supply SECL: Min. 494 Km (KUSMUNDA Colly Sdng), Max. 690 Km (Bhatgaon Colly Sdng, KARONJI) WCL: Min. 217 Km (Chargaon Colly Sdng, MAJRI Jn), Max.260 Km (Ballarpur colly sdng, Ballarshah) Mode of Transport Coal/ Lignite Annual Allocation or/andRequirement Annual allocation through FSA dated 24.03.2015 with SECL for Mauda-I- Unit-1- 1.917 MMT Annual allocation through Cost plus FSA dated 04.09.2013 with WCL for Mauda-I- Unit 2 - 1.7775 MMT Annual allocation through Cost plus FSA (Side agreement for FSA dated 04.09.2013) dated 10.01.2015 with WCL for Mauda- I- Unit 2 - 0.6 MMT Allocation through MOU dated 09 01.2014 with ECL - 5.0 MMT Allocation through MOU dated 22.07.2014 with NCL - 3.0 MMT Allocation through MOU dated 05.05.2016 with SCCL - 5.5 MMT Annual Requirement - 12.80 Sources of supply/ procurement along with contracted quantity and grade of coal WCL, SECL,SCCL,NCL,ECL Fuels : Indian Railways Maximum Station capability to stock primary fuel 30 / 0.99 Maximum stock maintained for primary fuel Minimum Stock maintained for primary fuel Average stock maintained for primary fuel For the Station (2320 MW) SECL: All Grades( Korea Rewa fields), G10 to G12 (Korba fields) WCL: G9 (4832 Kcal/Kg) Pro-forma for furnishing Actual annual performance/operational data for the coal/lignite based thermal generating stations for the 5-year period from 2012-13 to 2016-17 Particulars Name of Company NTPC Ltd. Name of Station/ Pit head or Non- Pit head Mouda Super Thermal Power Station Stage-I (non-pit-head) Circulating water system Closed Cycle Any other Site specific feature Installed Capacity and Configuration 2 x 500 = 1000 MW Rated Steam Parameters (Also state the type of Steam turbine and Boiler) MS 175ksc at 540 Deg C Boiler: Forced Circulation, Tangential Fired Type of BFP 2nos Steam Driven + 1nos Electric Driven 8.1.2.1 FSA MMT 8.1.2 Primary Fuel :
-
Upload
khangminh22 -
Category
Documents
-
view
4 -
download
0
Transcript of Mauda Final.xlsx - CERC
Sl.No. Units 2012-13 2013-14 2014-15 2015-16 2016-17Basis of Information/ Methodology/ Remarks
1
2
3 MW
4
5678
8.1
8.1.1
For the Station (2320 MW)Requirement has been worked out at 90% PLF
__ 2.31 2.91 2.91 2.91
LOA 0.08 0.47 0.68 1.21 2.36MoU 0.00 0.21 0.59 0.03 0.22
8.1.2.2 MMT 0.000 0.00 0.69 0.11 0.008.1.2.3 MMT 0.07 0.12 0.06 0.00 0.00
8.1.3 KM
8.1.48.1.5 Days & MMT8.1.6 MT 95654 190272 402000 614675 6423958.1.7 MT 95654 86954 26000 237856 1113498.1.8 MT 95654 142502 175630 452090 370688
Annexure-I
ImportedSpot Market/e-auction
Transportation Distance of the station from the sources of supply
SECL: Min. 494 Km (KUSMUNDA Colly Sdng), Max. 690 Km (Bhatgaon Colly Sdng, KARONJI)WCL: Min. 217 Km (Chargaon Colly Sdng, MAJRI Jn), Max.260 Km (Ballarpur colly sdng, Ballarshah)
Mode of Transport
Coal/ Lignite
Annual Allocation or/andRequirement
Annual allocation through FSA dated 24.03.2015 with SECL for Mauda-I- Unit-1- 1.917 MMTAnnual allocation through Cost plus FSA dated 04.09.2013 with WCL for Mauda-I- Unit 2 - 1.7775 MMTAnnual allocation through Cost plus FSA (Side agreement for FSA dated 04.09.2013) dated 10.01.2015 with WCL for Mauda- I- Unit 2 - 0.6 MMTAllocation through MOU dated 09 01.2014 with ECL - 5.0 MMTAllocation through MOU dated 22.07.2014 with NCL - 3.0 MMTAllocation through MOU dated 05.05.2016 with SCCL - 5.5 MMTAnnual Requirement - 12.80
Sources of supply/ procurement along with contracted quantity and grade of coal
WCL, SECL,SCCL,NCL,ECL
Fuels :
Indian RailwaysMaximum Station capability to stock primary fuel 30 / 0.99Maximum stock maintained for primary fuelMinimum Stock maintained for primary fuel
Average stock maintained for primary fuel
For the Station (2320 MW)
SECL: All Grades( Korea Rewa fields), G10 to G12 (Korba fields)WCL: G9 (4832 Kcal/Kg)
Pro-forma for furnishing Actual annual performance/operational data for the coal/lignite based thermal generating stations for the 5-year period from 2012-13 to 2016-17
Particulars
Name of Company NTPC Ltd.
Name of Station/ Pit head or Non- Pit head Mouda Super Thermal Power Station Stage-I (non-pit-head)
Circulating water system Closed CycleAny other Site specific feature
Installed Capacity and Configuration 2 x 500 = 1000 MWRated Steam Parameters (Also state the type of Steam turbine and Boiler)
MS 175ksc at 540 Deg CBoiler: Forced Circulation, Tangential Fired
Type of BFP 2nos Steam Driven + 1nos Electric Driven
8.1.2.1 FSAMMT
8.1.2
Primary Fuel :
Sl.No. Units 2012-13 2013-14 2014-15 2015-16 2016-17Basis of Information/ Methodology/ Remarks
Particulars
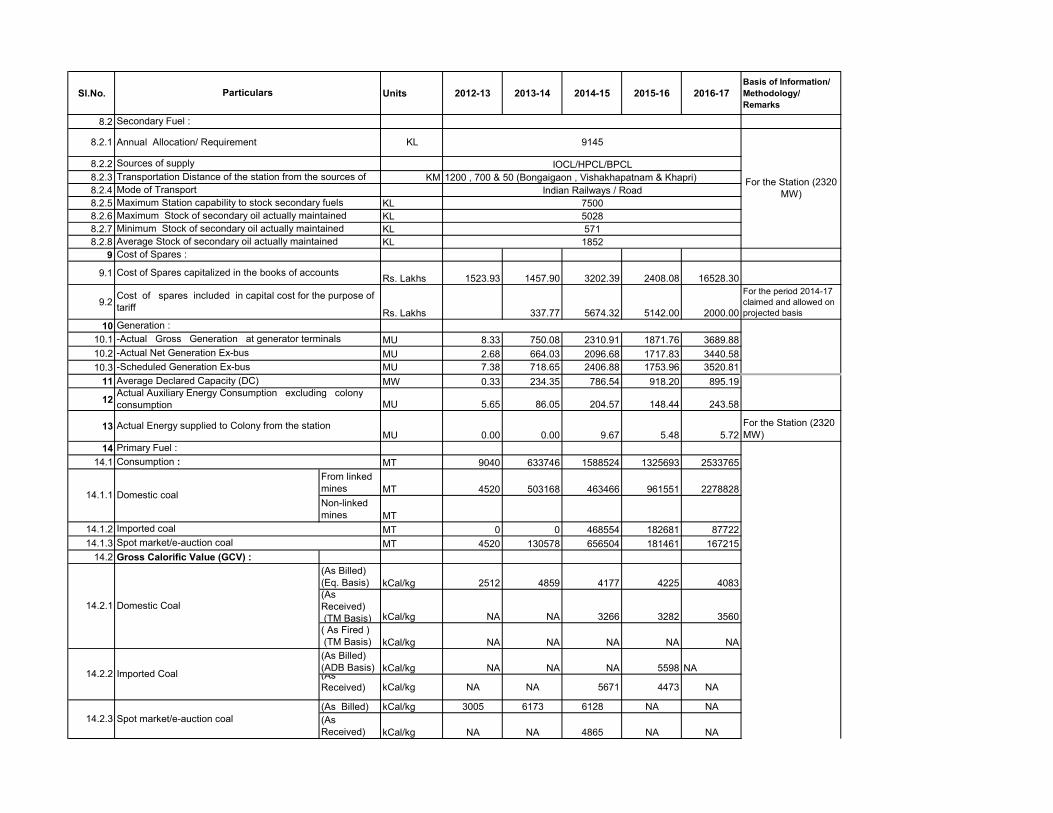
8.2
8.2.28.2.3 KM8.2.48.2.5 KL8.2.6 KL8.2.7 KL8.2.8 KL
9
9.1 Rs. Lakhs 1523.93 1457.90 3202.39 2408.08 16528.30
9.2Rs. Lakhs 337.77 5674.32 5142.00 2000.00
For the period 2014-17 claimed and allowed on projected basis
1010.1 MU 8.33 750.08 2310.91 1871.76 3689.8810.2 MU 2.68 664.03 2096.68 1717.83 3440.5810.3 MU 7.38 718.65 2406.88 1753.96 3520.81
11 MW 0.33 234.35 786.54 918.20 895.19
12 MU 5.65 86.05 204.57 148.44 243.58
13MU 0.00 0.00 9.67 5.48 5.72
For the Station (2320 MW)
14
14.1 MT 9040 633746 1588524 1325693 2533765
From linked mines MT 4520 503168 463466 961551 2278828
Non-linked mines MT
14.1.2 MT 0 0 468554 182681 8772214.1.3 MT 4520 130578 656504 181461 167215
14.2 Gross Calorific Value (GCV) :(As Billed)(Eq. Basis) kCal/kg 2512 4859 4177 4225 4083(As Received) (TM Basis) kCal/kg NA NA 3266 3282 3560( As Fired ) (TM Basis) kCal/kg NA NA NA NA NA(As Billed)(ADB Basis) kCal/kg NA NA NA 5598 NA(As Received) kCal/kg NA NA 5671 4473 NA
(As Billed) kCal/kg 3005 6173 6128 NA NA(As Received) kCal/kg NA NA 4865 NA NA
Imported coal
Spot market/e-auction coal
14.2.1 Domestic Coal
14.2.2 Imported Coal
Actual Energy supplied to Colony from the station
Primary Fuel :
Consumption :
14.1.1 Domestic coal
Cost of spares included in capital cost for the purpose of tariff
Generation :
14.2.3 Spot market/e-auction coal
-Actual Net Generation Ex-bus
-Scheduled Generation Ex-bus
Cost of Spares :
Cost of Spares capitalized in the books of accounts
5028571
Average Declared Capacity (DC)Actual Auxiliary Energy Consumption excluding colony consumption
8.2.1
Sources of supply IOCL/HPCL/BPCLTransportation Distance of the station from the sources of
-Actual Gross Generation at generator terminals
9145Annual Allocation/ Requirement KL
Average Stock of secondary oil actually maintained
Maximum Stock of secondary oil actually maintained Minimum Stock of secondary oil actually maintained
1852
For the Station (2320 MW)
1200 , 700 & 50 (Bongaigaon , Vishakhapatnam & Khapri)Mode of Transport Indian Railways / RoadMaximum Station capability to stock secondary fuels 7500
Secondary Fuel :

Sl.No. Units 2012-13 2013-14 2014-15 2015-16 2016-17Basis of Information/ Methodology/ Remarks
Particulars
14.2.4kCal/kg 2777 5385 5183 4338 4083
14.2.5kCal/kg NA NA 4690 3386 3560
14.2.6kCal/kg 2304 2977 NA NA NA
14.314.3.1 1596.23 2669.52 2257.29 3077.62 3242.5014.3.2 0.00 0.00 6056.58 5464.68 0.0014.3.3 3691.66 7603.05 7731.16 5744.41 4445.6414.3.4 2722.95 4642.76 5616.12 3334.16 3351.56
14.4.1Equivalent todomesticcoal
14.4.2 50.00 20.60 41.33 13.69 6.60
MT 95654 142502 175630 452090 370688
Days 12 19.96 12.30 31.66 25.9614.5
14.5.114.5.1.1 % NA NA NA NA NA14.5.1.2 NA NA NA NA NA14.5.1.3 NA NA NA NA NA
0.00% 0.00% 29.50% 13.78% 3.46%Blending :
% and MT( of the total
coalconsumed )
Proportion of e-auction coal in the blending
Transit loss from non-linked mines including e-auction coal Transit loss of imported coal
14.5 Actual Average Coal stock maintained
Actual Transit & Handling Losses for coal/Lignite Pit- Head StationTransit loss from linked mines
Weighted Average Landed price of Domestic coalWeighted Average Landed Price of Imported coalWeighted Average Landed Price of Spot market/e-auction Weighted Average Landed Price of all the Coals
Blending ratio of imported coal with domestic coal
Weighted Average Gross Calorific value (As Billed)
Weighted Average Gross Calorific value (As Received)
Weighted Average Gross Calorific value (As Fired)
Price of coal :
14.4

Sl.No. Units 2012-13 2013-14 2014-15 2015-16 2016-17Basis of Information/ Methodology/ Remarks
Particulars
14.5.2MT% 0.80 0.80 0.80 0.80 0.80
14.5.2.20.80 0.80 0.80 0.80 0.80
14.5.2.3 0.00 0.00 0.20 0.20 0.00
15
15.1 KL 889 16404 9620 3425 229315.2 Kcal/Ltr 9800 8672 9486 9457 947615.3 Rs/KL 65157 69720 65153 36153 42243
HFO KLLDO KL 1512 1789 1324 1100 3221
1616.1 Days 0.00 0.00 7.56 8.85 9.0016.2 Days 15.87 86.26 35.80 2.83 7.2916.3 Nos 3 33 22 15 916.4 Nos 3 48 48 36 24
16.4.1 Nos 0 7 17 19 1716.4.2 Nos 1 22 16 1 116.4.3 Nos 2 19 15 16 6
1717.1 mg/Nm3
SPM mg/Nm3 69 45 65SOX mg/Nm3 829 1095 1183NOX mg/Nm3 109 175 325
19 % - 1.14 14.41 80.31 100.0019.1 % - 1.07 1.28 78.53 65.1919.2 % - 0.00 12.92 0.00 33.9219.3 % - 0.06 0.06 1.76 0.0019.4 % - 0.00 0.15 0.02 0.8919.5 % - 0.00 0.00 0.00 0.00
20 Rs. Lakhs 304.36 878.12 1640.93 2507.89 3259.0221 Rs. Lakhs 753.10 3233.59 5942.51 7482.99 9437.16
22
22.1 379 388 379 361 342
22.2 42 52 50 77 80
22.3 3170 3051 2916 2973 2787
23 0.42 0.44 0.43 0.26 0.25Note: Allocation of stations attached at Appendix-I
Man-MW ratio computed excluding Corporate EmployeesAverage Coal stock computed based on monthly closing stock
Man-MW ratio
ConsumptionWeighted Average Gross Calorific value (As received)
Cost of spares actually consumedAverage stock of spares
Number of employees deployed in O&M
- Executives
- Non Executives
- Corporate office
Detail of Ash utilization % of fly ash produced
For the Station (1000MW)
Conversion of value added product For making roads & embarkmentLand filling Used in plant site in one or other form or used in some other Any other use , Please specify
Hot start-upNOx , SOx ,and other particulate matter emission in :Design value of emission control equipment ESP design dust outlet Conc.: 50
17.2 Actual emission
Planned OutagesForced OutagesNumber of tripping
Number of start-ups:
Cold Start-upWarm Start-up
Weighted Average Price
15.4 Actual Average Stock maintained
Weighted average duration of outages( unit-wise
Transit loss of imported coal
Secondary Fuel Oil :( If more than one fuel usedthen give details of all the fuels
Non-Pit Head station
14.5.2.1 Transit loss from linked mines
Transit loss from non-linked mines including e-auction coal mines.
For the Station (1000MW)
Manpower as on last day of FY. Mauda Stg-II Commissioning activities started in 2015-16

Name of the Company:Name of the Power Station:
Sl. No. Items 2012-13 2013-14 2014-15 2015-16 2016-171 Consumption of stores & spares 878.12 1640.93 2507.89 3259.022 Repair & Maintenance 1160.29 2523.57 3354.48 3934.483 Insurance 139.25 308.72 273.86 286.454 Security 629.93 761.77 973.67 1543.505 Water Charges 240.21 793.23 1036.80 897.466 Administrative Expenses
6.1 Rent 9.84 8.91 4.02 1.506.2 Electricity charges 111.88 191.06 249.91 233.236.3 Travelling & Conveyance 259.27 306.98 304.57 284.556.4 Communication Expenses 59.54 55.20 57.58 66.316.5 Advertising 5.79 106.59 11.31 13.206.6 Foundation Laying & Inaugration 0.00 0.00 0.00 0.006.7 Donation 0.00 0.00 0.00 0.006.8 Entertainment 6.43 13.05 15.19 17.026.9 Filing fee 13.04 44.12 44.00 44.00
Subtotal (Administrative Expenses) 465.79 725.91 686.57 659.817.0 Employee Cost
7.1.1 Salaries,Wages & Allowances 2529.91 2527.69 2684.00 3431.597.1.2 Pension 851.34 450.09 494.22 492.107.1.3 Gratuity 47.69 -20.60 -14.73 779.057.1.4 Provident Fund 404.91 426.70 457.92 485.937.1.5 Leave Encashment 401.39 490.76 526.22 818.99
7.2 Staff welfare expenses
7.2.1-Medical expenses on superannuated employees
3.50 6.86 36.47 0.00
7.2.2-Medical expenses on regular employees & others
272.11 338.99 460.75 163.27
7.2.3 -Uniform/Livries & safety equipment 102.58 94.22 96.33 131.82
7.2.4 -Canteen expenses 60.09 93.08 116.18 119.76
7.2.5 -Other staff welware expenses 95.12 80.85 53.55 111.90
Subtotal (Staff welfare Expenses) 533.40 614.00 763.28 526.75
7.3 Productivity linked Incentive 54.68 8.99 11.27 0.007.4 Expenditure on VRS 0.00 148.30 0.00 0.007.5 Ex-gratia 27.86 49.51 38.85 46.547.6 Performance Related Pay(PRP) 538.42 623.19 680.86 836.18
Sub Total (Employee Cost) 5389.59 5318.63 5641.89 7417.128 Loss of Store 0.00 0.00 0.00 0.009 Provisions 8.60 14.71 59.67 27.0810 Prior Period Expenses 0.00 0.00 500.70 0.0011 Corporate Office expenses allocation 1298.66 2766.77 2847.85 2993.4712 Others
12.1 Rates & Taxes 27.76 3.02 -60.35 -59.4112.2 Water cess 19.63 152.67 205.97 214.2312.3 Training & recruitment expenses 28.56 16.17 26.23 16.4612.4 Tender Expenses 5.45 19.38 22.31 4.6712.5 Guest house expenses 107.89 118.91 103.24 101.09
Mauda Super Thermal Power Station Rs. Lakhs
COD of 1st Unit:
13.03.2013
Annexure-VI(A)DETAILS OF OPERATION AND MAINTENANCE EXPENSES
NTPC Ltd.

Sl. No. Items 2012-13 2013-14 2014-15 2015-16 2016-17Rs. Lakhs
12.6 Education expenses 0.00 1.18 0.18 0.0012.7 Community Development Expenses 0.00 0.00 37.08 87.5912.8 Ash utilisation expenses 0.00 0.00 6.73 -27.2812.9 Books & Periodicals 0.37 0.36 0.11 0.84
12.10 Professional Charges 13.56 13.05 2.73 10.1912.11 Legal expenses 9.00 4.18 5.87 7.2212.12 EDP Hire & other charges 10.11 24.52 29.78 29.3512.13 Printing & Stationery 23.74 17.24 25.03 20.8012.14 Misc Expenses 498.35 645.53 366.61 1081.85
Sub Total (Others) 744.43 1016.21 771.53 1487.5913 (Total 1 to 12) 10954.87 15870.43 18654.92 22505.9814 Revenue / Recoveries -2.54 -9.02 -21.61 -27.4315 Net Expenses 10952.33 15861.41 18633.31 22478.5516 Capital spares consumed 0.00 90.10 143.17 214.93
Total O&M Cost 10952.33 15951.51 18776.48 22693.48
No. of Emp. Applied for VRS 3 No. VRS scheme was in operational

Name of the Company: NTPC Ltd.Name of the Power Station and Stage/Phase: Mauda Super Thermal Power Station (1000 MW)
(Rs. In Lakhs)Sl.No. ITEM 2012-13 2013-14 2014-15 2015-16 2016-17
1 2 3 4 5 6 7(A) Plant
1 Type of Plant 2 Type of Cooling Tower 3 Type of Cooling Water System
4Any Special Features which may increase/reduce water consumption
(B) Quantum of Water : ( Cubic Meter)5 Contracted Quantum6 Allocation of Water 40 MCM 50 MCM 12.5 MCM* 30 MCM 16 MCM
7 Actual water Consumption 2.348 MCM 13.96 MCM 1.946 MCM 8.213 MCM 16.04 MCM
8 Rate of Water Charges (Rs./Cubic meter)
9Other charges/Fees , if paid as part of Water Charges Rs lakhs
@20 % local tax
@20 % local tax
@20 % local tax
@20 % local tax &
royalty@5% of water charges of difference of 100 MCM and
yearly sub agreement qty)
20 % local tax & royalty@5%
of water charges of
difference of 100 MCM and
yearly sub agreement qty)
Total water Charges Paid Rs lakhs 52.36 240.21 793.23 1036.80 897.46
100 MCM
3.2
Annexure-VI (C)DETAILS OF WATER CHARGES
Coal Fired Thermal Power Plant Induced Draft Cooling Tower
Closed cycle

Annexure-VI (D)
Name of Company : NTPC LimitedName of Power station : Mauda Super Thermal Power Station
Sl . No. ITEM 2012-13 2013-14 2014-15 2015-16 2016-17
(A)Details of capital spares in Opening stock
- 15,23,93,113.38 29,81,83,418.20 60,94,12,555.40 83,59,03,908.89
(B)Details of capital spares procured during the year
15,23,93,113.38 14,57,90,304.82 32,02,39,240.49 24,08,08,324.56 1,65,28,30,492.78
(C)Details of capital spares consumed during the year
- - 90,10,103.29 1,43,16,971.07 2,14,92,719.76
(D)Details of capital spares closing at the end of the year
15,23,93,113.38 29,81,83,418.20 60,94,12,555.40 83,59,03,908.89 2,46,72,41,681.91
Note: Details of spares being provided in soft copy as voluminous
Details of capital Spares
Rs.

2004-05 2005-06 2006-07 2007-08 2008-09 2009-10 2010-11 2011-122012-13
(13.03.2013-31.03.2013)
2013-14 (01.04.2013-29.03.2014)
2013-14 (29.03.2014-31.03.2014)
2014-15 2015-16 2016-17
1 Plant Availability Factor (PAF) (%) 1.36 83.45 97.42 94.982 Plant Load Factors (PLF) (%) 3.65 26.38 21.31 42.123 Scheduled Energy (MU) 7.38 2406.88 1753.96 3520.814 Scheduled Generation (MU) 7.38 2406.88 1753.96 3520.815 Actual Generation (MU) 2.68 2095.86 1717.75 3440.586 Quantum of coal consumption (MT) 9040 1588524 1325693 25337657 Value of coal (Rs. Lakh) 246 89213 44201 849218 Specific Coal Consumption (kg/kwh) 1.09 0.69 0.71 0.699 Gross Calorific Value of Coal (Kcal/ Kg) 2304 3833 3400 3525
10 Heat Contribution of Coal (Kcal/ kwh) 2501 2635 2408 2420
11Cost Of Specific Coal Consumption (Rs./Kwh) –Finally admitted by CERC (Ex Bus) $
12Quantum of Oil Consumption (KL) HFO LDO
889.00 9619.60 3424.70 2292.50
13 Value of Oil (Rs. lakh)14 Gross calorific value of oil (kcal/lit) 9800.00 9486.00 9457.00 9476.0015 Specific Oil Consumption (ml/ kwh) 106.72 4.16 1.83 0.62
16Cost Of Specific Oil Consumption (Rs./Kwh) –Finally admitted by CERC (Ex Bus) $
17 Heat Contribution of Oil (Kcal/ kwh) 1046.0 39.0 17.0 6.018 Station Heat Rate (kcal/kwh) 3547 2674 2425 242619 Auxiliary Energy Consumption (%) 67.85 8.94 7.93 6.7420 Debt at the end of the year (Rs. Cr) 2088.37 2308.23 3713.00 3827.78 3806.89 3562.9921 Equity (Rs. Cr - (Average) # 883.79 981.09 2625.44 1734.18 1889.20 1997.55
22Working Capital (Rs. Cr) – finally admitted byCERC
358.10 369.96 1294.75 763.75 752.02 760.38
23Capital cost (Rs. Cr) – finally admitted by CERC(Average) #
2945.98 3270.31 5531.36 5830.84 6347.56 6637.87
24Capacity Charges/ Annual Fixed Cost (AFC) inRs. Cr
668.07 731.71 1358.58 1210.12 1280.54 1316.58
(a) Return on equity – post tax (admitted byCERC) for 2004-09 & pre tax (admitted byCERC) for 2009-17 $Absolute value (in Rs. Cr) 202.78 230.37 386.11 340.07 372.27 389.43Rate (%) 22.94 23.48 23.48 19.61 19.70 19.70(b) Interest on LoanAbsolute value (in Rs Cr) 165.81 179.23 300.43 304.08 303.42 295.47Rate (%) – Weighted Average Rate 8.06 8.15 8.09 8.07 7.95 8.02(c) Depreciation (finally allowed by CERC)Absolute value (in Rs Cr) 150.46 167.09 285.92 301.39 328.11 343.11Rate (%)
Spead out based on
5.11 5.11 5.17 5.17 5.17 5.17(d) Interest on working CapitalAbsolute value (in Rs Cr) 48.34 49.94 170.81 99.46 101.52 102.65Rate (%) 13.50 13.50 13.50 13.50 13.50 13.50(e) Operation and maintenance cost (finallyadmitted by CERC)Absolute value (in Rs Cr) 76.80 81.20 162.40 160 170.1 180.8Water charges (finally admitted by CERC) (in RsCr) # 5.12 5.12 5.12
Annexure-XIX
2705.0011.54
Not Applicable
8672.0021.86
190.00
294230.8429772515
16403.69
633745
Name of the Utility: NTPC LtdName of the Generating Station: MoudaSTPS Stage-IStation/ Stage/ Unit: 2 X 500 (Stage-I)Fuel Type (Coal/ Lignite/ Gas/ Liquid Fuel/ Nuclear/ Hydro): CoalCapacity of Plant (MW): 1000 MWCOD : 30.03.2014
49.8617
718.65719664

2004-05 2005-06 2006-07 2007-08 2008-09 2009-10 2010-11 2011-122012-13
(13.03.2013-31.03.2013)
2013-14 (01.04.2013-29.03.2014)
2013-14 (29.03.2014-31.03.2014)
2014-15 2015-16 2016-17
Name of the Utility: NTPC LtdName of the Generating Station: MoudaSTPS Stage-IStation/ Stage/ Unit: 2 X 500 (Stage-I)Fuel Type (Coal/ Lignite/ Gas/ Liquid Fuel/ Nuclear/ Hydro): CoalCapacity of Plant (MW): 1000 MWCOD : 30.03.2014
Rate (%) (f) Compensation Allowances (in Rs Cr)
25 AFC (Rs. Kwh) 0.98 1.08 2.00 1.77 1.87 1.9226 Energy Charge (Rs./Kwh) 1.90 1.90 4.37 2.15 1.87 1.9227 Total tariff (Rs. Kwh) 2.88 2.98 6.37 3.92 3.74 3.8428 Revenue realisation before tax (Rs. Crore)29 Revenue realisation after tax (Rs. Crore)30 Profit/ loss (Rs. Crore) -31.95 164.96 582.82 520.6231 DSM Generation (MU) -4.70 -311.03 -36.21 -80.2332 DSM Rate (Ps/Kwh)33 Revenue from DSM (Rs. Crore) 0.58 98.08 14.32 12.09
Note:
1 $ "Ex-Bus" word is additionally inserted.
2 # "Average" word is additionally inserted.
3 $ "for 2004-09 & pre tax (admitted by CERC) for 2009-17" word is additional inserted
4 # Additional Row 24(e) inserted
5 DSM Revenue (-)Received / (+) Paid
6 * For the whole station as an when the units were declared COD
10.77
Not Applicable
-55.14-181.26