Maternal activity in relation to birth size in rural India. The Pune Maternal Nutrition Study
12
ORIGINAL COMMUNICATION Maternal activity in relation to birth size in rural India. The Pune Maternal Nutrition Study S Rao 1 *, A Kanade 1 , BM Margetts 2 , CS Yajnik 3 , H Lubree 1 , S Rege 1 , B Desai 1 , A Jackson 2 and CHD Fall 4 1 Biometry and Nutrition Unit, Agharkar Research Institute, Pune, India; 2 Institute of Human Nutrition, University of Southampton, Southampton, UK; 3 KEM Hospital Research Center, KEM Hospital, Pune, India; and 4 MRC Environmental Epidemiology Unit, University of Southampton, Southampton, UK Objective: To describe the relationship of the mother’s physical activity to the birth size of her baby in a rural Indian population. Design: Prospective observational study. Setting: Six villages near Pune, Maharashtra, India. Subjects: A total of 797 women were studied after excluding abortions and termination of pregnancies (112), foetal anomalies (8), multiple pregnancies (3), incomplete pre-pregnancy anthropometry (14) and pregnancies detected later than 21 weeks of gestation (168). Method: An activity questionnaire was developed after focus group discussions and incorporated community-specific activities. It was validated against an observer-maintained diary. Activity scores were derived using published data on energy costs to weight the contributions of various activities. It was then administered to assess physical activity at 18 ( 2) and 28 ( 2) weeks of gestation. Outcome measures: Birth outcome, maternal weight gain and neonatal anthropometry. Results: The activity questionnaire was used to classify women into light, moderate and heavy activity categories. Maternal activity did not influence the incidence of prematurity or stillbirth, or the duration of gestation. It was inversely related to maternal weight gain up to 28 weeks of gestation (P ¼ 0.002). Higher maternal activity in early, as well as mid gestation, was associated with lower mean birth weight (P ¼ 0.05 and 0.02, respectively ), and smaller neonatal head circumference (P ¼ 0.005 and 0.009) and mid-arm circumference (P ¼ 0.03 and 0.01) after adjusting for the effect of major confounding factors. Conclusions: The Findings suggest that excessive maternal activity during pregnancy is associated with smaller foetal size in rural India, The approach described for developing an activity questionnaire has potential for adoption in other settings. Sponsorship: Wellcome Trust, London, UK, and the Medical Research Council, UK. European Journal of Clinical Nutrition (2003) 57, 531 – 542. doi:10.1038=sj.ejcn.1601582 Keywords: India; maternal activity; birth size; activity questionnaire Introduction Women from rural communities in developing countries like India have a high physical workload, including both farm labour and domestic chores. Energy expenditure could there- fore be an important factor affecting the relationship between maternal nutrition and birth size. Manual work has been associated with low birth weight in undernourished women in developing countries (Tafari et al, 1980; Launer et al, 1990). Strenuous physical work has also been associated with increased rates of abortion and premature delivery (Teitelmann et al, 1990; Ahlborg, 1995; Barnes et al, 1991). Investigators speculate that strenuous occupations increase uterine contractions and therefore increase the risk of pre- mature birth (Simpson, 1993; Keith & Luke, 1991). Similarly, it is postulated that nonsupine postures may affect utero- placental blood flow (Briend, 1979; Suonio et al, 1976) and therefore birth size. Maternal activity might therefore be a potentially modifi- able risk factor for reducing low birth weight prevalence (Kramer, 1987). Studies from India have examined the asso- ciations between birth weight and maternal age, parity, lack *Correspondence: Dr S Rao, Head, Division of Animal Sciences, In-charge, Biometry and Nutrition Group, Agharkar Research Institute, GG Agarkar Road, Pune, Maharashtra 411 004, India. E-mail: [email protected] Guarantor: S Rao. Contributors: A Kanade, BM Marrgetts, OS Yajnik, H Lubree, S Rege, B Desai, A Jackson, CHD Fall. Received 17 January 2002; revised 19 June 2002; accepted 3 July 2002 European Journal of Clinical Nutrition (2003) 57, 531–542 ß 2003 Nature Publishing Group All rights reserved 0954–3007/03 $25.00 www.nature.com/ejcn European Journal of Clinical Nutrition (2003) 57, 531–542 ß 2003 Nature Publishing Group All rights reserved 0954–3007/03 $25.00 www.nature.com/ejcn
-
Upload
independent -
Category
Documents
-
view
1 -
download
0
Transcript of Maternal activity in relation to birth size in rural India. The Pune Maternal Nutrition Study

ORIGINAL COMMUNICATION
Maternal activity in relation to birth size in rural India.The Pune Maternal Nutrition Study
S Rao1*, A Kanade1, BM Margetts2, CS Yajnik3, H Lubree1, S Rege1, B Desai1,A Jackson2 and CHD Fall4
1Biometry and Nutrition Unit, Agharkar Research Institute, Pune, India; 2Institute of Human Nutrition,University of Southampton, Southampton, UK; 3KEM Hospital Research Center, KEM Hospital, Pune, India; and4MRC Environmental Epidemiology Unit, University of Southampton, Southampton, UK
Objective: To describe the relationship of the mother’s physical activity to the birth size of her baby in a rural Indian population.Design: Prospective observational study.Setting: Six villages near Pune, Maharashtra, India.Subjects: A total of 797 women were studied after excluding abortions and termination of pregnancies (112), foetal anomalies(8), multiple pregnancies (3), incomplete pre-pregnancy anthropometry (14) and pregnancies detected later than 21 weeks ofgestation (168).Method: An activity questionnaire was developed after focus group discussions and incorporated community-specific activities.It was validated against an observer-maintained diary. Activity scores were derived using published data on energy costs toweight the contributions of various activities. It was then administered to assess physical activity at 18 (� 2) and 28 (�2) weeksof gestation.Outcome measures: Birth outcome, maternal weight gain and neonatal anthropometry.Results: The activity questionnaire was used to classify women into light, moderate and heavy activity categories. Maternalactivity did not influence the incidence of prematurity or stillbirth, or the duration of gestation. It was inversely related tomaternal weight gain up to 28 weeks of gestation (P¼0.002). Higher maternal activity in early, as well as mid gestation, wasassociated with lower mean birth weight (P¼0.05 and 0.02, respectively ), and smaller neonatal head circumference (P¼0.005and 0.009) and mid-arm circumference (P¼0.03 and 0.01) after adjusting for the effect of major confounding factors.Conclusions: The Findings suggest that excessive maternal activity during pregnancy is associated with smaller foetal size inrural India, The approach described for developing an activity questionnaire has potential for adoption in other settings.Sponsorship: Wellcome Trust, London, UK, and the Medical Research Council, UK.European Journal of Clinical Nutrition (2003) 57, 531 – 542. doi:10.1038=sj.ejcn.1601582
Keywords: India; maternal activity; birth size; activity questionnaire
IntroductionWomen from rural communities in developing countries like
India have a high physical workload, including both farm
labour and domestic chores. Energy expenditure could there-
fore be an important factor affecting the relationship
between maternal nutrition and birth size. Manual work
has been associated with low birth weight in undernourished
women in developing countries (Tafari et al, 1980; Launer
et al, 1990). Strenuous physical work has also been associated
with increased rates of abortion and premature delivery
(Teitelmann et al, 1990; Ahlborg, 1995; Barnes et al, 1991).
Investigators speculate that strenuous occupations increase
uterine contractions and therefore increase the risk of pre-
mature birth (Simpson, 1993; Keith & Luke, 1991). Similarly,
it is postulated that nonsupine postures may affect utero-
placental blood flow (Briend, 1979; Suonio et al, 1976) and
therefore birth size.
Maternal activity might therefore be a potentially modifi-
able risk factor for reducing low birth weight prevalence
(Kramer, 1987). Studies from India have examined the asso-
ciations between birth weight and maternal age, parity, lack
*Correspondence: Dr S Rao, Head, Division of Animal Sciences, In-charge,
Biometry and Nutrition Group, Agharkar Research Institute, GG Agarkar
Road, Pune, Maharashtra 411 004, India.
E-mail: [email protected]
Guarantor: S Rao.
Contributors: A Kanade, BM Marrgetts, OS Yajnik, H Lubree, S Rege,
B Desai, A Jackson, CHD Fall.
Received 17 January 2002; revised 19 June 2002;
accepted 3 July 2002
European Journal of Clinical Nutrition (2003) 57, 531–542� 2003 Nature Publishing Group All rights reserved 0954–3007/03 $25.00
www.nature.com/ejcn
European Journal of Clinical Nutrition (2003) 57, 531–542� 2003 Nature Publishing Group All rights reserved 0954–3007/03 $25.00
www.nature.com/ejcn

of antenatal care (Trivedi & Mavalankar, 1986; Theodore et al,
1992) social variables (Grover, 1982) and maternal pre-
pregnant nutritional status and dietary intake (Vijayalakshmi
& Lakshmi, 1985; Bhatia et al, 1983a,b; Rao et al, 2001), but
few studies have examined the relationship between mater-
nal physical activity and neonatal size.
We have recently carried out a study to examine the
relationship between maternal nutrition, physical activity
and birth size among women living in rural Maharashtra
State, India. Direct measurement of energy expenditure in
this community was not practical because the sophisticated
equipment required is culturally unacceptable and disruptive
to the rural lifestyle of these women. On the other hand, one
of the commonly used indirect methods of measuring energy
expenditure, the diary method, was impractical as the major-
ity of women were illiterate and used to measuring time.
Also, these women are too pre-occupied with their daily
routine work to cooperate in other elaborate methods of
measuring activity.
Studies reported in the literature indicate that interviewer-
assisted activity questionnaires can yield reliable data for
assessing habitual physical activity (Phillippaerts & Lefevre,
1998). Such questionnaires, however, provide data on
requency and duration of activity but reveal little quan-
titative information about the intensity of physical activity.
We set out to devise a questionnaire approach which
would be simple, quick and feasible to administer, to study
maternal activity among rural women from Maharashtra.
Applying values of energy costs for different physical
activities from the literature, we were able to convert the
women’s activity into semi-quantitative scores. This helped
to classify women into broad categories of light, moderate
and heavy activity. We validated our approach against
a conventional observer-maintained diary method and
then used it to study the relationship of physical activity
to birth size.
MethodsSubjects
The study was undertaken in six villages, 40 – 50 km from
Pune city and covered a population of approximately 35 000.
Of 2675 married eligible women (15 – 40 y), 2466 women
(92%) agreed to take part. The area is drought prone and
most families lived by subsistence farming on small land-
holdings. The majority of women (75%) worked on their
farms or as labourers, in addition to their domestic chores,
which are tedious and hard. Most families were vegetarian
and the usual diet consisted of pearl millet roti and dal or a
vegetable curry. Socio-economic status was assessed using a
standardized questionnaire (Pareek & Trivedi, 1964), which
derives a composite score based on occupation and educa-
tion of the head of the household, caste, type of housing,
and family ownership of animals, land material possessions.
Full details of the study including dietary intakes have been
reported earlier (Rao et al, 2001).
Gestation
Field workers visited the women every month to record the
date of their last menstrual period; women who missed two
successive periods were examined by ultrasound at 15 – 18
weeks to record sonographic gestational age (Hadlock, 1990).
Gestational age was derived from the last menstrual period,
unless it differed form the sonographic estimate by more
than 2 weeks, in which case the latter was used. Women
entered the study if a singleton pregnancy of less than 21
weeks gestation was confirmed. All women reporting missing
a period between June 1994 to April 1996 were thus enrolled
in the study. Of the 1102 women enrolled, 797 women were
studied after excluding abortions and termination of preg-
nancies (112), foetal anomalies (8), multiple pregnancies (3),
incomplete pre-pregnancy anthropometry (14) and pregnan-
cies detected later than 21 weeks of gestation (168). The
method of workload assessment was developed during the
pre-recruitment phase.
Weight
Women were measured every 3 months to record their
weight. The last weight recorded before confirmation of
pregnancy was used as pre-pregnant weight and the mea-
surement was repeated during pregnancy at 18�2 and 28�2
weeks gestation to get estimates of weight gain during
pregnancy.
Nutritional intakes
The conventional 24 h recall method was modified and
made more objective by incorporating information on por-
tion sizes, which were weighed at each mealtime by a trained
fieldworker. Women were interviewed at 18 and 28 weeks of
gestation by one of four nutritionists to record consumption
of food items in chronological order from morning until
dinnertime. At the time of diet survey interviewers ensured
that the women was not fasting or suffering from any illness
and had reported foods consumed outside home on the day
of visit. It was observed that mean energy and protein
intakes at 18 and 28 weeks were low: energy, 7.4�2.1 MJ
and 7.0�2.0 MJ; protein, 45.4�14.1 g and 43.5�13.5 g
respectively. These represented approximately 70 – 75% of
recommended intakes (Indian Council of Medical Research,
1998) at both time points.
Development of the activity questionnaire
Focus group discussions (FGDs). Use of FGDs in social
science research is well known but they have not been
used in community-based nutrition studies in India. In all,
four FGDs were held with groups of eight to 10 women,
representing young pregnant and elderly women. Women
voluntarily participated in FGDs. A tape recorder was kept at
the centre with prior consent of the women and the discus-
sions were moderated around eight to 10 important relevant
Maternal activity and birth sizeS Rao et al
532
European Journal of Clinical Nutrition

questions related to activity of rural women. The FGDs
aimed to obtain information about the different activities
that women undertake in this rural community, to under-
stand their perception of light and strenuous activities and
to know their perception of the distance and time for
activities involving walking. We also enquired if physical
workload is altered during pregnancy and by season.
Activity questionnaire. The information gained from FGDs
provided insights into the lifestyle of rural women. The data
obtained from the FGD assisted in developing the activity
questionnaire, which was field tested for discriminating
active women from others and was finalized (Appendix).
Details of their typical daily activity from morning until
evening were recorded under three broad categories as ‘rest-
ing’, ‘domestic’ and ‘other’ activities, including farming
work. Women who were not working on the farm were
either engaged as construction workers or were running a
small shop or stitching clothes, and were included under
‘other’ activities, constituting 13.9% of the population.
In the ‘resting’ category women were asked about the time
they went to bed and got up, whether and for how long they
rested during the day and how many TV programs they
watched in the evening. The ‘domestic’ category involved
the variety of activities besides cooking, such as fetching
water, washing utensils and clothes, fetching firewood, and
cleaning animal sheds. These activities were recorded in
terms of simple numeric measures such as number of roties
prepared each meal time, number of trips to the well and
number of animals cared for. Perception of the distance from
home to the farm or to the well was recorded as ‘near’, ‘far’ or
‘mid-way’, while the time spent in actual farm work was
recorded in terms of half day or full day and number of days
in a week.
Activity scores. Using published data for the energy expen-
diture of activities (Lawrence et al, 1985), a weighted score
was derived, which reflected as a base unit an activity level of
1 kcal per minute for a 30 min slot of time. For example, the
time required to make up to 10 roties was around 30 min
and, considering the energy costs for bread making (2.3 kcal),
the activity score for making 10 roties works out at 2.3�1
(one slot of 30 min). For making an additional 10 roties the
score was increased by 25% as the initial time for dough
preparation is saved. Similarly, farm work is listed as expend-
ing 3.5 kcal energy=min; 6 h of farm work had a score of
3.5�12 (6 h�2)¼42. For sleeping and resting activities a
different weighting was used to reflect the fact that, if a
woman spents less time sleeping, she would be spending
more time working. For all the activities in the question-
naire, the scores were computed (Appendix). A total daily
activity score and separate scores for the components resting,
domestic and other were derived.
Validation. The time spent in each activity and the energy
expenditure scores obtained using the questionnaire were
compared in 42 women from the same study population
with those derived from a detailed observer-maintained
diary. A trained nutritionist stayed with each woman
throughout the day and recorded her minute-to-minute
activity (including posture) from waking (7 am) until bed-
time (9 pm). Distances walked by the women were measured
using a pedometer (CMS Instruments Ltd, London, UK).
We were not able to select the subjects randomly as it
depended on the willingness of the family for the women
to be followed closely throughout the day. The short activity
questionnaire was administered the following day by a
different nutritionist.
The validation study aimed to determine (i) whether the
specific tasks recorded in the questionnaire reflected
observed behaviour, (ii) whether the simple numeric mea-
sures of various activities reflected the time spent in these
activities, and (iii) to test and validate the perceptions of
women about the ‘near’ or ‘far’ distance using a pedometer.
The activity questionnaire thus developed was adminis-
tered at 18�2 weeks and 28�2 weeks gestation to 797
women in the study.
Birth outcome
Birth outcome was recorded as prematurity (gestation <37
weeks), stillbirth or livebirth. Birth size was measured in
terms of several anthropometric measurements. Babies
were measured by one of five trained fieldworkers within
72 h of birth. Birth weight was measured to the nearest 50 g
using a Saltar spring balance (Salter Abbey, Suffolk, UK);
crown – heel length was measured to the nearest 0.1 cm
using a portable Pedobaby Babymeter (ETS J.M.B., Brussels,
Belgium). Triceps and subscapular skinfold were measured to
the nearest 0.2 mm, on the left side of the body, using
Harpenden skinfold callipers (CMS Instruments, London,
UK). Occipito-frontal head circumference and mid-upper-
arm circumference (MUAC) were measured to the nearest
0.1 cm using fibre glass tapes (CMS Instruments). Abdominal
circumference was measured at the level of umbilicus in
expiration. Placental weight was recorded to the nearest
5 g using Ishida scales, after trimming of the umbilical
cord and membranes. Inter- and intra-observer variation
studies were conducted 3-monthly to ensure quality of
these measurements.
Statistical methods
Proportions of pre-term and low birth weights in activity
groups were tested by w2 test. Multiple regression analysis
was carried out for examining the relationship of maternal
activity with birth size after adjusting for major confounding
variables. Maternal weight, sex of the new-born, gestation,
parity and weight gain (28th week) were direct predictors
while social class (as a group variable), and protein and
energy intakes (as a continuous variable) were indirect pre-
dictors. Comparisons of mean activity scores for farming and
Maternal activity and birth sizeS Rao et al
533
European Journal of Clinical Nutrition

non-farming women were done using t-tests for independent
samples. The data were analysed using the software package
SPSS=PC version 5.0.
ResultsFocus group discussions revealed that almost all the women
performed domestic activities that included cooking, wash-
ing clothes and utensils, sweeping the house and fetching
water and firewood. Women perceived fetching water and
washing clothes as the most strenuous activities. They often
carried three containers filled with water, placing two on
their head and one on their waist=hip. The capacity of each
container was 10 – 15 l (weighing in total about 45 kg). While
fetching water, women were required to bend and pull a
bucketful of water from the well, often without even using a
simple pulley.
In addition, many women did farm work in which speci-
fically ‘female’ tasks tended to be those requiring prolonged
bending, squatting or standing. These included weeding,
onion planting, harvesting groundnuts and threshing
grains. Some women were also engaged in caring for and
milking animals. Women had no recreation other than chit-
chatting. Going to the market to sell or buy things was often
done by an elderly man or woman in the house. During slack
periods farming activities were replaced by other tasks such
as stitching quilts and making pappadam and vermicelli
stocks for use throughout the year. There was a strong
belief among these women that working until late gestation
led to an easier delivery.
It was clear from the focus group discussions that women
were able to state with confidence the number of roties they
prepared in a day or the number of trips they made to the
well. They were not, however, able to describe the time taken
in particular activities. Similarly, women were not able to
assess distances accurately but perceived the farm or the well
as ‘near’ or ‘far’. FGDs were thus helpful in indicating
possible simple numeric measures proportional to time or
distance for various activities.
Validation results
The women who took part in the validation study were similar
to those enrolled in the main study in respect of age (20.8�2.9
vs 21.4�3.5 y, respectively) and pre-pregnancy weight
(42.8�5.3 vs 41.6�5.1 kg, respectively) but were slightly
taller (153.8� 4.5 vs 151.9�5.0 cm, respectively, P<0.05).
The actual observed time for several activities confirmed
the assumptions made in formulating the activity question-
naire. Thus mean time observed for making up to five roties
(measured on 15 women) was 24.4 min, while that observed
for six to eight roties (measured on 11 women) was 40.1 min.
Similarly, time spent in washing clothes (for five persons)
was 28.3 min (measured on 15 women) while that for five to
10 persons (observed on 11 women) was 70.6 min. These
observations revealed that time spent cooking was propor-
tional to the number of roties=chapaties, that spent in
washing clothes or utensils was proportional to the
number of persons, and time spent caring for animals was
proportional to the number of animals.
Perceptions of distance varied according to whether
the woman was carrying a load or not. Thus, when examined
with pedometers, it was observed that the average dis-
tance for walking without a load perceived as ‘far’ was
higher (4.7�2.67 km observed on 8 women) than that for
walking with a load (1.5�0.36 km observed on three
women).
Mean time recorded during validation for various broad
categories, ie farming, domestic activity and resting, were
323.4� 127.8, 616.8�148.4 and 479.3�48.9 min, respec-
tively (Table 1). The mean activity scores estimated from
the activity questionnaire show that, despite large differ-
ences in time spent in domestic and farming work, their
scores were similar owing to the higher energy costs of
farming activities. The correlation of the actual time
observed with the activity scores was significant in all three
broad categories of activities, as well as with the total
activities. The negative correlation for the resting category
indicates that women spending a long time resting had a
lower activity score. Data collected on total daily observed
time in various activities and daily activity score were cross-
classified (2�2) on the basis of the median values, to
examine sensitivity and specificity. The median was pre-
ferred as the majority of women were from farming families
and the distribution of activity scores was skewed. It was
observed that the activity scores had a high sensitivity (70%)
and specificity (70%) for identifying women engaged in high
levels of activity.
Activity patterns of rural mothers (main study)
The activity pattern of the rural mothers in the main study
based on the validated questionnaire (Table 2) shows that
Table 1 Results of the validation study
Activity No.
Time (min),
mean� s.d.
Activity score,
mean� s.d.
Correlationa between observed
time and activity scores
Domestic 42 616.8�148.4 25.0�10.8 0.34 (P< 0.03)
Farming 19 323.4�127.8 30.4�12.9 0.68 (P< 0.001)
Resting=sleeping 42 479.3�48.9 7.64�1.63 70.49 (P< 0.001)
aSpearman rank correlation.
Sensitivity (for identifying women doing higher activity: above median score)¼15=21¼70%.
Specificity (for identifying women doing low activity: below median score)¼ 15=21¼70%.
Maternal activity and birth sizeS Rao et al
534
European Journal of Clinical Nutrition

the majority of the women cooked and washed clothes and
utensils as their main domestic activities. Only 3.3% of
women did not report any cooking activity; this was due to
an additional helping hand, such as an elderly woman, a
sister-in-law or a mother-in-law in the house. Women who
did not cook were often involved in animal care or milking.
Over 85% of women fetched water and made an average of
two trips to the well, carrying three containers at a times,
while 64.8% of women had to collect firewood. Fetching
water contribute on average 17.6% to the total daily
score while that for firewood collection contributed 2.7%.
Washing utensils and clothes also made a considerable
contribution (7.7%).
Sixty-seven percent of women worked on the farm and of
these 90% worked a full day. This activity had the highest
mean contribution to the daily score (38.7%). They had
some rest (about 30 min) during the lunch hour, while
women not working on the farm could enjoy an afternoon
nap in the house. Only 3% of women reported leisure
activitiers such as chit-chatting. It was noticeable that 18%
of women were breast-feeding their youngest child, although
many stopped in late gestation.
Table 2 Activity pattern of rural women at 18 weeks of gestation
Activity
Percentage of women
reportinga
(n¼ 779)
Activity score,
mean� s.d.
Contribution (%) to
day’s activity score
Rest in afternoon 80.5 6.18�0.82 10.11� 3.59
Watching TV 47.4 4.57�0.58 8.62� 3.74
Cooking roties:
Morning 67.2 2.70�0.76 4.63� 2.54
Evening 87.5 2.40�0.38 3.83� 1.85
Both 58.1 5.00�0.86 8.71� 4.31
Washing clothes 92.4 (for average 6 persons) 5.32�1.80 7.92� 3.42
Washing utensils 95.1 (for average 7 persons) 5.21�1.79 7.87� 3.59
Breast feeding 17.9 (average 2 times=day) 1.17�0.75 1.70� 1.38
Care of animals 57.1 (for average 5 animals) 5.18�3.88 6.32� 4.82
Milking 19.4 (for average 2 animals) 1.57�0.92 1.94� 1.04
Fetching firewood 64.8 (for average 4 days=wk) 2.10�1.42 2.70� 1.93
Near 83.8 1.72�0.83 2.29� 1.43
Far 16.2 4.07�2.06 4.83� 2.66
Fetching water 86.6 (average 2 trips=day and
average 3 containers=trip)
13.43�11.47 17.61� 11.72
Distance from house:
Near 77.3 9.89�6.53 14.24� 8.61
Mid-way 7.4 18.23�8.92 23.10� 10.69
Far 15.3 29.03�16.98 31.91� 13.86
Working on farm 66.8 (average 6 days=week) 33.69�11.03 38.74� 11.36
Distance from house:
Near 64.2 32.51�10.85 37.84� 11.36
Far 35.8 36.78�9.03 40.80� 9.47
Whole day 90.0 36.09�8.41 40.67� 9.21
Half day 10.0 14.85�8.20 21.76� 10.87
Working as labourer 4.5 (45.7% whole day and
average 3.5 days=week)
15.16�11.41 18.22� 13.21
Stitching and others 11.7 (average 1 h=day) 0.46�3.11 2.53� 3.83
Sitting=chit-chatting 2.9 (average 4 h=day) 9.10�5.52 15.69� 11.00
aOut of 797 pregnant women information on activity was available on 779.
Table 3 Mean (95% confidence intervals) activity scores in early and late gestation for women from farming (F)and non-farming (NF) families
Activity
18 weeks of gestation 28 weeks of gestation
Category NF (271) F (508) NF (344) F (392)
Resting 17.9 (17.6 – 18.2) 19.9 (19.7 – 20.1) 18.1 (17.9 – 18.3) 19.5 (19.3 – 19.7)
Domestic 26.8 (25.1 – 28.5) 32.0 (30.8 – 33.2) 26.0 (24.5 – 27.5) 30.9 (29.5 – 32.3)
Other 3.2 (2.6 – 3.8) (87)a
36.0 (35.3 – 36.7) 2.9 (2.4 – 3.5) (101)a
34.2 (33.3 – 35.1)
Total 45.7 (43.9 – 47.5) 87.9* (86.5 – 89.3) 44.8 (43.2 – 46.4) 84.3* (82.4 – 86.2)
aThese are women doing other activities like running shop or stitching clothes.
*Activity score significantly (P< 0.01) different between F and NF.
Maternal activity and birth sizeS Rao et al
535
European Journal of Clinical Nutrition

Tab
le4
Birth
outc
om
ean
db
irth
size
by
leve
lsof
mate
rnalact
ivity
Act
ivity
at18
weeks
gest
atio
nA
ctiv
ity
at28
weeks
gest
atio
n
Var
iab
les
Low
Med
ium
Hig
hP
aLo
wM
ed
ium
Hig
hP
a
Sin
gle
ton
deliv
eriesb
(254)
(255)
(254)
(238)
(250)
(247)
Perc
en
tag
est
ill
birth
s(n
)c0.4
(1)
1.2
(3)
1.2
(3)
0.5
6—
1.6
(4)
1.2
(3)
0.1
7
Live
birth
sd,e
(233)
(236)
(233)
(224)
(229)
(229)
Weig
ht
gain
(kg
)2.1
(1.9
9–
2.1
9)
2.1
(1.9
4–
2.2
4)
1.9
7(1
.87
–2.0
7)
0.2
9h
6.1
(5.9
6–
6.1
4)
5.4
(5.2
8–
5.5
2)
5.1
(4.9
9–
5.1
5)
0.0
01
h
Gest
ati
on
(week)
39.1
(39.0
6–
39.1
4)
38.8
(38.7
6–
38.8
3)
39.1
(39.0
6–
39.1
3)
0.9
8h
39.1
(39.0
6–
39.1
4)
39.2
(39.1
6–
39.2
4)
38.8
(38.7
6–
38.8
4)
1.1
0h
Perc
en
tag
e
pre
matu
re( n
)c9.9
(23)
11.2
(26)
8.2
(19)
0.5
69.0
(20)
8.8
(20)
10.6
(24)
0.7
8
Perc
en
tag
eLB
W(n
)c28.6
(66)
38.4
(89)
30.3
(70)
0.0
532.0
(71)
31.4
(71)
33.2
(75)
0.9
2
Term
deliv
eriesf
(208)
(206)
(212)
(202)
(206)
(202)
Bir
thw
eig
ht
(g)g
2724
(2698
–2750)
2615
(2590
–2640)
2655
(2636
–2674)
0.0
52695
(2671
–2719)
2661
(2636
–2686)
2626
(2601
–2651)
0.0
2
Head
circ
um
fere
nce
(cm
)g33.4
(33.3
–33.5
)32.9
(32.8
–33.0
)33.0
(32.9
–33.1
)0.0
05
33.3
(33.2
–33.4
)33.0
(32.9
–33.1
)32.9
(32.8
–33.0
)0.0
09
Mid
-arm
circ
um
fere
nce
(cm
)g9.8
(9.8
–9.9
)9.6
(9.6
–9.7
)9.6
(9.6
–9.7
)0.0
39.8
(9.7
–9.8
)9.7
(9.6
–9.7
)9.6
(9.5
–9.6
)0.0
1
Tric
ep
ssk
info
ld(m
m)g
4.2
4(4
.2–
4.2
8)
4.1
0(4
.08
–4.1
2)
4.3
2(4
.3–
4.3
4)
0.1
64.2
2(4
.19
–4.2
5)
4.1
5(4
.12
–4.1
8)
4.2
4(4
.21
–4.2
7)
0.5
0
Pla
cen
talw
eig
ht
(g)g
373
(370
–376)
354
(351
–357)
354
(353
–356)
0.0
2366
(364
–367)
355
(352
–358)
357
(353
–361)
0.3
5
aP
aft
er
ad
just
ing
for
direct
pre
dic
tors
(sex,
parity
,g
est
ation
,p
re-p
reg
nan
cyw
eig
ht,
weig
ht
gain
up
to28th
week)
an
din
direct
pre
dic
tors
(soci
alcl
ass
,en
erg
yan
dp
rote
inin
take
s).
bO
f770
sin
gle
ton
deliv
eries,
act
ivity
data
ava
ilab
lefo
r763
an
d735
wom
en
at
18th
an
d28th
week
resp
ect
ively
.cPro
port
ion
sw
ere
com
pare
dusi
ngw2
test
.dLi
veb
irth
sexcl
ud
ing
still
birth
,co
ng
en
italab
norm
alit
ies
an
din
form
ation
.eO
f702
live
birth
s,act
ivity
data
ava
ilab
lefo
r702
an
d682
wom
en
at
18th
an
d28th
week,
resp
ect
ively
.f O
f633
full-
term
deliv
eries,
act
ivity
data
ava
ilab
leon
626
an
d610
wom
en
at
18th
an
d28th
week,
resp
ect
ively
.gValu
es
rep
rese
nt
ad
just
ed
mean
(95%
CI)
valu
es.
hP
aft
er
ad
just
ing
for
sex,
parity
,p
re-p
reg
nan
cyw
eig
ht
an
dg
est
ation
or
weig
ht
gain
.
Maternal activity and birth sizeS Rao et al
536
European Journal of Clinical Nutrition

Mean activity scores for broad categories of activities are
given in Table 3. Mean daily activity scores differed signifi-
cantly (P<0.001) between farming and non-farming groups.
Activity scores in winter (harvesting season) were higher
(89.9�15.3) than in summer (85.5�15.8). Farming women
performed similar levels of domestic activities to non-farming
women in addition to hard work on the farm. Further, there
was no significant difference between mean activity scores at
18 and 28 weeks of gestation, in both farming and non-
farming groups, indicating that physical activity at later
gestation was not substantially reduced compared with
that in earlier pregnancy.
Physical activity, maternal weight gain and
birth outcome
Of 797 women, 14 had late termination of pregnancy, while
one died of pregnancy-induced hypertension and 12 had
spontaneous abortions. Of 770 singleton deliveries, eight
babies were stillborn, nine had congenital abnormalities
and 51 did not have birth measurement. Sixty-nine of the
remaining 702 babies were born premature (<37 weeks
gestation).
Maternal weight gain was not related to activity score at
18 weeks but was inversely related at 28 weeks of gestation.
Women in the lowest third of activity gained more weight
(6.1�2.9 kg) up to 28 weeks than women in the highest
third (5.1�2.7 kg; P<0.01).
Birth outcome was compared in thirds of total activity
score at 18 and 28 weeks of gestation (Table 4). There was no
association between maternal activity and the incidence of
prematurity or stillbirth. We were unable to examine asso-
ciations with spontaneous abortion because of inadequate
information (the earliest sonographic confirmation of preg-
nancy took place at 14�2 weeks).
Physical activity and birth size
This analysis was limited to the 633 women who delivered at
term. The proportion of low-birth-weight (LBW) babies
(< 2500 g) was significantly (P<0.05) lower (28.6%) among
women in the lowest third of activity at 18 weeks gestation
than among those in the medium (38.4%) or highest third
(30.3%). At 28 weeks, however, the proportion of LBW did
not differ.
Associations of maternal daily activity scores with the
babies’ measurements at birth were also examined (Table 4).
After adjusting for direct as well as indirect predictors,
activity score at 18 weeks was inversely related to birth
weight (P¼0.05), head circumference (P¼0.005), mid-arm
circumference (P¼ 0.03) and placental weight (P¼0.02).
Similarly, activity score at 28 weeks was inversely related to
birth weight (P¼0.02), head circumference (P¼ 0.009) and
mid-arm circumference (P¼0.01). Maternal activity was not
related to neonatal body fat, as measured by triceps skinfold
thickness.
The above analysis was performed separately for women
with pre-pregnant weight below and above 45 kg to examineTab
le5
Birth
size
by
leve
lsof
act
ivity
for
pre
-pre
gn
an
tw
eig
ht<
45
kgof
rura
lm
oth
ers
Act
ivity
at18
weeks
gest
atio
nA
ctiv
ity
at28
weeks
gest
atio
n
Var
iab
lesa
Low
Med
ium
Hig
hP
bLo
wM
ed
ium
Hig
hP
b
Pre
-pre
gn
ant
weig
ht<
45
kg
Term
deliv
eri
es
(153)
(155)
(154)
(153)
(154)
(146)
Bir
thw
eig
ht
(g)
2694
(2668
–2720)
2583
(2558
–2608)
2629
(2607
–2650)
0.1
42665
(2641
–2689)
2633
(2604
–2662)
2597
(2573
–2621)
0.0
9
Head
circ
um
fere
nce
(cm
)33.3
(33.2
–33.4
)32.8
(32.7
–32.9
)32.9
(32.8
–33.0
)0.0
133.2
(33.1
–33.3
)32.9
(32.8
–33.0
)32.9
(32.8
–33.3
)0.0
6
Mid
-arm
circ
um
fere
nce
(cm
)9.7
7(9
.73
–9.8
1)
9.5
5(9
.51
–9.5
9)
9.6
2(9
.58
–9.6
6)
0.0
99.7
2(9
.69
–9.7
5)
9.6
2(9
.58
–9.6
6)
9.5
8(9
.55
–9.6
1)
0.0
9
Tric
ep
ssk
info
ld(m
m)
4.1
9(4
.15
–4.2
3)
4.0
6(4
.03
–4.0
9)
4.3
2(4
.28
–4.3
6)
0.0
74.1
9(4
.16
–4.2
2)
4.1
3(4
.08
–4.1
8)
4.1
9(4
.16
–4.2
2)
0.8
5
Pla
cen
talw
eig
ht
(g)
369.5
(366.3
–372.7
)346.3
(343.7
–348.9
)347.9
(344.6
–351.2
)0.0
2361.4
(358.4
–364.4
)349.6
(347
–352.2
)348.9
(345.0
–352.8
)0.1
5
aValu
es
rep
rese
nt
ad
just
ed
mean
(95%
CI)
valu
es.
bP
aft
er
ad
just
ing
for
direct
pre
dic
tors
(sex,
parity
,g
est
ation
,p
re-p
reg
nan
cyw
eig
ht,
weig
ht
gain
up
to28th
week)
an
din
direct
pre
dic
tors
(soci
alcl
ass
,en
erg
yan
dp
rote
inin
take
s).
Maternal activity and birth sizeS Rao et al
537
European Journal of Clinical Nutrition

how differences in pre-pregnant nutritional status affect
associations of activity with various neonatal measurements
(Table 5). None of the trends were significant for women
with weight above 45 kg. In contrast, in the other group
(ie <45 kg) they were significant and negative for head
circumference (P¼0.01) and placental weight (P¼0.02) at
the 18th week of gestation and for weight gain (P¼0.002) at
28th week of gestation.
Separate analyses were carried out for the subcategories of
total activity, ‘domestic’ and ‘other’, which included farming
activities (Table 6). Domestic activity was inversely asso-
ciated with birth weight (P¼0.01), head circumference
(P¼0.006), mid arm circumference (P¼0.05) and placental
weight (P¼0.03) only at 28 weeks. However, farming activity
at 18 weeks was inversely related to birth weight (P¼0.02),
head circumference (P<0.01) and mid-arm circumference
(P¼0.03), and these associations remained significant at
28 weeks.
According to the women’s perception, fetching water was
the most strenuous activity. At 28 weeks’ gestation this single
activity was inversely associated with birth weight
(P<0.001), head circumference (P¼0.01), mid-arm circum-
ference (P¼0.03) and placental weight (P<0.01) after
adjusting for the confounding variables (Table 6). Inverse
association of baby’s triceps skinfold thickness was seen
(P¼0.02) only when activity of fetching water was consi-
dered separately, which was not seen for the total activity
score. Babies born to women who were not performing this
strenuous activity were heavier by 112 g than those born to
women who fetched water.
DiscussionWe have earlier studied the maternal intakes in relation to
birth size among these rural mothers (Rao et al, 2001).
Maternal energy intakes showed no significant relationships
with neonatal size. However, the relationship between
maternal nutrition and foetal growth cannot be fully under-
stood by measurement of maternal food intake alone. In
communities where women are involved in hard work like
farming, consideration of physical activity becomes essen-
tial. Direct methods of measuring energy expenditure are
expensive and complicated to perform in field conditions,
especially in a place like rural India. A large number of
alternative approaches have emerged in the literature,
including simple categorization of subjects as ‘active’ and
‘non-active’ (Washburn et al, 1990), 7 day activity recall
(Warwick & Macqueen, 1988; Schoeller & Racette, 1990) or
24 h recall (Bernstein et al, 1998), using activity question-
naires. In simplifying conventional methods, it is advanta-
geous to take into consideration community peculiarities.
We therefore developed a community-specific activity ques-
tionnaire. We observed that maternal activity was inversely
related to maternal weight gain up to 28 weeks, birth weight,
head circumference and mid-arm circumference of the
new born.
Table 6 Birth size by levels of domestic, farming and strenuous activity
Activity
Variablesa Low Medium High Pb
Domestic (28 weeks)
Term deliveries (210) (200) (195)
Birth weight (g) 2686 (2659 – 2713) 2683 (2658 – 2708) 2612 (2592 – 2632) 0.01
Head circumference (cm) 33.2 (33.1 – 33.3) 33.1 (33.0 – 33.2) 32.9 (32.8 – 33.0) 0.006
Mid-arm circumference (cm) 9.73 (9.68 – 9.78) 9.74 (9.70 – 9.78) 9.57 (9.53 – 9.61) 0.05
Triceps skinfold (mm) 4.22 (4.19 – 4.25) 4.26 (4.23 – 4.29) 4.13 (4.11 – 4.15) 0.18
Placental weight (g) 360.5 (357.0 – 364.0) 372.1 (368.8 – 375.4) 344.4 (342.7 – 346.1) 0.03
Farming (18 weeks)
Term deliveries (205) (177) (228)
Birth weight (g) 2725 (2697 – 2753) 2637 (2620 – 2654) 2614 (2581 – 2647) 0.02
Head circumference (cm) 33.3 (33.2 – 33.4) 32.9 (32.8 – 33.0) 32.9 (32.8 – 33.0) 0.008
Mid-arm circumference (cm) 9.83 (9.79 – 9.87) 9.65 (9.61 – 9.69) 9.57 (9.53 – 9.61) 0.03
Triceps skinfold (mm) 4.21 (4.17 – 4.25) 4.21 (4.19 – 4.25) 4.18 (4.13 – 4.23) 0.37
Placental weight (g) 368.9 (366.8 – 371.0) 350.9 (348.4 – 353.4) 361.9 (356.6 – 367.2) 0.08
Fetching water (28 weeks)
Term deliveries (197) (233) (180)
Birth weight (g) 2718 (2692 – 2744) 2655 (2631 – 2679) 2606 (2583 – 2629) 0.0005
Head circumference (cm) 33.2 (33.1 – 33.3) 33.1 (33.0 – 33.2) 32.9 (32.8 – 33.0) 0.01
Mid-arm circumference (cm) 9.78 (9.74 – 9.82) 9.68 (9.64 – 9.72) 9.59 (9.56 – 9.62) 0.03
Triceps skinfold (mm) 4.27 (4.22 – 4.32) 4.24 (4.22 – 4.26) 4.07 (4.05 – 4.09) 0.02
Placental weight (g) 368.3 (366.5 – 370.1) 362.4 (359.2 – 365.6) 344.8 (342.5 – 347.1) 0.005
aValues represent adjusted mean (95% CI) values.
bP after adjusting for direct predictors (sex, parity, gestation, pre-pregnancy weight, weight gain upto 28th week) and indirect predictors
(social class, energy and protein intakes).
Maternal activity and birth sizeS Rao et al
538
European Journal of Clinical Nutrition

Focus group discussions provided valuable information
about the women’s lifestyle and more importantly helped
identify simple numerical variables to quantify the intensity
of various activities. Our questionnaire was quick and easy to
administer and was therefore applicable with minimal
disruption to their daily activity. It performed well in vali-
dation when compared with minute-to-minute observer-
maintained diaries and was able to reveal the differences in
activity patterns of farming and non-farming groups.
Our questionnaire revealed that domestic tasks contribute
a high proportions of the woman’s daily activity and that
farming women had a similar domestic workload to that of
non-farming women. Times spent in farming activities was
comparable to that observed by Bleiberg et al (1980) in
female farmers from Upper Volta. Time spent in domestic
work was, however, considerably more than that reported in
other studies, effectively reducing their resting time, which
was less than that reported in Upper Volta (Bleiberg et al,
1980, 1981). In developing countries excess physical activity
may reduce maternal weight gain (Langhoff-Roos et al,
1987). In our study, among women in the highest third of
activity score, weight gain up to 28 weeks of gestation was
significantly lower than that for women in the lowest third.
Weight gain during pregnancy is known to be a strong
determinant of birth size and several factors are known to
influence weight gain in pregnancy. Pre-pregnancy weight
has been shown to be negatively associated with weight gain
in poor and undernourished women (Kirchengast & Hartmann,
1998). In women from Sri Lanka, maternal weight gain was
inversely associated with parity but positively with income
and maternal education (Wanalawansa & Wikramanayake,
1987). Dietary energy intakes were associated with weight
gain in pregnant women from Bangla Desh (Tawfeek et al,
1999), while restrained eaters were observed to experience
significantly lower weight gain compared to their recom-
mended range based on pre-pregnant BMI (Lonway et al,
1999). Our data also shows association of weight gain
(28th week) with pre-pregnant weight (P<0.001), social
class (P¼0.02), gestation (P¼0.03), parity (P¼0.003),
energy intake (P¼0.01) and protein intake (P¼0.01). How-
ever, the association between maternal activity and weight
gain has been investigated only by few (Dewey & McCrony,
1994; Agarwal et al, 2001). Our study showed that maternal
activity, especially during mid gestation, had an inverse
effect on weight gain even after controlling for all above-
mentioned maternal factors.
We observed that maternal activity was not associated
with the occurrence of prematurity or stillbirth, or with
length of gestation. Some studies offer supportive evidence
for this relationship (Naeye & Peters, 1982; Teitelman et al
1990), while other do not show a relationship between
employment category and pregnancy outcome (Berkowitz
et al, 1983; Meyer & Daling, 1985; Hartikanen-Sorri & Sorri,
1989). The variation in the result could be partly due to the
fact that most studies have not adequately controlled for
potentially confounding variables (Dewey & McCrony, 1994)
or due to variations in categorisation of jobs as sedentary or
active.
Maternal activity was, however, associated with the inci-
dence of low birth weight in our study. In fact, total daily
maternal activity at 18 and 28 weeks was negatively asso-
ciated with almost all the birth measurements except length.
Separate analysis for farming activity scores showed similar
associations. The odds ratio for delivering a low-birth-weight
baby was 1.93 (95% CI 1.47 – 2.39) at the 18th week and 1.63
(95% CI 1.21 – 2.05) at the 28th week among women
engaged in farming compared with mothers not doing farm-
ing (as the reference category). Lima et al (1999) had also
reported that heavy agricultural work throughout pregnancy
significantly reduced birth weight in low income north-east
Brazilian women. In the case of ‘domestic’ activity, we
observed inverse association with birth size only at 28 weeks.
Separate data analysis for women with pre-pregnant
weight below and above 45 kg showed that the trends with
the activity at 18th week were significant only for head
circumference and placental weight and that at the 28th
week with weight gain, mainly among the undernourished
women (<45 kg). The adverse effects of excessive or strenuous
activity, therefore, are worse in undernourished women.
Agarwal et al (2001) also have reported that hard activity in
undernourished Indian rural women in later pregnancy
reduced foetal weight as well as length. In relatively well-
nourished US women, moderate exercise has only a small
effect on birth weight and in some reports it is associated with
higher birth weight, possible because of improved placental
blood flow. Strenuous exercise, on the other hand, appears to
reduce birth weight in both populations (Clapp, 2000).
The relationship between maternal activity and birth size
was strong for one specific activity, namely fetching water,
which was perceived as a strenuous activity by rural mothers.
Lima et al (1999) had also found lower mean birth weights
among mothers who fetched water during pregnancy. An
adverse influence of prolonged standing on birth outcome
and birth size has been reported in Filipino women (Barnes
et al, 1991). Many investigators (Simpson, 1993; Keith &
Luke, 1991) have speculated that strenuous occupations
increase uterine contraction and therefore increased the
risk of premature birth. The biological basis for harmful
effect of heavy work on pregnancy outcome has been iden-
tified as it decreases uterine and placental blood flow,
thereby reducing the foetal supply of oxygen and nutrients
which restricts intra-uterine growth (Lima et al 1999). In
contrast, leisure time exercise, especially in the second tri-
mester was observed to protect against pre-term delivery
(Misra et al, 1998; Berkowitz et al, 1983).
We found that higher maternal activity scores in earlier as
well as later pregnancy were associated with lower mean
birth weight, head circumference and mid-arm circumfer-
ence. The fact that these relationships were even stronger for
the strenuous activity of fetching water, points towards the
possible effects of certain postures such as bending in this
case. Our observation that higher activity in early gestation
Maternal activity and birth sizeS Rao et al
539
European Journal of Clinical Nutrition

resulted in lower placental weight gives some support to this
speculation. Physiological consequences of maternal activi-
ties involving certain postures thus needs further investiga-
tion. Interestingly, measures of neonatal fat were related
only to this strenuous activity. A negative association of
maternal physical activity with head circumference has not
been reported before and raises the question whether this
indicates an adverse impact on brain growth.
In conclusion, reduction in maternal physical activity
offers significant means for improving neonatal size in this
rural Indian community. It is often assumed that pregnant
women can economize their energy expenditure by curtailing
some activities (Ferro-Luzzi, 1985). However, the extent to
which such economization is possible may be limited by
social, seasonal or other constraints (Panter-Brick, 1993). For
example, in rural India, social beliefs, such as desire for more
sleep during pregnancy being interpreted to be a sign of
female foetus, or working until late gestation being thought
to result in an easy deliver, may create difficulties in reducing
maternal activity. Programmes aimed at reducing strenuous
workload during pregnancy will, therefore, need to adhere to
these community beliefs before it is likely that recommended
changes will be adopted. The impact of changes in workload
on household food security will also need to be considered.
Our findings demonstrate the strength of FGDs in design-
ing a community-specific activity questionnaire. This may
improve the chances of demonstrating a relationship
between physical activity and foetal growth when sophisti-
cated methods are not practical. We therefore feel that the
approach described in this study has the potential for adap-
tation for other settings, especially for rural communities in
developing countries where women have monotonous lives
with clearly defined routine tasks. Finally, the findings in this
study suggest that limiting maternal strenuous activities
could be a potential intervention for improving birth size
in rural Indian community.
Acknowledgements
We are grateful to the community, and to the pregnant
women and their families for their cooperation. The study
was supported by the Wellcome Trust, London, and the
Medical Research Council, UK. We thank Dr AD Agate,
Director, Agharkar Research Institute and Dr VN Rao,
Director, The KEM Hospital Research Center for providing
facilities for this collaborative research.
ReferencesAgarwal S, Agarwal A, Agarwal KN, Agarwal DK & Bansal A (2001):
Physical activity and pregnancy outcome in rural undernourishedwomen. Ind. Pediat. 38, 1017 – 1022.
Ahlborg G (1995): Physical workload and pregnancy outcome.J. Occup. Environ. Med. 37, 941 – 944.
Barnes DL, Adair LS & Popkin BM (1991): Women’s physicalactivity and pregnancy outcome: A longitudinal analysis fromthe Philippines. Int. J. Epidemiol. 20(1), 162 – 172.
Berkowitz GS, Kelsey JL & Holford DR (1983): Physical activity andrisk of spontaneous pre-term delivery. J. Reprod. Med. 28, 581 – 588.
Bernstein M, Sloutskis D, Kumanyika S, Sparti A, Schutz Y &Morabia A (1998): Data-based approach for developing a phy-sical activity frequency questionnaire. Am. J. Epidemiol. 147(2),147 – 154.
Bhatia BD, Banarjee D, Agarwal DK & Agarwal KN (1983a): Fetalgrowth: Importance of maternal body size and dietary intakesduring third trimester. Ind. J. Pediat. 50(402), 1 – 8.
Bhatia BD, Banarjee D, Agarwal DK & Agarwal KN (1983b): Fetalgrowth: relationship with maternal dietary intakes. Ind. J. Pediat.50(403), 113 – 120.
Bleiberg, F, Brun AT, Goihman S & Lippman D (1981): Food intakeand energy expenditure of male and female farmers from UpperVolta. J. Nutr. 45, 505 – 515.
Bleiberg FM, Brun TA & Goihman S (1980): Duration of activities andenergy expenditure of female farmers in dry and raining seasons inUpper Volta. Br. J. Nutr. 43, 71 – 81.
Briend A (1979): Fetal malnutrition — the price of upright posture?Br. Med. J. 2, 317 – 319.
Clapp JF (2000): Exercise during pregnancy; a clinical update. Clin.Sports. Med. 19, 273 – 286.
Dewey KG & McCrony MA (1994): Effects of dieting and physicalactivity on pregnancy and lactation. Am. J. Clin. Nutr. 59(Suppl),446S – 453S.
Ferro-Luzzi A. (1985): Work capacity and productivity in long termadaptation to low energy intakes. In: Nutritional Adaptation in Man,ed. K Blaxter & JC Waterlow, pp 61 – 67. London: John Libbey.
Grover I (1982): Effects if dietary intake, maternal factors and socio-economic factors on birth weight of infants in rural Haryana.Ind. J. Nutr. Dietet. 19, 80 – 86.
Hadlock FP (1990): Sonographic estimation of fetal age and weight.Fetal Ultrasound 28, 39 – 50.
Hartikainen-Sorri AL & Sorri M (1989): Occupational and socio-medical factors in pre-term birth. Obstet. Gynecol. 74, 13 – 16.
Indian Council of Medical Research (1998): Nutrient Requirements andRecommended Dietary Intakes for Indians. New Delhi: ICMR.
Jarski RW & Trippett DN (1990): The risks and benefits of exerciseduring pregnancy. J. Fam. Pract. 30, 185 – 189.
Keith L. & Luke B (1991): The association between women’s work,working conditions and adverse pregnancy outcomes: a review ofthe literature and directions for future research. Women’s HealthInst. 1, 113 – 119.
Krichengast S & Hartmann B (1998): Maternal prepregnancy weightstatus and pregnancy weight gain as major determinants fornewborn weight and size. Ann. Hum. Biol. 25(1), 17 – 28.
Kramer MS (1987): Determinants of low birth weight: methodologi-cal assessment and meta-analysis. Bull WHO 65, 663 – 737.
Langhoff-Roos J, Lindmark G, Kylberg E & Gebre-Medhin M (1987):Energy intake and physical activity during pregnancy in relationto maternal fat accretion and infant birth weight. Br. J. Obstet.Gynaecol. 94(12), 1178 – 1185.
Launer LJ, Villar J, Kestler E & de Onis M (1990): The effect ofmaternal work on fetal growth and duration of pregnancy: aprospective study. Br. J. Obstet. Gynaecol. 97, 62 – 70.
Lawrence M, Singh J, Lawrence F & Whitehead RG (1985): Theenergy cost of common daily activities in African Women:increased expenditure in pregnancy? Am. J. Clin. Nutr. 42,753 – 763.
Lima M, Ismail S, Ashworth A & Morris SS (1999): Influence of heavyagricultural work during pregnancy on birth weight in North-EastBrazil. Int. J. Epidemiol. 28, 469 – 474.
Lonway R, Reddy S & Davies J (1999): Dietary restraint and weightgain during pregnancy. Eur. J. Clin. Nutr. 53(11), 849 – 853.
Lotgering FK, Gilbert RD & Longo LD (1984): The interactionsof exercise and pregnancy: a review. Am. J. Obstet. Gynecol. 149,560 – 568.
Meyer BA & Daling JR (1985): Activity level of mother’ usualoccupation and low infant birth weight. J. Occup. Med. 27,841 – 847.
Maternal activity and birth sizeS Rao et al
540
European Journal of Clinical Nutrition

Misra DP, Strobino BM, Stashinko EE, Nagey DA & Nanda J (1998):Effects of physical activity on pre-term birth. Am J. Epidemiol.147(7), 628 – 635.
Naeye RI & Peters EC (1982): Working during pregnancy: effect onfetus. Pediatlics 69, 724 – 727.
Panter-Brick C (1993): Seasonality of energy expenditure duringpregnancy and lactation for rural Nepal women. Am. J. Clin.Nutr. 57, 620 – 628.
Pareek U & Trivedi G (1964): Reliability and valibility of socio-economic case. Ind. J. Appl. Psychol. 1, 34 – 40.
Phillippaerts RM & Lefevre J (1998): Reliability and validity of threephysical activity questionnaires in Flemish males. Am. J. Epidemiol.147(10), 980 – 990.
Rao S, Yajnik CS, Kanade AN, Fall CHD, Margetts BM, Jackson AA,Shier R, Joshi S, Rege S & Lubree H. (2001): Intake of micronutrient-rich foods in rural Indian mothers and size of their babies at birth(Pune Maternal Nutrition Study). J. Nutr. 131, 1217 – 1224.
Schoeller DA & Racette SB (1990): A review of field techniques for theassessment of energy expenditure. J. Nutr. 120(Suppl), 1492 – 1495.
Simpson JL (1993): Are physical activity and employment related topre-term birth and low birth weight? Am. J. Obstet. Gynecol. 168,1231 – 1238.
Suonio S, Simpanen A-L & Olkkonen H. (1976): Effect of the leftlateral recumbent position compared with the supine and uprightpositions on placental blood flow in normal late pregnancy. Ann.Clin. Res. 8, 22 – 26.
Tafari N, Naeye RL & Gobezie A (1980): Effects of maternal under-nutrition and heavy physical work during pregnancy on birth-weight. Br. J. Obstet. Gynaecol. 87, 222 – 226.
Tawfeek HL, Abdulla JN & Rasheed AH (1999): Maternal dietaryintakes and pregnancy outcomes in Baghdad, Iraq. Food Nutr.Bull. 20(2), 179 – 182.
Teitelmann AM, Welch LS, Hellenbrant KG & Bracken MB (1990):Effect of maternal work activity on preterm birth and low birth-weight. Am. J. Epidemiol. 131, 104 – 113.
Theodore K, Abel R & Sampathkumar V (1992): Epidemiologicalcorrelates of low birth weight in rural Tamil Nadu. Ind. J. Pediat.59, 299 – 304.
Trivedi CR & Mavalankar DV (1986): Epidemiology of low birthweight in Ahmedabad. Ind. J. Pediat. 53, 795 – 800.
Vijayalakshmi P & Lakshmi RN (1985): Reproductive performance ofexpectant, mothers. Ind. J. Nutr. Dietet. 22(2), 36 – 41.
Wanalawansa SJ & Wikramanayake TW (1987): Factors affectingweight gain during pregnancy and the growth of the infant.Ceylon J. Med. Sci. 30(1), 21 – 38.
Warwick PM & Macqueen SE (1988): Retrospective assessment oflevel of activity and energy expenditure — a pilot study. Proc. Nutr.Soc. Austr. 13, 149.
Washburn RA, Goldfield SRW, Smith KW & MacKinlay JB(1990): The validity of self reported exercise induced sweatingas a measure of physical activity. Am. J. Epidemiol. 132(1),107 – 113.
Maternal activity and birth sizeS Rao et al
541
European Journal of Clinical Nutrition
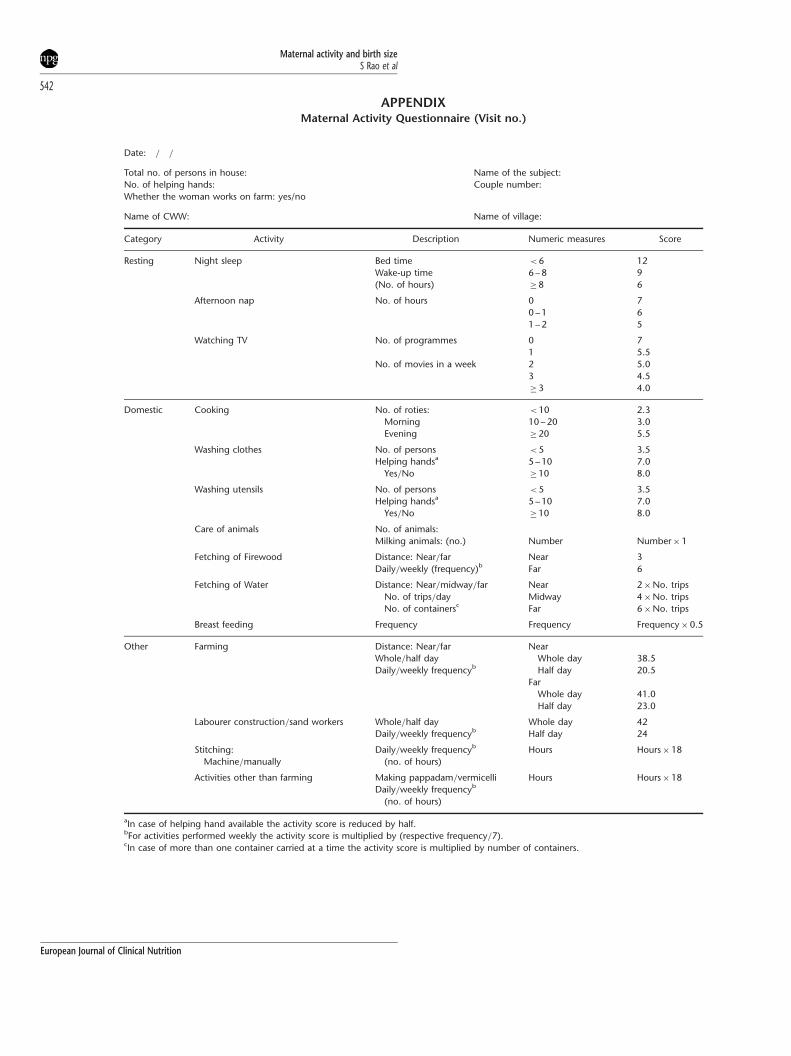
APPENDIXMaternal Activity Questionnaire (Visit no.)
Date: = =
Total no. of persons in house: Name of the subject:
No. of helping hands: Couple number:
Whether the woman works on farm: yes/no
Name of CWW: Name of village:
Category Activity Description Numeric measures Score
Resting Night sleep Bed time < 6 12
Wake-up time 6 – 8 9
(No. of hours) �8 6
Afternoon nap No. of hours 0 7
0 – 1 6
1 – 2 5
Watching TV No. of programmes 0 7
1 5.5
No. of movies in a week 2 5.0
3 4.5
�3 4.0
Domestic Cooking No. of roties: < 10 2.3
Morning 10 – 20 3.0
Evening �20 5.5
Washing clothes No. of persons < 5 3.5
Helping handsa 5 – 10 7.0
Yes=No �10 8.0
Washing utensils No. of persons < 5 3.5
Helping handsa 5 – 10 7.0
Yes=No �10 8.0
Care of animals No. of animals:
Milking animals: (no.) Number Number�1
Fetching of Firewood Distance: Near=far Near 3
Daily=weekly (frequency)b
Far 6
Fetching of Water Distance: Near=midway=far Near 2�No. trips
No. of trips=day Midway 4�No. trips
No. of containersc
Far 6�No. trips
Breast feeding Frequency Frequency Frequency�0.5
Other Farming Distance: Near=far Near
Whole=half day Whole day 38.5
Daily=weekly frequencyb
Half day 20.5
Far
Whole day 41.0
Half day 23.0
Labourer construction=sand workers Whole=half day Whole day 42
Daily=weekly frequencyb Half day 24
Stitching: Daily=weekly frequencyb Hours Hours�18
Machine=manually (no. of hours)
Activities other than farming Making pappadam=vermicelli Hours Hours�18
Daily=weekly frequencyb
(no. of hours)
aIn case of helping hand available the activity score is reduced by half.bFor activities performed weekly the activity score is multiplied by (respective frequency=7).cIn case of more than one container carried at a time the activity score is multiplied by number of containers.
Maternal activity and birth sizeS Rao et al
542
European Journal of Clinical Nutrition