MARK SCHEME - The Learning Space
107
1 PHYSICS 9749/01 Multiple Choice Questions 28 August 2018 1 hour Additional Materials: Multiple Choice Answer Sheet READ THESE INSTRUCTIONS FIRST Write your name and tutorial group on this cover page. Write and/or shade your name, NRIC / FIN number and HT group on the Answer Sheet (OMR sheet), unless this has been done for you. Write in soft pencil. Do not use staples, paper clips, highlighters, glue or correction fluid. There are a total of 30 Multiple Choice Questions in this paper. Answer all questions. For each question, there are four possible answers, A, B, C and D. Choose the one you consider correct and record your choice in soft pencil on the Answer Sheet (OMR sheet) provided. Read the instructions on the Answer Sheet very carefully. Each correct answer will score one mark. A mark will not be deducted for a wrong answer. Any rough working should be done in this booklet. Calculators may be used. This document consists of 25 printed pages and 1 blank page. [Turn over NAME MARK SCHEME CLASS 2T Catholic Junior College JC2 Preliminary Examinations Higher 2
-
Upload
khangminh22 -
Category
Documents
-
view
0 -
download
0
Transcript of MARK SCHEME - The Learning Space

1
PHYSICS 9749/01
Multiple Choice Questions 28 August 2018
1 hour
Additional Materials: Multiple Choice Answer Sheet
READ THESE INSTRUCTIONS FIRST Write your name and tutorial group on this cover page. Write and/or shade your name, NRIC / FIN number and HT group on the Answer Sheet (OMR sheet), unless this has been done for you. Write in soft pencil. Do not use staples, paper clips, highlighters, glue or correction fluid. There are a total of 30 Multiple Choice Questions in this paper. Answer all questions. For each question, there are four possible answers, A, B, C and D. Choose the one you consider correct and record your choice in soft pencil on the Answer Sheet (OMR sheet) provided. Read the instructions on the Answer Sheet very carefully. Each correct answer will score one mark. A mark will not be deducted for a wrong answer. Any rough working should be done in this booklet. Calculators may be used.
This document consists of 25 printed pages and 1 blank page.
[Turn over
NAME
MARK SCHEME
CLASS 2T
Catholic Junior College JC2 Preliminary Examinations
Higher 2

2 PHYSICS DATA: speed of light in free space c = 3.00 x 10⁸ m s-1 permeability of free space 0 = 4 x 10⁻⁷ H m-1 permittivity of free space 0 = 8.85 x 10⁻¹² F m-1
(1/(36)) x 10-9 F m-1 elementary charge e = 1.60 x 10⁻¹⁹ C the Planck constant h = 6.63 x 10⁻³⁴ J s unified atomic mass constant u = 1.66 x 10⁻²⁷ kg rest mass of electron me = 9.11 x 10⁻³¹ kg rest mass of proton mP = 1.67 x 10⁻²⁷ kg molar gas constant R = 8.31 J K-1 mol-1 the Avogadro constant NA = 6.02 x 10²³ mol-1 the Boltzmann constant k = 1.38 x 10⁻²³ mol-1 gravitational constant G = 6.67 x 10⁻¹¹ N m2 kg-2 acceleration of free fall g = 9.81 m s-2
PHYSICS FORMULAE: uniformly accelerated motion s = u t + ½ a t2
v2 = u2 + 2 a s
work done on / by a gas W = p V
hydrostatic pressure P = gh
gravitational potential = -
Gm
r
temperature T / K = T / ˚C + 273.15
pressure of an ideal gas p = 1
3
Nm
V⟨c2⟩
mean translational kinetic energy of an ideal gas molecule E = 3
2kT
displacement of particle in s.h.m. x = x0 sin t
velocity of particle in s.h.m. v = v0 cos t
= 22
0 xx
electric current I = Anvq
resistors in series R = R1 + R2 + ...
resistors in parallel 1/R = 1/R1 + 1/R2 + ...
electric potential V = Q
4πεor
alternating current / voltage x = x0 sin t
magnetic flux density due to a long straight wire B = μoI
2πd
magnetic flux density due to a flat circular coil B = μoNI
2r
magnetic flux density due to a long solenoid B = μonI
radioactive decay x = x0 exp(-t)
decay constant λ =
2
1
2ln
t
3
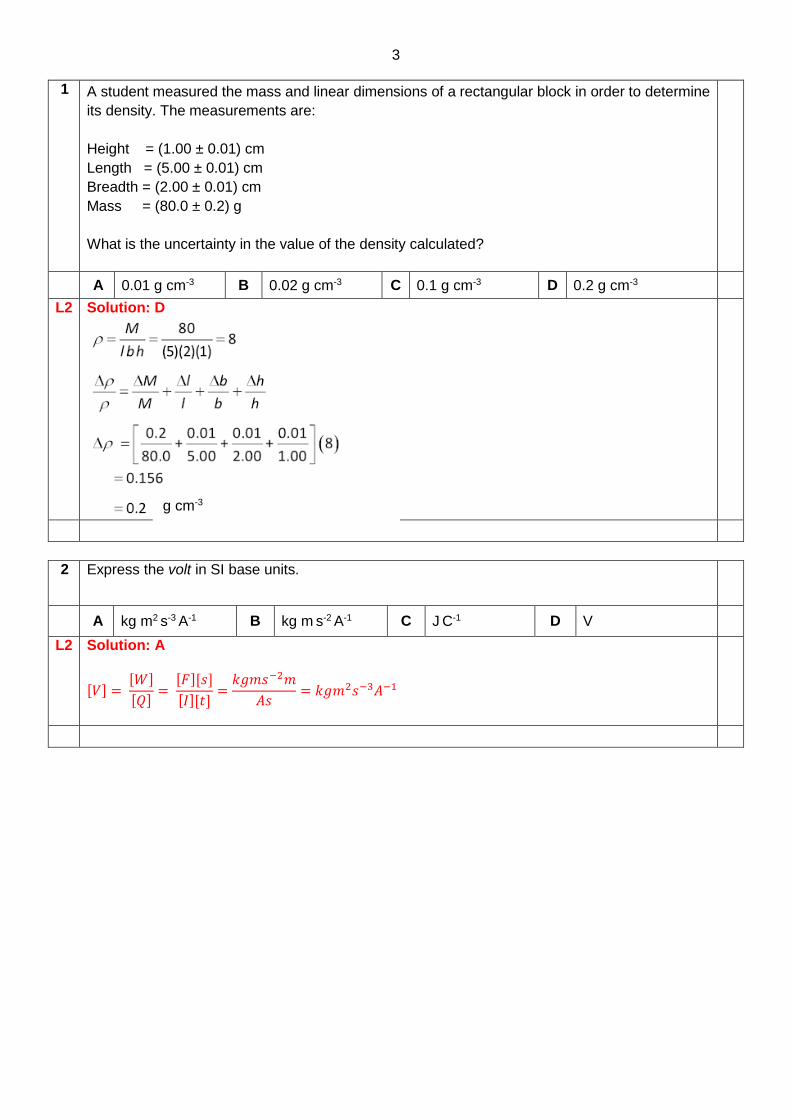
1 A student measured the mass and linear dimensions of a rectangular block in order to determine
its density. The measurements are:
Height = (1.00 ± 0.01) cm
Length = (5.00 ± 0.01) cm
Breadth = (2.00 ± 0.01) cm
Mass = (80.0 ± 0.2) g
What is the uncertainty in the value of the density calculated?
A 0.01 g cm-3 B 0.02 g cm-3 C 0.1 g cm-3 D 0.2 g cm-3
L2 Solution: D
2 Express the volt in SI base units.
A kg m2 s-3 A-1 B kg m s-2 A-1 C J C-1 D V
L2 Solution: A
[𝑉] = [𝑊]
[𝑄]=
[𝐹][𝑠]
[𝐼][𝑡]=
𝑘𝑔𝑚𝑠−2𝑚
𝐴𝑠= 𝑘𝑔𝑚2𝑠−3𝐴−1
g cm-3

4
3 A student throws a rubber ball vertically downwards at a speed of 3.0 m s-1. It hits the ground and rebounds vertically. The graph below shows the velocity-time graph for the first 1.7 s of the motion of the rubber ball
What is the displacement of the ball between the point at which it was first thrown and the highest point of the motion?
A zero B 0.4 m C 1.8 m D 3.6 m
L2 Solution: B Distance from initial point to the ground is = (0.6)(3) + ½ (6)(0.6) = 3.6 m Distance from ground to highest point = ½ (0.8)(8) = 3.2 m displacement is 3.6 – 3.2 = 0.4 m
1.4 .4v
1.7 .4
v / m s-1
8
0
-3
-9
0.6 .4v

5
4 An object is thrown vertically upwards in air in which the air resistance is not to be neglected.
If the times of flight for the upward motion tu and the time of flight to return to the same level td are compared, then
A td
> tu, because the object moves faster on its downward flight and therefore the air resistance is greater.
B td
= tu, because the effect of the air resistance is the same whether the object is moving upwards or downwards.
C td < tu, because at any given speed the net force when the object is moving downwards is
greater than the net force when it is moving upwards.
D td
> tu, because at a given speed the net force when the object is moving downwards is smaller than the net force when it is moving upwards.
L3 Solution: D Consider forces on the object when it moves upwards and it falls.
The net force in the downward motion is smaller than that in the upwards direction.
The average deceleration in the downward motion is lower than the average acceleration in the
upward motion.
Hence the time taken to rise is shorter than the time taken to fall.

6
5 A body of mass 2.0 kg is moving along a smooth horizontal surface to the right with a
constant velocity of 18 m s-1 when a left force is applied on it for 7 s. The graph below
shows how the applied force varies with time.
What is the final velocity of the body after 7 s?
A 12 m s-1 to the right
B 48 m s-1 to the right
C 12 m s-1 to the left
D 48 m s-1 to the left
L3 Solution: C The initial momentum of the body = (2.0) (18) = 36 Ns to the right The change in momentum = area under the graph = (10)(5) + (0.5)(2)(10) = 60 N s The applied force is to the left hence the change in the momentum is to the left. final momentum of the body = initial momentum + change in momentum = 36 + (– 60) = - 24 Ns to the right final velocity = - 24 / 2.0 = - 12 m s-1 to the right i.e. 12 m s-1 to the left

7
6 A fast moving neutron with an initial velocity u has a head-on elastic collision with a stationary proton. After the collision, the velocity of the neutron is v and that of the proton is w. Taking the masses of the neutron and proton to be equal, which of the following statements is incorrect?
A Since collision is elastic, it shows that u + v = w.
B The proton and the neutron move off in opposite directions with equal speeds.
C By considering kinetic energies of the particles, it can be shown that u2 = v2 + w2.
D The speed of the proton after the collision is the same as that of the neutron before the collision.
L2 Solution: B Relative velocity of approach = Relative velocity of separation
Taking vectors to the right as positive.
u – 0 = w – v
u + v = w Option A is true.
For elastic collision of the same mass, the velocities are exchanged.
Option B is incorrect
but option D is correct
Option C is correct since the total K.E. before and after collision is the same for an elastic collision.

8
7
A car is travelling on a hump with a radius of curvature of 30 m as shown in figure below. The car loses contact with the hump at the highest point.
At what speed will the car be losing contact as it moves over the hump at the highest point?
A 15.7 m s–1 B 17.2 m s–1 C 22.2 m s–1 D 29.4 m s–1
L2 Answer: B
Net force towards centre of curve provides centripetal force
mg – R = mv2/r where R is the normal contact force on car by road
car loses contact with road R = 0
v = √𝑟𝑔= 17.2 m s–1
R
mg r
9
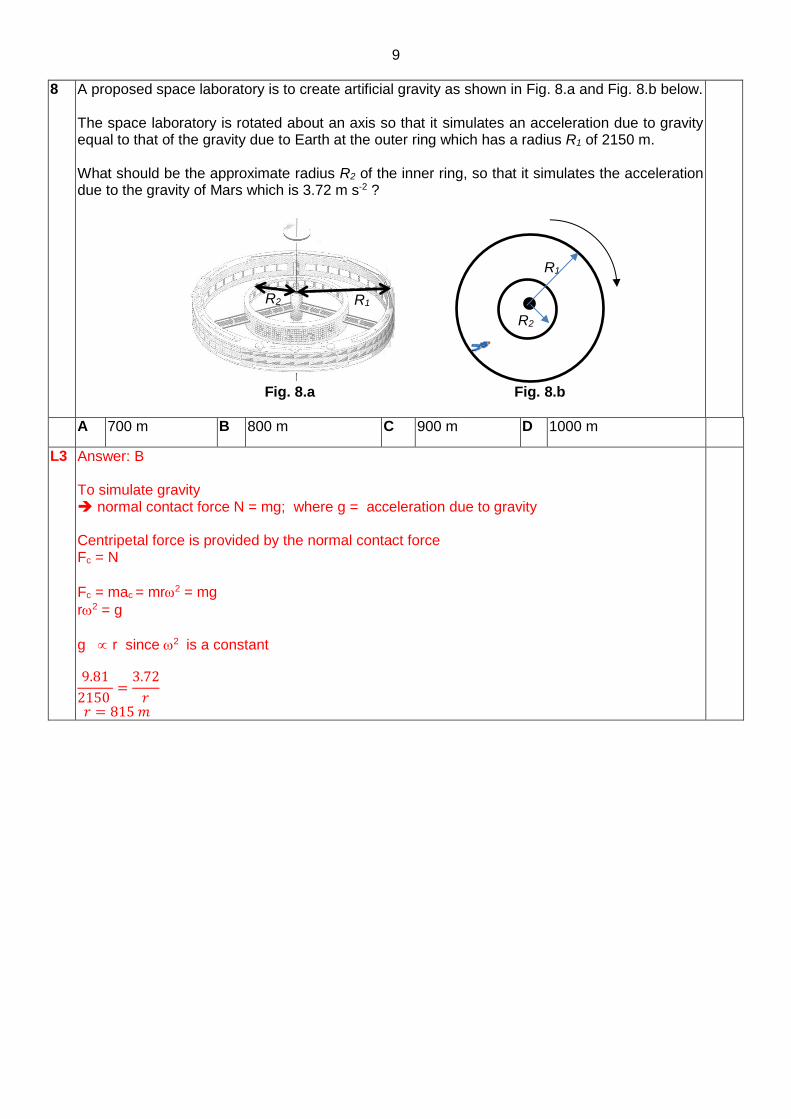
8
A proposed space laboratory is to create artificial gravity as shown in Fig. 8.a and Fig. 8.b below. The space laboratory is rotated about an axis so that it simulates an acceleration due to gravity equal to that of the gravity due to Earth at the outer ring which has a radius R1 of 2150 m. What should be the approximate radius R2 of the inner ring, so that it simulates the acceleration due to the gravity of Mars which is 3.72 m s-2 ? Fig. 8.a Fig. 8.b
A 700 m B 800 m C 900 m D 1000 m
L3 Answer: B To simulate gravity normal contact force N = mg; where g = acceleration due to gravity Centripetal force is provided by the normal contact force Fc = N
Fc = mac = mr2 = mg
r2 = g
g r since 2 is a constant 9.81
2150 =
3.72
𝑟
𝑟 = 815 𝑚
R1
R2
R2 R1

10
9 A person is located near the city of Shanghai which has a latitude of 31.28o N. Assuming that the Earth is a sphere of radius 6380 km, find the linear velocity of the person due to the rotation of the Earth about its axis.
A 240 m s-1 B 337 m s-1 C 397 m s-1 D 464 m s-1
L2 Answer: C
𝒗 = 𝒓𝝎
𝒗 = (𝟔. 𝟑𝟖 𝒙 𝟏𝟎𝟔) 𝐜𝐨𝐬 𝟑𝟏. 𝟐 (𝟐𝝅
𝟐𝟒 𝒙 𝟔𝟎 𝒙 𝟔𝟎)
𝒗 = 𝟑𝟗𝟕 𝒎 𝒔−𝟏
10 The density of a sample of helium gas at the pressure of 100 kPa is 0.180 kg m-3. The
root- mean- square speed of the helium molecules is
A 41 m s-1 B 561 m s-1 C 1290 m s-1 D 1685 m s-1
L2 Answer: C
2
rms
1 NmP= v
3 V
2
rms
1P= ρv
3
2
rms01 .10 801
)0000 = ( v3
vrms = 1290 m s-1

11
11 A car tyre, initially at o28 C , has been inflated to a pressure of 160 kPa as indicated by the
pressure gauge. This means that the pressure in the tyre is 160 kPa above the atmospheric pressure of 100 kPa.
After driving on hot roads, the temperature of the air in the tyre is o65 C .
What is the percentage increase in the pressure gauge reading?
A 10% B 20% C 200% D 270%
L3 Answer: B Taking n,R, V to be constant Using the ideal gas equation,
160 100 260 kPa
273.15 28 301.15 K
273.15 65 338.15 K
constant
260
301.15 338.15
291.94 kPa
New reading of Pressure Gauge
291.94 100 191.9 kPa
191.9 160%tage increase
i
i
f
i f
i f
f
f
P
T
T
PV nRT
P nR
T V
P P
T T
P
P
100% 20%
160x

12
12 Fig. 12a shows the variation with displacement x of the velocity v of a body in simple harmonic motion. Fig. 12b shows the variation with time t of the net force F acting on the body.
Fig. 12a Fig. 12b
Which of the points on Fig. 12b corresponds to the state of motion represented by point P on Fig. 12a?
L3 Answer: D At point P, the displacement is negative and velocity is negative. For s.h.m. net force F = ma = - mω2x, x is negative implies net F is positive (B and C not possible). As the displacement is negative and the velocity is negative, the displacement will be more negative in the next instant. Hence the force will increase positively.
13 The phase difference between 2 points at a distance 60 cm apart along a progressive
transverse wave is 2
rad.
If the frequency of the wave is 200 Hz, what is the speed of the wave?
A 240 m s-1 B 480 m s-1 C 24000 m s-1 D 48000 m s-1
L2 Answer: B
Since phase difference of 2
at distance 60 cm apart,
the wavelength = 60 x 4 = 240 cm = 2.40 m
speed = = 200 x 2.40 = 480 m s-1

13
14 A sound wave travelling towards the right through air causes the air molecules to be displaced from their original positions. The graph below shows the variation with distance of the displacement of the air molecules at a particular instant in time. Taking the displacement towards the right as positive, at which point is the pressure maximum?
L2 Answer: A Since displacement towards the right is taken as positive, we can label the directions of displacement of air molecules as follows:
It can be seen from the figure that at point A, it is a region of compression as air molecules on the left side of A is displaced to the right and on the right side of A, they are displaced to the left. Hence A has the maximum pressure.
15 In a two-slit interference experiment, one slit transmits waves of twice the amplitude compared to the other slit.
If the maximum intensity of the interference pattern is Io , what is the minimum intensity of the pattern?
A zero B 2
oI C
4
oI D
9
oI
L2 Answer: D
I A2
For maximum intensity, Io (2A +A)2
For minimum intensity, I (2A - A)2
2
3
9
A
A
o
o
I
I
II
Distance
Displacement
A
B
C
D
distance
displacement
A
B
C
D
14
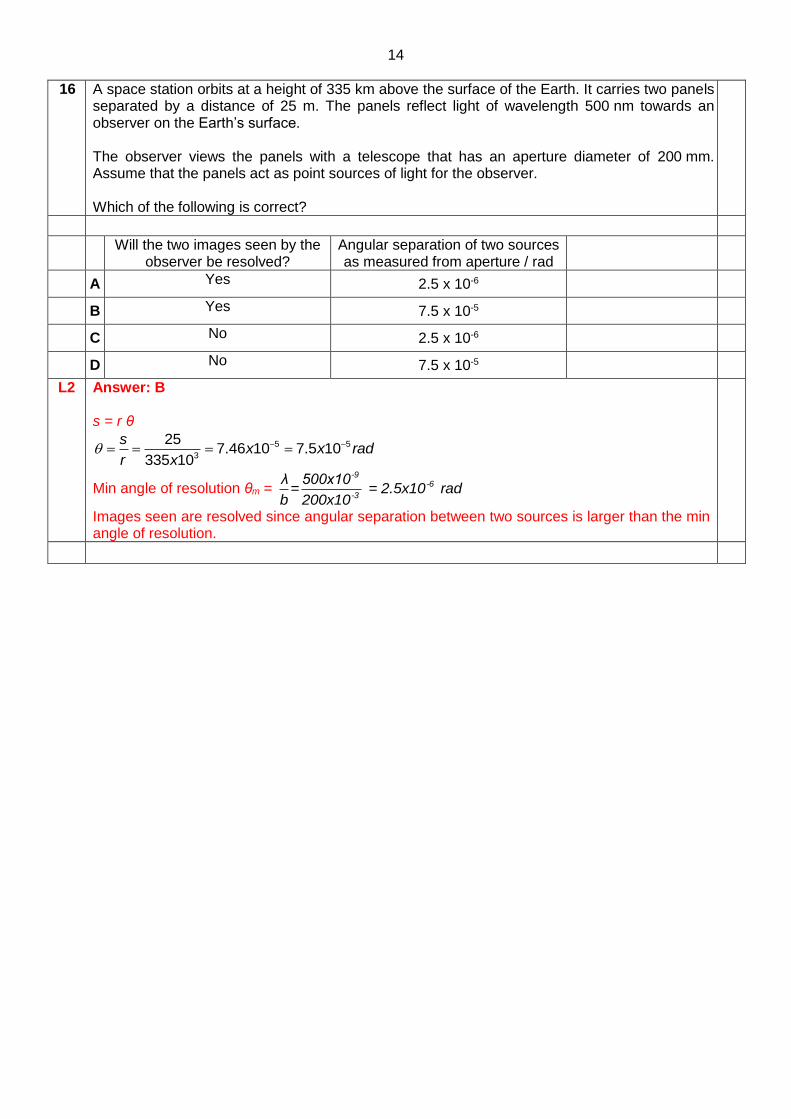
16 A space station orbits at a height of 335 km above the surface of the Earth. It carries two panels separated by a distance of 25 m. The panels reflect light of wavelength 500 nm towards an observer on the Earth’s surface. The observer views the panels with a telescope that has an aperture diameter of 200 mm. Assume that the panels act as point sources of light for the observer. Which of the following is correct?
Will the two images seen by the
observer be resolved? Angular separation of two sources as measured from aperture / rad
A Yes 2.5 x 10⁻⁶
B Yes 7.5 x 10⁻⁵
C No 2.5 x 10⁻⁶
D No 7.5 x 10⁻⁵
L2 Answer: B s = r θ
5 5
3
257.46 10 7.5 10
335 10
sx x rad
r x
Min angle of resolution θm = -9
-6
-3
λ 500x10= = 2.5x10 rad
b 200x10
Images seen are resolved since angular separation between two sources is larger than the min angle of resolution.

15
17
A region of electric field is represented by the electric field lines shown below. P, Q, R and S are 4 points in the field.
Which of the following statements is incorrect?
A The electric force on a charged particle is stronger when it is located at P than that at R.
B A positively charged particle released from rest at Q will travel along the electric field line which passes through Q.
C The electric potential energy of a negatively charged particle at S is higher than that at P.
D The electric field strength at Q is stronger than that at S.
L2 Answer: B The force on the charged particle is along the tangent of the field at a point and hence it experiences an acceleration along the tangent of the field. This implies that the change in the velocity is in the direction of the acceleration but the instantaneous velocity is not along the field line. Hence the path of the charged particle is not along the field line.
Q

16
18 A isolated metal sphere of radius 0.1 m is positively charged. A small charge was brought from
a distant point to a point 0.5 m from the centre of the metal sphere. The work done against the
electric field is W. At its final position, the electric force on the charge is F.
If the charge has been brought to a point 1.0 m from the centre of the metal sphere, what would
have been the values for the work done against the electric field and the electric force on the
charge at its final position?
work done against
electric field
force on charge at its final position
A W
4
F
4
B W
4
F
2
C W
2
F
4
D W
2
F
2
L2 Answer: C Treating the sphere as a point source,
At 0.5 m F =kqsphereq
0.52
At 1.0 m Fnew =kqsphereq
1.02 = 1
4
kqsphereq
0.52 =1
4F
At 0.5 m W = U = kqsphereq
0.5
At 1.0 m Wnew=kqsphereq
1.0=
1
2
kqsphereq
0.5=
1
2W

17
19 The electrical potential difference between two points in a wire carrying a current is
A the ratio of the power supplied to the current between the points.
B the force required to move a unit positive charge between the points.
C the ratio of the energy dissipated to the current between the points.
D the product of the square of the current and the resistance between two points.
L2 Answer: A
V = W/Q = P/I it can be expressed as the ratio of P to I.
20 An electrical source with internal resistance r is used to operate a lamp of resistance R.
What fraction of the total power is delivered to the lamp?
A
R + r
R
B R − r
R
C R
R+ r
D R
r
L2 Answer: C
PL
Ptot
=I2R
I2R+I
2r
=R
R+ r
21 A high potential is applied between the electrodes of a hydrogen discharge tube so that the gas is ionised. Electrons then move towards the positive electrode and protons towards the negative electrode. In each second, 7 x 10¹⁸ electrons and 2 x 10¹⁸ protons pass a cross section of the tube. The current flowing in the discharge tube is
A 0.32 A B 0.80 A C 1.12 A D 1.44 A
L2 Answer: D Since the electrons and protons are moving in opposite directions, the total current is the sum of the current due to both charges
I = Neq
e
t+
Npqp
t
= (7×10
18
1+
2×10¹⁸
1) ×(1.6×10
-19)
= 1.44 A

18
22
Six 5 resistors are connected to a 2 V cell of negligible internal resistance, as shown in the
figure below.
The potential difference between X and Y is
A 0 V B
2
3 V C
8
9 V D
4
3 V
L2 Answer: B The diagram can be re-drawn as shown:
the resistors are all with the same resistance,
the potential drop across each resistor =1
3(2)=
2
3 V
potential at X is = 2
3 V.
potential at Y is 2 x 2
3 =
4
3 V.
potential difference between XY is 4
3-2
3=
2
3 V

19
23 When an alternating power supply of 240 V r.m.s. is connected across PQ in the circuit shown below. The fuse F breaks the circuit if the current in it just exceeds 13 A r.m.s.
When the alternating power supply is replaced with a 120 V d.c. source, an identical fuse breaks the circuit if the current just exceeds
A 13
2 A B
13
√2 A C 13 A D 26 A
L2 Answer: C As the r.m.s current is the equivalent dc current for the same power dissipation in the same resistor, since the fuse breaks when the a.c. r.m.s. current is 13 A, this implies that the fuse will also break at d.c. current of 13 A.

20
24 An alternating power supply of root-mean-square voltage 4.0 V is connected across a resistive load such that the average power dissipated across it is P. What is the d.c. voltage applied across the same load which will give rise to an average power dissipation of 3P ?
A 6.9 V B 8.5 V C 12 V D 17 V
L2 Answer: A For an alternating supply, <P> = P
P =Vrms
2
R ……(1)
Across the same load, to have average power to be 3P,
⟨P⟩new =Vrms
2
new
R
3P= Vrms
2new
R …(2)
(1) / (2)
1/3 =
Vrms2
R
Vrms2
newR
Vrms, new =√3Vrms2=√3(4)2 = 6.9 V

21
25 A piece of wire WXYZ is pivoted freely about a horizontal axis at points W and Z. Section XY of the wire is situated between the North (N) and South (S) poles of a horse-shoe magnet. WXYZ is connected to an electrical circuit.
What will happen to the wire, if any, when the circuit is just turned on and there is a constant
current I in the wire as shown?
A swings to the left
B swings to the right
C swings from X to Y
D remains at rest at its original position
L1 Answer: A By Fleming’s left hand rule, the force acting on the wire section XY will be towards the left.

22
26
In the diagram below, the solenoid of length l which is closely and uniformly wound, carries an alternating current of constant amplitude. A search coil (which is a coil consisting of a few turns of wires) is placed in different positions along the solenoid.
Which one of the following graphs most nearly shows how the amplitude of the e.m.f. E induced in the search coil varies with its position?
A
B
C
D
L3 Answer: D As the current in the solenoid is alternating, the amplitude of the e.m.f. induced in the search coil is proportional to the max magnetic flux density which varies sinusoidally The maximum magnetic flux density along the length of the solenoid is uniform since it is long. The maximum magnetic flux density near the ends decreases. Hence maximum e.m.f. induced in the search coil is almost constant along the length of the solenoid and decreases at the ends.
x x

23
27 The diagram below shows a typical X-ray spectrum produced by an X-ray tube.
The operating voltage across the X-ray tube is increased. Which of the following gives
the corresponding changes, if any, in 1 and 2?
1
2
A no change no change
B no change decrease
C decrease no change
D decrease decrease
L2 Answer: A
1 and 2 is only dependent on the target.
intensity
1 2 wavelength

24
28 The diagram below shows a simplified representation of the three electron energy levels in an atom.
Cool vapour of this element at low pressure is bombarded with electrons accelerated from rest across a potential difference V. Two possible transitions which result in the emission of
photons of wavelengths 1 = 6.22 × 10⁻⁷ m and 2 = 1.78 × 10⁻⁷ m are observed. What is the minimum value of V for the above transitions to occur?
A 1.56 V B 2.80 V C 7.00 V D 9.00 V
L2 Ans: D Minimum energy of the electrons = hc/λ1 + hc/λ2 = 1.44 x 10⁻¹⁸ J Since E = qV => V = E/e = 1.44 x 10⁻¹⁸ / 1.6 x 10-19 = 9 V
the outermost electron in the sodium atom.
E3
E2
E1
λ1
λ2
E3
E2 E1
1
2

25
29 A stationary uranium nucleus of mass 238 units disintegrates by the emission of an α-particle of mass 4 units.
The ratio isnucleus daughter recoiling the ofenergy kinetic
particle the ofenergy kinetic -α
A 4
238 B
4
238 C
234
4 D
238
4
L3 Ans: C The reaction can be represented by
He ThU 42
23490
23892
By principle of conservation of momentum, (238 – 4) Vth = 4 Vα
where Vth : velocity of the recoiling thorium nucleus and vα : velocity of the
4
234
th
α
V
V
Ratio of the kinetic energies is
4
234
4
234
234
4
234
4
nucleus thorium recoiling the ofenergy kinetic
particle the ofenergy kinetic 2
2th
2
V
Vα
30 The half-life of a certain radioactive material is 3.0 s.
How long does it take for its activity to become 10 % of the original activity?
A 0.46 s B 5.4 s C 10 s D 15 s
L2 Ans: C
= In 2 / t ½ = In 2 / 3
A = Ao e - t
In (A / Ao) = - t In 0.1 = - (In2 /3) t t = 10 s
particleα

1
CANDIDATE NAME
MARK SCHEME
CLASS 2T
PHYSICS 9749/02 Paper 2 20 August 2018
2 hours
Candidates answer on the Question Paper.
READ THESE INSTRUCTIONS FIRST Write your name and class on all the work you hand in. Write in dark blue or black pen in the space provided. [PILOT FRIXION ERASABLE PENS ARE NOT ALLOWED]
You may use a soft pencil for any diagrams, graphs or rough working. Do not use staples, paper clips, highlighters, glue or correction fluid.
The number of marks is given in brackets [ ] at the end of each question or part of the question.
This document consists of 26 printed pages and 0 blank page.
[Turn over
FOR EXAMINER’S USE DIFFICULTY
L1 L2 L3
Q1 /6
Q2 /10
Q3 /7
Q4 /8
Q5 /5
Q6 /7
Q7 /10
Q8 /8
Q9 /20
TOTAL FOR
PAPER 2 / 80
Catholic Junior College JC2 Preliminary Examinations
Higher 2
2 PHYSICS DATA: speed of light in free space c = 3.00 x 10⁸ m s-1 permeability of free space 0 = 4 x 10⁻⁷ H m-1 permittivity of free space 0 = 8.85 x 10⁻¹² F m-1
(1/(36)) x 10-9 F m-1 elementary charge e = 1.60 x 10⁻¹⁹ C the Planck constant h = 6.63 x 10⁻³⁴ J s unified atomic mass constant u = 1.66 x 10⁻²⁷ kg rest mass of electron me = 9.11 x 10⁻³¹ kg rest mass of proton mP = 1.67 x 10⁻²⁷ kg molar gas constant R = 8.31 J K-1 mol-1 the Avogadro constant NA = 6.02 x 10²³ mol-1 the Boltzmann constant k = 1.38 x 10⁻²³ mol-1 gravitational constant G = 6.67 x 10⁻¹¹ N m2 kg-2 acceleration of free fall g = 9.81 m s-2
PHYSICS FORMULAE: uniformly accelerated motion s = u t + ½ a t2
v2 = u2 + 2 a s
work done on / by a gas W = p V
hydrostatic pressure P = gh
gravitational potential = -
Gm
r
temperature T / K = T / ˚C + 273.15
pressure of an ideal gas p = 1
3
Nm
V⟨c2⟩
mean translational kinetic energy of an ideal gas molecule E = 3
2kT
displacement of particle in s.h.m. x = x0 sin t
velocity of particle in s.h.m. v = v0 cos t
= 22
0 xx
electric current I = Anvq
resistors in series R = R1 + R2 + ...
resistors in parallel 1/R = 1/R1 + 1/R2 + ...
electric potential V = Q
4πεor
alternating current / voltage x = x0 sin t
magnetic flux density due to a long straight wire B = μoI
2πd
magnetic flux density due to a flat circular coil B = μoNI
2r
magnetic flux density due to a long solenoid B = μonI
radioactive decay x = x0 exp(-t)
decay constant λ =
2
1
2ln
t

3
1 A hydroelectric power station could make a significant contribution to energy requirements. Fig. 1.1 shows a dam at the hydroelectric power station which traps water behind a dam. When the height of the water behind the dam reaches 10.0 m, the water is released and passed through the turbines.
(a) It takes 6.0 hours for a total mass of 1.32 x 10¹² kg of water to flow through the turbines. The centre of mass of this amount of water is 5.0 m above the turbines. Calculate the loss in the potential energy of the trapped water when it is released through the turbines completely. Assume that the density of the water is uniform.
loss in the potential energy = ………………………………..J
[2]
L1 Loss in potential energy = mgh = 1.32 x 1012 x 9.81 x 5.0 (since the average height of the water is 5.0 m) = 6.5 x 10¹³ J
Examiners’ Comments: Candidates that did not gain full credit for this section did not use 5.0 m but
instead used 10.0 m.
M1 A1
(b) The potential energy calculated in part (a) is lost over a time period of 6.0 hours and the efficiency of the power station is 40 %. Calculate the average power output of the power station over this time period of 6.0 hours. [3]
L2 Power from sea water = gravitational energy lost / time = 6.5 x 10¹³ / 6.0 x 3600 = 3000 x 106 W
M1 M1 A1
Fig. 1.1
tidal barrier
turbines
10.0 m

4
Average power output = 3000 x 106 x 0.40 = 1200 MW
Examiners’ Comments: Candidates that did not gain full credit did not realise the energy efficiency
refers to the conversion of mechanical to electrical energy and that the mechanical energy is simply the loss in gravitational energy calculated in part (a).
(c) Suggest how the output power of the hydroelectric power station can be controlled as the level of trapped water decreases.
…………………………………………………………………………………………………………. …………………………………………………………………………………………………………. ………………………………………………………………………………………………………..…
[1]
L3 There are valves within the dam that controls and regulates the flow of water into the turbines.
Examiners’ Comments: Candidates that did not gain full credit did not mention about the control of
the amount of water flowing through the turbines that affects the power output. Candidates need not quote valves or wicket gates to gain full credit.
B1
2 In a binary star system, two stars, each of equal mass 3.5 x 1030 kg, rotate about their common centre of mass O which is equidistant from the centres of the stars. The separation between the two centres of the stars is 2.0 x 10¹¹ m.
O, centre of mass of the two stars
Star N
Star M
X
Y

5
(a) Define gravitational potential at a point.
………………………………………………………………………………………………………… ………………………………………………………………………………………………………… ………………………………………………………………………………………………………… [1]
L1 The gravitational potential at a point is the work done per unit mass by an external agent in bringing a point mass from infinity to that point.
Examiners’ Comments: Candidates are reminded to take note of the key words in definitions.
B1
(b) Calculate the gravitational potential at O, the centre of mass of the binary star system. [2]
L2 𝐺𝑟𝑎𝑣𝑖𝑡𝑎𝑡𝑖𝑜𝑛𝑎𝑙 𝑝𝑜𝑡𝑒𝑛𝑡𝑖𝑎𝑙 𝑎𝑡 𝑡ℎ𝑒 𝑐𝑒𝑛𝑡𝑟𝑒 𝑜𝑓 𝑚𝑎𝑠𝑠 𝑂
= (−𝐺𝑚
0.5𝑑) + (−
𝐺𝑚
0.5𝑑)
= −4𝐺𝑚
𝑑
= −4(6.67 𝑥 10−11)(3.5 𝑥 1030)
2.0 𝑥 1011
= −4.67 𝑥 109𝐽𝑘𝑔−1 Where d is the separation between the two stars.
Examiners’ Comments: Candidates that did not gain full credit did not pay attention to the negative
sign for gravitational potential. The formula is given in the formulae list.
Candidates that did not gain full credit did not consider the significance of the
denominator for the formula −𝑮𝒎
𝒓 and simply substitute the value given as the
separation between the two stars.
Candidates are strongly advised not to use the modulus sign here.
M1 A1
(c) An asteroid passes through point O, at a speed v. Determine the minimum speed of the asteroid if it is to escape from the gravitational pull of the binary star system.
minimum speed = ………………….. m s-1 [3]
L2 By the principle of conservation of energy, Loss in kinetic energy of the asteroid = Gain in gravitational potential energy of the asteroid as it completely leaves the gravitational pull of the binary star system
0 −1
2𝑚𝑣2 = −
4𝐺𝑀𝑚
𝑑− 0
𝑣 = √8𝐺𝑀
𝑑
M1
M1

6
= √8(6.67 𝑥 10−11)(3.5 𝑥 1030)
2.0 𝑥 1011
𝑣 = 9.66 𝑥 104 𝑚𝑠−1
Examiners’ Comments: Candidates must explain the change in the energies where the asteroid loses
kinetic energy and hence gains gravitational energy as it escapes the gravitational pull of the binary star system.
Candidates cannot memorize the formula for escape speed and use it casually. The conditions for the derivation for the escape speed may not be the same for difference contexts for any particular question.
Some candidates did not visualize the scenario carefully and quoted that the centripetal force is provided by the gravitational force when the asteroid is not in a circular motion.
A1
(d) (i) On Fig.2.1, sketch a graph showing the variation of gravitational potential along the line XY between the two stars.
[2]
Fig. 2.1
L2
Gravitational Potential / J Kg-1 Gravitational Potential / J Kg-1
gravitational potential / J kg-1 gravitational potential / J kg-1
Star M X Y Star N

7
M1 – The points are all negative where the turning point is at the centre of mass M1 – Symmetrical downward concave shape, ends of the curve to touch dotted lines
Examiners’ Comments: Candidates that did not gain full credit did not realise that the graph
plotted is the resultant gravitational potential graph due to both stars. This is expected for all candidates to know for the ‘A’ level examination.
Some candidates plotted for gravitational field strength instead.
Many graphs were clearly memorized but did not take into account the context of the question.
(ii) Hence describe the variation in gravitational potential energy of an object moving from O towards star M.
………………………………………………………………………………………… ………………………………………………………………………………………… ………………………………………………………………………………………… [2]
L2 The gravitational potential energy of the object will decrease as it moves towards one of the stars. As the object leaves the centre of mass, the gravitational potential decreases at an increasing rate and since the mass of the object is constant, the gravitational potential energy of the object decreases.
Examiners’ Comments: Candidates that did not gain credit did not realise this is a hence question
and they have to refer to their part (i) answer to score full credit here.
Candidates are advised not to quote magnitude of gravitational potential and that it is a scalar quantity.
Candidates need to be aware that gravitational potential decreases as it becomes more and more negative.
B1 B1
3 (a) Define specific latent heat.
…………………………………………………………………………………………………………… ……………………………………………………………………………………………………………

8
……………………………………………………………………………………………………………
[1]
L1 Solution: is a value that is numerically equal to the thermal energy transferred when unit mass of a substance changes state, without any change of temperature. Examiner’s Comments: Do not use “energy required” or “needed” as these terms indicate energy absorbed which is not just the case. Bear in mind that there is energy release as well. Some weaker students quoted specific heat capacity definition. Usually students did not give the complete definition as they missed out key terms.
B1
(b) A beaker containing a liquid is placed on a balance, as shown in Fig. 3.1.
A heater of power 120 W is immersed in the liquid. The heater is switched on and, when the liquid is boiling, balance readings M are taken at corresponding times t. A graph of the variation with time t of the balance reading M is shown in Fig. 3.2.
Fig. 3.2
Fig. 3.1

9
(i) State the feature of Fig. 3.2 which suggests that the liquid is boiling at a steady rate.
…………………………………………………………………………………………………….. ……………………………………………………………………………………………………..
[1]
L3 Solution: Straight line graph with constant gradient (Note: total mass M decreases linearly with time which means that mass of liquid evaporated increases linearly with time) Examiner’s Comments: Question that was mostly done well. Remember to mention “gradient” which is a graph feature.
B1
(ii) Use data from Fig. 3.2 to determine a value for the specific latent heat of vaporisation lv of the liquid. Explain your working.
lv = …………………………………. J kg-1
[3]
L3 Solution: Q = Pt = mlv (where m is the mass that has evaporated)
P = m
t lv
m
t=
M
t
(Note:
M
t
is a negative gradient of the graph in Fig 3.2 [where ΔM is the
mass loss]
Since gradient of graph = -M
t
P = (M
t
)lv or [power = - gradient × lv]
Determine gradient of graph (or two points separated by at least 3.5 minutes)
120 = lv ×
3372 – 325 10
7.0 0 60
lv = 1.07 × 10⁶ J kg-1 (accept 2 s.f.) [will get a negative gradient but times negative will become positive]
B1 M1 A1

10
Examiner’s Comments: Students are advised to use a “large gradient triangle” rather than small one to determine latent heat. There were some who did not realise that mass was in grams and they needed to convert to kg or that time was in min and that they need to convert to s. Most scored two marks because they did not explicitly highlight how mass loss is related to mass evaporated which is the B1 mark. Do note that answers are expected to be left in standard form.
(c) State, with a reason, whether the experimental value determined in (b)(ii) is likely to be an overestimate or an underestimate of the expected value for the specific latent heat of vaporisation of the liquid.
…………………………………………………………………………………………………………… ……………………………………………………………………………………………………………
[2]
L3 Solution: some energy/ heat is lost to surroundings so value is an overestimate In calculating for lv in part bii, heat lost was not taken into consideration
P = (M
t
)lv
However, if heat lost is taken into consideration,
P = (M
t
)lv + Q
lv will be a smaller value. Therefore, lv found in bii is an overestimation. Examiner’s Comments: A reason (heat lost to surroundings) must be given in order to earn marks for stating it is an overestimate. Some got the reason right but do not know how this is an overestimate.
B1 B1
4 (a) Describe one condition necessary for observable two-source interference fringes to be formed.
…………………………………………………………………………………………………………… ……………………………………………………………………………………………………………
[1]
L1 Solution: The sources must be coherent; i.e. they must maintain a constant phase difference with respect to each other. OR The two wave sources must also emit waves of roughly the same amplitude. Examiner’s comments: This is a very contextual situation where question is asking for CRITICAL conditions for OBSERVABLE fringes to be viewed. Do not give generic conditions such as same nature for example as this is the basic condition required for the principle of superposition.
B1 B1
(b) Two microwaves transmitters produce waves of the same frequency are placed at P and Q which are at a distance of 2d apart. Points Y and Z are equidistant from O. The line YXZ is perpendicular to OX, as shown in Fig. 4.1.

11
Fig. 4.1
(i) The waveforms of the microwaves from P and Q arriving at point Y vary with time as shown in Fig. 4.2.
Fig. X.2
1. State and explain if the waves arriving at Y are coherent.
………………………………………………………………………………………………. ……………………………………………………………………………………………….
[2]
L2 Solution: They are coherent as the phase difference between them is a constant value of π. Examiner’s Comments: Weaker students are still unclear what coherence is and think that the waves must be in phase. This is not what its meaning is.
B1 B1
2. Explain why a minimum intensity is detected at Y.
………………………………………………………………………………………………. ……………………………………………………………………………………………….
[1]
P
Q
2d O
Y
X
Z
d

12
L1 Solution: From the graph, the waves arrive at point Y in antiphase, and interfere destructively. Examiner’s Comments: It is good to justify why destructive interference occurs by providing evidence from the graphs that the two waves meet π radians out of phase.
B1
(ii) Show that the path difference of the waves arriving at point Y from P and Q is 0.625d.
[1]
L1 Solution:
Path difference, = QY – PY = 2 2 2 26 +3 - 6 +1 d
= 0.625 d Examiner’s Comments: Mostly well done. Note that for a “show” question, all detailed working must be given such as the working to determine QY and PY.
B1
(iii) As a detector is moved along a straight line from X to Y, it encountered three intensity maxima, including the maximum at X. Determine the frequency of the wave in terms of d.
frequency = …………………Hz
[3]
L2 Solution: 3rd order minimum is formed at Y (can see from graph that the waves meet in antiphase, hence destructive interference occurs.) Path difference = 0.625 d = 2.5 λ λ = 0.25 d From v = f λ
vf =
λ
83.0x10
df =
0.25
M1 M1 A1

13
= x
d
91.2 10Hz (allow for ecf)
Examiner’s Comments: Most students do not understand how to use data from the question that mentions that there are 3 maximum encountered treating the central max as one of them. Some do not realize that it is a minimum at Y even though it was explicitly mentioned in bi2. At the central max, path difference is 0. The first min above that has a path difference of 0.5 λ, the first max is 1 λ, the 2nd min is 1.5 λ, the 2nd max is 2 λ, the 3rd min is at Y and has a path difference of 2.5 λ. This is when the 2 sources are in phase. Students also need to learn to use their answers in previous part (ii) to get hints for what to do.
5 In a simple experiment to find the wavelength of monochromatic red light emitted by a laser, a fine beam of red laser light is incident on a diffraction grating as shown in Fig.5.1. The diffraction grating has 300 lines per millimeter and it is set so that its plane is normal to the incident light.
Fig. 5.1 Bright spots are observed at 0.46 m and 1.00 m from the central spot on a screen, which is 2.00 m from the grating.
(a) By considering the bright spot at 0.46 m from the central spot, calculate the wavelength of the laser light.
wavelength = ……………………. m
[3]
L2 Solution:
The first order maximum is diffracted at an angle θ = tan-1
(0.46/2.00) = 12.95 o
. From d sin θ = nλ
where d = 1/N = 1/300 x 103
and n = 1
3
sin12.95=1 x λ
300 x 10
⇒ λ = 7.47 x 10⁻⁷
m Examiner’s comments: This is a standard diffraction grating question but many students do not know how to find d. Quite a number of students also gave the equation for young’s double slit not realizing why they cannot use it as the spacing between fringes relative to distance between screen and grating is about the same order of magnitude.
B1 B1 A1
1.00 m
0.46 m
grating
laser
2.00 m

14
(b) Suggest and explain an experimental advantage of obtaining the wavelength of the laser light by using the second-order diffracted light rather than the first-order diffracted light.
……………………………………………………………………………………………………. ……………………………………………………………………………………………………. ……………………………………………………………………………………………………. …………………………………………………………………………………………………….
[2]
L3 Solution: Using the second-order diffracted light to measure the wavelength is more accurate. This is because the larger angle of diffraction can be measured experimentally with a lower percentage error for a given precision of the measuring instrument used. Examiner’s Comments: Students must explain correctly to score marks in this question. Please note that we can use a spectrometer to help us experimentally determine the diffraction angle here.
B1 B1
6 (a) Define magnetic flux density.
…………………………………………………………………………………………………………… …………………………………………………………………………………………………………… …………………………………………………………………………………………………………… [2]
L1 Solution: It is the force experienced per unit length of wire carrying per unit electric current when placed inside a magnetic field, with the conductor placed perpendicular to the magnetic field.
Examiners’ Comments: This is a question which emphasizes on the ratio relationships between the quantities used. Many candidates did not pay attention to this, stating “1A of current, 1m of length”.
B1
B1
(b) Fig. 6.1 shows a long, straight, vertical wire WX, carrying a current of 9.0 A downwards. A second long, straight wire YZ is placed horizontally, and carries a current of 12.0 A in the direction shown.

15
Fig. 6.1 ABCD is a horizontal, rectangular table-top: the wire YZ is parallel to the side BC of this table, and the wire WX passes through a small hole in the table. The perpendicular distance between the wires is 100 mm. P is the point 50 mm from YZ along the perpendicular between the wires.
(i) Determine the magnitude of the magnetic flux density at the point P due to WX only.
magnetic flux density at P due to WX = ……………..…. T [2]
L1 Solution:
BWX, P= μ
0IWX
2πrp
= (4π×10
-7 )(9.0)
2π(50×10-3)
=3.6×10⁻⁵
T
Examiners’ Comments: Although most candidates used the correct equation, many did not substitute the correct distance.
M1
A1
(ii) Determine the magnitude of the net magnetic flux density at the point P.
net magnetic flux density at P = ………………. T [3]
L3 Solutions
BYZ, P= μ
0𝐼𝑌𝑍
2πrp
= (4π×10
-7 )(12.0)
2π(50×10-3)
=4.8×10⁻⁵
T
Bres = √BWX, P2+BYZ, P
2
= √(3.6×10⁻⁵)
2+ (4.8×10
-5)2
= 6.0×10⁻⁵
T
C1 M1 A1

16
Examiners’ Comments: There is a significant number of candidates who were not aware of the vector nature of the flux density, thus doing a scalar addition of the densities involved.
7 A spring is attached to the middle of a horizontal wooden rod AB. A U-shaped metal wire ASTB is
attached to the rod AB. The U-shaped wire is placed with side ST in a region of uniform magnetic flux pointing out of the page, as shown in Fig. 7.1
Fig. 7.1 The frame is then pulled down a distance of 1.0 cm and then released. The wire ST undergoes simple harmonic motion.
(a) (i) Using Faraday’s law of electromagnetic induction, explain why there is an induced e.m.f. in the wire ST while it is in motion
……………………………………………………………………………………………………… ……………………………………………………………………………………………………… ……………………………………………………………………………………………………… ……………………………………………………………………………………………………… ………………………………………………………………………………………………………
[3]
L2 As the frame is in motion, the wire ST cuts the magnetic field and there is a rate of change of magnetic flux linkage The e.m.f. induced is proportional to the rate of change of flux linkage Hence there is an induced e.m.f. in the wire ST.
B1 B1 B1
A B

17
Examiners’ Comments: Many candidates are not clear in their explanation of how magnetic flux linkage change, stating that there is a change in the area of the loop, rather than the change in the area swept by the wire. Many are also not precise in the statement of the change in flux linkage, instead they also acknowledge the change of flux only. Take note that Faraday’s Law speaks of the change in the flux linkage.
(ii) Explain why the induced e.m.f. varies sinusoidally with time,
……………………………………………………………………………………………………… ……………………………………………………………………………………………………… ………………………………………………………………………………………………………
[2]
L3 Solution: As the frame oscillates, its velocity will vary in a sinusoidal manner. Therefore, the rate of change of magnetic flux linkage will also change sinusoidally. Since the emf across ST is proportional to the rate of change of magnetic flux linkage, it will also vary sinusoidally.
Examiners’ Comments: Candidates need to acknowledge that the variation of the flux linkage will affect the variation of how emf changes. Thus, they have to contextualize the situation and note the there is NO angular change in anyway (as opposed to the tutorial question on AC generator).
B1
B1
(b) The wooden rod AB is replaced by a metal rod. The frame is then set to oscillate as in (a).
(i) Sketch the time variation of the induced e.m.f. observed on Fig. 7.2. Explain your answer.
Fig. 7.2 [3]
L2 Solution:
e.m.f./ V

18
1 mark: sinusoidal e.m.f with decreasing amplitude The induced current results in a magnetic force on the metal wire ST which opposes the motion of the frame ASTB and hence the oscillation is damped. This affects the maximum speed and hence induced e.m.f in the frame. Therefore, amplitude of e.m.f decreases.
Examiners’ Comments: Many candidates did not realise that there is a damping effect due to the force present. Thus, many sinusoidal graphs did not indicate a decrease in the maximum emf.
B1
B1
(ii) Explain, how your graph in Fig. 7.2 will change, if any, when the metal rod AB and the wire ASTB are now inside the magnetic field.
……………………………………………………………………………………………………… ……………………………………………………………………………………………………… ………………………………………………………………………………………………………
[2]
L3 Solution: Case 1 (considering the whole loop) The oscillation will be undamped and the amplitude will be unchanged because there is no e.m.f. induced in the frame and there will be no current in the loop and there is no electromagnetic damping. OR There is no change in the magnetic flux linkage, thus there is no emf induced. Thus, the graph is a straight horizontal line, cutting the emf = 0. Case 2 (considering ST) Net emf induced is zero, therefore no current within rod ST, thus, no damping force. The graph drawn in Fig 7.2 remains the same.
Examiners’ Comments: Candidates must indicate the description of the graph in their solutions, as required by the question.
B1
B1
8 (a) (i) State what is meant by the photoelectric effect.
……………………………………………………………………………………………………
e.m.f./ V

19
……………………………………………………………………………………………………… ………………………………………………………………………………………………………
[1]
L1 Photoelectric effect is a phenomenon in which electrons are emitted from the surface of a metal when it is irradiated with electromagnetic radiation of high enough frequency. Examiner’s Comment: The photoelectric effect was peculiar because the emission of electrons only happened with EM wave of high enough frequency. There is a concerning number of students confused this effect with the X-ray Spectrum.
(ii) Describe the principal features that are observed in the photoelectric effect that support the particulate nature of electromagnetic radiation.
……………………………………………………………………………………………………… ……………………………………………………………………………………………………… ……………………………………………………………………………………………………… ……………………………………………………………………………………………………… ……………………………………………………………………………………………………… ……………………………………………………………………………………………………… ………………………………………………………………………………………………………
[3]
L2 Experimental observations which support the particulate nature of em radiation are 1. There is a minimum frequency below which no photoelectric emission of electrons is
possible, even with very intense radiation. 1. 2. The maximum KE of the emitted electrons increases with the frequency of the radiation. 2. The max KE does not depend on the intensity of the radiation. 3. 3. Photoelectrons are emitted almost immediately when radiation was incident; no time
lag was observed. 4. 4. The rate of emission of photoelectrons is proportional to the intensity of the incident
radiation. Max three marks. Examiner’s Comment: Only point 1 to 3 supported the concept that EM radiation consists of photons. Point 4 can be explained using wave. Many answers did not contain the necessary requirements of describing the “experimental observations” but gave the explanation of the phenomenon using photons
B1
B1
B1
(b) A low pressure sodium lamp produces an intensity of 0.2 W m-2 of yellow light of frequency 4.55 x 10¹⁴ Hz at a distance of 5.0 m from the lamp.
(i) Assuming that the lamp acts a point source, show that the intensity a distance 20 m from the lamp is 0.013 W m-2.
[1]
L2 Solutions For a point source of constant power, intensity is inversely proportional to the distance
from the source, i.e. I 1/ r2

20
I’ / I = (1/r’2) / (1/r2) = (r/r’)2
I’ / 0.20 = (5/20)2 I’ = 0.013 W m-2 Examiner’s Comment: Since this is the show question, the reasoning is more important than the answers. Quite a number of answers simply manipulated numbers to get the final answers without explaining. Common errors also include a wrong identification of the area of a sphere.
M1
(ii) Estimate the number of photons per second that would strike a piece of A4 size paper which is held 20 m perpendicular to the light from the lamp.
number of photons per second = …………………… s-1
[3]
L2 Solutions Energy of each photon = hf = 6.63 x 10-34 x 4.55 x 1014 = 3.02 x 10⁻¹⁹ J Estimate area of writing paper = 0.15 x 0.30 m2 Intensity = E / t A = Nhf / t A = (N/t) hf / A 0.013 = (N/t) 3.02 x 10⁻¹⁹ J / 0.15 x 0.30 N/t = 1.94 x 10¹⁵ Examiner’s Comment: Many answers did not have the estimation of an A4 size paper.
A1
M1 A1

21
9 The bow is a powerful two-arm string machine used for archery. Figure. 9.1 shows the three types
of bows, namely the Longbow, the Recurved and the Compound bow.
Fig. 9.1
Each bow consists of a limb, a handle and a as shown in Fig.9.2. The distance between the string and the bow handle at rest is known as the bracing distance. When a bow is drawn by the fingers of the archer, the string is not stretched but the shape of the bow is changed and bent and the string is displaced by a drawing distance. The shaft of the arrow is rested on the handle and the tail of the arrow is rested on the middle of the string.
Fig. 9.2
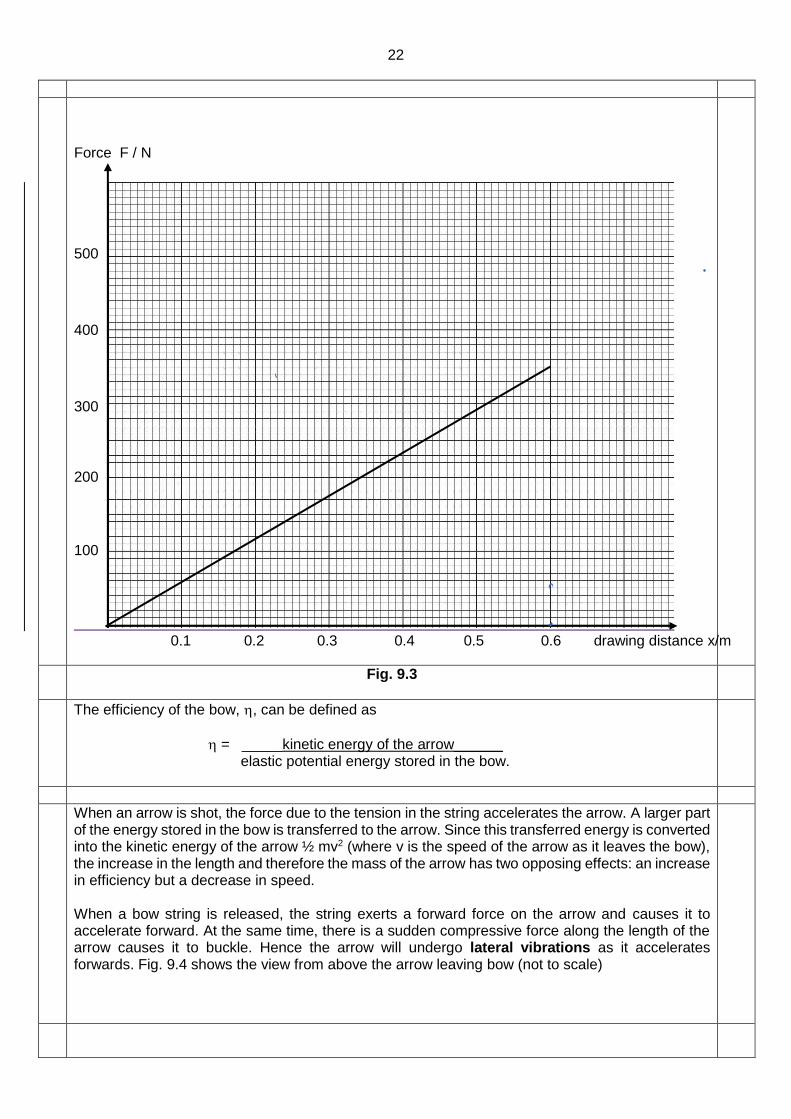
In a Longbow, if we suppose that the bow is initially unstressed and the string is almost slack, then the archer starts to draw his arrow with a pulling force which is nearly zero and the pulling force increases with the drawing distance. The energy stored in the bow is equal to the work done in drawing back the string. In practice, a typical archer can draw an arrow back about 0.6 m and with a maximum force of about 350 N as shown in Fig. 9.3.
Longbow Recurved bow Compound bow.
drawing distance 0.6 m
bracing distance0.15m
handle
limb
string
Pulling force 350 N
22
Fig. 9.3
The efficiency of the bow, , can be defined as
= _____kinetic energy of the arrow______ elastic potential energy stored in the bow.
When an arrow is shot, the force due to the tension in the string accelerates the arrow. A larger part of the energy stored in the bow is transferred to the arrow. Since this transferred energy is converted into the kinetic energy of the arrow ½ mv2 (where v is the speed of the arrow as it leaves the bow), the increase in the length and therefore the mass of the arrow has two opposing effects: an increase in efficiency but a decrease in speed. When a bow string is released, the string exerts a forward force on the arrow and causes it to accelerate forward. At the same time, there is a sudden compressive force along the length of the arrow causes it to buckle. Hence the arrow will undergo lateral vibrations as it accelerates forwards. Fig. 9.4 shows the view from above the arrow leaving bow (not to scale)
0.1 0.2 0.3 0.4 0.5 0.6 drawing distance x/m
Force F / N 500
400
300
200
100
23
Top view of the arrow Fig. 9.4
Both the frequency and the amplitude of these vibrations must be matched to the bow if the arrow is to avoid hitting the side of the handle during its discharge. Ideally the arrow will make 1¼ vibrations from the moment of release until it finally clears the handle of the bow. A Recurved bow is one in which the end of each limb curve away from the archer such that the limbs are braced with a bracing distance. The archer must start his pull with a non-zero force which is about 1/3 of the maximum force. When using a Recurved bow, the average force will be higher as compared to a Longbow without bracing. In a Compound bow, which utilizes levers, the drawing force increases and decreases with the drawing distance as shown in Fig.9.5.
Fig. 9.5
(a) Explain what is meant by lateral vibrations.
Force / N 350
0.6 displacement x / m
handle
arrow shaft
string
Moment of release
Moment of clearing the handle of bow
½ cycle of vibration of the arrow shaft
1 cycle of vibration of the arrow shaft

24
……………………………………………………………………………………………………….. ………………………………………………………………………………………………………..
[1]
L2 Solution: Periodic to and fro motion of a segment of the arrow from its position before release in a direction perpendicular to the motion of arrow/ limb of the bow/ left-right
B1
Examiner’s report The key point is that the displacement is perpendicular to the motion of the arrow. Most of the answers did not imply students’ understanding of the word “lateral”.
(b) Use the graph in Fig. 9.3 to calculate the energy stored in the Longbow when the maximum
pulling force of 350 N is exerted on the string.
energy stored = …………………………………J
[2]
L1 Energy stored
= area under the force-displacement graph
= ½ (350)(0.6)
= 105 J
M1
A1
Examiner’s report Many students applied W = Fd and use F = 350 N without realizing that the force is not constant When F is not constant W = <F> d where <F> is the average force Students should us area under the force-distance graph to work out the answer.
(c) On Fig. 9.6, sketch a graph to show how the work done on the Longbow changes with the
drawing distance of the string. Label the work done axis clearly.
Work done on the bow / J
0.0 0.1 0.2 0.3 0.4 0.5 0.6 drawing distance x / m
| | | | | |

25
[2]
Fig. 9.6
L2
Fig. 9.6
L2 Curve line from 0 J to 105 J when x changes from 0 to 0.6 m
Zero gradient at x = 0 and increasing gradient
B1 B1
Examiner’s report Many students worked out the values of W for each displacement but this is not necessarily since only a sketch is required. Almost all students did not apply the relation F = -dU/dx to show that the gradient = zero when F = 0.
(d) It is thought that the efficiency of the bow obeys a relation of the form
= m
m + k
where m is the mass of the arrow and k is a constant depending on the mass of the bow.
A student performed an experiment to investigate how , the efficiency of the bow varies with
m, the mass of the arrow. He obtained data which allows him to plot the graph of Fig. 9.7.
Work done on the bow / J 105
1/ 2.0
1.6
0.0 0.1 0.2 0.3 0.4 0.5 0.6 drawing distance x / m
| | | | | |

26
Fig. 9.7
(i) Draw the line of best fit for the points [1]
0.000 0.005 0.010 0.015 0.020 0.025 0.030 0.035 (1/m) / g-1

27
L1 Examiner’s report It is surprising that there are a few students did not draw the line correctly.
B1
(ii) Explain whether the relation in (d) is valid using the line drawn in Fig. 9.7.
……………………………………………………………………………………………………………. ……………………………………………………………………………………………………………. ……………………………………………………………………………………………………………. ……………………………………………………………………………………………………………. …………………………………………………………………………………………………………….
[3]
L2 From = m / (m + k)
1/ = (m + k)/ m = 1 + k/m
If the graph of 1/ against 1/m is a straight line with y-intercept equal to 1 Since the graph is a straight line with a y-intercept equal to 1, the relation is tested correct
M1
M1
A1
(iii) Use the line drawn in Fig. 9.7 to determine the magnitude of the constant k in the expression in (d).
Examiner’s report Most students were able to rewrite the expression into Y = mX + C. Mistakes:
Some merely state that k is the gradient. Constant gradient or straight line graph is to be stated.
Some did not justify that y-intercept is 1.
[2]
0.005 0.010 0.015 0.020 0.025 0.030 0.035 (1/m) / g-1
1/ 2.0
1.6
1.2
0.8
0.4

28
L2 k = gradient of the line = 1.84 – 1.0 / 0.030 – 0 = 28 g Calculate gradient correctly, read coordinate to ½ smallest grid
M1 A1
Examiner’s report Students who answered correctly in part (ii)v will proceed to get credit in this question. Mistake: Read coordinate wrongly or not to ½ a smallest grid Did not include the unit of k
(iv) An arrow of mass 70 g is being shot from an initially unstressed Longbow drawn back as
shown in Fig. 9.2. Use the graph in Fig. 9.7 and the definition of the efficiency to determine
the speed of the arrow leaving the bow.
speed of the arrow = ………………………..m s-1.
[3]
L3 Let m = 70 g , 1/m = 1/70 = 0.0143
From the graph 1/ = 1.40
= 0.714
= KE/Energy stored = ½ m v2 / E 0.714 = ½ (0.070)v2 / 105 v = 46 m s-1
B1
M1
A1
Examiner’s report Many students were able to make sensible steps to obtain the speed. Mistake: Did not use energy stored = answer to (b), Instead use EPE = ½ kx2 and k is the answer to (iii). They incorrectly taken k to be the force constant. Many students did not pay attention to the unit of m, k and ended up non sensible answers.
(e) Calculate the frequency of vibration for an arrow leaving the string at 50 m s-1, from a bow of
bracing distance of 0.15 m, and shot by an archer with a drawing distance 0.6 m, as shown in
Fig. 9.2.
frequency of vibration = ………………………….. s-1
[2]
L3 time to clear handle = (0.15 +0.60)/ 50 = 0.015 s
1 ¼ T = 0.0150 s
T = 0.012 s
f = 1/T = 1/0.0120 = 83 s-1
M1
A1
Examiner’s report The question was not well done and there many blanks. Some incorrectly applied wave
equation f = v / . This shows that they did not understand figure 9.2 which show vibration of the arrow instead of the wave motion of the arrow.

29
(f) (i) On Fig. 9.3, sketch the force-drawing distance graph for a Recurved bow which is already
braced to 150 N. The maximum drawing force of 350 N is exerted on the string at the
maximum drawing displacement of 0.6 m.
[1]
L2 Straight line from F = 150 N to F = 350 N B1
Examiner’s report Many students draw correctly showing that they were able to understand the passage on
the reversed bow
0.1 0.2 0.3 0.4 0.5 0.6 drawing distance x/m
Force F / N 500
400
300
200
100
Answer to f(i)
30
(ii) State and explain, in terms of the energy stored, why the Recurved bow is better than a Longbow.
……………………………………………………………………………………………………… ………………………………………………………………………………………………………
[1]
L2 Energy stored = ½ (350 + 150) x 0.6 = 150 N This is greater than that of the Longbow. Hence the arrow can travel at greater speed and further.
B1
Examiner’s report Most students who obtained correctly part (i) stated that the energy is larger. However, explanations were incompletely or incorrect Mistake Larger energy stored because there is energy stored when distance = 0 without realizing that this energy is not transferred No mention was made to the practical advantage due to larger energy stored.
(g) Refer to the force-displacement graph of a Compound bow as shown in Fig. 1.5. Suggest an advantage of a compound bow as compared to the Longbow.
…..…………………………………………………………………………………………………… ………………………………………………………………………………………………………..
[1]
L3 As compared to the fully drawn Longbow at same max drawing force (350 N) at the drawing distance of 0.6 N 1. It can store more energy for a fully drawn bow. 2. It allows the archer to hold and aim a fully drawn bow without as much strain or fatigue since
the drawing force at the fully drawn distance is smaller.
B1
B1
Examiner’s report There were few correct answers
-- END OF PAPER –

1
CANDIDATE NAME
MARK SCHEME
CLASS 2T
PHYSICS 9749/03 Paper 3 23 August 2018
2 hours
Candidates answer on the Question Paper.
READ THESE INSTRUCTIONS FIRST Write your name and class on the first page of both of Section A and Section B.
Write in dark blue or black pen in the space provided. [PILOT FRIXION ERASABLE PENS ARE NOT ALLOWED]
You may use a soft pencil for any diagrams, graphs or rough working. Do not use staples, paper clips, highlighters, glue or correction fluid. Answer all questions in Section A, and ONE out of two questions in Section B. Circle the question number attempted in Section B in the summary table below.
This document consists of 25 printed pages and 1 blank page.
[Turn over
FOR EXAMINER’S USE DIFFICULTY
L1 L2 L3
Q1 /13
Q2 /8
Q3 /7
Q4 /9
Q5 /10
Q6 /13
Q7 / 20
Q8 / 20
TOTAL PAPER 3 / 80
TOTAL PAPER 1 / 30
TOTAL PAPER 2 / 80
TOTAL /190
Catholic Junior College JC2 Preliminary Examinations
Higher 2

2 PHYSICS DATA: speed of light in free space c = 3.00 x 10⁸ m s-1 permeability of free space 0 = 4 x 10⁻⁷ H m-1 permittivity of free space 0 = 8.85 x 10⁻¹² F m-1
(1/(36)) x 10-9 F m-1 elementary charge e = 1.60 x 10⁻¹⁹ C the Planck constant h = 6.63 x 10⁻³⁴ J s unified atomic mass constant u = 1.66 x 10⁻²⁷ kg rest mass of electron me = 9.11 x 10⁻³¹ kg rest mass of proton mp = 1.67 x 10⁻²⁷ kg molar gas constant R = 8.31 J K-1 mol-1 the Avogadro constant NA = 6.02 x 10²³ mol-1 the Boltzmann constant k = 1.38 x 10⁻²³ mol-1 gravitational constant G = 6.67 x 10⁻¹¹ N m2 kg-2 acceleration of free fall g = 9.81 m s-2
PHYSICS FORMULAE: uniformly accelerated motion s = u t + ½ a t2
v2 = u2 + 2 a s
work done on / by a gas W = p V
hydrostatic pressure P = gh
gravitational potential = -
Gm
r
temperature T / K = T / ˚C + 273.15
pressure of an ideal gas p =
1
3
Nm
V⟨c2⟩
mean translational kinetic energy of an ideal gas molecule E =
3
2kT
displacement of particle in s.h.m. x = x0 sin t
velocity of particle in s.h.m. v = v0 cos t
= 22
0 xx
electric current I = Anvq
resistors in series R = R1 + R2 + ...
resistors in parallel 1/R = 1/R1 + 1/R2 + ...
electric potential V =
Q
4πεor
alternating current / voltage x = x0 sin t
magnetic flux density due to a long straight wire B =
μoI
2πd
magnetic flux density due to a flat circular coil B =
μoNI
2r
magnetic flux density due to a long solenoid B = μonI
radioactive decay x = x0 exp(-t)
decay constant
λ =
2
1
2ln
t

3
Section A
Answer all the questions in the spaces provided 1 A construction worker on the roof of a hemispherical dome releases a wrench at the highest point A
with negligible speed as shown in Fig 1.1. The radius R of the dome is 30.0 m. The surface of the dome’s roof is smooth. At a certain point B, the wrench just loses contact with the surface of the dome and falls with a projectile motion through the air, and finally hits the ground at point C.
Fig 1.1
(a) (i) Explain why the centripetal acceleration of the wrench increases as it slides from A to B.
………………………………………………………………………………………………………. ………………………………………………………………………………………………………. ………………………………………………………………………………………………………. ……………………………………………………………………………………………………… ………………………………………………………………………………………………………. ……………………………………………………………………………………………………….
[2]
L2 As the wrench falls, it loses gravitational potential energy but it gains kinetic energy. Kinetic energy = ½ mass x square of speed, therefore its speed increases. Centripetal acceleration is directly proportional to the square of the velocity and inversely proportional to the radius of the circular path, which in this case is the radius of the dome, and is constant. Therefore, the centripetal acceleration of the wrench increases as it slides from A to B.
Examiners’ Comments: Candidates that did not gain full credit for this section did not specify
carefully the component of the force that contributes to the centripetal force when attempting to explain using forces.
B1 B1 B1
point of release
dome
4
(ii) State the magnitude of the normal contact force on the wrench at point B.
normal contact force = …………………..N [1]
L1 N = 0
Examiners’ Comments: This part was well done.
Candidates must pick out the essential information to answer this question.
A1
(b) By considering the forces contributing to the centripetal force on the wrench at point B, show that the vertical distance between B and C, h is
vh =
g
2
where v is the linear velocity of the wrench at point B and g is the acceleration due to gravity. [3]
L2 Since N = 0 when wrench loses contact with the surface,
mg cos θ =mv2
r
mg(h
R)=
mv2
R
h=v2
g
Examiners’ Comments: Candidates that did not gain full credit for this section did not manage to
identify correctly the forces that contributes to the centripetal force.
Candidates must take note where is the centre of circular motion and identify the force pointed towards it. Resolution of vectors is a skill that is expected of candidates.
M1 B1 B1 A0
(c) (i) At the point of losing contact with the surface of the dome, h is related to R by h =
R2
3.
Use this relation and the relation in (b) to calculate for the wrench at the point of losing, 1. its speed and 2. its direction of motion with respect to the horizontal.
speed = ……………………… m s-1
direction from the horizontal = ………………………………………….o [2]
L2
v2=hg

5
v2=2
3(30.0)(9.81)
v= 14.0 m s-1 We also have,
cos θ =h
R
cos θ =
23
R
R=
2
3
θ = 48.2°
Examiners’ Comments: This section was not well attempted. Candidates are advised to pick out the
essential information and relate the two equations to obtain the speed.
For part 2, candidates will have to contextualize what is the direction of motion. The physical quantity can be referred to the velocity vector that is tangential to the dome at point B. Trigonometry can be applied to obtain the angle shown in the figure.
A1 A1
(ii) Using the equations of motion, determine the time taken for the wrench to fall from point B to C. Air resistance is assumed to be negligible.
time taken = …………………... s
[3]
L2 Considering vertical components and taking vectors downwards as positive,
sy=uyt+1
2gt
2
h=2
3R=(v sin θ )t+
1
2(9.81)t
2
h=2
3R=(14.0 sin (48.2) )t+
1
2(9.81)t
2
2
3(30.0)=(14.0 sin (48.2) )t+
1
2(9.81)t
2
20.0=(10.44)t+1
2(9.81)t
2
t =1.22 s
Examiners’ Comments: Candidates that did not gain full credit for this section did not specify the
direction in using the kinematics equation (either vertical or horizontal) and as well stating which vector direction is taken as positive or negative.
B1 B1 A1
(iii) Hence determine x, the horizontal distance between points B and C.

6
horizontal distance, x = ………………………. m
[2]
L2 sx=uxt+
1
2axt
2
sx=v cos θ (t)
sx=14(2
3)(1.22)
x=11.4 m
Examiners’ Comments: Similar to part (ii), candidates must take note of the command word ‘hence’,
therefore to use the earlier answer to solve.
M1 A1
2 In a diesel engine, a fixed amount of gas undergoes a cycle of four stages. The cycle is shown in Fig. 2.1.
Fig.2.1 (not to scale)
The four stages are P Q : compression with a rise in temperature and pressure, Q R : expansion at constant pressure while fuel is being burnt, R S : expansion with a drop in both temperature and pressure, S P : decrease in pressure at constant volume. Some numerical values of temperature, pressure and volume are given on Fig. 2.1.
(a) Using Fig. 2.1, calculate the work done by the gas during the stages
300 K

7
(i) Q R,
work done = ………….…….J [1]
L2 Solution: W = p ∆V = 57.0 × 105 Pa x (3.1 – 2.0) × 10–5 m-3
= 62.7 J Examiner’s Comments: Mostly done well. Some students wrongly inserted the negative sign. Since there is an increase in volume, positive work is done by the gas.
A1
(ii) S P.
work done = ………….…….J
[1]
L1 Solution: W = 0 J Examiner’s Comments: This part was not as well done as expected. Since there is no change in volume, there is no work done. Some students wrongly calculated for W = V∆p.
A1
(b) Using your answers in (a), complete Fig. 2.2 for the four stages of the cycle.
Stage of cycle heat supplied
to gas /J
work done
on gas /J
increase in internal
energy of the
system /J
P Q 0 235
Q R 246
R S 0 –333
S P
Fig. 2.2
[4]
L2 Solution:
Stage of cycle heat supplied
to gas /J
work done
on gas /J
increase in internal
energy of the
system /J

8
P Q 0 235
ΔU = Q + W
= 0 + 235 =
235 [A]
Q R 246
–62.7 [B]
Since it is work
done ON gas, put
a negative sign.
ΔU = Q + W
= 246 – 62.7 =
183 [A]
R S 0 –333
ΔU = Q + W
= 0 – 333
= – 333 [A]
S P
ΔU = Q + W
-85 = Q
Q = –85 [A]
No change in
vol no work
done
0 [C]
ΔU = 0
235 + 183 – 333 +
ΔUSP = 0
ΔUSP = –85 [D]
[A] (application of first law equation – mark by merit),
[B] (insertion of negative sign),
[C] (identifying work done is 0),
[D] (ΔU = 0)
Examiner’s Comments:
Some students did not realize that the column heading is now work done ON gas.
Hence there should be a negative sign inserted. Some students did not know for cyclic
process, ΔU should add up to 0. There is no ecf for [C] marks from the previous part.
(c) Assuming that the gas is ideal, calculate the temperature of the gas at point Q.
temperature = ………………… K [2]
L2 Solution:
Q QP P
P Q
Q Q PQ
P P
P VP V=
T T
P V TT
P V
K
5 5
5 5
(57.0 10 )(2.0 10 )(300)
(1.00 10 )(36.0 10 )
950
Examiner’s Comments: Students should familiarize themselves to solving by ratio and not need to find n first. Do bear in mind that there are changes to temperature as well so it must be factored in.
M1 A1
3 The variation with displacement of the acceleration of an animal’s eardrum is shown in Fig. 3.1.

9
Fig. 3.1
(a) Explain how Fig. 3.1 shows that the motion of the eardrum is simple harmonic.
………………………………………………………………………………………………………… ………………………………………………………………………………………………………… ………………………………………………………………………………………………………… …………………………………………………………………………………………………………
[2]
L2 Solution: The graph is a straight line passing through the origin which shows that the acceleration is directly proportional to the displacement. The straight line has a negative gradient which shows that direction of acceleration is always opposite to the direction of displacement. Examiner’s Comments: Since Q asks to make reference to Fig.3.1, students should not be just giving the general definition of what shm is. They should make reference to the features of a graph (underlined parts in answer above)
B1 B1
-0.20
-0.15
-0.10
-0.05
0.00
0.05
0.10
0.15
0.20
-2.5 -2.0 -1.5 -1.0 -0.5 0.0 0.5 1.0 1.5 2.0 2.5
displacement / cm
acceleration / m s-2

10
(b) The period of the oscillation is 2.10 s. Calculate the time taken for the eardrum to travel a distance of 0.50 cm starting from its maximum displacement towards the equilibrium point.
time taken = ………………….. s
[3]
L2 Solution: When the eardrum travels a distance of 0.50 cm from max displacement, its displacement will be 1.50 cm from equilibrium position.
0x=x cos (ωt)
2π1.50 = 2.00 cos( t)
2.10
t = 0.242 s
Examiner’s Comments: Question was generally poorly done. Students have forgotten how to choose which shm equation to use to solve this question. Do bear in mind that the displacement starts from the max displacement, hence the choice of cos rather than the sine version of this equation. Drawing a graph helps too. Students also did not realize that x is 1.50 and not 0.5 cm. Some weaker students attempted to use the kinematics equations to solve this forgetting that acceleration must be constant when using the kinematics equations. Likewise, for shm, the acceleration is not constant but varies with displacement.
C1 M1 A1
(c) The mass of the eardrum is 100 g. Show that the potential energy of the eardrum is 2.5 × 10⁻⁵ J when its displacement is 0.75 cm. [2]
L2 Solution:
Total energy = Maximum kinetic energy 2 2 2
max 0
1 1= mv = mω x
2 2
B1

11
Potential energy
2 2 2 2 2
0 0
2 2
2 -2 2
-5
=Total energy - Kinetic energy
1 1= mω x - mω (x -x )
2 2
1= mω x
2
1 2π= ×0.100×( ) ×(0.75×10 )
2 2.10
=2.5×10 J
Examiner’s Comments: Many students have forgotten the energy equations related to displacement for shm. Do not that in a show question, all detailed working such as giving the symbolic equation and showing values substituted is a requirement.
B1
4 A length of wire is held taut between two points M and P as shown in Fig. 4.1. A signal generator which produces an alternating current of variable frequency is passed through the wire and a pair of magnets is placed on either side of the wire.
Fig. 4.1 The frequency of the alternating current is gradually increased from zero. A stationary wave is set up as shown in Fig. 4.1 when the frequency is 10 Hz.
(a) Explain how the stationary wave is formed on the wire when an alternating current is passed through it.
………………………………………………………………………………………………………… ………………………………………………………………………………………………………… ………………………………………………………………………………………………………… ………………………………………………………………………………………………………… ……………………………………………………………………………………………………….. ……………………………………………………………………………………………………….. ………………………………………………………………………………………………………..
[4]
L3 Solution:
B1
signal generator

12
The current carrying wire experiences a magnetic force in the vertical plane as given by Fleming’s Left Hand Rule. Since the current is alternating and changes direction, the direction of force alternates and causes the wire to vibrate. The vibration will cause progressive waves travelling towards P & M and the reflected waves will superpose. Resonance occurs and a stationary wave will be formed when the frequency of the periodic magnetic force (due to the sinusoidal current) matches the natural frequency of the stationary waves in the string. Examiner’s Comments: Question that was not well done by many students. Students need to recognize the topic in which this Q comes from which is from electromagnetism not emi. Do not give the formation of a stationary wave but contextualize your answer. It is important to highlight direction of the magnetic force experienced too by the wire as this explains why the transverse waves travel towards P&M.
B1 B1 B1
(b) The distance between M and P is 0.60 m. Calculate the wavelength of the stationary wave formed.
wavelength = …………………………..m
[1]
L2 Solution:
0.6 =
m
Examiner’s comments: Students who cannot do this question did not recognize that the fundamental mode shown in diagram corresponds to half a wavelength rather than one wavelength.
A1
(c) Determine the speed of the wave.
speed = ………………………. m s-1
[2]
L2 Solution:
v = f
= 12.0 m s-1
Examiner’s Comments: No ecf was given here. Most were able to get this part.
M1 A1
(d) Sketch the stationary wave formed in the space below when the frequency of the alternating current is adjusted to 30 Hz.
[2]
L2 Solution: Correctly drawn stationary wave with 3 antinodes and 4 nodes, with 2 of the nodes at M and P. (Three loops with nodes at the ends with equal distance between adjacent nodes)
B1 B1
2
1.20
(10)1.20

13
Reason: Same tension, speed is the same Determine new wavelength when freq is increased to 30 Hz.
v 12λ= = = 0.4 m
f 30
Number of wavelengths formed = 0.6/0.4 = 1.5 There will be 3 loops formed. Examiner’s Comments: Mostly able to do this question. Do note that both ends must be a node. Also ensure that the loops are of equal lengths. Do also show the symbol of a stationary wave rather than progressive wave.
5 (a) A particle of mass m, carrying a negative charge - q and travelling at speed v, enters a region of
uniform magnetic field of flux density B directed at right angles to the motion of the particle as shown in Fig. 5.1.
Fig. 5.1
(i) State the expression for the magnitude of the force F acting on the particle and the direction of the force.
F = ……………
Direction = …………………………….. [2]
L1 F = Bqv And Direction downwards Examiner’s Comments Candidates need to read the question properly. It requires a magnitude of the force. Thus, there is no need to indicate the negative sign. And since the direction of the velocity is perpendicular to that of the flux density, there should not be an ambiguity of sin (theta).
B1 B1
(ii) Explain why the path of the electron is circular.
electron of speed v
uniform magnetic field of flux density B
directed into the paper
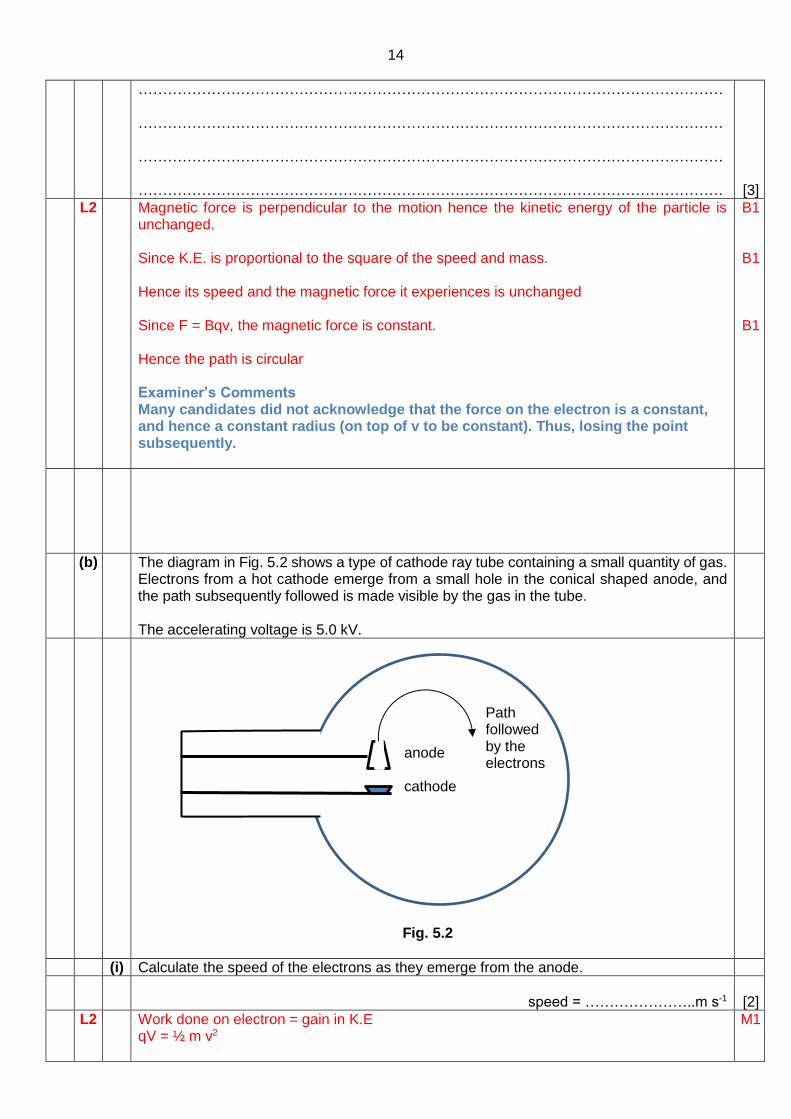
14
………………………………………………………………………………………………………… ………………………………………………………………………………………………………… ………………………………………………………………………………………………………… …………………………………………………………………………………………………………
[3]
L2 Magnetic force is perpendicular to the motion hence the kinetic energy of the particle is unchanged. Since K.E. is proportional to the square of the speed and mass. Hence its speed and the magnetic force it experiences is unchanged Since F = Bqv, the magnetic force is constant. Hence the path is circular Examiner’s Comments Many candidates did not acknowledge that the force on the electron is a constant, and hence a constant radius (on top of v to be constant). Thus, losing the point subsequently.
B1
B1
B1
(b) The diagram in Fig. 5.2 shows a type of cathode ray tube containing a small quantity of gas. Electrons from a hot cathode emerge from a small hole in the conical shaped anode, and the path subsequently followed is made visible by the gas in the tube. The accelerating voltage is 5.0 kV.
Fig. 5.2
(i) Calculate the speed of the electrons as they emerge from the anode.
speed = …………………..m s-1 [2]
L2 Work done on electron = gain in K.E qV = ½ m v2
M1
anode cathode
Path followed by the electrons

15
v = q V m2 /
= x x 19 312 1.6 10 5000 / 9.11 10 = 4.19 x 10⁷ m s-1
Examiner’s Comments Many are able to get this mark.
A1
(ii) The apparatus is situated in a uniform magnetic field acting into the plane of the paper.
1. Calculate the radius of the circular path for a flux density of 2.0 x 10⁻³ T.
radius = …………………… m [2]
L2 The magnetic force provides the centripetal force Bqv = mv2/r r = mv / Bq = 9.11 x 10-31 x 4.19 x 107 / 2.0 x 10-3 x 1.6 x 10-19 = 0.12 m Examiner’s Comments Many candidates know how to do this part, but, are stuck because they are not able to calculate the velocity before.
M1
A1
2. Suggest how the gas in the tube might make the path of the electrons visible.
…………………………………………………………………………………………………………
…………………………………………………………………………………………………………
[1]
L3 Condensation of the vapour/alcohol in the tube occurs and this forms a visible track along the trails of the charged particles (β-particles or α-particles or gamma ray photons). When the charged particles collide electrostatically with the gas atoms, they are ionized and the ions cause condensation of the vapour. Examiner’s Comments Many students were able to give a decent suggestion using the idea of photon emission, thus able to get this mark. Many are not able to acknowledge that this is an example of a cloud chamer.
B1
6 (a) In 1919, Rutherford performed the first nuclear reaction induced in a laboratory in which a
stationary nitrogen nucleus 14
7N bombarded with an α-particle of a certain energy, transmutes
to an oxygen nucleus 17
8O and a proton.
Data:
mass of 14
7N = 13.9993 u;
mass of 17
8O = 16.9947 u;
mass of a proton = 1.0073 u; mass of an α-particle = 4.0015 u.
(i) Write an equation for this nuclear reaction, showing the mass numbers and the atomic numbers of the particles involved.
[2]
L1
14
7N + 42He 178O + 11 H.

16
Symbol, mass number and atomic number of alpha particle Symbol, mass number and atomic number of proton Correct representation of nuclear equation
B1 B1
Examiner’s report most students get full credits Mistake: A few students did not show the atomic number and/or mass number despite stated explicitly in the question Use symbol α in stead of He; p instead of H
(ii) Calculate the minimum kinetic energy of the alpha particle for the reaction to make this reaction occur.
kinetic energy = …………………………..J
[3]
L2
Solutions Sum of the masses of 14
7N and an α-particle = 13.9993 u + 4.0015 u = 18.0008 u Sum of the masses of 17
8O and proton = 16.9947 u + 1.0073 u = 18.0020 u increase in mass = 18.0020 u - 18.0008 u = 0.0012 u The minimum energy is to be supplied to the reactants in the form of kinetic energy of the α-particle The kinetic energy of the alpha particle = mass increase x c2 = 0.0012 u x c2
= 0.0012 x 1.66 x 10-27 x (3 x 108)2
= 1.79 x 10⁻¹³ J
M1
M1
A1
Examiner’s report Many students get full credits Mistake: Some students did not include mass of proton in the calculations
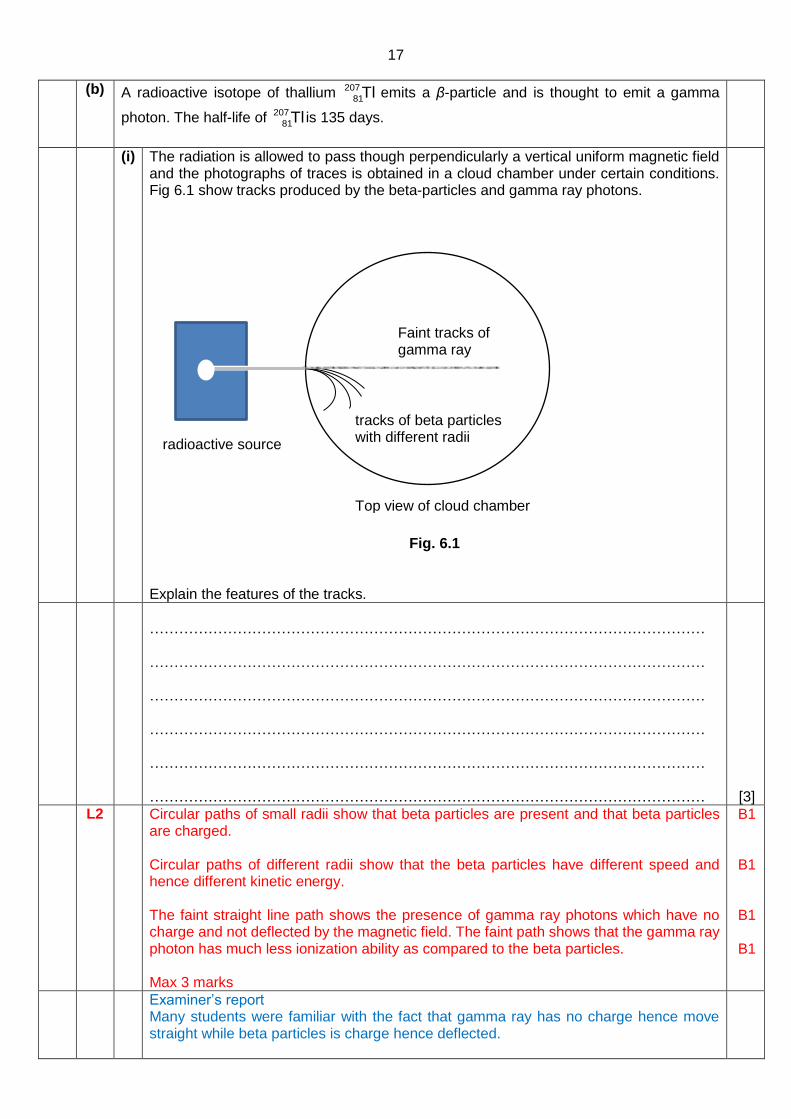
17
(b) A radioactive isotope of thallium 207
81Tl emits a β-particle and is thought to emit a gamma
photon. The half-life of 207
81Tl is 135 days.
(i) The radiation is allowed to pass though perpendicularly a vertical uniform magnetic field and the photographs of traces is obtained in a cloud chamber under certain conditions. Fig 6.1 show tracks produced by the beta-particles and gamma ray photons.
Fig. 6.1
Explain the features of the tracks.
…………………………………………………………………………………………………… …………………………………………………………………………………………………… …………………………………………………………………………………………………… …………………………………………………………………………………………………… …………………………………………………………………………………………………… ……………………………………………………………………………………………………
[3]
L2 Circular paths of small radii show that beta particles are present and that beta particles are charged. Circular paths of different radii show that the beta particles have different speed and hence different kinetic energy. The faint straight line path shows the presence of gamma ray photons which have no charge and not deflected by the magnetic field. The faint path shows that the gamma ray photon has much less ionization ability as compared to the beta particles. Max 3 marks
B1
B1
B1
B1
Examiner’s report Many students were familiar with the fact that gamma ray has no charge hence move straight while beta particles is charge hence deflected.
tracks of beta particles with different radii
Faint tracks of gamma ray
radioactive source
Top view of cloud chamber
18
Almost none of the students is aware that the gamma photons has very low ionization ability. Many students stated that the different in radii is due to the different in K.E. without mentioning that the speeds are different. It should be noted that the speed of the beta particles affects the radius of the path directly. Many students did not explain well for the circular path. The explanations given were rather vague or incomplete.
(ii) An isotope of thallium 207
81Tl emits a β-particle with an average energy of 2.4 x 10⁻¹³ J.
Calculate
1. the total energy available from 1 g of thallium-207,
total energy = ……………….J
[2]
L2 Solutions Energy available from 1 g of thallium-207 = number of thallium-207 atoms x 2.4 x 10-13 = (1/207) x 6.02 x 1023 x 2.4 x 10-13 = 6.98 x 10⁸ J
M1 A1
Examiner’s report Many students were not able to calculate number of thallium atoms in 1 g of thallium.
2. the initial rate at which the β-particles are emitted from 1 g of the freshly prepared isotope,
initial rate of emission = …..……………….day-1
[2]
L2 Solution: Initial rate of β-particle emission = activity of thallium = decay constant x number of thallium nuclei = (In 2 / half-life) x number of thallium nuclei = (In 2 /135) x (1/207) x 6.02 x 1023
= 1.493 x 1019
= 1.5 x 10¹⁹ day-1
M1
A1
Examiner’s report This question is not well done. Mistake: Many students confuse the rate of emission is the same as decay constant. However most students were able to relate decay constant to half-life.
3. the initial power available from the beta particles emitted at the rate calculated in b(ii)2.
initial power =.………………. W
[1]
L2 Solutions Initial power = initial rate x energy of a β-particle = 1.493 x 10¹⁹ / (24 x 60 x 60) x 2.4 x 10-13 = 41.5 W
A1
Examiner’s report This question is not well done. There were many guess answers. For example, they use the answer to (ii)(1) instead of 2.4 x 10⁻¹³ J. Students who successfully apply answer to (ii)(2) and 2.4 x 10⁻¹³ J did not convert the unit of in per day to per second

19
Section B
Answer One question from this section
7 A uniform wooden rod of weight 50 N and length 1.0 m is gently lowered into water. The upper end of the rod is attached to a light string. When the rod is in equilibrium, the string is vertical and
exactly half of the rod is underwater as shown in Fig. 7.1. The rod makes an angle 𝜃 with the surface of the water.
Fig. 7.1
(a) (i) Explain why the string is vertical.
………………………………………………………………………………………………… ………………………………………………………………………………………………… [1]
L2 There is no horizontal component of the upthrust and the weight, so in order for the rod to be in equilibrium, the tension must not have any horizontal component. Therefore, the string has to be vertical.
Examiners’ Comments: Candidates that did not gain full credit for this section must take note of
the word ‘vertical’. Explanation must be made to the horizontal and vertical components of the forces acted on the rod.
B1
(ii) On Fig. 7.1, draw the three forces tension T, upthrust U and the weight W acting on the rod. [2]
L1
Where M1 - W is the weight of the rod and T is the tension on the string M1 - U is the upthrust on the rod
Examiners’ Comments:
B1 B1

20
Candidates that did not gain full credit for this section did not take note of the position of the upthrust.
(iii) By considering moments about the centre of gravity of the rod, show that T = 0.5 U. [2] L2
Taking moments about the centre of gravity of the rod,
U cos θ (0.5
2) =T cos θ (0.5)
0.5 U=T
Examiners’ Comments:
Candidates must show the working step that showcase the application of principle of moments, (i.e. the perpendicular distance)
M1 A1
(iv) Calculate the magnitude of T. [2]
T = ………………..N
L2 Balancing vertical forces,
T + U = W Using,
0.5 U = T We have,
T + 2T = W T = 16.7 N
Examiners’ Comments: Candidates must pay attention to the forces acted on the rod. The sum
of the Tension and Upthrust is equal to the Weight. The Upthrust is not equal to half the weight of the rod.
B1 A1
(v) By balancing the forces, determine the density of the wooden rod. The density of water is 1.0 x 10³ kg m-3.
density of rod = ………………………kg m-3
[4]
L3
Balancing vertical forces,
T + U = W 0.5 U + U = W
B1

21
U=2
3W
U= Vfρf
g
Since volume of the rod, Vr is equal to the twice the volume of the fluid displaced, 2Vf
U= 0.5Vrρf
g
2U
ρfg
=Vr
We have,
W= Vrρrg
W= 2U
ρfg
ρrg
W= 4W
3ρfg
ρrg
ρr=
3(1000)
4=750 kg m-3
Examiners’ Comments:
Candidates are advised to recall the definition of Upthrust and relate it to the weight of the fluid displaced. The key information to pick out is that exactly half of the rod is submerged in the fluid.
B1 B1 A1
(b) (i) State the principle of the conservation of momentum.
………………………………………………………………………………………… ………………………………………………………………………………………… [1]
L1 The total linear momentum of a system will remain constant if no net external force acts on it.
Examiners’ Comments: Candidates are expected to recall the definition with the key words
present.
A1
(ii) Object A of mass 1.2 kg collides head-on and elastically with object B of mass 0.60 kg moving with a speed 0.20 m s-1 towards it as shown in Fig. 7.2. Object A Object B

22
Fig. 7.2 After the collision, object B moves off with a speed of 0.10 m s-1 opposite to its initial motion.
Calculate the initial speed of object A.
initial speed of A = ....................... m s-1 [3]
L2 Taking vectors to the right as positive. Using conservation of linear momentum
1.2u+0.6(-0.2)=1.2v+0.6(0.1)
1.2u=1.2v+0.18----(1)
Using relative speed of approach = relative speed of separation:
u+0.2=0.1-v-----(2)
Solving (1) and (2) u = 0.025 m s-1
Examiners’ Comments: Candidates must take note that momentum is a vector and when using
the principle of conservation of momentum to solve for velocities, they must assign a direction to be taken as positive.
Common mistake is to include a minus sign for the velocity of object B because of the word ‘opposite’.
M1 M1 A1
(c) A 80 kg astronaut is at a distance of 30 m from a space shuttle. He wishes to return to the space shuttle by means of a thruster. The thruster is attached to the body of the astronaut and it emits a stream of gas when it is turned on.
(i) State and explain the direction in which the gas has to be ejected for him to return to the space shuttle.
…………………………………………………………………………………………. …………………………………………………………………………………………. …………………………………………………………………………………………. …………………………………………………………………………………………. …………………………………………………………………………………………. [3]
L2 When the gas is ejected from the thruster, it gains a momentum. As a consequence, based on the conservation of momentum, the astronaut gains an equal and opposite momentum. Hence the gas is to be ejected in the opposite direction to that in the direction of the space shuttle.
B1 M1 A1

23
OR The thruster exerts a force onto the gas. By Newton’s third law, the gas exerts an equal and opposite force on the thruster and the astronaut. To allow the astronaut to move towards the space shuttle, the gas is to be ejected in the opposite direction to that in the direction of the space shuttle.
Examiners’ Comments: Candidates must be able to identify the physics concepts to attempt
this question. Candidates are advised to practice writing out the reasoning process and how each of the principle / laws are applied in different scenarios.
B1 M1 A1
(ii) The gas is ejected at a constant rate of 0.5 kg s-1 and at a speed of 20 m s-1 relative to the astronaut for a period of 1.0 s. Calculate the speed of the astronaut at the end of 1.0 s.
speed = ……………..m s-1 [2]
L2 Based on the conservation of momentum,
mu= Mv (0.5)(1)(20 – 0) = 80 (v – 0) v = 0.125 m s-1 OR Magnitude of momentum of gas F∆t = ∆p dp
dt∆t=m∆v
(0.5)(20)(1.0)=80(v-0)
v = 0.125 m s-1
Examiners’ Comments: This section was well done.
M1 A1 M1 A1
8 (a) A cell of electromotive force E and internal resistance r is connected to a resistor of resistance
R.
(i) Define electromotive force.
……………………………………………………………………………………………….
[1]
L1 It is the energy transferred per unit charge from some form into electrical energy when charge is moved round a complete circuit. Alternate solution: The energy delivered by the cell per unit charge flow. Examiner’s report Many did not able to give full definitions of the emf.
B1

24
(ii) Show, by considering energy conversion, that V the terminal potential difference of the cell is V = E – Ir where I is the current flowing in the cell.
[2]
L2 Energy supplied by the cell = energy dissipated in the external and internal resistance Energy supplied by the cell per unit charge = energy dissipated in the external and internal e.m.f. of cell per unit charge = p.d across the external circuit + p.d across the internal resistance of the cell E = V + Vr
E = V + Ir V = E – Ir Examiner’s report Many did not read the question and note that the solution has to take the conservation of energy into account., thus losing the credits.
M1
M2
(b) Fig. 8.1 shows a battery with e.m.f. E and an internal resistance r connected to a uniform nichrome resistance wire MN. J is a movable jockey which can slide along wire MN. The voltmeter and the ammeter are taken to be ideal.
Fig. 8.1 The voltmeter readings V and ammeter readings I obtained for different lengths of JN are used to plot the graph in Fig. 8.2.

25
Fig. 8.2
(i) Deduce from Fig. 8.2 the e.m.f. E and the internal resistance r of the cell.
E = ……………….. V
r = ……………….. Ω
[3]
L2 Solution:
V = E - Ir At (300, 0.4),
0.4 = E - (300×10-3)r - - - (1)
At (100, 1.2),
1.2 = E - (100×10-3)r - - - (2)
(2) – (1):
0.8 = (200×10-3)r
r = 4 Ω Sub into (2):
1.2 = E - (100×10-3)(4)
E = 1.6 V Examiner’s report most students get full credits
M1
A1
A1

26
(ii) J is placed at the position such that maximum power is delivered from the cell to the wire JN.
Determine the potential at J and N.
potential at J = …….……V
potential at N = …………V
[3]
L2 Solution:
The emf is 1.6 V as calculated in b(i). For maximum power to be delivered to JN, the resistance of JN must be the same as that of the internal resistance. Hence the potential difference across the internal resistance must be the same as that across JN. Since JN is the only external resistor in the circuit, the potential difference must be 0.8 V (which is 50% of the emf), as it is a series connection. Since J is connected to earth, potential at J is 0 V and since pd drops from J to N, N is at a lower potential of -0.8 V. (allow for ecf) Examiner’s report Many students did not do well for this question as they did not pay attention to the earth in the circuit, thus not indicating the correct potentials. Additionally, the maximum power transmission was also not factored in the solution.
B1
B1
B1
(iii) On Fig. 8.3, sketch the graph to show how electric potential varies with position along the wire JN. Label the vertical axis clearly. Explain your answer.
Fig. 8.3
J N position along JN
Electric potential / v V Vtion along JN

27
[3]
Fig. 8.3
1 mark: straight line graph starting with 0 V at J and ending at – 8 V at N (ecf) Reasons: Current along JN is constant Potential drops along wire JN is equal to current x resistance of wire Resistance of wire is proportional to the length since wire is uniform Potential difference drop is proportional to length of wire measured from J, therefore graph is linear. Examiner’s report Most graphs were drawn with the correct shape, though the potentials are wrongly identified. There are also a significant number of scripts which gave a curve, indicating a mix up with the potentials in the electric field scenario.
M1 A1
(iv) Suggest, with a reason, why the position of the jockey J has to be shifted, when the battery has been used for a prolong period of time for maximum power transfer.
………………………………………………………………………………………………………… ………………………………………………………………………………………………………… ………………………………………………………………………………………………………… …………………………………………………………………………………………………………
[1]
L3 Solution:
As the battery is used, its e.m.f. is reduced but its internal resistance will be increased. For maximum power transfer, the external resistance should be larger now since it is equal to that of the internal resistance of the battery, hence the wire JN will be longer , so that jockey J has to be shifter to the left. Examiner’s report
B1
J N position along JN
Electric potential / V V Vtion along JN
- 0.8

28
Many were not able to get the mark, as they were not able to identify the correct change in the battery’s emf and internal resistance.
(c) (i) Explain what is meant by an electric field.
………………………………………………………………………………………………………… ………………………………………………………………………………………………………… [1]
L1 Solution: It is the region of space where a charged particle experiences an electric force. Examiner’s report Many were gave the definition of electic field strength.
B1
(ii) Draw the charge distribution and the electric field around the charged metal bodies for the following bodies
1. an isolated positively charged sphere A.
Fig. 8.1 [2]
L2 Solution:
1 mark: approximately equal distribution of positive charges 1 mark: electric field pattern must correspond to the position of the charges, correct directional arrows indicated Examiner’s report Most were able to score at least one mark, losing the other mark due to inconsistency in drawing the correct number of electric field lines.
2. When a neutral metal sphere B is brought close to the positively charged metal sphere A in (c)(ii)1. [4]

29
Fig. 8.2
L3 Solution:
1 mark: closer distribution of positive charges on A facing B 1 mark: equal number of positive charges and negative charges on B, at the correct sides 1 mark: correct direction of electric field lines for A and B 1 mark: correct shape of the electric field pattern Note: equipotential lines are not required Examiner’s report Most did not score the full amrks, as they did not indicate the correct distribution of the charges md the correct field patterns.

1
CANDIDATE NAME
MARK SCHEME
CLASS 2T
PHYSICS 9749/04 Practical Examination 13 August 2018
2 hour 30 minutes
Candidates answer on the Question Paper.
Additional Materials: as listed in the Confidential Instructions
READ THESE INSTRUCTIONS FIRST Write your name and class on all the work you hand in. Write in dark blue or black pen in the space provided. [PILOT FRIXION ERASABLE PENS ARE NOT ALLOWED] You may use an HB or 2B pencil for any diagrams, graphs or rough working. Do not use staples, paper clips, highlighters, glue or correction fluid. Answer all questions. Write your answers in the spaces provided on the question paper. The use of an approved scientific calculator is expected, where appropriate. You may lose marks if you do not show your working or if you do not use appropriate units. Give details of the practical shift and laboratory where appropriate in the boxes provided. At the end of the examination, fasten all your work securely together. The number of marks is given in brackets [ ] at end of each question or part question. Half the candidates will start Questions 1-2 for one hour and the other half on Question 3 for one hour. There will be a changeover after that time and candidates will move to the other Question(s) for one hour. All candidates will then move to Question 4 for the last 30 minutes. During this last half hour, candidates are not allowed access to the apparatus.
This document consists of 19 printed pages and 1 blank page.
[Turn over
Shift
Laboratory
For Examiner’s Use
1 / 14
2 / 8
3 / 21
4 / 12
Total / 55
Catholic Junior College JC2 Preliminary Examinations
Higher 2

2
1. In this experiment, you will compare the diameters of objects seen through air with their apparent diameters seen through water and glass.
(a) The external diameter d1 of the test-tube is shown in Fig. 1.1.
Fig. 1.1
Measure and record d1, in the table using the half metre rule, the vernier caliper and the micrometer screw gauge.
[3]
Measuring Instrument Value of d1
half metre rule
……………………………………
vernier caliper
……………………………………
micrometer screw gauge
……………………………………
Solution: Range: 1.5 ≤ d1 < 1.7 cm rule: 1.5 cm vernier caliper: 1.58 cm micrometer screw gauge: 15.78 mm Marking point:
Metre Rule to 0.1 cm with appropriate unit (1 mark)
Vernier Caliper to 0.01 cm with appropriate unit (1 mark)
Micrometer Screw Gauge to 0.01 mm with appropriate unit (1 mark) Examiners’ Comments:
Most candidates scored credit for this section.
Candidates who did not score full credit must pay attention to the precision of the instrument.
Few candidates did not m≤anage to obtain sensible readings.
(b) (i) Stand the test-tube upside down in the centre of the beaker of water as shown in Fig. 1.2. Look through the glass and water at the test-tube. The external diameter d2 of the test-tube as seen through the water and glass is shown in Fig. 1.2.

3
Fig. 1.2
(ii) 1.
Measure and record d2 using only one of the measuring instruments.
d2= 2.0 cm [1]
Marking point:
Acceptable range between 1.8 cm to 2.1 cm
Include unit
d2 larger than d1 2. State which measuring instrument you used to measure d2.
[1]
Solution: Metre Rule Marking Point:
Do not accept Vernier caliper or Micrometre screw gauge (context heavy here. When given a choice, Vernier caliper and micrometer screw gauge requires the two ends of the instrument to touch firmly onto the object. d2 is an apparent length where the best instrument is the metre rule.)
Examiners’ Comments:
Most candidates scored credit for this section.
(iii) Remove the test-tube from the beaker and place the test-tube back into the
container.

4
(c) (i) Use one of the measuring instruments to measure and record the external diameter of d1 of the measuring cylinder.
d1 = 3.24 cm
(ii) Repeat (b) for the measuring cylinder. d2 = 3.8 cm [1]
Solution:
Use a metre rule to measure d2 and using micrometer screw gauge for d1 or vernier calipers.
Testing on the skill of using appropriate instrument for measurements.
Marking Point:
To be the same precision as b(ii)
d2 larger than d1
Examiners’ Comments:
Most candidates scored credit for this section.
(iii) Determine the percentage uncertainty in your value of d2 for the measuring
cylinder.
percentage uncertainty in d2 = 5.3 % [1]
Solution:
∆𝑑2 ≥ 0.2 cm
% =0.2
3.8× 100% = 5.3%
Marking Point
∆𝑑2 ≥ 0.2 cm (ecf from (c)(ii) for 0.02 cm for vernier caliper or 0.02 mm for micrometer screw gauge.)
Final answer to 1 or 2 s.f.
Examiners’ Comments:
Candidates who did not obtain credit did not quote the correct error for the calculation or that the rounding off to the correct significant figures is wrong.
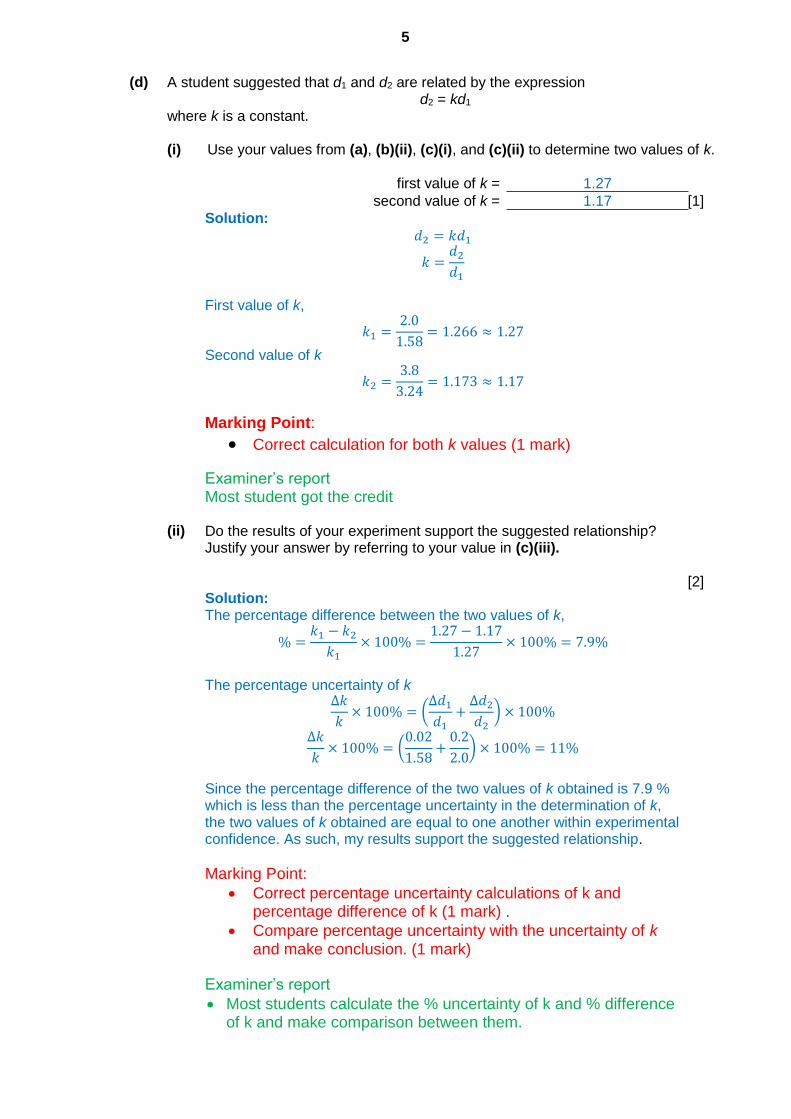
5
(d) A student suggested that d1 and d2 are related by the expression d2 = kd1
where k is a constant. (i) Use your values from (a), (b)(ii), (c)(i), and (c)(ii) to determine two values of k. first value of k = 1.27
second value of k = 1.17 [1]
Solution:
𝑑2 = 𝑘𝑑1
𝑘 =𝑑2
𝑑1
First value of k,
𝑘1 =2.0
1.58= 1.266 ≈ 1.27
Second value of k
𝑘2 =3.8
3.24= 1.173 ≈ 1.17
Marking Point:
Correct calculation for both k values (1 mark)
Examiner’s report Most student got the credit
(ii) Do the results of your experiment support the suggested relationship?
Justify your answer by referring to your value in (c)(iii). [2] Solution:
The percentage difference between the two values of k,
% =𝑘1 − 𝑘2
𝑘1× 100% =
1.27 − 1.17
1.27× 100% = 7.9%
The percentage uncertainty of k
∆𝑘
𝑘× 100% = (
∆𝑑1
𝑑1+
∆𝑑2
𝑑2) × 100%
∆𝑘
𝑘× 100% = (
0.02
1.58+
0.2
2.0) × 100% = 11%
Since the percentage difference of the two values of k obtained is 7.9 % which is less than the percentage uncertainty in the determination of k, the two values of k obtained are equal to one another within experimental confidence. As such, my results support the suggested relationship.
Marking Point:
Correct percentage uncertainty calculations of k and percentage difference of k (1 mark) .
Compare percentage uncertainty with the uncertainty of k and make conclusion. (1 mark)
Examiner’s report
Most students calculate the % uncertainty of k and % difference of k and make comparison between them.

6
Only some % uncertainty of k = sum of % uncertainty of d1 and d2
Very few state that the % uncertainty of k is o about that of c(iii) or o twice that of c(iii).
Mistake
Did not calculate % uncertainty of k, just compare % difference of k assumed acceptable 10 % value or 5 % value
Some just use % uncertainty of d1 from c(iii)
(e) The external diameter d2 of the test-tube as seen through the water and glass is thought
to be larger than the external diameter d1 as seen through air. The magnification factor, k is proposed as,
k = d2
d1
It is suggested that the magnification factor of the setup in Fig. 1.2 depends on the internal diameter of the beaker of water. Plan an investigation to determine the internal diameter of the beaker for which the magnification factor equal to 2. You are provided with several beakers, each with uniform internal diameter. Your account should include:
your experimental procedure
the table of measurements with appropriate units,
how you determine the internal diameter of the beaker for which the magnification factor is 2.
[4]
Solution: 1. Measure the internal diameter s of the beaker using the back end of a Vernier
caliper and take repeated measurements. 2. Fill the beaker with the smallest internal diameter with water until it is half full. 3. Perform the same experiment as per (a) and (b)(i),(ii) to measure the external
diameter of a test tube in the first beaker with the smallest internal diameter. Measure d1 and d2 using a Vernier caliper and a metre rule respectively as per (a) and (b)(i)(ii).
4. Calculate the magnification factor by k = d2 / d1. 5. Repeat steps 1 and 3 using the several beakers with different internal diameter
for at least 5 more sets of s and k. 6. The table of measurements are as follow:
s1 / cm s2 / cm <s> / cm
d1 / cm d2 / cm k (no units)
7. Plot a graph of internal diameter <s> against k. 8. Read off the position where k is equal to 2 and identify the internal diameter of
the beaker that gives the result.
Do not accept by trial and error to get the diameter. Use a graphical method to determine. Marking Point:

7
Measure the internal diameter s with Vernier calliper. (1 mark)
Setting up experiment according to Fig. 1.2. Measure apparent diameter of the test-tube. Showing or indicating the table of measurements. (1 mark)
Plot a sensible graph and read off the value of <s> when k = 2. (1 mark)
Generally workable and sensible procedure, that measurements can be made. Including chronological procedure. (1 mark) Ignore accuracy and precision consideration.
Examiners’ Comments:
There were mixed responses to this part. The better candidates quoted measuring instruments used to take the readings and showed a logical and workable flow of how the experiment should be carried out.
Candidates must take note that if logarithm is used for the method of analysis, it must be shown on the table of measurements.
Candidates must take note to quote that d1 is constant if it is not shown in the table and that the unit must also be shown in the answer.
Candidates are advised to read carefully and identify correctly the variables to be varied and what is the independent and dependent variables.
Candidates are advised to follow the symbols used in the question and not redefine the variables and symbols used.
Candidates are advised to define carefully new symbols used in their answer (e.g. internal diameter of the beaker of water, db or d3)
Total: 14 marks

8
2 In this experiment, you will investigate how the current in a circuit changes when a resistor is added to the circuit.
(a) (i) You have been provided with five identical resistors.
Use two resistors and other components to connect the circuit of Fig. 2.1.
Fig. 2.1
(ii) Close the switch. Record the ammeter reading I1. I1 = 16.9 mA [1]
Marking Point:
Sensible value
Record to 0.1 mA or 0.01 mA precision
Appropriate units Examiner’s report Most answers are correct
Mistake: unit in A (iii) Open the switch. (b) (i) Add a resistor as shown in Fig. 2.2 so that n = 2 where n is the number of resistors
in the parallel arrangement.
Fig. 2.2
(ii) Close the switch. Record the ammeter reading I2. I2 = 22.2 mA [1]
Marking Point:
Sensible value
Record to 0.1 mA or 0.01 mA precision

9
Appropriate units
Value larger than (a)(ii)
Examiner’s report Most answers are correct Mistake: unit in A
(iii) Open the switch. (c) It is suggested that I and n are related by the expression
𝐼 = kn
(n+1)
where k is a constant. (i) Use the apparatus to take sufficient readings to verify whether the suggestion is
correct by calculating values for k. Present your results in tabular form.
[3] Solution:
n I / mA k / mA
1 16.9 33.8
2 22.2 33.3
3 24.8 33.3
4 26.6 33.3
Marking Point:
4 sets of readings (1 mark)
Tabulation with correct table heading (1 mark)
Correct calculation for k (1 mark) Examiner’s report Mistakes: Did not include n = 1; Did not put in table form and omission of unit of k Wrong calculation of k or Round off k to 1 s.f.
(ii) State whether or not the results of your experiment support the relationship suggested. Justify your conclusion.
[1]

10
Solution: % difference of k = (33.8 – 33.0 / 33 ) x 100% = 2.4 % % uncertainty of k = % uncertainty of I = (0.1 /16.9) x100% = 0.6 % % difference of k values is larger than % uncertainty of k. Hence the data does not support the suggested relationship Marking Point:
Deduce sensibly that all the k values are the same (different)
Hence relationship is supported / not supported (1 mark) Examiner’s report
Most students attempt to calculate the percentage difference between the values of k and compare with the percentage uncertainty of current and make the correct decision.
Some students just follow this method without thinking. For example, while inspecting the values of k and found that they are almost the same (or very different), they still proceed to make calculation of the percentage difference and then make comparison with the uncertainty of k..
(iii) Justify the number of significant figures that you have given for your values of k.
[1]
Solution: n is an exact number it does not affect accuracy of k value. The accuracy of k is dependent only on that of I. Hence the s.f. of k follows that of I. Marking Point: Accepted points include:
s.f of k follows the s.f. of I Examiner’s report
Most students were confuse of the meaning of the s.f. and were not sure of how to relate uncertainty with s.f.
(d) The resistance of each of the resistors used in this experiment is 47 Ω. Suggest one problem that might arise if the experiment was repeated using five identical resistors of resistance 0.047 Ω.
[1]
This will cause:
Damage to the devices such as the digital multimeter
Overheating of the wire, risking burning of the resistors and wire.
Marking Point:
Any sensible issue related to the possibility of high current Examiner’s report Most students are aware that the current is very large due to small resistance. However they fail to state the practical problem of this large current: damage to device, overheating, cannot be measured by the ammeter, etc.

11
Quite a few wrongly state that the change in current will be too small to be detected. Some merely state that it is dangerous. A few state that the circuit will be shorted. A few state that he will get electrocuted and the apparatus get fire!
Total: 8 marks

12
3 In this experiment, you will investigate how the period of a spring pendulum varies with load. (a) Set up the apparatus as shown in Fig. 3.1.
Fig. 3.1
(b) Displace the mass horizontally.
Release the mass and allow it to oscillate. Take measurements to determine the period T of these oscillations.
T = [1]
Solution: Time taken for 15 oscillations, t15,1 = 12.8 s Repeat reading, t15,2 = 12.6 s
Therefore, the period is 𝑇 =𝑡15,1+𝑡15,2
2×15=
12.8+12.6
2×15= 0.847 s
Marking point
Raw timing to be more than or equal to 10.0 s
Evidence of time readings to 0.1 s precision
Includes units
3 s.f.
Examiner’s Comments: 1) To record total time to 1 dp instead of 2 dp. 2) To record T to 3sf (since measured timings are in 3sf) 3) To include units for T which is s. 4) Total measured time needs to be more than 10.0 s. 5)* If never repeat total time measurement, penalised under next part.
(c) Vary the mass m suspended from the spring and repeat (b) for further values of m.
[7]

13
Solution:
Number of dp
follow sf of m
Express in sf of
m
m / g
n tn,1 / s
tn,2 / s
tn,avg / s
T / s lg (T/s) lg (m / g) lg (m / g)
50 (2sf)
15 12.8 12.6 12.7 0.847 -0.0721 1.70 1.7
100 (3sf)
15 13.8 13.7 13.8 0.920 -0.0362 2.000 2.00
150 15 14.2 14.5 14.4 0.960 -0.0177 2.176 2.18
200 15 15.0 14.9 15.0 1.00 0.000 2.301 2.30
250 15 15.7 15.6 15.7 1.05 0.0212 2.398 2.40
300 15 16.3 16.1 16.2 1.08 0.0334 2.477 2.48
Marking Point:
Each column heading contains an appropriate quantity and unit. Quantity and unit are distinguished with a solidus. (1 mark)
Consistency of no. of d.p. for time reading, to 0.1 s. (1 mark. Allow ecf from (b) but mark for consistency)
Consistent least s.f. of calculated values, lg T and lg m according to the least s.f. of raw measurements. Number before the decimal place is NOT a significant figure. (1 mark)
Calculate lg T and lg m correctly. Allow at most 2 slips in calculation. (1 mark)
Repeat readings for t (1 mark)
Methods (2 marks) o At least 6 sets of readings without assistance (2 marks) o At least 5 sets of readings without assistance (1 mark)
Examiner’s Comments: 1a) Many never include a column for n 1b) No brackets for ln (T/s) or ln (m/g) 1c) Note that for m = 50 g don’t record as 50.0 g 1d) Some never record total time in table 1e) Some never find period but went on to find lg or ln total time 1f) Split tables will be penalised 1g) inconsistent symbols for headings eg. mass and m 2a) ecf from previous part (mostly ok) 2b) no total time 3a) badly done for lg m (m is 50 g <2sf>) vs m is 100 g <3sf> - some students consider 100 g as 1 sf - incorrect) 4a) rounding off issue will penalise (mostly ok) 5a) most have repeated reading column 6&7) penalise one marks if Tave is out of usual range (usual range 0.7 to 1.2 s); some students were penalised one mark for only giving 5 readings Others:
1) some students don’t want to deal with –ve values of lg or ln and went on to put a “minus” sign in front of ln T or lg Y
2) Some students converted g to kg for mass which is unnecessary 3) Some students tried to use standard forms in tables or graphs (unnecessary too)

14
[3]

15
Marking Point:
Good line of best fit with good scatter of plotted points.
Plot at least 3 data points accurately to ½ the smallest division, all data points plotted. (1 mark)
Examiner’s Comments:
1) Some students with missing labels of axis but most usually had it 2) Line of Best fit - issues with unbalanced number of points on one side of graph &
equidistant (draw line with mechanical pencil – cannot use thick pencil lead) 3) 0.0025 or 0.0125 per small square is not encouraged mostly led to plotting errors;
there should not be any points plotted incorrectly

16
Others: 1) Don’t go tweak values (inconsistent in plotted points and what is on table)
(d) It is suggested that T and m are related by the expression
𝑇 = 𝑎𝑚𝑏 where a and b are constants. Plot a suitable graph to determine the values of a and b.
a =
b =
[4] Solution:
Plot a graph of lg T against lg m. A straight line graph with gradient b and y-int lg a is expected.
Gradient = 0.025 0.061
0.1192.47 1.75
Hence, b = 0.119 (no units) Taking point (2.47, 0.025),
lg 0.025 0.119 2.47 0.270a
Hence, lg a = -0.270 s2 m a = 0.537 s g-0.119
Mark Scheme:
Gradient correctly determined. Read of ½ smallest division accuracy, hypotenuse of gradient triangle to be more than ½ of the line of best fit. (1 mark)
Vertical intercept read off or calculated correctly (1 mark)
Correct linearization of the equation. (be it seen in graph or relating b and lg a to the gradient and y-int of the line of best fit drawn) (1 mark)
correct calculations of a and b, with appropriate unit (1 mark) Examiners’ Comments:
Lineariasation: Majority of the candidates were able to linearise the equation correctly, although there are some who were not able to correctly use the logarithm functions. Gradient calculation: There are some candidates who wrote the coordinates, swopping the x- and y-coordinates. y-intercept determination: there are some candidates who read-pff the y-int wrongly, where the (x, 0) was mistakenly identified as the y-int. There is a significant number of candidates who used the exponential function instead of the log-10 base interchangeably, calculating the quantity wrongly. Units: Majority of the candidates were not able to conclude that a has units. Majority either did not indicate a unit, or indicate wrong units.
(e) Comment on any anomalous data or results that you may have obtained. Explain your
answer.

17
[1]
Solution: There is no anomalous data as none of the points are out of trend with one another and there is a good scatter of points about the line of best fit. OR The data points (x1, y1) is an anomalous data as this point is out of trend with the rest of the points. Marking Point:
Appropriate identification of anomalous data.
At most two anomalous points
Examiners’ Comments: Majority of the candidates were able to identify the correct amomaly, though many did not include the conditions for either case (no anomalous, or with anomaly)
(f) State one significant source of error or limitation of taking the readings for this
experiment. Give a reason.
[1]
Solution:
When the spring is hanging freely on the rod, it can oscillate not only in one plane as what this experiment require, but in other planes as well, causing a conical oscillation instead of vibrating in a plane. This causes difficulty in determining the period of the oscillation. Mark Scheme:
1 mark for each reasonable sources of error
Examiners’ Comments: There are a significant number of students who did not know what to write, resorting to stating wind conditions, human reaction time, etc. Many spoke about the difficulty in determining the number of oscillations, This will not be given credit, as this can be easily minimised by taking a larger number of oscillations, thus not a significant error. Those who indicated that the oscillations were in more than one plane, affecting the measurement of t will be given credit.
(g) (i) Calculate the value of T when m = 1500 g. T = s [1]
Solution:
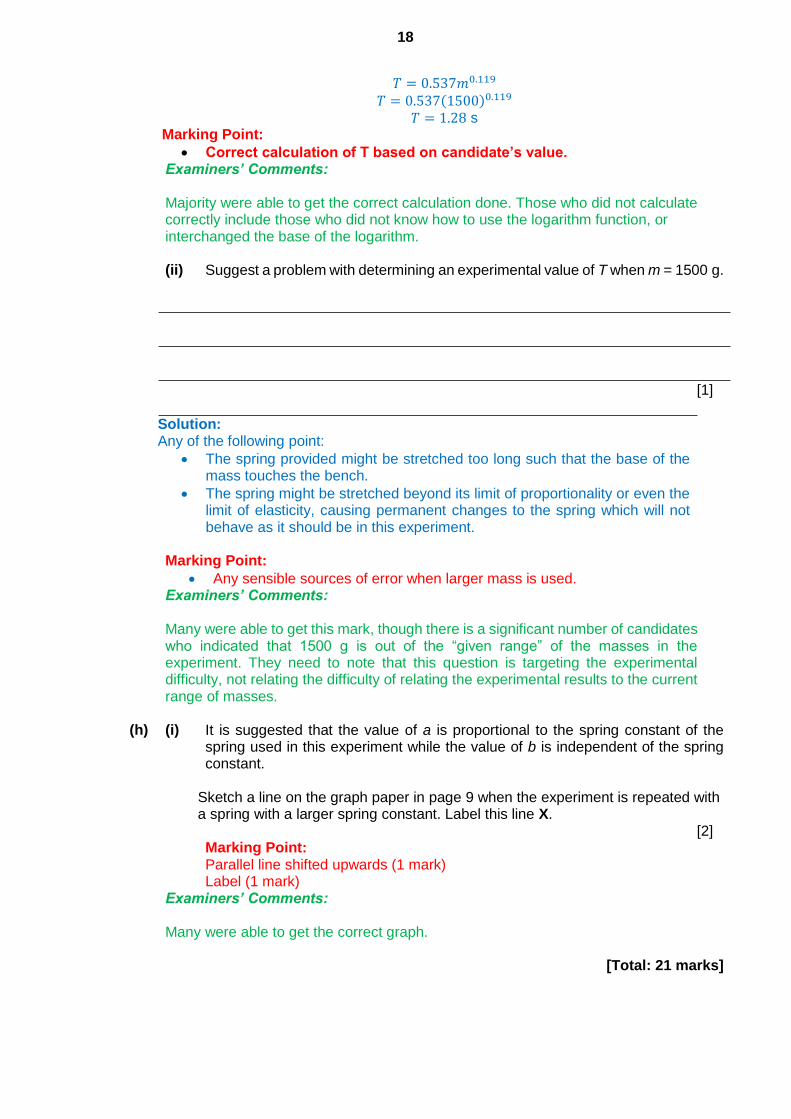
18
𝑇 = 0.537𝑚0.119
𝑇 = 0.537(1500)0.119 𝑇 = 1.28 s
Marking Point:
Correct calculation of T based on candidate’s value. Examiners’ Comments:
Majority were able to get the correct calculation done. Those who did not calculate correctly include those who did not know how to use the logarithm function, or interchanged the base of the logarithm.
(ii) Suggest a problem with determining an experimental value of T when m = 1500 g.
[1]
Solution: Any of the following point:
The spring provided might be stretched too long such that the base of the mass touches the bench.
The spring might be stretched beyond its limit of proportionality or even the limit of elasticity, causing permanent changes to the spring which will not behave as it should be in this experiment.
Marking Point:
Any sensible sources of error when larger mass is used.
Examiners’ Comments: Many were able to get this mark, though there is a significant number of candidates who indicated that 1500 g is out of the “given range” of the masses in the experiment. They need to note that this question is targeting the experimental difficulty, not relating the difficulty of relating the experimental results to the current range of masses.
(h) (i) It is suggested that the value of a is proportional to the spring constant of the
spring used in this experiment while the value of b is independent of the spring constant.
Sketch a line on the graph paper in page 9 when the experiment is repeated with a spring with a larger spring constant. Label this line X.
[2] Marking Point:
Parallel line shifted upwards (1 mark) Label (1 mark)
Examiners’ Comments: Many were able to get the correct graph.
[Total: 21 marks]
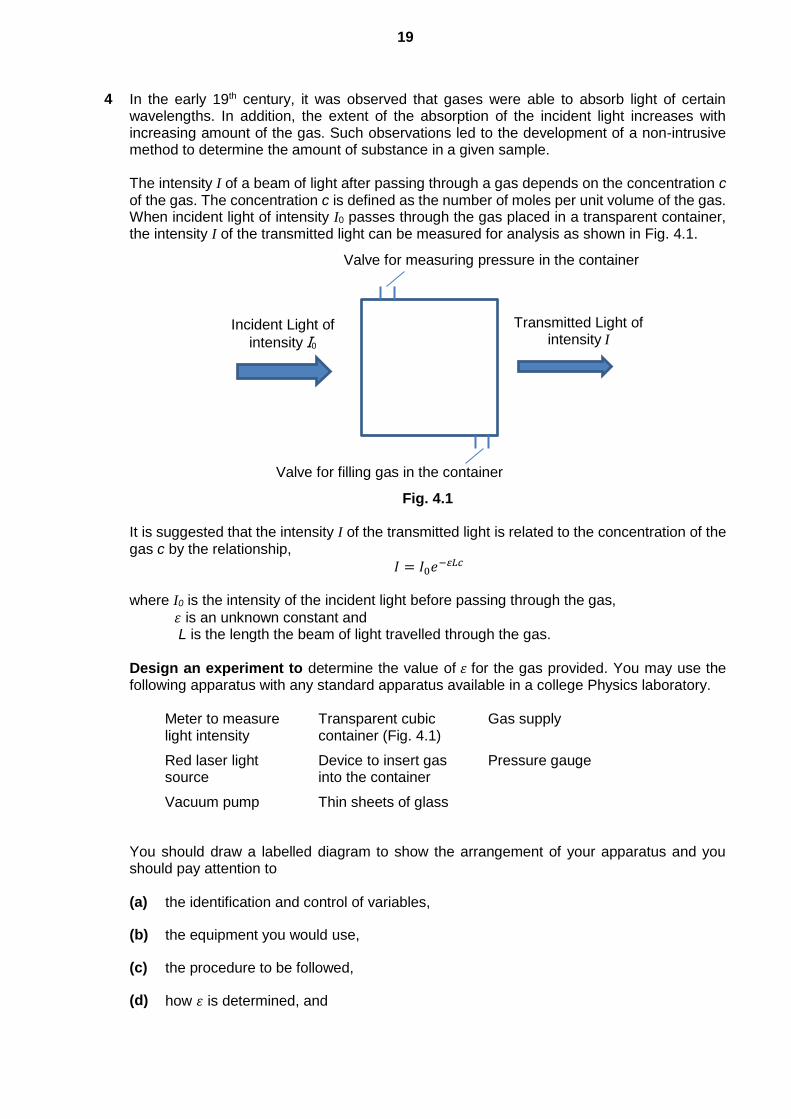
19
4
In the early 19th century, it was observed that gases were able to absorb light of certain wavelengths. In addition, the extent of the absorption of the incident light increases with increasing amount of the gas. Such observations led to the development of a non-intrusive method to determine the amount of substance in a given sample. The intensity I of a beam of light after passing through a gas depends on the concentration c of the gas. The concentration c is defined as the number of moles per unit volume of the gas. When incident light of intensity I0 passes through the gas placed in a transparent container, the intensity I of the transmitted light can be measured for analysis as shown in Fig. 4.1.
Fig. 4.1
It is suggested that the intensity I of the transmitted light is related to the concentration of the gas c by the relationship,
𝐼 = 𝐼0𝑒−𝜀𝐿𝑐 where I0 is the intensity of the incident light before passing through the gas,
𝜀 is an unknown constant and L is the length the beam of light travelled through the gas. Design an experiment to determine the value of 𝜀 for the gas provided. You may use the following apparatus with any standard apparatus available in a college Physics laboratory.
Meter to measure light intensity
Transparent cubic container (Fig. 4.1)
Gas supply
Red laser light source
Device to insert gas into the container
Pressure gauge
Vacuum pump Thin sheets of glass
You should draw a labelled diagram to show the arrangement of your apparatus and you should pay attention to
(a) the identification and control of variables,
(b) the equipment you would use,
(c) the procedure to be followed,
(d) how 𝜀 is determined, and
Valve for measuring pressure in the container
Valve for filling gas in the container
Incident Light of
intensity I0
Transmitted Light of intensity I

20
(e) any precautions that would be taken to improve the accuracy and safety of the experiment.
Diagram
………………………………………………………………………………………………[12]
Solution: Diagram:
Independent Variable: Concentration of gas, c Dependent Variable: Intensity of the transmitted light, I Controlled Variable: Distance between light source to meter, volume of container, Intensity of red laser light source before transmission, temperature of gas Procedure:
1. Set up the experiment as shown in the above diagram. Align the red laser such that the light enters the container at right angle and falls on the meter. Check using a set square, a ruler and a protractor.
2. Use a set square with a metre rule to measure the distance between the laser light and the bench to check that the laser beam is parallel to the bench. Once in position, secure the red laser, container and meter in place with a G-clamp, such that the distance between the laser and the meter and the alignment is fixed throughout the experiment.
3. At the start, there is no gas molecules in the container. Use a vacuum pump to remove any air particles in the container.
4. Switch on the laser light and measure the intensity I0 of the light source before passing through.
Red laser
Retort Stand
pressure gauge
meter to measure
intensity of light
bench
gas supply
Thermometer
L

21
5. Fill the container with the gas provided and measure the pressure of the gas in the container using a pressure gauge.
6. pV = nRT p = (n/V) RT c = p / RT Calculate c from the measured pressure using the equation above. Measure the temperature of the gas from the thermometer inserted into the container.
7. Switch on the laser light and measure the intensity of the light after passing through the gas using the meter.
8. Repeat steps 2 to 5 by varying the concentration c of the gas molecules in the container. Increase the gas molecules from the gas provided and measure the changes in p to determine the change in concentration c. Repeat until at least 6 sets of I and c are obtained.
9. Taking the natural ln of the equation,
𝐼 = 𝐼0𝑒−𝜀𝐿𝑐 ln 𝐼 = ln 𝐼0 − 𝜀𝐿𝑐
Plot a graph of ln I against c, a straight line should be obtained. Calculate the
gradient of the line and the gradient value will be equal to – 𝜀𝐿. Measure the length of the container with a metre rule to get L, and from there, calculate for a
value of 𝜀. Additional Details:
Use the same gas to ensure that the energy level of the gas molecules still allow absorption of the laser light. Use the same container to keep the volume of the gas fixed.
Conduct a preliminary experiment to determine the suitable range of pressure p that will cause an observable change in the light intensity measured. In addition, use a low pressure p in the preliminary experiment to ensure values changes are still obtainable while keeping the pressure low to prevent breakage of the container. Low pressure also ensures that the ideal gas equation, pV = nRT is more valid in this experiment.
Switch on the laser light and allow time (e.g. 5 min) for the laser light to stabilize before taking any reading. Conduct step 4 to check for the stability in the laser intensity. Wait for a longer period of time if laser light intensity is not stable yet.
Conduct the experiment in an air-conditioned room so that the temperature at which the experiment is conducted is kept constant. Continue to measure the temperature of the gas with a thermometer. When there is a difference in the temperature, allow time for the temperature to stabilize before taking the reading.
Have the laser light passing through the container at the same entry and exit point when repeating the readings for different sets of I and c so that the optical path length that the light passes through the container is kept the same
o To ensure the laser light enters the container perpendicular to the surface, check for possible reflection of the laser light from the container surface. The laser beam is perpendicular to the surface once the reflected beam and the incident beam are in the same line.
Calculate ln I0 from the data collected in step 4 and compared with the y-int values from the graph. Calculating the percentage difference between the two values will inform us the extent of the systematic error in this experiment.
Safety:
Wear goggles to prevent accidental eye contact to the strong laser light
Have signs put around the experiment area to warn passer-by on laser light being used in the experiment.
Conduct the experiment starting with low pressure and conduct preliminary experiment to determine the smallest increment necessary to take sensible reading. This is to avoid over-filling the container with too much gas so as to

22
prevent over-building up of pressure which might cause harm to instrument and people nearby.
Marking Points:
P1 mark – Problem Identification. Correct IV, DV and at least 2 CVs
D1 mark – Diagram. Shows relative positions of all apparatus that are used to take sensible reading. Apparatus are secured (no free hanging apparatus)
IV1 mark – Measurement of IV (Concentration). Pressure Measurement with Pressure Gauge
IV1 mark – Calculate IV, c, together with a measurement of temperature.
DV1 mark – Measurement of dependent variable. Light intensity using a meter
VIV1 mark – Methods of varying concentration of gas molecule and to collect at least 6 sets of readings.
A1 mark – Graphical analysis. Plot the correct log / ln graph
A1 mark – describe explicitly how 𝜀 is obtained experimentally. Involve measurement of L
CV1 mark – Addressed any one of the CV mentioned. Methods to keep constant
AD2 marks – Any 2 significant methods that improves the accuracy and precision of the experiment. (max 2 marks)
S1 mark – State a significant sources of error Examiners’ Comments:
Diagram: (D mark) The purposes of a diagram are to
o Identify most apparatus and their spatial set up to obtain observable data. o Indicate all spatial quantity such as length and angle
Apparatus in the diagram have to be supported or clamped in place. Most answers did not score the D mark due to free hanging apparatus such as the laser light source and the intensity metre. As candidates may not be expected to know novel instrument such as the intensity metre or the container, the skills knowing that they have to be secured would generally be awarded credit. Procedure: P mark: Most answers are awarded the P mark for identifying the problem at hand. Nonetheless, candidates will need to distinguish the exact IV and the means of getting the IV. In this question, the actual IV is the concentration while the pressure is a way of getting the concentration. IV mark: Most answers indicate the need to measure pressure P to derive concentration c. Better answers provides the ideal gas equation and the need to measure the temperature of the gas to derive c. Common errors that are worrying include using certain mole of gas without calculations or measurements; not reflecting the need for temperature measurement and stating that the volume of the gas changes when inside a container of fixed internal volume. DV Mark: Majority of the answers use the intensity metre to measure the light intensity after the light has passed through the gas, CV Mark: Only a few answers provide methods or action plans to keep the CV constant. Most answers reflect that some variables need to be constant but did not give satisfactory actions to keep them constant. In addition, candidates will need to realise that measuring a quantity does not keep the quantity constant. The solution might be trying to convey the idea of verifying the quantity is the same before taking the measurement but currently, they came across as keeping constant by mere acts of measurements.

23
VIV Mark: Most answers indicate the need to vary for at least 6 sets of readings so as to plot a graph for analysis. This mark is awarded to the action steps of how concentration is to be changed and not merely stating that concentration is changed. Analysis Mark (A): A graphical solution to the planning question is expected. Most answers indicate to plot ln I against ln c. However, the gradient is often quoted wrongly. In addition, a worrying number of answers did not measure L (just like measuring T) and assumed the length to be constant at a fixed known values. Candidates will need to appreciate that any physical quantity that can be measured using laboratory apparatus must be experimentally accounted for with an action plan. Additional Details Mark (AD): The purpose of the AD is to provide any actions that will improve the accuracy and precision of the experiment, after ascertain that the instrument used are the best with no error. Therefore, poor answers that claim faulty apparatus such as fingerprints on containers, tight sealing of the valves and etc are generally not awarded credit. Better answers mentioned the need for good alignment, conducting in a dark room and/or an air-conditioned room. Safety Mark (S): Many answers did not have the safety considerations in terms of preventive measures/actions but are in terms of non-action statements such as “Do not stare into the laser beam.” Instead, preventive measures such as wearing protective goggles is preferred.
-- END OF PAPER –