Managing large herbivores in theory and practice: is the game the same for browsing and grazing...
16
-
Upload
universite-lyon -
Category
Documents
-
view
0 -
download
0
Transcript of Managing large herbivores in theory and practice: is the game the same for browsing and grazing...


Chapter 11 Managing Large Herbivores in Theory and Practice: 1s the Game the Same for Browsing and Grazing Species?
Jean-Michel Gaillard, Patrick Duncan, Sip E. Van Wieren, Anne Loison, François Klein, and Daniel Maillard
11.1 Introduction
Management of large wild herbivores sometimes includes action on the availability of resources andor on the abundance of predators, but the management of most populations of these anirnals is limited to the choice of hunting quotas (Williams et al. 2002). The dynamics of the target populations, in interaction with their habitats, is therefore a central process in management. The dynamics of populations is driven by their demographic parameters, Le., the rates of reproduction and survival. Demographic rates vary according to the sex and age of the individuals, and also show different degrees of temporal and spatial variation among populations (Gaillard et al. 2000; Coulson et al. 2001). In this chapter we first address the question: do browsing and grazing large herbivores have different demographic rates driving the dynamics of their populations?
Management of most populations of large herbivores being, as stated, based on the choice of quotas for offtake by hunting, a reliable assessment of trends in popu- lation size is required. Total counts of individuals in the whole population area or sample counts of plotsltransects have been the most popular way for assessing population sizes (e.g., Caughley 1977; Seber 1982; for deer see Cederlund et al. 1998 and for mountain ungulates Loison et al. 2006). In the context of game species such as these, hunting-related methods such as drives (McCullough 1979), observa- tions from vantage points (Ratcliffe 1987), and number of animals seen during hunts (Ericsson and Wallin 1999) are often used. However, such counts are often imprecise, and biased (Williams et al. 2002). Caughley (1977) pointed out that it is difflcult to achieve a coeff~cient of variation of less than 20% for counts of animals. The roe deer (Capreolus capreolus), the most abundant deer species in Europe (Andersen et al. 1998), is particularly difficult to count and underestimates of density can be as high as 50% (Cederlund et al. 1998). Since grazers and browsers live in different habitats (Jarman 1974), they pose different problems in estimation of trends in abundance, due in particular to differences in visibility between habitats and to differences in variance because of contrasting group sizes.
Another problem in the management of large herbivores is that the response of populations to a given offtake varies according to the relative importance of
I.J. Gordon and H.H.T. Pnns (eds.), The Ecology of Browsing and Grazing. 293 Ecological Studies 195 O Spnnger 2008

294 J.-M. Gaillard et al.
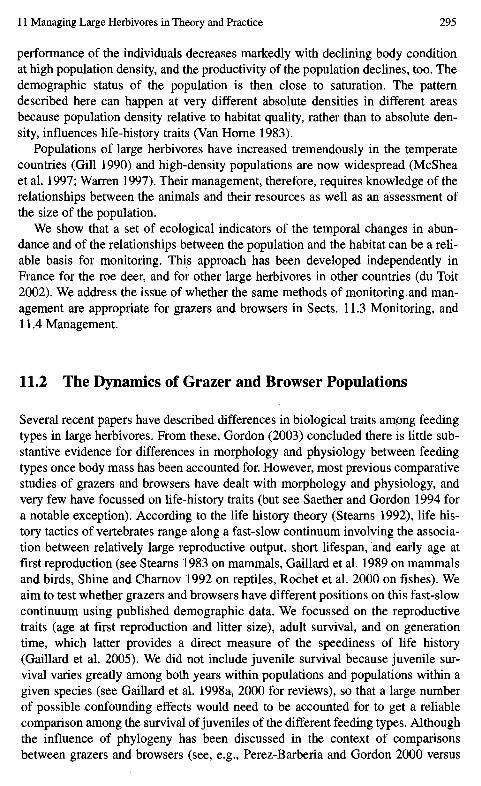
density-dependent and density-independent processes acting on the population (Caughley 1977). Populations of animals in good condition (because resources are abundant) respond differently from populations of animals in poor condition to the same offtake (Caughley 1977). Monitoring populations of large herbivores should, therefore, be rooted in the concept of density dependence, the functional depend- ence of a demographic rate on changes in population size (Williams et al. 2002). This provides a measure of the population-environment relationships, as illustrated in Fig. 11.1. Density dependence is a commonly observed process in populations of large herbivores (Saether 1997; Gaillard et al. 2000). It is widely accepted that populations of large herbivores vary in numbers according to a generalized logistic model (also called theta logistic model; Lande et al. 2003) that includes non-linear density-dependent changes in population growth (Gilpin and Ayala 1973; Fowler 1981). At very low density, the population shows a 'colonising' status and the growth rate is close to maximal (r-max sensu Caughley 1977). The population's productivity is, however, quite low because of the small size of the population. As the size of the population increases, small decreases in individual performance lead the growth rate of the population to decrease slowly, while the population produc- tivity increases. When the population size reaches 50-90% (depending on the gen- eration time, Fowler 1988) of the carrying capacity (defined here as the population size at which the population no longer increases), the population productivity peaks (MSY-maximum sustainable yield-in Caughley 1977). After this point, the
Time (years)
Fig. 11.1 Growth, individual growth and size of a theoretical population according to a theta logistic model. The black full line corresponds to changes of the population size over time, the greyfull line corresponds to the variation of the population productivity according to the population size, and the dotted line corresponds to the variation~of the individual performance according to the population size
11 Managing Large Herbivores in Theory and Practice 295
performance of the individuals decreases markedly with declining body condition at high population density, and the productivity of the population declines, too. The demographic status of the population is then close to saturation. The pattern described here can happen at very different absolute densities in different areas because population density relative to habitat quality, rather than to absolute den- sity, influences life-history traits (Van Home 1983).
Populations of large herbivores have increased tremendously in the temperate countries (Gill 1990) and high-density populations are now widespread (McShea et al. 1997; Warren 1997). Their management, therefore, requires knowledge of the relationships between the animals and their resources as well as an assessment of the size of the population.
We show that a set of ecological indicators of the temporal changes in abun- dance and of the relationships between the population and the habitat can be a reli- able basis for monitoring. This approach has been developed independently in France for the roe deer, and for other large herbivores in other countries (du Toit 2002). We address the issue of whether the same methods of monitoring and man- agement are appropriate for grazers and browsers in Sects. 11.3 Monitoring, and 11.4 Management.
11.2 The Dynamics of Grazer and Browser Populations
Several recent papers have described differences in biological traits among feeding types in large herbivores. From these, Gordon (2003) concluded there is little sub- stantive evidence for differences in morphology and physiology between feeding types once body mass has been accounted for. However, most previous comparative studies of grazers and browsers have dealt with morphology and physiology, and very few have focussed on life-history traits (but see Saether and Gordon 1994 for a notable exception). According to the life history theory (Stearns 1992), life his- tory tactics of vertebrates range along a fast-slow continuum involving the associa- tion between relatively large reproductive output, short lifespan, and early age at first reproduction (see Stearns 1983 on marnmals, Gaillard et al. 1989 on mammals and birds, Shine and Charnov 1992 on reptiles, Rochet et al. 2000 on fishes). We aim to test whether grazers and browsers have different positions on this fast-slow continuum using published demographic data. We focussed on the reproductive traits (age at first reproduction and litter size), adult survival, and on generation time, which latter provides a direct measure of the speediness of life history (Gaillard et al. 2005). We did not include juvenile survival because juvenile sur- vival varies greatly among both years within populations and populations within a given species (see Gaillard et al. 1998a?, 2000 for reviews), so that a large number of possible confounding effects would need to be accounted for to get a reliable comparison among the survival of juveniles of the different feeding types. Although the influence of phylogeny has been discussed in the context of comparisons between grazers and browsers (see, e.g., Perez-Barberia and Gordon 2000 versus

296 J.-M. Gaillard et al.
Mysterud 1998), we did not analyse phylogenetic influences. The usefulness of correcting for phylogenetic inertia has been challenged (e.g., Price 1997; Ricklefs and Starck 1996), leading many authors to perform both a standard analysis using the raw data and a comparative analysis accounting for phylogenetic inertia (inde- pendent contrasts in most cases; see Fisher and Owens 2000; Nagy and Bradshaw 2000; Perez-Barberia and Gordon 2001 for examples). As the correction for phylo- genetic inertia increases the p-values of the statistical tests, but does not affect the parameter estimates, we will consider the size of the effects more than the signifi- cance of the statistical tests. To test for life-history differences among feeding types, we split the species of large herbivores into three categories of feeding types: browsers with a diet including less than 10% grass, intermediate feeders with a diet including between 10 and 90% grass, and grazers with a diet of more than 90% of grass; in agreement with most recent analyses focussing on feeding types (e.g., Van Wieren 1996; Perez-Barberia and Gordon 2000). We used available data bases (restricted to ruminant species) to assess the influence of feeding types on life his- tory traits. To account for the marked allometric relationships that occur in most life history traits (Peters 1983; Calder 1984; Brown and West 2000), we performed an ANCOVA with the log-transformed life history trait as the dependent variable, the species-specific body mass (after log-transformation) as the covariate, and the feeding type as the factor. We ran five models in each case: (1) the model including an interaction term between feeding types and body mass that corresponds to dif- ferent allometric relationships among feeding types; (2) the model including an additive effect between feeding types and body mass that corresponds to a similar allometric relationship, but with differences in the life history trait at a given mass among feeding types; (3) the model including the allometric relationship only (i.e., no influence of feeding types); (4) the model including differences among feeding types only (Le., no influence of body mass); and (5) the model including a constant value of the life history trait (i.e., no influence of feeding types or body mass). According to the recommendations of Burnham and Anderson (1998), we used the model with the lowest Akaiké Information Criterion (AIC) as the best model (best compromise between precision and accuracy).
DifS'erences in reproductive traits among feeding types. We used the species- specific data available in Van Wieren (1996) to assess the influence of feeding types on age at first breeding (first recorded matings, N= 140 species) and on fecundity (N= 141), principally bovids and cervids from a wide variety of habitats in Africa, Eurasia, and the Americas. For age at first breeding, the best model included addi- tive effects of body mass and feeding types (Table 11.1). As expected, the age at first breeding was allometrically related to body mass, although the slope was much less than the expected value of 0.25 for biological time (slope 0.147, SE=0.019). For a given body mass browsers bred for the first time earlier than intermediate feeders (difference 0.269, SE = 0.058) and grazers (difference 0.349, SE = 0.066). The additive effects of body mass and feeding types accounted for 61.8% of the variability observed in age at first breeding. For the fecundity (measured as the number of offspring produced per year), the same model was retained (Table 11.1). As expected, fecundity decreased allometrically with increasing body mass

11 Managing Large Herbivores in Theory and Practice 297
Table 11.1 Model selection for the analysis of the variation in some life history traits. The table reports the AIC value of each model fitted (1: Interactive effects between feeding type and body mass, 2: additive effects of feeding type and body mass, 3: effect of body mass (allometric effect), 4: effect of feeding type, 5: constant value for the life history trait). The selected model (lowest AIC value) occurs in italics Mode1 Life history trait 1 2 3 4 5
Age at first breeding 30.61 2 7.63 53.99 74.79 156.41 Fecundity 90.43 86.57 88.86 111.73 146.45 Adult sumival 49.58 45.84 44.27 43.86 42.27 Generation time 11.28 7.98 8.33 23.36 20.1 8
although the slope differed from -0.25, the expected allometric exponent for fre- quency (slope -0.130, SE=0.024). For a given body mass browsers tended to have higher fecundity than intermediate feeders (difference 0.095, SE=0.072) and had higher fecundity than grazers (difference 0.202, SE=0.081). The additive effects of body mass and feeding types accounted for 37.5% of the variability observed in annual fecundity.
Differences in adult suwival among feeding types. We used the species-specific data available in Gaillard et al. (2000) to assess the influence of feeding types on adult survival (N=24 species). The model with a constant adult survival (2.42, SE=O.11 on a logit scale corresponding to a survival rate of 0.92) was selected (Table 11.1). The additive effects of body mass and feeding types only accounted for 9.63% of the variability observed in adult survival.
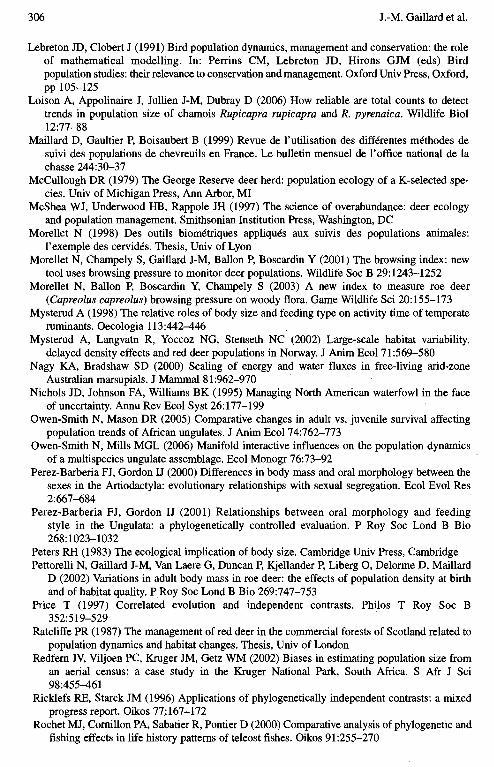
Dzferences in generation lime among feeding types. We used the data in Sinclair (1996) and Gaillard et al. (2000) to assess the influence of feeding types on generation time (N=26 species). The best model included additive effects of body mass and feed- ing types (Table 11.1). As expected, the generation tirne was allometrically related to body mass, with a slope very close to the expected value of 0.25 for biological times (slope 0.227, SE=0.050). For a given body mass browsers had shorter generation tirne than intermediate feeders (difference 0.25 1, SE = 0.132) and grazers (difference 0.223, SE=0.134). The additive effects of body mass and feeding types accounted for 50.4% of the variability obsened in generation time (Fig. 11.2).
These analyses show that browsers have faster life histories for a given body mass than intermediate feeders and grazers. A faster life history can involve an earlier age at first breeding, a higher fecundity rate, andor a shorter lifespan: we show that browsers have faster life histories than grazers and intermediate feeders because they breed earlier and produce more offspring. Thus, a lOOkg browser breeds for the first time at 1.15 years of age and produces an average of 1.37 off- springlyear, whereas a grazer of the same mass breeds for the first time at 1.62 years of age and produce an average of 1.12 offspringlyear (see Table 11.2). As expected from scaling theory (Brown and West 2000), the reproductive output of large herbivores decreased with increasing body mass at similar rates in al1 feeding types (Table 11.2). Adult survival of large herbivores, on the other hand, was quite constant at 0.92 and did not depend either on body mass or on feeding type. Such a constancy of adult survival fits with previous analyses of large herbivores that

J.-M. Gaillard et al.
1.2 2.0 2.5 3.0 3.5 4.0 4.5 5.0 5.5 6.0 6.5 7.0
Ln (Body mass)
Fig. 11.2 Allometric relationship between generation time and body mass in ruminants in relation to the feeding type. The lines (full line for browsers, dashed line for inteqnediate feeders, and dotted line for grazers) that correspond to the selected model (i.e., additive effects of body mass and feeding types) and the data points (filled circles for browsers, open squares for intermediate feeders, and open circles for grazers) are shown
'ïàble 112 Expected age at first breeding (AFB, in years) and annual fecundity (Fec, in number of o f f s p ~ g bom) for large herbivores of different body mass and belonging to diierent feeding types. The estimates correspond to the models selected in each anaiysis (see text for fwther details)
Browsers Intermediate feeders Grazers
AFB Fec AFB Fec AFB Fec
reported high survival rates resilient to environmental variations (Gaillard et al. 2000; Gaillard and Yoccoz 2003). The shorter generation time of browsers compared to intermediate feeders and grazers is thus due only to a higher reproduc- tive output. While this shorter generation time we report for browsers increases the relative influence of reproductive traits on population growth rate (Gaillard et al. 2005), Our analyses demonstrate the existence of a single general demographic pattern cornmon to al1 large herbivores. Indeed, a 2kg browser is the fastest large herbivore, in terms of its demography, that can exist. For such an animal, the expected generation time estimated from Our selected model is 2.57 years. According to the direct mathematical link that relates elasticities of demographic parameters (Le., the relative potential impact of demographic parameters on

11 Managing Large Herbivores in Theory and Practice 299
population growth) and generation time (see Lebreton and Clobert 1991, Gaillard et al. 2005), any population with a generation time longer than 2 years will be more sensitive to a given change in adult survival than to the same change in recruitrnent. This means that the population growth of al1 large herbivores, independently of size and feeding type, must be more sensitive to a given change in adult survival than to the same change in a reproductive rate.
The physiological mechanisms behind this difference in generation time remain to be elucidated: the meta-analyses that have so far been conducted do not prove that the digestive ability of browsers is greater than grazers and intermediate feeders, and it is not established that selective feeding by browsers on plants with high levels of ce11 contents provides them with richer diets (higher protein contents andor lower cell-wall constituents; Duncan, A. and Poppi, this volume). However, the quality of the data is not good enough to rule out these possible mechanisms.
The life-history differences between browsers and other feeding categories we report here are likely to have general consequences for the status of populations of large herbivores in the future, in the context of global change. The marked increases in CO2 concentrations (IPCC 2001) may favour woody plants within savannas (Bond and Midgley 2000), so browsers may increase relative to large her- bivores with other feeding types in this habitat (see Janis et al. 2000 and Gordon and Prins this volume). However, climate change will not affect the CO2 concentrations alone, and may decrease the area of savannas, so that the loss of favourable habitat may overcompensate the benefit of incieased CO2 concentra- tions. On the other hand, the increase of woodland areas in western Europe should benefit browsers. The success of roe deer (Andersen et al. 1998) is consistent with this view. With a faster turnover, browsers should be more resilient to overhunting than grazers and intermediate feeders. A comparative analysis of hunting bags over a large geographical scale in relation to feeding types would be required to test for such a prediction. Lastly, the faster turnover of browsers as compared to large her- bivores of other feeding types may confer browsers faster speciation rates. Vrba (1987) has identified some links between ecological features and speciation rates that could indicate that such differences between browsers and grazers could occur; this prediction, however, requires testing explicitly.
11.3 Monitoring
The relationships between the animals and their habitats should be monitored on the basis of 'indicators of ecological change' (sensu Cederlund et al. 1998). As defined by Waller and Alverson (1 997), these are 'efficient and reliable indicators capable of sewing as "early warnings signs" of impending ecological change' (see also Cairns et al. 1993). Such indicators include measures of trends in abundance of the condition of the animals and of the quality of their habitats. Dale and Beyeler (2001) have reviewed al1 criteria that an ecological indicator should meet: 'be easily measured, be sensitive to stresses on the system, respond to stress in a predictable

300 J.-M. Gaillard et al.
manner, be anticipatory, predict changes that can be averted by management actions, be integrative, have a known response to disturbances, anthropogenic stresses, and changes over time, and have low variability in response'.
As no single indicator fulfils al1 these criteria, a manageably small set of indica- tors needs to be derived that, together, meet these criteria (Dale and Beyeler, 2001). Moreover, because we cannot possibly monitor every component of an ecological system, we are constrained to identify a small number of indicators that characterise the relevant parts of the system.
Monitoring the abundance of grazers and browsers. The concepts outlined above are equally valid for grazers and browsers. However, large herbivores of different feeding types live in different habitats (Hofmann 1989; Fritz and Loison 2006), where visibility is different. Grazers typically live in open areas that have less variable, and overall greater, visibility than the often quite closed areas such as forests where browsers live. This means that undercounting might be less of a prob- lem, and bias error might be lower in counts of grazers as compared to browsers. However, this does not mean that total counts of grazers are reliable. For instance, both the number of ibex Capra ibex (Gaillard et al. 2003) and chamois Rupicapra rupicapra (Loison et al. 2006) counted in open mountainous areas, and the number of African ungulates counted from the air in savanna (Jachmann 2002) have been reported to be severely underestimated. However, the rate of underestimation when counting grazers should be less than that when counting browsers. For instance, an underestimation by a factor of 3 or more has been commonly reported for roe deer (Andersen 1953)'
As a corollary of differences in habitat openness, group sizes also differ among feeding types (Jarman 1974), with browsers living in smaller groups than grazers (Fritz and Loison 2006). As the variance of abundance estimate increases with increasing group size (Burnham et al. 1980), the precision of counts, al1 other things being equal, should be better for browsers than for grazers.
As visibility and group size differ markedly arnong feeding types and strongly influence the sampling design of population counts, the methods used to monitor trends in the abundance of browsers and grazers should be different.
For browsers like roe deer, the Kilometric Index (measured as the number of animals observed per km of foot transect; Vincent et al. 1991) is closely correlated with tme changes in the abundance of deer (as assessed by using Capture-Mark- Recapture methods; see Gaillard et al. 1993) in two forests where the exploitation of trees for timber caused considerable changes in visibility over 20 years. The passage of hurricane Lothar in late 1999 led to the breaking or uprooting of a third of the trees in these forests: there may have been an effect of lower visibility on the index in the three years after the hurricane, but this did not cause any bias in the long term. Visibility that varies spatially is not a major problem, provided that the mean value remains reasonably constant over time. This approach is now widely used for browsers (Maillard et al. 1999). If measures of absolute densities are required, 'distance' methods are insensitive to changes in visibility of the animals (Burnham et al. 1980), as the distances at which they are sighted are taken into account.

1 1 Managing Large Herbivores in Theory and Practice 30 1
For grazers, total or sample counts (most often aerial counts; Jachmann 2001) are usually performed. Although they can provide data for detailed demographic analyses (Owen-Smith and Mason 2005; Owen-Smith and Mills 2006), the accuracy of these procedures has not yet been assessed. However, available empirical evidence indicates that size (larger is better) and colour (high contrast between coat colour and ground colour is better) influence the reliability of aerial counts of large herbivores (Redfern et al. 2002; Jachmann 2002).
Monitoring the condition of grazers and browsers. The phenotypic quality of individuals varies strongly with population density (Fowler 1987), and hence offers a potential tool to monitor the population status of large herbivores. For instance, the body mass of fawns in winter (Vincent et al. 1995; Gaillard et al. 1996), the cohort jaw length (Hewison et al. 1996), and the hind foot length of fawns (Toïgo et al. 2006; Zanneïse et al. 2007) have al1 been reported to decrease markedly with increasing population density of roe deer and are now used as indicators of population changes in a management context (e.g., Blant and Gaillard 2004 in Switzerland). The winter body mass of fawns is widely used as a short-term measure, since this is related to events (such as rainfall) in the previ- ous sumrner, and the amount of acorn mast in autumn (Kjellander et al. 2006). The length of the hind foot of fawns integrates events over a longer time-scale, and is very convenient to measure. For longer time horizons the jaw length is a useful index of the quality of individuals (Hewison et al. 1996). Resource shortage in early life leads to permanent effects on the size of many marnrnals, including red deer Cewus elaphus (Mysterud et al. 2002) and roe deer (Pettorelli et al. 2002). This causes variation in performance among year classes and thus to delayed density-dependent effects on the dynamics of their populations ('cohort variation'; Albon et al. 1987).
The reproductive performance of individuals in the population can be moni- tored by the number of offspring per female (Vincent et al. 1995) or as the number of fawns per reproducing female (Le., females with fawns at heel; Boutin et al. 1987). However, for polytocous species such as roe deer, the pattern of variation of reproductive performance as assessed by sampling females can be blurred by differential farnily effects in relation to cohort quality, since in poor cohorts fawns born in the same family cornrnonly have similar fates (Le., both die or both survive in most cases), whereas there is no family effect during good years (Gaillard et al. 1998b). Further work is therefore required to assess the suitability of such indicators for management.
The abundance of resources, and the level of their use, can be measured easily on woody plants (Aldous 1944). However, there are strong biases due to differences among observers in their estimations of plant cover (Morellet 1998). The browsing index has, therefore, been developed (Morellet et al. 2001); this is calculated for each plant species using sample plots of 1 m2 as the proportion of plots in which that species was browsed. Data on the presence/absence of plant species and of signs of browsing on them in quadrants of 1 m2 have been found to be much more repeatable, and therefore better indices of the abundance and use of resources (Morellet et al. 2001; Morellet et al. 2003).

J.-M. Gaillard et al.
11.4 Management
For the management of populations of large herbivores to succeed, it needs to be based on (Nichols et al. 1995; Cederlund et al. 1998):
- an assessment of the current state of the animal-habitat relationships based on monitoring ecological changes
- an analysis of the range of possible alternatives to population counts, based on the system's current state, on ecological principles (such as density dependence; see Fig. 11.1), and on the benefits and costs of the possible states to human society
- a choice of management actions by the different stake-holders based on a vision of the optimal future state of the animal-habitat relationships, taking into account uncertainty as to the consequences of management actions in complex systems
Such management is 'adaptive'; its essence is the use of a wide range of indices of animal abundance and condition, and ideally of the abundance of resources and the impact of the animals on resources and on human activities. Managers learn about systems as they manage them (Lancia et al. 1996). Adaptive management (Walters 1986) deals with scientific uncertainty by incorporating a set of models representing the competing hypotheses about system responses to management (Runge and Johnson 2002). With adaptive management the information on the system response to management is gathered continuously so that the information is used to improve biological understanding and to inform future decision-making (Nichols et al. 1995; Shea et al. 1998; Williams et al. 2002). Variations on the theme of adaptive management are used in many wildlife management areas (du Toit 2002).
The two essential decisions in the management of populations of large herbiv- ores concern (1) the objective and (2) the quota. The objective is often decided simply on the basis of the objectives of hunters, but should be based on a wide range of considerations of the benefits and costs of highllow densities of large her- bivores for society as a whole (taking into account ethical, social and economic dimensions) as proposed in Cederlund et al. (1998).
Having decided on the objective, which could be to increase the population, decrease it, or maintain the current size, the quota needs to be decided. Given that the approach based on indicators of ecological changes proposed above do not pro- vide information on population sizes, the quota will initially have to be chosen on the basis of expert opinion, and it will be necessary to take into account the size of the target species and its feeding type. The potential population productivity of small and large grazers and browsers are given in Fig. 11.3; intermediate feeders will have intermediate productivities. As expected, it appears that the population productivity is higher for a given relative population size of small than of large species and of browsers than of grazers. Small browsers are thus expected to be much less sensitive to hunting andlor poaching impact than large grazers.
The quota should then be applied for three years or more, without change, in order to get estimates of the ecological indicators for a given hunting pressure, so that the success of the management can be judged from the monitoring. In the initial

11 Managing Large Herbivores in Theory and Practice
Relative Population Size
Fig. 11.3 Population productivity (measured as the population increase over two consecutive years) as a function of population size for small(25 kg) and large (500kg) browser and grazer. To get estimates of population productivities, we used a Leslie demographic mode1 parameterized with the demographic parameters expected for 25 and 500kg browsers and grazers (as denved from the allometric relationships presented in the text). We thus obtained estimates of population growth (r=0.324 for a 25 kg browser, 0.275 for a 25 kg grazer, 0.275 for a 500kg browser, and 0.181 for a 500kg grazer). Then we used the Fowler's equation relating the relative population size at which the maximum sustainable yield occurs in a population (R), its population growth and its generation time (Fowler 1988). We obtained very similar R values among the four case studies (from 0.536 for a large grazer to 0,560 for a small browser). We thus used a constant R of 0.55.
, We then calculated the population productivity as a function of N, r, and R by using the theta logistic function (Lande et al. 2003)
stages, the management of populations of large herbivores cannot be more accurate than a trial-and-error process dictates, however, as managers gain knowledge of the population-environment system over the years, management will become more finely tuned. Such an approach is thus based on long-term monitoring: the longer the system is monitored, the better it is understood.
11.5 Conclusions
The main source of variation in the life history of large herbivores is the body size of the animal. However, the feeding type, Le., grazing or browsing, also influences the turnover of the population, being faster for browsers and slower for grazers, but the relatively more important role of adult survival as compared to recruitment parameters on the population growth rate of large herbivores does not change. Feeding type strongly affects the use of habitat and the size of the groups the

304 J.-M. Gaillard et al.
animals live in. This means that different methods need to be used for the monitoring and management of grazers and browsers. Management should be adaptive, based on the biology of the animals, and appropriate monitoring of ecological and socio-economic changes in the animal-habitat relationships.
References
Albon SD, Clutton-Brock TH, Guinness FE (1987) Early development and population dynamics in Red Deer. II. Density-independent effects and cohort variation. J Anim Eco1 56:69-81
Aldous SE (1944) A deer browse survey method. J Mammal25:130-136 Andersen J (1953) Analysis of a Danish roe-deer population (Capreolus capreolus L) based upon
the extermination of the total stock. Dan Rev Game Bi01 2: 127-155 Andersen R, Duncan P, Linnell JDC (1998) The European roe deer: the biology of success.
Scandinavian Univ Press, Oslo Blant M, Gaillard JM (2004) Use of biometric body variables as indicators of roe deer (Capreolus
capreolus) population density changes. Game Wildl Sci 21:2140 Bond WJ, Midgley GF (2000) A proposed C02-controlled mechanism of woody plant invasion
in grasslands and savannas. Glob Change Bi01 6:865-869 Boutin JM, Gaillard JM, Delorme D, Van Laere G (1987) Suivi de l'évolution de la fécondité chez
le chevreuil (Capreolus capreolus) par l'observation des groupes familiaux. Gibier Faune Sauvage 4:255-265
Brown JH, West GB (2000) Scaling in biology. Oxford Univ Press, New York Bumham KP, Anderson DR (1998) Mode1 selection and inference: a practical information-theoretic
approach. Springer, Berlin Heidelberg New York Burnham KP, Anderson DR, Laake JL (1980) Estimation of density from line transect sampling
of biological populations. Wildiife Monogr No 72 Caims J, McCormick PV, Niederlehner BR (1993) A proposed framework for developing indica-
tors of ecosystem health. Hydrobiologia 2 3 6 : 1 4 Calder WA (1984) Size, function and life history. Harvard Univ Press, Cambridge, MA Caughley G (1977) Analysis of vertebrate populations. Wiley, Chichester, NY Cederlund G, Bergqvist J, Kjellander P. Gill R, Gaillard J-M, Boisaubert B, Ballon P, Duncan P
(1998) Managing roe deer and their impact on the environment: maxirnising the net benefits to society. In: Andersen R, Duncan P, Linnell JDC (eds) The European roe deer: the biology of sucçess. Scandinavian Univ Press, Oslo, pp 337-372
Coulson T, Catchpole EA, Albon SD, Morgan BJT, Pemberton JM, Clutton-Brock TH, Crawley MJ, Grenfell BT (2001) Age, sex, density, winter weather, and population crashes in Soay sheep. Science 292: 1528-1531
Dale VH, Beyeler SC (2001) Challenges in the development and use of ecological indicators. Ecol Indic 1:3-10
Duncan AJ, Poppi DP, this volume du Toit JT (2002) Wildlife hanesting guidelines for community-based wildlife management: a
southem African perspective. Biodivers Conserv 1 1 : 1403-141 6 Ericsson G, Wallin K (1999) Hunter observations as an index of moose Alces alces population
parameters. Wildlife Bi01 5:177-185 Fisher DA, Owens IPF (2000) Female home range size and the evolution of social organization in
macropod marsupials. J Anim Ecol 69: 1083-1098 Fowler CW (1981) Density dependence as related to life history strategy. Ecology 62:602-610 Fowler CW (1987) A review of density-dependence in populations of large mammals. In:
Genoways HH (ed) Current marnmalogy. Plenum, New York, pp 4 0 1 4 1 Fowler CW (1988) Population dynamics as related to rate of increase per generation. Evol Ecol
2: 197-204

11 Managing Large Herbivores in Theory and Practice 305
Fritz H, Loison A (2006) Large herbivores across biomes. In: Danell K, Duncan P, Bergstrom R, Pastor J (eds) Large herbivore ecology, ecosystem dynamics and conservation. Cambridge Univ Press, Cambridge, pp 1 9 4 9
Gaillard J-M, Yoccoz NG (2003) Temporal variation in survival of mamrnals: a case of environ- mental canalization? Ecology 84:3294-3306
Gaillard J-M, Pontier D, Allain6 D, Lebreton JD, Trouvilliez J, Clobert J (1989) An analysis of demographic tactics in birds and mamrnals. Oikos 5659-76
Gaillard J-M, Delorme D, Boutin JM, Van Laere G, Boisaubert B, Pradel R (1993) Roe deer sur- vival patterns: a comparative analysis of contrasting populations. J Anim Ecol 62:778-791
Gaillard J-M, Delorme D, Boutin JM, Van Laere G, Boisaubert B (1996) Body mass of roe deer fawns during winter in two contrasting populations. Journal of Wildlife Management 60:29-36
Gaillard J-M, Festa-Bianchet M, Yoccoz NG (1998a) Population dynamics of large herbivores: variable recruitment with constant adult survival. Trends Ecol Evol 1358-63
Gaillard J-M, Andersen R, Delorme D, Linnell JDC (1998b) Family effects on growth and sur- vival of juvenile roe deer. Ecology 79:2878-2889
Gaillard J-M, Festa-Bianchet M, Yoccoz NG, Loison A, Toïgo C (2000) Temporal variation in fitness components and population dynamics of large herbivores. Annu Rev Ecol Syst 31 :367-393
Gaillard J-M, Loison A, Toïgo C (2003) Variation in life history traits and realistic population models for wildlife management. In: Festa-Bianchet M, Apollonio M (eds) Animal behavior and wildlife conservation. Island Press, Washington, DC, pp 115-132
Gaillard J-M, Yoccoz NG, Lebreton JD, Bonenfant C, Devillard S, Loison A, Pontier D, D Allain6 (2005) Generation time: a reliable metric to measure life history variation among mammalian populations. Am Nat 166:119-123
Gill R (1990) Monitoring the status of European and North American cervids. GEMS information senes global environment monitoring system. UN Environment Programme, Nairobi, Kenya
Gipin ME, Ayala FJ (1973) Global models of growth and competition. Proc Nat Acad Sci USA, 70:359&3593
Gordon IJ (2003) Browsing and grazing ruminants: are they different beasts? Forest Ecol Manage 181:13-21
Gordon IJ, Pnns HHT, this volume Hewison AJM, Vincent J-P, Bideau E, Angibault J-M, Putman RJ (1996) Variation in cohort
mandible size as an index of roe ,deer (Capreolus capreolus) densities and population trends. J Zoo1 239573-581
Hofmann RR (1989) Evolutionary steps of ecophysiological adaptation and diversification of ruminants: a comparative view of their digestive system. Oecologia 78:443457
IPCC (2001) Working Group I third assessment report, climate change 2001: the scientific basis. http://www.gcno.org/online.htrnl
Jachmann H (2001) Estimating abundance of African wildlife: an aid to adaptive management. Spnnger, Berlin Heidelberg New York
Jachmann H (2002) Comparison of aenal counts with ground counts for large Afncan herbivores. J Appl Ecol 39:841-852
Janis CM, Damuth J, Theodor JM (2000) Miocene ungulates and terrestrial pnmary productivity: where have al1 the browsers gone? Proc Nat Acad Sci USA 97:7899-7904
Jannan PJ (1974) The social organisation of antelope in relation to their ecology. Behaviour 48:215-265
Kjellander P, Gaillard J-M, Hewison AJM (2006) Density-dependent responses of fawn cohort body mass in two contrasting roe deer populations. Oecologia 146521-530
Lancia RA, Braun CE, Collopy MW, Dueser RD, Kie JG, Martinka CJ, Nichols JD, Nudds TD, Porath WR, Tilghman NG (1996) ARM! For the future: adaptive resource management in the wildlife profession. Wildlife S0c.B 2443-2
Lande R, Engen S, Saether B-E (2003) Stochastic population dynamics in ecology and conservation. Oxford Univ Press, Oxford
306 J.-M. Gaillard et al.
Lebreton JD, Clobert J (1991) Bird population dynamics, management and conservation: the role of mathematical modelling. In: Perrins CM, Lebreton JD, Hirons GJM (eds) Bird population studies: their relevance to conservation and management. Oxford Univ Press, Oxford, pp 105-125
Loison A, Appolinaire J, Jullien J-M, Dubray D (2006) How reliable are total counts to detect trends in population size of chamois Rupicapra rupicapru and R. pyrenaica. Wildlife Bi01 12~77-88
Maillard D, Gaultier P. Boisaubert B (1999) Revue de l'utilisation des différentes méthodes de suivi des populations de chevreuils en France. Le bulletin mensuel de l'office national de la chasse 244:30-37
McCullough DR (1979) The George Resewe deer herd: population ecology of a K-selected spe- cies. Univ of Michigan Press, Ann Arbor, MI
McShea WJ, Underwood HB, Rappole JH (1997) The science of overabundance: deer ecology and population management. Smithsonian Institution Press, Washington, DC
Morellet N (1998) Des outils biométriques appliqués aux suivis des populations animales: l'exemple des cervidés. Thesis, Univ of Lyon
Morellet N, Champely S, Gaillard J-M, Ballon P, Boscardin Y (2001) The browsing index: new tool uses browsing pressure to monitor deer populations. Wildlife Soc B 29: 1243-1252
Morellet N, Ballon P, Boscardin Y, Champely S (2003) A new index to measure roe deer (Capreolus capreolus) browsing pressure on woody flora. Garne Wildlife Sci 20: 155-173
Mysterud A (1998) The relative roles of body size and feeding type on activity time of temperate ruminants. Oecologia 11 3:442446
Mysterud A, Langvatn R, Yoccoz NG, Stenseth NC (2002) Large-scale habitat variability, delayed density effects and red deer populations in Norway. J Anim Ecol 71:569-580
Nagy KA, Bradshaw SD (2000) Scaling of energy and water fluxes in free-living arid-zone Australian marsupials. J Mammal 81:962-970
Nichols JD, Johnson FA, Williams BK (1995) Managing North Amencan waterfowl in the face of uncertainty. Annu Rev Ecol Syst 26:177-199
Owen-Smith N, Mason DR (2005) Comparative changes in adult vs. juvenile survival affecting population trends of Afncan ungulates. J Anim Ecol 74:762-773
Owen-Smith N, Mills MGL (2006) Manifold interactive influences on the population dynamics of a multispecies ungulate assemblage. Ecol Monogr 76:73-92
Perez-Barbena FJ, Gordon Li (2000) Differences in body mass and oral morphology between the sexes in the Artiodactyla: evolutionary relationships with sexual segregation. Ecol Evol Res 2:667-684
Perez-Barberia FJ, Gordon IJ (2001) Relationships between oral morphology and feeding style in the Ungulata: a phylogenetically controlled evaluation. P Roy Soc Lond B Bio 268: 1023-1032
Peters RH (1983) The ecological implication of body size. Cambridge Univ Press, Cambridge Pettorelli N, Gaillard J-M, Van Laere G, Duncan P, Kjellander P, Liberg O, Delorme D, Maillard
D (2002) Variations in adult body mass in roe deer: the effects of population density at birth and of habitat quality. P Roy Soc Lond B Bio 269:747-753
Price T (1997) Correlated evolution and independent contrasts. Philos T Roy Soc B 352:519-529
Ratcliffe PR (1987) The management of red deer in the commercial forests of Scotland related to population dynamics and habitat changes. Thesis, Univ of London
Redfem JV, Viljoen PC, Kruger JM, Getz WM (2002) Biases in estimating population size from an aerial census: a case study in the Kruger National Park, South Africa. S Afr J Sci 98:455461
Ricklefs RE, Starck JM (1996) Applications of phylogenetically independent contrasts: a mixed progress report. Oikos 77:167-172
Rochet MJ, Comiiion PA, Sabatier R, Pontier D (2000) Comparative analysis of phylogenetic and fishing effects in life history patterns of teleost fishes. Oikos 91:255-270
11 Managing Large Herbivores in Theory and Practice 307
Runge MC, Johnson FA (2002) The importance of functional form in optimal control solutions of problems in population dynamics. Ecology 83: 1357-1371
Saether B-E (1997) Environmental stochasticity and population dynamics of large herbivores: a search for mechanisms. Trends Ecol Evol 12:143-149
Saether, B-E and 1 J Gordon 1994 The adaptive significance of reproductive strategies in ungu- lates. P Roy Soc Lond B Bio 256:263-268
Seber GAF (1982) The estimation of animal abundance and related parameters, 2nd edn. Griffin, London
Shea K, NCEAS working group (1998) Management of populations in conservations, harvesting and control. Trends Ecol Evol 13:371-375
Shine R, Chmov EL (1992) Patterns of sumival, growth, and maturation in snakes and lizards. Am Nat 139:1257-1269
Sinclair ARE (1996) Mammal populations: fluctuation, regulation, life history theory and their implications for conservation. In: Floyd RB, Sheppard AW, De Barro PJ (eds) Frontiers of population ecology. CSIRO Publishing, Melbourne, pp 127-154
Stems SC (1983) The influence of size and phylogeny on patterns of covariation among life his- tory traits in the mammals. Oikos 41:173-187
Stems SC (1992) The evolution of life histories. Oxford Univ Press, Oxford Toïgo C, Gaillard J-M, Van Laere G, Hewison AJM, Morellet N (2006) How does environmental
variation influence body mass, body size and body condition? Roe deer as a case study. Ecography 29:301-308
Van Home B (1983) Density as a misleading indicator of habitat quality. J Wildlife Manage 47:893-901
Van Wieren SE (1996) Digestive strategies in ruminants and nonmminants. Thesis, Wageningen Agricultural Univ, Wageningen, Netherlands
Vincent J-P, Gaillard J-M, Bideau E (1991) Kilometric index as biological indicator for monitor- ing forest roe deer populations. Acta Theriol36:315-328
Vincent J-P, Bideau E, Hewison AJM, Angibault JM (1995) The influence of increasing density on body weight, kid production, home range and winter grouping in roe deer (Capreolus capreolus). J Zoo1 236:371-382
Vrba ES (1987) Ecology in relation to speciation rates: some case histories of Miocene-recent mammal clades. Evol Ecol 1:283-300
Waller DM, Alverson WS (1997) The white-tailed deer: a keystone herbivore. Wildlife Soc B 25:217-226
Walters CJ (1986) Adaptive management of renewable resources. MacMillan, New York Warren RJ (1997) The challenge of deer overabundance in the 21st century. Wildlife Soc B
25:213-214 Williams BK, Nichols JD, Comoy MJ (2002) Analysis and management of animal populations.
Academic Press, San Diego Zanneïse A, Baïsse A, Gaillard JM, Hewison AJM, Saint-Hilaire K, Toïgo C, Van Laere G,
Morellet N (2007) Hind foot length: an indicator for monitoring roe deer populations at a landscape scale. Wildlife Soc B (In press)