MAN IN SOCIETY | Utkal University
127
MAN IN SOCIETY THE JOURNAL OF ANTHROPOLOGY DEPARTMENT PG DEPARTMENT OF ANTHROPOLOGY UTKAL UNIVERSITY BHUBANESWAR, INDIA - 751004 Published by VOL. 23, 2016 ISSN 2347-1530 MAN IN SOCIETY THE JOURNAL OF ANTHROPOLOGY DEPARTMENT PG DEPARTMENT OF ANTHROPOLOGY
-
Upload
khangminh22 -
Category
Documents
-
view
4 -
download
0
Transcript of MAN IN SOCIETY | Utkal University

MAN IN SOCIETYTHE JOURNAL OF ANTHROPOLOGY DEPARTMENT
PG DEPARTMENT OF ANTHROPOLOGYUTKAL UNIVERSITY
BHUBANESWAR, INDIA - 751004
Published by
VOL. 23, 2016 ISSN 2347-1530
MAN IN SOCIETYTHE JOURNAL OF ANTHROPOLOGY DEPARTMENT
PG DEPARTMENT OF ANTHROPOLOGY

Editor in Chief (Managing Editor):
Prof. Upali Aparajita
Editorial Board:
Prof. Kishor Kumar BasaProf. Sabita AcharyaDr. Prasanna Kumar Patra Dr. Kanhu Charan SatapathyMr. Daitari SahooMr. Subrat Kumar NaikDr. Priyanka Khurana
Board of Editorial Assistant:
Dr. Arundhuti DasUGC DS Kothari Postdoctoral Fellow
Mr. Gyanendra Kumar DhirPh. D. Scholar (UGC -JRF)
Mr. Manas Ranjan SahooPh. D. Scholar (UGC-JRF)
Editorial Office:
Editor Man in SocietyP.G Department of Anthropology, Utkal University, Vani Vihar,Bhubaneswar, Pin-754004Ph: 0674 2567217Email: [email protected]: www.misanthroutkal.com
Editorial Advisory Board:
Prof. L. K. MohapatraProf. K. C. TripathyProf. Prasanna Kumar NayakProf. S.K. GhoshMaulikProf. Jagannath DashProf. Renupama MohantyProf. Jyoti KanungoDr. Basanti Rath
Editorial Advisory Board (External):
Prof. Akio TanabeUniversity of Tokyo, Japan
Prof. Margaret Sleeboom-FaulknerUniversity of Sussex, UK
Prof. Subho RoyUniversity of Calcutta, India

“MAN IN SOCIETY- The Journal of Anthropology Department” is an annual peer-reviewed journal with ISSN No: 2347-1530 of the P.G. Department of Anthropology, Utkal University, designed for prompt publications of original and important articles in the field of anthropology. The contributions can be in the form of papers, shorter notes, review articles, book reviews and discussions.
All the printing process is powered by Prasar Media CommunicationB-9, Sahidnagar, Bhubaneswar
Odisha, India
Copy Right © 2016 by HOD, PG Department of Anthropology, Utkal University All rights reserved.
No part of this publication may be reproduced, transmitted or stored in a retrieval system, in any form or by any means, electronic, mechanical,
photocopying, recording or otherwise,Without the prior permission of the publisher.
This Journal is sold subject to the conditions that it shall not, by way of trade or otherwise, be lent, re-sold, hired out or otherwise circulated
without the publisher's prior consent in any form of binding or cover other than that in
which it is published.
Subscription: Man in Society is published once a year: Annual Subscription: Individual: INR 300 Institutional: INR 500
Printed and Published by Prof. Upali Aparajita, Head, PG Department of Anthropology, Utkal University on behalf PG Department of Anthropology, Utkal University, Vani Vihar, Bhubaneswar, Pin- 754004, Ph: 0674 2567217, Email: [email protected], Website: http://misutkaluniversity.nic.in/
PUBLICATION DETAILS

CONTENTS
Sl. Title of the Article Author/s Page
1. Consumer Culture Affects Product Design: Manas Ranjan Sahoo and Upali Aparajita 1-12 A Discussion
2. Anthropology of Disaster Mitigation and Prasant Kumar Sahoo 13-21 Management Upali Aparajita
3. Cultural Framework for Human Resource Dhyanadipta Panda, Upali Aparajita and 22-37 Information System Design Bijaya Krushna Mangaraj
4. ABO and Rh frequency distribution and gene Shyama Mohapatra, Arundhuti Das, 38-44 frequency among the Bhumij community of Sushree Lipsa Mohanty, Balasore district, Odisha Kanhu Charan Satapathy and Prasanna Kumar Patra
5. Maternal and childhealth among the ethnic Subhalaxmi Baral, 45-55 groups of Turunji village of Nabarangpur Kanhu Charan Satapathy district, Odisha and Prasanna Kumar Patra
6. Association study of alcohol consumption Sushree Lipsa Mohanty, Arundhuti Das, 56-59 with perceived stress among Munda and Pana Prasanna Kumar Patra communities of Jajpur district, Odisha and Kanhu Charan Satapathy
7. A Study on Age at Menopause, Menopausal Y.Puja, Kanhu Charan Satapathy 60-68 Symptoms and problems among Ethnic and Prasanna Kumar Patra groups of South Odisha
8. Assessment of Knowledge, Attitude and Basanta Kumar Bindhani 69-77 Awareness towards Sickle Cell Disease among People of Nine Villages of Koraput District: A Psychosocial Study
9. Urban Transformation Of Cities: A Case Study Krishna kumar A and Upali Aparajita 78-95 Of Bhubaneswar City
10. Growth pattern of Height and Body weight Jagatdarshi Badamali, Kanhu Charan 96-104 during Childhood and Adolescence: Satapathy and Prasanna Kumar Patra A Cross-sectional Study on three rural populations of Odisha
11. Impact Of Forest Proximity On Livelihoods Soumendra Sarangi 105-111 And Food Security Of Forest Dependent Tribal Communities
12. Prevalence of Undernutrition among three Diptiranjan Sahoo, Kanhu Charan Satapathy 112-119 Tribes of Nabarangpur, Odisha and Prasanna Kumar Patra

Editorial
The journal “Man in Society” brought out by the PG Department of Anthropology, Utkal University aims to provide a platform for young scholars pursuing research in new areas in the human science. The present volume, continuing with the importance of anthropological tradition of empirical fieldwork, includes papers highlighting the importance and relevance of ethnographic data in social science research. All the papers included in this volume were selected from a workshop on Scientific Research Paper Writing conducted by our Department and have pass through an intensive, interactive hands-on-training by resource persons specialized for this purpose as well as a peer review process.
The first paper by Sahoo and Upali is a discussion of how to design culture-specific consumer products based on analyzing a set of consumer culture theoretical paradigms related to product design in the relevant literatures and also sketches a historical review of consumption, culture and society. The next paper by Panda, et. al. highlights the intrusion of culture and its crucial role in the designing of Human Resource Information System (HRIS) in organizations. Since both organizational and societal culture influences managerial processes either directly or indirectly, culture becomes an important factor in HRIS's contribution to the efficiency and effectiveness of organizations.
The next paper by Mohapatra, et. al. deals with blood groups which is a causative factor in human evolution, and calculates ABO and Rh frequency distribution and gene frequency among a sample of 187 Bhumijas of Gopinathpur village of Nilagiri block of Balasore district. The following paper by Baral, et. al explores the factors associated with maternal and child health-care services of a sample of 50 females, both tribals and non-tribals of Turunji village of Nandahandi block of Nabarangpur district. The paper also discusses various factors such as age at menarche, age at first conception, food preferences and taboo during and after delivery, type and place of delivery, immunization and vaccinations of mother and child which are associated with the utilization of maternal and child health care services.
Mohanty, et. al paper highlights the association of alcohol consumption with perceived stress among Munda and Pano communities of Sukinda block of Jajpur district of Odisha showing that in their sample of 170 individuals, the respondents dependant on alcohol scored high on stress. Puja, et. al paper evaluates the age, menopausal symptoms and its problems among a sample of 45 post menopausal participants of 4 ethnic groups and reveals that psychosomatic symptoms are more prevalent than Vasomotor complaints as well as no significant difference of menopausal age in both caste and tribal participants.

Bindhani's paper throws light on the knowledge, attitude and awareness of Sickle-cell disease (SCD) among a sample of a selected population from 9 villages in Koraput district and measures how stigmatization affects the health related quality of life (HRQL). The following paper by Krishna Kumar and Upali discusses the urban spacio-temporal transformation of the city of Bhubaneswar in the light of the global transformation of urbal areas. As the capital of Odisha, this city has evolved from a small temple town, as an administrative city, to its selection as a smart city in 2016.
The next paper byBadamali, et. al. discusses the growth pattern of Height and Body Weight of children childhood and adolesence of the children of three rural population – Amanatya, Saora and Bhotra of Turunji village of Nandahandi block ofNabarangpur district of Odisha. The paper highlights the fact that though children upto 9 years of age exhibit consistency in terms of height and weight as compared with national averages, they lag behind during their adolescence stage. Another paper by Sahoo, et.al among the same groups and same area studies the prevalence of under nutrition in a sample of 200 adult individuals using an internationally accepted BMI guidelines to calculate the Chronic Energy Deficiency (CED) amongs two groups as well as gender differences among all three groups.
Sarangi's paper discusses the role of forest and its proximity in coping with livelihoods and food security of forest dependant tribal communities by using HFIAS, a scaling technique assessing household food security based on 3 level of proximity- High, Moderate and Low. The last paper by Sahoo and Upali discusses anthropology of disaster in the context of a worldwide increasing of vulnerability to environmental hazards. The main emphasis of the paper is on how the decision-making of societies at risk is embedded in culture and hence intervention measures should acknowledge cultural settings to reduce disaster risk and vulnerability.
I hope, the contributions in this volume will be helpful for researchers as well as practitioners of anthropology and other social sciences today.
Upali AparajitaEditor in Chief

Consumer Culture Affects Product Design: A Discussion1Manas Ranjan Sahoo
2Upali Aparajita
1 2Ph.D. Scholar , Professor , P.G. Department of Anthropology, Utkal University, Bhubaneswar-751004, Corresponding Author, E-mail: [email protected]
1. Introduction
Given the accelerated pace and increased scope of world trade, it is now more normal for goods to cross borders than ever before. As a result, the various products are now not necessarily consumed by the people from the same culture where the products are being produced; rather people from the outside cultures are consuming more. Further due to technological innovations and market split, the difference between the producer culture and consumer culture has more manifested leading researchers to study the consumers' and their behaviour. In this context, consumer behaviour can be defined as the study of individuals, groups, or organizations and the processes they use to select, secure, and dispose of products, services, experiences, or ideas to satisfy needs; and the impacts that these processes have on the consumer and society.
A review of consumer researches entailing studies on consumer behaviour are subsumed under
“Consumer Culture Theory”. Consumer culture is defined “as a social arrangement in which the relations between the lived cultural experience of everyday life and social resources, between meaningful valued ways of life and the symbolic and material resources on which they depend, is mediated through markets”. This includes a system of consumption or a set of behaviours found in all times and places, being dominated by the consumption of commercial products. It is also a system in which the transmission of existing cultural values, norms and customary ways of doing things from generation to generation “is largely understood to be carried out through the exercise of free personal choice in the private sphere of everyday life” (Arnould, 2010). Furthermore, consumer culture is also bound up with the idea of modernity, that is, a world “no longer governed by tradition but rather by flux,” and in which “social actors who are deemed to be individually free and rational” holds sway (Slater 2000,). And finally, “consumer culture denote an economy in which value has been
Abstract
Although history has witnessed that consumers are always a part of the production process, in recent years, they are more focussed particularly when consumer researchers study them globally. This paper traces how the consumer behaviour has became a very important factor in the production process of various products and how the designing of these consumer products are culture-specific. The analytical discussion is made based on a set of consumer-culture theoretical paradigms related to product design in the relevant literatures for finding out the scope for further research in this area. The analysis of consumer culture and product design papers shows that most of these were found applying survey research methods to collect both primary and secondary data and rarely ethnographic methods was employed for data collection. It is also found that the studies were based on the product as a whole while linking it with consumer culture but research to analyze the cultural linkages with different features of the single product is yet to begin. In addition to this the studies are mainly focused for the successful marketable product designs but were not sustainable designs.
Key Words: Culture, Consumer Behaviour, Product Design.
1
Man in Society ISSN 2347-1530Volume 23, 2016, pp. 1-12

divorced from the material satisfaction of wants and the sign value of goods takes precedence” (Baudrillard, 1968).The present paper focuses on three important research questions which serve as guidelines while reviewing the relevant research papers on consumer culture and product design :
· How consumption has boomed and shaped towards consumer culture in recent years and what changes are happening in society due to this mass consumerism?
· What are the main f indings and methodologies followed in the literatures?
· What more can be included for further research?
With the above introductory background, the following sections discusses the paper in detail. The second section discusses the interplay between consumption and society and gives a brief historical account of modern consumption. The societal changes because of modern consumption patterns
th stfrom the 16 century to the 21 century are also highlighted in this section. The third section notes the different theoretical paradigms relating to consumer culture and product designs. The influence of culture on different product is categorically highlighted with reference to the reviewed literatures. The paper concludes with an analysis of the major theoretical paradigms and their shortcomings which are discussed to find out the scope for further research in the area of product design with reference to consumer culture.
2. Consumption, Culture and society
Culture is the ideas and activities with which man construe and construct his world and consumption includes the process by which consumer goods and services are created, brought and used. Culture and consumption have an unprecedented relationship in the modern world (McCracken, 1988), a relationship that is so mutually intense. In recent years, the changing research trend is shows that consumption is basically a cultural phenomenon. It is shaped, driven, and constructed at every point by cultural considerations. The system of design and production that creates consumer goods is an entirely cultural enterprise. The consumer goods on which the consumers devote time, attention and income are charged with cultural meaning. They use
the meaning of consumer goods to express cultural categories and principles, cultivate ideas, create and sustain life style, construct notions of the self and create (and survive) social change. Without consumer goods, modern developed societies would lose key instruments for the reproduction, representation and manipulation of their culture. The world of design, product development, advertising, and fashion that create these goods are themselves important props of the cultural universe. The meaning of consumer goods and the meaning creation accomplished by consumer processes are important parts of the scaffolding of present realities.
Modern consumption was the cause and consequence of so many social changes that its emergence marked the great transformation of the Western world and is rivalled only by the Neolithic revolution for the throughness with which it changed society. Following the lead of Braudel and McKendrick, it has now been historically recognized that the 'great transformation' of the West included not just an 'industrial revolution' but also a 'consumer revolution'. Consumer revolution represented not just a change in tastes, preferences and buying habits, but a fundamental shift in the culture of the early world. Infact, modern consumption is a historical artefact. Thus, the consumer revolution is a piece of a larger social transformation to which a large amount of social, scientific and historical inquiry has been devoted by all social scientist who addressed themselves to 'the great transformation' of Polanyi (1957).
In the last quarter of the sixteenth century, a spectacular consumer boom occurred. The noblemen of Elizabethan England began to spend with a new enthusiasm on a new scale. In the process they dramatically transformed their world of goods and the nature of western consumption. They rebuilt their country seats according to a new and greater standard, and they began to assume the additional expense of a London residence. They changed their patterns of hospitality as well, vastly inflating its ceremonial character and costs. The second factor responsible for the consumer boom of the sixteenth century was the social competition that took place among the Elizabethan nobility. Developments in consumption have a way of creating circumstances which give rise to still further developments in
Consumer Culture Affects Product Design 2

consumption (Mc Cracken, 1988). The Elizabethan family as a unit of consumption was devoted to establishing and maintaining 'the cult of family status' which had preoccupied English families from the medieval period onwards (Thrupp, 1974). Family status rose and fell as a result of the efforts of each generation to increase the standing and honour of the lineage (Stone, 1965, James, 1974). This was a reciprocal process insofar as the success of one generation was seen reciprocate the efforts of past generation and to indebt future ones (Marston, 1973, McCracken, 1983). Family consumption was a collective matter undertaken by a corporation that spanned the generations. One generation brought goods that would represent and augment the honour of previous generations even as these goods established the foundation for the honour-seeking efforts of the next. Purchases were made by the living, but the consumption unit included the dead and the unborn.
The eighteenth century saw a consumer explosion as the world of goods expanded dramatically to include new opportunities in the frequency with which goods were bought, its influences on the consumer, the numbers of people engaged as active consumers and the tastes, preferences, social projects and cultural co-ordinates according to which consumption took place. McKendrik (1982) claims that the eighteenth century sees the “birth” of a consumer society and the beginning of the modern consumer culture. Following Simmel (1904) trickle-down concept and Veblen (1912) conspicuous consumption, McKendrik (1982) suggested that social competition was the motive force of this revolution. Furthermore, the explosive growth of markets in time and space is an innovation which included consumer choices and the participation rate. Earlier, the subordinate classes who could only watch in fascination nobility cultivating new tastes in their consumption, could now become participants in this consumption. In general terms, the implications this profusion was that consumption was taking place more often, in more places, under new influences, by new groups, in pursuit of new goods, for new social and cultural needs. Infact, consumption now became a major activity.
McKendrik's study of the eighteenth century gives sufficient evidence of the new use and sophistication
of other marketing devices such as fashion magazines and plates etc.. Further, it was also clear that the eighteenth century consumer had access to a new volume of influence and information. The consumer was the object of a more sophisticated attempt to awaken his wants and to direct his preferences. Living in an artificially stimulated climate the consumer removed his/her tastes and preferences from the hold of convention and local tradition, and put them increasingly in the hands of the emerging forces of marketplace. With the growth of fashion, an entirely new habit of mind and pattern of behaviour was cultivated by the consumers wherein aesthetic and stylistic considerations took precedence over utilitarian ones.
It appears, then, that in the eighteenth century goods began to carry a new kind of status meaning. This gave a very different implication for the status system and the organization of society and the kind of role information carried by goods in the present days probably began to emerge in this period (Solomon, 1983). Belk (1984) has suggested that growing role differentiation and anonymity in western society has encouraged the use of goods as an expression of and guide to social identity. Thus, the cultural meaning of goods was increasingly a way an anonymous society could maintain its centre. The consumers were surrounded by meaning-laden objects that could only be read by those who possessed a knowledge of the object-code. In other words, more social behaviour was becoming consumption, and more of the individual was subsumed in the role of the consumer. Besides as Mauss (1985) and subsequent anthropologists (Carrithers, Collins and Lukes, 1985) have pointed out the consumer varies from culture to culture. The consumer in the Western cultures as argued by Campbell (1983) led to a new pattern of consumption which were both cause and consequences of Romantic definition of the self. Both the Romantic instance on the uniqueness and autonomy of the self, and its insistence on the realization of the self through experience and creativity, drew from and drove the consumer revolution. Increasingly individuals were prepared to suppose that 'the self is built through consumption and that the consumption express the self'. This connection between consumption and individualism is one of the great cultural fusion of the modern world. Another cultural development is the
3
Man in Society ISSN 2347-1530Volume 23, 2016, pp. 1-12

development of new attitudes and outlook among the consumers. Consumer revolution required the inculcation of a willingness to consumers (O' Neill, 1978; Leach, 1984).
Fundamental changes were also taking place in the cultural definition of space and time. Space and time were being reconfigured to accommodate consumption and to make it a centrepiece of social and personal activities. Thompson (1967) has examined the reconfiguration of time for the purpose of a new industrial order. The reconfiguration of space was better studied by Braudel (1973) who argues that privacy was an eighteenth century innovation and the way this idea played out in the new building form and home furnishing. The consumer good also continued in its transformation from an object with 'patina' to an object that was fashionable. Fashion became the uppermost design consideration for most of the consumer goods of the eighteenth century.
With this shift in the symbolic properties of consumer goods, these goods came to assume a different gate-keeping significance by concealing the status origins of consumers and encouraged social mobility. Along with the explosive growth of consumption in space and time, there was also an explosion of choices by participating subordinate groups, new kinds of advertising, a new intensity to the control of fashion over consumer goods, an increase in obsolescence and an overall increase of sophisticated marketing techniques. The consequences of these development led to producers exploiting a social dynamics and harnessing the power of social competition and market manipulation. Increasingly amounts of time and attention devoted to the process of consumption, more information was required for its successful execution, and more of the individual's world being occupied by message carrying objects. New concepts of the person were driving, and driven by, new consumer pattern. Consumption was beginning to take place more often, in more places, under new influences, by new groups, in pursuit of new goods for new social and cultural purpose. The 'world of goods' was steadily making itself co-extensive with the world of social life.
By the nineteenth century, consumption and society were inextricably linked in a continual process of change. Some of the changes of this period are
essential for understanding the modern character of consumption and include the emergence of the department store, which contributed fundamentally to the nature and context of purchase activity as well as the nature of information and influence to which the consumer was subjected. It also saw the emergence of new 'consumer lifestyles' and their unique patterns of interaction between persons and things. New marketing techniques such as the employment of new aesthetic, cultural and sexual motifs were devised to add value to products and social meanings being loaded into goods through new and more sophisticated devices for meaning transfer. Social changes created new and more pressing communicational needs than the language of goods could claim to answer. The important change in this period was that the production of certain goods moved out of the private realm of nobel households into the public marketplace. In the 1790s, Chefs moved from aristocratic hotels to public restaurants while dressmakers and tailors who had once served nobel patrons now opened public shops. Increasingly it was public consumption rather than private consumption that directed the work of the producers of luxury goods (Williams, 1984). The style of democratic consumption attempted to draw the mass consumer away from one's preoccupation with goods by creating a manner of consumption that encouraged a simplicity of lifestyle and the dignity of the common man.
Williams (1982) suggests that the symbolic purpose of this new aesthetic was a crude one. It was simply to bring together anything that expresses distance from the ordinary. But it is also possible to say that in this period the use of goods to communicate much more coherent and purposeful messages. The language of goods was being used here very deliberately and skilfully to undertake a piece of social invention: the creation of a new order of social life. Another important development during this period was the emergence of the department store wherein the marketplace has changed. It was now devoted to the “arousal of free-floating desire instead of immediate purchase. Besides, prices were fixed and the consumer either purchased or did not the goods. Infact, this new pattern of interaction encouraged a passivity on the part of the consumer. Borrowing was made possible by the system of instalment purchase which gave consumption a
4Consumer Culture Affects Product Design

dream-like quality when the unobtainable was within the grasp of the consumer”. Miller (1981) similarly examines the contribution of the department store to changing tastes and preferences, purchase behaviour, marketplace and a changing relationship between buyer and seller.
Thus, the nineteenth century saw the creation of a permanent interaction between consumption and social change. Consumption now bred constant social change. This social change bred constant reforms in consumption. This dialectical relationship created a 'great transformation' which led to the manipulation of the cultural and symbolic properties of goods. With the growth of social disorganization and indeterminacy, due in some part of the consumer revolution itself, it was now necessary for everyone to resort to use of the expressive and culturally constitutive powers. The use of the cultural inventory and instrument was no longer a discretionary opportunity but an increasingly urgent necessity.
By the beginning of twenty-first century, consumption and the consumer behaviour became the part of full time academic research. Consumer research also successfully produced a flurry of research addressing the socio-cultural, experiential, symbolic, and ideological aspects of consumption. Finally, the concept 'Consumer Culture Theory' developed which refers to a family of theoretical perspectives that address the dynamic relationships between consumer actions, the marketplace, and cultural meanings (Arnould and Thompson, 2005). While representing a plurality of distinct theoretical approaches and research goals, CCT researchers nonetheless share a common theoretical orientation toward the study of cultural complexity that programmatically links their respective research efforts. Rather than viewing culture as a fairly homogenous system of collectively shared meanings, ways of life, and unifying values shared by a member of society (e.g., Americans share this kind of culture; Japanese share that kind of culture), CCT explores the heterogeneous distribution of meanings and the multiplicity of overlapping cultural groupings that exist within the broader socio-historic frame of globalization and market capitalism. The consumption of market-made commodities and desire-inducing marketing symbols is central to consumer culture, and yet the
perpetuation and reproduction of this system is largely dependent upon the exercise of free personal choice in the private sphere of everyday life (Holt 2002). The term “consumer culture” also conceptualizes an interconnected system of commercially produced images, texts, and objects that groups use—through the construction of overlapping and even conflicting practices, identities, and meanings—to make collective sense of their environments and to orient their members' experiences and lives (Kozinets 2001).
3. Culture-specific Designs of Consumer Products
Culture permits man to transcend sensitive experiences by manifesting its interpretation in science and symbols for converting the world appropriated used and sementized. Cultural identity is the symbolic concretion of culture and a set of science and symbols created, adopted and redesigned by each human group that permit its identification and projection towards inner and outer species. Objects are cultural products. The way a cultural identity appropriates a give object depends on collective imagery. Products influence culture through the creation of new imageries, and at the same time, respond to the identity, being an expression of culture. Culture embraces complex ways of living, value systems, traditions, beliefs and habits, including knowledge, morals, law and customs acquired by those within that society. These provide for a set of cultural objects which symbolize a shared schematic experience, and which we recognize as having cultural value. In this sense, culture is distinctive and distinguishable and is celebrated by the quality and of its sophistication, belief and level of enlightenment. It is nutrient rich and diverse in its concentration of medium. Thus culture is a creator of objects and objects are cultural identity shapers. The central theme of cultural interactionalism coined by Blumer (1969) states that human life is lived in the symbolic domain. Symbols are culturally derived social objects having shared meanings that are created and maintained in social interactions. Through language and communication symbols provides the means by which reality is constructed. Reality is primarily a social product and all that is humanly consequential-self, mind, society, culture- emerges from and is depended on symbolic interaction for its existence. Even the physical
5
Man in Society ISSN 2347-1530Volume 23, 2016, pp. 1-12

environment is relevant to human conduct as it is mainly interpreted through symbolic system. Thus Blumer proposes symbolic interaction is a communicative process involving five elements: the self, the act, social interaction, objects and joint action. These are interrelated to constitute a system that explains the idea of culture as constructed, learned, interpreted and transmitted among the group of people where meanings are given or shared in supporting social interactions.
A cultural insight has became essential for improving designs and product sales in both regional and global markets. Early links between culture and design became apparent in the domain of social anthropology where civilization was evaluated through the evolution of objects and it was traced through cultural characteristics left on those objects. Culture generates diversity revealed in all human actions including the products which people design. Design is seen both as a mirror and an agent of change. It also changes culture and at the same time is shaped it (Rose, 2004). As an example it is argued that cultural belief and social practices create and reinforce frames of meaning which determine ways of relating to a product. These cultural framings affect ways in which people use or do not use a particular product. It is culture that gives the product its meaning and provides the rituals within which artefacts are used and the values that are often reflected in their form and function (Press and Copper, 2003).
Design is embedded in the users' culture who are not just physical and biological beings but socio-cultural beings. Baxter (1999) argues that designers are not yet been able to consciously encode cultural phenomena to the same extent as physical and cognitive human factors due to inadequate research in this area. However, each culture has evolved its own answer to its problems (Hofsteed et.el., 2001). The use of society's cultural factors in design not only makes technologies more appropriate for their social context, but also makes better use of culture itself as a resource for innovation. Since design is an important medium of communication, it expresses the values of the system within which it functions. The users are not only competent members within their own cultures but are also interpreters of other cultures. The designers interpret and transform the users' needs and wants into products features that
will give them narratives as well as benefits. Popovic (2002) observes the following criteria which assists the designers to effect this transformation: (a) the interface and human interaction should support the user culture, (b) the artefact form or shape should correspond to the culture and life cycle which conforms to the appropriate aesthetics; (c) the artefact form and shape should convey humour or joy of that particular cultural set up; (d) appropriate colours should be used to evoke desirable feelings within the same cultural context; and (e) flexibility and adaptability of interaction should be related to culture. Cultural oriented products can be used for marking boundaries between groups, for creating and demarcating differences and communality between people (Fetherstone, 1995).
Globalization has ignited a new awareness within design which promotes local identity and highlights cultural values and traditions. Hence the challenge before the designer is to foster cultural diversity through localization of the products. In fact, individual users are no longer willing to settle for one-size-fits-all products with standardized design (Delaney, et.al., 2002). Rather factors like a wide range of sizes, shapes, colours, materials and features have become necessary for designing successful products. Thus designers have to balance core shared values with local empowerment to best satisfy individual wants and needs.
The importance of product design has been addressed in research, arguing that product form has a major role in product approach and avoidance behaviour in consumers (Bloch, 1995). Product design has also been understand to be part of marketing communication in which consumers can be persuaded to buy products through emotion eliciting product design (Seva, et. al., 2007). Furthermore, symbolic- aesthetic interaction in a product plays greater role towards difference in consumers responses. The role played by a product's physical elements such as geometry, dimensions, textures and other aspects of a product, influence what symbolic meaning a consumer infers from its design (Crilly, et. al., 2004).
The visual appearance of products is a critical determinant of consumer response and product success (Bloch, 1995). Judgements are often made on the elegance (Coates, 2003), functionality (Mono, 1997) and social significance (Dittmar,
6Consumer Culture Affects Product Design

1992) of products based largely on visual information. These judgements relate to the perceived attributes of products rather than their needs (Lewalski, 1988)).Users requirements of designed products have frequently been compared to Maslow's (1987) hierarchy of needs. This suggests that once issues of utility, safety and comfort have been satisfied, emphasis may shift towards the decorative, emotional and symbolic attributes of design. Thus depending on motivation and context, a product's perceived attributed may be of greater importance than its tangible properties. This is because appearances are important, and consumers do not just buy a product, they buy value in the form of entertainment, experience and identity.
Although visual information frequently dominated both culture and environment, it is accepted that the full range of human senses influence response to design. It is important that a product's appearance is congruent with other sensory aspects of design, as the product form that the eye sees creates in the observer expectation of what the other senses will perceive. Cognitive response refers to the judgements that the user or consumer makes about the product based on the information perceived by the senses. These judgements include evaluation of the products' perceived qualities. However, the three factors , aes thet ic impress ion, semant ic interpretation and symbolic association are important to describe cognitive response to product appearance (Lewalski, 1988; Crozier, 1994; Baxter,1995; Cupchik, 1999). Aesthetic impression may be defined as the sensation that results from the perception of attractiveness in products. Semantic interpretation may be defined as what a product is seen to say about its function, mode-of-use and qualities. Symbolic association may be defined as the perception of what a product says about its owner or user: the personal and social significance attached to the design (Lewalski, 1988; Crozier, 1994; Baxter,1995; Cupchik, 1999; Norman, 2004).
In addition to their apparent decorative and practical qualities almost all products are seen to hold some socially determined symbolic meaning (Levy, 1959; Mayall, 1979; Doyle, 1999). As such, products may evoke thoughts, feelings and associations which links to the commodity, or assumes that others must be associated with it (Haug, 1986). This culturally agreed meaning of objects allow persons to
communicate their identity through products, it allows them to project a desirable image to others, to express social status and to make visible their personal characteristics. Thus products contribute to the expressive equipment with which people present themselves (Goffman, 1990). The semantic interpretation relates to what the product is seen to indicate about itself, whereas symbolic association is determined by what the product is seen to symbolise about its user, or the socio-cultural context of use. As such, the social value assigned to products determines the symbolic associations that are made.
Products are used by people to communicate their identity not only to others but also to themselves (Dittmar, 1992). The objects consumed both reflect and contribute who are the consumers. The possessions may impose their identities and as such consumers regard possessions as parts of themselves. In addition to this distinction between an inward and outward expression of identity, Dittmar divides the symbolic qualities associated with products into self expressive and categorical meaning. The self expressive symbolism associated with products allows the expression of unique aspects of one's personality. This includes individual qualities, values and attributes (Dittmar, 1992). These self expressive meanings serve to differentiate the consumer from those that surround them. As such products are used to reflect the owner's distinction from others. They represent a means of defining one's self as unique and may symbolise the person's unique identity (Snyder, 1980). The categorical symbolism associated with products allows the expression of group membership, including social position and status (Dittmar, 1992). These categorical meanings serve to integrate the consumer with those that surround them (Csikszentmihalyi and Rochberg-Halton, 1981).
Indeed, one of the principal approaches to expressing membership of a social group is through shared consumption symbols (Belk, 1988).The symbolic meanings attached to products are culturally defined (Dittmar, 1992). Therefore, the extent to which a product is seen to reflect or support identity will be determined by the cultural context within which the product is consumed. The meaning attached to products are often determined by factors
7
Man in Society ISSN 2347-1530Volume 23, 2016, pp. 1-12

external to the product's appearance (Haug, 1986). Historical precedents, social conventions and marketing programmes all influence the perceived symbolism of products (Forty, 1986). However, it is the designer's job to decode the common values and opinions that exist in the culture, and reproduce them into forms that embody the appropriate symbolic meaning (Opperud, 2002). Thus, the meaning of designs should be considered from the beginning of the design process. Here, image boards may be of use in capturing and communicating the lifestyle, moods, and themes that are of interest (Baxter, 1995; Julier, 2000). The materials used in products are one aspect of visual form that may be associated with specific qualities (Ashby and Johnson, 2002).
Lazarus (1991) described that people evaluate a situation on goal relevance, goal congruence and on ego involvement. When evaluating a product, the situation is an object. This means that people evaluate the product, the object, on being significant for achieving goals they find important. Norman (2004) defines this as the reflective level of design which means that the product is evaluated in terms of goals and values. When being confronted with the appearance of a product only the evaluation must be performed with use of the design, including colour, form, material, etc. In this evaluation, an important information source is also the symbolic meaning. Besides, communicating brand identities, a product can also communicate characteristics of the product itself. Janlert and Stolterman (1997) argue that people have the tendency to think and talk about objects as having a character. People do not only use personality characteristics to describe and discriminate between people, but also use these characteristics for describing and discriminating product. Govers (2004) introduces the concept of product personality characteristics that people use to describe a specific product variant and to discriminate it from others. He shows that products that differentiate in product appearance (colour, form, proportion, material, etc.) differentiate in containing personality characteristics and assimilate this in the design.
Janlert and Stolterman (1997) address that within the field of product semantics, different approaches built on the assumption that certain shapes, patterns and symbols create certain emotions and
associations in the beholder. This product experience is influenced by conventions that people hold which are learned by interacting with others and the environment within a specific culture. Certain signs can create different associations in different cultures. Van Rompay, et, al. (2005) argue that product expressions are involved with image reactions with the environment. An example is the containment schama, which refers to the ways containers that are designs with high degrees of closure will evoke feelings of security and constriction. However, the degree of congruence between the symbolic meaning of product design and commitments possesses by consumer can be seen as an indicator for predicting product emotions.
4. Conclusion and scope for Further Research
It is now clear that the consumerism was started mainly from the sixteenth century western centuries, particularly among the Royalty and nobel families who spent more and more conspicuously for their own immediate purposes. Gradually it became a source of competition and a showcase of power and prestige. During the eighteenth century it became more wide-spread covering all over the world and became a part of social life. The participation rate was high as consumption became a mass activity. The number of consumer goods steadily rose and the transforming power of fashion now touched more product categories. Fashion also destroyed the 'Patina system' which served as a status gatekeeper. By nineteenth century, consumer revolution has installed itself as a permanent social fact and became a structural reality. It found an institutional locus, the department store which changed the nature of aesthetics by which goods were marketed. It created meanings that goods carried and became agents of diffusion of the new roles of the consumers. Thus, by the twentieth century, consumerism became a mirror and agent of social identity and consequently, in twenty fast century it became a full-fledged academic disciple as well as an emerging area of research.
Over the years, the thematic review of consumer research has dealt with the socio-cultural, experiential, symbolic and ideological aspects of consumption. The focus of these conceptual orientations and theoretical agendas are categorized in the Table-1, which are derived out of the different paradigms defined in previous section.
8Consumer Culture Affects Product Design

Table 1 reflects that there is no such historical account of any particular product with its societal utilization and the changes made through time and space. The consumer culture is studied for every product in same manner and there is no difference in perspective to study consumer behaviour according to various product categories e.g. societal product, luxury product, festive product, etc. Infact, the various product categories are important because different products have different cultural implications. Furthermore, most of the consumer culture studies are based on the marketing perspective whereas there are very less studies from the product designing perspective particularly for
sustainable product designing. In addition, cultures are usually studied at the national level and hence products have been designed devoid of local influences. Hofstede's (2001) cultural dimensions were used dominantly which is generally organizational research used in.
The current research about culture-oriented product design is still underdeveloped. While studying the consumer culture from the design perspective, producer or the producer culture is also a major stakeholder for design process. This producer part is totally lacking in consumer studies. Literature does not suggest or present holistic solutions for a culture-oriented product design process. Similarly the
Table I: Theoretical paradigms relating to Consumer culture and product design
Theoretical
Paradigms
Evaluated
Product
as a whole
Evaluated
Product with
its different
features
Historical account of the product
Tested with different product categories
Culture is observed on local level
Included producer culture
Cultural identity
Yes
No
No
No
No
No
Product
Symbolism
Yes
No
No
Yes
Yes
No
Design as a mirror
and agent of
change
Yes
No
No
No
No
No
Physical and
cognitive human
factors
Yes
No
No
Yes
No
No
Technology
appropriates with
social context
Yes
No
No
No
No
Yes
Users’ needs and
wants
Yes No No Yes No No
Product semantics:
Form, shape and
colour
Yes
Yes
No
Yes
No
No
Cultural values
and traditions
Yes
No
No
No
No
No
Localization of the
product
Yes
No
No
No
Yes
No
Product
personality
Yes
No
No
No
No
No
Product use and
environment
Yes
Yes
No
No
No
No
Reflective level of design
Yes No No Yes No No
9
Man in Society ISSN 2347-1530Volume 23, 2016, pp. 1-12

research methods used for consumer studies are mainly consumers on large scales and their group behaviours on a macro-level. Research methods are not developed for a through understanding of users from different cultures. Recently the consumption time and space are also changing due to modern market pattern and online consumption. So consumer ethnography may be a solution to study consumer culture and the product design. This can also provide new opportunities for companies, small and medium enterprises and local producers of developed as well as developing countries and consequently there will be value addition and motivation for academic network for further research as well. The future studies on consumer culture can focus on design process and models both for successful and sustainable product design as the final results rather than only general marketing suggestions. These results may need more examples and empirical research both in local and global industries.
References
Arnould, E. J. and C. J. Thompson., 2005. Consumer Culture Theory (CCT): Twenty years of Research. The Journal of Consumer Research, 31(4): 886-882.
Arnould, E. J. 2010. Global Consumer Culture. In: J. Sheth and N. Maholtra (Eds.): Encyclopedia of International Marketing (Vol.6). Chichester: UK, 1-16.
Ashby, M. and K. Johnson., 2002. Materials and Design. Oxford, UK: Butterworth Heinemann.
Baudrillard, J. 1968. Le systeme des objets. Paris: Gallimard.
Baxter, M. 1995. Product Design: A practical guide to systematic methods of new product development. London, UK: Chapman & Hall.
Baxter, M. 1999. Deep Design, Duncan of Jordanston University, Glasgow, UK.
Bayley, S. 2000. General Knowledge London, UK: Booth-Clibborn Editions.
Belk, R. W. 1984. Manifesto for a Consumer Behavior of Consumer Behavior. In: Paul F. Anderson and Michael J. Ryan (Eds.): AMA Winter Educators' Conference: Scientific Method in Marketing. Chicago: American Marketing Association, 163-167.
Belk, R. W. 1988. Possessions and the extended self. Journal of Consumer Research, 15(2): 139-167.
Bloch, P.H. 1995. Seeking the Ideal Form: Product Design and Consumer Response. Journal of Marketing, 59(3): 16-29.
Blumer, H. 1969. Fashion: From Class Differentiation to Collective Selection. Sociological Quarterly, 10(3), 275-291.
Blumer, H. 1971. Social Problems as Collective Behaviour. Social Problems, 18, 298-306.
Bourdieu, P. 1984. Distinction: A Social Critique of the Judgement of Taste. London, UK: English Translation, Routledge & Kegan Paul.
Braudel, F. 1973. Capitalism and Material Life 1400-1800. London: Weidenfeld and Nicolson.
Campbell, C. 1983. Romanticism and The Consumer Ethic: Intimation of a Weber-style Thesis. Sociological Analysis, 44(4): 279-295.
Carrithers, M., S. Collins, and S. Lukes, eds. 1985. The Category of the Person. Cambridge: Cambridge University Press.
Coates, D. 2003. Watches Tell More than Time: Product Design, Information and the Quest for Elegance. London, UK: McGraw-Hill.
Creusen, M.E.H. & Schoormans, J.P.L. 2005. The Different Roles of Product Appearance in Consumer Choice. The Journal of Product Innovation Management, 22: 63-81.
Crilly, N., Moultrie, J. and Clarkson, P.J. 2004. Seeing Things: Consumer Responses to the Visual Domain in Product Design. Design Studies, 25(6): 247-577.
Crozier, W. R. 1994. Manufactured Pleasures: Psychological response to design. Manchester, UK: Manchester University Press.
Csikszentmihalyi, M. and Rochberg-Halton, E. 1981. The Meaning of Things: Domestic Symbols and the Self. Cambridge, UK: Cambridge University Press.
Cupchik, G. C. 1999. Emotion and Industrial Design: Reconciling Meanings and Feelings. First International Conference on Design & Emotion. The Netherlands: Delft: 75-82.
10Consumer Culture Affects Product Design

Dittmar, H. 1992. The social psychology of material possessions: to have is to be. New York, NY: St Martin's Press.
Dormer, P. 1990. The Meanings of Modern Design: Towards the Twenty First Century. London, UK: Thames & Hudson.
Doyle, K. O. 1999. The social meanings of money and property: in search of a talisman. London, UK: Sage.
F e a t h e r s t o n e 1 9 9 5 . U n d o i n g C u l t u re : Globalization, Postmodernism and Identity, SAGE Publications, London, UK.
Forty, A. 1986. Objects of Desire - Design and Society 1750-1980. London, UK: Thames & Hudson.
Geertz, C. 1973. The Interpretation of Cultures. New York: Basic Books, Inc.
Goffman, E. 1990. The Presentation of Self in Everyday Life. London, UK: Penguin.
Govers, P. 2004. Product personality. Dissertation: Delft University of Technology.
Haug, W. F. 1986. Critique of Commodity Aesthetics. Cambridge, UK: Polity Press.
Hofstede, G. 2001. Culture's Consequences. Sage Publications.
Holbrook, M.B. & Hirschman, E.C. 1982. The Experiential Aspects of Consumption: Consumer Fantasies, Feelings, and Fun. The Journal of Consumer Research, 9(2): 132-140.
Holt, D. B., 2002. “Why Do Brands Cause Trouble? A Dialectical Theory of Consumer Culture and Branding,” Journal of Consumer Research, 29 (June), 70–90.
James, M. E. 1974. Family, Lineage and Civil Society. Oxford: Clarendon Press.
Julier, G. 2000. The Culture of Design. London, UK: Sage Publications.
Kozinets, Robert V. 2001. “Utopian Enterprise: Articulating the Meaning of Star Trek's Culture of Consumption,” Journal of Consumer Research, 28 (June), 67–89.
Lazarus, R. S. 1991. Emotion and adaptation. New York: Oxford University Press.
Levy, S. J. 1959. Symbols for Sale. Harvard Business Review, 37(4): 117-124.
Lewalski, Z. M. 1988. Product Esthetics: An Interpretation for Designers. Carson City, NV: Design & Development Engineering Press.
Marston, J. G. 1973. Gentry Honor and Royalism in Early Stuart England. The Journal of British Studies, 13: 21-43.
Maslow, A. H. 1987. Motivation and Personality (3rd Edition). New York, NY: Harper & Row.
Mauss, M. 1985. A Category of the Human Mind: the notion of the person; the notion of self. In: Michael Carrithers and Steven Collins (Eds.): The Category of the Person. Lukes, Cambridge: Cambridge University Press: 1-25.
Mayall, M. H. 1979. Principles in Design. London, UK: Design Council.
McCracken, G. 1983. History and Symbolic Anthropology: a Review and Critique of Four New Contributions to their Rapprochement, Culture, 3(2): 3-14.
McCracken, G. 1988. Culture and Consumption. Bloomington and Indianapolis: Indiana University Press.
McKendrick, Neil, J. Brewer, and J.H. Plumb., 1982. The Birth of a Consumer Society: The Commercialization of Eighteenth-Century England, Bloomington: Indiana University Press.
Monö, R. 1997. Design for Product Understanding. Stockholm, Sweden: Liber.
Norman, D. A. 2004. Emotional Design: Why we Love (or Hate) Everyday Things. New York, NY: Basic Books.
Opperud, A. 2002. Semiotic Product Analysis. D e s i g n a n d E m o t i o n C o n f e re n c e , U K : Loughborough: 137-141.
Polanyi, K. 1957. The Great Transformation: The Political and Economic Origins of Our Time. Boston: Beacon Press.
Popovic 2004. Activity and designing pleasurable interaction with everyday artifacts, pleasure with products: Beyond Usability. In: Jordan and Green (Eds.): Cultural Ergonomics, Elsevier, Amsterdam.
11
Man in Society ISSN 2347-1530Volume 23, 2016, pp. 1-12

Postrel, V. I. 2003. The Substance of Style: How the Rise of Aesthetic Value Is Remaking Commerce, Culture, and Consciousness. New York, NY: HarperCollins.
Press and Cooper 2003. The Design Experience: The role of design and designers in the twenty first century. Ashgate, Burlington, UK.
Rose 2004. The development of culture-oriented human machine system: specification, analysis and integration of relevant intercultural variables. In: Kaplan (Ed.): Cultural Ergonomics, Elsevier, Amsterdam.
Schmitt, B.H. & Simonson, A. 1997. Marketing Aesthetics: The Strategic Management of Brand, Identity, and Image. New York: The Free Press.
Schneider, D. M. 1980. American Kinship: A ndCultural Account (2 edition). Chicago and London:
Duke University Press.
Seva R.R., Duh H.B. & Helander, M.G. 2007. The Marketing Implications of Affective Product Design. Applied Ergonomics, 38(6): 723-731.
Simmel, G. 1904. Fashion, International Quarterly, 10: 130-155.
Solomon, M. R., 1983. The Role of Products as Social Stimuli: A Symbolic Interactionism Perspective, Journal of Consumer Research, 10: 319-329.
Somber, W. 1967. Laxury and Capitalism. Ann Arbor: University of Michigan Press.
Stone, L. 1965. The Crisis of the Aristocracy 1858-1641, London: Oxford University Press.
Tadvalkar, N. 2012. Motifs and their Symbolism: Floor Art and other Arts. www.britannica.com.
Thrupp, S. L. 1948. The Merchant Class of Mediwval London, Ann Arbor, MI: University of Michigan Press.
Van Rompay, T. J. L., Hekkert, P., Saakes, D., & Russo, B. 2005. Grounding abstract object characteristics in embodied interactions. Acta Psychologica, 119(3): 315-351.
Varadarajan, L. (), Arboreal Motifs in Kalamkari. In Decorative Arts of India, M. L. Nigam (ed.), Hyderabad: Salar Jung Museum.
Veblen, T. 1912. The Theory of the Leisure Class. New York: Macmillan.
Veryzer, R.W. 1995. The place of product design and aesthetics in consumer research. Advances in Consumer Research, 22: 641-645.
Williams, R. H. 1982. Dream Worlds: Mass Consumption in Late Nineteenth Century France. Berkeley: University of California Press.
12Consumer Culture Affects Product Design

Anthropology of Disaster Mitigation and Management
1Prasant Kumar Sahoo 2Upali Aparajita
1Asst. Professor in Anthropology, Govt. Model Degree College, Malkangiri, Email: [email protected] , P.G. Deptt of Anthropology, Utkal University, Bhubaneswar
Corresponding Author E-mail: [email protected]
Abstract
At a time of increasing global warming and climate change, increasing worldwide vulnerability to hazards, like floods, cyclones, droughts, earthquakes and so on, the study of disasters has become an important focus for anthropological research to address the multi-dimensionality of the effects to a community's social structures and its relation to the environment. This has resulted in a new field of growing importance known as anthropology of disaster, within ecological or environmental anthropology. Anthropology of disaster examines contemporary contributions and investigations, following the life-cycle of a disaster event, from pre-disaster vulnerability, and the conceptions of risks, to individual and social responses, coping strategies, and relief management. Its main emphasis is to study how the decision-making of societies at risk is embedded in culture, and how intervention measures acknowledge or neglect cultural settings. Understanding these cultural systems would help us to understand both the contributing causes to disasters as well as the collective responses to them. It concludes by providing recommendations and actions to be taken - for reducing the disaster risk and vulnerability - as well as for future research.
Key words: Anthropology, Culture, Disaster, Climate Change, Hazards, Risks, Vulnerability, Management.
13
Man in Society ISSN 2347-1530Volume 23, 2016, pp. 13-21
1. Introduction
With its holistic and comparative approach along with the unique method of ethnography, anthropology has widely called the attention in the world of academics as to how risks and disasters both influence and are products of human systems, rather than representing simply isolated, spontaneous, or unpredictable events. There is an especial concern with how cultural systems (the beliefs, behaviors, and institutions characteristic of a particular society or group) figure at the center of society's disaster vulnerability, preparedness, mobilization, and prevention. As a result of the better acquaintance with these local communities the causes of the disasters will be acnowldged. In other words, anthropology of disaster studies how the decision-making of societies at risk is embedded in culture, and how intervention measures acknowledge, or neglect, cultural settings. The
social construction of risk is being given increasing priority to understand how people experience and prioritize managing hazards in their own lives and how vulnerability can be reduced, and resilience increased, at a local level.
2. Evolution of The Anthropology of Disaster
Anthropologists have studied disasters since their post-war emeregence as research field, but only quite recently have disasters actually become a focus for anthropological research. After World War II, research on human behavior during bombardment evolved into the social scientific study of natural and technological disasters and anthropologists were the earlier contributors. Only one anthropologist Anthony F. C. Wallace actually carried out research in which the primary focus was the human structuring of the disaster experience (Oliver-Smith and Hoffman, 2002). With a reemergence of interest in socio-cultural change,

multi-lineal evolution and cultural ecology in the 1960's, and the interest in the political ecology and discourse analysis in the 1980's, the issue of disaster has become increasingly salient to the concerns of anthropologists. They are learning that they have an important contribution to make to the study of disasters and that disasters, in turn, have great expository relevance to the inquiries of their field. The alarming increase in disasters and their aftermaths have clearly demonstrated how much light catastrophes can shed on the content of an anthropological purview (Oliver-Smith and Hoffman, 2002).
Oliver-Smith (1996) in his paper “Anthropological Research on Hazards and Disasters” holds that there has been a general failure to consider the interaction of the social, technological and natural processes that produce hazards and disasters in accounts of human environmental adaptations. The paper ends with a discussion of potentials in hazard and disaster research for theory building in anthropology, particularly in issues of human-environment relations and socio-cultural change.
In their edited text “The Angry Earth: Disasters in Anthropological Perspective” (1999), Oliver-Smith and Hoffman highlight the problem of disaster research in anthropology including the very definition of what constitutes a disaster. From an anthropological perspective, they categorically hold that “disasters occur in societies and not in nature”, stating clearly the intimate linkage between the causal factors of disasters and the societal-environmental relations. Taking a political ecological approach, Oliver-Smith and Hoffman view that the conjunction of a human population and a potentially destructive agent does not inevitably produce a disaster; rather the society's vulnerability – its adaptive failure – is an essential element of a disaster. Consequently, a disaster is made inevitable by a historically produced pattern of vulnerability, evidenced in the location, infrastructure, socio-political structure, production patterns, and ideology that characterizes a society.
Another edited volume by the same authors named “Catastrophe and Culture: The Anthropology of Disaster” (2002) is the most pioneering work till date in the field of disaster anthropology. In the very first line of the introduction, they state that 'disasters are not bolts from the blue' 'but take place through
the conjucture of two factors: a human population and a potentially destructive agent that is a part of the total ecological system, including all natural, modified and constructed features'. Thus the crux of their argument is that it's through the“conditioned” conjucture of a community and hazard that a disaster takes place.
The paper “Impact of Culture towards Disaster Risk Reduction” (Kalatunga, 2006) highlights that in some situations culture is a factor for the survival of the communities from disasters, whereas in other situations, culture act as a barrier for effective Disaster Risk Reduction (DRR) activities. Kalatunga suggests that community-based disaster risk reduction activities as a mechanism to integrate disaster with culture for effectively managing disaster risks and holds that anthropologists can greatly contribute in such an endeavour. Scott's (2007), concept paper “Importance of Cultural Competency in Disaster Management” holds that 'disaster professionals do not have to be students of sociology or anthropology in order to understand and appreciate cultural differences and better relate to the varied neighborhoods within which they work'. He is of the opinion that since culture itself is the 'common sense or the shared understanding', the natives react to any particular natural hazards on the basis of this and that outside experts or professionals should become familiar with common sense disaster coping indigenous knowledge system of the communities.
“Introduction to Disaster Risk Reduction” by USAID (2011) is a comprehensive document on the DRR perspective because it defines all the relevant conceptual clarifications like disaster, risk, coping ability, resilience, vulnerability, disaster risk reduction and disaster risk management and so on. It throws light on the close interaction between hazard, vulnerability, and risk. Moreover the paper has a module on the development aspect of disaster. The most significant aspect of this document is that of disaster governance which is based on the Hyago Framework (2005-2015) which states that each country has the sovereign responsibility to p otect its rpeople infrastructure as well as and social , economicassets from disaste s. Therefore it is essential to rbuild the “Resilience of Nations and Communities to disasters”.
Jha and Jha (2011) studied how the traditional
Anthropology of Disaster Mitigation 14

knowledge of the Lepcha community of Sikkim helped them to resist the ill effects of disasters. Md. Anwar Hossain (2013) brings about the importance of the concept of community based disaster management (CBDM) in disaster risk reduction in Bangladesh. He also points out the role of social work and the contribution of anthropologists to help mitigate the disaster risks which can be a great learning point for the National Disaster Management Authority.
Jogia et al (2014) discuss the psychological impacts of disasters and disaster mental health as natural disasters have caused extensive loss and damage to the human psychological wellbeing, economy, and society. However, the issue of culture in disaster mental health seems to have received limited attention in policy and practice. In particular, this paper suggests the importance of cultural competence in the planning and delivery of effective disaster mental health services which requires s igni f icant changes in pol icy making , administration, and direct service provision.
Ekstrom and Kverndokk (2015) warns about increasing climate-related hazards, and the unevenly distribution of suffering caused by such disasters between different regions and groups of people. They emphasize that contemporary disasters fundamentally challenge the understanding of global and cross-temporal relations as well as long-established distinctions between natural and technological disasters, human and non-human agency, culture and nature. This is why social norms and cultural metaphors make a crucial difference to the capacity of societies to cope with and come to terms with disruptive events.
The edited book “Disaster Risk Research and Assessment to Promote Risk Reduction and Management” (Ismail-Zadeh and Cutter, 2015) holds that natural hazards are becoming direct threats to national security (because their impacts are amplified by rapid growth) and unsustainable development practices, both of which increase vulnerabilities of communities. Hence, reducing disaster risk becomes a foundation for sustainable development. According to them, science-driven approaches to disaster risk reduction and disaster risk management (DRM) can help communities and governments to become more resilient thereby
reducing the human and economic impacts of disasters.
Another edited text, “Culture and Disasters: Understanding Cultural Framings in Disaster Risk Reduction” (Kruger et al, 2015) adopts an interdisciplinary approach to explore the cultural dimension of disaster and throws light on how the decision-making of societies at risk is embedded in culture. Faas (2016) in his paper “Disaster Vulnerability in Anthropological Perspective” rightly highlights the concept of vulnerability as an indicator of the unequal distributions of certain poulations in proximity to environmental and technological hazards as well as individual or group ability to anticipate, cope with, resist and recover from disaster. This concept has influenced disater research as a means to answer as to why a particular population is at more risk than others.
Anthropology of disaster is unique in that it incorporates both the qualitative and quantitative methods of collecting, analyzing and presentation of the data. In addition to the basic anthropological methods, three specific methods are discussed here which can be effectively employed in disaster research. For the firsthand collection of data regarding indigenous knowledge on disasters, perception of people and their response including community based management etc, the ethno-climatology method is employed. Similarly to compare the hazards and their occurring at a cross-cultural level, hazard ranking method is used to highlight the severity of any particular hazard as per its frequency and how the natives perceive about the disaster as per their impacts. On the same line, various disaster risk indices have been formulated by several international agencies and institutions to quantify the level of vulnerability of particular regions.
1) Ethno - climatology:
It is people's specialized knowledge about weather and climate like folklore which have developed over thousands of years of inhabiting and observing one's natural environment. Thus the particular field of research on people's local, indigenous or traditional knowledge about the natural world is called as “ethno-climatology” (Lazrus, 2010). This knowledge is local, situational and embedded in a cultural context (Berkes, 1999). An interesting
Man in Society ISSN 2347-1530Volume 23, 2016, pp. 13-21 15

example of ethno-meteorology comes from an interdisciplinary team of anthropologists and meteorologists who learned that the traditional technique used by Peruvian potato farmers in the Andes to forecast rainfall and crop yield relied on the influence of El-Nino on the visibility on the Pleiades during the festival of San Juan in late June (Orlove et al, 2002). So ethno-climatology would bring forth the point of how to apply the local knowledge of environmental phenomena, especially the aspects of weather forecasting and planning of agricultural activities etc.
2) Hazard Ranking:
It is possible to rank hazards on a simple graph that plots magnitude of impact on an individual or
community against the probability and frequency of a specific hazard occurring. Risk is high where an event has a high magnitude of impact and a high probability of occurring in a short time span. The following graph can be used not only to judge the risk associated with impacts derived from a specific hazard, but can also be used to make judgments on the degree of attention that should be given to developing strategies to cope with different hazards. For example, if a second hazard of earthquakes had been identified for this region in addition to a major hazard, say flooding, then by comparing the different frequencies and magnitude of impact with flooding with those for the earthquake, we could identify what the priorities of the program should be relative to these hazards.
1) Disaster Risk Index:
Several disaster risk indices have been formulated by several international agencies and institutions to quantify the level of vulnerability of particular regions and thus the status of adaptability and resilience in case any disaster strikes. For instance, India has been ranked 77th on the World Risk Index, topped by Island state of Vanuatu. The Index, calculated by University of Stuttgart, ranks 171 countries according to their risk of becoming a victim of a disaster. It takes into account three factors for calculating the index:
· Risk: Inadequate infrastructure and weak logistic chains substantially increase the risk that
Impact
Risk increases
High
Medium
Low
100 years 50 years 20 years 10 years 5 years 4 years 3 years 2 years 1 years
Frequency
an extreme natural event will become a disaster.
· Response: Challenges mostly lie in the 'last mile' of the logistics chain: organizing transportation despite destroyed streets or bridges and ensuring fair distribution when there is a shortage of (for example) water, food, and shelter.
· Relief: Crumbling transport routes, unreliable electricity grids, and dilapidated buildings not only hinder humanitarian aid from overseas, but also delay crucial aid.
1. Anthropological Perspectives in Disaster Research
The Anthropological perspectives in Disaster
Anthropology of Disaster Mitigation 16

Research are circumscribed under the holistic approach which examines the complex interrelationships between humans, their cultures, and environment, ranging from the human actions that may influence the severity of disaster to the range of socio-cultural adaptations and responses. The comparative and relativistic thrust of the discipline has often given disaster research a critical stance, privileging local knowledge and local ways of management. Similarly, the ethno-scientific approach emphasizes the cognitive aspects of the natives when dealing disaster management. The humanistic tradition in anthropology help the anthropologists to experience the disaster themselves understanding their problems and provide a helping hand to the disaster affected communities. Applied anthropologists also advise and suggest to the concerned authorities to take endogenous policies to better cope the aftermath of disasters as well as to initiate preventive measures for mitigating future impacts. The following are some of the definitions of conceptual terms associated with disaster research:
Hazard vs. Disaster
Hazards “are the forces, conditions, or technologies that carry a potential for social, infrastructural, or environmental damage” (Oliver-Smith and Hoffman, 2002). On the other hand, a disaster is “a process/event combining a potentially destructive agent/force from the natural, modified, or built environment in a socially and economically produced condition of vulnerability, resulting in a perceived disruptions of the customary relative satisfaction of individual and social needs for physical survival, social order, and meaning” (Oliver-Smith and Hoffman, 2002). In other words, when a natural catastrophe or hazard is mixed-up or has some bearings with humans, it becomes a disaster. Therefore, the very definition of disaster and its various dimensions become important area of anthropological research because whenever and wherever the human interface are involved; anthropological perspectives are necessitated and incorporated.
Perceiving Vulnerability
Anthropology has sought ways to call attention to and alleviate structural conditions like gender inequality, global inequities, endemic poverty,
racism, a history of colonial exploitation, imbalances of trade, and underdevelopment of pre-disaster vulnerability that predispose some communities to experience disaster or that increase the severity of disaster impact. While talking about the perception of people, anthropologists stress on ethno-science that is the people's local knowledge and world view of what they perceive about certain natural events causing hardships to them.
Risk
Risk is a function of hazard and vulnerability. This means that while the phenomenon of hazard is experienced by all, the impact may be different for different communities based upon their adaptation to the natural and social environment. It is in accordance with this fact that the extent of vulnerability is estimated both qualitatively and quantitatively. As a consequence, societies which are more vulnerable are at greater risk and societies with less adaptive mechanism are more exposed to the vagaries of nature. Therefore managing risk is a matter of reducing the frequency of an event happening or reducing vulnerability to its impact.
Coping capacity vs. Resilience
Coping capacity refers to “the ability of people, organizations and systems, using available skills and resources, to face and manage adverse conditions such as hazards, emergencies or disasters” (UNISDR, 2009). Therefore the focus here should not only be the individual or community but also the capacity of the supporting mechanisms at large. For example, an impoverished community might not be the focus of development, but inherent in their internal social and economic structures these communities might possess significant coping capacity and resilience. Coping capacity is therefore just as much about what a community internally possesses, as the external structures on which they depend.
On the other hand, resilience is “the ability of a system, community or society exposed to hazards to resist, absorb, accommodate to and recover from the effects of a hazard in a timely and efficient manner, including through the preservation and restoration of its essential basic structures and functions” (UNISDR, 2009). This definition however considers the presence of a hazard and not a disaster. Thus once a disaster actually strikes, it would be
Man in Society ISSN 2347-1530Volume 23, 2016, pp. 13-21 17

incorrect to refer to the concept of resilience; rather the concept of coping capacity is more apt. Resilience therefore means the ability to “spring back from” a shock. Returning to an original state corresponds to returning back again to those vulnerable places without improving the conditions or rebuilding residential colonies without strong disaster-resilient coeds. Resilience, therefore, implicitly requires improvement ground. It is for this reason that people should be resilient enough to withstand the vagaries of nature with all possible means including the own cultural set up and the outside support.
Disaster risk reduction vs. disaster risk management
Disaster risk reduction (simply disaster reduction) is defined as the concept and practice of reducing disaster risks through systematic efforts to analyze and manage the causal factors of disasters, including through reduced exposure to hazards, lessened vulnerability of people and property, wise management of land and the environment, and improved preparedness for adverse effects (UNISDR, 2009). The assessment of the vulnerability of critical facilities, social and economic infrastructure, the use of effective early warning systems, and the application of many different types of scientific, technical, and other skilled abilities are essential features of disaster risk reduction. Disaster risk management, on other hand, is the systematic process of using administrative directives, organizations, and operational skills and capacities to implement strategies, polices and improved coping capacities in order to lessen the adverse impacts of hazards and their possibility of disaster. Disaster risk reduction activities are more focused on a strategic level of management, whereas disaster risk management is the tactical and operational implementation of disaster risk reduction.
4. Culture and Disaster : A symbiotic relationship
Cultural influences hold that some people within the social system are more vulnerable to disasters than others. Ethnic minorities, disempowered castes or classes, religious groups, or occupations may live or work in physical areas that are relatively disaster-prone. Some conceptual statements in this regard are highlighted in the following points:
Ÿ Culture plays a vital role in our perception, understanding, and activities undertaken to mitigate, manage and face the disaster. In the very idea of culture is embedded the notion of a social group. In other words, culture is a product of the society and the members share its culture. Because culture is shared that people realize that they are not the only ones but there are many others who have experienced the impact of disaster. Confrontation with disaster is, thus, a shared experience and accordingly people have always organized themselves to provide immediate rescue, relief, and support.
Ÿ One of the greatest consequences of disasters is that it acts as a cohesive force. Perhaps suddenness and acuteness of disasters breaks the social fabric of race, religion, caste, and class and forces people to live and survive as a cohesive unit. Strangely people revert back to their selfish mode once the imminent danger is gone.
Ÿ The role of hazards and disasters in mobilizing forces of cultural change is vastly understudied. Much of the sociological research considered that disasters rarely played a significant role in the evolution of society. But anthropologist with archaeological and historical perspectives has increasingly made evident that how causal disasters have been bringing about cultural transformation. There is much to be learned about cultural and societal modifications from the calamities that a people endure. Not only do societies undertake immediate adaptations after impact, but these can also set in motion forces with long-term implications for the evolution of each society.
Ÿ Disasters permit considerable trial and error in societal adaptation to the environment. While many hazards display their presence quite constantly, others despite their systematic environmental quality may not occur with great frequency, allowing the possibility of maladaptive responses over time. If these maladaptive responses become institutionalized they may lead to an increase in societal vulnerabilities that in due course may bring calamity and social collapse.
Ÿ These cultural adaptations include innovation
Anthropology of Disaster Mitigation 18

and persistence in memory, culture history, worldview, symbolism, social structural flexibility, religion, and the cautionary nature of folklore and folk tales.
Anthropologists dealing in disaster research are unique in their wide-scale application in areas of understanding climate change, global warming, culture-specific perceptional studies of disaster, applying ethno-climatological knowledge, understanding community-based disaster management, psychological health of post disaster period of affected communities and so on.
Anthropologists working in disaster research point out that there is an unequal distribution of risk and vulnerability. While discussing “why” and “how” of the vulnerabilities people face, anthropologists first look upon the local socio-cultural and natural environment and the psychology of the people. This i s because of the fac t tha t the same climatological/meteorological phenomena may not constitute a disaster for a particular group while that may be very harmful for another group. Taking this into account, anthropologists draw vulnerability map of the world on cultural basis and can rightly reason out the causes behind this. Further, as reckoning diversities in every form is a hall mark of the discipline, culture-specific, region-specific and population-specific, micro-studies help the world of knowledge as well as the authorities concerned to recognize the myriad forms of disasters. This knowledge helps to apply the techniques of disaster management not at a universal or generalized level but rather a specific and local level. Therefore cultural differences have a significant bearing on disaster risk management.
As ethnography is mostly employed as a method of data collection, the ethno-climatological perceptions of people would go a long way in policy advocacy and rooting out the top-down approach. This it would lead the way for a community based disaster management approach where people will have the major role instead of the outsiders. It is especially significant in the context of the National Disaster Management Authority Act, 2005 which works in bureaucratic set-up instead of emphasizing upon people-led works. Intervention during pre-disaster/post-disaster period, ignoring to recognize the shared views of people would result in the failure of mitigation programs.
The study of social structure, livelihood etc in pre and post-disaster period is an important area of research by anthropologists. This paves the way for looking into the societal relations and the solidarity among people. Scholars have found that during disasters peoples forget their disputes and work as a family while post-disaster people normally play their expected societal roles including quarrelling, competing with each other and the like. Therefore, the curiosity of anthropologists is as to why and how the society maintains the solidarity and social control of its people.
Anthropologists also play the role of torch-bearers in highlighting the negative impact from culture towards disaster risk reduction activities and focus on the process of integration of adaptive mechanisms toward effective disaster risk reduction. This particularly helps the authorities to take note of the adaptive mechanisms and to frame policies according to the needs of the people. For example, proper funding can be made and unnecessary expenditure could be diverted towards other constructive activities. Besides, this will make DRR strategies and measures compatible with cultural aspects of community. To estimate the loss of life and property both qualitatively and quantitatively, some indices or mathematical formula are needed so that the risks can be assessed comprehensively and effectively for a better disaster resilient community.
5. Conclusion
Every discipline has its own limitations and issues which it always strives to offset by deriving new tools and methodology and even new perspectives. Some of these issues includes as follows: First of all, disasters have pasts, presents and futures, whether they arise from events that people consider being sudden (earthquake) or those that occur unperceived over long periods (droughts) only to be recognized well after their initial manifestations. Therefore the very definition of what constitutes a disaster is the first problem.
Second, disasters are experienced first at the local level. However not all communities experience a disaster in the same way. Each undergoes a catastrophe in the context of its own profile of vulnerability. Such variations challenge more global macro approaches. By the same token, it is necessary
Man in Society ISSN 2347-1530Volume 23, 2016, pp. 13-21 19

to understand the total phenomenon, both physically and socially. Disasters therefore compel us to pair multi-site ethnography with quantitative methods capable of accessing greater levels of aggregation.
Third, just as the spatial dimension of disasters present challenges to anthropological research, temporal dimensions can prove equally problematical. Most anthropological research is planned out considerably ahead of actual entry into the field. Proposal preparation and review is a lengthy process. Research funding organizations have programs that are designed to support rapid response or perishable data research, but they generally fund very short term and even-focused kinds of research as opposed to the more important processual aspects of disasters that enquire longer term commitments of ethnographic research.
Fourth, while much important data about disasters can be gathered by synchronic slices based on surveys, questionnaires and crash emergency overviews, the actual process by which people and communities respond to risk, threat, vulnerability, impact and recovery are best understood through on-site ethnographic research. However it's very difficult to collect empirical data at that particular time as the people are affected and unstable and will be hesitant to speak; rather they need instant support and co-operation from all quarters including the researcher.
Lastly, disaster research has not yet assessed the effectiveness of disaster risk reduction. Here “effectiveness” means how far has the discipline, established itself to study disasters and its reduction as well as management in quantitative terms and how anthropologists dealing in disaster research are successful far are we satisfied in mobilizing community resources and people to reducing the impact of disasters. In this direction, the Sendai Framework (2015-2030), adopted recently by the international community, is the right step which aims to reduce the ill-effects of disasters in quantitative terms through its seven goals.
To conclude, anthropology of disaster incorporates the totality of human perception, response, adaptation and mitigation to disasters. As a sub-discipline of anthropology, it has strong bearing upon anthropological orientations and perspectives like holism, relativism. Similarly, as people's view
point is majorly emphasized, ethno-scientific approaches like ethno-climatology, ethno-meteorology is employed. Accordingly anthropologists always prioritize on community based management of disasters. Not only their adaptive mechanisms are highlighted but also the maladaptive features in that cultural context are pointed out so that appropriate actions could be initiated to reduce those cultural practices. In matters of application towards DRR, anthropology of disaster proves at ground the compatibility or incompatibility of various disasters-related policies and laws with the local cultures for better resilience strategies.
However certain areas are to be urgently looked upon in disaster research. At present there is a lack of comprehensive assessment of disaster risk. Besides formulating some indices for estimating vulnerability across geographical regions; making a culturally-based vulnerability map of the world; new perspectives on the political economy of disaster research and climate change; establishing a strong link between climate change, disaster management and sustainable development. To sum up, what is required is perspectives on integrated disaster research – the engagement of multiple disciplines and researchers, scales (local to global), methodological approaches, and stakeholders in the co-production of problem-focused, policy relevant research related to disaster risk (Ismail-Zadeh and Cutter, 2015).
References
Berkes, F. 1999. Sacred Ecology: Traditional ecological knowledge and resource management. Philadelphia: Taylor & Francis.
Ekström, A. and K. Kverndokk. 2015. Introduction: Cultures of Disaster. Culture Unbound, 7: 356-362.
Faas, A. J. 2016. Disaster Vulnerability in Anthropological Perspect ive. Annals of Anthropological Practice, 40 (1): 14-27.
Ismail-Zadeh, A. and S. Cutter. 2015. Disaster Risk Research and Assessment to Promote Risk Reduction and Management. ICSU ISSC adhoc group on disaster risk assessment.
Jha, V. and A. Jha. 2011. Traditional Knowledge on Disaster Management: A preliminary case study of
Anthropology of Disaster Mitigation 20

the Lepcha community of Sikkim, India. Indian Journal of Traditional Knowledge, 10 (1): 173-182.
Jogia, J, U. Kalatunga, G. P. Yates, and G. Wedawatta. 2014. Culture and the psychological impacts of natural disasters: Implications for disaster management and disaster mental health. The Built & Human Environment Review, (7): 1-10
Hossain, M. A. 2013. Community Participation in Disaster Management: Role of Social Work to Enhance Participation. Antrocom Online Journal of Anthropology, 9 (1): 159-171
Kalatunga, U. 2006. Impact of Culture towards Disaster Risk Reduction. Manchester: University of Salford
Kruger, F, G. Bankoff, T. Cannon, B. Orlowski, and E. L. F. Schipper. 2015. Cultures and Disasters: Understanding Cultural Framings in Disaster Risk Reduction. New York: Routledge.
Lazrus, W. 2010. Culture, Weather and Climate: Anthropology's Contribution to Understating our World. Weather and Society Watch, 5 (1): 2-3.
Narayan, S. (Ed.). 2000. Anthropology of Disaster Management. New Delhi: Gyan Publishing House.
Oliver-Smith, A. 1996. Anthropological Research on Hazards and Disasters. Annual Review of Anthropology, 25: 303-328.
Oliver-Smith, A and S. M. Hoffman (Eds). 1999. The Angry Earth: Disasters in Anthropological Perspective. New York: Routledge.
Oliver-Smith, A and S. M. Hoffman (Eds). 2002. Catastrophe and Culture: The Anthropology of Disaster. Oxford: Oxford University Press.
Orlove, B. S, J. C. H. Chiang and M. A. Cane. 2002. Ethno-climatology in the Andes. American Scientist, 90: 428-435.
Scott, J. C. 2007. Importance of Cultural Competency in Disaster Management. New York: CCDPCR.
UNISDR. 2009. Terminology on Disaster Risk Reduction. Geneva: UN.
USAID. 2011. Introduction to Disaster Risk Reduction. Washington D.C.: USAID.
21
Man in Society ISSN 2347-1530Volume 23, 2016, pp. 13-21

Cultural Framework for Human Resource Information System Design
1Dhyanadipta Panda2Upali Aparajita
3BijayaKrushnaMangaraj
1Ph.D. Research Scholar , Department of Business Administration, Utkal University, Bhubaneswar2Professor Department of Anthropology, Utkal University, Bhubaneswar
3Prfessor XLRI, Jamshedpur, Corresponding Author E-mail: [email protected]
Abstract
The integration of information systems with human resource management functions has led to the evolution and adoption of human resource information systems in business organizations. The cultural dimension of business as well as of information technology is an important consideration that highlights the crucial role of culture in its two sub-systems, viz., human resource management and information system. We discuss here a cultural framework of human resource information system for higher organizational effectiveness.
Key words: Culture, cultural mapping, ethnographic research, human resource management, human resource information system, reflective design.
1. Introduction
Human resources management (HRM) plays a strategic role in the achievement of organizational growth and excellence. With globalization and the advent of the information age, organizations need to adapt to the changes in technology and the changing issues in managing people. A set of individuals making up the workforce of the organization is its human resource (HR), who is responsible for performing the work assigned to them, so that organizational goals can be achieved effectively in time and space. This requires that HR should be properly managed and maintained, resulting in the emergence of HRM in the organizational setup. HRM has the responsibility of handling vital issues such as attracting people of different cultural background, dealing and managing workforce diversity and coping with technological and informational changes.However, some critical aspects of such a kind of management need to be addressed for planning, acquisition and development of HR, for responding to the demands of the work place so as to evolve a strategy to deal with organizational conflict. In this domain, the concept of competitive advantage acts as the main catalyst for taking correct decisions for the effective
functioning of the organization. This is becauseorganizational success rests on the speed of decision-making and the response to both internal and external environmental changes.Numerous rational decisions are possible only with the availability of information at the right time, which is possible only by a well-designed information system. Thus, information is an important and critical resource in every organization.
Information system (IS) is a set of interrelated components that collects, stores, processes and distributes information for various organizational activities. Organizations use these systems for managing information, thereby increasing their efficiencies and effectiveness. In this context, the management of HR with the help of such a system has resulted in the development of human resource information system (HRIS). HRIS helps organizations in supporting and improving the communicational process by significantly reducing the cost and time of HRM activities. The complicated operations necessary for hiring and retaining top performers and improving productivity with enhanced job satisfaction of the employees becomes much simpler by adopting HRIS.
22
Man in Society ISSN 2347-1530Volume 23, 2016, pp. 22-37

The present paper discusses the importance of cultural dimension in HRIS effectiveness which derives its values from the effect it has on the performance of the organization. These effects include usage, user satisfaction, productivity, performance and above all its usefulness. Apart from organizational culture, an anthropological perspective of societalculture also plays a dominant role in HRIS development and implementation. Since HRIS is closely intertwined with culture, be it organizational or societal, it has a powerful influence on the performance of people, organization and information flows. As culture influences managerial processes either directly or indirectly, it becomes an important factor in HRIS's contribution to the efficiency as well as the effectiveness level of the HRM unit of any organization.
2. From HRM to HRIS: A Paradigm Shift
Prior to 1945, the personnel staff of the organization kept its record of the core business interactions, limiting only to the employee's name, address and job history. The formal process for selection and development of HR by organizations began after 1945 when it was recognized that the employee's morale had an impact on the improvement of organizational performance. The next two decades saw the integration of HR into the core business mission of organizations as well as an increase in government and regulatory reporting requirements. Eventually, HRIS was introduced to meet the complexity of HR system of the organization and utilize them for effective organizational development. For the most part, HRIS remained as simple record-keeping systems in the initial period of their introduction, but gradually they grew extensively in size and scope and had to be c o m p u t e r i z e d ( K a v a n a u g h e t a l . , 1990).PresentlyHRIS is considered as a systematic procedure for collecting, storing, maintaining, and recovering data required by an organization about their HR, personnel activities and organizational characteristics(Kovach et. al., 2002).It assists HR in numerous ways by streamlining workflow processes and participated at all levels of organizational functions, viz., administrative, operational and strategic. In this context, Beckers and Bsat (2002) pointed out five reasons as to why organizations should use HRIS:
1. increasing competitiveness by improving HR practices
2. producing a greater number and variety of HR operations;
3. shifting the focus of HR from the processing of transactions to strategic HRM;
4. making employees part of HRIS; and
5. re-engineering the entire HR function
A sixth function was added by Ruel et al. (2004) which consisted in integrating the HR functions by setting the HRIS goals as the basic reasons for adopting it in any organization. Human resource planning (HRP) provides an example of its relevance by being concerned with forecasting the needs of additional employees and their availability in the future for the organization. When an organization considers a strategic decision to expand its production facility in a new location, HRP supports it by providing timely and requisite information, estimates of the available external labor market in the new location and other tactical and operational decisions for avoiding litigations for the organization.As a result, HRIS helped to improve the skills of professionals working in the HR department of the organization, leading to better delivery of its services. Infact, thistechnology wasseen as HR's 'partner in progress', by acting as a building block and an effective aid in the process (Lawler and Mohrman, 2003).
HRIS also affected changes on the organizational HRMby redesigning jobs, modifications in the recruitment and training of personnel and educating managers to deal with the complexity of a global economy. Very often, these systems are replacing several related systems, such as a personnel database, payroll system and benefits system, with one HRIS that does it all. In this regard the study of Hussain et al. (2006) on 'the use and impact of HRIS on HRM professionals' is quite relevant. They sought to determine whether HRIS usage was a strategic value-addition for the organization, and its impact on professional standing for HR professionals. By providing a comprehensive information picture as a single integrated database, ithelps structural connectivity across units and activities and increases the speed of information
Cultural Framework for Human Resource 23

transactions in organizations (Lengnick-Hall and Lengnick-Hall, 2006). Hence, HRIS can have a wide range of usage starting from simple spread sheets to complex calculations performed easily for all sorts of human resource functions in an organization(Perry, 2010).
Business functions of many organizations were transformed with the emergence of internet for finding improved way of managing their HR at a global level.Web-based operations of HRIS led to the performance of HR activities irrespective of time and space and by the creation of self-service technology which could be operated by line managers and employees. Hence, the time spent on basic administrative tasks couldbe spent on strategic issues and implementing progressive plans of the organization.
3. HRM in the framework of culture
Although the concept of culture is central to Anthropology, yet it is a fuzzy concept because once its definition is stated, it becomes difficult to identify it in specific human situation. As stated by Jordan (1994), “the culture of the Trobrianders and the culture of General Motors are different. Organizational culture is the result of secondary enculturation, which begins with employment of a member through training programmes, asides from seasoned employees, observations regarding rewards and punishment, and a host of other elements. The employee is also the member of a traditional culture resulting from enculturation from birth”. Thus, a business organization can be defined as an economic and social entity, composed of a group of people who interact with each other for the purpose of achieving a common goal. Traditionally, organization studies views organization as having three levels of structure:
a) The individual or micro level, which focuses on individual behaviour wi th extensive understanding of individual motivations and personality,
b) The group level focusing on managing relationships among individuals and involves group formation, structures, norms and conflicts and
c) The macro or organizational level in which purpose, technology, structure and change including decision-making and communication all function efficiently in the external environment(Jordan, 2012).
From this perspective, culture is an important characteristic at the organizational level, the “unwritten feeling” (Cherrington, 1948) representing values, beliefs and shared understanding. It is considered intangible and difficult to define and measure. The cultural approach as suggested by Trice and Beyer (1993) is useful in organizational studies, which it helps to explain neglected or overlooked aspects of organizations, and when concepts of other approaches are integrated with it.This accounts for the endurance of the concept of culture in organizational studies.
Anthropologists have defined the concept of culture of a society as an integrated system of shared ideas, behaviors and artifacts characteristic of a group. In this sense, an organization is a web of interacting cultural groupings. This inter-related nature of the organizat ion is important for s tudying organizational culture. Like societal culture, organizational culture also rests on a set of universal components
Table I: Universal components of societal culture and organizational culture
Sl. No Societal culture Organizational Culture
1 Patterns of subsistence Type of technology, division of labor
2 Magic and religion Values, goals, ceremonies and myths
3 Economic system Reward system
4 Political system Organizational structure, leadership behavior, power and politics,
conflict -management
5 Language and communication Communication
6 Social structure Group formation other than formal organizational structure
7 Art Organizational artifacts, dress, building types, logos
24
Man in Society ISSN 2347-1530Volume 23, 2016, pp. 22-37
Source: Jordan Ann. T. (1989). Organizational culture: It's here, but is it Anthropology? Anthropology of Work Review, 10 (3): 2-5

Since the 1930s, anthropologists have also conducted research in industrial and corporate settings. For example, the human relations school of organizational research of the 1930s and 1940s produced a number of ethnographies showing how informal culture patterns could influence managerial goals (Mayo, 1933; Roethlisberger and Dickson, 1939; Gardner, 1945; Warner and Low 1947; Richardson and Walker, 1948). Management interest in anthropology focused on methodology as reflected in several articles published in management journals by anthropologists (Morey and Luthans, 1984, 1987; Sanday, 1979; Schwartzman, 1993). There has been a surge of research interest by anthropologists in 1980's and 1990s which takes several forms: some of it is found in the study of work (Applebaum, 1984; Sach's, 1989); development of anthropology in formal organization (Britan and Cohen,1980; Jordan, 1990); industrial ethnography (Britan, 1981; Dubinskas 1988); anthropological fit in international business consulting( Hamada, 1988; Reever-Ellington,1988;Sherry,1988); cross cultural research on organizational culture(Hamada and Jordan,1990;Serrie,1986; Ouchi,1981;Pascale and Athos,1981); in-house research by corporations (Briody and Baba,1991; Briody and Chrisman ,1991) etc.
Understanding cultural differences relevant for examining organizational behaviour is a study by Hall (1976), which discusses differences between low context and high-context societies, context being defined by Hall “as the information that surrounds an event.” The cultures in former societies value clear explicit and written forms of communication whereas in latter societies, the external environment and non-verbal cues are more crucial.Moreover, culture is conceptualized and measured through a number of value dimensions (Hofstede, 1980; Schwartz, 1994; Trompenaars & Hampden-Turner, 1997). Although this concept of culture has its own limitations, it provides cross-cultural comparability and allows for its measurement. Hofstede (1980) examined the predominant values and attitudes across nations, basing on their national cultures and observed four important dimensions viz., power distance, uncertainty avoidance, individualism/collectivism, and masculinity/femininity Power distance is the .extent to which the less powerful members of the
organization expect and accept the unequally distributed power. Application of high power distance in an organization is reflected in the form of sending reports only to top management, closed-door meetings with selected people, centralized working of the organization as well as large gaps in remuneration and delegation of authority. On the other hand, a low power distance reflects a team-work culture and a flat hierarchy among top management, supervisors and employees and their involvement in the decision-making process in the organization. Secondly, uncertainty avoidance is the extent to which members of a culture is threatened by unknown situations, risky and unpredictable environment. High uncertainty in the organization is observed in the form of many rules, regulations and policies, which leads to increased anxiety and nervousness, whereas low uncertainty avoidance accepts change and risks and never biased by emotion as it is more concerned with long-term strategy. Thirdly, individualistic societies emphasize on personal achievements, giving importance to self-respect, privacy, honesty etc. In contrast, collective societies value the group over the individual, giving importance to collective decision, harmony, skills, training and group-achievement. Basing on social-gender roles, societies are masculine as men are assertive, tough and focus on success whereas in feminine societies, women are modest, tender and concerned with quality of work. Thus, the goals of male members in an organization include high earning, facing more challenges, professional advancement and recognition, in contrast to female members, who are inclined to have good relations with superiors, subordinates and peers in a working environment with a sense of security. A fifth dimension namely log-term versus short-term orientation considers the time-orientation of people towards the past, present and future. Long-term orientation indicates cultural values that are future-looking including thrift, perseverance, humility, shame and observe hierarchal relationships, whereas short-term orientation looks at the past such as respecting tradition (Hofstede & Bond, 1988).Additionally, a sixth dimension includes indulgence versus restraint. (Hofstede, Hofstede, & Minkov 1991). Indulgence stands for a society that stands for the fulfillment of basic human desires related to fulfillment of their desires, enjoyment of leisure time, freedom of speech, leading to a high
Cultural Framework for Human Resource 25

percentage of happy people. In contrast, restraint stands for a society that controls and regulates the fulfillment of needs by strict social norms, leading to helplessness and a low percentage of happy people These reinforce particular values and help . to understand and analyze managerial actions and choices in organizational setups.
A similar cultural orientation framework was earlier given by Kluckhohn and Strodtbeck (1961), who stated five main value orientations namely human nature, man-nature relationship, social relation with people, human activity and time-sense. This framework has been used by later studies(e.g., Aycan et al., 2007; Nyambegera et al., 2000; Sparrow & Wu, 1998).Schein (1984) pinpoints three specific levels in organizational culture including artifacts and behaviour, espoused values and shared basic assumptions. Schwartz and his colleagues (Schwartz and Sagiv, 1995; Schwartz & Bilsky, 1990, Schwartz, 1994) found seven value types in national culture across countries, which they labelled as egalitarianism or recognizing individuals as moral equals, harmony or adjusting well with the environment, embeddedness of people, hierarchy where unequal distribution of power becomes legitimate, mastery over natural and social environment, affective autonomy in the quest of positive experiences, intellectual autonomy or independent hunt of individual ideas. Trompenaars and Hampden-Turner (1997) discuss a link between organizational and national cultures and classify four ideal types of organizational cultures by focusing on task-relationship and extent of hierarchy: family model places high priority to the notion “to doing the right things rather than doing things right” and hence HR practice of pay for performance are viewed as threatening to family bonds ; Eiffel tower model where relationships are based on recommended roles within a rigid system and typical HR strategy include workforce planning and performance appraisal systems; guided missile model is egalitarian, task-oriented with focus on performance and contribution of employees to the overcome outcome with HR strategy focusing on objective and pay for performance; incubator model is more personal and individualistic where the goal is innovative products or services and HR focus is on rewards for innovation. The Globe project (House et.al, 2004) provides a more pervasive nine-dimension framework for investigating cultural
variations, both similarities and differences in organizational culture. The model of 'culture fit' (Kanungo and Jaeger, 1990; Mendonca and Kanungo, 1994) highlights that both socio-cultural environment and enterprise environment affect the internal work-culture and HRM practices. The model was also tested, using 1954 employees from business organizations in 10 countries (Zeynep et. al., 2000).
A more often quoted definition of organizational culture is that of Schein (1984) who argues that culture identifies and differentiates a social group, and suggests that culture can be managed and changed. De Lisi (1990) suggests that organizational culture and learning play a control role in strategic change in organizations. Similarly Applegate (1994) views that, the culture of a firm is embodied in the behaviours and values of its members. Zimmerman et al. (1994) talk of a shift from a control culture to a learning culture and discuss culture as if it was synonymous with learned behaviours which identify and distinguish one group from another. Straub (1994) assumes that culture is a clearly defined entity, that it, is something which identifies and differentiates one social group from other. There is a substantial debate within management literature which argues that HRM practices do not directly impact organizational performance (Boxall and Purcell, 2000). There is a missing link between the two. It has been claimed that organizational culture is manifested in the behavior of its employees(Ngo and Loi, 2008) and affect job attitudes, efficiency and productivity (Mahal, 2009) of its members. The plans and strategic goals of the organization also get influenced by it (Chan, Shaffer and Snape, 2004).
Societal cultures have an important impact on approaches to managing people as all HRM practices seem to be most vulnerable to cultural differences which certainly have important implications for their design and implementation. The cultural diversity in organizations have also become the challenging context for designing and implementing the unique and thus integrated HRM policies and practices that address cross-cultural concerns. In this context, a lot of studies have a l r e a d y b e e n d o n e h i g h l i g h t i n g t h e interdependencies between the cultural dimensions of Hofstede (1980, 1981, 1991 (a), 1991 (b)) and HRM practices and purposes. At the same time, as an organization gets influenced by internal and external
26
Man in Society ISSN 2347-1530Volume 23, 2016, pp. 22-37

environments, HRM requires understanding of internal work culture as well as enterprise or institutional culture (e.g. market characteristics, nature of industry, ownership status, resource availability etc.), and socio-cultural environment (viz. paternalism, power distance etc.).
Unlike management researchers who defined organizational culture as its characteristics values and beliefs, is only one of the variables of the organization, for an anthropologist organizational culture is holistic, integrated and super-organic which results in a web of interwoven and hierarchical cultural group. It is a part-culture in one or more larger cultures that might include regional cultures within one nation, more than one national culture and even a world culture of international business. Jordan(1994) defines it as an integrated system of shared ideas, behaviours and artifacts shared by members of the group in the organization. The nuances of behaviour can be understood if diversity is recognized. Baba (2006) classified organizational anthropology into three broad areas, viz., organizational culture in technology firms, boundary-crossing roles in global context, and regional views of corporation and work. Thus, the anthropological approach of developing organizational culture is more participative as well as human-centric which is instrumental in effective governance (Mangaraj&Upali, 2013).
Morey and Morey (1994) highlight the point that anthropologists have the ability to bridge the gap between macro-level andmicro-level structures in the organization. Besides, organizational culture is something that all employees create and transmit. In this regard, anthropologists have the strength in knowing how to conceptualize, explain, predict and modify the impact of structure (both formal and informal) on individual behaviour beyond the micro-level. Patterns in individual behaviour have to be discovered through participant observation and informed questioning (Morey and Luthans, 1984). These patterns create macro-level structures that impact on individuals to create additional patterns. Thus, anthropologists can unravel the intended and unintended patterns (Morey and Morey, 1994). Another area where anthropologists also contribute is in the field of cross-cultural expertise. Hofstede (1980, 1981) has chastised management for the implicit assumptions that
American management theories have universal application. There have been numerous examples of business miscues when U.S. corporations attempted to operate in an international context. These cross-cultural blunders have resulted in the loss of revenue, reputation and even product credibility.
4. Information systems in the framework of culture
At the organizational level, Information Systems (ISs) are considered to benefit organizations by increasing operational efficiency, strategic benefits, organizational intelligence and management control (Melville et al. 2004). These systemsassemble, store, process and deliver information relevant to an organization in such a way that necessary information is accessible and useful to those who wish to use it, including managers, staff, clients and citizens. It is a human-cum-organizational activity system that may or may not involve the computer systems (Buckingham et al., 1987). This definition encompasses a wide range of areas, as for example, information theory (information), semiology (delivers information), organization theory and sociology (organization and society) and computer science and engineering (computer systems). Hence, one finds that the discipline of information systems is pluralistic by nature and is founded on knowledge from many other well-established source disciplines. This definition aptly reflects the multi-faceted nature of IS which entails a wide variety of approaches that have been blended and refined. Although each approach has a different flavor requiring different expertise, this can be blended in a multi-view (Avison and Wood-Harper, 1990). Multi-view is a holistic or system approach in which the differences of the various approaches are considered as different means to a common goal. Besides, a cultural approach to information system not only adds to its holistic perspective, but also serve as a framework for optimizing the effectiveness of IS. This is because social theory has a substantial part to play in the development of the discipline of IS in helping to understand and interact with social, organizational and personal contexts without which the technology is meaningless(Rose and Scheepers, 2001). Many of the IS research into the effect of national culture has relied on Hofstede's (1980, 1991) dimensions of culture to test and validate propositions relating to varieties of IS issues. Leidner and Kayworth (2006) provided a
Cultural Framework for Human Resource 27

comprehensive review of organizational and cross-cultural IT literature that conceptually links these two traditionally separate streams of research. Rivard and Kappos (2008) adopted a conceptualization that views culture from three perspectives wiz., integration, differentiation, and fragmentation that come into play simultaneously and jointly. Using this conceptualization, they synthesized what is known about the role of culture in IS initiatives, and proposed a model of the relationships between culture, development and use processes, and an information system.
Within the discipline of ISs, the concept of organizational culture is also regarded as being very important. One of the first researcher to discuss the relationship between information technology and organizational culture was Olson (1982) whose article focuses on subtle changes in organizational behavior facilitated by technology that may affect overall organizational performance as much as individual productivity. Laudon and Laudon (1991) suggested that,“in general, organizational cultures are far more powerful than information technologies”. According to Stair (1992), organization culture can have a significant impact on the development and operation of information systems within the organization. The concept of organizational culture is also frequently mentioned in various researches on information systems (Applegate, 1994; De Lisi, 1990; Olson, 1982; Schein, 1984; Straub, 1994; Zimmerman et al., 1994; Jackson, 2011).
Despite the lack of recognition of the contributions of anthropology as a source discipline for IS development, some information systems researchers have recognized that anthropological concepts and methods facilitate the description and analysis of the social world in which such systems are developed and used. One of the fundamental and distinctive concept of anthropology is that of culture. Sandstorm (2004) feels that one of the common ground is the anthropological insight of culture as an information system or system of communication; conversely, many technologists are beginning to look at information as a cultural construct. Thus, an anthropological approach can humanize information technology and research practices because information is a part of an ongoing, organic cultural system and not a
commodity that can easily be divorced from its meaningful context or content.
An important and related concept to culture is that of symbolism. This concept has been widely used in anthropology to help interpret the actions of social actors, where there “is a pervasive search for meaning in cultural symbols” (Lewis, 1985). From anthropology, the symbolic approach found its way into sociology and more recently into organization theory literatures; to some extent, symbolism has now found its way into information systems literatures(Boland, 1987; Hirschheim and Newman, 1991; Kendall and Kendall, 1993; Lanzara, 1983; Robey and Markus, 1984). Hirschheim and Newman (1991) argue that the symbolic concepts of myth, metaphor and magic facilitate a much richer understanding of IS development than the conventional economic rationality model.
An important area in which anthropology is making relevant contribution to the discipline of information systems is that of research methods. The unique r e s e a r c h m e t h o d w h i c h c h a r a c t e r i z e s anthropological studies is ethnography. This method is a qualitative study, over an extended period of time, of a particular organization or society. In this approach, the ethnographer “immerses himself in the life of people he studies (Lewis, 1985) and seeks to place the phenomena to be studied in its social and cultural context. In recent years, growing number of information systems researchers have recognized the value of the ethnographic method for IS research (Bentley et al., 1992; Harvey and Myers, 1995; Hughes et al., 1992; Lee, 1991; Lee et al., 1992; Orlikowski, 1991; Preston, 1991; Suchman, 1987; Wynn, 1991; Zuboff, 1988). Bentley et al. (1992) highlights that ethnographic studies are helpful in informing the systems design process and may produce insights which contradict conventional thinking in systems design. Myers and Avison, (1995) point out that the concept of culture has been generally used rather narrowly in the IS literature and argued that a more critical anthropological view of the relationship between IT and organizational culture is required.
5. Cultural Framework of HRIS
HRIS tries to balance the conflicting criteria of usability, portability, maintainability, as well as reliability in the organization. Usability and user
28
Man in Society ISSN 2347-1530Volume 23, 2016, pp. 22-37

satisfaction are largely dependent upon culture and play a significant role (Thong and Yap., 1996; Mangaraj and Upali., 2013).Hence, an effective HRIS should be the reflection of the organization in human resource as well as information technology perspectives and should encompass a reflective design with culture playing a pivotal role. This involves a structured set of tasks and which comprises not only the technical sub-systems, but also members and their roles comprising the social sub-system. Although, there are several factors influencing the effectiveness of HRIS, the present paper highlights the role of culture in HRIS contributing to the success of an organization. In this approach, the differences and similarities of people from different cultural backgrounds are to be considered in order to give a better understanding of the processes associated with the cultural effects (Straub, 2002). This necessitates the need to distinguish societal culture from that of organizational culture and then demonstrate their interaction in the different aspects of HRIS, wherein culture acts as an independent as well as a dependent variable so as todesignan effective HRIS.
a. Culture and HRIS development.
The success of HRIS depends on the degree to which the values of various sub-groups of the organization fit with the particular values embedded in the software development innovation. A good fit between the values embedded in the software development processes and the overall organizational values will lead to a more successful implementation of HRIS. This involves a cultural sensitive approach for the various phases of development of a successful socio-technical system. In this context, societal culture and its effects can be used to make system more responsive. Although, there is a general lack of design theories regarding development of culturally sensitive socio-technical information systems in general and HRIS in particular, research methods generally used in culture studies can be utilized. For example, ethnographic research methods are be used for collecting and pooling the information from the employees which precedes the actual development of HRIS.
Societal cultural values have a strong impact on organizations. It has been observed that if an organization adopts HRIS according to its
embedded culture, the results will be a high performing organization. Conversely, if an organization adopts HRIS that deviate from its dominant culture, the results will decreases the performance of the organization. Several literatures also support the argument and emphasized on the importance between cultural fit and HRIS development to manage human resource for better organizational performance (Kanungo and Jaeger, 1990; Mendonca and Kanungo, 1994).Empirical studies have indicated that national values predict organizational processes and managerial practices (Communal and Senior 1999; Hofstede & Peterson, 2000).By taking the most widely studied cultural factors described by Hofstede(1980, 1981, 1991 (a), 1991 (b)), the impact of those factors can be observed. For example, in high power distance societies where hierarchy is very much rigid,people in top management are expected to enjoy relatively more advantage in status and power. With respect to such societies the HRIS is typically designed in such a way that the employees will have little access to the information which is non- interactive in nature. On the other hand, in societies having low power distance, it is expected that the HRIS should be developed is such a way that the employees will have access to more information. Similarly high uncertainty observed in the organization in the form of lots of rules, regulations and policies. High sense of nervousness and emotions observed in the organizational environment. Differences are avoided by clear and conscious about expectation. Proper plans are prepared and communicated which focuses on tactical aspect of jobs or project. Low uncertainty avoidance organizations are more concerned with long term strategy then short term. Accepts changes and risk do not impose unnecessary rules, never biased by emotion. The HRIS should be developed accordingly to face the uncertainty situation in a systematic manner. Individualism factor plays an important role in HRIS development and implementation. The organizational employeespossess such cultural factor prefer privacy at work, want that their opinion should count and give priority to their own work then relationship with others. Whereas in collectivism stress is observed on belonging. People have strong bonding with group. Opinions and votes in determined by group. Always maintains good relationship with others. In a similar manner the Masculine's in the
Cultural Framework for Human Resource 29

organization tend to be more assertive, commutative and tough. Their goals includes high earnings, facing more challenges, want advancement and recognition. In contrast feminine are more inclined towards good relation with superiors, subordinates and peers. Always prefer a good working environment with sense of security. The HRIS of the organizations should be designed and developed accordingly to meet the specific needs of employees irrespective of their gender so that organizational objectives can be achieved. These types of organizations emphasize on developing HRIS as an interactive system and allow the employees to perform various activities directly on that system (Aycan, 2005).Similarly, the cultural factor of future-orientation is the degree to which individuals engage in future-oriented behaviors (House et al., 2002). This indicates that the organizations embedded in future-oriented societies are more likely to develop advanced HRIS system in comparison with the organizations that are less future-oriented.The cultural factor individualism- collectivism refers to the degree to which societies value individual rights and opportunities versus group success and individual loyalty to the group. In collectivistic societies individuals are expected to work in groups to achieve organizational goals. In such a scenario, organizations are likely to avoid individual- based systems and will generally develop HRIS for the purpose of general benefit of all employees. Chow, Deng and Ho (2000), in a study comparing American and Chinese managers, found that Chinese respondents were more likely to share knowledge, since this was consistent with their collectivistic value system. The cultural factor affecting HRIS in uncertainty avoidance is the extent to which a society, organization or group relies on social norms, rules and procedures to reduce the unpredictability of future events (House et al., 2002; 2004). Organizations in societies are surrounded by high uncertainty avoidance today than were organizations embedded in societies a few years back which were low in uncertainty avoidance.Hence, organizations are more likely to develop HRIS which can be integrated to a wide range of systems besides being interactive in nature. Png, Tan and Wee (2001) in a multinational survey of 153 businesses found that uncertainty avoidance affected information systems adoption. Businesses in high uncertainty avoidance countries were less
l ikely to adopt information technology infrastructure. For them, understanding the level of fit between cultural values and HRIS is important as a basis for understanding the effects of such systems on organizational performance and argued that variation across cultural values may lead to different approaches for development of information system of organizations.
b. Culture and HRIS adoption and diffusion
Culture is an important moderating variable for the success and failure of the adoption and diffusion of information system. Many factors of national and organizational cultures affect Enterprise Resource Planning (ERP) implementation across various developing countries (Huang and Palvia, 2001). Martin's (2002) research on the three perspective of culture i.e., integration, differentiation and fragmentation provides an understanding of its multifaceted nature and how it affects the adaptation of an information system in an organization. Davison and Martinsons (2003) regard the main reason for an increased interest in studies to address the cultural issues in information systems adaptation is due to the many failures observed insuch adaptation due to a mismatch between the two. Many a times, cultural fit is a particularly neglected factor in assessing ERP implementation success (Willis and Chaison, 2007). This can be observed from a study done in China where factors of national cultural acted as barriers in ERP implementation (Avison and Malaurent, 2007).In this context, cultural groups are more likely to adopt the technology of HRIS if their own values match the values embedded with the technology.In fact, a successful HRIS diffusion requires that either technology fits organizational culture or culture to be shaped to fit the behavioral requirement of the HRIS.Thus, it is clearly evident that value orientation, be it societal or organizational, may pre-dispose certain social groups towards either favorable or unfavorable HRIS adoption and diffusion behaviors.
Hence, understanding cultural differences plays an expanding role in adopting HRIS as organizations expand their operation beyond national geographical boundaries. Proper adoption of technological innovation of HRIS will help modern
30
Man in Society ISSN 2347-1530Volume 23, 2016, pp. 22-37

multinational organizations in effective management of human resources. Researchers also pointed out that for better adaptation of HRIS, difference between societal culture and organizational culture must be understood and accordinglyacknowledged in the development of HRIS. Studies have consistently recognized that people are the important resource of an organization for achieving sustainable competitive advantage. To perform their duties properly, information regarding internal and external environment should effectively be given to the human resource (Pfeffer, 2005). Thus, the designing of a proper HRIS to pass information to thehuman resource helps to achieve organizational objectives as well as the competitive advantage (Gibson et al., 2007). In other words, the successful adaptation of HRIS will help modernorganizations in the effective management of human resource which will eventually lead toorganizational effectiveness.
c. Impact of HRIS on organization culture
HRIS have a profound effect on the performance of organizations, particularly in today's world, asemployees nowfocus on proper reporting and processing which can be only be achieved by the implementation of effective HRIS , challenging the operating structure and principles of all HR-related activities of the entire organization. Leidner and Kayworth (2006) inferred that IS has the potential for use in organizational culture re-engineering efforts where such system in the form ERP system impose its own logic on organizational structures and business processes. They also pointed that different types of technological artifacts may influence certain values. Mohanty and Tripathy (2007) write that although the HRIS of National Aluminum Company (NALCO) operating in Odisha(India) is not fully as per the expectation of the HR department, it has increased the efficiency and effectiveness of the HR department to a larger extent. Hence, they have suggested some important areas for improvement of the system so as to make it more compatible with the employees' needs and expectations.According to them an integrated system should develop containing provision for all category of HR functions. To improve the HRIS effectiveness coherent approach is required between HR and system department. Attention should be given to design and develop an effective
& user-friendly system. Transparency in implementing standards of codes and procedure should be maintained. The data in the system should be updated regularly with authenticity to make it worth or valuable. Support of top management is highly essential for further improvement and implementation of system properly. They should emphasize the importance of HRIS in decision making process. It should have provision for analyzing data in order to help in strategic decision making processes. The employees should be exposed with continuous training programs to be acquainted with the systems latest innovations, which will help them for better adoptability with the system. The HRIS should be accessible to all level of employees for knowing their own information maintained by HRIS keeping the privacy and security issue intact. In yet another study, Hosnavi and Ramezan, (2010) found that employees expressed their satisfaction in three dimensions of HRIS, viz., system quality, information quality and information use which largely influence the organizational culture of the National Iranian Oil Company.
6. Conclusion
HRM is the management of HR which is the most important resource of an organization. Efficient and effective management of such a resource should be given top priority for organizational development, more so when work-cultures are becoming complex day- by -day. With an increasing as well as diverse work-force in the organization, it is really becoming very difficult and time-consuming to maintain and manage the employees' information manually. Data need to be collected, written in a proper format, and kept in a systematic way so that it can be given to the required user as and when required. This increases the administrative expenses of the organization and un-timely delivery of information because of the dependency on those people who maintain it. It does not mean that an organization having no computerized system does not have a HRM system. But, in such a case, the management of employees' information cannot be done as efficiently and effectively as in a proper computerized system. To overcome this difficulty, most of the organizations have shifted towards automation. The rapid development in information technology and use of personal computers supported this process to a large
Cultural Framework for Human Resource 31

extent. This has facilitated the flow of information in all the directions, both within and outside of the organization. For managing activities relating to human resources of the organizations, HRISs were introduced and as a result, various functions of the HR department that dealing with employees' information, such as employee benefits, leave management, compensation management, performance evaluations etc. became easier.
The key element for managing HR in an organization is culture, be it organizational or societal, of the employees. Hence HRM practices seem to be most vulnerable to cultural similarities and differences found across cultures. Management systems in general and HRISs in particular should consider these aspects for their design and appropriateness for higher acceptability and diffusion in the organizations. This requires the study of culture, in a holistic way for identifying the characteristics to be embedded in the HRIS for effectively managing the HR in the organization. As has been discussed, the effectiveness of this system increases when such a system considers cultural dimension apart from technical one in the design phase, as this system involves people and people management in organizationand is largely culture dependent.
References
Applebaum, H. 1984.Work in Market and Industrial Societies Albany: State University of New York Press.
Applegate, L.M. 1994 ' M a n a g i n g i n a n information age: transforming the organization for the 1990s', in Baskerville, R. et al (Eds.), Transforming Organizations with Information Technology, North Holland, Amsterdam, PP.15-94.
Avison, D. E. and Wood-Harper. A.T. 1990.Multiview: An Exploration in Information Systems Development, Blackwell Scientific, Oxford
Avison, D. and Malaurent, J. 2007 Impact of cultural differences: A case study of ERP introduction in China. International Journal of Technology and Information Management, Vol. 27, pp. 368-374.
Aycan, Z., Al-Hamadi, A. B., Davis, A., & Budhwar, P. 2007. Cultural orientations and preferences for HRM policies and practices: the case of Oman.
International Journal of Human Resource Management, 18(1), 11-32.
Aycan, Z. 2005 The interplay between cultural and institutional/structural contingencies in human resource management practices.International Journal of Human Resource Management, Vol. 16, Issues. 7, pp. 1083-1119.
B a b a , M . 2 0 0 6 . A n t h r o p o l o g y a n d Business.Encyclopedia of Anthropology. H. James Birx, Ed. Thousand Oaks, CA: Sage Publications. Pages 83-117.
Beckers, A. M. and Bsat, M. Z. 2002 A DSS classification model for research in human resource information systems.Information Systems Management, Vol. 19, No. 3, pp. 41-50.
Bentley, R., Rodden, T., Sawyer, P., Sommerville, I., Hughes, J., Randall, R. and Shapiro, D. 1992.Ethnographically-informed systems design for air traffic control.Proceedings of the Conference on Computer-supported Co-operative Work: Sharing Perspectives (CSCW '92), ACM Press, New York, NY, pp. 123-9.
Boxall, P. and Purcell J. 2000. Strategic Human Resource Management: where have we come from and where should we be going?International Journal of Management Reviews,Vol. 2, Issue 2, pp. 183-203.
Briody, E.K and Baba, M. 1991. Explaining Differences in Repatriation Experiences: The Discovery of Coupled and Decoupled Systems. American Anthropologist 95: 322-344.
Briody, E. K and Christuan, J.B. 1991. Cultural Adaptation on Overseas Assignments. Human Organization 50: 264-282.
Britan, G.M and Cohen, R. 1980.Towards an Anthropology of Formal Organization”, in Hierarchy and Society. Gerald.M.Britan and Ronald Cohen (Eds) PP 9-30. Philadelphia: Institute for the study of Human Issues.
Britan, G.M. 1981.Bureaucracy and Innovation. Beverly Hills: Sage Publications.
Buckingham, R.A. et al (Eds.), 1987.Information Systems Education: Recommendations and implementation, Cambridge University Press, Cambridge.
32
Man in Society ISSN 2347-1530Volume 23, 2016, pp. 22-37

Chan, L. L. M., Shaffer, M. A. and Snape, E. 2004. In search of sustained competitive advantage: The impact of organizational culture, competitive strategy and human resource management practices on firm performance.International Journal of Human Resource Management, Vol. 15, Issue 1, pp. 17-35.
Chow, C. W., Deng, F. J., and Ho, J. L. 2000. The Openness of Knowledge Sharing Within Organizations: A comparative study of the United States and the people's republic of China.Journal of Management Accounting Research, Vol. 12, 65-95.
Communal, C. and Senior, B. 1999. National culture and management: Messages conveyed by British, French and German advertisements for managerial appointments.Leadership and Organization Development, Vol. 20, Issue. 1, pp. 26-35.
Cherrington, D. J. 1989 Organizational Behaviour, Boston: Allyn &Bacon.
Davison, R. and Martinsons, M. 2003. Guest Editorial Cultural Issues and IT Management: Past and Present.IEEE Transactions on Engineering Management, Vol. 50, Issue. 1, pp.3-7.
DeLisi, P.S. 1990. Lessons from the steel axe: cul ture , technology and organizat ional change.Sloan Management Review, Vol. 32, No. 1, pp. 83-93.
Dubinskas, F.A. 1988 Making Time: Ethnographies of High-Technology Organisations. Philadelphia: Temple University Press.
Gardner, B. 1945.Human relation in industry, Homewood III: Irwin.
Gibson, L., Barrett, B. and Burbidge, A. 2007.Dealing with uncertain absences in habitat modeling: a case study of a rare ground-dwelling parrot.Diversity and Distribution, Vol. 13, Issue. 6, pp. 704-713.
Hall, E. T. 1976. Beyond culture. New York: Anchor Press/Doubleday
Hamada, T. 1988. Working with Japanese: US-Japanese Joint Venture Contract.Practicing Anthropology. 10(1). 6-7.
Hamada, T. and Jordan, A.T., (Eds) 1990.Cross-cultural Management and Organisationl Culture, studies in third world societies. 42-willamsburg, VA: College of William and Mary.
Harvey, L. and Myers, M.D. 1995. Scholarship and practice: the contribution of ethnographic research methods to bridging the gap.Information Technology & People. (8:3), pp. 13-27.
Hirschheim, R., Newman, M. 1991.Symbolism and information system development: myth, metaphore and magic.Information Systems Research, Vol. 2, No. 1 , pp. 29-62
Hofstede, G.1980. Culture's consequences: International Differences in work related values. Beverly Hills: sage publications.
Hofstede, G.1980.Culture's consequences: International Differences in work related values. Beverly Hills: sage publications. 1981, culture and organizations. International studies of management and organizations. 10(4): 15-41.
H o f s t e d e , G . 1 9 8 1 . C u l t u r e a n d organizations.International studies of management and organizations, Vol. 10, No. 4, pp. 15-41
Hofstede, G. 1991a.Culture and Organisations. New York, McGraw-Hill.
Hofstede, G. 1991b.Cultures and Organizations: Software of the mind. London, McGraw-Hill.
Hofstede, G., & Bond, M. H. 1988. The Confucius connection: From cultural roots to economic growth. Organizational dynamics, 16(4), 5-21.
Hofstede, G., Hofstede, G. J., & Minkov, M. 1991. Cultures and organizations.Software of the mind (Vol. 2). London: McGraw-Hill.
Hofstede, G. and Peterson, M. 2000.Culture: National values and organizational practices.In N. Ashkanasy, C. Wilderom and M. Peterson (Eds.), Handbook of organizational culture and climate, pp. 401–416, Thousand Oaks, CA: Sage.
House, R. J., Hanges, P. J., Javidan, M., Dorfman, P. W., & Gupta, V. 2004.Leadership, Culture, and Organizations: The GLOBE study of 62 societies. London: Sage.
House, R., Javidan, M., Hanges, P., and Dorfman, P. 2002. Understanding cultures and implicit leadership theories across the globe: An introduction to project GLOBE.Journal of World Business, Vol. 37, pp. 3-10.
House, R., Hanges, P., Javidan, M., Dorfman, P., and Gupta, V. 2004 Culture, leadership, and
Cultural Framework for Human Resource 33

organizations: The GLOBE study of 62 societies, Thousand Oaks, CA: Sage.
Huang, Z. and Palvia, P. 2001 ERP implementation i s s u e s i n a d v a n c e d a n d d e v e l o p i n g countries.Business Process Management Journal, vol. 7, no. 3, pp. 276 - 284.
Hughes, J.A., Randall, D. and Shapiro, D. 1 9 9 2 . F a l t e r i n g f ro m e t h n o g r a p h y t o design.Proceedings of the Conference on Computer-supported Co-operative Work: Sharing Perspectives (CSCW '92), ACM Press, New York, NY, pp. 115-23.
Hussain, J., Millman, C. and Matlay, H. 2006. SME financing in the UK and in China: a comparative perspective.Journal of Small Business and Enterprise Development, Vol. 13, No 4, pp. 584–599.
Hosnavi, R., Ramezan, M. 2010. Measuring the effectiveness of a human resource information system in National Iranian Oil Company: An empirical assessment. Education, Business and Society: Contemporary Middle Eastern Issues, Vol. 3 Issue: 1, pp.28-39
Jackson, S. 2011. Organizational culture and information systems adoption: A three-perspective approach.Journal Information and Organization, Vol. 21, Issue 2, pp. 57-83.
Jordan, A.T., (Eds) 1994.Practicing Anthropology in Corporate Amer ica: Consul t ing on Organizational Culture. NAPA bulletin, 14.
Jordan, A. T. 2012.Business anthropology. Waveland Press.
Jordan, A. T. 1990 Organizational Culture and Culture Change: A Case Study, in Cross-cultural Management and Organizational Culture, Tomoko Hamade and Aun. T. Jorden (Eds) studies in Third World Societies, 42. Williamsburg, VA: College of William and Mary.
Jordan Ann. T. 1989 Organizational culture: It's here, but is it Anthropology? Anthropology of Work Review, 10 (3): 2-5.
K a n u n g o , R . N . a n d J a e g e r , A . M . 1990.Introduction: The Need for Indigenous Management in Developing Countries.In A. M. Jaeger and R. N. Kanungo (eds.) Management in
Developing Countries, London: Routledge, pp. 1-23.
Kavanagh, M. J., Gueutal, H. G. and Tannenbaum, S. I. 1990.Human resource information systems: development and application,Boston, Mass: PWS-Kent Publications Co.
Kluckhohn, F., and Strodtbeck, F. 1961.Variations in value orientations. Evanston: Row-Peterson.
Kovach, K. A., Hughes, A. A., Fagan, P. and Maggitti, P. G. 2002. Administrative and Strategic Advantages of HRIS.Employment Relations Today, Vol. 29, Issue. 2, pp. 43–48.
Laudon, D.P. and Laudon, J.P. 1991.Business Information System: A Problem Solving Approach, New York, HBJ, College Publishers, 21.
Lawler, E. E. and Mohrman, S. A. 2003. HR as a strategic business partner: What does it take to make it happen? Human Resource Planning, Vol. 26, No. 3, pp. 15–29.
Lee, A.S. 1991. Integrating positivist and interpretive approaches to organizational research.Organization Science, Vol. 2 No. 4, pp. 342-65.
Lee, A.S., Baskerville, R.L. and Davies, L. 1992.A workshop on two techniques for qualitative data analysis: action research and ethnography. Proceedings of the Thirteenth International Conference on Information Systems, Dallas, TX, 13-16 December, pp. 305-6.
Leidner, D. E. and Kayworth, T. 2006. A Review of Culture in Information Systems Research: Toward a Theory of Information Technology Culture Conflict.MIS Quarterly, Vol. 30, Issue. 2, pp. 357-399.
Lengnick-Hall, C. A. and Lengnick-Hall, M. L. 2006. HR, ERP, and knowledge for competitive advantage.Human Resource Management, Vol. 45, No. 2, pp. 179–194.
L e w i s . 1 9 8 5 . S o c i a l a n t h ro p o l o g y i n prospective .Cambridge university press, Cambridge (Boland, 1987; Kendall and Kendall, 1993; Lanzara, 1983; Robey and Markus, 1984)
Mahal, P. K. 2009. Organizational Culture and Organizational Climate as a determinant of motivation.The IUP Journal of management
34
Man in Society ISSN 2347-1530Volume 23, 2016, pp. 22-37

research, Vol. 8, No. 10, pp. 38-51.
Mangaraj, B. K. and Aparajita, U. 2013. 'Measuring Effectiveness of an E-Government System: A Human-centric Approach, in Human-cantered System Design for Electronic Governance' pp. 147-170, Saeed, S. & Reddick, C. G., Information Science Reference, IGI Global, USA.
Martin, J. 2002Organizational culture: Mapping the terrain, Thousand Oaks, CA: Sage.
Mayo, E. 1933. The human problems of an industrial civilization, New York: Macmillian.
Melville, N., Kraemer, K. and Gurbaxani, V. 2004. R e v i e w : I n f o r m a t i o n Te c h n o l o g y a n d Organizational Performance: An Integrative Model of IT Business Value.MIS Quarterly, Vol. 28, Issue. 2, pp. 283-322
Mendonca, M. and Kanungo, R. N. 1994. Managing Human Resources: The Issue of Culture Fit.Journal of management Inquiry, Vol. 3, No. 2, pp. 189-205.
Mohanty, M. and Tripathy, S. K. 2009. HRIS of Ind ian Scenar io : Case s tudy of la rge organizations.South Asian Journal of management, Vol. 16, No. 2, pp. 137-168.
Morey, N. C., and Luthans, F. 1984. An Emic Prospective and Ethnoscience Methods for organizational Research.Academy of Management Review, 9: 27-36.
Morey, N.C., and Luthans, F. 1987.Anthropology: The Forgotten Behavioral science in Management
thHistory.In Best papers Proceedings of the 47 Annual Meeting of the Academy of Management. Fronk Hoy (Eds) PP 128-132. Athers, G.A: university of Georgia.
Morey, N.C., and Morey, R.V. 1994. Organizational culture: The Management Approach, in Ann. T. Jordan (Eds), practicing Anthropology in corporate America: consulting on Organizational culture. NAPA bulletin, 14.
Myers, D. M., Avison, D. E. 1995. Information system and anthropology: an anthropological p rospec t ive on IT and o rgan i sa t iona l culture.Information technology and people, Vol. 8, Issue 3, pp. 43-56.
Morey, Nancy C., and Luthans, F. 1984. An Emic Perspective and Ethnoscience Methods for
Organizational Research. Academy of Management Review, 9 : 27-36.
Ngo, H.Y. and Loi, R. 2008. Human resource flexibility, organizational culture, and firm performance: An investigation of multi-national firms in Hong Kong.International Journal of Human Resource Management, Vol. 19, Issue. 9, pp. 1654-1666
Nyambegera, S. M., Sparrow, P. R., & Daniels, K. 2000. The impact of cultural value orientations on individual HRM preferences in developing countries: Lessons from Kenyan organizations. International Journal of Human Resource Management, 11(4), 639-663.
Olson, M. 1982.The Rise and Decline of Nations- economic growth, stagflation and social rigidities, Yale University Press.
Orlikowski, W.J. 1991. Integrated information environment or matrix of control? The contradictory implications of information technology.Accounting, Management and Information Technologies, Vol. 1 No. 1, pp. 9-42.
Ouchi, W. 1981.Theory Z, Reading. MA: Addison-Wesley.
Pascale, R.T. and Athos, A.G. 1981. The Art of Japanese Management. New York: Simon and Schuster.
Perry. E. 2010. The benefits of using technology in human resource management.IGI global. Cranfield School of Management.
Pfeffer, J.2005.Producing sustainable competitive advantage through the effective management of people. Academic of Management Executive,vol. 19, No. 4, pp. 95-106.
Png, I. P. L., Tan, B. C. Y., and Wee, K.L. 2001. Dimensions of national culture and corporate adoption of IT infrastructure.IEEE Transactions of Engineering Management, Vol. 48, Issue. 1, pp. 36-45.
Preston, A.M. (1991). The 'problem' in and of management information systems.Accounting, Management and Information Technologies, Vol. 1 No. 1, pp. 43-69.
Reeves-Ellington, R. 1988. A Manager's Use of Anthropology. Practicing Anthropology 10(1):8-9.
Cultural Framework for Human Resource 35

Richardson, F., and Walker, C. 1948.Human relations in an expanding company. New Haven, Conn.: Yale University Labor Management Center.
Rivard, S., and Kappos, A. 2008. A Three-Perspective Model of Culture, Information Systems, and Their Development and Use. MIS Quarterly, Vol. 32, Issue. 3, pp. 601-634.
Roethlisberger, F. J and, F. J and Dickson, W.J. 1939.Management and the worker: An account of a research problem conducted by a western electric company. Hawthorne works, Chicago, Cambridge, Mass. Harvard University Press.
Rose, J. and Scheepers, R. 2001.Structuration theory and information system development frameworks for practices.European Conference on Information Systems (ECIS), Bled, Slovenia.
Ruel, H. J. M., Bondarouk, T. and Looise, J. C. 2004.E-HRM: Innovation or Irritation: An Exploration of Web-based Human Resource Management in Large Companies, Lemma Publishers, Utrecht, Netherlands.
Sachs, P., (Eds), 1989. Anthropological Approaches to Organizational culture. Theme Issue. Anthropology of Work Review. 10(3).
Sanday, Peggy Reeves, 1979.The Ethnographic Paradigm(s).Administrative Science Quarterly, 24: 527-538.
Schein, E. H. 1984.Coming to a new awareness of organizational culture.Sloan Management Review, Vol. 25, No. 2, pp. 3-16.
S c h w a r t z , S . H . 1 9 9 4 . B e y o n d individualism/collectivism: New cultural dimensions of values. In K. Uichol, C. Kagitcibasi, H. C. Triandis & G. Yoon (Eds.), Individualism and collectivism: Theory, method, and applications (pp. 85-119). Thousand Oaks, CA: Sage.
Schwartz, S. H., & Sagiv, L. 1995. Identifying culture-specifics in the content and structure of values. Journal of cross-cultural psychology, 26(1), 92-116.
Schwartz, S. H., & Bilsky, W. 1990. Toward a theory of the universal content and structure of values: Extensions and cross-cultural replications. Journal of personality and social psychology, 58(5), 878.
Schwartzman, H. B. 1993.Ethnography in organizations. Qualitative Research Methods Series, 27 Newbuny Park, CA: Sage.
Serrie, H. (Eds) 1986. Anthropology and Business Studies in Third World Societies. 28 Williamsburg, VA: College of William and Mary.
Sherry, J. F, 1988. Teaching International Business: A view from Anthropology.Anthropology and Education Quarterly, 19:396-415.
Sparrow, P., & Wu, P.-C. 1998. Does national culture really matter? Predicting HRM preferences of Taiwanese employees. Employee Relations, 20(1), 26-56.
Stair, R.M. 1992.Principles of Information Systems, Boyd & Fraser, Boston.
Straub, D. W. 1994. The effect of culture on IT diffusion: e-mail and Fax in Japan and the US.Information Systems Research, Vol. 5, No. 1, pp. 23-47.
Straub, D., Loch, K., Evaristo, R., Darahanna, E., and Strite, M. 2002. Toward a Theory-Based Measurement of Culture.Journal of Global Information Management, Vol. 10, No. 1. Pp. 13-23.
Suchman, L. 1987.Plans and Situated Actions: The Problem of Human-Machine Communication, Cambridge University Press, Cambridge.
Sandstorm P. E. 2001. Scholarly Communication as Socio-Ecological System, Scientometrics, 51, 573-605.
Thong, J. Y. L. and Yap, C. 1996. Information system effectiveness: a user satisfaction approach.Information Process and Management, Vol. 32, Issue. 5, pp. 601-610.
Trompenaars, F., & Hampden-Turner, C. 1997. Riding the waves of culture: Understanding cultural diversity in business. London: McGraw-Hill.
Trice, H. and Beyer, J. 1993. The Cultures of Work Organisations. Englewood Cliffs, NJ: Pentice-Hall.
Warner, W.L., and Low, J.O. 1947.The Social system of the modern factory: The Strike, a social analysis. New Haven, Conn.: Yale University Press.
Willis, R. and Chiasson, M. 2007. Do the ends justify the means? A Gramscian critique of the p r o c e s s e s o f c o n s e n t d u r i n g a n E R P
36
Man in Society ISSN 2347-1530Volume 23, 2016, pp. 22-37

implementation.Information Technology & People, Vol. 20, Issue. 3, pp. 212 – 234.
Wynn, E. 1991.Taking practice seriously.In Greenbaum, J. and Kyng, M. (Eds), Design at Work, Lawrence Erlbaum, Hillsdale, NJ.
Zeynep, A., Kanungo, R. N., Mendonca, M., Kaichang, Y., Deller, J., Stahl, G. and Kurshid, A. (2000). Impact of culture in Human Resource Management P rac t i ces : A 10 Coun t ry comparison.Applied Psychology: An International
Review, Vol. 49, Issue 1, pp. 192-221.
Zimmerman, J., Grande, S., and Johnston, S. 1994.Adding value by working differently: enabling the learning culture.In Baskerville, R., Smithson, S., Ngwenyama, O., and DeGross, J.I., (Eds.) Transforming Organisations with Information Technology. North Holland, Amsterdam. PP 437-50.
Zuboff, S. 1988.In the Age of the Smart Machine.Basic Books, New York, NY.
Cultural Framework for Human Resource 37

ABO and Rh frequency distribution and gene frequency among the Bhumij community of Balasore district, Odisha
1Shyama Mohapatra, Arundhuti Das 2Sushree Lipsa Mohanty, Kanhu Charan Satapathy
3Prasanna Kumar Patra
1 2 3 4,5Ph.D. Scholar , Post Doctoral Scholar , Ph.D. scholar , Associate Professor Department of Anthropology, Utkal University, Bhubaneswar, Odisha.Corresponding author E-mail: [email protected]
Abstract
Global distribution pattern of blood groups depends on various environmental factors, such as disease, climate, altitude, humidity etc.. Blood group is a classical marker, its knowledge remains very significant in understanding the influence of evolution causing factors. The main objective of the present study is to find out the percentage distribution and gene frequency of ABO, Rh blood type in the Bhumij community (an Austro-Asiatic population) from Balasore district. The results showed that the frequency of blood group O is highest in the studied population which varies from the other Austro-Asiatic populations.
Key words: ABO, RH, Gene Frequency, Hardy-Weinberg Equilibrium, Bhumij.
1. Introduction
ABO and Rh blood groups are the most studied blood systems among human populations due to their clinical, genetic and anthropological importance (Davey WW and Elebute EA, 1963, Bakare, 2006 and Jeremiah, 2006). The grouping of ABO and Rh factor into blood groups is based on the antigenic properties on the surface membrane of the red blood cells (RBCs) (Garratty G., 2005). All human populations share the same blood group systems; although they differ in the frequencies of specific types. The incidence of ABO and Rh groups varies markedly in different races and ethnic groups in different part of the world. The frequencies of ABO and Rh blood groups vary from one population to another and time to time in the same region. The knowledge of distribution of ABO and Rh blood groups at local and regional levels are helpful in the effective management of blood banks and safe blood transfusion services. Identification of Rh system is important to prevent erythroblastosisfetalis (Gadwalkar, 2013).
Many studies have found difference of ABO and Rh frequency among the world population (Zahra et al., 2014; Kostovski et al., 2014). Several studies have also been conducted to understand the distribution of ABO blood group frequency among the Indian population (Subhashini, 2007; Periyavan et al., 2010; Rai and Kumar, 2011; Pathania, 2011; Haloi, 2011; Pandey et al., 2012; Prakash et al., 2013; Pandey et al., 2013; Soram et al., 2014; Handoo and Bala, 2014; Rao and Shetty, 2014; Shrivastava et al., 2015; Sukumaran et al., 2016; Sah and Sahadalal, 2016). Overall distribution of ABO frequency in India shows the group B to be the commonest blood group in northern and western part of India whereas in eastern, southern and central part O is the most prevalent blood group. Cumulatively, O is the dominant blood group among the Indian population (Shekhar et al., 2014).
In the present study the ABO blood group and Rh (D) frequency distribution of the Bhumij community of Balasore district was studied and the gene frequency was also calculated to understand the micro-evolutionary forces is acting or not through Hardy-Weinberg equilibrium.
38
Man in Society ISSN 2347-1530Volume 23, 2016, pp. 38-44

2. Materials and Methods:
Brief description of the land and people:
The Bhumijare believed to be a branch of the Munda tribe. They belong to the Austro Asiatic linguistic family. In Odisha the Bhumij population ranges from 2, 48,114 to 3, 21,592.The study was conducted in Gopinathpur Village of Nilgiri, Balasore districts covering 3 hamlets namely Nuasahi, Kendupadia and Patrasahi. A total of 187 blood samples were obtained.
Collection and Determination of Blood samplesEach individual was requested to sign on consent
form before blood collection for the serological test. A total of 3 ml of blood sample was collected in Ethylene diamine tetra acetic acid (EDTA) vial for blood grouping and total cell count. This vial was marked with individuals name and the unique donor identification number. After collection of blood, the samples were packed with in a thermocol boxes, with ice packs and these were analysed within 24 hours. Each blood samples were grouping manually by adding anti sera-A, B and D. frequency distribution, gene frequency was calculated. Hardy-Weinberg law was studied by using Chi-Square test.
3. Results
Table I: Phenotypic distribution of ABO blood group among the studied population
Ethnic group ABO blood group type frequency
Total Type A Type B Type O Type AB
Bhumij 46(24.6%) 55(29.4%) 62(33.2%) 24 (12.8) 187
The present study revealed that in the studied population, frequency of the blood group type O (Table I is highest (33.2%) followed by B (29.4%)
Table II: Phenotypic distribution of Rh blood group among the studied population.
Ethnic
group
Rh blood group type frequency
TotalRh Positive
Rh Negative
Bhumij 187(100%) 0(0.0%) 187
As shown in table II, there are no Rh Negative people found from the sample collected.
4. Distribution of ABO and Rh (D) allele frequency
Table III: showing the phenotype and allele frequency of ABO blood group
Ethnic
Group
Total (N)
Observed Phenotype Frequency Allele Frequency
Bhumij 187 A B AB O A (I ) B (I ) O (I
0.246 0.294 0.128 0.332 0.184 0.240 0.576
and A (24.6%) and the frequency of AB blood group is least (12.8%).
) A B o
ABO and Rh frequency distribution and gene frequency 39

Table IV: showing phenotype and allele frequency of Rh blood group
Ethnic
Group
Total (N) Observed Phenotype frequency
Allele Frequency
Bhumij 187 Rh Positive Rh Negative Rh Positive(D) Rh Negative(d)
1.0 0.0 1.0 0.0
The allele frequency was calculated using maximum likelihood method. Table III and IV shows the allele frequency of ABO and Rh blood group system respectively. The frequency of O
o Ballele (I ) is 0.576, frequency of B allele (I ) is 0.240 Aand A allele (I ) is 0.184. In case of Rh system, the
frequency of D allele was 1.0 and the recessive allele is 0.
Chi square test for goodness of fit between the observed and expected phenotypes was done to find if the frequencies observed follow hardy Weinberg equilibrium (Table V). In both the case of ABO blood group and Rh system the frequencies were not in Hardy Weinberg equilibrium, as the difference between observed and expected frequency was found to be statistically significant (p< 0.5).
Table V: showing genotype frequency, observed, expected frequency, Chi square value in both ABO and Rh blood group system
Ethnic
Group
Genotype Genotype
Frequency
Observed
Phenotype
Expected
Frequency
Chi -square
value (df)
Bhumij AA 0.034 A 0.246 A 0.246 P<0.05
AO 0.106
BB 0.058 B 0.294 B 0.335
BO 0.138
AB 0.044 AB 0.128 AB 0.088
OO 0.332 O 0.332 O 0.332
Rh+v e (DD)
1.0 Rh Positive 1.0 Rh Positive 1.0
P<0.05
Dd 0.0
Dd 0.0 Rh Negative 0.0 Rh
Negative
0.0
5. Discussion and Conclusion
It was observed in the present study that blood group O is the most frequent blood group among the population followed by B, A and AB. And all the samples comes under Rh +ve group. Precursor substance for ABO blood group is antigen H, present on the surface of membrane of red cells and most of the epithelial and endothelial cells. The A allele codes for an enzyme that adds an N-acetyl galactosamine to the H antigen. The B allele, which differs from the former by four amino acid changes,
codes for an enzyme that adds a D-galactose. The O allele occurs most frequently in modern humans and carries a human-specific inactivating mutation which produces a non-functional enzyme, and thus the H antigen remains without further modification on the surface of the cells (Narendrakumar, 2014) As ABO blood group system is of autosomal inheritance controlled by a single gene at chromosome 9q34 , the frequency of blood groups is not different in both sexes (Rudman, 2005), so we have not divided study group on the basis of male and female.
40
Man in Society ISSN 2347-1530Volume 23, 2016, pp. 38-44

Many studies have been done to investigate the ABO blood group frequency among Indian population. Agarwal A et al showed O blood group predominance from central part of India. Blood group A predominance has been shown by Naidu and Veeraju in Brahmin community, by Datta et al in Lodha tribes of West Bengal and by Vokendra and Devi among selective tribes of Arunachal Pradesh. This difference in distribution of blood groups
represents multi-ethnic and anthropologically different origins of population. Allele O was most common in present study followed by allele B and A. these findings are in concordance with Agarwal A et al (Agarwal, 2014). When data across the world is compared blood group distribution frequencies for A, B, O and AB blood group vary among different parts of the world (Table VI)
Table VI: Distribution of ABO phonotype in different parts of India and some other Countries.
Study A (%) B (%) O (%) AB (%)
Bhumij (Present study) 24.6 29.4 33.2 12.8
Chhattisgarh 22.17 35.42 33.55 8.17
Bangalore 23.85 29.95 39.81 6.37
Kashmir 22.95 32.05 38.43 6.55
Rajasthan 22.2 36.4 31.7 9.4
South India 25.74 27.86 39.76 6.64
North (Lucknow) 21.38 39.92 29.87 9.43
Uttarakhand 28.70 32.70 28.70 10.53
Western Ahmedabad 21.94 39.40 30.79 7.86
Eastern Ahmedabad 23.30 35.50 32.50 8.80
Maharashtra (Loni) 28.38 31.89 30.99 8.72
Neighbouring Countries
Bangl adesh 23.51 39.8 27.6 9.2
Pakistan 21.20 36.16 34.14 9.05
Nepal 34.00 29.00 32.50 4.00
Australia 38.00 10.00 49.00 3.00
Africa 24.60 20.70 50.30 4.50
Blood group B has its highest frequency in northern India and central Asia. Comparison of results of present study with that of some other populations is shown in Table VI. Blood group O is the most common phenotype globally with parts of Africa and Australia showing highest frequency. Blood group A is most common in northern and central Europe. Several theories have been proposed as reason for this difference in distribution and one of them is evolutionary selection based on pathogen driven blood group antigen changes (Storry, 2009). Balgir (2005) made a field study among scheduled tribes constituting a major chunk of the total
population of India. i.e., 15 tribes viz., Bathudi, Bhatra Bhumij, Bhuyan, Gond, Kharia, Kissan, Kolha, Kondh, Lodha, Munda, Oraon, Paraia, Santal and Saora. The ABO and Rh (D) blood groups distribution showed the high frequency of B over A blood group in 12 major scheduled tribes except Bhumij, Gond and Lodha. Pandey (2012) did studies among the different tribal groups of Jharkhand and found that In general blood group B is predominant. Rh negative frequency is the highest in Santhal. On the whole Bhumij showed the influence of large range of gene flow than that of others (Pandey et al. 2012).
ABO and Rh frequency distribution and gene frequency 41

Reference
Agrawal, A., Tiwari, A. K., Mehta, N., Bhattacharya, P., Wankhede, R., Tulsiani, S., Kamath, S. 2014. ABO and Rh (D) distribution and gene frequency; the first multicentre study in India. Asian Journal Transfusion Science, 8:121-5.
Bakare, A. A., Azeez, M. A., Agbolade, J. O. 2006. Gene frequencies of ABO and Rhesus blood groups and haemoglobin variants in Ogbomoso, south-west Nigeria. African Journal of Biotechnology, 5:224–229.
Behra, R., Joshi, Y.R. 2013. Distribution of ABO blood group and Rh (D) factor in western Rajasthan. National journal of medical research, 3:1: 73-75.
Chandra, T., Gupta, A. 2001. Frequency of ABO and Rhesus blood groups in blood donors. Asian Journal Transfusion sciences,6.1:52-53.
Das, P. K. , Nair, S. C., Harris, V. K., Rose, D., Mammen, J. J. ,Bose, Y. N., etal. 2001. Distribution of ABO and Rh D blood groups among blood donors in a tertiary care centre in South India. Tropical Doctor, 31: 47-48.
Datta, U. K., Mondal, S., Mukherjee, S. 1997. A study of the distribution of ABO and Rh (D) blood groups amongst Lodha tribe in Midnapore district of West Bengal. Journal of the Indian Medical Association, 95:497-8, 506.
Davey, W. W., Elebute, E. A. 1963. ABO blood groups in relation to duodenal ulceration among the Yorubas of Western Nigeria. Gut, 4:367.
Gadwalkar, S.R., Sunil Kumar N. and Ravidhar. 2013. Distribution of blood groups in and around Bellary, Karnataka. Indian journal of clinical practice, 24 (3):247-250.
Garg, P.Upadhyay, S.,Chufal, S. S.,Hasan, Y., Tayal, I. 2014.Prevalance of ABO and Rhesus Blood Groups in Blood Donors: A Study from a Tertiary Care Teaching Hospital of Kumaon Region of Ut ta rakhand . Journal o f Cl in ica l and DiagnosticResearch, 8(12): FC16–FC19.
Garratty, G. 2005. Relationship of blood groups to disease: do blood group antigens have a biological role? Revista Medica Del Instituto Mexicano Del SeguroSocial, 43:113–121.
Giri, P. A., Yadav, S., Parhar, G. S., Phalke, D. B. 2011. Frequency of ABO and Rhesus Blood Groups: A study from a rural tertiary care teaching hospital in India. International Journal of Biological and MedicalResearch,2(4):988– 90.
Giri, P. A., Yadav, S., Parhar, G. S., Phalke, D. B. 2011. Frequency of ABO and Rhesus Blood Groups: A study from a rural tertiary care teaching hospital in India. International Journal of Biological and Medical Research, 2(4):988–90.
Haloi, A. 2011. Genetic Characterization of the Biates of Saipung Village of Jaintia Hills District, Meghalaya Anthropologist. 13: 239-240.
Hammed, A., Hussain, W., Ahmed, J., Rabbi, F., Quersh, J. A. 2002. Prevalence of Phenotypes and Genes of ABO and Rhesus (Rh) blood groups in Faisalabad, Pakistan. PakistanJournal of Biological Sciences,5:722-724.
Handoo, S., Bala, S. S. 2014. Distribution of ABO and Rhesus Blood Groups in Kashmir Valley.International Journal of Scientific Research, 3(9): 233-35.
Jeremiah, Z. A. 2006. Abnormal haemoglobin variants, ABO and Rh blood groups among student of African descent in Port Harcount, Nigeria. African Health Sciences, 6:177–181.
Kostovski, M., Makarovska-Bojadzieva, T., Blagoevska, M. 2014. Blood group distribution of ABO antigens and rhesus blood group system in the Macedonian and Albanian population in the republic of Macedonia. International Journal of Biological and Medical Research, 5: 3988-3990.
Kumar, N., Kapoor, A., Kalwar, A. 2014. Allele Frequency of ABO Blood Group Antigen and the Risk of Oesophageal Cancer. BioMed Research International, 9.
Latoo, J. A.,Masoodi, N. A., Bhat, N. A., Khan, G. Q., Kadla, S, A.2006. The ABO and Rh blood groups in Kashmiri population .Indian journal for the practicing Doctor, 3.
Naidu, J. M., Veeraju, P. 1982. Blood groups among Brahmin and Kamma caste populations of coastal Andhra Pradesh. American Journal of physical anthropology, 58:197-9.
42
Man in Society ISSN 2347-1530Volume 23, 2016, pp. 38-44

Pandey, B. N., Jahangeer M D, Kumar D, Vatsal S and Verma D K (2013) Genetic structure and micro genetic differentiation among populations of Terai belt of Bihar, India.European Journal of Experimental Biology, 3 80-87.
Pandey, B. N., Kumari, R., Mishra, A., Jahangeer, K. D., Ojha, A. K. 2012. Genetic variation and micro-genetic differentiation among tribal populations of Jharkhand. India Scholarly Journal of Agricultural Science, 2, 2: 147-156.
Pandey, B. N., Kumari, R., Mishra, A., Jahangeer. K. D., Ojha, A. K. 2012. Genetic variation and micro-genetic differentiation among tribal populations of Jharkhand, India. Scholarly Journal of Agricultural Science, 2(8):147-156.
Patel, P. A, Patel. S. P., Shah, J. V, OzaHaren V. 2012. Frequency and distribution of blood groups in blood donors in western Ahmedabad – a hospital based study. National Journal of. Medical. Research, .2(2):207–210. 19.
Wadhwa, M. K., Patel, S. M., Kothari, D.C., Pandey, M., Patel, D. D. 1998. Distribution of ABO and Rhesus-D groups in Gujarat, India: a hospital based s t u d y . I n d i a n J o u r n a l o f m e d i c a l andPaediatricOncology, 19(4):137–41.
Pathania, I. 2011. The Serological Variation among Tribal and Non-Tribal population of Himachal Pradesh. Biological Forum Biological Forum- An International Journal, 3: 44- 47.
Periyavan, A., Sangeetha, S. K., Marimuthu, P., Manjunath, B. K. 2010. Distribution of ABO and Rhesus-D, groups in and around Bangalore. Asian Journal of Transfusion Science, 4: 41.
Periyavan, S., Sangeetha, S. K., Marimuthu, P., Manjunath, B. K., Seema, D. M. 2010. Distribution of ABO and Rhesus D blood groups in and around Bangalore. Asian Journal of transfusion sciences, 4:41.
Prakash, D. S. R. S., Varma, P. J., Reddy, S. G., Dasgupta, A. 2013. Genetic Variation of Blood Group Polymorphism among an Endogamous Human Population from Andhra Pradesh, India. International Journal of Scientific Study, 1, 1: 22-25.
Rai, V., Kumar, P. 2011. Genetic Analysis of ABO and Rh Blood Groups in Backward Caste Population of Uttar Pradesh.. India Not Sci Bio, 3: 7-14.
Rao, C., Shetty, J. 2014. Frequency of ABO and rhesus (D) blood groups in Dakshina Kannada district of Karnataka - A study from rural tertiary care teaching hospital in south India.NUJHS, 4: 57-60.
Rudman, S. V. 2005. The ABO and H blood group system. In text book of blood banking and transfusion medicine 2nd ed. Saunders publication, 73-74.
Sah, A. K.,Sahadalal, B. 2016. Frequency and distribution of blood groups in the donors of a rural hospitals, Barasat, 24 Parganas, West Bengal, India. International Journal of Pharma and Biological Sciences, 7: 414-418.
Shekhar, H., Kaur, A., Jadeja, P., Parihar, P. M., Mangukiya. K. K. 2014. Frequency and distribution of ABO blood group and Rh (D) factor in southern Rajasthan.International Journal of Science & Nature, 5: 494-497.
Shrivastava, S., Gahine, R.Kapse, V. 2015. ABO, rhesus blood group and allele frequency in and around Raipur (Chattisgarh state), India. International Journal of Contemporary Research and Review, 7: 52-58.
Soram, J. S., Panmei, K., Biswas, S. P. 2014. Distribution of ABO and Rh (D) blood group among the people of Mao naga Tribe of Mao, Senapati district of Manipur, North East India.International Journal of Development Research, 4: 184-187.
Storry, J. R., Olsson, M. L. 2009. The ABO blood group system revisited: a review and update. Immunohematology, 25(2):48–59.
Subhashini, A. B. 2007. Distribution of ABO and Rh (D) Blood Groups among Irulas a Tribal Population of Pondicherry. Indian Anthropologist, 9: 163-64.
Sukumaran, M. K., Padma, A. S., Vanitha, S., Rajani, D. Padma, S. 2016. Frequency of ABO and Rh Blood Groups among High School Children of Alwal, Secunderabad, Telangana. Indian Journal of dental and medical sciences, 15: 47-49.
ABO and Rh frequency distribution and gene frequency 43

Sultana, R., Rahman, Z., Helali,A. M., Yousuf,R., Mustafa, S., Salam, A. et al. 2013. Study of ABO and Rh-D blood groups among the common people of capital city of Bangladesh. International Journal of Pharmacy and Pharmaceutical Sciences,5.3: 814-16.
Vokendro,H., Devi. S. 2012. ABO Blood Group Frequency Distribution among the Tangsas of
Arunachal Pradesh, India. Antrocom Online Journal of Anthropology, 8 (2).
Zahra, G., Kouresh, S., Majid, Z., Seyed, M. S. 2014. Distribution of ABO and Rh blood groups in a major ethnic group of the West Iran, the Kurdish population. Asian Journal of Medical Science, 5: 26-29.
44
Man in Society ISSN 2347-1530Volume 23, 2016, pp. 38-44

Maternal and childhealth among the ethnic groups of Turunji village of Nabarangpur district, Odisha
1Subhalaxmi Baral2Dr. K.C. Satapathy
3Dr. P.K. Patra
1 2,3M. Phil Scholar, Associate Professor , Department of Anthropology, Utkal University, Bhubaneswar-751004, OdishaCorresponding author's e-mail: [email protected]
Abstract
This study explores the prevalence and factors associated with the utilization of maternal and child health care services among mothers in Turunji village of Nabarangpur district, Odisha. The present study covers a sample of 50 both tribal females such as Amanatya, Bhotra and Saora and other nontribal like Gouda, Christian and Harijan females of Turunji village of Nandahandi block of Nabarangpur district. . I had used different methods for data collection such as mapping, household numbering, participant observation and interview. I have interviewed those mothers whose youngest child is less than or equal to 6 years. So the age range of the participants varies. So the age range of the participants is not constant. The paper attempts to analyze various factors such as age at
stmenarche, age at 1 conception, food preferences and taboos during or after delivery, types of delivery, place of delivery, TT immunisation of the mother and vaccination of the child.
Key words: Maternal and child health services, tribals and non tribals, Odisha.
1. Introduction
Promotion of maternal and child health has been one of the important objectives of the India's Family Welfare Programme since its inception. It is still an important component of RCH programme which seeks to integrate maternal and child health and fertility regulation interventions with reproductive health programmes. Studies suggest better pregnancy outcomes for women who receive antenatal care: they are less likely to die of maternal causes, experience stillbirth or perinatal mortality, or give birth to low birth weight babies (Bhatia 1993; Jejeebhoy 2000).
Worldwide each year, over 500,000 women and girls die of complications related to pregnancy and childbirth. Additionally, another 138,000 to 207,000 Nepalese women and girls suffer from disabilities caused by complications during pregnancy and childbirth each year, (the Maternal Health Study, 2006)..The United Nations population Fund (UNFPA) estimated that 2.89,000 women died of pregnancy or child birth related causes, 2013. The
mother's death occurs in vulnerable families and vulnerable infants. Even if they are able to survive somehow, are more likely to die before their second birth date. While in1990, worldwide, 12.7 million children under age five died; in 2013 this number fell to 6.3 million children (UNICEF, 2015). Due to growing awareness for family planning, skilled birth attendance and emergency obstetric care, the global maternal mortality ratio (MMR) has fallen from 380 maternal deaths per 1,00,000 live births in 1990 to 210 in 2013.
Maternal health forms a very important part of the general reproductive health of women in India. In a developing country like India, poverty, illiteracy and multiple pregnancies take their toll of mother's health and that of the infant. In India, considerable attention has been paid to estimates of 27 maternal mortality, but the issue of adolescent's pregnancies which require paramount attention has been neglected (Sahoo.,2011). The scheduled tribe (ST) population is 104.2 million, which is 8.6 percent of the total population of India (Census 2011). Madhya
45
Man in Society ISSN 2347-1530Volume 23, 2016, pp. 45-55

Pradesh, Maharashtra, Orissa, Gujarat, Rajasthan, Jharkhand, Chhattisgarh, Andhra Pradesh, West Bengal, and Karnataka are the states having a large number of ST populations. Like other social groups, the tribal women face problems related to reproductive health. Tribal mothers have incidence of anaemia, and girl child gets less than the required nutritional intake (Maiti, Unisa and Agrawal, 2005). The infant mortality rate among the ST children is 62.1 which is 57 for the other social groups. The child mortality rate among the tribes is 35.8 which is much higher than the other social groups i.e. 18.4 percent. There is a need for proper understanding of health aspects of tribal women and their specific health needs so that relevant health measures can be prepared and implemented. The present study aims to determine the health status of the mother and children of tribal and nontribal populations. In order to reduce the maternal and child mortality as well as morbidity, the domain of maternal and child health becomes very important.
The key aspects considered for the purposes are as under:
1. To study the age at menarche, regular or irregular type of menstrual cycle, age at
stmarriage. And age at 1 conception etc.
2. To study maternal health during pregnancy.
3. To find out the antenatal and postnatal care giving practices.
4. To know about .place of delivery and type of delivery.
5. To s tudy about the post natal complication and the immunization status of the child.
2. Area and people
Selection of the area is very important for research. Fieldwork for this research was carried out in Turunji village and its three hamlets namely; Naikguda and Domnaikguda under Dhondra panchayat of Nandahandi block of Nabarangpur district,Odisha. The fieldwork was conducted among the tribals and nontribal populations of this village. We choose this village because we want to do fieldwork in an interior area.
On 2nd October, 1992 Nabarangpur now spelled as Nabarangpur came into being as a separate district of Odisha State. It was one of the subdivisions of Koraput district having her headquarters at Nabarangpur town now functioning as district headquarters. The area of the district is 5294 Sq. km. Its boundary stretches in the north to Nuapada and Kalahandi Districts, west to Bastar District in Chhattisgarh, east to Kalahandi and Rayagada Districts and south to Koraput District. The Nabarangpur district is located at 810 52' to 820 53' E Longitude and 190 9' to 200 5' N Latitude and stretches over an area of approximately 5294 Sq. Kms.
Ethnography of Turunji village
As discussed earlier, the ethnographic fieldwork was carried out in three hamlets of Turunji village n a m e l y ; B a d a g a o n , N a y a k g u d a a n d Domnayakguda. These three hamlets comprises of multi-ethnic groups that include scheduled tribes (Amanatya, Bhotra and Soura), caste groups (Gouda and Bindhani) and religious group (Christian).
Omanatya/ Amanatya
Omanatya are Odia speaking cultivating tribal people who live in the north of Jeypore and south of Nabarangpur. Omanatya are divided into two sections i.e. Bodo and Sano. Intermarriage between Bada and Sana is generally not preferred. Mostly used surnames among the Amanatya tribe are Amanatya, Pujari and Randhari. According to the local people there are around 100 Amanatya families in Turunji village who have been increased from a meagre 4 families; related brothers who started living here for many generations.
Bhottoda / Bhotra/ Bhattra
Bhotra synonymous with Bhottada or Bhattra are predominantly found in all blocks of Nabarangpur district except Raigarh and Chandahandi. Out of 4.51lakh populations in the state 3.25 Bhatrapopulation, live in Nabarangpur district as per 2011 census. The Bhotras are one of the numerically major agricultural tribe of the district. They speak Bhatri, a nonliteracy dialect among themselves. They speak a corrupt form of Odiya language known as Desia. There are 3 types of Bhattras namely; Bada, Majhia and Sana Bhattras.The most popular and common surnames
Maternal and childhealth among the ethnic 46

among them are MajhiBhottra, Nayak and Disari. Endogamy is not practiced among them.
Saora / Saura
The Saoras also called Savaras constitute a major tribe in the State of Odisha. The Saoras are very famous for their wall paintings known as ikons, which are of religious significance.
Table I Ethnic group wise distribution of households.
Sl.
No.
Name of the community/ ethnic group
Number of
Households
Number of
individuals
1 Amanatya 56 269
2 Bhotra 78 400
3 Saora 24 113
4 Gauda 68 310
5 Christians 33 160
6 Others 6 36
Total 262 1288
3. Methodology
The present study is based on both primary and secondary sources of data collection. Primary data was collected using anthropological fieldwork technique during 20 days from February 8 to February 28. Eight students of our specialization were involved in data collection. First we filled the census form and then collected our own data individually. We use a standard questionnaire for census data collection which includes age, sex, clan, and marital status, types of marriage, education, occupation, income and expenditure of the total members of the family. We also collected data about their demographic data and socio-economic data. Then I collected information about my own topic “maternal and child health” using a questionnaire
stwhich includes mean age at marriage,menarche,1 conception and body weight of the mother, antennal and post natal care, delivery practice, immunisation status of mother and child. The data was collected by using different methods like scheduled questionnaire, interview and observation etc. Rapport establishment with the villagers is very necessary in fieldwork. Correct age calculation of the subject is very important, As they are basically illiterate and they donot say about their accurate age.
So I used some indirect methods for calculating the age like use of some land marks of the village. I also used participant observation and case study method during my data collection. After completion of our fieldwork. we entered the data into an excel sheet. Then the data was analysed through SPSS(16.0) and were compared through secondary data. The data for this topic “Maternal and child health” was collected from women's of Badagaon,Nayakguda and Damanayakguda hamlet of Turunji village Nabarangpur district. The present study covers 50 households.10 students have participated in data collection.
4. Results and discussion
Table II Distribution of population according to mean age at menarche among the ethnic groups of Turunji village, Nabarangpur
Ethnic groups
Number
Mean age at menarche
Std. Deviation
Amanatya 15 12.27 1.033
Bhotra 15 12.47 1.060
Saora 6 13.17 .753
Gouda 8 12.75 1.165
Harijan 1 14.00 .
Christian 5 12.00 1.000
Total 50 12.52 1.054
Table II represents that the mean age at menarche among the ethnic groups of Turunji village is 12.52. The time of first menstruation is called Menarche. An enumeration of average age at menarche of girls of 24 countries gives the range as 10-18 years, sterility rate is relatively low in women of low menarchial age which increases with the increase in menarchial age, age of mother at birth, season, month of birth, diet, family size and adult body size are the factors determining the age at menarche. In the present study in the Turunji village of Nabarangapur district, Odisha it was observed that the average age at menarche of the ethnic groups is 12.52. (Table 2). The occurrence of menarche is highest between 13-15 age groups. The table 4.2 shows that the mean age at menarche in Amanatya is 12.27,Bhotra is 12.47,in Saora is 13.17,in Gouda is 12.75,in Harijan is 14 and in Christian it is 12.
47
Man in Society ISSN 2347-1530Volume 23, 2016, pp. 45-55

Celebration and restrictions at the time of first attainment of puberty is seen in rural and urban as well as in tribal areas. In the present study celebration at puberty is seen among the ethnic
Mean age at menarche in different states in India
Age in years
Source
Delhi 13.3 Rokade and Mane,2008
Kolkata 12.3 Rokade and Mane,2008
Odisha 15.2 ICMR bulletin,Oct 2003
Hariyana 13.1 Mittel and Goel,2010
Amanatya 12.27 Present study
Bhotra 12.47 Present study
Saora 13.17 Present study
Table III shows the comparison among different states of India with the studied present population. It is observed that the mean age at menarche among
Table IV Distribution of population of Turunji village according to nature of Menstrual Cycle in beginning
Nature Of Menstrual Cycle Beginning
Ethnic groups Total
Amanatya
N(%)
Bhotra N(%)
Saora N(%)
Gouda N(%)
Harijan N(%)
Christian N(%)
Regular 13(26.0) 13(26.0) 6(12.0) 7(14.0) 1(2.0) 5(10.0) 45(90.0)
Irregular 2(4.0) 2(4.0) 0(0.0) 1(2.0) 0(0.0) 0(0.0) 5(10.0)
Total
15(30.0) 15(30.0) 6(12.0) 8(16.0) 1(2.0) 5(10.0) 50(100.0)
The nature of menstruation is categorised into five types. These are, regular, irregular, lactate, pregnant and amenorrhea. Most of the women have regular type of menstruation cycle. Irregular type of cycle is
groups of Turunji village. Mostly it is celebrated in the tribes for 7 days or 9 days. They have some restrictions in food items and they prefer certain foods.
Table III Mean age at menarche among the women of different states in India and that of the tribal communities under study
the studied population is lower as compared to the other states of India. So among the studied population early onset of menarche is observed.
also seen in these communities. The table 3 shows the nature of menstrual cycle in the It is observed that 90% female have regularity in menstrual cycle.
Table V Distribution of ethnic groups of Turunji village according to age at marriage
Age group Amanatya
N (%) Bhotra
N (%)
SaoraN (%)
GoudaN (%)
HarijanN (%)
ChristianN (%)
Total
11 -15 8 (16.0) 6(12.0) 1(2.0) 3(6.0) 0(0.0) 2(4.0) 20(40.0)
16 -20 7(14.0) 9(18.0) 5(10.0) 4(8.0) 1(2.0) 2(4.0) 28(56.0)
21 -25 0(0.0) 0(0.0) 0(0.0) 1(2.0) 0(0.0) 0(0.0) 1(2 .0)
26 -30 0(0.0) 0(0.0) 0(0.0) 0(0.0) 0(0.0) 1(2.0) 1(2.0)
Total 15(30.0)
15(30.0)
6(12.0)
8(16.0)
1(2.0)
5 (10.0)
50(100.0)
Maternal and childhealth among the ethnic 48

stTable VII Mean age at 1 marriage among the women's of different states in India.
Mean age at 1st marriage in different states in India
Age in years Source
Tamilnadu 22.4 WHO and Ministry of Health and Family Welfare in India- 2011
Kerala 22.7 WHO and Ministry of Health and Family Welfare in India- 2011
Delhi 22.4 WHO and Ministry of Health and Family Welfare in India - 2011
Rajasthan 19.8 WHO and Ministry of Health and Family Welfare in India -2011
Turunji village of Nabarangpur district, Orissa
16.34 Present study
The age at which the girls are given in marriage depend on social values. Girls in tribal societies are given in marriage general after puberty. There are a few micro level studies, which deal with the age at marriage of individual tribe,e.g, female age at marriage AO Naga(16-20years), Bhil(16 years),
Khasi(13-18 years), Munda(18 years), Gond (18 years),Chenchu after puberty.As per NFHS-3(National Family Health Survey) about 17.0 % of the females in the age group 15-19 years were married.. The table 6 shows the age at marriage of different states of India and the present study.
stTable VII Distribution of ethnic groups according to mean age at 1 conception.
Ethnic groups Number Mean age at 1st conception
Std. Deviation
Amanatya 15 17.93 5.007
Bhotra 15 16.93 1.751
Saora 6 16.83 1.169
Gouda 8 19.13 4.190
Harijan 1 18.00 .
Christian 5 19.80 6.140
Total 50 17.88 3.847
Table VII presents the distribution of population staccording to mean age at 1 conception. In the
stpresent study it is found that the mean age at 1 conception is 17.88.It is highest in Christian which is 19.80 and in Saora tribe it is lowest which is 16.83.However in Bhotra it is 16.93,in Amanatya it
is 17.93,in Gouda it is 19.13 and in Harijan it is 19.80.The result is significant. For better results it needs more time and more investigation. The result is significant. For better results it needs more time and more investigation.
49
Man in Society ISSN 2347-1530Volume 23, 2016, pp. 45-55

Table VIII Distribution of population according to the intake of Iron and Folic acid tablets
Iron and folic acid tablets
Ethnic groupsTotal
Amanatya
N (%)BhotraN (%)
SaoraN (%)
GoudaN (%)
Harijan N (%)
Christian N (%)
Yes 14(28.0) 15(30.0) 6(12.0) 8(16.0) 1(2.0) 5(10.0) 49(98.0)
No 1(2.0) 0(0.0) 0(0.0) 0(0.0) 0(0.0) 0(0.0) 1(2.0)
Total 15(30.0) 15(30.0) 6(12.0) 8(16.0) 1(2.0) 5(10.0) 50(100.0)
This table VIII shows that 98% people take Iron and Folic acid tablets
Table IX Distribution of ethnic groups according to the types of antenatal check-up preferred
Ethnic Groups
Types Of Antenatal Check- Up (Government Hospital)
Total
Amanatya N (%)
15(30.0)
15(30.0)
Bhotra N (%)
15(30.0) 15(30.0)
Saora N (%) 6(12.0) 6(12.0)
Gouda N (%)
8(16.0) 8(16.0)
Harijan N (%)
1(2.0) 1(2.0)
Christian N (%) 5(10.0) 5(10.0)
Total 50(100.0) 50(100.0)
Table IX represents the distribution of ethnic groups according to the types of antenatal check-up preferred. This table shows that all the people prefer government hospitals rather than private hospitals.
Ethnic groups
Types Of Food Taken During Pregnancy
TotalTraditional N (%)
Traditional And Medical N (%)
Amanatya 8(16.0) 7(14.0) 15(30.0)
Bhotra 10(20.0) 5(10.0) 15(30.0)
Saora 5(10.0) 1(2.0) 6(12.0)
Gouda 5(10.0) 3(6.0) 8(16.0)
Harijan 1(2.0) 0(0.0) 1(2.0)
Christian 2(4.0) 3(6.0) 5(10.0)
Total 31(62.0) 19(38.0) 50(100.0)
Table X Distribution of population according to the types of food taken during pregnancy
Maternal and childhealth among the ethnic 50

The table X represents the special food items taken by the women's of ethnic groups of Turunji village of Nabarangpur district,Odisha during pregnancy. It is observed that 52% people prefer traditional practice of food habit and 38% people prefer both traditional practice of foods and the foods prescribed by doctor or any healthcare practitioner during pregnancy.
Table XI Distribution of population according to the types of food taken after delivery
Ethnic groups
Traditional N (%)
Traditional And Medical N (%)
Total
Amanatya 13 (26.0) 2 (4.0) 15 (30.0)
Bhotra 11 (22.0) 4 (8.0) 15 (30.0)
Saora 4 (8.0) 2 (4.0) 6 (12.0)
Gouda 6 (12.0) 2 (4.0) 8 (16.0)
Harijan 1 (2.0) 0 (0.0) 1 (2.0)
Christian 3 (6.0) 2 (4.0) (10.0)
Total N(%) 38 (76.0)
12 (24.0)
5 (100.0)
Types Of Food Avoided During Pregnancy
Ethnic GroupsTotal
Amanatya N (%)
Bhotra N (%)
SaoraN (%)
GoudaN (%)
HarijanN (%)
ChristianN (%)
None 14 (28.0) 15 (30.0) 5 (10.0) 8 (16.0) 1 (2.0) 4 (8.0) 47 (94.0)
Traditional 1(2.0) 0 (0.0) 1 (2.0) 0 (0.0) 0 (0.0) 1 (2.0) 3 (6.0)
Total 15 (30.0) 15 (30.0) 6 (12.0) 8 (16.0) 1 (2.0) 5 (10.0) 50 (100.0)
The table XI shows that 76% people prefer traditional practice of food items taken after delivery. Only 24% people prefer both traditional food and the food prescribed by the doctor or any medical practitioner. Traditionally the special food items taken by them include “Biribadhi, Masurdali and kandul”
Table XII Distribution of population according to the Types of food avoided during pregnancy
Table XII represents the special types of food items avoided by the women's of ethnic groups of Turunji village of Nabarangpur district, Odisha during pregnancy. It is observed that 94% women have no restrictions in food items during pregnancy.
Table XIII type of food avoided after pregnancy
6 (12.0)
Types Of Food Avoided During Pregnancy
Ethnic Groups Total
Amanatya N (%)
Bhotra N (%)
SaoraN (%)
GoudaN (%)
HarijanN (%)
ChristianN (%)
15 (30.0) 15 (30.0) 8 (16.0) 1(2.0)Traditional
Total 15 (30.0) 15 (30.0) 6 (12.0) 8 (16.0) 1(2.0) 5 (10.0) 50 (100.0)
5 (10.0) 50 (100.0)
51
Man in Society ISSN 2347-1530Volume 23, 2016, pp. 45-55

The table XIII implies the type of food avoided after pregnancy. It shows that all the 100% people avoided certain food items after pregnancy. They don't eat Amla, potato, tomato, chilli foods, fish etc. They believe that if they these foods they suffer from diseases like digestion problem and stomach pain.
Ethnic groups Number
Mean
Std. Deviation
Amanatya 15 46.73 6.584
Bhotra 15 47.60 4.437
Saora 6 46.50 4.370
Gouda 8 47.62 3.623
Harijan 1 52.00 .
Christian 5 46.20 3.033
Total 50 47.16 4.833
The above table shows the mean body weight during the last trimester of pregnancy in all the population is 47.16.
Anycomplication during delivery
Ethnic groups TotalN (%)
AmanatyaN (%)
Bhotra N (%)
SaoraN (%)
GoudaN (%)
HarijanN (%)
ChristianN (%)
Yes 10(20.0) 13(26.0) 5(10.0) 6(12.0) 1(2.0) 2(4.0) 37(74.0)
No 5(10.0) 2(4.0) 1(2.0) 2(4.0) 0(0.0) 3(6.0) 13(26.0)
Total N (%) 15(30.0) 15(30.0) 6(12.0) 8(16.0) 1(2.0) 5(10.0) 50(100.0)
The table XV presents the complications during delivery of the women's of ethnic groups of Turunji village of Nabarangpur district, Odisha.The table reveals that 74% women have complications during fieldwork and 26% women have no complications
Ethnic groups Types of delivery Sources
Vaginal (%)
Caesarean (%)
Ethnic groups of Turunji
92 4 Present study
100 0 Unpublished P.G dissertation(Y.Puja,20 16)
Pano 97.3 2.7 Unpublished P.G dissertation(Y.Puja,20 16)
Munda
Table XIV Distribution of ethnic groups according to the mean body weight during last trimester of pregnancy
Table XV Distribution of ethnic groups according to the complication during delivery
Table XVI A comparative status of the types of delivery occur in different ethnic groups of Odisha
during pregnancy. These complications include headache, vomiting and stomach pain etc. The result is significant. For better results it needs more time and more investigation.
Maternal and childhealth among the ethnic 52

The table XVI explains that in Munda tribes all the deliveries are normal and in Pano 97.3% is normal delivery. .In turunji village 92% deliveries are normal and only 4% caesarean cases are found. The
Types of delivery
Ethnic groups
AmanatyaN (%)
BhotraN (%)
SaoraN (%)
GoudaN (%)
HarijanN (%)
ChristianN (%)
Total
not available 1(2.0) 0(0.0) 0(0.0) 1(2.0) 0(0.0) 0(0.0) 2(4.0)
Vaginal 14(28.0) 15(30.0) 6(12.0) 7(14.0) (0.0) 4(8.0) 46(92.0)
Caesarean 0(0.0)
0(0.0) 0(0.0) 0(0.0) 1(2.0) 1(2.0) 2(4.0)
Total 15(30.0) 15(30.0) 6(12.0) 8(16.0) 1(2.0) 5(10.0) 50(100.0)
The table XVII presents the types of delivery done by the ethnic groups of Turunji village of
Ethnic groups TT immunisation Source
Yes (%) No (%)
Ethnic groups of Turunji village
100 0 Present study
Munda (Mayurbhanj)
93.33 6.67 Supriya Sahoo,2015
Mahanta (Mayurbhanj) 80.56 19.35 Supriya Sahoo,2015
Sabar (Mayurbhanj) 84.00 16.00 Supriya Sahoo,2015
The above table XVIII shows the TT immunisation of mother during pregnancy. It is observed that in turunji village, all the mothers take TT immunisation. However in Munda it is 93.33%, in
TT immunisation of the mother Amanatya
N(%)
BhotraN(%)
SaoraN(%)
GoudaN(%)
HarijanN(%)
ChristianN(%)
Total N(%)
Yes 15(30.0) 15(30.0) 6(12.0) 8(16.0) 1(2.0) 5(10.0) 50(100.0)
No 0(0.0) 0(0.0) 0(0.0) 0(0.0) 0(0.0) 0(0.0) 0(0.0)
Total 15(30.0) 15(30.0) 6(12.0) 8(16.0) 1(2.0) 5(10.0) 50(100.0)
The table XIX shows the immunisation status of mothers of Turunji village of Nabarangpur district during pregnancy. It is observed that in turunji village all the mothers take TT immunisation.
Table XVII The types of delivery done by the ethnic groups of Turunji village.
ethnic groups of Turunji village include tribes like Amanatya,Bhotra and Saora and nontribal like Gouda, Christian and Harijan communities.
Nabarangpur district. The table shows that 92% of the total deliveries are vaginal and only 4% cases are caesarean.
Table XVIII A comparative study of different ethnic groups of Turunji village with other tribes of Odisha on the basis of TT immunisation of mother
Table XIX Distribution of ethnic groups according to TT immunisation status of mother
Mahant it is 80.56% and in Sabar it is 84.00.The result is significant. For better result it needs more time and further investigation.
However in Munda it is 93.33%, in Mahant it is 80.56% and in Sabar it is 84.00.The result is significant. For better result it needs more time and further investigation.
53
Man in Society ISSN 2347-1530Volume 23, 2016, pp. 45-55

BREAST FEEDING OF THE CHILD AFTER BIRTH
TRIBE/ CASTE
YES N(%) NO N(%) Not available N(%) TOTAL N(%)
Amanatya N(%)
13 (26.0)
1 (2.0)
1 (2.0)
15 (30.0)
Bhotra N(%) 15 (30.0) 0 (0.0) 0 (0.0) 15 (30.0)
Saora N(%) 4 (8.0) 2 (4.0) 0 (0.0) 6 (12.0)
Gouda N(%) 7 (14.0) 0 (0.0) 1 (2.0) 8 (16.0)
Harijan 1 (2.0) 0 (0.0) 0 (0.0) 1 (2.0)
Christian N(%) 5 (10.0) 0 (0.0) 0 (0.0) 5 (10.00)
TOTAL N(%) 45 (90.0) 3 (6.0) 2 (4.0) 50 (100.0)
The above table shows that 90% children take breastfeeding after birth. Breastfeeding practices have significant effects on child survival and health as well as maternal fertility. It improves the nutritional status of children and reduces morbidity
Ethnic groups
Post natal complication of child
AmanatyaN (%)
Bhotra N(%)
SaoraN (%)
GoudaN (%)
HarijanN (%)
ChN (%)
ristian
TotalN (%)
Yes 6(12.0) 11(22.0) 1(2.0) 4(8.0) 0(0.0) 1(2.0) 23(46.0)
No 8(16.0) 4(8.0) 5(10.0) 3(6.0) 1(2.0) 3(6.0) 24(48.0)
NA 1(2.0) 0(0.0) 0(0.0) 1(2.0) 0(0.0) 1(2.0) 3(6.0)
Total 15(30.0) 15(30.0) 6(12.0) 8(16.0) 1(2.0) 5(10.0) 50(10 0.0)
The above table 3.21 shows that 46% children have postnatal complications, 48% children have no complications after birth and 6% mother did not say about the postnatal complication of their children.
5. Conclusion
Maternal health is the health of women during pregnancy, childbirth, and the postpartum period”. It encompasses the healthcare dimensions of family planning, preconception, prenatal, and postnatal care in order to ensure a positive and fulfilling experience in most cases and reduce maternal morbidity and mortality in other cases. Scheduled tribes have been known for their high poverty, lack
of education and low socio economic condition etc. In India, maternal knowledge of child health can be improved by an effective social support network, which includes female and high-educated people, and healthcare providers. Therefore, policymakers should promote mothers' social support networks. The basic findings of the present study:
It is observed that the females of Turunji village marry at very early age. I found that the mean age at marriage is 16.34year which is very earlier than the age at marriage of Odisha and India. As the mean
stage at marriage is earlier so the age at 1 conception is also earlier which is 17.88.
Table XX Distribution of ethnic groups according to breastfeeding of the child after birth
and mortality. The duration and frequency of breastfeeding have effects on the duration of postpartum amenorrhoea, birth intervals and hence fertility (NFHS-1, 1992-93).
Table XXI Distribution of ethnic groups according to the postnatal complication of the child
Maternal and childhealth among the ethnic 54

• I observed that the females of the Turunji village are more illiterate and they have no idea about their age an age at menarche.The mean age at menarche is 12.52 year in this village.
• Basically the mother prefers the traditional foods during or after pregnancy. After delivery they specially eat “masuradali,kandul, biribadhi”.They have also restrictions in food habit after delivery. They donot eat Amla,potato,tomato,chilli foods, fish etc.
• The people of Turunji village have also sttraditional belief system. They 1 go to the local
traditional healer (Disari) during pregnancy.
• They have no much more pain during or after delivery. The general problems occur during pregnancy are vomiting, headache, sometimes stomach pain and weakness.
• The NFHS -3 and the DLHS-3 reports reveals that the proportion of delivery without any ANC in India was 22.8% among non-tribal women and whereas it was as much higher as 37.8% among tribal women. It is further estimated that 49% of all the non-tribal deliveries and 82.3% tribal deliveries were at home.
The present study shows mostly normal delivery and one caesarean case found because they do very hard work. The medical report shows that all the deliveries are done at hospital. But in reality it is found that in some cases the deliveries done at home and after delivery they go to the hospital without cutting the umbilical cord of the baby for getting money from the government. The result is significant. For better results it needs more time and more investigation.
References
Annual health survey (AHS),2010-2011.Odisha fact sheet
Census of India 2001, Ministry of Home Affairs, Government of India.
Census of Odisha 2011, National fact sheet, Government of India (?)
Mittel,K. and Goel, M.K.(2010),Knowledge regarding reproductive Health among Urban Adolescent girls of Hariyana.India J Community Med, 55(4),529-530
WHO and Ministry of health and Family Welfare in INDIA,2011 Report
Rokade, S. and Mane, A.(2008).A Study of Age at Menarche, The Secular Trend and Factors Associated with it. The internet journal of Biological Anthropology.
WHO and Ministry of Health and Family welfare in India, 2011 Report.
Y.Puja, P.G thesis On Demographic study
Lucky Singh, Rajesh kumar Rai ,Prashant kumar Singh. Accessing the utilisation of maternal and child health care among married adolescent women;Evidence from India
Basu S. K., Jindal A., Kshatriya G. (1994). Perception of Health and Pattern of Health Seeking Behviour among Selected Tribal Population Groups of Madhya Pradesh, in S. Basu, eds. Tribal Health in India. Delhi: Mayank Publication Pvt. Ltd
UNICEF,STATISTICS(Retrived on june 14,2015)1 2Ranjan Kumar Prusty , Sayeed Unisa . Effect of
social support networks on maternal knowledge of child health in rural Odisha, India: Journal of Health and Social Sciences 2017; 2,1:99-118
Prusty RK, Unisa S. Modern and traditional care practices to childhood Morbidities in rural Odisha,
Dr. K Gangadharan Professor and Head Department of Applied Economics Kannur University, Thalassery campus, Palayad. Maternal and child health among tribals in kerala: strategies for rational deployment of health infrastructure and health manpower: (Project Report Submitted to the Indian Council of Medical Research in connection w i t h t h e A d - h o c R e s e a r c h P r o j e c t Adhoc/26/2012/HSR dated 15/06/2012)
UNFPA 2013. www.unfpa.org/maternalhealth (retrieved on Nov 13, 2016).
55
Man in Society ISSN 2347-1530Volume 23, 2016, pp. 45-55

Association study of alcohol consumption with perceived stress among Munda and Pana communities of Jajpur district, Odisha
1Sushree Lipsa Mohanty2Arundhuti Das
3Prasanna Kumar Patra 4Kanhu Charan Satapathy
1 2 3,4Ph.D. Scholar , Post-Doctoral Scholar , Associate Professor Department of Anthropology, Utkal University, BhubaneswarCorresponding author, E-mail: [email protected]
Abstract
Addiction to alcohol is harmful not only for individual but also for the family and the society at large. Alcoholism is a complex problem determined by multiple factors, including psychological components. The present study was conducted on Munda and Pana communities in Sukinda block of Jajpur district, Odisha to find perceived stress among alcohol dependents and non-dependents. The analyses show the respondents dependent on alcohol scored high on stress.
Key words: Alcohol consumption, Perceived stress, Munda, Pana.
1. Introduction
Throughout the world among all beverages, rice beer is an essential part of life of several aboriginal communities (Panda et.al., 2014). In India, rice beer commonly made by the indigenous people in Bihar, Jharkhand, Odisha, Mandhya Pradesh and Chhattishgarh states (Kumar, 2006). In Odisha, since long, preparation of both fermented and distilled beverages have been made by fermenting different varieties of rice. All over the state different tribal communities primarily prepared these kinds of beverages.
The term "stress" often is used to describe the subjective feeling of pressure or tension (NIH, April 1996). Stress is a physiological response to demanding external stimuli that can result in feelings of danger and anxiety and could be defined as a risk factor for individual harm (Park et.al., 1999). The response to stress is often accompanied by risky behaviours, such as smoking, alcohol consumption, and overeating (Torres et.al., 2007).
In a survey with 1,000 samples in South Korea, subjects with extremely high stress were found to have 3 times more seriously alcohol dependence than those with high stress, and subjects with higher
levels of stress demonstrated greater consumption of alcohol (Ko et.al., 2011). Moderate consumption of alcohol is a common means to relieve stress; however, these behaviours may result in increased consumption of alcohol if the perceived stress becomes even greater (Lee et.al., 2011).
The association of alcohol consumption and stress has been studied among various populations in India. Among military personnel deployed in North East Region of India indicates that those who intake alcohol specifically to reduce stress reported significantly higher stress level than those who do not consumes alcohol (Nagle et.al., 2009).
Among Indian IT professionals the individuals who were professionally stressed were found to have 5.9 times higher prevalence of harmful alcohol use compared to those who were not professionally stressed (Darshan et.al., 2013).
However, no such study, has been reported from Odisha. Therefore, the present study was undertaken to investigate the association of stress and intake of alcohol among the Munda (scheduled tribe) and the Pana (scheduled caste) communities in Sukinda block of Jajpur district, Odisha.
56
Man in Society ISSN 2347-1530Volume 23, 2016, pp. 56-59

In the last two decades Sukinda block has grown as a planed Industrial area. It has affected the lifestyles of both Munda and Pana communities inhabited there. The main occupation of the Munda community is daily wage labor either in the agriculture field given to them by their land lord or most of the days they do daily labor work in the industry. Both male and female do the labour work. The amount of land owned by most of the families is not sufficient to meet all their requirements. Some particular women in the village sell Handia (the rice beer which is prepared from fermented rice) or Rassi (a special upper part of handia). On the other hand pana which is a sc community has the traditional occupation of agriculture. Mostly men are engaged in the agriculture which is based on rice cultivation and women work at their home. A large number of Munda and Pana families are declared as family living below poverty line with very low socio-economic status.
2. Methodology
The present study was conducted in Sukinda block of Jajpur district, Odisha. It was done during the period of January 2016 to March 2016. Total sample of 170 individuals from two groups, one is a tribal community, Munda (n=80) and another one is schedule caste group, Pana (n=90). Subjects of both male (n=96) and female (n=74) above the age of 18 were considered for the present study. Both qualitative and quantitative data were collected for the present study. Socio cultural question related to alcohol consumption was collected through personal interviews. Following standardized questionnaires related to alcohol consumption and perceived stress were used.
1. Alcohol Use Disorders Identification Test (AUDIT) for alcohol consumption.
2. Perceived Stress Scale (PSS) by Cohen et al, 1983 for perceived stress.
AUDIT was developed by World Health Organization (2001) as a simple method of screening for excessive drinking. The Perceived Stress Scale was developed to measure the degree to which situations in individual's life as stressful (Cohen et.al., 1983).
Psychological tests and genotype data were analyzed using SPSS 20.0 for windows .The basic
statistical tests involved with reference to psychological questionnaire involve were mean ,standard deviation, test of significance such Chi-square test, and one way ANOVA .
3. Results
Perceived stress is the feelings that an individual has about how much stress they are under at a given time period. The extent of stress in the individuals were accessed using psychological questionnaire called the perceive stress scale (PSS).
Table 1 comparison of PSS scores between alcohol dependents and non-dependents in both the communities.
PSS(Mean Score± Standard Deviation)Both communities together
AUDIT PSS
Dependence (69) 19.54±5.78
Nondependence (101) 17.07±6.94
DF=1,168, F value=5.910, p value= 0.016
Out of total 170 subjects from both the communities 69 were found to be alcohol dependent. The mean score in individuals dependents on alcohol is 19.54 for PSS and individuals with alcohol non-dependence score is 17.07 for PSS respectively. The differences in the mean value scores of stress were statistically significant between alcohol dependents and non dependents of both the community.
Table 2 comparison of PSS scores between alcohol dependents and non-dependents in Pana community.
PSS(Mean Score± Standard Deviation) Pana
AUDIT PSS
Dependence(19) 17.21±4.52
Nondependence(71) 18.80±5.21
DF=1,88, F value=1.470, P value=0.229
The mean score in individuals dependents on alcohol is 17.21 for PSS and individuals with alcohol non-dependence score is 18.80 for PSS respectively. However the difference in the mean value scores of stress was not found to be statistically significant between alcohol dependents and nondependents of Pana community.
Association study of alcohol consumption with perceived 57

Table III comparison of PSS scores between alcohol dependents and non-dependents in Munda community.
PSS(Mean Score± Standard Deviation) Munda
AUDIT PSS
Dependence (50) 20.42±5.99
Non-dependence(30) 12.97±8.70
DF=1,78, F value=20.53, P value= 0.000
The mean score in individuals dependents on alcohol is 20.42 for PSS and individuals with alcohol non-dependence score is 12.97 for PSS respectively. The differences in the mean value scores of stress was also found to be statistically significant between alcohol dependents and nondependents of Munda community.
4. Discussion
In most of the tribal communities alcohol consumption is a part of culture and also their food. Handia/rasi is the local beverage of Munda community. Both male and female members consumes handia/rasi on daily basis. They consume other verities of local beverages like mahuli (prepared by fermented mahula flower), tadi (palm wine), aska-40 (a cheap variety alcohol) and occasionally they take international brands like beer, no-1, whisky and rum etc. socio-cultural contexts play the role between alcohol consumption and perceived stress. For Munda people handia is not only a beverage but also their food, a part of culture and sometime plays as medicine for jaundice disease. The Munda people are daily labour, they need their local beverage like handia/rasi for doing hard work and release their stress. They believe that alcohol will help to reduce the stress in their lives, but it is most likely to be used in response to stress.
On the other hand The male members of Pana community are consuming some amount of handia/rasi, mahuli and high amount of beer, whisky and rum. Although 78 % of pana population was found to be non alcohol depent but similar level of stress was observed among alcohol dependents and non dependents. It is due to non dependent may be relying on other substance abuse then alcohol as alcohol non depended samples (n=71) are more than alcohol depended samples (n=19). Traditional
alcohol intake is not found among Pana community. But the handia consumption is limited to male members. Except handia/rasi they consume other kinds of alcohol. Alcohol is a taboo for females to consume. This pattern of alcohol depence and perceived stress could be attributed to some other kind of substance abuse probability gundi (a form of nicotine) which is taken both by male and females to relieve stress Sahoo et.al., 2016 Thus the pana ( ). community shows low alcohol dependence cases but equal perceived stress condition among alcohol dependence and non dependence.
5. Conclusion
Stress is considered a major contributor to the initiation and continuation of alcohol or other drugs use as well as to relapse. Alcohol is reportedly the world's third-largest risk factor for disease burden. This study helps us to understand the reason behind increases of stress level and alcohol consumption among both the communities. Perceived stress is a significant contribution to alcohol dependence in the Muda community. But in the Pana community it is not significant because a few members are consuming alcohol rather people in pana community were found to take other psychoactive substance that is nicotine. The low socio-economic status is one of the main causes of increasing alcohol or nicotine dependency in these communities which was found to increase stress than relieving it.
Acknowledgement:
Preparation of this article was supported by P.G. Department of Anthropology, Utkal University.We would like to thank all participants of study populations. We are thankful to UGC- Dr. D.S Kothari Postdoctoral Fellowship (BL/2014-15/0111) for their support.
Reference
Brady, K.T. and Sonne S.C.1999. The Role of Stress in Alcohol Use, Alcoholism Treatment, and Relapse. Alcohol Research & Health, 263.
Cohen, S., Lamarck, T., and Mermelstein, R.1983.A global measure of perceived stress. Journal of Health and Social Behavior, 24:385-396.
Kalant, H. 1990. Stress-related effects of ethanol in mammals. Critical Reviews in Biotechnology 9(4):265-272.
58
Man in Society ISSN 2347-1530Volume 23, 2016, pp. 56-59

Ko, J.A., Shim, J.W., Kim, J.S., Lee, M.S. 2011. Stress risk factors and mental death: findings from 2011 Seoul Mental Health Survey. The Mental Health , 2:32-46.
Kumar,V., and Rao,R.R. 2007. Some interesting indigenous beverages among the tribals of Central India. Indian Journal of Traditional Knowledge, 6(1):141-43.
Lee, J.C., Park, J.S. and Kim, G.H. 2011.The effects of stress, quality of life and family relationship of smokers and drinkers on tobacco and alcohol use: Focusing on mediating effects of self-rated health. Korean Public Health Research, 37:29-43.
Nagle, Y.K., Rani, E.K., Indubala & Pradhan, J. 2009 . Stress and its relationship to alcohol intake among military personnel. Indian J. Prev. Soc. Med., 40 (1 & 2).
Panda, S.K., Bastia, A.K. and Sahoo, G. 2014. Process characteristics and nutritional evaluation of handia – A cereal based ethnic fermented food from Odisha. Indian Journal of Traditional Knowledge, 13(1):149-156.
Park, Y.E., Lee, D.H. 1999. A study on socio-psychological stresses affected with health status. Korean J Health Educ Promot, 16:61-82.
Sadava, S.W., & Pak A.W. 1993. Stress-related problem drinking and alcohol problems: A longitudinal study and extension of Marlatt's model. Canadian Journal of Behavioral Science, 25(3):446-464.
Sahoo, S., Das, A., Satapathy, K.C. and Patra P.K. 2016. Association of Perceived Stress with Nicotine Consumption in Pana Community of Jajpur District, Odisha. Man in Society.
Seung-Jin Yoon, M.S. , Hae-Joon Kim, M.D., Miae, D. 2016. Association between perceived stress, alcohol consumption levels and obesity in Koreans. Asia Pac J Clin Nutr, 25(2):316-325.
Tavolacci, M.P., Joel, L., Sebastien, G., Laure, R., Herve, V. and Pierre, D.2013. Prevalence and association of perceived stress, substance use and behavioural addictions: a cross-sectional study among un ive r s i ty s tuden t s i n F rance , 2009–2011.BMC Public Health , 13:724.
Torres, S.J., Nowson, C.A. 2007. Relationship between stress, eating behavior, and obesity. Nutrition. 23:887-94.
Volpicelli, J.R. 1987.Uncontrollable events and alcohol drinking. British Journal of Addiction, 82(4): 381-392.
World Health Organization (WHO) WHO Global Status Report on Alcohol and Health 2014.
Geneva: WHO; [Accessed August 18, 2015]. Available at: http://www.who.int/substance abuse/publications/global alcohol report/en/
Yokotsuka, T. 1991. Non-proteinaceous fermented foods and beverages produced with koji molds, In: D.K. Arora, K.G.Mukherji and E.H. Marth (Ed.): Handbook of Applied Mycology. Marcel Dekker Inc. New York, 3,293.
Association study of alcohol consumption with perceived 59

A Study on Age at Menopause, Menopausal Symptoms and problems among Ethnic groups of South Odisha.
1Y.Puja2P.K Patra
2K.C Satapathy
1 2,3M.Phil scholar , Associate Professor Department of Anthropology, Utkal University, BhubaneswarCorresponding author E-mail:[email protected]
Abstract
Present study aimed to evaluate the age and menopausal symptoms between the four ethnic groups. This study was conducted among the four ethnic groups- three, were tribal group (Amantaya, Bhotra, and Saora) and other one was “Gouda” caste population in the village of Nabarangpur district, of South Odisha.Data were collected from 45 study participants.( Amantya-15, Bhotra-14, Saora- 6 and Gouda-10). All the participants selected for the study were aged between 45-55years have attained natural menopause ( not because of any medical reasons) at least one year prior to the date of study, were still in wedlock and had at least one surviving child. Age at menarche, age at marriage and age menopause data were collected by recalled method. Descriptive statistics used for analyzing the percentage of sociodemographic strata. The result revealed that psychosomatic symptoms being more prevalent than vasomotor complaint in both the tribe and caste participants and there were no significant difference between menopausal age in both caste and tribe participants. Present study concluded that early menopause found in both tribe and caste population.
Key words: Age at Menopause, Menopausal symptoms, Ethnic group, Participants
1. Introduction
Menopausal age and menopausal symptoms varies from woman to woman and among different ethnic groups. The worldwide, the estimate for the median age at menopause ranges from 45 to 55years.( Biri, Bakar, Maral, karabacak and Bumin. 2005; Kaufert and Syrotaik 1981; Kaw, Khunnu & Vasishta.1994, ku.etal 2004; Meschia etal,2002. Mohammad, Sadat Hasheme & Farahani, 2004; Sidhu & Sidhu 1987, Syamala & Sivakami, 2005) with women from western countries hayin higher menopausal age compared to other parts of world ( Beard,1976. Holte 1991,Wright 1981). Several studies of Indian women have reported ages at menopause ranging between 40 and the late 40s (Dasgupta and Ray, 2013; Sharma et al., 2007; Singh and Ahuja, 1980).Age at menopause may have profound implications for subsequent morbidity and mortality (Jacobsen et al., 2003). The early age at menopause
carries osteoporosis (Nagata C etal 1998) and cardiovascular disease while the late age at menopause is associated with increased risk of endometrial an breast cancers.( de Graaff J, Stolte Lam 1978 & Kavale G, Heuchj,1988). Several studies have shown that frequency of menopausal symptoms of Indian women varies with culture and sociodemographic status. (T.S Syamala & M Sivakami 2005). During menopause, women may exper ience vasomotor, u rogent ia l and psychological symptoms as well as sexual dysfunction.. A wide array of symptoms and signs are observed in women during menopause. The common symptoms associated with menopause and estrogen deficiency include: hot flushes, excessive perspiration, mood swings, depression, anxiety, insomnia, urinary symptoms like frequency , vaginal dryness, leucorrhoea, purities, backache, muscle weakness, joint pain, memory loss, dementia, dental problems, skin changes and
60
Man in Society ISSN 2347-1530Volume 23, 2016, pp. 60-68

etc Many of the above symptoms are age related and aggravated by stresses of life. Indian women living in rural areas (72% of he population and urban areas both cite having urogenital symptoms and general body ache and pains. Interestingly, women in urban areas complain more about having hot flashes, mood swings, psychological problems and intercourse challenges. (T.S Syamala & M Sivakami 1999).
Few studies addressed the menopausal age and menopausal symptom of any indigenous ethnic group (tribe). However the prevalence of symptom differs widely in different societies. The indigenous ethnic group maintains homogeneity in the form of practicing endogamy and in maintaining traditional cultural practices. They differ from the other ethnic groups in terms of their biological and cultural practices such as mating structure and social tradition. This inequality in social and cultural characteristics is likely to affect the reproductive characteristics, including reproductive aging or menopause of the indigenous groups differentially. Under this circumstance, the present study aimed to find out the age at menopause and prevalence of menopausal problems between tribe and caste population of Turunji village, Nabrangapur District of South Odisha.
2. Methodology and Study area
The present study was conducted in Turunji village, Nabarangapur District Odisha. Nabarangpur district which is in the northeastern corner of the Deccan plateau. The selections of the village have been choosed operational convenience. This is one of the village where both tribe and caste population staying together. We selected this village because we found maximum number of Bhotra population staying in village. We selected predominantly found in all blocks of Nabarangpur district except Raigarh and Chandahandi. Out of 4.51lakh populations in the state 3.25 Bhatra populations, live in Nabarangpur district as per 2011 census. We decided to cover all the (Amanatya, Bhotra, Saora and Gouda) Communities of Turunji village residing in Nabarangapur District, Odisha. Data on attitudes and perception towards menopause have been collected by using case study technique from postmenopausal women, belonging Hindu ethnic groups. All the participants selected for the study are
aged between 45 and 55 years.
Study Population
Data were collected from the 45 postmenopausal participants who had attained natural menopause (not because of any medical reason) at least one year prior to the date of study, are still in wedlock and have at least one surviving child.
Sample size
Sl No. Community Sample size
1 Amanatya 15
2 Bhotra 14
4 Gouda 10
5 Saora 6
Total 45
Data collection Technique
A pretested structured questionnaire was used for the collecting of quantitative data on the sociodemographic features (age of participant, education, and working status of women) reproductive history includes (age at menarche, marriage, menopause, use of contraceptive pills, parital status of, duration of breast feeding of last child), menstrual history, and lifestyle of participants includes consumption of alcohol or tea/coffee and use of tobacco. Menopausal symptoms of the participants were collecting with the help of menopausal symptoms list that is Vasomotor (Hot flushes, Night Sweating), Vaginal (U te r ine p ro l apsed , Vag ina l a t rophy) , Psychosomatic symptoms ( Dizziness, Rapid heartbeat, Numbness of extremities, Tiredness, Irritability, Headache, Sleep Disturbance, Muscle and Joint pain, Faint, Breast pain), Psychological Symptoms ( Depression, tension, Forgetfulness, Poor concentration, ) Urinary symptoms (Dysuria, Increased urine frequency, Urine peak during cough & laugh), Other problems ( Post menopausal bleeding, Fracture, Loss of sexual desire). This question set on the canvassing the West Bengal study. We adopted questionnaire which was used in the study of West Bengal. (Ray etal, 2015). The West Bengal and Odisha shares certain cultural and biological similarities.
A Study on Age at Menopause, Menopausal Symptoms 61

The present study is conducting during the period of th6th February 2017 to 6 April 2017. For the present
research work necessary ethical clearance were taken and was approved by the Utkal University., Odisha. The approval of families and clearance from village heads also taken and the purpose of visit were also explained. Respondents who participated voluntarily were considered in the present study and confidentiality was maintained.
3. Data analysis Data were analyzed by the using of SPSS 20(statistical package for social science).
Descriptive analysis( frequency and mean variable) were performed to carried out the percentage of socio demographic features, reproductive history and mean variable standard deviation of marriage and menopause are also analyzed by the descriptive method. And the simple descriptive statistics was carried out to understand the significant percentage of menopausal symptoms (muscle and joint pain, headache, vaginal symptoms, psychological depression, urinary symptoms) and other life style factors (tobacco chewing, consumption of alcohol or black tea).
Age group Amantya (N%)
Bhotra (N%) Soara ( N%)
Gouda (N%) Total (N%)
41 -45
1 (1.9)
5 (35.7)
1 (16.7)
0
7(15.5)
46 -50
7 (46.7)
3 (21.4)
0
1 (10.0) 11 (24.4)
51 -55
2 (13.3)
5 (35.7)
3 (50.7)
3 (30.3) 13 (28.8)
56 -60
4 (26.7)
1 (7.1)
0
3 (30.3) 8 (17.77)
60+
1 (6.7)
1
2 (33.3)
2 (20.0) 6 (13.33)
total
15 (28.8)
1 (28.6)
6 (11.5)
10 (19.2) 45 ( 100.0)
Employment Status of women
Employed 1 (6.7) 1 (7.1) 1 (16.7) 1 (10.0) 4 (8.8)
Home maker 14 (93.3) 13(92.9) 5 (83.3) 9 (90.0) 41 (91.1)
Educational status
Literate 1(6.7) 2 (14.3) 1(16.7) 1(10.0) 4 (8.8)
Non literate 14 (93.3) 12 (85.7) 5 (83.3) 9 (90.0) 41 (91.1)
Regular exercise
Regularly 5 (33.3) 4 (28.5) 2 (33.3) 5 ( 50.0) 16 (35.5)
Occasionally 2 (13.3) 2 (14.28) 0 0 4 (8.8)
No 8 (53.3) 8 (57.1) 4 (66.6) 5 ( 50.0) 25 (55.5)
Total 15 (33.3) 14 (31.1) 6 (13.3) 10 (22.2) 45 (100.0)
4. ResultTable I Socio demographic features of participants Age wise distribution of participants
62
Man in Society ISSN 2347-1530Volume 23, 2016, pp. 60-68

Table I shows that major percent of participants are fallen in menopause at the age of 46-50. Majority of the participants were home maker. And they are not doing any other regular physical exercise after the age 40. They were
Participants responds by recalled method
Amantaya
Bhotra
Saora
Gouda
ean age at menarche
Mean SD Mean SD Mean SD Mean SD
11.5 8.34 12.14 5.34 13.0 8.9 11.90 5.34
Mean age at marriage 14.13 2.58 15.00 4.97 15.67 5.48 13.80 2.58
Mean age menopause 49.53 1.90 45.29 2.97 46.67 2.33 45.70 7.95
History of menstrual N (%) N (%) N (%) N (%)
Regularity 15(100.0) 14(100.0) 6 (100.0) 10(100.0)
Irregularity - - - -
Bleeding length (days)
2 -3
-
-
1(1.9)
1(1.9)
3 -4 3 (20.0)
- - -
4 -5 12 (80.0) 11 (78.57) 4(3.8) 2(38)
5 -6 - 3(5.8) - 6(11.5)
6abovee - - 1(1 .9) 1(1.9)
Experience of fetal loss
4(26.66) -
1(1.9)
2(3.8)
Ever used Contraceptive pills(yes)
- 2(14.2) - -
mostly engaged in the agricultural field in the rainy season. Most of the tribal participants were obliterating. Nuclear family type mainly seen in that ethnic group.
Table II revealed that the mean age of menarche of the tribal women was higher than that of the caste participants. These two groups differed significantly at the age of marriage. Early attainment of menarche and early marriage was shown in caste participants than that of the tribal women. In general the mean age at menopause was All the is 45.77 years.participants were did not use oral contraceptive
pills in their life experience. Same percentage of fetal loss has been found both tribal (Bhotra) and caste participant. 90 percent of participants were suffering from menopausal complication after the menopause. Regarding the menstrual cycle 99% of women had regular menstruation. The majority participants had bleeding length 4-5days.
Table 2 Reproductive history of participants.
A Study on Age at Menopause, Menopausal Symptoms 63

Table III Menopausal symptom of participants
Menopausal symptoms Severe Moderate Mild No
Hot Flushes 3 (5.8) 11(21.6) 7(13.5) 31(59.6)
Night sweating 3 (5.8) 10(19.2) 7(13.5) 32(61.5)
Dizziness 11 (21.6) 12(23.4) 12(23.4) 17(32.7)
Rapid heartbeat 1(1.9) 4(7.7) 5(9.6) 40(80.8)
Numbness of extremities 6(11.5) 6(11.5) 4(7.7) 36(69.2)
Irritability 1(1.9) 6(11.5) 3(5.8) 42(80.5)
Tiredness 2(3.8) 4(7.7) 11(21.6) 35(67.5)
Headache 2(3.8) 12(23.4) 6(11.5) 32(61.5)
Sleep Disturbance 8(15.4) 11(21.6) 12(23.4) 21(40.2)
Muscle joint pain 17 (32.7) 18(34.7) 6(11.5) 11 (21.6)
Breast pain 10 (19.2) 8(15.4) 0(0.0) 34(65.5)
Dysuria 1 (1.9) 3(5.8) 3(5.8) 45(80
Increased urine frequency 12(23.4) 14(26.9) 17(32.7) 9(17.3)
Urine peak during cough & laugh 1(1.9) 5(9.6) 15(28.8) 31(59.6)
Uterine prolapsed 0(0.0) 0(0.0) 0(0.0) 0
Vaginal atrophy 0(0.0) 0(0.0) 0(0.0) 0
Depression 4(7.7) 4(7.7) 2(3.8) 42(80.8)
Tension 3(5.8) 7(13.5) 8(15.4) 34(65.5)
Forgetfulness 1(1.9) 3(5.8) 5(9.6) 43(82.7)
Poor concentration 1(1.9) 5(9.6) 0(0.0) 46(88.5)
Table III revealed that have participants have moderate range of hot flushes and night sweating due to the early onset of menarche and early conception among the ethnic group. Majority of the participants suffered from the Muscle and joint pain. 32.7 percent of women's have severe muscle and joint pain and 34.7 percent of participants have
moderate muscle and joint pain. Osteoporosis (muscle and joint pain) is the common problem among the post menopausal women. It affects because of the unawareness about the disease due to the poor educational and economic status and might be their dietary habit. Severe increased urine frequency also found in all the participants.
64
Man in Society ISSN 2347-1530Volume 23, 2016, pp. 60-68

Table IV Shows the Life Style in Different Ethnic Group of Turunji Village
Life style Category Ethnic groups
Amantya N(%)
BhotraN(%)
GoudaN(%)
SaoraN(%)
Consumption of coffee/tea Regularly 13(25.0) 14(26.9) 10(19.2) 6(11.5)
Occasionally 2(3.8) 0(0.0) 0(0.0) 0(0.0)
Consumption of alcohol Regularly 1(1.9) 4(7.7) 0(0.0) 0(0.0)
Occasionally 7(13.5) 2(3.8) 2(3.8) 3(5.8)
No 7(13.5) 8(15.4) 8(15.4) 3(5.8)
Tobacco chewing
Regularly 17.3) 9(17.3) 8(15.4) 6(11.5)
Occasionally 3(5.8) 0(0.0) 0(0.0) 0(0.0)
No 3(5.8) 5(9.6) 2(3.8) 0(0.0)
Perceived present health status
Excellent 1(1.9) 4(7.7) 0(0.0) 0(0.0)
Good 12(23.1) 8(15.4) 7(13.5) 6(11.5)
Moderate 2(3.8) 1(1.9) 2(3.8) 0(0.0)
Bad 0(0.0) 1(1.9) 1(1.9) 0(0.0)
Perceived stress in life Serious 1(1.9) 2(3.8) 1(1.9) 0(0.0)
Moderate 4(7.7) 5(9.6) 4(7.7) 1(1.9)
No 10(19.2) 7(13.5) 5(9.6) 5(9.6)
Our present study participants (all groups pooled) were not smokers. Consumption of tea is highly shown in this ethnic groups. Table-4 reveals that total (94.2%) of Participants are consumed regularly black tea (Dikasini) in ethnic groups. (3.8%) of Amanatya participants are occasionally consumed tea and (1.9%) of Bhotra participants are occasionally consumed tea. And the total (71.2%)of Participants are Chewing Tobacco regularly in Amantya, Bhotra , Gouda and Saora communities and 7.7% participants are Chewing tobacco Occasionally in Amantya, Bhotra , Saora and Gouda communities.
5. Discussion
The study investigated a small community based sample. Analysis of the result revealed that scores for both the age at menopause and menopausal problems of menopausal women. The mean age at menopause is 44.68 ± 2.765 yearYanadi tribal woman in Nellore District of Andhra Pradesh ( T ,2014) and the mean age at menopause among Bengali Hindu women ranges from 44.0 years to 45.0 years (Dasgupta and Ray, 2013; Som and Ray, 2012) which was relatively similar to the present
study of age at menopause. The mean age of menopause in India is 44.3 years. From India, some scattered studies have focused on estimating age at menopause and menopausal symptoms, but there has been no published literature on this topic from eastern India. Few Indian studies have attempted to determine the tribe and caste difference in menopausal age and symptoms.
Menopause may have profound implications for subsequent morbidity and mortality. Early studies show that early onset of menopause are greater risk of being cardiovascular disorder ,and osteoporosis while late menopause late menopause carries a higher risk of breast and endometrial cancer .The mean age at menopause observed in our study is 45.77 years. A wide range of mean age at menopause in Indian women 40.32 to 48.84 years. And development countries from 48.0 to 51 years have been shown in the table 4. Mean age at menopause in the present study corresponded with the Bengal women from West Bengal (Dasupta D, Ray S.2009) This difference may be probably because of community ethnic variation. Dietary habit , life style and environment may play important role .
A Study on Age at Menopause, Menopausal Symptoms 65

Table-V Shows the Mean age at Menopause in Different areas of India
Tribe/ Caste /Ethnic Group / Community
Mean age at Menopause
Source
Amanatya 45.93 Present study
Bhotra 45.29 Present study
Gauda 45.70 Present study
Saora 46.67 Present study
Tribal communities of Nabarangpur (cumulative)
45.77 Present study
Yanadi Tribal Women of Andhrapradesh
44.68 Previous study by Chandrika T & Adilaxmi T (2014)
Iruliga Tribal women of Mysore District. Karnatak.
46.63 Previous study by B.Daskshayani and etal (2007)
Bengali speaking Hindu(rural) ( West Bengal Calcutta
46.94Previous study by D.Gupta & S. Ray
Bengali speaking Hindu(urban) ( West Bengal Calcutta)
44.92 Previous study by D.Gupta & S. Ray
Lodha tribe in ( West Bengal Calcutta)
41.69 Previous study by D.gupta,P.karar,S.Ray and N.Ganguly.
Schedule caste ( West Bengal Calcutta)
40.65
Previous study by D.gupta,P.karar,S.Ray and N.Ganguly.
Women of Assam 40.32 Singh & Ahuja
Kaibarta (Assam) 42.95
Sengupta,1993
Deshastha Bramin Maharashtra 43.46
Kulkarni& Joshi [6]
Singhpho women 43.65
Kar &Mahanta
Sikligar women, Punjabi 43.71
Balgir,1985
Choudary Women Kangra 43.84
Sharma &Singh
Arora women Punjabi 43.96
Singh & Ahuja
Sindhi women Delhi 44.60
Gosh & Kumari
Punjabi women 44.68
Singh & Ahuja
women from rural north India 44.1
Singh & Arora
women from Mumbai 44.7
Shah R et al
Hindu Kalita women 44.94
Bagga A[
Maharashtrian Brahmin 45.84
Rakshit S
Ahom women of Dibrugarh in Assam 47.10
Sengupta & rjkhowa
Assam Women 47.50 Kaw et al [16]
Among labanas North West India 47.68 Mastana
Brahmin women Himachal 48.84 Sharma & Singh
Bengali women West Bengal 45.22 Subha Roy
66
Man in Society ISSN 2347-1530Volume 23, 2016, pp. 60-68

Studies from outside India
Kim YH et al Urban area of Korea 48.29
Malacara JM et al States of Mexico 48.0
Mckinlay et al South East Asian women 51.0
One of the caste participants is suffering from severe Muscle and joint pain (Bata roga) after her menopause. And she visit occasionally to the general doctor for her treatment. And due to financial problem she stops private clinical treatment and follows the herbal treatment. She used (Builuli and Mustard oil) for curing her Muscle and joint pain( Bata Roga). They collect that Builuli from the soil. The review of literature shows that, low calcium diet, lack of exercise and vitamin D deficiency may be the major factors for muscle and Joint pain.
Another case study of present study shows that all the participants were born their babies at home. Till now home delivery mostly seen in that village. Previously they were not preferred any antenatal care. One professional Dhai is present in that village for home delivery. She also trained her niece for this work. The unhygienic condition, dietary habit may be the important factors for early menopause. In this context it has been stated that regular consumption of black tea and alcohol may be the factors of increased urine frequency.
6. Conclusion
In present study we found a strong relationship between the years of attaining menopause with the menopausal problems. Changing of life style, dietary habits, unhygienic condition of living pattern, and lack of awareness may be major causes of onset of early menopause and menopausal problem among these ethnic group.
Acknowledgment
I express my indebtedness towards the study participants for their supporting. I wish to thank my research guide Dr. Prasanna Kumar Patra, Associate Proffessor in Anthropology, Utkal U n i v e r s i t y a n d D r . K a n h u C h a r a n Satapathy,Associate Proffessor in Anthropology, Utkal University.
Reference
Anderson D, Yoshizawa T, Gollschewski S,
Atogami F, Courtney M. Menopause in Australia and Japan: effects of country of residence on menopausal status and menopausal symptoms. Climacteric 2004; 7:165–74
Bagga, A. (2004). Age and Symptomology of menopause: A case study. Obstetric and Gynecology Today,11, 660–666
Bairy L, Adiga S, Bhat P, Bhat R. Prevalence of menopausal symptoms and quality of life after menopause in women from South India. Aust N Z J Obstet Gynaecol 2009;49:106–9
D.Dasgupta, B. Pal, and S. Ray, “Factors that discriminate age at menopause: a study of Bengali Hindu women of West Bengal, “American Journal of Human Biology, 2015.
D. Dasgupta and S. Ray, “Vasomotor and urogenital problems at midlife: a study on rural and urban women in India,” Annals of Human Biology, vol. 42, no. 3, pp. 268–275, 2015
D.Dasgupta, and S. Ray(2009). Menopausal Problems among Rural and Urban Women From Eastern India, Vol.3, Issue1 Pp 20-33.
D.Dasgupta, , S. Ray, Priyanka K, and Nandini G (2015) Menopaual Symptoms and Its Correlates: A Study on Tribe and Caste Population of East India, Vol 2015
Hawkers', O'Connell. J.M., Blurten Jones. N.G, Alvarez.H and Charnav.E.L (1995), Grand mothering Menopause and the Evolution of Human life Histories.Vol.95, Pp. 1336-1339
Indian Institute of Population Sciences (IIPS) and ORCMacro, National Family and Health Survey-3, 2005-2006, IIPS, Mumbai, India, 2007.
International Institute for Population Sciences (IIPS). National Family Health Survey (MCH and Family Planning), India 1992–93. Mumbai: IIPS, 1995
Kriplani. A and Banerjee. K (2005), An Overview of Age of onset of Menopause in Northern India, Masturitas , Pp 199-204.
Kapur P, Sinha B, Pereira BM. Measuring climacteric symptoms and age at natural menopause in an Indian population using the Greene Climacteric Scale. Menopause 2009;16:378–84
A Study on Age at Menopause, Menopausal Symptoms 67

Laurence.M.A. Shaw(2004), Anthropology of the Menopause, Pp. 396-399.
Linda. S Mitteness,(1983), Historical Changes In Public Information: About the Menopause, Vol.12(2).
Lock M. Menopause in a cultural context. Exp. Gerontol 1994;29:307–17
Lock.M (1998), Menopause: Lesson From Anthropology, Vol.60, Pp 410-419.
Melby. M.K, Lock.M, and Kaufert. P(2005), Culture and Symptoms Reporting at Menopause, Vol.11, No-5. Pp.495-512.
N.Som and S.Ray (2012), Menopause Specific Quality of Life of Urban Women in West Bengal, India, Vol.18 No.3
Sharma, S., Tandon, V. R., & Mahajan, A. (2007). Menopausal symptoms in urban women. JK Science,9, 13–17.
Sharma S, Tandon VR, Mahajan A. Menopausal symptoms in urban women. JK Sci 2007;9:13
Syamala TS, Sivakami M. Menopause: an emerging issue in India. Econ Polit Wkly 2005;XL:19–25
Shah R, Kalgutkar S, Savardekar L, Chitlang S, Iddya U, Balaiah D.Menopausal symptoms in urban Indian women. Obste t Gynecol Today 2004;11:667–70
T. S. Syamala and M. Sivakami, “Menopause: an emerging issue in India,” Economic and Polit
V. Scheid (2007), Traditional Chinese medicine- What are we investigating ? The case of Menopause. Vol.15 Pp 54-68
World Health Organization, “Research on the menopause in the 1990s. Report of a WHO scientific group,” WHO Technical Report Series 866, World Health Organization, Geneva, Switzerland, 1996.
68
Man in Society ISSN 2347-1530Volume 23, 2016, pp. 60-68

Assessment of Knowledge, Attitude and Awareness towards Sickle Cell Disease among People of Nine Villages of Koraput District:
A Psychosocial Study
1Basanta Kumar Bindhani
Research Scholar, Department of Anthropology, Utkal University, Corresponding authorEmail- [email protected]
Abstract
Sickle cell disease (SCD) is a genetic disorder with an estimated 5,200 live births each year. Although SCD has been described in India in numerous ethnic groups, it is most prevalent in tribal community. Prevalence of Sickle Cell gene is 5 to 34 % in tribal community, who have a high prevalence of socio-economic disadvantage and are frequently medically underserved. These show the big burden on the public health of India.The vital purpose of this study is to explore the psychosocial responses made by families in adjusting to the painful reality of having a family member with SCD, psychosocial attitude of the people affected with SCD, the awareness and general knowledge of sickle cell disease among a non-probability sampling of a selected population in Koraput district which is one of the most backward districts of the state and predominantly tribal populated one. Major data were collected among 78 participants in which 43 individuals are patients and 35 subjects are their family members with the help of schedules, discussion, observation and interview. In addition to this, data was collected on several demographic variables, including sex and age of patient, family income, religion, education, ethnic group, living arrangements and occupation, and response to knowledge of sickle cell anaemia. Results indicated that 48.7% of the samples have a good knowledge and awareness about SCD and this level is statistically more significant among the SCD affected individuals than their family members.
Key words: Sickle cell disease (SCD), awareness, attitude, general knowledge, Koraput.
1. Introduction
Sickle cell disease (SCD), also known as sickle cell anaemia, or Drepanocytosis is a group of genetic disorders that is characterized by the development of abnormal haemoglobin (Hgb S), abnormal red blood cells, and the resultant complications. SCD is one of the most common monogenic disorders globally with an autosomal recessive inheritance. James Herrick (1910) in his work confirmed the elongated shape of a red blood cell. Herrick is the first person to discover SCD. Adeyemo et al. (2015) conducted a cross sectional study on “health related quality of life and perception of stigmatization in adolescents living with sickle cell disease in Nigeria”. The study was conducted on 160 adolescents, which included 80 participants with SCD and 80 participants without SCD. Health surveys were distributed to
participants to measure how stigmatization affects the health related quality of life (HRQL). The results of the study shows that participants with SCD have lower HRQL than those without the SCD. Ballas (2009) mentioned that the management of SCD ranges from frequent acute pain episode requiring hospitalization, the use of intensive care units and facilities, surgical and nonsurgical treatment, and multidisciplinary method to management. There are different indicators used to evaluate the yearly health care cost among individuals with SCD, these include: hospital admissions, clinic visits, doctors' a p p o i n t m e n t s , e m e rg e n c y d e p a r t m e n t appointments, diagnostic procedures (scans, laboratory, and radiography) cost, and prescription cost (Ballas, 2009). It is estimated that the age lifespan of male and female with SCD is 42–45
69
Man in Society ISSN 2347-1530Volume 23, 2016, pp. 69-77

years, and the lifetime cost is said to be about $2,696,400 for male in a total of 24 years, and $3,145,800 for adult female (Ballas, 2009). Ninety-seven percentage (97%) of the hospital admission was related to painful crises, giving the average annual costs for health care to be $725,037 in 2008 (Ballas, 2009). Kauf et al. (2009) conducted an updated study on the total cost of medical care that is estimated to serve children and adults living with SCD. Among the 4,294 individuals who participated in the study, the monthly per patient average cost was $1,946; for adults between the ages of 30 to 39 average cost per patient- month was at $2,853 and children between the ages of new born to nine years were at $892 per patient-month. Rees et al. (2010) stated that the managements of SCD include educating those with the disease, their parents and caregivers. Education includes monitored nutrition, growth, and development of the individuals with SCD. Management of SCD also includes the administrat ion of t reatments including, pneumococcus and influenza vaccinations, and provision of medications. GR Serjeant et al. (2001) sited about the natural history of sickle cell disease in his article “sickle cell disease”. He discussed about the nature of sickle cell anaemia in patients of African and Indian origin.
There is no definitive supporting literature related to study on individuals living with SCD in Koraput. The literature review provided insight on previous studies that have been performed by other researcher in relation to factors affecting SCD. Furthermore, it provided detail analysis of the studies and the relating factors with emphasis on their effect on SCD. With that being said, in this aspect of the literature review, previous researchers have done very little research and less research has been conducted in the last five years.
The objectives of the study are to explore general knowledge, attitudes, beliefs and awareness of sickle cell disease among the studied people.
2. Materials and Methods
The study involved the utilization of various tools for information assimilation. Major data were collected through primary sources with the help of discussion, observation, schedules and interview method. Some schedules are modified and some schedules are developed. Additional information
was collected from secondary sources through discussion and literature review. Analyses of data were done by using SPSS and Microsoft Excel software.
Koraput was purposefully selected for study because this district is one of the most backward districts of the state and predominantly tribal populated one and there is not a single work done before regarding sickle cell anaemia. Hence, Koraput district is taken as the sample of the present study.
The villages were selected accordingly the availability of SCD patients in that village. More priority was given to those villages which have more numbers of SCD patients and more remote, where medical facilities are not easily assessable. And these villages were selected through several pilot surveys.
Table-I: Name of the studied villages
Village Name GramPanchayat Name
Nuaguda Rajpalma
Chakraliput Rajpalma
Rajpalma Rajpalma
Padmapur Padmapur
Panasput Padmapur
Mohanapada Padmapur
Gopalput Padmapur
Chikapar -2 NAC
Jabapatraput Kundura
In this study, the data were collected from the individuals of 28 households who have affected in SCD in 9 villages of Koraput district. For this study totals 78 samples were included from which 43 subjects are SCD affected individuals, and 35 samples are family members and parents of the patients. The name of the studied villages and panchayats are mentioned in the table-I.
3. Results and Discussion
The purpose of this study was to explore the psychosocial responses made by families in adjusting to the painful reality of having a family member with sickle cell, psychosocial attitude of the people affected with SCD, the sickle cell trait of studied people, knowledge, attitudes, beliefs of patients living with SCD, and general knowledge and awareness among the studied people in Koraput district.
Assessment of Knowledge, Attitude and Awareness 70

Table-II: Demographic information of the participants of the study
DEMOGRAPHICS MALE FEMALE TOTAL
% % No. %
Number of participant (Including 43 patients)
38
48.7
40
51.3
78
100.0
Age group (in year)0 -5 2 5.26 0 0 2 2.56
6 -10 2 5.26 7 17.5 9 11.54
11 -15 3 7.89 2 5 5 6.41 16 -20 4 10.53 6 15 10 12.82
21 -25 2 5.26 6 15 8 10.26 26 -30 7 18.42 5 12.5 12 15.38
31 -35 5 13.16 5 12.5 10 12.82 36 -40 3 7.89 4 10 7 8.97
41 -45 4 10.53 5 12.5 9 11.54
46 -50 5 13.16 0 0 5 6.41
50 and above 1 2.63 0 0 1 1.28
Marital Status
Married 28 73.68 27 67.5 55 70.51
Single 10 26.32 13 32.5 23 29.49
Caste/Sub-caste SC 30 78.95 35 87.5 65 83.33
ST 8 21.05 5 12.5 13 16.67
Religion
Hindu 27 71.05 32 80 59 75.64
Christian 11 28.95 8 20 19 24.36
Occupation
Unemployed 10 26.32 13 32.5 23 29.49
Employed (private) 4 10.53 0 0 4 5.13
Cultivation 8 21.05 0 0 8 10.26
Business 4 10.53 0 0 4 5.12
Labour 12 31.57 0 0 12 15.38
House wife 0 0.00 27 67.5 27 34.62
No.No.
Annual household income (in rupees) =x
Number of household Percentage
10
12.8250,000<x<1,00,000
66 84.62x≥1,00,000
2 2.56Average household income = 66,907 / -(SD=13636.11)
71
Man in Society ISSN 2347-1530Volume 23, 2016, pp. 69-77

Awareness of Sickle Cell Disease
To verify the awareness of sickle cell anaemia 78 subjects were included. Numerically, 74 (94.87%) of the subjects were aware of sickle cell anaemia and 71(91.03%) of the subjects were indicated hearing of sickle cell trait. This implies that average 92.95 % of total subjects are aware of both sickle cell anaemia and sickle cell trait.
Table-III: Frequency and Distribution of Awareness of Sickle Cell Disease.
(n=78)
The onset of awareness of sickle cell disease among the subjects in the sample is presented in Table-IV. By analysing the data it explores that most of the individuals i.e. 50% of the total subjects had known about sickle cell disease before 7 months to 1 year.
Table IV Frequency and Distribution of Extent of awareness of Sickle Cell Disease
Time period Frequency Percentage
Less than 6 months ago 13 17.56
7 months to 1 year 35 47.30
2 to 3 years 12 16.22
4 to 5 years 10 13.51
6 to 7 years 4 5.41
Total 74 100.00
Questions Yes No Total
No. % No. % No. %
Have you ever heard of sickle cell anaemia?
74 94.87 4 5.13 78 100
Have you ever heard of sickle cell trait?
71 91.03 7 8.97 78 100
Source of learning Frequency Percentage
Doctor 58 78.38
Friend 2 2.70
Other 13 17.57
No answer 1 1.35
Total 74 100.00
General knowledge of sickle cell disease:
Table-VI shows the distribution of the general
knowledge of sickle cell disease. Although most
respondents had become aware of sickle cell disease
only recently, there was an overall general
knowledge and understanding- of the disease. Not
all of the subjects in the sample were able to clearly
differentiate between sickle cell anaemia and sickle
cell trait. Many individuals unable to answers these
questions, which implies they have a little
knowledge regarding to SCD.
Several sources were generally indicated by the
subjects in relating the original source of awareness
of sickle cell disease. It was found that a large
number of the subjects learned of sickle cell disease
from the doctor. As out of 78 subjects, selected for
awareness programme, 43 subjects are patients, and
the reaming are their family members and relatives,
therefore it increases the probability of source of
learning about sickle cell anaemia from the doctor.
(Table-V)
Table V Frequency and Distribution of Sources of Awareness
of Sickle Cell Disease
Assessment of Knowledge, Attitude and Awareness 72

Table VI Frequency and Distribution of the General Knowledge of Sickle Cell Disease
Sl.No.
DESCRIPTION
TRUE FALSE NO ANS. TOTAL
No. % No. % No. % No. %
1. Most people who have sickle cell anaemia are under 20 years of age.
45 57.69 23 29.49 10 12.82 78 100
2.
Sickle cell anaemia is a disease of the blood.
21 26.92 45 57.69 12 15.38 78 100
3. People do not get sick whenthey have the sickle cell trait.
36
46.15
31
39.74
11
14.10
78
100
4. Sickle cell anaemia is a disease of the aged. 22
28.21
40
51.28
16
20.51
78
100
5. Both sickle cell anaemia and sickle cell trait are inherited.
42
53.85
23
29.49
13
16.67
78
100
6. Sickle cell anaemia is highly contagious.
38
48.72
36
46.15
2
2.56
78 100
7.
Sickle cell anaemia is a very serious and often fatal disease.
50
64.10
28
35.90
0
0.00
78
100
8.
A person can have sickle cell trait and not know that they have it.
45
57.69
27
34.62
6
7.69
78
100
9. Sickle cell anaemia is caused by "wild" living
31 39.74 26 33.33 21 26.92 78 100
10.
Sickle cell anaemia is a disease that usually strikes black people.
48
61.54
22
28.21
8
10.26
78
100
11.
There is no cure for sickle cell anaemia or sickle cell trait.
40
51.28
30
38.46
8
10.26
78
100
12.
A person can't catch sickle cell anaemia like mumps or measles
40
51.28
20
25.64
18
23.08
78
100
13.
A person is born with sickle cell anaemia
41
52.56
28
35.90
9
11.54
78
100
73
Man in Society ISSN 2347-1530Volume 23, 2016, pp. 69-77

Attitude and belief of sickle cell disease:
Table-VII represents the distribution on opinions relating to issues on hereditary disease, illness in children, mass screening for sickle cell anaemia, and
issues on sickle cell anaemia. As mentioned before that total seventy-eight subjects are included. Both frequency and percentage value of the issue given by the subjects are installed in the table.
Table-VII: Opinions on Attitude of SCD
Sl. No.
Statements Strongly Agree=1
Slightly Agree=2
Slightly Disagree=3
Strongly Disagree=4
No Answer=0
Total
1.
All people should be tested for hereditary disease
77 (98.72%) 0
0
0
1(1.28%)
78(100%)
2.
Most parents care more about their healthy children than they do about their sick children.
0
4
(5.13%)
26(33.33%)
47(60.26%)
1(1.28%)
78(100%)
3.
People with sickle cell disease should not be allowed get married.
5 (6.41%)
25(32.05%)
20
(25.64%)
24
(30.77%)
4
(5.13%)
78
(100%)
4.
It is a mother's duty to do her best to avoid any disappointments for her children.
15(19.23%)
46
(58.97%)
12
(15.39%)5
(6.41%)
0
78
(100%)
5.
Most parents with sickle cell anaemia children love them more than they love their other children
11(14.10%)
42
(53.85%)
21
(26.92%)
4(5.13%)
0
78
(100%)
6.
If a family member has sickle cell anaemia or the sickle cell trait, it should be kept a secret.
6(7.69%)
1
(1.28%)
16(20.52%)
54(69.23%)
1(1.28%)
78(100%)
7.
Sometimes I feel that the sickle cell anaemia subject is just one more example of white supremacy and the black man's burden.
14(17.95%)
36(46.15%)
10(12.82%)
12
(15.39%)
6
(7.69%)
78
(100%)
8.
Children with sickle cell anaemia or sickle cell trait should not be allowed to play with those children who do not have sickle cell anaemia or sickle cell trait.
2(2.55%)
12(15.39%)
16(20.52%)
47
(60.26%)
1
(1.28%)
78
(100%)
9.
The future is gloomy for the family with a member having sickle cell anaemia.trait
5(6.41%)
54
(69.23%)
7
(8.97%)
8
(10.26%)
4
(5.13%)
78
(100%)
10. Most doctors don't know enough about sickle cell anaemia and sickle cell
0 9
(11.55%)
51(65.38%)
16(20.52%)
2(2.55%)
78(100%)
Assessment of Knowledge, Attitude and Awareness 74

11.
Having a child with sickle cell anaemia causes many problems in a marriage.The family having a sick child faces unbearable financial hardships. All people regardless of race should be required by law to be tested for hereditary disease before they are allowed to marry
57(73.07%)
11(14.10%)
9(11.55%) 0
1(1.28%)
78(100%)
12.
Mass screening for sickle cell disease is being used to stop the growth of the black population.
0
13
(16.67%)
11
(14.10%)
47(60.26%)
7
(8.97%)
78(100%)
13.
People with sickle cell anaemia should be sterilized
11(14.1%)
46
(58.98%)
19(24.36%)
0 2
(2.56%)
78
(100%)
14.
A family is drawn closer together if someone in the' family has sickle cell anaemia
2(2.56%)
48(61.54%)
14
(17.95%)
10(12.82%)
4
(5.13%)
78(100%)
15.
Healthy brothers and sisters are cheated if a family member has sickle cell anaemia
0
13
(16.67%)
15
(19.23%)
48(61.54%)
2
(2.56%)
78(100%)
16.
Black people have no choice in their life
4(5.13%) 19
(24.36%) 42
(53.85%) 9
(11.53%) 4
(5.13%) 78
(100%)
17.
The name sickle cell anaemia should be changed
0
6(7.69%)
6
(7.69%)
65
(83.34%)
1
(1.28%)
78
(100%)
18.
Sickle cell anaemia means someone with bad blood.
58(74.36%)
8(10.26%)
8(10.26%)
2
(2.56%)
2
(2.56%)
(100%)
19.
If sickle cell disease was found predominantly among the white population, more research would have been done
53(67.95%)
4(5.13%)
6(7.69%)
4(5.13%)
11(20.10%)
78(100%)
20.
Having a child with sicklecell anaemia is a disgrace to the family.
0
21
(26.92%)
50
(64.10%)
7(8.98%)
0
78
(100%)
21. Public education about sickle cell anaemia would help people plan and prepare for their own families.
50
(64.1%)
17(21.79%)
9(11.55%)
0
2(2.56%)
78(100%)
75
Man in Society ISSN 2347-1530Volume 23, 2016, pp. 69-77

22.
The law should have no authority over a person1s right to marry or have children.
0 15(19.23%)
10(12.82%)
53(67.95%)
0 78(100%)
23.
Screening programs for sickle cell disease is necessary for providing better health care and counselling services.
57(73.07%)
13(16.67%)
8(10.26%)
0 0 78(100%)
24.
Parents should give more attention to their sick children because they have fewer opportunities to participate in normal childhood activities.
65(83.33%)
13(16.67%)
0 0 0 78(100%)
25.
People having sickle cell trait should be prevented from having children. Sickle cell anaemia and sickle cell trait is being used by politicians to get votes
0 32(41.03%)
33(42.31%)
9(11.53%)
4(5.13%)
78(100%)
Understanding of Sickle Cell Anaemia of Different Individuals:
Table-VIII represents both the patients understanding of his illness and that of the other
members of the family. For this study total 78 subjects were included among which 43 individuals are patients. The number of parents, siblings, grandparents and other members are 17, 15, 2 and 1 respectively.
Table VIII Distribution on Understanding of Sickle Cell Anaemia of Different Individuals
Category Good Fair Poor Not discussed
No % No. % No. % No. % No. %
Patient (n=43) 22 51.16 12 27.91 6 13.95 3 6.98 0 0
Parents (n=17) 8 47.06 6 35.29 2 11.77 0 0 1 5.88
Siblings (n=15) 7 46.67 6 40.00 2 13.33 0 0 0 0
Grandparents (n=2) 0 0 2 100 0 0 0 0 0 0
Other members (n=1) 1 10 0 0 0 0 0 0 0 0 0
Total (n=78) 38 48.72 26 33.33 10 12.82 3 3.85 1 1.28
Dont Understand
Increased financial burdens due to frequent and extensive hospitalizations and medical care, and infrequent or inadequate insurance coverage were suggested as factors creating difficulties for the families. Therefore many families rely on traditional medicines. Further research can explore
all these above facts. As I mentioned before understanding level is more in case of SCD affected individuals than the other family members, which implies after the diagnosis they came to know more about the disease. Hence there exists lackof awareness among the community.
Assessment of Knowledge, Attitude and Awareness 76

4. CONCLUSION AND SUGGESTIONS
The purpose of this study was to explore the psychosocial responses made by families in adjusting to the painful reality of having a family member with sickle cell, psychosocial attitude of the people affected with SCD, knowledge, beliefs of patients living with SCD, and awareness among the studied people in Koraput district.
In conclusion, there appeared to be a not satisfactory general knowledge and awareness of sickle cell disease in the identified target samples. One very important issue in this study is that, the studied individuals have no knowledge about biological inheritance patterns and the cause of SCD. But overall understanding level of SCD among the studied people is statistically significant,with many interesting comparative responses to the attitudinal survey. Within all the study conducted by the peer-reviewed authors, there were no studies conducted on a combination of psychosocial attitude, general knowledge and awareness among SCD patients and their family members in Koraput.
In response to collected data from the families experiencing sickle cell anaemia, and from the search of literature, the following recommendations are made:
Ÿ In the studied area it was found that all most all persons marry without testing their blood and also they prefer to marry their nearer people and relatives that lead to a greater probability to be a carrier or affected with SCD. Hence village wise awareness programmes should be implements in the sickle cell belts.
Ÿ All persons experiencing genetic disease have the option to choose genetic counselling and sufficient community education to know they have this choice.
Ÿ That all genetic counselling include supportive family therapy and education over a sufficient period of time, so the family can integrate the information into their own life systems.
Ÿ That community educative effort is initiated to help parents learn and- understand more about sickle cell anaemia.
References
BallasSK, Gupta K, and Adams-Graves P. 2012. Sickle cell pain: a critical reappraisal. Blood; 120 (18): 3647–56. doi:10.1182/blood-2012-04-383430. PMID 22923496.
Darbari D. S, Kple-Faget P, Kwagyan J, Rana S, Gordeuk V. R and Castro O. 2006.Circumstances of d e a t h i n a d u l t s i c k l e c e l l d i s e a s e patients.AmericanJournal of Hematology; 81, 858–863. doi:10.1002/ajh.20685.
Herrick JB1910 Peculiar elongated and sickle-shaped red blood corpuscles in a case of severe anaemia.rch. Intern. Med5): 517–21.
How s Sickle Cell Disease Treated?National Heart, Lung, and Blood Institute. June 12, 2015. Rtrieved 8 March 2016 (ww.nhlbi.nih.gov
Leaning About Sickle Cell Disease National Human Genome Research Institute. May 9, 2016. Retrieved January 23, 2017. (ww.nhlbi.nih.gov
LebbyR 1846 Case of absence of te spleen.outhern J of Med Pharmacology1: 481–83
Owotomo J. 2016 The Socioeconomic and Cultural Impact of Sickle Cell Disease in Nigeria.
Rees DC, Williams TN, and Gladwin MT 2 0 1 0 S ick l e - ce l l d i s ea s e . a n ce t ( Lo n d o n , England)376 (9757): 2018–1. doi:10.1016/s0140-6736(10)61029-x. PMID 21131035.
Serjeant GR, Serjeant BE(Editors. 2001 Sickle cell disease. (3rd ed). Oxford: Oxford Univ Press.
Sickle-cell disease and other haemoglbin disorders Fact Sheet N08 January 2011. Retrieved 8 March 2016.
Washburn,and R.E. 1911 Peculiar elongated and sickle-shaped red blood corpuscles in a case of severe anaemia. he Virginia Medical Semi-Monthly15 (21): 490–93.
Welkom, J. S. 2012 The Impact of Sickle Cell Diease on the Family : An Examination of the Illness Intrusiveness Framework.
What Are the Signs and Symptoms of Sickle Cell Disease?.National Heart, Lung, and Blood Institute. June 12, 2015. Retrieved 8 March 2016. (www.nhlbi.nih.gov)
What Causes Sickle Cell Disease?.National Heart, Lung, and Blood Institute. June 12, 2016. Retrieved 8 March 2016. (www.nhlbi.nih.gov)
What Is Sickle Cell Disease?.National Heart, Lung, and Blood Institute. June 12, 2015. Retrieved 8 March 2016. (www.nhlbi.nih.gov).
77
Man in Society ISSN 2347-1530Volume 23, 2016, pp. 69-77

Urban Transformation of Cities: A Case Study of Bhubaneswar city
1Krishna kumar A 2Prof.UpaliAparajita
Abstract
Cities are indispensable to nations as they are the hubs of economic growth and innovation. Cities have been witnessing a growing middle - class population explosion urbanization. By the year 2050 approximately 70 percent of the global population is projected to living cities. India is also experiencing this trend with and exponential growth of urban population owing to more employment and entrepreneurial opportunities and good quality of life.The story of urbanization in India in historical times is a story of spatial and temporal discontinuities. The earliest urban developments were confined to the Indus valley and the adjoining parts of Rajasthan, Punjab and, to some extent, western Uttar Pradesh while the other parts ofthecountry remained outside the pale of urbanization. In the early historical period, urbanization took place in the middle Gagnetic plains andin the southern part of the Indian peninsula whereas the areas inbetween had no know cities. During much of the historical period, vast parts of the country were untouched or only partly affected by urbanization. The present paper highlights that although urbanization in Odisha prior to independence of the country was only three percent which has now risen to around seventeen percent in the last decade, its capital city Bhubaneswar has evolved from a small temple town, as an administrative city, to its selection as a smart city in 2016. The paper discusses the urban spacio-temporal transformation of the city of Bhubaneswar in the light of the global transformation of urban areas.
Key words: urbanization, transformation, cities, smart city.
1. Introduction
The twenty-first century is likely to be dominated by urban living in a way that we have not experienced before. Over half the world's populations are now city dwellers. By 2025, according to World Bank estimates, 88 percent of the world's total population growth will be located in rapidly expanding urban areas and 90 percent of that urban growth will be absorbed by the developing world (World Bank 1996). Having said this, it is also important to appreciate that cities contain enormous diversity. Crucial in creating these differences have been the pace at which cities have grown, their historical roots and the layers of physical and social structure that have given rise to the present social and physical infrastructures and practices. At the present day, we have the phenomenon of the incredibly fast growth
1 2Ph.D scholar , ProfessorDepartment of Anthropology, Utkal University, BhubaneswarCorresponding author E-mail: [email protected]
of areas such as Pudong in China, the new economic zone of Shanghai, which has gone from green fields and farming in nine years to an urban area of 1.8 million people (Shanghai: Pudong New Area Press Office 1998). This new area is being promoted as the financial, information, and manufacturing hub of the increasingly market-oriented Chinese economy. At the other end of the spectrum, we have centuries-old cities in Europe where the additions and refurbishment to the urban landscape have occurred much more gradually over time. The urban world are now more interconnected than they have ever been before through new systems of communication that has developed and shaped the present 'information age'.
Transformations have occurred at every level of the global economic, political and social structures in
78
Man in Society ISSN 2347-1530Volume 23, 2016, pp. 78-95

the ways that people fashion their everyday lives. Though people share a globalculture today, yet, at the same time, they live out their lives in 'local places' – in houses, neighborhoods, cities, regions and nations. ransformation implies changes over time and thus an appreciation of the importance of the history of any particular city's development. The present urban fabric results from successive generations of settlers leaving their mark in both the physical structure and in the political, economic and social institutions. To understand the present thus requires some reflection on the past course of urban growth and development. These urban settlements have been through a number of transformations since it emerged in human history. The first settlements arose at a time when the capacity of societies had grown such that they could become more settled and permanent. A move from hunting and gathering towards agrarian production occurred leading to surplus production and the emergence of new classes within the population who had greater wealth and a more differentiated set of tasks and lifestyles. There was thus the need for an administrative system to complement the family and clan structures which had provided the basis of social organization. Cities are relatively recent developments emerging around 3000–4000 BC in the Nile valley and Mesopotamia of the Fertile Crescent. They first became significant as places of trade and governance – activities, which were to continue to be significant for decades to come. Later, around 2000 BC, cities also emerged in Crete, the Yellow River area of China, Greece, and the Indus valley. In South America, the Mayan Aztec urban settlements date from the first millennium AD (Carter,1983)As the settled parts of the world grew in Europe, urban areas and cities became a feature of the landscape. Over time, they grew from small settlements for trade and fortification into grander political, economic and cultural centers. London, for example, in Roman times was a site of imperial activity. With the fall of the Roman Empire, its importance waned and it was some centuries later when it started to become again a center of trade, commerce, and political power. The division was sharp between the city of London, a place of trade and merchants and the newer city of Westminster, the site of the court and Government. Early discussions about a city reflected these aspects and thus emphasized the city as a political
entity and as a marketplace for trading and wealth generation. Many cities were city-states and, as such, wielded considerable economic and political power in the centuries before nation-states became the dominant geopolitical entities(Weber 1899).
The major transformation that created the most rapid shift in patterns of settlement from the country to the city was the rise of the modern industrial city(Giddens 1987). The Industrial Revolution of the eighteenth and nineteenth centuries ushered in the modern world, a world where manufacturing production was the driving force of societies. The new wealthy and powerful were not the aristocrats and landed gentry or the merchants and their guilds, but industrial capitalists making the new commodities of an industrial age. The rise of industry required the harnessing of new resources and new forms of energy to drive machinery in the growing number of factories. New locations thus became significant. Labor was required for the factories and housing developed for workers close to the new sources of employment. Industrial cities grew rapidly providing sharply differentiated residential locations for the new workers and new bosses (Weber 1899). Thus urbanization was the dominant spatial process of the nineteenth and an early twentieth century's in the industrializing world. Britain, for example, in 1801 had 85 percent of the population still living in rural areas. By the middle of the nineteenth century, this had changed and more people lived in urban areas than in the country and almost one third lived in towns with a population over 50,000 (Mellor 1977). Power and wealth shifted from the older port and merchant cities to the new industrial cities. The discovery of the new world and migration were also to change the population distribution and impact on city growth(Elliott and McCrone 1982).
In the latter part of the twentieth century, a further transformation took place from the industrialized modern system of cities based around wealth created from large-scale commodity production for a mass marketplace, to a new system based around the generation of wealth from information services which are globally organized. Cities now compete in an international system where there are new hierarchies of power and opportunities from the core global cities of New York or London or Tokyo where the world's information and the financial
Urban Transformation of Cities: A Case Study 79

super highway is centered to regional and local centers. The various centers intersect with the global system in a variety of ways creating the differences and local variations which are visible across the cities of the world (Friedman 1995).Although all cities are increasingly drawn into a system of global relations, local identities have survived and are part of what, in the end, creates their competitive advantage which increase the quality as well as the quantity of life andhas become an important global issue (Sassen,1991).Globalization has been a key factor in urban transformation in the last two decades of the twentieth century. Globalization is not a product but an interrelated set of processes, economic, social, political, cultural and ecological, that are continuing to shape the world in which we live. These globalizing processes crucially affect the city as this is the place where most people live. For some, globalization has brought increased homogeneity, for others the result is difference and heterogeneity. For some, global processes have impacted upon the local in ways that have reduced our ability as individuals, families and communities to shape our lives. For others, resistance is still possible and in fact a very significant part of the global world. Exploring the dimensions of city transformation from the industrial modern city to the global city will require an interrogation of these claims and can be addressed through an examination of the way the city has been reshaped over the second half of the twentieth century(Knox,1996).
In developing the cities, the agendas are likely to be different. Some are still passing through the industrializing phase of their development but are doing so at a much greater pace than was the case for western cities. Many of them are also experiencing a faster rate of growth of their population than of their economic capacity leading to many migrants occupying squatter and marginal forms of housing and getting by in the informal economy rather than the formal. The imperative to growth and the need to be part of the 'globalizing economy' for many of these cities are just as strong as it is for the older cities of Europe, and the restructuring that has occurred and continues has led to both social and spatial inequalities and new forms social of exclusion. Some studies on urban transformation tend to rely less on the search for causes and look more towards the contextual and contingent aspects of change. They are more likely to be grounded in
the study of the local and the everyday life of the urban dwellers. They are less concerned with predicting the pattern of change and more focused upon the meaning attached by individuals and groups to their place – their home, community, neighborhood, and city (Featherstone 1991). Thus, the latest set of transformations of this century has centered on the shift to the knowledge and information industries which are less dependent on being physically located within particular regions. Their raw materials are ideas and knowledge and thus require research-centered institutions and access to knowledge flows. Much of these are now information technologies, ones associated with computers on the Internet and the World-Wide Web. The new forms of wealth creation are however not evenly spread across the globe and questions of access and control are still significant.
History of Urbanization in India
The Indian subcontinent shares with Mesopotamia and Nile Valley a long history of urbanization. The first phase of urbanization in the Indus valley is associated with the Harappan civilization dating back to 2350 BC. The cities of this civilization flourished over a period of more than 600 years up to about 1700BC after which there are no evidence of urban development till around 600 BC,when there are towns and cities associated with the two major, but closely related, cultural streams of India, namely the Aryan civilization of the north and the Dravidian civilization of the south. From this period onwards, for about 2500 years, India has had a more or less continuous history of urbanization. However, we know from historical evidence that there were both periods of urban growth and periods of urban decline. Thus cities grew in number and in size during the Mauryan and post-Mauryan period (from 300 BC to AD 600), both in northern India as well as in the extreme south. Cities declined and were largely neglected during the post- Gupta period that is from AD 600 to about AD 1000 in northern India. In southern India, on the other hand, urbanization attained its zenith during the period from AD 800 to 1200. Urbanization on a subdued scale flourished in northern India under the influence of Muslim rulers who came to India from Afghanistan and beyond from around AD 1200, and attained the second climax during the Mughal period when many of Indian's cities were established. The early part of
80
Man in Society ISSN 2347-1530Volume 23, 2016, pp. 78-95

British rule saw a decline in the level of Indian urbanization while during the latter half of British rule, Indian cities regained some of their lost importance future, several new towns and cities were added, in addition to generating newer urban forms in the existing cities. The post- Independence period has witnessed urbanization in India on a scale never before achieved.
Many well-known cities of prehistoric and historic times exist today in the form of small mounds or ruins such asMohenjodaro, Harappa, Naland, Taxashila. In most historical cities likePataliputra, Madurai, Kancheepuram, Varanasi,and Delhi, the past has been partly or totally obliterated, while in some cases, the old structure and street layouts are still in evidence. The beautiful temples of southern
thcities belong to the 12 or 13 centuries, while the thmonuments of the Mughal period belong to the 16
thand 17 centuries. In Varanasi, which is perhaps India's oldest existing city, there is no trace of structures dating back to more than 300 years. The cities of Nasik, Jaipur, Moradabad, Kanpur, and Shimla testify to their widely different socio-cultural origins. The emergences of industrial cities such as Bokaro, Bhilaiand Rourkela have added another dimension to the already variegated nature of Indian urbanization.
On the basis of the temporal discontinuities in Indian urbanization,Ramachandran (1989) has divided the urban history of India into five time periods which are as follows:
1. the prehistoric period – 2350 to 1800 BC,
2. the early historical period – 600 BC to AD 500,
3. the medieval period – AD 600 to 1800,
4. the British period – AD 1800 to 1947, and
5. the post –Independence period.
The first phase of urbanization in the Indian subcontinent dating back to 2350 BC began in the Indus Valley region even though, prior to this, there is sufficient archaeological evidence of Paleolithic and Neolithic settlements in northern, central and southern India and in the border regions of Afghanistan and Baluchistan. The evidences of the practice of agriculture, domestication of animals, wheel-thrown pottery, painted wares, stone and
later, copper and bronze implements were clearly marked in these areas. These evidences shows a fairly thorough understanding of the city development, such as the spatial extent of the cities, the outline of their streets, the types of constructions and residences and the materials of which they were made. Concrete evidence of writing in baked tabloids provides additional information about the social cultural life of the people. Any civilization is the product of its people. The persons of different racial types- Proto-Australoid, Mediterranean, Mongoloid and Alpine- points to towards a composite culture. The Harappans were primarily an agricultural people who settled on fertile plains where flood waters provided means of natural irrigation. The twin cities of Mohenjodaro and Harappa represents the climax of urban development extending over more than an approximate area of two square kilometers and had population of around 30,000 persons. The city consisted of two component parts: (1) a citadel built on high ground and always located on the Western side of the city. It was fortified and consisted of a number large halls and palatial residences for the nobles and high priests, a great bath and state gallery, thus, representing the capital area. (2) the lower city built on a grid iron pattern where streets were aligned east- west and north – south . The city had an elaborate drainage system, with covered drainage channels along the street and manholes for periodic cleaning. The house drains were connected to the street drains and after partial purification in soak-pits , the sewage was drained into the river. Water supply for the city population was available from brick- lined wells. The lower city housed residences of the ordinary people of the city. Other smaller towns like Lothal, Kalibangan, Rangpur etc, functioned as regional centers. The Harappan cities flourished till about 1700 BC when their general condition deteriorated and progressively declined.
The second phase of urbanization in India began around 600 BC. The architect of this phase was the Aryans in the north and the Dravidians in the south. The parallel and independent urban developments are later culturally interlinked by large-scale migration of Aryan people to southern India, particularly the Brahmins, Jain, and Buddhist monks, starting from around 300 BC. These migrations initiated a process of Sanskritization of the Dravidian south, resulting in the emergence of a
Urban Transformation of Cities: A Case Study 81

composite culture. This phase of urbanization is important as it became a permanent feature in India and is substantiated by great literary texts in the three periods namely post-Vedic period, Mauryan-period and post- Mauryan period . These periods indicate the early origins urbanization with its climax in the Mauryan period the earliest cities during this phase Hastinapura, Sravasthi, Kapilavastu, Ujjain, Mahishamati, Champa, Rajgir, Ayodhya, Mathura, Taxshila, Pataliputra, Varanasi and Kausambi whose locations were supported by both literary and archeological evidence in the North. The major cities in the South were Puhar, Uraiyur, Korkai, Madurai, Musuri, and Vanji. The city was the center of urban administration as well as a center of manufacturing industry. An advanced system of guilds of merchants and industrial labors regulated the manufacture of goods. The urban society was stratifiedwith caste and occupation being the primary indicator of status. The use of iron was important in many ways for setting the stage for the urbanization as it widened the area of settlement, generated large food supply by the use of iron ploughs, lead to the manufacture of horse-driven chariots for warfare and ox-driven carts for transportation, and increased mobility helped trade and commerce.
thThe decline of an urban center that began in the 5 century AD during Gupta period, and continued during the succeeding centuries in northern India, which witnessed political disintegration of large empires and unstable dynastic regimes. The decline of Buddhism gave rise to the revival of Hinduism. The concept of Bharatavarsha now included the entire South as well as the North. Sankaracharya of
thKaladi in the 8 century AD, who contributed in large measure to the revival of Vedic religion, traveled widely over the country and established four months in the four corners of Bharatavarsha – Joshimath in the Himalayan region, Puri in Odisha, Dwarka in Gujarat Sringeri in Karnataka. These centers have emerged asanurban place of great religious important wielding enormous influence all over India. The most significant aspect of these places is their continuity throughthehistory of present times. During the period, the decline of urban centers in the North was paralleled by the emergence of powerful Hindu Kingdoms and urban centers in South in India. Urbanization in North India, on the other hand, further suffered from
Muslim invasion from the Northwest. The story of urbanization during this period is a story of turmoil in the North and rapid growth in South.
During the medieval period, urbanization the South received a strong stimulus and numerous cities came into existence. A major feature of urbanization was closely identified with the rise of dynasties and kingdoms as well as influence of Brahmanical religious customs and rituals. This explains the dominance of the temple and the religio- political elite of southern cities. The major kingdoms in the south during this period were Chalukyas of Karnataka, Ishvakus of Krishna- Godavari region, PallavasofKancheepuram, Rahtrakustas of Malkhed, Hoysalas of Belur and Kakatiyas of Warangal. Important cities include Vatspi, Nagarjunakonda, Dharanikota, Vijayawada, Rajhmundry, Nellore, Trichirappalli, Tanjoretc, A major feature of the societies is the presence of temple gopurams which served as the focal center of the city. The upper castes lived in concentric circles around the temple while the lower castes lived in the periphery of the city and were not allowed to come near the temple. The streets leading outwards from the gopurams were used for commercial activities and linked the inner city with the peripheral rural regions beyond the city.
In the north this period marks a major political as well as cultural shift in the Indian urbanization the Muslim dynasties included the Slave dynasty followed the Khiljis ,Tughluqs and Lodis. For the first time Islamic influence made its impact on the urban landscape. Mosques, forts, palaces reflect Islamic art and values during this period. A new Muslim urban culture arose with the kings, nobles and military at the apex. Persian became the court language and fashions were determined by Persian customs and manners. The city and the country side were largely alienated from each other during this period. The Mughal period (AD 1526-1800) stands out as high watermark of urbanization in India and saw the revival of the older established cities, the addiction of new cities and the building of an impressive array of monumental structures. The Mughal Empiric overs the whole of northern India for Assam to Gujarat including present Pakistan and Bangladesh. The empire divided into provinces which contained many cities, small towns and large villages. The urban system was dominated 16 large
82
Man in Society ISSN 2347-1530Volume 23, 2016, pp. 78-95

cities such as Agra, Sikri, Delhi, Ahmedabad, Cambay, Ellichpur, Burhanpur, Ajmer, Ujjain, Mandu, Awadh, Lucknow, Aaranasi, Jaunpur, Bihar, and Cuttack. At the southern fringe of the mughal empire, the Marathas, the Bahmani kingdoms, Vijayanagar Empire and Nizamof Hyderabad stimulated urban growth Golconda, Hyderabad, Bijapur, Aurangabad and Pune are outstanding example of the urban development during this period. The capital cities- Delhi , Agra, FatehpurSikri- were the largest and most impressive. A major characteristic of Mughal cities building of forts were the entire royal entourage lived. The ordinary people lived outside the fort. The chowk constituted the main market which was the home of the craftsmen and local industry selling a variety of goodsand also the mosque or Jama Masjid, which is the symbol of Islamic culture. The palaces was large structures while the outer city was divided into mohallas or localities with narrow streets. All cities had an outer wall for defending the cities from invadersand gates for regulating entry the cities had planned network of roads and streets. A major factor contributing to urbanization during this period was the growth of traditional industries which was an urban activity and the market were full of goods of high quality. A number of trading centers carried out external trade to West Asian, South-east Asian, and European markets.
The European phase of India's urban history has its beginnings, ironically, in the period during which Mughal supremacy was at its height. The Portuguese were the first to established new port towns of Panaji (1510)and Bombay(1532). They were followed by the Dutch- Machilipatnam(1605) and Nagapatt inam(1658)and in French- Pondicherry(1673)and Chandranagore(1690). The British established themselves in Madras( Chennai)(1639)and Calcutta (1690). These port towns were used as trading centers. It is only in the
thearly 19 century and that the British established a firm territorial hold in India, and continued to exercised unquestioned sway over the entire country. The course of urbanization after 1800 in all parts of India was determined by British colonial economic policies and social attitudes. Around 1800 India had 16 cities and about 1500 towns located western and southern India while eastern India was least urbanized .The first Census taken by the British in 1872 showed decline from 11 percent in 1800 to
8.7 percent in 1872. This decline was primarily due to the negative attitude towards the traditional industries of India.
The major contributions of the British to the Indian urban scene were (1) the creation of the three metropolitan port cities, which emerged as the leading colonial cities of the world , (2) the creation of a chain of hill stations in the Himalayan foothills and in south India, and the introduction of tea and coffee plantations which produced a number of small settlements with distinct urban characteristics in Assam and elsewhere, (3) the modification of the urban landscape of the existing cities with the introduction of (a) the Civil Lines and (b) the Cantonments, (4) the introduction of the railways and modern industry which led to the creation of new industrial township such as Jamshedpur, Asansol, Dhanbad and so on , and (5) the improvements in urban amenities and urban administration.
Urbanization has entered a new and more important phase in the post-Independence period. In contrast with the British period, which witnessed a period, which witnessed a period of urban stagnation, the post-Independence period is notable for rapid urbanization, particularly of the one-lakh and million cities. There has been nearly a threefold increase in India's urban population, from 62 million in 1951 to 159 million in 1981. The proportion of urban population to total population has increased at a slower pace from 17.6 percent in 1951 to 23.7 percent in 1981. The major changes that have occurred in India's urban scene in the post-Independence period are :(1)The influx of refugees and their settlement, primary in urban areas in northern India,(2)The building of new administrative cities, such as Chandigarh, Bhubaneswar and Gandhi Nagar,(3)The construction of new industrial cities and new industrial township near major cities, (4)The repaid growth of one-lakh and million cities, (5)The stagnation and in some cases decline, of small towns, (6)The massive increase in squatter and the proliferation of slums in the million cities and the emergence of the rural-urban fringes and , (7)The introduction of city planning and the general improvement in civic amenities.
There has been a steady increase in India's urban population over the decades. The population has
Urban Transformation of Cities: A Case Study 83

increased to 31 percent from 26 million in 1901 to 377 million in 2011. Urbanization in India presents a contrasting picture – a large urban population with low urbanization and showing a growth of 2.76% per annum during 2001-2011.The annual exponential growth - rate of urban population and rate of urbanization show that urban population of India was about 79 million in 1961, which constituted about 18% of the total population. The average growth rate of the urban population was 2.32% during 1951-61 which accelerated up to 3.79% during 1971-81. This was the highest urban growth since independence. After 1981, the urban growth rate decelerated to 3.09% during 1981-91 and further declined to 2.75 during 1991-2001. However, the declining growth- rate was reversed during 2001-2011. The number of urban centers increased from 3,126 in 1971 to 5,161 by 2001 and to about 8000 in 2011. According to the 2011 census, urbanization has increased faster than expected. This has reversed the declining trend in the growth rate of the urban population observed during the 1980 and 1990. Also, for the first time since independence, the since independence, the absolute increase in the urban population was higher than that in the rural population. This has huge implications on infrastructure and provision of other civic amenities in urban area. Census of India classifies urban centers into six categories based on population ranges. In each size class there can be some fast growing cities and towns and some slow growing. One feature of India's urbanization is the growth of large and metropolitan cities. This is a challenge on India's urbanization. In 1901 only Calcutta had more than a million populations, the number increased to 12 by 1981, to 23 by 1991 and to 35 in 2001 At the Census 2011, there are 468 such UAs/Towns. The corresponding number in Census 2001 was 394. The 53 metropolitan cities contain 19.24 percent of the total urban population of India. However, as a proportion of the entire population of India the 53 metropolitan cities account for just 6 percent of the total population. One aspect of metropolitan growth is that there is very favorable spatial spread of these large cities that may help in achieving the goals of balanced urban development. Today Mumbai is the most populous city of the country followed by Kolkata, Chennai and Delhi. These four cities have remained at the top of India's urban hierarchy. (SAAP, 2017-18).
2. Urbanization Trend in Odisha
Ever since the occupation of Odisha by the British in 1804 , the administration of the province had been characterized by alternating rebellions, droughts
st,floods and famines. On April 1 1936 Government of India promulgated the Constitution of Odisha order under Section 298(i) (b) of the Government of India Act of 1935. This heralded the birth of Odisha as the eleventh province of British India. The occasion marked the culmination of the Odisha movement for a separate province on a linguistic basis. Following India's independence, the area of Odisha came to be almost doubled and the population increased by a third, by the addition of 24 former princely state. In 1950, Odisha became a constituent state in the Union of India.
According to 1941 census, only three percent of the total population in Odisha lived in cities and towns as against 13.86% for India. Though the percentage of urban population is less in Odisha, the pace of urbanization in the State between 1941 and 2011 was low compared to the pattern for the country as a whole. In the 2011 census, the proportion of population living in urban areas in Odisha was 16.68% compared to31.16% for the country. Odisha
stranks 31 in list of most urbanized states of the country, while in terms of actual urban population ,
ththe state ranks 11 in the list of state with largest urban population. Based on 2011 census figures, the urban areas in Odisha are classified into six categories with a total of 223 towns, as illustrated in the Table1:The size of population of people engaged in non- agriculture activities and industrial areas have been considered as the major criteria for the constitution of urban local bodies (ULBs). Odisha does not have a metropolitan city as per 2011 but in future Bhubaneswar and Cuttack with 881,988 and 658,989 population are like to join the metropolitan category. Table 1 : Classification of Towns in Odisha
Category of Towns
Class I Cities (Population 100,000 or more)
Class II towns (Population 50,000-99,999)
Class III towns (Population 20,000-49,999)
Class IV towns (Population 10,000-19,999)
Class V Towns (Population 5,000-9,999)
Class VI towns (Population 4,999 and below)
Total
Source : Census 2011
No.of Towns
101
14
43
49
78
29
223
84
Man in Society ISSN 2347-1530Volume 23, 2016, pp. 78-95

1 Including Rourkela ITS due to its population size but previously not included due to its status
Figure : 1 illustrates the urbanization trends in Odisha showing the percentage urban population of India, compared to the urban population of the State for the period 1941-2011. Prior to 1951, there were only 39 urban centers in Odisha, which has increased
to 138 (2001) and 223 (2011). The percentage of population living in urban areas in the state has gone up from 3% (1941) to 14.97% (2001) and 16.68% (2011). Table 2: shows the growth trend of nine developing cities in Odisha from 2001 to 2021. Figure 2: shows the Graph of the growth trend increasing from 1971 to 2021.
Figure:1 Trends of Urban Population Percentage in Odisha
Urbanisation in India & Odisha
20.19
3.5
17.29
4.06
17.97
6.32
19.91
6.41
23.34
11.79
25.72
13.38
27.78
14.97
31.16
16.68
% o
f ur
bani
sati
on
1941 1951 1961 1971 1981 1991 2001 2011
India Urban Odisha Urban
Source: Census 2011
Table : 2 Growth trends in Odisha Cities
Source: Census 2011
Bhubaneswar I I M.Corp. 105.491 219,211 411,542 658,220 843402 1033816
Cuttack I I M.Corp. 205.759 295,268 403,418 534,654 610189 684226
Berhampur I I M.Corp. 117,662 162,550 210,418 307,792 356598 404912
Rourkela I I M.Corp. 47,076 96,000 152,690 259,553 310976 284952
Puri I I M 72,674 100,942 125,199 157,837 200564 245556
Sambalpur I I M.Corp. 74,458 112,631 134,824 157,253 335761 210651
Balasore I I M 46,239 65,779 101,829 127,358 118162 110265
Baripada I I M 28,725 52,989 69,240 100,651 109743 118393
Bhadrak II I M 40,487 60,600 76,435 92,515 107463 122286
Town class2001
class2011
C_status Pop-1971
Pop-1981
Pop-1991
Pop-2001
Pop-2011
Pop-2021
Urban Transformation of Cities: A Case Study 85

Source: Census 2011
3. Transformation of Bhubaneswar As an Urban City
Categorized as a tier-2 city, Bhubaneswar replaced Cuttack as the capital of Odisha in 1949. Designed by Otto Königsberger in 1946, Bhubaneswar, along with Jamshedpur and Chandigarh, is known as one of India's first planned cities. Due to the presence ofreserve forests in the north-western part and flood plains in the eastern part, the cityhas grown more towards the south-west . Currently, the Bhubaneswar Municipal Corporation (BMC) is spread over an area of 135square kilometers, covering 67 administrative wards. According to Census 2011, the city has a population of 885,363 people, with a 'slum' population of 163,983 people (18.5 percent).
Brief History of Bhubaneswar
Bhubaneswar is the capital city of the state of Odisha. Renowned as the city of temples, has been a place of religious and cultural efflorescence through the ages and today the city reflects a unique harmony between antiquity and urbanity. A number of puranas, historical monuments, shrines and other ruins throw ample light on the rich cultural heritage of Bhubaneswar. The name Bhubaneswar comes from the word 'Thribhuvaneswar' which means 'The Lord of the Universe'. Ancient Sanskrit literature mentions Bhubaneswar as Ekamrakshetra ( mango forest) , named after the mango groves in the area, which developed around the Lingaraj temple which
was erected to commemorate the Svayambhu Lingam ( phallus made out of natural stone) that stood under a mango tree. Bhubaneswar which first witnessed prolific activity of temple building in the seventh century A.D. , experienced several changes earlier in its physical form, ethnic composition, religious character and its role as a subcontinental socio-religious center from one century to another . The city's character alternated among different religion namely Buddhism, Jainism, Shaivism and Vaishnavism which found a home in Bhubaneswar.
The history of Bhubaneswar began during the Mauryanperiod under emperor Ashoka (269- 232 B.C), who chose a hill outside of Bhubaneswar for the promulgation of his rock edicts, including the two special Kalinga edicts, and for erecting a pillar. The excavations at Sisupalagarh, five kilometers to the southeast to Bhubaneswar, take the origin of the old city back to the fourth or third century B.C, lending credence to the belief that the city of Tosali, the regional administrative capital of Ashok, might have been situated in the neighborhood of Dhauligiri, eight kilometers south of Bhubaneswar. Political events in Odisha after the close of the Mauryan period became diffuse, involving different dynasties and people. The next phase in the history of this city was the rule of king Kharavela(159 B.C)of the Chedis dynasty under whose patronage the Hatigumpha and Ranigumpha inscriptions in the twin hills of Khandagiri and Udayagiriindicate the stronghold of Buddhism and Jainism in Odisha.
86
Man in Society ISSN 2347-1530Volume 23, 2016, pp. 78-95

Buddism reasserted itself in Kalinga under the Murunda dynasty in the third century A.D, however, when parts of Bihar and Odisha came under the rule of Murunda kings. A controversy remains as to whether the Guptas ( A.D.320-550) occupied Odisha or not. Early history unequivocally maintained that there is no evidence to prove that any part of Kalinga was included in the Gupta Empire. A more recent study has argued that there are evidences to show that the Guptas were in occupation of at least the coastal districts of Odisha. In spite of the controversy, the sheer size of the Gupta Empire must have exerted enormous influence on Kalinga. The discovery of copperplates and sculptures bearing the Gupta dates points to the presence of Gupta cultural influence in Odisha. Moreover, the conversion of the Buddhist pillar into a Shaivite phallic emblem in the fifth century points to a struggle between the two faiths. The Hindu cultural renaissance continued till the seventh- century when the ShaiviteGauda king Sasanka ruled Kalinga. A devout Shaivite, he builted several Shivite temples on the ruins of Buddhist monuments in the Bhubaneswar. Tradition credits him with erecting the famous Lord Tribhuvaneswara (The Lord of the three worlds) temple, from which the city derives its name. Though none of the monuments built by Sasanka have survived, it is probable the eleventh country Lingaraja temple in Bhubaneswar was built on the ruins of the Tribhuvaneswara temple.
There was a sudden outburst of temple building in Bhubaneswar in the seventh century, of which the best preserved Parasuramesvara temple built by Madhavaraja Sailodbhava II of Kongoda (modern Ganjam) who was feudatory of the Gauda king Sasanka. The political fragmentation of Kalinga that followed the death of Sasanka resulted in the rise of three separated kingdoms of Odra, Kongoda, and Kalinga. The Sailodhava kingdom included both Bhubaneswar and Puri which has been determined by the discovery of Sailobhava copperplates from the two areas. The Bhauma-karas succeeded the Sailodbhava, occupying Bhubaneswar sometime before A.D. 736, built many temples here. Bhauma-kara rule challenged the caste and the orthodox practices of Shaivites in Bhubaneswar. During this period, tantric (occult) practices entered Shaivism and Mahayana Buddhism which fosters tantrism became the dominated religion in the region. They
renovated Shaiva temples in Bhubaneswar and introduced Buddhist images and motives in these temples. This period also witnessed the rise of Shakti ( power) cult for the first time in the region. The syncretism of Shaktism, Shaivism and Mahayana Buddhism is best reflected in the sculpture of theVaitaltemple.
For nearly a hundred after the end of Bhauma-kara rule around A.D. 830, Bhubaneswar underwent yet another period of political uncertainty. In the first half of the tenth century, the Kesari kings of the Somavamsi dynasty ruled Kalinga. The Kesari dynasty was brahmanical and under its patronage Shiva worship prospered for over two centuries. Three Kesarikings -Yayati, Ananta and Lalatendu – used royal resources to complete the monumental Lingaraj temple at Bhubaneswar. The Kesaries are also credited the building of the Jagannath temple at Puri which became the center of the worship of Vaishnavism . However, nothing of the original temple have survived and the present temple was built in the twelfth century by Anantavarman Chodaganga of the Ganga dynasty. The Kesaries also performed Ashvamedha ( horse sacrifice) at Chaudwar now modern Cuttack, which became their capital. Kesarirule brought Odisha under one administrationand the royal support for art and architecture and tolerance of different cultures culminated in distinctive Odishian culture.
The vacuum created by the end of the Kesari dynasty was finally filled up by the Ganga dynasty in the last quarter of the eleventh century who revolutionized the religion in Odisha as they were the patron king of Vaishnavism.AnantavarmanChodaganga built many monuments and temples including the famous Jagannath temple at Puri. The Gangashad their capital at Cuttack, adopted local culture, supported Odia language and succeeded to make Kalinga to unified Kingdom. The religious syncretism of their age came to bear its imprint on art, architecture and literature. The great Sun temple at Konark bears the stamp of this syncretism, its many sculptures celebrating Shiva, Jagannath and Shakti cults. Even the Lingaraj temple at Bhubaneswar came under the influence of the new religious creed of Harihara, representing both Shiva and Vishnu. An inscription in the Jagamohana (audience hall) of the Lingaraja records a grant by a Ganga for the maintenance of a perpetual lamp in the temple and the Ganga are
Urban Transformation of Cities: A Case Study 87

believed to have added two new chambers to the temple, the natamandira (dance hall)and the bhogamandapa (dining hall) and are believed to have introduced some other Vaishnavite features during renovation. A reduced Odisha remained under Hindu rule until the middle of the sixteenth century, after which it yield first to the Mughals, then to the Marathas, and finallt to the British in the beginning of the nineteenth century. The end of Hindu rule in Odisha also brought an end to the period of temple building in Bhubaneswar.
The Temple Town (Up to 1948)
The old temple town had been the seat of a continuous culture of about 2,500 years. It covers an area of 510 ha and comprises of 4 villages namely Kapil Prasad, Bhubaneswar, Goutam Nagar and Rajarani .The o ld c i ty i s fea tured bya conglomeration of temples, monuments, Mandaps, heritage ponds etc. Initially, the old city had 1000 temples and at present, the total temples are limited to 320.
Majority of the existing temples are deteriorating rapidly and the precious stone carvings are also in damaged condit ion.The temple town of Bhubaneswar presents a mixed land use pattern with a congregation of residential, commercial, industrial and institutional uses in a single locality.
Ÿ Ribbonated development along major roads is prevalent with complete lack of planning.
Ÿ Inadequate road network system, results in traffic congestion in almost all roads of the old city. Moreover, inadequate parking space for vehicles also adds to the above problem. The roads are very often narrow with little possibility of widening as building have been constructed
Map no1: Bhubaneswar 1948
on either side leaving vast open lands behind.
Ÿ The open spaces are vacant and very often inaccessible. The interstices which were vacant till recently and could have been planned for land-scaping around the temple / monuments are fast getting filling up as a result of pressure of population on land.
Ÿ Due to pressure of development, these finest architectural and sculptural elements are slowly dominated by modern development and the same is gradually reducing its importance. In many cases the visibility of temples lost due to modern construction.
The “New Capital” (1948 – 56)
On 13th April 1948, Bhubaneswar got back its status when the foundation stone of the present capital township was laid by Pandit Jawaharlal Nehru, after a gap of 1600 Years. The present old temple town was formed and was confined to an area of 956 Ha. Later on, Bhubaneswar was born as the new capital of Orissa in close proximity of the old temple town, the Master Plan for the new township was prepared by the famous architect Dr. Otto. H.Koenigsberger in 1954 on the basis of the concept of neighborhood unit planning.
Map no2: Bhubaneswar 1948-56
Source: Odisha forest department Draft report
Source :Odisha forest department Draft report
The capital town was planned in 1948 and was built between 1948 and 1961 at a respectful distance from the temple town with no conscious steps taken to preserve the individual identities of each. The city grew fast and the intervening areas were filled up quickly. Today the “New Capital” presents a sharp contrast with distinct areas earmarked for residential, commercial, and institutional and such
88
Man in Society ISSN 2347-1530Volume 23, 2016, pp. 78-95

other uses. It comprised 6 units namely Units – I, II, III, IV, V and VI. With unit V earmarked for administrative functions, the other units were planned as residential neighborhoods with theaccent on horizontal rather than vertical growth.
Ÿ There is a total absence of provision of areas for a number of urban activities such as industrial, institutional etc. which were not envisaged then.
Ÿ With an absence of economy in allotting land for different uses, the development spread over large areas, with even residential quarters allotted in much larger areas then was necessary.
Ÿ Such a sparse development pattern resulted in much lower density of population, then was desirable and involved higher unit cost of infrastructure development.
Map no3:Bhubaneswar 1956-76
Growth of Institutions (1956 – 76)
During 1956-76 major administrative activities like secretariat, heads of departments and similar government offices came up in Bhubaneswar. The salubrious climate, availability of suitable land attracted a number of state level and regional institution such as Vanivihar, Sainik School, the Regional Research Laboratory, the Orissa University of Agriculture and Technology, the Government Press, the Institute of Physics and several industrial units like C.R. Factory, OMFED Chilling Plant, the Industrial Estate at Bomikhal and subsequently at Pandara were also established.
Also with the growth of population the need for developing residential areas both in private and organized sectors led to developments of Sahid Nagar (Unit – II), Satya Nagar (Unit – X), Surya Nagar (Unit – VII), Acharya Vihar and Lewis Road Housing Colony (Jayadev Nagar). The growth of Bhubaneswar during this period is shown in figure But in location of these institutions, the perspective growth of some of the major functions of the city, and the inter-relationship among the different city functions do not seem to have been considered. Much larger areas have been allotted to some of the
Map no 4: Bhubaneswar 1976 onwards
Source: Odisha forest department Draft report
Developments in Organized Sector(1976 Onwards)
Constitution of the Bhubaneswar Regional Improvement Trust (BRIT) in 1976 and subsequently the Bhubaneswar Development Authority (BDA) in 1983 and the role of institutional finance for mass housing in the organized sector appears to be alandmark in this phase of city's growth.The following major schemes and multistoried buildings were executed during the period:
Ÿ Housing Board Colony,VSS Nagar
Ÿ BRIT Colony, Laxmisagar
Ÿ BRIT Colony, Nayapalli
Ÿ BRIT Colony, Baragarh
Ÿ Chandrasekharpur Improvement Scheme
Ÿ GGP Housing Colony
Ÿ Palaspalli Duplex Complex
Urban Transformation of Cities: A Case Study 89
Source: odisha forest department draft report

Ÿ Housing Board Colony at Kapilprasad
Ÿ Housing Board Colony at Baramunda
Ÿ Housing Board Building
Ÿ IDCO Tower
Ÿ CRP Market
In all such cases economy of space and cost had influenced the structure as well as their immediate environment. Shortage of Government land and economy of scale contributed to construction of multistoried flats at Chandrasekharpur and buildings like IDCO tower, Housing Board Building, IPICOL Building etc. This phase also witnessed construction of number of market complexes like BRIT market at Laxmisagar, BDA's Suryakiran Market, Municipal market and Housing Board markets at Saheed Nagar, Ashoka Market at Station Square, Ruchika Market Complex at Baramunda and Municipal Market at Old Town. In all such constructions the availability of i n s t i t u t i o n a l f i n a n c e a n d d e m a n d f o r office/commercial space have played a key role towards a balance of space, economy anddesign.Although articulate and organized, these developments in the organized sector have followed the availability of government land. While inducing the pace of growth in the nearby areas in private holdings, the execution of housing schemes have not succeeded in articulating the development in such areas in desired manner. Many of the housing schemes in the organized sector are subsidized in terms of cost of roads, open space and infrastructure but in the nearby private areas cost of infrastructure is charged to the individual development leading to inadequacy of roads, open spaces and other infrastructure. A disparity in quality of environment prevails in many of the private areas adjoining the housing scheme areas executed in the organized sector.
Bhubaneswar after 2000
The city which was planned originally for 40, 000 people with an area of 1684 Ha of land is now accommodating about 10 lakhs people with an area of about 135 sq km. The shape of the present city has assumed nearly a rectangular form which shows the signs of development of the town on a vast unutilized undulating plateau. The city has extended in seven different directions during the last few decades by engulfing the fringe villages.
Map no5: Bhubaneswar after 2000
Source: Odisha forest department Draft report
This extension has got varied length and dimensions from the core of the original town, which has been supposed to lie at the Lingaraj temple area from the centre of growth of the original temple town, the present town has extended maximum towards north i.e. about 22.5 km. towards village Patia. Its extension towards north-west is about 14.5 km., west 11 km., south-west 8 km., south 6.5 km and east 9.5 km. Virtually it has no growth towards south-east due to the location of the flood plains of Kuakhai and Daya River. Presently the city has been extended up to the Chandershekharpur in the north and beyond Daya West Canal in the south. In the east, the development is confined to the Daya West Canal. In the west, the city has expended well beyond the Chandragiri Junction. The land between Day west Canal and the Kuakhai is put to the agricultural use, which is rapidly being put to Brick kiln. The present township of Bhubaneswar sprawls over 233 sq. km. comprising of total number of 2312 revenue villages. The shape of the city is almost dumble shape. Its boundary in the south, southeast and east are somewhat irregular. The city is divided into 30 wards under the Bhubaneswar Municipal Corporation control. There are also 204 more villages along the rural periphery, which are coming under the direct sphere of influence of the city.
Bhubaneswar as a smart city
The Smart Cities Mission is a bold new initiative by the Government of India to drive economic growth and improve the quality of life of people by enabling local development and harnessing technology as a means to create smart outcomes for citizens. The Indian government's smart city initiative has specified several possible funding sources –both
90
Man in Society ISSN 2347-1530Volume 23, 2016, pp. 78-95

conventional as well as innovative, in order to meet the 7.5 trillion INR amount required over 20 years. Beside central and state funding, the list includes possible funding from multi-lateral and bilateral development agencies, pooled municipal debt obligation facilities, municipal bonds, real estate investment trust and infrastructure investment trusts. For specific needs, depending on the nature of investment required, cities may be able to tap a few other funding sources. Institutional factors for achieving sustainable cities.
Ÿ Good governanceŸ PlanningŸ Legislation and policiesŸ Financing Ÿ Public and private cooperationŸ Education, training and development
Bhubaneswar has become the first Indian city selected as one of the finalists to compete for the World Smart City Awards at Barcelona in 2016. Bhubaneswar, the capital city of Odisha had topped among the first batch of 20 cities that were selected to be developed as smart city, according to urban development ministry sources, Bhubaneswar had submitted its proposal to the evaluating committee of the World Smart city Awards organized by Smart city Expo World Congress (SCEWC) Bhubaneswar Municipal Corporation (BMC) is the urban local body governing the city of Bhubaneswar, covering an area of 162.5 sq.kms with 67 wards and 51 revenue villages. Established in 1994, BMC as Bhubaneswar's apex body is the principal provider
of services for a better quality of life to the Bhubaneswar. The functions of the BMC include water supply, drainage and sewerage, sanitation, solid waste management, street lighting, and building regulation. Bhubaneswar Development Authority (BDA)is responsible for the statutory planning and development of the Bhubaneswar Development Planning Area (BDPA). It takes care of planned development in peri-urban area and at present its jurisdiction extends to 1110 Sq. Kms. and 556 revenue villages. BDA is responsible for creat ing development plans, regulat ing development and use of land, undertaking works pertaining to construction of housing colonies, commercial complexes and providing public amenities like water supply, drainage, sewerage, and transportation, social facilities etc.
Bhubaneswar's Area based Development proposal envisions to retrofit and redevelop 985-acres centered on main Railway Station in heart of the city to a vibrant 24×7 destination 'The Bhubaneswar Town Centre District (BTCD). As a signature intervention reflecting the city's image, the area will be :a walk-able , well-connected mixed-use area with public realm investments visible in its streets, public spaces and buildings ; A model of low-impact carbon neutral development using innovations in transportation and green infrastructure ; A model for achieving social equity by planning with children at the centre ; An economic engine supporting region's knowledge industry and providing pro-business environment. Bhubaneswar Smart City, 2013.
Map no6 : Proposed Area for Bhubaneswar Town centre (BTCD)
Source: Bhubaneswar smart city.org
Urban Transformation of Cities: A Case Study 91

Pan city smart solutions
The pan-city smart solution is aimed to benefit the entire city through application of ICT and resulting improvement in local governance and delivery of public services. Intelligent City Operations and Management Centre (ICOMC) will result in safe mobility, responsive city operations and management along with optimisation of capital expenditures by providing real time data support. ICOMC as a solution, has provisions for core multi-layer digital infrastructure, complementary physical infrastructure and change management initiatives. This will have six basic components viz. Traffic Management, Parking, Transit Operations, Common Payment Card, Emergency Response & City Incident Management and Centralised Command &Control Centre.Bhubaneswar Smart City proposal envisages to take up 57 projects strategically aggregated into ten Implementation Modules (IM) for bidding so as to reduce time and cost overruns.This aggregation was done after consultation with all stakeholders especially line departments, domain experts, contractors and vendors; and on basis of convergences, inter linkages, precedence mapping, financial timelines and dependency networks.
Chart No1: pan city smart solution
Ÿ Build basics s Citizen's connect Initiative s “I support my city” volunteer program s Town center online s One map s Project Bhubaneswar urban knowladge
center
Ÿ Transit Oriented Development s Railway station multimodal square MLCP s Satya Nagar institutional core s Satya Nagar MLCP s Lake Neutral
Ÿ Urban Mobility s Janpath people's Smart path s Project URBS urban s BBSR Cycle highway s Pubilice bike sharing scheme s E-rickshaw project
Ÿ Housing s J a n p a t h G o v e r n m e n t h o u s i n g
redevelopment s Mission Abass s Rental housing for construction workers s Project Kutumb
Ÿ Social development s Museum of Urban history s I am BBSR initative s Neighbourhood watch s Senior citizen district contact program s Safe refuge points for women safety s E- Promary health care for all
Ÿ Economic development s Invest BBSR s Project Swabhimaan s Street vendors improvemnet project s Project Kusum s Multimedia digital learning in schools
Ÿ Basic serives s 24*7 water supply s Water recycling project s Decentralized STPs s 24*7 Energy supply s Underground electric wiring s Waste-let's recycle s Project samman s City gas distribution dusting s City fibre ducting
92
Man in Society ISSN 2347-1530Volume 23, 2016, pp. 78-95
Source : Bhubaneswarsmartcity.org

Ÿ Technology for all s Intellgent city operations & Management
center (ICOMC) s City Wi-Fi project public internet access
centers degital literacy initiative
Ÿ Future proofing s Energy efficiency initiative – DELP s LED streeet lighting energy efficient water
pumps solar city program – roof top micro solar power
s Rain water harvesting
Ÿ Intelligent City Operations and Management Centre (ICOMC)
s Traffic management s Parking s Transit operation s Common payment card
s Emergancy responces and city incidenc managemant system
s Command and control center.
Strategic Plan
To move towards a more livable city, the plan focuses on creating a model of sustainable urbanization based on New Urbanism principles. Bhubaneswar's Strategic Plan is built on five strategic pillars-Responsive Governance , Transit Oriented Development (TOD) Based Planning and Design , Fiscal Sustainability , Infrastructure and Socio-economic Development. These five strategicpillars are guided by ten Strategic Directions corresponding to UNDP's “Sustainable Development Goals”which are the key strategies for the planand together provide the foundation for creating a more inclusive, resource-efficient, and technology enabled future for the city.
Table no2 : Strategic Planning for Bhubaneswar
Source: Bhubaneswar smart city.org
Urban Transformation of Cities: A Case Study 93

4. CONCLUSION
Cities account for the majority of greenhouse, gas emissions and energy consumption across the globe. As cites are economic growth drivers, urbanization is projected to increase further in the near future which will drive the depletion of non renewable resources as well as add to the extent of carbon –dioxide emissions. To cope with rising urbanization and climate change issues, innovations and digital technology must be leveraged to minimize energy consumption and improve quality of life sustainability covers not only environmental aspect but also social equity and the economy. The history of urbanization in India reveals four processes of urbanization at work throughout the historicalperiod in India which are as follows:
a) the emergence of new social relationships among people in cities and between people in cities and those in villages through a process of social change.
b) the rise and fall of cities with change in the political order
c) the growth of cities based on new productive process, which alter the economic base of the city and
d) the physical spread of cities with the inflow of migrants who come in search of a means of livelihood as well as a new way of life.
Thesefour processes are also evident in the history of urbanization in the Odisha . The paces of urban towns have steadily increased over the year and according to the census 2011, there are a total of 223 towns in Odisha. Although there are no metropolitan city in the state, both Bhubaneswar and Cuttack are inching their way to attain the metropolitan state by the next censes enumeration. As per a recent statistics, the population of Bhubaneswar in 2016 was 905,339 and the forecasted population of the city in 2017 was 917,766. The city of Bhubaneswarhas a great potential not only for human contacts but also for exchange of knowledge, transfer of technology, sharing of experiencesand increase in business opportunities, growth in employment and livelihood potentials leading to a more sustainable urban management.Urban governance entails the commitment, collaboration, coordination and synergy between different
stakeholders at all levels.The selection of Bhubaneswar as a smart city will lead to the marriage of innovation with technology which will go a long way in optimizing the management of resources and infrastructure and, at the same time focus on inclusiveness and a greener environment.
References
Bank, W. (1996,). Liveable Cities for the 21st century. Washington: World Bank.
Bhubaneswar Smart city. (2013). Retrieved 02 19, 2018, from https: // smart city bhubaneswar. org. in/index
BMC. (2018, Feb 19). Bhubaneswar smart city. Re t r ieved f rom smar tc i tybhubaneswar : https://www.smartcitybhubaneswar.org.in
Bokova, I. (2016). Culture Urban Future . Paris (France): UNESCO.
Carter, H. (1983). An Introduction to Urban Historical Geography. London: Edward Arnold.
Elliot, B. a. (1982). The City Patterns of Domination and Conflict. London:: Macmillan – now Palgrave Macmillan,.
Featherstone, M. (1991.). Consumer Culture and Post Modernism. . London: : Sage.
Featherstone,M , J. Bird, B. Curtis, T. Putnam, G. Robertson and L. Tickner. (1993. ). 'Global and Local Cultures'. In Mapping the Futures: Local Cultures, Global Change (eds). London: : Routledge.
Friedman, J. (1995.). Where Do We Stand: A Decade of World City Research'. In World Cities in a World System (eds). Cambridge: Cambridge University Press.
Giddens, A. (1987). Sociology, a Brief but Critical Introduction. San Diego: Harcourt Brace Jovanovich.
Kalia, R. (1994). Bhubaneswar from a Temple town to a capital city. Delhi: Oxford University Press.
Knox. (——. 1996.). Globalization and the World City Hypothesis'. In Scottish Geographical Maga- zine. 112, 124–6.
Knox, P. (1996). 'Globalization and the World City Hypothesis'. In Scottish Geographical Magazine ,
94
Man in Society ISSN 2347-1530Volume 23, 2016, pp. 78-95

124-6.
Knox, P. a. (1995.). World Cities in a World System. Cambridge:: Cambridge University Press.
Knox, P. (1993.). The Restless Urban Landscape. Engelwood Cliffs,. New Jersey: : Prentice Hall.
(1996). Liveable Cities for the 21st century. Washington: World Bank.
(1996). Liveable Cities for the 21st century. Washington : World bank .
Mellor, J. (1977). Urban Sociology in an Urbanized Society. London: Routledge & Kegan Paul.
Mellor, J. (1977.). Urban Sociology in an Urbanized Society. London: Routledge & Kegan Paul.
Office, S. P. (1998). Shanghai Basic Facts: Pudong New Area. Beijing China: : Intercontinental Press.
Pudong, S. (1998). Shanghai Basic Facts: Pudong New Area. Beijing China: : Intercontinental Press.
Ramchandran, R. (2001). Urbanization and Urban System in India. New Delhi: Oxfor University Press.
Sassen, S. (1994.). Cities in a World Economy. . Thousand Oaks: Pine Forge Press.
Sassen, S. (1991). The Global City. New York, London, Tokyo.: University Press.
Sassens, S. (1996.). 'Rebuilding the Global City: Economy, Ethnicity and Space'. In Re-Presenting the City .
Weber, A. (1889). The Growth of Cities in the Nineteenth Century. New York: Macmillan.
Weber, A. (1889.). The Growth of Cities in the Nineteenth Century. New York:.
Urban Transformation of Cities: A Case Study 95

Growth pattern of Height and Body weight during Childhood and Adolescence: A Cross-sectional Study on three rural
populations of Odisha.1Jagatdarshi Badamali
2K.C. Satapathy3P.K. Patra
Abstract
Child malnutrition is becoming a risk factor for illness during adolescence and is responsible for about one-third of child deaths globally and also in India. Now some present studies shows it is increasing in tribals . This present study attempts to examine the growth pattern of height and body weight of both boys and girls of Turunji village aged 5 to 16 years. A total number of 155 rural children were recruited from 3 schools of Turunji for the study. The present study was conducted at Turunji village of Nabarangpur district. Anthropometric measurements were taken to assess growth and nutritional status. Means and percentile curves were used to examine the pattern of growth which help to compare the nutritional status with other studies. Values of <5th percentile of body mass index (BMI) for age were considered as indicators of under-nutrition. The height and weight of the study participants were compared with ICMR values. Results reveal that 50.96 per cent of the school children's found in underweight category, weight of 34.19 per cent children found in normal category and 8.38 per cent and 6.45 per cent are found in over weight and obese categories respectively.
Key words: Height, weight, , BMI, tribal children, Odisha.
1. Introduction
The growth of children in a population reflects their nutritional status and indirectly determines their living standard. The development of an national growth standard for the screening, surveillance and monitoring of school-aged children and adolescents has been motivated by 2 contemporaneous events, the global surge in childhood obesity and the release of a new international growth standard for infants and preschool children by the international parameters. There are National parameters as well as international parameters like ICMR, WHO, NCHS to compare the growth pattern. Growth is also influenced by dietary pattern, expenditure behind food and general health condition of an individual. Slowing or cessation of growth is one of the first observable responses to nutritional in adequacy.
1 2&3M.Phil Scholar, Associate Professor , P. G. Department of Anthropology, Utkal University, BhubaneswarCorresponding author' s e-mail: [email protected]
There are also some genetically and environ mental factors which are responsible for linear growth and development like BMI, dietary habits. A well designed growth study may provide a powerful tool to identify the health and nutritional status of any population or community (Tiwari et al., 2007).
Many studies demonstrated that growth pattern may vary between rural and urban residence (Eveleth and Tanner, 1990 and Graham et al., 1980). Adair et al., (1993) is of the opinion that environmental and cultural factors are responsible for urban-rural difference. In view of the above present study is an attempt to examine the growth pattern on Turunji school children's. According to the World Health Organisation (WHO) globally, 30% of children under five are estimated to be stunted and 18% have low weight-for-height, and 43 million children are
96
Man in Society ISSN 2347-1530Volume 23, 2016, pp. 96-104

overweight. Optimal breastfeeding could save the lives of 1.5 million children under five every year. Nearly nine million children die every year from preventable diseases and infections: the largest killer being Diarrhoeal disease. There are over 2 billion cases of diarrhoeal disease every year and is the leading cause of malnutrition amongst children under five (WHO). In developing countries, with India being one of them, the proportion of overweight and obese people now coexist with those who are undernourished. According to the World Health Organization estimates, by the year 2020, non-communicable diseases will account for approximately three quarters of all deaths in the developing world .
Materials and Menthods
Area and People
The state of Odisha is the homeland of 62 different tribal communities (Census of India 2011. The
present study included 3 tribes (Amanatya, Bhotra and Saora) living in the Nabarangapur, district of Odisha, India. The study was conducted in the village Turunji of Nabarangpur district and the village has three hamlets i.e Badagaon, Naikguda and Damunaikguda. Badagaon and Naikguda is dominated by Amanatya , Saora's were Sparsely living both in Badagaon and Naikguda and the Bhotra's dominated over Damunaikguda of Nandahandi Block. The duration of the study was
th thfrom 8 February 2017 to 28 February 2017 and the data were collected earlier field work for M.Sc. . For calculating the age of children's, class wise data were taken which makes easier to calculate their age. Anthropometry and weight were taken simultaneously by using Anthropometric rod and weighing machine respectively. Mean, standard deviation, standard error of mean and percentile value were calculated by using Microsoft Excel 2007 and SPSS version 20.0.
Map- 1 Location of Nabarangapur district, in Odisha map
Growth pattern of Height and Body weight 97

Ethical statement
This research has been carried out in conformity with the ICMR's 'Ethical Guidelines of Biomedical Research on Human Participants (2006)'. The subjects who had voluntarily participated were considered.
Sample
The study comprised the growth pattern of both boys and girls having a total sample size of 155 rural children's from Turunji village of Nabarangapur district, Odisha , out of which 84 are males childrens and 71 are female childrens.
Selection of the study participants
The Childrens have been selected purposively. The place of our study is Nabarangpur District, Odisha on which we emphasized three tribes namely Amanatya , Saora and Bhotra. Also two communities namely Gouda and Harijan are also present in the area. So the total ethnic group of the childrens were measured randomly. Materials for the present study was collected from three schools of turunji village of nabarangpur district. This study is a part of Msc fieldwork conducted by specialization having Biological anthropology students of Utkal university, vanivihar,
Bhubaneswar. Here only height and weight of the school childrens(5 to 16 years of age) were considered. Altogether 155 childrens were measured. Age of childrens was determined from the school records.
Standing height was measured to the nearest cm using anthropometric rod. Weight was measured by manual weighing machine. To assess child nutrition percentile values of BMI for age were calculated. In this connection CDC growth chart developed by the Indian council of medical research (ICMR, 2000) was compared.
Results and discussion
Cross-sectional growth of height of Turunji school boys is presented in Table 1 and fig 1 respectively. The mean values of the measurements increased steadily from 5 to 16 years. Highest increment in stature is found between 14 - 15 years (19.66cm) and then in latter no growth seen. It is observed at the age of 5 - 6 years the increased stature seen is 14.69 cm, then percent of growth has increased at the age of 5 - 6 that is 15.07 then the next increment is in between 15 - 16 that is 13.86. The growth spurt seen in between 14 - 15 age group is an ideal type of increment in height.
AGE N Mean Std. Error of Mean Difference between mean(cm)
Per cent growth per annum
5 2 97.45 1.85 - -
6 9 112.14 1.18 14.69 15.07
7 10 117.47 2.58 5.33 4.75
8 8 121.30 1.91 3.83 3.26
9 8 127.36 1.77 6.06 4.99
10 13 128.75 1.57 1.39 1.09
11 7 131.12 1.80 2.37 1.84
12 10 140.15 1.83 9.03 6.88
13 10 142.66 3.46 2.51 1.79
14 1 141.80 0.00 - 0.86 0.60
15 3 161.46 0.84 19.66 13.86
16 3 156.00 5.58 5.46 3.38
Table 1.Age wise height(cm) among school boys of Turunji(Nabarangpur), Odisha
98
Man in Society ISSN 2347-1530Volume 23, 2016, pp. 96-104

97.45
117.47 121.03127.36
128.75131.12
140.15142.66
141.08
161.46156.00
5 6 7 8 9 10 11 12 13 14 15 16
0
20
40
60
80100
120
140
160
180
Age-wise mean height among school boys
Age (in years)
mea
n st
atur
e (i
n cm
s)
Figure 1.Age wise height (cm) among school boys of Turunji ( Nabarangpur ), Odisha
AGE N Mean Std. Error of Mean
Difference between
mean(cm)
Per cent growth per annum
5 5 107.08
6 12 111.30
7 14 115.13
8 9 121.25
9 13 127.07
10 5 129.06
11 3 138.06
12 6 142.56
13 1 146.00
14 1 147.00
15 2 147.05
16 - -
1.18
1.01
1.42
0.61
1.78
1.40
3.72
2.14
.
.
0.45
-
-
4.22
3.83
6.12
5.82
1.99
9.00
4.50
3.44
1.00
0.05
-
-
3.94
3.44
5.31
4.80
1.56
6.97
3.25
2.41
0.68
0.03
-
Table 2.Age wise height(cm) among school girls of Turunji(Nabarangpur), Odisha
Growth pattern of Height and Body weight 99

Figure 2.Age wise height(cm) among school girls of Turunji(Nabarangpur), Odisha
To considering the cross-sectional study of girl child of the same age group it seen the highest increment of girl child is at the age between 10-11 years (9.00 cm) and before in between the age of 7-8
age groups it is found as 6.12. The percent of growth rate is high at the age of 10-11 age groups that is 6.97.
AGE N Mean Std. Error of Mean
Difference between mean(kg)
Per cent growth per annum
5 2 13.00 -
6 9 17.00 4.00 30.76
7 10 18.85 1.85 10.88
8 8 20.87 2.02 10.71
9 8 22.37 1.50 7.18
10 13 23.50 1.13 5.05
11 7 24.85 1.35 5.74
12 10 29.00 4.15 16.70
13 10 29.60 0.60 2.06
14 1 34.00 4.40 14.86
15 3 43.33 9.33 27.44
16 3 43.00
1.00
.23
1.03
.69
.94
.82
1.14
.77
2.00
.
1.66
2.08 - 0.33 - 0.76
-
Table 3. Age wise weight(kg) among school boys of Turunji(Nabarangpur), Odisha
Age-wise mean height among school girls
107.08111.03 115.13 121.25
127.07 129.06138.06 142.56
146.00 147.00 147.05160
140
120
100
80
60
40
20
0
5 6 7 8 9 10 11 12 13 14 15
Age(in years)
mea
n st
atur
e (i
n cm
s)100
Man in Society ISSN 2347-1530Volume 23, 2016, pp. 96-104
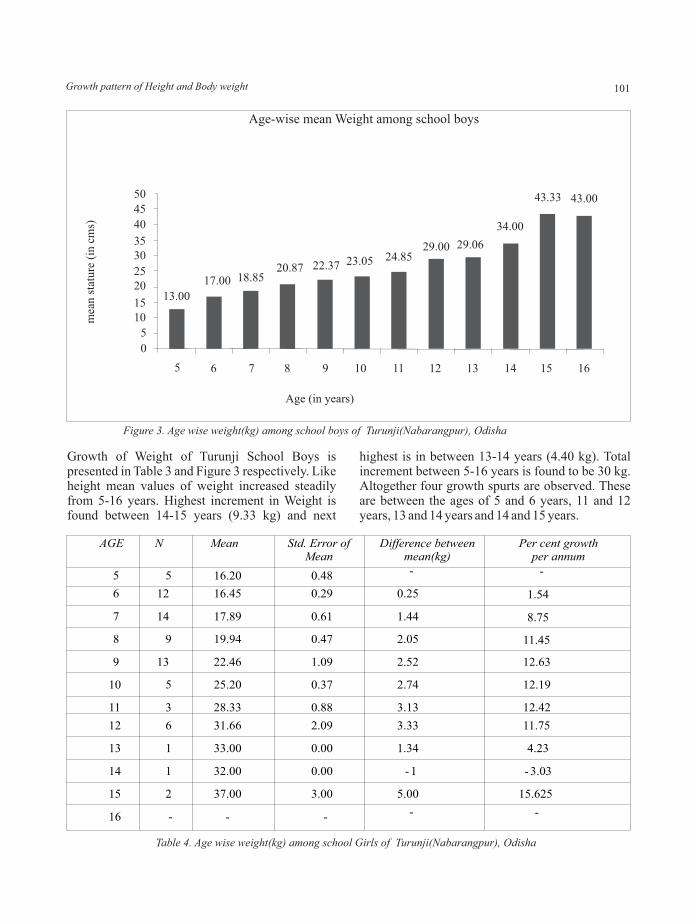
Figure 3. Age wise weight(kg) among school boys of Turunji(Nabarangpur), Odisha
Growth of Weight of Turunji School Boys is presented in Table 3 and Figure 3 respectively. Like height mean values of weight increased steadily from 5-16 years. Highest increment in Weight is found between 14-15 years (9.33 kg) and next
highest is in between 13-14 years (4.40 kg). Total increment between 5-16 years is found to be 30 kg. Altogether four growth spurts are observed. These are between the ages of 5 and 6 years, 11 and 12 years, 13 and 14 years and 14 and 15 years.
5
12
14
9
13
5
3
6
1
1
2
16.20
16.45
17.89
19.94
22.46
25.20
28.33
31.66
33.00
32.00
37.00
0.48
0.29
0.61
0.47
1.09
0.37
0.88
2.09
0.00
0.00
3.00
-
0.25
1.44
2.05
2.52
2.74
3.13
3.33
1.34
- 1
5.00
-
1.54
8.75
11.45
12.63
12.19
12.42
11.75
4.23
- 3.03
15.625
- - - - -
AGE N Mean Std. Error of Mean
Difference between mean(kg)
Per cent growth per annum
5
6
7
8
9
10
11
12
13
14
15
16
Table 4. Age wise weight(kg) among school Girls of Turunji(Nabarangpur), Odisha
13.00
17.00 18.8520.87 22.37 23.05 24.85
29.00 29.06
34.00
43.33 43.00
5 6 7 8 9 10 11 12 13 14 15 16
0
5
1015
2025
3035
40
45
50
Age (in years)
mea
n st
atur
e (i
n cm
s)
Age-wise mean Weight among school boys
Growth pattern of Height and Body weight 101

Figure 4. Age wise weight(kg) among school Girls of Turunji(Nabarangpur), Odisha
Similarly the Weight of Turunji School girls is presented in Table 4 and Figure 4 respectively. Here also the mean values of weight increased steadily from 5-15 years. Highest increment in Weight is found between 14-15 years(5.00 kg) and next highest is in between 11- 12 years(3.33 kg). Here
total increment between 5-16 years is found to be 20.8 kg. Here in between 10 and 11, 11 and 12 and 14 and 15 age groups the growth spurt is found.
Comparison of Height and weight of the present study with that of Indian urban boys(ICMR , 2000)
Table 5.Comparison of height (cm) of present study with Indian Rural study (ICMR , 2000)
Age in years
Turunji school boys
Indian rural boys (ICMR, 2000)
Turunji school girls
Indian rural girls (ICMR, 2000)
5
6
7
8
9
10 11
12
13
14
15
16
97.45
112.14
117.47
121.30
127.36
128.75 131.12
140.15
142.66
141.80
161.46
156.00
105.80
111.70
117.40
123.20
129.20
132.90 137.50
142.90
148.70
154.50
159.50
164.90
107.08
111.30
115.13
121.25
127.07
129.06 138.06
142.56
146.00
147.00
147.05
-
105.20
111.10
117.00
122.40
128.60
132.60 137.80
143.10
148.20
152.20
153.50
154.20
16.02 16.45 17.89 19.94
22.4625.2
28.33
31.6633.00 32.00
37.00
1 2 3 4 5 6 7 8 9 10 11
0
5
10
15
20
25
30
35
40
Age-wise mean Weight among school Girls
Age (in years)
102
Man in Society ISSN 2347-1530Volume 23, 2016, pp. 96-104

It is seen that Turunji school boys having 6 - 7 age groups are taller as compared to Indian rural boys i.e. 112.14 and117.47 respectively. Boys attaining the age of 15 are also taller than Indian rural boys. Similarly 5 - 6 age groups girls are taller than Indian
rural girl's i.e. 138.06. It is also seen that girls at the age of 11 are taller than Indian rural girls. Which show that at the age of childhood and maturity both the boys and girls are taking their peak value in their growth spurt.
Age in years
Turunji school boys
Indian rural boys
Turunji school girls
Indian rural girls
5 13.00 16.30 16.20 15.90
6 17.00 17.90 16.45 17.70
7 18.85 20.40 17.89 20.20 8 20.87 23.0 19.94 22.90
9 22.37 25.80 22.46 26.20
10 23.50 27.50 25.20 28.20
11 24.85 31.40 28.33 32.30
12 29.00 34.60 31.66 36.20
13 29.60 37.20 33.00 39.8014 34.00 41.0 32.00 42.90 15 43.33 45.70 37.00 45.30
16 43.00 50.90 - 47.20
Table 6.Comparison of Weight (kg) of present study with Indian Rural study (ICMR , 2000)
It may be seen from table 6 that Turunji school children's both boys and girls have of less weight as compared to Indian rural children's it means Indian rural children's are heavier than Turunji school children's. The difference is noted to be small in the 5 age group of turunji school girls i.e. 16.20. The mean value of weight is how ever higher than Turuji School chidrens.
Child Nutrition
To assess child Nutrition(5-16 years), height and weight for 155 childrens(both boys and girls) are measured. Percentile values of BMI for age were calculated. In this connection ICMR, 2000 growth chart are compared with the study area Turunji school childrens. BMI according to percentile values were furnished in Table 7.
Age in Years
N Percentile Value
<5th(Underweight)
5th-85th(Healthy weight)
85th-95th(Over weight)
≥ 95th(Obese)
5 7 4(57.14) 3(42.85) 0(0.00) 0(0.00)
6 21 17(80.95) 4(19.04) 0(0.00) 0(0.00)
7 24 18(75.00) 6(25.00) 0(0.00) 0(0.00)
8 17 10(58.82) 7(41.17) 0(0.00) 0(0.00)
9 21 12(57.14) 7(33.33) 2(9.52) 0(0.00)
10 18 7(38.88) 9(50.00) 2(11.11) 0(0.00)
11 10 3(30.00) 5(50.00) 2(20.00) 0(0.00) 12 16 4(25.00) 7(43.75) 0(0.00) 5(31.25)
13 11 4(36.36) 4(36.36) 0(0.00) 3(27.27)14 2 0(0.00) 1(50.00) 1(50.00) 0(0.00)
15 5 0(0.00) 0(0.00) 4(80.00) 1(20.00)
16 3 0(0.00) 0(0.00) 2(66.66) 1(33.33)Total 155 79(50.96) 53(34.19) 13(8.38) 10(6.45)
Table 7.BMI for age(5-16 years) Figures in parenthesis indicates percentage values
Growth pattern of Height and Body weight 103

The Distribution or frequency of underweight Children's are found 50.96 in underweight category similarly 34.19 found in healthy weight category and 8.38 and 6.45 are found in over weight and obese category. From the above table it is clear that majority of the children are coming under underweight category and healthy weight category is following by it. The underweight found more in 5, 6, 7, 8, 9, 10, 13 age groups which ranges up to 36.36 to 80.95 per cent. Then it is seen in the healthy weight category 5, 8, 9, 10, 12, 13, 14 age groups ranges up to 33.33 to 50.00 per cent. However 80.00 per cent children's from 15 age group, 50.00 per cent children's in overweight category and 31.25 per cent and 33.33 per cent children's from 12, 16 age groups respectively comes in obese category.
Conclusion
Growth and development is influenced by socio-economic condition, environment and genetic potential of the individual. The present study conducted among children of Turunji village of Nabaragpur district, Odisha shows that there is a pace of increment of height and weight among the boys and girls with respect to age. The children up to 9 years of age exhibits a consistent in terms of height and weight when compared with national averages (Table 5 &6). However, adolescences are lagging behind the national averages in term of mean height and weight with respect to age and sex. This is may be due to lack of proper nutrition during the adolescent stage which needs further investigation.
Acknowledgement
We are thankful to all the participants who volunteered for the present research work . We are also thankful to the Head, P.G. Department of Anthropology, Utkal University and Govindalaya, Nabarangpur for their all type of support during fieldwork.
References
Adair, l. s., j. Vanderslice and N. johoori. 1993. Urban-rural difference in growth and diarrhoeal morbidity of Filipino infants. In: L.M. Schell, M. Smith and A. Bilsborough( Eds.): Urban ecology
and health in the third world. Cambridge University Press, Cambridge
B. M. Popkin, “The shift in stages of the nutritional transition in the developing world differs from past experiences,” Public Health Nutrition, vol. 5, no. 1, pp. 205–214, 2002. Eveleth, ph. B. and J.M. Tanner. 1990. World –wide variation in human growth. Cambridge University press, Cambridge
Graham, G.G., W.C. Maclean, C.H. Kallman, J. Rabold, D.Mellits. 1980. Urban-rural difference in the growth in the Peruvian Children. Am.J. Clin. Nutr.,33:338-344.
Hamill P.V.V., T. A. Drizd, C.L.Johnson, R.B. Reed, A.F.Roche, W.M.Moore.1979. Physical Growth : National Center for Health Statistics percentiles. The American journal of clinical Nutrition.32:607-629
Indian council of medical research. 1989. Growth and Physical Development of Indian Infant and children. Technical Report Series, No.18, ICMR, New delhi
National center for Chronic Disease prevention and health promotion, USA. 2000
Sharma, J.C. 1970. Physical growth and development of the Maharastrians. Ethnographic and Folk Culture Society, Lucknow.
T.Baruah, P. kashyap, J.phukan, U.Boarah, D.k. Adak and P.Bharati. Growth Pattern of stature and Body Weight during Chldhood and Adolescence: A Cross-sectional Study among School Boys of Guwahati, Asam, India.
Tiwari, M.K., K.K.N. Sharma, S. Bharati, D.K. Adak, R. Ghosh and P.Bharati,2007. Growth and Nutritional Status of the Bharia _ A Primitive Tribe of Madhya Pradesh. Coll Antropol, 31 (1): 95-101.
World Health Organization. Physical status: the use and interpretation of anthropometry. Technical Report Series No. 854. Geneva: World Health Organization, 1995 Assessment of Nutritional Status: A Case of Tribal Children in Assam, Northeast India.
104
Man in Society ISSN 2347-1530Volume 23, 2016, pp. 96-104

Impact of Forest Proximity on Livelihoods and Food Security of Forest Dependent Tribal Communities
1Soumendra Sarangi
Abstract
The present paper discusses a method of assessing the role of forest and its proximity in coping with livelihoods and food insecurity as experienced by forest- dependent households. Several variables reflecting the status of livelihoods and food security including income from forest, forest use for coping with livelihoods stress, dietary diversity etc were compared between households with high, moderate and low proximity to forest. Households with higher proximity to forest illustrated higher income from forest and increased use of forest resources during phases of livelihoods and food insecurity.
Key words: Forest, livelihood, food insecurity.
1. Introduction
Even though forests contributes significantly to livelihoods and food systems of nearly 1.6 billion people ( FAO, 2014) including tribal and forest dwelling communities spread all over the globe, yet the wide range of contributions made by forests to livelihoods and nutrition remain poorly understood( Vincetti, et al, 2013). Much of this gap in research information is currently being reviewed with a new perspective owing to increasing vulnerability of conventional agriculture to climate change and potential role of forest in supplementing and diversifying the food base through multifunctional landscape approach ( Bhaskar, et al,2015). In fact, mounting evidence indicate that forests with wide range of ecosystem services not only enhance agricultural productivity in adjacent fields( Mitchell et al, 2014) but also provide sustainable food base and income for thepoor forest-dependent communities. New researches also suggest emerging link between forest food, food security and nutrition (Arnold et al., 2011, Jamnadass et al,2011 Vincetti et al.2013, Ickowitz et al,2014, Sunderland et al, 2013) and highlight the role played
1Ph.D Scholar , Department of Anthropology, BhubaneswarCorresponding author E-mail: [email protected]
by diverse forest foods like fruits, leafy vegetables, nuts, plant foods etc in micronutrient deficiency ( Stephenson et al, 2010, Powell et al,2011, Vincetti, et al,2008,), especially in developing countries where forest food can constitute essential source of nutrition for poor and remote tribal population ( Sunderlin et al,2008, Colfer et al,2008).
The importance of forests further enhances as a safety net for poor forest-dwelling and tribal communities during crop failure, seasonal crop production gape and other periods of food stress (Blackie et al, 2014, Keller et al, 2006, Shackleton and Shackleton, 2004). Despite such growing attention on the link between forests and livelihoods of forest dwelling communities, many studies are qualitative studies under specific contexts confined to particular regions and a large number of studies are also based on analysis of existing literature (Larsen et al, 2010, Pagdee et al, 2006) excepting a few like the recently published PEN studies on a comparative analysis of 33 multi - scale case studies in developing countries including India( Angelsen et al, 2014)
105
Man in Society ISSN 2347-1530Volume 23, 2016, pp. 105-111

While there is a growing recognition that forests play important role in livelihoods and food security of forest- dwelling tribal communities, the complex, interconnecting and overlapping processes through which these marginalized communities draws a wide range of services from forests, even during phases of extreme food and livelihood insecurity, still remains to be fully understood.
The present study focuses on how livelihood and food security of forest-dependent tribal communities tend to vary with varied access to forest and specifically measures households based on their proximity to forest leading to differential use of forest resources to cope with livelihoods and food insecurity.
Background and Research question
The hilly tribal areas in the eastern region of India including the area selected for the proposed study with higher proportion of forest invariably show much higher dependence of tribal population on forest both socio-culturally and economically. These are also the areas that are marked by poor infrastructure development, low employment opportunities, poor access to basic services like health, education, drinking water facilities etc. In the absence of other opportunities, forest produces play important role in the livelihood and food security of millions of poor forest dwellers. The present paper poses the research question –“Do increased proximity and access to forest reduce food and livelihood insecurity among the forest dependent tribal communities?” and finds an answer to this question.
Study Area and People
This study was conducted in two of the most socio-economically backward and adjacent tribal districts namely Keonjharof Odisha and West Singhbhum of Jharkhand states. Both the tribal districts are marked by higher incidence of poverty, presence of higher proportion of tribal population and forested landscapes. BothWest Singhbhum and Banspal block of Keonjhar are included in the fifth scheduled of the Constitution of India there are special laws for protection of land and forest rights of tribals. Most of the forest areas in the both states including the areas covered under the study was owned by the state and governed under the MOEF, Government of India. The tribal communities
covered under the study included predominantly Hocommunity from West Singhbhum and Bhuyian, Santhaland Juang communities from Keonjhar.
Methods
This study was a longitudinal study conducted in two phases over two years' time. While the first phase started in June 2014 and lasted until May 2015, the second phase was completed between June 2015 and May 2016. Both quantitative and qualitative methods were used to collect information on wide range of variables, resource use, seasonality etc. A structured interview schedule consisting of questions on livelihoods, food security and consumption/expenditure was used to elicit information from sample households. The detail information on livelihoods consisted of information on all sources of livelihood with special emphasis on forest based livelihoods including information on income from forest, role forest in coping lean season, exchange of forest produce for accessing food etc. Many studies on forest based livelihoods increasingly use these standardized information to reflect on the link between forest and livelihoods (Angelsen et al,2014, ). HFIAS (Household Food insecurity Access scale) was used as a proxy measure to assess the status of food in security among surveyed households.
The consumption /expenditure survey was used to collect information on proportion of monetary expenditures on food in relation to total expenditure and details of consumption pattern among the sample households. The 7 days and 24 hours recall method was used to record information on consumption of variety of foods from 13 selected food groups. Apart from details on quantities of consumption, source of accessing food, cost and durability of food was also collected. The sample of 300 households for the present study was selected out of a larger sample of women and their children below two years of age spread across 60 villages each in two districts for community based intervention(CARING) aimed at improving nutrition and growth. Proximity of households to forest was classified on the basis of their distance from forest. Households that were located within 0 to 2km was put in the category of High Proximity (HP) and households that were located within 2-4km were kept within Moderate Proximity (MP). Finally households that were located more than 4km away from forest were put in the category of households with Low Proximity(LP).
Impact of Forest Proximity on Livelihoods 106

Analysis
The analysis was based on the comparison between mean values of variables like annual income from forest, months of NTFP collection, Number of HH engaged in forest produce collection, frequency of use of forest for coping with livelihood and food stress, frequency of exchange of forest produce with food etc between households with Higher Proximity, Moderate Proximity and Low Proximity to forest. The status of food security was analysed on the basis of information collected through HFIAS scale and consumption pattern of specific food groups. While the HFIAS scale indicates the status of food insecurity and is being increasingly used as a most standard tool for measuring existence and frequency of food insecurity conditions, the dietary diversity scores have been validated as proxy measures for macro and /or micronutrient adequacy of the diet for several age/sex groups( Smith et al, 2007, FAO, 2013). Both the indicators used for measur ing food secur i ty are comprehensive standard tools and inversely correlated.
Results/Findings
(A) Livelihood Status and Strategies
The livelihoods Strategies adopted by all the households included several livelihoods activities like agriculture, livestock rearing, agriculture paid labor, daily wage labor, collection and selling forest produce, selling of alcohol etc. It was observed that majority of households followed these livelihood options in various combination as strategies to adapt to scarce resources. For example, agriculture was practiced by 87% of households, collection and selling of forest produce followed by 82% HH , Livestock rearing by 75%HH, daily wage labor by 68% and agriculture paid labour was continued by 71% of households. From among these options, some combinations like Agriculture, collection and selling of forest produce and livestock rearing featured among nearly 60% of Households consistently along with some other varying combinations. These observations were consistent with many other findings that highlight diversified strategies adopted by rural households to meet basic needs and cope with livelihood uncertainties arising out of unforeseen shocks/vulnerabilities (Ellis,1998 cited in Belcher et al, 2014).
(B) Forest dependence among different groups based on productive assets
Land was considered as an important asset by majority of the household surveyed but largest proportion of households (40%) happened to be marginal farmers with less than 2 bighas of land and could obtain only 6 months of their food needs from agriculture. The qualitative information obtained through focussed group discussion and community meetings indicated that such shortfall in food among landless families and marginal farmers was mostly supplemented by selling and consumption of forest produces. This was further supported by quantitative information that showed 84% such marginal farming households with small landholding were engaged in collection of NTFP and 65% of which were engaged in forest produce collection for all 12 months in a year. Likewise 87% of the landless households found to be engaged in NTFP collection and their average annual income from selling NTFP was higher (8000Rs) than any other group possessing land. In comparison to more vulnerable social groups like landless families and marginal farmers, only 28% ofthe families with higher proportion of land were engaged in collection of forest produces for all 12 months. Aclear pattern thus seemed to be emerging where forest dependence increased with reducing land size and decreased with productive assets like increasing land size and livestock.
(C) Variation in income from forest and availability of forest produce based on proximity and access to forest
Forest played an important role in the livelihoods of majority of households as large proportion (83%) of households accessed forests for collection of various forest products ranging from fuel woods, leaves, fruits, mushrooms, other NTFPs etc. even though level of dependence varied among families based on their proximity to forest. Forest Access and collection of forest produce was highest (98%) among households with Higher Proximity to forest and lowest (74%) with Low Proximity to forest. It was observed that the average annual income from forest through sale of NTFP was highest (5140 Rupees) among households located nearer to forest (HP) and lowest( 3350/-) among households which are located farther away from forest (LP).
107
Man in Society ISSN 2347-1530Volume 23, 2016, pp. 105-111

(D) Role of forest in coping with livelihood and food insecurity during lean season
The availability of variety of forest products for consumption, exchange with food and earn income from selling forests produces led families to rely more on forests at the time of food shortages and livelihood stress experienced during lean season. Such reliance of families on forests was measured through different indicators like incidence of exchange of NTFP items with food, reliance on forest during lean season, income from selling of NTFP etc. The data revealed that 50% of the households from High Proximity (HP) area used forest produces for coping with livelihood and food stress during lean season compared to 29% of Households from areas of Moderate Proximity (MP) and 13% households from areas of Low Proximity (LP). Apart from incidence of higher reliance among households from HP area on forest during lean season, it was found 33% of the households from High Proximity area exchanged Char, Mahua and other NTFPs with food item like rice compared to only 4% of households from Low proximity area (LP) exchanging NTFPs with food. The focussed group discussions with household exchanging Forest produces for food indicated that such food accessed through forest produce exchange meet their food requirements of 3-4 months during extreme food shortage experienced after festivals and other times. This indicated that forest played a bigger role in coping with livelihoods and food stress among Households from HP area compared to other households from areas of MP and LP.
(E) Status of Food Insecurity among different groups based on proximity and access to forest
A detail comparison between status of food insecurity of households from HP and LP showed that households from higher proximity to forest showed lower food insecurity. It was observed that fewer households in areas from HP had to limit their food diversity in comparison to households from LP due to limited resources. Several other conditions of food insecurity like limiting size, number and quantity of foods by family members due to limited resources was higher (Varied from 20-30%) in households from LP in comparison to households from High Proximity areas. Besides this, the dietary diversity and consumption of specific foods like fruits, green and leafy vegetables among households
from HP areas was higher than households from areas of LP.
(F) Forest proximity and Community led Conservation and Management of forest resources
It was found that the involvement of families in conservation and management of community forest was much higher among households with high proximity (HP) to forest compared with households with moderate (MP) and Low proximity (LP). Analysis of the data revealed that 44% of families having high proximity (HP) were involved in such conservation and management of forest resources compared to 31% of families having moderate proximity(MP) and 11% of families having low proximity(LP). Increased access and return from forest among HH with high proximity also prompted the community to protect and manage the forest resources through local institutional arrangements.
Discussion
The Tribal households selected for the present study from two of the poorest forested Tribal regions i l lustrated much higher dependence on forest(85%).in different form though the nature and level of dependence tended to vary based on proximity, access to forest, land size etc. While the dependence on forest in the form of collection and selling of NTFP, consumption of forest food, fuel and fodder etc was much higher among the more vulnerable groups like landless and marginal farmers, the extent and level of dependence on forest showed a decreasing trend with increasing status of productive assets like land and livestock. The vulnerable groups exhibited engagement of more number of family members for collection of forest produce for more number of months in a year compared to households owning higher productive assets. These findings add to the existing literature that highlights the importance of forest as an important livelihood option and higher dependence of more vulnerable groups on forest by supporting with empirical data collected over two years. Apart from adding to the literature on forest dependence and livelihood, the present study add a new dimension by analyzing the role of forest in coping with food and livelihood insecurity among forest dependent community during lean season and other
Impact of Forest Proximity on Livelihoods 108

times of vulnerability based on proximity and access to forest. The study findings relating to increased role of forest in coping with livelihood and food insecurity is highly relevant to the newly enacted legislation of “ The Scheduled Tribes and Other Traditional Forest Dwellers (Recognition of forest Rights) Act,2006”. It lends support to the assumption made in the preamble of law that emphasizes on importance of forest rights of Tribal in relation to their food insecurity. These findings could strengthen policies for better implementation of this empowering legislation.
ConclusionThe findings of the present study showed that households having higher proximity to forest showed higher average annual income from forest, increased dependence on forest during lean season and times of food and livelihoods insecurity and increased exchange of forest produce with food compared to households having moderate and lower proximity to forests. Findings of the present study based on empirical data of small sample of three hundred households among Ho community from West Singhbhumin Jharkhand and Bhuyian, Santhal and Juang communities from Keonjhar in Odisha indicate how increased proximity to forest help the more vulnerable Tribal communities to cope with livelihood and food insecurity during lean period experienced by them periodically ranging from July to October every year. Apart from the lean period, the study also showed that forest is being used as an
important resource for livelihood insecurities throughout the year.
Another important aspect revealed by this study is that households with higher proximity to forest were engaged more in community led forest conservation and management initiatives than compared to households with moderate and lower proximity to forest. These causal relationships revealed by the present study indicate a linkage between forest proximity and use of forest by forest dependent Tribal communities which can be explored further on a wider scale.
Acknowledgements
The field for the present study was conducted in field areas of Ekjut, a national voluntary organization working on public health and located in Jharkhand. The support of team members from Ekjut and their feedback during this study was very helpful in r e f i n ing t he s t u d y. I pe r s o n a l l y t han k Dr.PrasantTripathy, Dr.Rajesh Sinha and other friends from Ekjut and Dr. Audrey Prost,Lecturer in International Health and Dr. Hasan Hagparast Bidgoli, Faculty of population and Health science, Institute of Global Health from University College of London, UCL, UK for their support and Guidance during my field study.
Above all, I thank my guide Dr.PrasannaKumar Patra for guiding me, providing feedback and encouraging me to complete this paper in time.
Livelihood Indicators Mean Value
Moderate Proximity (MP)
Low Proximity (LP)
Annual Income from NTFP ( Rupees) 5140/ - 4146/ - 3350/ -
% of HH engaged in NTFP collection 98% 88% 74%
No of months of NTFP collection in a year 9 10 8
Quantity of fuelwood consumed (Per Month) 216.6 Quintal 152 Quintal 142.44 Quintal
% of HH used forest for coping with lean season 50% 29% 13%
% HH that exchanged NTFP for food 33% 20% 4%
High Proximity (HP)
Table I Livelihood Indicators
109
Man in Society ISSN 2347-1530Volume 23, 2016, pp. 105-111

Graph I Use of forest produce for livelihood based on forest proximity
References
Arnold, M., Powell, B., Shanley, P. &Sundernald, T.C.H. 2011. Forests, biodiversity and food security. International Forestry Review, 13(3): 259–264.
Berry,S 1993 No condition is permanent : The Social Dynamics of Agrarian Change in Sub-Sahara Africa. University of Wisconsin Press, Madison, Wisconsin, USA
Colfer, C.J.P.2008. Human health and forests: global overview of issues, practice and policy. London, Earthscan
DFID 2007. Land: Better access and secure tenure for poor people.London,UK: Department for International Development
Diaw,M.C.2005 Modern economic theory and the challenge of embedded tenure institutions: African Attempt to reform local forest policies. 43-51. Springer, Dordrecht, The Netherlands
FAO 2013.Guideline for measuring Household and Individual Dietary Diversity
FAO. 2014. State of World's Forests; Enhancing Socio-economic benefits from forest Rome, Italy: Food and Agriculture Organization of the United Nations
Gilmour, Don 2016, Forty years of Community-Based forestry: A review of its extent and effectiveness.
Ickowitz, A., Powell, B., Salim, A. and Sunderland, T., 2014. Dietary Quality and Tree Cover in Africa. Global Environmental Change 24: 287–294.
Jamnadass, R.H., Dawson, I.K., Franzel, S., Leakey, R.R.B., Mithhöfer, D., Akinnifesi, F.K. &Tchondjeu, Z.2011.Improving livelihoods and nutrition in sub‐Saharan Africa through the promotion of indigenous and exotic fruit production in smallholders' agroforestry systems: a review. International Forestry Review, 13(3): 338–354.
Jagger, P. 2010. Forest sector reform, livelihoods and sustainability in Western Uganda. In L. German, A . Karsenty, & A. M. Tiani (Eds.),Governing Africa's forests in a globalized world (pp. 103–125). London,UK: Earthscan Publications Ltd. and Center for International Forestry Research.
Larson, A. M., Barry, D., Dahal, G. R., &Colfer, C. J. P. 2010c. Forests for people: Community rights and forest tenure reform. London, UK: Earthscan Publications Ltd.
Meinzen-Dick, R. and Mwangi, E. 2008 'Cutting the web of interests: pitfalls of formalizing property
Impact of Forest Proximity on Livelihoods 110

rights', Land Use Policy, vol 26, pp36–43
Ostrom, E., 1990. Governing the Commons: The Evolution of Institutions for Collective Action. Cambridge University Press.
Oldekop JA, Bebbington AJ, Brockington D and Preziosi RF, 2010. Understanding the lesions and limitations of conservation and development, Conservation Biology24(2): 461-9
Pagdee,A, Kim, Y. and Daugherty, P.J. 2006 What makes community forest management successful: a meta-study from community forests throughout the world. Society and Natural Resources 19: 33-52
Peluso,N.L1992 Rich Forests ,Poor People: Resource control and Resistance in Java. University of California Press, Berkeley, California, USA
Powell B., Hall, J. & Johns, T. 2011. Forest cover, use and dietary intake in the East Usambara Mountains, Tanzania. International Forestry Review, 13(3): 305–317.
Persha L, Agrawal A and Chhatre A. 2011. Social and ecological synergy: Local rulemaking, forest livelihoods, and biodiversity conservation .Science 331(6024):1606-8.
Roe, D., and Fred N., "Chapter 2: The Origins and Evolution of Community-Based Natural Resource Management in Africa." Community Management
of Natural Resources in Africa: Impacts, Experiences and Future Directions, 2009: 2-12.
Seymour F, Vina TL and Hite K.2014. Evidence Linking Community –level Tenure and Forest Condition: An Annotated Bibliography. San Francisco, CA: Climate and Land use Allaince
Spierenburg, M., Sttenkamp,C. And Wells,H(2008) 'Enclosing the local for Global Commons: Community Land Rights in great Limpopo Transfrontier Conservation Area, Conservation and Society, Vol 6, no 1, pp87-97
Sunderlin, W. D., Hatcher, J., & Liddle, M. (2008). From exclusion to ownership?: Challenges and opportunities in advancing forest tenure reform. Washington, DC: Rights and Resources Initiative.
Somanathan, E., Prabhakar, R., Mehta, B., 2009. Decentralization for cost-effective conservation. Proceedings of the National Academy of Sciences of the United States of America 106, 4143–4147.
Vira,B., Wildberger,C. Mansourian, S., 2015, Forest, Trees and Landscapes for food security and Nutrition, International Union of Forest Research Organizations, Volume 33, 2015
Vinceti, B., Ickowitz, A., Powell, P., Kehlenbeck, K., Termote, C.,Cogill, B. and Hunter, D., 2013. The contributions of forestfoods to sustainable diets. Unasylva 64(241): 54-64.
111
Man in Society ISSN 2347-1530Volume 23, 2016, pp. 105-111

Prevalence of Undernutrition among three Tribes of Nabarangpur, Odisha.
1Diptiranjan Sahoo2KanhuCharan Satapathy
2Prasanna Kumar Patra
Abstract
Document pertaining to the prevalence of undernutrition among the tribes of Odisha is scanty. Under these circumstances, this paper attempts to examine the nutritional status of the Amanatya, Bhotra and Saora tribes of Nabarangpur district of Odisha. 200 adult individuals from three hamlets of village Turunji, Nabarangpur district of Odisha were studied. Height and weight were recorded and the Body Mass Index was calculated using the standard protocol. Internationally accepted BMI guidelines were followed to access the nutritional status. The present study reveals a high percentage of Chronic Energy Deficiency(CED) or under nutrition among the Saoras (44.44% males and 33.33% females) and Amanatyas (50% of females) as compared to the Bhotras (7.6% males and 16.6 % of females).From the total individuals studied,24% found to suffer from under nutrition. This implies that these tribes are under serious nutritional stress. Gender difference in nutritional status is observed in all the groups. Several socio-economic factors, such as uncertainty of food supply, lack of adequate health care facilities and awareness, their belief system and cultural practice, less income were responsible for this higher prevalence of CED among these tribes. Thus, appropriate nutritional intervention programs by the government and non-government organisations touplift these tribal populations are imperative.
Key words: Nutritional Status, Body Mass Index, CED, Undernutrition, Tribe, Odisha
1. Introduction
Nutrition remains a major health issue in India for centuries. In recent past, India has made a considerable progress in social and economic aspects but the improvement in nutritional status has been less impressive (Griffith and Bentley, 2001). In general, various tribal populations are among the most underprivileged people in India. This because of their geographical isolation, uncertainty of food supply, lack of adequate health care facilities and awareness and their belief system and cultural practice.To have a comprehensive idea about the development process of a community, it is very much essential to have the knowledge of nutritional status of the community. Undernutrition is a major health issue in developing countries like India. The basic causes of undernutrition and infections in developing countries are poverty, poor hygienic
1 2, 3M.Phil Scholar , Associate Professor Department of Anthropology, Utkal University, BhubaneswarCorresponding author E-mail:[email protected]
conditions and access to healthcare facilities (Mitra, 1985; WHO,1990). Assessment of nutritional status is considered as a measure of health. Body Mass Index (BMI) is the most widely used method of assessing the nutritional status as it is in-expensive, non-invasive, and suitable for large scale survey (Lohman et al., 1988; Ferro-Luzzi et al., 1992; James et al., 1994). BMI is generally considered a good indicator of not only nutritional status but also the socio-economic condition of a population, especially adult population of developing countries. Keeping in view the points, the present study attempted to determine the nutritional status of the Bhotra, Amanatya and Saora Tribes of Turunji Village in Nabarangpur District, Odisha. The study further attempts to compare the nutritional status of the participants with the other tribal populations of Eastern Indiaand to investigate the factors influencing nutritional status of these communities.
112
Man in Society ISSN 2347-1530Volume 23, 2016, pp. 112-119

Map 1: Geographical location of Nabarangpur District, Odisha
Bhotra: Bhotra synonymous with Bhottada,Bhattra and Dhottada are widely distributed in Koraput and Kalahandi districts of Odisha, Bastar area of Madhya Pradesh. Out of 4.51lakh populations in the state 3.25 lakhBhatras live in Nabarangpur district as per 2011 census. The Bhotras are one of the numerically major agricultural tribe of the district. They are primarily settled agriculturists and cultivators.
Amanatya: Amanatyas, also known as Omanatya, Omaito and Omanaito are Odia speaking cultivating tribal people who live in the north of Jeypore and south of Nabarangpur. They are dominantly found in the undivided Koraput district. Their population accounts to 28736 in Odisha out of which 17,463 are in Koraput, and 10746 in Nabarangpur district as per 2011 census. Amanatyaare largely found in Nandahandi block of Nabarangpur district.Settled cultivation is the mainstay of their subsistence economy. It is supplemented by wage earning, animal husbandry, forest collection, hunting, fishing and khali stitching etc.
Saora: The Saoras also called Savara, Saura, Sabara, Sahar, Saur and Sora is a major tribe in the State of Odisha. The tribe having reference in the epigraphic records and ancient literature of India is very widely distributed throughout the State of Odisha. They are mostly concentrated in Gajapati, Sambalpur, Puri and Rayagada districts. In Nabarangpur district, their population is 7369 with a Male population of 3531 and female population of 3838. The Saora depend upon land and forest for their subsistence. In recent times settled agriculture has taken precedence over shifting cultivation.
Study Design
Fieldwork for this research was carried out in Turunji village under DhondraPanchayat of Nandahandi block of Nabarangpur district, Odisha. The village is divided in to three hamlets namely Badagaon, Naikguda and Damunaikguda. Out of these three settlements, Badagaon is the biggest and is inhabited by scheduled tribal communities such as Amanatya / Omanatya, Bhattra/ Bhotra and Saura, scheduled caste communities such as Gauda and Biswakarma / Lohar (ironsmith), other religious group such as the Christians.
Area and People
The tribes of Odisha account to 22.8% of the states total population. There are 62 tribal communities in Odisha, 13 out of which are categorized as Particularly Vulnerable Tribal Groups(PVTG). Nabarangpur is a tribal dominated district of Odisha where 55.8% of total population of the district are tribes with 48 different tribal communities. Its boundary stretches in the north to Nuapada and Kalahandi Districts, west to Bastar District in Chhattisgarh, east to Kalahandi and Rayagada Districts and south to Koraput District. The district is home to about 13 tribal communities constituting 97.07% of the total tribal population of the district. The rest 35 categories of tribes constitute only 2.93% (Odisha District Gezetteers, Nabarangpur, Gopabandhu Academy of Administration [Gazetteers Unit], General Administration Department, Government of Odisha, 2016). Bhotra, Gond ,Paroja, Kandha, Amanatya, Saora and Holva are some tribal groups of the district. The primary occupation of the tribe of Nabarangpur is mainly daily agricultural and manual labours. Their traditional occupation used to be settled cultivation, gathering, and fishing. Many people travel to cities like Jeypore, Malkangiri, Nabarangpur, and nearby states like Chattisgarh and Andhra Pradesh for the purpose of unskilled labours. To summarize, the tribes of the district are very much lagging behind in socio economic aspects and have a very low literacy rate.
Prevalence of Undernutrition among three Tribe 113

Materials and Methods
The present study was undertaken to understand the pattern of height, weight, Body Mass Index (BMI) among the three tribal communities such as Bhotras, Amanatyas and Saoras of Turunji Village in Nabarangpur District, Odisha. For the present study data were collected from 200 individuals consisting of 100 males and 100 females. Individuals who voluntarily participated in the survey were only considered in the present work. Necessary ethical clearance were made at the institutional level to conduct th is research . Anthropometr ic measurements such as height and weight were taken to compute the Body Mass Index of these individuals. Anthropometry is an important tool for assessment of nutritional status of individuals or of a community. Hence, measurements such as height and weight were takenand Body Mass Index was calculated to evaluate the extent of malnutrition in these three tribes. The primary information about the subject who participated in the study, like name of the tribe, and sex was recorded in a structured schedule. Standard techniques were followed while taking all the anthropometric measurements. Standing height and weight was measured to the nearest 0.1 cm and 0.1 kg respectively. Stature was measured by using anthropometric rod and weight was by using manual weighing machine. Circumference measurements were taken using a measuring tape and skin fold measurements were taken by using skinfold calliper. Body mass index (BMI) is calculated as the weight in kilograms divided by the square of the height in meters
2(kg/m ).Nutritional status was evaluated using WHO guidelines (1995). The following cut-off points were utilized: CED: BMI <18.5; Normal:
BMI = 18.5–24.9; Overweight: BMI ≥ 25.0. Two trained anthropologists were involved during the
data collection process. One anthropologist took all the measurements while the other entered all the data in the data sheet in order to avoid measurement and data entry bias.
Data on socio-economic conditions of the village were collected from each households using a questionnaire/schedule (National Family Health S u r v e y ( N F H S ) - 4 , 2 0 1 5 - 1 6 ) . T h e questionnaire/schedule was completed using information on family s ize , education, income/expenditure, household assets/ liabilities, information on general health and hygienic practices and awareness, etc. The informationwere collected from household heads and were crosschecked from several other sources. Household size has been classified arbitrarily into in three groups such as Small (4 members), Medium (5- 7 members), Big (> 7 members). The literacy rate of the village Turunji is 60.17% (67.18 % in males and 53.24% in females) with gender literacy gap of 13.94%.In 2011 census, the literacy rate in Nabarangpur District was 48.20%. It was 59.45% for males and 37.22% for females. There is a gender literacy gap of 22.23% in the district as against the corresponding figure of 18.04% in Odisha & 16.3% in the country.Income wise, the population of village Turunji of Nabarangpur district has been classified into Low economic subgroup (income less than Rs. 10,000), Middle economic subgroup (income Rs.10,000 to Rs. 50,000) and High economic subgroup (income of Rs.50,000 or more) on the basis of per capita income per year using the cut-off point 50,000.00 as suggested by the local people themselves.All statistical analysis were undertaken using the SPSS Statistical Package version 20 for Windows(SPSS, 2011, Chicago). Descriptive statistics such as Mean and Standard Deviation (SD) for each variable was estimated for the selected anthropometric variables.
Result and Discussion In Table 1, Anthropometric characteristics of adult individuals (>20 years) presented.
Variables
Amanatya(n=28)
Bhotra(n=100)
Saora(n=72)
Total (n=200)
Male
(n=12)
Female(n=16)
Male(n=52)
Female(n=48)
Male(n=36)
Female(n=36)
Male(n=100)
Female(n=100)
Height (cm) (SD) 160.33
(±9.07)
156.00
(±4.69)
163.54
(±5.57)
149.75
(±5.75)
166.33
(±4.35)
153.00
(±5.12)
164.16
(±5.70)
151.92
(±5.67)
Table 1:Distribution of anthropometric variables across the study participants.
114
Man in Society ISSN 2347-1530Volume 23, 2016, pp. 112-119

Weight (kg) (SD) 54.67
(±9.71)
46.00
(±1.41)
54.92
(±6.04)
44.50
(±5.45)
51.22
(±6.61)
43.67
(±2.91)
53.56
(±6.62)
44.44
(±4.16)
BMI 21.33
(±1.5)
18.75
(±0.95)
20.46
(±1.85)
19.67
(±1.55)
18.56
(±2.0)
18.89
(±1.45)
19.88
(±2.08)
19.24
(±1.45)
Min waist (cm) (SD) 70.33 74.25 73.31 74.17 72.33 68.89 72.60 72.28
(±9.60) (±2.63) (±6.21) (±6.56) (±5.59) (±5.15) (±6.19) (6.01)
Max hip (cm) (SD)
87.33
(±6.02)
89.00
(±2.58)
86.31
(±4.44)
85.67
(±6.88)
85.33
(±3.90)
84.00
(±3.42)
86.08
(±4.29)
85.60
(±5.41)
WHR (SD) 0.80
(±0.05)
0.83
(±0.28)
0.85
(±0.60)
0.85
(±0.45)
0.85
(±038)
0.82
(±0.38)
0.84
(±0.53)
0.84
(±0.44)
Conicity Index(SD)
1.20
(±0.08)
1.25
(±0.02)
1.18
(±0.08)
1.20
(±0.08)
1.18
(±0.08)
1.18
(±0.08)
1.19
(±0.08)
1.20
(±0.08)
Head Circumference(SD)
53.67
(±1.53)
53.50
(±1.29)
53.77
(±1.58)
53.60
(±2.02)
52.44
(±1.23)
52.89
(±0.92)
53.28
(±1.54)
53.24
(±1.56)
MUAC(SD) 27.67
(±2.51)
25.50
(±1.29)
24.62
(±1.66)
23.17
(±1.40)
24.00
(±2.55)
22.44
(±1.13)
24.76
(±2.31)
23.28
(±1.62)
Table 1 indicates that the mean heights of the overall population (both males and females) are 164.16 ± 5.70 cm and 151.92 ± 5.67 cm respectively. Among the three tribal groups under study the Saora males are tallest (166.33 ± 4.35 cm) followed by the Bhotras (163.54 ± 5.57) cm and the Amanatya (160.33 ± 9.07 cm). Among the females, the Amanatyas are the tallest (156.00 ± 4.69 cm) and the Bhotras are the shortest (149.75 ± 5.75) cm. The mean weights of the overall population are 53.56 ± 6.62 kg and 44.44 ± 4.16 kg respectively. The mean weight of males of the three tribal communities Amanatya (54.67 ± 9.71) kg, Bhotra (54.92 ± 6.04kg) andSaora(51.22 ± 6.61kg) which
is greater than the females of the three tribal communities Amanatya (46.00 ± 1.41kg), Bhotra (44.50 ± 5.45kg) andSaora(43.67 ± 2.91kg) respectively.This indicates that the females are shorter and lighter than the males.The mean BMI of the total population are 19.88 for males and 19.24 for females. The Bhotras have males have a better BMI value (21.33) as compared to the Amanatya (20.46) and the Soaras (18.56). The Amanatya females have a better nutritional profile in terms of BMI as compared to the other two tribal groups.The nutritional profile of the Bhotras is better than the Amanatyas and the Saoras.
Tribe Sample size CED (BMI <18.5) Normal (BMI 18.5-25) Overweight(BMI >25)
Amanatya Male : 12
Female: 16
Bhotra Male: 52
Female: 48
Saora Male: 36
Female: 36
Total
Male : 100
Female:100
Total: 200
0
8 (50.0%)
4 (7.69%)
8 (16.6%)
16 (44.44%)
12 (33.33%)
20(20.0%)
28 (28.0%)
48 (24.0%)
12 (100%)
8 (50.0%)
48 (92.39%)
40 (83.4%)
20 (55.56 %)
24 (66.67%)
80(80.0%)
72(72.0%)
152 (76.0%)
0
0
0
0
0
0
0
0
0
Table 2: Nutritional status of the population based on BMI
Prevalence of Undernutrition among three Tribe 115

The rate of undernutrition among the three tribal groups are compared in Table 2. The rate of under nutrition is very high in Saora population and among the Amanatya females. The rate of undernutrition is comparatively low as compared to Bhotras and Saoras. The highest frequency of undernutrition is found among the Amanatya females i.e, 50.0% followed by Saoras ( male = 44.44% ; female =33.33%) and Bhotras ( males =7.69%; females= 16.6%). Total population shows that 24% of overall population (including both male and female) fall under CED level. None of the individuals are found
overweight or obese in the studied population.
The study shows a high prevalence of CED among Amanatyas and Saoras. The Bhotras have a low percentage of CED but this can not be neglected. While comparing our study with other studies among various tribes of Eastern India we find a coherence that in most studies females have a lower BMI value than the males. But in Oraon, Santal (Mukhopadhyay, 2010), Savar (Bisai and Bose, 2012) and Saora (present study) the females have higher BMI value than that of the males.
Sl No Community Body Mass Index Reference
Male Female
1
Bathudi 18.4 17.9 Bose and Chakravarti, 2005
2
Oraon (Odisha) 18.8 19.3 Beck and Mishra, 2010
3
Oraon (West Bengal)
18.8 19.7 Mittal and Srivastava,2006
4
Juang
19.4 18.3 Goswami, 2013
5
Bhumij (Odisha) 18.9 18.5 Goswami, 2012
6
Bhumij (West Bengal) 18.7 18.4 Ghosh, 2007
7
Mankidia 19.3 18.6 Goswami, 2011
8
Munda 18.7 17.7 Ghosh and Bharati, 2006
9
Santal
20.0 19.3 Bose et al., 2006
10
Santal
18.5 18.7 DattaBanik etal., 2007
11
Santal
20.5 19.5 Mukhopadhyay, 2010
12
Santal
19.5 18.1 Das and Bose, 2010
13
KoraMudi 18.7 18.3 Bose et al., 2006
14
Dhimal 19.5 19.1 DattaBanik et al., 2007
15
Lodha 19.5 19.3 Mondal, 2007
16
Hill Kheria 19.2 17.9 Das and Bose, 2014
17
Birhor 20.5 20.0 Das et al.. 2013
18
Savar
18.9 19.3 Bisai and Bose, 2012
19
Amanatya 21.33 18.75 Present study , 2017
20
Bhotra 20.46 19.67 Present study , 2017
21
Saora
18.56 18.89 Present study , 2017
Table 3 gives an overview to the mean BMI values of some tribes of Eastern India.
116
Man in Society ISSN 2347-1530Volume 23, 2016, pp. 112-119

Under nutrition remains a major issue among the tribes of India. Several recent studies (Bose and Chakravarti, 2005, Ghosh and Bharati, 2006, Mittal and Srivastava,2006, Bose et al., 2006, DattaBanik et al., 2007, Mondal, 2007, Mukhopadhyay, 2010,
Goswami, 2012, Bisai and Bose, 2012, Das and Bose, 2014,) have highlighted the nutritional status of various tribes of Eastern India such as Oraon, Bhumij, Bathudi, Juangs, Lodha, Dhimal, Santal, Mankidia, Savara, KoraMudis etc.
Table 4 shows the prevalence of CED or undernutrition among the tribes of Eastern India.
Tribe Sample size Mean BMI CED (BMI<18.5)
(%)
Study Area Reference
Oraon Male – 200 18.8 (2.0) 47.0 Jalpaiguri Mittal and
Srivastava,2006Female – 150 19.7 (2.4) 31.7
Lodha Male – 157 19.5 (2.7) 45.2 PaschimMedinipur Mondal, 2007
Female - 199 19.3 (2.6) 40.7
Dhimal Male: 159 19.5(2.5) 27.0 Darjeeling DattaBanik et al., 2007
Female:146 19.1(2.6) 46.4
Santal Male:400 18.5(2.1) 55.0 Bankura DattaBanik et al., 2007
Female:400 18.7 (2.3) 52.5
Bhumij Male: 244 18.9 (2.6) 48.4 Balasore Goswami, 2012
Female:223 18.5 (2.0) 58.3
Mankidia Male:124 19.3 (2.2) 48.4 Mayurbhanj Goswami, 2011
Female:136 18.6 (2.8) 59.5
Juang Male:414 19.4 (2.7) 51.9 Keonjhar Goswami, 2013
Female:423 18.3 (2.9) 62.9
Bathudi Male:226 18.4 (1.9) 52.7 Keonjhar Bose and Chakravarti,
2005 Female:183 17.9 (2.5) 64.5
Savara Male: 19.3 (2.1) 38.0 Keonjhar Bose et al., 2006
Female: 18.9 (2.7) 49.0
KoraMudi Male: 18.7 (1.8) 48.0 Bankura Bose et al., 2006
Female: 18.3 (2.1) 56.4
Amanatya Male : 12 21.3 (1.5) 0 Nabarangapur Present study, 2017
Female: 16 18.6 (0.9) 50.0
Bhotra Male: 52 20.5 (1.8) 7.69 Nabarangapur Present study, 2017
Female: 48 19.7 (1.5) 16.6
Saora Male: 36 18.6 (2.0) 44.44 Nabarangapur Present study, 2017
Female: 36 18.9 (1.4) 33.33
Table 4: Prevalence of CED among the tribes of Eastern India.
These studies reveal that there is a very high prevalenceof CED among the tribes of Eastern India. Studies show that the percentage of CED is higher in females as compared to females whereas in Oraon, Lodha, Santal, and Saora (present study)
the prevalence of CED is higher in case of males. The present study shows a high percentage of CED among the Saoras and Amanatyas. The Bhotras have a lower CED level but this cannot be neglected. This implies that the tribes of Eastern India are under
Prevalence of Undernutrition among three Tribe 117

serious nutritional stress. This might be due to their poor socio-economic conditions, lack of education, food habits and lack of awareness about health and healthcare facilities. The government should play a pro-active role in increasing the socio-economic conditions and hence reducing the rate of undernutriton among the tribal groups of eastern India.
Conclusion
The present study among the three ethnic groups of Turunji village of Nabarangpur reveals that the prevalence of undernutrition is very much common irrespective of. Females are the worst sufferers as compared to their male counterparts. When the results of the present studies were compared with other studies among the tribes of Eastern India, it shows a similar trend in terms of undernutrition. However, this distinct inter-tribal difference is due the variation in their poor socio-economic condition, poor literacy rate, food habits, lack of awareness and health care facilities.Therefore, better education and employment opportunities will enhance their overall development. Keeping this in mind, formulation and implementation of culture and gender specific nutritional intervention programs forupliftment of these tribal groups is imperative. Since undernutrition has several underlying causes, future investigations should aim at identifying the likely causes of high prevalence of undernutrition among these tribes.
Acknowledgements
I would like to thank all the subjects for their cooperation and patience during the study span. I also express my indebtedness towards Prof. UpaliAparaj i ta , Head and Professor in Anthropology, Utkal University for her cooperation.
References.
Bisai S. and Bose K. 2008.Body Mass Index and Chronic Energy Deficiency among Adult tribal populations of West Bengal: A Review.Tribes and Tribals.2, 87-94.
Bose K. and Chakrabarty F. 2005. Anthropometric characteristics and nutritional status based on body mass index of adult Bathudis; a tribal population of Keonjhar district, Orissa, India. Asia Pacific Journal of Clinical Nutrition.14, 80-82.
Bose K., Chakrabarty F, Mitra K. &Bisai S. 2006a.Nutritional status of adult Santal men in Keonjhar District, Orissa, India.Food Nutrition Bulletin.27, 353-356.
Bose K., Chakrabarty F., Bisai S., Khatun A. &Bauri H. 2006b. Body mass index and nutritional status of adult Savartribals of Keonjhar District, Orissa, India.Asia Pacific Journal of Public Health.18, 3-7.
Bose K., Ganguli S., Mamtaz H., Mukhopadhyay A. &Bhadra M 2006c. High prevalence of under-nutrition among adult KoraMuditribals of Bankura District, West Bengal, India.Anthropological Science.114, 65-68.
Bose K., Banerjee S., Bisai S., Mukhopadhyay A. &Bhadra M. 2006d. Anthropometric profile and chronic energy deficiency among adult Santaltribals of Jhargram, West Bengal, India: Comparison with other tribal populations of Eastern India.Ecology of Food and Nutrition.45, 1-11.
Beck P, Mishra B.K. 2010.Socio Economic profile and Quality of Life of Selected Oraon Tribal Living in and around Sambalpur town, Orissa.Curr Res J SocSci 2(6): 340-349.
Chakraborty S., Pal M., Bharati S. &Bharati P. 2008. Chronic energy deficiency among tribal communities of Orissa, India.Tribes and Tribals.2, 95-101.
Das, S. and Bose K. 2012.Nutritional deprivation among the Indaintribals: A cause of concern. Anthropological Notebooks 18(2):5-16.
Das,S. and Bose K. 2015. Adult Tribal Malnutrition in India: An Anthropometric and Socio-Demographic Review, Anthropological Review , 78(1), 47-65.
Datta Banik S., Bose K., Bisai S., Bhattacharya M., Das S., Jana A. &Purkait P. 2007. Chronic energy deficiency among the Adult Dhimals of Naxalbari, West Bengal – Comparison with other tribes of Eastern India.Food and Nutrition Bulletin. 28(3), 348-352.
DattaBanik S. 2008. Nutritional Status of Adult Men from the Oraon Tribe in Ranchi District of Jharkhand, India.Malaysian Journal of Nutrition. 14(1), 91-98.
Ghosh M. 2007. Nutritional status of adult Bhumij
118
Man in Society ISSN 2347-1530Volume 23, 2016, pp. 112-119

males of Kharagpur, PaschimMedinipur. Paper presented in seminar on Approaching Development in Department of Anthropology, Vidyasagar University. Abstract no 05, 22.
Ghosh R. &Bharati P. 2006. Nutritional status of adults among Munda and Pod populations in a peri urban area of Kolkata city, India.Asia Pacific Journal of Public Health. 18(2), 12-20.
Ghosh S. & Malik S. L 2007.Sex differences in Body size and Shape among Santals of West Bengal.Anthropologist. 9(2), 143-149.
Goswami M. 2011. Socio-economic profile and anthropometric characteristics of the Mankidias-A primitive tribe of Northern Orissa, India.Tribes &Tribals.
Goswami M. 2012. Body mass index and chronic energy deficiency of adult Bhuyans: A vulnerable tribal group.
Griffiths P.L and Bentley M.E. 2001. The nutrition transition is underway in India. Journal of Nutrition.131, 2692-2700.
Kapoor S, Prerna B, Dhall M, Bhardwaj S. Reproductive characteristics and sociodemographic factors as predictors of general and regional obesity among adult women., Indian Journal of Physical
Anthropology and Human Genetics,2010(d); 29 (1-2):1-19.
Khongsdier R. Body Mass Index of Adult Males in 12 populations of Northeast India. Annals of Human Biology 2001; 28 (4):374-383.
Mishra A. Biology, Culture and Aging: A Comparative Study (Unpublished Doctoral Thesis).University of Delhi, Delhi. 2012.
Mondal P. S. 2007. Nutritional status of adult Lodha males of Shyamraipur, PaschimMedinipur. Paper presented in seminar on Approaching Development in Department of Anthropology, Vidyasagar University. Abstract No 06, 23.
Mungreiphy, N. K., Dhall, M., Tyagi, R., Saluja, K., Kumar, A., Tungdim, M. G., and Kapoor, S. Ethnicity, obesity and health pattern among Indian population. Journal of natural science, biology, and medicine.2012; 3(1):22-29.
Saini M, Kapoor A.K, Kapoor S. 2015. Pattern of Cardiovascular Functions, Nutritional Status and Obesity Indices among Baiga and Gond Tribes of Madhya Pradesh: International Journal of Medical Research Health Science: 4(1): 94-102.
Weiner, J.S and Lourie J.A, Practical Human Biology, Academic Press, London, UK, 1981.
Prevalence of Undernutrition among three Tribe 119

INSTRUCTIONS TO THE AUTHORS
Manuscripts for MAN IN SOCIETY must be prepared in accordance with the following guidelines for prompt action.
EDITORIAL POLICY: The manuscripts should be typed with line-spacing of 1.5, including notes on A4 paper, in Times New Roman, font size 12. Within the text the tables should be referred to by their numbers. Use single quotation marks while quoting sentences or a single word/phrase and double quotation marks for use within single quotes. All words in languages/dialects other than English should be in italics. The manuscript should be aproxmately 6000 to 8000 wards: in any case it should not exceed 10000 wards, original unpublished work and should not have been submitted for publication elsewhere The manuscripts should be sent only in Microsoft Word to the Editor Man in Society, P.G Department of Anthropology, Utkal University, Vani Vihar, Bhubaneswar, Pin-754004Ph: 0674 2567217Email: [email protected]: www.misanthroutkal.com
REFERENCES: These should be listed at the end of article, as per the Chicago style of references practiced in the Current Anthropology Journal. Following are the examples for the proper style of references from various sources:Journals:Nayak, P.K. 2013. Shamanism in Tribal India: Dimensions of an Everyday Religion. Man in Society, 20: 11-32.Books:Mahapatra, L.K. 2003. State, Society and Religion: Culturehistorical Comparative Perspectives of Southeast Asia. Chennai: Emerald PublishersSections of Books:Cohen, C.P. 1998. United Nations convention on rights of the child: relevance for indigenous children. In: D.K. Bherea (Ed.): Children and Childhood in Contemporary Societies. Delhi: Kamla-Raj Enterprises, pp. 173-187.Newspaper / Magazine:
Bhasin, V. 1982. Ecology and Gaddi Culture.
Hindustan Times, Weekly, August 29, 1982, P. 9
Meeting Paper:
Bhasin, V., Bhasin M.K., Singh, I.P. 1978. Some problems in the education of Gaddis of Bharmour, Chamba District, Himachal Pradesh. Paper presented in Seminar on Education and Social Change in Himachal Pradesh (H.P.) in H.P. University, Shimla, November 13 to 16, 1978.
Report:
Work “in press”:
Das, K.C. 2004. Economic pursuits and strategies of survival among Birhor of Odisha. J Hum Ecol, (in press).
Website:
From <https://deepblue.lib.umich.edu/ bitstream/ handle/2027.42/66329/aa.1999.101.1.23.pdf>(Retrieved on 18 March 2016).
REFERENCES IN THE TEXT: References citations in the text should be in parentheses and include author name(s) and year of publication. Text citations of two or more works at the time should be given in chronological order. When citing a paper written by three or more authors, write the name of the first author title plus “et al”. (However, all authors must be given in the Reference section). Where there are two or more papers by the same author in one year, distinguishing letter (a, b, c....) should be added to year. All references should be carefully crosschecked. It is the author's responsibility to ensure that references are correct.
Disclaimer
This publication contains information obtained from authentic and highly regarded sources. Reasonable effort has been made to publish reliable data and information, but the author and the publisher cannot assume responsibility for the validity of all materials or for the consequences of the use.
All rights are reserved. No part of this publication may be reproduced, stored in a retrieval system or transmitted, in any form, or by any means, electronic, mechanical, photocopying, recording or otherwise, without prior permission, in writing, from the publisher or the author.

CONTENTS
Sl. Title of the Article Author/s Page
1. Consumer Culture Affects Product Design: Manas Ranjan Sahoo and Upali Aparajita 1-12 A Discussion
2. Anthropology of Disaster Mitigation and Prasant Kumar Sahoo 13-21 Management Upali Aparajita
3. Cultural Framework for Human Resource Dhyanadipta Panda, Upali Aparajita and 22-37 Information System Design Bijaya Krushna Mangaraj
4. ABO and Rh frequency distribution and gene Shyama Mohapatra, Arundhuti Das, 38-44 frequency among the Bhumij community of Sushree Lipsa Mohanty, Balasore district, Odisha Kanhu Charan Satapathy and Prasanna Kumar Patra
5. Maternal and childhealth among the ethnic Subhalaxmi Baral, 45-55 groups of Turunji village of Nabarangpur Kanhu Charan Satapathy district, Odisha and Prasanna Kumar Patra
6. Association study of alcohol consumption Sushree Lipsa Mohanty, Arundhuti Das, 56-59 with perceived stress among Munda and Pana Prasanna Kumar Patra communities of Jajpur district, Odisha and Kanhu Charan Satapathy
7. A Study on Age at Menopause, Menopausal Y.Puja, Kanhu Charan Satapathy 60-68 Symptoms and problems among Ethnic and Prasanna Kumar Patra groups of South Odisha
8. Assessment of Knowledge, Attitude and Basanta Kumar Bindhani 69-77 Awareness towards Sickle Cell Disease among People of Nine Villages of Koraput District: A Psychosocial Study
9. Urban Transformation Of Cities: A Case Study Krishna kumar A and Upali Aparajita 78-95 Of Bhubaneswar City
10. Growth pattern of Height and Body weight Jagatdarshi Badamali, Kanhu Charan 96-104 during Childhood and Adolescence: Satapathy and Prasanna Kumar Patra A Cross-sectional Study on three rural populations of Odisha
11. Impact Of Forest Proximity On Livelihoods Soumendra Sarangi 105-111 And Food Security Of Forest Dependent Tribal Communities
12. Prevalence of Undernutrition among three Diptiranjan Sahoo, Kanhu Charan Satapathy 112-119 Tribes of Nabarangpur, Odisha and Prasanna Kumar Patra