M.A.MacDougall_Heasman_PhD_2020.pdf - Abertay University
399
The Chemical And Physical Characterisation Of Illicit Tablets And Development Of A Statistical Model To Identify Populations Within The Illegal Supply Chain A thesis submitted for the degree of Doctor of Philosophy (PhD) by Mavis Ann MacDougall-Heasman School of Science, Engineering and Technology, Abertay University. October, 2018
-
Upload
khangminh22 -
Category
Documents
-
view
0 -
download
0
Transcript of M.A.MacDougall_Heasman_PhD_2020.pdf - Abertay University
The Chemical And Physical Characterisation Of Illicit
Tablets And Development Of A Statistical Model To
Identify Populations Within The Illegal Supply Chain
A thesis submitted for the degree of Doctor of Philosophy
(PhD)
by
Mavis Ann MacDougall-Heasman
School of Science, Engineering and Technology,
Abertay University.
October, 2018

i
ii
I certify that this is a true and accurate version of the thesis approved by
the examiners, and that all relevant ordinance regulations have been
fulfilled.
Supervisor…………………………………………………………………..…….
Date………………………………………………………………………………..

iii
I would like to thank my supervisors, Mrs Isobel Stewart, Dr Anne Savage
and Prof. David Bremner for their guidance, support, advice and endless
patience throughout my project. Their encouragement and wisdom has
given me the opportunity to achieve more than I had imagined both in
terms of carrying out the research and in presenting at various
international conferences, for which I am deeply grateful.
My thanks also go to the technical staff at Abertay and in particular Ms
Louise Milne and Mr Maurice Lindsay, whose knowledge, advice and
support has been invaluable. The lessons in how to strip down and clean
out the HPLC were helpful for practical reasons and to help me think
through processes more logically.
I would also like to thank the staff at Robert Gordon University,
particularly Dr Ann Tough and Mr. Iain Tough for allowing me access to
their valuable resources and providing the necessary training. Special
thanks to Dr Kerr Matthews for his support, guidance and expertise, as
well as indulging my interest to test baby milk both by DSC and in the
tablet press. The lessons on thermal analysis and tablet production were
invaluable. Thanks also to Ms Shahdia Bibi, Dr Laurie Smith and Mr
Stephen Williamson for their endless support.
Thank you also to Dr Nia White and Mrs Wendy Robb in the Graduate
School for their guidance and encouragement during my research period
and, to Abertay University RLincs project for the financial support for the
research.

iv
For my mum, my dad and Richard for supporting me. For Jordan,
Marietta and Brooke for believing in me.
For Mairi for always being there and, for Helen because nothing is
forgotten. Nothing is ever forgotten.
v
Diazepam is an effective pharmaceutical used for both medicinal and illicit
purposes and its popularity has led to the sale of both diverted
pharmaceutical tablets and illicitly manufactured products. The aim of this
project was to characterise 65 different cases of illicit tablets seized from the
Tayside area. Physical and chemical analysis was compared with known
pharmaceutical tablets and resulting data was statistically evaluated, to reveal
potential links between illicit cases and distinguish pharmaceutically
manufactured diverted products.
Physical differences between cases revealed many of the tablets were not
pharmaceutically manufactured for the UK market. This was supported by
chemical analysis using GC-MS and HPLC, which indicated that only 39 of
the 63 cases analysed contained diazepam as the main active ingredient,
with diazepam levels varying between 8 – 48 mg and more potent substances
found in many tablets. An innovative use of DSC demonstrated great
sensitivity in distinguishing between cases, based largely on excipients. A
novel approach for forensic analysis was taken both through visual
comparison of thermograms and by statistical analysis of resulting data.
The statistical clustering techniques of AHC and k-means were used to
explore combined results and potential links between a subset of cases were
visualised in a heat map. DSC data points were then explored by PCA and
LDA to further distinguish between the pharmaceutical tablets and seized
cases.
Overall, a combination of physical characteristics, chemical properties and
statistical analysis were able to distinguish between the small number of
pharmaceutically manufactured diverted cases and the majority revealed to
be illicitly produced. This is important new research into street drugs, which
reveals an insight into the illicit market and the dangerous nature of blue
tablets being sold, providing valuable information to both police and medical
services.

vi
Table of Contents
Declaration ................................................................................................. i
Certificate of Approval ............................................................................... ii
Acknowledgements .................................................................................. iii
Dedication ................................................................................................ iv
Abstract ................................................................................................. v
Table of Contents ..................................................................................... vi
List of Figures ........................................................................................ xix
List of Tables......................................................................................... xxvi
List of Abbreviations .............................................................................. xxix
Benzodiazepine Structures referred to in this Thesis ............................ xxxi
Chapter 1. Aims and Objectives of this Study .......................................... 1
1.1 Aims of the Research ................................................................. 1
1.2 Objectives of the Research ......................................................... 1
1.3 Chapter Overview ....................................................................... 2
Chapter 2. Introduction .............................................................................. 5
2.1 Chapter Summary....................................................................... 5
2.2 Diazepam ................................................................................... 5
2.2.1 Description and Structure ...................................................... 5
2.2.2 Discovery of Diazepam ......................................................... 6
2.2.3 Benzodiazepine Family ....................................................... 10

vii
2.2.4 The Rise in Popularity of Diazepam .................................... 16
2.2.5 Illicit Benzodiazepine Use ................................................... 17
2.2.5.1 Polydrug Use ............................................................... 18
2.2.5.2 Drug Related Deaths.................................................... 19
2.3 Pharmaceutics .......................................................................... 24
2.3.1 Formulation of Tablets ......................................................... 24
2.3.2 Impact of Particle Size ......................................................... 24
2.3.3 Crystal Properties of Molecules ........................................... 25
2.3.4 Tablet Excipients ................................................................. 26
2.3.4.1 Diluents Used In Tablet Manufacture ........................... 26
2.3.4.2 Disintegrants Used In Tablet Manufacture ................... 27
2.3.4.3 Binders Used In Tablet Manufacture ............................ 27
2.3.4.4 Glidants Used In Tablet Manufacture ........................... 27
2.3.4.5 Lubricants Used In Tablet Manufacture ....................... 28
2.3.4.6 Anti-adherents Used In Tablet Manufacture ................. 29
2.3.4.7 Colourants Added in Tablet Manufacture ..................... 30
2.3.4.8 Pharmaceutical Excipients ........................................... 31
2.3.4.9 Interactions between Excipients ................................... 31
2.3.5 Tableting Methods ............................................................... 32
2.3.5.1 Granulation Method...................................................... 32
2.3.5.2 Direct Compression Method ......................................... 34

viii
2.3.6 Tablet Manufacture ............................................................. 35
2.3.6.1 Tablet Presses ............................................................. 35
2.3.6.2 Compression of Powders ............................................. 38
2.3.7 Tablet Properties ................................................................. 39
2.4 Drugs and the Law.................................................................... 42
2.5 Illicit Drugs ................................................................................ 46
2.5.1 Substandard and Counterfeit Products ............................... 46
2.5.2 The Rise of Illicit Drug Usage in the United Kingdom .......... 47
2.5.3 Sourcing of Illicit Drugs ........................................................ 48
2.5.4 Drug Seizures ..................................................................... 50
2.6 Analysis of Illicit Diazepam (1) Tablets ..................................... 52
2.7 The Use of Statistical Analysis ................................................. 55
2.8 Assumptions and Strategies used in this Study ........................ 58
Chapter 3. Physical Characteristics of the Tablets .................................. 60
3.1 Chapter Summary..................................................................... 60
3.2 Introduction ............................................................................... 60
3.2.1 The Manufacture of Pharmaceutical Tablets ....................... 60
3.2.2 Tablet Quality ...................................................................... 61
3.2.3 Physical Appearance of Illicit Tablets .................................. 62
3.2.3.1 Comparison of the Physical Characteristics ................. 62
3.2.3.2 Manufacturer Logos ..................................................... 63

ix
3.2.3.3 Tool Marks ................................................................... 63
3.2.3.4 Granularity of Tablets ................................................... 63
3.2.3.5 Colour of Tablets .......................................................... 64
3.3 Overview of the Analysis of the Physical Characteristics.......... 64
3.4 Experimental ............................................................................. 65
3.4.1 Photography of Tablets ....................................................... 65
3.4.1.1 Light Intensity ............................................................... 66
3.4.1.2 Materials for the Light Box ........................................... 66
3.4.1.3 Construction of the Light Box ....................................... 67
3.4.1.4 Camera set-up ............................................................. 68
3.4.2 Tablet Markings ................................................................... 69
3.4.3 Tablet Measurements .......................................................... 69
3.4.3.1 Weight of the Tablets ................................................... 69
3.4.3.2 Dimensions of the Tablets ............................................ 70
3.5 Results and Discussion ............................................................ 72
3.5.1 Photography of the Tablets ................................................. 72
3.5.2 Tablet Markings ................................................................... 72
3.5.2.1 Imprint Details on the Tablets ...................................... 72
3.5.2.2 Damage Marks on the Tablets ..................................... 74
3.5.3 Measurements of the Tablets .............................................. 75
3.5.3.1 Tablet Diameter ........................................................... 81
x
3.5.3.2 Tablet Depth ................................................................ 83
3.5.3.3 Tablet Weight ............................................................... 85
3.5.4 Comparison of Results ........................................................ 88
3.6 Conclusion ................................................................................ 91
Chapter 4. Gas Chromatography - Mass Spectrometry ........................... 93
4.1 Chapter Summary..................................................................... 93
4.2 Introduction ............................................................................... 93
4.2.1 Analysis of Benzodiazepines ............................................... 94
4.2.1.1 Analysis of Impurities ................................................... 94
4.2.1.2 Derivatisation of Benzodiazepines ............................... 95
4.2.1.3 Thermal Degradation of Benzodiazepines ................... 96
4.2.2 Application of GC-MS to the Analysis of Illicit Drug Samples ..
............................................................................................ 99
4.2.2.1 Mass Spectrometry .................................................... 100
4.3 Experimental ........................................................................... 101
4.3.1 Instrumentation.................................................................. 101
4.3.2 Method of Analysis ............................................................ 101
4.3.3 Materials used in this Project ............................................ 102
4.3.4 Preparation of Standards .................................................. 103
4.3.5 Preparation of Samples ..................................................... 104
4.3.5.1 Preparation of Samples using Diethyl Ether ............... 104

xi
4.3.5.2 Preparation of Samples using Methanol .................... 104
4.3.5.3 Preparation of whole tablets using Methanol ............. 104
4.3.6 Overview of the GC-MS analysis performed ..................... 105
4.3.6.1 Benzodiazepines in Salt and Freebase Form ............ 105
4.3.6.2 Sample size used for GC-MS Analysis ...................... 105
4.3.6.3 Run sequence of Samples ......................................... 106
4.3.6.4 Small Case Size ......................................................... 107
4.4 Results and Discussion .......................................................... 108
4.4.1 Diazepam and Ketazolam ................................................. 110
4.4.1.1 Detection of Ketazolam (10) ....................................... 111
4.4.2 Identification of Phenazepam ............................................ 118
4.4.3 Chromatographic Separation of Etizolam and Triazolam .. 121
4.4.3.1 Identification of Etizolam (7) ....................................... 125
4.4.4 Identification of Chlordiazepoxide (3) ................................ 129
4.4.4.1 Analysis of Case 136 ................................................. 131
4.4.5 Detection of Lubricants ...................................................... 137
4.4.6 Summary of GC-MS Results ............................................. 138
4.4.7 Analysis of Results ............................................................ 140
4.5 Conclusion .............................................................................. 143
Chapter 5. High Performance Liquid Chromatography .......................... 145
5.1 Chapter Summary................................................................... 145
xii
5.2 Introduction ............................................................................. 145
5.2.1 Uses of HPLC ................................................................... 145
5.2.1.1 HPLC in Pharmaceutical Studies ............................... 145
5.2.1.2 Analysis of Illicit Tablets ............................................. 146
5.2.2 Methodology ...................................................................... 147
5.2.2.1 Methodological Background ....................................... 147
5.2.2.2 Sample Sizes ............................................................. 149
5.3 Experimental ........................................................................... 150
5.3.1 Instrumentation.................................................................. 150
5.3.2 Materials used in the HPLC Analysis ................................ 150
5.3.3 Preparation of Solutions .................................................... 151
5.3.4 Preparation of Standards .................................................. 151
5.3.5 Preparation of Tablets ....................................................... 152
5.3.6 Validation of the Method .................................................... 152
5.3.7 Precision of Quantification ................................................. 156
5.3.8 Run sequence ................................................................... 157
5.3.9 Overview of the HPLC Analysis......................................... 157
5.3.9.1 Drift in Retention Times .............................................. 157
5.3.9.2 Difference in Colourants ............................................. 157
5.3.9.3 Tablet Availability ....................................................... 158
5.3.9.4 Consistency of Blend of the Illicit Tablets ................... 159
xiii
5.4 Results and Discussion .......................................................... 160
5.4.1 Content of Illicit Cases ....................................................... 160
5.4.1.1 Active Drug Substances Detected ............................. 160
5.4.1.2 Chromatographic Separation of Active Drug Substances
................................................................................... 163
5.4.1.3 Comparison of Case 136 to the Certified
Chlordiazepoxide Standard ........................................................ 165
5.4.2 Analysis of Results ............................................................ 168
5.4.3 Quartered Tablet ............................................................... 170
5.5 Conclusion .............................................................................. 171
Chapter 6. Differential Scanning Calorimetry ......................................... 173
6.1 Chapter Summary................................................................... 173
6.2 Introduction ............................................................................. 173
6.2.1 Types of Differential Scanning Calorimeter ....................... 173
6.2.2 Pharmaceutical Use .......................................................... 174
6.2.2.1 Polymorphism in Solid Substances ............................ 174
6.2.2.2 Compatibility Studies.................................................. 176
6.2.3 Forensic Use of DSC ......................................................... 177
6.3 Overview of DSC analysis ...................................................... 178
6.4 Experimental ........................................................................... 178
6.4.1 Instrumentation.................................................................. 178
6.4.2 Materials used in DSC Analysis ........................................ 179
xiv
6.4.3 Methodology used in DSC Analysis .................................. 179
6.4.4 Repeatability of the Analysis ............................................. 181
6.4.5 Temperature Range Analysed .......................................... 181
6.5 Results and Discussion .......................................................... 182
6.5.1 Common Excipients used in Pharmaceutical Tablets........ 182
6.5.2 Certified Drug Standards Tested for Comparative Purposes ..
.......................................................................................... 183
6.5.3 Pharmaceutical Tablets Analysed by DSC ........................ 185
6.5.4 Illicit Cases Analysed by DSC ........................................... 187
6.5.5 Effects of Excipients .......................................................... 195
6.5.6 Baby Milk ........................................................................... 196
6.5.6.1 Methodology .............................................................. 196
6.5.6.2 Results of DSC Analysis ............................................ 196
6.5.7 Effects of Ageing ............................................................... 197
6.5.8 Analysis of Results ............................................................ 199
6.6 Conclusion .............................................................................. 203
Chapter 7. Statistical Cluster Analysis ................................................... 205
7.1 Chapter Summary................................................................... 205
7.2 Introduction ............................................................................. 205
7.3 Aim of Statistical Cluster Analysis .......................................... 206
7.4 Procedure ............................................................................... 207

xv
7.4.1 Variables Used in the Analysis .......................................... 207
7.4.1.1 Subjective Comparison .............................................. 207
7.4.1.2 The Physical Characteristics ...................................... 210
7.4.1.3 Differential Scanning Calorimeter .............................. 211
7.4.2 The Clustering Techniques ............................................... 212
7.4.2.1 The use of Subjective Clustering ............................... 213
7.4.2.2 The use of Agglomerative Hierarchical Clustering (AHC)
................................................................................... 213
7.4.2.3 The use of K-means Clustering .................................. 214
7.4.3 Heat Map Creation ............................................................ 215
7.5 Results and Discussion .......................................................... 215
7.5.1 Results of Subjective Clustering ........................................ 215
7.5.2 Results of AHC .................................................................. 217
7.5.2.1 Active Drug Substance and Physical Data ................. 217
7.5.2.2 Sample Size Test ....................................................... 220
7.5.2.3 Analysis of Chemical Test Results Generated by DSC ....
................................................................................... 224
7.5.3 Results of K-means Clustering .......................................... 226
7.5.3.1 Active Drug Substance and Physical Data ................. 226
7.5.3.2 Sample Size Test ....................................................... 227
7.5.3.3 Results of K-Means Clustering of DSC Data .............. 230
7.5.4 Creation of Heat Map ........................................................ 234
xvi
7.6 Conclusion .............................................................................. 239
Chapter 8. Statistical Differentiation of Pharmaceutically Manufactured
Tablets ............................................................................................. 241
8.1 Chapter Summary................................................................... 241
8.2 Introduction ............................................................................. 241
8.2.1 Tablet Classification .......................................................... 241
8.2.2 Rationale Behind the Statistical Methodology ................... 241
8.2.3 Choice of model ................................................................ 242
8.3 Aim of Statistical Model .......................................................... 246
8.4 Analytical Procedure Employed .............................................. 246
8.4.1 The MA/D10 Test Group ................................................... 246
8.4.2 Pharmaceutical and Non Pharmaceutical Tablets ............. 248
8.4.3 Separation of Illicitly Manufactured Tablets ....................... 249
8.4.3.1 Identification of the Active Drug Substance by GCMS249
8.4.3.2 Quantification of Diazepam by HPLC ......................... 249
8.4.3.3 Excipient Analysis using DSC .................................... 251
8.4.3.4 Reducing DSC dataset dimensionality with Principal
Component Analysis (PCA) ........................................................ 252
8.4.3.5 Visualisation of the Results of Principal Component
Analysis ................................................................................... 253
8.4.3.6 Application of Linear Discriminant Analysis ................ 256
8.5 The Statistical Model Applied ................................................. 258

xvii
8.5.1 Aim of the Analysis ............................................................ 258
8.5.2 Results of Linear Discriminant Analysis ............................ 259
8.5.3 Allocation Rules................................................................. 259
8.5.3.1 Investigation of Centroids ........................................... 260
8.5.3.2 Investigation into Confidence Intervals....................... 261
8.5.3.3 Receiver Operating Characteristic curve (ROC) Analysis
................................................................................... 264
8.5.4 Validation of the Statistical Technique ............................... 265
8.5.4.1 Validation by Leave-one-out analysis......................... 265
8.5.4.2 Validation of models using test sample ...................... 266
Centroids ............................................................... 266
Confidence Intervals .............................................. 267
ROC Curve ............................................................ 268
8.5.5 Test of Assumptions and Suitability of Data ...................... 269
8.5.5.1 Independence and non-multiple linearity. ................... 270
8.5.5.2 Multivariate normality ................................................. 270
8.5.5.3 Homogeneity of variance/covariance matrix .............. 271
8.5.6 Suitability of Data .............................................................. 273
8.6 Conclusion .............................................................................. 276
Chapter 9. Conclusions and Recommendations for Future Work .......... 278
9.1 Chapter Summary................................................................... 278

xviii
9.2 Conclusions ............................................................................ 278
9.3 Recommendations for Future Work ........................................ 282
Publications Arising from this Work ....................................................... 286
Appendices ........................................................................................... 287
Appendix I - Statistical Techniques Applied....................................... 287
Euclidean Distance ........................................................................ 288
Agglomerative Hierarchical Clustering ........................................... 297
K-Means Clustering ....................................................................... 303
Principal Component Analysis ....................................................... 311
Linear Discriminant Analysis .......................................................... 321
‘R’ Scripts used for PCA Analysis .................................................. 330
Appendix II – Accepted Ethics Form ..................................................... 332
References............................................................................................ 342

xix
Figure 2.1. The structure of diazepam (1), with carbon numbering. ......... 6
Figure 2.2. Structure of chlorpromazine. .................................................. 8
Figure 2.3. Structure of chlordiazepoxide (3). .......................................... 9
Figure 2.4. The chemical structure of the parent compound used in
Sternbach’s research. ............................................................................. 10
Figure 2.5. Structure used by Sternbach as a basis for studying the
pharmacological effects of different substituents and their positions. ..... 10
Figure 2.6. Structure of phenazepam (16). ............................................ 11
Figure 2.7. The synthesis of Oxazepam (15). (Sternbach, 1979)........... 12
Figure 2.8. The metabolism of diazepam (1), showing the active
metabolites nordiazepam (14) and oxazepam (15). ................................ 12
Figure 2.9. Structure of four of the substances that were legally sold in
the UK until the Psychoactive Substances Act of 2016 and the Misuse of
Drugs Act 1971. ...................................................................................... 15
Figure 2.10. The number of diazepam (1) prescriptions dispensed in
Scotland since 2005/6. ............................................................................ 17
Figure 2.11. Comparison of benzodiazepine related deaths in the USA,
when taken with and without opioids. ...................................................... 20
Figure 2.12. Comparison of the number of drug related deaths in
Scotland, to those where benzodiazepines were identified. .................... 21
Figure 2.13. Comparison of the total number of benzodiazepine related
deaths in Scotland, to those where diazepam (1) was identified, since
2008. ............................................................................................... 23
xx
Figure 2.14. Sketch of a granule, showing a variety of components of
different sizes combined into a coherent unit. ......................................... 33
Figure 2.15. Diagram of a single- punch tablet press. ........................... 36
Figure 2.16. Diagram of rotary press mechanism. ................................. 37
Figure 3.1. The purpose built light-box. .................................................. 68
Figure 3.2. Diagram showing position that the callipers could have
measured the diameter of tablets. ........................................................... 71
Figure 3.3. Photographs taken by different cameras. ............................ 72
Figure 3.4. Tablet from Case 159, showing a double strike. .................. 74
Figure 3.5 Bar chart showing the diameters of illicit and pharmaceutical
batches of tablets. ................................................................................... 78
Figure 3.6 Scatter graphs comparing the Relative Standard Deviation (%)
in depth and weight within batches of illicit and pharmaceutical tablets. . 79
Figure 3.7 Box Plots showing the range of Relative Standard Deviation
(%) in depth and weight within batches of illicit and pharmaceutical
tablets. ............................................................................................... 80
Figure 3.8. Diagram illustrating variation in mean diameter of the cases
analysed ............................................................................................... 82
Figure 3.9. Diagram illustrating variation in mean depth of the cases
analysed. ............................................................................................... 84
Figure 3.10. Diagram illustrating variation in mean weight of the cases
marked MA | D/10 compared to the manufacturers designed range. ...... 87
Figure 3.11. Venn diagram comparing the physical characteristics of
cases against the criteria demonstrated by the known pharmaceutical
tablets. ............................................................................................... 89

xxi
Figure 4.1. The structure of diazepam (1) and ketazolam (10). ............. 97
Figure 4.2. The structure of chlordiazepoxide (3), demoxepam (5) and
nordiazepam (14). ................................................................................... 97
Figure 4.3. Chromatogram of the diazepam (1) standard compared to a
sample of mixed standards. .................................................................. 110
Figure 4.4. Comparison of GC-MS chromatogram of the certified
ketazolam (10) and diazepam (1) standards. ........................................ 113
Figure 4.5. Comparison of GC-MS spectra of the certified ketazolam (10)
and diazepam (1) standards. ................................................................ 114
Figure 4.6. The structure of ketazolam (10). ........................................ 115
Figure 4.7. Spectra of Case 134. ......................................................... 120
Figure 4.8. Structures of aspirin, paracetamol and metacetamol. ........ 121
Figure 4.9. Chromatograms .................................................................. 123
Figure 4.10. Comparison of GC-MS Rt and spectra of the etizolam (7)
and triazolam (18) standards. ............................................................... 124
Figure 4.11. Comparison of chromatograms produced by two illicit cases
containing etizolam (7) and spectra of the peaks at 11.82 and 12.98
minutes. ............................................................................................. 127
Figure 4.12. The mass spectrum of chlorphenamine shown in the NIST
14 library. ............................................................................................. 128
Figure 4.13. Chromatogram and mass spectrum produced by the
chlordiazepoxide (3) standard. .............................................................. 130
Figure 4.14. Spectra of two of the peaks produced by the
chlordiazepoxide (3) standard. .............................................................. 131

xxii
Figure 4.15. Chromatogram produced by Case 136 compared to the
chlordiazepoxide (3) standard. .............................................................. 132
Figure 4.16. Chromatograms and spectra of case 136. ........................ 133
Figure 4.17. Two spectra produced by the broad peak at around 17
minutes generated during the analysis of Case 136. ............................ 134
Figure 4.18. The identification of methyl stearate and diazepam (1) in
Case 136. ............................................................................................. 135
Figure 4.19. Comparison of the chromatographic peak at 14.61 minutes
in Case 136 to the diazepam (1) standard. ........................................... 136
Figure 4.20. The identification of stearic acid and palmitic acid in Case
160. ............................................................................................. 137
Figure 4.21. Groupings of Illicit Cases according to main Active Drug
Substance. ............................................................................................ 139
Figure 4.22. Venn Diagram of Illicit Cases according to Physical and GC-
MS Analysis .......................................................................................... 142
Figure 5.1. HPLC calibration curve. ..................................................... 153
Figure 5.2. Chromatogram showing the peaks produced by five of the
active drug substances. ........................................................................ 164
Figure 5.3. Case 136 and the following blank, along with the certified
chlordiazepoxide (3) standard and related blank. ................................. 166
Figure 5.4. Venn diagram showing the combined results of the physical
analysis, active drug substance identification through GC-MS and
diazepam (1) quantification determined by HPLC. ................................ 168
Figure 6.1. DSC thermogram of lactose identifying the thermal events. ....
............................................................................................. 175
xxiii
Figure 6.2. DSC trace produced by Diazepam (1) ............................... 176
Figure 6.3. Calibration of DSC with Indium. ......................................... 179
Figure 6.4. Comparison of thermograms produced by eight different
pharmaceutical tablets supplied by MA Pharmachem. ......................... 181
Figure 6.5. Thermograms of three tablet excipients (Povidone, Mg
Stearate and EmcompressTM) at a heating rate of 10 C / min. ............ 182
Figure 6.6. Thermograms of different lactose grades showing similarity
in endothermic peaks. ........................................................................... 183
Figure 6.7. Thermograms produced by a selection of benzodiazepines
using a single heating cycle at 10 C / min from 20 to 200 – 250 C. .... 184
Figure 6.8. Thermograms showing the differences between DSC profiles
produced by the Actavis tablet compared to the MA tablet. .................. 185
Figure 6.9. Thermogram showing the difference in peak size produced
by melting tablets with different amounts of diazepam (1). ................... 186
Figure 6.10. Closer detail of thermogram produced by Group 7 cases. .....
............................................................................................. 193
Figure 6.11. Thermogram from Case 136 overlaid with Baby milk....... 195
Figure 6.12. Thermogram produced by heating baby milk in a
hermetically sealed pan. ....................................................................... 197
Figure 6.13. DSC thermograms produced by tablets from the same case
generated 9 months apart showing the disappearance of the inflected
transition relating to crystallisation, centred around 175 C. ................. 198
Figure 6.14. DSC profiles produced by tablets taken from the same batch
of pharmaceutical tablets generated 16 months apart. ......................... 198

xxiv
Figure 6.15. Thermogram produced by the same tub of baby milk as
analysed in Figure 6.8 but analysed 10 months later. ........................... 199
Figure 6.16. Venn diagram produced by combining the results of DSC
analysis with the previous data obtained from physical analysis and the
chemical techniques of GC-MS and HPLC. .......................................... 200
Figure 7.1. Bar chart showing the number of cases marked MA and D/10
and the amount of tablets within the cases. .......................................... 208
Figure 7.2. Photographs of tablets from different cases taken with the
Olympus DSX100 opto-digital microscope. ........................................... 209
Figure 7.3. Bar chart showing the number of available tablets within each
case marked MA and D10 .................................................................... 210
Figure 7.4. DSC Thermogram of a 10 mg pharmaceutical tablet produced
by MA Pharmachem. ............................................................................ 212
Figure 7.5. The effect of outliers on k-means clustering. ..................... 214
Figure 7.6. Dendrogram of MA marked tablets using non-standardised
data. ............................................................................................. 218
Figure 7.7. Dendrogram of MA marked tablets using standardised data. ..
............................................................................................. 219
Figure 7.8. Dendrogram of all MA marked tablets using all available
tablet weights and standardised data. ................................................... 223
Figure 7.9. Dendrogram of the MA marked cases generated using data
produced by DSC. ................................................................................. 225
Figure 7.10. K-means clustering of DSC data using MA marked cases. ...
............................................................................................. 231
Figure 7.11. K-means clustering of DSC data using MA marked cases. ....
............................................................................................. 232

xxv
Figure 7.12. Heat map showing a pairwise comparison of all cases. .... 238
Figure 8.1. Bar chart showing the cases marked MA and D/10
highlighted in red, and the amount of tablets within the cases. ............. 247
Figure 8.2. Flow chart showing the separation of cases that had been
illicitly manufactured. ............................................................................. 250
Figure 8.3. DSC Thermogram indicating the temperature regions
dominating each of the first five principal components. ......................... 252
Figure 8.4 Miner 3D image showing PCA results of the DSC data. ...... 254
Figure 8.5. Miner 3D image showing separation between the
pharmaceutical (red) and unknown (green) cases based on the first three
principal components of the DSC data. ................................................. 256
Figure 8.6. The stratagem for discriminating between tablets which had
been illicitly and pharmaceutically manufactured. ................................. 257
Figure 8.7. Box plot of the D values. .................................................... 260
Figure 8.8. Histograms showing the separation of the unknown cases
from the cases that were known to be pharmaceutically manufactured
and their normal distribution curves. ..................................................... 262
Figure 8.9. The ROC curve produced by the analysis of the principal
components of the DSC data. ............................................................... 265

xxvi
Table 2.1. The penalties for certain drug offences according to the
Misuse of Drugs Act, 1971. ..................................................................... 43
Table 3.1. Table identifying the number of cases and the case numbers
which bear each logo. ............................................................................. 73
Table 3.2. The mean measurements and weights of each case of tablets.
............................................................................................... 76
Table 4.1 Comparison of mass ion abundance between the NIST 14
library, a certified diazepam (1) standard and a known pharmaceutical
tablet produced by MA Pharmachem. ................................................... 111
Table 4.2 Table showing the Rt and m/z of the eight most abundant ions
for the certified drugs standards analysed. ........................................... 117
Table 4.3. Table identifying the active ingredients detected in the illicit
cases by GC-MS. .................................................................................. 119
Table 5.1. Results of the coefficient of variation, based on six runs of a
0.02 mg / mL standard. ......................................................................... 153
Table 5.2. Results of the HPLC analysis. ............................................. 161
Table 5.3. Results of HPLC analysis of different active drug standards. ....
............................................................................................. 163
Table 5.4. Results of HPLC analysis showing the level of diazepam (1)
present in the illicit cases. ..................................................................... 169
Table 5.5. The weight and diazepam (1) content found in each quarter of
a single tablet taken from Case 27. ....................................................... 170
Table 6.1. Grouping of the thermograms produced by the various cases.
............................................................................................. 187
xxvii
Table 7.1. The results of the subjective groupings of the tablets marked
‘MA’ and ‘D/10’. ..................................................................................... 216
Table 7.2. Cluster membership for each case using five different samples
containing four tablets. .......................................................................... 221
Table 7.3. AHC cluster membership for cases marked MA and D/10
using all tablets where a weight had been recorded. ............................ 222
Table 7.4. Cluster membership for each case using five different samples
of four tablets, indicated by AHC and k-means cluster analysis............ 228
Table 7.5. Cluster membership for cases marked MA and D/10 analysed
by k-means and using all tablets where a weight had been recorded. .. 229
Table 7.6. Mean weight and size measurements of tablets within Case 5
in comparison to pharmaceutical batches. ............................................ 230
Table 7.7. The results of K-Means Clustering and AHC of DSC data
based on 9 clusters suggested by the AHC dendrogram at a distance of
5. ............................................................................................. 233
Table 8.1. The variance in the first five principal components. ............ 253
Table 8.2. Results of allocation rules. .................................................. 263
Table 8.3. Classification and Cross-Validation Results using both
models 1 and 2. .................................................................................... 266
Table 8.4. Results of the four test cases using discriminant analysis with
centroids and the SPSS default discriminant value of 0. ....................... 267
Table 8.5. Results of Discriminant Analysis using 95% confidence
interval boundaries using the data from the four test cases and the
training samples. ................................................................................... 268
Table 8.6. Results of the ROC curve using data from the four test cases
and the training samples. ...................................................................... 269
xxviii
Table 8.7. Correlation between variables. ............................................ 270
Table 8.8. Results of Shapiro Wilk Test of normality on values of D for
each tablet group .................................................................................. 271
Table 8.9. Results of Box’s M Test and the log determinants .............. 272
Table 8.10. Wilks’ Lambda test for significance of independent variables.
............................................................................................. 274
Table 8.11. Wilks’ Lambda test of discriminant function significance and
Eigenvalue results. ................................................................................ 275
Table 8.12. Standardized discriminant function coefficients showing the
relative importance of each principal component to the discriminant
function. ............................................................................................. 276

xxix
AC2O Acetic Anhydride
AMU Atomic Mass Unit
AHC Agglomerative Hierarchical Clustering
oC Degrees Celsius
CDA Canonical Discriminant Analysis
CI Chemical Ionisation
CNS Central Nervous System
CT Computerized Tomography
CZE Capillary Zone Electrophoresis
D Discriminant Value
DART-MS Direct Analysis in Real Time - Mass Spectrometry
Dpi Dots per inch
DSC Differential Scanning Calorimeter
DFA Discriminant Function Analysis
DFC Discriminant Function Coefficient
DSLR Digital Single Lens Reflex
EDX Energy Dispersive X-Ray
EI Electron Ionisation
ELISA Enzyme-Linked Immunosorbent Assay
EtOAc Ethyl Acetate
GABA Gamma-Amino Butyric Acid
GC-MS Gas Chromatography Mass Spectrometry
HPLC High Performance Liquid Chromatography
ISO International Standards Organisation
ITMS Ion Trap Mass Spectrometer
LC Liquid Chromatography
LDA Linear Discriminant Analysis
LOD Limit of Detection
LOOCV Leave-One-Out Cross Validation
LOQ Limit of Quantification

xxx
M Molarity
MA Methamphetamine
mAUs Milli-Absorbance Units
MDA 3,4-Methylenedioxyamphetamine
MDMA 3,4-Methylenedioxymethamphetamine
MHRA Medicines and Healthcare products Regulatory Agency
ms Mass Spectrum
MS Mass Spectroscopy
MS/MS Tandem Mass Spectroscopy
m/z Mass to Charge Ratio
NIR Near Infrared
NIST National Institute of Standards and Technology
PCA Principal Component Analysis
QMS Quadrupole Mass Spectrometer
ROC Receiver Operating Characteristic
RSD Relative Standard Deviation
Rt Retention Time
SD Standard Deviation
SEM Scanning Electron Microscope
TDGC Thermal Desorption Gas Chromatography
TIC Total Ion Chromatogram
TLC Thin Layer Chromatography
UK United Kingdom
UNODC United Nations Office on Drugs and Crime
USA United States of America
UV Ultraviolet
VSC Video Spectral Comparator
WHO World Health Organisation
Δ (Delta) Heat

xxxi
Structure
Numer
Benzodiazepine
Common and IUPAC
Name
Structure
1 Diazepam
7-chloro-1-methyl-5-
phenyl-3H-1,4-
benzodiazepin-2-one
2 Alprazolam
8-Chloro-1-methyl-6-
phenyl-4H-s-triazolo(4,3-
a)(1,4)benzodiazepine
3 Chlordiazepoxide
7-chloro-4-hydroxy-N-
methyl-5-phenyl-3H-1,4-
benzodiazepin-2-imine
xxxii
Structure
Numer
Benzodiazepine
Common and IUPAC
Name
Structure
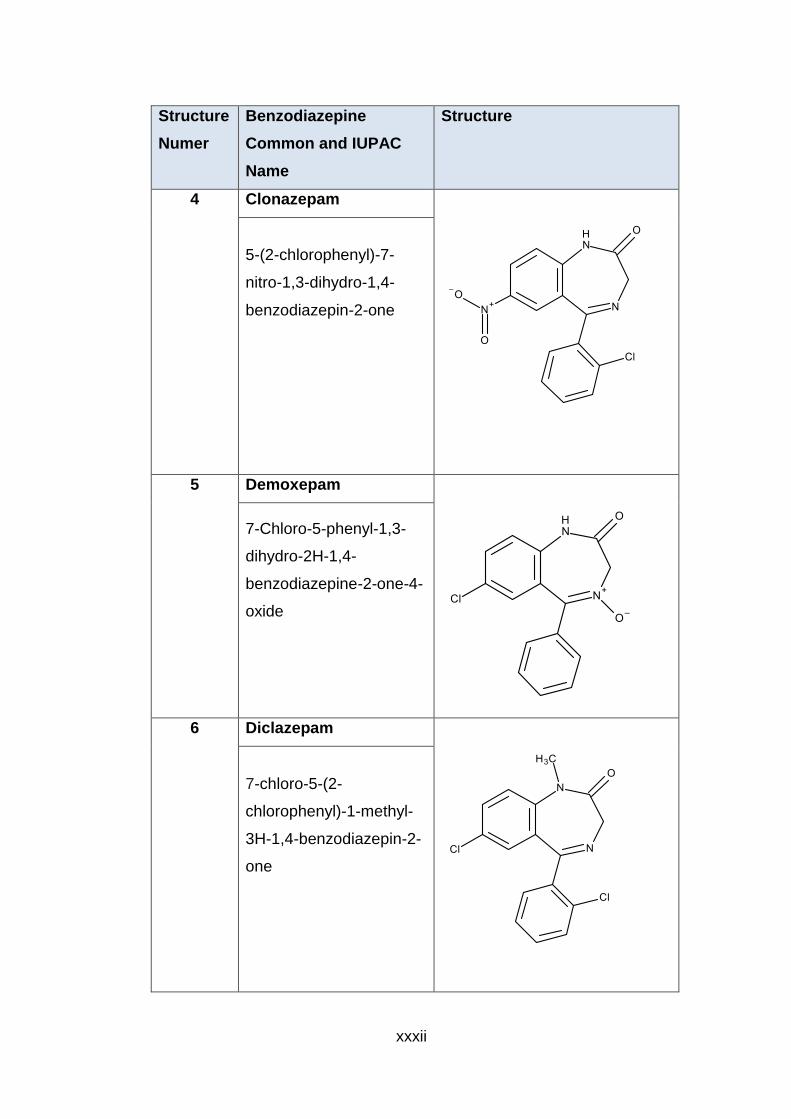
4 Clonazepam
5-(2-chlorophenyl)-7-
nitro-1,3-dihydro-1,4-
benzodiazepin-2-one
5 Demoxepam
7-Chloro-5-phenyl-1,3-
dihydro-2H-1,4-
benzodiazepine-2-one-4-
oxide
6 Diclazepam
7-chloro-5-(2-
chlorophenyl)-1-methyl-
3H-1,4-benzodiazepin-2-
one

xxxiii
Structure
Numer
Benzodiazepine
Common and IUPAC
Name
Structure
7 Etizolam
4-(2-Chlorophenyl)-2-
ethyl-9-methyl-6H-
thieno[3,2-
f][1,2,4]triazolo[4,3-
a][1,4]diazepine
8 Flubromazepam
7-Bromo-5-(2-
fluorophenyl)-1,3-
dihydro-2H-1,4-
benzodiazepin-2-one
9 Flurazepam
7-chloro-1-[2-
(diethylamino)ethyl]-5-(2-
fluorophenyl)-3H-1,4-
benzodiazepin-2-one

xxxiv
Structure
Numer
Benzodiazepine
Common and IUPAC
Name
Structure
10
Ketazolam
11-Chloro-2,8-dimethyl-
12b-phenyl-8,12b-
dihydro-4H-
[1,3]oxazino[3,2-
d][1,4]benzodiazepine-
4,7(6H)-dione
11
Lorazepam
7-chloro-5-(2-
chlorophenyl)-3-hydroxy-
1,3-dihydro-1,4-
benzodiazepin-2-one
12
Lormetazepam
7-chloro-5-(2-
chlorophenyl)-3-hydroxy-
1-methyl-3H-1,4-
benzodiazepin-2-one

xxxv
Structure
Numer
Benzodiazepine
Common and IUPAC
Name
Structure
13
Nitrazepam
7-nitro-5-phenyl-1,3-
dihydro-1,4-
benzodiazepin-2-one
14
Nordiazepam
7-chloro-5-phenyl-1,3-
dihydro-1,4-
benzodiazepin-2-one
15
Oxazepam
7-chloro-3-hydroxy-5-
phenyl-1,3-dihydro-1,4-
benzodiazepin-2-one

xxxvi
Structure
Numer
Benzodiazepine
Common and IUPAC
Name
Structure
16
Phenazepam
7-bromo-5-(2-
chlorophenyl)-1,3-
dihydro-1,4-
benzodiazepin-2-one
17
Pyrazolam
8-bromo-1-methyl-6-
pyridin-2-yl-4H-
[1,2,4]triazolo[4,3-
a][1,4]benzodiazepine
18
Triazolam
8-Chloro-6-(2-
chlorophenyl)-1-methyl-
4H-[1,2,4]triazolo[4,3-
a][1,4]benzodiazepine

xxxvii
Structure
Numer
Benzodiazepine
Common and IUPAC
Name
Structure
19
Temazepam
7-chloro-3-hydroxy-1-
methyl-5-phenyl-3H-1,4-
benzodiazepin-2-one
1
1.1 Aims of the Research
Benzodiazepines have been implicated in an increasing number of drug related
deaths in Scotland in recent years. The threat posed is elevated by the existence of
illicitly manufactured tablets, which are in circulation within the illegal supply chain
(Police Scotland, 2016; McGivern, 2016), with 10 mg tablets believed to be the most
abused of the diazepam (1) tablets (Doward, 2012; McGivern, 2018).
The aim of this project was to characterise sixty-five different cases of illicit blue
tablets, believed to have been sold as 10 mg diazepam (1) tablets, which had been
seized in the Tayside area by Police Scotland. By measuring a range of physical
and chemical characteristics, it was intended to generate data which could be tested
using statistical clustering methods to determine whether these characteristics could
be used to link separate cases. Principal component analysis and linear discriminant
analysis of the dataset would then be used with the purpose of distinguishing known
pharmaceutical tablets from pharmaceutically plausible tablets.
1.2 Objectives of the Research
The objectives of this thesis were to analyse the physical and chemical properties of
seized cases of blue tablets, in order to characterise them. This included recording
the weight, diameter and depth of the 1989 tablets contained within the sixty-five
seized cases being assessed and the five batches of pharmaceutical tablets used for
comparative purposes. Chemical analysis was performed using gas
chromatography-mass spectrometry (GC-MS) to identify the main active drug
substances and high performance liquid chromatography (HPLC) for quantification of
diazepam (1) content. Information about the excipients was determined by
differential scanning calorimetry (DSC).
All data on the physical and chemical properties of the tablets was stored in an MS
Access database which could be searched and subsets extracted.

2
The first objective of the statistical analysis was to determine whether illicit cases
could be linked by identifying clusters within the data derived from illicit tablets.
Clustering was carried out using visual methods, agglomerative hierarchical
clustering and k-means clustering.
The second objective of the statistical analysis was to use the physical and chemical
data to develop a series of methods that could distinguish illicitly made tablets from
possible pharmaceutical tablets that had been diverted into the illegal supply chain.
Principal component analysis and linear discriminant analysis was used for further
analysis of cases that most resembled the pharmaceutically manufactured tablets.
1.3 Chapter Overview
The work undertaken for this project will be described in detail in the following
Chapters:-
Chapter 2 – Introduction
This chapter provides a background to this project and describes the diazepam (1)
drug substance in context of the discovery and use of benzodiazepines. The
increase in diazepam (1) use and abuse is explained with data showing the numbers
of deaths related to its misuse and the UK legislation concerning benzodiazepines is
also described.
Factors influencing the effectiveness of the drugs, including tablet manufacturing
processes are explored. This chapter also exposes how illicit tablets can pose
hidden dangers with their highly variable composition and how differences can be
identified between tablets produced by different manufacturers.
Chapter 3 – Physical Characteristics
The techniques used to measure the physical weights and measurements of seized
illicit tablets and those of pharmaceutical origin are described. The weight, diameter
and depth of all tablets were recorded on a Microsoft access database, enabling
comparisons to be performed. Data was analysed and visualised in graphical form
and by using box plots.

3
The colour of the tablets was recorded by photography using a purpose built
lightbox.
Chapter 4 – Gas Chromatography - Mass Spectrometry
Tablets from each of the cases were analysed by GC-MS in order to confirm the
active drug substance present. Although the street samples were believed to be
sold as 10 mg diazepam (1) tablets and were blue in colour, the origin of the tablets
was unknown and therefore the actual content was also uncertain. However, tablets
containing diazepam (1) were not necessarily of pharmaceutical origin.
Chapter 5 – High Performance Liquid Chromatography
HPLC was used to quantify the diazepam (1) content of three tablets taken from
each case. All of the illicit cases analysed were blue in colour, which is consistent
with the colour of 10 mg diazepam (1) tablets manufactured for the UK market.
However, the presence of the correct amount of active drug substance does not
guarantee the tablets have been pharmaceutically manufactured.
Chapter 6 – Differential Scanning Calorimetry
The thermal technique of differential scanning calorimetry was tested as a way to
explore differences in the excipient content of the tablets. A large proportion of a
pharmaceutical diazepam (1) tablet is comprised of excipients, with an anticipated
amount of about 10 mg of active drug substance being present. Therefore,
information gained on the excipient content was explored as a way to differentiate
between different tablets.
Chapter 7 – Statistical Cluster Analysis
The information gained from the physical and chemical tests was used to provide
data for statistical and chemometric analysis. Agglomerative hierarchical clustering
and k-means clustering were used to explore patterns in the data and identify
potential groupings. The results of all of the experiments were then added to a heat
map under the premise that the more individual cases cluster with other individual
4
cases, as an indication of the probability of there being a potential link between
them.
Chapter 8 – Linear Discriminant Analysis
In order to further examine the seized cases which contained approximately 10 mg
of diazepam (1), a smaller test sample was chosen. As the tablets could not be
differentiated from the pharmaceutical tablets based on physical characteristics or
type and quantity of active drug substance, the data generated by DSC was
analysed using chemometric methods. DSC was chosen because the thermograms
generated were largely influenced by the excipient content of the tablets. The data
points were explored by principal component analysis and linear discriminant
analysis to determine if any differences could be found between the
pharmaceutically manufactured tablets and the street diazepam (1) cases.
Chapter 9 – Conclusion and recommendations for Future Work
The conclusion describes the context in which this study was based and briefly
summarises the work performed and results obtained.
Innovative methods of analysis such as the forensic use of the DSC performed
during this project, are described along with its potential benefits. Ideas for future
work are also discussed, in order to build upon the analysis performed during this
project. The research carried out in this study has provided an important step on
which to base future work and suggestions are described with a view to obtaining
further information that would help in the characterisation of illicit tablets.
Appendices
The appendices contain “hand-worked” examples of the statistical techniques of
principal component analysis, agglomerative hierarchical clustering and k-means
clustering and the script used for principal component analysis using the ‘R’
programming system.
5
2.1 Chapter Summary
This chapter provides a background to the project and describes the diazepam (1)
drug substance in context of the discovery and use of benzodiazepines. The
increase in diazepam (1) use and abuse is explained with data showing the numbers
of deaths related to its misuse and the UK legislation concerning benzodiazepines is
also described.
Factors influencing the effectiveness of the drugs, including tablet manufacturing
processes are explored and exposes how illicit tablets can pose hidden dangers with
their highly variable composition and how differences can be identified between
tablets produced by different manufacturers.
2.2 Diazepam
2.2.1 Description and Structure
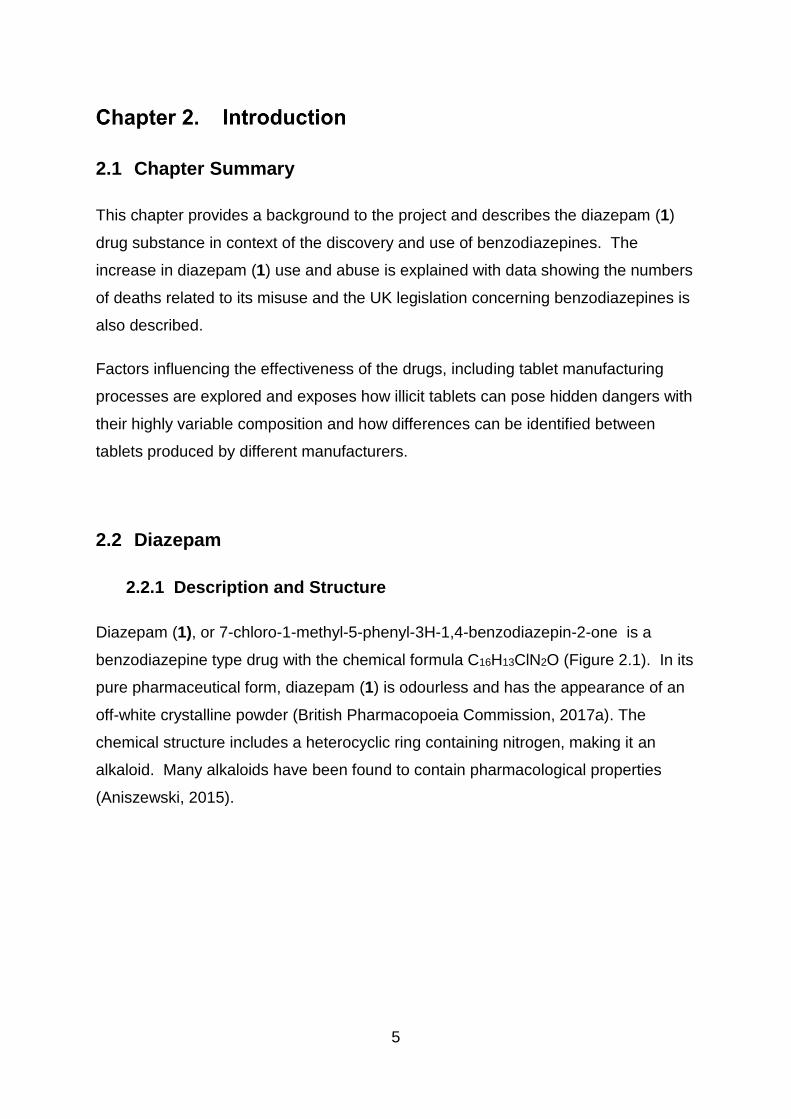
Diazepam (1), or 7-chloro-1-methyl-5-phenyl-3H-1,4-benzodiazepin-2-one is a
benzodiazepine type drug with the chemical formula C16H13ClN2O (Figure 2.1). In its
pure pharmaceutical form, diazepam (1) is odourless and has the appearance of an
off-white crystalline powder (British Pharmacopoeia Commission, 2017a). The
chemical structure includes a heterocyclic ring containing nitrogen, making it an
alkaloid. Many alkaloids have been found to contain pharmacological properties
(Aniszewski, 2015).

6
Figure 2.1. The structure of diazepam (1), with carbon numbering.
Medically, diazepam (1) is used to treat anxiety, sleep disorders, muscle spasms and
alcohol withdrawal. However, over time there may be an increased tolerance to
many of the sedative effects and both physical and psychological dependence can
develop. Sudden withdrawal from diazepam (1) can cause adverse reactions
including nausea, restlessness, anxiety, nervousness, tremors, dysphoria, insomnia,
stiffening muscles, abdominal pain and headaches. In more extreme cases
hallucination, hyperthermia, panic attacks, disorientation and delirium can set in,
leading to tachycardia, hypertension and seizures (Ashton, 2013). These risks are
aggravated by the use of other drugs including opiates, barbiturates, alcohol and
other central nervous system depressants. Benzodiazepines are sedatives and
taken with other sedatives, such as barbiturates, have an accumulative effect.
Therefore dangerous doses of other substances could lead to fatality when
consumed in conjunction with benzodiazepines (Medicines and Healthcare
Products Regulatory Agency, 2015b; Ashton, 2013).
2.2.2 Discovery of Diazepam
Sedatives have long been used for medical purposes to aid physiological and mental
depression, producing a more sedate state. Anxiolytic drugs are designed to reduce
anxiety without affecting physical functions but many have sedative properties,
leading to a degree of overlap between treatments (Rang, 2016). Previous
sedatives have included alcohol, chloral hydrate and bromides but all of these have
been shown to have serious side effects. Bromides for example, are toxic, with a
half-life of approximately twelve days and accumulation in tissues, leads to delirium,
7
hallucinations, gastrointestinal problems and irritability (López-Muñoz, Álamo and
García-García, 2011).
The synthesis of barbituric acid in 1864 gave rise to the introduction of the first
barbiturates in 1904. Almost immediately problems with tolerance, dependence,
ease of overdose and hazards of withdrawal were recorded. However, over 2500
barbiturates were synthesised by the early 1950s with around 50 introduced into
clinical use (López-Muñoz, Ucha-Udabe and Alamo, 2005; Dundee and Mcilroy,
1982; Maxwell, 2012).
An alternative to the barbiturates, meprobamate was introduced as an anxiolytic in
the 1950s but had limited effects, while dangers posed by tolerance, dependence,
potential for abuse and overdose meant it was withdrawn in North America during
the 1960s (López-Muñoz, Ucha-Udabe and Alamo, 2005). Interestingly, the last
licence for meprobamate production in the United Kingdom was only withdrawn after
a review across the European Union in 2016 (Medicines and Healthcare Products
Regulatory Agency, 2016a).
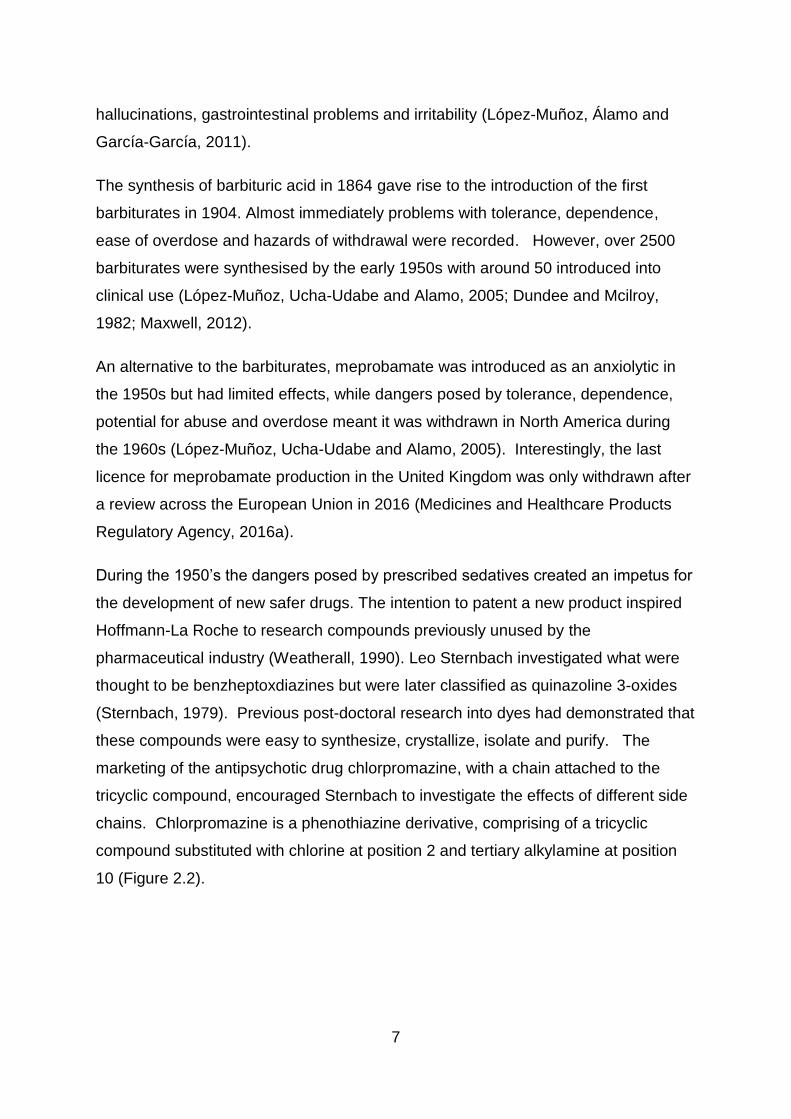
During the 1950’s the dangers posed by prescribed sedatives created an impetus for
the development of new safer drugs. The intention to patent a new product inspired
Hoffmann-La Roche to research compounds previously unused by the
pharmaceutical industry (Weatherall, 1990). Leo Sternbach investigated what were
thought to be benzheptoxdiazines but were later classified as quinazoline 3-oxides
(Sternbach, 1979). Previous post-doctoral research into dyes had demonstrated that
these compounds were easy to synthesize, crystallize, isolate and purify. The
marketing of the antipsychotic drug chlorpromazine, with a chain attached to the
tricyclic compound, encouraged Sternbach to investigate the effects of different side
chains. Chlorpromazine is a phenothiazine derivative, comprising of a tricyclic
compound substituted with chlorine at position 2 and tertiary alkylamine at position
10 (Figure 2.2).

8
Figure 2.2. Structure of chlorpromazine.
Phenothiazines are biologically active and Sternbach decided to investigate whether
altering the side chains could affect their biological influence (López-Muñoz, Álamo
and García-García, 2011). Amino ketones with different benzene ring substituents
were acylated and further treatment with secondary amines was performed to
produce a variety of side chains. Hydrogenation and removal of the oxygen from the
N-oxide were both attempted, however, laboratory research indicated that the
compounds produced no pharmacological effect (Sternbach, 1979). Further work at
Hoffmann-La Roche meant that the investigation into the compounds had to be
postponed but eighteen months later, during a laboratory clean-up operation, a
crystalline substance resulting from the earlier work was discovered and sent for
biological assessment (Maxwell, 2012). The results indicated that the substance
relaxed muscles and calmed mice by preventing convulsions caused by electrical
stimuli; and monkeys were found to be less aggressive without apparent tiredness,
after being treated with the drug. Toxicologically it was discovered that large
quantities could be consumed without fatal consequences. The benefit being that in
cases of overdose, the patient may become unconscious but would not manifest
symptoms of asphyxiation or respiratory failure, which could occur with barbiturates,
and it did not affect the heart (Weatherall, 1990; Maxwell, 2012). Another benefit
was the greater difference in human dosage levels required between anxiolytic and
sedative effects, when compared to barbiturate or meprobamate concentrations
(Maxwell, 2012). The substance was marketed as Librium in 1960 and was given
the generic name chlordiazepoxide (3) (Figure 2.3).

9
Figure 2.3. Structure of chlordiazepoxide (3).
Sternbach performed further research into chlordiazepoxide (3) in order to determine
why this had been the only one of the synthesized substances to demonstrate
physiological properties. The results indicated that a primary amine had been used
instead of a secondary amine, during the final treatment, causing a ring enlargement
reaction to occur (López-Muñoz, Álamo and García-García, 2011).
Chlordiazepoxide hydrochloride was found to be bitter, hygroscopic and unstable but
examination of the main metabolite, demoxepam (5) revealed that simplification of
the compound by removal of the N-oxide functionality resulted in a more potent
product. This became the new parent compound and exploration began into the
addition of chains in positions 1 and 3, as shown in Figure 2.4. The 1-methyl
derivative proved to be more effective than chlordiazepoxide (3) and it was marketed
as Valium (1) in 1963 (Sternbach, 1979; López-Muñoz, Álamo and García-García,
2011). When the patent expired in 1985, production was opened to generic forms of
the drug which were termed diazepam (1) (Calcaterra and Barrow, 2014).

10
Figure 2.4. The chemical structure of the parent compound used in Sternbach’s research.
Positions 1 and 3, which are indicated in red, identify the locations where different groups
were substituted. (Sternbach, 1979)
2.2.3 Benzodiazepine Family
Benzodiazepines are characterised by a benzene ring, which is fused to a seven-
membered diazepine ring containing nitrogen at positions 1 and 4 (Sultan and El-
Mubarak, 1996). Research by Sternbach revealed that the pharmacological effects
increased when electron withdrawing groups, such as chlorine or nitro were attached
to position 7 of Ring A, (Figure 2.5). Electron donating groups, such as a methyl,
caused a reduction in pharmacological properties. Sternbach also discovered that
groups located in any other position on Ring A, diminished pharmacological activity.
Figure 2.5. Structure used by Sternbach as a basis for studying the pharmacological effects of
different substituents and their positions. (Sternbach, 1979)

11
The addition of a methyl group on position 1 of Ring B also produces an increase in
pharmacological activity but larger groups can diminish the effect. The addition of a
phenyl in position 5 also demonstrated greater biological effects. Pharmacological
properties increase with a halogen in position 2 of Ring C, as demonstrated in
phenazepam (16) (Figure 2.6) with a potency around five times that of diazepam (1)
(World Health Organisation, 2015c). However, the pharmacological properties
decrease when a group is added to position 4. During his studies on diazepam (1)
compounds Sternbach synthesised over 3000 related compounds (Sternbach,
1979).
Figure 2.6. Structure of phenazepam (16).
After the launch of chlordiazepoxide (3) in 1960 and diazepam (1) in 1963 by
Hoffmann-La Roche, the first benzodiazepine marketed by a different company was
oxazepam (15), sold under the brand name Serax, by Wyeth laboratories in 1965.
Research had indicated that the N-oxides could easily be synthesized and after
acetic acid or acetic anhydride or treatment, a 3-acetoxy derivative is formed. The 3-
hydroxy derivative (oxazepam 15) is then obtained through hydrolysis (Figure 2.7)
(Sternbach, 1979).

12
Figure 2.7. The synthesis of Oxazepam (15). (Sternbach, 1979)
Oxazepam (15) is an active metabolite of diazepam (1) and undergoes
glucuronidation to aid excretion from the body. A potential disadvantage of being
prescribed diazepam (1), is that the demethylation process results in the production
of nordiazepam (14) (Figure 2.8), which has a much longer half-life of between 36-
200 hours. This poses particular problems for the elderly as the oxidative reaction
slows during the ageing process, thus increasing the time before converting to
oxazepam (15) and then exiting the body (Ashton, 2013; Rang, 2016).
Figure 2.8. The metabolism of diazepam (1), showing the active metabolites nordiazepam (14)
and oxazepam (15).
13
The degrees of pharmacological activity produced by the benzodiazepines vary with
the drug substance, therefore a number of them are used for different clinical
purposes. For example, diazepam (1), oxazepam (15) and chlordiazepoxide (3) are
marketed as anxiolytics; clonazepam (4) as an anti-convulsant; and nitrazepam (13)
as a hypnotic, to aid sleep. However, there may be some cross-over depending on
the symptoms and the patient, so clonazepam (4) may also be used as an anxiolytic,
for example and oxazepam (15) is prescribed for treating insomnia. The
benzodiazepines also vary in absorption rate, active metabolites and length of
duration (Ashton, 2013; Maxwell, 2012)
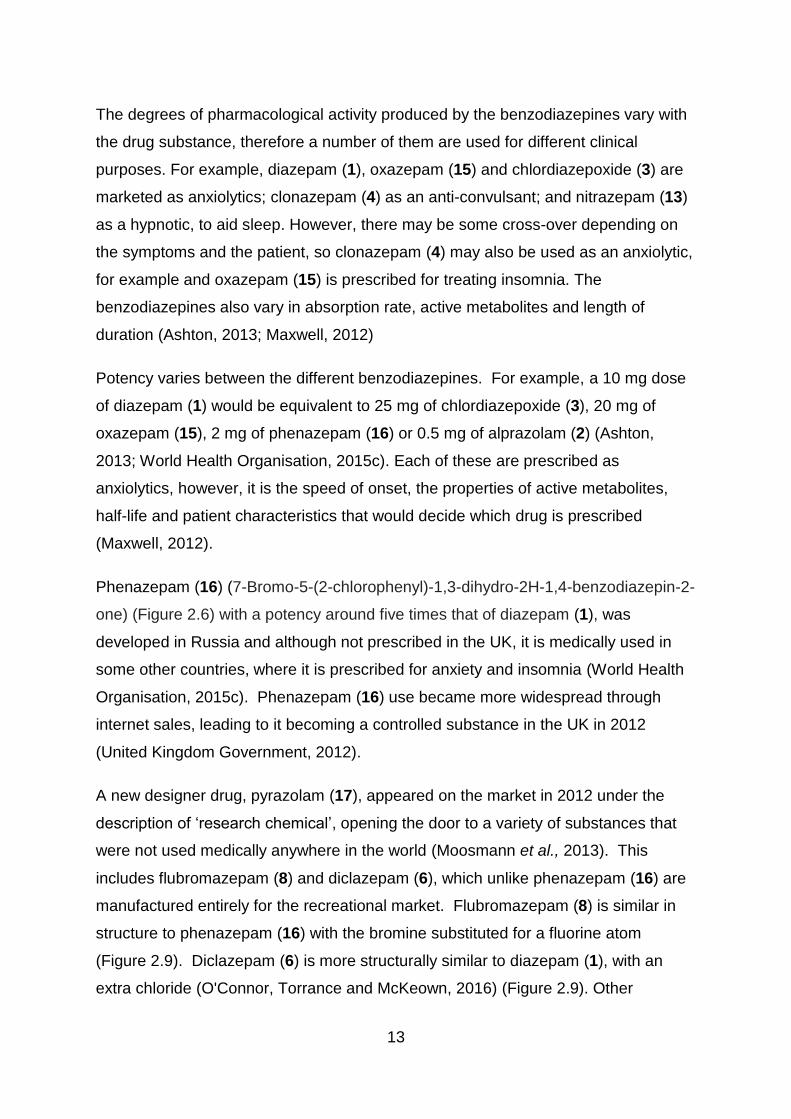
Potency varies between the different benzodiazepines. For example, a 10 mg dose
of diazepam (1) would be equivalent to 25 mg of chlordiazepoxide (3), 20 mg of
oxazepam (15), 2 mg of phenazepam (16) or 0.5 mg of alprazolam (2) (Ashton,
2013; World Health Organisation, 2015c). Each of these are prescribed as
anxiolytics, however, it is the speed of onset, the properties of active metabolites,
half-life and patient characteristics that would decide which drug is prescribed
(Maxwell, 2012).
Phenazepam (16) (7-Bromo-5-(2-chlorophenyl)-1,3-dihydro-2H-1,4-benzodiazepin-2-
one) (Figure 2.6) with a potency around five times that of diazepam (1), was
developed in Russia and although not prescribed in the UK, it is medically used in
some other countries, where it is prescribed for anxiety and insomnia (World Health
Organisation, 2015c). Phenazepam (16) use became more widespread through
internet sales, leading to it becoming a controlled substance in the UK in 2012
(United Kingdom Government, 2012).
A new designer drug, pyrazolam (17), appeared on the market in 2012 under the
description of ‘research chemical’, opening the door to a variety of substances that
were not used medically anywhere in the world (Moosmann et al., 2013). This
includes flubromazepam (8) and diclazepam (6), which unlike phenazepam (16) are
manufactured entirely for the recreational market. Flubromazepam (8) is similar in
structure to phenazepam (16) with the bromine substituted for a fluorine atom
(Figure 2.9). Diclazepam (6) is more structurally similar to diazepam (1), with an
extra chloride (O'Connor, Torrance and McKeown, 2016) (Figure 2.9). Other
14
substances which were legally sold at the time include meclonazepam, nifoxipam,
nitrazolam and the thienodiazepines such as deschloroetizolam and metizolam
(Manchester et al., 2018). The introduction of the Psychoactive Substances Act of
2016 brought an end to the legal sale of such substances by preventing the
production, supply, import and export of any psychoactive substance. Interestingly,
the potential for benzodiazepine abuse was realised soon after their introduction and
thirty-five different benzodiazepine type drugs were controlled under the UN
Convention on Psychotropic Substances 1971 (United Nations Office on Drugs and
Crime, 1971).
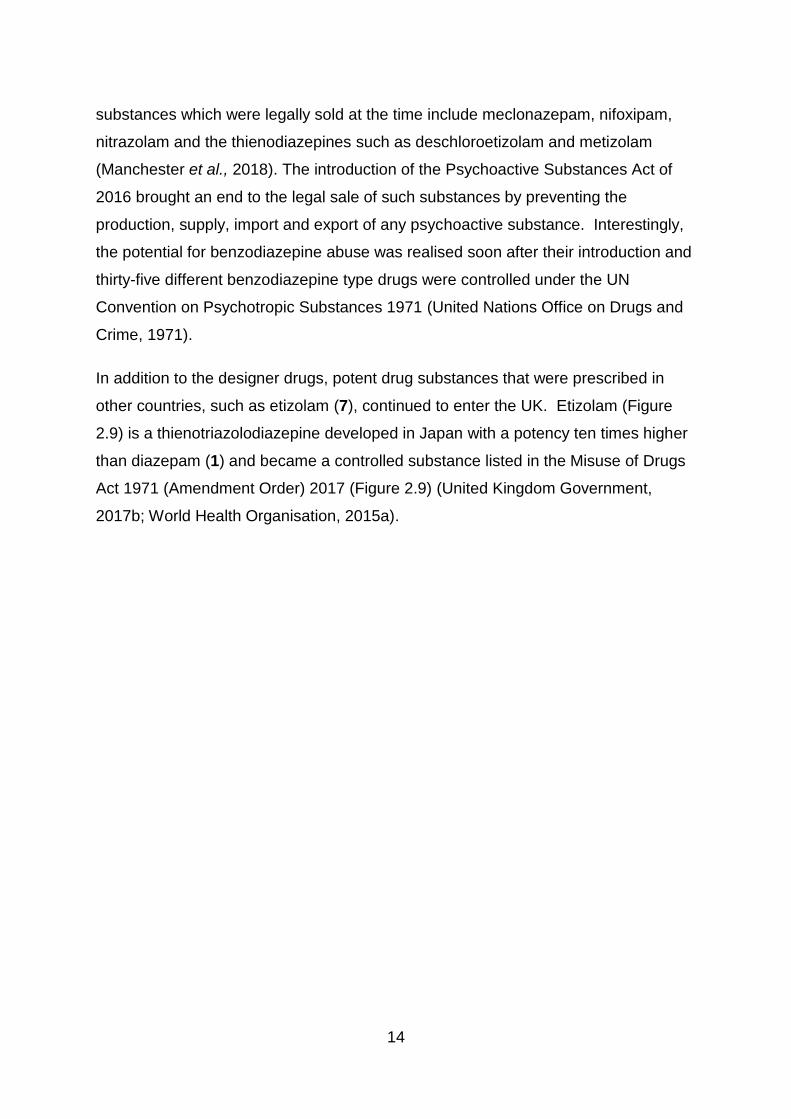
In addition to the designer drugs, potent drug substances that were prescribed in
other countries, such as etizolam (7), continued to enter the UK. Etizolam (Figure
2.9) is a thienotriazolodiazepine developed in Japan with a potency ten times higher
than diazepam (1) and became a controlled substance listed in the Misuse of Drugs
Act 1971 (Amendment Order) 2017 (Figure 2.9) (United Kingdom Government,
2017b; World Health Organisation, 2015a).

15
Etizolam Pyrazolam
Flubromazepam Diclazepam
Figure 2.9. Structure of four of the substances that were legally sold in the UK until the
Psychoactive Substances Act of 2016 and the Misuse of Drugs Act 1971. (Amendment Order)
2017 (Home Office, 2016; United Kingdom Government, 2017b)

16
2.2.4 The Rise in Popularity of Diazepam
Due to the relative safety of the benzodiazepines compared to previously available
anxiolytics, there was a 110% rise in benzodiazepine prescriptions between 1965-
1970 and they became the most prescribed tablets across the world within ten years
of their introduction (López-Muñoz, Álamo and García-García, 2011). By 1977,
diazepam (1) was estimated as being taken by one in ten adults in the USA and it
has been suggested that this was because of a rise in social stress leading to
diazepam (1) being prescribed for non-medical problems (Waldron, 1977).
The benefit of diazepam (1) over other benzodiazepines is the speed of absorption
and the duration of the drug substance, which limits potential fluctuations in blood
concentration. Active substances with higher potency, such as alprazolam (2), are
expelled more quickly, causing a drop in levels and leading to anxiety between
doses. Less potent prescriptions such as chlordiazepoxide (3), with a maximum daily
dose of 100 mg for anxiety, may not be the most suited for the symptoms presented
(Ashton, 1994), though the dose of chlordiazepoxide (3) can be repeated after 2
hours in the treatment of severe alcohol withdrawal (Dr Reddy's Laboratories (UK)
Ltd, 2015)
Data supplied by the National Health Service in Scotland (Figure 2.10) indicates that
the number of diazepam (1) prescriptions had been on a steady rise over the last
decade, reaching a peak of 893,146 in 2011/12 (Information Services Division,
National Health Services Scotland, 2016). Over the last few years there has been a
slight downward trend in the number of prescriptions, possibly due to concerns over
tolerance and dependence that develop with long term usage (Listos, Talarek and
Fidecka, 2010).

17
Figure 2.10. The number of diazepam (1) prescriptions dispensed in Scotland since 2005/6.
(Information Services Division, National Health Services Scotland, 2016)
2.2.5 Illicit Benzodiazepine Use
Benzodiazepines were originally marketed as a safer option to barbiturates, with
cases of benzodiazepine overdose leading to unconsciousness as opposed to the
fatalities caused by high concentrations of barbiturate (López-Muñoz, Álamo and
García-García, 2011; Cappell, 1986). However, there is a greater risk posed to
those with a history of substance abuse, the elderly and patients with respiratory or
renal disease or when ingested in conjunction with other active substances or
alcohol (Palmaro, Dupouy and Lapeyre-Mestre, 2015). For example, the arrhythmic
effects experienced by more vulnerable subjects when diazepam (1) is ingested at
pharmaceutical levels, are heightened when the amount is increased. It has been
reported that substance abusers often consume up to ten times the prescribed dose
(Johnson, Barnsdale and McAuley, 2016).
Studies have indicated that a control group of subjects who have never used
benzodiazepines, do not tend to favour benzodiazepines but they have more appeal
to patients who had previously been prescribed for medical reasons and/or those
with a history of drug or alcohol abuse (Cappell, 1986). Screening interviews of
patients undergoing drug abuse treatment in America indicated that benzodiazepines
800,000810,000820,000830,000840,000850,000860,000870,000880,000890,000900,000
Nu
mb
er o
f P
resc
rip
tio
ns
Year
Diazepam Prescriptions In Scotland

18
produce a mild feeling of euphoria and therefore they would preferentially choose
more potent substances such as cocaine or MDMA. However, it was noted that
benzodiazepines were taken to boost the effects of other active substances including
methadone. Trials revealed that diazepam (1) was the most popular benzodiazepine
and in high doses was sometimes believed to be a barbiturate (J. O. Cole and
Chiarello, 1990). In 2016, records in the United Kingdom indicate that three times
more people listed benzodiazepines as their secondary substance when referred to
treatment centres, than their primary drug of abuse. Over two thirds of these cases
identified heroin as the main active drug substance used (United Kingdom
Government Focal Point on Drugs, 2017). However, it has been suggested that
secondary drug substances are frequently under-reported (Johnson, Barnsdale and
McAuley, 2016). Therefore, the rise of diazepam (1) abuse is not isolated but is
reflected in the abuse of other depressant type substances.
Interestingly, in surveys, subjects taking part in trials and recognising the effects of
diazepam (1), ascribed a higher monetary street value to diazepam (1) than other
benzodiazepines, such as oxazepam (15) (Griffiths et al., 1984), which introduces a
motive for clandestine laboratories and illicit traders.
2.2.5.1 Polydrug Use
Benzodiazepines are commonly ingested at high levels, in conjunction with alcohol
to speed up and intensify the intoxification; with cocaine to alleviate agitation and
irritability; and opioids to enhance the euphoric effect (Stevens and King, 2013).
Polydrug use exacerbates respiratory depression through synergistic effects, which
is especially dangerous with opioids, antidepressants, and antipsychotics (Dear and
Bateman, 2016). In addition, competition for metabolic pathways leads to an
increase in drug concentration levels within the body and is exacerbated when the
active substances are ingested in larger quantities (Johnson, Barnsdale and
McAuley, 2016).
The combined use of benzodiazepines and opioids can trigger physical and
psychological problems. Drug interactions can cause selective serotonin reuptake
inhibitors to raise diazepam (1) levels in the blood and during metabolism,

19
interactions exacerbated by hepatic dysfunction can raise the concentration of opioid
serum in the body, thus increasing sedation and the likelihood of overdose (Stevens
and King,2013; Stein et al., 2017; Johnson, Barnsdale and McAuley, 2016). A patient
survey performed in a drug treatment centre in America, revealed that almost a third
of the subjects admitted to having overdosed during the previous year. However,
their continued use of benzodiazepines indicates a potential dependency (Stein et
al., 2017). In addition, some overlap exists in the withdrawal symptoms of
benzodiazepines and opioids, emphasising the potential connection in
neurochemical pathways. Benzodiazepines influence the impact of the GABA
system on the locus coeruleus, aggravating opiate withdrawal symptoms (de Wet et
al., 2004).
2.2.5.2 Drug Related Deaths
Dangers posed by drug addiction and possible overdose are dependent on the types
of drugs consumed. However, the problem is heightened by polydrug use and one
of the most common drugs used in conjunction with other drugs and/or alcohol is
diazepam (1), which is often taken to enhance euphoric effects, or for the alleviation
of agitation and anxiety (J. O. Cole and Chiarello, 1990). This polydrug use is
dangerous and has the potential of resulting in coma or death. In 2002, it was noted
that the majority of people who died in amphetamine, cocaine or MDMA related
incidents were also found to have consumed benzodiazepines and / or opiates,
usually in conjunction with alcohol. It was even recorded that the most common
combination was morphine, alcohol and benzodiazepines (EMCDDA.Europa.EU,
2002).
Problems related to polydrug use have been highlighted by the National Institute on
Drug Abuse in the USA. Data released in 2017 year reveals a dramatic difference in
the number of deaths related to benzodiazepines when taken with opioids, compared
to benzodiazepines alone. The figures show that between 2002 - 2015,
benzodiazepine deaths involving opioids increased twice as much as those that did
not involve opioids (Figure 2.11).
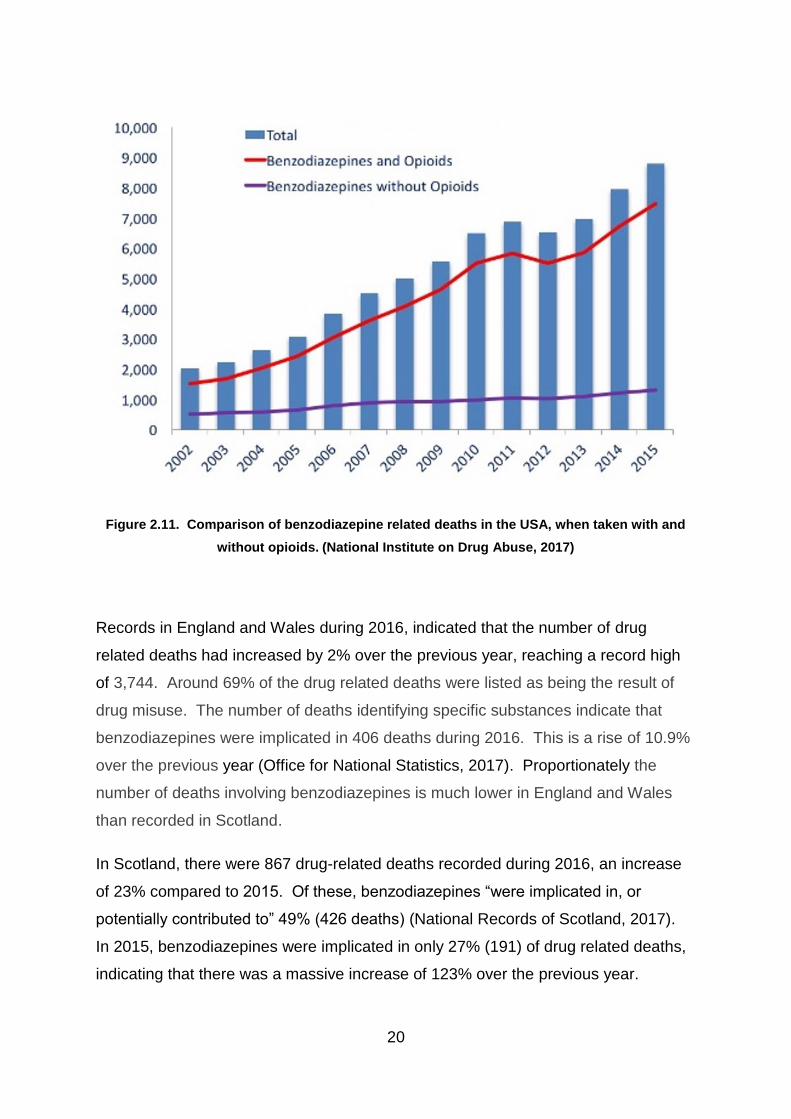
20
Figure 2.11. Comparison of benzodiazepine related deaths in the USA, when taken with and
without opioids. (National Institute on Drug Abuse, 2017)
Records in England and Wales during 2016, indicated that the number of drug
related deaths had increased by 2% over the previous year, reaching a record high
of 3,744. Around 69% of the drug related deaths were listed as being the result of
drug misuse. The number of deaths identifying specific substances indicate that
benzodiazepines were implicated in 406 deaths during 2016. This is a rise of 10.9%
over the previous year (Office for National Statistics, 2017). Proportionately the
number of deaths involving benzodiazepines is much lower in England and Wales
than recorded in Scotland.
In Scotland, there were 867 drug-related deaths recorded during 2016, an increase
of 23% compared to 2015. Of these, benzodiazepines “were implicated in, or
potentially contributed to” 49% (426 deaths) (National Records of Scotland, 2017).
In 2015, benzodiazepines were implicated in only 27% (191) of drug related deaths,
indicating that there was a massive increase of 123% over the previous year.
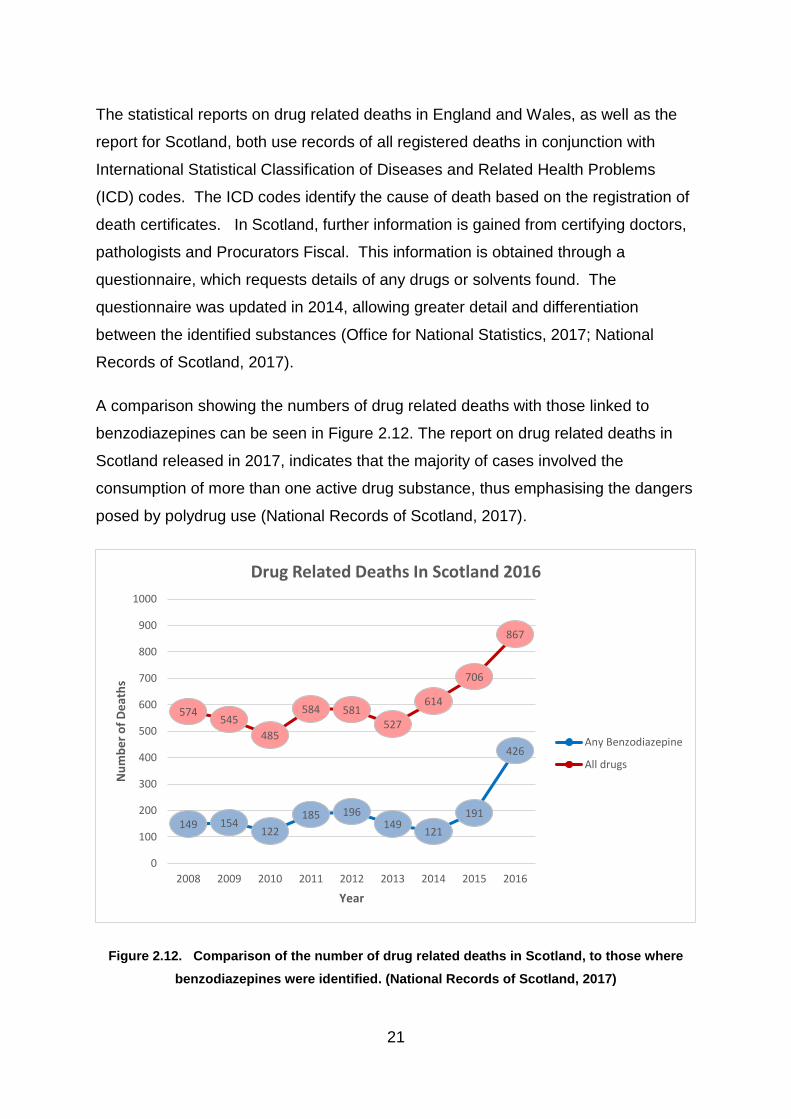
21
The statistical reports on drug related deaths in England and Wales, as well as the
report for Scotland, both use records of all registered deaths in conjunction with
International Statistical Classification of Diseases and Related Health Problems
(ICD) codes. The ICD codes identify the cause of death based on the registration of
death certificates. In Scotland, further information is gained from certifying doctors,
pathologists and Procurators Fiscal. This information is obtained through a
questionnaire, which requests details of any drugs or solvents found. The
questionnaire was updated in 2014, allowing greater detail and differentiation
between the identified substances (Office for National Statistics, 2017; National
Records of Scotland, 2017).
A comparison showing the numbers of drug related deaths with those linked to
benzodiazepines can be seen in Figure 2.12. The report on drug related deaths in
Scotland released in 2017, indicates that the majority of cases involved the
consumption of more than one active drug substance, thus emphasising the dangers
posed by polydrug use (National Records of Scotland, 2017).
Figure 2.12. Comparison of the number of drug related deaths in Scotland, to those where
benzodiazepines were identified. (National Records of Scotland, 2017)
149 154122
185 196149
121
191
426
574545
485
584 581527
614
706
867
0
100
200
300
400
500
600
700
800
900
1000
2008 2009 2010 2011 2012 2013 2014 2015 2016
Nu
mb
er
of
De
ath
s
Year
Drug Related Deaths In Scotland 2016
Any Benzodiazepine
All drugs

22
According to the National Records of Scotland report on drug related deaths during
2016, benzodiazepines were identified in 277 out of 286 incidents, where New
Psychoactive Substances (NPS) had potentially contributed to or been implicated in
a death. Although a variety of substances were identified, the most common NPS
found was etizolam (7). The number of incidents relating to etizolam (7) and
diclazepam (6) rose at a much faster rate than for diazepam (1) (Figure 2.13). Until
recently, diazepam (1) had been the most commonly identified benzodiazepine in
drug related deaths (National Records of Scotland, 2017). However, whether the
consumers had chosen to change active ingredients or were taking tablets
unwittingly believing them to contain diazepam (1), cannot be determined.
Potentially, illicit manufacturers could have swapped drug substance in order to stay
within the law because etizolam (7) for example, was not controlled until the
Psychoactive Substances Act of May 2016. However, it is now controlled as a class
C drug under the Misuse of Drugs Act of 1971, due to an amendment in May 2017
and has been listed as Schedule 1 (United Kingdom Government, 2017b). As
described in section ‘2.1.3 – Benzodiazepine Family’, diclazepam (6), which was
recorded as being on the rise, has no medical use but was produced exclusively for
the recreational market.

23
Figure 2.13. Comparison of the total number of benzodiazepine related deaths in Scotland, to
those where diazepam (1) was identified, since 2008. (National Records of Scotland, 2017)
Although the number of drug related deaths in Scotland has been reported as being
the highest in the European Union, differences in reporting and areas covered make
true comparison difficult (National Records of Scotland, 2017).
149 154
122
185196
149
121
191
426
115 11693
123
160
10684
121
154
2008 2009 2010 2011 2012 2013 2014 2015 2016
Nu
mb
er
of
De
ath
s
Year
Benzodiazepine Related Deaths In Scotland 2016
Any Benzodiazepine
Diazepam

24
2.3 Pharmaceutics
2.3.1 Formulation of Tablets
Tablet formulation is vitally important in the manufacture of pharmaceutical products.
Ethical pharmaceutical tablets are designed to ensure a consistent medicinal dosage
is provided, while ensuring stability and the correct bioavailability over the term of
their shelf-life (Narang, Desai and Badawy, 2012). The bioavailability is the level of
the administered drug substance that enters the systemic circulation enabling it to
have an effect (Aulton, 2007b). However, there are many influencing factors,
including particle size, dissolution properties, ease of handling, and the flow and
compression properties. This means that a variety of constituents (excipients) have
to be added along with the drug substance, to ensure the viability of the tablet. In
addition, interactions between the different substances have to be monitored to
safeguard the integrity of the product.
Formulations vary between manufacturing companies and therefore not all the
excipients will be the same or create the same interactions within a tablet. However,
the final product is registered with the Medicines and Healthcare products
Regulatory Agency (MHRA), who monitor the quality and specifications of each
product.
2.3.2 Impact of Particle Size
Particle size has a significant impact on tablets and their properties as it affects
content uniformity, particularly in low-dosage tablets. Pharmaceutical blue diazepam
(1) tablets produced for the UK market and analysed for this project (chapter 3 –
Physical Characteristics), ranged in weight between approximately 148 – 180 mg, of
which 10 mg is diazepam (1) and the remaining weight relates to a variety of
excipients. By incorporating the active ingredient as a larger quantity of smaller
particles, a more consistent batch can be produced. Small particles also provide a
greater surface area to maximise dissolution and absorption rates (Fu et al., 2012;
Aulton, 2007b).
25
2.3.3 Crystal Properties of Molecules
Solid components used to manufacture tablets exist in crystalline, amorphous and
polymorphic forms. Loosely packed molecules are more likely to fragment, dissolve
or melt, which impacts on tablet compaction, storage and use. Although some
substances are enantiotropic, meaning they can change between different equally
stable polymorphic forms under certain conditions, many are not. Substances used
in pharmaceutical formulations are often monotropic, meaning that one of the
polymorphs is more stable and the less stable forms will convert over time.
Consequently, the crystalline structure of some tablets changes over time, reducing
the bioavailability of the active ingredient but the rate of conversion fluctuates
according to storage conditions. (Aulton, 2007b). In order to limit these problems,
analytical tests are often performed to check for the presence of polymorphic forms
(European Medicines Agency, 2000).
The level of amorphous content also influences the crystal state and is affected by
the glass transition temperature. Samples kept below this temperature will be hard
and brittle with no mobility. However, above the glass transition temperature the
molecules become more fluid, enabling them to recrystallize in a more regular
structure.
The absorption of moisture by amorphous substances can act as an effective
plasticizer by lowering the glass transition temperature. The added water can either
form hydrogen bonds with the polar molecules in the structure, which binds the water
within the network; or if the substance is more hydrophobic, the molecules will create
distance by breaking the secondary bonds that already exist within the molecule.
Both of these effects allow movement of the molecules, enabling them to find a more
stable form (Smith et al., 2009). Unbound water content may be expelled through
the crystallisation process. However, some substances including lactose, which is a
common tablet excipient, retain moisture and are converted into a monohydrate
(Aulton, 2007b).
26
2.3.4 Tablet Excipients
The term ‘excipient’ relates to all the constituents added to a tablet, other than the
active drug substance. Excipients are “inert substances” with no biological effects
however, they significantly influence the absorption rates of active drug substances
(Aulton, 2007b). Each excipient has its own function and some compounds have
multiple roles. The purpose of many of the excipients is described below.
Formulations vary between different manufacturing companies but each factor
requires consideration and is tested to assess the interactions taking place between
the various constituents.
2.3.4.1 Diluents Used In Tablet Manufacture
The use of a diluent or bulking agent is important for giving volume to tablets
containing a small amount of active drug substance. Bulk is required for tablet
compression and manageability (Lachman, Lieberman and Kanig, 1970). A tablet
containing only 10 mg of diazepam (1) on its own would not be practical. Ideal
diluents should be biocompatible, chemically inert and non-hygroscopic with good
solubility and compaction properties (Aulton, 2007b). The most common bulking
agent used in diazepam (1) tablets produced for the UK market is lactose (Medicines
and Healthcare Products Regulatory Agency, 2014; Medicines and Healthcare
Products Regulatory Agency, 2016b; Medicines and Healthcare Products Regulatory
Agency, 2015b; Medicines and Healthcare Products Regulatory Agency, 2015c;
Actavis UK Ltd, 2014)
Lactose exists as both crystalline and amorphous structures. Either the -
monohydrate or the anhydrous β-lactose are produced depending on the
crystallisation conditions. Amorphous lactose is easier to dissolve and compact but
is hygroscopic and unstable. High relative humidity and a rise in temperature can
cause crystallisation (Aulton, 2007b).

27
2.3.4.2 Disintegrants Used In Tablet Manufacture
Disintegrants are added to the formula in order to facilitate the breakdown of the
tablet thus creating a larger surface area for dissolution. Disintegrants work in two
ways: firstly, some disintegrants promote the uptake of water by increasing
hydrophilicity and the interfacial tension is reduced and the tablet disintegrates when
it becomes wet. Secondly, the disintegrant particles swell during sorption of water,
causing the tablet to rupture. The most prevalent disintegrant used in tableting is
starch, which works by the latter method (Aulton, 2007b). Maize starch is commonly
used in the diazepam (1) pharmaceutical tablets produced for the UK market
(Medicines and Healthcare Products Regulatory Agency, 2014; Medicines and
Healthcare Products Regulatory Agency, 2016b; Medicines and Healthcare Products
Regulatory Agency, 2015b; Medicines and Healthcare Products Regulatory Agency,
2015c; Actavis UK Ltd, 2014)
2.3.4.3 Binders Used In Tablet Manufacture
The use of binders helps to hold a tablet together and gives the required mechanical
strength. Binders can be added as a dry powder or as a solution depending on the
tableting method. The binder used for diazepam (1) tablets by MA Pharmachem
and Wockhardt, is polyvinyl pyrrolidone (PVP), otherwise known as Povidone
(Medicines and Healthcare Products Regulatory Agency, 2015c; MA Pharmachem
Ltd, 2011). Povidone is a synthetic polymer, which has increased adhesive
properties. Due to its hydrophilic nature, Povidone can also act as a disintegrant and
can reduce the speed of polymorphic conversion of crystals by working as a
viscosity-inducing agent (Panakanti and Narang, 2012).
2.3.4.4 Glidants Used In Tablet Manufacture
Glidants are used to improve the smooth flowing of powders through the tableting
machine. This restricts blockages and helps to promote correct filling of the dies.
Ensuring consistency within tablets and between batches in the pharmaceutical
industry is of the utmost importance. Consistency is affected by particle shape and
size, the effectiveness of the mix and the ease of flow through the tableting machine.
Irregular flow leads to uneven filling of the die wells on the tableting machine,

28
potentially producing fragile tablets due to incorrect compression, which, could result
in tablets containing an incorrect blend and uneven dosage.
Spherical particles flow more easily than irregular crystals, which are more likely to
interlock. This results in the rough crystals clumping together creating an uneven,
more heterogeneous blend. There are a variety of measures which can be taken to
limit these problems. For example, certain additives can be introduced which are
designed to encourage crystal growth on particular faces during the production
process. In terms of tableting, glidants such as talc, colloidal silicon dioxide or
magnesium stearate can be added to help reduce the bulk density. Diazepam (1)
tablets in the UK contain magnesium stearate, which has a dual purpose as both a
glidant and a lubricant (Medicines and Healthcare Products Regulatory Agency,
2014; Medicines and Healthcare Products Regulatory Agency, 2016b; Medicines
and Healthcare Products Regulatory Agency, 2015b; Medicines and Healthcare
Products Regulatory Agency, 2015c; Actavis UK Ltd, 2014; Aulton, 2007b).
2.3.4.5 Lubricants Used In Tablet Manufacture
Lubricants are used to enable compressed tablets to slide out of the die wells
(Lachman, Lieberman and Kanig, 1970). They are generally fine powders which
create a thin barrier between the tablet and die to reduce friction.
However, there are a number of problems associated with lubricants. For example,
agglomeration of particles can increase through static charge of the fine powder.
Also, as lubricants are often lipophilic, they can slow down the dissolution rate of the
tablet by increasing hydrophobicity. Magnesium stearate used in the manufacture of
some pharmaceutical diazepam (1) tablets (MA Pharmachem Ltd, 2011), is
hydrophobic and although it is useful as both a lubricant and anti-adherent, it can
hinder the dissolution of tablets by adhering to the surface of the tablet creating a
film (Ariyasu, Hattori and Otsuka, 2016). Quantities of magnesium stearate are
therefore kept to a minimum. Alternatively, a water-soluble surfactant and
hydrophilic diluent can be added. Surfactants can aid dissolution by decreasing the
interfacial tension between solid and liquids thus allowing the solid particles to
become wet. They also have the ability to disrupt membranes in the gastro-intestinal

29
tract, increasing absorption. This requires careful monitoring however, as an
increase in absorption and bioavailability could have potentially toxic consequences
(Aulton, 2007b).
The choice of excipient is important because some substances interact to the
detriment of bioavailability or by increasing toxicity. The presence of magnesium
stearate for example, can increase the alkalinity and encourage hydrolysis of some
active ingredients. The effects may be further influenced by the presence of
magnesium oxide which is an impurity produced during the manufacture of
magnesium stearate, thus increasing the level of alkalinity. Alternatively, stearic acid
being used as the lubricant can help to protect some active drug substances from
degradation. Further interactions with magnesium stearate can occur through
oxidation, interactions with primary amines and the magnesium metal ions leading to
metal chelation (Li and Wu, 2014). The pharmaceutical company Actavis list both
magnesium stearate and stearic acid in their list of ingredients in their 10 mg
diazepam (1) tablets (Actavis UK Ltd, 2014).
2.3.4.6 Anti-adherents Used In Tablet Manufacture
Anti-adherents, including magnesium stearate, prevent tablets from sticking to the
punch or die wall (Lachman, Lieberman and Kanig, 1970). Sticking is related to the
moisture content of the tablet and is a common problem, which is particularly
prevalent with patterned punches. Accumulation of powder on the dies can create
uneven tablets with indistinct logos.
The tableting of illicit preparations can be performed in a variety of ways. Firstly, a
paste can be made containing the active ingredient, excipients and dyes, which are
placed into a mould and allowed to dry. This forms a more rough and uneven tablet,
without logo and bearing little resemblance to pharmaceutical tablets and therefore
creating tablets less affected by the anti-adherent. This is an older method that is
rarely used industrially but may still be used in some illicit circles.
A much more common process is the use of tablet presses (Humphries, 1984). The
use of a single punch press means that dies containing pharmaceutical logos can
allow distinguishing between illicit and legitimate tablets more difficult, especially as
30
the clandestine manufacturers perfect their formula to prevent sticking. However,
incorrect alignment or mishandling of the equipment can lead to punch marks which
can link tablets back to the press. The more sophisticated multi-station press makes
the linking of tablets less likely as many more tablets are manufactured at the same
time and not necessarily bearing the same logo (Humphries, 1984).
2.3.4.7 Colourants Added in Tablet Manufacture
Colourants are added to tablets for a number of reasons, including as a complement
to the flavour, to mask a less appealing colour or to hide a colour change. For
example, primary amines can interact with amorphous lactose in a Maillard Reaction,
resulting in a brown discolouration of tablets (Rowe, Sheskey and Weller, 2003).
This reaction has also been reported with secondary amines but not with nitrogen
present in heterocyclic rings (Narang, Desai and Badawy, 2012).
Dyes may be added as a coating or as an integral part of the tablet but blue
diazepam (1) tablets produced for the UK market have the colourant blended
throughout. Colour also enables standardisation and helps with tablet identification.
The colourant helps to identify the strength of the different tablets, so for diazepam
(1) produced for the UK market, 10 mg tablets are blue, 5 mg yellow and 2 mg are
white. This colour coding therefore assists in tablet differentiation and housekeeping
for pharmacists, but although all 10 mg diazepam (1) tablets from UK manufacturers
are blue, the type of dye used may vary.
The dyes used can be oil or water soluble but may also be in lake form. Aluminium
lake complexes are insoluble in water or oil and demonstrate an increased stability to
light and pH compared to the dye alone (Aulton, 2007b). In the UK, the most
common dye used in 10 mg pharmaceutical diazepam (1) tablets is indigo carmine
(E132). However, Actavis list the indigo carmine lake as their colourant (Actavis UK
Ltd, 2014) and Bristol laboratories use dispersed blue 12726 (Medicines and
Healthcare Products Regulatory Agency, 2015a), which is an alumina lake (Harvey
and Hayes, 1984).

31
2.3.4.8 Pharmaceutical Excipients
Each company produces an information leaflet to inform consumers of the
constituents of their tablets. MA Pharmachem for example, list their ingredients as:
lactose for the diluent, making up the majority of the bulk; maize starch is used as
the disintegrant, Povidone or PVP as the binder and magnesium stearate as the
glidant, lubricant and anti-adherent. The colourant used by MA Pharmachem is
indigo carmine dye (E132).
2.3.4.9 Interactions between Excipients
Excipients are “inert substances” but they do interact with each other and the active
ingredients, impacting on the bioavailability of the active drug substance. Excipients
are intended to help the absorption process by ensuring the active drug substance is
dissolved so that it rapidly reaches its absorption site. However, poorly chosen
excipients could form complexes that have lower solubility or increased molecular
size rendering them incapable of diffusing through cell membranes. Extensive tests
are performed by the manufacturing companies to ensure interactions are beneficial
and do not hinder the bioavailability (Panakanti and Narang, 2012).
In terms of diazepam (1) tablets, an investigation into incompatibilities between the
active ingredient and excipients has been performed by Matos et al. (2017) This
research entailed using Differential Scanning Calorimetry (DSC) and
thermogravimetric analysis (TA), in conjunction with infrared spectroscopy (IR). The
excipients tested were lactose monohydrate (diluent), microcrystalline cellulose
(emulsifier and bulking agent), pregelatinized starch (binder), sodium starch
glycoloate (disintegrant and gelling agent), croscarmellose sodium (super
disintegrant), colloidal silicon dioxide (glidant, adsorbent, disintegrant and anti-caking
agent) and magnesium stearate (lubricant). The study showed that an interaction
took place between the diazepam (1) and colloidal silicon dioxide, however this was
not significant enough to cause incompatibility. This interaction was detected using
DSC but not by TA or IR and it was suggested that DSC was more sensitive for this
type of analysis (Matos et al., 2017).
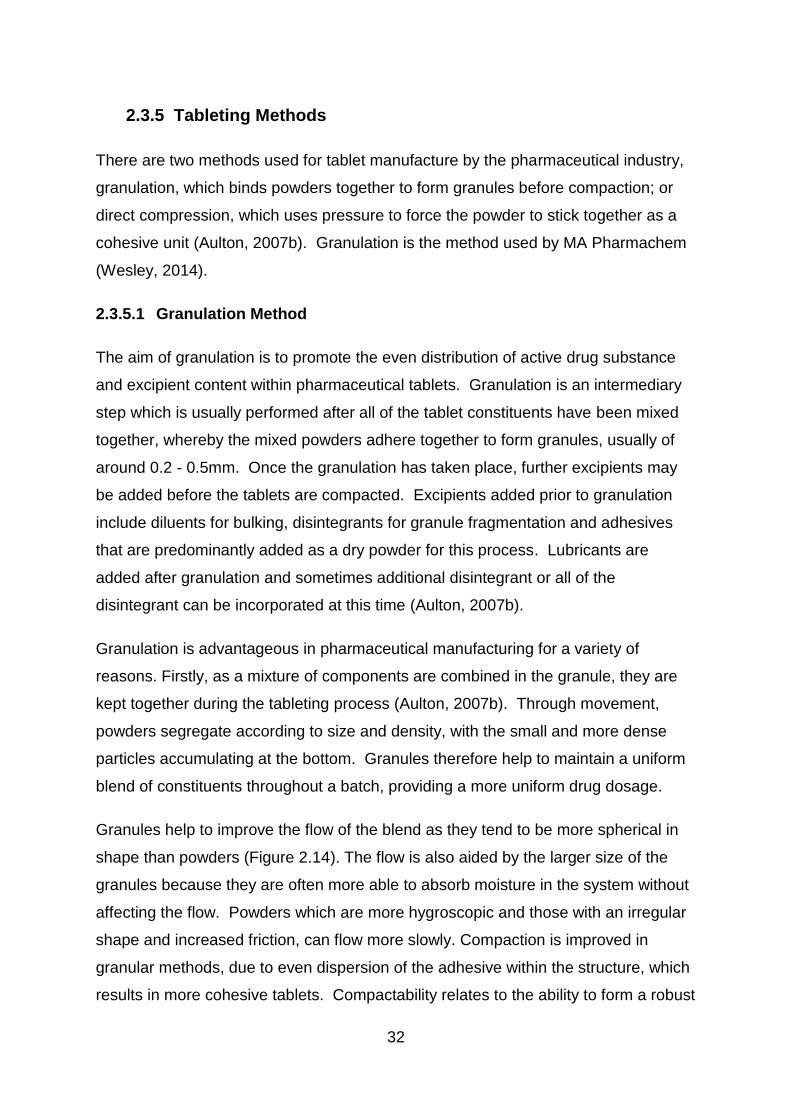
32
2.3.5 Tableting Methods
There are two methods used for tablet manufacture by the pharmaceutical industry,
granulation, which binds powders together to form granules before compaction; or
direct compression, which uses pressure to force the powder to stick together as a
cohesive unit (Aulton, 2007b). Granulation is the method used by MA Pharmachem
(Wesley, 2014).
2.3.5.1 Granulation Method
The aim of granulation is to promote the even distribution of active drug substance
and excipient content within pharmaceutical tablets. Granulation is an intermediary
step which is usually performed after all of the tablet constituents have been mixed
together, whereby the mixed powders adhere together to form granules, usually of
around 0.2 - 0.5mm. Once the granulation has taken place, further excipients may
be added before the tablets are compacted. Excipients added prior to granulation
include diluents for bulking, disintegrants for granule fragmentation and adhesives
that are predominantly added as a dry powder for this process. Lubricants are
added after granulation and sometimes additional disintegrant or all of the
disintegrant can be incorporated at this time (Aulton, 2007b).
Granulation is advantageous in pharmaceutical manufacturing for a variety of
reasons. Firstly, as a mixture of components are combined in the granule, they are
kept together during the tableting process (Aulton, 2007b). Through movement,
powders segregate according to size and density, with the small and more dense
particles accumulating at the bottom. Granules therefore help to maintain a uniform
blend of constituents throughout a batch, providing a more uniform drug dosage.
Granules help to improve the flow of the blend as they tend to be more spherical in
shape than powders (Figure 2.14). The flow is also aided by the larger size of the
granules because they are often more able to absorb moisture in the system without
affecting the flow. Powders which are more hygroscopic and those with an irregular
shape and increased friction, can flow more slowly. Compaction is improved in
granular methods, due to even dispersion of the adhesive within the structure, which
results in more cohesive tablets. Compactability relates to the ability to form a robust
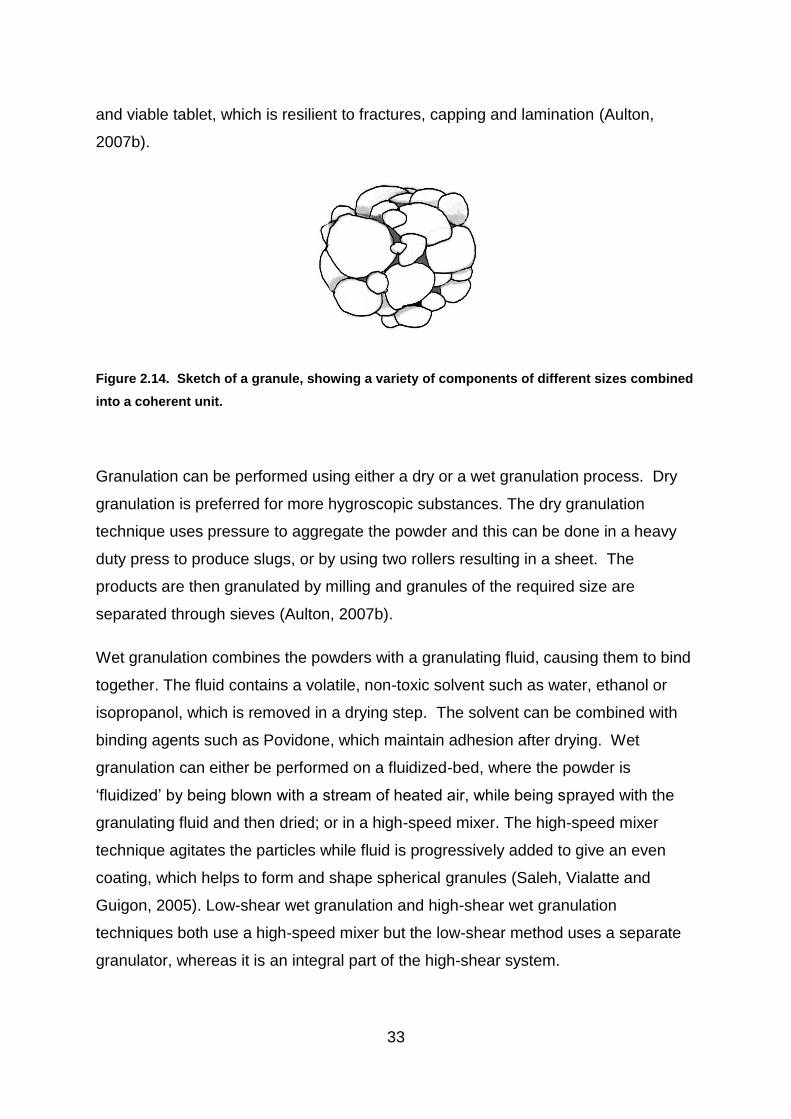
33
and viable tablet, which is resilient to fractures, capping and lamination (Aulton,
2007b).
Figure 2.14. Sketch of a granule, showing a variety of components of different sizes combined
into a coherent unit.
Granulation can be performed using either a dry or a wet granulation process. Dry
granulation is preferred for more hygroscopic substances. The dry granulation
technique uses pressure to aggregate the powder and this can be done in a heavy
duty press to produce slugs, or by using two rollers resulting in a sheet. The
products are then granulated by milling and granules of the required size are
separated through sieves (Aulton, 2007b).
Wet granulation combines the powders with a granulating fluid, causing them to bind
together. The fluid contains a volatile, non-toxic solvent such as water, ethanol or
isopropanol, which is removed in a drying step. The solvent can be combined with
binding agents such as Povidone, which maintain adhesion after drying. Wet
granulation can either be performed on a fluidized-bed, where the powder is
‘fluidized’ by being blown with a stream of heated air, while being sprayed with the
granulating fluid and then dried; or in a high-speed mixer. The high-speed mixer
technique agitates the particles while fluid is progressively added to give an even
coating, which helps to form and shape spherical granules (Saleh, Vialatte and
Guigon, 2005). Low-shear wet granulation and high-shear wet granulation
techniques both use a high-speed mixer but the low-shear method uses a separate
granulator, whereas it is an integral part of the high-shear system.
34
The method of granulation used impacts on the pore structure both within and
between granules by influencing the level of packing between the granules, for
example, granules produced by the fluid-bed are not as tightly packed as those that
had been sprayed (Aulton, 2007b). The inclusion of an adhesive in wet granulation
techniques increases the strength of the tablets. A study comparing granulation by
fluidized-bed to low and high-shear methods, to create a low dose soluble active
tablet was performed by researchers at Procter & Gamble (Hausman, 2004). The
experiment combined an unnamed active drug substance with lactose monohydrate,
microcrystalline cellulose, Povidone, Crospovidone (polyvinyl polypyrrolidone, which
is a cross-linked version of povidone) and magnesium stearate. Many of the
excipients used in the experiment are formulated into pharmaceutical diazepam (1)
tablets in the UK. The test concluded that in terms of producing a viable cohesive
product, the fluidized-bed method was effective as low and high-shear granulation
methods.
2.3.5.2 Direct Compression Method
In direct compression the active drug substance and excipients are mixed and
tableted. Although this can prove a speedier and less expensive option, the specially
formulated binders and other excipients can increase the cost. Disadvantages
include the increased likelihood of particle segregation and a reduced level of
compactability (Aulton, 2007b).
Direct compression is preferred for soluble or potent drug substances, where they
can be combined with course excipient particles, to improve flow and even
distribution of active drug substance. Other benefits of direct compression include
an improvement in tablet stability because water and heat are not required in the
manufacturing process and disintegration rates can increase due to particles being
held together with weaker bonds. Dry granulation and direct compression use Van
der Waals forces which increase in magnitude as the particles are forced together at
pressure.
In contrast, wet granulation distributes a liquid film around the particles, which forms
liquid bridges. As the granule dries, the added adhesive hardens creating a solid

35
bridge between the particles. Adhesives which bind in this way include PVP, which is
present in the 10 mg diazepam (1) tablets produced by Wockhardt. Partial
dissolution of powdered components through wet granulation, can result in
crystallisation binding the particles as they dry. Lactose crystallises in this way, using
water as the solvent in the wet granulation process. Bonds created during
crystallisation produce stronger, more robust tablets (Aulton, 2007b).
Clandestine laboratories tend to use the direct compaction method of tableting, by
compressing the free flowing powders (Humphries, 1984) which avoids the added
expense of purchasing granulation equipment. However, research into the
manufacture of ecstasy tablets revealed that another method of tableting involved a
combination of the moulded method of dye filling, whereby the mixture is fed into a
moulded plate, pressed with a steel punch to even it and then compressed by hitting
it with a hammer (Baer, 2007).
2.3.6 Tablet Manufacture
The blend of granules and/or powders is poured into the tableting machine through a
hopper, or funnel. From there it flows by gravitational force towards the die table and
into the die. The die is a well in the die table, which has the lower punch positioned
at the bottom. The location of the lower punch determines the amount of powder that
will be compressed into the tablet, thus affecting tablet depth. The lower punch may
be stationary or could move upwards during compression.
Once the die has been filled, the upper punch enters the die well from above and
compresses the powder into a tablet. The upper punch withdraws and the lower
punch moves up the die, allowing the tablet to be ejected.
2.3.6.1 Tablet Presses
Two main types of press are used for manufacturing tablets: - the single-punch press
or the rotary press. Hydraulic presses are often used for development stages or
research but are not usual for product manufacture (Aulton, 2007b).
A single-punch press can produce around 200 tablets per minute and is mainly used
for small batches of tablets, such as in clinical trials. Single- punch presses have

36
one die and set of punches (Figure 2.15). The powder flows from the hopper into a
hopper shoe above the die table. The hopper shoe moves across until positioned
over the die, allowing the powder to fall in to the well and then returns to allow the
upper punch to descend. The lower punch in a single-punch press is stationary and
does not push upwards during compression. The pressure is therefore applied from
above by the upper punch. The new tablet is then ejected and pushed away by the
hopper shoe as it returns to refill the die well (Aulton, 2007b).
Figure 2.15. Diagram of a single- punch tablet press. (Aulton, 2007b)
The rotary press is a multi-station press, which can produce over 10,000 tablets per
minute. The number of die and punch sets can vary from three to over 60 for large
scale operations. The dies are positioned in a circle around the die table and the
table rotates with the punches so that the same punch is always used for each die
(Figure 2.16). Compression is completed by the vertical motion of both the upper and
lower die.

37
Figure 2.16. Diagram of rotary press mechanism. (Sajib, 2011)
Machine maintenance and cleaning to keep the surfaces smooth helps to limit
technical problems. Most tableting problems result from powder content, such as
variability in dosage or weight, uneven flow, sticking to the punch, low mechanical
strength and capping or laminating. Capping is where the top of the tablet separates
from the bulk of the tablet and lamination is a horizontal split across the tablet.
The availability of tableting machines on the internet allows clandestine
manufacturers easy access to more sophisticated equipment. Research into ecstasy
tablets noted that although older or second hand machines may be used by illicit
manufacturers, the investigation had identified that newer and more powerful
tableting machines were also used in clandestine laboratories (Baer, 2007). This
can provide a more professional appearance for the illicit tablets and allows them to
be produced in greater numbers.
38
2.3.6.2 Compression of Powders
Compression of powder takes place over several stages:
1. Rearrangement of the powder within the die.
2. Once a certain pressure is exerted, the particles no longer move due to the
finite space and an increase in inter-particulate friction.
3. Particles undergo elastic deformation, plastic deformation or brittle deformation.
Viscoelastic recovery means that powders that undergo elastic deformation can
revert on decompression, or may reverse more slowly. Plastic deformation is
a permanent alteration and brittle deformation results in fragmentation into
smaller particles. The type and level of deformation is dependent on the
formulated powders and the pressure exerted (Roopwani and Buckner, 2011).
4. The smaller particles then repeat the compression process beginning with
rearrangement, as further force is exerted.
5. As the particles are forced together, agglomerations form.
6. On decompression, powders which underwent elastic deformation begin to
revert back, breaking some of the newly formed bonds (Buckner, Friedman and
Wurster, 2010).
The stages were confirmed in a study by Roopwani, who investigated the
compaction behaviour of some common pharmaceutical excipients, including
lactose, varying grades of corn starch and microcrystalline cellulose. It was found
that at lower pressure, there was rearrangement of the powder and some
fragmentation. Plastic deformation increased with the pressure, until available pore
space was filled leaving nowhere for the particles to flow. At higher pressure, there
was an increase in elastic deformation. These results were supported by the
statistical principal component analysis used to examine the generated data. The
statistical analysis also identified differences in the change of decompression density
of pre-gelatinized corn starch, which was believed to relate to its unique viscoelastic
properties (Roopwani and Buckner, 2011).
Compression of granules is different to powder compression and can result in
deformation of the granules and/or the powders within the granules. At low pressure,
39
granules rearrange within the die but due to the course nature of granules and better
flow properties, this stage is less significant than for powders. As the pressure
increases, granules undergo elastic and plastic deformation. In addition,
intragranular porosity reduces, resulting in an increased density of the granules.
Limited fragmentation does occur but to a lesser extent than deformation. Minimal
attrition can also occur through friction with the die walls (Aulton, 2007b).
2.3.7 Tablet Properties
Properties of pharmaceutical tablets produced for the UK market are specified in the
British and European Pharmacopeia, the MHRA and by the individual manufacturing
companies. The manufactured tablets are required to meet a variety of quality
control measures, which include:
1. Correct dosage and uniformity of dosage. Uniformity of the dose is tested by
analysing a sample of tablets and calculating whether their contents lie within
the stipulated limit of standard deviation from the mean.
2. Consistency of tablet appearance, weight and size. Uniformity of weight is batch
tested by weighing a sample of tablets and calculating the mean.
3. Consistent release and bioavailability of active drug content.
4. Safety of content, with no harmful substance or microorganisms present
5. Mechanical strength to ensure the tablet will remain intact under reasonable
conditions, for the duration of its lifetime.
6. Crystalline stability for the duration of its lifetime so that changes in amorphous
content do not affect bioavailability of the active drug substance.
7. Appropriate packaging to ensure the integrity of the tablets. (Aulton, 2007b)
A study was performed into the relationship between mechanical strength and
dissolution rates of diazepam (1) tablets. The experiment compared varying
quantities of excipients including microcrystalline cellulose, lactose and magnesium
stearate, with different mixing times and compression pressures. Results indicated
that although the mechanical strength of the tablets was affected, this did not directly
correlate with the dissolution rates of the tablets (Pesonen et al., 1997).
40
A study using a computer-generated hologram, investigated the homogeneity of the
surface of tablets containing the common pharmaceutical excipient, EmcompressTM
(Dicalcium phosphate dihydrate) compared to those containing starch. The tablet
surface is important because it impacts on dissolution, surface wetting and contact
angles. The technique used the diffuse reflection of incident laser light from the
surface of a tablet to create the hologram. The results indicated that the surface of
the tablets containing starch were more homogenous than those containing
EmcompressTM. It was suggested that during the compression process starch was
more likely to break and form new bonds than EmcompressTM (Ketolainen et al.,
1997).
Tablet manufacture is therefore a complex process. Some of the considerations are
purely to help with the production of tablets, such as the inclusion of glidants,
whereas others are concerned with bioavailability and safety of use. Illicit
manufacturers may want to make tablets easily but are not necessarily as aware or
even concerned about the impact of their formula. Therefore, irrespective of the
active drug substance, the excipients used by illicit producers may cause harmful
effects.
Little is known about excipients used in illicit diazepam (1) tablets but they are likely
to differ between the illicit manufacturers based on their own experience and
according to the substances that are readily available. It has been suggested that
due to the complications posed by the tableting process, once an illicit manufacturer
finds a formula that works, they are likely to stick to it (Baer, 2007).
In 2010, an investigation into excipients used as cutting agents in a variety of illicit
preparations, performed by the Centre for Public Health, based at John Moores
University, reported that amphetamine tablets were found to contain glucose,
bicarbonate of soda and paracetamol. They also noted that previous interviews with
drug dealers had revealed that they regularly added caffeine, ephedrine,
paracetamol and sugars, although dimethyl sulphone had recently been found. This
had also been discovered in methamphetamine tablets in Australia, along with
caffeine and a variety of sugars. In addition, ecstasy tablets were reported to
regularly contain lactose as the main sugar, accompanied by cellulose, calcium
41
phosphate, and calcium and magnesium stearate. However, these tablets were also
found to contain additional active ingredients such as paracetamol, caffeine,
ephedrine, procaine, amphetamine and 1- phenylethylamine. Interestingly the
investigation also claimed that heroin samples were sometimes cut with diazepam
(1) (C. Cole et al., 2010).
The rise of internet sales has also impacted on excipient availability and the
European Monitoring Centre for Drugs and Drug Addiction (2016) reported that not
only could relatively cheap tableting equipment and die stamps be bought from
China, the vendors could also provide pre-mixed coloured excipients, which
therefore makes accessing the ingredients easier and negates the problems of
finding a viable formula.
The differences between illicit cases of tablets therefore result from a number of
factors from the formula and excipients used, to the tableting and compaction
methods and the dies used. Each of the choices made by the illicit manufacturer
impact on the final characteristics of the tablet and can provide useful information for
linking together the illicit tablets. Therefore, this project aimed to investigate a
variety of physical and chemical characteristics of the illicit tablets in order to detect
any similarities that could identify links between the different cases. This was done
by comparing the results of the different forms of analysis and the data obtained and
by employing statistical clustering techniques and linear discriminant analysis to
group cases with similar characteristics. This is a novel type of research that has
never previously been performed on illicit blue tablets seized in Scotland which
provides important intelligence for police.

42
2.4 Drugs and the Law
The growth of the opium trade in Asia alerted trading countries, particularly America,
to problems created by drugs, which became recognised as an international
problem. After the establishment of the League of Nations, drug production, levels
and usage were monitored internationally. The list of controlled drugs increased,
with the inclusion of cannabis by the 1925 Geneva Convention. However, the
emergence of new drugs meant that further legislation was required and this was
finally brought together in 1961, with the United Nations Single Convention on
Narcotic Drugs. This described an order for drugs based on the level of perceived
danger and the amount of restriction required. Concern over the increasing abuse of
stimulants and hallucinogenic drug substances lead to The Convention on
Psychotropic Substances, 1971. This legislation listed substances such as psilocybin
and lysergide under schedule 1 and named diazepam (1) and other benzodiazepines
in schedule 4 (United Nations Office on Drugs and Crime, 1971).
The Convention against Illicit Traffic in Narcotic Drugs and Psychotropic Substances,
1988 was implemented due to a rise in recreational drug use, which had sparked an
increase in clandestine laboratories and international drug trafficking during the
1970s-80s. The legislation was aimed at targeting the drug traffickers and had
provisions for money laundering, as well as restricting the availability of many drug
precursors (United Nations Office on Drugs and Crime, 1971).
The international policies were embedded into drug legislation in each of the
participating countries. In the United Kingdom, the Dangerous Drugs Act, 1951
supported the policies set out in the Geneva Convention and focussed on restriction
of production, import and export of cannabis, opium and morphine (United Nations
Office on Drugs and Crime, 1951). The Dangerous Drugs Act of 1964 addressed
concerns about cannabis cultivation and use, while the Drugs (Prevention of Misuse)
Act of the same year concentrated on criminalising the possession of amphetamines,
which were believed to be related to juvenile crime (Reuter and Stevens, 2007). In
1965 a new Dangerous Drugs Act was drafted to consolidate the previous laws.
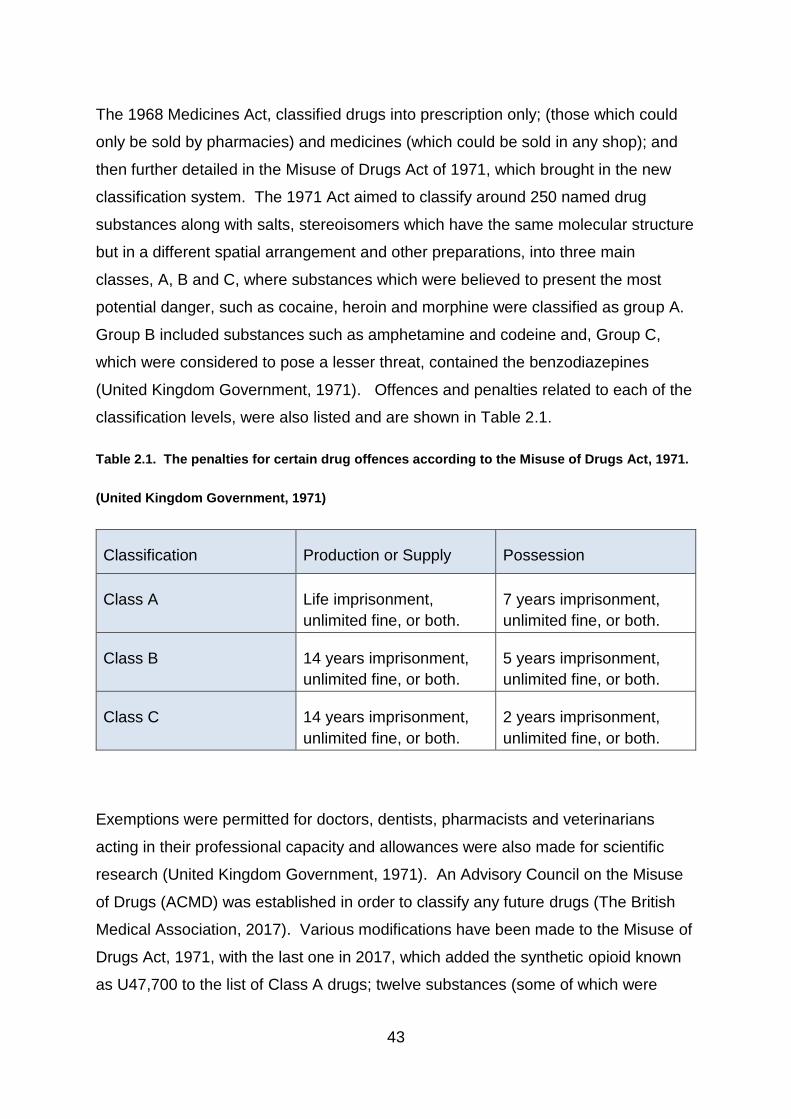
43
The 1968 Medicines Act, classified drugs into prescription only; (those which could
only be sold by pharmacies) and medicines (which could be sold in any shop); and
then further detailed in the Misuse of Drugs Act of 1971, which brought in the new
classification system. The 1971 Act aimed to classify around 250 named drug
substances along with salts, stereoisomers which have the same molecular structure
but in a different spatial arrangement and other preparations, into three main
classes, A, B and C, where substances which were believed to present the most
potential danger, such as cocaine, heroin and morphine were classified as group A.
Group B included substances such as amphetamine and codeine and, Group C,
which were considered to pose a lesser threat, contained the benzodiazepines
(United Kingdom Government, 1971). Offences and penalties related to each of the
classification levels, were also listed and are shown in Table 2.1.
Table 2.1. The penalties for certain drug offences according to the Misuse of Drugs Act, 1971.
(United Kingdom Government, 1971)
Classification Production or Supply Possession
Class A Life imprisonment,
unlimited fine, or both.
7 years imprisonment,
unlimited fine, or both.
Class B 14 years imprisonment,
unlimited fine, or both.
5 years imprisonment,
unlimited fine, or both.
Class C 14 years imprisonment,
unlimited fine, or both.
2 years imprisonment,
unlimited fine, or both.
Exemptions were permitted for doctors, dentists, pharmacists and veterinarians
acting in their professional capacity and allowances were also made for scientific
research (United Kingdom Government, 1971). An Advisory Council on the Misuse
of Drugs (ACMD) was established in order to classify any future drugs (The British
Medical Association, 2017). Various modifications have been made to the Misuse of
Drugs Act, 1971, with the last one in 2017, which added the synthetic opioid known
as U47,700 to the list of Class A drugs; twelve substances (some of which were
44
previously listed in the ‘temporary’ category) were classified as Class B; and sixteen
”‘designer’ benzodiazepines” were added to Class C. These sixteen include:
Etizolam (7) (4-(2-Chlorophenyl)-2-ethyl-9-methyl-6H-thieno[3,2-f][1,2,4]triazolo[4,3-
a] [1,4]diazepine ), Metizolam (4-(2-Chlorophenyl)-2-ethyl-6H-thieno[3,2-f]
[1,2,4]triazolo[4,3-a][1,4] diazepine) and Nitrazolam (1-Methyl-8-nitro-6-phenyl-4H-
[1,2,4]triazolo[4,3-a][1,4]benzodiazepine) (United Kingdom Government, 2017b).
The 1971 Misuse of Drugs Regulations were introduced to clarify the 1971 Act. The
regulations helped to outline the circumstances permitting controlled substances to
be lawfully supplied, such as through prescription and pharmaceutical dispensation,
for use by a named patient only and covered everything from prescription, to
storage, disposal and record keeping.
The regulations have been updated over the years with the most recent version
being the Misuse of Drugs Regulations of 2001. (United Kingdom Government,
2001). In addition to the classifications outlined in the Misuse of Drugs Act, 1971, the
drug regulations group the specified drug substances into schedules which specify
how each of the controlled substances must be handled to ensure safe usage. Drug
substances listed under Schedule 1 such as cannabis, cathinone, LSD and now
etizolam (7) are illegal and are prohibited for use. Schedule 2 drugs, which include
diamorphine and cocaine, must be stored in a locked safe with a handwritten register
of all additions and withdrawals. These drug substances may be prescribed with
details of the form and dosage level to be taken. Schedule 3 drugs such as
temazepam (19), flunitrazepam and phenazepam (16) require the same security as
Schedule 2 without the handwritten register. The majority of benzodiazepines,
including diazepam (1) itself are listed as Schedule 4 part 1. These drug substances
do not require such a high level of security as those above but are only legal by
prescription and are illegal if supplied otherwise, where Schedule 4 part 2 drugs do
not require a prescription but must be for personal use. The only requirement for
Schedule 5 substances such as is that invoices must be retained for two years.
Schedule 5 drugs include preparations of some controlled substances such as
codeine and morphine in a prepared and low strength form.

45
The Psychoactive Substances Act of 2016 was introduced in order to prevent the
production, supply, import and export of any psychoactive substances, with the
exceptions of caffeine, tobacco and alcohol, not already regulated by the Misuse of
Drugs Act (Home Office, 2016).
In the United Kingdom, the manufacturing, distribution, supply and storage of all
medicines is monitored by the Medicines and Healthcare products Regulatory
Agency (MHRA). In order to manufacture medicinal products, pharmaceutical
companies are required to have a Home Office Licence in addition to any MHRA
registration documents. Pharmaceutical companies register with the MHRA, stating
the product they intend to manufacture along with a list of ingredients, the intended
purpose of the medicinal product and potential side-effects. Tablet specifications
particular to that company, such as tablet weight and size are also provided. Tablet
weight and size may be variable between companies but each company has to
register the details of their own product. Each licensed company is then legally
obliged to ensure that the tablets meet the stipulated criteria for the entirety of their
shelf life. The MHRA ensure that the specifications for the tablets, including dosage
level are met, in accordance with the British Pharmacopeia monographs by
undertaking regular inspections. (Medicines and Healthcare Products Regulatory
Agency, 2012). This means that not only do the MHRA perform inspections and
quality checks but pharmaceutical companies also monitor their own products.
Therefore, preformulation studies are performed ensuring tablets are stable and
have the correct bioavailability; and random samples are regularly analysed to
ensure they continue to meet the required standard.

46
2.5 Illicit Drugs
2.5.1 Substandard and Counterfeit Products
One of the problems within the drugs sector is the rise in the sale of inferior and/or
counterfeit medicines. According to the World Health Organisation (WHO)
‘Substandard’ medicines are authorised products, which do not fulfil the standard of
quality expected nationally and/or internationally. Counterfeit or ‘falsified’ medicine is
defined as misrepresenting the true origin or content of the product by deliberate or
fraudulent means (World Health Organisation, 2015b). This is a particular problem
for people trying to buy medicinal products without a prescription and in countries
such as the USA, where medical treatment needs to be paid for. The possibility of
buying products over the internet at a cheaper price is very appealing. However, the
purchasing of medicinal products is problematic because unless the supplier is
known, there is no certainty that the tablets have been pharmaceutically
manufactured or are of sufficient quality. This dilemma was discussed by Liang and
Mackey (2009), who called for more regulation and accountability for internet sales.
They identified the real victims as being the more vulnerable patients including the
elderly who may be naïve or less well-off. As a consequence they may receive
tablets that are not effective, suitable nor safe and take the tablets with no medical
supervision and consequently suffer further financial loss as well as potential harm.
It has been suggested that although counterfeit products do exist, the majority of
sub-standard drugs on the market are pharmaceutical medications that were not
made with adequate quality control (Johnston and Holt, 2014). The problem is
exacerbated when the products are bought to treat severe medical conditions or
disease. In the UK, the collection of information relating to counterfeit medication, as
well as quality control, falls within the remit of the MHRA (Medicines and Healthcare
Products Regulatory Agency, 2012).
In 2016, the WHO noted that 920 types of medical product had so far been identified
as ‘substandard, spurious, falsely labelled, falsified and counterfeit’ (SSFFC) (World
Health Organisation, 2016). In addition, they warned of the dangers posed by these
products, which had been found to contain varying levels of active drug substance,
no active ingredient or different drug substances altogether. It was commented that
47
the falsified products were often unhygienically produced by untrained operators,
thus resulting in toxic levels of impurities, or chemicals and possibly having bacteria
encapsulated within (World Health Organisation, 2015b).
Although clandestine laboratories are known to produce tablets containing illegal
substances such as methylenedioxymethylamphetamine (MDMA), with varying
contents (Sherlock et al., 1999), knowledge on which medicinal products have
counterfeit counterparts is slower to emerge. In 2014, it was noted that
approximately 10% of all drugs on the market were counterfeit (Dégardin, Roggo and
Margot, 2014). A great deal of analysis has been performed and recorded about
illicitly manufactured anti-malarial tablets (Ricci et al., 2007; Nyadong et al., 2007),
as well as the erectile dysfunction drugs Viagra and Cialis (Jung et al., 2012; Bate
and Hess, 2010; Kwok and Taylor, 2012; Goldstein et al., 2015). Interest in
diazepam (1) has grown over recent years, with reports claiming that the majority of
the illicit tablets originate in Scotland (Birch, 2012); however, there has been little
analytical work performed on these tablets.
2.5.2 The Rise of Illicit Drug Usage in the United Kingdom
During the 1960s, a new generation of heroin addicts emerged. The Brain
Committee reported this had resulted from over-prescribing by a small number of
doctors. It was believed that the unused prescription drugs had been diverted into
the illicit market. The drug problem continued to worsen and from 1975 - 2000,
there was an estimated increase in the number of heroin addicts in England, from
approximately 5,000 to 281,000. In Scotland there were estimated to be over 50,000
addicts by the year 2000 (Reuter and Stevens, 2007).
Along with the increase in the reported number of heroin addicts came an increase in
reported seizures. An interdepartmental government document on tackling drug
misuse, along with guidelines for doctors was produced in1998 and updated in 2000
(United Kingdom Cabinet Office, 2000). Although concerns were raised over the
social and economic problems associated with drug use, medical issues such as the
use of dirty needles leading to an increase in HIV cases, focussed attention on
minimising risk.

48
By the end of the 20th century, a number of new drugs such as amphetamine, LSD,
barbiturates and ‘party’ drugs such as ecstasy (3,4-
methylenedioxymethamphetamine) had emerged. These became linked to crime,
with a heavy socio-economic impact. Surveys in England and Wales indicated that a
third of men in prison and one quarter of those on community service admitted to
problematic drug issues in the years 2000 and 2002. It has been estimated that in
2005-6 approximately £508 million was spent on treatment; with an increase in the
number of people being treated from approximately 67,000 in 1994 to around
195,400 in 2006-7 (The British Medical Association, 2017).
A government report into the impact of the drug market in Scotland estimated that
over £51million was spent on benzodiazepines alone in 2006 (Casey et al., 2009).
By 2007, it was estimated that the illicit drug market in the UK was worth over £5
billion but the economic and social costs resulting from drug related crime in England
and Wales was estimated to be over £13 billion (Reuter and Stevens, 2007).
An advisory council report in 2016 noted an increase in individuals seeking treatment
for addiction to prescription drugs and warned of an increase in diversion of
pharmaceutical tablets. However concern and urgent action was requested on the
purchase of wholesale powders allowing illicit tablets to be illegally manufactured in
the UK (Advisory Council on the Misuse of Drugs, 2016)
2.5.3 Sourcing of Illicit Drugs
A study carried out in the USA in 2014 reported that deceiving doctors was more
prevalent than previously realised. Out of 2349 young adults surveyed 4% admitted
misleading doctors to obtain prescription drugs, mainly for personal use, though
around half also indicated that the ability to sell on the products provided an added
incentive (Stogner, Sanders and Miller, 2014). Surveys of patients in America have
indicated that the majority of benzodiazepine users purchased their tablets on the
street (Jaffe et al., 2004; Stein et al., 2017).
In the United Kingdom, the diversion of pharmaceutical tablets into the illegal supply
chain was described by the Advisory Council on the Misuse of Drugs in 2016. The
prescription medicines which were most frequently diverted were identified as

49
benzodiazepines and prescribed opioids. It was also reported that the MHRA had
investigated reports on diverted diazepam (1) tablets, along with other substances,
leading to arrests. (Advisory Council on the Misuse of Drugs, 2016). However, a
reduction in benzodiazepine prescriptions may be making the diversion of
pharmaceutically manufactured diazepam (1) tablets less viable (Johnson,
Barnsdale and McAuley, 2016). Data recorded by the Pharmaceutical Security
Institute in America indicated that between 2005-10 there was a 66% rise in the
number of incidents involving the theft or diversion of pharmaceutical tablets,
whereas instances related to counterfeiting increased by 122% (Mackey et al.,
2015).
A prevalence of bulk supply purchases over the internet has also been reported
(Advisory Council on the Misuse of Drugs, 2016). The accessibility of the internet
has provided an easy means for consumers to buy products from their own home
without even visiting a doctor. Apart from regular internet sales, the availability of the
Darknet allows access to a variety of both illegal and prescription drugs including
benzodiazepines. The Global Drug Survey reported that there has been a
continuing rise of sales through the Darknet over the last three years (Winstock et
al., 2016). It has been noted that many customers believe this to be a safer way of
buying illegal drugs with around a quarter of drug sales reported to take place over
the internet; a trend that is likely to rise (United Nations Office on Drugs and Crime,
2016; Van Buskirk et al., 2017). Of those surveyed in 2015, 30% claimed to have
ingested a wider variety of active substances because of the ability to purchase
substances on the Darknet, rather than buying products elsewhere (United Nations
Office on Drugs and Crime, 2016).
An investigation into drug trafficking over the Darknet reported that the USA was
listed as the country most ‘shipped from’, with 24.9% (11,996) of the 48,026 listings
found on the Evolution marketplace. The United Kingdom was listed as the second
most ‘shipped from’ country at 12.4% (5972) of all listings. Along with Agora,
Evolution traded from January 2014 – March 2015 and was one of the two main
Darknet marketplaces at the time the study was being performed. It was also
discovered that cannabis accounted for over 25% of the listings, opioids over 15%
and benzodiazepines at under 10% of the listings (Rhumorbarbe et al., 2016).

50
The Darknet investigation was based at the University of Lausanne in Switzerland
and part of their research involved making four purchases over Evolution. Prices
were believed to be higher than street samples but offered safety and anonymity of
online purchases by avoiding physical contact with sellers. The purchases were
made from sellers who specified shipment from Switzerland. The results of the
investigation reported that the packages arrived by the Swiss postal system in a
normal envelope. However, inside the envelope the goods were packaged in heat
sealed static shielding bags, to avoid detection (Rhumorbarbe et al., 2016).
Chemical analysis on the samples of cocaine purchased in the Darknet study,
showed that one of the samples had the same chemical profile and cutting agents as
two cases previously seized by Swiss police. It was therefore implied that the online
sample and seized cases originated from the same distribution network
(Rhumorbarbe et al., 2016).
2.5.4 Drug Seizures
A study in 2007, commented that law enforcement is focussed on tackling drug
supply, by discouraging dealers and making the trade of illicit drugs more difficult. It
is hoped that this would lead to rising drug prices and lower illicit drug use.
However, it reported that the drug markets in the USA were resilient and despite
increasing conviction rates and lengthier jail sentences being put in place, the illicit
drug market was thriving. This was partly due to the expendability of those working
in the supply chain and the ease of finding replacements, combined with stability in
the prices of illicit market drugs (Bouchard, 2007).
The trading of illicit drugs on the street poses problems for vendors. They need to
perform their transactions unseen, with customers they can trust. There is also the
dilemma of wanting to increase the customer numbers while avoiding becoming
recognised as a drug dealer. It was reported that sales would take place in areas
with good visibility allowing look-out guards to be posted, or quick street transactions
in commercial areas during daylight hours to avoid attracting attention, until mobile
phones permitted the arrangement of private meetings. This meant that new
51
customers were usually only accepted on recommendation (Aldridge and Askew,
2017). However, this remains problematic with police targeting the drug market.
Over the period 2016/17, there were a total of 138,955 drug seizures made in
England and Wales by the police force, the transport police and the Border Force.
The majority of seizures were Class B drugs, with almost 75% involving cannabis
(Broadfield and Marshall, 2017).
Although the total number of seizures was recorded as a 6% decrease on the
previous year, it does not account for changes in police activity or records. It also
does not reflect the prevalence of the illicit drug trade (Broadfield and Marshall,
2017).
In line with this, there was a 2% decrease in the seizure of Class C drugs, although
this was only a fall of 1% in the case of benzodiazepines. The majority of Class C
seizures (39%) comprised of benzodiazepines, with a total of 1,945 seizures during
the 2016/17 time period. The number of benzodiazepine tablets seized (567,438)
was more than double the previous year but was heavily influenced by four different
seizures, in South Wales, containing over 30,000 tablets. It was noted however, that
seizures made by the Border Force tended to contain far larger quantities than those
made by the police. This included 53% of the seizures of anabolic steroids and 47%
of seizures containing other Class C drugs, which included the benzodiazepines
(Broadfield and Marshall, 2017).
The statistics on seizures in Scotland separate data according to 85-92% of supply
cases and estimated figures relating to possession. The data indicates that the
majority of seizures in the period 2015/16, involved cannabis. However, the Class C
drug seizures were dominated by benzodiazepines, with diazepam (1) being
reported as the most commonly found. In crimes related to possession, 90% of all
cases involved herbal cannabis, cannabis resin, cocaine, heroin or diazepam (1).
For supply related crimes, 382 out of 393 seizures on Class C drugs, were listed as
benzodiazepines and totalled 1,276,100 tablets (Scottish Government, 2017).
Internet sales present different issues. Purchasers and suppliers may be
anonymous, making identification of the culprit difficult but they are faced with

52
problems relating to inconspicuous shipment and delivery. Also there is no
protection against misconduct. Trading on the Darknet leaves customers open to
exit scams, such as the closure of Evolution in March 2015, when the moderators
stole around $12million of buyers money, stored in the system (Van Buskirk et al.,
2017).
By using information on forums, the first Silk Road was closed down in 2013. In
November 2014, Operation Onymous succeeded in closing down a number of
cryptomarkets and several arrests were made (Rhumorbarbe et al., 2016; Aldridge
and Askew, 2017). Confronting cryptomarkets has become an essential part of
dealing with the illicit drug market (Broséus et al., 2017).
2.6 Analysis of Illicit Diazepam (1) Tablets
According to British law, the possession and use of certain active substances are
prohibited and prescription drugs, such as diazepam (1) are controlled. The terms of
use are detailed under the Misuse of Drugs Act 1971 and the Misuse of Drugs
Regulations which are updated as the need arises. Breaking these laws can lead to
prosecution, however proof is required to confirm the active drug substance present
along with the number of tablets involved in order to substantiate the crime that has
been committed. Tablet numbers could help support a supply charge but the
circumstances of the case and the fact there is a controlled drug present determine
the offence (United Kingdom Government, 1971; M. D. Cole, 2003).
In addition, to providing forensic evidence for prosecutions, analysis of seized drug
samples can provide useful intelligence for both police and medical staff. Medically,
analysis can help alert doctors to problems that may arise in emergency cases,
especially if drugs ingested are not those which the consumer believed them to be.
Problem batches of tablets in circulation that have a specific visual appearance and
which have been previously analysed, can therefore provide valuable information.
Police intelligence can be gained from discovering potential links between cases,
which could provide information regarding the origins of illicit substances or help to
uncover a drug network (Esseiva et al., 2007).

53
In the past, it was suggested that if seized tablets appeared to be pharmaceutical
products, then literature could be used to support the tablet identity but when the
markings were not recognised, full chemical analysis was required. This included
presumptive and confirmatory chemical testing (United Nations Office on Drugs and
Crime, 2012). However, it is no longer feasible to assume that an official logo is
representative of tablets being pharmaceutically manufactured, as many of these
markings are now reproduced in clandestine laboratories (Police Scotland, 2016)
When an unknown substance is seized, presumptive tests may be used to give an
indication of the active drug substance present and to inform decisions on the type of
confirmatory test to be performed (Philp and Fu, 2017).
Although the Zimmerman test has been used as a spot test for benzodiazepines,
through the creation of a Meisenheimer complex (El-Hawary, Issa and Talat, 2007;
Philp and Fu, 2017), colour tests are not ideal presumptive tests because the results
are not specific.
Thin Layer Chromatography (TLC) has also been used as a test for
benzodiazepines. Although there is not a development reagent that is specific for
benzodiazepines, it can be performed using a sprayed solution of 1M sulphuric acid,
which is visualised under UV at 366nm. This is followed by spraying with acidified
potassium iodoplatinate, which produces purple spots in the presence of alkaloids by
reacting with tertiary and quarternary nitrogen atoms (United Nations Office on Drugs
and Crime, 2012; Baerheim Svendsen and Verpoorte, 1983; M. D. Cole, 2003). The
method was compared to an Enzyme-Linked Immunosorbent Assay (ELISA) assay
for detection of morphine in urine samples of drug abusers. False positives were
detected in the assay and it was therefore suggested that the TLC method be used
in conjunction with assays as a relatively cheap method of checking for potential
errors (Alireza Timcheh-Hariri et al., 2016).
Due to lack of specificity, it is more common to analyse several tablets from one
case using GC-MS and comparing the fragmentation pattern and retention time to
identify the main drug substance (United Nations Office on Drugs and Crime, 2012).

54
An investigation into nimetazepam tablets in Malaysia used GC-MS to compare
pharmaceutical batches to illicit cases. The results revealed that 11 out of the 64
illicit batches tested (17.2%), were found to contain diazepam (1) instead of
nimetazepam (Abdullah et al., 2012). Nimetazepam is a benzodiazepine used to
treat severe insomnia and was commonly prescribed in Southeast Asia (Manchester
et al., 2018). In the UK, nimetazepam is controlled under the Misuse of Drugs Act
1971 as a class C substance under schedule 4 part 1 and was listed as one of the
most commonly encountered controlled drugs in 2017 (United Kingdom
Government).
A comparison of techniques between a quadrupole mass spectrometer (QMS) and
an ion-trap mass spectrometer (ITMS) was performed using diazepam (1). This
showed that although the ITMS demonstrated greater sensitivity, the ion-mass ratio
proved more precise than with the QMS. Full scan analysis was considered more
beneficial than examining a smaller range but filtering out the unwanted ions meant
that some accuracy was lost (Fitzgerald et al., 1997).
As benzodiazepines are thermally labile, quantification of the active substance is
better achieved by High Performance Liquid Chromatography (HPLC) (M. D. Cole,
2003). Until recently, the majority of benzodiazepine tablets in the illicit market were
believed to have been pharmaceutically manufactured (United Nations Office on
Drugs and Crime, 2012) therefore, much of the literature on HPLC analysis of the
tablets has been aimed towards pharmaceutical batch analysis. For example, the
HPLC quantification of diazepam (1) by Sruthi et al. (2013) was performed by
crushing twenty tablets together, mixing the powder and then removing 25 mg for
analysis. Similarly, an investigation into alprazolam (2) tablets, involved crushing ten
tablets together for analysis (Pérez-Lozano et al., 2004). This batch analysis is not
suitable for illicit tablets as variability between concentrations of the active substance
may occur through uneven blending and only an average value for the batch will be
achieved.
Further analytical techniques have been recommended by the UNODC, including
infrared spectroscopy, although difficulties in extracting the pure drug substance and
solubility of derivatives were noted. Although the current UNODC is dated 2012
55
some of the techniques listed are nonspecific and do not particularly reflect current
laboratory best practise.
It is also indicated in the report by UNODC, that any techniques used should always
be repeated for comparative purposes, with a known pharmaceutical tablet alongside
the unknown sample (United Nations Office on Drugs and Crime, 2012).
The World Health Organisation (WHO) stress the importance of ensuring the quality
of pharmaceutical products (Ratanawijitrasin and Wondemagegnehu, 2002), which
supports the MHRA in their inspection and regulation of manufacturing processes.
Quantification of diazepam (1) within tablets is regularly performed for quality control
purposes in the pharmaceutical industry, leading to studies which are aimed at
enhancing the techniques used (Ferreyra and Ortiz, 2001; Moros, Garrigues and
Guardia, 2007). However, even for industrial quantification of active ingredient,
tablets tend to be batch tested, with the tablets being ground together. While this
technique may be suitable as a quality control check during pharmaceutical
manufacturing processes it is not suitable for the analysis of illicit tablets, where each
item could be different.
In 2015 the WHO sent out a Medical Product alert relating to falsified diazepam (1)
tablets which had emerged in Central Africa. The yellow tablets bearing the imprint
AGOG were sold in containers labelled as diazepam (1) but were found to contain
haloperidol (World Health Organisation, 2015b). Instances of fake diazepam (1)
tablets have also been recorded in Scotland (McGivern, 2016; BBC News, 2017).
However, although it has been recorded that ‘diazepam’ (1) tablets produced in
clandestine laboratories have entered the illegal supply chain little work has been
done to identify active ingredients or quantify the level of drug substance present.
2.7 The Use of Statistical Analysis
Physical and chemical analysis of illicit tablets provides a variety of information
regarding the content and manufacturing procedure. Due to the different options
regarding formulation and tableting methods, there is likely to be significant variation
between the physical and chemical characteristics of tablets produced by different
illicit manufacturers and more similarity between tablets made in the same
56
clandestine laboratory. Therefore, knowledge of these differences and similarities
can be used to separate illicit cases into different groups. Similarities between
chemical profiles can therefore highlight potential links between illicit cases,
indicating that they are not isolated incidents (Morelato et al., 2013).
The use of a database allows information to be stored and compared to other cases,
maybe from a wider area. This means that whereas a single case of illicit tablets
may require investigation for a particular prosecution, similarities to other cases may
provide useful intelligence for investigating a bigger problem (Morelato et al., 2013).
Potential links between cases are based on similarities demonstrated by a
combination of physical, chemical and statistical characteristics rather than by a
single factor (NicDaéid and Waddell, 2005). The characteristics chosen must be
clearly defined and be able to distinguish between different batches. Visual analysis
of colour is often subjective (Dams et al., 2001) and therefore not ideal for this
analysis. Whereas, tablet weight and thickness are definable measurements and
provide variable results based on differences in die pressure and the amount of
powder added to the die, therefore allowing variation between cases to be observed
(Marquis et al., 2008).
Chemical analysis can include GC-MS to explore impurities created during the
synthesis of the active drug substance if it makes up a large percentage of the tablet
weight (Weyermann et al., 2008; Morelato et al., 2015). A study into processing
impurities of diazepam (1) led to six impurities being identified and characterised by
Kalas et al. (2015). Identification of the active drug substances present, given the
many types of drug available on the illicit market, along with identification of
excipients, can also help to characterise the tablets, particularly if the illicit
manufacturer continually uses the same formula (Baer, 2007). Each of these
characteristics help to distinguish between different cases of illicit tablets and
similarities may therefore be significant.
Comparison and interpretation of results can prove difficult and may be subjective,
especially when large quantities of data are generated by a variety of analytical
techniques being used to analyse a number of samples. Although statistics may not
57
provide a definitive solution, it does remove any bias in interpretation of results and
is a good way of comparing large datasets.
A variety of statistical methods are available for interpreting the data. In terms of
profiling illicit tablets in this study, the aim was to find ways of investigating potential
links between cases. Therefore, statistical clustering techniques such as
agglomerative hierarchical clustering (AHC) and k-means clustering were an
effective method of exploring patterns within the data (NicDaéid and Waddell, 2005).
A review by Dams et al. (2001) described the benefits of using the chemometric
methods of principal component analysis (PCA), AHC and k-means for investigating
links between heroin samples. Klemenc (2001) used these techniques and recorded
results of between 95-100% accuracy. K-means clustering was also used to
characterise two clusters of ecstasy tablets seized in nine different cities in the Sao
Paulo district of Brazil, thus identifying links based on the chemical profiles (Maione
et al., 2017).
Chemometric techniques can be used to enable prediction of group membership.
Once different groupings can be separated, the data can be used to build a training
set used to inform on the group membership of future samples. These supervised
techniques include linear discriminant analysis, which was used by Johnston and
King (1998) to predict the country of origin of seized heroin, based on the
concentrations of alkaloids and adulterants within the samples. However, it was
recorded that the content of heroin samples changed over time and therefore
comparing data from future samples to information stored on a database generated
by previous seized samples, may be flawed.
The benefits of creating a database to store information can provide more than local
intelligence (NicDaéid and Waddell, 2005). Establishment of a common method of
analysis, enabling a means to share intelligence through a common database has
been discussed and tried (Weyermann et al., 2008; Lociciro et al., 2008). The illicit
drug market has no borders and it has been suggested that cross-border intelligence
is valuable in tackling drug crime (Lociciro et al., 2008).

58
2.8 Assumptions and Strategies used in this Study
Although it has been recognised that counterfeit versions of medicinal products are
produced in clandestine laboratories, there appears to be little documentation or
research on illicit diazepam (1) tablets. A great deal of the work performed on
diazepam (1) tablets appears to be based on the assumption that they are
pharmaceutically manufactured and is concerned about ensuring standards are met
or comparing the varying levels of active substance in tablets produced by different
companies. Batch testing is often applied to pharmaceutically manufactured tablets
however, illicit tablets may show more variability between tablets and therefore need
to be analysed individually.
This project focussed on analysing individual tablets taken from 65 different cases of
illicit tablets, which were seized in the Tayside area by Police Scotland. These
tablets were compared to known pharmaceutical tablets. Data produced from
physical and chemical tests was compiled on a database and a variety of statistical
tests were performed to create models with the potential to identify similarities and
differences which could highlight links between the different cases. In order to carry
out the research, certain assumptions and strategies were employed:
1. The Tablets
During this project 1989 tablets, which belonged to 65 different illicit cases and 5
batches of known pharmaceutical tablets were analysed. The illicit and the
pharmaceutical tablets were treated in exactly the same way.
2. Assumptions
The assumption was made that the illicit tablets submitted from each case would be
similar to each other in terms of physical and chemical properties. This allowed a
variety of analytical techniques to be performed using multiple tablets where
necessary, instead of trying to perform every test on each individual tablet.

59
3. Sampling Strategy
On arrival at the University, each batch of illicit tablets were contained in separate
plastic bags. Within each bag, all of the tablets from the batch were loose and able
to mix. However, to ensure random samples would be selected for analysis, as the
tablets were photographed separately, individual bags were labelled, providing a
sample number for each tablet. After photographing the tablets, a random number
generator was used, in order to determine which number bag each sample would be
placed in. This meant that when tablets were taken for analysis, they were already
randomly selected. The use of a random number generator was in line with
recommendations in the ‘Guidelines on Representative Drug Sampling’ produced by
the United Nations Office on Drugs and Crime (2009).

60
3.1 Chapter Summary
The physical weights and measurements of seized illicit tablets and those of
pharmaceutical origin were recorded and compared. The aim was to explore
differences and similarities, with consideration to acceptable variability as outlined in
the British Pharmacopeia. The weight, diameter and depth of all tablets were
recorded on a Microsoft access database, enabling the comparisons to be performed
and the information used to differentiate between the different tablets.
The colour of the tablets was recorded by photography using a purpose built
lightbox.
3.2 Introduction
3.2.1 The Manufacture of Pharmaceutical Tablets
A large variety of prescription tablets are manufactured for the United Kingdom
market. New branded products are initially patented, preventing other companies
from manufacturing similar formulations until the patent expires. This allows the
developing company time to recoup the expense of discovering and introducing the
new medication (National Health Service, 2014). Once the patent period is
completed, other manufacturers are permitted to produce their own formula for the
manufacture of the same generic drug. This may result in variations of colour,
weight and dimensions, due to differences in colourants and excipients used.
However, each company must license their product, specifying details of tablet
content, weight and general appearance (European Medicines Agency, 2000;
Medicines and Healthcare Products Regulatory Agency, 2012). At present, twelve
marketing authorisation licenses exist for the manufacture and sale of 10 mg
diazepam (1) tablets in the UK (Goddard, 2018).
61
Colour and logos on the pharmaceutically made tablets are useful for identifying the
manufacturer and drug substance present and are described on accompanying
patient information leaflets. However, the type of font and size are not registered
characteristics. This means that for 10 mg diazepam (1) tablets produced by MA
Pharmachem for example, there could legitimately be a variety of fonts and sizes on
their tablets (Wesley, 2014). In the United States of America, the Department of
Health and Human Services issue guidelines to promote coded imprints on the
tablets or capsules themselves, to aid identification (Department of Health and
Human Services USA, 2017).
In the United Kingdom, the TICTAC database can be used to identify pharmaceutical
tablets and is regularly updated with photographs and information regarding illicit
tablets and capsules. The information provided includes the legal standing of the
active substance present and details the formula and chemical structure, along with
physical characteristics of the product, in order to separate it from other tablets or
capsules of a similar appearance. It is estimated that TICTAC is used by over 60,000
professionals from both healthcare and law enforcement sectors (TICTAC
Communications Ltd., 2015).
3.2.2 Tablet Quality
Details of drug specifications and regulations determining the quality and
consistency of manufactured products are defined in the British and European
Pharmacopoeias and are upheld in the United Kingdom, by the Medicines and
Healthcare Products Regulatory Agency (MHRA). This ensures the safe
manufacture and storage of pharmaceutical drug products.
Consistency in dosage is affected by even distribution of drug substance in the tablet
blend and by variation in tablet thickness, which results from over or under-filling dies
on the tablet press and the pressure applied to the press. Tablet circumference and
diameter are determined by the die measurements and are therefore more
consistent. Checks for confirming tablet consistency are described in the
pharmacopoeia. The test for uniformity of weight is defined in Appendix XII C of the
British Pharmacopoeia. It states that 20 tablets should be randomly analysed and

62
that from those tablets, no more than two are allowed to deviate from the average
weight by more than a set percentage. In addition, none of the tablets are permitted
to deviate by more than twice the set percentage. The percentage variation allowed
differs according to the average mass of the tablet. The diazepam (1) tablets
analysed for this project all fell into the category of weight between 80 – 250 mg.
Thus allowing a variation percentage of 7.5% (British Pharmacopoeia, 2008; British
Pharmacopoeia Commission, 2017b). This means that two of the tablets could go
over or under the average weight by 7.5% but not beyond 15%.
An investigation into identification of counterfeit capsules found that the weight of the
legitimate pharmaceutical capsules within the study, fell within the range of 315 –
321 mg, with a corresponding relative standard deviation (RSD) of 1%. In contrast,
the counterfeit capsules had a much larger weight range of between 224 – 384 mg
and an RSD varying from 2 – 40% (Dégardin, Roggo and Margot, 2015).
A study by Zaid, investigating the content of lorazepam (11) half-tablets discussed
how the correlation between weight and drug uniformity was important because
pharmacies are not equipped to check the uniformity of the drug substance. Half
tablets are also taken as lower dosage units, with the tablets split on the score line,
therefore emphasising the importance of ensuring even distribution of the active
ingredient (Zaid et al., 2013).
3.2.3 Physical Appearance of Illicit Tablets
3.2.3.1 Comparison of the Physical Characteristics
Similarities in the physical appearance of tablets can identify potential links between
illicit cases. For example, Camargo explored the possibility of using different digital
capabilities of photographs to compare colour, shape and texture of tablets. The
resulting information was then used to investigate potential links between tablets
(Camargo et al., 2012).

63
3.2.3.2 Manufacturer Logos
Logos could be a useful way to differentiate between batches of tablets. However, it
is possible that an illicit manufacturer may have a number of presses or a multi-
station press using a variety of dies, which could produce tablets with an appearance
similar to one or more legitimate pharmaceutical manufacturer. Potential links
between tablets therefore require identification through chemical analysis as well.
Alternatively, chemical differences may become apparent between tablets of a
similar physical appearance, potentially indicating that different manufacturers are
using similar dies.
3.2.3.3 Tool Marks
Another approach to investigating potential links would be to compare tool marks on
the tablets. If the same damage mark kept reoccurring within and between cases, it
could indicate that the same die had been used. However, it was decided for three
reasons that this would not form part of this current research project. The first being
the difficulty in recognising a true damage mark from accidental damage and wear
that has occurred over the tablet lifespan as well as any differences in the
formulation leading to inconsistencies in visual appearance of the tablets. As
discussed in Chapter 2 - Introduction (Section 2.2.6.1 Tablet Presses), differences in
blend or formula can result in powders sticking to the punch, produce differences in
mechanical strength or result in capping or lamination causing a split in the tablet,
making consistent damage marks difficult to identify. Thirdly, with increasing
complexity of modern illicit tableting operations, it is more likely that a multi-station
tablet press could be used.
3.2.3.4 Granularity of Tablets
The granularity of tablets results from formulation, blend and manufacturing
procedure employed (Lopatka and Vallat, 2011). Similarities in granularity may
therefore help to identify potential links. A study performed in 2011 explored surface
granularity though digital photography, which used the grey scale to differentiate
shades of colour that represented various granules, facilitating comparison (Lopatka
and Vallat, 2011). This technique therefore required consistent digital photographs

64
of a good quality. Although granularity was considered for this project, it was not
pursued because the appearance of granules does not only result from the tablet
constituents and manufacturing processes but also from the effects of storage and
the consistent blend of the tablet mix, meaning that even tablets from the same
batch could appear different.
3.2.3.5 Colour of Tablets
The colour of tablets vary according to the type and amount of colourant used, as
well as how well mixed in the colourant is. Consistency of colour gives the
appearance of tablets being more evenly blended and therefore, well made. In the
United Kingdom, the colourant most often used in pharmaceutical 10 mg diazepam
(1) tablets is indigo carmine (E132). However, this may be present in powder or lake
form, as discussed in Chapter 2 – Introduction (Section 2.2.4.7 Colourants) (Actavis
UK Ltd, 2014; Medicines and Healthcare Products Regulatory Agency, 2016b;
Medicines and Healthcare Products Regulatory Agency, 2015b; Medicines and
Healthcare Products Regulatory Agency, 2014; Medicines and Healthcare Products
Regulatory Agency, 2015c). Alternatives, such as the lake dispersed blue 12726 are
also used (Medicines and Healthcare Products Regulatory Agency, 2015a).
Colourants may therefore aid in distinguishing between illicit batches of diazepam (1)
tablets, however this was not pursued for the project as it was believed greater
information may be obtained using other analytical techniques, particularly if only a
limited number of colourants were used.
3.3 Overview of the Analysis of the Physical Characteristics
The physical characteristics of each tablet were recorded in as much detail as
possible and added to a database built with Microsoft Access. The use of a
database for storing information related to the analysis of capsules and tablets is
becoming more widespread. It provides a structured method of storing detailed
information which can be constantly updated, while allowing comparisons of relevant
65
characteristics to be performed. Databases can even be set up to flag notifications
of similarity as new entries are added (Dégardin, Roggo and Margot, 2015).
The intention for creating a database for this project was twofold. Firstly, the
information was detailed in order that a selection of characteristics could be
extracted from the database, as required. Thus allowing a variety of differentiation
criteria to be utilised. Secondly, as many of the tablets were to be destroyed through
chemical analysis, it was important to maintain a record containing as much detail as
possible for future work.
Many of the physical characteristics, such as colour, font and surface
inconsistencies, were best captured with photography. In case of visual comparison
of the tablets at a later date, as much consistency as possible was maintained
between the photographs (the details of which are described in section 3.3.1.4
Camera Set-Up). Photographs were then linked to the database.
Tablet weights and measurements were recorded and where possible, compared to
data supplied by the MA Pharmachem and Wockhardt, in order to differentiate
between the pharmaceutical and illicitly manufactured tablets. This was done by
adding the recorded information into the database, which allowed a direct
comparison of the information relating to tablet markings, weights and
measurements.
3.4 Experimental
3.4.1 Photography of Tablets
In order to keep an accurate visual record of each tablet before its destruction,
photographs were taken of every tablet received. The diazepam (1) tablets were all
circular in shape, usually with a flat surface on both sides. However, some of the
cases had bevelled edges and a few were convex in shape. In order to record as
much variation as possible, photographs were taken of the front, the reverse and
from the side.

66
Initially photographs were taken using an Olympus DSX100 optical microscope, with
a 3.6x objective lens and 1.3x zoom, creating a photograph of 1194 x 1194 pixels at
96 dpi. Later intakes of tablets were photographed with a Nikon D5100 camera,
using a 36mm extension tube and a 5000K lightbox producing pictures 3696 x 2448
pixels at 300 dpi.
In order to keep the photographs consistent, a 5000K lightbox was constructed. This
was then configured on the white balance settings of the camera. The use of a
lightbox meant that the light source could be kept even and shadow avoided. It also
prevented any influence from external light sources affecting the colour temperature
and ensuring consistency over multiple use. The construction was based on the
lightbox used in the study on illicit tablet distribution networks by image collection
performed by Camargo et al. (2012).
3.4.1.1 Light Intensity
The intensity of the light was important for the photographs. As the tablets were
photographed alongside a measure, the depth of field needed to keep both in focus.
An increase in light helped to keep the image sharp.
While Digital Single Lens Reflex (DSLR) cameras can boost the brightness of a
picture this is usually done at the expense of the quality. In order to reduce any grain
and to retain the detail of the surface photographed, the lowest International
Standards Organisation (ISO) setting of the camera was used (Brady, 2017).
The other benefit with using greater light was that a higher shutter speed could be
used. This helped to reduce the impact of external vibration or “camera shake”,
which is more noticeable in highly magnified subjects.
3.4.1.2 Materials for the Light Box
Black Plastic Box (MB7 177 x 120 x 83 mm), 2 x PCB Mounting 4 AA Battery Boxes
with mounting screws, 16/0.2 mm Stranded Copper AWG 16/32 3 Amp Equipment
Wire 10 mm (black and red) and a Snap-in Miniature Round Rocker Switch (Black)
were obtained from Maplin, Edinburgh. 8 x 48 LED 5000K Panels, Size 39 x 48 mm
(Part No. SKU014825 – 25210 EVU) and a dual flash bracket holder for studio light
67
stand tripod camera DSLR 1/4" Screw were purchased from ebay. A plastic cat litter
tray (1 mm thick black) was bought from Asda, Dundee and cut to size to mount the
LED panels on. Roof bolts (2 x M6 25 mm), dome nuts (2 x M6), spring and flat
washers (2 x M6) and 8 x AA Alkaline Batteries were purchased from Homebase,
Dundee.
3.4.1.3 Construction of the Light Box
A circle was drawn around the camera lens, in the centre of the top of the black box.
A hole was cut which was approximately ¾ inches larger diameter than the drawn
circle maintaining a 5 mm distance from the edge of where the camera bracket was
to be mounted. The 5 mm clearance allowed for the box and LED panel thickness.
The camera bracket was fastened onto the long face of the box with the M6 roof
bolts. The 1mm black tray was cut to size and the LED panels were mounted with
the electrical connections towards the lens aperture to allow the assembly to be
withdrawn for periodic battery changes.
The four AA battery boxes were screwed to each short end on the inside of the box,
allowing a 3 mm clearance from the base lid to allow the box to fully close. Then a
20 mm hole was drilled to position the rocker switch away the components. The two
AA battery boxes were soldered in series to create a 12V source and the LED panels
in parallel via the rocker switch to the battery boxes (i.e. all positive terminals
combined and similarly the negative terminals). Finally, the eight AA batteries were
fitted and the panels were replaced ensuring the wires remained away from the lens
aperture.
A sheet of photographic paper was printed black, with a 2.5 mm square left white.
The sheet was cut to size, locating the white square towards one corner. This was
fixed onto the inside of the lid of the black box, which was used as the base.
Alongside this, a corner scale was fixed alongside it, to allow measurements to be
taken. Images of the construction and set-up of the light box can be seen in Figure
3.1.

68
Figure 3.1. The purpose built light-box. Showing the light box turned off, allowing the LED
lights inside to be seen; switched on, to show brightness; from underneath to show
construction; showing the scale and background mounted on the lid; and as seen by the lens;
how the camera is fixed to the lightbox and the lens from underneath.
3.4.1.4 Camera set-up
A Nikon D5100 camera with a standard lens was set to 55mm and the filter was
removed to prevent reflection. A 36mm extension tube was attached.
The camera was set to manual, with an aperture of F36 and a shutter speed of 0.5
seconds. The ISO was 100 and whitebalance of 5, for the 5000K colour
temperature. The quality used was Raw-F (large) for high resolution and spot
metering was chosen to focus on a mark or edge of the tablet.
Once the settings had been adjusted, the camera was mounted on the bracket.
69
3.4.2 Tablet Markings
Before analysis each tablet was physically examined and a brief description of the
colour was recorded, along with the tablet markings. Although a note was made of
the colour of the tablets, it was acknowledged that this was subjective. However,
descriptions such as mid blue or bright blue could be used to give an indication of
colour. Differences in colour were best recorded through keeping methods of
photography as consistent as possible. The photographs taken in the light box were
taken against a black background with a small white box measuring 2.5 mm in one
corner. This was to ensure that the white balance was kept constant. This
methodology was based on a study by Camargo et al. (2012).
Each tablet was checked for surface irregularities, such as chipping or double strikes
and any noticeable detail was recorded. Noticeable differences in font size and style
between some cases bearing the same marking, were apparent. Initially, it was
believed this may be an area worth investigating. However, after discussions with
MA Pharmachem, it was discovered that no specification was listed on the
manufacturing licence from the Medicines and Healthcare products Regulatory
Agency (MHRA) (as described in section 3.1.1 The Manufacture of Pharmaceutical
Tablets).
3.4.3 Tablet Measurements
3.4.3.1 Weight of the Tablets
Due to the stringent rules regarding tablet weight that are laid down in the British and
European Pharmacopoeias, weights were recorded and assessed in comparison to
the prescribed criteria (British Pharmacopoeia, 2008).
The tablets were each weighed three times on a calibrated Mettler Toledo analytical
balance. The mean weight of each tablet was recorded, in order to reduce variation.
The weights were noted and the mean, standard deviation (SD) and relative
standard deviation (RSD) were calculated for each case. This was compared to the
±7.5% difference permitted and an allowance for any errors of measurement. The
error of measurement of the independently calibrated Mettler Toledo was estimated

70
at ±0.1 mg. Ten weights were recorded of the same tablet, giving a standard
deviation of 9.48 x 10⁻⁴ mg.
As tablet weight was originally determined by each pharmaceutical company and
registered for their own product, it varied between manufacturers. For example, MA
Pharmachem manufacture tablets within the weight range 165-175 mg (Wesley,
2014), whereas tablets produced by Wockhardt are noticeably lighter, with the
average weight of Wockhardt pharmaceutical tablets analysed for this project being
around 153 mg. The variation in weight results from differences in excipient content
because although the amount of active drug substance would have been the same,
the exact formulations could vary. Therefore, the allowances in weight described for
this project were linked to the measured tablet weight and compared to the
pharmaceutical criteria.
3.4.3.2 Dimensions of the Tablets
The diameter and the depth of each individual tablet were measured using digital
callipers. The callipers with an estimated error of measurement of ±0.02 mm, were
calibrated against a series of metric ‘Matrix’ steel slip gauges by the Coventry Gauge
& Tool Company Ltd. The diameter and depth of the tablets were measured across
the centre, in line with any markings. Each measurement was taken three times and
the mean was calculated, to minimise any variance. The mean, standard deviation
and relative standard deviation were then calculated for each case.
The tablet diameter was taken across the centre of the tablets, in line with any
markings, where appropriate. However, although lifted from a flat surface, the
callipers did not always touch the tablets in the same place on both sides, meaning
that instead of being taken directly across the tablet, measurements may have been
taken at a slight angle, as demonstrated in Figure 3.2. Any inaccurate
measurements were avoided as much as possible and all measurements were taken
three times, with the mean being the recorded result to minimise variation.
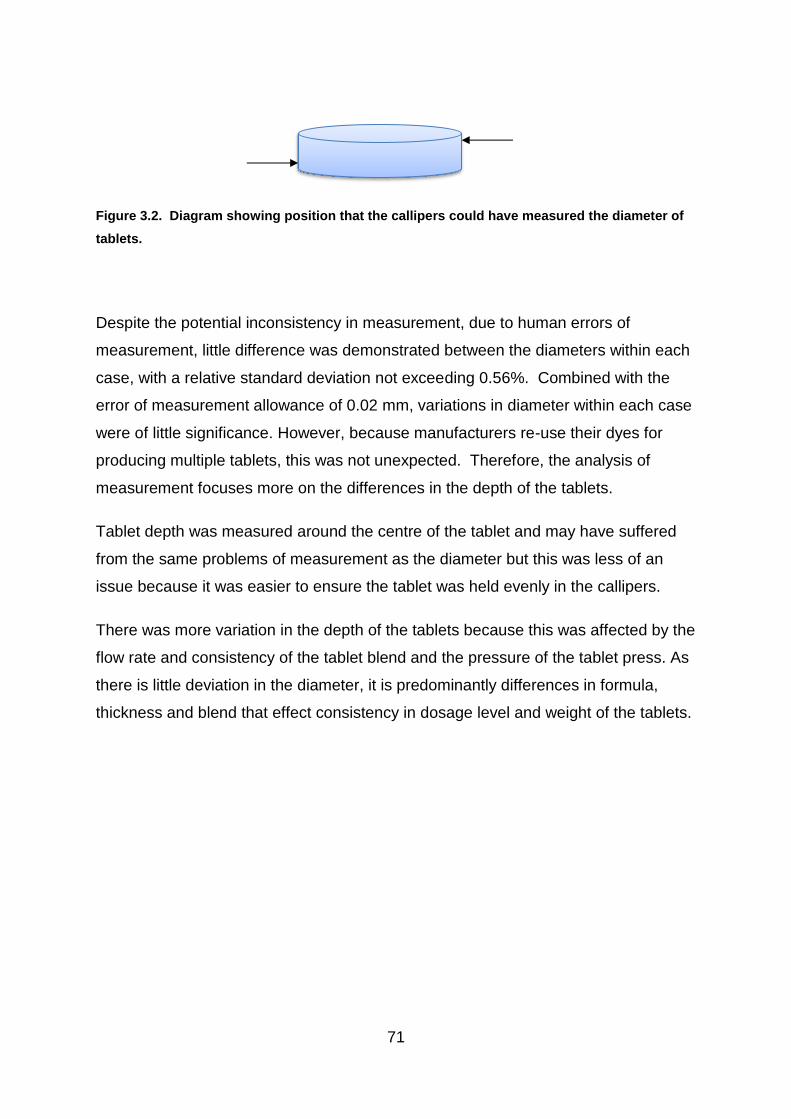
71
Figure 3.2. Diagram showing position that the callipers could have measured the diameter of
tablets.
Despite the potential inconsistency in measurement, due to human errors of
measurement, little difference was demonstrated between the diameters within each
case, with a relative standard deviation not exceeding 0.56%. Combined with the
error of measurement allowance of 0.02 mm, variations in diameter within each case
were of little significance. However, because manufacturers re-use their dyes for
producing multiple tablets, this was not unexpected. Therefore, the analysis of
measurement focuses more on the differences in the depth of the tablets.
Tablet depth was measured around the centre of the tablet and may have suffered
from the same problems of measurement as the diameter but this was less of an
issue because it was easier to ensure the tablet was held evenly in the callipers.
There was more variation in the depth of the tablets because this was affected by the
flow rate and consistency of the tablet blend and the pressure of the tablet press. As
there is little deviation in the diameter, it is predominantly differences in formula,
thickness and blend that effect consistency in dosage level and weight of the tablets.
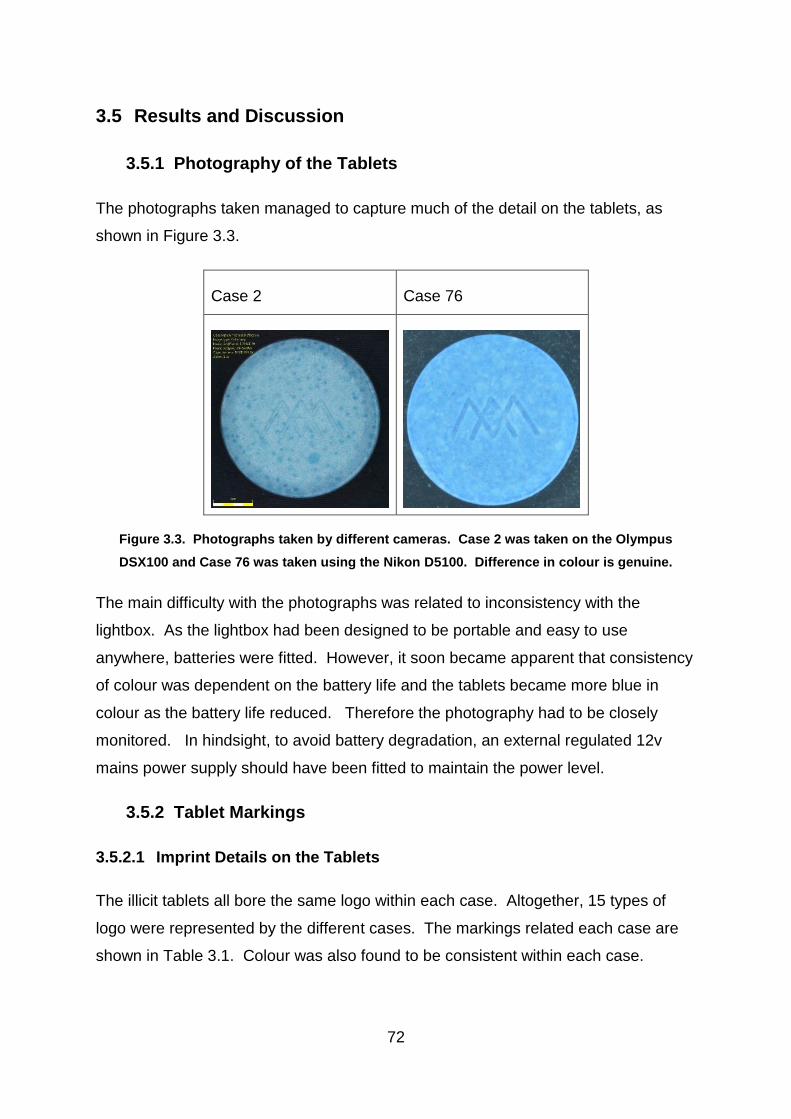
72
3.5 Results and Discussion
3.5.1 Photography of the Tablets
The photographs taken managed to capture much of the detail on the tablets, as
shown in Figure 3.3.
Case 2 Case 76
Figure 3.3. Photographs taken by different cameras. Case 2 was taken on the Olympus
DSX100 and Case 76 was taken using the Nikon D5100. Difference in colour is genuine.
The main difficulty with the photographs was related to inconsistency with the
lightbox. As the lightbox had been designed to be portable and easy to use
anywhere, batteries were fitted. However, it soon became apparent that consistency
of colour was dependent on the battery life and the tablets became more blue in
colour as the battery life reduced. Therefore the photography had to be closely
monitored. In hindsight, to avoid battery degradation, an external regulated 12v
mains power supply should have been fitted to maintain the power level.
3.5.2 Tablet Markings
3.5.2.1 Imprint Details on the Tablets
The illicit tablets all bore the same logo within each case. Altogether, 15 types of
logo were represented by the different cases. The markings related each case are
shown in Table 3.1. Colour was also found to be consistent within each case.
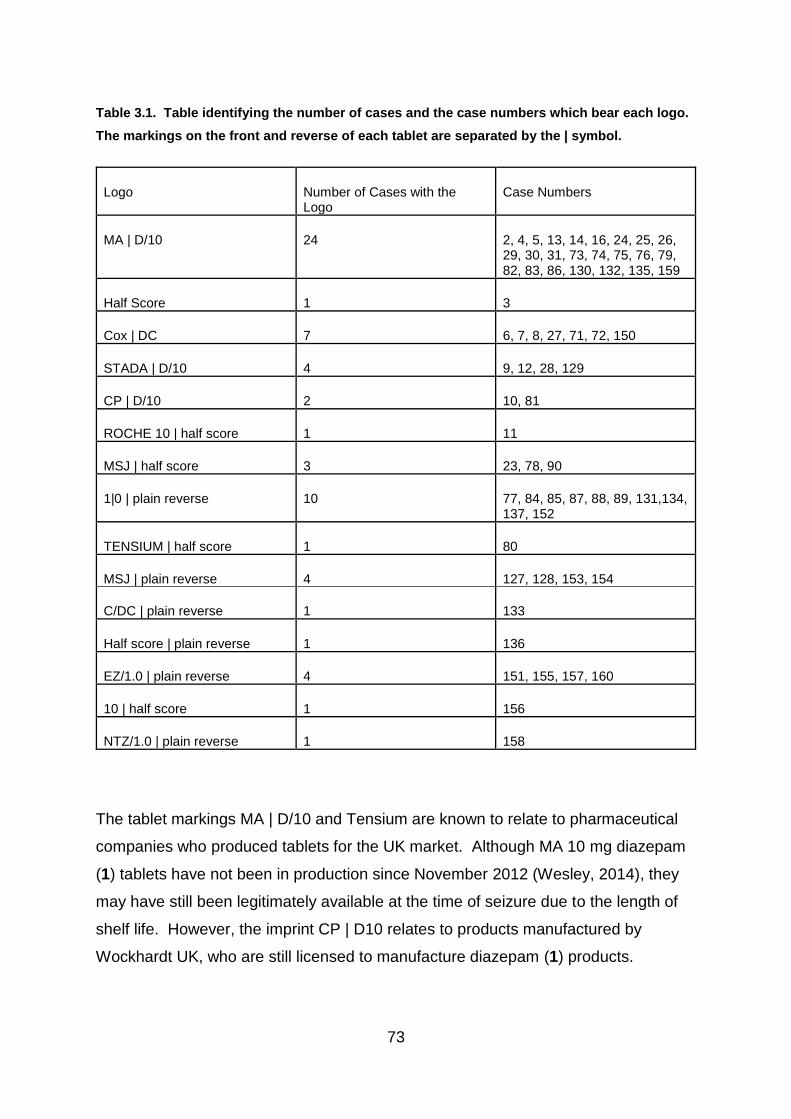
73
Table 3.1. Table identifying the number of cases and the case numbers which bear each logo.
The markings on the front and reverse of each tablet are separated by the | symbol.
Logo Number of Cases with the Logo
Case Numbers
MA | D/10 24 2, 4, 5, 13, 14, 16, 24, 25, 26, 29, 30, 31, 73, 74, 75, 76, 79, 82, 83, 86, 130, 132, 135, 159
Half Score 1 3
Cox | DC 7 6, 7, 8, 27, 71, 72, 150
STADA | D/10 4 9, 12, 28, 129
CP | D/10 2 10, 81
ROCHE 10 | half score 1 11
MSJ | half score 3 23, 78, 90
1|0 | plain reverse 10 77, 84, 85, 87, 88, 89, 131,134, 137, 152
TENSIUM | half score 1 80
MSJ | plain reverse 4 127, 128, 153, 154
C/DC | plain reverse 1 133
Half score | plain reverse 1 136
EZ/1.0 | plain reverse 4 151, 155, 157, 160
10 | half score 1 156
NTZ/1.0 | plain reverse 1 158
The tablet markings MA | D/10 and Tensium are known to relate to pharmaceutical
companies who produced tablets for the UK market. Although MA 10 mg diazepam
(1) tablets have not been in production since November 2012 (Wesley, 2014), they
may have still been legitimately available at the time of seizure due to the length of
shelf life. However, the imprint CP | D10 relates to products manufactured by
Wockhardt UK, who are still licensed to manufacture diazepam (1) products.
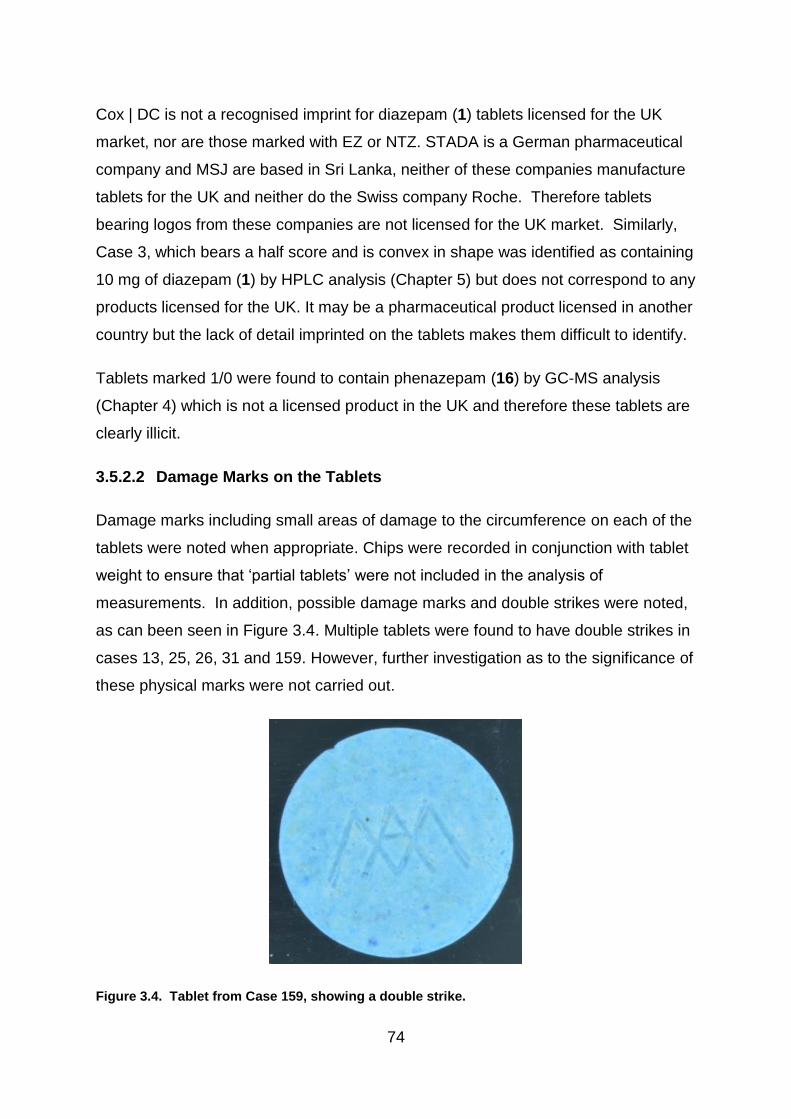
74
Cox | DC is not a recognised imprint for diazepam (1) tablets licensed for the UK
market, nor are those marked with EZ or NTZ. STADA is a German pharmaceutical
company and MSJ are based in Sri Lanka, neither of these companies manufacture
tablets for the UK and neither do the Swiss company Roche. Therefore tablets
bearing logos from these companies are not licensed for the UK market. Similarly,
Case 3, which bears a half score and is convex in shape was identified as containing
10 mg of diazepam (1) by HPLC analysis (Chapter 5) but does not correspond to any
products licensed for the UK. It may be a pharmaceutical product licensed in another
country but the lack of detail imprinted on the tablets makes them difficult to identify.
Tablets marked 1/0 were found to contain phenazepam (16) by GC-MS analysis
(Chapter 4) which is not a licensed product in the UK and therefore these tablets are
clearly illicit.
3.5.2.2 Damage Marks on the Tablets
Damage marks including small areas of damage to the circumference on each of the
tablets were noted when appropriate. Chips were recorded in conjunction with tablet
weight to ensure that ‘partial tablets’ were not included in the analysis of
measurements. In addition, possible damage marks and double strikes were noted,
as can been seen in Figure 3.4. Multiple tablets were found to have double strikes in
cases 13, 25, 26, 31 and 159. However, further investigation as to the significance of
these physical marks were not carried out.
Figure 3.4. Tablet from Case 159, showing a double strike.

75
3.5.3 Measurements of the Tablets
The results of the measurements are shown in Table 3.2 and are summarised as a
bar chart in Figure 3.5 and as scatter graphs and box plots in Figures 3.6 and 3.7.
Table 3.2 lists the mean diameter, depth and weight of every illicit case and batch of
pharmaceutical tablets, although allowance needs to be made for the ±0.02mm error
of measurement for diameter and depth and the ±0.1mg error of measurement for
weight. In addition, the relative standard deviations (RSD) are listed for the depth
and weight of each case.
Table 3.2 also lists Roche next to the Pharmaceutical tablets. Although the Roche
tablets were pharmaceutically manufactured, they were not produced for the UK
market. However, with similar work on pharmaceutical intelligence being performed
in other countries, Roche tablets may be used for comparative work elsewhere and it
has been noted that there is little variability between Roche products manufactured
either on one site or in multiple locations and they remain consistently within
pharmaceutical guidelines (Dégardin, Roggo and Margot, 2015).
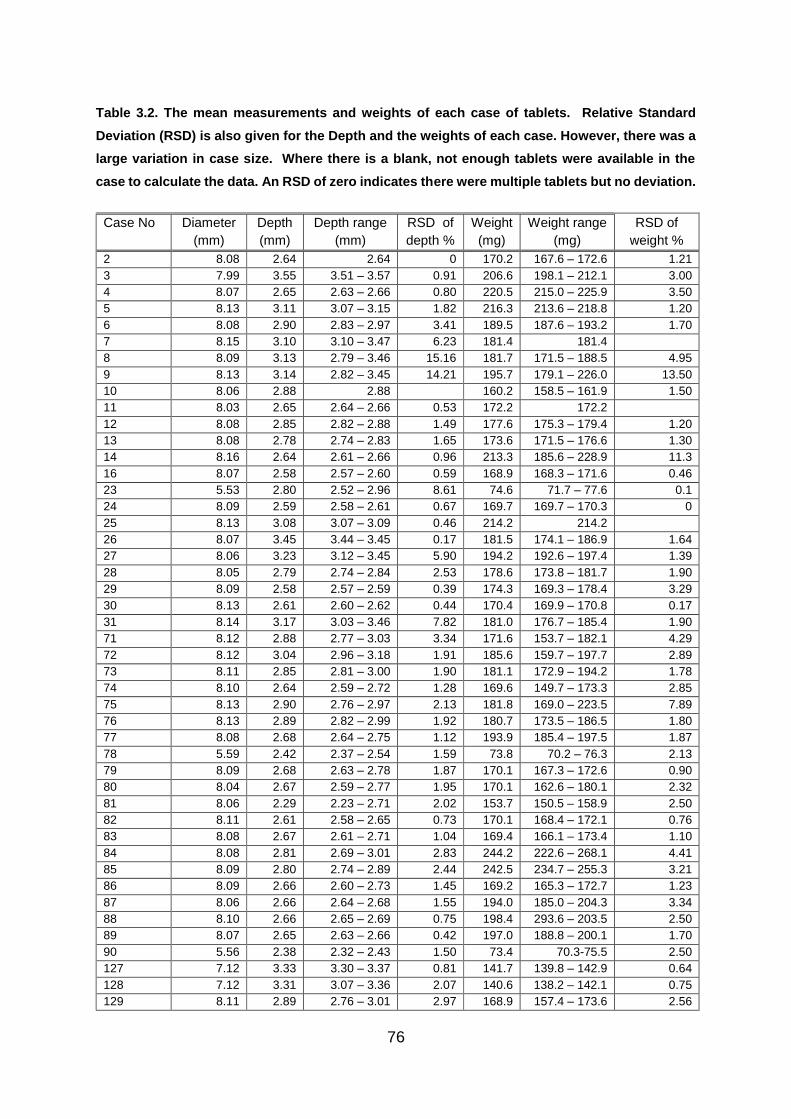
76
Table 3.2. The mean measurements and weights of each case of tablets. Relative Standard
Deviation (RSD) is also given for the Depth and the weights of each case. However, there was a
large variation in case size. Where there is a blank, not enough tablets were available in the
case to calculate the data. An RSD of zero indicates there were multiple tablets but no deviation.
Case No Diameter
(mm)
Depth
(mm)
Depth range
(mm)
RSD of
depth %
Weight
(mg)
Weight range
(mg)
RSD of
weight %
2 8.08 2.64 2.64 0 170.2 167.6 – 172.6 1.21
3 7.99 3.55 3.51 – 3.57 0.91 206.6 198.1 – 212.1 3.00
4 8.07 2.65 2.63 – 2.66 0.80 220.5 215.0 – 225.9 3.50
5 8.13 3.11 3.07 – 3.15 1.82 216.3 213.6 – 218.8 1.20
6 8.08 2.90 2.83 – 2.97 3.41 189.5 187.6 – 193.2 1.70
7 8.15 3.10 3.10 – 3.47 6.23 181.4 181.4
8 8.09 3.13 2.79 – 3.46 15.16 181.7 171.5 – 188.5 4.95
9 8.13 3.14 2.82 – 3.45 14.21 195.7 179.1 – 226.0 13.50
10 8.06 2.88 2.88 160.2 158.5 – 161.9 1.50
11 8.03 2.65 2.64 – 2.66 0.53 172.2 172.2
12 8.08 2.85 2.82 – 2.88 1.49 177.6 175.3 – 179.4 1.20
13 8.08 2.78 2.74 – 2.83 1.65 173.6 171.5 – 176.6 1.30
14 8.16 2.64 2.61 – 2.66 0.96 213.3 185.6 – 228.9 11.3
16 8.07 2.58 2.57 – 2.60 0.59 168.9 168.3 – 171.6 0.46
23 5.53 2.80 2.52 – 2.96 8.61 74.6 71.7 – 77.6 0.1
24 8.09 2.59 2.58 – 2.61 0.67 169.7 169.7 – 170.3 0
25 8.13 3.08 3.07 – 3.09 0.46 214.2 214.2
26 8.07 3.45 3.44 – 3.45 0.17 181.5 174.1 – 186.9 1.64
27 8.06 3.23 3.12 – 3.45 5.90 194.2 192.6 – 197.4 1.39
28 8.05 2.79 2.74 – 2.84 2.53 178.6 173.8 – 181.7 1.90
29 8.09 2.58 2.57 – 2.59 0.39 174.3 169.3 – 178.4 3.29
30 8.13 2.61 2.60 – 2.62 0.44 170.4 169.9 – 170.8 0.17
31 8.14 3.17 3.03 – 3.46 7.82 181.0 176.7 – 185.4 1.90
71 8.12 2.88 2.77 – 3.03 3.34 171.6 153.7 – 182.1 4.29
72 8.12 3.04 2.96 – 3.18 1.91 185.6 159.7 – 197.7 2.89
73 8.11 2.85 2.81 – 3.00 1.90 181.1 172.9 – 194.2 1.78
74 8.10 2.64 2.59 – 2.72 1.28 169.6 149.7 – 173.3 2.85
75 8.13 2.90 2.76 – 2.97 2.13 181.8 169.0 – 223.5 7.89
76 8.13 2.89 2.82 – 2.99 1.92 180.7 173.5 – 186.5 1.80
77 8.08 2.68 2.64 – 2.75 1.12 193.9 185.4 – 197.5 1.87
78 5.59 2.42 2.37 – 2.54 1.59 73.8 70.2 – 76.3 2.13
79 8.09 2.68 2.63 – 2.78 1.87 170.1 167.3 – 172.6 0.90
80 8.04 2.67 2.59 – 2.77 1.95 170.1 162.6 – 180.1 2.32
81 8.06 2.29 2.23 – 2.71 2.02 153.7 150.5 – 158.9 2.50
82 8.11 2.61 2.58 – 2.65 0.73 170.1 168.4 – 172.1 0.76
83 8.08 2.67 2.61 – 2.71 1.04 169.4 166.1 – 173.4 1.10
84 8.08 2.81 2.69 – 3.01 2.83 244.2 222.6 – 268.1 4.41
85 8.09 2.80 2.74 – 2.89 2.44 242.5 234.7 – 255.3 3.21
86 8.09 2.66 2.60 – 2.73 1.45 169.2 165.3 – 172.7 1.23
87 8.06 2.66 2.64 – 2.68 1.55 194.0 185.0 – 204.3 3.34
88 8.10 2.66 2.65 – 2.69 0.75 198.4 293.6 – 203.5 2.50
89 8.07 2.65 2.63 – 2.66 0.42 197.0 188.8 – 200.1 1.70
90 5.56 2.38 2.32 – 2.43 1.50 73.4 70.3-75.5 2.50
127 7.12 3.33 3.30 – 3.37 0.81 141.7 139.8 – 142.9 0.64
128 7.12 3.31 3.07 – 3.36 2.07 140.6 138.2 – 142.1 0.75
129 8.11 2.89 2.76 – 3.01 2.97 168.9 157.4 – 173.6 2.56

77
Case No Diameter
(mm)
Depth
(mm)
Depth range
(mm)
RSD of
depth %
Weight
(mg)
Weight range
(mg)
RSD of
weight %
130 8.10 2.92 2.86 – 3.06 1.89 179.8 172.9 - 196.0 3.32
131 8.08 2.78 2.66 – 2.89 2.42 240.4 231.0 – 259.0 3.21
132 8.12 3.07 2.98 – 3.17 1.80 195.0 178.7 – 208.5 3.46
133 8.22 2.85 2.74 – 3.24 4.98 170.5 159.1 – 175.8 2.94
134 8.08 2.61 2.41 – 2.82 4.05 223.3 201.5 – 247.2 5.74
135 8.15 2.89 2.81 – 2.98 1.61 179.1 173.5 – 18.36 1.65
136 8.12 2.94 2.82 – 3.06 1.97 197.0 186.1 – 212.9 3.39
137 8.06 2.81 2.69 – 3.06 4.09 234.8 227.8 – 253.4 3.85
150 8.10 2.87 2.74 – 3.06 2.90 174.1 160.6 – 191.5 4.99
151 8.09 2.83 2.78 – 2.87 0.95 178.7 165.1 – 186.0 4.57
152 8.15 2.70 2.60 – 3.03 3.23 234.7 225.1 – 262.1 3.40
153 7.11 3.31 3.17 – 3.38 1.65 141.5 138.6 – 143.8 0.88
154 7.11 3.32 3.26 – 3.37 0.94 141.2 139.0 – 143.7 1.27
155 8.11 2.88 2.78 – 3.09 2.80 185.3 174.0 – 191.1 2.25
156 8.07 2.52 2.48 – 2.54 0.83 174.2 171.2 – 176.1 0.88
157 8.10 2.89 2.76 – 2.96 2.30 181.9 177.5 – 186.0 1.84
158 8.10 2.81 2.59 – 3.00 2.87 176.5 152.9 – 187.6 5.66
159 8.16 2.90 2.78 – 3.07 2.50 174.4 162.8 – 185.5 3.65
160 8.11 2.83 2.73 – 2.88 1.47 181.6 177.1 – 185.8 1.52
Roche 8.11 2.58 2.57 – 2.60 0.51 169.7 168.3 – 171.2 0.62
MA 061 8.08 2.59 2.55 – 2.63 0.62 170.7 168.1 – 173.0 0.66
MA 064 8.07 2.65 2.61 – 2.70 0.78 170.3 166.9 – 173.6 0.93
Actavis 8.10 2.71 2.66 – 2.78 0.92 173.6 168.6 – 178.6 1.66
Teva 8.10 2.59 2.52 – 2.67 1.17 175.7 167.1 – 179.0 1.14
Wockhardt 8.07 2.28 2.21 – 2.41 1.90 153.6 148.3 – 163.3 1.90

78
Figure 3.5a Bar chart showing the range of diameters measured from illicit cases of ‘diazepam’ (1)
tablets.
.
Figure 3.5b Bar chart showing the range of diameters measured from pharmaceutical batches of
diazepam (1) tablets.
Figure 3.5 Bar chart showing the diameters of illicit and pharmaceutical batches of tablets.
0
1
2
3
4
5
6
7
8
9
10
5.53 5.56 5.59 7.11 7.12 7.99 8.03 8.04 8.05 8.06 8.07 8.08 8.09 8.1 8.11 8.12 8.13 8.14 8.15 8.16 8.22
Nu
mb
er o
f C
ases
Diameter (mm)
Diameter of Tablets in Illicit Cases
0
0.5
1
1.5
2
2.5
8.07 8.08 8.1 8.11
Nu
mb
er o
f B
atch
es
Diameter (mm)
Diameter of Tablets in Pharmaceutical Batches

79
Figure 3.6a The RSD of depth and weight within cases of illicit tablets.
Figure 3.6b The RSD of depth and weight within cases of illicit tablets.
Figure 3.6 Scatter graphs comparing the Relative Standard Deviation (%) in depth and weight
within batches of illicit and pharmaceutical tablets.
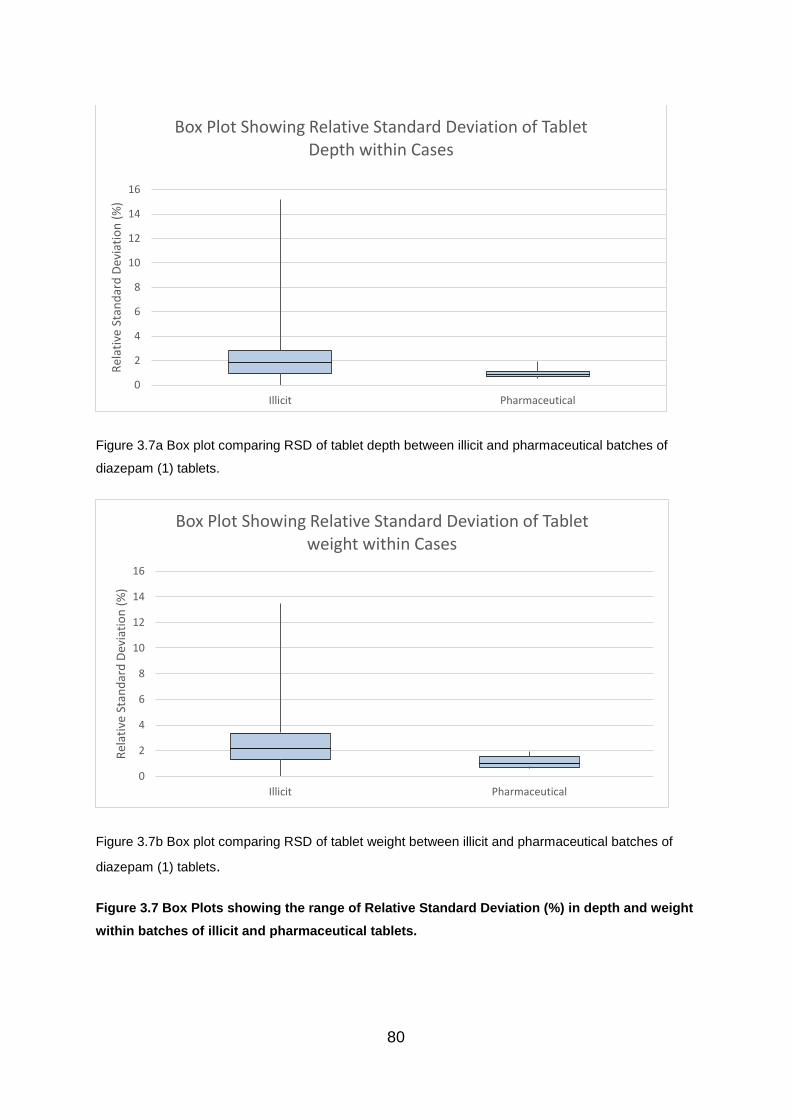
80
Figure 3.7a Box plot comparing RSD of tablet depth between illicit and pharmaceutical batches of
diazepam (1) tablets.
Figure 3.7b Box plot comparing RSD of tablet weight between illicit and pharmaceutical batches of
diazepam (1) tablets.
Figure 3.7 Box Plots showing the range of Relative Standard Deviation (%) in depth and weight
within batches of illicit and pharmaceutical tablets.
0
2
4
6
8
10
12
14
16
Illicit Pharmaceutical
Rel
ativ
e St
and
ard
Dev
iati
on
(%
)Box Plot Showing Relative Standard Deviation of Tablet
Depth within Cases
0
2
4
6
8
10
12
14
16
Illicit Pharmaceutical
Rel
ativ
e St
and
ard
Dev
iati
on
(%
)
Box Plot Showing Relative Standard Deviation of Tablet weight within Cases

81
3.5.3.1 Tablet Diameter
As shown in Table 3.2 and Figure 3.5 all of the pharmaceutical tablets had a
diameter measuring between approximately 8.05 - 8.12 mm, with little variation due
to the fixed size of the dyes used and allowing for errors of measurement.
In comparison, there was much more variation between the measurements
generated by the illicit tablets. Cases 23, 78, 90 had a much smaller diameter at
around 5.5 mm. These tablets were all marked MSJ, with a half score on the
reverse and were found to contain approximately 9 – 10 mg diazepam (1).
Cases 127, 128, 153 and 154, also bore the MSJ marking but with a plain reverse,
all had a diameter measuring around 7.11 – 7.12 mm, a depth of between 3.31 -
3.33 mm and mean weight of 141 mg. The highest RSD for these four cases was
1.74% for the weight of Case 128 and 2.07% for the depth of the same case
however, it is worth noting that this is still within the ±7.5% range permitted within the
pharmaceutical industry. Notably, these tablets were also marked MSJ but were
coated, convex shaped tablets that were very different in appearance to Cases 23,
78 and 90. However, analysis by gas chromatography – mass spectrometry (GC-
MS) later revealed that these tablets contained promethazine as the active drug
substance.
Visually the two groups of tablets with the MSJ marking were well made. It was the
markings on the tablets and difference in shape and size that identified these tablets
as being illicit for the UK market. However, they do have the potential of being
pharmaceutically manufactured for use in other countries, since it is not possible to
check the markings of all legitimate tablets produced for the rest of the world
markets. However, research has shown that MSJ Industries is a subsidiary
company of J.L. Morison Son & Jones (Ceylon) plc., which is a legitimate
pharmaceutical company producing tablets in Asia and Scandinavia
(Substance.org.uk, 2017). However, information regarding the types of tablets
manufactured is difficult to obtain.
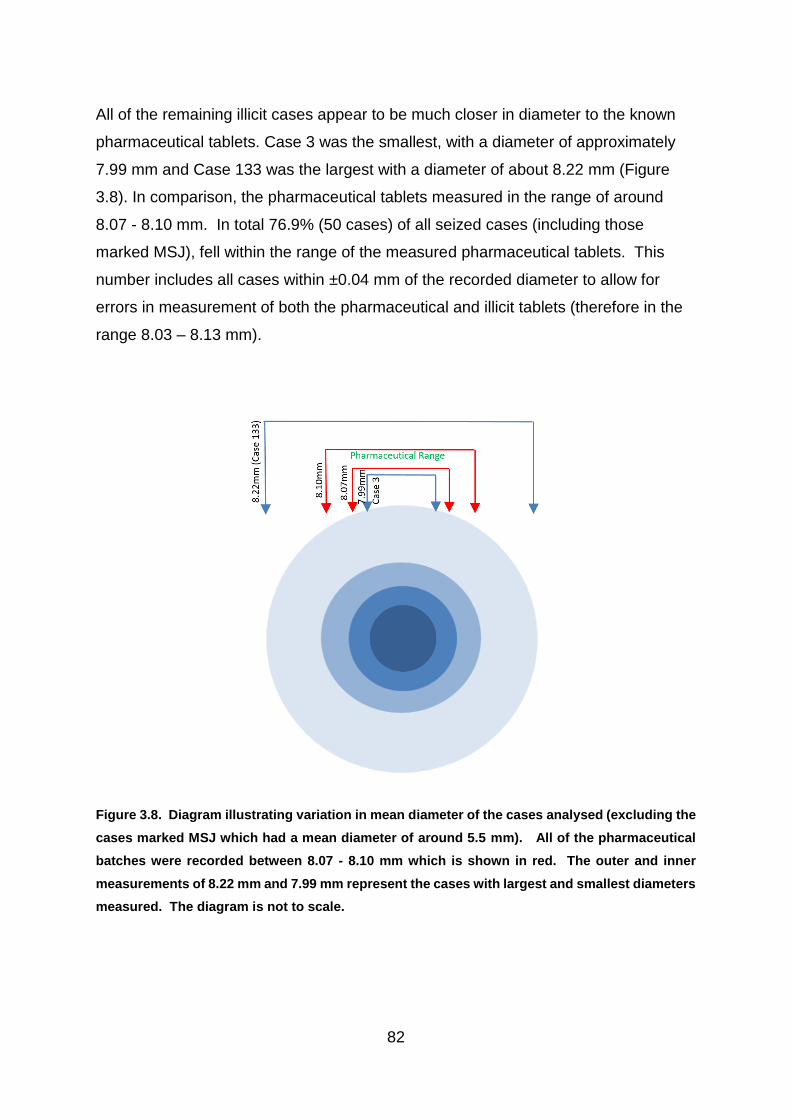
82
All of the remaining illicit cases appear to be much closer in diameter to the known
pharmaceutical tablets. Case 3 was the smallest, with a diameter of approximately
7.99 mm and Case 133 was the largest with a diameter of about 8.22 mm (Figure
3.8). In comparison, the pharmaceutical tablets measured in the range of around
8.07 - 8.10 mm. In total 76.9% (50 cases) of all seized cases (including those
marked MSJ), fell within the range of the measured pharmaceutical tablets. This
number includes all cases within ±0.04 mm of the recorded diameter to allow for
errors in measurement of both the pharmaceutical and illicit tablets (therefore in the
range 8.03 – 8.13 mm).
Figure 3.8. Diagram illustrating variation in mean diameter of the cases analysed (excluding the
cases marked MSJ which had a mean diameter of around 5.5 mm). All of the pharmaceutical
batches were recorded between 8.07 - 8.10 mm which is shown in red. The outer and inner
measurements of 8.22 mm and 7.99 mm represent the cases with largest and smallest diameters
measured. The diagram is not to scale.
83
3.5.3.2 Tablet Depth
The difference in range of tablet depth is visualised in Figures 3.6 and 3.7a. The
whiskers of the box plot (Figure 3.7a) highlight the large difference in RSD range,
while the lower median and smaller variability recorded from the pharmaceutical
tablets is also demonstrated.
The depth of the pharmaceutical tablets varied in range from approximately 2.59 -
2.71 mm, with the exception of the tablets manufactured by Wockhardt which had a
mean depth of about 2.28 mm. The Wockhardt tablets were the thinnest of all cases,
with Case 81 measuring a similar size given the potential error of measurement of
±0.04 mm and showing a recorded mean thickness of approximately 2.29 mm.
Interestingly the marking of CP | D10 present on the tablets in Case 81 is consistent
with the logo used by the pharmaceutical company Wockhardt UK.
The MSJ marked cases 90 and 78 were the next smallest tablets measuring
approximately 2.38 mm and 2.42 mm respectively. These cases were discussed
above in section 3.4.3.1 (tablet diameter) regarding their potential to be
pharmaceutically manufactured outside the UK for a foreign market. However, in
this instance, Case 23, which had a comparable diameter to cases 90 and 78, was
recorded as having a greater mean depth of around 2.8 mm, which presents a
potentially significant variation.
The pharmaceutical batch with the largest mean depth were manufactured by
Actavis and had a mean thickness of approximately 2.71 mm. 41 illicit cases had a
recorded mean depth above this, with only 36.9% (24 cases) falling within the range
2.24 – 2.75 mm and allowing for the ±0.04mm error of measurement (Figure 3.9).
The case with the largest mean depth was Case 3, measuring approximately 3.55
mm.

84
Figure 3.9. Diagram illustrating variation in mean depth of the cases analysed. All
pharmaceutical tablets fell between the two red lines marked by the Actavis and Wockhardt
batches. Twenty-four of the illicit cases also fell within this range but the majority (41 cases)
appeared to be deeper tablets than the pharmaceutical products made for the UK market, that
were measured within this project. The diagram is not to scale.

85
3.5.3.3 Tablet Weight
The difference in range of tablet weight is visualised in Figures 3.6 and 3.7b. The
whiskers of the box plot (Figure 3.7b) demonstrate that greater variability was
measured between the illicit tablets, while the lower median of the pharmaceutical
tablets is also shown.
The known pharmaceutical tablets all weighed between approximately 153 – 176
mg. The heaviest were the tablets produced by Teva with a mean weight of
approximately 175.7 mg and the lightest were the tablets manufactured by
Wockhardt, which were considerably thinner and had a mean weight of about 153.6
mg. Based on the mean weight of pharmaceutical tablets manufactured by
Wockhardt and Teva to provide a boundary and calculated with the permitted ±7.5%
deviation, it was found that 66.1% (43 cases) of the sixty-five illicit cases fell within
the acceptable range of 140 - 190 mg, allowing for errors of measurement of ±0.1
mg.
The lightest tablets were cases 90, 78 and 23, which were marked MSJ and had a
mean weight between 73 – 75 mg. This corresponds with them having the smallest
diameter and thickness. These tablets are not licensed for the UK market and it is
unknown whether these tablets are pharmaceutically manufactured outside the UK.
No legitimate tablets are available for comparison.
The lightest pharmaceutical tablets, which were manufactured by Wockhardt, had a
mean weight of approximately 153.6 mg. The only illicit cases that bore the CP logo
used by Wockhardt were cases 10 and 81. Case 10 contained tablets with a range
from 158.5 – 161.9 mg, and a mean weight of 160.2 mg and Case 81 had a mean
weight of 153.7 mg, with a range of 150.5 – 158.9 mg. Both of these cases were
within the permitted ±7.5% range of deviation for weight. Case 81 had only a 0.01
mm difference in both diameter and depth from the pharmaceutical tablets and Case
10 was slightly deeper giving it a heavier weight but both tablets fell within the
pharmaceutical criteria, making them consistent with the Wockhardt products in
terms of physical characteristics. This suggests both cases 10 and 81 have the

86
potential to be pharmaceutically manufactured but diverted into the illegal supply
chain.
Cases 4, 5, 14, 25, 84, 85, 131, 134, 137, 152 each had a mean weight of over 210
mg and were too heavy to be pharmaceutical tablets produced for the UK market,
when compared to the data produced by the legitimate tablets tested. Interestingly,
the later six cases, which had mean weights in the range of 223 – 245 mg were all
marked 1/0 and were found to contain phenazepam (16) (Chapter 4 – GCMS).
Cases 4 and 14 with the MA & D/10 markings also contained phenazepam (16) but
had a slightly lower mean weight of approximately 220.5 mg and 213.3 mg
respectively.
The only ‘heavy’ tablets which contained diazepam (1) were cases 5 and 25, which
each had a mean weight between 214 – 216 mg and were both marked MA |D/10.
Correspondence with MA Pharmachem indicated that their tablets should weigh
between 165 - 175 mg. In total, twelve of the illicit cases with the corresponding MA
| D/10 marking were found to weigh within this range (Figure 3.10). These were
cases 2, 13, 16, 24, 29, 30, 74, 79, 82, 83, 86 and 159. The remaining twelve cases
with the MA logo had a mean weight above this level.
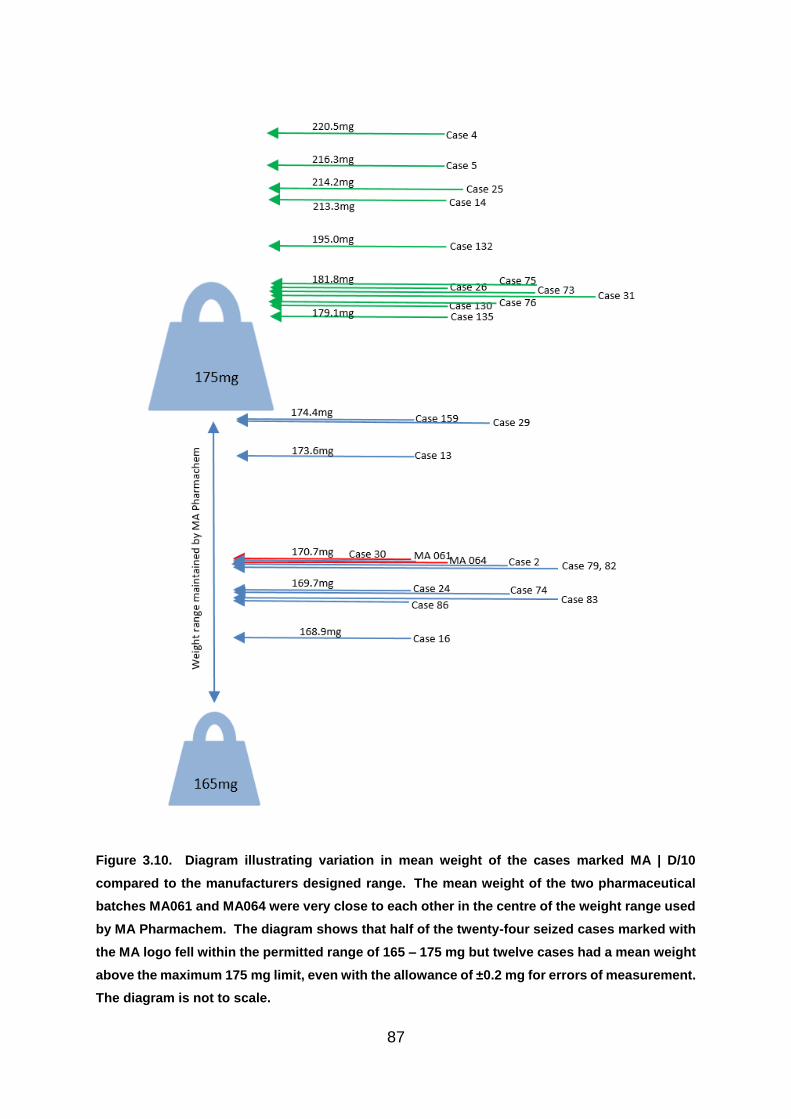
87
Figure 3.10. Diagram illustrating variation in mean weight of the cases marked MA | D/10
compared to the manufacturers designed range. The mean weight of the two pharmaceutical
batches MA061 and MA064 were very close to each other in the centre of the weight range used
by MA Pharmachem. The diagram shows that half of the twenty-four seized cases marked with
the MA logo fell within the permitted range of 165 – 175 mg but twelve cases had a mean weight
above the maximum 175 mg limit, even with the allowance of ±0.2 mg for errors of measurement.
The diagram is not to scale.

88
Any comparison becomes more complicated however, due to the regulations laid
down in the pharmacopoeia. The criteria states that in testing twenty units, up to two
tablets can deviate in mass by up to 15% for tablets that weigh between 80 – 250 mg
(British Pharmacopoeia, 2008). This would allow two of the tablets produced by MA
Pharmachem, for example, to weigh between 144.5 - 195.5 mg. In reality however,
manufacturers tend to be more precise than this, with the samples tested having a
RSD of less than 1%.
Case 9 contained tablets with an approximate weight in the range of 179.1 – 226 mg
and the largest RSD of 13.5%. As this case is imprinted with the STADA logo, it is
not manufactured for the UK market. However, the high level of variation indicates
little consistency in the tablet manufacture and therefore suggests that this case is
unlikely to be pharmaceutically manufactured.
3.5.4 Comparison of Results
By comparing the physical data generated by the illicit cases against those of the
pharmaceutical batches, the indications are that some of the cases could have the
potential to have been manufactured by pharmaceutical companies and diverted into
the illegal supply chain. The results of the comparison of physical data is shown in
Figure 3.11 and demonstrates that only fourteen of the of the 65 seized cases
demonstrated similarity to the pharmaceutical tablets in all three measurements.
Cases 3 and 23 did not replicate any of the pharmaceutical characteristics.
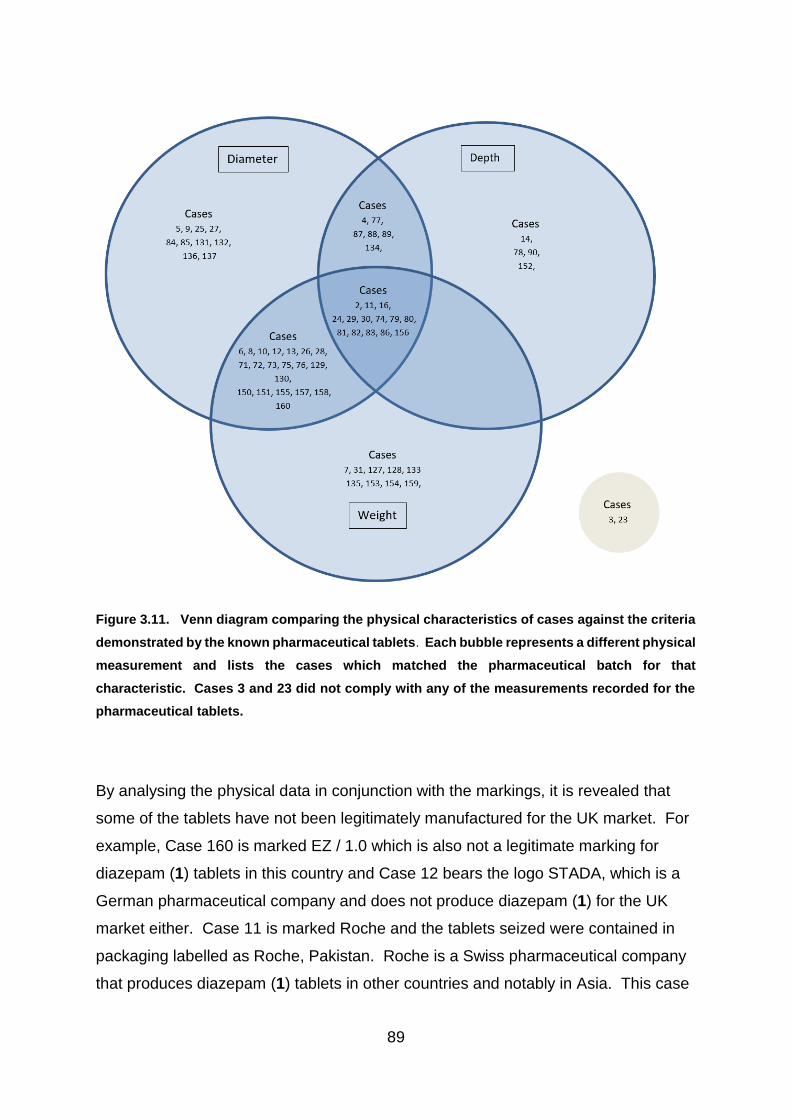
89
Figure 3.11. Venn diagram comparing the physical characteristics of cases against the criteria
demonstrated by the known pharmaceutical tablets. Each bubble represents a different physical
measurement and lists the cases which matched the pharmaceutical batch for that
characteristic. Cases 3 and 23 did not comply with any of the measurements recorded for the
pharmaceutical tablets.
By analysing the physical data in conjunction with the markings, it is revealed that
some of the tablets have not been legitimately manufactured for the UK market. For
example, Case 160 is marked EZ / 1.0 which is also not a legitimate marking for
diazepam (1) tablets in this country and Case 12 bears the logo STADA, which is a
German pharmaceutical company and does not produce diazepam (1) for the UK
market either. Case 11 is marked Roche and the tablets seized were contained in
packaging labelled as Roche, Pakistan. Roche is a Swiss pharmaceutical company
that produces diazepam (1) tablets in other countries and notably in Asia. This case

90
was consistent with all of the physical characteristics demonstrated by the UK
pharmaceutical tablets but is not a licensed product for the UK market.
Cases need to be compared to the pharmaceutical tablets bearing the same logo.
Case 81 only weighs 153.7 mg, however it bears the logo of Wockhardt and is
consistent with their pharmaceutical tablets. Case 10 also bears the Wockhardt logo
but recorded a greater depth when measured, at 2.88 mm. Although this tablet fell
outwith the range of depths recorded for the entire batch of Wockhardt tablets, in this
study, it may be that differences between batches, or tablets produced in different
factories have slight inconsistencies, such as a variation in pressure which could
affect tablet depth. In addition, they may be pharmaceutically manufactured tablets
that were rejected, as they met the criteria of diameter and weight. Another
possibility is that tablets in Case 10 were affected by storage conditions. Therefore
variation in one measurement may not entirely discount the case from being of
pharmaceutical origin.
Likewise, allowing for errors of measurement, Case 133 could be described as
consistent with tablets produced by Actavis. The small differences in weight and
diameter of 0.07 mg and 0.12 mm respectively, above the largest and deepest tablet
in the pharmaceutical batch, may be due to errors of measurement. However, it was
recorded that the relative standard deviations in both depth and weight between all
of the tablets in the seized case were greater, at 4.98% and 2.94%, than the
pharmaceutical batch which recorded levels below 1% for each measurement.
Case 156 bearing markings consistent with tablets manufactured by Teva, was also
consistent with tablets from the pharmaceutical batch. Case 80, marked Tensium,
which produces legitimate diazepam (1) tablets for the UK market, recorded
measurements consistent with all of the pharmaceutical criteria used in this study.
Ten cases appeared to be consistent with MA Pharmachem tablets according to
their physical measurements (cases 2, 16, 24, 29, 30, 74, 79, 82, 83, 86).

91
3.6 Conclusion
The results of the physical analysis of the tablets was found to be an important part
of the project. The tablet markings were an integral part of the analysis and were
assessed in conjunction with the physical measurements. Data generated was
shown to be valuable for determining whether tablets may have been
pharmaceutically manufactured, emphasising the benefits of this new research.
The analysis of physical measurements and comparison to known pharmaceutical
tablets has not previously been explored with illicit blue tablets. This new research
revealed both similarities and variances between different cases in the illegal supply
chain and also to those of pharmaceutical origin. By comparing the tablets to
pharmaceutical diazepam (1) tablets and exploring the data statistically, using box
plots, the level of variation in measurements was highlighted giving insight into
differences in consistency between pharmaceutical and illicit tablets and increasing
our understanding of illicit manufacturing processes.
The findings of the physical investigation proved that some of the tablets could be
identified as being of illicit origin because they were too heavy or of the wrong size.
Measurements can therefore be used to differentiate between legitimate and
illegitimate tablets in some of the cases. The use of box plots further revealed the
amount of variation within the illicit and pharmaceutical batches and clearly indicated
that many of the illicit cases contained tablets which had greater inconsistency in
weight and depth. Thus indicating that a simple test into levels of variation may
provide an important initial step into the origins of seized cases.
Similarities in physical characteristics, such as imprint details and diameter could
also reveal potential similarities between cases, or even to pharmaceutical
manufacturers. The similarities indicated that some of the seized cases may have
been diverted into the illegal supply chain. Chemical analysis of the tablets, through
HPLC, GC-MS and DSC later revealed that some of the potential pharmaceutical
tablets contained varying levels of diazepam (1) or different active drug substances
altogether and enabled further separation of cases begun through the physical
analysis.
92
The comparison of the physical information brought to light potential similarities or
links between some of the cases providing an important first step in differentiation
between groups of tablets. The next step was therefore to ascertain chemical
information regarding the illicit cases which could then be explored in conjunction
with the knowledge gained by analysis of the physical characteristics. The combined
results of physical and chemical tests were then analysed in further statistical tests
(See Chapter 7 – Statistical Cluster Analysis).

93
4.1 Chapter Summary
Where sufficient tablet numbers allowed, Gas Chromatography-Mass Spectrometry
(GC-MS) analysis was performed on at least one tablet from each of the cases in
order to determine the main active drug substance present. Although the street
samples were believed to be sold as 10 mg diazepam (1) tablets and were blue in
colour, the origin of the tablets was unknown and therefore the actual content was
also uncertain. In addition, any tablets containing diazepam (1) were not necessarily
going to be of pharmaceutical origin.
The total ion chromatograms of all case samples were compared to retention time
(Rt) and mass ions produced from purchased certified standards analysed using the
same method conditions. Following this process allowed likely identification of the
main drug substance to be made in each analysed tablet. Known pharmaceutical
diazepam (1) standards were also run as part of the sequence, to determine any day
to day drift present in Rt and on-going accuracy of the mass spectrometry detector.
Standards were run both at the beginning and end of each run sequence.
4.2 Introduction
Gas Chromatography (GC) is an effective analytical technique used for separating a
mixture of volatile organic compounds in a sample and when coupled with Mass
Spectrometry (MS), structural information about many of the components present
can be gained from the mass ions present. This technique was therefore used to
provide valuable information regarding the main organic components present in the
illicit blue tablets under examination. While the sensitivity of the method is
determined by the limit of detection for each compound in question, in this instance,
provided an active drug substance was detected in each tablet then limit of detection
determination was not carried out. HPLC analysis was performed (Chapter 5) to
determine the amount of main drug substance present indicated through GC-MS
analysis.

94
The work performed in this project is important because no reports have previously
been published on GC-MS analysis of illicit blue tablets with markings consistent with
diazepam (1) tablets. This may be partly because of the large numbers of
pharmaceutical tablets that were being diverted into the illegal supply chain, as
described by the Advisory Council on the Misuse of Drugs (2016). However,
previous work using GC-MS to confirm the identity of benzodiazepines has been
performed on unknown powders and body fluids or wastewater, to investigate drug
consumption (Papoutsis et al., 2012; Boumba et al., 2016; Fatta-Kassinos, Meric and
Nikolaou, 2011).
4.2.1 Analysis of Benzodiazepines
4.2.1.1 Analysis of Impurities
GC-MS has been used widely in the pharmaceutical industry to analyse impurities
(Hiriyanna and Basavaiah, 2008). The impurities in a formulated tablet include
everything that is not the active drug substance, and can include precursors of
synthesized substances, degradation products, reaction specific impurities and
excipients (Stawny, Piekarski and Marciniec,2016).
In forensic science, impurities are analysed to identify the by-products of drug
synthesis (Power et al., 2013). For example, GC-MS is often used to investigate
impurities found in tablets such as MDMA, because identification can give an
indication of the method of synthesis, thus providing information that can potentially
link cases. However, GC-MS can also identify other active drug substances present
in the illicit tablets. An investigation into both the impurities and active drug content of
ecstasy tablets in Hong Kong (Cheng et al., 2006) revealed that although many
tablets had varying quantities of MDMA, others also contained a mixture of MDMA
with MDA (3,4-methylenedioxyamphetamine) and methamphetamine (MA) and
seven of the 89 tablets analysed were identified as containing ketamine in levels
varying between 1 – 50 mg. Such information may help link the manufacture of
different batches of tablets, as it relates to formulations and manufacturing
processes used. It was therefore suggested that ketamine may have been present
95
due to cross contamination from the production of other illicit ketamine tablets, which
is widely abused in Hong Kong.
Similarly, although the primary purpose of GC-MS analysis in this project was to
identify the main active drug substance present in the tablet, on occasion quantities
of other active substances, such as paracetamol were identified in some of the
tablets containing phenazepam (16). This could therefore indicate that these
phenazepam (16) tablets form a distinct group produced by an illicit manufacturer
who included paracetamol in their formulation, or as a result of contamination from
other products containing paracetamol which were manufactured within the same
clandestine laboratory. However, due to the low levels of active drug substance
present in most benzodiazepine tablets, the levels of reaction specific impurities and
degradants would be extremely low, making detection very difficult. Therefore,
linking synthetic benzodiazepines based on their impurities is less practical.
4.2.1.2 Derivatisation of Benzodiazepines
Analysis should be performed on the original substance when possible in order to
prevent the appearance of additional impurities and to avoid complications through
incomplete derivatisation, particularly if the technique is used quantitatively. Many
benzodiazepines such as diazepam (1), chlordiazepoxide (3), nordiazepam (14),
flurazepam (9) and alprazolam (2), are volatile and do not require derivatisation
(Levine, 2003) and can be analysed by GC-MS directly after extraction in methanol
(M. D. Cole, 2003). One of the main excipients added to pharmaceutically produced
diazepam (1) tablets for the UK market, is lactose (Chapter 2 Introduction, Section
2.2.4 Excipients) which is ‘very slightly soluble in alcohol’ (National Center for
Biotechnology Information, 2017). Therefore, after extraction into methanol, the
samples were filtered to remove any insolubles prior to filling the sample vials for
analysis to prevent interference.
Derivatisation of the more polar benzodiazepines and their metabolites by silylation
of active hydrogens, acylation of the polar functional groups or alkylation with amine
hydrogens and acidic hydroxyl groups can lower the Rt caused through adsorption

96
on the stationary phase in some columns and may prevent thermal degradation of
polar compounds (Levine, 2003; Kyle, 2017; Blachut et al., 2004).
A ZB-5MS column was used for the analysis in this project. The 5 % - phenyl-arylene
phase incorporated into a polymer of 95% dimethylpolysiloxane creates a complex
network making interaction with the stationary phase more difficult and allowing
preferential access based on compound shape. Therefore, the limited access
causes stronger adsorption to the stationary phase, thus allowing greater resolution
of structures such as multi-ring aromatic compounds, like benzodiazepines
(Phenomenex, 2014).
4.2.1.3 Thermal Degradation of Benzodiazepines
A major consideration when carrying out GC-MS is the thermal stability of the
compounds likely to be under investigation. Instability of some substances can
result in rearrangement of the molecules and degradation. Functional groups
containing active hydrogens, including the hydroxyl group (as in Oxazepam 15 which
is an active metabolite of diazepam 1) and amine group (as in Chlordiazepoxide 3)
can reduce volatility and are thermally unstable. Peak broadening may also occur
due to interactions with the stationary phase (Danielson, Gallagher and Bao,2000;
Lin et al., 2008). As the tablets analysed in this project were illicit, the active drug
substance present and its thermal stability was therefore unknown. However,
chlordiazepoxide (3) was identified in one of the cases tested (case 136) and
multiple peaks were produced due to thermal degradation.
Some benzodiazepines may be thermally unstable during GC-MS analysis. A study
of sixteen benzodiazepines using capillary gas chromatography related thermal
degradation directly to the chemical structure of the drugs (Joyce et al., 1984). It
was found that nine of the sixteen benzodiazepines tested were thermally unstable.
This included ketazolam (10), which decomposed to diazepam (1) (Figure 4.1),
making identification of ketazolam (10) and the presence of any diazepam (1) difficult
by GC-MS alone. Therefore, for this project, the tablets identified as containing
diazepam (1) by GC-MS were also analysed by HPLC, along with both ketazolam
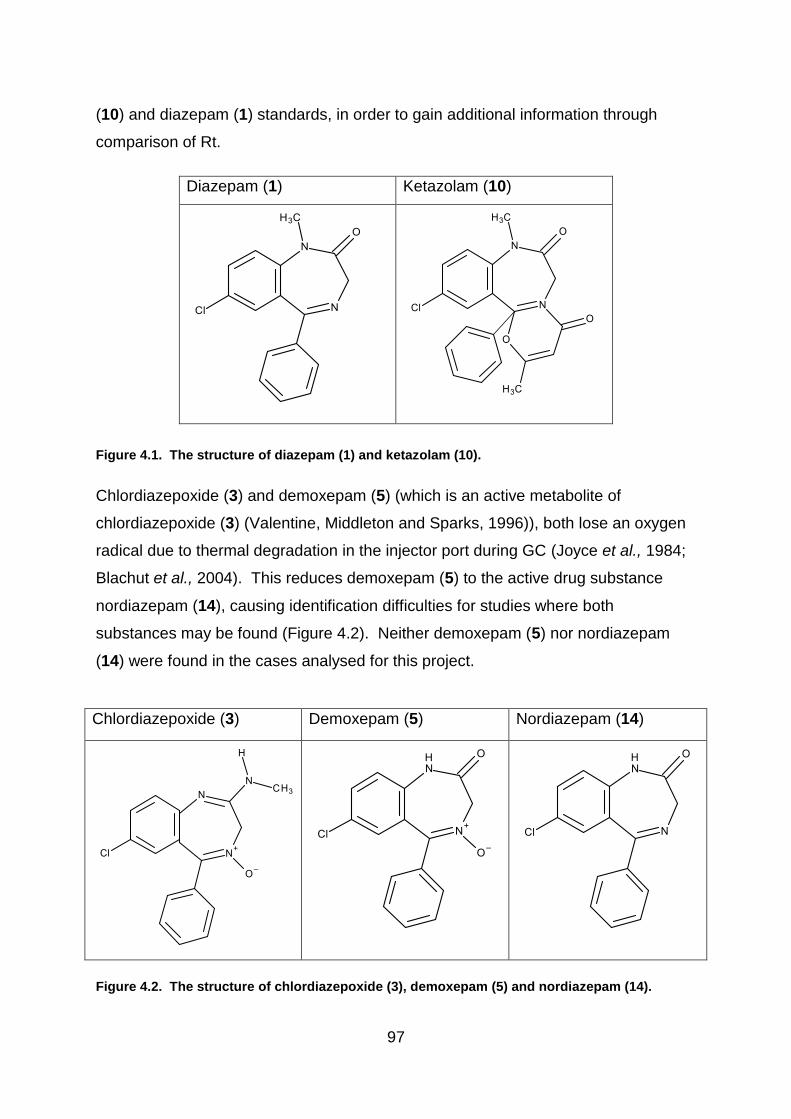
97
(10) and diazepam (1) standards, in order to gain additional information through
comparison of Rt.
Diazepam (1) Ketazolam (10)
Figure 4.1. The structure of diazepam (1) and ketazolam (10).
Chlordiazepoxide (3) and demoxepam (5) (which is an active metabolite of
chlordiazepoxide (3) (Valentine, Middleton and Sparks, 1996)), both lose an oxygen
radical due to thermal degradation in the injector port during GC (Joyce et al., 1984;
Blachut et al., 2004). This reduces demoxepam (5) to the active drug substance
nordiazepam (14), causing identification difficulties for studies where both
substances may be found (Figure 4.2). Neither demoxepam (5) nor nordiazepam
(14) were found in the cases analysed for this project.
Chlordiazepoxide (3) Demoxepam (5) Nordiazepam (14)
Figure 4.2. The structure of chlordiazepoxide (3), demoxepam (5) and nordiazepam (14).

98
A report by the United Nations Office on Drugs and Crime (UNODC) (2012) noted
that chlordiazepoxide (3), temazepam (19) and lormetazepam (12), produce multiple
peaks in the GC chromatogram. Although the report notes that three peaks were
detected from the chlordiazepoxide (3) sample, no further information regarding the
resulting spectra was provided.
A study by Hida et al (1999), into thermal desorption gas chromatography (TDGC) of
benzodiazepines investigated differences in thermal stability of the various drug
substances. The results indicated that benzodiazepines which demonstrated melting
and decomposition temperatures that were considered closer together, such as
chlordiazepoxide (3), tended to produce multiple peaks. The results of the TDGC
recorded a melting temperature for chlordiazepoxide (3) of 242.7 oC and a
decomposition temperature of 284.2 oC, resulting in seven peaks being produced.
This compares to diazepam (1) with a greater difference in melting and
decomposition temperatures of 132.3 oC and 282.9 oC respectively, which resulted in
just one peak. Therefore it is important to find a balance whereby the temperature is
high enough to vaporise the sample while sufficiently low to limit degradation.
Previous GC-MS analysis of benzodiazepines by Joyce et al (1984) and Blachut et al
(2004) used different temperature programmes. Joyce set an injection temperature
of 270 oC and the oven temperature was ramped from 50 oC at a rate of 30 oC / min
to 260 oC. Blachut used an injector temperature of 250 oC and the initial oven
temperature of 110 oC was maintained for 2 minutes before increasing by 15 oC / min
up to 255 oC. The ramp rate was then decreased to 8 oC / min up to 300 oC and
maintained for 5 minutes.
As Rt vary according to conditions and temperature, UNODC recommend that when
GC-MS is used for the examination of benzodiazepines and barbiturates, all samples
should be tested alongside certified standards on the same instrument and under the
same conditions. (United Nations Office on Drugs and Crime, 2012). However, it is
important to note that in some cases where new psychoactive drug substances have
been used, certified standards may not always be available for purchase. Although
this was not the case in this project, it may impact on the certainty of the drug
substance identification by GC-MS alone.
99
4.2.2 Application of GC-MS to the Analysis of Illicit Drug Samples
A paper by Morelato et al. (2014) discussing how illicit drugs were examined in
Australia focussed on prioritising a simple, relatively quick method of analysing
MDMA seizures for intelligence purposes. The aim was to determine which methods
of analysis would provide the best intelligence on links between seizures in the
shortest time. The data came from 54 cases of seized tablets, divided into three
groups: i) those known to be linked; ii) those suspected of being linked; and iii) those
where no connection was evident. The results indicated that greater discrimination
between cases was achieved through GC-MS analysis and that although using a
combination of techniques provided more information, GC-MS could be prioritised in
order to provide information quickly for purely intelligence purposes. However, the
greater concentration of active drug substance which is often present in MDMA
tablets, also results in an increase in the detection of process impurities.
Consequently this is not suitable for “diazepam” (1) tablets, because the larger
sample size required to pick up low levels of impurities may result in overloading the
detector and obscuring the data actually being sought. They also studied GC-MS
peak areas of the active drug substance and compared impurities. Although forty
organic impurities were detected in the samples, an investigation was performed to
determine whether analysis of a reduced number of the impurities could be as
effective while reducing experimental time. The results indicated that analysis of all
impurities was significantly more effective thus reducing the numbers could not be
scientifically justified.
Due to GC-MS enabling identification of compounds in small samples, this technique
was used to confirm the main active drug substance present in the illicit blue tablets
analysed in this study. On occasion, the main organic excipients, such as stearic
and palmitic acid, which are often found in tablets, were also detected in some of the
samples. Due to the relatively small amount of active drug substance present
though, the lower levels of organic impurities were likely to remain undetected. In
addition, a limitation of this project is the possibility that low levels of other active
drug substances have gone unrecorded. However, as the aim of the project was to
compare data from a variety of chemical and physical techniques, in order to explore
potential links between the illicit batches, it was believed that identification of the

100
main active drug substance was sufficient for this investigation. The objective was
not to provide a detailed analysis of each tablet but, that the results of the GC-MS
would be supported by diazepam (1) quantification through HPLC and thermal
analysis by DSC, to further explore the excipients to reveal similarities and
differences between the illicit batches. For example, although Case 137, produced a
peak consistent with phenazepam (16), another peak with a Rt of 10.78 minutes was
detected with a suggested similarity of 97.28% to caffeine, according to the National
Institute of Standards and Technology (NIST) library (Number 14), however this was
not verified by analysing a standard.
4.2.2.1 Mass Spectrometry
It has been noted that the presence of the halogen in benzodiazepines is particularly
suited to analysis with an Electron Capture Detector (Levine, 2003; Pirnay et al.,
2002). Fitzgerald et al. (1997) chose diazepam (1) as the model compound to
compare an ion-trap and a quadrupole mass spectrometer, using the same column
and heating program. Diazepam (1) was selected due to its ability to elute without
derivatisation, producing a good chromatographic peak shape and because of the
presence of an aromatic halogen. The pure drug sample was injected in an
unextracted state to avoid any interference from a matrix. The results revealed
differences between the two methods which were explained by greater sensitivity of
the ion-trap mass spectrometer and increased ion-ratio precision when the
quadrupole mass spectrometer was in selected ion mode.
For this project, a 5977E single quadrupole mass spectrometer was used for
detection. Pirnay et al. (2002) noted that the ion-trap detectors are not as reliable for
detecting all benzodiazepines and as the active drug substance present in the illicit
tablets was unknown, neither would the selected ion mode have been suitable.
Therefore, the detector was used to scan the range of ions with a mass-to-charge
ratio (m/z) between 40 - 600 amu.

101
4.3 Experimental
4.3.1 Instrumentation
The GC-MS analysis was performed on an Agilent 7820A gas chromatograph with a
5977E mass spectrometer using a ZB-5MS column with 30 mm x 0.25 mm inner
diameter and 0.25 µm film thickness (Phenomenex, Macclesfield, England).
4.3.2 Method of Analysis
A syringe and 4mm filter with 0.2 μm pore size was used to remove any undissolved
material before transferring the solutions into vials for analysis. The samples were
injected in a split-less mode and the injection port was held at 250 oC. The carrier
gas was helium, which was set at a constant flow rate of 1 mL / minute. The oven
programme was set at 50 oC for 2 minutes, then ramped at 15 oC / minute to 280 oC,
with the final temperature being held for 11 minutes. The ion source was maintained
at 230 oC and the detector was set to acquire spectra in the range of 40 - 600 amu.
The mass spectra were compared to certified drug standards, run at the beginning
and end of the same run sequence and with the NIST 14 mass spectral library
(NIST, Maryland, USA).
The above method for GC-MS benzodiazepine analysis method was taken from
Clarke’s Analysis of Drugs and Poisons and adapted for use in this project, based on
information described by the Home Office Forensic Science Service based at
Aldermaston (Joyce et al., 1984) and on research into the application of GC-MS to
the analysis of benzodiazepines (Blachut et al., 2004).
The method was amended three times (Methods 2, 3 and 4) for separating etizolam
(7) and triazolam (18), which were found to have similar retention times of 17.52
minutes for etizolam (7) and 17.59 minutes for triazolam (18) using the original
method.

102
Method 2 used an initial oven temperature of 50 oC, held for 2 minutes, ramped at 15
oC / minutes to 260 oC, held for 5 minutes, then ramped at 10 oC / minutes to 280 oC
and held for 10 minutes.
Method 3 had the initial oven temperature of 50 oC which was held for 2 minutes
The initial ramp rate was reduced by 5 oC /minute, to 10 oC / minutes to 260 oC,
which was held for 5 minutes and ramped at 10 oC / minutes to 280 oC. The
temperature was held for 10 minutes.
Method 4 set the initial oven temperature at 50 oC, held for 2 minutes and ramped at
10 oC / minutes to 230 oC. The temperature was held for 30 minutes, then ramped at
10 oC / minutes to 280 oC and held for 10 minutes.
4.3.3 Materials used in this Project
HPLC grade acetonitrile, diethyl ether and HPLC grade methanol were supplied by
Fisher Scientific (Loughborough, England). Chlordiazepoxide (3) (certified standard
1 mg / mL in methanol), diazepam (1) (certified standard 1 mg / mL in methanol),
etizolam (7) (certified standard 1 mg / mL in methanol), triazolam (18) (certified
standard 1 mg / mL in methanol), paracetamol (acetaminophen; 1 g analytical
standard), aspirin, (1 g analytical standard) and bupivacaine (1 g analytical
standard) were obtained from Sigma Aldrich (Gillingham, England). Ketazolam (10)
(certified standard 1 mg / mL in methanol) and phenazepam (16) (certified standard
1 mg / mL in methanol) were purchased from LGC (Middlesex, England). MA tablets
were supplied by MA Pharmachem Ltd (Bolton, UK); Wockhardt tablets were
supplied by Wockhardt UK Ltd (Wrexham, UK); Teva tablets were supplied by Teva
UK Ltd (Runcorn, UK); Actavis Tablets were supplied by Actavis Ltd (Barnstaple,
UK); and illicit blue tablets were obtained from Police Scotland.

103
4.3.4 Preparation of Standards
Standards of diazepam (1), ketazolam (10), phenazepam (16), etizolam (7),
triazolam (18), chlordiazepoxide (3), promethazine, aspirin and paracetamol were
prepared separately, from certified drug standards diluted with methanol to produce
a working stock solution of 0.1 mg / mL.
4ml of each 0.1mg / mL drug standard was pipetted into a separate 5ml flask. 1mL
of an internal standard of 0.1mg /mL bupivicaine solution used to make up to the
mark. Resulting in a flask containing 0.08 mg / mL drug standard and 0.02 mg / mL
bupivacaine.
Standards were analysed both individually and in combination with other drug
standards. Vials were prepared for analysis containing an equal combination of
diazepam (1), phenazepam (16), etizolam (7), triazolam (18) and bupivacaine all
taken from working stock solutions with the concentration of 0.1 mg / mL. Resulting
in a solution containing 0.02 mg / mL of each drug substance.
Additional vials were prepared with a combination of triazolam (18), etizolam (7) and
the bupivacaine internal standard by adding equal amounts of each 0.1 mg / mL
working stock solution resulting in 0.033 mg / mL of each drug in the final solution.
Vials were also prepared containing equal amounts of the 0.1 mg / mL phenazepam
(16), aspirin, paracetamol and bupivacaine standards, resulting in a solution
containing 0.025 mg / mL of each drug in the final solution.
The certified standards were run at the start and end of each sample sequence

104
4.3.5 Preparation of Samples
4.3.5.1 Preparation of Samples using Diethyl Ether
A single tablet from each case was quartered and one quarter of the tablet was
taken for analysis (or one eighth for cases indicated as containing over 20 mg of
diazepam (1) by HPLC analysis). The remaining three-quarters of the tablet was
retained for future experimentation.
The one quarter tablet was crushed in a folded piece of filter paper. The powdered
sample was added to a test tube containing dilute ammonia (2 M; 1 mL) and the test
tube was gently agitated to dissolve the tablet. Diethyl ether (2 mL) was added to
the test tube and it was gently agitated to facilitate the extraction of the sample into
the diethyl ether. A sample was taken from the upper diethyl ether layer and
transferred to a GC-MS vial using a Pasteur pipette prior to analysis.
4.3.5.2 Preparation of Samples using Methanol
A quarter (or eighth for cases containing over 20 mg of diazepam (1) by HPLC
analysis) of a tablet was crushed in a folded piece of filter paper. The powdered
sample was added to methanol (1 mL) a test tube. The test tube was gently agitated
to dissolve the drug substance. A syringe and 4mm filter with 0.2 μm pore size was
then used to filter any undissolved material before transferring the solutions into vials
for analysis.
4.3.5.3 Preparation of whole tablets using Methanol
A whole tablet from cases where no chromatographic peaks were found from smaller
samples (quarter tablets, using both methanol and diethyl ether extraction, then half
tablets), was individually crushed in a piece of folded filter paper and added to a test
tube. Methanol (2 mL) was added and the solution was agitated to dissolve the drug
substance and the sample was filtered into a GC-MS vial.

105
4.3.6 Overview of the GC-MS analysis performed
4.3.6.1 Benzodiazepines in Salt and Freebase Form
According to a report by the United Nations Office on Drugs and Crime (2012), the
majority of benzodiazepines encountered are in the free base form and likely to be
soluble in methanol alone, or on occasion, they may be in the form of a
hydrochloride salt or mesylate. For qualitative analysis, the report states that most
benzodiazepines are soluble in methanol, whether in free base / acid or salt form
and this was the recommended method for qualitative analysis (United Nations
Office on Drugs and Crime, 2012).
The tablets analysed in this study were illicit and therefore neither the active drug
substance present, nor their form, was known. Therefore, the drug substances
present in the illicit tablets were converted to their freebase form by adding dilute
ammonia and then extracted into diethyl ether. In addition, the illicit tablets were
also subjected to GC-MS after only being dissolved in methanol.
4.3.6.2 Sample size used for GC-MS Analysis
GC-MS is a sensitive technique and therefore a quarter or an eighth of a tablet was
initially used for analysis. This was to allow multiple experiments to be performed,
including initial drug identification by GC-MS, followed by a further run for
comparison alongside the certified standard; thus leaving the remaining portion for
DSC. Additional tablets from cases containing diazepam (1) were further analysed
by HPLC and these Rt compared with that of certified diazepam (1) and ketazolam
(10) standards as an additional consistency check. However, cases containing
etizolam (7) or phenazepam (16), such as cases 76 and 77, did not produce an
identifiable chromatographic peak on the GC-MS, when analysing a quarter tablet,
therefore the sample size was increased to a half tablet and then a whole tablet, as
required.
With the exception of the early cases, where only one or two tablets were available
for analysis. For cases where the active substance was not detected, the analysis
was repeated another two times, in case of inhomogeneity. When the active
106
substance remained undetected, a half tablet was analysed and then, when
unsuccessful, a whole tablet, when tablets numbers allowed. As little difference was
found in the results but more identifiable peaks were produced using methanol, this
was the method used for the whole tablet preparations.
4.3.6.3 Run sequence of Samples
Each run sequence of cases began with a blank to ensure there was no carry over
from previous runs. The blank was a vial of methanol when the tablet preparation
used methanol and a blank of diethyl ether when the preparation method used dilute
ammonia and diethyl ether.
The second vial in a sequence was a diazepam (1) standard in order to provide a
comparison and Rt for the sequence. This was followed by a blank in order to pick
up any carry over. In cases of carry over, which occurred on the initial analysis of
case 136 and the certified chlordiazepoxide (3) standard, the run time of the
sequence was lengthened.
Samples prepared from the illicit cases were then run, alternating with blanks until
the end of the sequence. Finally, a second diazepam (1) standard was run followed
by a blank to complete the sequence. The second standard ensured consistency of
the results and monitored drift. The Rt and spectra were compared between the
standards and the case samples to corroborate initial results suggested from the
mass spectral libraries to determine whether the certified standard did indeed
produce the same mass ions and Rt as the case samples. Only then, was the
identification accepted.
Diazepam (1) standards were run at the beginning and end of every sequence.
However, when samples did not have Rt or mass spectra which corresponded to the
diazepam (1) standard, a comparison was made to the NIST 14 library, to give a
tentative identification. The sample was then rerun with a vial of mixed standards
and a separate standard of the active substance suggested by the NIST 14 library, in
order to confirm similarities in Rt and mass ions using the same instrumentation and
methodology.

107
This method of analysis allowed a direct comparison of Rt and the mass ions to be
performed, for each of the illicit cases. The aim of the analysis was to provide an
identification of the main active drug substance present within each of the cases by
comparing results of the samples to certified standards and the NIST 14 library. As
drug substances were identified in all case samples and no quantification was
attempted using GC-MS, then, the limit of detection (LOD) and limit of quantification
(LOQ) for the GC-MS methodology were not carried out during this project.
4.3.6.4 Small Case Size
Some of the illicit cases analysed for this project contained only a small quantity of
tablets. The aim of the project was to characterise cases of illicit blue tablets and
build statistical models with the potential to differentiate between different groupings.
Since police seizures vary in size having valid statistical models that are appropriate
for small case numbers may be beneficial. However, this does mean at times that
the analysis performed has to be prioritised in order to gain the most useful
information. Initial screening results carried out by the Robert Gordon University
suggested that cases 7 and 10 contained diazepam (1). Although not enough
tablets were available for GC-MS analysis, samples from these two cases were
however, run alongside a diazepam (1) standard on the HPLC for quantification
purposes and remaining fragments were thermally analysed using differential
scanning calorimetry (DSC) in order to gain information about excipients.. In both of
these cases, the single chromatographic peak produced by the HPLC analysis
corresponded with the Rt of the diazepam (1) standard. The thermograms resulting
from DSC indicated that their thermal profiles were consistent with the presence of
diazepam (1). Therefore, an assumption has been made that both cases 7 and 10
contained diazepam (1).
Similarly, cases 4 and 14 were found to contain phenazepam (16) in screening tests
performed at Robert Gordon University. Again, HPLC analysis indicated that the
single chromatographic peak produced by samples from each of the two cases
corresponded to the Rt produced by the certified phenazepam (16) standard and
DSC thermograms were also consistent with phenazepam (16). Therefore, the
assumption was made that both cases 4 and 14 contained phenazepam (16).

108
4.4 Results and Discussion
The method used was intended to be a balance between those used in two previous
studies. The research by Blachut (2004) and Joyce (1984) both revealed thermal
degradation of the benzodiazepines, including complete degradation of ketazolam
(10) to diazepam (1) and decomposition of chlordiazepoxide (3) (See section 4.2.1.3.
Thermal Degradation). This may have been due to the higher injection temperature
set by Joyce and high oven temperature used by Blachut. The similarity of melting
and degradation temperatures as suggested by Hida (1999) indicated that lower
temperatures may limit some of the degradation. Therefore, for this project, an
injection temperature of 250 oC was used, the same as in Blachut’s research (2004)
but the lower oven temperature (from Joyce (1984)) was selected. It was ramped at
15 oC / min (the same as in Blachut’s study) but to 280 oC, a temperature between
the intermediate and higher levels previously used by Blachut. Both research
studies had used a split-less injection for the samples. Both split and split-less
injections were tested in this project, with no significant difference in the results,
other than the smaller peaks becoming more difficult to detect.
Analysis of individual standards was carried out in order to determine the relative Rt,
resolution and mass ions of the different active drug substances using the
methodology in this study and an internal standard of bupivacaine was used to
monitor relative Rt for drug substances. Additional vials containing a combination of
triazolam (18), etizolam (7) and the bupivacaine certified standards were also
analysed as part of the run sequence comprising of the unknown samples with Rt of
around 17 minutes. This was performed as an added comparison because of the
similarity in Rt between the triazolam (18) and etizolam (7) standards and because
etizolam (7) was not identified using the NIST 14 library. Identification was facilitated
by their respective mass ion fragmentation patterns.

109
Vials were also prepared containing equal amounts of phenazepam (16), aspirin,
paracetamol and bupivacaine standards as a comparison to samples which
produced peaks with a match of over 90% to phenazepam (16), paracetamol and
aspirin according to the NIST 14 library.
The certified standards were run at the start and end of each sample sequence to
demonstrate that there had been no significant drift in Rt during the run. The
standards produced distinct chromatographic peaks with mass ion fragmentation
patterns that corresponded well with the instrument mass spectral libraries. This
gave confidence that the method was capable identifying the active drug substances.
The results produced by the combined standards can be seen in Figure 4.3.
Differentiation between ketazolam (10) and diazepam (1) was supported by HPLC
analysis as the certified standards were found to produce peaks with different Rt,
whereas GC-MS alone, may result in ketazolam (10) undergoing thermal
degradation to diazepam (1) as detailed in paragraph 4.2.1.3 ‘Thermal degradation’
(above) and section 4.4.1 ‘Diazepam and Ketazolam’.

110
Figure 4.3. Chromatogram of the diazepam (1) standard compared to a sample of mixed
standards. The upper image is the diazepam (1) standard, and shows the two peaks produced
by the bupivacaine enantiomers at 13.17 and 13.72 minutes. The bottom image shows the
chromatogram produced by the mixed standards. The small broad peak at about 6.5 minutes
was not identified. The remaining peaks are from left to right, bupivacaine (Rt 13.72 minutes),
diazepam (1) (Rt 14.61 minutes), phenazepam (16) (Rt 15.95 minutes) and the unresolved peak
of etizolam (7) and triazolam (18) (17.52 and 17.59 minutes).
4.4.1 Diazepam and Ketazolam
Using the instrumentation and methodology stated above, analysis of the certified
diazepam (1) standard, demonstrated a 97.78% similarity to the NIST 14 library.
Comparison of the spectra produced by the standard revealed that the eight ions
with greatest abundance (m/z 256, 283, 221,165, 110, 77, 89, 177) were consistent
with the diazepam (1) spectrum recorded on the NIST 14 library. However, there
was a difference in the order of abundance between m/z 165 and 110. The certified
standard also demonstrated similar abundance between mass ions at 177 and 241,
therefore contributing to the slight discrepancy in similarity. These discrepancies
were likely to be a result of having different MS conditions on different machines.
The diazepam (1) spectra produced by the pharmaceutical tablets was consistent
with the certified standard, applying the methodology and equipment used in this
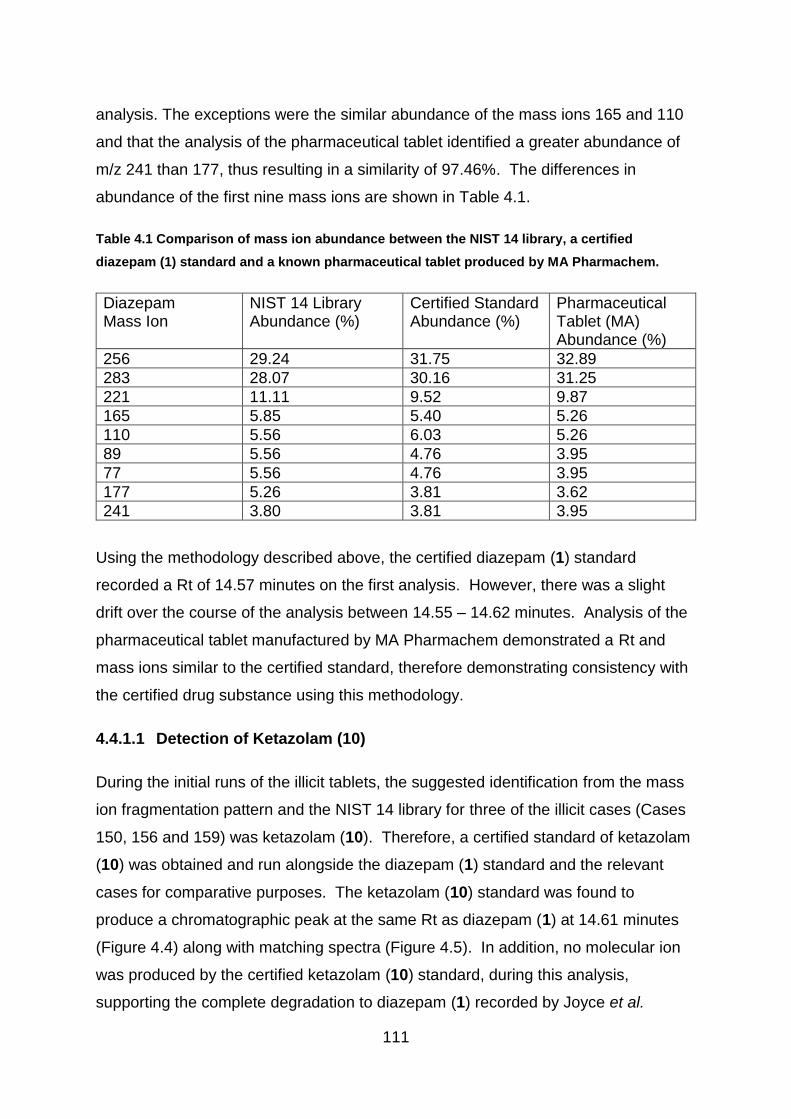
111
analysis. The exceptions were the similar abundance of the mass ions 165 and 110
and that the analysis of the pharmaceutical tablet identified a greater abundance of
m/z 241 than 177, thus resulting in a similarity of 97.46%. The differences in
abundance of the first nine mass ions are shown in Table 4.1.
Table 4.1 Comparison of mass ion abundance between the NIST 14 library, a certified
diazepam (1) standard and a known pharmaceutical tablet produced by MA Pharmachem.
Diazepam Mass Ion
NIST 14 Library Abundance (%)
Certified Standard Abundance (%)
Pharmaceutical Tablet (MA) Abundance (%)
256 29.24 31.75 32.89
283 28.07 30.16 31.25
221 11.11 9.52 9.87
165 5.85 5.40 5.26
110 5.56 6.03 5.26
89 5.56 4.76 3.95
77 5.56 4.76 3.95
177 5.26 3.81 3.62
241 3.80 3.81 3.95
Using the methodology described above, the certified diazepam (1) standard
recorded a Rt of 14.57 minutes on the first analysis. However, there was a slight
drift over the course of the analysis between 14.55 – 14.62 minutes. Analysis of the
pharmaceutical tablet manufactured by MA Pharmachem demonstrated a Rt and
mass ions similar to the certified standard, therefore demonstrating consistency with
the certified drug substance using this methodology.
4.4.1.1 Detection of Ketazolam (10)
During the initial runs of the illicit tablets, the suggested identification from the mass
ion fragmentation pattern and the NIST 14 library for three of the illicit cases (Cases
150, 156 and 159) was ketazolam (10). Therefore, a certified standard of ketazolam
(10) was obtained and run alongside the diazepam (1) standard and the relevant
cases for comparative purposes. The ketazolam (10) standard was found to
produce a chromatographic peak at the same Rt as diazepam (1) at 14.61 minutes
(Figure 4.4) along with matching spectra (Figure 4.5). In addition, no molecular ion
was produced by the certified ketazolam (10) standard, during this analysis,
supporting the complete degradation to diazepam (1) recorded by Joyce et al.

112
(1984). This indicated that the ketazolam (10) molecule fragmented to form the same
ions as the diazepam (1) standard, thus making a definitive identification by GC-MS
very problematic. The chromatographic peaks at 13.17 and 13.72 minutes relate to
enantiomers of the internal standard of bupivacaine, used to monitor drift.
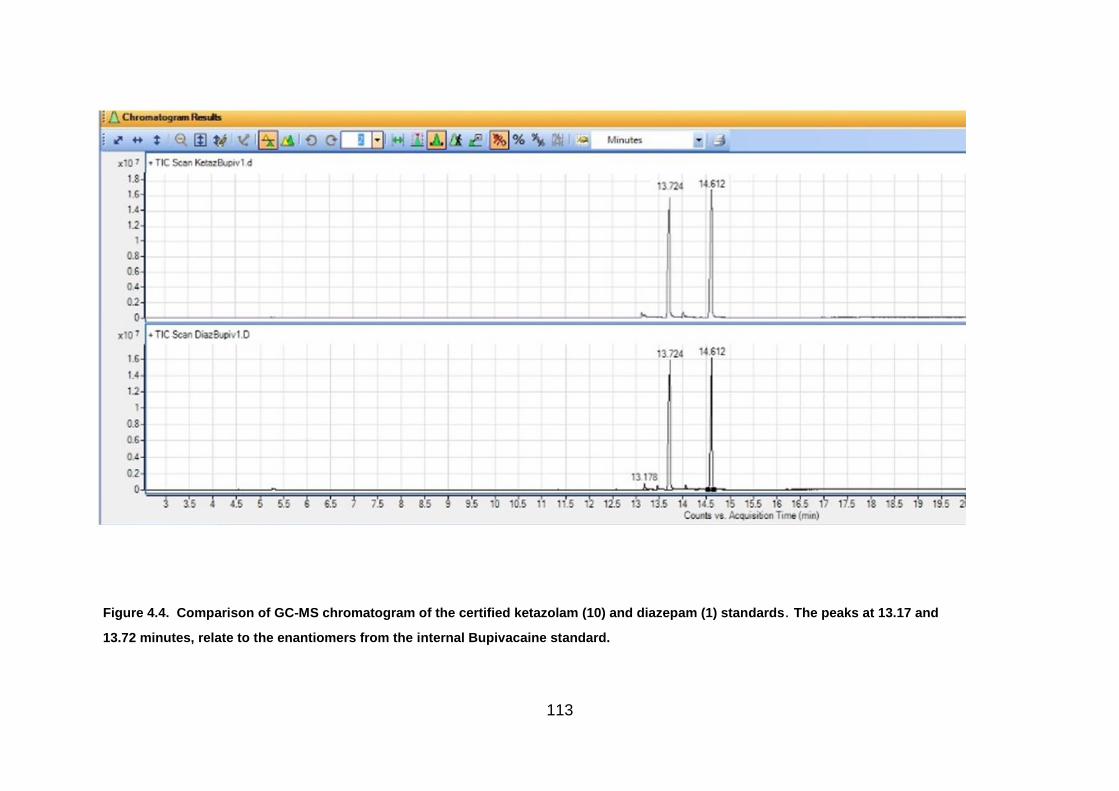
113
Figure 4.4. Comparison of GC-MS chromatogram of the certified ketazolam (10) and diazepam (1) standards. The peaks at 13.17 and
13.72 minutes, relate to the enantiomers from the internal Bupivacaine standard.
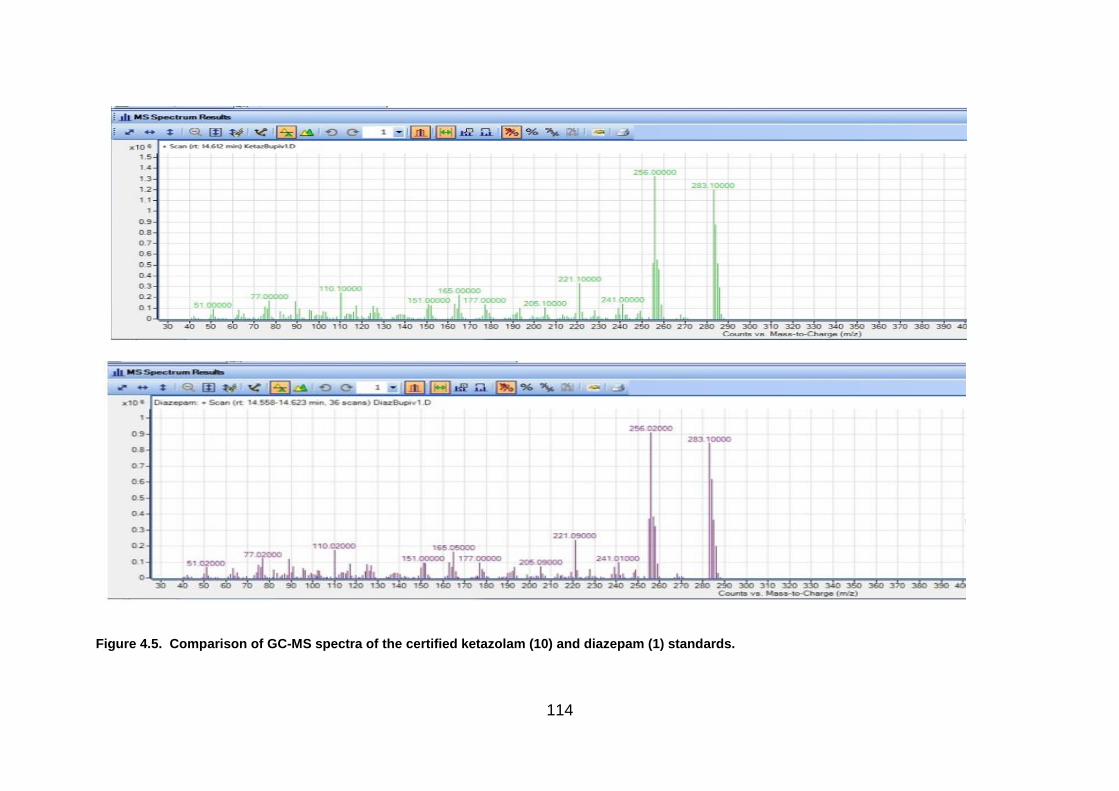
114
Figure 4.5. Comparison of GC-MS spectra of the certified ketazolam (10) and diazepam (1) standards.

115
As discussed in Section ‘4.2.1.3. Thermal Degradation’, it is likely that due to its
thermal instability, ketazolam (10) degrades by losing C4H4O2. This thermal
degradation to diazepam (1) is indicated below in Figure 4.6.
Figure 4.6. The structure of ketazolam (10). Thermal instability causes ketazolam (10) to
degrade to diazepam (1) during gas chromatography unless the sample has been derivatised
(Joyce et al., 1984)
While the difference between the two drug substances could not be easily
distinguished by GC-MS alone without carrying out a derivatisation process, it was
possible to separate both the standards and illicit tablets successfully by high
performance liquid chromatography (HPLC) as discussed in Chapter 5, where both
diazepam (1) and ketazolam (10) were found to have good chromatographic
separation, with Rt of 8.8 minutes and 11.4 minutes respectively.
Using the methods described above, the certified diazepam (1) standard generated a
peak with the Rt of 14.61 minutes and ions with mass to charge ratio (m/z) of (in
order of abundance) 256, 283, 221, 165, 110, 77, 241, 205, 51, 151 and 177 (Table
4.2). This was supported by the identification indicated by the NIST 14 mass
spectral library which listed the mass ions in the following order of abundance 256,
283, 221, 165, 110, 77, 89, 177 with a suggested similarity of 97.78%.
116
The certified diazepam (1) standard was run at the beginning and end of every
sequence in order to provide confidence in the results. Peaks with the same Rt and
ions were identified in all of the pharmaceutical tablets and the illicit cases listed in
Table 4.3.
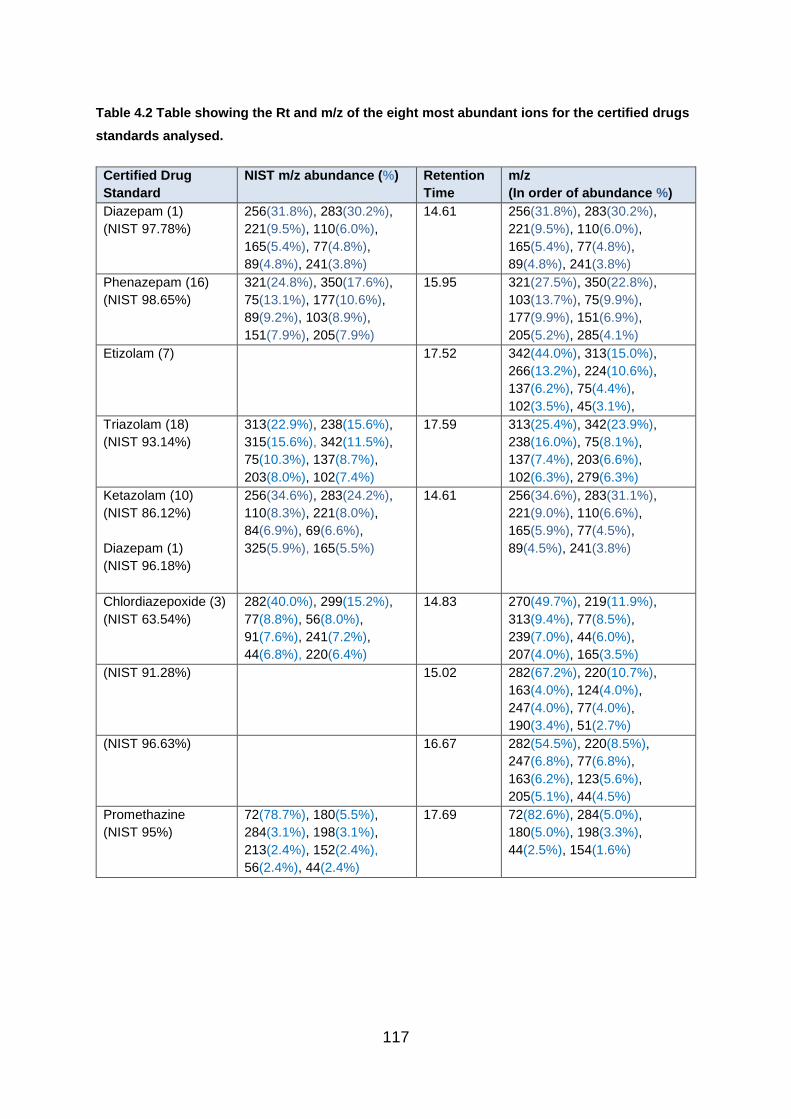
117
Table 4.2 Table showing the Rt and m/z of the eight most abundant ions for the certified drugs
standards analysed.
Certified Drug
Standard
NIST m/z abundance (%) Retention
Time
m/z
(In order of abundance %)
Diazepam (1)
(NIST 97.78%)
256(31.8%), 283(30.2%),
221(9.5%), 110(6.0%),
165(5.4%), 77(4.8%),
89(4.8%), 241(3.8%)
14.61 256(31.8%), 283(30.2%),
221(9.5%), 110(6.0%),
165(5.4%), 77(4.8%),
89(4.8%), 241(3.8%)
Phenazepam (16)
(NIST 98.65%)
321(24.8%), 350(17.6%),
75(13.1%), 177(10.6%),
89(9.2%), 103(8.9%),
151(7.9%), 205(7.9%)
15.95 321(27.5%), 350(22.8%),
103(13.7%), 75(9.9%),
177(9.9%), 151(6.9%),
205(5.2%), 285(4.1%)
Etizolam (7) 17.52 342(44.0%), 313(15.0%),
266(13.2%), 224(10.6%),
137(6.2%), 75(4.4%),
102(3.5%), 45(3.1%),
Triazolam (18)
(NIST 93.14%)
313(22.9%), 238(15.6%),
315(15.6%), 342(11.5%),
75(10.3%), 137(8.7%),
203(8.0%), 102(7.4%)
17.59 313(25.4%), 342(23.9%),
238(16.0%), 75(8.1%),
137(7.4%), 203(6.6%),
102(6.3%), 279(6.3%)
Ketazolam (10)
(NIST 86.12%)
Diazepam (1)
(NIST 96.18%)
256(34.6%), 283(24.2%),
110(8.3%), 221(8.0%),
84(6.9%), 69(6.6%),
325(5.9%), 165(5.5%)
14.61 256(34.6%), 283(31.1%),
221(9.0%), 110(6.6%),
165(5.9%), 77(4.5%),
89(4.5%), 241(3.8%)
Chlordiazepoxide (3)
(NIST 63.54%)
282(40.0%), 299(15.2%),
77(8.8%), 56(8.0%),
91(7.6%), 241(7.2%),
44(6.8%), 220(6.4%)
14.83 270(49.7%), 219(11.9%),
313(9.4%), 77(8.5%),
239(7.0%), 44(6.0%),
207(4.0%), 165(3.5%)
(NIST 91.28%) 15.02 282(67.2%), 220(10.7%),
163(4.0%), 124(4.0%),
247(4.0%), 77(4.0%),
190(3.4%), 51(2.7%)
(NIST 96.63%) 16.67 282(54.5%), 220(8.5%),
247(6.8%), 77(6.8%),
163(6.2%), 123(5.6%),
205(5.1%), 44(4.5%)
Promethazine
(NIST 95%)
72(78.7%), 180(5.5%),
284(3.1%), 198(3.1%),
213(2.4%), 152(2.4%),
56(2.4%), 44(2.4%)
17.69 72(82.6%), 284(5.0%),
180(5.0%), 198(3.3%),
44(2.5%), 154(1.6%)
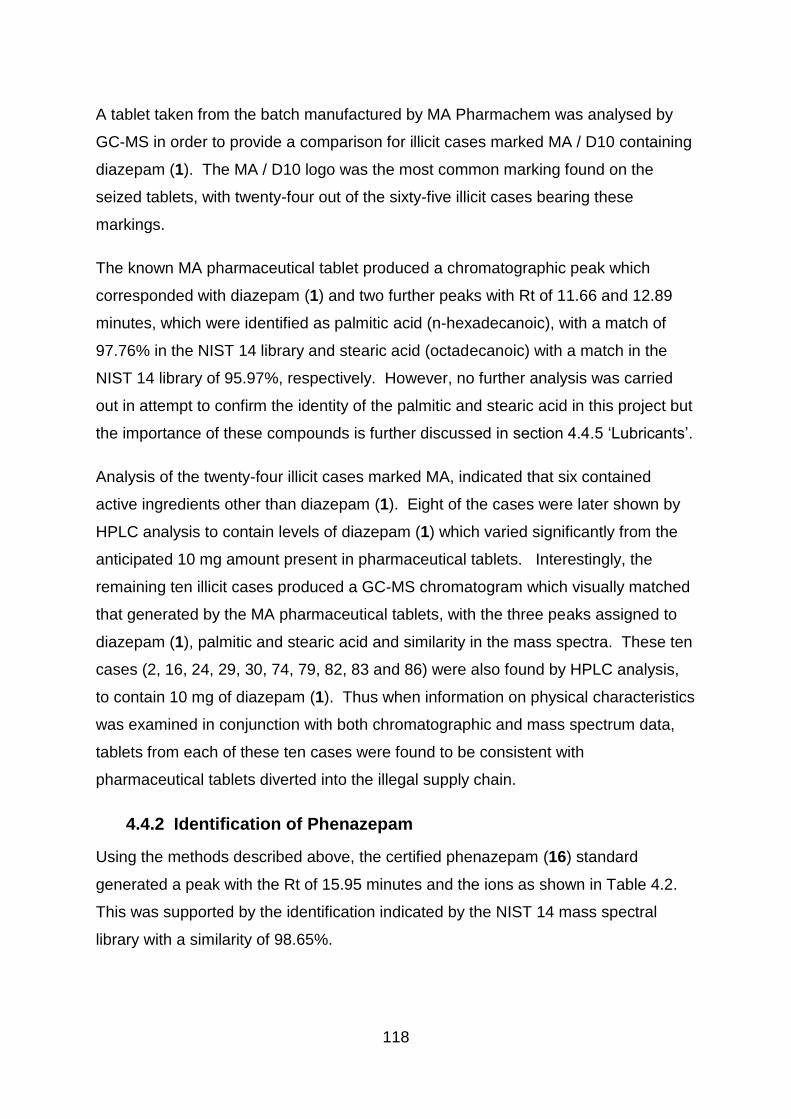
118
A tablet taken from the batch manufactured by MA Pharmachem was analysed by
GC-MS in order to provide a comparison for illicit cases marked MA / D10 containing
diazepam (1). The MA / D10 logo was the most common marking found on the
seized tablets, with twenty-four out of the sixty-five illicit cases bearing these
markings.
The known MA pharmaceutical tablet produced a chromatographic peak which
corresponded with diazepam (1) and two further peaks with Rt of 11.66 and 12.89
minutes, which were identified as palmitic acid (n-hexadecanoic), with a match of
97.76% in the NIST 14 library and stearic acid (octadecanoic) with a match in the
NIST 14 library of 95.97%, respectively. However, no further analysis was carried
out in attempt to confirm the identity of the palmitic and stearic acid in this project but
the importance of these compounds is further discussed in section 4.4.5 ‘Lubricants’.
Analysis of the twenty-four illicit cases marked MA, indicated that six contained
active ingredients other than diazepam (1). Eight of the cases were later shown by
HPLC analysis to contain levels of diazepam (1) which varied significantly from the
anticipated 10 mg amount present in pharmaceutical tablets. Interestingly, the
remaining ten illicit cases produced a GC-MS chromatogram which visually matched
that generated by the MA pharmaceutical tablets, with the three peaks assigned to
diazepam (1), palmitic and stearic acid and similarity in the mass spectra. These ten
cases (2, 16, 24, 29, 30, 74, 79, 82, 83 and 86) were also found by HPLC analysis,
to contain 10 mg of diazepam (1). Thus when information on physical characteristics
was examined in conjunction with both chromatographic and mass spectrum data,
tablets from each of these ten cases were found to be consistent with
pharmaceutical tablets diverted into the illegal supply chain.
4.4.2 Identification of Phenazepam
Using the methods described above, the certified phenazepam (16) standard
generated a peak with the Rt of 15.95 minutes and the ions as shown in Table 4.2.
This was supported by the identification indicated by the NIST 14 mass spectral
library with a similarity of 98.65%.

119
All cases which had an initial indication of phenazepam (16) according to the NIST
14 library, were re-tested with a certified phenazepam (16) standard run at the
beginning and end of all sequences. All of the cases with the initial indication of
phenazepam (16) produced peaks with the same Rt and ions as the phenazepam
(16) standard. Table 4.3 gives a brief summary of the main active drug substances
found within the illicit cases.
Table 4.3. Table identifying the active ingredients detected in the illicit cases by GC-MS.
Substances Detected Case Number
Diazepam (1) 2, 3, 5, 6, 8, 9, 11, 12, 13, 16, 23, 24, 25, 26, 27, 28, 29, 30,
31, 71, 72, 74, 75, 78, 79, 80, 81, 82, 83, 86, 90, 129, 130,
133, 150, 156, 159
Phenazepam (16)
+ Paracetamol and aspirin
+ Caffeine
77, 84, 85, 87, 88, 89, 131
134, 152
137
Etizolam
+ Aspirin
+ Chlorphenamine
76, 132, 135, 158
73
151, 155, 157, 160
Chlordiazepoxide (3)
(+ Diazepam – maybe a product of degradation)
136
Promethazine 127, 128, 153, 154
In addition to a peak resembling phenazepam (16) with a Rt of 15.95 mins and
similar mass ions produced, Cases 134 and 152 were also found to contain both a
large peak consistent in Rt and mass ions with the paracetamol standard and
another with the aspirin standard (Figures 4.7 and 4.8). These were first identified in
the initial GC-MS run and then confirmed by rerunning the illicit tablets alongside
standards both by GC-MS and HPLC.
Similarly, case 137 produced a peak consistent with phenazepam (16) but a peak
with the Rt of 10.78 minutes was also detected. This had a suggested match of
97.28% to caffeine, according to the NIST 14 library but it was not verified by
analysing a certified standard. The presence of caffeine was not detected in other
cases containing phenazepam (16), therefore distinguishing it apart from the other
illicit cases. This was supported by DSC analysis, which produced a thermal profile
which was distinct from other cases identified as containing phenazepam (16). This
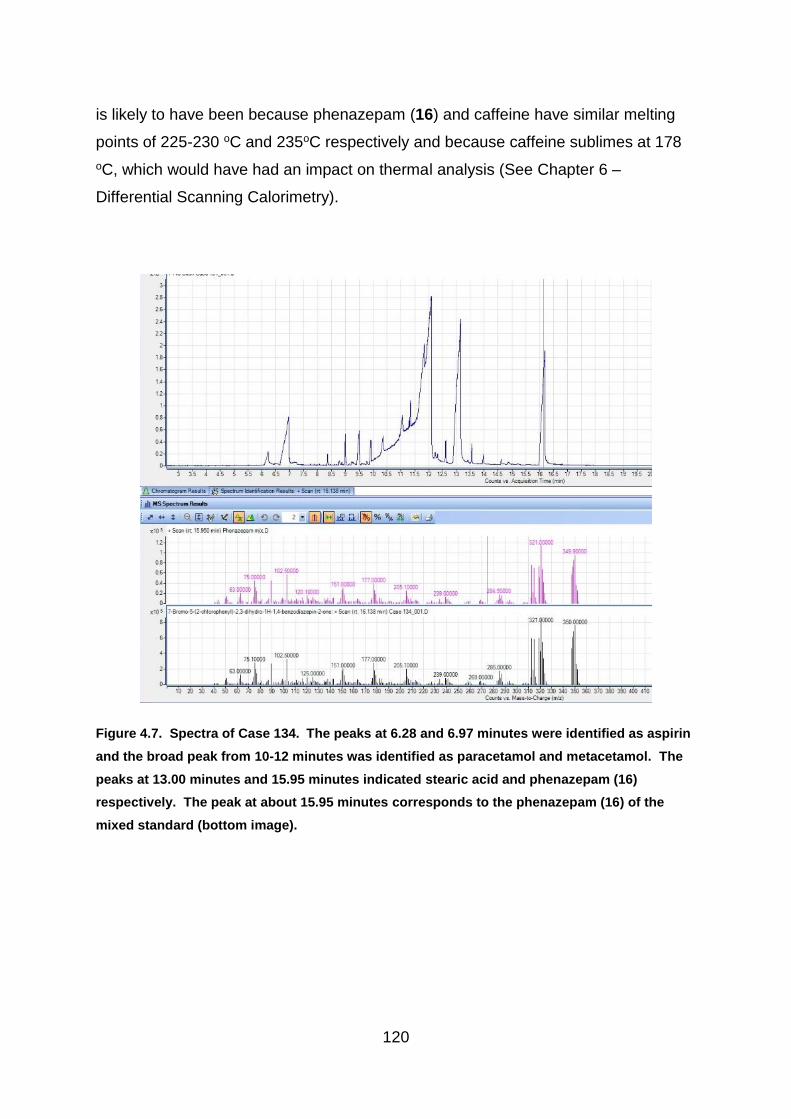
120
is likely to have been because phenazepam (16) and caffeine have similar melting
points of 225-230 oC and 235oC respectively and because caffeine sublimes at 178
oC, which would have had an impact on thermal analysis (See Chapter 6 –
Differential Scanning Calorimetry).
Figure 4.7. Spectra of Case 134. The peaks at 6.28 and 6.97 minutes were identified as aspirin
and the broad peak from 10-12 minutes was identified as paracetamol and metacetamol. The
peaks at 13.00 minutes and 15.95 minutes indicated stearic acid and phenazepam (16)
respectively. The peak at about 15.95 minutes corresponds to the phenazepam (16) of the
mixed standard (bottom image).
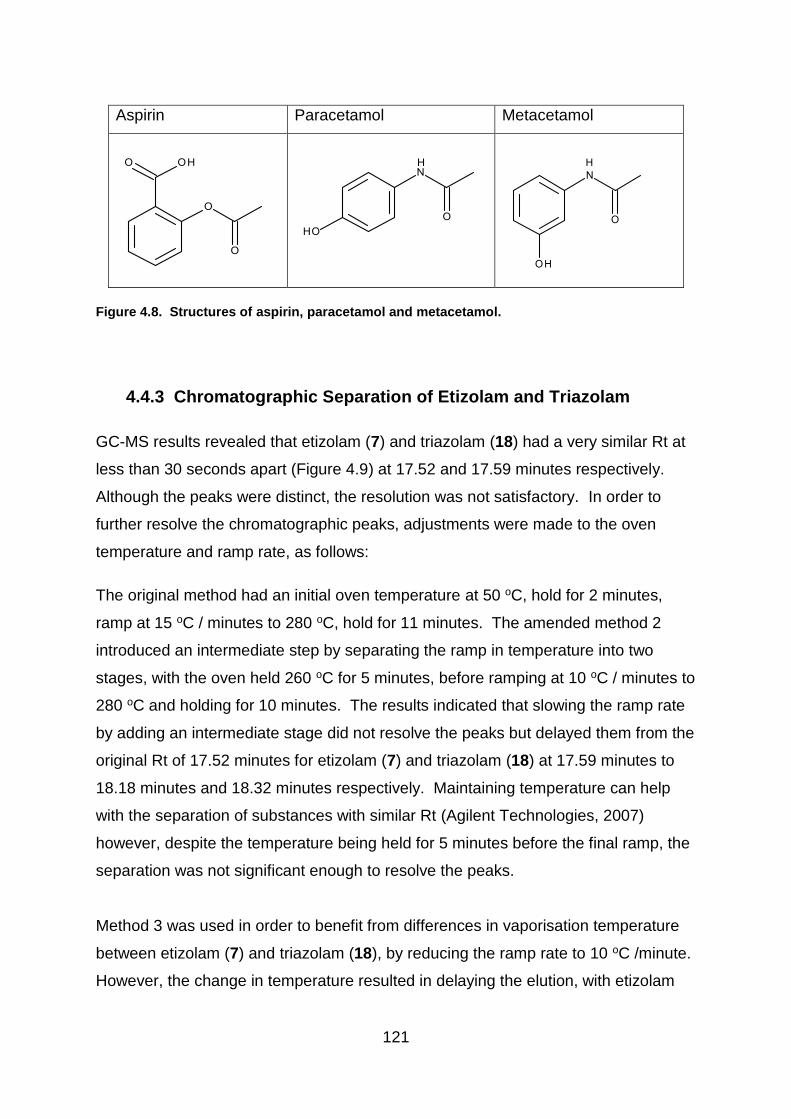
121
Aspirin Paracetamol Metacetamol
Figure 4.8. Structures of aspirin, paracetamol and metacetamol.
4.4.3 Chromatographic Separation of Etizolam and Triazolam
GC-MS results revealed that etizolam (7) and triazolam (18) had a very similar Rt at
less than 30 seconds apart (Figure 4.9) at 17.52 and 17.59 minutes respectively.
Although the peaks were distinct, the resolution was not satisfactory. In order to
further resolve the chromatographic peaks, adjustments were made to the oven
temperature and ramp rate, as follows:
The original method had an initial oven temperature at 50 oC, hold for 2 minutes,
ramp at 15 oC / minutes to 280 oC, hold for 11 minutes. The amended method 2
introduced an intermediate step by separating the ramp in temperature into two
stages, with the oven held 260 oC for 5 minutes, before ramping at 10 oC / minutes to
280 oC and holding for 10 minutes. The results indicated that slowing the ramp rate
by adding an intermediate stage did not resolve the peaks but delayed them from the
original Rt of 17.52 minutes for etizolam (7) and triazolam (18) at 17.59 minutes to
18.18 minutes and 18.32 minutes respectively. Maintaining temperature can help
with the separation of substances with similar Rt (Agilent Technologies, 2007)
however, despite the temperature being held for 5 minutes before the final ramp, the
separation was not significant enough to resolve the peaks.
Method 3 was used in order to benefit from differences in vaporisation temperature
between etizolam (7) and triazolam (18), by reducing the ramp rate to 10 oC /minute.
However, the change in temperature resulted in delaying the elution, with etizolam

122
(7) having a Rt of 24.22 minutes and triazolam (18) eluting at 24.57 minutes with no
further significant resolution.
By holding the temperature for 5 minutes, as an intermediate stage, in method 2, a
small increase in the separation between the two peaks had been produced but had
not achieved complete resolution. Therefore, method 4 was introduced to hold the
temperature for 30 minutes, to test whether the separation could be enhanced.
Complete resolution was still not achieved but broader peaks were produced with a
Rt of 29.50 minutes for etizolam (7) and 29.93 minutes for triazolam (18).
The change in methodology did not result in the complete resolution of etizolam (7)
and triazolam (18) but increased the run time to 65 minutes. This new methodology
also increased the Rt of other benzodiazepines included in the mixed standards run
along with the illicit cases, while also producing broader peaks.
In addition, etizolam (7) was not listed in the NIST 14 library and was therefore
labelled as ‘not identified’. In order to resolve these issues, both etizolam (7) and
triazolam (18) standards were analysed before and after tablets suspected of
containing either drug in order to directly compare Rt as well as the mass spectra. It
was noted that while the Rt were similar, the spectra produced for each drug
standard were notably different (Figure 4.10) thereby making identification possible,
based on the certified standard used for the analysis. The Rt of the remaining
standards used in the analysis were distinct and fully resolved isolated peaks were
produced. Comparison of the Rt and spectra therefore enabled identification to be
made.
.

123
Figure 4.9. Chromatograms showing the closeness of the chromatographic peaks produced by certified standards of etizolam (7) with a Rt of 17.52
minutes and triazolam (18) at 17.59 minutes. The peaks at 13.17 and 13.72 minutes related to the internal standard, bupivacaine.
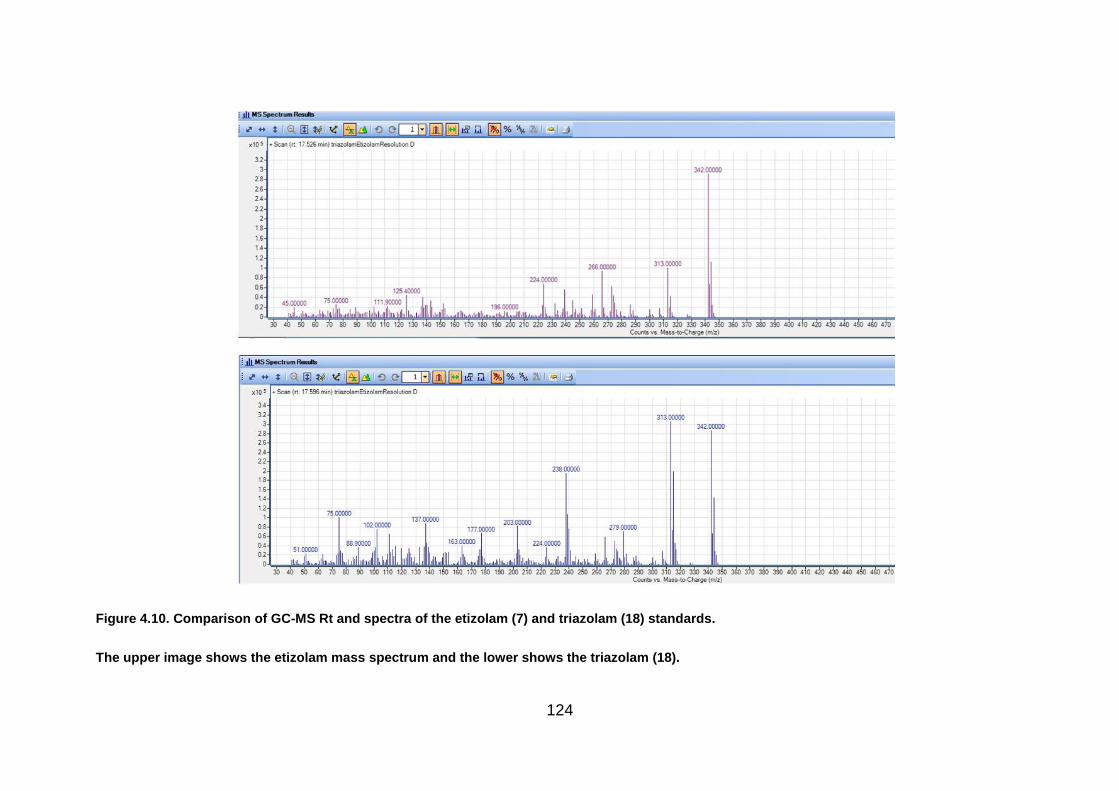
124
Figure 4.10. Comparison of GC-MS Rt and spectra of the etizolam (7) and triazolam (18) standards.
The upper image shows the etizolam mass spectrum and the lower shows the triazolam (18).
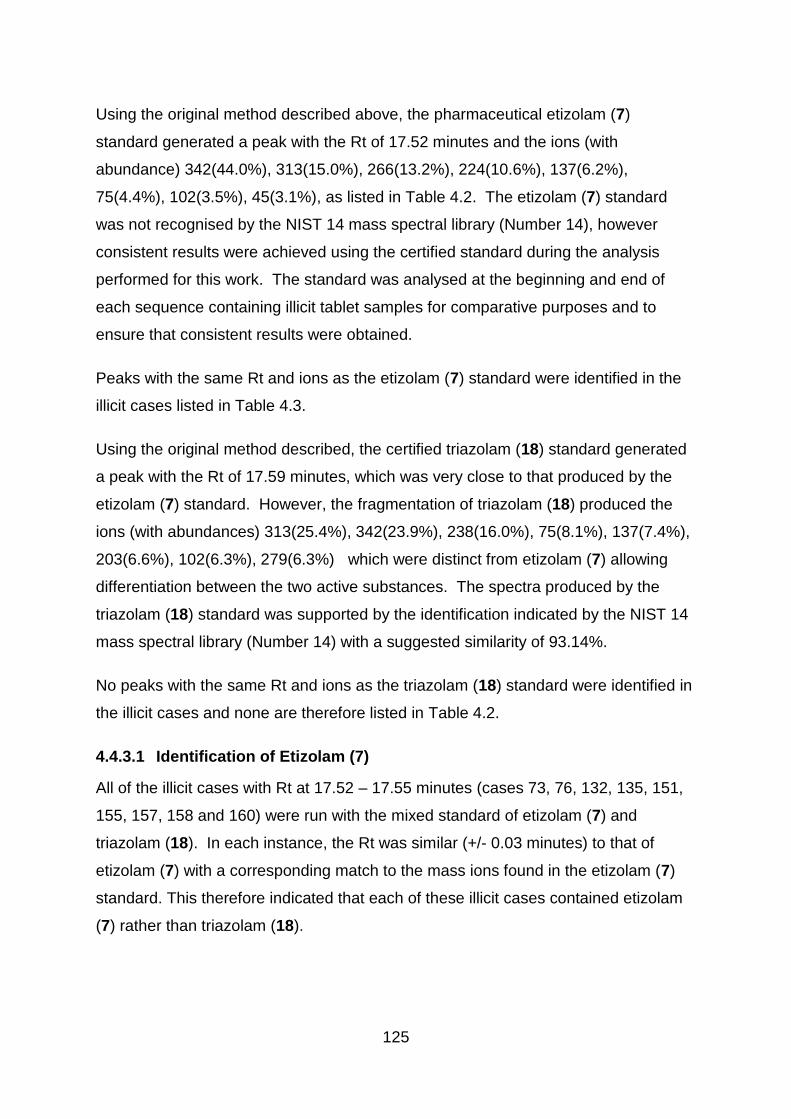
125
Using the original method described above, the pharmaceutical etizolam (7)
standard generated a peak with the Rt of 17.52 minutes and the ions (with
abundance) 342(44.0%), 313(15.0%), 266(13.2%), 224(10.6%), 137(6.2%),
75(4.4%), 102(3.5%), 45(3.1%), as listed in Table 4.2. The etizolam (7) standard
was not recognised by the NIST 14 mass spectral library (Number 14), however
consistent results were achieved using the certified standard during the analysis
performed for this work. The standard was analysed at the beginning and end of
each sequence containing illicit tablet samples for comparative purposes and to
ensure that consistent results were obtained.
Peaks with the same Rt and ions as the etizolam (7) standard were identified in the
illicit cases listed in Table 4.3.
Using the original method described, the certified triazolam (18) standard generated
a peak with the Rt of 17.59 minutes, which was very close to that produced by the
etizolam (7) standard. However, the fragmentation of triazolam (18) produced the
ions (with abundances) 313(25.4%), 342(23.9%), 238(16.0%), 75(8.1%), 137(7.4%),
203(6.6%), 102(6.3%), 279(6.3%) which were distinct from etizolam (7) allowing
differentiation between the two active substances. The spectra produced by the
triazolam (18) standard was supported by the identification indicated by the NIST 14
mass spectral library (Number 14) with a suggested similarity of 93.14%.
No peaks with the same Rt and ions as the triazolam (18) standard were identified in
the illicit cases and none are therefore listed in Table 4.2.
4.4.3.1 Identification of Etizolam (7)
All of the illicit cases with Rt at 17.52 – 17.55 minutes (cases 73, 76, 132, 135, 151,
155, 157, 158 and 160) were run with the mixed standard of etizolam (7) and
triazolam (18). In each instance, the Rt was similar (+/- 0.03 minutes) to that of
etizolam (7) with a corresponding match to the mass ions found in the etizolam (7)
standard. This therefore indicated that each of these illicit cases contained etizolam
(7) rather than triazolam (18).
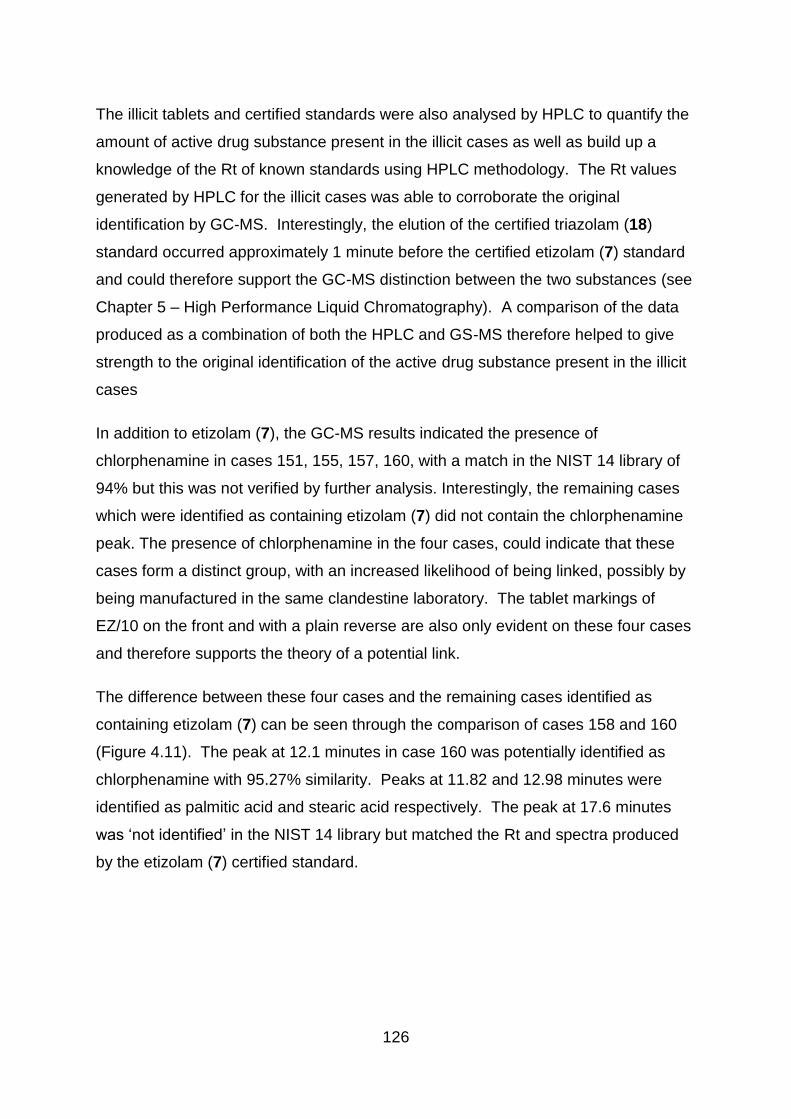
126
The illicit tablets and certified standards were also analysed by HPLC to quantify the
amount of active drug substance present in the illicit cases as well as build up a
knowledge of the Rt of known standards using HPLC methodology. The Rt values
generated by HPLC for the illicit cases was able to corroborate the original
identification by GC-MS. Interestingly, the elution of the certified triazolam (18)
standard occurred approximately 1 minute before the certified etizolam (7) standard
and could therefore support the GC-MS distinction between the two substances (see
Chapter 5 – High Performance Liquid Chromatography). A comparison of the data
produced as a combination of both the HPLC and GS-MS therefore helped to give
strength to the original identification of the active drug substance present in the illicit
cases
In addition to etizolam (7), the GC-MS results indicated the presence of
chlorphenamine in cases 151, 155, 157, 160, with a match in the NIST 14 library of
94% but this was not verified by further analysis. Interestingly, the remaining cases
which were identified as containing etizolam (7) did not contain the chlorphenamine
peak. The presence of chlorphenamine in the four cases, could indicate that these
cases form a distinct group, with an increased likelihood of being linked, possibly by
being manufactured in the same clandestine laboratory. The tablet markings of
EZ/10 on the front and with a plain reverse are also only evident on these four cases
and therefore supports the theory of a potential link.
The difference between these four cases and the remaining cases identified as
containing etizolam (7) can be seen through the comparison of cases 158 and 160
(Figure 4.11). The peak at 12.1 minutes in case 160 was potentially identified as
chlorphenamine with 95.27% similarity. Peaks at 11.82 and 12.98 minutes were
identified as palmitic acid and stearic acid respectively. The peak at 17.6 minutes
was ‘not identified’ in the NIST 14 library but matched the Rt and spectra produced
by the etizolam (7) certified standard.

127
Figure 4.11. Comparison of chromatograms produced by two illicit cases containing etizolam (7) and spectra of the peaks at 11.82 and 12.98
minutes.

128
Although a chlorphenamine standard was not run in conjunction with case 160, to
confirm the result, the spectra did correspond with that identified in the NIST 14
library (Figure 4.12).
Figure 4.12. The mass spectrum of chlorphenamine shown in the NIST 14 library. (National
Institute of Standards and Technology, 2017)
The physical differences in the tablet markings of EZ/1.0 on one side with a plain
reverse, separated cases 151, 155, 157, 160 from the other illicit cases. The
remainder of the cases containing etizolam (7) (cases 73, 76, 132 and 135) were
marked MA and D/10 and a single case (158) marked NTZ/1.0 with a plain reverse
was found to contain etizolam (7) as well. Interestingly, the results revealed that
each of the tablet markings on all of the illicit cases, varied with the drug substance
content identified through GC-MS.
GC-MS analysis also identified a small chromatographic peak in case 73, which
produced the same ions (120, 92, 152, 65, 53, 81, 137, 167 in order of abundance)
and had the same Rt of 6.27 minutes as the aspirin standard. This peak was not
detected in the other cases containing etizolam (7). Although, tablets in this case had
a similar appearance to those in cases 76, 132 and 135, there are several
explanations for the difference. Firstly, the cases may not be related and may be
manufactured completely independently of each other; secondly, inconsistent
blending could result in larger quantities of constituents such as aspirin, being
present in some tablets within a batch, while being of lower concentration in others
even if the tablets were produced together; or thirdly, if the tablets were produced by
the same manufacturer, it may be that different batches of tablets were made with
varying levels of active drug substances and the cases were made at different times.

129
As the chromatographic peak was very small however, and given that it was only
detected in the sample which was prepared using the whole tablet, it is possible that
inconsistent blending leading to differences within tablets meant that the aspirin was
not detected elsewhere.
4.4.4 Identification of Chlordiazepoxide (3)
In this project, the temperature of the injection port was set higher than the melting
temperature of chlordiazepoxide (3) at 250 oC to allow vaporisation. The oven was
set at 50 oC for 2 minutes before being ramped up at a rate of 15 oC / minute to 280
oC. It would therefore, have taken 17 minutes to reach the higher temperature. The
chlordiazepoxide (3) peaks had Rt of 14.83, 15.02 and 16.67 minutes, relating to
temperatures of approximately 230 oC, 245 oC and 260 oC respectively, making them
lower than the degradation temperature recorded by Hida.
However, the chlordiazepoxide (3) certified standard produced multiple peaks when
analysed by GC-MS, as indicated by the UNODC (section 4.1.2.3 ‘Thermal
Degradation’ (Division of Narcotic Drugs, 1988)) with Rt of 14.83 minutes, 15.02
minutes and 16.67 minutes (Figure 4.13).
The ions of the three peaks are listed in Table 4.2. The spectra show that the peak
at 16.67 mins contains an ion consistent with the molecular ion at m/z 299. The ion
at m/z 299 was not visible in the peak at 15.02 mins (Figure 4.14). It has been
suggested by both Joyce (1984) and Blachut (2004), that thermal degradation is a
result of the N-4 oxide in the 4-position of the 1,4-azepine ring, losing the oxygen
atom in the injection port. The molecular ion of chlordiazepoxide (3) appears with an
m/z at 298. The loss of the oxygen therefore creates an ion at m/z 282. The
generation of a base peak at 282 was consistent with the analysis performed in this
study and were found in the two peaks with the Rt of 15.02 and 16.67 minutes.
The mass spectrum of the chromatographic peak at 14.83 minutes shows an ion at
m/z 313 which is larger than the molecular mass of chlordiazepoxide (3). The origin
of this ion is unclear. Different preparations of the chlordiazepoxide (3) standard
were prepared and each were found to contain this peak and blanks run between
samples did not show any carry over.

130
Figure 4.13. Chromatogram and mass spectrum produced by the chlordiazepoxide (3)
standard. The upper image shows the peaks at 13.18 and 13.72 minutes, which relate to the
bupivacaine standard isomers. The final three peaks were generated by the chlordiazepoxide
(3). The lower image shows the identification of the spectrum relating to the final peak at 16.67
minutes.

131
Figure 4.14. Spectra of two of the peaks produced by the chlordiazepoxide (3) standard. The
upper image shows the mass spectrum of the smaller peak at 14.83 minutes and the lower
image shows the spectrum of the peak at 15.02 minutes.
The origin of the chromatographic peak at 14.83 minutes with the ion at m/z 313,
larger than the molecular mass of chlordiazepoxide (3) is uncertain and does not
appear to relate to chlordiazepoxide (3). It could be a result of contamination, or
perhaps from a rearrangement but it appeared in both the analysis of the certified
standard and in samples taken from case 36. This chromatographic peak is not
recorded by either Joyce or Blachut. Interestingly, the report by the United Nations
Office on Drugs and Crime (UNODC) noted that chlordiazepoxide (3), produces
multiple peaks. Although no specific details of the GC-MS results are given, the
UNODC note that three peaks were detected using GC with a flame ionization
detector (United Nations Office on Drugs and Crime, 2012)
4.4.4.1 Analysis of Case 136
The results produced by the gas chromatograph of Case 136, showed results
consistent with a tablet containing chlordiazepoxide (3) (Figure 4.15), with peaks at
14.83 minutes, 15.02 minutes and 16.67 minutes, as produced by the
chlordiazepoxide (3) standard. Interestingly, the mass spectrum for the
chromatographic peak at 14.83 minutes is consistent with that from the
chlordiazepoxide (3) standard, including the ion at an m/z of 313 (Figure 4.16). The
spectra for the three peaks are shown in Figures 4.16 and 4.17.
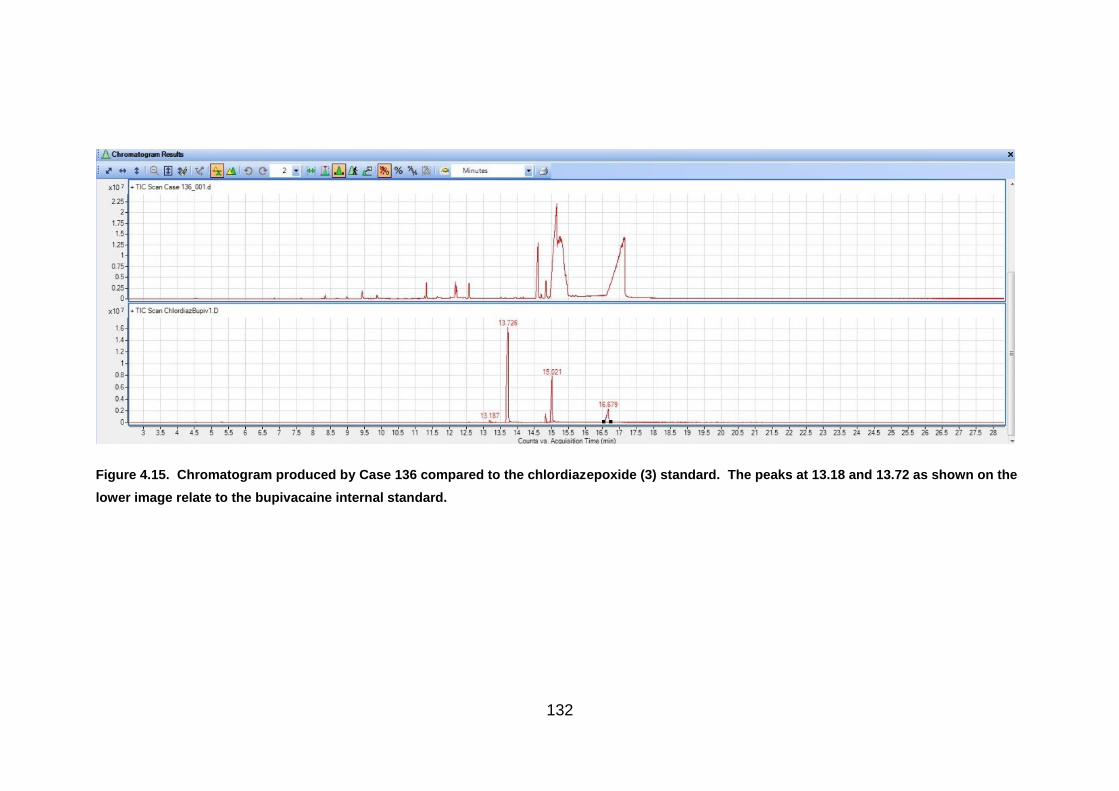
132
Figure 4.15. Chromatogram produced by Case 136 compared to the chlordiazepoxide (3) standard. The peaks at 13.18 and 13.72 as shown on the
lower image relate to the bupivacaine internal standard.

133
Figure 4.16. Chromatograms and spectra of case 136. The three images at the top show the Rt of the chromatographic peaks produced by Case
136 in comparison to the chlordiazepoxide (3) standard. The two lower images show the spectra produced by the peaks at 14.82 and 15.16
minutes, which were consistent with the spectra from the chlordiazepoxide (3) standard, including the ion at m/z 313.
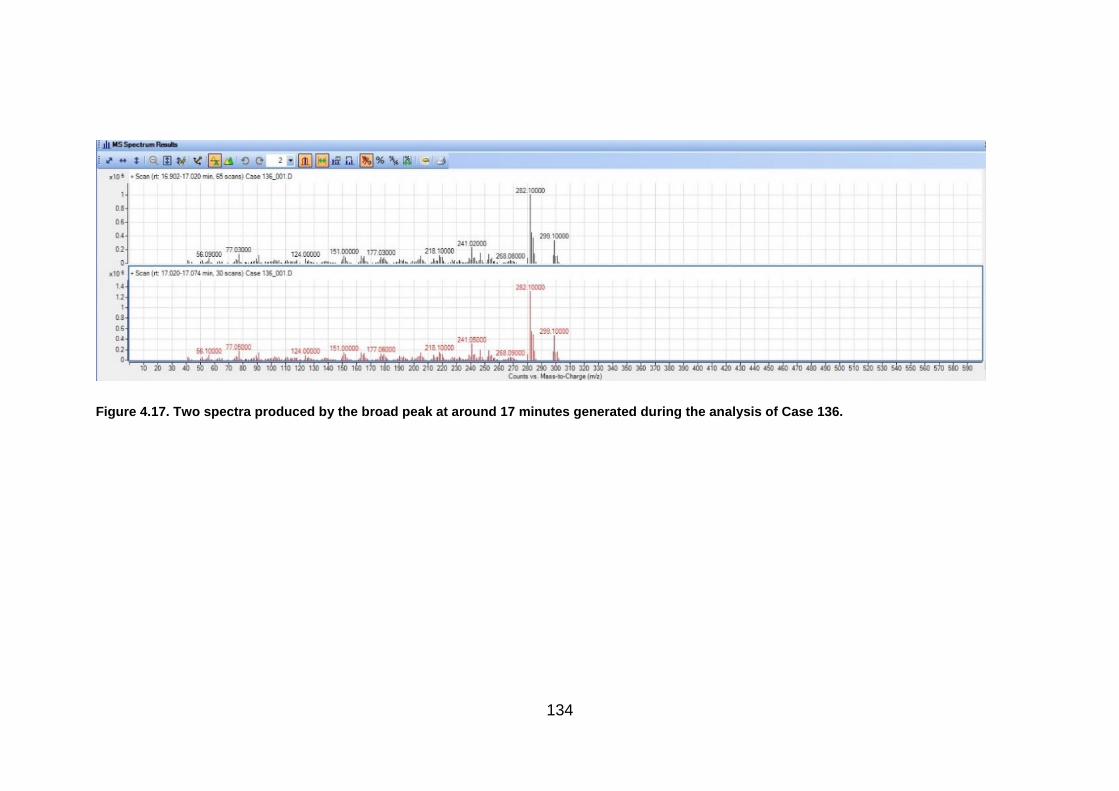
134
Figure 4.17. Two spectra produced by the broad peak at around 17 minutes generated during the analysis of Case 136.

135
In addition to the chlordiazepoxide (3), other peaks were present, which would be
expected due to excipients in a tablet preparation. The smaller peaks at 9.43 and
11.32 minutes were not identified but the spectrum produced at 12.57 minutes was
indicated to be methyl stearate by the NIST 14 library, with a similarity of 95.94%.
Although no further work was performed to confirm this suggested identification, it
would be consistent with tablet excipients.
A very small peak, barely visible above the baseline, was produced at 14.61 minutes
by the chlordiazepoxide (3) standard, however, a much larger peak was visible on
the chromatogram produced by Case 136. The spectra indicated that this was
diazepam (1) (Figure 4.18) and was consistent with the diazepam (1) standard
analysed by the same instrument in the same run sequence (Figure 4.19).
Figure 4.18. The identification of methyl stearate and diazepam (1) in Case 136.
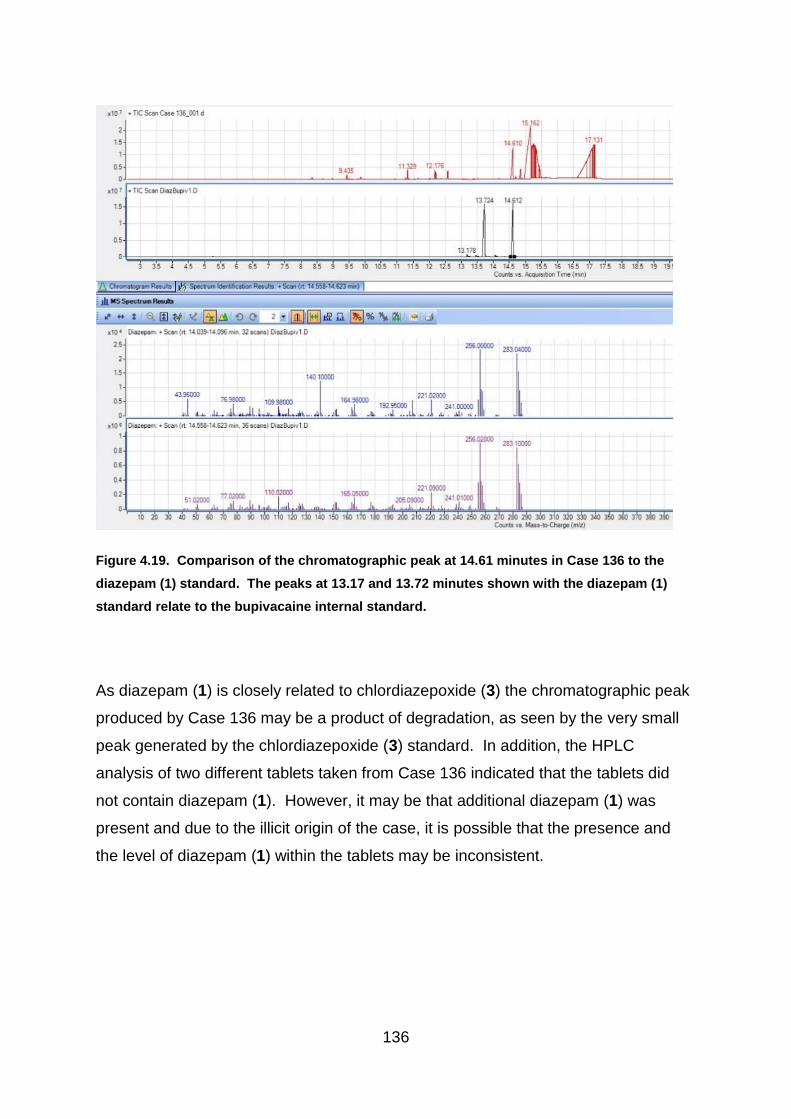
136
Figure 4.19. Comparison of the chromatographic peak at 14.61 minutes in Case 136 to the
diazepam (1) standard. The peaks at 13.17 and 13.72 minutes shown with the diazepam (1)
standard relate to the bupivacaine internal standard.
As diazepam (1) is closely related to chlordiazepoxide (3) the chromatographic peak
produced by Case 136 may be a product of degradation, as seen by the very small
peak generated by the chlordiazepoxide (3) standard. In addition, the HPLC
analysis of two different tablets taken from Case 136 indicated that the tablets did
not contain diazepam (1). However, it may be that additional diazepam (1) was
present and due to the illicit origin of the case, it is possible that the presence and
the level of diazepam (1) within the tablets may be inconsistent.

137
4.4.5 Detection of Lubricants
Although no additional work was performed to identify excipients within the tablets,
as the focus of the analysis was to identify the main active drug substance, the GC-
MS analysis detected stearic and palmitic acid in 32 of the illicit cases and all of the
pharmaceutical tablets sampled (Figure 4.20). These are ingredients commonly
used as lubricants within the pharmaceutical industry, to reduce friction between the
tablet and the tabletting machine during production (see section 2.2.4.5 lubricants, in
Chapter 2 – Introduction). Although stearic and palmitic acid are not listed
individually as components of the tablets on the product information leaflet for MA
pharmaceutical diazepam (1) tablets, for example (MA Pharmachem Ltd, 2011),
magnesium stearate is listed. Magnesium stearate consists of a variety of fatty acids,
with over 90% content provided by a mix of stearic and palmitic acid (Delaney et al.,
2017).
Figure 4.20. The identification of stearic acid and palmitic acid in Case 160. These are used as
lubricants within the pharmaceutical industry.
Magnesium stearate is added to the pharmaceutical formula in small quantities of
around 3%, due to its propensity to hinder tablet dissolution (see section 2.2.4.5
lubricants, in Chapter 2 – Introduction). Research has shown that magnesium

138
stearate is also present in illicit tablets, including ecstasy (Baer, 2007) and the NIST
14 library suggested similarity to chromatographic peaks detected in cases 71 and
72 (etizolam 7) as well as 76 and 77 (phenazepam 16), in this study, although this
was not confirmed. As etizolam (7) and phenazepam (16) are not licensed for use in
the UK, the identification confirms the use of lubricants in illicit tablets in this country.
However, these tablets could have entered the illicit supply chain as diverted
pharmaceutical preparations since they are licenced in other countries.
The use of lubricants may suggest a more advanced illicit tableting operation with
clandestine producers having a knowledge of tablet manufacturing procedures.
Searches of the internet reveal many websites describing how to make ‘vitamin
tablets and supplements’ with some suggesting a formula (Ecomdash, 2019; HTC
Health, 2019) and one website by London Fashion Arts sells tableting machines and
provides a link to receive a free ebook on ‘How to make your own tablets’ (LFA
Machines, 2019). London Fashion Arts also have videos on ‘You Tube’ to
demonstrate the process (2010). The formulae described online can be adapted to
contain other illicit ingredients obtained on the dark net. In addition, cheap and
easily accessible pharmaceutical tablets, such as paracetamol, may be crushed and
added as a bulking agent to the mix, thus providing some of the pharmaceutical
constituents. However, little is known about the illicit production of diazepam (1)
tablets and results of this analysis would indicate that cases which contain stearic or
palmitic acid are not necessarily diverted, pharmaceutically manufactured products.
4.4.6 Summary of GC-MS Results
Results of the GC-MS analysis identified that 39 of the 63 seized cases analysed
were found to contain diazepam (1). Therefore, the remaining 24 cases were
presumed to be illicit. Discrimination according to main active ingredient divides the
seized cases into five groups, those containing diazepam (1), etizolam (7),
phenazepam (16), chlordiazepoxide (3) or promethazine (Figure 4.21). Each of the
illicit cases was found to contain at least one active drug substance using the GC-
MS procedure adopted in this project and on occasion additional substances such as
paracetamol, aspirin, stearic and palmitic acid were also noted.
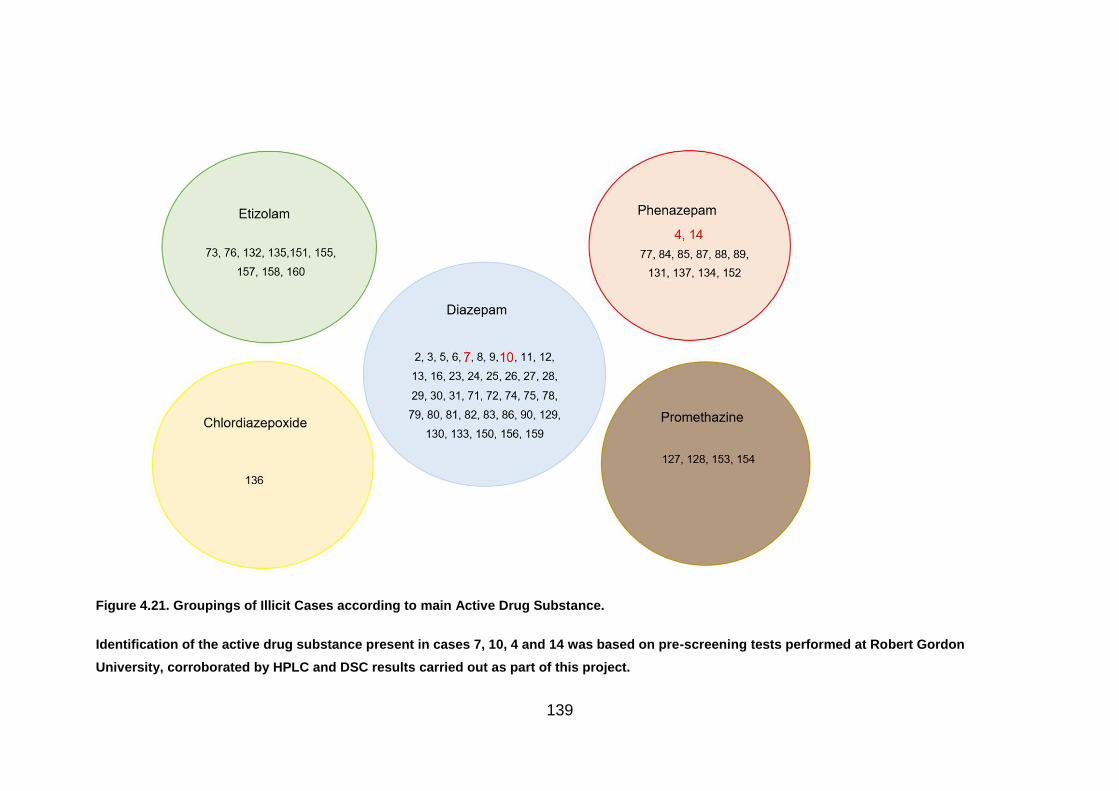
139
Figure 4.21. Groupings of Illicit Cases according to main Active Drug Substance.
Identification of the active drug substance present in cases 7, 10, 4 and 14 was based on pre-screening tests performed at Robert Gordon
University, corroborated by HPLC and DSC results carried out as part of this project.

140
4.4.7 Analysis of Results
In order to assess the results of the GC-MS analysis, they were compared to the
results produced from the physical examination of the tablets (Chapter 3).
Knowledge gained on the main active drug substance present in the seized cases
was used to give greater insight into the discrimination already performed and the
results can be seen in Figure 4.22. The Venn diagram, shows the groupings
indicated by the physical analysis of the tablets and further groupings which were
discerned through the GC-MS. For example, the cases which had previously been
identified as being similar to the pharmaceutical tablets in diameter could now be
separated into groups containing diazepam (1), etizolam (7), phenazepam (16) and
chlordiazepoxide (3). However, the tablets containing promethazine were shown to
differ in both diameter and depth to the pharmaceutical diazepam (1) tablets but
were of a similar weight.
Similarly, case 136, which was identified as containing chlordiazepoxide (3), only
resembled pharmaceutical diazepam (1) tablets in diameter but not in depth nor
weight.
Interestingly, groupings of cases containing phenazepam (16), which had been
separated during the physical analysis, were found to show similarities to
pharmaceutical diazepam (1) tablets in depth, or diameter, or both. However, this
was shown to be distinct from tablets containing etizolam (7) which indicated
similarities in diameter and weight but not depth.
It could be interpreted that manufacturers of these tablets could produce tablets
containing phenazepam (16) and others with etizolam (7), using dies of a similar
diameter, based on the results of the physical analysis. However, by examining the
results of the GC-MS analysis in conjunction with physical characteristics, it could be
interpreted that the manufacturer of phenazepam (16) tablets tend to produce tablets
of similar size in diameter and depth to the pharmaceutical tablets, whereas those
who manufacture the etizolam (7) tablets, using similar dies, are less concerned with
depth but produce tablets of a similar weight. As the tablets use dies of a similar
diameter, it may be that the weight is affected by differences in excipient. For
141
example, EmcompressTM (Dicalcium phosphate dihydrate), is a heavier excipient,
which although present in some pharmaceutical preparations, is not used in
pharmaceutical diazepam (1) tablets produced for the UK market. A difference in
formulation between the cases, may therefore suggest that the etizolam (7) and
phenazepam (16) tablets are not manufactured at the same time.

142
Figure 4.22. Venn Diagram of Illicit Cases according to Physical and GC-MS Analysis. Cases listed in blue contain diazepam (1). Those in red/pink
shapes contain phenazepam (16), green contain etizolam (7), brown promethazine and yellow chlordiazepoxide (3). Identification of the active
drug substance present in cases 7, 10, 4 and 14 was based on pre-screening tests performed at Robert Gordon University, corroborated by HPLC
and DSC results carried out as part of this project.

143
4.5 Conclusion
For the first time, results from GC-MS analysis of real street drugs as obtained by
Police Scotland have shown that there was a variety of active drug substances
present in the illicit cases examined in this study. Of the 63 seized cases, which
were initially presumed to contain diazepam (1) due to their markings and were
investigated by GC-MS only 39 were actually found to contain diazepam (1). It is
very interesting to note that the remaining 24 cases contained a variety of psycho
actives many of which are illegal in the UK such as phenazepam (16) and etizolam
(7). This study provides a novel snapshot of the illicit diazepam (1) market and
provides invaluable intelligence regarding the variety of content of street drugs
confiscated in Scotland. Interestingly, such seized drugs are normally not analysed
to the extent as discussed in the current work and the information provided herein
requires to be distributed as widely as possible as such knowledge is currently
unavailable to police Scotland.
It is also worth noting that the seized cases marked MA, previously recorded as
having physical measurements consistent with the known pharmaceutical tablets
(Chapter 3) and subsequently found to contain approximately 10 mg of diazepam (1)
when later analysed by HPLC, produced visually similar chromatograms to that of
the known MA pharmaceutical tablets. Therefore, based on the sample preparation
used in this project, it has been noted that no obvious differences exist for these
particular ten seized MA cases indicating a further interesting facet of the drug chain,
namely, some of the illicit drugs are probably genuine diazepam (1) tablets which
may have been stolen, diverted or obtained by removal of quality control failures
destined for destruction.
This study also presents results relating to the use and detection of lubricants in
many of the illicit cases which reflects the sophistication of current illicit
manufacturing methods, although some of these tablets will have been
pharmaceutically manufactured tablets, which had been diverted. Initial work on the
use of tablet presses and dies, has helped to link illicit cases via their mode of
manufacture and circumvents the lack of quality of such produced illicit tablets which
can make them difficult to recognise without extensive scientific measurement. Thus

144
difference in active drug substance were detected via GC-MS analysis and revealed
the true nature of street drugs and gave considerable insight into the illicit market.
GC-MS analysis provided vital information for this study and the results were used to
corroborate other data such as HPLC analysis and DSC. HPLC (Chapter 5) proved
to be highly useful for confirming identification, for example to aid in distinguishing
between diazepam (1) and ketazolam (10), where thermal degradation made
absolute identification problematic. It also helped to further separate the illicit cases
based on quantification of diazepam (1) because pharmaceutically manufactured
tablets would not be expected to contain more than the “stated” dose.
DSC (Chapter 6) also provided information to support the GC-MS analysis, by
generating thermal profiles with distinct differences and similarities according to the
varying tablet constituents. This therefore enabled further distinction to be made
between the illicit cases.
This study reports for the first time an innovative approach by utilising a variety of
analytical and physical techniques to establish similarities and differences between
street drugs. The use of GC-MS was invaluable at identifying more unusual active
ingredients and could lead to methodology which could be expanded to provide drug
intelligence for Police Forces worldwide.
145
5.1 Chapter Summary
High Performance Liquid Chromatography (HPLC) was used to quantify the
diazepam (1) content of three tablets taken from each seized case and from each of
the pharmaceutical batches, used for comparative purposes. Although the seized
cases contained tablets which were blue in colour, consistent with the colour of 10
mg diazepam (1) tablets manufactured for the UK market, some of the cases were
identified as containing other active drug substances through GC-MS analysis
(Chapter 4). HPLC analysis was therefore used to further distinguish between
tablets by identifying the seized cases which contained a level of drug content
consistent with 10 mg diazepam (1) tablets manufactured for the UK market.
However, the presence of the correct amount of active drug substance does not
necessarily mean the tablets have been pharmaceutically manufactured.
5.2 Introduction
5.2.1 Uses of HPLC
5.2.1.1 HPLC in Pharmaceutical Studies
High Performance Liquid Chromatography (HPLC) is an important method of drugs
analysis. It is used in pre-formulation studies within the pharmaceutical industry, as
well as in the testing of illicit drugs. However, until now, no work has been performed
by HPLC, to quantify the amount of active drug substance present in illicit blue
tablets with markings consistent with pharmaceutical diazepam (1) tablets. This was
partly because of the large numbers of pharmaceutical tablets that were being
diverted into the illegal supply chain, as described by the Advisory Council on the
Misuse of Drugs (2016), leading to an assumption that many of the diazepam (1)
products in circulation were diverted products of pharmaceutical origin (United
Nations Office on Drugs and Crime, 2012).
In pre-formulation studies HPLC is utilised for the identification and quantification of
impurities and degradation products (Narang, Desai and Badawy, 2012).
146
Wyttenbach, at Hoffmann La Roche, used the level of impurity found through HPLC
analysis, as a means of determining the amount of drug degradation that had taken
place (Wyttenbach et al., 2005). Information on degradation products and
impurities can also be of interest forensically and could potentially help to link
different cases. However, matching retention times alone, does not necessarily
mean that the same unknown substances are present. Whereas, the benefit of
using this technique for pharmaceutical testing is more palpable since a specific set
of known impurities is often studied to provide assurance that there has been no
significant impact on the efficacy of the material.
An interesting study in Nigeria compared a variety of pharmaceutical ibuprofen
tablets to investigate their equivalence. This included ensuring that each of the
manufacturers produced tablets that conformed to the regulations stipulated in the
British Pharmacopoeia, regarding everything from tablet size, disintegration and
dissolution rates to the level of active drug content. The results of the study revealed
that although the level of active drug substance may be similar, differences in
physicochemical characteristics such as dissolution rates, could greatly affect the
bioavailability of the ibuprofen. The differences were likely to originate from variation
between excipients. Quantification of the active ingredient for the study, was
performed on HPLC in addition to UV assay. The results indicated that despite all of
the tablets falling within the guidelines, there was some variation between the
pharmaceutically manufactured tablets. However, it was noted that although the
results generated by the HPLC demonstrated that all of the tablets did satisfy the
regulations, the results produced by the UV assay did not and suggested that two of
the brands contained a lower level of ibuprofen, at 92.43% and 91.18% compared to
the HPLC indications of 100.54% and 96.66% respectively. The results of the UV
assay were not consistently lower with 50% indicating a higher concentration of
ibuprofen than by HPLC analysis. It was suggested that this was because the HPLC
was a more consistent and sensitive technique (Eraga et al., 2015).
5.2.1.2 Analysis of Illicit Tablets
In terms of illicit drug analysis, HPLC can help to corroborate identification of the
active drug substance by comparing the retention time to a known standard, once

147
the substance has been identified by gas chromatography – mass spectrometry
(GC-MS), as well as providing a reliable method of quantification. This therefore
makes it an invaluable technique for the analysis of illicit tablets.
A study in 2011 compared the use of reversed-phase HPLC with capillary zone
electrophoresis (CZE) for the separation of benzodiazepines. In this experiment, a
Zorbax Stable Bond C-18 column was compared to a C-8 column using a mobile
phase of acetonitrile and deionised water with acetic acid, at a pH of 3.0. It was
discovered that using the C-18 column reduced the retention time as a higher
proportion of acetonitrile could be incorporated into the mobile phase. In comparison
to the CZE, HPLC was the preferred technique because the level of baseline noise
was lower. In addition, the increased noise in combination with the smaller sample
size for the CZE resulted in a much higher Limit of Detection (LOD) and Limit of
Quantification (LOQ) (Kalíková et al., 2011).
Although, Kalíková described how retention times could be reduced by increasing
the amount of acetonitrile in the mobile phase, the shorter chain length in C-8
columns also gives a lower retention time (Agilent Technologies, 2005). For this
research a C-8 column was used as good separation was achieved with the lower
retention time.
5.2.2 Methodology
5.2.2.1 Methodological Background
It was noted by the United Nations Office on Drugs and Crime (UNODC) that a
specific methodology for use with the HPLC would not be appropriate for the
analysis of all benzodiazepines. This was due to the range of chemical structures
within the drug family. However, it was suggested that the drug sample being tested
should be prepared in methanol, which could dissolve the drug substance whether in
free base or salt form. The recommended method included the use of a mobile
phase consisting of methanol, water and phosphate buffer. The proposed injection
size was 20 µl, using a UV detector set at 240 nm. (United Nations Office on Drugs
and Crime, 2012).

148
The method described by the UNODC was designed for the general analysis of
benzodiazepines. As the aim of this project was to analyse illicit blue tablets believed
to be sold as diazepam (1), the adopted HPLC method used was based on the
European Pharmacopeia Monograph for the purity assessment of diazepam (1) drug
substance. To ensure that the recovery of drug substance was complete the
preparation of tablets for UV assay (B.P. monograph) using acidified methanol to
quantitatively extract the diazepam (1) from the formulation was followed, with a
mobile phase of 22: 34: 44 acetonitrile: methanol: potassium dihydrogen phosphate
solution.
The eluent was run as an isocratic system with a flow rate of 1 mL / minute and a run
time of 15 minutes.
The report by UNODC also suggested that multiple tablets should be combined and
analysed together for quantification purposes. However, this was based on the
assumption that the illicit tablets had been pharmaceutically manufactured and
diverted into the illegal supply chain. Quantification of multiple tablets was not
believed to be appropriate for this project, because the differences in active drug
substance as well as the varying levels present, indicated that the tablets had been
illicitly manufactured and may not be uniform. This therefore meant that different
tablets within a case could potentially contain disparate active ingredients or be
inconsistent according to the effectiveness of the blend (United Nations Office on
Drugs and Crime, 2012).
After reviewing a variety of detectors, Siddiqui commented that UV detection is often
preferred as it provides the best specificity, reliability and repeatability with a short
analysis time (Siddiqui, Alothman and Rahman, 2017). However, process or
degradation impurities may have a similar structure and absorb at the same
wavelength as the drug substance (Ryan, 1998), therefore producing a bigger peak
by UV.
Single wavelength analysis can provide excellent results when the corresponding
wavelength is known and the European pharmacopeia monograph advised using a
UV detector set to a wavelength of 254nm. The use of a diode array detector would
149
have given confidence in the peak purity of the HPLC diazepam (1) peak, indicating
that the chromatographic peak was only due to diazepam (1) and no other
substance. However, as a UV detector was used for this study, GC-MS was used to
confirm the drug substance and determine the likelihood of co-elution on the HPLC.
In addition, comparison of retention times with the appropriate drug standard was
constantly performed by HPLC analysis.
5.2.2.2 Sample Sizes
In the ‘Guidelines on Representative Drug Sampling’ produced by the United Nations
Office on Drugs and Crime, several methods for determining a suitable number of
samples were suggested, including batch analysis according to markings. For police
seizures, it indicated that each situation should be case dependent (2009). Izenman
wrote a detailed analysis of representative sampling in America and noted how an
Illinois court supported the decision of a chemist to analyse three tablets in a batch
of 100 for identification purposes (Izenman, 2003). The tablets received for analysis
in this study were themselves just a representative amount of each police production
sampled. Entire cases of small productions were obtained but when larger cases
were seized by the police, a selection of the visually similar tablets were provided for
the project.
The tablets analysed for this study were divided into separate seized cases. Many of
the seizures were small, with 29 of the seized cases containing fewer than ten
tablets for analysis and the remaining 36 seized cases contained between 20 and 70
tablets. The hypergeometric distribution method, uses a frequentist approach to
determine the number of variations in drug substance within a batch, depending on
the number of tablets analysed and the number of samples containing a variation. In
order for a 95% confidence interval (making a correct assumption for about 95% of
the entire batch), a sample size of three would need to be analysed in cases
containing fewer than ten tablets. For cases containing between 10-70 tablets, four
tablets were suggested (United Nations Office on Drugs and Crime., 2009), For this
project, three illicit tablets taken from each case were analysed by HPLC to ensure
the peak produced by the active drug substance present in the illicit tablets matched
the retention time of the diazepam (1) standard. The scientific assumption was made
150
that all tablets within a case would be similar in terms of quantification, unless
analysis proved otherwise. This allowed an average result to be reported for each
case, given that in most cases the results were very similar. Reproducibility was
determined by preparing three tablets from each case, with three vials made from
each tablet solution and three readings taken from each vial, thus giving confidence
in the individual results. This was further supported by comparison of the GC-MS
and DSC analysis.
5.3 Experimental
5.3.1 Instrumentation
The HPLC analysis was performed on a Shimadzu 10 HPLC system with autosampler
and ultra-violet detector set at 254nm. This was supported by Clarity software.
The column used was a Zorbax XDB C8 Eclipse column of 4.6 x 150mm, with a 5µm
particle size and double end-capped, purchased from Agilent Technologies. This was
maintained at 30 oC in the column oven.
5.3.2 Materials used in the HPLC Analysis
Hplc grade acetonitrile, ethyl acetate, hplc grade methanol and potassium
dihydrogen phosphate were obtained from Fisher Scientific, Loughborough.
Chlordiazepoxide (3) certified standard 1 mg / mL in methanol, diazepam (1) certified
standard 1 mg / mL in methanol, etizolam (7) certified standard 1 mg / mL in
methanol, triazolam (18) certified standard 1 mg / mL in methanol, acetaminophen 1
g analytical standard, aspirin 1 g analytical standard and bupivacaine 1 g analytical
standard were purchased from Sigma Aldrich, Gillingham. Ketazolam (10) certified
standard 1 mg / mL in methanol and phenazepam (16) certified standard 1 mg / mL
in methanol were provided by LGC, Middlesex. MA tablets (supplied by MA
Pharmachem Ltd., Bolton, UK), Wockhardt tablets (supplied by Wockhardt UK Ltd.,
Wrexham), Teva tablets (supplied by Teva UK Ltd., Runcorn), Actavis tablets

151
(supplied by Actavis UK Ltd., Barnstaple) and illicit blue tablets (supplied by Police
Scotland).
5.3.3 Preparation of Solutions
The method used acidified methanol to quantitatively extract the diazepam (1) from
the formulation, with a mobile phase of 22: 34: 44 acetonitrile: methanol: potassium
dihydrogen phosphate solution.
500 mL of a 3.4 g / L solution of potassium dihydrogen phosphate was prepared and
adjusted to pH5 with a 0.1 M sodium hydroxide. The resulting solution was then 5
times the strength of the buffer required for the final mobile phase but since the storage
was better than for a more dilute buffer, this was then diluted appropriately with distilled
water immediately before adding to the mobile phase.
The mobile phase was prepared by adding the prepared diluted potassium dihydrogen
phosphate to a conical flask, containing methanol and acetonitrile and the solution was
de-gassed with a vacuum filter, before use.
This eluent was used as the mobile phase, for the dilution of samples and for the
blanks.
5.3.4 Preparation of Standards
Each standard was prepared separately. 1 mL of the certified 1 mg / mL diazepam
(1) drug standard was pipetted into a 10 mL volumetric flask and made up to the
mark with methanol. This was the working 0.1 mg / mL stock solution. The
standards were prepared for the calibration of 0.0025 mg / mL, 0.01 mg / mL, 0.02
mg / mL, 0.03 mg / mL and 0.05 mg / mL dilutions.
In addition, a further 0.02 mg / mL diazepam (1) standard was prepared and used at
the beginning and end of each run sequence in order to monitor drift and were run
before and after corresponding samples from the illicit cases which had been
identified by Gas Chromatography - Mass Spectrometry. A 0.02 mg / mL solution
was also prepared from each of the certified standards of other active drug
substances identified through GC-MS analysis to run at the beginning and end of

152
each run sequence containing the corresponding drug substances as a comparison
for the seized tablets and to identify the Rt of the known standards on the HPLC.
5.3.5 Preparation of Tablets
Both pharmaceutical and illicit tablets were prepared in the same way. This involved
softening the tablet in 5 mL of distilled water and then dissolving the drug content in
approximately 40 mL of 0.5% w/v solution of sulphuric acid in methanol.
The solution was agitated with a flask shaker for 15 minutes before being made up to
100 mL with additional acidified methanol. The agitate solution was then filtered into
a flask to remove any insoluble material and an aliquot (2 mL) of the filtered solution
was pipetted into a 10 ml volumetric flask and made up to the mark with eluent, giving
a further 1 in 5 dilution. This was passed through a syringe fitted with 4mm filter (0.2μm
pore size) into an HPLC vial. The sample was introduced into the HPLC as a 20 µL
injection.
Some of the tablets from the illicit cases were still outwith the linear working range of
the method and required a further 1 in 25 dilution, which was analysed with a 20 µL
injection, resulting in a multiplication factor of 2500.
5.3.6 Validation of the Method
The linearity of the method was determined by making up five solutions with different
concentrations across the range 0.0025 mg / mL to 0.05 mg / mL and provided a
validation for up to 25 mg of diazepam (1). Each of the solution concentrations were
prepared three times to determine the method precision. The area response was
plotted against concentration and least-square regression was used to determine
slope, intercept and correlation coefficient. The resulting calibration curve (Figure
5.1) had a correlation coefficient of 0.9994 with an equation of the line determined by
the calibration curve. The equation of the line was used to calculate the
concentration of diazepam (1) mg /mL, within each sample. So that:
𝑥 =𝑚𝐴𝑈𝑠 + 71.836
301833
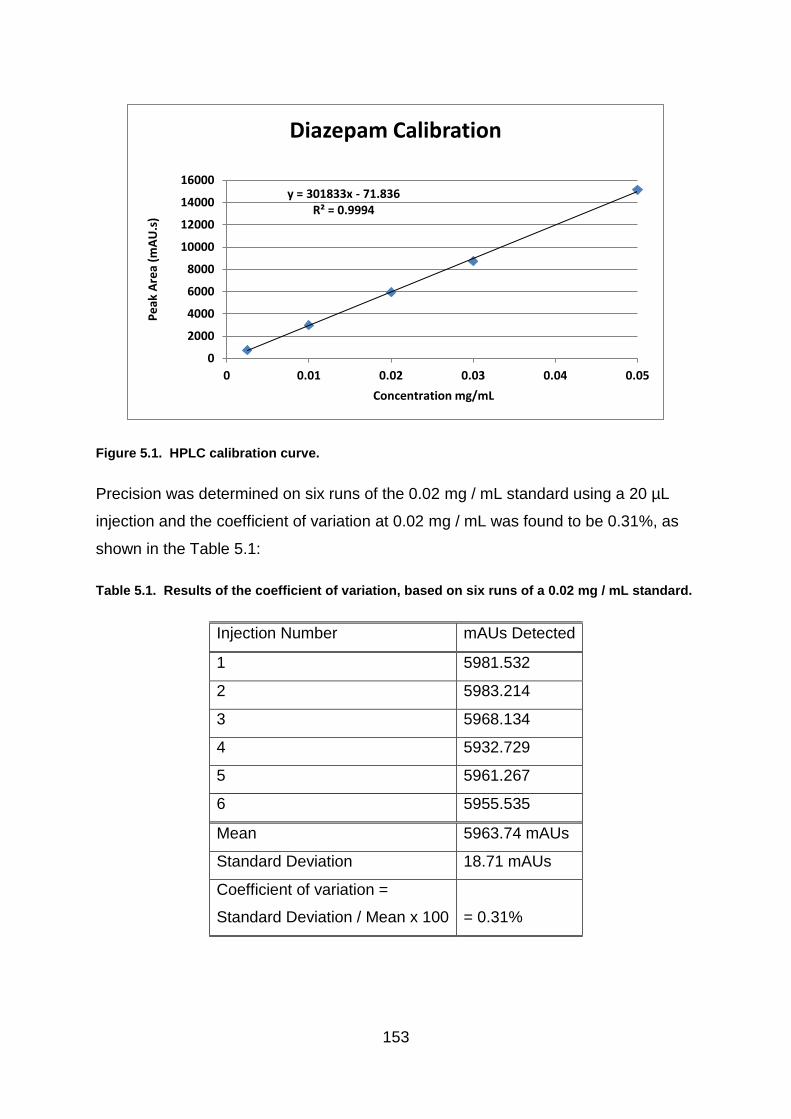
153
Figure 5.1. HPLC calibration curve.
Precision was determined on six runs of the 0.02 mg / mL standard using a 20 µL
injection and the coefficient of variation at 0.02 mg / mL was found to be 0.31%, as
shown in the Table 5.1:
Table 5.1. Results of the coefficient of variation, based on six runs of a 0.02 mg / mL standard.
Injection Number mAUs Detected
1 5981.532
2 5983.214
3 5968.134
4 5932.729
5 5961.267
6 5955.535
Mean 5963.74 mAUs
Standard Deviation 18.71 mAUs
Coefficient of variation =
Standard Deviation / Mean x 100
= 0.31%
y = 301833x - 71.836R² = 0.9994
0
2000
4000
6000
8000
10000
12000
14000
16000
0 0.01 0.02 0.03 0.04 0.05
Pe
ak A
rea
(mA
U.s
)
Concentration mg/mL
Diazepam Calibration

154
The recovery of the method was assessed by spiking 2 mL taken from a 0.05 mg /
mL sample prepared from a known 5 mg pharmaceutical tablet with 0.5 mL of a 0.1
mg / mL standard solution and making up to the mark in a 10 mL volumetric flask, to
give a final concentration of 0.015 mg / mL. The milli-absorbance units (mAUs)
obtained were put into the equation of the line determined by the calibration curve:
𝑥 =𝑚𝐴𝑈𝑠 + 71.836
301833
A mean recovery of 0.0141 mg / mL was obtained from three 0.0150 mg / mL
samples analysed. This calculated to a final recovery of 94%:
Injection 1: mAUs recovered = 4197.583
Therefore: 𝑥 =4197.583+71.836
301833 = 0.0141449
Injection 2: mAUs recovered = 4196.315
Therefore: 𝑥 =4196.315+ 71.836
301833 = 0.0141408
Injection 3: mAUs recovered = 4198.145
Therefore: 𝑥 =4198.145+71.836
301833 = 0.0141468
Mean = 0.0141442
Amount of diazepam (1) in sample = 0.015 mg / mL
Therefore 0.0141442 / 0.015 = 0.9429
x 100 = 94%
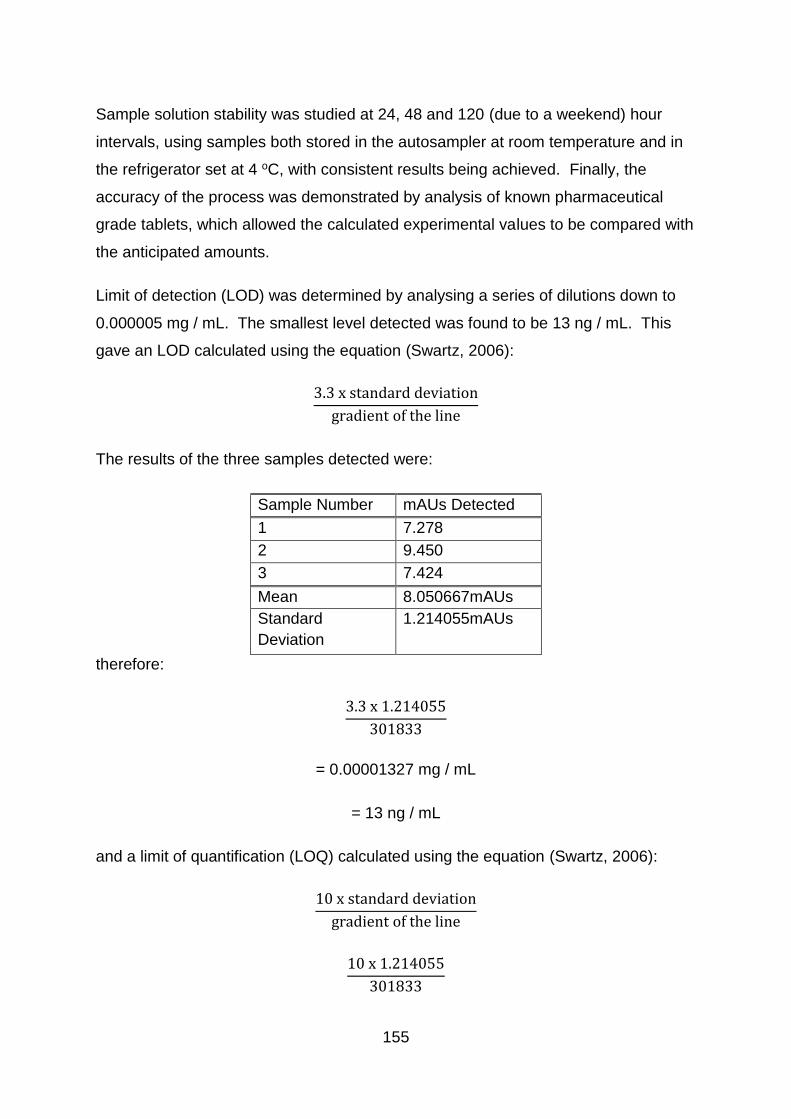
155
Sample solution stability was studied at 24, 48 and 120 (due to a weekend) hour
intervals, using samples both stored in the autosampler at room temperature and in
the refrigerator set at 4 oC, with consistent results being achieved. Finally, the
accuracy of the process was demonstrated by analysis of known pharmaceutical
grade tablets, which allowed the calculated experimental values to be compared with
the anticipated amounts.
Limit of detection (LOD) was determined by analysing a series of dilutions down to
0.000005 mg / mL. The smallest level detected was found to be 13 ng / mL. This
gave an LOD calculated using the equation (Swartz, 2006):
3.3 x standard deviation
gradient of the line
The results of the three samples detected were:
Sample Number mAUs Detected
1 7.278
2 9.450
3 7.424
Mean 8.050667mAUs
Standard
Deviation
1.214055mAUs
therefore:
3.3 x 1.214055
301833
= 0.00001327 mg / mL
= 13 ng / mL
and a limit of quantification (LOQ) calculated using the equation (Swartz, 2006):
10 x standard deviation
gradient of the line
10 x 1.214055
301833

156
= 0.00004022 mg / mL
= 40 ng / mL
5.3.7 Precision of Quantification
Due to the larger numbers involved, it was calculated that the highest standard
deviation from three replicates was produced by the 0.05 mg / mL standard, with a
standard deviation of 76.14 milli-absorbance units (mAUs). The 95% confidence
interval level of two standard deviations was used for acceptance of the results and
was calculated at 152.28 mAUs. This value was put into the equation of the line as
the y value and multiplied by the appropriate dilution factors, in order to determine
what the +/- allowance values would be in terms of mg / mL. After taking into
account the dilutions used in the tablet preparation, this equated to an allowance of
±0.37 mg per tablet.
Given that the tablet preparations had an initial dissolution factor of 100 followed by
a one in five dilution to bring the sample solution within the calibration range for a 20
µl injection, then this also meant that any errors would be subject to a multiplication
factor of 500. Clearly, this does have an impact on the reported quantification results
and all results were initially rounded to one decimal place but reported to the nearest
whole number.
In an attempt to monitor the variation of results for any one tablet, three vials were
prepared from each tablet and three injections run from each vial. In order to
understand within case variation, three tablets were prepared from each case
following the above process. However, an awareness of the possibility of error must
be considered when accepting the results of quantification.
Although potential errors and large multiplication factors may impact on the
quantification of diazepam (1), it is believed that an adequate assessment of drug
content was achieved for the purposes of this project. The results ultimately showed
a variation in diazepam (1) levels between around 8 – 48 mg in tablets that were
anticipated as containing 10 mg. Any greater precision and accuracy would have
157
required far greater input of time and use of standards and been largely unnecessary
for what was being attempted in this project. Differences in concentration of around
0.5 mg would have added little further information given that the pharmaceutical
diazepam (1) drug release specification states that the level of active drug substance
should be 10 mg +/- 7.5%, equating to 9.25 mg to 10.75 mg (British Pharmacopoeia
Commission, 2017b). In addition, the quantification of diazepam (1) was only one of
the parameters being studied for this project and the aim was to combine scientific
results to provide a greater understanding of the illicit seized tablets.
5.3.8 Run sequence
Samples were run with blanks of eluent between vials, in order to avoid carry over
between samples and to detect long retention times. Standards were run at the
beginning and end of each sequence to monitor drift and ensure daily accuracy. In
addition to the suitability check at the start and end of the run additional checks were
made between tablets of the same case. In total three tablets from each case were
normally analysed by HPLC. Three vials were prepared of each tablet solution and
three different analyses were made from each vial, giving nine results for each tablet
analysed and 27 results for each case.
5.3.9 Overview of the HPLC Analysis
5.3.9.1 Drift in Retention Times
The retention times were found to drift on occasion. This appeared to be caused by
the age of the mobile phase, the fluctuating temperatures in the laboratory and by
moving the location of the instrumentation. The mobile phase was therefore
changed weekly and was kept as consistent as possible for comparative purposes.
In addition, a diazepam (1) drug standard was run at the beginning and end of each
sequence to monitor any small drift that occurred each day.
5.3.9.2 Difference in Colourants
As each tablet was softened in water and acidified methanol, it was noted that there
were a variety of differences in the solutions produced. This was not only true of the
illicit cases but also the different manufacturer’s pharmaceutical preparations. For
158
example, the Actavis and Teva tablets produced a clear solution with insoluble blue
particulates in the bottom of the flask, whereas the MA tablets produced a pale blue
solution with a few fine residual white particulates. This would suggest a difference
in the colourant used. MA Pharmachem use the water soluble indigo carmine dye
(E132) in their manufacturing process (MA Pharmachem Ltd, 2011). Whereas,
Actavis 10 mg diazepam (1) tablets contain the HT lake (E132) version of the same
colour. The aluminium lake is a more stable dye, which is not water soluble and is
often used in the food industry (Actavis UK Ltd, 2014). Lakes are formed by the
precipitation of a food dye with an aluminium salt, making them virtually insoluble in
water and they therefore colour by dispersion (Pharmorgana GmbH, 2018).
Although the Teva tablets dissolved to produce a clear solution with insoluble blue
particulates, very similar to Actavis, the patient information leaflet only identifies the
dye E132 without detailing whether this is in lake form (Medicines and Healthcare
Products Regulatory Agency, 2015b).
Results indicated there was more fluctuation in the level of diazepam (1) content
found within the Actavis and Teva tablets during the initial analysis in this study. The
problem may have been due to incomplete dissolution of the diazepam (1) with some
active drug substance becoming trapped in the larger particulate material which was
removed during filtration. Replacing the filtration step by centrifuging the samples at
3000 RPM for 10 minutes, a more consistent level of diazepam (1) at around 10 mg
was then recovered from the pharmaceutical tablets. As a result, the centrifuge was
then used on all cases, in order to alleviate any discrepancies.
5.3.9.3 Tablet Availability
Given the small number of tablets within many of the batches, three tablets were
normally used for HPLC analysis. However, due to limited numbers of tablets, only
one tablet was analysed by HPLC from Cases 2 – 31 as the few remaining tablets
were required for other forms of analysis. Limited availability of later cases meant
the cases that were found not to contain diazepam (1) in the initial HPLC analysis
were identified by GC-MS and re-run on the HPLC along with a standard of the
indicated drug substance.

159
Although certified drug standards were run before and after each run of
pharmaceutical and illicit tablets to ensure retention times were correct for the
suspected substance, on occasion, this was not possible. For example, the limited
number of tablets available for Cases 4 and 14 meant that the initial HPLC was
performed to provide an indication of retention time. However, once the certified
standards had been obtained there were no tablets left to compare them to. The
active drug substance was then tentatively identified by matching retention times
with other cases run at the same time and then later matching them with the certified
standards. The recorded retention time for the visible peaks produced by the earlier
run of Cases 4 and 14, were also compared to the later standards. DSC
thermograms were also compared to gain additional information. This therefore may
give an indication of the active drug substance present but is not conclusive.
5.3.9.4 Consistency of Blend of the Illicit Tablets
In order to investigate the uniformity of the active drug substance within one of the
illicit tablets, a single tablet from Case 27 was quartered and analysed. A content
uniformity test was performed by Zaid et al. (2013) on ½ scored pharmaceutical
lorazepam (11) tablets. Lorazepam (11) tablets were chosen because of the
popularity of benzodiazepines and as there was a small amount of active ingredient
within the tablet. Essentially this would mean that if the tablets were inconsistent in
the distribution of active drug substance when half tablets were the prescribed dose,
which Zaid suggested was common practice, then incorrect amounts may be taken.
The results indicated that the analysed pharmaceutical tablets were evenly blended
with consistent levels of lorazepam (11) in each tablet half.
The situation was very different for this project. Case 27 had the highest recorded
level of diazepam (1) found in this study, with 48 mg reported in a single tablet. The
test was performed to investigate whether each quarter of the tablet contained an
equal amount of the diazepam (1) content.
However, as this was an illicitly manufactured tablet, it may be that if this tablet had a
high diazepam (1) content then others in the batch may have been low, depending
on how well mixed the ingredients had been prior to tableting. It is worth pointing out
160
however, that several of the tablets from this case had been analysed both during
this study and for honours projects and the quantity of diazepam (1) present had
been consistently high. Also, the results of this case may not necessarily reflect on
the effect of batch mixing for other illicit cases.
Although recreational drug use often involves the consumption of large quantities of
multiple drugs, the option of internet purchases for medicinal use in countries such
as America, may mean that half tablets are consumed. It would therefore be possible
that a person splitting what is believed to be a 10 mg diazepam (1) tablet to provide
a 5 mg dose, could be taking 20 mg of an unequally blended illicit tablet, for
example.
5.4 Results and Discussion
5.4.1 Content of Illicit Cases
5.4.1.1 Active Drug Substances Detected
The results of the HPLC analysis are shown in Table 5.2. Results were rounded to
give a reported level for statistical analysis. However, cases found to contain
between 9 – 11 mg were all reported as containing the 10 mg pharmaceutical dose
to allow for errors of measurement and the 7.5% tolerance permitted within the
pharmaceutical industry.
The results indicate that of the 65 cases of illicit tablets analysed 31% (20 cases)
were found to contain the 10 mg stated pharmaceutical dose of diazepam (1)
(approximately 9 – 11 mg); 3% (2 cases) contained a slightly lower amount
(approximately 8 mg); 26% (17 cases) contained considerably higher than the
expected dose (19 – 48 mg); and 40% (26 cases) were found to contain no
diazepam (1) but other active drug substances instead.

161
Table 5.2. Results of the HPLC analysis. The tablet marked * was used to check the
homogeneity of a quartered tablet.
Diazepam (1) content recorded in tablet (mg)
Reported Level
Mean Standard Deviation
Relative Standard Deviation
Case Number
Tablet 1 Tablet 2 Tablet 3
2 9.5 - - 10 9.5
3 8.9 - - 9 8.9
4 0 - - 0 0
5 7.8 - - 8 7.8
6 27.7 - - 28 27.7
7 22.3 21.0 - 22 21.65 0.9 4.3
8 20.4 - - 20 20.4
9 21.9 - - 22 21.9
10 9.9 - - 10 9.9
11 9.6 - - 10 9.6
12 22.3 - - 22 22.3
13 21.5 - - 22 21.5
14 0 - - 0 0
16 9.8 - - 10 9.8
23 9.6 - - 10 9.6
24 9.8 - - 10 9.8
25 7.9 - - 8 7.9
26 24.8 - - 25 24.8
27 48.4 * 40.6 - 48 44.5
28 20.3 - - 20 20.3
29 10.0 - - 10 10.0
30 10.2 - - 10 10.2
31 22.1 - - 22 22.1
71 19.8 19.0 19.5 19 19.4 0.4 2.1
72 20.6 23.1 20.3 21 21.3 1.5 7.2
73 0 0 0 0 0 0
74 8.8 9.0 8.8 9 8.9 0.1 1.3
75 21.3 19.6 17.9 20 19.6 1.7 8.7
76 0 0 0 0 0 0
77 0 0 0 0 0 0
78 8.8 8.6 8.4 9 8.6 0.2 2.3
79 8.7 8.6 8.8 9 8.7 0.1 1.2
80 9.0 8.7 8.7 9 8.8 0.2 2.0
81 8.6 8.5 8.4 9 8.5 0.1 1.2
82 8.9 8.9 8.8 9 8.9 1.0 0.7
83 8.7 8.8 8.6 9 8.7 0.1 1.2
84 0 0 0 0 0 0
85 0 0 0 0 0 0
86 8.5 8.7 8.5 9 8.6 0.1 1.4
87 0 0 0 0 0 0
88 0 0 0 0 0 0
89 0 0 0 0 0 0
90 8.5 8.6 8.6 9 8.6 0.1 0.7
127 0 0 - 0 0 0
128 0 0 - 0 0 0
129 18.3 19.4 18.7 19 18.8 0.6 3.0
130 19.6 19.7 - 20 19.7 0.1 0.4

162
Diazepam (1) content recorded in tablet (mg)
Reported Level
Mean Standard Deviation
Relative Standard Deviation
Case Number
Tablet 1 Tablet 2 Tablet 3
131 0 0 - 0 0 0
132 0 0 - 0 0 0
133 8.4 8.9 - 9 8.7 0.4 4.1
134 0 0 - 0 0 0
135 0 0 - 0 0 0
136 0 0 - 0 0 0
137 0 0 - 0 0 0
150 21.4 23.6 24.1 23 23.0 1.4 6.2
151 0 0 - 0 0 0
152 0 0 - 0 0 0
153 0 0 - 0 0 0
154 0 0 - 0 0 0
155 0 0 - 0 0 0
156 10.6 10.6 9.4 10 10.2 0.7 6.8
157 0 0 - 0 0 0
158 0 0 - 0 0 0
159 24.4 23.2 22.1 23 23.2 1.2 5.0
160 0 0 - 0 0 0
Actavis 10.5 10.6 10.7 10 10.6 0.1 0.9
Teva 10.6 10.5 10.6 10 10.6 0.1 0.6
MA Batch 061
10.8 10.6 10.8 10 10.7 0.1 1.1
MA Batch 064
10.1 10.6 10.5 10 10.4 0.3 2.5
Wockhardt 9.8 10.1 10.3 10 10.1 0.3 2.5
The diazepam (1) content within each illicit case was found to be fairly consistent,
with the largest relative standard deviation of 8.7% calculated for Case 75, which
had three tablets ranging from 17.9 mg – 21.3 mg of diazepam (1). This case was
reported as containing 20 mg of diazepam (1) for statistical purposes. However,
there were large differences between the cases, with diazepam (1) content ranging
between 8 – 48 mg. The cases which did not produce peaks corresponding to
diazepam (1) did generate peaks analogous to other active drug substances as can
be seen in Table 5.3.

163
Table 5.3. Results of HPLC analysis of different active drug standards. The case numbers
listed alongside indicate cases which were analysed at the same time as the drug standard
and which generated the same retention time.
Drug standard Retention
Time (mins)
Case Numbers
Diazepam (1) 8.8 2, 3, 5, 6, 7, 8, 9, 10, 11, 12, 13, 16, 23,
24, 25, 26, 27, 28, 29, 30, 31, 71, 72, 74,
75, 78, 79, 80, 81, 82, 83, 86, 90, 129,
130, 133, 150, 156, 159
Phenazepam (16) 7.1 – 7.3 77, 84, 85, 87, 88, 89, 131, 134, 137, 152
Etizolam (7) 6.2 73, 76, 132, 135, 151, 155, 157, 158, 160
Chlordiazepoxide (3) 12.1-12.2 136
Promethazine 6.6 – 6.7 127, 128, 153, 154
Acetaminophen 1.5 – 1.6 134, 152
Aspirin 1.38 73, 134, 152
Triazolam (18) 5.2
Ketazolam (10) 11.4
5.4.1.2 Chromatographic Separation of Active Drug Substances
Analysis of a certified ketazolam (10) standard by Gas Chromatography - Mass
Spectrometry (GC-MS), produced a chromatographic peak with the same retention
time and mass spectrum as diazepam (1), in this study (see Chapter 4). This meant
that seized tablets which produced a peak similar to the certified standard of
ketazolam (10) or diazepam (1), could not be positively identified by GC-MS alone.
However, HPLC analysis of the two substances produced different retention times,
enabling separation to be made between the ketazolam (10) and diazepam (1)
certified standards (United Nations Office on Drugs and Crime, 2012). By running
both certified standards at the beginning and end of each HPLC sequence
containing samples from the seized cases, allowed comparison to be made to the
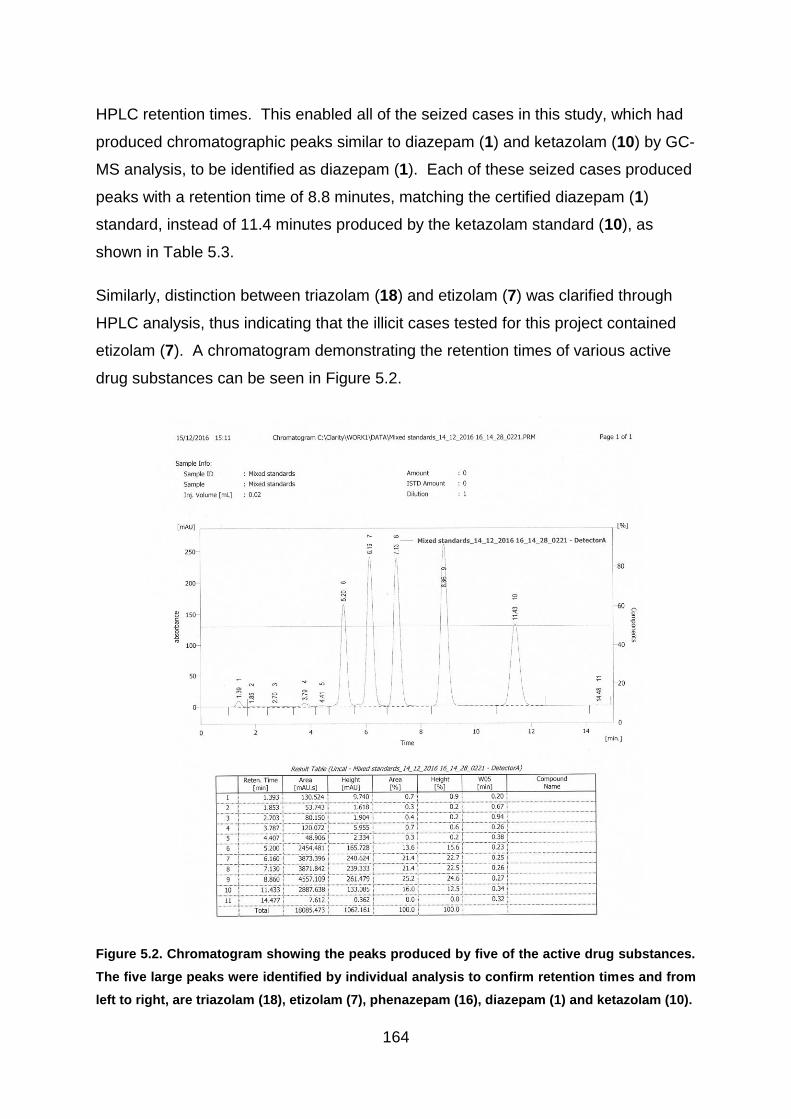
164
HPLC retention times. This enabled all of the seized cases in this study, which had
produced chromatographic peaks similar to diazepam (1) and ketazolam (10) by GC-
MS analysis, to be identified as diazepam (1). Each of these seized cases produced
peaks with a retention time of 8.8 minutes, matching the certified diazepam (1)
standard, instead of 11.4 minutes produced by the ketazolam standard (10), as
shown in Table 5.3.
Similarly, distinction between triazolam (18) and etizolam (7) was clarified through
HPLC analysis, thus indicating that the illicit cases tested for this project contained
etizolam (7). A chromatogram demonstrating the retention times of various active
drug substances can be seen in Figure 5.2.
Figure 5.2. Chromatogram showing the peaks produced by five of the active drug substances.
The five large peaks were identified by individual analysis to confirm retention times and from
left to right, are triazolam (18), etizolam (7), phenazepam (16), diazepam (1) and ketazolam (10).

165
5.4.1.3 Comparison of Case 136 to the Certified Chlordiazepoxide Standard
The cases that were not identified as diazepam (1) were tested alongside the drug
standards indicated from the GC-MS analysis. This included Case 136, which was
analysed with the certified chlordiazepoxide (3) standard. This not only produced a
peak at 12.2 minutes but was also discovered to carry over into the following blank
where it generated a peak at 9.8 minutes as noted in Figure 5.3 for both illicit tablets
and known standard. The reason for the two peaks is unclear but it may be due to the
onset of degradation with the standard and sample being analysed at the end of a run
sequence, leaving the prepared samples in slightly acidic conditions (pH5) at room
temperature in the autosampler. Further investigation could have been performed on
the chlordiazepoxide (3) standard and the samples taken from Case 136, using fresh
samples just before the run and samples which had been refrigerated. The results of
the further analysis would not have added more information for the aim of this study
which was to separate out different potential groupings among the seized cases and
was therefore not pursued.

166
Case 136 Blank after Case 136
Chlordiazepoxide Standard Blank after Chlordiazepoxide Standard
Figure 5.3. Case 136 and the following blank, along with the certified chlordiazepoxide (3)
standard and related blank.

167
Interestingly, GC-MS analysis of case 136 (Chapter 4) had indicated that there may
have been diazepam (1) present in these tablets. However, this was not corroborated
by HPLC analysis, with no peaks visible at around 8.8 minutes. If diazepam (1) was
present, it was a quantity below the LOD of 75 ng / mL.
A similar situation was discovered with Cases 127, 128, 153 and 154. These cases
were analysed at the same time as the certified promethazine standard and were
found to be consistent with the main peak appearing at approximately 6.6 minutes and
a smaller peak carrying over into the next run at about 3.7 minutes.
The results of the HPLC analysis were added to the Venn diagram (Figure 5.4), in
order to compare the new information with the previous findings. The diazepam (1)
quantification is listed in more detail in Table 5.4. The level of diazepam (1) shown
has been rounded to the nearest milligram and colour coded in groups of around 10
mg. The exception to the groupings, were the tablets which were analysed as
containing between 9.4 – 10.6 mg, which were all reported as containing the 10 mg
pharmaceutical dose to allow for errors of measurement. Anything identified as
being below 8 mg was deemed too low to be classified along with the
pharmaceutical tablets. No tablets were found to contain between 10 – 19 mgs of
diazepam (1), therefore creating an acceptable differentiation point.
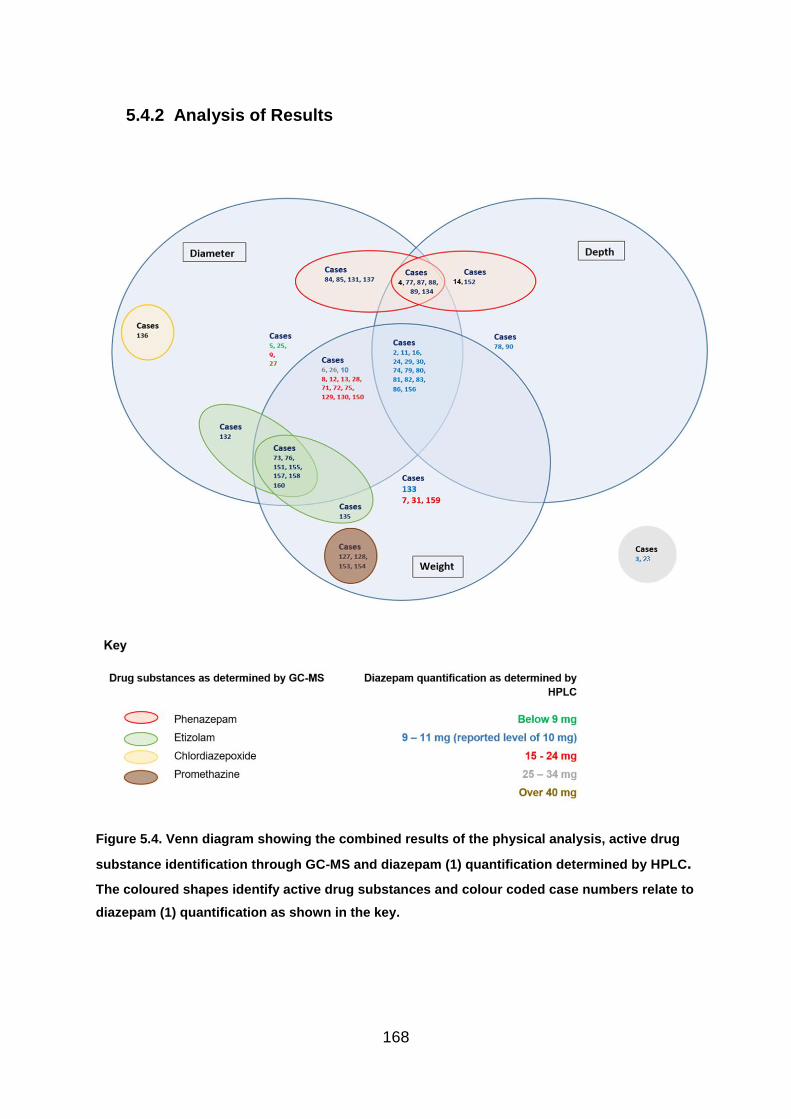
168
5.4.2 Analysis of Results
Figure 5.4. Venn diagram showing the combined results of the physical analysis, active drug
substance identification through GC-MS and diazepam (1) quantification determined by HPLC.
The coloured shapes identify active drug substances and colour coded case numbers relate to
diazepam (1) quantification as shown in the key.

169
Table 5.4. Results of HPLC analysis showing the level of diazepam (1) present in the illicit
cases. The case numbers have been colour coded for comparison to the Venn diagram
(Figure 5.4)
Diazepam level (mg) Case numbers
8 5, 25
9–11 2, 3, 10, 11, 16, 23, 24, 29, 30, 74, 78, 79, 80, 81, 82, 83, 86, 90, 133, 156
19 71, 129,
20 8, 28, 75, 130
21 72
22 7, 9, 12, 13, 31
23 150, 159
25 26
28 6
48 27
The Venn diagram identifies interesting clusters when combining the quantification of
diazepam (1) with the comparison of physical measurements. Firstly, the majority of
cases, which were recorded as containing a pharmaceutical level of diazepam (1) of
between 9-11 mg appear to be comparable to the known pharmaceutical tablets in
diameter, depth and weight. Indeed these cases, typed in blue, are the only ones
which appear in the central area of the Venn diagram, relating to consistency with the
pharmaceutical tablets. This would indicate that the illicit tablets, which do not contain
the expected level of diazepam (1) are also not consistent in physical measurement
to known pharmaceutical tablets. However, it may be that some of the seized cases,
which were found to contain the reported level of 10 mg of diazepam (1) are also of
illicit origin and further analysis is needed to further distinguish between these cases.
Interestingly, only six cases which were reported as containing 10 mg diazepam (1)
(Cases 3, 10, 23, 78, 90 and 133), were found to vary from the pharmaceutical tablets
in at least one measurement. Of the six, cases 23, 78 and 90 were imprinted with the
logo MSJ and differed from the pharmaceutical tablets manufactured for the UK
market in both diameter and weight (with case 23 differing in depth too). As described
in Chapter 3 (Section 3.5.3.1-Tablet Diameter), MSJ markings may be consistent with
the pharmaceutical company J.L. Morison Son & Jones (Ceylon) plc., which is a
licensed manufacturer in other countries. However, this is not a licensed product in
the UK, therefore these cases are deemed illicit. Case 3 was an isolated case marked

170
only with a half score on one side and is not a licensed product for the UK market.
Case 133 was a single case with the marking C/DC on one side and with a plain
reverse, relating to the UK licensed manufacturer Actavis. However, it measured a
greater depth and diameter than the known pharmaceutical batch and had a greater
relative standard deviation between the measurements recorded within the case (See
Chapter 3, section 3.5.4 - Comparison of Results).
Case 10, along with Case 81 were marked CP and D/10, which is related to the
pharmaceutical company Wockhardt. Although the tablets from Case 81 were
consistent in measurement with the pharmaceutical tablet, Case 10 was found to vary
in tablet depth
It is also worth noting that although the six cases had a reported level of 10 mg, four
of them (cases 3, 78, 90 and 133) had an analytical level of below 9 mg and were
rounded up to allow for errors of measurement. By rounding up the level of diazepam
(1), these four cases reached the lower end of the pharmaceutical level.
5.4.3 Quartered Tablet
A single tablet from Case 27 was cut into quarters using a scalpel and then weighed
as a whole tablet, at 192.4 mg. Each individual portion of the tablet was then re-
weighed individually in order to determine the percentage of the tablet size. Every
quarter of the tablet was analysed on the HPLC, as an individual sample and the
results are shown in Table 5.5.
Table 5.5. The weight and diazepam (1) content found in each quarter of a single tablet taken
from Case 27.
Number of
Quarter
Weight (mg) % of tablet
weight
Diazepam
content
(mg)
% of
Diazepam
content
Difference
in %
Diazepam
content
1 52.5 27.3 % 11.4 28.1% +2.93%
2 51.8 26.9 % 11.3 27.8% +3.34%
3 40.0 20.8% 8.2 20.2% -2.88%
4 48.1 25.0% 9.7 23.9% -4.40%
171
The results indicate that the diazepam (1) appears to have been fairly evenly spread
throughout the tablet, with the largest quantity of diazepam (1) being found in the
largest portion of the tablet and the second highest in the second largest etc. The
difference in diazepam (1) content defines the variation in the amount of diazepam (1)
found compared to the expected level in each quarter of the tablet and was calculated
by using the equation ((% diazepam (1) content - % tablet weight) / % tablet
weight)*100. However, there was a slight discrepancy, with the first two quarters
showing an increase in diazepam (1) content compared to the weight and the smaller
two having a slight loss. However, as these are illicit tablets the consistency of the
batch is still unknown because consistency may vary according to its position in the
hopper. Also, even if this batch was consistently produced, it may not follow that all
of the other illicit cases were as well mixed. Inconsistency in mixing tablets leads to
dangers of overdose, either because tablets taken are extremely high in active drug
content meaning the consumer does not realise how much they have actually
consumed, or because the tablets taken contain very little active drug substance,
giving little pharmaceutical effect. Consequently, the consumer may take a greater
quantity of tablets on the following occasion.
5.5 Conclusion
The HPLC analysis of blue tablets performed in this study was of vital importance.
As the majority of benzodiazepines in the illicit market had largely been presumed to
be diverted products of pharmaceutical origin (United Nations Office on Drugs and
Crime, 2012), no work has previously been published on the content of seized blue
‘diazepam’ (1) tablets.
The results of the HPLC analysis would indicate that there is a huge variety of
content within the illicit blue “diazepam” (1) tablet population. The tablets analysed
were all believed to be being sold as 10 mg diazepam (1) tablets however, the level
of diazepam (1) present within the analysed tablets was found to vary between
approximately 8 mg – 48 mg in a single tablet. In terms of this project HPLC proved
invaluable for distinguishing between groups of tablets containing different amounts
of diazepam (1) content. The HPLC was also able to identify that only 20 cases out
of the 65 analysed contained the pharmaceutical dose of between 9 – 11 mg of
172
diazepam (1), therefore revealing that the majority of illicit cases seized and
analysed for this project were illicit. This means that only 31% of the cases had the
potential to be pharmaceutically manufactured diazepam (1) tablets produced for the
UK market, which had been diverted into the illegal supply chain. This may reflect a
change in the illicit market from diverted pharmaceutical tablets (Advisory Council on
the Misuse of Drugs, 2016) to illicitly manufactured products, with greater access to
knowledge and equipment for clandestine operations (See Chapter 4, section 4.4.5 –
Lubricants).
In addition, the variety of active substances found including phenazepam (16) with a
potency five times greater than diazepam (1) and etizolam (7) with a potency ten
times higher reflect the variation and dangers within the illicit market. The situation
would be magnified if multiple tablets are consumed within a short time span or in
conjunction with other drugs and / or alcohol, which could have potentially serious
consequences. Therefore the results of this analysis are extremely important and
provide invaluable information for both police and medical services.

173
6.1 Chapter Summary
Differential scanning calorimetry was tested as a way to explore thermal differences
between batches of tablets. A large fraction of a pharmaceutical diazepam (1) tablet
is comprised of excipients, with only 10 mg of active drug substance present in the
samples tested for this project. Therefore, thermal events detected by DSC have the
potential of providing valuable information on the excipient content of the illicit tablets
by comparison to thermograms produced by known pharmaceutical preparations.
The technique was also explored as a way to differentiate between different batches
of seized tablets.
6.2 Introduction
6.2.1 Types of Differential Scanning Calorimeter
Differential Scanning Calorimetry (DSC) is a well-established analytical technique
that enjoys widespread use in both polymer characterisation and pharmaceutical
development. However, it is not commonly used for the forensic examination of illicit
tablets.
There are two kinds of DSC, a power compensation system and a heat flux system.
The former uses two heaters, one for the sample and the other for the reference pan.
The heaters utilise exactly the same temperature programme and it is the difference
in power used to keep the temperature the same, which is measured. The heat flux
DSC, which was employed in this study, uses a furnace to heat the sample and
reference together and uses a thermocouple to measure the difference in the heat
flow between the two pans. The heat flow is affected by the thermal changes
occurring in the sample (Craig and Reading, 2006).
Changes to the heat capacity of a sample during a heating or cooling cycle can be
used as an indication of the chemical reactions or phase changes, both of which are
characteristic of the sample being tested. Phase changes that can be detected with
DSC include dehydration, de-solvation, recrystallization, melting and degradation.
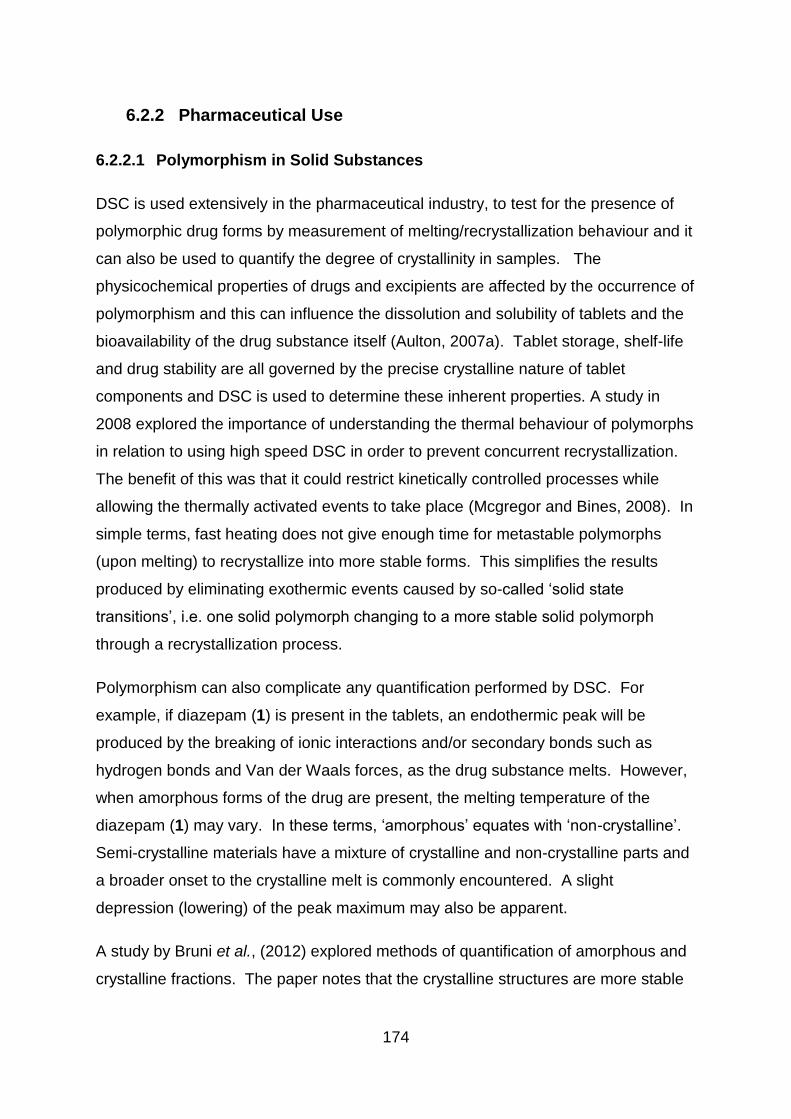
174
6.2.2 Pharmaceutical Use
6.2.2.1 Polymorphism in Solid Substances
DSC is used extensively in the pharmaceutical industry, to test for the presence of
polymorphic drug forms by measurement of melting/recrystallization behaviour and it
can also be used to quantify the degree of crystallinity in samples. The
physicochemical properties of drugs and excipients are affected by the occurrence of
polymorphism and this can influence the dissolution and solubility of tablets and the
bioavailability of the drug substance itself (Aulton, 2007a). Tablet storage, shelf-life
and drug stability are all governed by the precise crystalline nature of tablet
components and DSC is used to determine these inherent properties. A study in
2008 explored the importance of understanding the thermal behaviour of polymorphs
in relation to using high speed DSC in order to prevent concurrent recrystallization.
The benefit of this was that it could restrict kinetically controlled processes while
allowing the thermally activated events to take place (Mcgregor and Bines, 2008). In
simple terms, fast heating does not give enough time for metastable polymorphs
(upon melting) to recrystallize into more stable forms. This simplifies the results
produced by eliminating exothermic events caused by so-called ‘solid state
transitions’, i.e. one solid polymorph changing to a more stable solid polymorph
through a recrystallization process.
Polymorphism can also complicate any quantification performed by DSC. For
example, if diazepam (1) is present in the tablets, an endothermic peak will be
produced by the breaking of ionic interactions and/or secondary bonds such as
hydrogen bonds and Van der Waals forces, as the drug substance melts. However,
when amorphous forms of the drug are present, the melting temperature of the
diazepam (1) may vary. In these terms, ‘amorphous’ equates with ‘non-crystalline’.
Semi-crystalline materials have a mixture of crystalline and non-crystalline parts and
a broader onset to the crystalline melt is commonly encountered. A slight
depression (lowering) of the peak maximum may also be apparent.
A study by Bruni et al., (2012) explored methods of quantification of amorphous and
crystalline fractions. The paper notes that the crystalline structures are more stable

175
but sometimes the amorphous form of the active drug substance is preferred as it
improves bioavailability. A large proportion of the pharmaceutically manufactured
tablets are comprised of lactose, which contains both crystalline and amorphous
forms (Rowe, Sheskey and Weller, 2003). As a result, an exothermic peak can be
seen on the thermograms when the particles anneal.
The 𝞪-lactose monohydrate present in pharmaceutical tablets, has water molecules
within its structure along with additional water molecules that are adsorbed onto the
surface. Therefore, as the sample is gradually heated in the DSC, the initial falling
line on the thermogram relates to desorption of the moisture. This is followed by the
𝞪-lactose monohydrate dehydration and then its melt. It has been recorded that the
starting point for lactose to become anhydrous is 120 oC, producing an endothermic
peak at 150 oC and it begins to melt at 201 oC. The resulting peak produced by the
melt varies according to the size of the particles (Rowe, Sheskey and Weller, 2003).
The β-lactose melt takes place after this at 224 oC (Figure 6.1).
Figure 6.1. DSC thermogram of lactose identifying the thermal events. There was very little
crystallisation of this sample, therefore the peak was drawn in for demonstration.
The thermal history of a tablet can also have a significant impact on the shape of the
thermogram produced. This is particularly true of semi-crystalline substances which
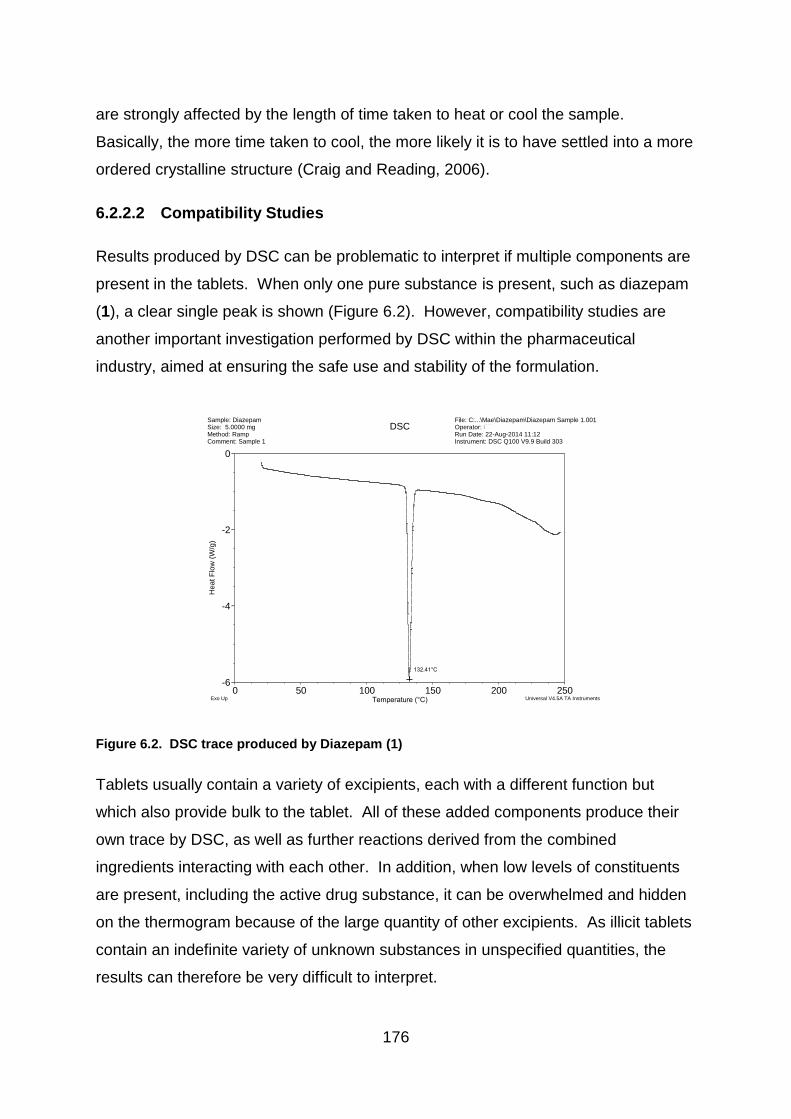
176
are strongly affected by the length of time taken to heat or cool the sample.
Basically, the more time taken to cool, the more likely it is to have settled into a more
ordered crystalline structure (Craig and Reading, 2006).
6.2.2.2 Compatibility Studies
Results produced by DSC can be problematic to interpret if multiple components are
present in the tablets. When only one pure substance is present, such as diazepam
(1), a clear single peak is shown (Figure 6.2). However, compatibility studies are
another important investigation performed by DSC within the pharmaceutical
industry, aimed at ensuring the safe use and stability of the formulation.
Figure 6.2. DSC trace produced by Diazepam (1)
Tablets usually contain a variety of excipients, each with a different function but
which also provide bulk to the tablet. All of these added components produce their
own trace by DSC, as well as further reactions derived from the combined
ingredients interacting with each other. In addition, when low levels of constituents
are present, including the active drug substance, it can be overwhelmed and hidden
on the thermogram because of the large quantity of other excipients. As illicit tablets
contain an indefinite variety of unknown substances in unspecified quantities, the
results can therefore be very difficult to interpret.
132.41°C-5.916W/g
-6
-4
-2
0
He
at
Flo
w (
W/g
)
0 50 100 150 200 250Temperature (°C)
Sample: DiazepamSize: 5.0000 mgMethod: RampComment: Sample 1
DSCFile: C:...\Mae\Diazepam\Diazepam Sample 1.001Operator: CTRun Date: 22-Aug-2014 11:12Instrument: DSC Q100 V9.9 Build 303
Exo Up Universal V4.5A TA Instruments
Mae

177
A recent study investigated the compatibility of diazepam (1) with various tablet
excipients using thermal analysis. No incompatibilities between the substances were
found but DSC did indicate that an interaction had taken place between the
diazepam (1) and colloidal silicon dioxide by demonstrating a lower enthalpy value
(Matos et al., 2017). Colloidal silicon dioxide is present in tablets produced by
Sovereign Medical (Medicines and Healthcare Products Regulatory Agency, 2016b)
and consequently pharmaceutical tablets produced by this company may show
slightly smaller thermal peaks compared to other pharmaceutical tablets.
6.2.3 Forensic Use of DSC
Forensic interest has recently been growing into the potential use of DSC. A study in
2015 used DSC to investigate amphetamine type stimulants without the potential
interference caused by creating artefacts through pre-treatment of samples
(Boumrah et al., 2015). Research performed into illicit diazepam (1) tablets,
suggests that DSC may be a powerful tool for identifying similarities and differences
between cases (Bibi et al., 2015).
One of the benefits of using DSC for forensic analysis is that the excipients within the
tablets and their interactions can be investigated. Many of the more widely used
methods of analysing illicit tablets concentrate on determination of the active drug
substance. However, as the amount of diazepam (1) present in the tablets is so
small, DSC is heavily influenced by the excipient content, thus it produces a
chemical profile that reflects primarily the thermal character of the excipients.
178
6.3 Overview of DSC analysis
A selection of known tablet excipients and a variety of different grades of lactose
were analysed by DSC. In addition, different brands of known pharmaceutical
tablets were also analysed. The resulting thermograms were visually compared to
the illicit cases. Statistical analysis was also performed on the data and the results
can be found in Chapters 7 and 8.
Multiple samples were tested from the same tablets to ensure repeatability and
consistency within individual tablets. Repetitions were also tested using multiple
tablets from the same case.
The aim of the analysis was to investigate if it would be possible to create a chemical
profile of the illicit cases that could give an indication of the constituents present
within the tablets, by comparison to thermographic peaks of common excipients. In
addition, by producing thermograms which were visually very similar this may
highlight chemical similarities between cases that had not previously been realised.
For example, if an illicit manufacturer sticks to a formula that produces successful
tablets but just changes the active ingredient, then the thermogram is likely to be
very similar, particularly if the active drug substance in only added in small
quantities. It was also intended that comparisons with the known pharmaceutical
tablets should help to denote a potential origin of the illicit cases. Likewise, seized
cases which produced DSC thermograms similar to those of known pharmaceutical
tablets could support the previous analysis regarding physical characteristics and
diazepam (1) content in identifying potential cases or pharmaceutical origin.
6.4 Experimental
6.4.1 Instrumentation
Differential Scanning Calorimeter (DSC) thermograms were produced on a TA
Instruments Q100 Differential Scanning Calorimeter with RCS90 cooling system,
using Thermal Advantage software. Samples were analysed in standard aluminium

179
pans set with a starting temperature of 20 oC. The heating rate was ramped up at 10
oC per minute to a final temperature of 250 oC. The temperature was calibrated
against indium, with a melting point of 156.60 oC, as shown in Figure 6.3.
Figure 6.3. Calibration of DSC with Indium.
6.4.2 Materials used in DSC Analysis
Illicit blue tablets were provided by Police Scotland. 10 mg diazepam (1)
pharmaceutical tablets were supplied by Actavis UK Ltd., Barnstaple; Teva
Pharmaceutical Industries, UK; and Wockhardt UK Ltd., Wrexham. Two different
batches of 10 mg diazepam (1) pharmaceutical tablets were provided M&A
Pharmachem Ltd., Bolton. Certified standards of diazepam (1) were obtained from
Sigma Aldrich and Cow and Gate Follow on Baby Milk was purchased from Asda,
Aberdeen. Standard DSC pans (900779.901) and standard lids (900786.901) were
supplied by TA Instruments Ltd, Crawley.
6.4.3 Methodology used in DSC Analysis
Samples for DSC were prepared by crushing a tablet with a clean mortar and pestle.
A small quantity between 5 – 10 mg of the powdered sample was place in a sealed
aluminium pan and heated alongside an empty reference pan, in the DSC at the
predetermined rate. The temperature difference between the pans was recorded.
-1.0
-0.8
-0.6
-0.4
-0.2
0.0
Hea
t F
low
(W
/g)
0 50 100 150 200 250Temperature (°C)
Sample: IndiumSize: 84.7000 x 0.0000 mgMethod: Cell constant calibrationComment: Cell constant calibration
DSCFile: C:\TA\Data\DSC\Mae\calibration.001Operator: MHRun Date: 09-Nov-2016 11:09Instrument: DSC Q100 V9.9 Build 303
Exo Up Universal V4.5A TA Instruments

180
(Although the samples could range between 5 – 10 mg in weight, the initial analysis
aimed at using a consistent sample size of 9 mg, in order to avoid unnecessary
discrepancies).
Samples were prepared from common tablet excipients including
polyvinylpyrrolidone (PVP), also known as Povidone. This is a synthetic polymer
that is used as a binder and is present in tablets manufactured by MA (MA
Pharmachem Ltd, 2011), and Wockhardt (Wockhardt UK, 2015). Other excipients
analysed were magnesium stearate, which is a lubricant present in most
pharmaceutically manufactured diazepam (1) tablets and EmcompressTM.
EmcompressTM is the trading name for calcium hydrogen phosphate dihydrate. This
is a commonly used filler and diluent used in the pharmaceutical industry (Rowe,
Sheskey and Weller, 2003). Interestingly, it is not normally used in diazepam (1)
tablets that are produced for the UK market. In addition, various grades of lactose
were run using DSC, in order to assess if a difference in grade would affect the
resulting thermogram. Lactose is a tablet filler or diluent used in all pharmaceutically
manufactured diazepam (1) tablets in the UK.
Samples were also prepared and run from each of the batches of known
pharmaceutical tablets for comparative purposes. This included multiple runs of up
to three samples produced from the same powdered tablet and up to eight samples
prepared from different tablets within the same batch.
One tablet was taken and prepared from each of the illicit cases. Depending on the
number of tablets available, more than one sample was occasionally analysed from
the same tablet, or multiple tablets were investigated from the same batch. The
repeats were performed on random tablets and consistency of the results was
evident.
Repeats of some of the samples were performed between 9-10 months later and
some of the pharmaceutical cases were repeated after 4 months.
Whole tablets were placed in small plastic bags and powdered tablets were
contained in vials for storage. These were not kept in a humidity or temperature
controlled environment. Storage of the tablets before seizure was also unknown.

181
6.4.4 Repeatability of the Analysis
Eight separate pharmaceutical tablets from MA Pharmachem were prepared and
analysed. Consistent results were demonstrated, as shown in Figure 6.4.
Figure 6.4. Comparison of thermograms produced by eight different pharmaceutical tablets
supplied by MA Pharmachem. Differences occurring after 220 oC were the result of sample
degradation and provided no relevant information for this project.
6.4.5 Temperature Range Analysed
The temperatures analysed for samples ranged between 100 – 220 oC. Although
the thermograms were recorded from 22 oC, many of the profiles indicate a gentle
slope reflecting a decrease in heat flow up to 100 oC. This is likely to be a result of
solvent and water loss according to storage rather than being directly characteristic
of the drug substances and excipients present in the tablet.
-4
-2
0
2
4
He
at F
low
(W
/g)
0 50 100 150 200 250Temperature (°C)
Exo Up Universal V4.5A TA Instruments

182
Similarly, many of the samples analysed began to degrade at 220 oC as
demonstrated in Figure 6.4 and by the thermogram produced by the Actavis tablet
shown in Figure 6.8. This meant that although the β-lactose melt had been
recorded at 224 oC (Figure 6.1), this was not always consistent due to falling within
the area of degradation.
It was therefore decided that these areas would not be included for the analysis or
for the data collection used in later statistical analysis. However, a great deal of data
was gained from the thermograms and data produced within the 100 – 220 oC range.
6.5 Results and Discussion
6.5.1 Common Excipients used in Pharmaceutical Tablets
No surprisingly, the thermograms produced by the excipients demonstrated
considerable differences in profile (Figure 6.5).
PolyVinylPyrrolidone
(Povidone)
Magnesium stearate
EmcompressTM
Figure 6.5. Thermograms of three tablet excipients (Povidone, Mg Stearate and
EmcompressTM) at a heating rate of 10 C / min.
However, there was less of a difference between the different varieties of lactose
(Figure 6.6). Although they are different grades, they are effectively the same
substance and therefore all lactose samples exhibited endothermic peaks at about
the same temperature for the dehydration and melt of the 𝞪-lactose monohydrate.

183
150 micron lactose Lactose Bp Spray dried lactose
Figure 6.6. Thermograms of different lactose grades showing similarity in endothermic peaks.
6.5.2 Certified Drug Standards Tested for Comparative Purposes
Most of the drug substances analysed produced different thermograms by DSC
(Figure 6.7) although the melting points of the phenazepam (16) and nitrazepam (13)
were similar. Clonazepam (4) also demonstrated a high melting point but it appeared
closer to 240 oC, than the other two. Although the analytical grade of the drug
substances produce thermograms with distinct melting points, it is important to be
aware that polymorphic forms or impurities can affect the melting point. Therefore
the drug substance suggested by comparison is not conclusive for identification
purposes. Illicit tablets in particular, contain a variety of unknown substances which
interact with the active drug substance. Synthesis of drug substances involves the
use of different organic solvents to recrystallize the drug during recovery and
purification. Many drugs can form solvates and these have their own specific
thermal behaviour which normally involves the loss of solvent to form a metastable
desolvate, followed by subsequent recrystallization into a more stable polymorphic
form. Also, the origin of the drug substance itself is unspecified therefore the level of
purity is unknown.
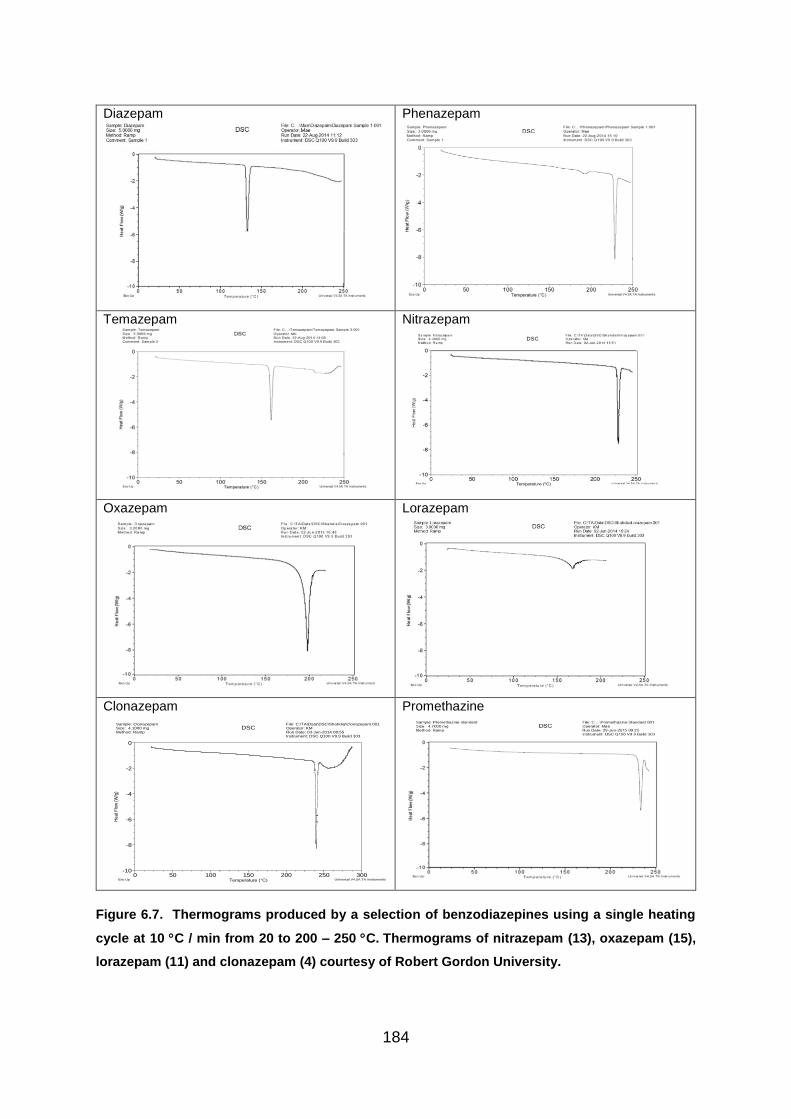
184
Diazepam
Phenazepam
Temazepam
Nitrazepam
Oxazepam
Lorazepam
Clonazepam
Promethazine
Figure 6.7. Thermograms produced by a selection of benzodiazepines using a single heating
cycle at 10 C / min from 20 to 200 – 250 C. Thermograms of nitrazepam (13), oxazepam (15),
lorazepam (11) and clonazepam (4) courtesy of Robert Gordon University.
-10
-8
-6
-4
-2
0
Hea
t Flo
w (
W/g
)
0 50 100 150 200 250 300Temperature (°C)
Sample: ClonazepamSize: 4.1000 mgMethod: Ramp
DSCFile: C:\TA\Data\DSC\Shahdia\Clonazepam.001Operator: KMRun Date: 03-Jun-2014 08:55Instrument: DSC Q100 V9.9 Build 303
Exo Up Universal V4.5A TA Instruments

185
6.5.3 Pharmaceutical Tablets Analysed by DSC
The results of DSC traces on the known pharmaceutical tablets proved interesting.
All of the thermograms appeared to be dominated by lactose, which was one of the
known ingredients. Therefore the expected dehydration and melt of the 𝞪-lactose
monohydrate was present. Occasionally a peak could be seen which could be
indicative of the β-lactose melt at 224 oC however, this could be subjective as it was
either close to or within the area of degradation which began at 220 oC.
The majority of the pharmaceutical cases produced a very similar thermogram, as
demonstrated by the MA trace shown in Figure 6.8. The thermogram generated by
the Actavis tablet exhibited some differences, however. Firstly the endothermic peak
produced by the diazepam (1) melt at 130 oC was barely visible. Only the very tip
can be seen on the trace shown in Figure 6.8. In this case, it is largely hidden by the
𝞪-lactose dehydration. Another endothermic peak is also visible at just above 58 oC.
Earlier work performed at Robert Gordon University identified this peak as stearic
acid (Bibi et al., 2015). This is a lubricant which is listed by Actavis as being in their
formulation (Actavis, 2014).
Actavis MA
Figure 6.8. Thermograms showing the differences between DSC profiles produced by the
Actavis tablet compared to the MA tablet. The pharmaceutical companies Teva and Wockhardt
manufactured tablets generated thermograms that were almost identical to that of the MA tablet.
Thermogram of Actavis tablet courtesy of Robert Gordon University.

186
The indication of diazepam (1) concentration within the tablets was also detected in
the pharmaceutical tablets. Although Roche do not produce diazepam (1) tablets for
the UK market, the tablets were originally treated as being of pharmaceutical origin
and the data produced was consistent with results from the other legitimate
manufacturers. By analysing two Roche tablets, one containing 2 mg and the other
10 mg of diazepam (1), a difference in the height of the peak produced by the
diazepam (1) melt emerged (Figure 6.9).
Figure 6.9. Thermogram showing the difference in peak size produced by melting tablets with
different amounts of diazepam (1).

187
6.5.4 Illicit Cases Analysed by DSC
At least one tablet from each case was used for DSC analysis in order to assess any
potential links between the cases. It was discovered that the 65 illicit cases could be
visually grouped into eleven potential sub-groups based on the thermograms
produced. The details of the groupings can be seen in Table 6.1. This table lists all
of the cases that generated similar thermograms, along with an example of the trace.
This allowed for minor differences, such as in the area of degradation and
crystallisation.
Table 6.1. Grouping of the thermograms produced by the various cases.
Group Thermogram Case Numbers
Group 1
2, 6, 7, 8, 9, 10, 11,
12,13, 16, 23, 24, 26,
28,29, 30, 31, 71, 72,
74,75, 78, 79, 80, 81,
82,83, 86, 90, 129,
130, 150, 156, 159
Group 2
27
-6
-4
-2
0
Heat F
low
(W
/g)
0 50 100 150 200 250Temperature (°C)
Sample: Case 6Size: 4.9000 mgMethod: Ramp
DSCFile: C:\TA\Data\DSC\Mae\Case 6\Case 6.004Operator: MaeRun Date: 18-Jun-2015 10:20Instrument: DSC Q100 V9.9 Build 303
Exo Up Universal V4.5A TA Instruments

188
Group Thermogram Case Numbers
Group 3
3, 5, 25
Group 4
4, 14, 87, 88, 152
Group 5
73, 76, 132, 135, 151,
155, 157, 158, 160,
-12
-10
-8
-6
-4
-2
0
He
at
Flo
w (
W/g
)
0 50 100 150 200 250Temperature (°C)
Sample: Case 87 T11Size: 5.1000 mgMethod: Ramp
DSCFile: C:...\Mae\Case 87\Case 87 Tablet 11.001Operator: MaeRun Date: 12-Jun-2015 10:42Instrument: DSC Q100 V9.9 Build 303
Exo Up Universal V4.5A TA Instruments
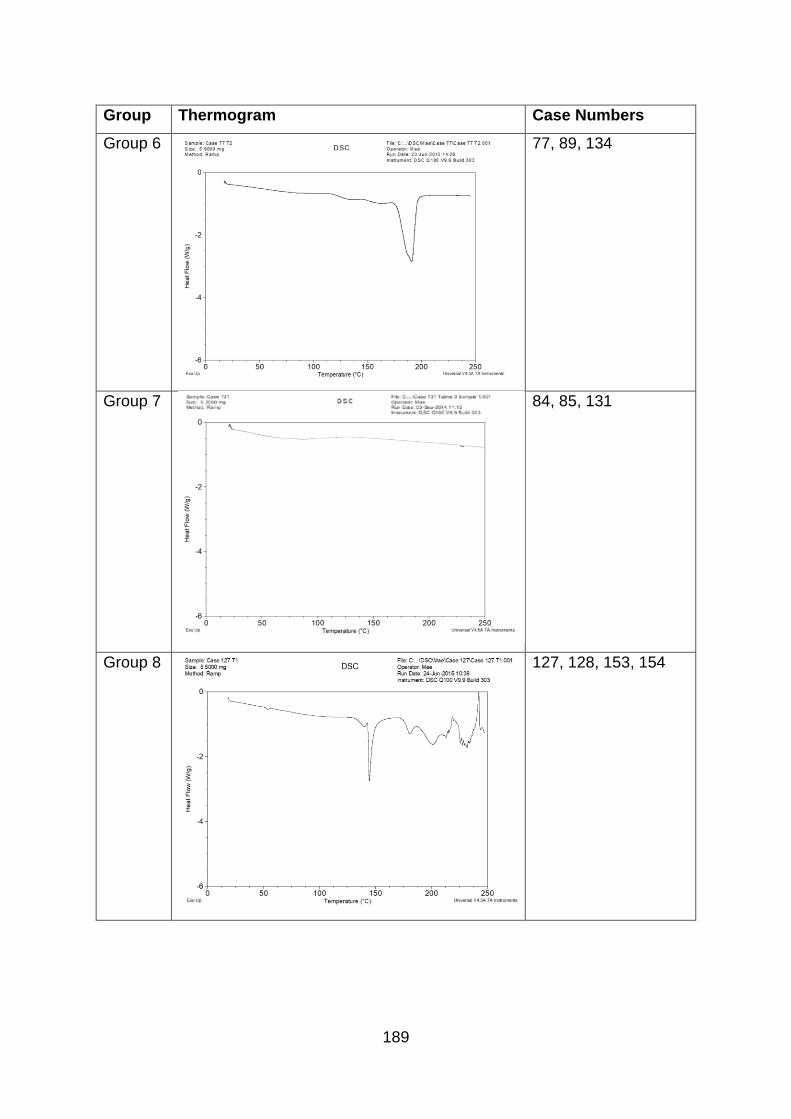
189
Group Thermogram Case Numbers
Group 6
77, 89, 134
Group 7
84, 85, 131
Group 8
127, 128, 153, 154
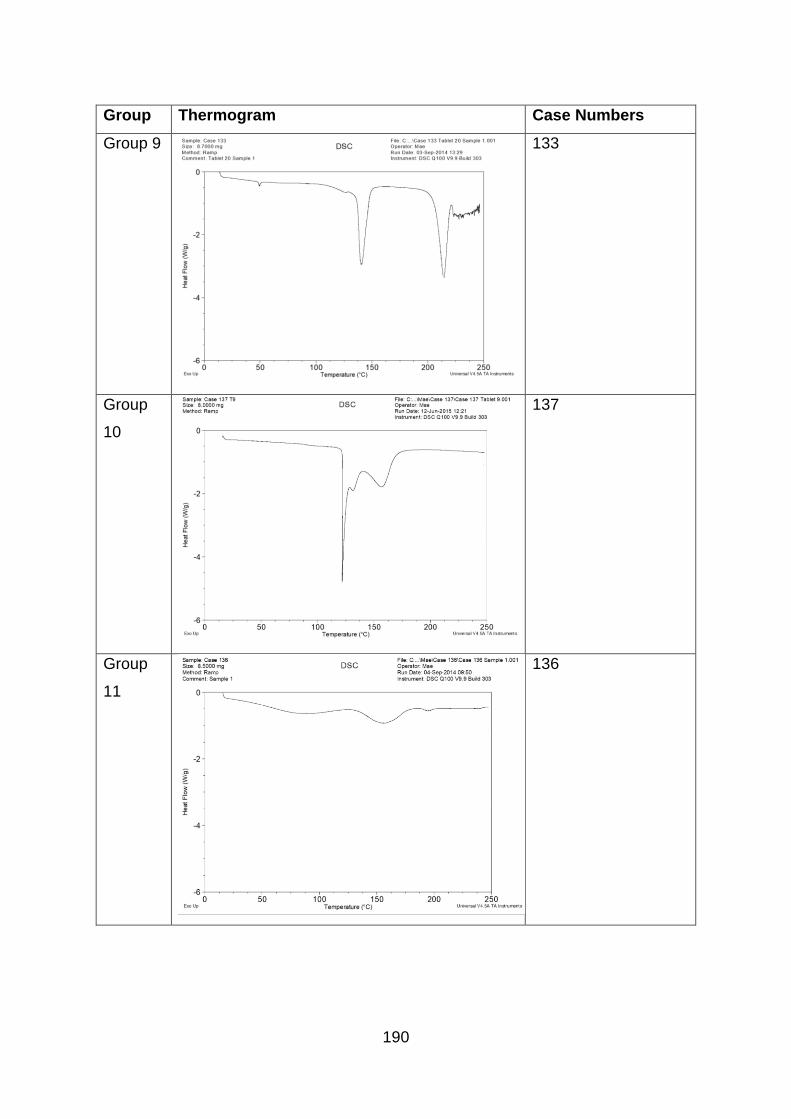
190
Group Thermogram Case Numbers
Group 9
133
Group
10
137
Group
11
136

191
Group 1
The cases listed in Group 1 include, with a few notable exceptions, the majority of
illicit cases which were found to contain diazepam (1). The fact that these tablets
have been linked together is somewhat subjective because they were found to
contain varying amounts of diazepam (1), ranging from 9 mg in Case 74 to 28 mg in
Case 6. The difference in concentration is not immediately noticeable in the
thermograms, which are largely dominated by the lactose.
Group 2
Interestingly, Case 27, which has been listed as Group 2, also produced a fairly
similar trace to Group 1. The difference with this profile was the extra endothermic
peak after the dehydration of the 𝞪-lactose monohydrate, at 160 oC. Tablets in this
case bore the same markings as Case 6, but were found to contain approximately 48
mg of diazepam (1) by HPLC analysis. Comparison of the ratio of diazepam (1) to
lactose dehydration in Groups 1 and 2 indicates an increased level of diazepam (1)
in Group 2.
Group 3
The cases in Group 3 were an interesting mix. Cases 5 and 25 had been recorded
in the visual clustering as being slightly chalky in appearance and were found to
contain approximately 8 mg of diazepam (1) by HPLC analysis. Ageing and storage
of tablets may have promoted the degradation of the drug substance and
appearance of these tablets and therefore they could not have been conclusively
deemed as being illicitly manufactured. However, DSC analysis indicated that the
thermogram produced by Cases 5 and 25 were different to the pharmaceutically
manufactured tablets.
Case 3 appeared very different visually to Cases 5 and 25, having different markings
on the tablets and being convex in shape. However, tablets in this case were also
found to contain a slightly lower amount of diazepam (1) at approximately 9 mg.
Whether theses tablets had suffered through storage or were produced from a
completely different formulation is uncertain.
192
Group 4
The cases in Group 4 were all found to contain phenazepam (16). Although the
single endothermic peak is closer to the temperature indicated for the melt of
diazepam (1), it may be that the form of the phenazepam (16) has altered its melting
point. However, using HPLC, it was discovered that the level of phenazepam (16)
present in the tablets was very small so, it is unlikely that this would produce such a
strong peak. Considering the magnitude of the heat transfer (almost 20 W/g), the
precise temperature at which it occurred and the very sharp nature of the event, a
single substance which is most probably an excipient, is dominating this tablet
sample. Without extra corroborating data such as hot stage microscope or thermal
gravimetric analysis it is not possible to state the nature of the event.
Group 5
The Group 5 tablets appear to have a very similar formulation to the pharmaceutical
diazepam (1) tablets. The only difference is that there is no melt for the diazepam
(1). GC-MS and HPLC revealed that these tablets contained etizolam (7) and in fact,
every case that was found to contain etizolam (7) was in this group. It appears that
the main constituent in them is lactose and the small amount of drug substance
present was not obvious in the form of an endothermic event. The tablets had a
variety of logos and there were differences in their shades of blue. Although well
made in appearance, the fact that etizolam (7) is not present in tablets produced for
the UK market identifies these cases as illicit.
Group 6
The three cases in Group 6 were found to contain phenazepam (16) and once more,
the small amount of active drug substance present is not clearly visible and may be
hidden behind the strong trace produced by the excipients. In these cases, the
endotherm with an onset of 175 oC is consistent with the dehydration generated by
EmcompressTM, as demonstrated in Figure 6.5.

193
Group 7
Further analysis of the cases in Group 7 indicated that these also contained
phenazepam (16), though clearly with a different formulation to those in either Group
4 or 6. It appears that the thermogram is shaped by the excipients. Although the
endothermic event at 225 oC is in the area of degradation, shown in greater detail in
Figure 6.10, this small peak appears clearly on all three thermograms. It is also
close to the melt of phenazepam (16) indicated in DSC analysis of the drug
substance, as seen in Figure 6.7.
Figure 6.10. Closer detail of thermogram produced by Group 7 cases.
Case 85 was the only one of the three Group 7 cases, which generated an additional
small endothermic peak at 165 oC. Whether this was hidden in the remaining cases
by the steep slope produced by melting is uncertain. It may also be that whatever
this constituent was, could have been present in a slightly larger concentration in
Case 85.
Group 8
The Group 8 tablets included all of the cases, which GC-MS identified as containing
promethazine. Unfortunately, there is too much sample degradation occurring to see
anything meaningful above 200 C in this group.

194
Group 9
The thermogram produced by Case 133, which is listed as Group 9 was consistent
with that produced by the pharmaceutical tablets manufactured by Actavis. There
was only a small indication of the diazepam (1) melt at 130 oC, which was obscured
by the dehydration of the 𝞪-lactose monohydrate. The endothermic peak at 50 oC,
relating to stearic acid was also visible. In addition, the tablet markings were
consistent with those used by Actavis.
Groups 10 and 11
The remaining two groups contained only one isolated case each. Group 10, which
consisted of only Case 137 was found by GC-MS analysis, to contain phenazepam
(16) and caffeine and Case 136 (Group 11) was the only case that was identified as
containing chlordiazepoxide (3) by GC-MS. As the level of phenazepam (16) in
Case 137 was small and the melting point of caffeine and chlordiazepoxide (3) is
well in excess of 200 C, the two thermograms appear to be dominated by the
unknown excipients.

195
6.5.5 Effects of Excipients
Although, it is not possible to identify excipients through this analysis because there
are so many influencing factors and interactions that must be considered, some
similarities do appear. For example, the thermogram produced by Case 136 is
similar to a trace produced by a large concentration of lactose. As a result of this, it
was decided to run a sample of ‘Cow & Gate Growing Up Milk, age 1-2 years’. As it
consists mainly of lactose, this produced a result that was similar in shape to Case
136 (Figure 6.11).
Figure 6.11. Thermogram from Case 136 overlaid with Baby milk.
Differences can be seen between the thermograms generated by the baby milk and
Case 136, however there are a wide variety of baby milk brands and formulations.
Also, Case 136 contained active drug substances and maybe other ingredients that
would have interacted with the formulation, therefore creating differences in the
trace.
Interestingly, Case 136 was the only case identified as containing chlordiazepoxide
(3), making it different to the other illicit cases. GC-MS analysis also indicated that
there may have been a small amount of diazepam (1) present in the tablets from this
case but this was not confirmed by HPLC. It is likely that any diazepam (1) present
196
in the sample used for DSC analysis would have been obscured by the large
endotherms produced by the lactose.
6.5.6 Baby Milk
Baby milk was further analysed in an attempt to determine if it would be possible to
uncover the hidden interactions behind the large endotherms produced by the
lactose. As the lactose produced such a large desorption curve at the beginning of
the trace, which was likely to be hiding other thermal events, a sample was run using
a hermetically sealed pan to prevent the water from leaving.
6.5.6.1 Methodology
Baby milk (10 mg) was analysed in a hermetically sealed pan using a thermal
programme consisting of equilibration at 20 oC (1 minute) and then heat at 20 oC per
minute to 220 oC.
6.5.6.2 Results of DSC Analysis
The sample of baby milk produced a complicated thermogram to 145 oC, followed by
a sudden dip (Figure 6.12). A large exothermic peak was then produced before the
sample degraded. The complicated line at the beginning of the trace is likely to be a
result of the fats, oils and proteins within the milk formula, as well as their
interactions, which will include melts, crystallisations and changes in the
conformation of proteins. The dip at 145 oC is likely to be caused by the dehydration
of the lactose monohydrate. Lactose is listed as one of the main constituents on the
label of the baby milk tin (Cow & Gate, 2015).
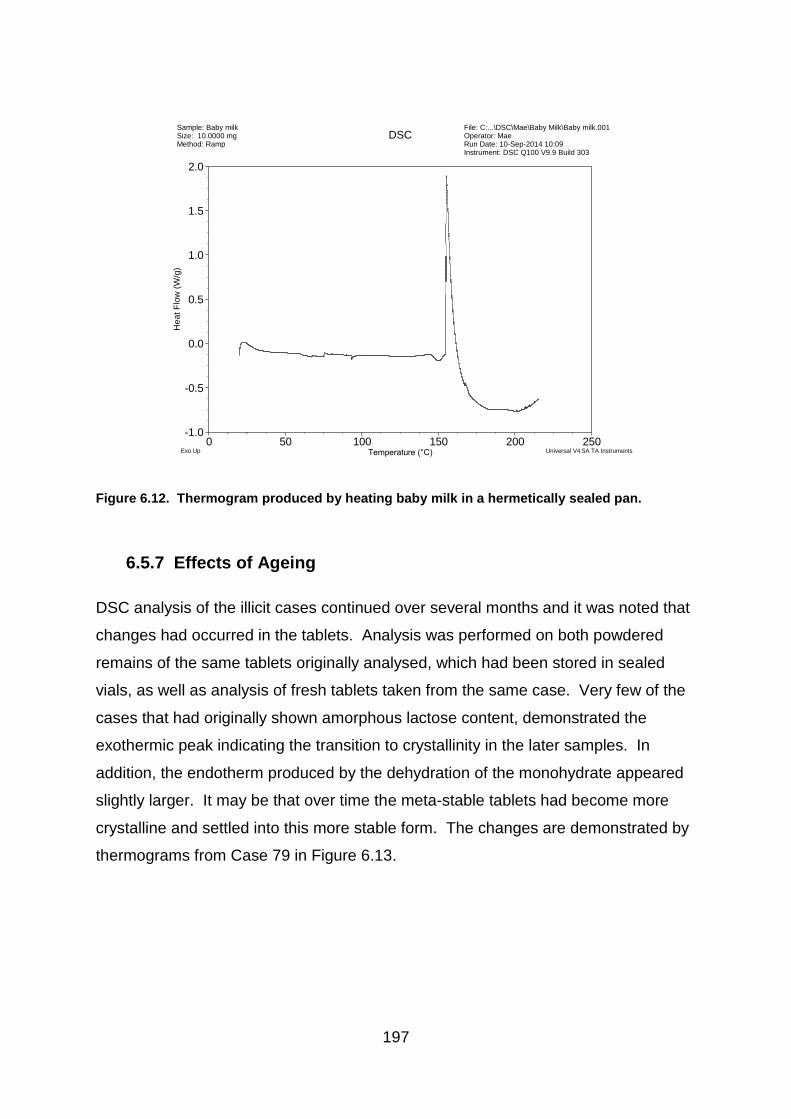
197
Figure 6.12. Thermogram produced by heating baby milk in a hermetically sealed pan.
6.5.7 Effects of Ageing
DSC analysis of the illicit cases continued over several months and it was noted that
changes had occurred in the tablets. Analysis was performed on both powdered
remains of the same tablets originally analysed, which had been stored in sealed
vials, as well as analysis of fresh tablets taken from the same case. Very few of the
cases that had originally shown amorphous lactose content, demonstrated the
exothermic peak indicating the transition to crystallinity in the later samples. In
addition, the endotherm produced by the dehydration of the monohydrate appeared
slightly larger. It may be that over time the meta-stable tablets had become more
crystalline and settled into this more stable form. The changes are demonstrated by
thermograms from Case 79 in Figure 6.13.
-1.0
-0.5
0.0
0.5
1.0
1.5
2.0H
eat F
low
(W
/g)
0 50 100 150 200 250Temperature (°C)
Sample: Baby milkSize: 10.0000 mgMethod: Ramp
DSCFile: C:...\DSC\Mae\Baby Milk\Baby milk.001Operator: MaeRun Date: 10-Sep-2014 10:09Instrument: DSC Q100 V9.9 Build 303
Exo Up Universal V4.5A TA Instruments

198
Case 79
September 2014 June 2015 Overlay
Figure 6.13. DSC thermograms produced by tablets from the same case generated 9 months
apart showing the disappearance of the inflected transition relating to crystallisation, centred
around 175 C.
The difference in crystallinity was also demonstrated in the pharmaceutical tablets
(Figure 6.14). The initial run of the tablets from this batch took place only one month
before the expiry date given on the packet. Therefore, these tablets were already
beginning to age, which may explain the slightly smaller crystal transition in the
original trace. However, within sixteen months this exothermic event was no longer
visible.
MA Pharmaceutical Batch 064
July 2015 November 2016
Figure 6.14. DSC profiles produced by tablets taken from the same batch of pharmaceutical
tablets generated 16 months apart.
-4
-3
-2
-1
0
Heat F
low
(W
/g)
0 50 100 150 200 250Temperature (°C)
Sample: Case 79 T5Size: 5.6000 mgMethod: Ramp
DSCFile: C:...\DSC\Mae\Case 79\Case 79 T5.001Operator: MaeRun Date: 23-Jun-2015 10:03Instrument: DSC Q100 V9.9 Build 303
Exo Up Universal V4.5A TA Instruments
-4
-3
-2
-1
0
He
at
Flo
w (
W/g
)
0 50 100 150 200 250Temperature (°C)
Case 79–––––––
Case 79 Tab RGU 5· · · ·
Exo Up Universal V4.5A TA Instruments
-5
-4
-3
-2
-1
0
Heat F
low
(W
/g)
0 50 100 150 200 250Temperature (°C)
Sample: M&A Batch 064 T7Size: 5.3000 mgMethod: Ramp
DSCFile: C:...\Mae\M&A\Batch 064\M&A (064) T7.001Operator: MaeRun Date: 01-Jul-2015 14:25Instrument: DSC Q100 V9.9 Build 303
Exo Up Universal V4.5A TA Instruments

199
DSC analysis was also performed on the baby milk to identify any changes that
might have taken place over time (Figure 6.15). Interestingly, this trace has begun to
show similarities to the thermograms produced by the Group 7 cases, (84, 85 and
131) (Figure 6.10). There are still noticeable differences however but further work
into the ageing of baby milk and maybe analysis of other brands could prove
interesting in the future to gain insight into the behaviour of this material compared to
lactose which is a major excipient in pharmaceutical and illicit tablets.
Figure 6.15. Thermogram produced by the same tub of baby milk as analysed in Figure 6.8 but
analysed 10 months later.
6.5.8 Analysis of Results
The results of DSC analysis of the pharmaceutical and illicit tablets indicated that
further separation could be made between the batches. By combining the data
gained through previous investigations into the physical characteristics and chemical
analysis using GC-MS and HPLC, with the groupings identified through comparison
of the thermal profiles, a more complicated scenario of potential links emerged. This
is demonstrated by the inclusion of DSC results to the Venn diagram (Figure 6.16).
-1.6
-1.4
-1.2
-1.0
-0.8
-0.6
-0.4
-0.2
He
at
Flo
w (
W/g
)
0 50 100 150 200 250Temperature (°C)
Sample: Baby Milk PowderSize: 5.4000 mgMethod: Ramp
DSCFile: C:...\Mae\Baby Milk\Baby milk powder.001Operator: MaeRun Date: 02-Jul-2015 09:27Instrument: DSC Q100 V9.9 Build 303
Exo Up Universal V4.5A TA Instruments
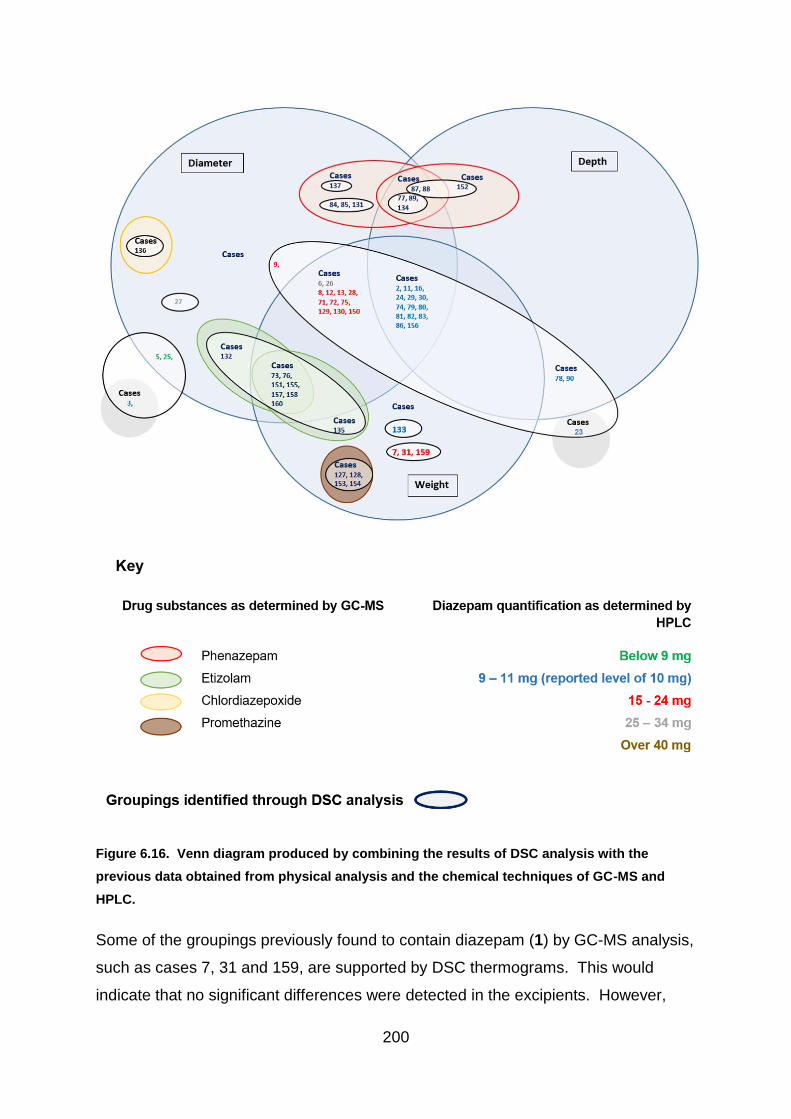
200
Figure 6.16. Venn diagram produced by combining the results of DSC analysis with the
previous data obtained from physical analysis and the chemical techniques of GC-MS and
HPLC.
Some of the groupings previously found to contain diazepam (1) by GC-MS analysis,
such as cases 7, 31 and 159, are supported by DSC thermograms. This would
indicate that no significant differences were detected in the excipients. However,

201
although DSC grouped these cases with the pharmaceutical tablets, they have been
identified as illicit due to a higher level of diazepam (1) (15 – 24 mg). Differences in
the level of diazepam (1) were not easily visible on the thermogram as the profile
was largely dominated by lactose, indicating that these illicit tablets use a formula
with some similarities to pharmaceutical tablets.
Other groupings of cases confirm the results of previous tests, such as cases 127,
128, 153 and 154, which were separated out from the remaining cases by all other
techniques. Cases 3 and 23, however, produced distinct thermograms indicating
differences between these two cases of tablets. Case 3 notably showed similarities
to cases 5 and 25 which recorded a diameter similar to the pharmaceutical tablets
but did not match with the pharmaceutical range in either depth or weight. Cases 5
and 25 also contained a level of diazepam (1) slightly lower than the pharmaceutical
dose at 8 mg. It may be that if there is a link between cases 3, 5 and 25, that these
are illicit tablets with an inconsistent blend of constituents or that they may have
been pharmaceutical tablets that did not meet the accepted standard and were
rejected. However, difference in measurements, lower diazepam (1) levels and a
thermal profile distinct from the pharmaceutical tablets would suggest that these
three cases were illicitly manufactured.
Case 23 produced a thermogram consistent with pharmaceutical tablets, along with
cases 78 and 90. These three cases were found to contain a slightly lower level of
diazepam (1) by HPLC analysis, which was rounded up to 9 mg to allow for errors of
measurement. This meant that the diazepam (1) level was at the lower end of the
pharmaceutical range. A difference in the physical measurements of the tablets had
previously separated these cases from the known pharmaceutical batches, with
cases 78 and 90 only showing consistency with the legitimate tablets in depth. Case
23 differed in all measurements.
Interestingly the cases which GC-MS analysis identified as containing phenazepam
(16) have been separated into smaller clusters according to DSC analysis, with
distinct differences being highlighted in the thermograms. This could indicate that
the phenazepam (16) tablets were produced by multiple manufacturers or at different
times, with a varying formula. However, this may require further investigation. As
202
the constituents of the phenazepam (16) tablets are unknown, it is not understood
how differences in storage conditions over a period of time may affect the thermal
profile of the illicit tablets. The initial investigations in this project have detected
changes in lactose over a short period of time. It may therefore be the case that
some of the phenazepam (16) tablets are linked but were manufactured at varying
times or have experienced different storage conditions. Alternatively, it may be that
there were differences in blend either during manufacture, or due to the small
amount of sample analysed, the portion tested may not have been fully
representative.
In contrast, the cases containing etizolam (7), two of which (cases 132 and 135) had
been separated by measurements of diameter and weight, were grouped together by
thermal analysis. The similarity in thermograms would indicate that there was no
detectable difference in their excipients by DSC analysis. As filling of die wells and
blend are more likely to be effected by human judgement and a difference in
diameter of 0.01mm may be due to errors of measurement, it may be that there is a
potential link between cases 73, 76, 132, 135, 151, 155, 157, 158 and 160.
Interestingly the DSC thermogram separated Case 133 into group 9. This case was
noted during the investigation into physical characteristics as bearing markings
consistent with tablets manufactured by the UK licensed pharmaceutical company
Actavis. The tablets in this case had slight discrepancies in both weight and
diameter with the known Actavis pharmaceutical tablets and also demonstrated a
greater variation in measurements within the batch. However, the thermogram
generated by DSC was consistent with those produced by the known pharmaceutical
samples. As mentioned in section ‘6.5.3 – Pharmaceutical Tablets’, the thermogram
produced by the Actavis pharmaceutical tablets was distinct from all other known
pharmaceutical samples tested in this project. This would therefore support the
theory that Case 133 may contain pharmaceutically manufactured tablets that have
been diverted into the illicit market. The thermogram produced by Case 133 also
revealed only a small indication of the melt of diazepam (1) at 130 oC, which was
concealed by the 𝞪-lactose monohydrate dehydration. This supports the findings of
the HPLC analysis which revealed that the tablets analysed from Case 133 had a
lower level of diazepam (1), which was rounded up to 9 mg, to allow for errors of
203
measurement. This adjustment permitted Case 133 to reach the lower level of
diazepam (1) accepted within the pharmaceutical range. The reason for the lower
level of diazepam (1) being present may be due to degradation through age and / or
storage conditions or the tablets may have originated from a rejected batch.
The group of tablets consistent with the known pharmaceutical tablets in the
previous physical and chemical analysis performed in this project (cases 2, 11, 16,
24, 29, 30, 74, 79, 80, 81, 82, 83, 86 and 156), also produced DSC thermograms
similar to the known pharmaceutical tablets. This continued to support the theory
that these cases may be of pharmaceutical origin but have been diverted into the
illegal supply chain.
6.6 Conclusion
DSC analysis into illicit tablets is an innovative use of an established technique and
no previous work on this type of analysis has previously been published. It has
proved to be an interesting and informative technique. It is a quick method of
analysis requiring little preparation and unlike many of the other analytical methods
used, which focus on the active drug substance, DSC provides a valuable insight
into the excipients present within the tablets. This is particularly important when
there is only a small amount of drug substance present.
Experiments have shown consistent results when multiple runs have been performed
on the same tablet and for different tablets within a case. The technique was found
to be sensitive enough to identify different concentrations of diazepam (1) within
tablets, as can be seen on thermograms produced by two different Roche tablets.
DSC could identify the tablets that contained diazepam (1) and distinguish between
those which contained other active substances, alongside those which contain
lactose as opposed to other diluents such as EmcompressTM. Thus, DSC has the
potential to show clear differences between the seized cases as well as showing
similarities.
204
One of the major benefits of the technique however, is that the thermograms are
largely influenced by the main excipients present within the tablets. It may be that
illicit manufacturers include a variety of active drug substances as they become
available but if they have a formulation of excipients that work, it is possible that the
other constituents will remain the same. This could therefore produce a chemical
profile which may help to identify potential links between illicit cases. This analysis
has therefore proved valuable for distinguishing between batches of seized tablets in
this project but has also provided an important insight into a technique that deserves
further investigation for future studies.
In addition, although this chapter concentrated on visual comparison of DSC
thermograms, the technique generated a vast dataset, allowing further analysis
using k-means clustering and Principal Component Analysis (PCA). The statistical
investigation compared finer detail missed by visual comparison. Both statistical
techniques were performed for this project and discussed in Chapters 7 and 8 –
‘Statistical Cluster Analysis’ and ‘Statistical Differentiation of Pharmaceutically
Manufactured Tablets’. This project therefore, presents the benefits of using DSC
for both visual and statistical analysis, making it a novel and innovative technique
with great potential for future use in forensic studies.

205
7.1 Chapter Summary
The information gained from the physical and chemical tests was used to provide
data for statistical and chemometric analysis. Agglomerative hierarchical clustering
and k-means clustering were used to explore patterns in the data and identify
potential groupings. The results of all of the experiments were then added to a heat
map under the premise that the more individual cases cluster with other individual
cases, as an indication of the probability of there being a potential link between them
7.2 Introduction
Analytical scientific techniques provide vital information regarding the chemical
content of tablets but simple comparison of drug and excipient content cannot
necessarily provide information regarding the origin of illicit cases. During this study,
chemical and physical examination of illicit and pharmaceutical diazepam (1) tablets
produced a rich dataset of measurements for each case on a range of variables.
Within this dataset there are likely to be cases that are related because they were
produced by the same manufacturer, illicit or otherwise. Cluster analysis uses the
values in a multivariate dataset such as the one produced in this study to group
similar observations (cases) based solely on their numerical values on a set of
variables.
Statistical techniques involve both supervised and unsupervised methods.
Supervised methods are used to distinguish between known numbers of groupings
within the data when examples of each can be provided to build a training set,
against which future samples can be tested. Examples of a supervised procedure
include linear discriminant analysis, which is used in the following chapter to
distinguish between known pharmaceutical tablets and those of unknown origin.
Unsupervised techniques are used to investigate patterns within the data without
prior knowledge of potential groups, allowing clusters to be determined according to
similarities between the samples alone (Clarke, 2009). In this chapter, cluster
analysis will be used to reveal groupings within the illicit cases that may suggest
206
relationships between the groups. These groups will be decided objectively using
only the numerical data produced by the analysis of the tablets’ physical and
chemical characteristics.
The clustering techniques used will be agglomerative hierarchical clustering (AHC)
and k-means clustering. These techniques are well documented for identifying
batches of illicit drugs, for example hierarchical cluster analysis was used by Ortiz
(2012) for identifying clusters between illicit viagra and cialis tablets based on
physical measurements of weight, thickness and length. In the study, the clustering
technique clearly separated the cialis tablets into two groups, illicitly and
pharmaceutically manufactured but, there proved less separation between the viagra
tablets, where the authentic tablets were grouped with batches of illicit tablets.
Principal component analysis and k-means clustering were used by Myors (1998) for
‘heroin fingerprinting’ and hierarchical clustering was also applied using ‘manhattan’
distances instead of euclidean. However, the findings of this study indicated that the
results were comparable and supported each other.
In terms of this project, ‘pharmaceutically manufactured’ refers to tablets that have
been legitimately manufactured for the UK market. Tablets originating from other
sources may have entered the illicit market through the internet, making purchases
from unknown suppliers across the world a viable option. Therefore, tablets that did
not bear the markings of a legitimate manufacturer, known to have produced tablets
for UK consumption, or tablets failing to meet the specifications regarding type and
quantity of active drug substance, were deemed as illicit for this project.
7.3 Aim of Statistical Cluster Analysis
The aim of this study was to find related groups of illicit drugs and potential links
between illicit and pharmaceutical tablets produced for the UK market by applying
cluster analysis to the dataset of physical and chemical properties. Two objective
clustering techniques were used, AHC and k-means and a subjective visual
clustering of the tablets’ appearance. A consensus was reached on the number of
appropriate clusters.
207
Each clustering technique was carried out twice; one on the physical and chemical
data and once on DSC thermogram data and combined with the subjective clustering
produced five grouping outcomes. Each clustering attempt was carried out
independently of the others and the results visualised in a heat map.
7.4 Procedure
7.4.1 Variables Used in the Analysis
The method of clustering is an exploratory data analysis method for grouping similar
observations in multivariate data sets. In this case, the observations are the cases
and there were three independent data sets used:
1. Subjective - colour, markings, general appearance and texture. Chemical
analysis performed by high performance liquid chromatography was used to
inform on type and level of active drug substance.
2. Physical – tablet diameter, thickness, weight and standard deviation of weight
was also combined with information generated through chemical analysis
regarding the type of active drug substance and amount of diazepam (1).
3. Differential Scanning Calorimetry data – 7211 heat flow measurements that
form a thermogram, supported by the visual appearance of the thermograms
provided an independent dataset that was heavily influenced by excipient
content.
7.4.1.1 Subjective Comparison
Subjective separation was carried out in order to discriminate between cases
according to physical appearance. Initially the seized cases were separated
according to tablet markings, with thirteen different sets of embossed markings
revealed. The largest group consisted of twenty-four out of the total sixty-five cases
and had the overlaid logo MA on one side with D/10 on the reverse (Figure 7.1). MA
and D/10 are the markings used by MA Pharmachem, a known pharmaceutical
manufacturer that has supplied 10 mg tablets for the United Kingdom. Although
these tablets are no longer produced by MA Pharmachem, the tablets may have
been legitimately available at the time of seizure, due to the length of their shelf-life.

208
MA Pharmachem provided specification details of their diazepam (1) tablets along
with two batches of pharmaceutically manufactured tablets for comparative purposes
in this study. Therefore, these tablets became the focus of the statistical analysis as
a valuable test sample group.
Figure 7.1. Bar chart showing the number of cases marked MA and D/10 and the amount of
tablets within the cases. Cases with the MA and D/10 marking are shown in red and those with
alternative marking are shown in blue. The named cases on the right of the chart identify
pharmaceutically manufactured batches analysed for comparative purposes.
The illicit cases bearing the MA and D/10 mark were separated visually according to
general appearance. Initially the style and size of font were considered but this was
soon disregarded after correspondence with MA Pharmachem indicated that the
company had previously produced tablets with some variability in the character size
and appearance. Thus, this feature could legitimately vary between the known
pharmaceutical tablets. Albeit, this allowance could be made, it was deemed
unnecessary as the font remained constant within the groups that were identified
through the visual clustering process. Two of the cases (case numbers 5 and 25)
had a chalky appearance and others were a deeper blue (case 73) or more green in
colour (case 5). The differences can be seen in Figure 7.2.
Cases bearing the MA marking
Cases bearing alternate marking

209
Case 2 Case 5 Case 159
Case 4 Case 73 MA Pharmaceutical
Tablet
Figure 7.2. Photographs of tablets from different cases taken with the Olympus DSX100 opto-
digital microscope. The MA pharmaceutical tablet was photographed using a Nikon D5100
camera with 36mm extension and 5000K lightbox.
Data regarding the identification of active drug substance by gas chromatography-
mass spectroscopy (Chapter 4) and quantification of diazepam (1) using high
performance liquid chromatography (Chapter 5) was analysed in combination with
the visual differences to gain extra insight. This allowed tablets containing the
expected 10 mg of diazepam (1) to be grouped together and those with a higher or
lower concentration to be placed with one another. Likewise, the tablets containing
phenazepam (16) and those with etizolam (7) were grouped accordingly (Figure 7.3).
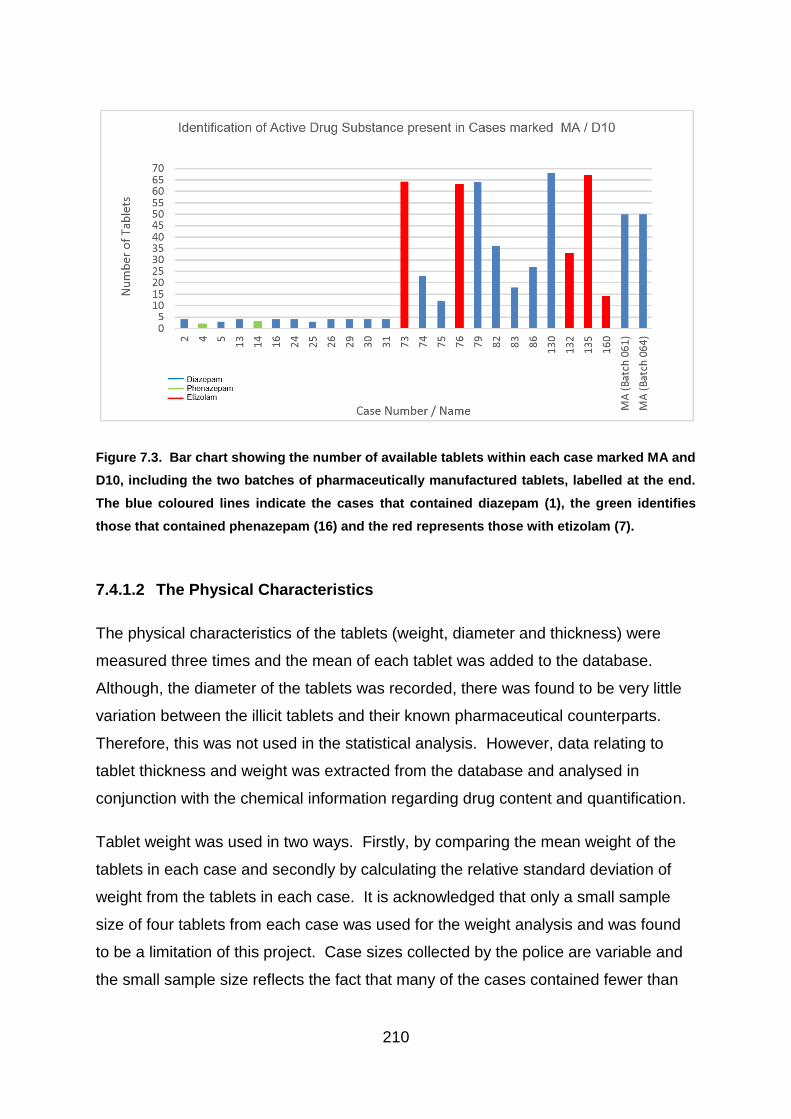
210
Figure 7.3. Bar chart showing the number of available tablets within each case marked MA and
D10, including the two batches of pharmaceutically manufactured tablets, labelled at the end.
The blue coloured lines indicate the cases that contained diazepam (1), the green identifies
those that contained phenazepam (16) and the red represents those with etizolam (7).
7.4.1.2 The Physical Characteristics
The physical characteristics of the tablets (weight, diameter and thickness) were
measured three times and the mean of each tablet was added to the database.
Although, the diameter of the tablets was recorded, there was found to be very little
variation between the illicit tablets and their known pharmaceutical counterparts.
Therefore, this was not used in the statistical analysis. However, data relating to
tablet thickness and weight was extracted from the database and analysed in
conjunction with the chemical information regarding drug content and quantification.
Tablet weight was used in two ways. Firstly, by comparing the mean weight of the
tablets in each case and secondly by calculating the relative standard deviation of
weight from the tablets in each case. It is acknowledged that only a small sample
size of four tablets from each case was used for the weight analysis and was found
to be a limitation of this project. Case sizes collected by the police are variable and
the small sample size reflects the fact that many of the cases contained fewer than
211
five tablets (Figure 7.3). Therefore, four tablets were selected from each case in
order to maximise the number of cases that were available for analysis.
It was noted that having such a small sample size for weight was a limitation with this
project. In order to test the viability of using only 4 tablets from a case, the analysis
was performed with five different sets of four tablets from each case, when the
quantities in the case so permitted. However, this did mean that the cases which
contained only four tablets continued to use data from the same four tablets. If the
four randomly chosen tablets were a representative sample, then the clustering
should essentially remain consistent.
7.4.1.3 Differential Scanning Calorimeter
Pharmaceutical diazepam (1) tablets contain only 10 mg of active drug substance,
with excipients making up the bulk of the tablet. The Differential Scanning
Calorimeter (DSC) measured changes in heat flow against temperature as a sample
was heated, creating a thermogram based on the data points. Endothermic and
exothermic peaks were created according to thermal events taking place in the
heated sample and varied in location and height according to the substances and
quantities present (Figure 7.4). DSC analysis therefore demonstrated the capacity to
identify differences between tablets based largely on their excipient content (Chapter
6 - Differential Scanning Calorimetry). The data points generated by DSC were
converted to an excel spreadsheet and analysed as an independent dataset.
Although DSC thermograms ranged from 22 – 240 oC, only the 7211 data points
relating to the temperatures between 100 oC – 220 oC were used. This was because
the lower temperature was affected by evaporation of water and solvent content from
the samples and degradation manifested at higher temperatures did not characterise
specific components within the tablets (Bibi et al., 2015).

212
Figure 7.4. DSC Thermogram of a 10 mg pharmaceutical tablet produced by MA Pharmachem.
The main peaks are identified but vary in size and location according to the components present.
7.4.2 The Clustering Techniques
A variety of statistical techniques were applied to the data produced by the physical
and chemical analyses. The intention was to demonstrate that the more frequently
two cases clustered together, the greater the likelihood of there being a potential link
between the two cases. The clustering techniques used were agglomerative
hierarchical clustering (AHC) and k-means clustering. AHC utilised the principle of
single linkage clustering to identify the different groupings, whereby each sample is
clustered with its nearest neighbour according to euclidean distance. K-means
clustering also uses euclidean distance but groupings were determined by
comparing each object to the cluster mean. Worked examples of both AHC and k-
means clustering are demonstrated in the Appendix III. The results of these
213
techniques were combined on a heat map to visualise results and determine whether
repeats of the same groupings could identify potential links between the cases.
7.4.2.1 The use of Subjective Clustering
The physical appearance of the tablets was examined and a subjective assessment
was made regarding colour and texture of the tablets. Although description of colour
is very subjective, noticeable differences between the shades of blue was very
apparent, allowing tablets to be separated. Variations in texture was also visible,
with cases 5 and 25 appearing more chalky. Again, this was subjective because the
cause of the powdery nature of the tablets within the cases was unknown and may
have been due to constituents within the tablet or storage conditions.
Differences in font were not used for separation because it was acknowledged that
pharmaceutical companies may use a variety of fonts. Interestingly, the cases did
separate according to font when chemical information was added. The identification
of active drug substance (by GC-MS) and quantification of diazepam (1) (by HPLC)
allowed further separation to made between the seized cases and all of this
information combined into five distinct groups.
7.4.2.2 The use of Agglomerative Hierarchical Clustering (AHC)
AHC uses a single-linkage technique to classify continuous data, whereby each
observation (case) starts off as being separated from the rest. For each step,
Euclidean distance is used to locate its nearest neighbour(s) and the observations
are grouped together. The process continues until all observations are grouped into
one large cluster (Kogan, 2006). The number of groups is determined by common
sense relating to background information relating to the data explored. For this
study, the number of clusters was informed by the subjective clustering, in order to
provide comparable data for the heat map. However, the dendrograms were studied
for additional intelligence generated by the data.
The data was standardized using SPSS to create a Z-score. This was done to avoid
the data being weighted towards the higher numbers and allow each variable to
contribute equally to the result. Standardization was performed by subtracting the

214
mean from each variable and then dividing the remainder by the standard deviation,
according to the equation:
𝑍𝑥 =𝑋𝑖 − 𝑋
𝑆𝑥
(Geert van den Burg, R., 2017).
AHC was performed using SPSS and a range of solutions from 2 - 10 clusters was
requested, in order to explore any alternative groupings present. The method of
nearest neighbour was used and the results were visualised in form of a
dendrogram.
7.4.2.3 The use of K-means Clustering
K-means is a clustering technique used to analyse continuous data through
Euclidean distance in a similar way to AHC. However, k-means uses a cluster
centroid to locate the nearest neighbour. As observations (or cases) are added to
the cluster, the centroid is recalculated for the following iteration (Kogan, 2006).
The number of clusters has to be stipulated by the user based on knowledge of the
data and background information and no alternatives are provided by the analysis.
This therefore has the potential of being affected by outliers. Outliers may be forced
into clusters with nearest neighbours that may be some distance away, instead of
forming a new cluster. As the centroid is then recalculated, the nature of the cluster
is altered and distorted (Liu and Lu, 2015). This is demonstrated in Figure 7.5.
Figure 7.5. The effect of outliers on k-means clustering. In the first diagram two clusters can
be identified, leaving the outlier. The cluster centre is marked in red. In the second diagram,
the outlier has been incorporated into the second cluster, thus moving the centroid.
215
The problem of distortion is less of an issue for AHC. Using AHC, as the clusters
increase in size new members are connected to the nearest neighbour, not to a
centroid and cluster distance can be visualised on a dendrogram. Therefore, in order
to help alleviate the problem caused by outliers, the number of clusters requested for
the k-means was based on the results of the AHC dendrograms. K-means clustering
was performed using SPSS with 20 iterations using running means.
7.4.3 Heat Map Creation
The results of each of the clustering techniques were combined in a heat map. This
allowed a comparison of results to be performed with the aim of highlighting cases
that consistently grouped together, given the three independent sets of variables and
three different clustering techniques applied.
Two cases consistently clustering together suggests that the two have similar
features and, in this study, given that the features relate to physical and chemical
parameters, this implies the tablets have similar chemical and physical features. It is
therefore possible that the two cases may be related i.e. they may be produced by
the same manufacturer or maybe from the same batch.
7.5 Results and Discussion
7.5.1 Results of Subjective Clustering
Examination of the tablet appearance in conjunction with chemical data regarding
active drug substance, allowed the seized cases to be separated into five groups.
Ten cases clustered in Group 1. Group 1 cases contained tablets similar in
appearance to the batches of pharmaceutical tablets provided by MA Pharmachem
and contained the anticipated 10 mg of diazepam (1).
The six cases placed in Group 2 contained more than double the expected amount
of diazepam (1) with over 20 mg and are almost certainly illicitly manufactured.

216
Group 3 contained the two tablets with a chalky appearance but also contained a
slightly lower level of diazepam (1) (8 mg instead of the purported 10 mg). Both the
drug substance level and the tablet appearance may be due to tablet content and
manufacturing procedure or they may have been affected by deterioration and
degradation over time.
Two cases were placed together in Group 4 and four cases in Group 5. The cases
in Groups 4 and 5 did not contain diazepam (1) but contained different active drug
substances, phenazepam (16) and etizolam (7) respectively, which are not licensed
in the UK and so by definition originate from an illicit manufacturer. The results of
the subjective groupings are listed in Table 7.1.
Table 7.1. The results of the subjective groupings of the tablets marked ‘MA’ and ‘D/10’.
GROUP
1
GROUP
2
GROUP
3
GROUP 4 GROUP
5
DIAZEPAM LEVEL (mg) ~10 >20 ~8 0 0
OTHER
CHARACTERISTICS
Chalky Phenazepam Etizolam
CASE NUMBERS 2 13 5 4 73
16 26 25 14 76
24 31 132
29 75 135
30 130
74 159
79
82
83
86

217
7.5.2 Results of AHC
7.5.2.1 Active Drug Substance and Physical Data
Agglomerative Hierarchical Clustering (AHC) was used to define groupings in the
illicit cases using the variables of the mean weight and relative standard deviation of
weight from a random sample of four tablets taken from each case and the quantity
of diazepam (1) measured by HPLC (Chapter 5). The two batches of known MA
pharmaceutical tablets MA 061 and MA 064 were analysed alongside the illicit
tablets for comparative purposes.
Three clusters were requested in the analysis based on the subjective clustering of
the MA marked cases. Subjectively these tablets had been separated into five
groups; however neither cases 4 and 14 nor cases 5 and 25 contained four tablets
where weight measurements had been available. Therefore, these cases were not
included in the AHC or k-means clustering of the physical data combined with the
diazepam (1) quantification. As these four cases alone made up two of the groups
identified by subjective clustering (Groups 3 and 4), it meant that three clusters
would have been expected, with Group 1 visually grouping alongside the
pharmaceutical tablets.
Both standardised and non-standardised data was tested (see section 7.3.2.2. –
AHC) and the results indicated that when the data was not standardised, the
diazepam (1) quantification dominated the clusters and the groupings reflected the
concentration levels. However, when the data was standardised the majority of
cases clustered together, with a few outliers. Although the outliers were shown as
individual groups, clusters could still be identified to support the subjective clustering
results. This was shown in the dendrograms produced by the AHC of the MA marked
cases as demonstrated in Figures 7.6 and 7.7. In Figure 7.6 three clusters can be
identified at a distance measure of 20, which is shown as a red dotted line. The
three clusters represent cases that contained 10 mg of diazepam (1), those with no
diazepam (1) but etizolam (7) as the active drug substance and cases that contained
over 20 mg of diazepam (1). Figure 7.7 shows the same three clusters at a distance
measure of 4 (shown as a red dotted line) but also identifies two outliers. The
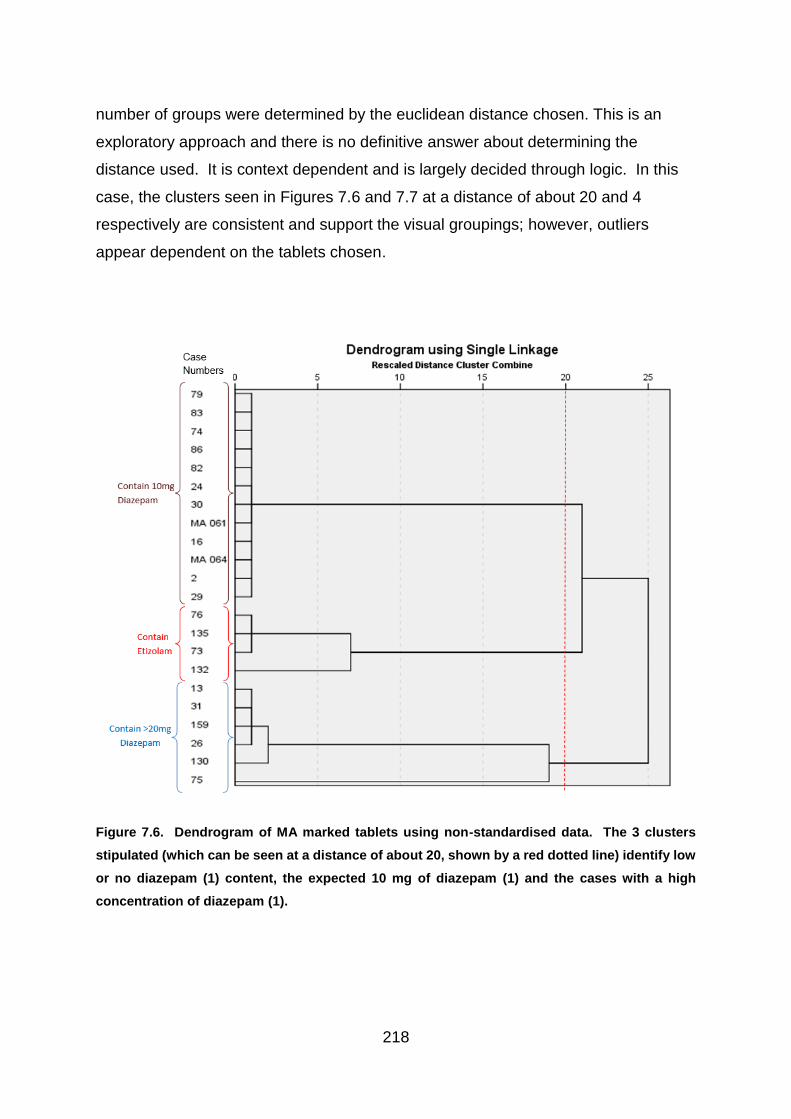
218
number of groups were determined by the euclidean distance chosen. This is an
exploratory approach and there is no definitive answer about determining the
distance used. It is context dependent and is largely decided through logic. In this
case, the clusters seen in Figures 7.6 and 7.7 at a distance of about 20 and 4
respectively are consistent and support the visual groupings; however, outliers
appear dependent on the tablets chosen.
Figure 7.6. Dendrogram of MA marked tablets using non-standardised data. The 3 clusters
stipulated (which can be seen at a distance of about 20, shown by a red dotted line) identify low
or no diazepam (1) content, the expected 10 mg of diazepam (1) and the cases with a high
concentration of diazepam (1).

219
Figure 7.7. Dendrogram of MA marked tablets using standardised data. Although groupings
containing the different concentrations of diazepam (1) can be seen, the three clusters stipulated
identify one main cluster and two outliers and can be seen at a distance of 10 (blue dotted line).
However, at a distance of 4 (red dotted line), the identified clusters support the visual groupings
plus the two outliers.

220
7.5.2.2 Sample Size Test
The clustering was repeated using a different random sample of four tablets to
evaluate whether such a small sample was representative for the case from which it
was extracted. In total, the test was run five times, with a different sample of four
tablets taken from each case, every time. The results were similar to previous
dendrograms (Figures 7.6 and 7.7), which indicated that when a tablet was identified
in Cluster 1 at a distance measure of about 10, it appeared to support the visual
groupings, whereas clusters 2 and 3 appeared to be outliers. The cases identified
as outliers changed each time, according to the four tablets chosen for the weight
analysis. Each case fell within the same grouping each time, unless it was identified
as an outlier (Figure 7.7). Table 7.2 shows how many times each of the cases
clustered in a group other than the main Cluster 1. Eight of these separations
occurred during the third run of the test. The group in which each case clustered is
also identified.

221
Table 7.2. Cluster membership for each case using five different samples containing four
tablets. According to the dendrogram shown in Figure 7.7, groups 2 and 3 appear to be outliers.
The cases separated from the main cluster changed each time according to the four tablets
chosen for the weight analysis, indicating some variation within each case.
Cluster number
Case
Number
Run
1
Run
2
Run
3
Run
4
Run
5
No of times case separates from main
cluster
2 1 1 1 1 1 0
13 1 1 1 1 1 0
16 1 1 1 1 1 0
24 1 1 1 1 1 0
26 1 1 3 1 1 1
29 1 1 3 1 1 1
30 1 1 1 1 1 0
31 1 1 1 1 1 0
73 1 1 2 1 1 1
74 1 1 1 1 1 0
75 1 1 1 1 3 1
76 1 1 2 3 1 2
79 1 3 1 1 1 1
82 2 1 3 1 1 2
83 1 1 1 1 1 0
86 3 1 1 1 1 1
130 1 1 1 1 1 0
132 1 2 2 2 2 4
135 1 1 2 1 1 1
159 1 1 3 1 1 1
MA 061 1 1 1 1 1 0
MA 064 1 1 1 1 1 0
In effect, the different cases which kept falling as outliers were largely inconsistent,
with only 3 of the cases being identified as belonging to a different cluster on more
than one occasion. Case 132 was the only case identified more than twice, with four
separate samples being identified as inconsistent with the main group. These
findings would indicate that there was some variability in weight between the tablets
in a single case and therefore a sample set of four would not be ideal for producing
the most consistent results in this type of analysis. However, as explained in section
7.3.1.2 (Physical Characteristics), due to the small number of tablets in some cases,
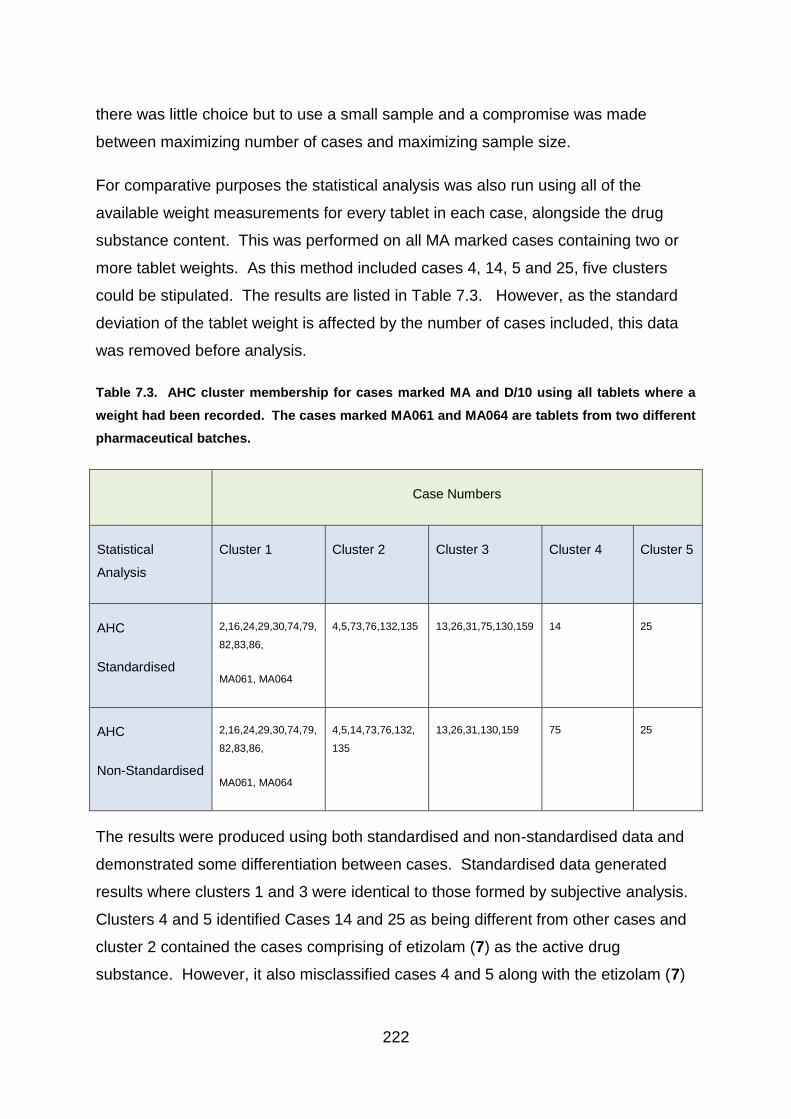
222
there was little choice but to use a small sample and a compromise was made
between maximizing number of cases and maximizing sample size.
For comparative purposes the statistical analysis was also run using all of the
available weight measurements for every tablet in each case, alongside the drug
substance content. This was performed on all MA marked cases containing two or
more tablet weights. As this method included cases 4, 14, 5 and 25, five clusters
could be stipulated. The results are listed in Table 7.3. However, as the standard
deviation of the tablet weight is affected by the number of cases included, this data
was removed before analysis.
Table 7.3. AHC cluster membership for cases marked MA and D/10 using all tablets where a
weight had been recorded. The cases marked MA061 and MA064 are tablets from two different
pharmaceutical batches.
Case Numbers
Statistical
Analysis
Cluster 1 Cluster 2 Cluster 3 Cluster 4 Cluster 5
AHC
Standardised
2,16,24,29,30,74,79,
82,83,86,
MA061, MA064
4,5,73,76,132,135 13,26,31,75,130,159 14 25
AHC
Non-Standardised
2,16,24,29,30,74,79,
82,83,86,
MA061, MA064
4,5,14,73,76,132,
135
13,26,31,130,159 75 25
The results were produced using both standardised and non-standardised data and
demonstrated some differentiation between cases. Standardised data generated
results where clusters 1 and 3 were identical to those formed by subjective analysis.
Clusters 4 and 5 identified Cases 14 and 25 as being different from other cases and
cluster 2 contained the cases comprising of etizolam (7) as the active drug
substance. However, it also misclassified cases 4 and 5 along with the etizolam (7)

223
cases. Potentially, if these cases were illicitly made, the same formula could have
been used with different active drug substances, therefore giving a similar weight.
Case 5, which contained diazepam (1), had been visually grouped with Case 25 due
to its chalky appearance and Case 4 had been previously clustered with Case 14 as
they both contained phenazepam (16). However, the AHC cluster analysis
categorised these cases as being different. The difference between the clusters are
recorded in Figure 7.8.
The non-standardised data clustered cases 4 and 14, which contained phenazepam
(16), in Group 2, with the cases containing etizolam (7) and separated case 75.
Figure 7.8. Dendrogram of all MA marked tablets using all available tablet weights and
standardised data.
224
The dendrogram of all tablets does contain a variety of case sizes. The mean of all
tablets within a case provides a centroid, with the larger cases forming a larger
population in the cluster and a more accurate centroid on which to base the analysis.
However, AHC is an unsupervised method of clustering which relies only on
similarities within the dataset to form clusters rather than previous knowledge of the
tablet origins, so there can be no certainty that the tablets within the suggested
groupings bear any relationship with each other, except for their similar properties.
7.5.2.3 Analysis of Chemical Test Results Generated by DSC
DSC thermograms show the data generated by heat flow against temperature at a
given time. The data related to temperatures lower than 100 oC and above 220 oC
were removed from the dataset (see section 7.3.1.3 - Differential Scanning
Calorimeter) and the remaining data was standardised and compared using both
AHC and k-means clustering.
Initially the MA marked tablets were tested by AHC and the results indicated that for
five clusters, all cases tended to group together except for four cases, which formed
their own individual clusters as shown in the dendrogram in Figure 7.9. The five
clusters can be seen at a distance measure of about 13 and is indicated with a red
dotted line. The cases clustered individually were numbers 4, 14, 5 and 25, which
subjective analysis had anticipated as being different but clustered in pairs.
However, a closer look at the resulting dendrogram (Figure 7.9) proves interesting.

225
Figure 7.9. Dendrogram of the MA marked cases generated using data produced by DSC.
The dendrogram based on DSC data was generated from DSC thermogram data
alone and contains no further input, such as drug quantification. Each thermogram is
composed of 7211 sample heat flow values at a temperature between 100 and 220
oC. The thermogram is based on the reactions of the sample constituents, the
majority of which are excipients rather than the active drug substance itself.
Although the five clusters suggested by the subjective comparison are not entirely
consistent with DSC results, the different clusters are still visible at the smaller
distances with the subjective groups 1 and 2 being split into two clusters

226
each. Interestingly, the tablets in Cluster 1, which were considered to be potential
pharmaceutical tablets in the subjective cluster have been separated. Due to
potential errors of measurement and precision, during hplc analysis, all cases found
to contain between 9-11 mg of diazepam (1) had a reported level of 10 mg for this
project. However, in terms of DSC results, the cases which had been found to
contain around 10 mg of diazepam (1) in the HPLC analysis, clustered very closely
with the pharmaceutical tablets in DSC clustering. However, those with a recorded
weight closer to 9 mg of diazepam (1) during HPLC analysis (cases 74,79,82,83 and
86), clustered separately based on DSC results. 9 mg is slightly low for the drug
concentration permitted within the pharmaceutical industry but the level is close
enough that it may be a result of degradation through ageing of the tablet, or maybe
due to mathematical or analytical errors e.g. rounding of figures, or experimental
inconsistencies, therefore they were reported as 10 mg tablets with the potential to
be pharmaceutical. It is therefore interesting that DSC data identified a variation in
these cases based largely on the excipient content, when no extra information
regarding drug substance or quantification was included in this analysis. Cases 4,
14, 5 and 25 were notably different to the other cases.
The nine clusters (including outliers) at a distance of 5 were taken as the results of
the AHC cluster analysis of DSC data, for the generation of the heat map in section
7.4.4.
7.5.3 Results of K-means Clustering
7.5.3.1 Active Drug Substance and Physical Data
K-means clustering of the physical data and chemical information regarding active
drug substance was tested in both standardised and non-standardised form. This
was based on the mean weight and standard deviation of weight, along with quantity
of diazepam (1) from four randomly chosen tablets within each case. K-means
produced the same results as the AHC analysis and indicated that non-standardised
data was heavily influenced by diazepam (1) quantification, whereas standardised
data produced one main cluster and isolated ungrouped cases.

227
7.5.3.2 Sample Size Test
The results of the sample size test, where a different four tablets were randomly
chosen from each case when the required data was available, revealed that the
cases which clustered apart from the main group were not necessarily identical to
those separated by AHC. The results are shown in Table 7.4, which shows that
fifteen more cases were separated from the main cluster using k-means clustering
than with AHC. In each of these fifteen instances, the cases were separated away
from Group 1 which contained the known pharmaceutical batches. Interestingly, with
the exception of Case 29 in the fourth run of the experiment, all of the remaining
separations were cases which had been subjectively differentiated from the
pharmaceutical tablets based on the level of diazepam (1) present and the type of
active drug substance. These cases were therefore likely to be illicitly manufactured
and k-means detected a greater variability within them.

228
Table 7.4. Cluster membership for each case using five different samples of four tablets,
indicated by AHC and k-means cluster analysis. The cases separated from the main cluster
changed each time according to the four tablets chosen for the weight analysis, indicating some
variation within each case. Cluster membership that differed between the groupings identified
by AHC and k-means are highlighted in yellow. The case numbers at the side are coloured
according to the subjective clustering technique, whereby the dark blue represents Group 1
which contain 10 mg of diazepam(1), pale blue represents Group 2 which contain over 20 mg of
diazepam(1) and the pink represents Group 5 which contain etizolam (7).
Cluster number AHC Cluster number k-means
Case Number
Run 1
Run 2
Run 3
Run 4
Run 5
No of times case separates from main cluster
Run 1
Run 2
Run 3
Run 4
Run 5
No of times case separates from main cluster
2 1 1 1 1 1 0 1 1 1 1 1 0
13 1 1 1 1 1 0 1 1 1 3 1 1
16 1 1 1 1 1 0 1 1 1 1 1 0
24 1 1 1 1 1 0 1 1 1 1 1 0
26 1 1 3 1 1 1 1 1 3 3 1 2
29 1 1 3 1 1 1 1 1 3 3 1 2
30 1 1 1 1 1 0 1 1 1 1 1 0
31 1 1 1 1 1 0 1 1 3 3 1 2
73 1 1 2 1 1 1 1 2 2 1 2 3
74 1 1 1 1 1 0 1 1 1 1 1 0
75 1 1 1 1 3 1 1 1 3 3 3 3
76 1 1 2 3 1 2 1 2 2 2 2 4
79 1 3 1 1 1 1 1 3 1 1 1 1
82 2 1 3 1 1 2 2 1 3 1 1 2
83 1 1 1 1 1 0 1 1 1 1 1 0
86 3 1 1 1 1 1 3 1 1 1 1 1
130 1 1 1 1 1 0 1 1 1 3 1 1
132 1 2 2 2 2 4 1 2 2 2 2 4
135 1 1 2 1 1 1 1 2 2 1 2 3
159 1 1 3 1 1 1 1 1 3 3 1 2
MA 061 1 1 1 1 1 0 1 1 1 1 1 0
MA 064 1 1 1 1 1 0 1 1 1 1 1 0
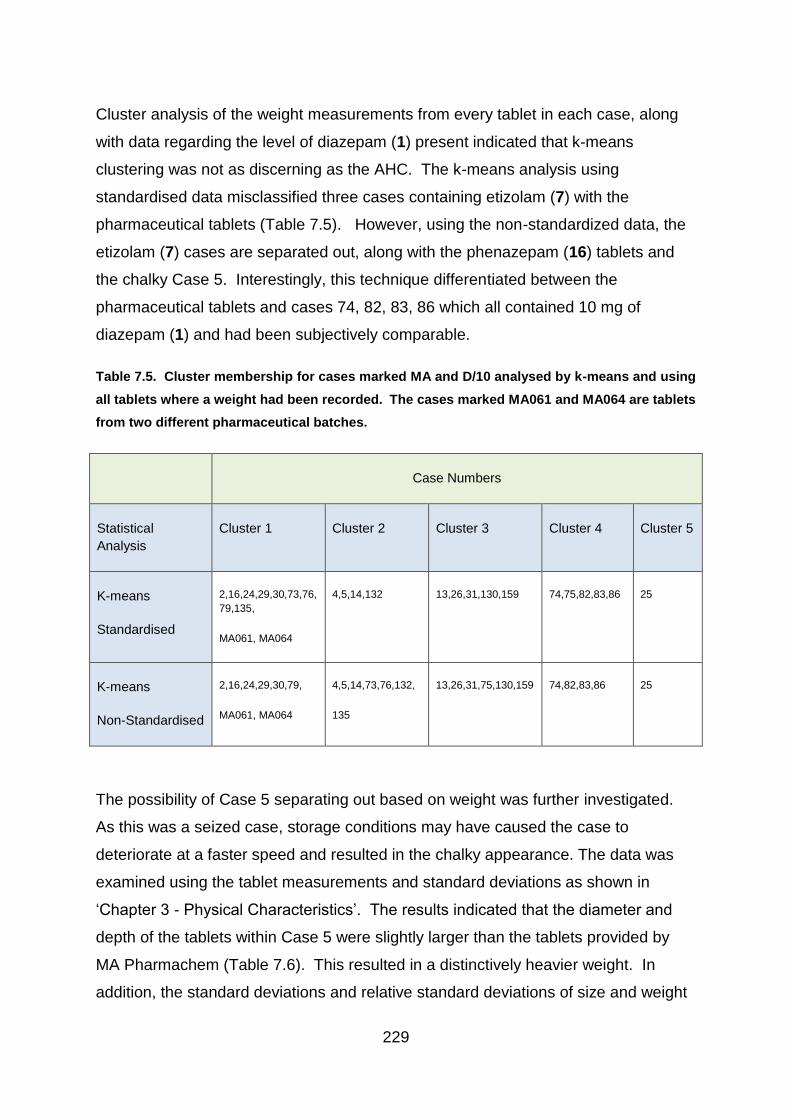
229
Cluster analysis of the weight measurements from every tablet in each case, along
with data regarding the level of diazepam (1) present indicated that k-means
clustering was not as discerning as the AHC. The k-means analysis using
standardised data misclassified three cases containing etizolam (7) with the
pharmaceutical tablets (Table 7.5). However, using the non-standardized data, the
etizolam (7) cases are separated out, along with the phenazepam (16) tablets and
the chalky Case 5. Interestingly, this technique differentiated between the
pharmaceutical tablets and cases 74, 82, 83, 86 which all contained 10 mg of
diazepam (1) and had been subjectively comparable.
Table 7.5. Cluster membership for cases marked MA and D/10 analysed by k-means and using
all tablets where a weight had been recorded. The cases marked MA061 and MA064 are tablets
from two different pharmaceutical batches.
Case Numbers
Statistical
Analysis
Cluster 1 Cluster 2 Cluster 3 Cluster 4 Cluster 5
K-means
Standardised
2,16,24,29,30,73,76,
79,135,
MA061, MA064
4,5,14,132 13,26,31,130,159 74,75,82,83,86 25
K-means
Non-Standardised
2,16,24,29,30,79,
MA061, MA064
4,5,14,73,76,132,
135
13,26,31,75,130,159 74,82,83,86 25
The possibility of Case 5 separating out based on weight was further investigated.
As this was a seized case, storage conditions may have caused the case to
deteriorate at a faster speed and resulted in the chalky appearance. The data was
examined using the tablet measurements and standard deviations as shown in
‘Chapter 3 - Physical Characteristics’. The results indicated that the diameter and
depth of the tablets within Case 5 were slightly larger than the tablets provided by
MA Pharmachem (Table 7.6). This resulted in a distinctively heavier weight. In
addition, the standard deviations and relative standard deviations of size and weight

230
indicate a greater variation within the case, compared to the pharmaceutical tablets.
This would therefore suggest that the statistical methods were correct in separating
out this case from the pharmaceutical tablets.
Table 7.6. Mean weight and size measurements of tablets within Case 5 in comparison to
pharmaceutical batches. Information taken from Chapter 3 – Physical Characteristics.
Diameter
(mm)
Depth
(mm)
SD of
depth
(mm)
RSD of
depth
%
Weight
(mg)
SD of
weight
(mg)
RSD of
weight
%
Case 5 8.13 3.11 0.057 1.82 216.3 2.60 1.20
MA061 8.08 2.59 0.016 0.62 170.7 1.13 0.66
MA064 8.07 2.65 0.021 0.78 170.3 1.58 0.93
The results of the k-means clustering appeared to be slightly less discerning than the
AHC. This is probably because the centroid moves with each addition to the group
thus causing it to be heavily influenced by outliers, as explained in section 7.3.2.3. –
k-means Clustering.
7.5.3.3 Results of K-Means Clustering of DSC Data
K-means clustering of DSC data was initially performed with five groups requested
based on the subjective comparison and then on the nine groups indicated by the
AHC.
The results of the five group analysis separated cases 4 and 14 but clustered cases
5 and 25 together (Figure 7.10). The result of the k-means cluster analysis based on
the excipients analysed by DSC (Figure 7.10) is compared with subjective clusters in
Figure 7.11. As can be seen in the bar charts, ten of the twenty-six cases are
clustered differently between the two techniques. It is also worth noting that where
cases seem to cluster differently between these two methods, these differences

231
could also potentially identify further clusters. So, for example, Cases 13, 26, 31 and
159, which formed part of Cluster 1 for the AHC of the DSC data and part of Cluster
3 according to the subjective groupings, still form a cluster together. In addition, they
also formed part of a cluster together by AHC analysis of the physical data.
Figure 7.10. K-means clustering of DSC data using MA marked cases.
14
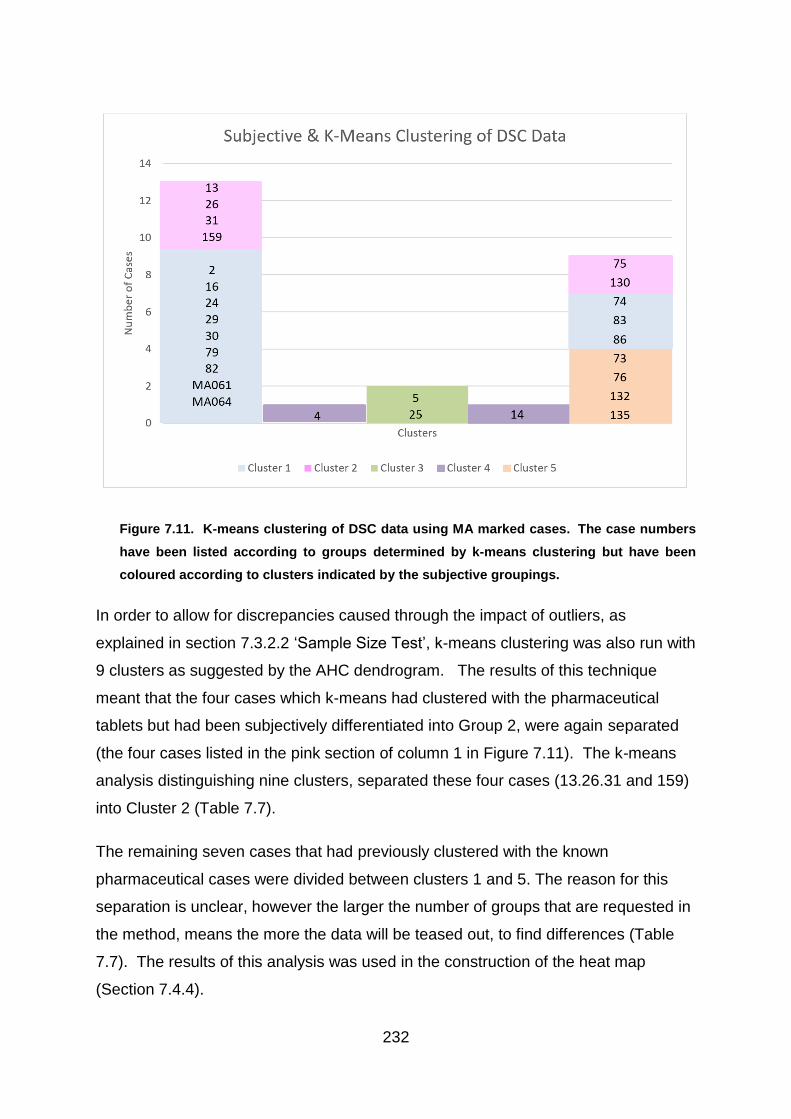
232
Figure 7.11. K-means clustering of DSC data using MA marked cases. The case numbers
have been listed according to groups determined by k-means clustering but have been
coloured according to clusters indicated by the subjective groupings.
In order to allow for discrepancies caused through the impact of outliers, as
explained in section 7.3.2.2 ‘Sample Size Test’, k-means clustering was also run with
9 clusters as suggested by the AHC dendrogram. The results of this technique
meant that the four cases which k-means had clustered with the pharmaceutical
tablets but had been subjectively differentiated into Group 2, were again separated
(the four cases listed in the pink section of column 1 in Figure 7.11). The k-means
analysis distinguishing nine clusters, separated these four cases (13.26.31 and 159)
into Cluster 2 (Table 7.7).
The remaining seven cases that had previously clustered with the known
pharmaceutical cases were divided between clusters 1 and 5. The reason for this
separation is unclear, however the larger the number of groups that are requested in
the method, means the more the data will be teased out, to find differences (Table
7.7). The results of this analysis was used in the construction of the heat map
(Section 7.4.4).
4 14

233
Table 7.7. The results of K-Means Clustering and AHC of DSC data based on 9 clusters
suggested by the AHC dendrogram at a distance of 5.
K-Means Clustering Agglomerative Hierarchical Clustering
Cluster 1 2, 29, 30, MA 2, 16, 24, 29, 30 MA
Cluster 2 13, 26, 31, 159 13, 26, 31, 159
Cluster 3 73, 74, 76, 83, 86, 132, 135 73, 74, 76, 79, 82, 83, 86, 132, 135
Cluster 4 75, 130 75
Cluster 5 16, 24, 79, 82 130
Cluster 6 4 4
Cluster 7 14 14
Cluster 8 5 5
Cluster 9 25 25
The sample size is a limitation for the statistical analysis of this project and further
work may be required to determine an optimum number of tablets to be analysed.
Assessing a higher proportion of tablets in a case improves the reliability of the
clustering model but many of the cases recovered by the police contain only small
numbers of tablets. This is an exploratory technique however, and there is no
hypothesis test so although repeating and increasing the sample size would be
helpful, results will largely depend on the tablets analysed.

234
7.5.4 Creation of Heat Map
The results of the subjective, AHC and k-means clustering techniques were
combined and compared using a heat map (Figure 7.12) which identified the number
of times different cases clustered together. The results were based on the tests
using standardised data and included:
1. Clustering by subjective comparison + drug identification (GC-MS) +
quantification (HPLC)
2. Clustering of cases using data from physical analysis (mean and standard
deviation of weight) + diazepam (1) quantification by AHC
3. Clustering of cases using DSC generated data by AHC
4. Clustering of cases using data from physical analysis + diazepam (1)
quantification by k-Means clustering
5. Clustering of cases using DSC generated data by k-means
Given the three independent data sets (subjective, physical and DSC chemical) and
the three types of cluster analysis performed (subjective, AHC and k-means), there
was a low chance of multiple grouping if there was no connection between the
cases. The probability of two cases clustering repeatedly is illustrated by calculating
that if case x was in a given cluster, the probability of case y being in the same
cluster would be 1/5 (given 5 clusters are produced, based on the subjective cluster
analysis). For every pair of cases, the clustering event will have one or other of two
binary outcomes i.e. the cases cluster together (p) or they do not cluster together (1-
p) where p is the probability of the cases clustering together by chance alone. The
results of one trial do not influence the results of the remaining trials. There are still
only two possible outcomes for each trial and the probability of these outcomes
remain constant (The Open University, 2009). This is comparable to the binomial
calculation demonstrated by independent flips of a coin attaining the same result
(Imrey, 2000).
For 3 clustering events (1 with each independent data set) the probability would be
calculated using the binomial model:

235
𝑝(𝑘 𝑠𝑢𝑐𝑐𝑒𝑠𝑠𝑒𝑠 𝑖𝑛 𝑛 𝑡𝑟𝑖𝑎𝑙𝑠) = (𝑛
𝑘)𝑝𝑘𝑞𝑛−𝑘
Where:
n = number of trials (3)
k = number of successes
p = probability of success in one trial (0.2)
q = 1-p = probability of failure in one trial
n-k = number of failures
Therefore for two cases to cluster together in each of the three events, the
probability would be:
3 successes in 3 trials = (33)0.230.83−3
3-3 = 0. Anything to power of 0 = 1
(𝑛𝑘) =
𝑛!
𝑘!(𝑛−𝑘)!
So
(33) =
3 𝑋 2 𝑋 1
3 𝑋 2 𝑋 1 𝑋 0!
As 0! = 1 and 3! / 3! = 1
(1)0.230.80
= 1 x 8x10-3x1
= 8 x10⁻³
Therefore the probability of 2 cases clustering together on 3 occasions is 8 x10⁻³.
236
For two cases to cluster together twice in the three trials, the probability would be:
2 successes in 3 trials = (32)0.220.83−2
(𝑛𝑘) =
𝑛!
𝑘!(𝑛−𝑘)!
So
(32) =
3 𝑋 2 𝑋 1
2 𝑋 1 𝑋 1
Therefore,
(3)0.220.81
= 3 x 0.04 x 0.8
= 9.6 x10⁻²
Therefore the probability of two cases clustering together on two occasions is 9.6
x10-2.
For two cases to cluster together once in the three trials, the probability would be:
1 success in 3 trials = (31)0.210.83−1
(𝑛𝑘) =
𝑛!
𝑘!(𝑛−𝑘)!
So
(31) =
3 𝑋 2 𝑋 1
1 𝑋 2
Therefore,
(3)0.210.82
= 3 x 0.2 x 0.64
237
= 0.384
Therefore the probability of two cases clustering together once during the three trials
is 0.384.
These calculations are based on five clusters being produced by each set of data.
However, as the AHC and k-means clustering of DSC data generated nine clusters,
the probability would have been lower with p = 0.11 and q = 0.89 for those two
results.
The probability of the cases clustering together randomly with no connection is
therefore small and suggests a potential link between them. A connection between
clustered cases could indicate that the cases were produced in the same laboratory
or possibly manufactured by the same processes.
The heat map (Figure 7.12) shows that five cases matched with the pharmaceutical
tablets on a minimum of four out of five trials. This would suggest that there is a
strong connection and cases 2, 16, 24, 29 and 30 could be of pharmaceutical origin.
However, the results are not entirely clear cut. Case 79, for example, clusters as
many times with Cases 74, 83 and 86 and more times with Case 82 than with the
known pharmaceutical tablets. These are the remaining cases that had been
subjectively clustered as potential pharmaceuticals. Interestingly, these cases, along
with Case 79 are also the cases which were given a reported level of 10 mg of
diazepam (1) according to hplc analysis but were recognised as different to
pharmaceutical tablets, based on DSC thermograms. The origin of these tablets is
therefore still uncertain. It is possible that they may be well made counterfeits or
degraded pharmaceuticals.
The heat map also identifies potential links between other cases, such as Cases 73,
76, 132, 135, which contain etizolam (7). There may also be a possible connection
between Cases 13, 26, 31 and 159; and between 74, 83 and 86 all of which cluster
in every trial (Figure 7.12).

238
Figure 7.12. Heat map showing a pairwise comparison of all cases. Five different approaches to clustering were carried out and the numbers show
the frequency that particular pair of cases were allocated to the same cluster out of a maximum of five clustering attempts. The frequencies are
colour coded according to those shown in the legend.

239
7.6 Conclusion
The aim of the cluster analysis was to clarify the results of the physical and chemical
tests on the seized cases, with the intention of distinguishing between the
pharmaceutical and illicitly made tablets. In addition, it was hoped that potential links
between illicit cases would emerge. Despite the limitations posed by sample size,
several groupings were found. For example cases 2, 16, 24, 29, and 30 were
identified as potentially being of pharmaceutical origin. In addition, links between
illicit cases, such as Cases 13, 26, 31 and 159 were demonstrated by these cases
matching in all five tests. However, further background information would be
required to support any connection but this information could prove useful to the
police.
Ideally a larger sample size would have been beneficial in terms of providing a more
accurate mean or centroid on which to calculate the statistics. It could also allow
further information to be added to the heat map by performing further analytical tests.
This would help to clarify any results. However, the technique of combining all of the
analytical and statistical results in a heat map has demonstrated great potential in
identifying potential links.
As some of the cases grouped together it indicates that there may be a link between
them. It is possible that tablets that grouped together were manufactured together.
Some of the seized cases clustered with the pharmaceutical batches a number of
times and therefore raises the possibility that they are pharmaceutically made.
Pharmaceutical tablets enter the illicit market by a number of methods. A report into
countering the problem posed by falsified and substandard drugs, commented that
prescription medicines change hands many times between manufacturer and
pharmacist, providing many opportunities to divert the tablets (Institute of Medicine,
2014). It was commented that tablets may be stolen at source, from a pharmacy, or
by people selling their own, friends or relative’s prescription medication, with those
stolen closer to source usually providing a much larger quantity for illicit sales.
Therefore, illicit cases may be pharmaceutically manufactured but not directly
prescribed. It was also noted that many diverted pharmaceutical products

240
deteriorate over time due to incorrect storage and handling conditions (Institute of
Medicine, 2014).
Although the heat map can suggest that potential links exist, it cannot determine if
the seized cases containing 10 mg of diazepam (1) are of pharmaceutical origin. It
could therefore be beneficial to further explore the potential pharmaceutical tablets in
order to investigate differences and similarities between them and the genuine
pharmaceutical tablets. One method of performing this would be to use supervised
statistical methods. By using data produced by tablets known to be illicitly
manufactured and known pharmaceutical tablets, a training model can be built. This
information can then be used to inform and further test the unknown tablets.
241
8.1 Chapter Summary
In order to further examine the seized cases which contained approximately 10 mg
of diazepam (1), a smaller test sample was chosen. As the tablets could not be
differentiated from the pharmaceutical tablets based on physical characteristics or
type and quantity of active drug substance, the data from DSC was analysed by
chemometric methods. DSC was chosen because the thermograms generated were
largely influenced by the excipient content of the tablets. The data points were
explored by principal component analysis and linear discriminant analysis to
determine if any differences could be found between the pharmaceutically
manufactured tablets and the seized cases.
8.2 Introduction
8.2.1 Tablet Classification
Tablets may be classified based on their physical or chemical properties raising the
possibility that legitimately produced tablets can be identified amongst illicit seizures
of tablets. Pharmaceutical tablets will possess certain properties such as correct
markings and amount and type of active drug substance but well-made counterfeit
tablets may also satisfy these requirements so additional aspects of the tablet’s
contents such as the excipient may help to distinguish pharmaceutical tablets from
illicitly made tablets.
8.2.2 Rationale Behind the Statistical Methodology
The aim of this part of the study was to compare the physical and chemical
properties of a group of twenty-four illicit tablet batches with MA markings to ten
known pharmaceutical tablets to see if there were any illicit tablets that could
plausibly have been manufactured by a pharmaceutical company. The first objective
242
was to separate out all tablets with MA markings then identify and quantify the active
drug substance. This used the results of the gas chromatography mass spectrometry
(GC-MS) analysis to isolate the cases that contained diazepam (1) and high
performance liquid chromatography (HPLC) to identify those tablets that contained
the pharmaceutical level of around 10 mg of diazepam (1).
The second objective was to investigate further those cases that could not be
distinguished from the pharmaceutical tablets based on markings and active drug
substance alone. The Differential Scanning Calorimeter (DSC) was used to
investigate the excipient content of the tablets. Excipients comprise of all the
formulated components of a tablet excluding the active drug substance and can
include fillers, glidants and binders for example. Each tablet manufacturer chooses
the excipients used in their manufacturing process, which means the excipient
content of tablets with the same amount and type of active ingredient can differ
between companies. Information regarding excipients could therefore help to
determine the authenticity of illicit cases because if there is a variation in excipient
content between seized cases and pharmaceutical tablets bearing the same marking
or logo, this discrepancy could support an argument for the illicit cases having been
manufactured in a clandestine laboratory. By analysing the tablets with DSC, a
thermal profile is generated which is heavily influenced by the more abundant
components within each tablet. In the case of diazepam (1) tablets, this is largely
the excipients. The thermograms produced can then be compared both visually and
by statistical and chemometric analysis.
The third objective was therefore to compare DSC thermograms produced by the
illicit and pharmaceutical tablets using multivariate statistical techniques and develop
a simple model that could be used to distinguish between MA-marked cases that
have been pharmaceutically or illicitly manufactured.
8.2.3 Choice of model
A thermogram is a plot of several thousand heat flow measurements taken at given
temperature points between 100 and 250 oC, from a single observation or tablet. In
this study, the heat flow measurement at each temperature is considered an

243
independent variable and the dependent variable is the binary classification of known
pharmaceutical or other manufacturer. The DSC procedure produces a multi-
dimensional or multivariable dataset across the whole temperature range examined
with each temperature point considered a variable. The final dataset consisted of
7211 variables for each of the 34 observations. However, with such a data set, there
is a high degree of correlation between the variables. Correlation between the
explanatory variables creates problems for statistical modelling techniques such as
regression techniques and linear discriminant analysis, which constructs a
discriminant value based on finding significant variables within the dataset that are
related to the dependent variable or, in this case, classification group. Correlation
can lead to important variables being ignored as insignificant, in favour of alternative,
correlated variables. The variables chosen could therefore be defective in
representing the true importance of the data, thus creating an unstable and
inaccurate model (Hosmer and Lemeshow, 1989). High-dimensionality and
multicollinearity can be addressed by using Principal Component Analysis (PCA) to
reduce the number of dimensions and produce a number of uncorrelated
components.
PCA is an unsupervised statistical method, whereby no information regarding
potential groupings is included in the analysis. PCA uses correlation in the
independent variables to reduce the dimensionality of the dataset but retains most of
the variation of the original dataset within a much smaller set of principal
components (PC). This is done by using the data on p variables for n observations
so that the first PC (Z1) is then a linear combination on the variables X1, X2 …Xp,
which maximizes the variation between the observation such that
Equation 1
Z1 = a11X1 +a12X2 ….+a1pXp
and
Equation 2
(a11)2 + (a12)2 + …. (a1p)2 = 1

244
This is repeated for the remaining principal components so that Z1, Z2, Z3… Zn have
zero correlation. A worked example of Principal Component Analysis can be seen in
Appendix III.
Once the principal components have been calculated, the number of principal
components that account for about 90% of the variation in the dataset (in the study 5
principal components) were used as the variables in the discriminant analysis where
they are combined according to equation 1 to calculate the discriminant value (D).
Equation 3
D = ((b1PC1) + (b2PC2) + (b3PC3) + (b4PC4) + (b5PC5) + c)
Where the discriminant function coefficients of the first five principal components of
DSC data are represented by b1 to 5 and c is a constant associated to the Y-intercept
of the regression line (Brown and Wicker,2000).
The first component represents the largest percentage of the variation in the dataset
and each subsequent component represents a smaller proportion. Frequently 90%
of the data variation resides in the first few components (The Open University, 2007).
This means that most of the variation in the dataset can be visualised by plotting the
values of the observations on a small number of PCs. Each component, thus
allowing visualisation of patterns within a compressed form of the original dataset.
Principal Component Analysis is a widely used technique that is often favoured for
exploring spectra because of its ability to compress large data sets by integrating
correlated dimensions. Klara Dégardin used Raman Spectroscopy and PCA to firstly
identify counterfeit tablets and then to investigate links between the illicit tablets and
historical cases. The PCA was particularly beneficial for finding clusters by plotting
the principal components to visualise the data (Dégardin et al., 2011). The number of
principal components required depends on the data and constituents involved. A
recent study by Risoluti only required the first two principal components to be plotted
in order to differentiate between two groups of New Psychoactive Substances (NPS)
(Risoluti et al., 2016). However, it has been noted that only a portion of the variation
can usually be visualised with PCA alone (NicDaéid and Waddell, 2005). Dégardin

245
used PCA to gain an initial insight into potential clusters of pharmaceutical and illicit
tablets before following it up with supervised statistical methods (2016).
Once the dataset has been compressed, the principal components can be used as
surrogate explanatory variables in follow-on modelling procedures such as linear
discriminant analysis (LDA). LDA is a method that uses low-dimensional data to
highlight differences between subgroups. Information regarding the properties of the
subgroups, whose classification is already known, is then used to create allocation
rules which enable predictions to be made regarding the groupings of new
observations (The Open University, 2007; Brown and Wicker,2000).
The supervised technique of Linear Discriminant Analysis (LDA) was used by
Johnston and King (1998), to detect links between heroin samples by analysing the
levels of alkaloids and adulterants in the sample. This ultimately led to some
success in predicting their country of origin. LDA was also applied to discrimination
of young drug and fibre type cannabis plants according to chemical composition of
their leaves as identified by GC-MS. This technique classified observations correctly
with 89% accuracy (Broséus, Vallat and Esseiva, 2011). Similarly, LDA with leave
one out cross validation was used to classify saffron into its geographical area of
origin based on chemical constituents identified through HPLC analysis. Although it
proved more difficult to distinguish between geographical areas that were closer
together which, increased the misclassification rate (D’archivio et al., 2016). Lesiak
(2014) used LDA to distinguish between Mitragyna speciosa and other plant species
based on the mass spectral data generated by Direct Analysis in Real Time - Mass
Spectrometry (DART-MS), with 99% accuracy.
In a study investigating counterfeit medicines, Dégardin used a variety of statistical
techniques for distinguishing between samples. This included PCA and Receiver
Operating Characteristic (ROC) curves. However, the most effective analysis
resulted from studying a variety of information gained from all available resources,
including police reports, in order to identify potential links (Dégardin et al., 2011).

246
In this chapter, I describe how data from DSC thermograms were used to develop an
allocation rule to distinguish between pharmaceutical and non-pharmaceutical
tablets using a combination of PCA and LDA.
8.3 Aim of Statistical Model
The aim of this section was to devise a model that could distinguish between illicit
cases of MA tablets and known, pharmaceutically manufactured 10 mg diazepam
tablets. This first step was to examine the tablet type and quantity of diazepam (1)
present, allowing classification of those tablets that did not contain 10 mg of
diazepam (1) as non-pharmaceutical. The second step used data from DSC
thermograms and linear discriminant analysis to create a model that distinguishes
pharmaceutical tablets with 10 mg of diazepam (1) from illicit, 10 mg diazepam (1)
tablets.
8.4 Analytical Procedure Employed
8.4.1 The MA/D10 Test Group
Visual examination of the tablets revealed that twenty-four of the sixty-eight illicit
cases bore the markings MA/D10. The number of cases of this design is illustrated
in Figure 8.1. These markings relate to a recognised pharmaceutical company, MA
Pharmachem, which provided 10 mg diazepam (1) tablets for the United Kingdom.
Although MA Pharmachem no longer produce diazepam (1) tablets, these tablets
may have still been legitimately available at the time of seizure due to the length of
their shelf life after manufacture.

247
Figure 8.1. Bar chart showing the cases marked MA and D/10 highlighted in red, and the amount of tablets within the cases.
248
Twenty-four illicit cases had the MA marking and relevant data regarding tablet
weight and specifications was provided by the pharmaceutical company, along with
two batches of pharmaceutically manufactured tablets for comparative purposes.
The statistical analysis used physical and chemical data from all of the twenty-four
illicit cases containing tablets marked MA and D/10, to assess whether these cases
had the same properties as the pharmaceutically manufactured tablets.
8.4.2 Pharmaceutical and Non Pharmaceutical Tablets
The twenty-four illicit cases of MA tablets could have either been produced illicitly or
pharmaceutically manufactured but then diverted into the illegal supply chain. For
the purposes of this project, ‘pharmaceutically manufactured’ refers to tablets that
were produced legitimately for the UK market. Illicit tablets may have been imported
from other sources via the internet and could include either clandestine laboratories
or pharmaceutical companies in other countries. However, if the tablets did not meet
the manufacturers’ specifications and therefore were not believed to be legitimately
manufactured by pharmaceutical companies (MA Pharmachem in this instance) for
UK consumption, the tablets were deemed as illicit.

249
8.4.3 Separation of Illicitly Manufactured Tablets
8.4.3.1 Identification of the Active Drug Substance by GCMS
Chemical analysis by Gas Chromatography-Mass Spectroscopy (GC-MS) showed
that not all the twenty-four illicit cases marked MA/D10 contained diazepam (1). Six
cases contained phenazepam (16) or etizolam (7) and were automatically deemed
illicitly manufactured tablets without consideration of properties since these active
drug substances are not licenced within the UK. These cases were included in the
remainder of the study as examples of illicit tablets. The remaining 18 cases
contained diazepam (1) and were then analysed by HPLC to ensure the quantity of
active drug substance was consistent with the manufacturer’s specification (Figure
8.2).
8.4.3.2 Quantification of Diazepam by HPLC
High Performance Liquid Chromatography (HPLC) was used to quantify the
diazepam (1) content in the remaining 18 illicit cases. Six of the illicit cases
contained over 20 mg of diazepam (1) and two contained approximately 8 mg. The
tablets in these cases did not meet the manufacturer’s specification for quantity of
diazepam (1) and were classified as non-pharmaceutical, leaving ten cases with the
correct type and quantity of active drug substance and the potential to have been
pharmaceutically manufactured (Figure 8.2).
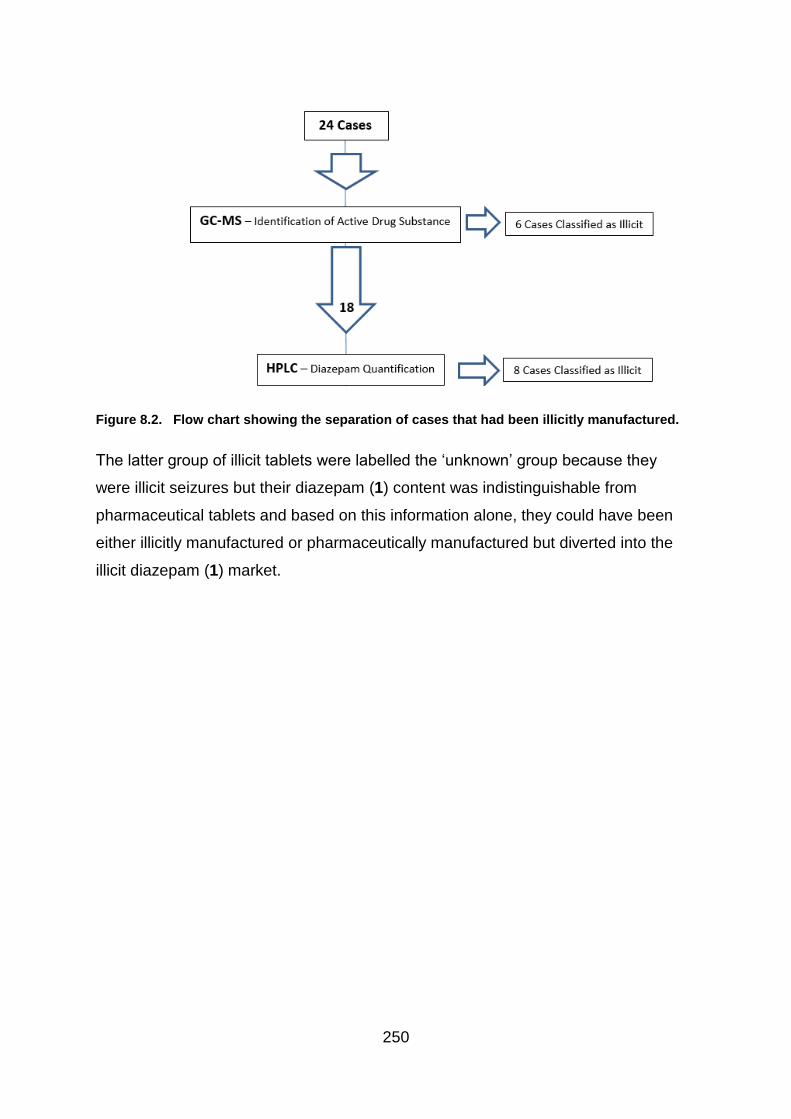
250
Figure 8.2. Flow chart showing the separation of cases that had been illicitly manufactured.
The latter group of illicit tablets were labelled the ‘unknown’ group because they
were illicit seizures but their diazepam (1) content was indistinguishable from
pharmaceutical tablets and based on this information alone, they could have been
either illicitly manufactured or pharmaceutically manufactured but diverted into the
illicit diazepam (1) market.
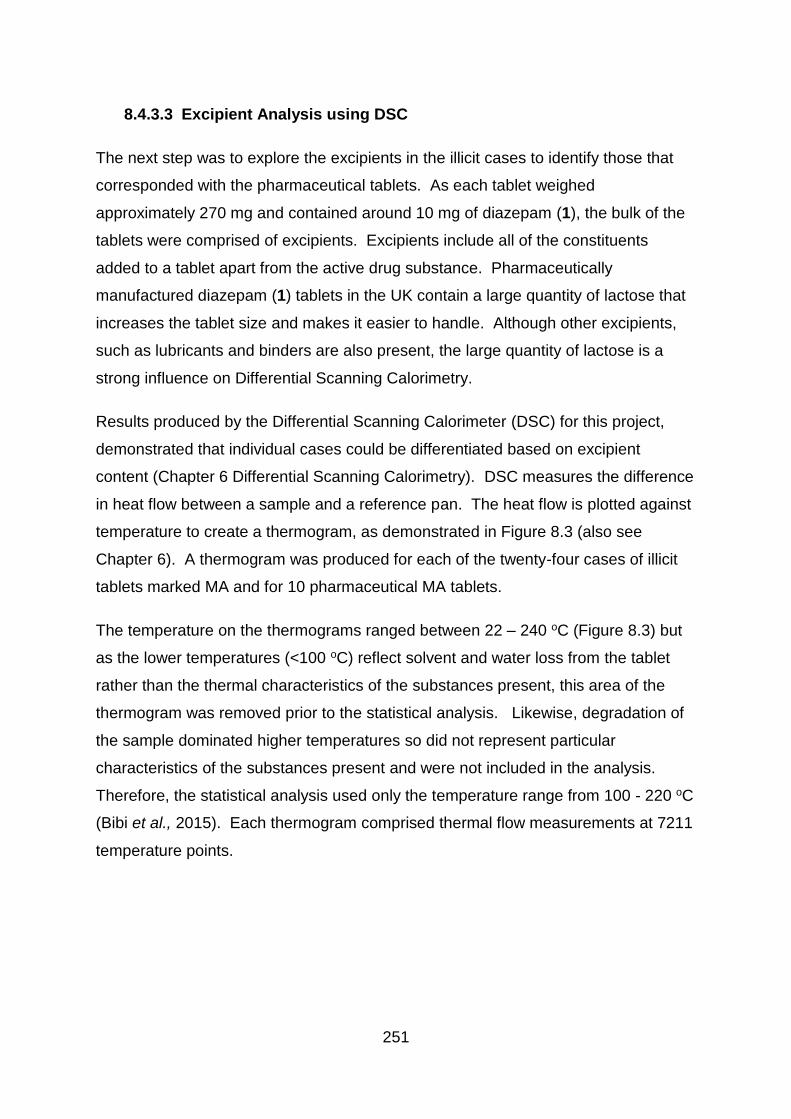
251
8.4.3.3 Excipient Analysis using DSC
The next step was to explore the excipients in the illicit cases to identify those that
corresponded with the pharmaceutical tablets. As each tablet weighed
approximately 270 mg and contained around 10 mg of diazepam (1), the bulk of the
tablets were comprised of excipients. Excipients include all of the constituents
added to a tablet apart from the active drug substance. Pharmaceutically
manufactured diazepam (1) tablets in the UK contain a large quantity of lactose that
increases the tablet size and makes it easier to handle. Although other excipients,
such as lubricants and binders are also present, the large quantity of lactose is a
strong influence on Differential Scanning Calorimetry.
Results produced by the Differential Scanning Calorimeter (DSC) for this project,
demonstrated that individual cases could be differentiated based on excipient
content (Chapter 6 Differential Scanning Calorimetry). DSC measures the difference
in heat flow between a sample and a reference pan. The heat flow is plotted against
temperature to create a thermogram, as demonstrated in Figure 8.3 (also see
Chapter 6). A thermogram was produced for each of the twenty-four cases of illicit
tablets marked MA and for 10 pharmaceutical MA tablets.
The temperature on the thermograms ranged between 22 – 240 oC (Figure 8.3) but
as the lower temperatures (<100 oC) reflect solvent and water loss from the tablet
rather than the thermal characteristics of the substances present, this area of the
thermogram was removed prior to the statistical analysis. Likewise, degradation of
the sample dominated higher temperatures so did not represent particular
characteristics of the substances present and were not included in the analysis.
Therefore, the statistical analysis used only the temperature range from 100 - 220 oC
(Bibi et al., 2015). Each thermogram comprised thermal flow measurements at 7211
temperature points.
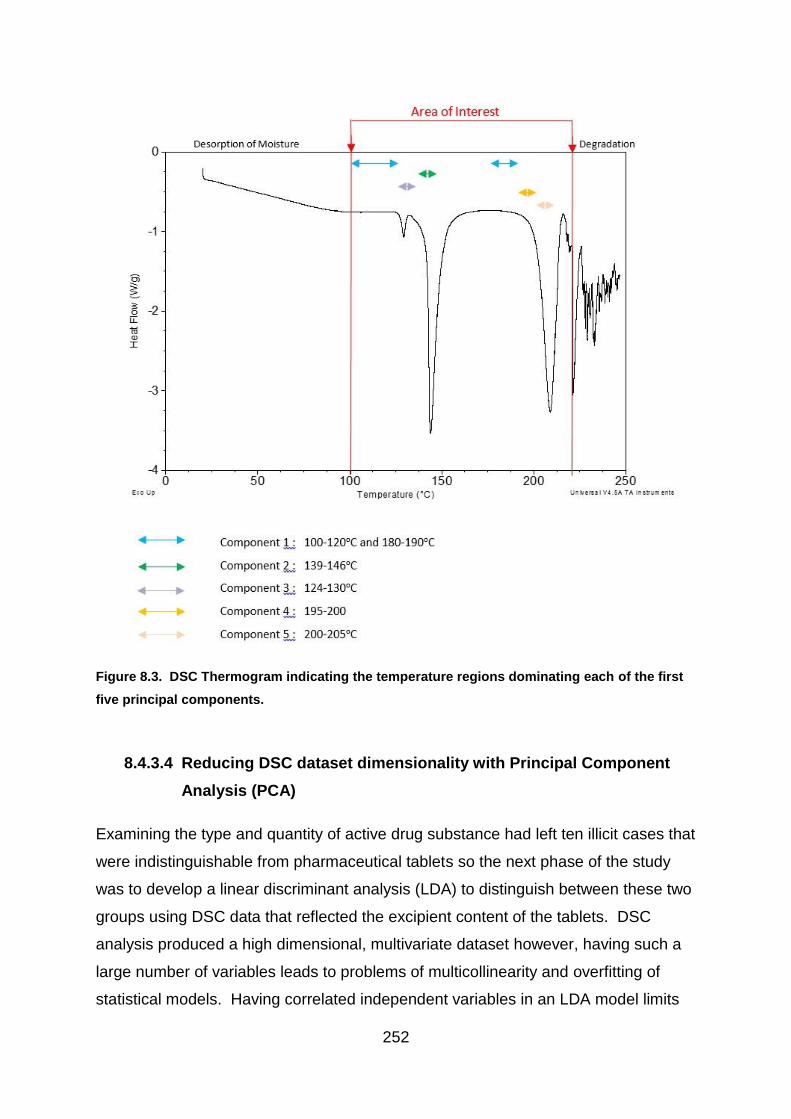
252
Figure 8.3. DSC Thermogram indicating the temperature regions dominating each of the first
five principal components.
8.4.3.4 Reducing DSC dataset dimensionality with Principal Component
Analysis (PCA)
Examining the type and quantity of active drug substance had left ten illicit cases that
were indistinguishable from pharmaceutical tablets so the next phase of the study
was to develop a linear discriminant analysis (LDA) to distinguish between these two
groups using DSC data that reflected the excipient content of the tablets. DSC
analysis produced a high dimensional, multivariate dataset however, having such a
large number of variables leads to problems of multicollinearity and overfitting of
statistical models. Having correlated independent variables in an LDA model limits
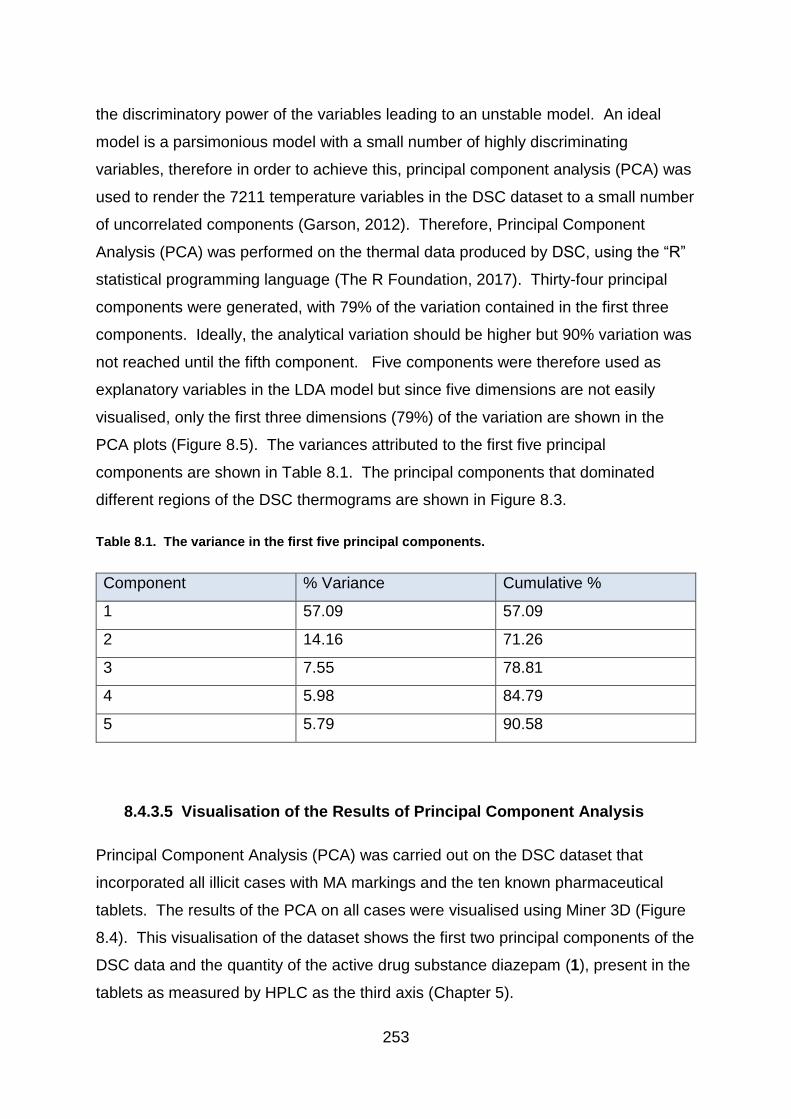
253
the discriminatory power of the variables leading to an unstable model. An ideal
model is a parsimonious model with a small number of highly discriminating
variables, therefore in order to achieve this, principal component analysis (PCA) was
used to render the 7211 temperature variables in the DSC dataset to a small number
of uncorrelated components (Garson, 2012). Therefore, Principal Component
Analysis (PCA) was performed on the thermal data produced by DSC, using the “R”
statistical programming language (The R Foundation, 2017). Thirty-four principal
components were generated, with 79% of the variation contained in the first three
components. Ideally, the analytical variation should be higher but 90% variation was
not reached until the fifth component. Five components were therefore used as
explanatory variables in the LDA model but since five dimensions are not easily
visualised, only the first three dimensions (79%) of the variation are shown in the
PCA plots (Figure 8.5). The variances attributed to the first five principal
components are shown in Table 8.1. The principal components that dominated
different regions of the DSC thermograms are shown in Figure 8.3.
Table 8.1. The variance in the first five principal components.
Component % Variance Cumulative %
1 57.09 57.09
2 14.16 71.26
3 7.55 78.81
4 5.98 84.79
5 5.79 90.58
8.4.3.5 Visualisation of the Results of Principal Component Analysis
Principal Component Analysis (PCA) was carried out on the DSC dataset that
incorporated all illicit cases with MA markings and the ten known pharmaceutical
tablets. The results of the PCA on all cases were visualised using Miner 3D (Figure
8.4). This visualisation of the dataset shows the first two principal components of the
DSC data and the quantity of the active drug substance diazepam (1), present in the
tablets as measured by HPLC as the third axis (Chapter 5).

254
Figure 8.4 Miner 3D image showing PCA results of the DSC data. The first two principal
components plotted against the level of diazepam (1). Groupings can be identified according to
the active drug substance (identified by GC-MS and colour-coded) and the amount of diazepam
(1), where present (quantified by HPLC). The tablets labelled as ‘Non-Pharma’ contain levels of
diazepam (1) that do not meet pharmaceutical specification. Tablets containing a different active
drug substance are labelled ‘phenazepam’ (16) or ‘etizolam’ (7) according to the GC-MS results.
Unknown tablets (illicit tablets with 10 mg of diazepam (1)) and genuine pharmaceutical tablets
are also indicated.
255
There are clear groupings in the illicit tablets (Figure 8.4) depending on the
diazepam (1) content and the active drug substance. The genuine pharmaceutical
tablets are illustrated in red as a separate group. However, these groups are not just
distinguishable by their active drug content. The tablets can also be separated by
their values on PC1 and PC2 from the DSC data. For example, the PC1 values
range between 79 to 113 for tablets containing etizolam (7), -100 to -47 for tablets
containing phenazepam (16) and between -110 to -25 for pharmaceutical tablets,
while the PC2 values range between -4.5 to +5 for tablets containing etizolam (7), 65
to 80 for tablets containing phenazepam (16) and between -30 to +2.5 for
pharmaceutical tablets. This separation indicates variation in the excipient content as
well.
Two groups could not be distinguished using active ingredient content alone; these
groups were named unknown tablets and genuine pharmaceutical tablets. As the
level of diazepam (1) present in the pharmaceutical tablets and unknown tablets was
similar, the quantity of drug substance was no longer useful in discriminating
between the groups of interest in this analysis but these two groups clustered
separately on the PC1 and PC2 axes from DSC analysis which represented the
excipient content. Separation between these two groups was clearer if the DSC data
were plotted on the first three principal components (Figure 8.5).

256
Figure 8.5. Miner 3D image showing separation between the pharmaceutical (red) and
unknown (green) cases based on the first three principal components of the DSC data.
The subjective impression of the image illustrated in Figure 8.5, shows that there is
separation between the two groups, based on the DSC data. Therefore, the
hypothesis that the two groups of tablets could be distinguished based on their DSC
thermogram alone, was investigated further using linear discriminant analysis.
8.4.3.6 Application of Linear Discriminant Analysis
The next step was to separate the pharmaceutical tablets from the unknown tablets.
A variety of statistical techniques are available for classification purposes, including
binary logistic regression. However, Linear Discriminant Analysis (LDA) is generally
simpler to use and does not undergo the level of iterations that slow down the
calculations in the logistic regression. LDA is also more precise in its results as long
as the assumption of normality is met (Tuffery and Tuffery, 2011).
The dataset is first split into two subsets; a training set and a test set. To
discriminate between groups of observations, an LDA model is produced using
samples from the training set where the classification is known and a classification
rule can be formulated. The quality of this classification rule is assessed by applying
it to the test set and recording the number of observations in the test set that are
classified correctly

257
The group used for testing the model was comprised of data from two randomly
chosen cases containing illicit tablets and one tablet taken from each of the two
batches provided by MA Pharmachem. The remaining illicit cases and an equal
number of pharmaceutical tablets comprised the training set. The stratagem used to
distinguish between illicit cases and those with the potential to have been
pharmaceutically manufactured, is demonstrated in Figure 8.6.
Figure 8.6. The stratagem for discriminating between tablets which had been illicitly and
pharmaceutically manufactured. The numbers of illicit tablets used to build and test the model
were matched with pharmaceutical tablets.
The independent variables used for the linear discriminant analysis were the first five
components of the PCA carried out on the DSC data. Monfreda (2015) chose to use
the first ten principal components for analysis into cocaine and gave equal weighting
to the data generated by the alkaloid and residual solvent. For this study, five
components were used for Model 1 because this contained 90% of the variation from
258
the original dataset. A second model using only PCs 1, 2 and 5 was also tested as
an alternative. The second model was developed because two PCs were found to
have no significant discriminatory power (Table 8:10) and were therefore removed to
form a more parsimonious model (model 2). This is discussed in Section 8.4.6
‘Suitability of Data’.
The analysis was performed with principal components that were both weighted and
unweighted by the proportion of variance determined by the PCA. This was to reflect
the difference in discriminating power of each of the components. However,
although both methods were attempted with only slight differences in the figures, the
results were the same and so only the results from the weighted data is shown
below. The weighting was applied by multiplying the principal component values by
their % variation prior to using them as independent variables for the LDA.
8.5 The Statistical Model Applied
8.5.1 Aim of the Analysis
The aim of the linear discriminant analysis was to see if the DSC thermograms and
hence the excipient content of the group of unknown tablets could be distinguished
from pharmaceutically manufactured tablets. If unknown tablets were
indistinguishable from the pharmaceutical tablets, this could indicate that
pharmaceutical tablets had been diverted into the illicit market. If the groups were
distinct, a number of possible explanations could exist:
1. Unknowns were not pharmaceutically manufactured
2. Unknowns were pharmaceutically manufactured with a slight difference in
formulation
3. Unknowns were pharmaceutically manufactured but the formulation had
deteriorated over time.

259
8.5.2 Results of Linear Discriminant Analysis
Linear discriminant analysis creates a discriminant function (D), which is a weighted
combination of the independent variables in the dataset, in this case, PC1 – PC5 of
the DSC data variables. A value (D) for each observation (tablet) on the discriminant
function is determined and based on this value, an allocation rule was created to
separate the tablets which share the characteristics of the pharmaceutical tablets
and those which do not. The discriminant values for each observation in the training
dataset were determined according to equation 1, where a1 to 5 are the discriminant
function coefficients for the first five principal components of the DSC data and c is a
constant related to the Y-intercept of the regression line (Brown and Wicker,2000).
Equation 3
D = ((b1PC1) + (b2PC2) + (b3PC3) + (b4PC4) + (b5PC5) + c)
In terms of the models used for this project, the equations translate as:
Model 1
D = ((PC1 x 0.031) + (PC2 x 0.089) + (PC3 x -0.17) + (PC4 x 0.107) + (PC5 x 0.035)
+ 0.573).
Model 2
D = ((PC1 x 0.023) + (PC2 x 0.086) + (PC5 x 0.027) + 1.378).
8.5.3 Allocation Rules
The discriminant function values (D) were then used to establish an allocation rule.
There are a number of ways this allocation rule can be calculated but three simple
approaches were compared in this study. The first method used the average of the
central D values for each group as a cut-off point. This is the default method used in
SPSS and the independent variables are weighted such that the average for the
centroid values of the two groups is zero.

260
Secondly, 95% confidence intervals for the mean D value for each group were
calculated and a cut-off point for group allocation was determined as the midpoint
between the lower 95% confidence limit of the mean D value for outcome = unknown
and the upper 95% confidence limit of the mean D value for outcome =
pharmaceutical (Figure 8.7).
Figure 8.7. Box plot of the D values. The green dotted lines indicate the lower boundary of the
95% confidence interval for the mean D value for the unknown group and the upper boundary of the
95% confidence interval for the mean D value for the pharmaceutical group. The blue line indicates
the average value for these boundaries and the cut-off lines at 0.22 for model 1 and 0.23 for Model
2.as blue lines.
The final allocation technique involved the creation of a Receiver Operating
Characteristic curve (ROC), which plots sensitivity vs 1-specificity from the predicted
allocations for various values of D. A cut-off value of D was selected that maximized
the sensitivity and specificity of the predicted allocations.
8.5.3.1 Investigation of Centroids
Using discriminant analysis on SPSS, the default setting gives weight to the
centroids creating a midpoint of “0”, which is used as the demarcation between the
different types of tablets. Cases that are evaluated with a discriminant function
value above “0” are classified as being of unknown origin and those which are
evaluated below “0” are classified as being of pharmaceutical origin.

261
Allocation rule 1:
If D >0 {𝑐𝑙𝑎𝑠𝑠𝑖𝑓𝑦 𝑎𝑠 𝑢𝑛𝑘𝑛𝑜𝑤𝑛
𝑜𝑡ℎ𝑒𝑟𝑤𝑖𝑠𝑒 𝑝ℎ𝑎𝑟𝑚𝑎𝑐𝑒𝑢𝑡𝑖𝑐𝑎𝑙
The discrimination value of “0” misclassified one of the known pharmaceutical tablets
as being of unknown origin, thus resulting in a sensitivity value of 0.875 and a
specificity of 1. The closer the sensitivity and specificity are to 1 reflects the closer
the results are to the original classification. The results of models 1 and 2 are shown
in Figure 8.8 and the corresponding data in Table 8.2.
8.5.3.2 Investigation into Confidence Intervals
The 95% confidence intervals were calculated for the unknown cases and the
pharmaceutical tablets using SPSS. The midpoint between the lower confidence
interval of the D value of the data for the unknown cases and the upper confidence
interval for the pharmaceutical data was taken as the demarcation value.
Allocation rule 2 (model 1):
If D >0.22 {𝑐𝑙𝑎𝑠𝑠𝑖𝑓𝑦 𝑎𝑠 𝑢𝑛𝑘𝑛𝑜𝑤𝑛
𝑜𝑡ℎ𝑒𝑟𝑤𝑖𝑠𝑒 𝑝ℎ𝑎𝑟𝑚𝑎𝑐𝑒𝑢𝑡𝑖𝑐𝑎𝑙
Allocation rule 2 (model 2):
If D >0.23 {𝑐𝑙𝑎𝑠𝑠𝑖𝑓𝑦 𝑎𝑠 𝑢𝑛𝑘𝑛𝑜𝑤𝑛
𝑜𝑡ℎ𝑒𝑟𝑤𝑖𝑠𝑒 𝑝ℎ𝑎𝑟𝑚𝑎𝑐𝑒𝑢𝑡𝑖𝑐𝑎𝑙
The use of the confidence intervals in determining a cut-off point resulted in one of
the known pharmaceutical tablets being misclassified as unknown. This again
resulted in a sensitivity value of 0.875 and a specificity of 1. The results are shown
in Figure 8.8 and the corresponding data in Table 8.2.
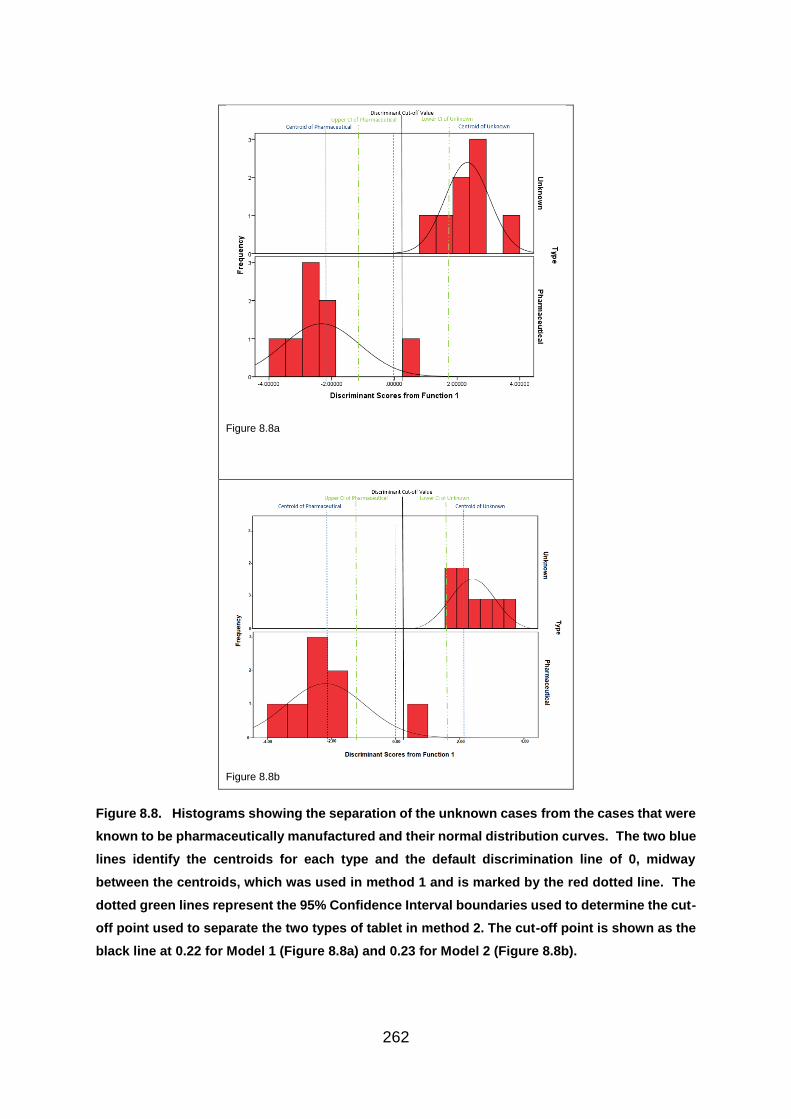
262
Figure 8.8a
Figure 8.8b
Figure 8.8. Histograms showing the separation of the unknown cases from the cases that were
known to be pharmaceutically manufactured and their normal distribution curves. The two blue
lines identify the centroids for each type and the default discrimination line of 0, midway
between the centroids, which was used in method 1 and is marked by the red dotted line. The
dotted green lines represent the 95% Confidence Interval boundaries used to determine the cut-
off point used to separate the two types of tablet in method 2. The cut-off point is shown as the
black line at 0.22 for Model 1 (Figure 8.8a) and 0.23 for Model 2 (Figure 8.8b).
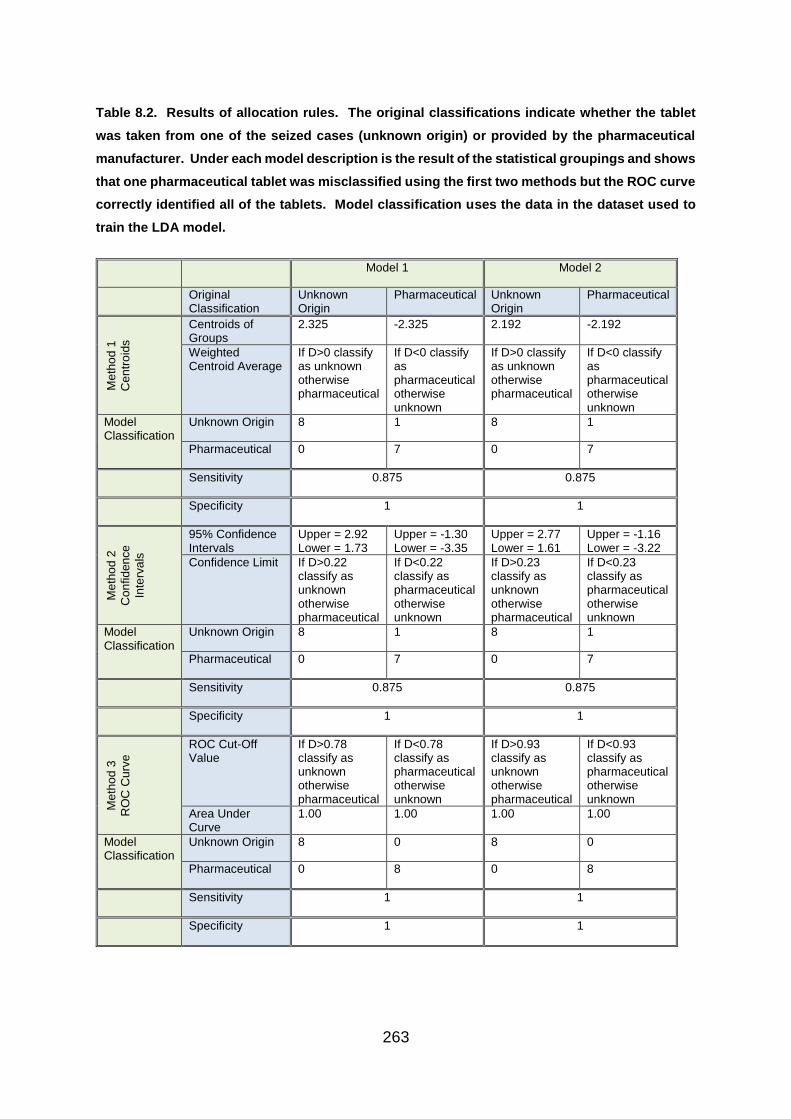
263
Table 8.2. Results of allocation rules. The original classifications indicate whether the tablet
was taken from one of the seized cases (unknown origin) or provided by the pharmaceutical
manufacturer. Under each model description is the result of the statistical groupings and shows
that one pharmaceutical tablet was misclassified using the first two methods but the ROC curve
correctly identified all of the tablets. Model classification uses the data in the dataset used to
train the LDA model.
Model 1 Model 2
Original Classification
Unknown Origin
Pharmaceutical Unknown Origin
Pharmaceutical
Me
tho
d 1
Ce
ntr
oid
s
Centroids of Groups
2.325 -2.325 2.192 -2.192
Weighted Centroid Average
If D>0 classify as unknown otherwise pharmaceutical
If D<0 classify as pharmaceutical otherwise unknown
If D>0 classify as unknown otherwise pharmaceutical
If D<0 classify as pharmaceutical otherwise unknown
Model Classification
Unknown Origin 8 1 8 1
Pharmaceutical 0 7 0 7
Sensitivity 0.875 0.875
Specificity 1 1
Me
tho
d 2
Con
fid
en
ce
Inte
rva
ls
95% Confidence Intervals
Upper = 2.92 Lower = 1.73
Upper = -1.30 Lower = -3.35
Upper = 2.77 Lower = 1.61
Upper = -1.16 Lower = -3.22
Confidence Limit If D>0.22 classify as unknown otherwise pharmaceutical
If D<0.22 classify as pharmaceutical otherwise unknown
If D>0.23 classify as unknown otherwise pharmaceutical
If D<0.23 classify as pharmaceutical otherwise unknown
Model Classification
Unknown Origin 8 1 8 1
Pharmaceutical 0 7 0 7
Sensitivity 0.875 0.875
Specificity 1 1
Me
tho
d 3
RO
C C
urv
e
ROC Cut-Off Value
If D>0.78 classify as unknown otherwise pharmaceutical
If D<0.78 classify as pharmaceutical otherwise unknown
If D>0.93 classify as unknown otherwise pharmaceutical
If D<0.93 classify as pharmaceutical otherwise unknown
Area Under Curve
1.00 1.00 1.00 1.00
Model Classification
Unknown Origin 8 0 8 0
Pharmaceutical 0 8 0 8
Sensitivity 1 1
Specificity 1 1

264
8.5.3.3 Receiver Operating Characteristic curve (ROC) Analysis
The final allocation rule used a ROC curve, which operates a balance between
sensitivity and specificity, to determine a cut-off point between the two groups and
the discrimination value is chosen as the point that maximises both sensitivity and
specificity. According to the dataset used to train the LDA model, this value of D was
D = 0.78 for Model 1 and D = 0.93 for Model 2. A lower cut-off value would reduce
the specificity of the model and a higher cut-off value would decrease the sensitivity.
In this case, the sensitivity is the true classification rate for pharmaceutical tablets
and specificity is the true classification rate for illicit/unknown tablets. Therefore,
Sensitivity =
𝑛𝑜 𝑐𝑜𝑟𝑟𝑒𝑐𝑡𝑙𝑦 𝑐𝑙𝑎𝑠𝑠𝑖𝑓𝑖𝑒𝑑 (𝑇𝑟𝑢𝑒)𝑎𝑠 𝑃ℎ𝑎𝑟𝑚𝑎𝑐𝑒𝑢𝑡𝑖𝑐𝑎𝑙 (𝑇𝑃)
(𝑛𝑜 𝑐𝑜𝑟𝑟𝑒𝑐𝑡𝑙𝑦 𝑐𝑙𝑎𝑠𝑠𝑖𝑓𝑖𝑒𝑑 (𝑇𝑟𝑢𝑒)𝑎𝑠 𝑃ℎ𝑎𝑟𝑚𝑎𝑐𝑒𝑢𝑡𝑖𝑐𝑎𝑙 (𝑇𝑃) + 𝑛𝑜 𝑖𝑛𝑐𝑜𝑟𝑟𝑒𝑐𝑡𝑙𝑦 𝑐𝑙𝑎𝑠𝑠𝑖𝑓𝑖𝑒𝑑 (𝐹𝑎𝑙𝑠𝑒) 𝑎𝑠 𝑢𝑛𝑘𝑁𝑜𝑤𝑛(𝐹𝑁))
Specificity =
𝑛𝑜 𝑐𝑜𝑟𝑟𝑒𝑐𝑡𝑙𝑦 𝑐𝑙𝑎𝑠𝑠𝑖𝑓𝑖𝑒𝑑 (𝑇𝑟𝑢𝑒) 𝑎𝑠 𝑢𝑛𝑘𝑁𝑜𝑤𝑛 (𝑇𝑁)
(𝑛𝑜 𝑐𝑜𝑟𝑟𝑒𝑐𝑡𝑙𝑦 𝑐𝑙𝑎𝑠𝑠𝑖𝑓𝑖𝑒𝑑 (𝑇𝑟𝑢𝑒) 𝑎𝑠 𝑢𝑛𝑘𝑁𝑜𝑤𝑛 (𝑇𝑁) + 𝑛𝑜 𝑜𝑓 𝑖𝑛𝑐𝑜𝑟𝑟𝑒𝑐𝑡𝑙𝑦 𝑐𝑙𝑎𝑠𝑠𝑖𝑓𝑖𝑒𝑑 (𝐹𝑎𝑙𝑠𝑒) 𝑎𝑠 𝑝ℎ𝑎𝑟𝑚𝑎𝑐𝑒𝑢𝑡𝑖𝑐𝑎𝑙(𝐹𝑃)
A ROC curve plots sensitivity against 1-specificity to produce a curve. The closer
this is to the top left of the plot, the higher the proportion of true positive results and
hence the more accurate the calculation. If the curve lies close to the diagonal line
(Figure 8.9), the classification is no better than random allocation of the tablets to the
two groups (Altman and Bland, 1994). This means that the closer the area under the
curve is to 1, the closer the LDA model classification is to a perfect classification
according to the original classification of pharmaceutical and unknown. The ROC
analysis was carried out in SPSS and the results for both models (1 and 2) indicated
that this was a perfect classification, with no false positives being recorded. The
results are shown in Table 8.2 and Figure 8.9.
265
Figure 8.9. The ROC curve produced by the analysis of the principal components of the DSC
data. The result was the same for both models 1 and 2.
Two validation methods were employed to assess the performance of the models.
8.5.4 Validation of the Statistical Technique
8.5.4.1 Validation by Leave-one-out analysis
Validation was performed in order to ensure the model was fit for purpose by testing
whether the model predictions were reliable. Validation of the model was performed
using ‘Leave-one-out’ analysis. This technique runs the application n times using n-
1 observations from the dataset each time and then the model is tested on the
excluded observation as a form of cross-validation. After all the n-1 iterations of the
model, each observation has been used once to test the model and n-1 times to train
the model. Each of the samples are therefore used for testing the classification
capabilities of the model.
The results of the validation show that although all the unknown cases were
classified by the model in accordance with the original classification during the
building process and one pharmaceutical was incorrectly classified as being of
unknown origin, an additional unknown case was classified as being pharmaceutical
during the cross-validation (Table 8.3). The validation was performed using both
models 1 and 2, producing identical results. The Leave-One-Out Cross Validation

266
(LOOCV) was performed by SPSS using the default mean centroid allocation rule
which has the cut-off D>0 for unknown and D<0 for pharmaceutical. Options for
changing the cut-off to test the other two allocation rules were not available in SPSS
and this therefore made an impact on the results since the third allocation rule
produced a more reliable classification on the data used.
Table 8.3. Classification and Cross-Validation Results using both models 1 and 2.
Predicted Group Membership
Type Unknown
Origin
Pharmaceutical Correct
Classification (%)
Original Unknown Origin 8 0
93.8 Pharmaceutical 1 7
Cross-
Validated
Unknown Origin 7 1
87.5 Pharmaceutical 1 7
8.5.4.2 Validation of models using test sample
Prior to developing the LDA models, the dataset was split into a training dataset for
training the model and a testing dataset to test the predictive quality of the model.
The model for the LDA had been trained using all of the unknown cases except for
two chosen at random (Cases 2 and 29) and two pharmaceutical tablets also taken
at random (MA064 and MA061-30). These reserved cases of unknown tablets and
two pharmaceuticals, were used for testing the two models. Ideally a larger number
of samples would have been used for the test but this was not possible given the
small number of tablets available for the dataset.
Centroids
The SPSS default of 0 was used to analyse all of the four test cases, using both
models 1 and 2. All of the test samples were correctly identified using Model 1.
However, one pharmaceutical tablet was misclassified as being of unknown origin by
using Model 2. In addition, all of the tablets that did originate from an unknown
source were classified as being from the unknown group. Since there were only

267
four samples in the test dataset, the number of observations is too small to calculate
separate sensitivity and specificity. The results are shown in Table 8.4.
Table 8.4. Results of the four test cases using discriminant analysis with centroids and the
SPSS default discriminant value of 0.
Model 1 Model 2
Original
Classification
Unknown
Origin
Pharmaceutical Unknown
Origin
Pharmaceutical
Unknown
Origin
Classification 2 0 2 1
Pharmaceutical Classification 0 2 0 1
Confidence Intervals
Calculations of the midpoint between the upper 95% confidence interval of the
pharmaceutical data and the lower 95% confidence interval of the unknown data,
meant that the cut-off point moved only fractionally from the default point of 0 to 0.12
for Model 1 and to 0.21 for Model 2. This resulted in all of the test samples being
correctly classified using Model 1, and one pharmaceutical tablet being misclassified
as unknown, using Model 2. However, all the tablets in the dataset that were known
to be of unknown origin were correctly classified using this allocation rule (Table 8.5).
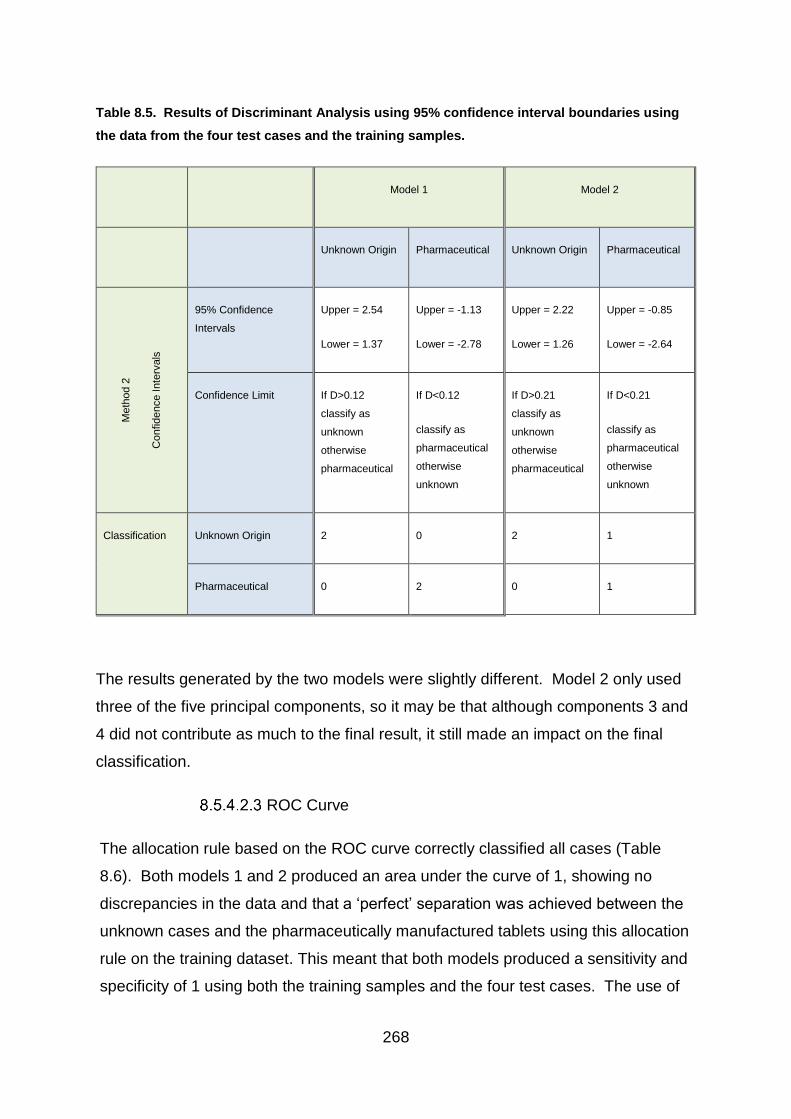
268
Table 8.5. Results of Discriminant Analysis using 95% confidence interval boundaries using
the data from the four test cases and the training samples.
Model 1 Model 2
Unknown Origin Pharmaceutical Unknown Origin Pharmaceutical
Me
thod 2
Confid
ence Inte
rvals
95% Confidence
Intervals
Upper = 2.54
Lower = 1.37
Upper = -1.13
Lower = -2.78
Upper = 2.22
Lower = 1.26
Upper = -0.85
Lower = -2.64
Confidence Limit If D>0.12
classify as
unknown
otherwise
pharmaceutical
If D<0.12
classify as
pharmaceutical
otherwise
unknown
If D>0.21
classify as
unknown
otherwise
pharmaceutical
If D<0.21
classify as
pharmaceutical
otherwise
unknown
Classification Unknown Origin 2 0 2 1
Pharmaceutical 0 2 0 1
The results generated by the two models were slightly different. Model 2 only used
three of the five principal components, so it may be that although components 3 and
4 did not contribute as much to the final result, it still made an impact on the final
classification.
ROC Curve
The allocation rule based on the ROC curve correctly classified all cases (Table
8.6). Both models 1 and 2 produced an area under the curve of 1, showing no
discrepancies in the data and that a ‘perfect’ separation was achieved between the
unknown cases and the pharmaceutically manufactured tablets using this allocation
rule on the training dataset. This meant that both models produced a sensitivity and
specificity of 1 using both the training samples and the four test cases. The use of
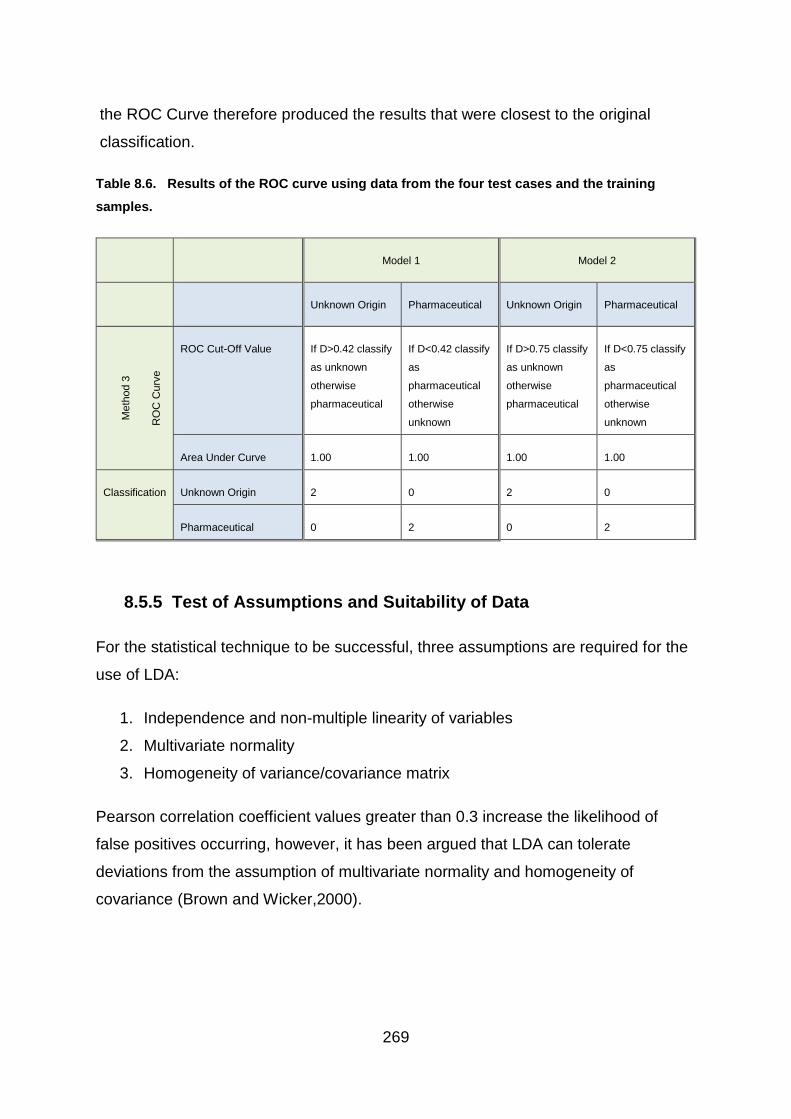
269
the ROC Curve therefore produced the results that were closest to the original
classification.
Table 8.6. Results of the ROC curve using data from the four test cases and the training
samples.
Model 1 Model 2
Unknown Origin Pharmaceutical Unknown Origin Pharmaceutical
Me
thod 3
RO
C C
urv
e
ROC Cut-Off Value If D>0.42 classify
as unknown
otherwise
pharmaceutical
If D<0.42 classify
as
pharmaceutical
otherwise
unknown
If D>0.75 classify
as unknown
otherwise
pharmaceutical
If D<0.75 classify
as
pharmaceutical
otherwise
unknown
Area Under Curve 1.00 1.00 1.00 1.00
Classification Unknown Origin 2 0 2 0
Pharmaceutical 0 2 0 2
8.5.5 Test of Assumptions and Suitability of Data
For the statistical technique to be successful, three assumptions are required for the
use of LDA:
1. Independence and non-multiple linearity of variables
2. Multivariate normality
3. Homogeneity of variance/covariance matrix
Pearson correlation coefficient values greater than 0.3 increase the likelihood of
false positives occurring, however, it has been argued that LDA can tolerate
deviations from the assumption of multivariate normality and homogeneity of
covariance (Brown and Wicker,2000).

270
8.5.5.1 Independence and non-multiple linearity.
The assumption of independence and non-multiple linearity can be demonstrated by
a lack of correlation between the variables, with an ideal Pearson’s correlation
coefficient value of <0.3 between pairs on independent variables. Tests of the
assumption of independence and non-collinearity for both models (Table 8.7) show
that the correlation coefficient was below the recommended 0.3 level for PC1, 2 and
5 but the correlations to PC3 and 4 were slightly higher. Therefore, the LDA
assumption of independence and non-collinearity is acceptable for the three
discriminating independent variables in the model.
Table 8.7. Correlation between variables.
8.5.5.2 Multivariate normality
The tests for multivariate normality are difficult to perform and are not generally
included in most statistical packages but Brown and Wicker (2000) suggest that if
the discriminant function scores are normally distributed then multivariate normality
is likely. The Shapiro-Wilk test presents a null hypothesis that the population is
normally distributed. The results of the Shapiro-Wilk test are shown in Table 8.8

271
and demonstrate that the data used for the LDA are normally distributed so this
assumption of the LDA method is satisfied.
Table 8.8. Results of Shapiro Wilk Test of normality on values of D for each tablet group, where:
W = the observed value of the Shapiro-Wilk statistic and p is the probability of the
outcome. The number in brackets refers to the degrees of freedom. H0: Data are normally
distributed. A p-value >0.05 indicates that the null hypothesis is true and the data are normally
distributed. A p-value <0.05 results in the null hypothesis being rejected, indicating that the data
are not normally distributed.
Model 1 Shapiro-Wilk Null
Hypothesis
Distribution
Unknown W(8) = 0.996;
p=1.000
Accepted Normal
Pharmaceutical W(8) = 0.825;
p=0.053
Accepted Normal
Model 2
Unknown W(8) = 0.909;
p=0.348
Accepted Normal
Pharmaceutical W(8) = 0.880;
p=0.190
Accepted Normal
8.5.5.3 Homogeneity of variance/covariance matrix
The variance/covariance matrices should demonstrate similarity across groups and
the assumption is examined by the Box’s M test. The null hypothesis states that the
covariance matrices do not differ and the significance level is set at p=0.01.
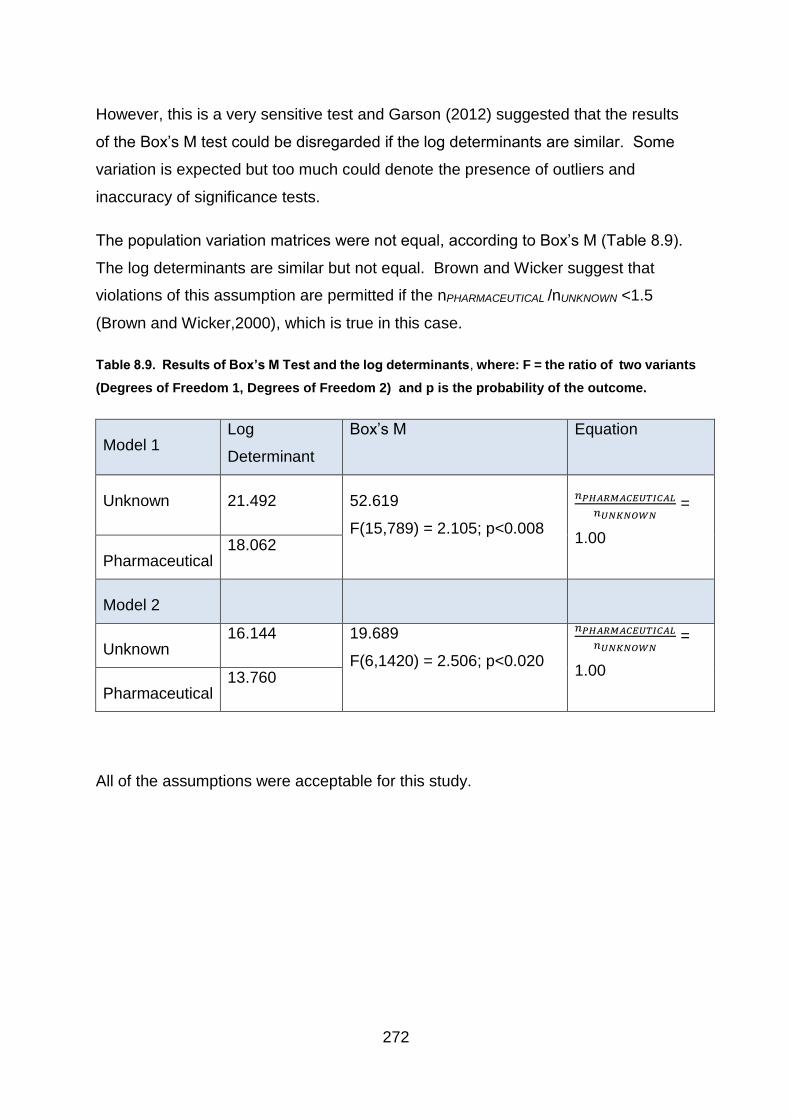
272
However, this is a very sensitive test and Garson (2012) suggested that the results
of the Box’s M test could be disregarded if the log determinants are similar. Some
variation is expected but too much could denote the presence of outliers and
inaccuracy of significance tests.
The population variation matrices were not equal, according to Box’s M (Table 8.9).
The log determinants are similar but not equal. Brown and Wicker suggest that
violations of this assumption are permitted if the nPHARMACEUTICAL /nUNKNOWN <1.5
(Brown and Wicker,2000), which is true in this case.
Table 8.9. Results of Box’s M Test and the log determinants, where: F = the ratio of two variants
(Degrees of Freedom 1, Degrees of Freedom 2) and p is the probability of the outcome.
Model 1 Log
Determinant
Box’s M Equation
Unknown 21.492 52.619
F(15,789) = 2.105; p<0.008
𝑛𝑃𝐻𝐴𝑅𝑀𝐴𝐶𝐸𝑈𝑇𝐼𝐶𝐴𝐿
𝑛𝑈𝑁𝐾𝑁𝑂𝑊𝑁 =
1.00
Pharmaceutical 18.062
Model 2
Unknown 16.144 19.689
F(6,1420) = 2.506; p<0.020
𝑛𝑃𝐻𝐴𝑅𝑀𝐴𝐶𝐸𝑈𝑇𝐼𝐶𝐴𝐿
𝑛𝑈𝑁𝐾𝑁𝑂𝑊𝑁 =
1.00
Pharmaceutical 13.760
All of the assumptions were acceptable for this study.

273
8.5.6 Suitability of Data
An important step of the LDA was to ensure the data was suitable for this type of
analysis. A discriminant procedure such as LDA requires variance between the
independent variables in order to distinguish between groups. The Wilks’ Lambda
test evaluates the discriminating power of each of the independent variables. The
test generates a Wilks’ Lambda value which is the ratio between the within group
variance and the total variance. Wilks’ Lambda uses a scale of 0 – 1, where results
of 0 indicate there is significant variation in the means of the groups, giving it total
discriminatory power. Results of 1 signify that there is no difference in the groups’
means and therefore no discriminatory potential. However, even if only one group
variable is significant, then the whole model is regarded as significant (Garson,
2012).
The F test explores the ratio of variance and determines the level of significance. It
stipulates that when p<0.05, the independent variable has a significant impact on
discrimination. An F test with p>0.05 indicates that discrimination simply occurs by
chance (Garson, 2012). In this study PC1, PC2 and PC5 have significant
discriminatory power whereas, PC3 and PC4 have little discriminatory potential
(Table 8.10). Wilks’ Lambda can be used to refine a model by removal of the less
discriminating functions (Garson, 2012). For this reason, two models were created
for this project. Model 1 incorporated the statistical results produced by all five
principal components and Model 2 was based on the results of only principal
components 1, 2 and 5.

274
Table 8.10. Wilks’ Lambda test for significance of independent variables.
Wilks’ Lambda Discriminatory Significance
PC1 0.332 F(1,14) = 28.15; p<0.00
PC2 0.401 F(1,14) = 20.88; p<0.00
PC3 0.943 F(1,14) = 0.85; p<0.373
PC4 0.767 F(1,14) = 4.25; p<0.058
PC5 0.678 F(1,14) = 6.66; p<0.022
The aim of the discriminant analysis was to use the DSC data which represents the
tablets’ excipient content to separate the illicit cases into groups which originate from
a pharmaceutical manufacturing process to those where the origin is unknown.
Therefore, only one discriminant function, or allocation rule, was required to
distinguish between the two groups. Wilks’ Lambda was used to determine the
effectiveness of the discriminant function. The null hypothesis stated that the group
means are equal and therefore do not discriminate but a significant Wilks’ Lambda
score, as determined by both models in this project, indicates that the null hypothesis
can be rejected (Garson, 2012). This means that both models were found to be
discriminating (Table 8.11).
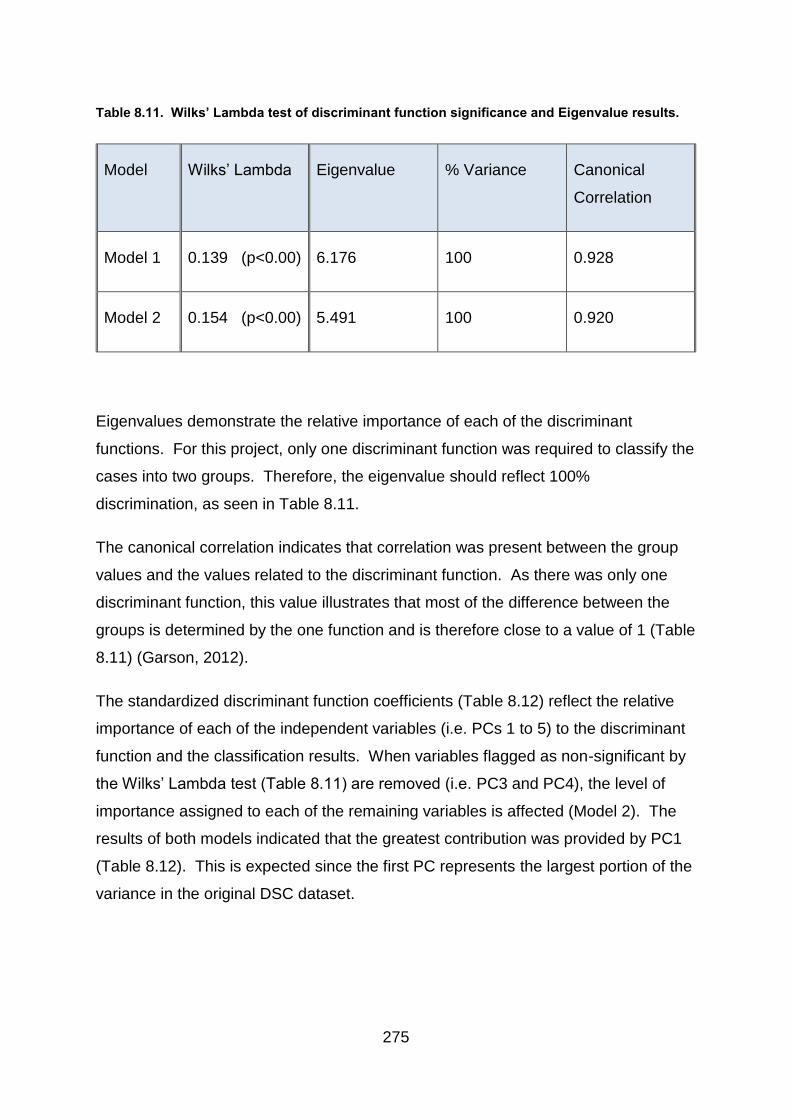
275
Table 8.11. Wilks’ Lambda test of discriminant function significance and Eigenvalue results.
Model Wilks’ Lambda Eigenvalue % Variance Canonical
Correlation
Model 1 0.139 (p<0.00) 6.176 100 0.928
Model 2 0.154 (p<0.00) 5.491 100 0.920
Eigenvalues demonstrate the relative importance of each of the discriminant
functions. For this project, only one discriminant function was required to classify the
cases into two groups. Therefore, the eigenvalue should reflect 100%
discrimination, as seen in Table 8.11.
The canonical correlation indicates that correlation was present between the group
values and the values related to the discriminant function. As there was only one
discriminant function, this value illustrates that most of the difference between the
groups is determined by the one function and is therefore close to a value of 1 (Table
8.11) (Garson, 2012).
The standardized discriminant function coefficients (Table 8.12) reflect the relative
importance of each of the independent variables (i.e. PCs 1 to 5) to the discriminant
function and the classification results. When variables flagged as non-significant by
the Wilks’ Lambda test (Table 8.11) are removed (i.e. PC3 and PC4), the level of
importance assigned to each of the remaining variables is affected (Model 2). The
results of both models indicated that the greatest contribution was provided by PC1
(Table 8.12). This is expected since the first PC represents the largest portion of the
variance in the original DSC dataset.

276
Table 8.12. Standardized discriminant function coefficients showing the relative importance of
each principal component to the discriminant function. The results identify that the largest
contribution for both models was given by PC1.
Model 1 PC1 PC2 PC3 PC4 PC5
Coefficients 1.073 0.817 -0.205 0.484 0.411
Model 2
Coefficients 0.815 0.792 0.320
8.6 Conclusion
Illicit tablets can be distinguished from pharmaceutical tablets using a variety of
analytical methods which examined either the nature and amount of active drug
substance or the properties of the excipient. Two groups of illicit tablets contained
an active drug substance other than diazepam (1) and another group contained
quantities of diazepam (1) that were outside the specified level for a pharmaceutical
tablet. This left a group of illicit tablets with the correct type and amount of active
drug substance (10 mg diazepam 1) but DSC analysis discriminated between these
tablets and pharmaceutical tablets based on the tablets’ excipient content. Linear
discriminant analysis of the DSC data indicated that the excipient content of the
unknown tablets was distinct from pharmaceutical diazepam (1) tablets licenced in
the UK. However, this result does not rule out the possibility that the unknown
tablets were pharmaceutically manufactured outside the UK and diverted for illicit
use or that they had been pharmaceutically manufactured for the UK market and
diverted but were older than the pharmaceutical tablets used in this study and had
degraded over time. Degradation of the excipient could generate a DSC
thermogram that was distinct from the newer tablets obtained directly from the
pharmaceutical company. This possibility merits further investigation.
The LDA model had good predictive power as indicated by the LOOCV but one
pharmaceutical and one unknown tablet in the training dataset were misclassified.
277
However, analysis of the four test cases and the training data using the centroid and
confidence interval methods only misclassified one pharmaceutical tablet using the
first model and two using the second. One possible reason for two of the
pharmaceutical tablets being misclassified is that not all of the pharmaceutical
tablets were run on the DSC on the same day. The first two cases (MA061 and
MA064) were analysed along with the illicit cases. The remaining eight cases of
pharmaceutical tablets were run later. It was these two pharmaceutical tablets
(MA061 and MA064) which were misclassified, as they did not group with the
remaining pharmaceutical tablets. The DSC instrument underwent maintenance
during the interval between analyses and this may have had an effect on the
outcome and explain why these two pharmaceutical tablets were misclassified by the
model. Potentially, if the tablets had all been run together, it may have been more
difficult to separate the pharmaceutical tablets from the unknown. This would be
worth further investigation in the future and could help to produce a more effective
model.
Despite this, the unknown tablets were correctly classified using the majority of
methods. However, the LOOCV result achieved 87.5% accuracy, while the use of
centroids and confidence intervals gave a result of over 90%. In addition the ROC
Curve correctly identified all of the tablets. The limitation of this analysis was the
small dataset but the results of this study indicate the strong potential in this
statistical model.
278
9.1 Chapter Summary
The conclusion describes the context in which this study is set and provides a brief
summary of the work performed and the results obtained.
This section also suggests ideas for future work to build upon the analysis performed
during this project. Some investigations could have been performed in different
ways and a variety of avenues could have been taken. Initial tests were also made
into alternative methods of analysis such as DSC. Therefore, the work performed in
this project has provided an important step on which to base future work and
suggestions are described with a view to obtaining further information that would
help in the characterisation of illicit tablets.
9.2 Conclusions
The results of this project have proved that differentiation can be made between
tablets in the illegal supply chain by using information gained from their physical and
chemical analysis. By characterising the illicit blue tablets and comparing the
resulting data to results generated by similar analysis of known pharmaceutical
tablets, differences emerged which enabled some distinction to be made between
illicitly produced and pharmaceutically manufactured tablets. Comparison of the illicit
tablets also revealed an array of different active drug substances in varying
quantities in the illegal drug tablets. However, some similarities were also
discovered between the illicit tablets, indicating possible connections between the
seized cases, which may provide important intelligence to police forces.
Differences in tablet markings showed that many of the tablets in the illegal supply
chain had not been pharmaceutically manufactured for the UK market, including
tablets containing the letters EZ or NTZ. Some of the markings, such as MA / D10
were consistent with pharmaceutical logos that were no longer in production in the
UK. However, due to shelf life, they may have been legally available at the time of

279
manufacture and then diverted for illegal use. Other cases contained tablets marked
CP | D10, which correspond with the imprints used by Wockhardt and which are still
being manufactured in the UK, indicating that they may also have been diverted into
the illegal supply chain.
Weight analysis of the illicit tablets highlighted differences in the consistency of illicit
cases. The weight range of pharmaceutical tablets was very small because of the
requirement to comply with pharmaceutical regulations. Variation in tablet weight
could ultimately affect the dosage level of the drug and is therefore carefully
monitored within the pharmaceutical industry. However, greater variation of tablet
weight existed within illicit cases. This provides an insight into illicit manufacturing
procedures and can provide a quick and simple basis for initial screening of seized
cases.
Similarly, tablets manufactured by for example, the pharmaceutical company MA
Pharmachem, consistently weighed between 165 – 175 mg, however, twelve of the
illicit cases with a corresponding MA | D/10 marking were found to have a mean
weight above this level, therefore suggesting that these cases had been illicitly
manufactured, or were possibly a failed pharmaceutical batch, which had not been
destroyed. Another twelve illicit cases contained tablets that did correspond to the
pharmaceutical range indicating they may have been pharmaceutically
manufactured, but diverted tablets.
Greater variation was also found in tablet depth, within illicit cases compared to
pharmaceutical batches and was emphasised through relative standard deviation.
The data was analysed in conjunction with box plots and graphical representations
which enabled differences to be clearly visualised.
Measurements of diameter, depth and weight allowed 14 cases of seized tablets to
be identified as matching known pharmaceutical tablets. These 14 cases were
comprised of ten cases marked MA and one case consistent with tablets produced
by each of Tensium, Teva and Wockhardt. These companies have all been licensed
to produce diazepam (1) tablets. The final case which matched the pharmaceutical
tablets was marked Roche which is a legitimate manufacturer of diazepam (1)
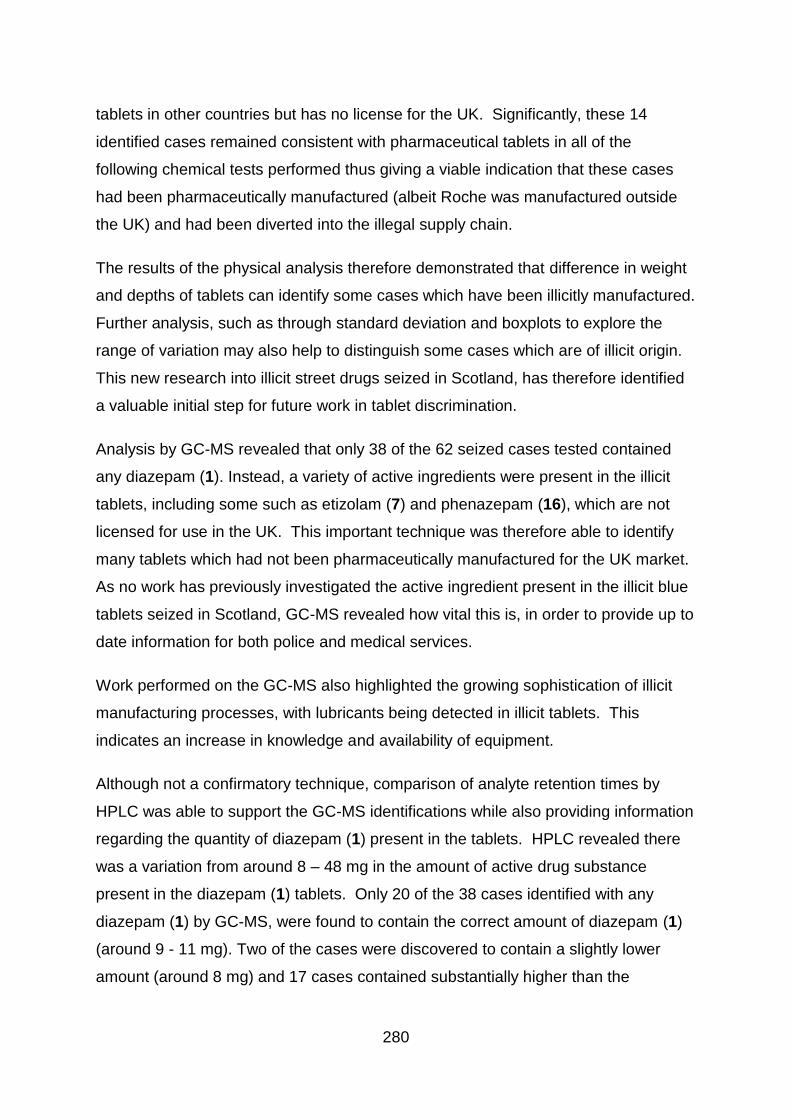
280
tablets in other countries but has no license for the UK. Significantly, these 14
identified cases remained consistent with pharmaceutical tablets in all of the
following chemical tests performed thus giving a viable indication that these cases
had been pharmaceutically manufactured (albeit Roche was manufactured outside
the UK) and had been diverted into the illegal supply chain.
The results of the physical analysis therefore demonstrated that difference in weight
and depths of tablets can identify some cases which have been illicitly manufactured.
Further analysis, such as through standard deviation and boxplots to explore the
range of variation may also help to distinguish some cases which are of illicit origin.
This new research into illicit street drugs seized in Scotland, has therefore identified
a valuable initial step for future work in tablet discrimination.
Analysis by GC-MS revealed that only 38 of the 62 seized cases tested contained
any diazepam (1). Instead, a variety of active ingredients were present in the illicit
tablets, including some such as etizolam (7) and phenazepam (16), which are not
licensed for use in the UK. This important technique was therefore able to identify
many tablets which had not been pharmaceutically manufactured for the UK market.
As no work has previously investigated the active ingredient present in the illicit blue
tablets seized in Scotland, GC-MS revealed how vital this is, in order to provide up to
date information for both police and medical services.
Work performed on the GC-MS also highlighted the growing sophistication of illicit
manufacturing processes, with lubricants being detected in illicit tablets. This
indicates an increase in knowledge and availability of equipment.
Although not a confirmatory technique, comparison of analyte retention times by
HPLC was able to support the GC-MS identifications while also providing information
regarding the quantity of diazepam (1) present in the tablets. HPLC revealed there
was a variation from around 8 – 48 mg in the amount of active drug substance
present in the diazepam (1) tablets. Only 20 of the 38 cases identified with any
diazepam (1) by GC-MS, were found to contain the correct amount of diazepam (1)
(around 9 - 11 mg). Two of the cases were discovered to contain a slightly lower
amount (around 8 mg) and 17 cases contained substantially higher than the

281
expected quantity (approximately 19 – 48 mg). The remaining tablets contained
other active drug substances. HPLC analysis therefore revealed that many of the
tablets containing diazepam (1) on the illicit market, had not been pharmaceutically
manufactured and reflects a potential change away from diverting pharmaceutical
tablets to illicit manufacture.
This vital investigation was therefore able to distinguish between cases containing
different levels of active drug substance and revealed the true nature of diazepam
(1) being sold on the streets of Tayside. This again may provide useful information
to both police and medical staff.
Use of DSC proved very informative and provided a thermal profile which was largely
based on the excipients present in the analysed tablets, due to the small amount of
active drug substance present in diazepam (1) tablets. DSC thermograms clearly
showed differences and similarities between the illicit cases and in comparison to the
pharmaceutical tablets. This therefore proved valuable for distinguishing between
the various cases and for revealing potential links which may have otherwise been
missed. Although unable to identify excipients, the technique gave an indication of
substances present, such as lactose, which gives a distinctive trace and is often a
major component of both pharmaceutical and some illicit tablets. The use of DSC
proved invaluable for this project and has demonstrated great potential for future
projects.
The DSC thermograms also provided data influenced by the excipients, which was
subjected to statistical cluster analysis using k-means clustering. Data reduction
using principal component analysis was also performed on the data and allowed
linear discriminant analysis to be performed on the seized cases which were most
similar to the pharmaceutical tablets. By using three different allocation rules, the
results indicated that illicit tablets were able to be distinguished from the
pharmaceutical tablets. This novel investigation into illicit tablets using a
combination of DSC and statistical analysis has demonstrated how powerful the
technique can be, by exploring finer detail of the main constituents of the tablets and
distinguishing all cases from the pharmaceutical tablets. This new and innovative

282
technique, developed from well-established methodologies could provide vital
insights in future work.
Statistical cluster analysis using AHC, k-means clustering and a subjective approach
based on visual comparison, was performed using three sets of independent data
generated by each of the analytical techniques. The results of the analyses were
combined in a heat map which, highlighted how similar different illicit cases were to
each other and to analysed pharmaceutical tablets based on statistical analysis of
their physical and chemical properties. The heat map identified seized cases which
clustered with the pharmaceutical batches a varying number of times, which could
suggest that they had been pharmaceutically manufactured and diverted into the
illegal supply chain. In addition, a number of the illicit cases were found to cluster
together on multiple occasions, implying there may be a link between the seized
cases. The heat map proved to be a useful and informative way of combining results
from multiple tests and an effective method of visualising cases which shared certain
characteristics.
Study into illicit diazepam (1) tablets had not previously been performed and this
work has successfully provided a greater understanding of “blue tablets” (allegedly
diazepam 1) in the Scottish illicit market. In addition, an investigation into the
forensic use of DSC has demonstrated the potential value that thermal analysis
could provide in future investigations. The study has also shown how physical and
chemical characterisation and statistical analysis can successfully be combined to
both differentiate between tablets and to highlight potential links. The results have
indicated that of the twenty-four MA / D10 marked tablets (which were used as the
sample set) obtained from the Scottish Police Authority there is a high probability
that five are diverted pharmaceutical tablets, with another five potential diverted
tablets. The remaining fourteen are illicit.
9.3 Recommendations for Future Work
Based on the work performed a number of recommendations for future work can be
suggested to build on the knowledge already gained. Firstly, the great potential
offered by DSC would require a substantial amount of further investigation. Reruns

283
of tablets suggest that changes take place over time and investigation into effects of
time and storage conditions would provide greater understanding of the limitations of
the technique. This could reveal that direct comparison of different cases is difficult
as resulting thermograms may show variation despite tablets originating from the
same source. However, it may also provide an understanding of how each excipient
would behave over time thus helping to identify links been illicit seizures.
Consequently, the forensic analysis of tablets using DSC would benefit from further
research in this area.
Some differences between samples may also be due to inconsistent blending of the
tablet and the small sample size. Therefore, it may be advisable to analyse more
samples from each tablet and case. It should be noted however, that samples that
were used in this project were those obtained by Police Scotland so the sample size
was dependent on the seizures.
The sensitivity of DSC had shown that tablets could be separated according to visual
comparison of the thermograms produced. The tablets marked MA / D10 for
example, could be separated into groups similar to those distinguished by visual
comparison (Chapter 7 – Statistical Cluster Analysis). The difference being the
amalgamation of groups 1 and 2 through comparison of thermograms. However,
this was not due to the inability of DSC but due to the subjective nature of deciding a
cut-off point by which to distinguish between levels of diazepam (1) detected.
Interestingly, analysis of spectra produced testing the use of near infrared
spectroscopy (NIR) for this project, had only been able to separate the cases into
three groups. Groups 1 and 2 with varying amounts of diazepam (1) again looked
similar but the cases containing etizolam (7) also appeared comparable making it
difficult to distinguish between the spectra produced by cases containing diazepam
(1) and etizolam (7). This would suggest that DSC may be a more sensitive
technique for visual comparison of traces produced. This would be supported by the
study by Matos et al. (2017) whose compatibility studies using both DSC and
infrared spectroscopy found that interaction between diazepam (1) and colloidal
silicon dioxide produce a lower enthalpy value, which was not detected by infrared
spectroscopy alone, suggesting that DSC is a more sensitive technique. However, a

284
more detailed investigation into the benefits and comparison of each technique may
be required to assess whether the two methods could complement each other.
DSC thermograms show initial moisture loss from tablets through the presence of a
gentle endothermic slope from the start of the trace. It is possible that this may hide
events affecting the lower level constituents and could also affect data used for
statistical analysis depending on the amount present. Therefore, for this project, the
temperature range up to 100 oC was disregarded in the statistical analysis. Future
work could benefit from pre-drying tablets for DSC analysis to assess whether further
information could be revealed.
Inclusion of Thermal Gravimetric Analysis would also be interesting to compare to
DSC analysis, as it would help to clarify thermal events taking place in the sample.
In tests performed as part of this research, TGA was able to clarify instances of
dehydration or melting because of differences in weight loss. This could be valuable
particularly if endotherms from melting were obscured by a broader endotherm
produced by dehydration.
Other work that could prove useful would be colour analysis and granularity of
tablets. Identifying a means of describing colour that is not subjective and allows for
mottled tablets, would help with the classification. Uneven colour could be to do with
an uneven blend but variance in the level of dye added between different batches,
may also change perception of the colour. However, analysis of dyes may indicate
that the same food dyes are used, which would not help to distinguish between
cases. The use of photography may be a more realist approach and may also be
combined with assessing granularity. The granularity of tablets gives an indication of
the methods of production used and could provide useful intelligence for the police.
Identification of sugars could determine whether the same excipients were used by
the pharmaceutical companies and those produced illegally and could highlight
differences or similarities between different illicit seizures. Similarly, although
investigations into tablet markings and damage analysis could prove problematic,
largely due to tableting machines with multiple stations, overlaying photographs of
similarly marked cases may again help to identify links between seizures.

285
By including information related to where each seizure was made could also prove
interesting because when combined with information relating to potential links
between cases, this could indicate how widespread the market is for a particular illicit
manufacturer.
This work has a number of avenues which could be pursued and a potential first step
would be to approach the procurator fiscal to increase the number of tablets
analysed, thus giving a greater understanding of the illicit “blue tablet” market. Over
the time this project has been performed, differences have been witnessed in the
types of tablets received. Many of the first batch of seizures received from the police
contained tablets with 10 mg of diazepam (1) and only two cases which contained
another active drug substance (phenazepam 16). By the time the last batch was
received, six of the twenty-two cases contained diazepam (1) and, of those, only two
contained the pharmaceutical amount of between 9 – 11 mg. This would indicate
that more illegally manufactured tablets were entering the illicit market than
pharmaceutically diverted tablets. The market is constantly changing, possibly due
to using whichever active drug substance is the most easily accessible and the
availability of tableting equipment. This highlights the importance of the work started
in this project and the need to continue with the work in order to provide police and
medical staff with up to date information on what is being bought and sold on the
streets of Scotland.
The final overall aim of this and later projects would be to develop a rapid robust
system for determining the active ingredients in seized drug tablets and, along with
some of the techniques described herein, be able to provide highly useful drug
intelligence for police forces.
286
A preliminary investigation to group disparate batches of licit and illicit diazepam
tablets using differential scanning calorimetry.
Authors:
S. Bibi,a D. H. Bremner,b M. Macdougall-Heasman,b R. Reid,a K. Simpson,c A.
Tough,a S. Waddell,a I. J. Stewartb and K. H. Matthews*a
a: Robert Gordon University, Aberdeen b: Abertay University, Dundee Published in: Analytical Methods, 20 (7), pp. 8597-8604.
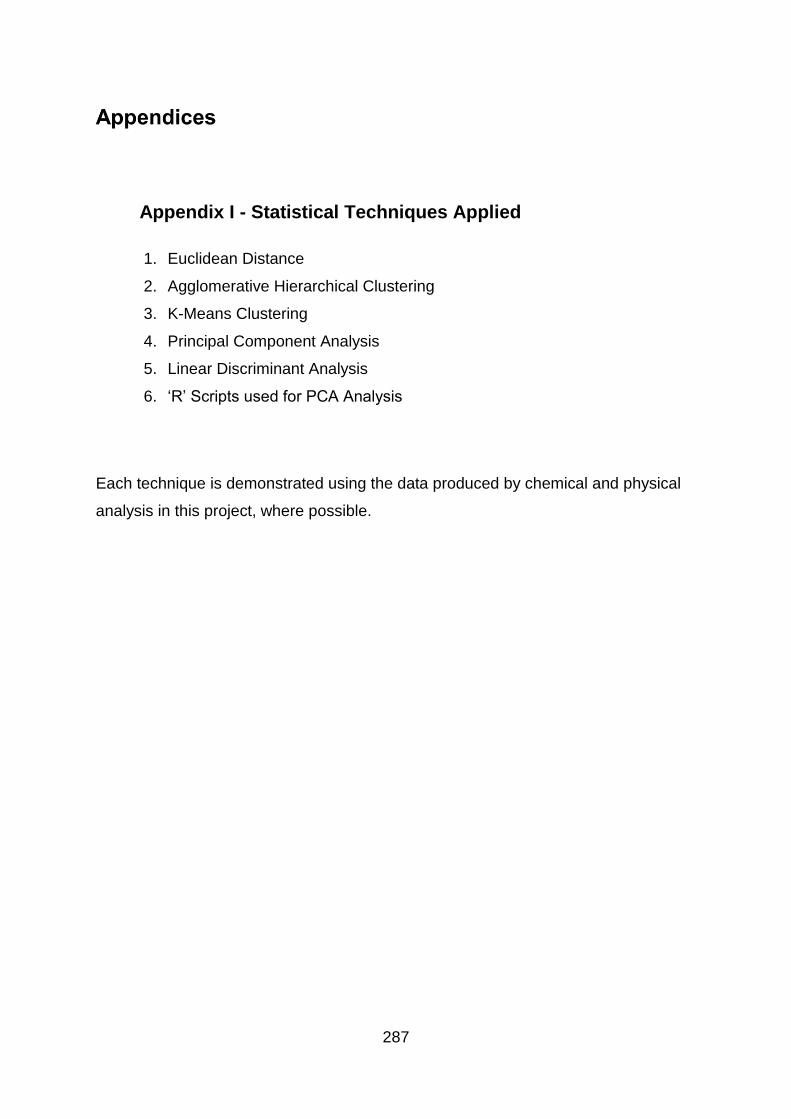
287
Appendix I - Statistical Techniques Applied
1. Euclidean Distance
2. Agglomerative Hierarchical Clustering
3. K-Means Clustering
4. Principal Component Analysis
5. Linear Discriminant Analysis
6. ‘R’ Scripts used for PCA Analysis
Each technique is demonstrated using the data produced by chemical and physical
analysis in this project, where possible.

288
Euclidean Distance
(𝓍2 - 1)2 + (y2 - y1)2
It is the distance of a straight line between two points.
The source of this formula is the Pythagorean theorem,
ie. The (hypotenuse)2 = 32 + 42 = 9 + 16 = 25
25 = 5
Therefore Euclidean Distance between points (2,-1) and (-2,2) =
Dist ((2,-1), (-2,2)) = (2- (-2))2 + ((-1) -2)2
= (2+2)2 + (-1-2)2
= (4)2 + (-3)2
= 16 + 9
= 25
= 5

289
Therefore using data relating to cases 26, 31, 13, 83, 16, 74, indicating their
diazepam (1) levels and relative standard deviation of weight of four tablets taken
from each case, a distance matrix showing the distance between each of the points
is required.
In order to determine the matrix, the distance between each of the points needs to
be calculated.
Cases 26 – 31
Points (25, 3.06) and (22, 1.99) =
Dist ((25, 3.06), (22, 1.99)) = (25 -22)2 + (3.06 – 1.99)2
= (25 - 22)2 + (3.06 – 1.99)2
= (3)2 + (-1.07)2
= 9 + 1.1449
= 10.1449
= 3.185
Cases 26 – 13
Points (25, 3.06) and (22, 1.99) =
Dist ((25, 3.06), (22, 1.27)) = (25 -22)2 + (3.06 – 1.27)2
= (25 - 22)2 + (3.06 – 1.27)2
= (3)2 + (-1.79)2
= 9 + 3.204
= 12.204
= 3.493

290
Cases 26 – 83
Points (25, 3.06) and (9, 0.92) =
Dist ((25, 3.06), (9, 0.92)) = (25 - 9)2 + (3.06 – 0.92)2
= (25 - 9)2 + (3.06 – 0.92)2
= (16)2 + (3.98)2
= 256 + 15.8404
= 271.8404
= 16.488
Cases 26 – 16
Points (25, 3.06) and (10, 0.82) =
Dist ((25, 3.06), (10, 0.82)) = (25 -10)2 + (3.06 – 0.82)2
= (25 - 10)2 + (3.06 – 0.82)2
= (15)2 + (2.24)2
= 225 + 5.0176
= 230.0176
= 15.166
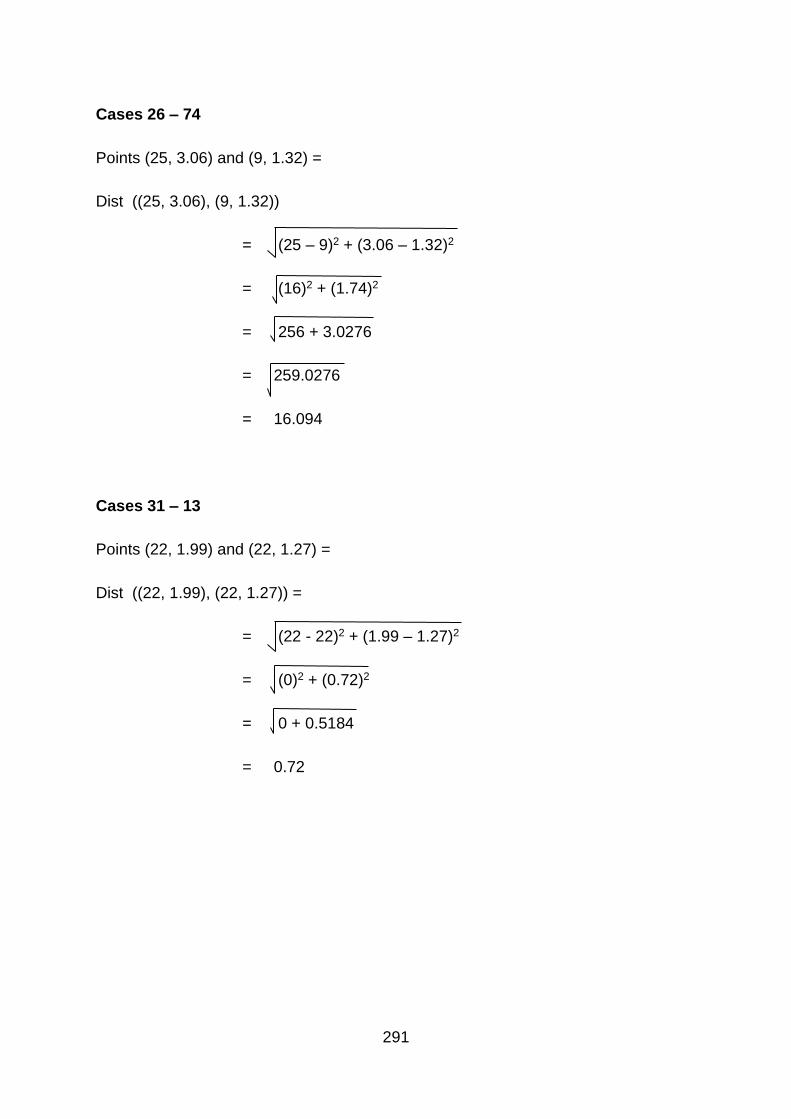
291
Cases 26 – 74
Points (25, 3.06) and (9, 1.32) =
Dist ((25, 3.06), (9, 1.32))
= (25 – 9)2 + (3.06 – 1.32)2
= (16)2 + (1.74)2
= 256 + 3.0276
= 259.0276
= 16.094
Cases 31 – 13
Points (22, 1.99) and (22, 1.27) =
Dist ((22, 1.99), (22, 1.27)) =
= (22 - 22)2 + (1.99 – 1.27)2
= (0)2 + (0.72)2
= 0 + 0.5184
= 0.72
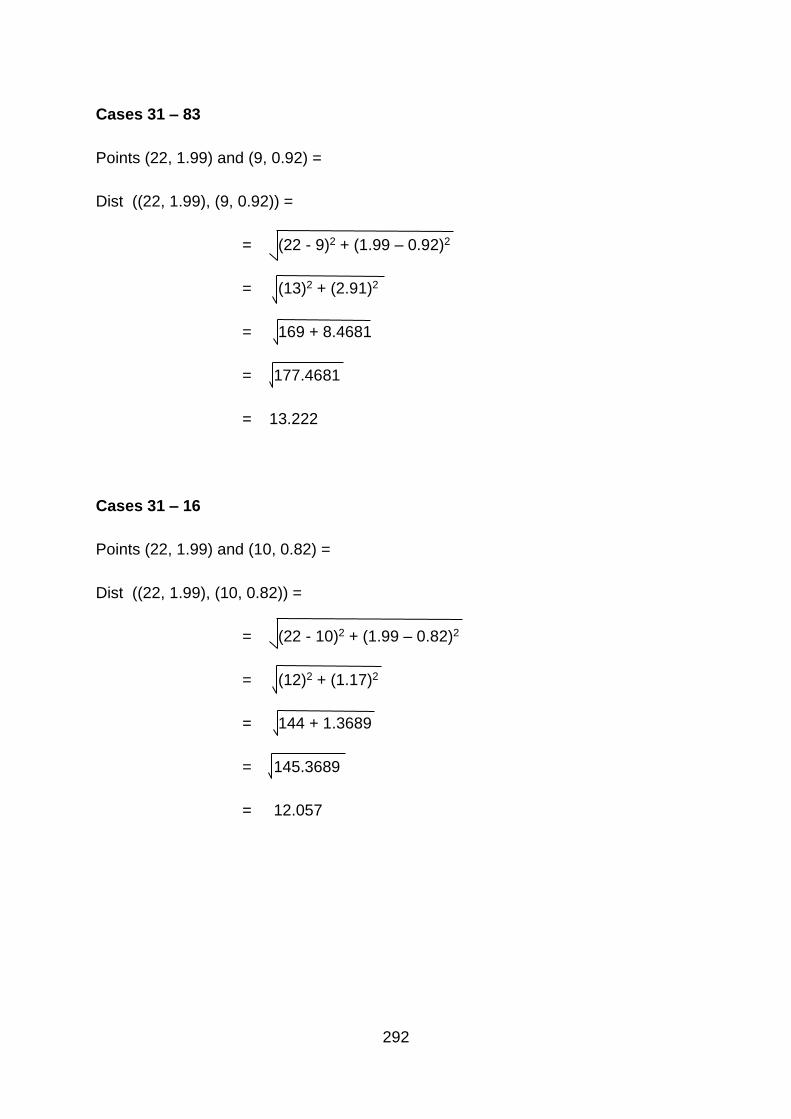
292
Cases 31 – 83
Points (22, 1.99) and (9, 0.92) =
Dist ((22, 1.99), (9, 0.92)) =
= (22 - 9)2 + (1.99 – 0.92)2
= (13)2 + (2.91)2
= 169 + 8.4681
= 177.4681
= 13.222
Cases 31 – 16
Points (22, 1.99) and (10, 0.82) =
Dist ((22, 1.99), (10, 0.82)) =
= (22 - 10)2 + (1.99 – 0.82)2
= (12)2 + (1.17)2
= 144 + 1.3689
= 145.3689
= 12.057

293
Cases 31 – 74
Points (22, 1.99) and (9, 1.32) =
Dist ((22, 1.99), (9, 1.32)) =
= (22 - 9)2 + (1.99 – 1.32)2
= (13)2 + (0.67)2
= 169 + 0.4489
= 169.4489
= 13.017
Cases 13 – 83
Points (22, 1.27) and (9, 0.92) =
Dist ((22, 1.27), (9, 0.92)) =
= (22 - 9)2 + (1.27 – 0.92)2
= (13)2 + (0.35)2
= 169 + 0.1225
= 169.1225
= 13.005

294
Cases 13 – 16
Points (22, 1.27) and (10, 0.82) =
Dist ((22, 1.27), (10, 0.82)) =
= (22 - 10)2 + (1.27 – 0.82)2
= (12)2 + (0.45)2
= 144 + 0.2025
= 144.2025
= 12.008
Cases 13 – 74
Points (22, 1.27) and (9, 1.32) =
Dist ((22, 1.27), (9, 1.32)) =
= (22 - 9)2 + (1.27 – 1.32)2
= (13)2 + (-0.05)2
= 169 + 0.0025
= 169.0025
= 13.00

295
Cases 83 – 16
Points (10, 0.82) and (9, 0.92) =
Dist ((10, 0.82), (9, 0.92)) =
= (10 - 9)2 + (0.82 – 0.92)2
= (1)2 + (-0.1)2
= 1 + 0.01
= 1.01
= 1.005
Cases 83 - 74
Points (9, 1.32) and (9, 0.92) =
Dist ((9, 1.32), (9, 0.92)) =
= (9 - 9)2 + (1.32 – 0.92)2
= (0)2 + (0.4)2
= 0 + 0.16
= 0.16
= 0.4
Cases 16 – 74
Points (10, 0.82) and (9, 1.32) =
Dist ((10, 0.82), (9, 1.32)) =
= (10 - 9)2 + (0.82– 1.32)2
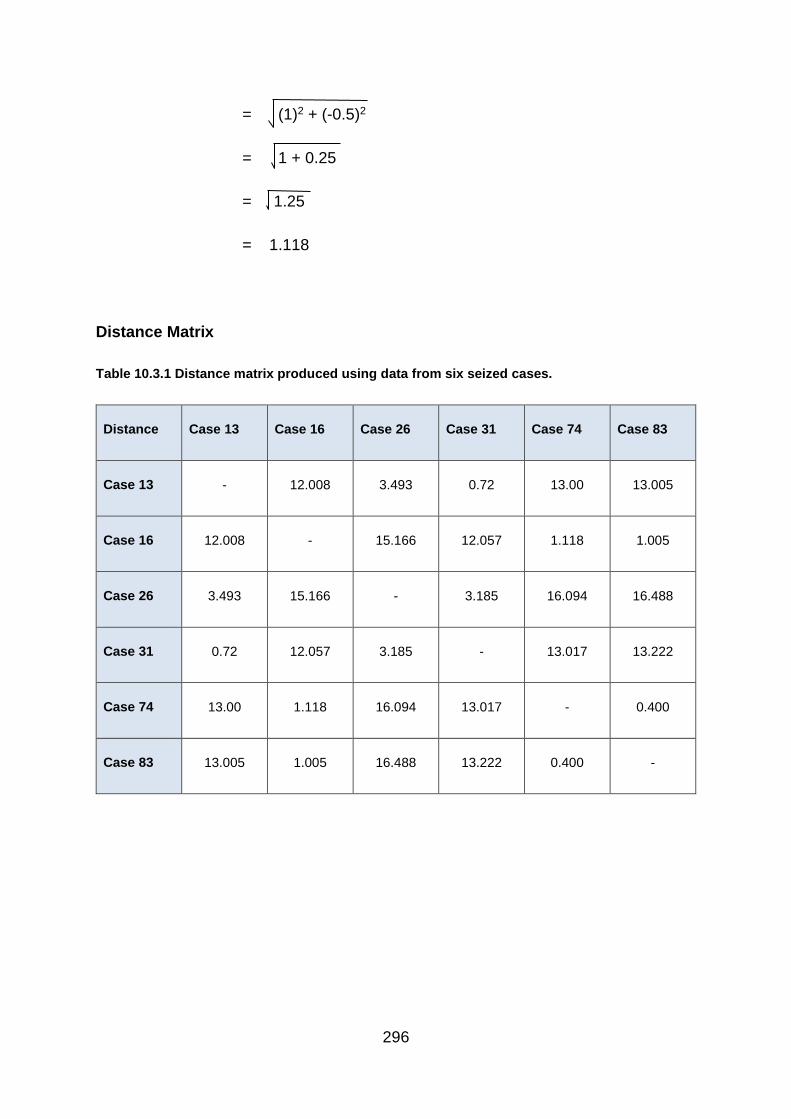
296
= (1)2 + (-0.5)2
= 1 + 0.25
= 1.25
= 1.118
Distance Matrix
Table 10.3.1 Distance matrix produced using data from six seized cases.
Distance Case 13 Case 16 Case 26 Case 31 Case 74 Case 83
Case 13 - 12.008 3.493 0.72 13.00 13.005
Case 16 12.008 - 15.166 12.057 1.118 1.005
Case 26 3.493 15.166 - 3.185 16.094 16.488
Case 31 0.72 12.057 3.185 - 13.017 13.222
Case 74 13.00 1.118 16.094 13.017 - 0.400
Case 83 13.005 1.005 16.488 13.222 0.400 -
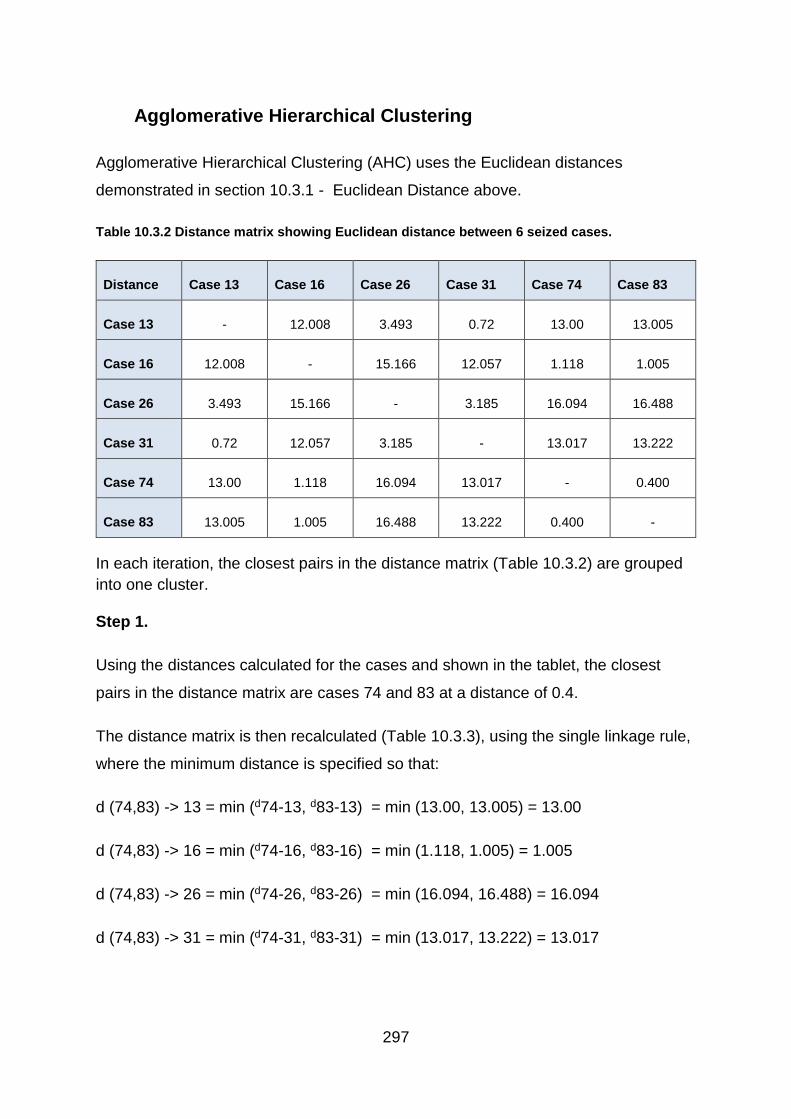
297
Agglomerative Hierarchical Clustering
Agglomerative Hierarchical Clustering (AHC) uses the Euclidean distances
demonstrated in section 10.3.1 - Euclidean Distance above.
Table 10.3.2 Distance matrix showing Euclidean distance between 6 seized cases.
Distance Case 13 Case 16 Case 26 Case 31 Case 74 Case 83
Case 13 - 12.008 3.493 0.72 13.00 13.005
Case 16 12.008 - 15.166 12.057 1.118 1.005
Case 26 3.493 15.166 - 3.185 16.094 16.488
Case 31 0.72 12.057 3.185 - 13.017 13.222
Case 74 13.00 1.118 16.094 13.017 - 0.400
Case 83 13.005 1.005 16.488 13.222 0.400 -
In each iteration, the closest pairs in the distance matrix (Table 10.3.2) are grouped
into one cluster.
Step 1.
Using the distances calculated for the cases and shown in the tablet, the closest
pairs in the distance matrix are cases 74 and 83 at a distance of 0.4.
The distance matrix is then recalculated (Table 10.3.3), using the single linkage rule,
where the minimum distance is specified so that:
d (74,83) -> 13 = min (d74-13, d83-13) = min (13.00, 13.005) = 13.00
d (74,83) -> 16 = min (d74-16, d83-16) = min (1.118, 1.005) = 1.005
d (74,83) -> 26 = min (d74-26, d83-26) = min (16.094, 16.488) = 16.094
d (74,83) -> 31 = min (d74-31, d83-31) = min (13.017, 13.222) = 13.017
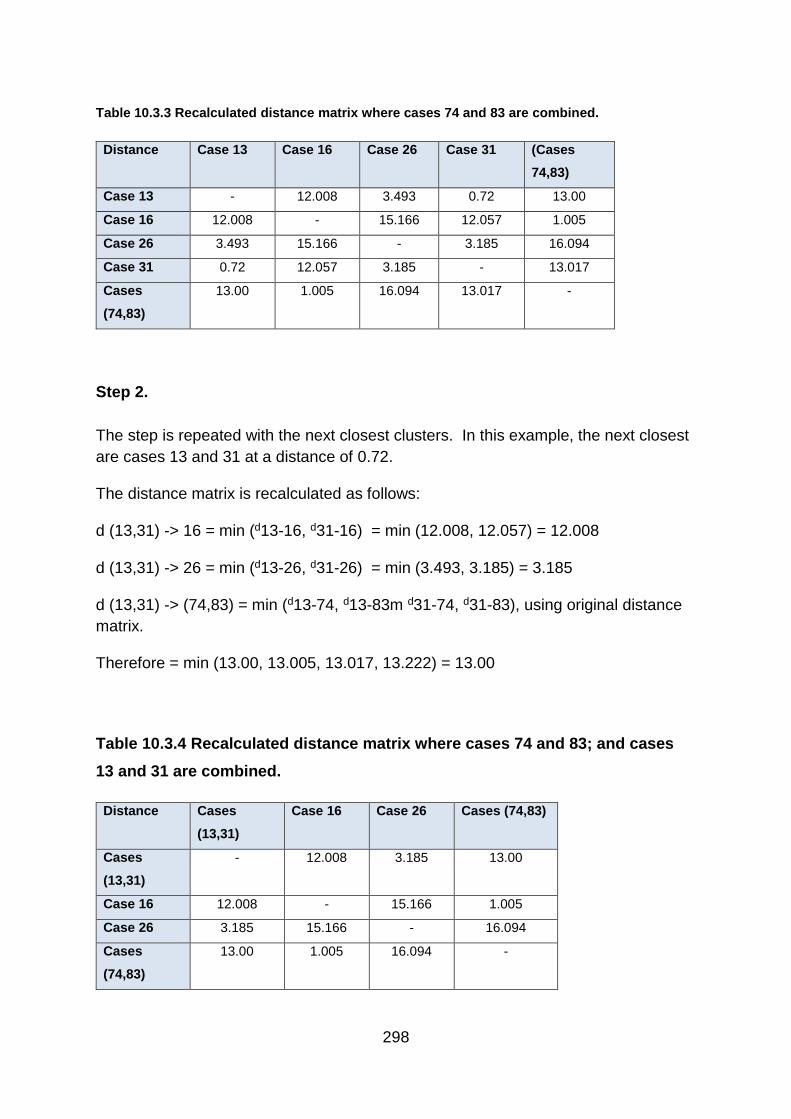
298
Table 10.3.3 Recalculated distance matrix where cases 74 and 83 are combined.
Distance Case 13 Case 16 Case 26 Case 31 (Cases
74,83)
Case 13 - 12.008 3.493 0.72 13.00
Case 16 12.008 - 15.166 12.057 1.005
Case 26 3.493 15.166 - 3.185 16.094
Case 31 0.72 12.057 3.185 - 13.017
Cases
(74,83)
13.00 1.005 16.094 13.017 -
Step 2.
The step is repeated with the next closest clusters. In this example, the next closest
are cases 13 and 31 at a distance of 0.72.
The distance matrix is recalculated as follows:
d (13,31) -> 16 = min (d13-16, d31-16) = min (12.008, 12.057) = 12.008
d (13,31) -> 26 = min (d13-26, d31-26) = min (3.493, 3.185) = 3.185
d (13,31) -> (74,83) = min (d13-74, d13-83m d31-74, d31-83), using original distance
matrix.
Therefore = min (13.00, 13.005, 13.017, 13.222) = 13.00
Table 10.3.4 Recalculated distance matrix where cases 74 and 83; and cases
13 and 31 are combined.
Distance Cases
(13,31)
Case 16 Case 26 Cases (74,83)
Cases
(13,31)
- 12.008 3.185 13.00
Case 16 12.008 - 15.166 1.005
Case 26 3.185 15.166 - 16.094
Cases
(74,83)
13.00 1.005 16.094 -

299
Step 3.
The step is repeated with the next closest clusters. In this example, the next closest
are clusters (64, 83) and case 16 at a distance of 1.005.
The distance matrix is recalculated as follows:
d ((74,83),16) -> (13,31) = min (d74-13, d74-31, d83-13, d83-31, d16-13, d16-31 )
= min (13.00, 13.017, 13.005, 13.222, 12.008, 12.057) = 12.008
d ((74,83),16) -> 26 = min (d74-26, d83-26, d16-26)
= min (16.094, 16.488, 15.166) = 15.166
Table 10.3.5 Recalculated distance matrix where cases 16, 74 and 83; and cases 13 and 31 are
combined.
Distance Cases (13,31) Case 26 Cases
((74,83)16)
Cases (13,31) - 3.185 12.008
Case 26 3.185 - 15.166
Cases
((74,83)16)
12.008 15.166 -
Step 4.
The next closest are clusters (13, 31) and case 26 at a distance of 3.185.
The distance matrix is recalculated as follows:
d ((13,31),26) -> ((74,83),16)
= min (d13-74, d13-83, d13-16, d31-74, d31-83, d31-16, d26-74, d26-83, d26-16)
= min (13.00, 13.005, 12.008, 13.017, 13.222, 12.057, 16.094, 16.488, 15.166)
= 12.008

300
Table 10.3.6 Recalculated distance matrix where cases 16, 74 and 83; and cases 13, 26 and 31
are combined.
Distance Cases
((13,31)26)
Cases
((74,83)16)
Cases
((13,31)26)
- 12.008
Cases
((74,83)16)
12.008 -
Step 5.
The remaining two clusters are merged.
Results
1. Six original clusters
2. Merge 74 and 83 at 0.4
3. Merge 13 and 31 at 0.72
4. Merge (74, 83) and 16 at 1.005
5. Merge (13, 31) and 26 at 3.185
6. Merge ((74, 83),16) and ((13, 31), 26 at 12.008
The results can be drawn on a dendrogram (Figure 10.3.1).

301
Figure 10.3.1 Dendrogram of the Agglomerative Hierarchical Clustering Results.
By returning to the original data points produced by analysis of diazepam (1) content
and relative standard deviation of weight, a scatter graph can be plotted in 𝓍, y
space and the hierarchy shown (Figure 10.3.2).

302
Figure 10.3.2 Scatter graph showing the hierarchy of the clustering Results.
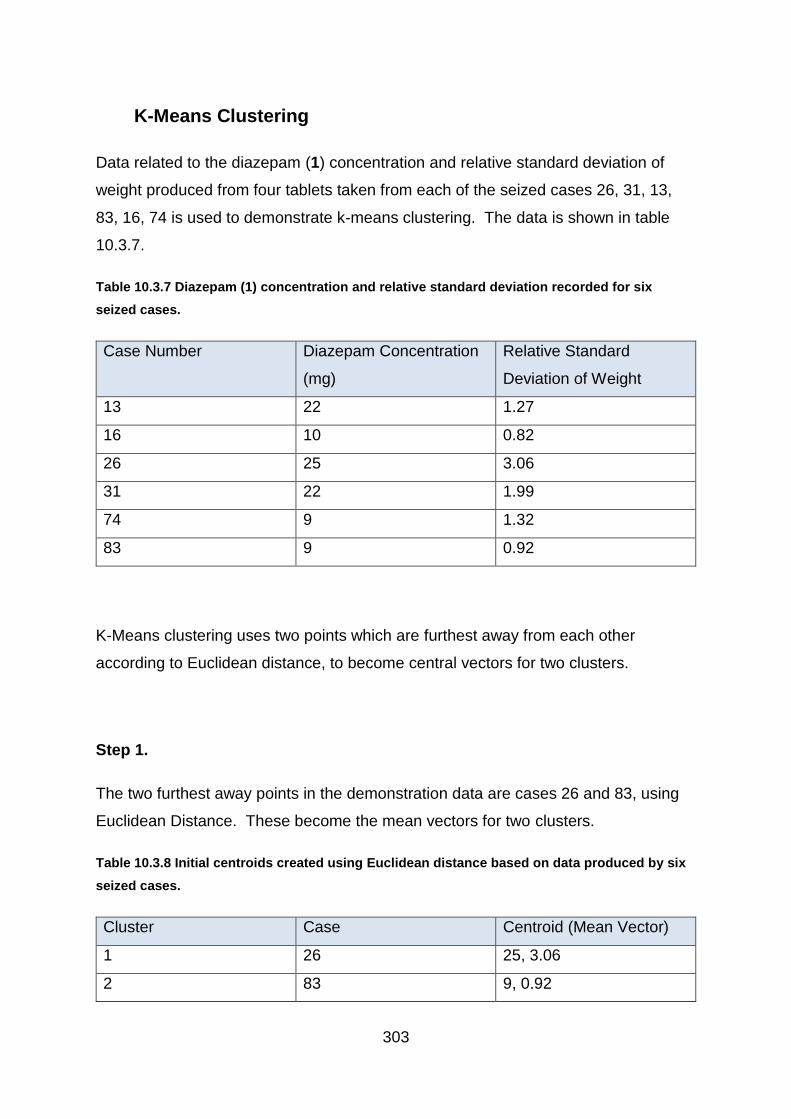
303
K-Means Clustering
Data related to the diazepam (1) concentration and relative standard deviation of
weight produced from four tablets taken from each of the seized cases 26, 31, 13,
83, 16, 74 is used to demonstrate k-means clustering. The data is shown in table
10.3.7.
Table 10.3.7 Diazepam (1) concentration and relative standard deviation recorded for six
seized cases.
Case Number Diazepam Concentration
(mg)
Relative Standard
Deviation of Weight
13 22 1.27
16 10 0.82
26 25 3.06
31 22 1.99
74 9 1.32
83 9 0.92
K-Means clustering uses two points which are furthest away from each other
according to Euclidean distance, to become central vectors for two clusters.
Step 1.
The two furthest away points in the demonstration data are cases 26 and 83, using
Euclidean Distance. These become the mean vectors for two clusters.
Table 10.3.8 Initial centroids created using Euclidean distance based on data produced by six
seized cases.
Cluster Case Centroid (Mean Vector)
1 26 25, 3.06
2 83 9, 0.92

304
Step 2.
Working through each of the remaining cases, each are assigned to the nearest
centroid and the mean is recalculated. So:
Case 13:
Cluster Case Centroid (Mean
Vector)
1 26, 13 23.5, 2.165
Unchanged 2 83 9, 0.92
Case 16:
Cluster Case Centroid (Mean
Vector)
Unchanged 1 26, 13 23.5, 2.165
2 83, 16 9.5, 0.87
Case 31:
Cluster Case Centroid (Mean
Vector)
1 26, 13, 31 23, 2.107
Unchanged 2 83, 16 9.5, 0.87
Case 74:
Cluster Case Centroid (Mean
Vector)
Unchanged 1 26, 13, 31 23, 2.107
2 83, 16, 74 9.333, 1.02

305
Step 3.
To ensure correct clustering, each subject is compared to both cluster means.
Case 13 -> Centroid of group 1
Points (23, 2.107) and (22, 1.27) =
Dist ((23, 2.107) (22, 1.27)) =
= (23 - 22)2 + (2.107 – 1.27)2
= (1)2 + (0.837)2
= 1 + 0.7006
= 1.706
= 1.306
Case 13 -> Centroid of group 2
Points (22, 1.27) and (9.333, 1.02) =
Dist ((22, 1.27) (9.333, 1.02)) =
= (22-9.333)2 + (1.27-1.02)2
= (12.667)2 + (0.25)2
= 160.453 + 0.0625
= 160.5155
= 12.670
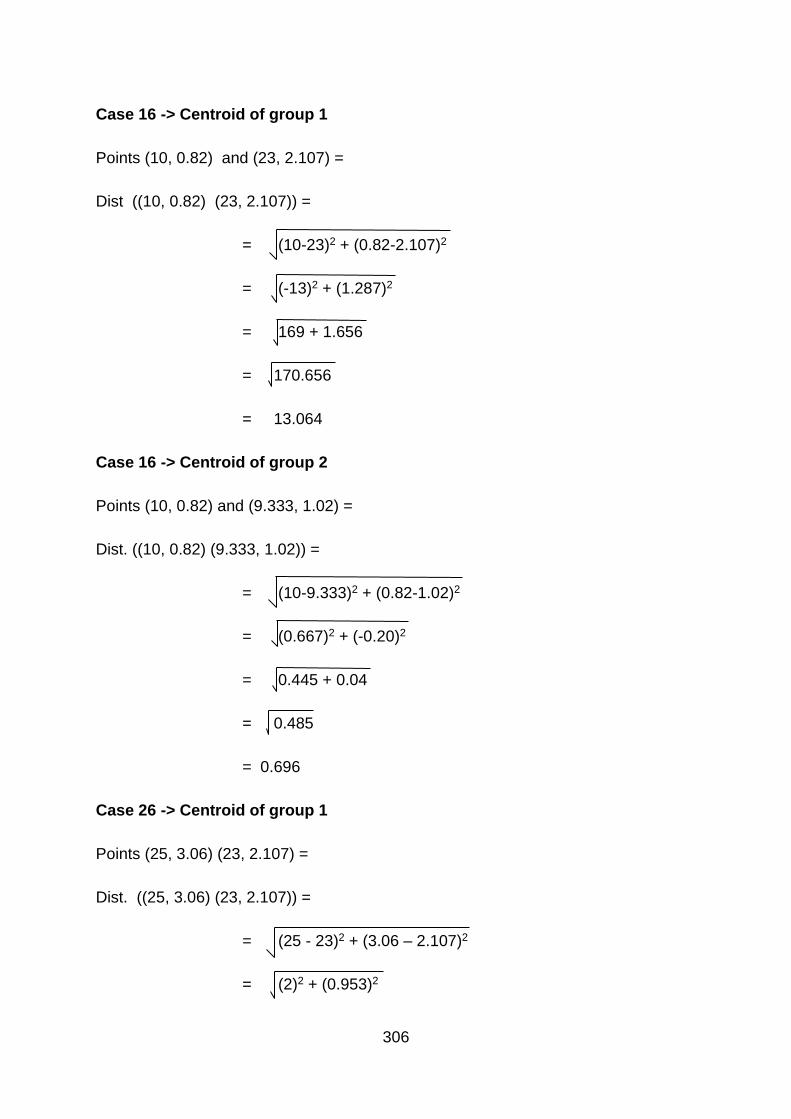
306
Case 16 -> Centroid of group 1
Points (10, 0.82) and (23, 2.107) =
Dist ((10, 0.82) (23, 2.107)) =
= (10-23)2 + (0.82-2.107)2
= (-13)2 + (1.287)2
= 169 + 1.656
= 170.656
= 13.064
Case 16 -> Centroid of group 2
Points (10, 0.82) and (9.333, 1.02) =
Dist. ((10, 0.82) (9.333, 1.02)) =
= (10-9.333)2 + (0.82-1.02)2
= (0.667)2 + (-0.20)2
= 0.445 + 0.04
= 0.485
= 0.696
Case 26 -> Centroid of group 1
Points (25, 3.06) (23, 2.107) =
Dist. ((25, 3.06) (23, 2.107)) =
= (25 - 23)2 + (3.06 – 2.107)2
= (2)2 + (0.953)2
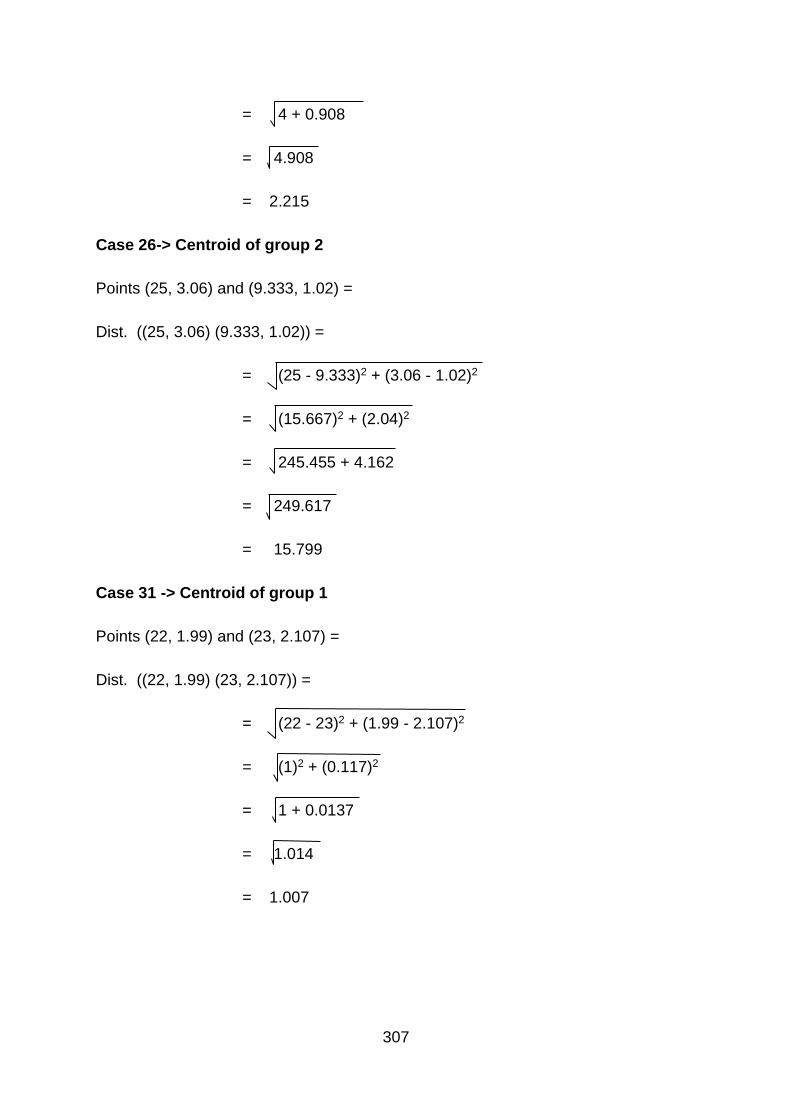
307
= 4 + 0.908
= 4.908
= 2.215
Case 26-> Centroid of group 2
Points (25, 3.06) and (9.333, 1.02) =
Dist. ((25, 3.06) (9.333, 1.02)) =
= (25 - 9.333)2 + (3.06 - 1.02)2
= (15.667)2 + (2.04)2
= 245.455 + 4.162
= 249.617
= 15.799
Case 31 -> Centroid of group 1
Points (22, 1.99) and (23, 2.107) =
Dist. ((22, 1.99) (23, 2.107)) =
= (22 - 23)2 + (1.99 - 2.107)2
= (1)2 + (0.117)2
= 1 + 0.0137
= 1.014
= 1.007

308
Case 31 -> Centroid of group 2
Points (22, 1.99) and (9.333, 1.02) =
Dist. ((22, 1.99) (9.333, 1.02)) =
= (22 - 9.333)2 + (1.99 - 1.02)2
= (12.667)2 + (0.97)2
= 160.453 + 0.941
= 161.394
= 12.704
Case 74 -> Centroid of group 1
Points (9, 1.32) and (23, 2.107) =
Dist. ((9, 1.32) (23, 2.107)) =
= (9 - 23)2 + (1.32 - 2.107)2
= (-14)2 + (-0.787)2
= 196 + 0.619
= 196.619
= 14.022
Case 74 -> Centroid of group 2
Points (9, 1.32) and (9.333, 1.02) =
Dist. ((9, 1.32) (9.333, 1.02)) =
= (9 - 9.333)2 + (1.32 - 1.02)2
= (-0.333)2 + (0.3)2

309
= 0.111 + 0.09
= 0.201
= 0.448
Case 83 -> Centroid of group 1
Points (9, 0.92) and (23, 2.107) =
Dist. ((9, 0.92) (23, 2.107)) =
= (9 - 23)2 + (0.92 - 2.107)2
= (-14)2 + (-1.187)2
= 196 + 1.409
= 197.409
= 14.050
Case 83 -> Centroid of group 2
Points (9, 0.92) and (9.333, 1.02) =
Dist. ((9, 0.92) (9.333, 1.02)) =
= (9 - 9.333)2 + (0.92 - 1.02)2
= (-0.333)2 + (-0.1)2
= 0.111 + 0.01
= 0.121
= 0.348
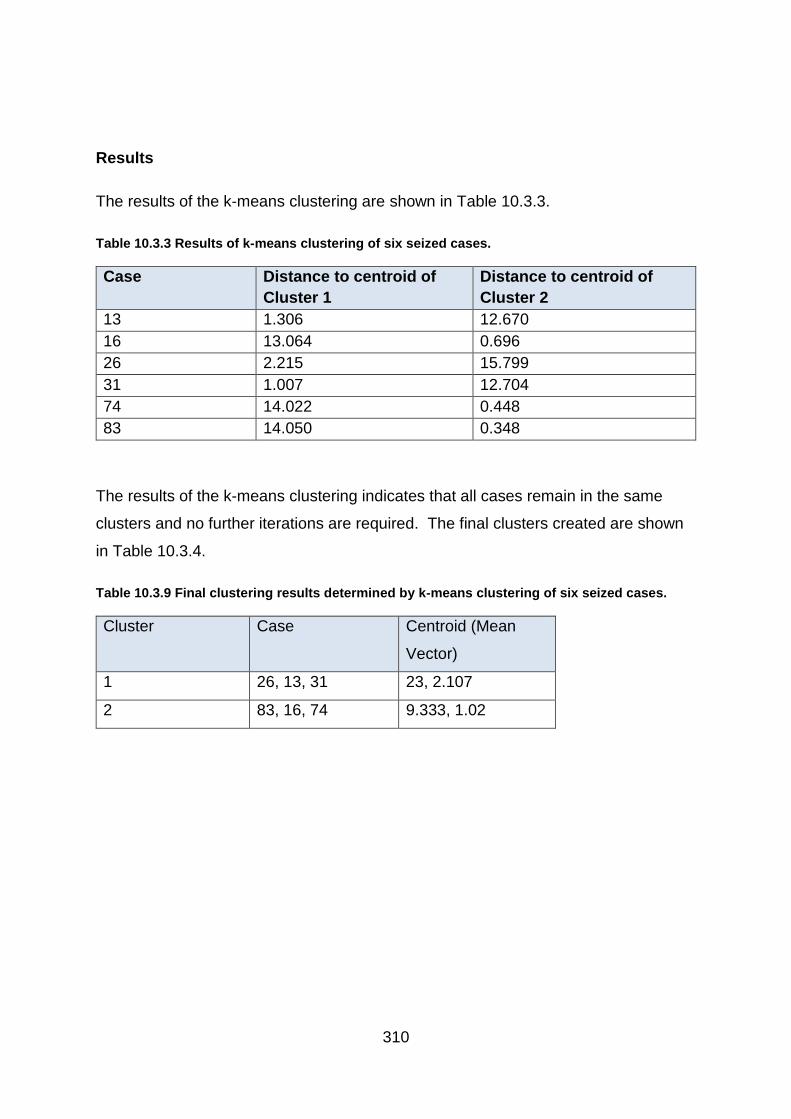
310
Results
The results of the k-means clustering are shown in Table 10.3.3.
Table 10.3.3 Results of k-means clustering of six seized cases.
Case Distance to centroid of
Cluster 1
Distance to centroid of
Cluster 2
13 1.306 12.670
16 13.064 0.696
26 2.215 15.799
31 1.007 12.704
74 14.022 0.448
83 14.050 0.348
The results of the k-means clustering indicates that all cases remain in the same
clusters and no further iterations are required. The final clusters created are shown
in Table 10.3.4.
Table 10.3.9 Final clustering results determined by k-means clustering of six seized cases.
Cluster Case Centroid (Mean
Vector)
1 26, 13, 31 23, 2.107
2 83, 16, 74 9.333, 1.02

311
Principal Component Analysis
To work out PCA on data, the first step is to zero the mean of the variables. In order to do
this, the mean has to be calculated for each row of variables, then it needs to be subtracted
from each of the variables to zero them. The equation to find the mean is:
µ = 1
𝑛 (𝓍1 +…..+ 𝓍n)
Where µ is the mean in vector form, n is the number of samples 𝓍 and represents the
samples in vector form.
Therefore matrix A becomes:
a1-µ1 b1-µ1 c1-µ1
a2-µ2 b2-µ2 c1-µ2
a3-µ3 b3-µ3 c3-µ3
an-µn bn-µn cn-µn
Using data produced by Cases 2, 3 and 4, using the differential scanning calorimeter for the
first three blocks of temperature, with data rounded to two decimal places:
Temperature Case 2 Case 3 Case 4
100 – 105 oC -1082.37 -1111.79 -882.15
105 – 110 oC -1107.89 -1176.85 -902.51
110 – 115 oC -1133.25 -1250.24 -927.76
The mean of each row was calculated as: 100 – 105 oC = 1025.44
105 – 110 oC = 1062.42
110 – 105 oC = 1103.75
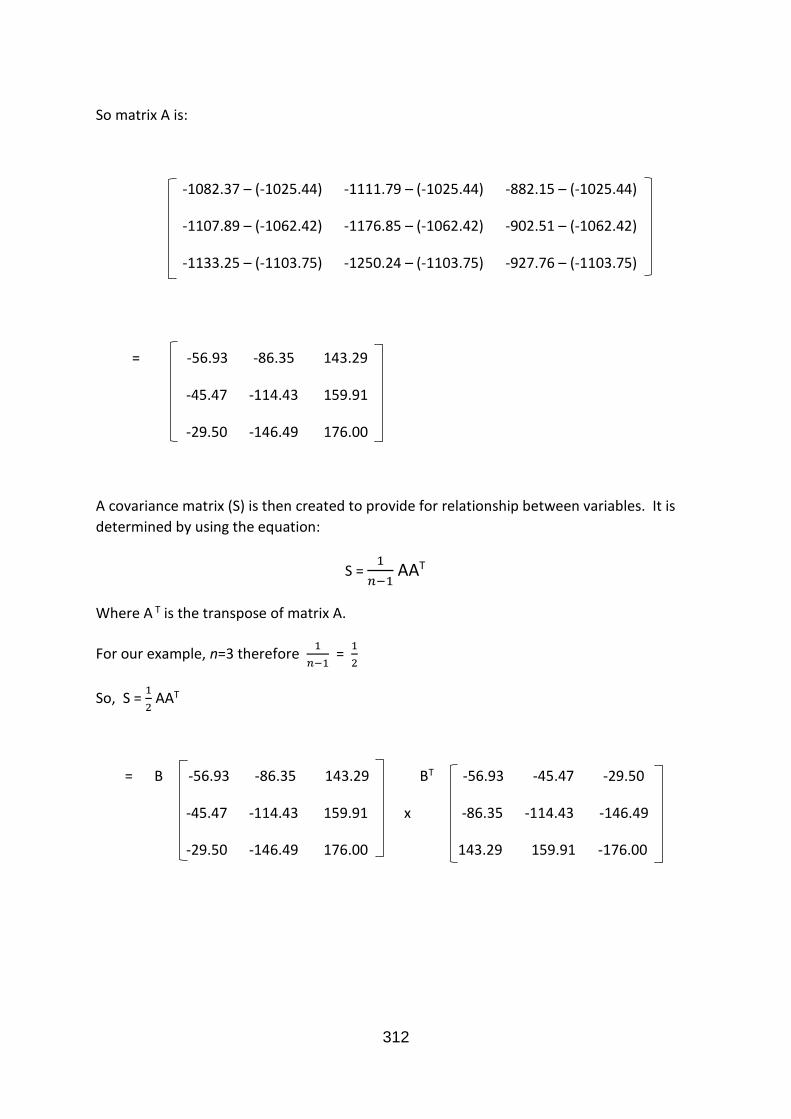
312
So matrix A is:
-1082.37 – (-1025.44) -1111.79 – (-1025.44) -882.15 – (-1025.44)
-1107.89 – (-1062.42) -1176.85 – (-1062.42) -902.51 – (-1062.42)
-1133.25 – (-1103.75) -1250.24 – (-1103.75) -927.76 – (-1103.75)
= -56.93 -86.35 143.29
-45.47 -114.43 159.91
-29.50 -146.49 176.00
A covariance matrix (S) is then created to provide for relationship between variables. It is
determined by using the equation:
S = 1
𝑛−1 AAT
Where A T is the transpose of matrix A.
For our example, n=3 therefore 1
𝑛−1 =
1
2
So, S = 1
2 AAT
= B -56.93 -86.35 143.29 BT -56.93 -45.47 -29.50
-45.47 -114.43 159.91 x -86.35 -114.43 -146.49
-29.50 -146.49 176.00 143.29 159.91 -176.00
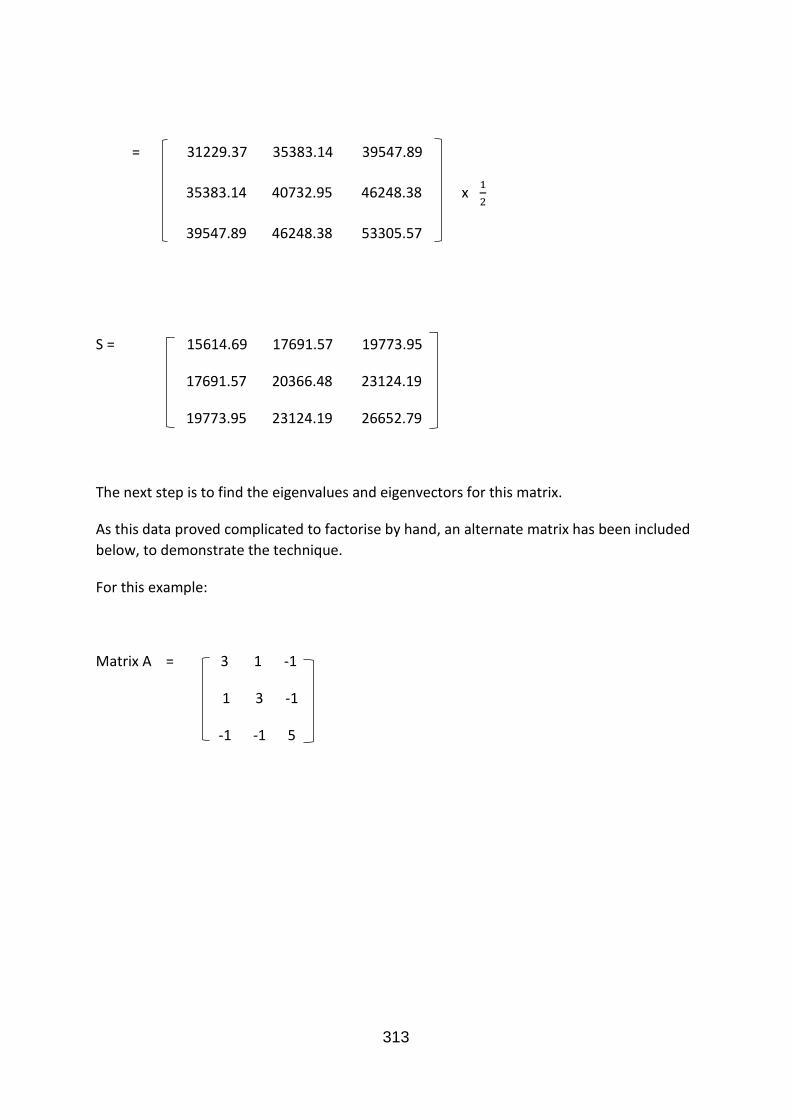
313
= 31229.37 35383.14 39547.89
35383.14 40732.95 46248.38 x 1
2
39547.89 46248.38 53305.57
S = 15614.69 17691.57 19773.95
17691.57 20366.48 23124.19
19773.95 23124.19 26652.79
The next step is to find the eigenvalues and eigenvectors for this matrix.
As this data proved complicated to factorise by hand, an alternate matrix has been included
below, to demonstrate the technique.
For this example:
Matrix A = 3 1 -1
1 3 -1
-1 -1 5

314
To find the Eigenvalues:
The first step is to find the determinant (A - 𝜆 I) :
So 3 - 𝜆 1 -1
1 3 - 𝜆 -1
-1 -1 5 - 𝜆
= (3- 𝜆) |3 − 𝜆 −1−1 5 − 𝜆
| -1 |1 −1−1 5 − 𝜆
| -1 |1 3 − 𝜆−1 −1
|
= (3- 𝜆) ((3- 𝜆) (5 - 𝜆) – (-1) (-1)) -1 (1(5 - 𝜆) – (-1) (-1)) – (1 (-1) - (-1) (3 - 𝜆))
Simplify:
= (3- 𝜆) (15 - 3𝜆 - 5𝜆 + 𝜆2 – 1) -1 ( 5 – 𝜆 -1) -1 ( -1 + 3 – 𝜆)
= (3- 𝜆) ( 𝜆2 - 8𝜆 + 14) - ( – 𝜆 + 4) - ( – 𝜆 + 2)
Multiply:
= 3𝜆2 - 24𝜆 + 42 –𝜆3 + 8𝜆2 - 14𝜆 + 𝜆 – 4 + 𝜆 – 2
Rearrange:
= –𝜆3 + 11𝜆2 - 36𝜆 + 36
Factorise: and a x b = c

315
Factorise:
- λ2 + 9λ - 18
λ-2 - λ3 + 11λ2 – 36λ + 36
- - λ3 + 2λ2
0 + 9λ2 - 36λ + 36
9λ2 – 18λ
0 - 18λ + 36
- - 18λ + 36
0
So,
- λ3 + 11λ2 – 36λ + 36
= (λ-2) (- λ2 + 9λ - 18)
= (λ-2) (- λ + 3) (λ - 6) = 0
As each bracket = 0;
λ-2 = 0 Therefore λ = 2
-λ+3 = 0 Therefore λ = 3 These are the eigenvalues.
λ-6 = 0 Therefore λ = 6

316
The eigenvectors are calculated for each of the eigenvalues.
a. For λ = 2
(A – λ1 I) v1 = 0
v1 = v1,1
v1,2
v1,3
3 - 𝜆 1 -1 3-2 1 -1 1 1 -1
1 3 - 𝜆 -1 = 1 3-2 -1 = 1 1 -1
-1 -1 5 - 𝜆 -1 -1 5-2 -1 -1 3
1 1 -1 v1,1
1 1 -1 x v1,2 = 0
-1 -1 3 v1,3
v1,1 + v1,2 -v1,3
v1,1 + v1,2 -v1,3 = 0 So, each row = 0
-v1,1 -v1,2 +3v1,3
v1,1 + v1,2 -v1,3 = 0
-v1,1 -v1,2 +3v1,3 = 0
Rearrange to find V1,3:
v1,3 = v1,1 + v1,2 ⇒ 3v1,3 = 3v1,1 + 3v1,2
Replace this value of 3V1,3 into the second equation:
-v1,1 -v1,2 + 3v1,1 + 3v1,2 = 0
2v1,1 + 2v1,2 = 0
v1,1 = - v1,2
So, v1,1 = 1
v1,2 = -1
v1,3 = 0 (Because there is no v1,3 in the final equation.

317
This is the eigenvector for λ = 2.
b. For λ = 3
(A – λ2 I) v2 = 0
V2 = v2,1
v2,2
v2,3
3 - 𝜆 1 -1 3-3 1 -1 0 1 -1
1 3 - 𝜆 -1 = 1 3-3 -1 = 1 0 -1
-1 -1 5 - 𝜆 -1 -1 5-3 -1 -1 2
0 1 -1 v2,1
1 0 -1 x v2,2 = 0
-1 -1 2 v2,3
v2,2 - v2,3
v2,1 - v2,3 = 0 So, each row = 0
-v2,1 -v2,2 + 2v2,3
v2,2 - v2,3 = 0 So, v2,2 = v2,3
v2,1 - v2,3 = 0 So, v2,1 = v2,3
- v2,1 - v2,2 + 2v2,3 = 0 So, v2,1 , v2,2 and v2,3 are equal.
So, v2,1 = 1
V2,2 = 1
V2,3 = 1
This is the eigenvector for λ = 3.
c. For λ = 6

318
(A – λ3 I) v3 = 0
v3 = v3,1
v3,2
v3,3
3 - 𝜆 1 -1 3-6 1 -1 -3 1 -1
1 3 - 𝜆 -1 = 1 3-6 -1 = 1 -3 -1
-1 -1 5 - 𝜆 -1 -1 5-6 -1 -1 -1
-3 1 -1 v3,1
1 -3 -1 x v3,2 = 0
-1 -1 -1 v3,3
-3v3,1 + v3,2 - v3,3
v3,1 -3v3,2 - v3,3 = 0 So, each row = 0
-v3,1 -v3,2 + v3,3
- 3v3,1 + v3,2 - v3,3 = 0 (equation 1)
v3,1 - 3v3,2 - v3,3 = 0 (equation 2)
- v3,1 - v3,2 - v3,3 = 0 (equation 3)
To remove v3, subtract equation 2 from equation 1.
- 3v3,1 + v3,2 - v3,3 - v3,1 + 3v3,2 + v3,3 = 0
- 4v3,1 + 4v3,2 = 0
v3,1 = v3,2
Then,
- v3,1 - v3,2 - v3,3 = 0
And - v3,1 - v3,1 - v3,3 = 0
And - 2v3,1 = v3,3

319
So, v3,1 = 1
V3,2 = 1
V3,3 = -2
This is the eigenvector for λ = 6.
An eigenvector gives the position on a multidimensional graph, where each one represents
a position of a different axis. The more values present represents a greater number of
dimensions.
Once the eigenvalues and corresponding eigenvectors have been calculated, they are lined
up from highest to lowest in order to interpret the results. Eigenvector 1 is the first
principal component because it has the highest eigenvalue.
The eigenvalues for the small sample of my data was calculated using data points originating
from DSC thermograms, which plot heat flow against temperature. The results were as
follows:
λ1 ≈ 62016.6 This is the first principal component because it is the highest value.
λ2 ≈ 617.344 This is the second principal component.
λ3 ≈ 0.005 This is the third principal component.

320
Corresponding eigenvectors:
v1 ≈ - 0.496372
- 0.57294
- 0.652192 The vector is closest to this axis, therefore this is the most
important for influencing the results.
v2 ≈ - 0.736324
- 0.120077
0.665889
v3 ≈ 0.459828
- 0.810754
0.362266
To find the variation in the data:
In this case 𝜆
𝜆1+𝜆2+𝜆3 = 0.990% for component 1.
Principal
Component
1
2
3
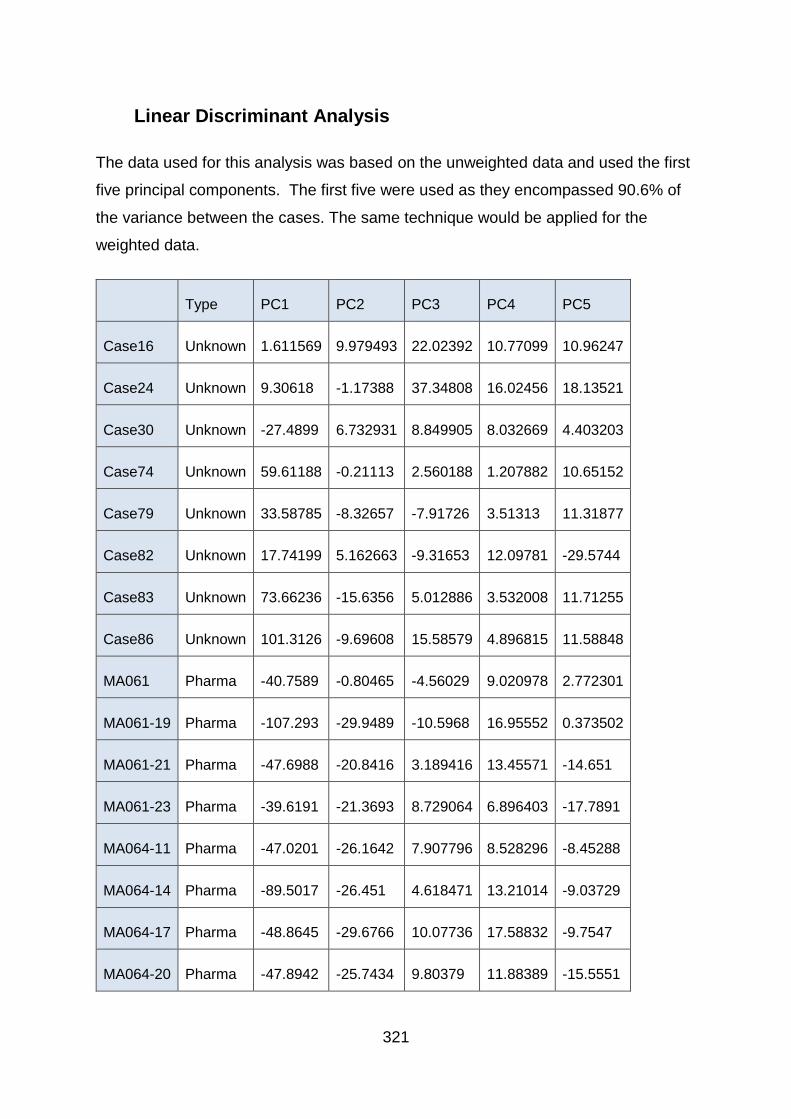
321
Linear Discriminant Analysis
The data used for this analysis was based on the unweighted data and used the first
five principal components. The first five were used as they encompassed 90.6% of
the variance between the cases. The same technique would be applied for the
weighted data.
Type PC1 PC2 PC3 PC4 PC5
Case16 Unknown 1.611569 9.979493 22.02392 10.77099 10.96247
Case24 Unknown 9.30618 -1.17388 37.34808 16.02456 18.13521
Case30 Unknown -27.4899 6.732931 8.849905 8.032669 4.403203
Case74 Unknown 59.61188 -0.21113 2.560188 1.207882 10.65152
Case79 Unknown 33.58785 -8.32657 -7.91726 3.51313 11.31877
Case82 Unknown 17.74199 5.162663 -9.31653 12.09781 -29.5744
Case83 Unknown 73.66236 -15.6356 5.012886 3.532008 11.71255
Case86 Unknown 101.3126 -9.69608 15.58579 4.896815 11.58848
MA061 Pharma -40.7589 -0.80465 -4.56029 9.020978 2.772301
MA061-19 Pharma -107.293 -29.9489 -10.5968 16.95552 0.373502
MA061-21 Pharma -47.6988 -20.8416 3.189416 13.45571 -14.651
MA061-23 Pharma -39.6191 -21.3693 8.729064 6.896403 -17.7891
MA064-11 Pharma -47.0201 -26.1642 7.907796 8.528296 -8.45288
MA064-14 Pharma -89.5017 -26.451 4.618471 13.21014 -9.03729
MA064-17 Pharma -48.8645 -29.6766 10.07736 17.58832 -9.7547
MA064-20 Pharma -47.8942 -25.7434 9.80379 11.88389 -15.5551
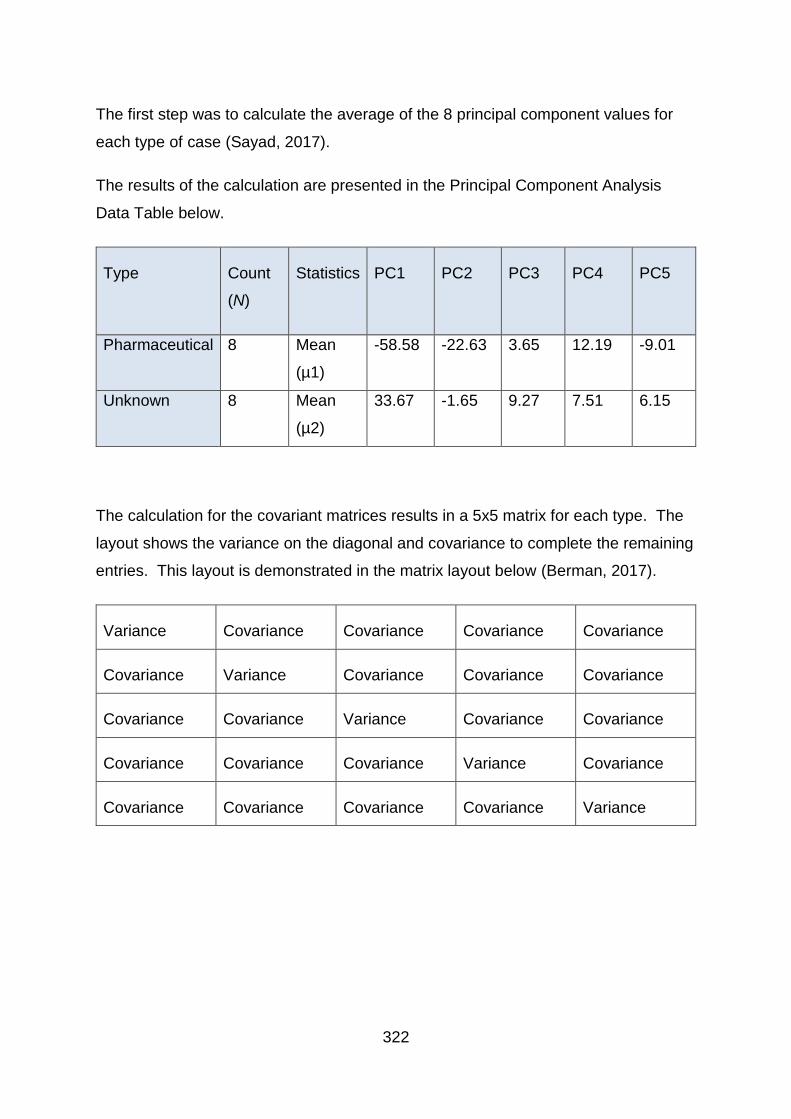
322
The first step was to calculate the average of the 8 principal component values for
each type of case (Sayad, 2017).
The results of the calculation are presented in the Principal Component Analysis
Data Table below.
Type Count
(N)
Statistics PC1 PC2 PC3 PC4 PC5
Pharmaceutical 8 Mean
(µ1)
-58.58 -22.63 3.65 12.19 -9.01
Unknown 8 Mean
(µ2)
33.67 -1.65 9.27 7.51 6.15
The calculation for the covariant matrices results in a 5x5 matrix for each type. The
layout shows the variance on the diagonal and covariance to complete the remaining
entries. This layout is demonstrated in the matrix layout below (Berman, 2017).
Variance Covariance Covariance Covariance Covariance
Covariance Variance Covariance Covariance Covariance
Covariance Covariance Variance Covariance Covariance
Covariance Covariance Covariance Variance Covariance
Covariance Covariance Covariance Covariance Variance

323
In order to visualise the positions of the entries described below, the positions of the
entries are demonstrated in the following table.
1 2 3 4 5
6 7 8 9 10
11 12 13 14 15
16 17 18 19 20
21 22 23 24 25
As the table is reflective on the diagonal, only half the table needs to be calculated
and copied over.
Each variance calculation is the same but the value of x varies according to its
position in the matrix. Each covariance calculation varies in the same way. For
example, to find the value of position 9 in row 2 and column 4, the values used would
be x2 and x4 (Berman, 2017).
The calculation for entries 1 and 2 would be slightly different as one is for variance
and the other covariance. The equations for each are shown below (Columbia
Business School, 2003).
Entry 1 (variance) would be calculated using the equation:
∑ (𝑥1 − 𝑥1)2/(𝑁 − 1) 𝑐𝑎𝑠𝑒𝑠
∑ (𝑃𝐶1 𝑣𝑎𝑙𝑢𝑒 − 𝑃𝐶1 )2/(𝑁 − 1)
𝑐𝑎𝑠𝑒𝑠
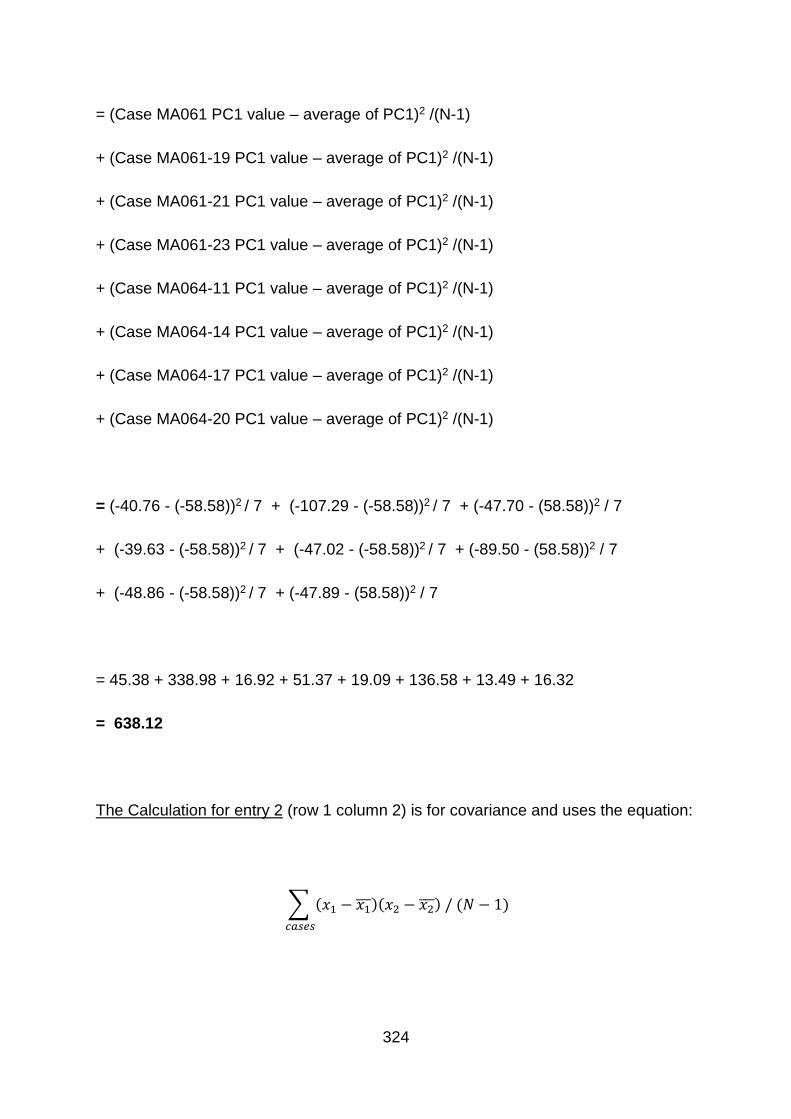
324
= (Case MA061 PC1 value – average of PC1)2 /(N-1)
+ (Case MA061-19 PC1 value – average of PC1)2 /(N-1)
+ (Case MA061-21 PC1 value – average of PC1)2 /(N-1)
+ (Case MA061-23 PC1 value – average of PC1)2 /(N-1)
+ (Case MA064-11 PC1 value – average of PC1)2 /(N-1)
+ (Case MA064-14 PC1 value – average of PC1)2 /(N-1)
+ (Case MA064-17 PC1 value – average of PC1)2 /(N-1)
+ (Case MA064-20 PC1 value – average of PC1)2 /(N-1)
= (-40.76 - (-58.58))2 / 7 + (-107.29 - (-58.58))2 / 7 + (-47.70 - (58.58))2 / 7
+ (-39.63 - (-58.58))2 / 7 + (-47.02 - (-58.58))2 / 7 + (-89.50 - (58.58))2 / 7
+ (-48.86 - (-58.58))2 / 7 + (-47.89 - (58.58))2 / 7
= 45.38 + 338.98 + 16.92 + 51.37 + 19.09 + 136.58 + 13.49 + 16.32
= 638.12
The Calculation for entry 2 (row 1 column 2) is for covariance and uses the equation:
∑ (𝑥1 − 𝑥1)(𝑥2 − 𝑥2 ) / (𝑁 − 1)
𝑐𝑎𝑠𝑒𝑠

325
∑ (𝑃𝐶1 𝑣𝑎𝑙𝑢𝑒 − 𝑃𝐶1 ) (𝑃𝐶2 𝑣𝑎𝑙𝑢𝑒 − 𝑃𝐶2 ) / (𝑁 − 1)
𝑐𝑎𝑠𝑒𝑠
= (Case MA061 PC1 value – average of PC1) x (Case MA061 PC2 – average of
PC2) /(N-1)
+ (Case MA061-19 PC1 value – average of PC1) x (Case MA061-19 PC2 –
average of PC2) /(N-1)
+ (Case MA061-21 PC1 value – average of PC1) x (Case MA061-21 PC2 –
average of PC2) /(N-1)
+ (Case MA061-23 PC1 value – average of PC1) x (Case MA061-23 PC2 –
average of PC2) /(N-1)
+ (Case MA064-11 PC1 value – average of PC1) x (Case MA064-11 PC2 –
average of PC2) /(N-1)
+ (Case MA064-14 PC1 value – average of PC1) x (Case MA064-14 PC2 –
average of PC2) /(N-1)
+ (Case MA064-17 PC1 value – average of PC1) x (Case MA064-17 PC2 –
average of PC2) /(N-1)
+ (Case MA064-20 PC1 value – average of PC1) x (Case MA064-20 PC2 –
average of PC2) /(N-1)
=
(-40.76 – (-58.58)) x (-0.80 – (22.63)) / 7 + (-107.293 – (-58.58)) x (-29.95 –
(-22.63)) / 7
+ (-47.70 – (-58.58)) x (-20.84 – (22.63)) / 7 + (-39.62 – (-58.58)) x (-21.37 –

326
(-22.63)) / 7
+ (-47.02 – (-58.58)) x (-26.16 – (22.63)) / 7 + (-89.50 – (-58.58)) x (-26.45 –
(-22.63)) / 7
+ (-48.86 – (-58.58)) x (-29.68 – (22.63)) / 7 + (-47.89 – (-58.58)) x (-25.74 –
(-22.63)) / 7
= 109.20
The resulting covariance matrix for the pharmaceutical cases would be:
𝐶1 =
(
638.12 109.20 112.35 −57.13 −77.84109.20 88.73 −21.79 −19.50 27.30112.35 −21.79 56.38 −7.30 −45.02−57.13 −19.50 −7.30 15.15 6.09−77.84 27.30 −45.02 6.09 54.21 )
The resulting covariance matrix for the unknown cases would be:
𝐶2 =
(
1780.50 −295.91 −98.13 −130.86 133.75−295.91 79.88 20.77 24.56 −49.42−98.13 20.77 242.16 43.80 136.32−130.86 24.56 43.80 26.11 −18.92133.75 −49.42 136.32 −18.92 221.94)
From these a pooled covariance matrix is calculated (Sayad, 2017):
𝐶 =1
𝑁1 + 𝑁2(𝑁1𝐶1 + 𝑁2𝐶2)
=1
8 + 8(8𝐶1 + 8𝐶2)

327
=1
2(𝐶1 + 𝐶2)
𝐶 =
(
1209.31 −93.35 7.11 −94.00 27.96−93.35 84.31 −0.51 2.53 −11.067.11 −0.51 149.27 18.25 45.65−94.00 2.53 18.25 20.63 −6.4127.96 −11.06 45.65 −6.41 138.08)
This pooled covariance matrix then needs to be inverted.
This is demonstrated below using more simple data.
(1 4 41 2 41 3 2
)
Elementary row operations are conducted to turn this into a 3x3 identity matrix.
Every operation used to create this is also performed on a separate 3x3 identity
matrix to produce the inverse of the above matrix.
𝑅1𝑅2𝑅3
(1 4 41 2 41 3 2
) (1 0 00 1 00 0 1
)
R2 R2 - R1
R3 R3 - R1

328
(1 4 40 −2 00 −1 −2
) ( 1 0 0−1 1 0−1 0 1
)
R2 - R2/2
(1 4 40 1 00 −1 −2
) ( 1 0 00.5 −0.5 0−1 0 1
)
R1 R1 - 4R2
R3 R3 + R2
(1 0 40 1 00 0 −2
) (−1 2 0 0.5 −0.5 0−0.5 −0.5 1
)
R3 - R3/2
(1 0 40 1 00 0 1
) (−1 2 00.5 −0.5 0 0.25 0.25 −0.5
)
R1 R1 – 4R3

329
(1 0 00 1 00 0 1
) (−2 1 20.5 −0.5 0 0.25 0.25 −0.5
)
Returning to the unweighted data, the information was inserted into:
http://matrix.reshish.com/inverCalculation.php (Reshish.com, 2017).
The results showed the inverted matrix would be:
𝐶−1 =
(
0.001597 0.001589 −0.00129 0.08415 0.0006210.001589 0.013599 −0.0014 0.007302 0.00157−0.00129 −0.0014 0.009832 −0.01559 −0.003830.08415 0.007302 −0.01559 0.102441 0.008790.000621 0.00157 −0.00383 0.00879 0.008915)
The coefficients can then be calculated. (Sayad, 2017).
𝐶−1(−𝜇1 + 𝜇2)
= 𝐶−1
(
−
(
−58.58−22.633.6512.19−9.01 )
+
(
33.67−1.659.277.516.15 )
)
= 𝐶−1
(
92.2520.985.63−4.6815.16)
= [0.143413 0.413628 −0.07807 0.495355 0.167]

330
‘R’ Scripts used for PCA Analysis
options(max.print=999999) #(This increases the number of print lines in R because
the file is big)
MAset<-read.table("MA tablets_22Feb17.txt", header =TRUE) #(Read the table in
from the file and store as object ‘MAset’)
comp=prcomp(MAset, scale = TRUE) # (Run the pca on the dataset MAset using a
built in function called prcomp and assign outcome to a variable ‘comp’. TRUE
means that the data are standardised so that each variable has a mean=0 and a
standard deviation =1)
summary(comp) # (Get a summary of the outcome of the PCA - output of 34
components).
compvalue<-comp$x # (To view the component value for each observation in
comp. Assign this output to ‘compvalue’).
compvalue # (Print out compvalue. This gives you all the principal components
usually far more than needed).
(output of observation values across 34 components).
To Plot A Bi-Plot, there are 3 separate steps most of the code relates to axes labels
and choice of dot.
plot(compvalue[ ,1], compvalue[ ,2], pch=19, xlab = "PCA1 - 57%", ylab ="PC2 -
14%") # (plotting the observations on the first two principal components)
abline(h=0, v=0, lty =2) # (put in the horizontal and vertical dotted lines)
text(compvalue[ ,1], compvalue[ ,2], labels = rownames(compvalue), cex=0.7,
pos=3)
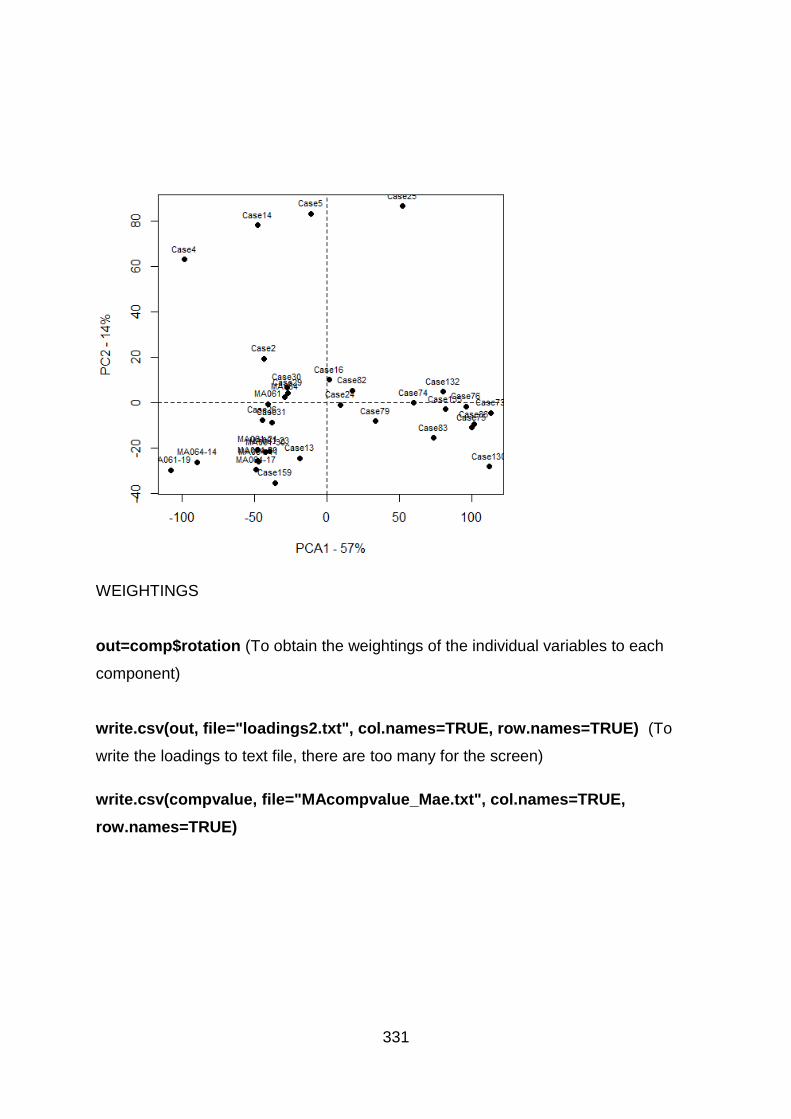
331
WEIGHTINGS
out=comp$rotation (To obtain the weightings of the individual variables to each
component)
write.csv(out, file="loadings2.txt", col.names=TRUE, row.names=TRUE) (To
write the loadings to text file, there are too many for the screen)
write.csv(compvalue, file="MAcompvalue_Mae.txt", col.names=TRUE,
row.names=TRUE)

332
Appendix II – Accepted Ethics Form
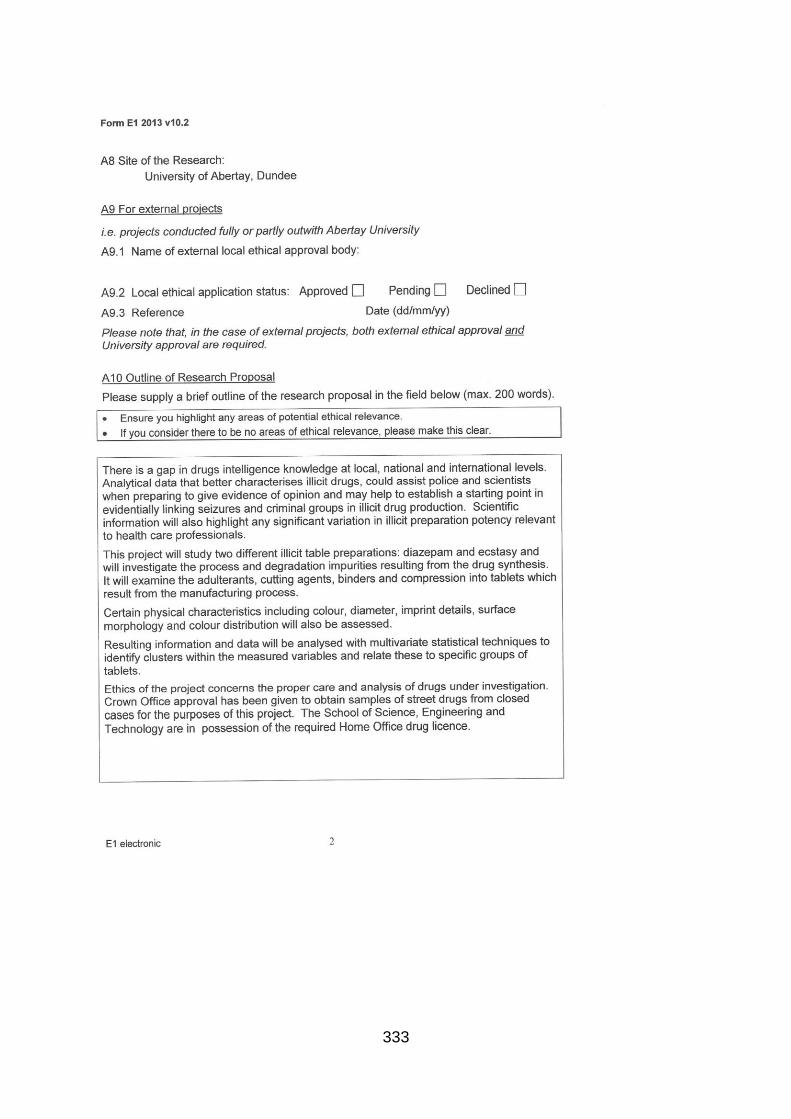
333

334

335
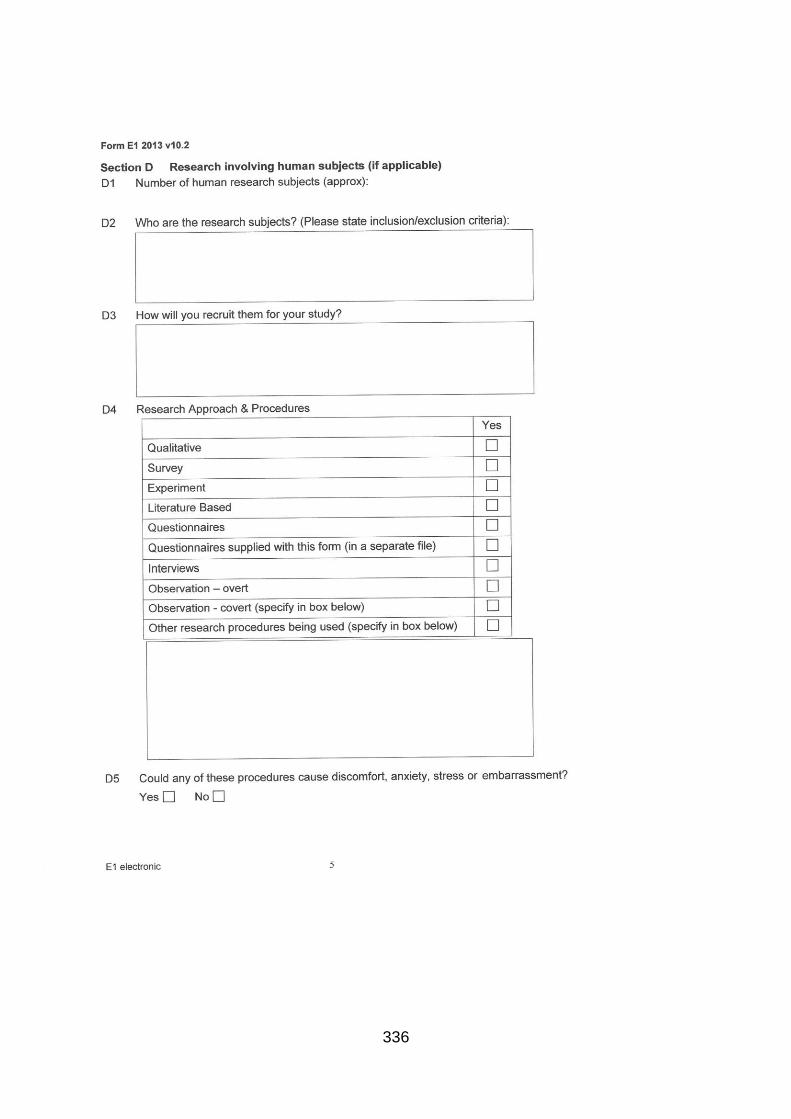
336

337
338
339
340
341
342
Abdullah, A.F.L., Abraham, A.A., Sulaiman, M. and Kunalan, V. (2012) 'Forensic Drug Profile of Erimin-5 Using TLC and GC-MS', Malaysian Journal of Forensic Sciences, 3(1), pp. 11-15.
Actavis (2014) Actavis Diazepam Tablets : Patient Information Leaflet. Available at: https://www.medicines.org.uk/emc/medicine/18061 (Accessed: 28/03/2017).
Actavis UK Ltd (2014) Actavis Diazepam Tablet Patient Information Leaflet. Available at: https://www.medicines.org.uk/emc/product/4522/pil (Accessed: 18/12/2017).
Advisory Council on the Misuse of Drugs (2016) Diversion and Illicit Supply of Medicines. London: United Kingdom Government. Available at: https://www.gov.uk/government/uploads/system/uploads/attachment_data/file/580296/Meds_report-_final_report_15_December_LU__2_.pdf (Accessed: 27/02/2018).
Agilent Technologies (2007) GC Method Development. Available at: https://www.agilent.com/cs/library/support/documents/f3964554214.pdf (Accessed: 02/08/2017).
Agilent Technologies (2005) Zorbax Eclipse XDB HPLC Columns - Technical Overview. Available at: https://www.agilent.com/cs/library/technicaloverviews/Public/5989-1268EN.pdf (Accessed: 14/11/2016).
Aldridge, J. and Askew, R. (2017) 'Delivery Dilemmas: How Drug Cryptomarket Users Identify and Seek to Reduce Their Risk of Detection by Law Enforcement', International Journal of Drug Policy, 41, pp. 101-109. doi: 10.1016/j.drugpo.2016.10.010.
Alireza Timcheh-Hariri, Mahdi Balali-Mood, Sadeghi, M., Lari, N. and Bamdad Riahi-Zanjani (2016) 'Comparison of ELISA and TLC Methods for the Morphine Detection in Urine of Drug Abusers', Iranian Journal of Toxicology, 10(3), pp. 47-50. doi: 10.29252/arakmu.10.3.47.
Altman, D.G. and Bland, J.M. (1994) Diagnostic tests 1: Sensitivity and Specificity. Available at: http://www.bmj.com/content/bmj/308/6943/1552.full.pdf (Accessed: 11/01/18).
Aniszewski, T. (2015) 'Chapter 1 - Definition, typology, and occurrence of alkaloids'Alkaloids Chemistry, Biology, Ecology, and Applications. 2nd ed.. edn. Burlington: Burlington : Elsevier Science, pp. 1-97.
Ariyasu, A., Hattori, Y. and Otsuka, M. (2016) 'Delay effect of magnesium stearate on tablet dissolution in acidic medium', International journal of pharmaceutics, 511(2), pp. 757-764. doi: 10.1016/j.ijpharm.2016.07.034.

343
Ashton, H. (2013) Benzodiazepines: How they work and how to withdraw. Available at: https://www.benzo.org.uk/manual/bzcha01.htm (Accessed: 06/11/2017).
Ashton, H. (1994) 'Guidelines for the rational use of benzodiazepines. When and what to use', Drugs, 48(1), pp. 25-40. doi: https://www.ncbi.nlm.nih.gov/pubmed/7525193.
Aulton, M.E. (ed.) (2007a) Aulton's Pharmaceutics. 3rd edn. Edinburgh: Churchlll Livingstone Elsevier; Series number, .
Aulton, M.E. (ed.) (2007b) Aulton's Pharmaceutics: The design and manufacture of medicines. 3rd edn. Edinburgh: Churchill Linvingstone Elsevier; Series number, .
Baer, I. (2007) The Analysis Of Excipients In Ecstasy Tablets And Their Contribution In A Drug Profiling Context. Doctorate (unpublished).
Baerheim Svendsen, A. and Verpoorte, R. (eds) (1983) Chromatography of alkaloids. 1st edn. Amsterdam: Elsevier; Series number, 23.
Bate, R. and Hess, K. (2010) 'Assessing Website Pharmacy Drug Quality: Safer Than You Think? (Website Pharmacy Drug Quality)', PLoS ONE, 5(8), pp. e12199. doi: 10.1371/journal.pone.0012199.
BBC News (2017) Fake Valium 'Cheaper than Chips', warns Drug Expert. Available at: http://www.bbc.co.uk/news/uk-scotland-38610142 (Accessed: 18/08/2017).
Berman, H. (2017) Stat Trek. Available at: http://stattrek.com/matrix-algebra/covariance-matrix.aspx (Accessed: 16/06/2017).
Bibi, S., Bremner, D.H., Macdougall-Heasman, M., Reid, R., Simpson, K., Tough, A., Waddell, S., Stewart, I. and Matthews, K.H. (2015) 'A Preliminary Investigation Into Grouping Disparate Batches of Licit and Illicit Diazepam Tablets Using Differential Scanning Calorimetry', Analytical Methods, 20 (7), pp. 8597-8604.
Birch, I. (2012) Dangers of Counterfeit Diazepam. Available at: http://www.mentalhealthy.co.uk/news/1771-dangers-of-counterfeit-diazepam.html (Accessed: 11/08/2017).
Blachut, D., Bykas-Strêkowska, M., Taracha, E. and Szukalski, B. (2004) 'Application of Gas Chromatography/mass spectrometry (GC/MS) to the analysis of benzodiazepines', Problems of Forensic Sciences, 59, pp. 5-37.
Bouchard, M. (2007) 'On the Resilience of Illegal Drug Markets', Global Crime, 8(4), pp. 325-344. doi: 10.1080/17440570701739702.
Boumba, V.A., Rallis, G., Petrikis, P., Vougiouklakis, T. and Mavreas, V. (2016) 'Determination of clozapine, and five antidepressants in human plasma, serum and whole blood by gas chromatography– mass spectrometry: A simple tool for clinical

344
and postmortem toxicological analysis', Journal of Chromatography B, 1038, pp. 43-48. doi: 10.1016/j.jchromb.2016.10.023.
Boumrah, Y., Bouanani, S., Khimeche, K. and Dahmani, A. (2015) 'Analysis of synthetic drugs by differential scanning calorimetry', Journal of Thermal Analysis and Calorimetry, 120(1), pp. 583-590.
Brady, B.J. (2017) How to avoid and reduce noise in your images. Available at: https://digital-photography-school.com/how-to-avoid-and-reduce-noise-in-your-images/ (Accessed: 22/03/17).
British Pharmacopoeia (2008) Appendix VII C. Consistency of Formulated Preparations. Available at: http://www.uspbpep.com/bp2008/data/869.asp (Accessed: 16/03/2017).
British Pharmacopoeia Commission (2017a) 'Diazepam Monograph'British Pharmacopoeia Volume I The Stationary Office, pp. I-736.
British Pharmacopoeia Commission (2017b) 'Diazepam Preparations'British Pharmacopoeia Volume III: Formulated Preparations The Stationary Office, pp. III-469.
Broadfield, D. and Marshall, J. (2017) Seizures of drugs in England and Wales, financial year ending 2017. Online: Home Office. Available at: https://www.gov.uk/government/uploads/system/uploads/attachment_data/file/657872/seizures-drugs-mar2017-hosb2217.pdf (Accessed: 08/03/2018).
Broséus, J., Morelato, M., Tahtouh, M. and Roux, C. (2017) 'Forensic drug intelligence and the rise of cryptomarkets. Part I: Studying the Australian virtual market', Forensic Science International (Online), 279, pp. 288-301. doi: 10.1016/j.forsciint.2017.08.026.
Broséus, J., Vallat, M. and Esseiva, P. (2011) 'Multi-class differentiation of cannabis seedlings in a forensic context', Chemometrics and Intelligent Laboratory Systems, 107(2), pp. 343-350. doi: 10.1016/j.chemolab.2011.05.004.
Brown, M.T. and Wicker, L.R. (2000) '8 - Discriminant Analysis', in Tinsley, H.E.A. and Brown, S.D. (eds.) Handbook of Applied Multivariate Statistics and Mathematical Modeling San Diego: Academic Press, pp. 209-235.
Bruni, G., Berbenni, V., Sartor, F., Milanese, C., Girella, A., Franchi, D. and Marini, A. (2012) 'Quantification methods of amorphous/crystalline fractions in high-energy ball milled pharmaceutical products', Journal of Thermal Analysis and Calorimetry; An International Forum for Thermal Studies, 108(1), pp. 235-241. doi: 10.1007/s10973-011-1504-y.
Buckner, I.S., Friedman, R.A. and Wurster, D.E. (2010) 'Using compression calorimetry to characterize powder compaction behavior of pharmaceutical

345
materials', Journal of pharmaceutical sciences, 99(2), pp. 861-870. doi: 10.1002/jps.21881.
Calcaterra, N.E. and Barrow, J.C. (2014) 'Classics in chemical neuroscience: diazepam (valium)', ACS chemical neuroscience, 5(4), pp. 253. doi: 10.1021/cn5000056.
Camargo, J., Esseiva, P., González, F., Wist, J. and Patiny, L. (2012) 'Monitoring of illicit pill distribution networks using an image collection exploration framework', Forensic science international, 223(1–3), pp. 298-305. doi: http://dx.doi.org.libproxy.abertay.ac.uk/10.1016/j.forsciint.2012.10.004.
Cappell, H.D. (1986) Research Advances in Alcohol and Drug Problems. Boston, MA : Springer US : Imprint: Springer.
Casey, J., Hay, G., Godfrey, C. and Parrott, S. (2009) Assessing the scale and impact of illicit drug markets in Scotland. Edinburgh: Scottish Government. Available at: http://www.gov.scot/resource/doc/287490/0087669.pdf (Accessed: 27/02/2018).
Cheng, J.Y.K., Chan, M.F., Chan, T.W. and Hung, M.Y. (2006) 'Impurity profiling of ecstasy tablets seized in Hong Kong by gas chromatography–mass spectrometry', Forensic science international, 162(1), pp. 87-94. doi: 10.1016/j.forsciint.2006.02.055.
Clarke, B. (2009) Principles and Theory for Data Mining and Machine Learning. New York, NY : Springer New York.
Cole, C., Jones, L., McVeigh, J., Kicman, A., Syed, Q. and Bellis, M.A. (2010) Cut: A Guide to Adulterants, Bulking Agents and other Contaminants found in Illicit Drugs. Available at: http://www.cph.org.uk/wp-content/uploads/2012/08/cut-a-guide-to-the-adulterants-bulking-agents-and-other-contaminants-found-in-illicit-drugs.pdf (Accessed: 15/05/2018).
Cole, J.O. and Chiarello, R.J. (1990) 'The benzodiazepines as drugs of abuse', Journal of psychiatric research, 24(1), pp. 135-144. doi: 10.1016/0022-3956(90)90045-R.
Cole, M.D. (2003) The Analysis Of Controlled Substances. Chichester: John Wiley & Sons Ltd.
Columbia Business School (2003) PreMBA Analytical Methods: Statistical Sampling and Regression. Available at: http://ci.columbia.edu/ci/premba_test/c0331/s7/s7_5.html (Accessed: 16/06/2017).
Cow & Gate (2015) Growing Up Milk 1-2 Years: Nutritional Information. Available at: http://www.cowandgate.co.uk/article/growing-up-milk-1-to-2-years#nutritional-information (Accessed: 29/03/2017).

346
Craig, D.Q.M. and Reading, M. (eds) (2006) Thermal Analysis of Pharmaceuticals. Boca Raton, Florida: CRC Press; Series number, .
D’archivio, A.A., Giannitto, A., Maggi, M.A. and Ruggieri, F. (2016) 'Geographical classification of Italian saffron (Crocus sativus L.) based on chemical constituents determined by high-performance liquid-chromatography and by using linear discriminant analysis', Food Chemistry, 212, pp. 110-116. doi: 10.1016/j.foodchem.2016.05.149.
Dams, R., Benijts, T., Lambert, W.E., Massart, D.L. and De Leenheer, A.P. (2001) 'Heroin impurity profiling: trends throughout a decade of experimenting', Forensic science international, 123(2), pp. 81-88. doi: 10.1016/S0379-0738(01)00541-2.
Danielson, N.D., Gallagher, P.A. and Bao, J.J. (2000) 'Chemical Reagents and Derivatisation Procedures in Drug Analysis', in Meyers, R.A. (ed.) Encylopedia of Analytical Chemistry Chichester: Wiley and Sons, pp. 7042-7076.
de Wet, C., Reed, L., Glasper, A., Moran, P., Bearn, J. and Gossop, M. (2004) 'Benzodiazepine co-dependence exacerbates the opiate withdrawal syndrome', Drug and alcohol dependence, 76(1), pp. 31-35. doi: 10.1016/j.drugalcdep.2004.04.002.
Dear, J.W. and Bateman, D.N. (2016) 'Benzodiazepines', Medicine, 44(3), pp. 145-145. doi: 10.1016/j.mpmed.2015.12.025.
Dégardin, K., Guillimain, A., Guerreiro, N. and Roggo, Y. (2016) 'Near Infrared Spectroscopy for Counterfeit Detection using a large Database of Pharmaceutical Tablets', Journal of Pharmaceutical and Biomedical Analysis, (128), pp. 88-97.
Dégardin, K., Roggo, Y. and Margot, P. (2015) 'Forensic intelligence for medicine anti-counterfeiting', Forensic Science International, 248, pp. 15-32.
Dégardin, K., Roggo, Y. and Margot, P. (2014) 'Understanding and fighting the medicine counterfeit market', Journal of pharmaceutical and biomedical analysis, 87, pp. 167-175. doi: 10.1016/j.jpba.2013.01.009.
Dégardin, K., Roggo, Y., Been, F. and Margot, P. (2011) 'Detection and chemical profiling of medicine counterfeits by Raman spectroscopy and chemometrics.(Report)', Analytica Chimica Acta, 705(1), pp. 334.
Delaney, S.P., Nethercott, M.J., Mays, C.J., Winquist, N.T., Arthur, D., Calahan, J.L., Sethi, M., Pardue, D.S., Kim, J., Amidon, G. and Munson, E. (2017) 'Characterization of Synthesised and Commercial forms of Magnesium Stearate using Differential Scanning Calorimetry, Thermogravimetric Analysis, Powder X-ray Diffraction, and Solid State NMR Spectroscopy', Journal of Pharmaceutical Sciences, 106, pp. 338-347. doi: doi.org/10.1016/j.xphs.2016.10.004.
Imprinting of solid oral dosage form products for human use (SI year and number). Available at:

347
https://www.accessdata.fda.gov/scripts/cdrh/cfdocs/cfcfr/CFRSearch.cfm?CFRPart=206&showFR=1 (Accessed: 18/07/2017).
Division of Narcotic Drugs (1988) Recommended Methods for Testing Benzodiazepine Derivatives under International Control. New York: United Nations. Available at: https://www.unodc.org/pdf/publications/report_testingbenzodiazepine_1988-12-01_1.pdf (Accessed: 14/04/2017).
Doward, J. (2012) 'Diazepam boom threatens more drug deaths, say experts.', The Observer, 1st July 2012, https://www.theguardian.com/society/2012/jul/01/diazepam-boom-threatens-more-drug-deaths.
Dr Reddy's Laboratories (UK) Ltd (2015) Chlordiazepoxide Information Leaflet. Available at: https://www.medicines.org.uk/emc/files/pil.3717.pdf (Accessed: 04/05/18).
Dundee, J.W. and Mcilroy, P.D. (1982) 'The history of barbiturates', Anaesthesia, 37(7), pp. 726.
Ecomdash (2019) Beginners guide to selling vitamins and supplements online. Available at: https://www.ecomdash.com/selling-vitamins-and-supplements-online/ (Accessed: 13/011/19).
El-Hawary, W.F., Issa, Y.M. and Talat, A. (2007) 'Spectrophotometic Determination of Diazepam in Pure Form, Tablets and Ampoules', International Journal of Biomedical Science, 3(1), pp. 50-55.
EMCDDA.Europa.EU (2002) Polydrug Use (In Annual Report on the state of the drugs problem in the European Union and Norway). Available at: http://www.emcdda.europa.eu/attachements.cfm/att_37265_EN_sel2002_1en.pdf (Accessed: 10/08/2017).
Eraga, S.O., Arhewoh, M.I., Chibuogwu, R.N. and Iwuagwu, M.A. (2015) 'A comparative UV− HPLC analysis of ten brands of ibuprofen tablets', Asian Pacific Journal of Tropical Biomedicine, 5(10), pp. 880-884. doi: 10.1016/j.apjtb.2015.06.005.
Esseiva, P., Ioset, S., Anglada, F., Gasté, L., Ribaux, O., Margot, P., Gallusser, A., Biedermann, A., Specht, Y. and Ottinger, E. (2007) 'Forensic drug Intelligence: An important tool in law enforcement', Forensic science international, 167(2), pp. 247-254. doi: 10.1016/j.forsciint.2006.06.032.
European Medicines Agency (2000) Note for Guidance Specifications: Test Procedures and Acceptance Criteria for New Drug Substances and Drug Products: Chemical Substances. London: European Medicines Agency. Available at: http://www.ema.europa.eu/docs/en_GB/document_library/Scientific_guideline/2009/09/WC500002823.pdf (Accessed: 14/03/17).
348
European Monitoring Centre For Drugs and Drug Addiction (2016) EU Drugs Market Report. Lisbon: EMCDDA and Europol. Available at: http://www.emcdda.europa.eu/publications/joint-publications/eu-drug-markets-2016-in-depth-analysis_en (Accessed: 15/05/2018).
Fatta-Kassinos, D., Meric, S. and Nikolaou, A. (2011) 'Pharmaceutical residues in environmental waters and wastewater: current state of knowledge and future research', Analytical and Bioanalytical Chemistry, 399(1), pp. 251-275. doi: 10.1007/s00216-010-4300-9.
Ferreyra, C. and Ortiz, C. (2001) 'Analysis of multicomponent formulations containing phenylpropanolamine hydrochloride, caffeine and diazepam by using LC', Journal of pharmaceutical and biomedical analysis, 25(3), pp. 493-499. doi: 10.1016/S0731-7085(00)00599-9.
Fitzgerald, R.L., O'Neal, C.L., Hart, B.J., Poklis, A. and Herold, D.A. (1997) 'Comparison of an Ion-Trap and a Quadrupole Mass Spectrometer using Diazepam as a Model Compound', Journal of analytical toxicology, 21(6), pp. 445-450. doi: 10.1093/jat/21.6.445.
Fu, X., Huck, D., Makein, L., Armstrong, B., Willen, U. and Freeman, T. (2012) 'Effect of particle shape and size on flow properties of lactose powders', Particuology, 10(2), pp. 203-208. doi: 10.1016/j.partic.2011.11.003.
Garson, G.D. (2012) Discriminant Function Analysis. Asheboro, North Carolina: Statistical Associates Publishers.
Geert van den Burg, R. (2017) SPSS Tutorial: Z-Scores - what and why. Available at: https://www.spss-tutorials.com/z-scores-what-and-why/ (Accessed: 18/04/2018).
Goddard, M. (2018) 'Diazepam Manufacturing Companies Email'M. Heasman, .
Goldstein, E.J.C., Wurcel, A.G., Merchant, E.A., Clark, R.P. and Stone, D.R. (2015) 'Emerging and Underrecognized Complications of Illicit Drug Use', Clinical Infectious Diseases, 61(12), pp. 1840-1849. doi: 10.1093/cid/civ689.
Griffiths, R.R., McLeod, D.R., Bigelow, G.E., Liebson, I.A., Roache, J.D. and Nowowieski, P. (1984) 'Comparison of diazepam and oxazepam: Preference, liking and extent of abuse', The Journal of pharmacology and experimental therapeutics, 229(2), pp. 501-508.
Harvey, K. and Hayes, H. (1984) Visually Clear Lake Colored Dentifrice. Authoring organisation. 4,444,746. Available at: https://patentimages.storage.googleapis.com/ca/8e/dc/89d5e442eb655a/US4444746.pdf (Accessed: 25/04).
Hausman, D.S. (2004) 'Comparison of Low Shear, High Shear, and Fluid Bed Granulation During Low Dose Tablet Process Development', Drug Development and

349
Industrial Pharmacy, 2004, Vol.30; 30(3; 3), pp. 259; 259-266; 266. doi: 10.1081/DDC-120030419.
Hida, M., Mitsui, T., Ohtani, H. and Tsuge, S. (1999) 'Determination of benzodiazepine in tablets studied by thermal desorption gas chromatography', Journal of pharmaceutical and biomedical analysis, 20(3), pp. 419-426. doi: 10.1016/S0731-7085(98)00254-4.
Hiriyanna, S.G. and Basavaiah, K. (2008) 'Isolation and characterization of process related impurities in anastrozole active pharmaceutical ingredient', Journal of the Brazilian Chemical Society, 19(3), pp. 397-404. doi: 10.1590/S0103-50532008000300005.
Home Office, U.G. (2016) Psychoactive Substances Act. Available at: https://www.gov.uk/government/collections/psychoactive-substances-bill-2015 (Accessed: 08/08/2017).
Hosmer, D.W. and Lemeshow, S. (1989) Applied Logistic Regression. New York: John Wiley & Sons.
HTC Health (2019) HTC Health - Raw Ingredients. Available at: https://htc.co.uk/product-category/raw-materials/ (Accessed: 13/11/19).
Humphries, I.J. (1984) The Work of the Drugs Intelligence Laboratory, Home Office, Forensic Science Service. Available at: https://www.unodc.org/unodc/en/data-and-analysis/bulletin/bulletin_1984-01-01_1_page005.html#s0003 (Accessed: 14/05/18).
Imrey, P.B. (2000) '14 - Poisson Regression, Logistic Regression, and Loglinear Models for Random Counts', in Tinsley, H.E.A. and Brown, S.D. (eds.) Handbook of Applied Multivariate Statistics and Mathematical Modeling San Diego: Academic Press, pp. 391-437.
Information Services Division, National Health Services Scotland (2016) Prescribing and Medicine Data Tables. Available at: http://www.isdscotland.scot.nhs.uk/Health-Topics/Prescribing-and-Medicines/Publications/data-tables.asp?Co=Y (Accessed: 26/07/17).
Institute of Medicine (2014) Countering the Problem of Falsified and Substandard Drugs. Washington: Washington : National Academies Press.
Izenman, A.J. (2003) 'Sentencing Illicit Drug Traffickers: How do the Courts Handle Random Sampling Issues?', International Statistical Review, 71(3), pp. 535-556. doi: 10.1111/j.1751-5823.2003.tb00210.x.
Jaffe, J.H., Bloor, R., Crome, I., Carr, M., Alam, F., Simmons, A. and Meyer, R.E. (2004) 'A postmarketing study of relative abuse liability of hypnotic sedative drugs', Addiction, 99(2), pp. 165-173. doi: 10.1111/j.1360-0443.2003.00631.x.

350
Johnson, C.F., Barnsdale, L.R. and McAuley, A. (2016) Investigating the role of benzodiazepines in drug-related mortality. Edinburgh: NHS Health Scotland. Available at: http://www.scotpho.org.uk/publications/reports-and-papers/1803-investigating-the-role-of-benzodiazepines-in-drug-related-mortality (Accessed: 27/02/2018).
Johnston, A. and King, L.A. (1998) 'Heroin profiling: Predicting the country of origin of seized heroin', Forensic science international, 95(1), pp. 47-55. doi: 10.1016/S0379-0738(98)00081-4.
Johnston, A. and Holt, D.W. (2014) 'Substandard drugs: a potential crisis for public health', British journal of clinical pharmacology, 78(2), pp. 218-243. doi: 10.1111/bcp.12298.
Joyce, J.R., Bal, T.S., Ardrey, R.E., Stevens, H.M. and Moffat, A.C. (1984) 'The Decomposition of Benzodiazepines during Analysis by Capillary Gas Chromatography / Mass Spectrometry', Biological Mass Spectrometry, 11(6), pp. 284-289.
Jung, C.R., Ortiz, R.S., Limberger, R. and Mayorga, P. (2012) 'A new methodology for detection of counterfeit Viagra® and Cialis® tablets by image processing and statistical analysis', Forensic science international, 216(1-3), pp. 92-96. doi: 10.1016/j.forsciint.2011.09.002.
Kalas, S., Naik, J., Patil, S. and Jadhav, V. (2015) 'Identification, synthesis and characterization of principal process related potential impurities in Diazepam', Journal of chemical and pharmaceutical research, 7(8), pp. 497-501.
Kalíková, K., Riesová, M., Chudoba, R., Schmid, M. and Tesaøová, E. (2011) 'Separation and Quantification of 1,4- benzodiazepines: HPLC versus CZEdagger]', Croatica Chemica Acta, 84(3), pp. 367-373.
Ketolainen, J., Silvennoinen, R., Peiponen, K., Suihko, E. and Paronen, P. (1997) 'Evaluation of tablet surface homogeneity by computer-generated hologram method', European Journal of Pharmaceutical Sciences, 5, pp. S30-S30. doi: 10.1016/S0928-0987(97)84023-7.
Klemenc, S. (2001) 'In common batch searching of illicit heroin samples — evaluation of data by chemometrics methods', Forensic science international, 115(1), pp. 43-52. doi: 10.1016/S0379-0738(00)00306-6.
Kogan, J. (2006) Grouping Multidimensional Data Recent Advances in Clustering. Berlin, Heidelberg : Springer Berlin Heidelberg.
Kwok, K. and Taylor, L.S. (2012) 'Analysis of counterfeit Cialis® tablets using Raman microscopy and multivariate curve resolution', Journal of pharmaceutical and biomedical analysis, 66, pp. 126-135. doi: 10.1016/j.jpba.2012.03.026.

351
Kyle, P.B. (2017) 'Chapter 7 - Toxicology: GCMS', in Nair, H. and Clarke, W. (eds.) Mass Spectrometry for the Clinical Laboratory San Diego: Academic Press, pp. 131-163.
Lachman, L., Lieberman, H.A. and Kanig, J.L. (1970) The Theory and Practice of Industrial Pharmacy. Philadelphia: Lea and Febiger.
Lesiak, A.D., Cody, R.B., Dane, A.J. and Musah, R.A. (2014) 'Rapid detection by direct analysis in real time-mass spectrometry (DART-MS) of psychoactive plant drugs of abuse: The case of Mitragyna speciosa aka "Kratom"', Forensic science international, 242, pp. 210-218. doi: 10.1016/j.forsciint.2014.07.005.
Levine, B. (2003) 'Chapter 11 - Central Nervous System Depressants', in Levine, B. (ed.) Principles of Forensic Toxicology. 2nd edn. Washington: AACC Press, pp. 173-186.
LFA Machines (2019) How to make your own supplements. Available at: https://www.lfatabletpresses.com › articles › how-to-make-your-own-supplements (Accessed: 13/11/19).
Li, J. and Wu, Y. (2014) 'Lubricants in Pharmaceutical Solid Dosage Forms', Lubricants, 2(1), pp. 21-43. doi: 10.3390/lubricants2010021.
Liang, B.A. and Mackey, T. (2009) 'Searching for Safety: Addressing Search Engine, Website, and Provider Accountability for Illicit Online Drug Sales', American Journal of Law and Medicine, 35, pp. 125-184.
Lin, D., Wang, S., Wu, C., Chen, B. and Liu, R. (2008) 'Chemical Derivatization for the Analysis of Drugs by GC-MS -- A Conceptual Review', Journal of Food and Drug Analysis, 16(1).
Listos, J., Talarek, S. and Fidecka, S. (2010) 'Adenosinergic system is involved in development of diazepam tolerance in mice', Pharmacology, Biochemistry and Behavior, 94(4), pp. 510-515. doi: 10.1016/j.pbb.2009.11.005.
Liu, H. and Lu, J. (2015) 'Brief Survey of K- Means Clustering Algorithms', Applied Mechanics and Materials, 740, pp. 624-628. doi: 10.4028/www.scientific.net/AMM.740.624.
Lociciro, S., Esseiva, P., Hayoz, P., Dujourdy, L., Besacier, F. and Margot, P. (2008) 'Cocaine profiling for strategic intelligence, a cross-border project between France and Switzerland: Part II. Validation of the statistical methodology for the profiling of cocaine', Forensic science international, 177(2), pp. 199-206. doi: 10.1016/j.forsciint.2007.12.008.
London Fashion Arts (2010) How to make a tablet pill mix for a press. Available at: https://www.youtube.com/watch?v=ys0ihFluFKM (Accessed: 13/11/19).

352
Lopatka, M. and Vallat, M. (2011) 'Surface granularity as a discriminating feature of illicit tablets', Forensic science international, 210(1), pp. 188-194. doi: 10.1016/j.forsciint.2011.03.008.
López-Muñoz, F., Ucha-Udabe, R. and Alamo, C. (2005) 'The History Of Barbiturates A Century After Their Clinical Introduction', Neuropsychiatric Disease and Treatment, 1(4), pp. 329-343.
López-Muñoz, F., Álamo, C. and García-García, P. (2011) 'The Discovery of Chlordiazepoxide and the Clinical Introduction of Benzodiazepines: Half a Century of Anxiolytic Drugs', Journal of anxiety disorders, 25(4), pp. 554-562. doi: 10.1016/j.janxdis.2011.01.002.
MA Pharmachem Ltd (2011) Diazepam: Patient Information Leaflet, Bolton: MA Pharmachem Ltd.
Mackey, T.K., Liang, B.A., York, P. and Kubic, T. (2015) 'Counterfeit drug penetration into global legitimate medicine supply chains: a global assessment', The American Journal of Tropical Medicine and Hygiene, 92(6), pp. 59. doi: 10.4269/ajtmh.14-0389.
Maione, C., de, O.S., Togni, L.R., Da Costa, J.L., Campiglia, A.D., Barbosa, F. and Barbosa, R.M. (2017) 'Using Cluster Analysis and ICP-MS to Identify Groups of Ecstasy Tablets in Sao Paulo State, Brazil', Journal of forensic sciences, . doi: 10.1111/1556-4029.13448.
Manchester, K.R., Lomas, E.C., Waters, L., Dempsey, F.C. and Maskell, P.D. (2018) 'The Emergence of New Psychoactive Substance (NPS) Benzodiazepines: A Review', Drug Testing and Analysis, 10(1), pp. 37-53. doi: https://doi.org/10.1002/dta.2211.
Marquis, R., Weyermann, C., Delaporte, C., Esseiva, P., Aalberg, L., Besacier, F., Bozenko Jr, J.S., Dahlenburg, R., Kopper, C. and Zrcek, F. (2008) 'Drug intelligence based on MDMA tablets data: Physical characteristics profiling', Forensic Science International, 178(1), pp. 34.
Matos, A., Costa, J., Boniatti, J., Seiceira, R., Pitaluga, A., Oliveira, D., Viçosa, A. and Holandino, C. (2017) 'Compatibility study between diazepam and tablet excipients', Journal of Thermal Analysis and Calorimetry; An International Forum for Thermal Studies, 127(2), pp. 1675-1682. doi: 10.1007/s10973-016-5350-9.
Maxwell, R.A. (2012) Drug Discovery A Casebook and Analysis. Totowa, NJ : Humana Press : Imprint: Humana Press.
McGivern, M. (2018) 'Use of 'street Valium' or 'Blue Plague' soaring in Scotland with 2.2 million illegal pills seized last year.', Daily Record, https://www.dailyrecord.co.uk/news/scottish-news/use-street-valium-blue-plague-12261525, 28 March 2018, .
353
McGivern, M. (2016) 'Fake Valium Epidemic: Blue Pills flooding Scotland's Streets and killing hundreds of Users, warn Insiders.', 25th July 2016, .
Mcgregor, C. and Bines, E. (2008) 'The use of high-speed differential scanning calorimetry (Hyper- DSC™) in the study of pharmaceutical polymorphs', International journal of pharmaceutics, 350(1), pp. 48-52. doi: 10.1016/j.ijpharm.2007.08.015.
Medicines and Healthcare Products Regulatory Agency (2016a) Meprobamate: Licence to be Cancelled. Available at: https://www.gov.uk/drug-safety-update/meprobamate-licence-to-be-cancelled (Accessed: 30/10/2017).
Medicines and Healthcare Products Regulatory Agency (2016b) Sovereign Medical Diazepam Tablet Patient Information Leaflet. Available at: http://www.mhra.gov.uk/home/groups/spcpil/documents/spcpil/con1481174134703.pdf (Accessed: 27/03/17).
Medicines and Healthcare Products Regulatory Agency (2015a) Bristol Laboratories, patient information leaflet - Diazepam. Available at: http://www.mhra.gov.uk/home/groups/spcpil/documents/spcpil/con1502429841010.pdf (Accessed: 25/03/2018).
Medicines and Healthcare Products Regulatory Agency (2015b) Teva Diazepam Tablet Patient Information Leaflet. Available at: http://www.mhra.gov.uk/home/groups/spcpil/documents/spcpil/con1454650228724.pdf (Accessed: 02/11/2017).
Medicines and Healthcare Products Regulatory Agency (2015c) Wockhardt Diazepam Tablet Patient Information Leaflet. Available at: http://www.mhra.gov.uk/home/groups/spcpil/documents/spcpil/con1512105923954.pdf (Accessed: 18/12/2017).
Medicines and Healthcare Products Regulatory Agency (2014) Tensium Diazepam Tablet Patient Information Leaflet. Available at: http://www.mhra.gov.uk/spc-pil/?prodName=TENSIUM%20TABLETS&subsName=DIAZEPAM&pageID=SecondLevel (Accessed: 16/03/17).
Medicines and Healthcare Products Regulatory Agency (2012) Medicines and Medical Devices Regulation: What You Need to Know. Available at: http://www.mhra.gov.uk/home/groups/comms-ic/documents/websiteresources/con2031677.pdf (Accessed: 14/03/17).
Monfreda, M., Varani, F., Cattaruzza, F., Ciambrone, S. and Proposito, A. (2015) 'Fast profiling of cocaine seizures by FTIR spectroscopy and GC-MS analysis of minor alkaloids and residual solvents', Science & Justice, 55(6), pp. 456-466. doi: 10.1016/j.scijus.2015.06.002.
Moosmann, B., Huppertz, L.M., Hutter, M., Buchwald, A., Ferlaino, S. and Auwärter, V. (2013) 'Detection and identification of the designer benzodiazepine

354
flubromazepam and preliminary data on its metabolism and pharmacokinetics', Journal of Mass Spectrometry, 48(11), pp. 1150-1159. doi: 10.1002/jms.3279.
Morelato, M., Beavis, A., Tahtouh, M., Ribaux, O. and Kirkbride, P. and Roux, C. (2014) 'The use of organic and inorganic impurities found in MDMA police seizures in a drug intelligence perspective', Science & Justice, 54, pp. 32-- 54.
Morelato, M., Beavis, A., Tahtouh, M., Ribaux, O., Kirkbride, K.P. and Roux, C. (2015) 'The use of methylamphetamine chemical profiling in an intelligence-led perspective and the observation of inhomogeneity within seizures', Forensic science international, 246, pp. 55-64. doi: 10.1016/j.forsciint.2014.10.041.
Morelato, M., Beavis, A., Tahtouh, M., Ribaux, O., Kirkbride, P. and Roux, C. (2013) 'The use of forensic case data in intelligence-led policing: The example of drug profiling', Forensic science international, . doi: 10.1016/j.forsciint.2013.01.003.
Moros, J., Garrigues, S. and Guardia, d.L. (2007) 'Quality control Fourier transform infrared determination of diazepam in pharmaceuticals', Journal of pharmaceutical and biomedical analysis, 43(4), pp. 1277-1282. doi: 10.1016/j.jpba.2006.10.036.
Myors, R., Wells, R.J., Skopec, S.V., Crisp, P., Iavetz, R., Skopec, Z., Ekangaki, A. and Robertson, J. (1998) 'Preliminary investigation of heroin fingerprinting using trace element concentrations', Analytical Communications, 135(12), pp. 403-410.
Narang, A., Desai, D. and Badawy, S. (2012) Impact of Excipient Interactions on Solid Dosage Form Stability, New York: Springer Science & Business Media.
National Center for Biotechnology Information (2017) PubChem Database: Compound Number: 44095 Lactose. Available at: https://pubchem.ncbi.nlm.nih.gov/compound/Lactose (Accessed: 28/06/17).
National Health Service (2014) Medicines Information - Brand Names and Generics. Available at: http://www.nhs.uk/Conditions/Medicinesinfo/Pages/Brandnamesandgenerics.aspx (Accessed: 19/03/17).
National Institute of Standards and Technology (2017) Mass Spectrum of Chlorphenamine (electron ionisation). Available at: https://webbook.nist.gov/cgi/cbook.cgi?ID=C132229&Mask=200#Mass-Spec (Accessed: 22/06/2018).
National Institute on Drug Abuse (2017) Overdose Death Rates. Available at: https://www.drugabuse.gov/related-topics/trends-statistics/overdose-death-rates (Accessed: 25-09-17).
National Records of Scotland (2017) Drug Related Deaths in Scotland in 2016. Scottish Government. Available at: https://www.nrscotland.gov.uk/files//statistics/drug-related-deaths/drd2016/16-drug-rel-deaths.pdf (Accessed: 16.08.2017).

355
NicDaéid, N. and Waddell, R.J.H. (2005) 'The Analytical and Chemometric Procedures used to Profile Illicit Drug Seizures', Talanta, 67(2), pp. 280-285. doi: 10.1016/j.talanta.2005.05.018.
Nyadong, L., Green, M.D., De Jesus, V., Newton, P. and Fernandez, F. (2007) 'Reactive desorption electrospray ionization linear ion trap mass spectrometry of latest-generation counterfeit antimalarials via noncovalent complex formation', Analytical Chemistry; Anal.Chem., 79(5), pp. 2150-2157. doi: 10.1021/ac062205h.
O'Connor, L.C., Torrance, H.J. and McKeown, D.A. (2016) 'ELISA Detection of Phenazepam, Etizolam, Pyrazolam, Flubromazopam, Diclazepam and Delorazopam in Blood using Immunalysis Benzodiazepine Kit', Journal of analytical toxicology, 40, pp. 159-161. doi: 10.1093/jat/bkv122.
Office for National Statistics (2017) Deaths Related to Drug Poisoning in England and Wales: 2016 Registrations. Available at: https://www.ons.gov.uk/peoplepopulationandcommunity/birthsdeathsandmarriages/deaths/bulletins/deathsrelatedtodrugpoisoninginenglandandwales/2016registrations (Accessed: 10th August 2017).
Ortiz, R.S., de Cássia Mariotti, K., Limberger, R.P. and Mayorga, P. (2012) 'Physical profile of counterfeit tablets Viagra® and Cialis®', Brazilian Journal of Pharmaceutical Sciences, 48(3).
Palmaro, A., Dupouy, J. and Lapeyre-Mestre, M. (2015) 'Benzodiazepines and risk of death: Results from two large cohort studies in France and UK', European Neuropsychopharmacology, 25(10), pp. 1566-1577. doi: 10.1016/j.euroneuro.2015.07.006.
Panakanti, R. and Narang, A. (2012) 'Impact of Excipient Interactions on Drug Bioavailability from Solid Dosage Forms', Pharmaceutical research, 29(10), pp. 2639-59. doi: 10.1007/s11095-012-0767-8.
Papoutsis, I., Khraiwesh, A., Nikolaou, P., Pistos, C., Spiliopoulou, C. and Athanaselis, S. (2012) 'A fully validated method for the simultaneous determination of 11 antidepressant drugs in whole blood by gas chromatography- mass spectrometry.(Clinical report)', Journal of pharmaceutical and biomedical analysis, 70, pp. 557.
Pérez-Lozano, P., Garcıa-Montoya, E., Orriols, A., Miñarro, M., Ticó, J.R. and Suñé-Negre, J.M. (2004) 'Development and validation of a new HPLC analytical method for the determination of alprazolam in tablets', Journal of pharmaceutical and biomedical analysis, 34(5), pp. 979-987. doi: 10.1016/j.jpba.2003.12.012.
Pesonen, T., Heinämäki, J., Miettunen, T., Antikainen, O., Pohjola, J. and Yliruusi, J. (1997) 'The effects of some formulation and process variables on the properties of direct-compression diazepam tablets', European Journal of Pharmaceutical Sciences, 5, pp. S30-S30. doi: 10.1016/S0928-0987(97)84025-0.

356
Pharmorgana GmbH (2018) Aluminium Lake Food Colours. Available at: http://www.pharmorgana.de/english/products/aluminium-lake-food-colours.html (Accessed: 30/07/2018).
Phenomenex (2014) Zebron 5 Phase GC Columns. Available at: http://separations.co.za/wp-content/uploads/2014/08/ZB5-Phases.pdf (Accessed: 06/12/2017).
Philp, M. and Fu, S. (2017) A Review of Chemical 'Spot' Tests: A presumptive illicit drug identification technique. Available at: https://onlinelibrary.wiley.com/doi/epdf/10.1002/dta.2300 (Accessed: 16/05/2018).
Pirnay, S., Ricordel, I., Libong, D. and Bouchonnet, S. (2002) 'Sensitive method for the detection of 22 benzodiazepines by gas chromatography–ion trap tandem mass spectrometry', Journal of Chromatography A, 954(1), pp. 235-245. doi: 10.1016/S0021-9673(02)00190-5.
Police Scotland (2016) Drug Trend Bulletin: The Illicit Benzodiazepine Market in Scotland. Available at: http://www.nhsborders.scot.nhs.uk/media/456560/Issue-13-NOT-PROTECTIVELY-MARKED-Police-Scotland-Drug-Trend-Bulletin-2-.pdf (Accessed: 12/08/2017).
Power, J., Clarke, K., Mcdermott, S., Mcglynn, P., Barry, M., White, C., O'Brien, J. and Kavan Agh, P. (2013) 'The identification of 4-methylamphetamine and its synthesis by-products in forensic samples', Forensic Science International (Online), 228(1), pp. 115-31. doi: 10.1016/j.forsciint.2013.02.039.
Rang, H.P. (2016) Rang and Dale's pharmacology. 8th ed.. edn. London?]: London? : Churchill Livingstone.
Ratanawijitrasin, S. and Wondemagegnehu, E. (2002) Effective Drug Regulation: A Multicountry Study. Geneva: World Health Organisation. Available at: http://apps.who.int/medicinedocs/pdf/s2300e/s2300e.pdf (Accessed: 18/08/2017).
Reshish.com (2017) Matrix Reshish. Available at: http://matrix.reshish.com/inverse.php (Accessed: 16/06/2017).
Reuter, P. and Stevens, A. (2007) An Analysis of UK Drug Policy: A Monograph prepared for the UK Drug Policy Commission. London: UK Drug Policy commission. Available at: http://www.ukdpc.org.uk/wp-content/uploads/Policy%20report%20-%20An%20analysis%20of%20UK%20drug%20policy.pdf (Accessed: 01/08/17).
Rhumorbarbe, D., Staehli, L., Broséus, J., Rossy, Q. and Esseiva, P. (2016) 'Buying drugs on a Darknet market: A better deal? Studying the online illicit drug market through the analysis of digital, physical and chemical data', Forensic science international, 267, pp. 173-182. doi: 10.1016/j.forsciint.2016.08.032.
Ricci, C., Nyadong, L., Fernandez, F., Newton, P. and Kazarian, S. (2007) 'Combined Fourier-transform infrared imaging and desorption electrospray-ionization
357
linear ion-trap mass spectrometry for analysis of counterfeit antimalarial tablets', Analytical and Bioanalytical Chemistry, 387(2), pp. 551-559. doi: 10.1007/s00216-006-0950-z.
Risoluti, R., Materazzi, S., Gregori, A. and Ripani, L. (2016) 'Early detection of emerging street drugs by near infrared spectroscopy and chemometrics', Talanta, 153, pp. 407-413. doi: 10.1016/j.talanta.2016.02.044.
Roopwani, R. and Buckner, I.S. (2011) 'Understanding deformation mechanisms during powder compaction using principal component analysis of compression data', International journal of pharmaceutics, 418(2), pp. 227. doi: 10.1016/j.ijpharm.2011.05.040.
Rowe, R.C., Sheskey, P.J. and Weller, P.J. (eds) (2003) Handbook Of Pharmaceutical Excipients. 4th edn. London: Pharmaceutical Press; Series number, .
Ryan, T.W. (1998) 'Identification of Four Process-Related Impurities in the Bulk Drug Butalbital Using HPLC-UV Photodiode Array Detection, Particle Beam MS, and NMR', Analytical Letters, 31(14), pp. 2447-2456. doi: 10.1080/00032719808005317.
Rotary Tablet Press Video Still (2011) Directed by Sajib, S. [Video Still]. https://www.youtube.com/watch?v=g4rrGMJqEdk: You Tube.
Saleh, K., Vialatte, L. and Guigon, P. (2005) 'Wet granulation in a batch high shear mixer', Chemical Engineering Science, 60(14), pp. 3763-3775. doi: 10.1016/j.ces.2005.02.006.
Sayad, S. (2017) Linear Discriminant Analysis. Available at: http://www.saedsayad.com/lda.htm (Accessed: 16/06/17).
Scottish Government (2017) Drug Seizures and Offender Characteristics, 2014-15 and 2015-16. Online: Scottish Government. Available at: http://www.gov.scot/Resource/0052/00521660.pdf (Accessed: 08/03/2018).
Sherlock, K., Wolff, K., Hay, A.W. and Conner, M. (1999) 'Analysis of illicit ecstasy tablets: implications for clinical management in the accident and emergency department', Journal of accident & emergency medicine, 16(3), pp. 194. doi: 10.1136/emj.16.3.194.
Siddiqui, M.R., Alothman, Z.A. and Rahman, N. (2017) 'Analytical techniques in pharmaceutical analysis: A review', Arabian Journal of Chemistry, 10, pp. S1409-S1421. doi: 10.1016/j.arabjc.2013.04.016.
Smith, K.E., Parks, S.S., Hyjek, M.A., Downey, S.E. and Gall, K. (2009) The effect of the glass transition temperature on the toughness of photopolymerizable (meth)acrylate networks under physiological conditions.

358
Sruthi, A., Tejaswi, P., Thanuja, N., Sudheer Kumar, D. and Vivek Sagar, P. (2013) 'Simple RP-HPLC method for estimation of diazepam in tablet dosage form', Journal of Pharmacy Research, 6(1), pp. 140-144. doi: 10.1016/j.jopr.2012.11.029.
Stawny, M., Piekarski, M. and Marciniec, B. (2016) 'Analysis of Drug Impurities', in Baranowska, I. (ed.) Handbook of Trace Analysis: Fundamentals and Applications Springer, pp. 181-202.
Stein, M.D., Anderson, B.J., Kenney, S.R. and Bailey, G.L. (2017) 'Beliefs about the consequences of using benzodiazepines among persons with opioid use disorder', Journal of substance abuse treatment, 77, pp. 67-71. doi: 10.1016/j.jsat.2017.03.002.
Sternbach, L.H. (1979) 'The Benzodiazepine Story', Journal of Medicinal Chemistry, 22(1), pp. 1-7.
Stevens, D.N. and King, S.L. (2013) 'Neuropharmacology of Benzodiazepines', in Miller, P., Blume, A.W., Kavanagh, D.J., Kampman, K.M., Bates, M.E., Larimer, M.E., Petry, N.M., De Witte, P. and Ball, S.A. (eds.) Biological Research on Addiction. 1st edn. Elsevier, pp. 605-614.
Stogner, J.M., Sanders, A. and Miller, B.L. (2014) 'Deception for drugs: Self-reported " doctor shopping" among young adults', Journal of the American Board of Family Medicine, 27(5), pp. 583-593. doi: 10.3122/jabfm.2014.05.140107.
Substance.org.uk (2017) MSJ (Diazepam) Information and Advice. Available at: http://www.substance.org.uk/topic/37-msj-guide-diazepam.aspx (Accessed: 16/03/17).
Sultan, S.M. and El-Mubarak, A. (1996) 'High performance liquid chromatographic method for the separation and quantification of some psychotherapeutic benzodiazepines optimized by the modified simplex procedure', Talanta, 43(4), pp. 569-576. doi: 10.1016/0039-9140(95)01772-0.
Swartz, M. (2006) A Guide to Analytical Method Validation. Available at: https://www.waters.com/webassets/cms/library/docs/720001826en.pdf (Accessed: 02/05/2014).
The British Medical Association (2017) Drug Policy in the UK: From the 19th century to the present day. Available at: fhttps://webcache.googleusercontent.com/search?q=cache:7vPxRpRfHx4J:https://www.bma.org.uk/-/media/files/pdfs/news%2520views%2520analysis/in%2520depth/drugs%2520of%2520dependence/drugsofdepend_chapter5.pdf%3Fla%3Den+&cd=1&hl=en&ct=clnk&gl=uk (Accessed: 07/08/17).
The Open University (2009) M249 Practical Modern Statistics: Analysing Data. 1st edn. Milton Keynes: The Open University.
359
The Open University (2007) M249 Practical Modern Statistics: Multivariate Analysis. Book 3. 1st edn. Milton Keynes: The Open University.
The R Foundation (2017) The R Project. Available at: https://www.r-project.org/foundation/ (Accessed: 09/01/18).
TICTAC Communications Ltd. (2015) TICTAC visual drug identification and information system. Available at: http://www.tictac.org.uk/ (Accessed: 26/03/2018).
Tuffery, S. and Tuffery, S. (2011) Data mining and statistics for decision making. Chichester; Chichester, West Sussex ; Hoboken, NJ.: Chichester : Wiley.
United Kingdom Cabinet Office (2000) Tackling Drugs to Build a better Britain : Second National Plan. London: United Kingdom Government Office. Available at: http://www.dldocs.stir.ac.uk/documents/natplan.pdf (Accessed: 19/09/2017).
United Kingdom Government (2017a) List of most commonly encountered drugs currently controlled under the Misuse of Drugs legislation. Available at: https://www.gov.uk/government/publications/controlled-drugs-list--2/list-of-most-commonly-encountered-drugs-currently-controlled-under-the-misuse-of-drugs-legislation (Accessed: 17/05/2018).
The Misuse of Drugs Act 1971 (Amendment) Order 2017 (SI year and number). Available at: https://www.legislation.gov.uk/uksi/2017/634/article/5/made (Accessed: 29/01/2018).
United Kingdom Government (2012) Circular: A Change to the Misuse of Drugs Act 1971. London: Home Office. Available at: https://www.gov.uk/government/publications/a-change-to-the-misuse-of-drugs-act-1971-control-of-pipradrol-related-compounds-and-phenazepam (Accessed: 21/10/2017).
United Kingdom Government (2001) The Misuse Of Drugs Regulations. Available at: http://www.legislation.gov.uk/uksi/2001/3998/contents/made (Accessed: 26/07/2017).
United Kingdom Government (1971) The Misuse Of Drugs Act. Available at: http://www.legislation.gov.uk/ukpga/1971/38/contents (Accessed: 26/07/2017).
United Kingdom Government Focal Point on Drugs (2017) United Kingdom Drug Situation 2016. London: united Kingdom Government. Available at: https://www.gov.uk/government/uploads/system/uploads/attachment_data/file/669021/UK-drug-situation-2016-report.pdf (Accessed: 27/02/2018).
United Nations Office on Drugs and Crime (2016) World Drug Report 2016. Vienna: United Nations. Available at: https://www.unodc.org/doc/wdr2016/WORLD_DRUG_REPORT_2016_web.pdf (Accessed: 21/08/2017).

360
United Nations Office on Drugs and Crime (2012) Recommended Methods for the Identification and Analysis of Barbiturates and Benzodiazepines under International Control. Vienna: United Nations. Available at: https://ewsd.wiv-isp.be/UNODC%20Publications/barbiturates_and_benzodiazepines.pdf (Accessed: 11/04/2017).
United Nations Office on Drugs and Crime (1971) Convention on Psychotropic Substances. Available at: https://www.unodc.org/pdf/convention_1971_en.pdf (Accessed: 26/07/17).
United Nations Office on Drugs and Crime (1951) Dangerous Drugs Act, 1951. Available at: https://www.unodc.org/res/cld/document/gbr/dangerous-drugs-act-1951_html/uk-dangerousdrugsact-51.pdf (Accessed: 24/01/2018).
United Nations Office on Drugs and Crime. (2009) Guidelines on Representative Drug Sampling. Vienna: United Nations Office on Drugs and Crime. Available at: http://enfsi.eu/wp-content/uploads/2016/09/drugs_sampling_guideline_unodc-enfsi.pdf (Accessed: 10/03/2017).
Valentine, J.L., Middleton, R. and Sparks, C. (1996) 'Identification of Urinary Benzodiazepines and their Metabolites: Comparison of Automated HPLC and GC-MS after Immunoassay Screening of Clinical Specimens', Journal of analytical toxicology, 20(6), pp. 416-424. doi: 10.1093/jat/20.6.416.
Van Buskirk, J., Bruno, R., Dobbins, T., Breen, C., Burns, L., Naicker, S. and Roxburgh, A. (2017) 'The recovery of online drug markets following law enforcement and other disruptions', Drug and alcohol dependence, 173, pp. 159-162. doi: 10.1016/j.drugalcdep.2017.01.004.
Waldron, I. (1977) 'Increased Prescribing of Valium, Librium, and other Drugs—An Example of the Influence of Economic and Social Factors on the Practice of Medicine', International Journal of Health Services, 7(1), pp. 37-62. doi: 10.2190/FPJT-V9YE-VWM1-UXPA.
Weatherall, M. (1990) 'Drugs of The Mind'In Search of A Cure: A History of Pharmaceutical Discovery Oxford University Press, pp. 261-264.
Wesley, A. (2014) 'MA Pharmachem tablet details'Personal Communication, .
Weyermann, C., Marquis, R., Delaporte, C., Esseiva, P., Lock, E., Aalberg, L., Bozenko Jr., J.S., Dieckmann, S., Dujourdy, L. and Zrcek, F. (2008) 'Drug intelligence based on MDMA tablets data: I. Organic impurities profiling', Forensic Science International, 177(1), pp. 11.
Winstock, A.R., Barrett, M., Ferris, J. and Maier, L. (2016) Global Drug Survey. Available at: https://www.globaldrugsurvey.com/wp-content/uploads/2016/06/TASTER-KEY-FINDINGS-FROM-GDS2016.pdf (Accessed: 21/08/2017).
https://www.unodc.org/res/cld/document/gbr/dangerous-drugs-act-1951_html/uk-dangerousdrugsact-51.pdf

361
Wockhardt UK (2015) Wockhardt Diazepam Tablet Information Leaflet. Available at: https://www.medicines.org.uk/emc/PIL.30825.latest.pdf (Accessed: 29/03/17).
World Health Organisation (2016) Substandard, Spurious,Falsely Labelled, Falsified and Counterfeit (SSFC) Medical Products. Available at: http://www.who.int/mediacentre/factsheets/fs275/en/ (Accessed: 12/08/2017).
World Health Organisation (2015a) Etizolam: Preview Report. Geneva: World Health Organisation. Available at: http://www.who.int/medicines/access/controlled-substances/5.7_Etizolam_PreRev.pdf (Accessed: 20/10/17).
World Health Organisation (2015b) Medical Product Alert No. 4/2015: Adverse Reactions caused by Falsified Diazepam in Central Africa. Available at: http://www.who.int/medicines/publications/drugalerts/Alert4_2015DiazepamEN.pdf (Accessed: 11/08/2017).
World Health Organisation (2015c) Phenazepam: Preview Report. Geneva: World Health Organisation. Available at: http://www.who.int/medicines/access/controlled-substances/5.8_Phenazepam_PreRev.pdf (Accessed: 21/10/17).
Wyttenbach, N., Birringer, C., Alsenz, J. and Kuentz, M. (2005) 'Drug-Excipient Compatibility Testing Using a High- Throughput Approach and Statistical Design', Pharmaceutical Development and Technology, 2005, 10; Vol.10(4; 4), pp. 499; 499-505; 505. doi: 10.1080/10837450500299875.
Zaid, A.N., Al-Ramahi, R.J., Ghoush, A.A., Qaddumi, A. and Zaaror, Y.A. (2013) 'Weight and Content Unformity of Lorazepam Half-Tablets: A study of correlation of a low drug content product', Saudi Pharmaceutical Journal, 21, pp. 71-75.