MADERA COUNTY
63
MADERA COUNTY Economic & Demographic Profile 2018
-
Upload
khangminh22 -
Category
Documents
-
view
0 -
download
0
Transcript of MADERA COUNTY

MADERA COUNTY Economic & Demographic Profile
2018

Page i
Acknowledgments
Rural County Representatives of California Economic Development Department
In partnership with Golden State Finance Authority
(916) 447-4806 [email protected] • www.rcrcnet.org
Document Production Peter Owens, Senior AnalystRyan Miller, Senior Analyst
Jose T. Valdovinos, Project AnalystAmanda Kabisch-Herzog, Senior Research Assistant
Karen C Hernandez, Senior Research AssistantWyatt Caldeira, Senior Research Assistant
Emilio Hernandez, Research AssistantMizan Shaikh, Research Assistant
Stephen Butler, Research AssistantLuke T. Scholl, Technical Writer
We would also like to thank the photo contributors. A full list of photo contributors can be found on
page 57.
Center for Economic DevelopmentCalifornia State University, Chico
(530) 898-4598 www.cedcal.com
Page ii
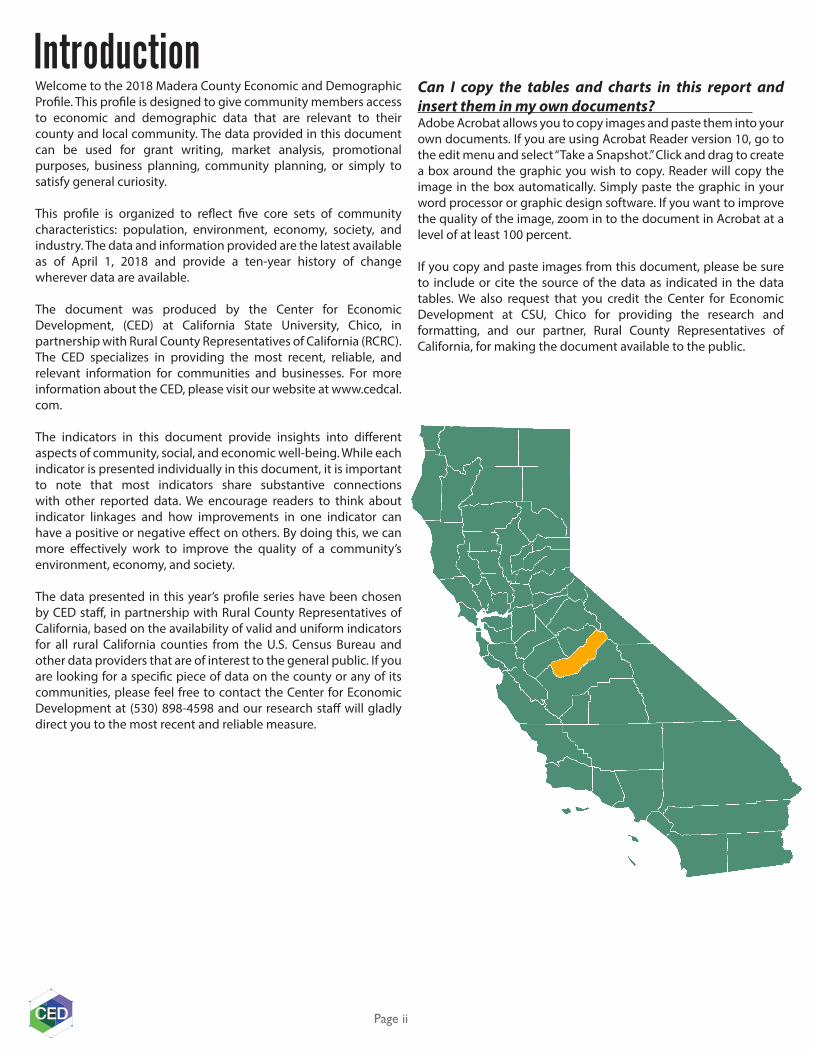
Welcome to the 2018 Madera County Economic and Demographic Profile. This profile is designed to give community members access to economic and demographic data that are relevant to their county and local community. The data provided in this document can be used for grant writing, market analysis, promotional purposes, business planning, community planning, or simply to satisfy general curiosity. This profile is organized to reflect five core sets of community characteristics: population, environment, economy, society, and industry. The data and information provided are the latest available as of April 1, 2018 and provide a ten-year history of change wherever data are available. The document was produced by the Center for Economic Development, (CED) at California State University, Chico, in partnership with Rural County Representatives of California (RCRC). The CED specializes in providing the most recent, reliable, and relevant information for communities and businesses. For more information about the CED, please visit our website at www.cedcal.com. The indicators in this document provide insights into different aspects of community, social, and economic well-being. While each indicator is presented individually in this document, it is important to note that most indicators share substantive connections with other reported data. We encourage readers to think about indicator linkages and how improvements in one indicator can have a positive or negative effect on others. By doing this, we can more effectively work to improve the quality of a community’s environment, economy, and society. The data presented in this year’s profile series have been chosen by CED staff, in partnership with Rural County Representatives of California, based on the availability of valid and uniform indicators for all rural California counties from the U.S. Census Bureau and other data providers that are of interest to the general public. If you are looking for a specific piece of data on the county or any of its communities, please feel free to contact the Center for Economic Development at (530) 898-4598 and our research staff will gladly direct you to the most recent and reliable measure.
Can I copy the tables and charts in this report and insert them in my own documents? Adobe Acrobat allows you to copy images and paste them into your own documents. If you are using Acrobat Reader version 10, go to the edit menu and select “Take a Snapshot.” Click and drag to create a box around the graphic you wish to copy. Reader will copy the image in the box automatically. Simply paste the graphic in your word processor or graphic design software. If you want to improve the quality of the image, zoom in to the document in Acrobat at a level of at least 100 percent. If you copy and paste images from this document, please be sure to include or cite the source of the data as indicated in the data tables. We also request that you credit the Center for Economic Development at CSU, Chico for providing the research and formatting, and our partner, Rural County Representatives of California, for making the document available to the public.
Introduction
Page iii

Page iv
Table of Contents4 Social Indicators ������������������������������������������ 29
Leading Causes of Death 30TANF-CalWORKs Caseload 31Medi-Cal Caseload 32School Free and Reduced Meal Program 33Educational Attainment 34High School Dropout Rate 35Graduates Eligible For UC and CSU Systems 36Average SAT Scores 37English Learners Enrollment 38Crime Rates 39Voter Registration and Participation 41
5 Industry Indicators �������������������������������������� 42Agricultural Including Forestry and Fishing 43Energy and Utilities 45Construction 47Manufacturing 49Travel and Recreation 51Retail 53Government 55
1 Demographic Indicators ����������������������������� 1 Total Population Components of Population Change Migration Patterns Age Distribution Population by Race and Ethnicity
2 Environmental Indicators ��������������������������� 8 Land Area & Population Density 9 Harvested Acreage 10 Commute Patterns 11 Travel Time to Work 12 Means of Transportation to Work 13
3 Economic Indicators ������������������������������������14Labor Force 15Employment 16Unemployment 17Seasonal Employment 18Jobs by Industry 19Total Personal Income 21Components of Personal Income 22Per Capita Income 24Earnings by Industry 25Median Household Income 26Poverty Rates 27Fair Market Rent 28
2345
6

Page 1
This section presents basic demographic characteristics such as population, age, and ethnicity, which provide a framework from which most other community indicators are based.
Madera County’s population increased from 2008-2017, with the exceptions of 2014 and 2016, when Madera County experienced declines in total population. With the exceptions of 2014 and 2016, the population growth rate of Madera County was consistently greater than that of California as a whole. Madera County experienced a natural increase in population every year between 2008 and 2017, although the magnitude of these increases declined rather steadily over time (27 percent decrease overall). Net migration, in contrast, fluctuated widely between positive and negative, with a notable out-migration of over 2,000 in 2012. However, 2012 was also the only year in which Madera County experienced a total population decrease. Between 2015 and 2016, the vast majority of Madera County’s in-migration came from nearby Fresno County; providing over four times as many in-migrants to Madera County as the next highest supplier, Merced. As with in-migration, Fresno County was the destination for an overwhelming majority of Madera County’s out-migration.
Madera County experienced its largest proportional population growth between 2007 and 2016 in those aged 65 to 74 years old (79 percent), those aged 55 to 64 years old (27 percent), and those aged 5 to 17 years old (7 percent). In contrast, Madera County experienced its largest proportional population decreases for those aged 25 to 39 years old (7 percent), those under 5 years old (4 percent), and those aged 85 years and older (4 percent). In 2016, the largest proportion of Madera County’s population by age were those aged 5 to 17 old (20 percent). Madera County experienced its greatest proportional population growth in its Native Hawaiian/Pacific Islander, Other/Multiracial, and Hispanic/Latino populations (87 percent, 79 percent, and 9 percent, respectively). In contrast, the county experienced its greatest proportional population losses in its American Indian, Black/African American, and Asian American populations (39 percent, 17 percent, and 9 percent, respectively). In 2016, the greatest proportion of the county population by race/ethnicity were those who identified as Hispanic or Latino (57 percent).
In This Section:Total Population ...........................................................2Components of Population Change ......................3Migration Patterns ........................................................4Age Distribution ............................................................5Population by Race and Ethnicity ...........................6
DEMOGRAPHIC INDICATORS

Page 2
What is it? Total population measures the number of people who consider the county to be their primary residence, and does not include those who reside in the county as a result of incarceration, or persons who reside in the county but do not consider it their primary residence. The data are estimated annually by the California Department of Finance and provide a point-in-time estimate for January 1 of each year.
How is it used? Population represents a cumulative measurement of the size of the county’s consumer market, labor availability, and the potential impact of human habitation on the environment. Population data provide the basis for many of the other indicators in this report.
Madera County’s population increased from 2008-2017, with the exceptions of 2014 and 2016 when Madera County experienced declines in total population. With the exceptions of 2014 and 2016, the population growth rate of Madera County was consistently greater than that of California as a whole. The majority of the county’s population resides in the cities of Madera and Chowchilla.
Total Population
-1.5%
-1.0%
-0.5%
0.0%
0.5%
1.0%
1.5%
2.0%
2008
2009
2010
2011
2012
2013
2014
2015
2016
2017
Population* Annual Percent Change Madera County
California
134,000136,000138,000140,000142,000144,000146,000148,000150,000152,000
2008
2009
2010
2011
2012
2013
2014
2015
2016
2017
County Population* Madera County
2008 139,860 1.75% 0.85%2009 141,492 1.17% 0.73%2010 143,095 1.13% 0.79%2011 144,555 1.02% 0.78%2012 146,362 1.25% 0.95%2013 148,575 1.51% 0.99%2014 147,023 -1.04% 0.86%2015 149,268 1.53% 0.89%2016 148,920 -0.23% 0.90%2017 149,946 0.69% 0.68%
Source: California Department of Finance, Demographic Research Unit* Total population data do not include incarcerated individuals unless otherwise noted.
Total Population*, Madera County
YearMadera County
1-yearchange
CA 1-yearchange
Chowchilla 10,825 11,152 11,316 11,638 11,855 13,536 12,191 12,174 12,118 12,294Madera 58,767 59,868 61,119 61,670 62,587 63,293 63,635 64,810 65,474 66,082
Source: California Department of Finance, Demographic Research Unit
City Population, Madera County
City 2008 2009 2010 2011 2012 2013 2014 2015 2016 2017
* Total population data do not include incarcerated individuals unless otherwise noted.
* Total population data do not include incarcerated individuals unless otherwise noted.
Page 3
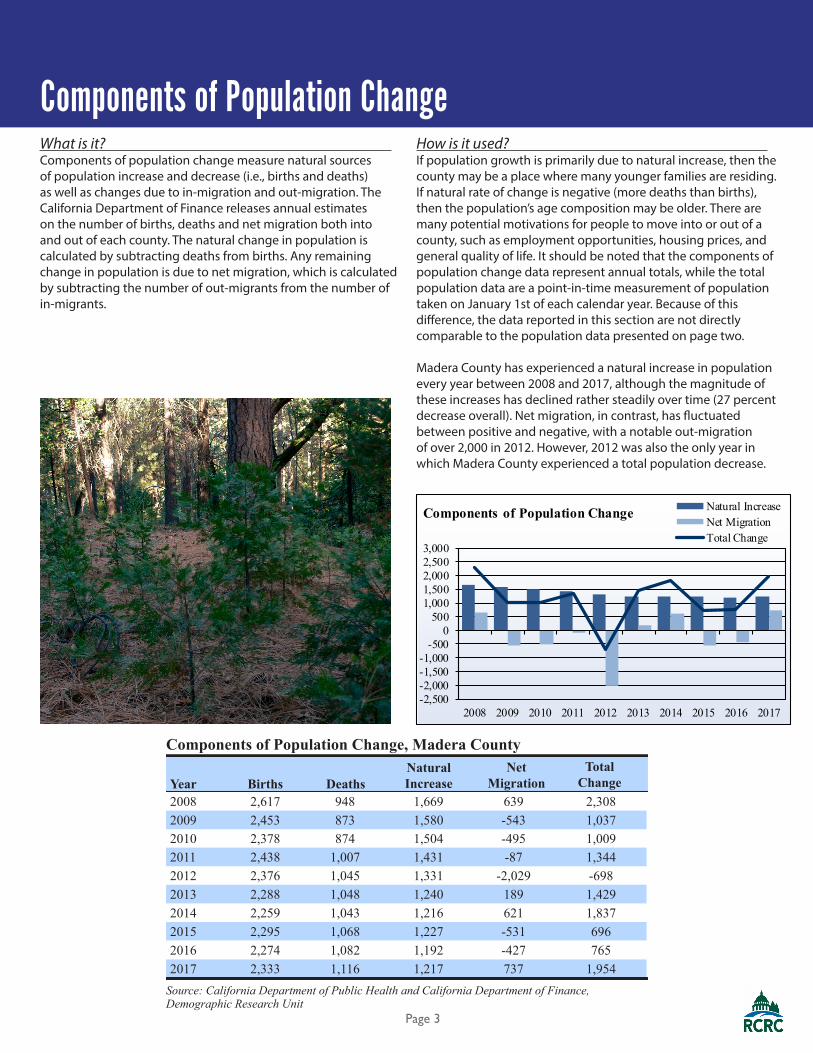
What is it? Components of population change measure natural sources of population increase and decrease (i.e., births and deaths) as well as changes due to in-migration and out-migration. The California Department of Finance releases annual estimates on the number of births, deaths and net migration both into and out of each county. The natural change in population is calculated by subtracting deaths from births. Any remaining change in population is due to net migration, which is calculated by subtracting the number of out-migrants from the number of in-migrants.
How is it used? If population growth is primarily due to natural increase, then the county may be a place where many younger families are residing. If natural rate of change is negative (more deaths than births), then the population’s age composition may be older. There are many potential motivations for people to move into or out of a county, such as employment opportunities, housing prices, and general quality of life. It should be noted that the components of population change data represent annual totals, while the total population data are a point-in-time measurement of population taken on January 1st of each calendar year. Because of this difference, the data reported in this section are not directly comparable to the population data presented on page two.
Madera County has experienced a natural increase in population every year between 2008 and 2017, although the magnitude of these increases has declined rather steadily over time (27 percent decrease overall). Net migration, in contrast, has fluctuated between positive and negative, with a notable out-migration of over 2,000 in 2012. However, 2012 was also the only year in which Madera County experienced a total population decrease.
Components of Population Change
-2,500-2,000-1,500-1,000
-5000
5001,0001,5002,0002,5003,000
2008 2009 2010 2011 2012 2013 2014 2015 2016 2017
Components of Population Change Natural IncreaseNet MigrationTotal Change
2008 2,617 948 1,669 639 2,3082009 2,453 873 1,580 -543 1,0372010 2,378 874 1,504 -495 1,0092011 2,438 1,007 1,431 -87 1,3442012 2,376 1,045 1,331 -2,029 -6982013 2,288 1,048 1,240 189 1,4292014 2,259 1,043 1,216 621 1,8372015 2,295 1,068 1,227 -531 6962016 2,274 1,082 1,192 -427 7652017 2,333 1,116 1,217 737 1,954
Source: California Department of Public Health and California Department of Finance, Demographic Research Unit
Components of Population Change, Madera County
YearNatural Increase
Net Migration
Total ChangeBirths Deaths

Page 4
What is it? This indicator includes migration patterns between Madera County and the ten counties with the highest numbers of in- and out-migrants. Data are collected from the Internal Revenue Service (IRS), and are based on income tax records for all available households. Migrations to and from group living quarters, such as college dormitories, nursing homes, or correctional institutions, are not included.
How is it used? Migration can indicate positive or negative changes in the economic, political, and social structure of an area, based on the characteristics of the area from which the migrants originate. For example, some migration from urban to rural areas may be based upon the lower cost of housing outside of major urban centers, while rural to urban migrants are often seeking better job opportunities. Neighboring counties, as well as those with higher population totals, generally show the largest amount of migration activity. Migration between non-neighboring counties, particularly those that are geographically distant and/or socioeconomically quite distinct, may thus be worthy of further investigation.
Between 2015 and 2016, the vast majority of Madera County’s in-migration came from nearby Fresno County, providing over four times as many in-migrants to Madera County as the next highest supplier, Merced. As with in-migration, Fresno County was the destination for an overwhelming majority of Madera County’s out-migration.
Migration Patterns
Fresno County 2,208Merced County 515Santa Clara County 259Los Angeles County 187Monterey County 156Stanislaus County 118Orange County 94Tulare County 93Kern County 92Mariposa County 77
Source: Internal Revenue Service
Top 10 In-Migration Counties, 2015-16, Madera County
County Number of In-MigrantsFresno County 2,314Merced County 365Monterey County 167Los Angeles County 138Santa Clara County 103Stanislaus County 99San Diego County 94Tulare County 89San Joaquin County 82San Luis Obispo County 73
Source: Internal Revenue Service
Top 10 Out-Migration Counties, 2015-16, Madera County
County Number of Out-Migrants
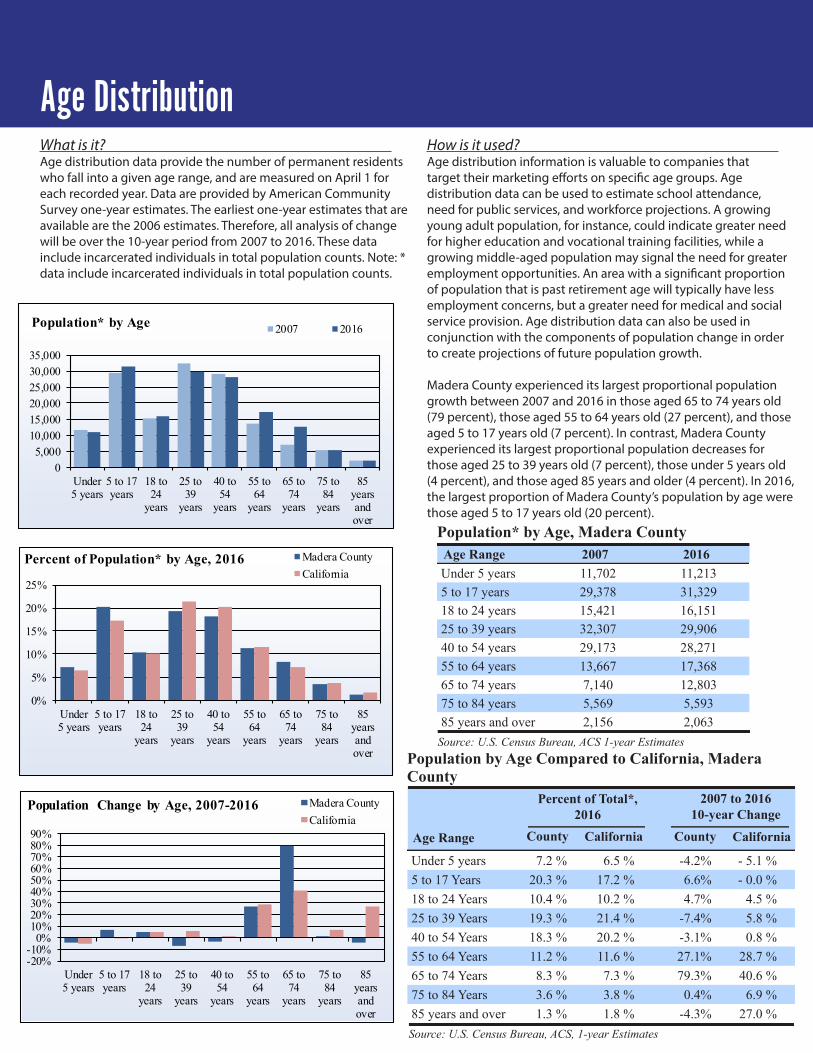
What is it? Age distribution data provide the number of permanent residents who fall into a given age range, and are measured on April 1 for each recorded year. Data are provided by American Community Survey one-year estimates. The earliest one-year estimates that are available are the 2006 estimates. Therefore, all analysis of change will be over the 10-year period from 2007 to 2016. These data include incarcerated individuals in total population counts. Note: * data include incarcerated individuals in total population counts.
How is it used? Age distribution information is valuable to companies that target their marketing efforts on specific age groups. Age distribution data can be used to estimate school attendance, need for public services, and workforce projections. A growing young adult population, for instance, could indicate greater need for higher education and vocational training facilities, while a growing middle-aged population may signal the need for greater employment opportunities. An area with a significant proportion of population that is past retirement age will typically have less employment concerns, but a greater need for medical and social service provision. Age distribution data can also be used in conjunction with the components of population change in order to create projections of future population growth.
Madera County experienced its largest proportional population growth between 2007 and 2016 in those aged 65 to 74 years old (79 percent), those aged 55 to 64 years old (27 percent), and those aged 5 to 17 years old (7 percent). In contrast, Madera County experienced its largest proportional population decreases for those aged 25 to 39 years old (7 percent), those under 5 years old (4 percent), and those aged 85 years and older (4 percent). In 2016, the largest proportion of Madera County’s population by age were those aged 5 to 17 years old (20 percent).
Age Distribution
Under 5 years 11,702 11,213 5 to 17 years 29,378 31,329 18 to 24 years 15,421 16,151 25 to 39 years 32,307 29,906 40 to 54 years 29,173 28,271 55 to 64 years 13,667 17,368 65 to 74 years 7,140 12,803 75 to 84 years 5,569 5,593 85 years and over 2,156 2,063
Source: U.S. Census Bureau, ACS 1-year Estimates
Population* by Age, Madera CountyAge Range 2007 2016
Under 5 years 7.2 % 6.5 % -4.2% - 5.1 % 5 to 17 Years 20.3 % 17.2 % 6.6% - 0.0 % 18 to 24 Years 10.4 % 10.2 % 4.7% 4.5 % 25 to 39 Years 19.3 % 21.4 % -7.4% 5.8 % 40 to 54 Years 18.3 % 20.2 % -3.1% 0.8 % 55 to 64 Years 11.2 % 11.6 % 27.1% 28.7 % 65 to 74 Years 8.3 % 7.3 % 79.3% 40.6 % 75 to 84 Years 3.6 % 3.8 % 0.4% 6.9 % 85 years and over 1.3 % 1.8 % -4.3% 27.0 % Source: U.S. Census Bureau, ACS, 1-year Estimates
Population by Age Compared to California, Madera County
Age Range County California County California
Percent of Total*, 2016
2007 to 201610-year Change
-20%-10%
0%10%20%30%40%50%60%70%80%90%
Under5 years
5 to 17years
18 to24
years
25 to39
years
40 to54
years
55 to64
years
65 to74
years
75 to84
years
85yearsandover
Population Change by Age, 2007-2016 Madera CountyCalifornia
0%
5%
10%
15%
20%
25%
Under5 years
5 to 17years
18 to24
years
25 to39
years
40 to54
years
55 to64
years
65 to74
years
75 to84
years
85yearsandover
Percent of Population* by Age, 2016 Madera CountyCalifornia
05,000
10,00015,00020,00025,00030,00035,000
Under5 years
5 to 17years
18 to24
years
25 to39
years
40 to54
years
55 to64
years
65 to74
years
75 to84
years
85yearsandover
Population* by Age 2007 2016

Page 6
What is it? Racial and ethnic identification is frequently a product of both collective assignment by others and individual assertion of a felt or claimed identity. It is important to note that both the Census and the American Community Survey measure an individual’s race and ethnicity through self-identification, rather than assignment by the interviewer. There are seven major racial/ethnic categories provided: American Indian, Asian, Black, Hispanic/Latino, Native Hawaiian/Pacific Islander, White, and Other/Multiracial. These data include incarcerated individuals in total population counts.
How is it used? Data on population within racial and ethnic categories are often used by advertisers to target their marketing efforts towards particular groups and to estimate how profitable these efforts might be. Grant writers frequently use population data on racial and ethnic groups to secure funding for programs meant to address group-specific social conditions or inequalities. Government officials and political candidates also use population data on race and ethnicity in order to tailor their campaign messages to people who make claims to particular racial and ethnic identities.
Between 2010 and 2016, Madera County experienced its greatest proportional population growth in its Native Hawaiian/Pacific Islander, Other/Multiracial, and Hispanic/Latino populations (87 percent, 79 percent, and 9 percent, respectively). In contrast, the county experienced its greatest proportional population losses in its American Indian, Black/African American, and Asian American populations (39 percent, 17 percent, and 9 percent, respectively). In 2016, the greatest proportion of the county population by race/ethnicity were those who identified as Hispanic or Latino (57 percent).
Population by Race and Ethnicity
White alone 57,666 53,651 34.7% 37.5% -7.0% -1.7%Hispanic or Latino 81,446 88,801 57.4% 38.9% 9.0% 8.5%American Indian alone 1,759 1,081 0.7% 0.3% -38.5% -11.4%Black or African American alone 5,351 4,462 2.9% 5.5% -16.6% 0.3%Asian alone 2,962 2,711 1.8% 14.1% -8.5% 14.1%Native Hawaiian and Pacific Islander 167 312 0.2% 0.3% 86.8% 2.5%Other/Multiple 2,057 3,679 2.4% 3.3% 78.9% 42.1%
Source: U.S. Census Bureau, Census 2010 and 2016, ACS 1-Year Estimates* Incarcerated individuals are included in total population counts.
Population* by Race/Ethnicity, Madera County
Race/Ethnicity 2010 2016 County California County CaliforniaPercent of Total* in 2016 2010 to 2016 7-year Change

Page 7
010,00020,00030,00040,00050,00060,00070,00080,00090,000
100,000
White alone Hispanic or Latino American Indianalone
Black or AfricanAmerican alone
Asian alone Native Hawaiian andPacific Islander
Other/Multiple
Population* by Race/ Ethnicity 2010 2016
0.0%
10.0%
20.0%
30.0%
40.0%
50.0%
60.0%
White alone Hispanic or Latino American Indianalone
Black or AfricanAmerican alone
Asian alone Native Hawaiian andPacific Islander
Other/Multiple
Population by Race/Ethnicity as a Percent of Total Population*, 2016Madera County California
-30.0%-20.0%-10.0%
0.0%10.0%20.0%30.0%40.0%50.0%60.0%
White alone Hispanic or Latino American Indianalone
Black or AfricanAmerican alone
Asian alone Native Hawaiian andPacific Islander
Other/Multiple
Six-Year Population Percent Change, 2010-2016 Madera County California
* Incarcerated individuals are included in total population counts.
* Incarcerated individuals are included in total population counts.
Page 8
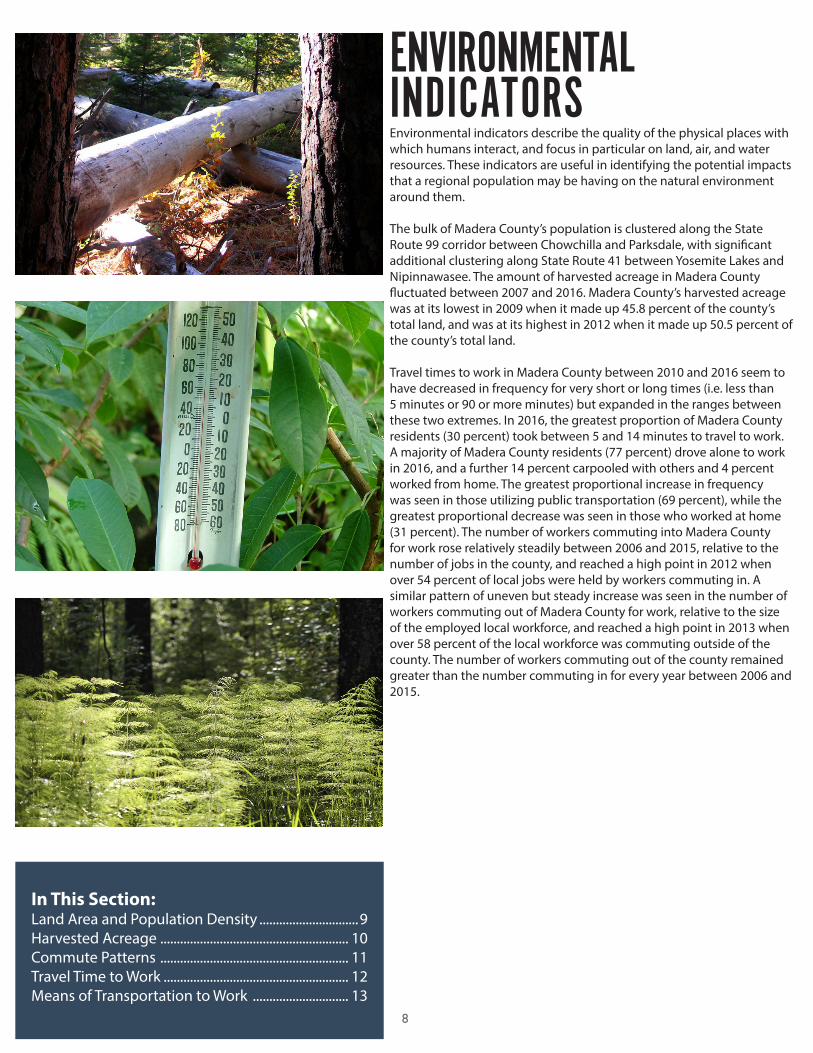
ENVIRONMENTAL INDICATORSEnvironmental indicators describe the quality of the physical places with which humans interact, and focus in particular on land, air, and water resources. These indicators are useful in identifying the potential impacts that a regional population may be having on the natural environment around them.
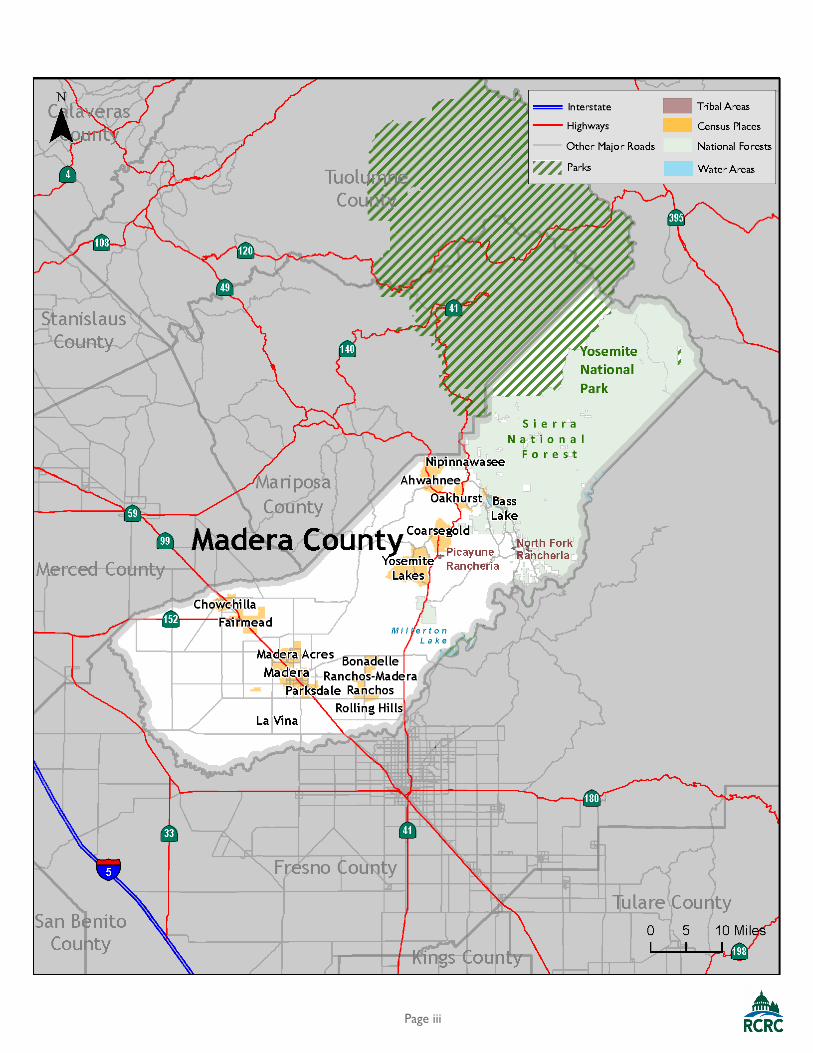
The bulk of Madera County’s population is clustered along the State Route 99 corridor between Chowchilla and Parksdale, with significant additional clustering along State Route 41 between Yosemite Lakes and Nipinnawasee. The amount of harvested acreage in Madera County fluctuated between 2007 and 2016. Madera County’s harvested acreage was at its lowest in 2009 when it made up 45.8 percent of the county’s total land, and was at its highest in 2012 when it made up 50.5 percent of the county’s total land.
Travel times to work in Madera County between 2010 and 2016 seem to have decreased in frequency for very short or long times (i.e. less than 5 minutes or 90 or more minutes) but expanded in the ranges between these two extremes. In 2016, the greatest proportion of Madera County residents (30 percent) took between 5 and 14 minutes to travel to work. A majority of Madera County residents (77 percent) drove alone to work in 2016, and a further 14 percent carpooled with others and 4 percent worked from home. The greatest proportional increase in frequency was seen in those utilizing public transportation (69 percent), while the greatest proportional decrease was seen in those who worked at home (31 percent). The number of workers commuting into Madera County for work rose relatively steadily between 2006 and 2015, relative to the number of jobs in the county, and reached a high point in 2012 when over 54 percent of local jobs were held by workers commuting in. A similar pattern of uneven but steady increase was seen in the number of workers commuting out of Madera County for work, relative to the size of the employed local workforce, and reached a high point in 2013 when over 58 percent of the local workforce was commuting outside of the county. The number of workers commuting out of the county remained greater than the number commuting in for every year between 2006 and 2015.
In This Section:Land Area and Population Density ..............................9Harvested Acreage ......................................................... 10Commute Patterns ......................................................... 11Travel Time to Work ........................................................ 12Means of Transportation to Work ............................. 13
Page 9
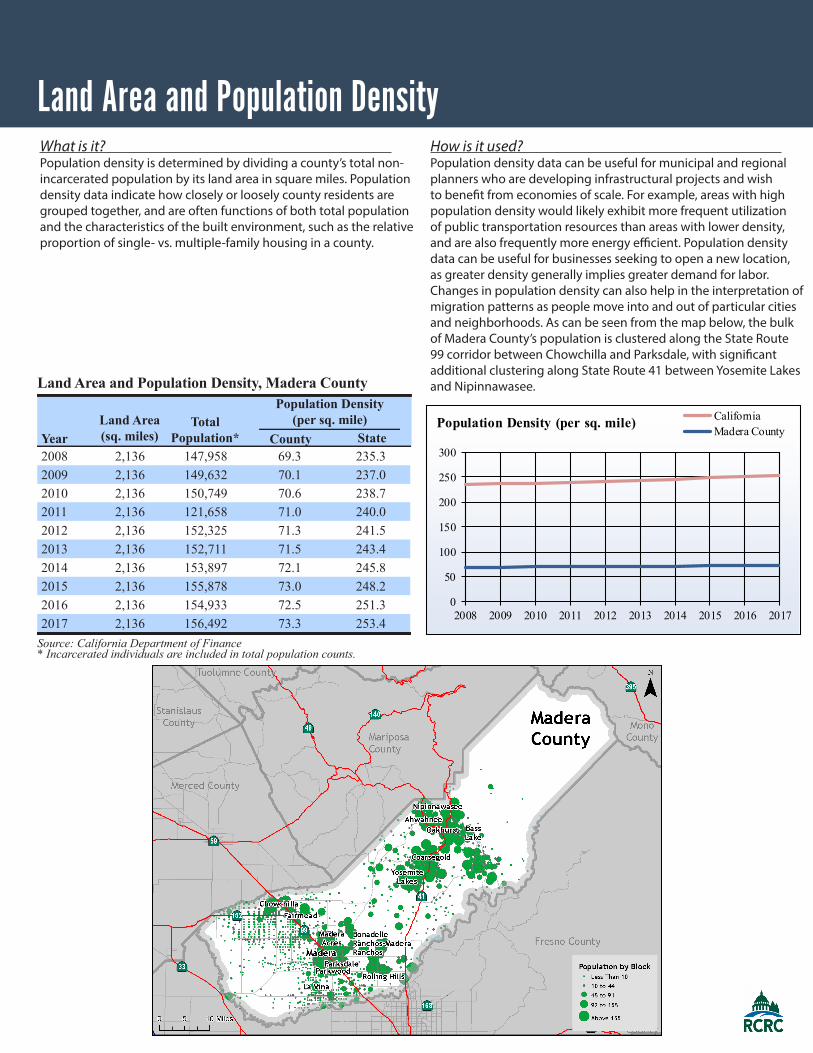
What is it? Population density is determined by dividing a county’s total non-incarcerated population by its land area in square miles. Population density data indicate how closely or loosely county residents are grouped together, and are often functions of both total population and the characteristics of the built environment, such as the relative proportion of single- vs. multiple-family housing in a county.
How is it used? Population density data can be useful for municipal and regional planners who are developing infrastructural projects and wish to benefit from economies of scale. For example, areas with high population density would likely exhibit more frequent utilization of public transportation resources than areas with lower density, and are also frequently more energy efficient. Population density data can be useful for businesses seeking to open a new location, as greater density generally implies greater demand for labor. Changes in population density can also help in the interpretation of migration patterns as people move into and out of particular cities and neighborhoods. As can be seen from the map below, the bulk of Madera County’s population is clustered along the State Route 99 corridor between Chowchilla and Parksdale, with significant additional clustering along State Route 41 between Yosemite Lakes and Nipinnawasee.
Land Area and Population Density
0
50
100
150
200
250
300
2008 2009 2010 2011 2012 2013 2014 2015 2016 2017
Population Density (per sq. mile) CaliforniaMadera County
2008 2,136 147,958 69.3 235.32009 2,136 149,632 70.1 237.02010 2,136 150,749 70.6 238.72011 2,136 121,658 71.0 240.02012 2,136 152,325 71.3 241.52013 2,136 152,711 71.5 243.42014 2,136 153,897 72.1 245.82015 2,136 155,878 73.0 248.22016 2,136 154,933 72.5 251.32017 2,136 156,492 73.3 253.4
Source: California Department of Finance* Incarcerated individuals are included in total population counts.
Land Area and Population Density, Madera County
YearLand Area(sq. miles)
Total Population* County State
Population Density (per sq. mile)

Page 10
What is it? Harvested acreage reports the total amount of land that is used in any aspect of agricultural production as a proportion of a county’s total land area. Data on harvested acreage are reported annually by individual County Agricultural Commissioners to the U.S. Department of Agriculture. Unfortunately, there is no consistent method for estimating harvested acreage from county to county or from year to year. However, commissioners are required to base their estimate on a local survey that is statistically representative of all agricultural producers in an area.
How is it used? Agriculture is often a dominant land use in rural counties, and harvested acreage as a proportion of total land area can indicate the relative importance of agriculture to a local economy. In addition to being a major economic factor, agriculture can also form the basis for community and regional identity, as well as factor when determining use policies for areas surrounding farmland.
The amount of harvested acreage in Madera County fluctuated between 2007 and 2016. Madera County’s harvested acreage was at its lowest in 2009 when it made up 45.8 percent of the county’s total land, and was at its highest in 2013 and 2016 when it made up 50.5 percent of the county’s total land. The vast majority of Madera County’s harvested acreage is used for animal pastures and almond orchards.
Harvested Acreage
2007 647,610 47.4%2008 644,900 47.2%2009 625,760 45.8%2010 648,530 47.4%2011 651,960 47.7%2012 668,320 48.9%2013 690,050 50.5%2014 679,610 49.7%2015 687,920 50.3%2016 690,710 50.5%
Source: California Agricultural Statistics Service, California Department of Finance
Total Harvested Acreage, Madera County
YearTotal Acres Harvested
Percent of Total Land Area
Pasture, Range 387,000 56.0%Almonds, All 125,000 18.1%Grapes, Wine 37,300 5.4%Pistachios 33,500 4.9%Grapes, Raisin 23,400 3.4%Silage 21,300 3.1%Corn, Silage 18,000 2.6%Hay, Alfalfa 13,100 1.9%Tomatoes, Processing 5,700 0.8%Figs, Dried 5,600 0.8%
Source: California Agricultural Statistics Service, California Department of Finance
Total Crops Harvested Acreage, Madera County
Crop 2016Percent of
Total
Pasture, Range56.0%
Almonds, All18.1%
Grapes, Wine5.4%
Pis tachios4.9% Grapes, Raisin
3.4%
Top 5 Crops by Harvested Acreage, Madera County
580,000
600,000
620,000
640,000
660,000
680,000
700,000
2007 2008 2009 2010 2011 2012 2013 2014 2015 2016
Total Harvested Acreage Madera County

Page 11
Commute Patterns
2006 37,082 41,999 21,652 15,473 41.7% 20,347 48.4%2007 38,212 43,052 21,817 17,160 44.9% 21,235 49.3%2008 37,567 39,931 21,609 16,531 44.0% 18,322 45.9%2009 37,063 46,074 21,052 16,878 45.5% 25,022 54.3%2010 37,233 45,785 21,036 17,090 45.9% 24,749 54.1%2011 41,947 43,579 20,185 21,843 52.1% 23,394 53.7%2012 42,745 46,257 19,460 23,285 54.5% 26,797 57.9%2013 43,692 48,444 20,090 23,602 54.0% 28,354 58.5%2014 46,945 49,526 21,377 25,568 54.5% 28,149 56.8%2015 45,552 48,634 21,265 24,287 53.3% 27,369 56.3%
Source: U.S. Census Bureau’s Longitudinal Employment Data
Place of Work Patterns, Madera County
YearJobs in County
Employed Local Workforce
Local Workforce Employed in County
Workforce Commuting In
Percent Commuting In
Workforce Commuting Out
Percent Commuting Out
What is it? Commute pattern data assess the number of jobs in a county relative to its total labor force, as well as the proportion of workers who commute either into or out of the county for work. The U.S. Census Bureau’s Longitudinal Employment and Household Dynamics data include all jobs reported to the IRS by businesses, with social security numbers matched to the locations of residential tax returns to determine a worker’s location.
How is it used? Commute pattern data are useful for estimating the ability of a county economy to meet the employment needs of its workforce. A larger proportion of workers commuting into the county from outside is indicative of a job surplus relative to labor force size, while a larger proportion of workers commuting out may indicate that there are not enough jobs relative to labor force size. These data can also be used to estimate daytime population, which is the number of people present in the county during normal business hours compared to the total (resident) population, and are often used by businesses in designing their marketing strategy for various products.
The number of workers commuting into Madera County for work rose unevenly but relatively steadily between 2006 and 2015, relative to the number of jobs in the county, and reached a high point in 2012 when over 54 percent of local jobs were held by workers commuting in. A similar pattern of uneven but steady increase is seen in the number of workers commuting out of Madera County for work, relative to the size of the employed local workforce, and reached a high point in 2013 when over 58 percent of the local workforce was commuting outside of the county. The number of workers commuting out of the county remained greater than the number commuting in every year between 2006 and 2015.
0
5,000
10,000
15,000
20,000
25,000
30,000
2006 2007 2008 2009 2010 2011 2012 2013 2014 2015
County Workforce Commute Patterns Commuting in Commuting Out
Page 12
Travel Time to Work
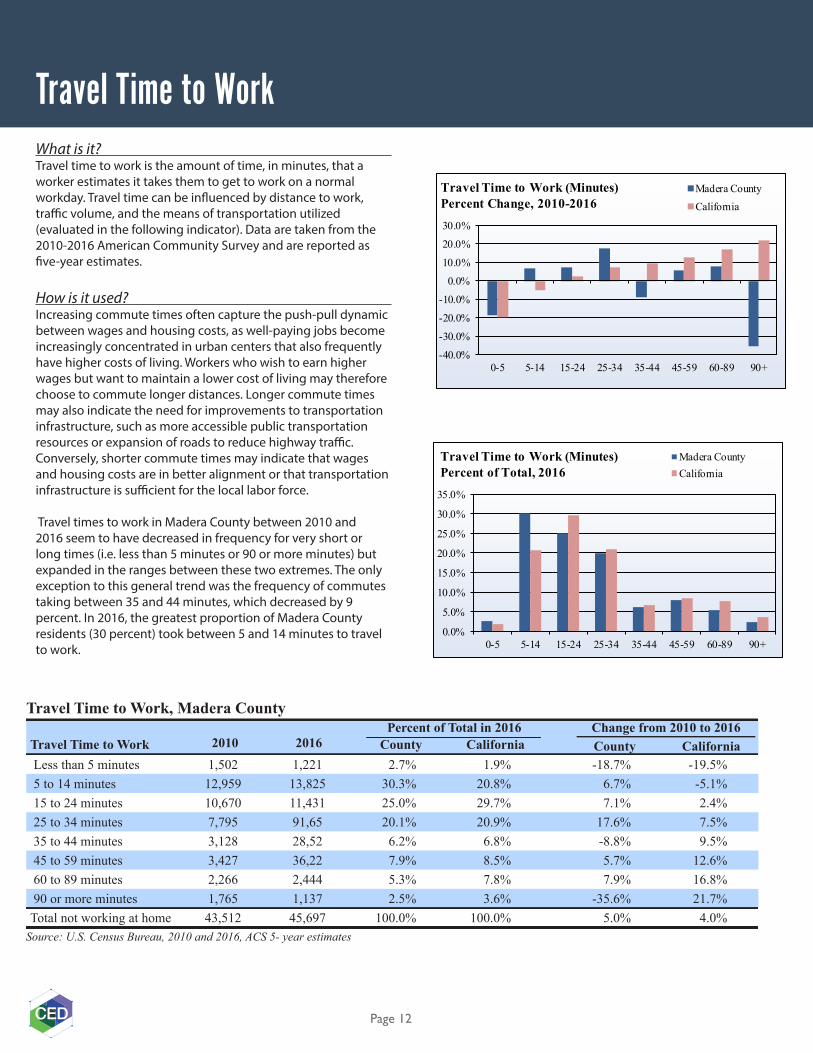
Less than 5 minutes 1,502 1,221 2.7% 1.9% -18.7% -19.5% 5 to 14 minutes 12,959 13,825 30.3% 20.8% 6.7% -5.1% 15 to 24 minutes 10,670 11,431 25.0% 29.7% 7.1% 2.4% 25 to 34 minutes 7,795 91,65 20.1% 20.9% 17.6% 7.5% 35 to 44 minutes 3,128 28,52 6.2% 6.8% -8.8% 9.5% 45 to 59 minutes 3,427 36,22 7.9% 8.5% 5.7% 12.6% 60 to 89 minutes 2,266 2,444 5.3% 7.8% 7.9% 16.8% 90 or more minutes 1,765 1,137 2.5% 3.6% -35.6% 21.7%Total not working at home 43,512 45,697 100.0% 100.0% 5.0% 4.0%
Source: U.S. Census Bureau, 2010 and 2016, ACS 5- year estimates
Travel Time to Work, Madera County
Travel Time to Work 2010 2016 County California County CaliforniaPercent of Total in 2016 Change from 2010 to 2016
0.0%
5.0%
10.0%
15.0%
20.0%
25.0%
30.0%
35.0%
0-5 5-14 15-24 25-34 35-44 45-59 60-89 90+
Travel Time to Work (Minutes)Percent of Total, 2016
Madera CountyCalifornia
-40.0%
-30.0%
-20.0%
-10.0%
0.0%
10.0%
20.0%
30.0%
0-5 5-14 15-24 25-34 35-44 45-59 60-89 90+
Travel Time to Work (Minutes)Percent Change, 2010-2016
Madera CountyCalifornia
What is it? Travel time to work is the amount of time, in minutes, that a worker estimates it takes them to get to work on a normal workday. Travel time can be influenced by distance to work, traffic volume, and the means of transportation utilized (evaluated in the following indicator). Data are taken from the 2010-2016 American Community Survey and are reported as five-year estimates.
How is it used? Increasing commute times often capture the push-pull dynamic between wages and housing costs, as well-paying jobs become increasingly concentrated in urban centers that also frequently have higher costs of living. Workers who wish to earn higher wages but want to maintain a lower cost of living may therefore choose to commute longer distances. Longer commute times may also indicate the need for improvements to transportation infrastructure, such as more accessible public transportation resources or expansion of roads to reduce highway traffic. Conversely, shorter commute times may indicate that wages and housing costs are in better alignment or that transportation infrastructure is sufficient for the local labor force.
Travel times to work in Madera County between 2010 and 2016 seem to have decreased in frequency for very short or long times (i.e. less than 5 minutes or 90 or more minutes) but expanded in the ranges between these two extremes. The only exception to this general trend was the frequency of commutes taking between 35 and 44 minutes, which decreased by 9 percent. In 2016, the greatest proportion of Madera County residents (30 percent) took between 5 and 14 minutes to travel to work.

Page 13
What is it? Means of transportation to work is the type of vehicle or mode of transportation most frequently used to get from home to work in an average workday. As with travel time, this indicator is measured through individual self-reports in the American Community Survey, and workers are asked to report the mode of travel most frequently used in the previous week. The data reported here are five-year estimates.
How is it used? The most frequently utilized means of transportation to work may indicate how accessible or feasible certain modes of transportation are for a county’s labor force. This indicator is especially useful when assessed alongside travel times to work, and can be helpful for county and municipal planners in the development of public transportation resources, bike paths, and other transportation infrastructure. A majority of Madera County residents (77 percent) drove alone to work in 2016, and a further 14 percent carpooled with others and 4 percent worked from home. The proportions of workers either driving alone or carpooling to work in 2016 were somewhat higher than those for the rest of the state of California in 2016. Between 2010 and 2016, the greatest proportional increase in frequency was seen in those utilizing public transportation (69 percent), while the greatest proportional decrease was seen in those who worked at home (31 percent).
Means of Transportation to Work
Drove Alone 34,258 36,822 77.3% 73.5% 7.5% 6.4%Carpooled 7,507 6,713 14.1% 10.6% -10.6% -5.9%Public transportation 89 150 0.3% 5.2% 68.5% 7.2%Bicycle 178 173 0.4% 1.1% -2.8% 24.9%Walked 840 1,016 2.1% 2.7% 21.0% 2.9%Taxicab, motorcycle, or other means 640 823 1.7% 1.4% 28.6% 14.0%Worked at Home 2,755 1,916 4.0% 5.4% -30.5% 16.0%Total 46,267 47,613 100.0% 100.0% 2.9% 5.7%
Source: U.S. Census Bureau, 2010 and 2016, ACS 5-year estimates
Means of Transportation to Work, Madera County
Means of Transportation 2010 2016 County California County CaliforniaPercent of Total in 2016 Change from 2010 to 2016Madera County
0.0%10.0%20.0%30.0%40.0%50.0%60.0%70.0%80.0%90.0%
Drove Alone Carpooled Public transportation Bicycle Walked Taxicab, motorcycle,or other means
Worked at Home
Means of Transportation to Work, Percent of TotalMadera County California

Page 14
In This Section:Labor Force .....................................................................15Employment ...................................................................16Unemployment .............................................................17Seasonal Employment ................................................18Jobs by Industry ............................................................19Total Personal Income .................................................21Components of Personal Income ...........................22Per Capita Income ........................................................24Earnings by Industry ....................................................25Median Household Income .......................................26Poverty Rates ..................................................................27Fair Market Rent ............................................................28
ECONOMIC INDICATORSEconomic indicators provide valuable insight into the relative availability of financial and employment resources for a county population, as well as the growth or decline of wages in particular industries and the average cost of housing. *Note: (D) Withheld disclosure of confidential business data.
Madera County’s labor force grew by a significant amount between 2007 and 2009, but due to substantial declines in 2010 and 2015, experienced a net decrease in size between 2007 and 2016. Overall, Madera County’s labor force decreased in size by roughly 3 percent between 2007 and 2016. For much of the period between 2007-2016, Madera County experienced modest growth in employment. However, in 2010, Madera County experienced a substantial decrease of 10.8 percent in employment. Overall, due to the loss of employment in 2010, the number of employed individuals in Madera County decreased by nearly 5 percent by 2016. Unemployment in Madera County increased steadily between 2007 and 2010, before entering a period of steady decline from 2011-2016. Madera County experienced significant seasonal changes in employment. Employment levels were generally at their highest in May through September, and at their lowest levels in November, March and April.
Total personal income and per capita income in Madera County grew steadily between 2007-2016, with the exception of 2009 when they experienced slight declines. Overall, once adjusted for inflation, total personal income in Madera County increased by over a billion dollars between 2007 and 2016. The primary components of personal income in Madera County are work earnings, dividends, interest, rent, and medical benefits. A significantly larger portion of Madera County’s personal income derived from income maintenance and unemployment benefits when compared to the statewide average. Median household income in Madera County fluctuated, but ultimately grew between 2007 and 2016. Overall, median household income in Madera County increased by nearly 12 percent between 2007 and 2016. Poverty rates in Madera County rose significantly between 2007 and 2016. Madera County’s poverty rates consistently remained higher than the statewide average between 2007 and 2016.
In 2016, Madera County’s farming, government and health care sectors were disproportionately larger than the statewide average. Conversely, Madera County’s information, finance/insurance and educational services sectors were disproportionately smaller than the statewide average. In 2016, over 50 percent of Madera County’s reported earnings derived from either the government, health care or farming sectors. The government sector plays such a significant role in Madera’s economy due largely to the presence of a Native American casino and two state prisons in the county. The percentage of Madera County’s total earnings derived from the farming sector was nearly 21 times larger than the statewide average, while total earnings derived from the information, finance/insurance and professional/scientific/technical services sectors were far less than the statewide average.

Page 15
What is it? The labor force is the number of people living in the county who are considered willing and able to work. This is operationally defined by the California Employment Development Department as all individuals over the age of 16 who are either currently working or currently receiving unemployment benefits (which requires one to be actively seeking work). Therefore, changes in both employment and unemployment levels affect labor force size. Individuals who are unemployed and are no longer actively seeking work are considered discouraged workers, and are not included in labor force estimates. The data are provided as annual averages of monthly estimates from the California Employment Development Department.
How is it used? Labor force size is a useful indicator of the overall employment potential for a county. However, because labor force is an aggregate measure of both employment and unemployment, it is often necessary to interpret increases or declines in labor force size alongside these constitutive measures. Because discouraged workers are not included in labor force counts, these data can also be compared to the distribution of a county population by age, in order to identify the number of people of working age (16-65) who are not in a county’s workforce.
Madera County’s labor force grew by a significant amount between 2007 and 2009, but, due to substantial declines in 2010 and 2015, experienced a net decrease in size between 2007 and 2016. Overall, Madera County’s labor force decreased in size by roughly 3 percent between 2007 and 2016. Madera County’s labor force was at its largest in 2009, and smallest in 2015.
Labor Force
2007 63,400 17,893,100 1.1% 1.4%2008 65,000 18,178,100 2.5% 1.6%2009 66,500 18,215,100 2.3% 0.2%2010 61,600 18,336,300 -7.4% 0.7%2011 62,000 18,415,100 0.6% 0.4%2012 62,500 18,523,800 0.8% 0.6%2013 62,300 18,624,300 -0.3% 0.5%2014 61,900 18,755,000 -0.6% 0.7%2015 60,000 18,893,200 -3.1% 0.7%2016 61,500 19,102,700 2.5% 1.1%
Source: California Employment Development Department, Labor Market Information Division
Total Labor Force, Madera County
Year County State1-Year Change
County StateLabor Force
56,000
58,000
60,000
62,000
64,000
66,000
68,000
2007 2008 2009 2010 2011 2012 2013 2014 2015 2016
Labor Force Madera County
-8.0%
-6.0%
-4.0%
-2.0%
0.0%
2.0%
4.0%
2007 2008 2009 2010 2011 2012 2013 2014 2015 2016
Labor Force Annual Percent Change Madera County
California
Page 16
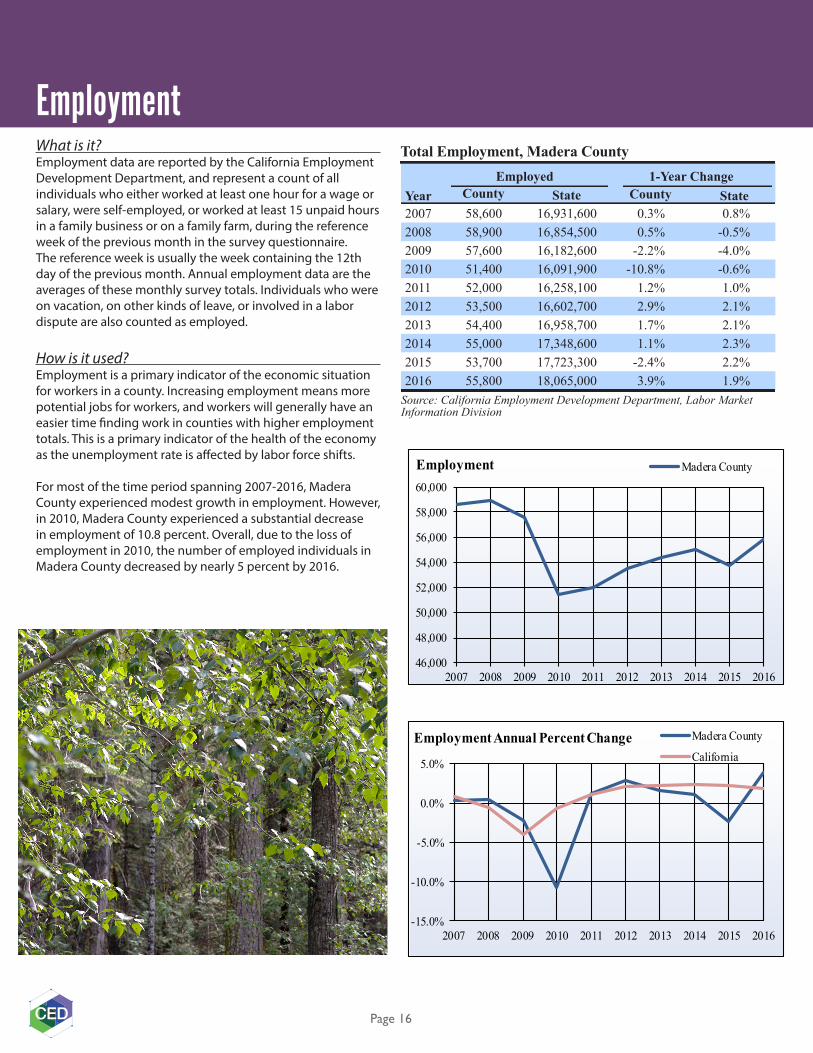
What is it? Employment data are reported by the California Employment Development Department, and represent a count of all individuals who either worked at least one hour for a wage or salary, were self-employed, or worked at least 15 unpaid hours in a family business or on a family farm, during the reference week of the previous month in the survey questionnaire. The reference week is usually the week containing the 12th day of the previous month. Annual employment data are the averages of these monthly survey totals. Individuals who were on vacation, on other kinds of leave, or involved in a labor dispute are also counted as employed.
How is it used? Employment is a primary indicator of the economic situation for workers in a county. Increasing employment means more potential jobs for workers, and workers will generally have an easier time finding work in counties with higher employment totals. This is a primary indicator of the health of the economy as the unemployment rate is affected by labor force shifts.
For most of the time period spanning 2007-2016, Madera County experienced modest growth in employment. However, in 2010, Madera County experienced a substantial decrease in employment of 10.8 percent. Overall, due to the loss of employment in 2010, the number of employed individuals in Madera County decreased by nearly 5 percent by 2016.
Employment
2007 58,600 16,931,600 0.3% 0.8%2008 58,900 16,854,500 0.5% -0.5%2009 57,600 16,182,600 -2.2% -4.0%2010 51,400 16,091,900 -10.8% -0.6%2011 52,000 16,258,100 1.2% 1.0%2012 53,500 16,602,700 2.9% 2.1%2013 54,400 16,958,700 1.7% 2.1%2014 55,000 17,348,600 1.1% 2.3%2015 53,700 17,723,300 -2.4% 2.2%2016 55,800 18,065,000 3.9% 1.9%
Source: California Employment Development Department, Labor Market Information Division
Total Employment, Madera County
Year County State1-Year Change
County StateEmployed
46,000
48,000
50,000
52,000
54,000
56,000
58,000
60,000
2007 2008 2009 2010 2011 2012 2013 2014 2015 2016
Employment Madera County
-15.0%
-10.0%
-5.0%
0.0%
5.0%
2007 2008 2009 2010 2011 2012 2013 2014 2015 2016
Employment Annual Percent Change Madera County
California

Page 17
What is it? Unemployment data are counts of the estimated number of people who are actively seeking work, are not working at least one hour per week for pay, and who are not self-employed. The data are reported by the California Employment Development Department (EDD) from data collected by the U.S. Current Population Survey (CPS). It is important to note that unemployment data do not include individuals who are not actively seeking work and thus no longer qualify for unemployment benefits, and thus represent an inexact estimation of the total unemployed population.
How is it used? Although unemployment levels are often used as a primary measure of economic health, it is perhaps more accurate to view them as an indicator of recent economic disruptions than a holistic indicator of growth or decline, due to its direct connection to unemployment benefits provision. Sustained high unemployment rates typically indicate the presence of structural economic and/or social issues within the community, although what is considered “high” may vary from one community to the next.
Unemployment in Madera County increased steadily between 2007 and 2010, before entering a period of steady decline from 2011-2016. Overall, the number of unemployed individuals in Madera County increased by 900 individuals by 2016, resulting in a 1.7 percent increase in unemployment rates.
Unemployment
2007 4,700 7.5% 5.4% 6.8% 11.2%2008 6,200 9.5% 7.3% 31.9% 37.7%2009 8,900 13.4% 11.2% 43.5% 53.6%2010 10,200 16.6% 12.2% 14.6% 10.4%2011 10,000 16.2% 11.7% -2.0% -3.9%2012 9,000 14.4% 10.4% -10.0% -10.9%2013 7,800 12.6% 8.9% -13.3% -13.3%2014 6,900 11.2% 7.5% -11.5% -15.6%2015 6,300 10.5% 6.2% -8.7% -16.8%2016 5,600 9.2% 5.4% -11.1% -11.3%
Source: California Employment Development Department, Labor Market Information Division
Total Unemployment, Madera County
Year County State1-Year Change
County StateUnemployment RateCounty
Unemployed
0
2,000
4,000
6,000
8,000
10,000
12,000
2007 2008 2009 2010 2011 2012 2013 2014 2015 2016
Unemployment Madera County
0.0%2.0%4.0%6.0%8.0%
10.0%12.0%14.0%16.0%18.0%
2007 2008 2009 2010 2011 2012 2013 2014 2015 2016
Unemployment Rate Madera CountyCalifornia
Page 18
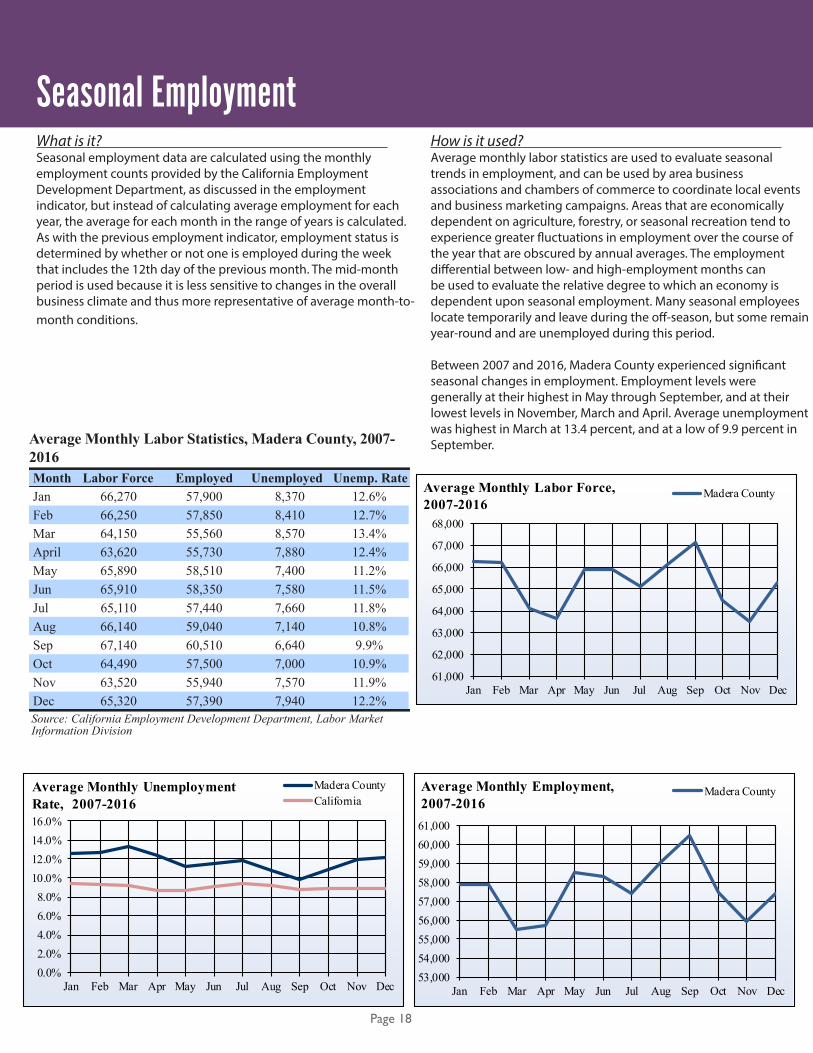
What is it? Seasonal employment data are calculated using the monthly employment counts provided by the California Employment Development Department, as discussed in the employment indicator, but instead of calculating average employment for each year, the average for each month in the range of years is calculated. As with the previous employment indicator, employment status is determined by whether or not one is employed during the week that includes the 12th day of the previous month. The mid-month period is used because it is less sensitive to changes in the overall business climate and thus more representative of average month-to-month conditions.
How is it used? Average monthly labor statistics are used to evaluate seasonal trends in employment, and can be used by area business associations and chambers of commerce to coordinate local events and business marketing campaigns. Areas that are economically dependent on agriculture, forestry, or seasonal recreation tend to experience greater fluctuations in employment over the course of the year that are obscured by annual averages. The employment differential between low- and high-employment months can be used to evaluate the relative degree to which an economy is dependent upon seasonal employment. Many seasonal employees locate temporarily and leave during the off-season, but some remain year-round and are unemployed during this period.
Between 2007 and 2016, Madera County experienced significant seasonal changes in employment. Employment levels were generally at their highest in May through September, and at their lowest levels in November, March and April. Average unemployment was highest in March at 13.4 percent, and at a low of 9.9 percent in September.
Seasonal Employment
Jan 66,270 57,900 8,370 12.6%Feb 66,250 57,850 8,410 12.7%Mar 64,150 55,560 8,570 13.4%April 63,620 55,730 7,880 12.4%May 65,890 58,510 7,400 11.2%Jun 65,910 58,350 7,580 11.5%Jul 65,110 57,440 7,660 11.8%Aug 66,140 59,040 7,140 10.8%Sep 67,140 60,510 6,640 9.9%Oct 64,490 57,500 7,000 10.9%Nov 63,520 55,940 7,570 11.9%Dec 65,320 57,390 7,940 12.2%Source: California Employment Development Department, Labor Market Information Division
Average Monthly Labor Statistics, Madera County, 2007-2016Month Employed UnemployedLabor Force Unemp. Rate
53,00054,00055,00056,00057,00058,00059,00060,00061,000
Jan Feb Mar Apr May Jun Jul Aug Sep Oct Nov Dec
Average Monthly Employment, 2007-2016
Madera County
0.0%2.0%4.0%6.0%8.0%
10.0%12.0%14.0%16.0%
Jan Feb Mar Apr May Jun Jul Aug Sep Oct Nov Dec
Average Monthly UnemploymentRate, 2007-2016
Madera CountyCalifornia
61,000
62,000
63,000
64,000
65,000
66,000
67,000
68,000
Jan Feb Mar Apr May Jun Jul Aug Sep Oct Nov Dec
Average Monthly Labor Force, 2007-2016
Madera County

Page 19
What is it? Published by the U.S. Department of Commerce’s Bureau of Economic Analysis (BEA), this indicator measures the number of jobs in a county within major industry sectors, regardless of whether or not the workers are themselves county residents. Because the BEA uses business tax returns to identify jobs within each industry, a worker who changed their workplace over the course of the year would be counted twice, once for each business’s tax return. Self-employed proprietors and members of business partnerships are also included in jobs by industry data, meaning that someone who owns their own business but also works for another employer would also be counted twice. Unpaid family care workers and volunteers are not included. The symbol “(D)” is used for information withheld to avoid disclosing data for individual companies. Values for (D) are included in aggregate totals.
How is it used? Jobs by industry is a useful measure of the economic diversity and potential resilience of the local economy, and is thus of great utility to local chambers of commerce and economic development organizations. A county with a large proportion of its jobs concentrated in a few industry sectors may be more susceptible to a recession or economic downturn than one with a more diversified economy.
In 2016, Madera County’s farming, government and health care sectors were disproportionately larger than the statewide average. Conversely, Madera County’s information, finance/insurance and educational services sectors were disproportionately smaller than the statewide average. Government employment in the county is consistently higher than the state average primarily because of the presence of a Native American casino in Coarsegold, and two state prisons in Chowchilla.
Jobs by Industry
0.0%
10.0%
20.0%
Oth
er se
rvic
es, e
xcep
tpu
blic
adm
inis
tratio
n
Hea
lth c
are
and
soci
alas
sista
nce
Man
ufac
turin
g
Gov
ernm
ent a
ndgo
vern
men
t ent
erpr
ises
Educ
atio
nal s
ervi
ces
Reta
il tra
de
Cons
truct
ion
Acc
omm
odat
ion
and
food
serv
ices
Real
esta
te an
d re
ntal
and
leas
ing
Farm
em
ploy
men
t
Jobs by Industry Sector, 2016 Madera County California
Jobs by Industry, Madera County, 2016
Industry
County Percent of
Total
California Percent of
Total
Madera County
Farm employment 4,489 7.0% 1.0%Forestry, fishing, and related activities (D) 0.0% 1.1%
Mining (D) 0.0% 0.3%Utilities 263 0.4% 0.3%Construction 2,815 4.4% 4.7%Manufacturing 3,850 6.0% 6.1%Wholesale trade 1,214 1.9% 3.8%Retail trade 5,152 8.0% 9.1%Transportation and warehousing 1,547 2.4% 3.8%Information 437 0.7% 2.6%Finance and insurance 1,359 2.1% 4.4%Real estate, rental, and leasing 1,925 3.0% 5.0%Professional, scientific, and technical services 1,726 2.7% 8.6%
Management of companies and enterprises 400 0.6% 1.1%
Administrative and waste services 2,580 4.0% 6.4%
Educational services 310 0.5% 2.3%Health care and social assistance 8,705 13.6% 11.2%Arts, entertainment, and recreation 748 1.2% 2.8%
Accommodation and food services 3,314 5.2% 7.5%
Other services, except public administration 3,480 5.4% 6.2%
Government and government enterprises 10,769 16.8% 11.8%
Sum of withheld "(D)" values 9,142 14.2% n/a Total Jobs 64,225 100.0% 100.0%
Source: California Employment Development Department, Labor Market Information Division

Page 20
0.0%
10.0%
20.0%
Oth
er se
rvice
s, ex
cept
publ
ic ad
min
istra
tion
Hea
lth c
are
and
soci
alas
sista
nce
Man
ufac
turin
g
Gov
ernm
ent a
ndgo
vern
men
t ent
erpr
ises
Educ
atio
nal s
ervi
ces
Reta
il tra
de
Cons
tructi
on
Acc
omm
odati
on a
nd fo
odse
rvice
s
Real
esta
te an
d re
ntal
and
leas
ing
Farm
empl
oym
ent
Jobs by Industry Sector, 2007 Madera County California
Farm employment 4,699 7.8% 1.1%Forestry, fishing, and related activities (D) 0.0% 1.0%
Mining (D) n/a 0.2%Utilities 188 0.3% 0.3%Construction 3,559 5.9% 5.9%Manufacturing 3,640 6.0% 7.4%Wholesale trade 807 1.3% 3.8%Retail trade 5,296 8.8% 10.1%Transportation and warehousing 1,532 2.5% 2.9%Information 625 1.0% 2.7%Finance and insurance 1,172 1.9% 4.6%Real estate, rental, and leasing 2,441 4.0% 5.7%Professional, scientific, and technical services (D) 0.0% 8.3%
Management of companies and enterprises (D) 0.0% 1.0%
Administrative and waste services 2,926 4.9% 6.4%
Educational services 276 0.5% 1.9%Health care and social assistance 6,654 11.0% 8.4%Arts, entertainment, and recreation 678 1.1% 2.5%
Accommodation and food services 2,652 4.4% 6.8%
Other services, except public administration 3,020 5.0% 6.0%
Government and government enterprises 11,275 18.7% 12.9%
Sum of withheld "(D)" values 8,849 14.7% n/a Total Jobs 60,289 100.0% 100.0%
Source: California Employment Development Department, Labor Market Information Division
Jobs by Industry, Madera County, 2007
Industry
County Percent of
Total
California Percent of
Total
MaderaCounty

Page 21
What is it? Total personal income data are provided by the U.S. Department of Commerce’s Bureau of Economic Analysis. The indicator represents the sum of all income collected by individuals over the course of each year, including but not limited to earned income, government payments, and returns on investment. The data do not include personal contributions for social insurance (such as payments to Social Security or Medicare). The indicator is tabulated using individual and corporate tax returns from the Internal Revenue Service.
How is it used? Total personal income is the basis for several other income indicators in this section. Growing personal income generally indicates a growing economy, as long as the growth is greater than the annual average inflation rate. Increases or decreases in total personal income are most frequently due to changes in worker’s earnings, population changes, or both.
Total personal income in Madera County grew between 2007-2016, with the exception of 2009 when it experienced a decline. Total personal income in Madera County experienced its most significant growth in 2010 and 2011. Overall, once adjusted for inflation, total personal income in Madera County increased by over a billion dollars between 2007 and 2016.
Total Personal Income
$0
$1,000
$2,000
$3,000
$4,000
$5,000
$6,000
$7,000
2007 2008 2009 2010 2011 2012 2013 2014 2015 2016
Inflation-Adjusted TotalPersonal Income (in Millions)
Madera County
-6.0%-4.0%-2.0%0.0%2.0%4.0%6.0%8.0%
10.0%
2007 2008 2009 2010 2011 2012 2013 2014 2015 2016
Inflation-Adjusted TotalPersonal Income, 1-Year Change
Madera CountyCalifornia
2007 $3,918 8.8% $4,673 8.8% 2.1%2008 $3,968 1.3% $4,538 -2.9% -1.8%2009 $3,818 -3.8% $4,365 -3.8% -4.1%2010 $4,170 9.2% $4,645 6.4% 0.4%2011 $4,555 9.2% $4,993 7.5% 5.1%2012 $4,770 4.7% $5,080 1.7% 4.1%2013 $4,920 3.1% $5,158 1.5% 0.5%2014 $5,107 3.8% $5,270 2.2% 3.2%2015 $5,450 6.7% $5,549 5.3% 7.0%2016 $5,806 6.5% $5,806 4.6% 3.3%
Source: U.S. Department of Commerce, Bureau of Economic Analysis
Total Personal Income, Madera County
YearNominal Personal Income
in Millions of Dollars
CaliforniaMadera County1-Year Change
Inflation Adjusted Personal Income in Millions of Dollars (2016)
1-Year Change
1-Year Change
Page 22
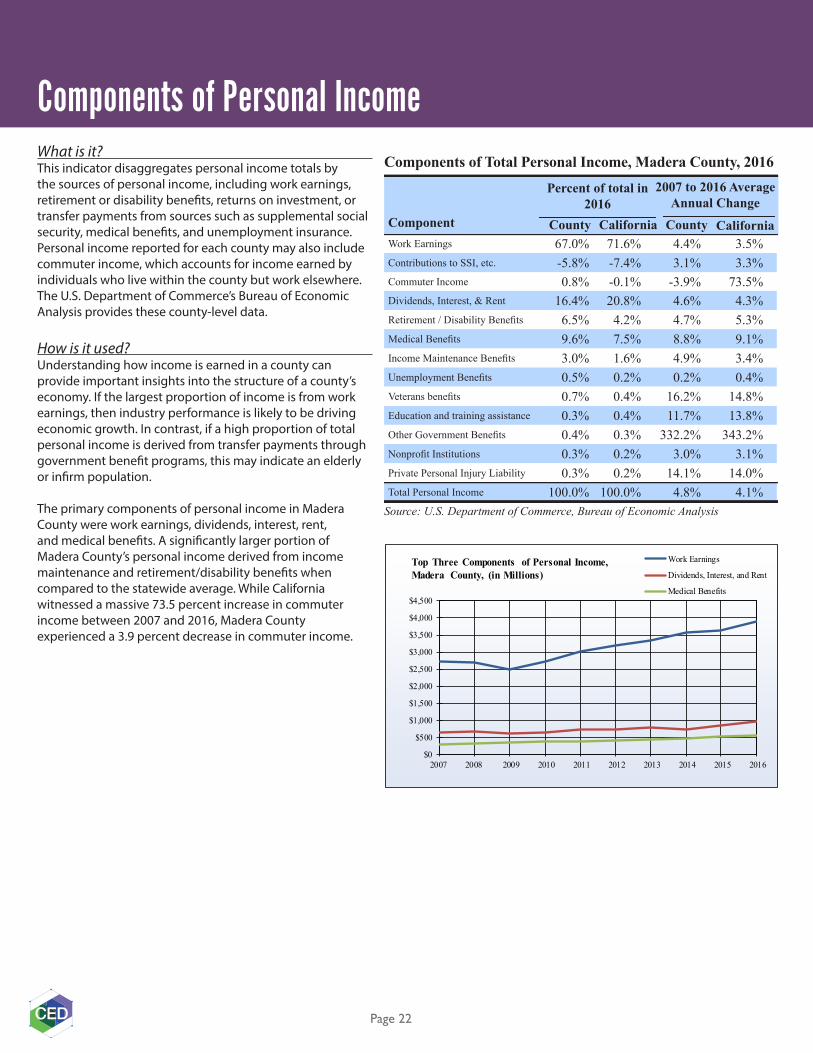
What is it? This indicator disaggregates personal income totals by the sources of personal income, including work earnings, retirement or disability benefits, returns on investment, or transfer payments from sources such as supplemental social security, medical benefits, and unemployment insurance. Personal income reported for each county may also include commuter income, which accounts for income earned by individuals who live within the county but work elsewhere. The U.S. Department of Commerce’s Bureau of Economic Analysis provides these county-level data.
How is it used? Understanding how income is earned in a county can provide important insights into the structure of a county’s economy. If the largest proportion of income is from work earnings, then industry performance is likely to be driving economic growth. In contrast, if a high proportion of total personal income is derived from transfer payments through government benefit programs, this may indicate an elderly or infirm population.
The primary components of personal income in Madera County were work earnings, dividends, interest, rent, and medical benefits. A significantly larger portion of Madera County’s personal income derived from income maintenance and retirement/disability benefits when compared to the statewide average. While California witnessed a massive 73.5 percent increase in commuter income between 2007 and 2016, Madera County experienced a 3.9 percent decrease in commuter income.
Components of Personal Income
$0
$500
$1,000
$1,500
$2,000
$2,500
$3,000
$3,500
$4,000
$4,500
2007 2008 2009 2010 2011 2012 2013 2014 2015 2016
Top Three Components of Personal Income, Madera County, (in Millions)
Work Earnings
Dividends, Interest, and Rent
Medical Benefits
Work Earnings 67.0% 71.6% 4.4% 3.5%Contributions to SSI, etc. -5.8% -7.4% 3.1% 3.3%Commuter Income 0.8% -0.1% -3.9% 73.5%Dividends, Interest, & Rent 16.4% 20.8% 4.6% 4.3%Retirement / Disability Benefits 6.5% 4.2% 4.7% 5.3%Medical Benefits 9.6% 7.5% 8.8% 9.1%Income Maintenance Benefits 3.0% 1.6% 4.9% 3.4%Unemployment Benefits 0.5% 0.2% 0.2% 0.4%Veterans benefits 0.7% 0.4% 16.2% 14.8%Education and training assistance 0.3% 0.4% 11.7% 13.8%Other Government Benefits 0.4% 0.3% 332.2% 343.2%Nonprofit Institutions 0.3% 0.2% 3.0% 3.1%Private Personal Injury Liability 0.3% 0.2% 14.1% 14.0%Total Personal Income 100.0% 100.0% 4.8% 4.1%
Source: U.S. Department of Commerce, Bureau of Economic Analysis
Components of Total Personal Income, Madera County, 2016
Component
Percent of total in 2016
2007 to 2016 Average Annual Change
County CountyCalifornia California

Page 23
-10.0%0.0%
10.0%20.0%30.0%40.0%50.0%60.0%70.0%80.0%
Work Earnings Contribut ions toSSI, etc.
CommuterIncome
Dividends,Interest , and
Rent
Retirement/DisabilityBenefits
MedicalBenefits
IncomeMaintenance
Benefits
UnemploymentBenefits
Veteransbenefi ts
Education andtraining
assis tance
NonprofitInsti tutions
Private PersonalInjury Liabi lity
Components of Total Personal Income, Change from 2007 to 2016 Madera County California
Work Earnings $2705.8 $2682.1 $2486.8 $2724.1 $3016.2 $3188.3 $3317.9 $3555.5 $3627.8 $3887.4Contributions to SSI, etc. $-257.4 $-257.9 $-260.3 $-256.3 $-241.9 $-252.0 $-296.8 $-310.6 $-313.1 $-336.9Commuter Income $73.7 $61.3 $38.6 $52.8 $53.2 $52.3 $49.0 $7.2 $97.3 $44.9Dividends, Interest, and Rent $652.0 $665.0 $630.0 $644.9 $721.6 $746.0 $779.1 $739.5 $823.9 $952.0Retirement/ Disability Benefits $255.1 $268.3 $293.3 $301.9 $308.9 $327.8 $339.4 $352.0 $367.2 $375.8Medical Benefits $296.4 $319.7 $347.5 $381.6 $385.4 $414.7 $435.7 $472.1 $530.5 $557.5Income Maintenance Benefits $118.6 $128.1 $144.3 $158.1 $167.0 $170.5 $173.1 $172.7 $173.9 $177.0Unemployment Benefits $27.6 $33.8 $69.9 $81.9 $69.8 $57.5 $45.5 $31.3 $30.8 $28.2Veterans benefits $14.4 $16.0 $17.7 $20.5 $22.8 $24.9 $30.3 $32.1 $35.6 $37.8Education and training assistance $9.0 $9.9 $12.2 $14.4 $15.6 $16.8 $17.3 $17.8 $18.1 $19.5Other Government Benefits $0.7 $40.5 $16.2 $33.6 $28.2 $5.4 $4.3 $18.0 $23.6 $24.6Nonprofit Institutions $14.9 $14.7 $15.7 $17.7 $17.1 $18.3 $18.5 $19.1 $19.0 $19.3Private Personal Injury Liability $7.7 $11.4 $12.1 $12.3 $16.5 $12.4 $11.6 $13.2 $15.8 $18.4Total Personal Income $3918.4 $3993.0 $3824.0 $4187.5 $4580.5 $4782.8 $4924.8 $5119.8 $5450.5 $5805.6
Source: U.S. Department of Commerce, Bureau of Economic Analysis
Components of Total Personal Income (Millions of Dollars), Madera CountyComponent 2007 2008 2009 2010 2011 2012 2013 2014 2015 2016
Note: Other government benefits is not included for components of total personal income in this figure due to large fluctuations in its 10-year average percent change.
-20.0%-10.0%
0.0%10.0%20.0%30.0%40.0%50.0%60.0%70.0%80.0%
Work Earnings Contribut ionsto SSI, etc.
CommuterIncome
Dividends,Interest , and
Rent
Retirement/DisabilityBenefits
MedicalBenefits
IncomeMaintenance
Benefits
UnemploymentBenefits
Veteransbenefi ts
Education andtraining
assis tance
OtherGovernment
Benefits
NonprofitInsti tutions
PrivatePersonal Injury
Liabil ity
Components of Total Personal Income, Percent of Total Income in 2016 Madera County California
Page 24
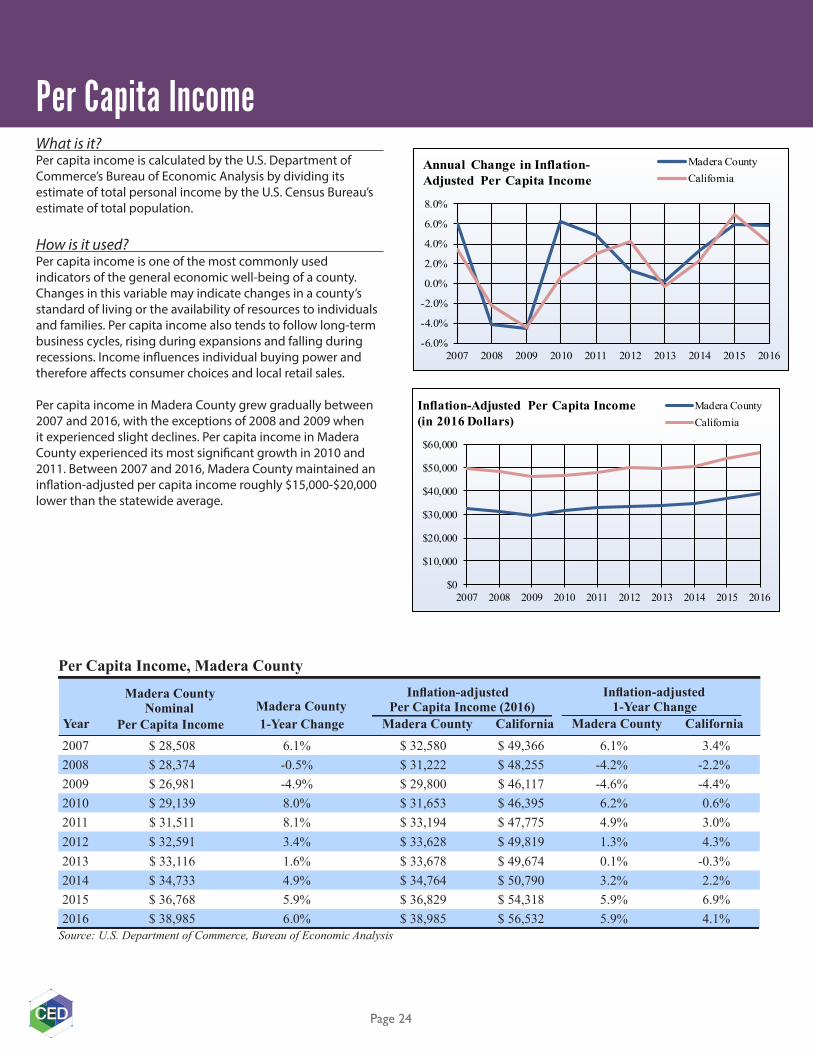
What is it? Per capita income is calculated by the U.S. Department of Commerce’s Bureau of Economic Analysis by dividing its estimate of total personal income by the U.S. Census Bureau’s estimate of total population.
How is it used? Per capita income is one of the most commonly used indicators of the general economic well-being of a county. Changes in this variable may indicate changes in a county’s standard of living or the availability of resources to individuals and families. Per capita income also tends to follow long-term business cycles, rising during expansions and falling during recessions. Income influences individual buying power and therefore affects consumer choices and local retail sales.
Per capita income in Madera County grew gradually between 2007 and 2016, with the exceptions of 2008 and 2009 when it experienced slight declines. Per capita income in Madera County experienced its most significant growth in 2010 and 2011. Between 2007 and 2016, Madera County maintained an inflation-adjusted per capita income roughly $15,000-$20,000 lower than the statewide average.
Per Capita Income
-6.0%
-4.0%
-2.0%
0.0%
2.0%
4.0%
6.0%
8.0%
2007 2008 2009 2010 2011 2012 2013 2014 2015 2016
Annual Change in Inflation-Adjusted Per Capita Income
Madera CountyCalifornia
$0
$10,000
$20,000
$30,000
$40,000
$50,000
$60,000
2007 2008 2009 2010 2011 2012 2013 2014 2015 2016
Inflation-Adjusted Per Capita Income(in 2016 Dollars)
Madera CountyCalifornia
2007 $ 28,508 6.1% $ 32,580 $ 49,366 6.1% 3.4%2008 $ 28,374 -0.5% $ 31,222 $ 48,255 -4.2% -2.2%2009 $ 26,981 -4.9% $ 29,800 $ 46,117 -4.6% -4.4%2010 $ 29,139 8.0% $ 31,653 $ 46,395 6.2% 0.6%2011 $ 31,511 8.1% $ 33,194 $ 47,775 4.9% 3.0%2012 $ 32,591 3.4% $ 33,628 $ 49,819 1.3% 4.3%2013 $ 33,116 1.6% $ 33,678 $ 49,674 0.1% -0.3%2014 $ 34,733 4.9% $ 34,764 $ 50,790 3.2% 2.2%2015 $ 36,768 5.9% $ 36,829 $ 54,318 5.9% 6.9%2016 $ 38,985 6.0% $ 38,985 $ 56,532 5.9% 4.1%
Source: U.S. Department of Commerce, Bureau of Economic Analysis
Per Capita Income, Madera County
Year
Madera CountyNominal
Madera County CaliforniaPer Capita IncomeMadera County1-Year Change
Inflation-adjustedPer Capita Income (2016)
Madera County California
Inflation-adjusted1-Year Change

Page 25
What is it? Earnings by industry data represent the total personal earnings for workers within individual industry sectors, and should not be confused with total business revenues within industries. The total earnings of an industry are calculated by taking the sum of three components: wage and salary disbursements, supplements to wages and salaries, and proprietor’s income. Earnings by industry are the components of earnings by place of work from the section on components of personal income. The symbol “(D)” is used for information withheld to avoid disclosing data for individual companies. The symbol “(L)” is used when reported values are less than $50,000. Values for both (D) and (L) are included in aggregate totals.
How is it used? Earning levels by industry are important indicators of the overall economic contributions of particular industries to a local economy. Similar to the previous Jobs by Industry indicator, these data can also provide important insights into the relative diversification of a county’s economy, and thus how resilient an economy is to economic downturns or recessions.
In 2016, over 50 percent of Madera County’s reported earnings derived from either the government, health care or farming sectors. Government earnings in the county are significantly higher than the state average, due largely to the presence of a Native American casino in Coarsegold, and two state prisons in Chowchilla. The percentage of Madera County’s total earnings derived from the farming sector was nearly 21 times larger than the statewide average, while total earnings derived from the information, finance/insurance and professional/scientific/technical services sectors were significantly lower than the state average. However, it should be taken into account that data are unavailable for the forestry/fishing and mining sectors, due to sampling and estimation requirements for the underlying survey data.
Earnings by Industry
Farm employment $ 813.6 20.9% 0.7%Forestry, fishing, and related activities (D) 0.0% 0.3%
Mining (D) 0.0% 0.3%Utilities $ 41.2 1.1% 0.3%Construction $ 173.5 4.5% 2.3%Manufacturing $ 271.0 7.0% 4.7%Wholesale trade $ 71.1 1.8% 2.4%Retail trade $ 180.2 4.6% 2.8%
Transportation and warehousing $ 85.6 2.2% 1.4%
Information $ 32.5 0.8% 3.0%Finance and insurance $ 35.6 0.9% 2.7%Real Estate, rental, and leasing $ 43.0 1.1% 1.6%Professional, scientific, and technical services $ 50.7 1.3% 6.1%
Management of companies and enterprises $ 27.7 0.7% 1.1%
Administrative and waste services $ 70.1 1.8% 2.0%
Educational services $ 3.6 0.1% 0.8%
Health care and social assistance $ 533.8 13.7% 4.7%
Arts, entertainment and recreation $ 9.6 0.2% 0.8%
Accommodation and food services $ 89.1 2.3% 1.6%
Other services, except public administration $ 140.4 3.6% 1.8%
Government and government enterprises $ 856.3 22.0% 8.7%
Sum of withheld “(D)” values $358.7 9.2% n/aTotal Earnings $ 3,887.4 100.0% 100.0%
Source: California Employment Development Department, Labor Market Information Division
Earnings by Industry, Madera County, 2016 (in Millions)
Industry County Percent
of Total
California Percent of
TotalMadera County
0.0%
5.0%
10.0%
15.0%
20.0%
25.0%
Gov
ernm
ent
and
gove
rnm
ent
ente
rpris
es
Far
m e
arni
ngs
Hea
lth c
are a
ndso
cial
assi
stanc
e
Man
ufac
turin
g
Reta
il tra
de
Con
stru
ctio
n
Oth
er se
rvic
es,
exce
pt p
ublic
adm
inist
ratio
n
Acc
omm
odati
onan
d fo
odse
rvice
s
Tra
nspo
rtatio
nan
dw
areh
ousin
g
Who
lesa
le tr
ade
Earnings by Industry, 2016 Madera California

Page 26
What is it? Household income includes the incomes of the householder (i.e. renter or title holder) and all other people 15 years of age and older in the household, regardless of their relation to the householder. Once income totals for all households are gathered, the median value is the data point at which exactly one-half of households have greater income and one-half of households have less income. The median value is based on the income distribution of all households, including those with no income.
How is it used? Median household income is a more useful measure of collective economic well-being than per capita income because it aggregates income levels within a basic unit of economic collaboration and decision making. Median income values are also less sensitive to fluctuations at the extreme high and low ends of a county’s earnings spectrum, and changes in median household income therefore signal changes within a wide range of earnings in a regional economy.
Median household income in Madera County fluctuated, but ultimately grew between 2007 and 2016. Overall, median household income in Madera County increased by nearly 12 percent between 2007 and 2016. Madera County consistently maintained a median household income $10,000-$20,000 less than California as a whole.
Median Household Income
$0
$10,000
$20,000
$30,000
$40,000
$50,000
$60,000
$70,000
$80,000
2007 2008 2009 2010 2011 2012 2013 2014 2015 2016
Median Household Income Madera CountyCalifornia
-10.0%-8.0%-6.0%-4.0%-2.0%0.0%2.0%4.0%6.0%8.0%
10.0%12.0%
2006-07
2007-08
2008-09
2009-10
2010-11
2011-12
2012-13
2013-14
2014-15
2015-16
Percent Change in MedianHousehold Income
Madera CountyCalifornia
2007 $44,259 $59,928 2008 $46,066 $61,017 2009 $42,769 $58,925 2010 $43,596 $57,664 2011 $44,795 $57,275 2012 $42,054 $58,322 2013 $41,223 $60,185 2014 $43,171 $61,927 2015 $46,593 $64,483 2016 $49,467 $67,715
Source: U.S. Department of Commerce, Bureau of the Census, Small Area Income and Poverty Estimates
Median Household Income (Nominal), Madera CountyYear County California

Page 27
What is it? The Census Bureau determines whether or not a family is in poverty using a series of income thresholds that vary by family size and composition. If a family’s total income is less than that family’s poverty threshold, then every person in that household is considered to be in poverty. Official poverty thresholds do not vary geographically, but are updated for inflation using the Consumer Price Index. Income thresholds are based on pre-tax earnings and do not include capital gains or noncash benefits such as Medicaid.
How is it used? The poverty rate is a very commonly used indicator of the overall economic health and well-being of a region. Despite their wide use, official poverty rates have notable shortcomings. For instance, because the thresholds that define poverty status only vary by family size and composition, and not by the underlying cost of living in a particular neighborhood or community (e.g., housing and insurance costs), they tend to either over- or underestimate the real level of economic hardship in a region.
Poverty rates in Madera County rose between 2007 and 2016. Madera County’s poverty rate was at its lowest at 16.9 percent in 2007 and its highest at 23.6 percent in 2011. Madera County’s poverty rates consistently remained higher than the statewide average between 2007 and 2016.
Poverty Rates
0.0%
5.0%
10.0%
15.0%
20.0%
25.0%
2007 2008 2009 2010 2011 2012 2013 2014 2015 2016
Poverty Rates Madera CountyCalifornia
2007 16.9% 12.4%2008 18.2% 13.3%2009 20.6% 14.2%2010 21.7% 15.8%2011 23.6% 16.6%2012 23.3% 17.0%2013 23.4% 16.8%2014 22.3% 16.4%2015 22.6% 15.4%2016 20.4% 14.4%
Source: U.S. Department of Commerce, Bureau of the Census, Small Area Income and Poverty Estimates
Poverty Rates, Madera CountyYear County California

Page 28
What is it? Fair market rent is defined by the U.S. Department of Housing and Urban Development as the price point where 40 percent of gross rents for typical, non-substandard housing units are below it and 60 percent of gross rents are above it. Gross rent is the sum of the rent paid to a landlord plus any utility costs incurred by the tenant. Fair market rent calculations typically exclude rents paid for public housing units, rental units built in the last 2 years, rental units considered substandard in quality, seasonal rentals, and rental units on 10 or more acres of land. Fair market rent does not include public housing costs to avoid skewing the distribution of rents downward.
How is it used? Fair market rent is an indicator of housing costs for poorer households in a county, and is used to determine whether families or individuals qualify for federal housing certificate and voucher programs and the amount of compensation they would receive. Because calculation of fair market rents incorporates the total distribution of gross rents within a region, it can also be a helpful indicator of overall housing costs, and, by extension, the general cost of living for that region.
Fair market rent in Madera County fluctuated between 2009 and 2018, but ultimately rose by a significant degree by 2018. Fair market rent in Madera County remained consistently 25-35 percent lower than the statewide average.
Fair Market Rent
$0$200$400$600$800
$1,000$1,200$1,400$1,600$1,800
2009 2010 2011 2012 2013 2014 2015 2016 2017 2018
Fair Market Rent, 2-Bedroom Units Madera CountyCalifornia
$0
$500
$1,000
$1,500
$2,000
$2,500
$3,000
2009 2010 2011 2012 2013 2014 2015 2016 2017 2018
Fair Market Rent, 4-Bedroom Units Madera CountyCalifornia
2009 $623 $654 $834 $1,213 $1,250
2010 $642 $674 $860 $1,250 $1,289
2011 $659 $691 $882 $1,282 $1,322
2012 $599 $629 $802 $1,166 $1,202
2013 $632 $636 $861 $1,251 $1,372
2014 $576 $580 $785 $1,140 $1,251
2015 $647 $651 $881 $1,280 $1,404
2016 $699 $704 $942 $1,368 $1,546
2017 $667 $672 $893 $1,278 $1,469
2018 $718 $723 $962 $1,361 $1,548Source: U.S. Department of Housing and Urban Development
Fair Market Rent, Madera CountyYear 0-Bedroom 1-Bedroom 2-Bedroom 3-Bedroom 4-Bedroom

Page 29
SOCIAL INDICATORS
In This Section:Leading Causes of Death ............................................. 30TANF-CalWORKs Caseload ........................................... 31Medi-Cal Caseload .......................................................... 32School Free and Reduced Meal Program ............... 33Educational Attainment ............................................... 34High School Dropout Rate .......................................... 35Graduates Eligible For UC and CSU Systems ......... 36Average SAT Scores ........................................................ 37English Learners Enrollment ....................................... 38Crime Rates ....................................................................... 39Voter Registration and Participation ....................... 41
Social indicators explain the capacity of community institutions and organizations to provide for adequate human health, education, safety and social participation. Effective social systems intensify human capacities for collective growth and improvement. Many of the included indicators are often referred to as “quality-of-life” measures because they include non-economic attributes that reflect the general health and well-being of community members. *Note: (D) Withheld disclosure of confidential health data.
Madera County crime rates rose gradually between 2007 and 2016, with the exceptions of 2009 and 2014. Madera County’s crime rates remained similar to statewide crime rates from 2007-2016. Voter registration rates in Madera County rose gradually from 2002-2016, but remained consistently lower than the statewide average throughout this time period. Causes of death in Madera County differed very little from the statewide averages except for slightly higher rates of death from Cirrhosis and Accidents.
The number of Temporary Assistance for Needy Families (TANF) and California Work Opportunity and Responsibility to Kids (CalWORKs) recipients in Madera County rose slightly between 2007 and 2016. Recipients of TANF/CalWorks per capita in Madera County remained 1-3 percent higher than the statewide average between 2007 and 2016. Between 2007 and 2016, the number of Medi-Cal beneficiaries in Madera County nearly doubled; seeing its greatest increase of over 8 percent in 2014. Madera County’s increase in Medi-Cal beneficiaries mirrors statewide changes throughout California; however, Medi-Cal beneficiaries have consistently made up a significantly larger percentage of Madera County’s population when compared to the statewide average.
When compared to the statewide average in 2016, Madera County had a high percentage of residents of the age of 18 or over who had completed some college but had not attained a degree. Madera County consistently maintained a percentage of high school dropouts roughly equivalent to the rest of California between 2006 and 2016. Overall, dropout rates in Madera County declined between 2006 and 2016. Conversely, the percentage of Madera County graduates eligible for the UC or CSU systems rose substantially, yet the percentage of Madera County graduates eligible for the UC or CSU systems remained roughly 10 percent lower than the percentage of eligible graduates statewide. SAT scores in Madera County steadily declined between 2006 and 2016. SAT scores in Madera County were consistently below the statewide average. Madera County maintained a higher percentage of students enrolled in free and reduced meal programs than the statewide average between 2008 and 2017. English Language Learner (ELL) enrollment in Madera County dropped by 1,403 students between 2007 and 2017. Throughout the period spanning 2007-2017 the percentage of Madera County students enrolled in ELL programs was fairly higher than the statewide average.

Page 30
What is it? This indicator lists the top ten most frequent causes of death for all county residents in 2016, and is derived from vital records data provided by the California Department of Public Health.
How is it used? Cause of death statistics provide important insights into the overall health of a region, and can be used by health care practitioners and social service providers to coordinate disease prevention and educational efforts. If death rates for preventable causes are greater than those for other counties in a region, this is indicative of a greater need for community health education. If death rates for environmentally influenced factors, such as cancer and influenza, are high, this may indicate the presence of systemic factors that need to be addressed.
Like the rest of California in 2016, Madera County’s leading causes of death were heart disease and cancer. Causes of death in Madera County differed very little from the statewide averages except for slightly higher rates of death from Cirrhosis and Accidents.
Leading Causes of Death
Heart Disease 21.4% 23.5%Cancer 21.0% 22.7%Stroke 6.7% 6.0%Pulmonary Disease 5.5% 5.2%Accidents 6.8% 5.0%Alzheimer’s 5.9% 5.9%Diabetes 3.1% 3.5%Pneumonia & Influenza 2.0% 2.3%Cirrhosis 2.8% 2.0%Suicide 1.3% 1.6%All other causes 23.6% 22.2%
Source: California Department of Public Health
Cause of Death as a Percentage of Total Deaths, 2016Cause of Death Madera County California
0.0%
5.0%
10.0%
15.0%
20.0%
25.0%
Hear
t Dise
ase
Canc
er
Stro
ke
Pulm
onary
Dise
ase
Accid
ents
Alzh
eimers
Diab
etes
Pneu
mon
ia &
Influ
enza
Cirrh
osis
Suici
de
All o
ther
caus
es
Leading Causes of Death as Percent of Total, 2016 Madera County California
All Causes 944 922 913 1,022 1,035 998 1,092 998 1,096 1,105 Heart Disease 221 268 248 254 274 266 273 225 246 236 Cancer 212 192 210 231 204 205 214 207 244 232 Stroke 58 37 42 46 67 62 60 54 69 74 Pulmonary Disease 53 67 53 63 56 59 64 61 56 61 Accidents 74 58 54 65 61 61 61 60 79 75 Alzheimer’s 37 33 38 43 70 36 64 58 70 65 Diabetes 36 27 21 21 20 25 26 33 31 34 Pneumonia & Influenza 17 33 24 21 24 19 28 19 23 22 Cirrhosis 18 23 20 22 20 24 23 40 29 31 Suicide 20 14 6 25 26 25 23 18 12 14 All other causes 198 280 197 231 213 216 256 223 237 261
Source: California Department of Public Health
Leading Causes of Death, Madera CountyCauses of Death 2007 2008 2009 2010 2011 2012 2013 2014 2015 2016
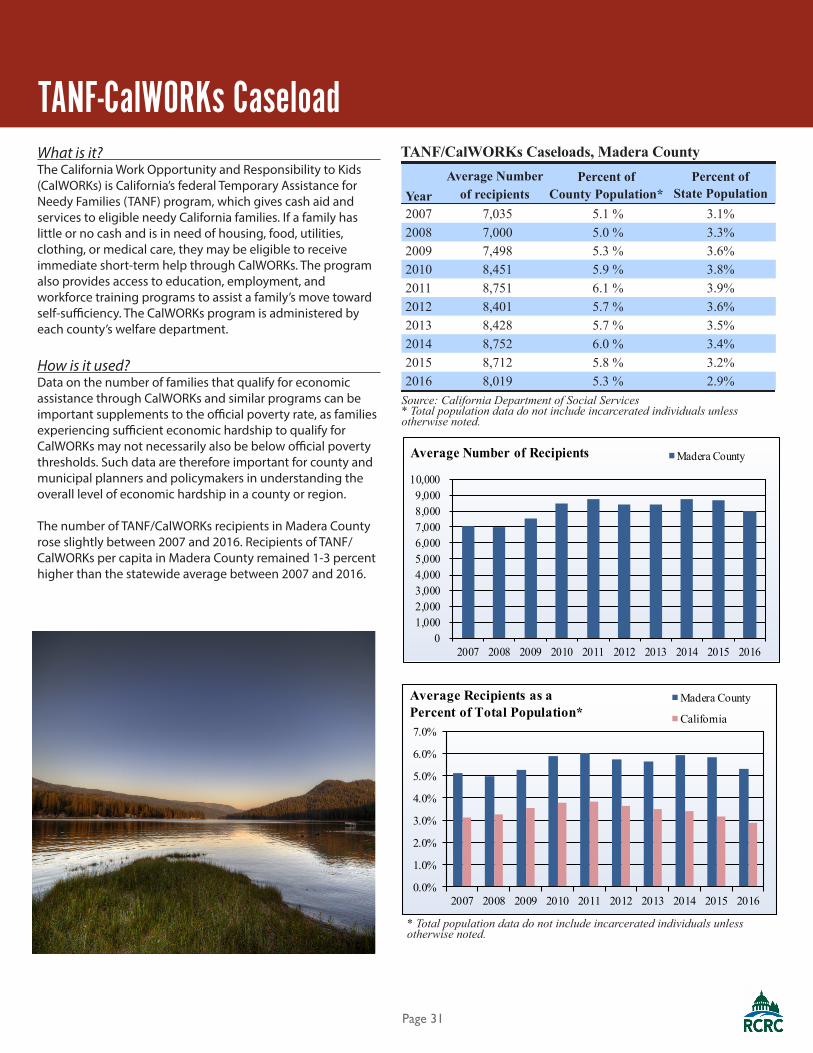
Page 31
What is it? The California Work Opportunity and Responsibility to Kids (CalWORKs) is California’s federal Temporary Assistance for Needy Families (TANF) program, which gives cash aid and services to eligible needy California families. If a family has little or no cash and is in need of housing, food, utilities, clothing, or medical care, they may be eligible to receive immediate short-term help through CalWORKs. The program also provides access to education, employment, and workforce training programs to assist a family’s move toward self-sufficiency. The CalWORKs program is administered by each county’s welfare department.
How is it used? Data on the number of families that qualify for economic assistance through CalWORKs and similar programs can be important supplements to the official poverty rate, as families experiencing sufficient economic hardship to qualify for CalWORKs may not necessarily also be below official poverty thresholds. Such data are therefore important for county and municipal planners and policymakers in understanding the overall level of economic hardship in a county or region.
The number of TANF/CalWORKs recipients in Madera County rose slightly between 2007 and 2016. Recipients of TANF/CalWORKs per capita in Madera County remained 1-3 percent higher than the statewide average between 2007 and 2016.
TANF-CalWORKs Caseload
2007 7,035 5.1 % 3.1%2008 7,000 5.0 % 3.3%2009 7,498 5.3 % 3.6%2010 8,451 5.9 % 3.8%2011 8,751 6.1 % 3.9%2012 8,401 5.7 % 3.6%2013 8,428 5.7 % 3.5%2014 8,752 6.0 % 3.4%2015 8,712 5.8 % 3.2%2016 8,019 5.3 % 2.9%
Source: California Department of Social Services* Total population data do not include incarcerated individuals unless otherwise noted.
TANF/CalWORKs Caseloads, Madera County
YearAverage Number
of recipientsPercent of
County Population*Percent of
State Population
0 1,000 2,000 3,000 4,000 5,000 6,000 7,000 8,000 9,000
10,000
2007 2008 2009 2010 2011 2012 2013 2014 2015 2016
Average Number of Recipients Madera County
0.0%
1.0%
2.0%
3.0%
4.0%
5.0%
6.0%
7.0%
2007 2008 2009 2010 2011 2012 2013 2014 2015 2016
Average Recipients as aPercent of Total Population*
Madera County
California
* Total population data do not include incarcerated individuals unless otherwise noted.

Page 32
What is it? Medi-Cal is California’s version for the federal Medicaid program, and offers access to free or low-cost health insurance for children and adults with limited resources or income. Common Medi-Cal recipients include low-income adults, families with children, seniors, persons with disabilities, pregnant women, children in foster care and former foster youth up to age 26.
How is it used? Data on Medi-Cal program recipients is helpful in determining the need for public medical assistance in a county. Similar to the CalWORKs caseload data, this indicator can also provide important insights into general economic hardship in a region by identifying needy individuals and families who may not be below official poverty thresholds.
Between 2007 and 2016, the number of Medi-Cal beneficiaries in Madera County nearly doubled; seeing its greatest increase of over 8 percent in 2014. Madera County’s increase in Medi-Cal beneficiaries mirrors statewide changes throughout California; however, Medi-Cal beneficiaries have consistently made up a significantly larger percentage of Madera County’s population when compared to the statewide average. The significant increases in the number of Medi-Cal beneficiaries in 2014, which occurred across California and within many counties, correlate with the first year of enrollment for health care benefits under the Affordable Care Act.
Medi-Cal Caseload
2007 36,966 26.9% 6,553,258 18.0%2008 38,327 27.4% 6,721,003 18.3%2009 40,726 28.8% 7,094,877 19.2%2010 43,341 30.3% 7,397,748 19.9%2011 45,597 31.5% 7,594,640 20.4%2012 45,875 31.4% 7,619,341 20.3%2013 50,174 34.1% 7,280,074 19.0%2014 62,796 42.7% 11,522,700 30.1%2015 68,833 44.5% 12,834,234 33.0%2016 70,003 47.0% 13,542,960 34.6%
Source: California Department of Healthcare Services* Total population data do not include incarcerated individuals unless otherwise noted.
Medi-Cal Users, Madera County
Year BeneficiariesPercentage of County
Total Population*CaliforniaCounty
BeneficiariesPercentage of California
Population
0.0%
10.0%
20.0%
30.0%
40.0%
50.0%
2007 2008 2009 2010 2011 2012 2013 2014 2015 2016
Medi-Cal Beneficiaries as Percent of Total Population*
Madera CountyCalifornia

Page 33
What is it? This indicator provides data on the number and proportion of K-12 students who are enrolled in a free or reduced school meal program. Families only have to claim a household income level that is below the given threshold to enroll their children in the program, and no evidence or auditing of family income is required. Thus, the indicator is an effective proxy for student poverty but does not necessarily reflect the true economic status of enrolled families. Students enrolled in this program are counted on Fall Census Day, which is the first Wednesday in October for each academic year.
How is it used? Enrollment data on free and reduced meal programs aid in the estimation of family economic assistance needs in a county. Enrollment totals and proportions can also be used to determine a school’s eligibility for receiving funding from official programs and grants intended to alleviate student poverty.
The percentage of Madera County students enrolled in free and reduced meal programs grew steadily between 2008 and 2017. Madera County maintained a higher percentage of students enrolled in free and reduced meal programs than the statewide average between 2008 and 2017. In 2013, when California witnessed a 10 percent drop in enrollment, enrollment in Madera County actually decreased by only 3.4 percent.
School Free and Reduced Meal Program
2008 18,820 29,544 63.7% 51.2%2009 16,014 29,794 53.7% 44.0%2010 21,257 29,303 72.5% 55.9%2011 22,021 30,559 72.1% 56.7%2012 22,124 29,343 75.4% 57.5%2013 21,945 30,484 72.0% 45.5%2014 23,913 30,864 77.5% 59.4%2015 24,216 30,868 78.5% 58.6%2016 24,127 31,079 77.6% 58.9%2017 24,427 31,471 77.6% 58.1%
Source: California Department of Education
School Free and Reduced Meals, Madera County
YearTotal Free and Reduced Meals CaliforniaCounty
Percent of StudentsTotal Enrollment
0.0%10.0%20.0%30.0%40.0%50.0%60.0%70.0%80.0%90.0%
2008 2009 2010 2011 2012 2013 2014 2015 2016 2017
County Percent of Students UsingFree and Reduced Meals Program
Madera CountyCalifornia
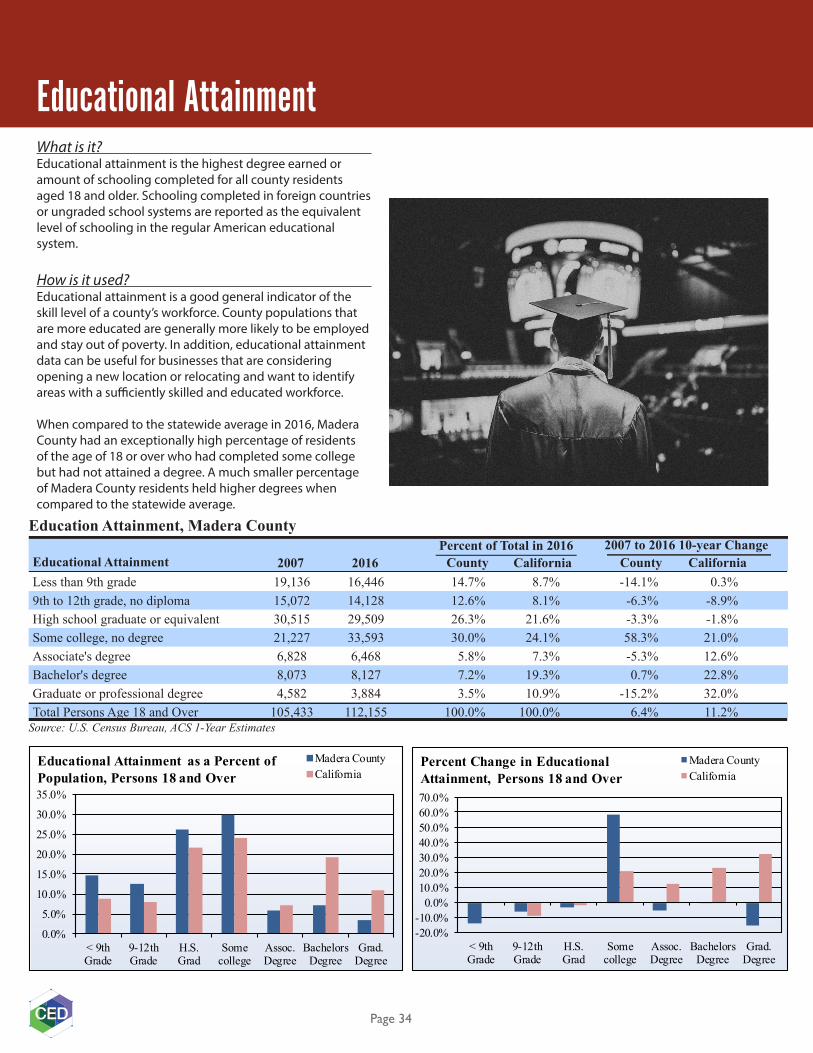
Page 34
What is it? Educational attainment is the highest degree earned or amount of schooling completed for all county residents aged 18 and older. Schooling completed in foreign countries or ungraded school systems are reported as the equivalent level of schooling in the regular American educational system.
How is it used? Educational attainment is a good general indicator of the skill level of a county’s workforce. County populations that are more educated are generally more likely to be employed and stay out of poverty. In addition, educational attainment data can be useful for businesses that are considering opening a new location or relocating and want to identify areas with a sufficiently skilled and educated workforce.
When compared to the statewide average in 2016, Madera County had an exceptionally high percentage of residents of the age of 18 or over who had completed some college but had not attained a degree. A much smaller percentage of Madera County residents held higher degrees when compared to the statewide average.
Educational Attainment
Less than 9th grade 19,136 16,446 14.7% 8.7% -14.1% 0.3%9th to 12th grade, no diploma 15,072 14,128 12.6% 8.1% -6.3% -8.9%High school graduate or equivalent 30,515 29,509 26.3% 21.6% -3.3% -1.8%Some college, no degree 21,227 33,593 30.0% 24.1% 58.3% 21.0%Associate's degree 6,828 6,468 5.8% 7.3% -5.3% 12.6%Bachelor's degree 8,073 8,127 7.2% 19.3% 0.7% 22.8%Graduate or professional degree 4,582 3,884 3.5% 10.9% -15.2% 32.0%Total Persons Age 18 and Over 105,433 112,155 100.0% 100.0% 6.4% 11.2%
Source: U.S. Census Bureau, ACS 1-Year Estimates
Education Attainment, Madera County
Educational Attainment 2007 2016 County California County CaliforniaPercent of Total in 2016 2007 to 2016 10-year Change
-20.0%-10.0%
0.0%10.0%20.0%30.0%40.0%50.0%60.0%70.0%
< 9thGrade
9-12thGrade
H.S.Grad
Somecollege
Assoc.Degree
BachelorsDegree
Grad.Degree
Percent Change in EducationalAttainment, Persons 18 and Over
Madera CountyCalifornia
0.0%
5.0%
10.0%
15.0%
20.0%
25.0%
30.0%
35.0%
< 9thGrade
9-12thGrade
H.S.Grad
Somecollege
Assoc.Degree
BachelorsDegree
Grad.Degree
Educational Attainment as a Percent of Population, Persons 18 and Over
Madera CountyCalifornia

Page 35
What is it? High school dropout rate data are calculated by the California Department of Education by adding each school’s number of dropouts from the 12th grade for the current year, from the 11th grade the previous year, from the 10th grade two years previous, and from the 9th grade three years previous, and then dividing by the total number of high school graduates for the current year.
How is it used? Data on high school dropouts indicate the capacity of county school systems to provide youth with a basic level of education and workforce training. Lower dropout rates are generally correlated with lower poverty rates and higher income levels, as employers frequently require a high school degree for most jobs.
Madera County consistently maintained a percentage of high school dropouts roughly equivalent the rest of California between 2006 and 2016. Overall, dropout rates in Madera County declined between 2006 and 2016. Madera County saw its lowest high school dropout rates of 2.1 percent in the 2015-2016 school year.
High School Dropout Rate
2006-07 603 7.0% 5.5%2007-08 386 4.4% 4.9%2008-09 384 4.4% 5.7%2009-10 341 3.9% 4.6%2010-11 373 4.1% 4.2%2011-12 342 3.8% 4.0%2012-13 377 4.1% 3.9%2013-14 333 3.6% 3.1%2014-15 255 2.8% 2.8%2015-16 198 2.1% 2.6%
Source: California Department of Education
High School Dropouts, Madera County
YearNumber of dropouts
1-yeardropout rate
CA 1-year dropout rate
0
100
200
300
400
500
600
700
2006-07
2007-08
2008-09
2009-10
2010-11
2011-12
2012-13
2013-14
2014-15
2015-16
Number of High School Dropouts Madera County
0.0%1.0%2.0%3.0%4.0%5.0%6.0%7.0%8.0%
2006-07
2007-08
2008-09
2009-10
2010-11
2011-12
2012-13
2013-14
2014-15
2015-16
High School Dropout Rate Madera CountyCalifornia

Page 36
What is it? This indicator provides data on the number of high school graduates who completed coursework that is required for admission by either the California State University or the University of California postsecondary education systems. These data were reported by individual public schools to the California Department of Education, and do not include information on other common requirements for college admission such as standardized test scores.
How is it used? These data are an important indicator of how well a county school system is preparing its students for higher-wage employment, as a college education is generally correlated with higher earnings from employment. Counties with a low proportion of eligible high school graduates may therefore exhibit greater competition for jobs in lower-wage sectors of the regional economy.
Between 2006 and 2016, the percentage of Madera County graduates eligible for the UC or CSU systems rose substantially. The percentage of Madera County graduates eligible for the UC or CSU systems remained roughly 10 percent lower than the percentage of eligible graduates statewide between 2006 and 2016.
Graduates Eligible For UC and CSU Systems
2006-07 293 19.2% 35.5%2007-08 395 24.1% 33.9%2008-09 415 25.7% 35.3%2009-10 417 25.7% 36.3%2010-11 562 33.1% 40.3%2011-12 472 25.9% 38.3%2012-13 567 31.5% 39.4%2013-14 593 32.0% 39.1%2014-15 592 30.7% 43.4%2015-16 602 30.9% 45.4%
Source: California Department of Education
Graduates Eligible for UC or CSU System, Madera County
Year Number CaliforniaMadera County
County Graduates CA Graduates
0
100
200
300
400
500
600
700
2006-07
2007-08
2008-09
2009-10
2010-11
2011-12
2012-13
2013-14
2014-15
2015-16
Graduates Eligible forUC or CSU System
Madera County
0.0%
10.0%
20.0%
30.0%
40.0%
50.0%
2006-07
2007-08
2008-09
2009-10
2010-11
2011-12
2012-13
2013-14
2014-15
2015-16
Percentage of County GraduatesEligible for UC or CSU System
Madera CountyCalifornia

Page 37
What is it? The SAT is designed to measure verbal and mathematical reasoning abilities that are related to successful performance in college. Like many standardized tests, however, SAT scores are most strongly correlated with socioeconomic status, since better-resourced students will generally have more preparatory options and resources. Sufficiently high SAT scores are a requirement for admission to most American colleges and universities, although the strong correlation with economic status has generated challenges to these requirements from many educators.
How is it used? SAT scores are usually treated as an indicator of academic performance and college readiness for children in local schools, except where an exceptionally low or high percentage of students took the test. Because scores are standardized, test results provide a baseline for comparing student performance across all regions of the country. However, their utility has been challenged due to the strong correlation between scores and socioeconomic status.
The average SAT scores in Madera County steadily declined between 2006 and 2016. SAT scores in Madera County were consistently below the statewide average. The proportion of students taking the SAT nearly doubled between the 2006-2007 and 2015-2016 school years.
Average SAT Scores
2006-07 17.8% 1,445 36.9% 1,497 2007-08 19.7% 1,448 35.9% 1,500 2008-09 17.9% 1,411 34.7% 1,502 2009-10 16.5% 1,424 33.3% 1,521 2010-11 21.6% 1,393 37.9% 1,502 2011-12 25.4% 1,375 39.3% 1,492 2012-13 26.5% 1,379 40.4% 1,489 2013-14 25.8% 1,358 41.1% 1,487 2014-15 33.3% 1,348 42.4% 1,473 2015-16 30.2% 1,337 43.5% 1,455
Source: California Department of Education *In newly released 2016 data, the method used to calculate average SAT scores has changed, and therefore is not directly comparable to previous year’s data.
Average SAT Scores* (out of 2,400), Madera County
YearPercent of Students
who took SATAverage
SAT Scores
Madera County CaliforniaPercent of Students
who took SATAverage
SAT Scores
1,200
1,250
1,300
1,350
1,400
1,450
1,500
1,550
2007 2008 2009 2010 2011 2012 2013 2014 2015 2016
Average SAT Scores* (out of 2,400) Madera County
California

What is it? This indicator provides data on the number of K-12 students enrolled in English language learning (ELL) programs, which were previously referred to as “English as a second language” (ESL) programs. The California Department of Education tabulates enrollment based on annual reports from individual school districts.
How is it used? ELL enrollment data can be an important indicator of international migration or internal migration of non-English-speaking populations into an area. The ability and willingness of non-English speakers to learn and use English is also commonly seen as indicative of their willingness to “assimilate” into the English-speaking community, and can therefore influence their access to jobs and community resources.
ELL enrollment in Madera County fell between 2007 and 2017, with the exception of the 2013-2014 and 2015-2016 school years. Overall, ELL enrollment in Madera County dropped by 1,403 students between 2007 and 2017. ELL enrollment in Madera County was at its highest in the 2007-2008 school year, and its lowest in the 2016-2017 school year. Throughout the period spanning 2007-2017 the percentage of Madera County students enrolled in ELL programs was consistently 2 to 5 percent higher than the state average
English Learners Enrollment
2007-08 9,139 -0.1% 29,544 30.9% 25.2%2008-09 8,854 -3.1% 29,794 29.7% 24.7%2009-10 8,356 -5.6% 29,303 28.5% 23.9%2010-11 8,178 -2.1% 30,559 26.8% 24.0%2011-12 7,843 -4.1% 30,308 25.9% 22.6%2012-13 7,795 -0.6% 30,478 25.6% 21.7%2013-14 8,490 8.9% 30,861 27.5% 22.7%2014-15 7,931 -6.6% 30,865 25.7% 21.5%2015-16 8,160 2.9% 31,077 26.3% 21.3%2016-17 7,736 -5.2% 31,468 24.6% 21.4%
Source: California Department of Education
English Language Learning Program Enrollment, Madera County
Year StudentsPercentage Change
in E.L.L. EnrollmentTotal EnrolledEnrolled E.L.L.Students K-12
CaliforniaMadera CountyPercent of EnrolledStudents in E.L.L.
Percent of Enrolled E.L.L Students
-8.0%-6.0%-4.0%-2.0%0.0%2.0%4.0%6.0%8.0%
10.0%
2007-08
2008-09
2009-10
2010-11
2011-12
2012-13
2013-14
2014-15
2015-16
2016-17
Percentage Change in EnglishLanguage Learning Program Enrollment Madera County
California
7,000
7,500
8,000
8,500
9,000
9,500
2007-08
2008-09
2009-10
2010-11
2011-12
2012-13
2013-14
2014-15
2015-16
2016-17
English Language LearningProgram Enrollment
Madera County
0.0%5.0%
10.0%15.0%20.0%25.0%30.0%35.0%
2007-08
2008-09
2009-10
2010-11
2011-12
2012-13
2013-14
2014-15
2015-16
2016-17
Percent of Students Enrolledin English Language Learning Program
Madera County California

What is it? This indicator provides data on property, violent, and total crime rates for Madera county. A county’s crime rate is the number of reported crimes per 1,000 residents. These data are reported by the California Department of Justice and reflect all misdemeanor and felony reports, but do not include reports for minor violations and infractions.
How is it used? The relative level of criminal activity in a county is a major factor in how residents perceive their quality of life. An area with a high crime rate is often seen as a much less attractive place to live than one with a low rate. However, crime rates are also dependent on other factors besides the actual incidence of criminal activity, such as the willingness of residents to report crimes to police and overall population density. Crime rates are also generally correlated with the spatial concentration of disadvantage, such as poverty and unemployment.
Madera County crime rates rose between 2008 and 2016, with the exception of 2009 and 2014. The total crime rate spiked considerably in 2011. Madera County’s crime rate was at its highest in 2013 when both the Madera County and California crime rates increased significantly.
Crime Rates
0
5
10
15
20
25
30
35
2007 2008 2009 2010 2011 2012 2013 2014 2015 2016
Total Crime Rateper 1,000 Population*
Madera County
California
2007 15.1 18.8 5.4 5.3 20.5 24.1 2008 15.2 18.0 5.3 5.1 20.5 23.0 2009 15.2 16.2 4.8 4.7 20.0 20.9 2010 16.1 15.8 4.6 4.4 20.7 20.2 2011 19.7 15.9 5.5 4.2 25.2 20.0 2012 19.8 17.2 6.4 4.3 26.2 21.5 2013 26.5 26.8 6.8 4.0 33.3 30.8 2014 23.0 24.8 6.0 4.0 29.0 28.7 2015 24.8 26.3 5.7 4.3 30.6 30.6 2016 24.9 25.5 6.9 4.2 31.8 29.7
Source: California Department of Justice, Criminal Justice Statistics Center* Total population data do not include incarcerated individuals unless otherwise noted.
Crime Rate per 1,000 Population*, Madera County
Year CaliforniaCountyProperty Crime Rate
CaliforniaCountyViolent Crime Rate
CaliforniaCountyTotal Crime Rate
* Total population data do not include incarcerated individuals unless otherwise noted.

Page 40
2007 1,078 506 489 2,073 2008 1,043 508 577 2,128 2009 1,166 520 458 2,144 2010 1,198 590 518 2,306 2011 1,628 574 642 2,844 2012 1,654 648 599 2,901 2013 1,454 550 773 2,777 2014 1,116 445 641 2,202 2015 1,110 532 706 2,348 2016 978 572 645 2,195
Source: California Department of Justice, Criminal Justice Statistics Center
Property Crimes, Madera County
Year BurglaryLarceny
TheftMotor Vehicle
TotalOver $400 2007 5 31 118 592 746 2008 10 37 185 512 744 2009 3 36 162 484 685 2010 10 49 129 466 654 2011 5 27 139 628 799 2012 2 35 139 758 934 2013 13 59 132 813 1,017 2014 9 36 99 742 886 2015 4 31 124 692 851 2016 7 41 124 842 1,014
Source: California Department of Justice, Criminal Justice Statistics Center
Violent Crimes, Madera County
Year HomicideAggravated
RapeForcible
TotalAssaultRobbery
0
5
10
15
20
25
30
2007 2008 2009 2010 2011 2012 2013 2014 2015 2016
Property Crime Rateper 1,000 Population*
Madera CountyCalifornia
012345678
2007 2008 2009 2010 2011 2012 2013 2014 2015 2016
Violent Crime Rateper 1,000 Population*
Madera CountyCalifornia
* Total population data do not include incarcerated individuals unless otherwise noted.
* Total population data do not include incarcerated individuals unless otherwise noted.

Page 41
What is it? This indicator provides data on the number of individuals who registered to vote and who participated in state and federal elections during major election years. Data for the previous (even) election year are collected and reported by the California Secretary of State every two (odd) years on February 10th.
How is it used? Voter registration in California is now built into many other social service processes, such as receiving a state driver’s license or identification, in order to promote enfranchisement and electoral participation. The differential between voter registration and participation is therefore a good indicator of how engaged a county population is with the overall electoral process. Large differences between the voting-age population and the number of registered/participating individuals may also indicate potential issues in accessing electoral resources and reaching local voting centers.
Voter registration rates in Madera County rose gradually from 2002-2016, but remained consistently lower than the statewide average throughout the time period. Madera County experienced an increase in voter participation between 2002 and 2016 that was slightly higher than the statewide average. Both Madera County and California as a whole experienced sizeable decreases in voter participation in 2014.
Voter Registration and Participation
2002 71,157 43,036 26,874 60.5% 62.4%2004 74,632 49,997 39,211 67.0% 78.4%2006 79,655 50,066 30,795 62.9% 61.5%2008 82,749 54,003 43,032 65.3% 79.7%2010 84,767 54,817 34,987 64.7% 63.8%2012 86,894 53,779 40,325 61.9% 75.0%2014 85,976 52,494 27,370 61.1% 52.1%2016 87,254 58,086 44,186 66.6% 76.1%Source: California Secretary of State, Elections Divisions
Voter Participation in General Elections, Madera County
YearEligible to Register
Registered Voters
Total Voters
Registration Rate
Participation Rate
0.0%10.0%20.0%30.0%40.0%50.0%60.0%70.0%80.0%90.0%
2002 2004 2006 2008 2010 2012 2014 2016
Voter Registration Rate Madera CountyCalifornia
0.0%10.0%20.0%30.0%40.0%50.0%60.0%70.0%80.0%90.0%
2002 2004 2006 2008 2010 2012 2014 2016
Voter Participation Rate Madera CountyCalifornia
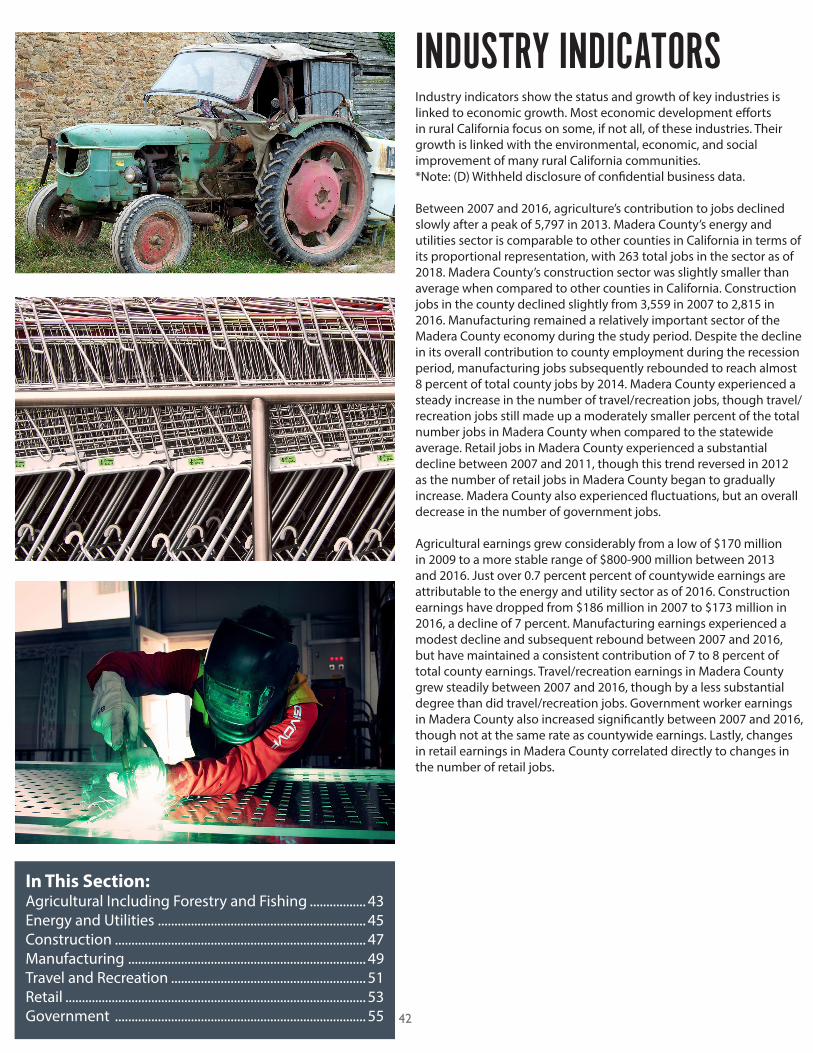
Page 42
In This Section:Agricultural Including Forestry and Fishing ................. 43Energy and Utilities ............................................................... 45Construction ............................................................................ 47Manufacturing ........................................................................ 49Travel and Recreation ........................................................... 51Retail ........................................................................................... 53Government ............................................................................ 55
INDUSTRY INDICATORSIndustry indicators show the status and growth of key industries is linked to economic growth. Most economic development efforts in rural California focus on some, if not all, of these industries. Their growth is linked with the environmental, economic, and social improvement of many rural California communities.*Note: (D) Withheld disclosure of confidential business data.
Between 2007 and 2016, agriculture’s contribution to jobs declined slowly after a peak of 5,797 in 2013. Madera County’s energy and utilities sector is comparable to other counties in California in terms of its proportional representation, with 263 total jobs in the sector as of 2018. Madera County’s construction sector was slightly smaller than average when compared to other counties in California. Construction jobs in the county declined slightly from 3,559 in 2007 to 2,815 in 2016. Manufacturing remained a relatively important sector of the Madera County economy during the study period. Despite the decline in its overall contribution to county employment during the recession period, manufacturing jobs subsequently rebounded to reach almost 8 percent of total county jobs by 2014. Madera County experienced a steady increase in the number of travel/recreation jobs, though travel/recreation jobs still made up a moderately smaller percent of the total number jobs in Madera County when compared to the statewide average. Retail jobs in Madera County experienced a substantial decline between 2007 and 2011, though this trend reversed in 2012 as the number of retail jobs in Madera County began to gradually increase. Madera County also experienced fluctuations, but an overall decrease in the number of government jobs.
Agricultural earnings grew considerably from a low of $170 million in 2009 to a more stable range of $800-900 million between 2013 and 2016. Just over 0.7 percent percent of countywide earnings are attributable to the energy and utility sector as of 2016. Construction earnings have dropped from $186 million in 2007 to $173 million in 2016, a decline of 7 percent. Manufacturing earnings experienced a modest decline and subsequent rebound between 2007 and 2016, but have maintained a consistent contribution of 7 to 8 percent of total county earnings. Travel/recreation earnings in Madera County grew steadily between 2007 and 2016, though by a less substantial degree than did travel/recreation jobs. Government worker earnings in Madera County also increased significantly between 2007 and 2016, though not at the same rate as countywide earnings. Lastly, changes in retail earnings in Madera County correlated directly to changes in the number of retail jobs.
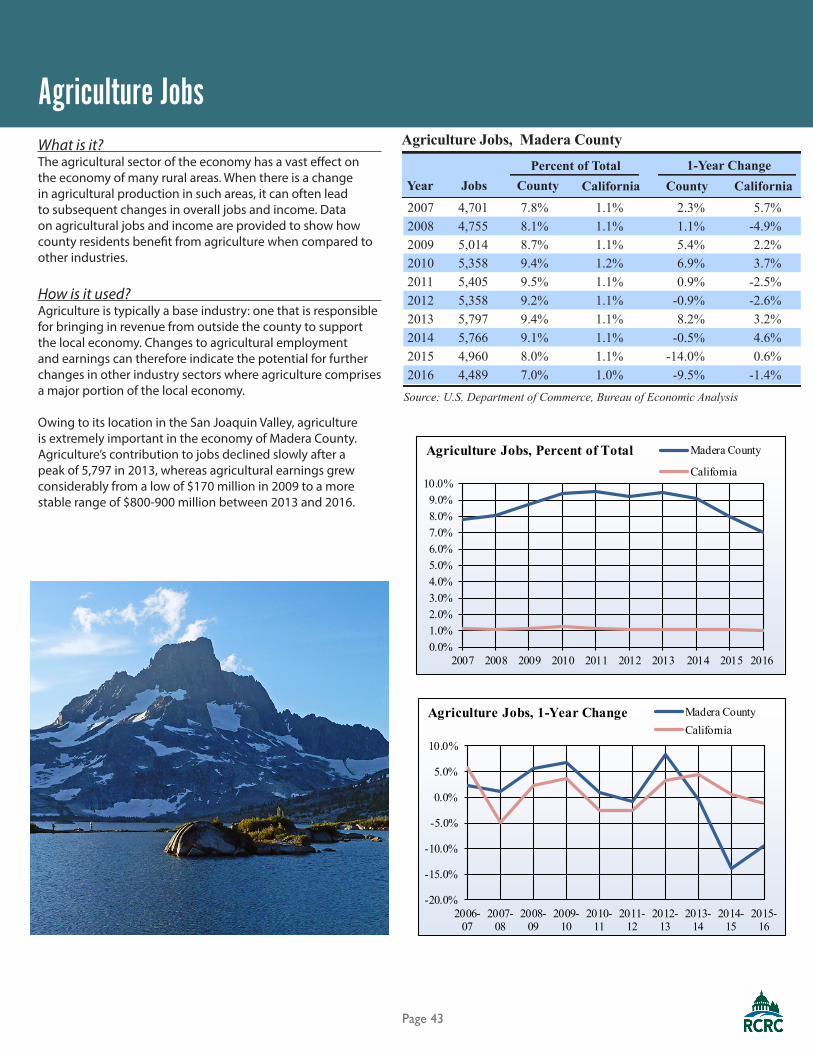
Page 43
What is it? The agricultural sector of the economy has a vast effect on the economy of many rural areas. When there is a change in agricultural production in such areas, it can often lead to subsequent changes in overall jobs and income. Data on agricultural jobs and income are provided to show how county residents benefit from agriculture when compared to other industries.
How is it used? Agriculture is typically a base industry: one that is responsible for bringing in revenue from outside the county to support the local economy. Changes to agricultural employment and earnings can therefore indicate the potential for further changes in other industry sectors where agriculture comprises a major portion of the local economy.
Owing to its location in the San Joaquin Valley, agriculture is extremely important in the economy of Madera County. Agriculture’s contribution to jobs declined slowly after a peak of 5,797 in 2013, whereas agricultural earnings grew considerably from a low of $170 million in 2009 to a more stable range of $800-900 million between 2013 and 2016.
Agriculture Jobs
2007 4,701 7.8% 1.1% 2.3% 5.7%2008 4,755 8.1% 1.1% 1.1% -4.9%2009 5,014 8.7% 1.1% 5.4% 2.2%2010 5,358 9.4% 1.2% 6.9% 3.7%2011 5,405 9.5% 1.1% 0.9% -2.5%2012 5,358 9.2% 1.1% -0.9% -2.6%2013 5,797 9.4% 1.1% 8.2% 3.2%2014 5,766 9.1% 1.1% -0.5% 4.6%2015 4,960 8.0% 1.1% -14.0% 0.6%2016 4,489 7.0% 1.0% -9.5% -1.4%
Source: U.S. Department of Commerce, Bureau of Economic Analysis
Agriculture Jobs, Madera County
Year Jobs CountyPercent of Total
California County1-Year Change
California
-20.0%
-15.0%
-10.0%
-5.0%
0.0%
5.0%
10.0%
2006-07
2007-08
2008-09
2009-10
2010-11
2011-12
2012-13
2013-14
2014-15
2015-16
Agriculture Jobs, 1-Year Change Madera CountyCalifornia
0.0%1.0%2.0%3.0%4.0%5.0%6.0%7.0%8.0%9.0%
10.0%
2007 2008 2009 2010 2011 2012 2013 2014 2015 2016
Agriculture Jobs, Percent of Total Madera County
California

Page 44
Agriculture Earnings
2007 $ 393,610 14.1 % 2.5% 36.8% 12.1%2008 $ 326,971 11.9 % 2.4% -16.9% -6.4%2009 $ 170,758 6.7 % 2.6% -47.8% 3.4%2010 $ 412,933 14.7 % 2.6% 141.8% 3.1%2011 $ 528,929 17.6 % 2.6% 28.1% 8.1%2012 $ 731,703 22.2 % 2.7% 38.3% 9.9%2013 $ 858,676 24.7 % 2.9% 17.4% 9.5%2014 $ 932,325 25.5 % 2.8% 8.6% 2.0%2015 $ 844,701 23.3 % 2.8% -9.4% 4.6%2016 $ 878,408 22.6 % 2.6% 4.0% -0.7%
Source: U.S. Department of Commerce, Bureau of Economic Analysis*Revised estimates for 2001-2014 were recently released by the BEA, therefore data may not be directly comparable to previous years.
Agriculture Earnings (in Thousands), Madera County
Year Earnings CountyPercent of Total
California County1-Year Change
CaliforniaCounty
-100.0%
-50.0%
0.0%
50.0%
100.0%
150.0%
200.0%
2007-08
2008-09
2009-10
2010-11
2011-12
2012-13
2013-14
2014-15
2016-17
Agriculture Earnings,1-Year Change
Madera CountyCalifornia
0.0%
5.0%
10.0%
15.0%
20.0%
25.0%
30.0%
2007 2008 2009 2010 2011 2012 2013 2014 2015 2016
Agriculture Earnings,Percent of Total
Madera CountyCalifornia

Page 45
Energy and Utilities JobsWhat is it? Energy and utilities jobs and earnings data are provided to demonstrate the degree to which county residents rely on and benefit from this industry.
How is it used? Like agriculture, energy and utilities often comprise a base industry in rural counties and are thus a valuable indicator of broader potential changes to a county economy.
Madera County’s utilities and energy sector was comparable to other counties in California in terms of its proportional representation. Just over 0.7 percent of industry earnings were attributable to the sector as of 2016, with 263 total jobs in the sector as of 2018. The number of jobs in the sector grew slowly, following statewide trends, while earnings peaked at $41 million in 2016.
2007 188 0.3% 0.5% 36.2% 5.0%2008 179 0.3% 0.5% -4.8% 12.6%2009 196 0.3% 0.6% 9.5% -1.8%2010 189 0.3% 0.6% -3.6% 0.4%2011 189 0.3% 0.6% 0.0% 0.1%2012 229 0.4% 0.6% 21.2% 13.5%2013 268 0.5% 0.6% 17.0% 1.3%2014 285 0.5% 0.6% 6.3% 1.7%2015 252 0.4% 0.6% -11.6% -9.3%2016 263 0.4% 0.5% 4.4% 0.0%
Source: U.S. Department of Commerce, Bureau of Economic Analysis
Energy and Utilities Jobs, Madera County
YearCounty
Jobs CountyPercent of Total
California County1-Year Change
California
-20.0%
-10.0%
0.0%
10.0%
20.0%
30.0%
40.0%
2006-07
2007-08
2008-09
2009-10
2010-11
2011-12
2012-13
2013-14
2014-15
2015-16
Energy and Utilities Jobs,1-Year Change
Madera County
California
0.0%
0.1%
0.2%
0.3%
0.4%
0.5%
0.6%
0.7%
2007 2008 2009 2010 2011 2012 2013 2014 2015 2016
Energy and Utilities Jobs,Percent of Total
Madera County
California

Page 46
Energy and Utilities Earnings
2007 $20,384 0.5% 0.7% 45.6% -3.2%2008 $20,259 0.5% 0.8% -0.6% 13.0%2009 $21,606 0.6% 0.7% 6.6% -19.3%2010 $22,866 0.5% 0.7% 5.8% 3.9%2011 $24,143 0.5% 0.7% 5.6% 10.5%2012 $28,381 0.6% 0.7% 17.6% 4.8%2013 $35,555 0.7% 0.8% 25.3% 8.7%2014 $40,996 0.8% 0.7% 15.3% 1.5%2015 $40,474 0.7% 0.7% -1.3% 1.5%2016 $41,234 0.7% 0.6% 1.9% -6.8%
Source: U.S. Department of Commerce, Bureau of Economic Analysis
Energy and Utilities Earnings (in Thousands), Madera County
YearCounty
Earnings CountyPercent of Total
California County1-Year Change
California
-30.0%-20.0%-10.0%
0.0%10.0%20.0%30.0%40.0%50.0%
2006-07
2007-08
2008-09
2009-10
2010-11
2011-12
2012-13
2013-14
2014-15
2015-16
Energy and Utilities Earnings,1-Year Change
Madera CountyCalifornia
0.0%0.1%0.2%0.3%0.4%0.5%0.6%0.7%0.8%0.9%
2007 2008 2009 2010 2011 2012 2013 2014 2015 2016
Energy and Utilities Earnings,Percent of Total
Madera CountyCalifornia

Page 47
What is it? Construction jobs and earnings data are provided to demonstrate the degree to which county residents rely on and benefit from this industry.
How is it used? Construction is often a leading indicator of economic growth, as the industry creates new and improved infrastructure for homes, businesses, and community and government institutions. Furthermore, the construction industry provides employment for a large number of blue-collar workers and generally does not require high educational attainment for entry-level employment.
Madera County’s construction sector was slightly smaller than average when compared to other counties in California. Construction jobs in the county declined slightly over the past ten years in line with changes statewide: from 3,559 in 2007 to 2,815 in 2016. Construction earnings also dropped from $186 million in 2007 to $173 million in 2016, a decline of 7 percent.
Construction Jobs
2007 3,559 5.9% 6.0% -15.1% -3.2%2008 2,986 5.1% 5.5% -16.1% -9.6%2009 2,498 4.3% 4.8% -16.3% -15.6%2010 2,150 3.8% 4.4% -13.9% -8.1%2011 1,949 3.4% 4.3% -9.3% -0.6%2012 2,028 3.5% 4.4% 4.1% 4.9%2013 2,138 3.5% 4.5% 5.4% 6.0%2014 2,271 3.6% 4.6% 6.2% 4.4%2015 2,606 4.2% 4.7% 14.8% 5.8%2016 2,815 4.4% 4.7% 8.0% 3.3%
Source: U.S. Department of Commerce, Bureau of Economic Analysis
Construction Jobs, Madera County
YearCounty
Jobs CountyPercent of Total
California County1-Year Change
California
0.0%
1.0%
2.0%
3.0%
4.0%
5.0%
6.0%
7.0%
2007 2008 2009 2010 2011 2012 2013 2014 2015 2016
Construction Jobs,Percent of Total
Madera CountyCalifornia
-20.0%-15.0%-10.0%-5.0%0.0%5.0%
10.0%15.0%20.0%
2006-07
2007-08
2008-09
2009-10
2010-11
2011-12
2012-13
2013-14
2014-15
2015-16
Construction Jobs,1-Year Change
Madera CountyCalifornia

Page 48
2007 $186,522 6.7% 6.8% -12.5% -7.7%2008 $162,963 5.9% 5.6% -12.6% -16.7%2009 $150,303 5.9% 5.0% -7.8% -15.5%2010 $150,985 5.4% 4.6% 0.5% -4.5%2011 $130,140 4.3% 4.2% -13.8% -3.0%2012 $109,665 3.3% 4.4% -15.7% 9.3%2013 $124,600 3.6% 4.7% 13.6% 11.2%2014 $126,325 3.5% 4.9% 1.4% 7.8%2015 $145,103 4.0% 5.1% 14.9% 11.8%2016 $173,479 4.5% 5.3% 19.6% 8.6%
Source: U.S. Department of Commerce, Bureau of Economic Analysis
Construction Earnings (in Thousands), Madera County
YearCounty
Earnings CountyPercent of Total
California County1-Year Change
California
0.0%1.0%2.0%3.0%4.0%5.0%6.0%7.0%8.0%
2007 2008 2009 2010 2011 2012 2013 2014 2015 2016
Construction Earnings,Percent of Total
Madera CountyCalifornia
-20.0%-15.0%-10.0%-5.0%0.0%5.0%
10.0%15.0%20.0%25.0%
2006-07
2007-08
2008-09
2009-10
2010-11
2011-12
2012-13
2013-14
2014-15
2015-16
Construction Earnings,1-Year Change
Madera CountyCalifornia
Construction Earnings

Page 49
What is it? Manufacturing is the mechanical, physical, or chemical transformation of materials, substances, or components into new products, and encompasses a wide variety of specific processes and inputs. Manufacturing jobs and earnings data are provided to demonstrate the degree to which county residents rely on and benefit from this industry.
How is it used? Manufacturing is usually an economic base industry, making it an important indicator of changes to a county’s economy. Counties that have a solid manufacturing base of export goods benefit from the outside revenue that these businesses bring into the county.
Manufacturing remained a relatively important sector of the Madera County economy during the study period. Despite the decline in its overall contribution to county employment during the recession period, manufacturing jobs subsequently rebounded to reach almost 8 percent of total county jobs by 2014. Manufacturing earnings also experienced a modest decline and subsequent rebound between 2007 and 2016, but have maintained a more consistent contribution of 7 to 8 percent of total county earnings.
Manufacturing Jobs
2007 3,646 6.1% 7.4% 0.4% -0.4%2008 3,555 6.0% 7.3% -2.5% -1.8%2009 3,276 5.7% 6.9% -7.8% -3.0%2010 3,147 5.5% 6.8% -3.9% -8.4%2011 3,307 5.8% 6.6% 5.1% -2.7%2012 3,730 6.4% 6.5% 12.8% -0.3%2013 4,279 6.9% 6.3% 14.7% 0.8%2014 4,781 7.6% 6.3% 11.7% 0.6%2015 3,934 6.4% 6.2% -17.7% 2.3%2016 3,850 6.0% 6.1% -2.1% 1.1%
Source: U.S. Department of Commerce, Bureau of Economic Analysis
Manufacturing Jobs, Madera County
YearCounty
Jobs CountyPercent of Total
California County1-Year Change
California
0.0%1.0%2.0%3.0%4.0%5.0%6.0%7.0%8.0%
2007 2008 2009 2010 2011 2012 2013 2014 2015 2016
Manufacturing Jobs,Percent of Total
Madera CountyCalifornia
-20.0%-15.0%-10.0%-5.0%0.0%5.0%
10.0%15.0%20.0%
2006-07
2007-08
2008-09
2009-10
2010-11
2011-12
2012-13
2013-14
2014-15
2015-16
Manufacturing Jobs,1-Year Change
Madera CountyCalifornia

Page 50
0.0%
2.0%
4.0%
6.0%
8.0%
10.0%
12.0%
2007 2008 2009 2010 2011 2012 2013 2014 2015 2016
Manufacturing Earnings,Percent of Total
Madera CountyCalifornia
-15.0%
-10.0%
-5.0%
0.0%
5.0%
10.0%
15.0%
20.0%
2006-07
2007-08
2008-09
2009-10
2010-11
2011-12
2012-13
2013-14
2014-15
2015-16
Manufacturing Earnings,1-Year Change
Madera CountyCalifornia
2007 $210,771 7.6% 10.5% 5.4% 2.0%2008 $216,044 7.9% 10.3% 2.5% -1.6%2009 $196,713 7.7% 9.9% -8.9% -7.9%2010 $195,727 7.0% 9.8% -0.5% 1.9%2011 $215,278 7.2% 9.6% 10.0% 3.8%2012 $251,348 7.6% 9.5% 16.8% 4.0%2013 $260,956 7.5% 9.3% 3.8% 1.1%2014 $273,888 7.5% 9.4% 5.0% 5.7%2015 $274,449 7.6% 9.2% 0.2% 4.6%2016 $270,995 7.0% 9.2% -1.3% 4.0%
Source: U.S. Department of Commerce, Bureau of Economic Analysis
Manufacturing Earnings (in Thousands), Madera County
YearCounty
Earnings CountyPercent of Total
California County1-Year Change
California
Manufacturing Earnings

Page 51
What is it? This indicator presents data on jobs and earnings within the travel and recreation industry provided by the U.S. Department of Commerce.
How is it used? Visitor-serving industries are often an important economic base industry because they attract spending from outside of the area. This makes travel and recreation industry performance an important local economic indicator. Because the industry is generally dependent on others’ discretionary income levels, travel and recreation jobs and earnings are often more sensitive to economic downturns or recessions than those in other base industries.
Between 2007 and 2016, Madera County experienced a steady increase in the number of travel/recreation jobs. Travel/recreation jobs made up a moderately smaller percent of the total number jobs in Madera County when compared to the statewide average. Travel/recreation earnings in Madera County also grew steadily between 2007 and 2016, though by a less substantial degree.
Travel and Recreation Jobs
-6.0%
-4.0%
-2.0%
0.0%
2.0%
4.0%
6.0%
8.0%
2007-08
2008-09
2009-10
2010-11
2011-12
2012-13
2013-14
2014-15
2015-16
Travel and Recreation Jobs,1-Year Change
Madera CountyCalifornia
0.0%
2.0%
4.0%
6.0%
8.0%
10.0%
12.0%
2007 2008 2009 2010 2011 2012 2013 2014 2015 2016
Travel and Recreation Jobs,Percent of Total
Madera CountyCalifornia
2007 3,330 5.5% 9.3% -0.7% 2.8%2008 3,478 5.9% 9.5% 4.4% 0.9%2009 3,330 5.8% 9.6% -4.3% -3.6%2010 3,269 5.7% 9.7% -1.8% 0.5%2011 3,251 5.7% 9.7% -0.6% 2.5%2012 3,429 5.9% 9.9% 5.5% 3.4%2013 3,619 5.9% 9.9% 5.5% 4.5%2014 3,772 6.0% 10.0% 4.2% 4.0%2015 4,000 6.5% 10.2% 6.0% 4.9%2016 4,062 6.3% 10.3% 1.6% 3.1%
Source: U.S. Department of Commerce, Bureau of Economic Analysis
Travel and Recreation Jobs, Madera County
YearCounty
Jobs CountyPercent of Total
California County1-Year Change
California

Page 52
0.0%
1.0%
2.0%
3.0%
4.0%
5.0%
6.0%
2007 2008 2009 2010 2011 2012 2013 2014 2015 2016
Travel and Recreation Earnings,Percent of Total
Madera CountyCalifornia
2007 $ 66,001 2.4% 5.0% -3.7% 2.5%2008 $ 71,047 2.6% 5.0% 7.6% 0.4%2009 $ 61,271 2.4% 4.8% -13.8% -7.2%2010 $ 61,674 2.2% 4.8% 0.7% 2.1%2011 $ 65,208 2.2% 4.8% 5.7% 6.4%2012 $ 82,113 2.5% 5.0% 25.9% 8.8%2013 $ 87,242 2.5% 5.0% 6.2% 4.3%2014 $ 95,277 2.6% 5.3% 9.2% 10.6%2015 $ 102,985 2.8% 5.4% 8.1% 8.5%2016 $ 107,539 2.8% 5.5% 4.4% 7.0%
Source: U.S. Department of Commerce, Bureau of Economic Analysis
Travel and Recreation Earnings (in Thousands), Madera County
YearCounty
Earnings CountyPercent of Total
California County1-Year Change
California
Travel and Recreation Earnings
-20.0%
-10.0%
0.0%
10.0%
20.0%
30.0%
2006-07
2007-08
2008-09
2009-10
2010-11
2011-12
2012-13
2013-14
2014-15
2015-16
Travel and Recreation Earnings,1-Year Change
Madera County
California

Page 53
What is it? Retail jobs and earnings data are provided to demonstrate the degree to which county residents rely on and benefit from this industry.
How is it used? The bulk of most retail sales are made to individuals who are living within the local area, as opposed to those visiting from outside the area. Retail activity is traditionally most impacted by changes in base industries like agriculture and manufacturing, and can thus serve as an indicator of change in these sectors. Retail is also one of the largest industry sectors in many local economies.
Between 2007 and 2011, Madera County experienced a substantial decline in the number of retail jobs. This trend reversed in 2012 as the number of retail jobs in Madera County began to gradually increase. Retail jobs made up a slightly smaller percent of the total of number jobs in Madera County when compared to the statewide average. Changes in retail earnings in Madera County correlated directly to changes in the number of retail jobs.
Retail Jobs
2007 5,298 8.8% 10.1% 0.3% 0.5%2008 5,082 8.6% 9.9% -4.1% -3.3%2009 4,941 8.6% 9.6% -2.8% -6.1%2010 4,743 8.3% 9.6% -4.0% -0.8%2011 4,620 8.1% 9.5% -2.6% 1.0%2012 4,653 8.0% 9.5% 0.7% 1.6%2013 4,799 7.8% 9.3% 3.1% 2.1%2014 4,869 7.7% 9.2% 1.5% 2.1%2015 5,115 8.3% 9.2% 5.1% 2.4%2016 5,152 8.0% 9.1% 0.7% 1.0%
Source: U.S. Department of Commerce, Bureau of Economic Analysis
Retail Jobs, Madera County
YearCounty
Jobs CountyPercent of Total
California County1-Year Change
California
0.0%
2.0%
4.0%
6.0%
8.0%
10.0%
12.0%
2007 2008 2009 2010 2011 2012 2013 2014 2015 2016
Retail Jobs,Percent of Total
Madera CountyCalifornia
-8.0%
-6.0%
-4.0%
-2.0%
0.0%
2.0%
4.0%
6.0%
2006-07
2007-08
2008-09
2009-10
2010-11
2011-12
2012-13
2013-14
2014-15
2015-16
Retail Jobs,1-Year Change
Madera CountyCalifornia

Page 54
-15.0%
-10.0%
-5.0%
0.0%
5.0%
10.0%
2006-07
2007-08
2008-09
2009-10
2010-11
2011-12
2012-13
2013-14
2014-15
2015-16
Retail Earnings,1-Year Change
Madera CountyCalifornia
0.0%1.0%2.0%3.0%4.0%5.0%6.0%7.0%8.0%
2007 2008 2009 2010 2011 2012 2013 2014 2015 2016
Retail Earnings,Percent of Total
Madera CountyCalifornia
2007 $ 194,526 7.0 % 6.8 % - 2.7 % - 0.9 % 2008 $ 170,290 6.2 % 6.1 % - 12.5 % - 9.7 % 2009 $ 175,557 6.8 % 6.0 % 3.1 % - 5.8 % 2010 $ 165,353 5.9 % 5.9 % - 5.8 % 1.8 % 2011 $ 163,889 5.5 % 5.9 % - 0.9 % 4.4 % 2012 $ 159,904 4.9 % 5.9 % - 2.4 % 5.6 % 2013 $ 161,280 4.6 % 5.8 % 0.9 % 2.4 % 2014 $ 163,975 4.5 % 5.8 % 1.7 % 4.1 % 2015 $ 173,390 4.8 % 5.7 % 5.7 % 4.8 % 2016 $ 180,235 4.6 % 5.5 % 3.9 % 1.5 %
Source: U.S. Department of Commerce, Bureau of Economic Analysis
Retail Earnings (in Thousands), Madera County
YearCounty
Earnings CountyPercent of Total
California County1-Year Change
California
Retail Earnings

Page 55
What is it? Government jobs and income are provided to demonstrate the degree to which county residents rely on and benefit from this industry.
How is it used? Because government institutions often comprise a large portion of the local economy, especially in rural counties, increases or decreases in government spending can have a direct impact on the county economy.
Between 2007 and 2016, Madera County experienced fluctuations, but an overall decrease in the number of government jobs. Government jobs made up a significantly higher percent of the total number of jobs in Madera County when compared to the statewide average, due largely to the presence of a Native American casino and two state prisons in the county. Government worker earnings in Madera County increased significantly between 2007 and 2016, though not at the same rate as countywide earnings.
Government Jobs
0.0%
5.0%
10.0%
15.0%
20.0%
25.0%
2007 2008 2009 2010 2011 2012 2013 2014 2015 2016
All Government Jobs,Percent of Total
Madera CountyCalifornia
-6.0%-4.0%-2.0%0.0%2.0%4.0%6.0%8.0%
10.0%12.0%14.0%
2006-07
2007-08
2008-09
2009-10
2010-11
2011-12
2012-13
2013-14
2014-15
2015-16
All Government Jobs,1-Year Change
Madera CountyCalifornia
2007 11,281 18.8% 13.0% 6.2% 1.7%2008 11,734 19.9% 13.0% 4.0% 1.5%2009 11,622 20.2% 13.3% -1.0% -0.9%2010 11,174 19.5% 13.7% -3.9% -1.6%2011 10,678 18.7% 13.6% -4.4% -2.7%2012 10,302 17.6% 13.0% -3.5% -1.0%2013 10,026 16.3% 12.6% -2.7% -0.1%2014 10,191 16.1% 12.1% 1.6% 1.1%2015 9,669 15.6% 11.9% -5.1% 2.6%2016 10,769 16.8% 11.9% 11.4% 2.5%
Source: U.S. Department of Commerce, Bureau of Economic Analysis
All Government Worker Jobs, Madera County
YearCounty
Jobs CountyPercent of Total
California County1-Year Change
California
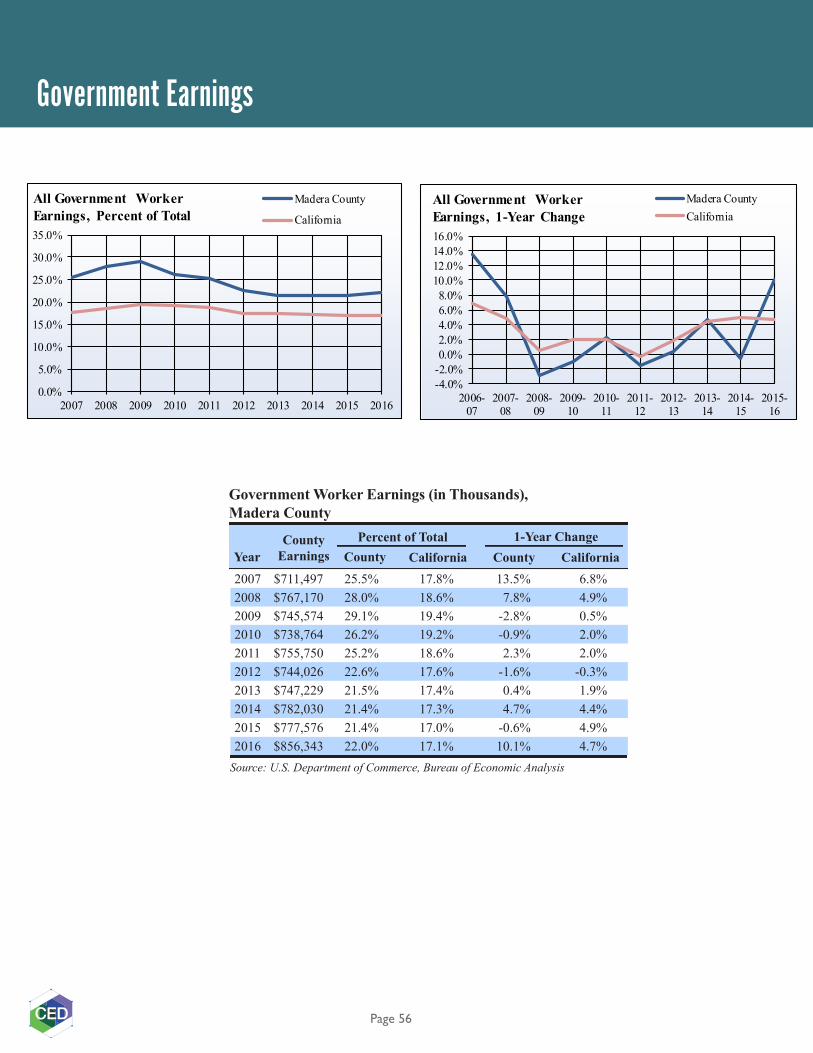
Page 56
0.0%
5.0%
10.0%
15.0%
20.0%
25.0%
30.0%
35.0%
2007 2008 2009 2010 2011 2012 2013 2014 2015 2016
All Government WorkerEarnings, Percent of Total
Madera County
California
Government Earnings
-4.0%-2.0%0.0%2.0%4.0%6.0%8.0%
10.0%12.0%14.0%16.0%
2006-07
2007-08
2008-09
2009-10
2010-11
2011-12
2012-13
2013-14
2014-15
2015-16
All Government Worker Earnings, 1-Year Change
Madera CountyCalifornia
2007 $711,497 25.5% 17.8% 13.5% 6.8%2008 $767,170 28.0% 18.6% 7.8% 4.9%2009 $745,574 29.1% 19.4% -2.8% 0.5%2010 $738,764 26.2% 19.2% -0.9% 2.0%2011 $755,750 25.2% 18.6% 2.3% 2.0%2012 $744,026 22.6% 17.6% -1.6% -0.3%2013 $747,229 21.5% 17.4% 0.4% 1.9%2014 $782,030 21.4% 17.3% 4.7% 4.4%2015 $777,576 21.4% 17.0% -0.6% 4.9%2016 $856,343 22.0% 17.1% 10.1% 4.7%
Source: U.S. Department of Commerce, Bureau of Economic Analysis
Government Worker Earnings (in Thousands), Madera County
YearCounty
Earnings CountyPercent of Total
California County1-Year Change
California

Page 57
PHOTO CREDITSThe Center for Economic Development would like to thank the contributors of the photos. Many of the photos were cropped in the making of this booklet. If you would like to find out where the photos originated, please contact the Center for Economic Development at 530-898-4598.
Dion Hinchcliffe, Front Cover
Bottom photo, Tiago Muraro, Page 1
David Prasad, Page 3
Arkansas Highways, Page 4
Phillip Kendall, Page 6
Middle photo, mookitty, Page 8
_quintin_, Page 13
Top photo, Blogs Mcgill, middle photo, Ian Muttoo, bottom photo, Sharon McCutcheon, Page 14
Ben Laufer, Page 27
Top photo, Becca Tapert, Bottom photo, Becca Tarter, Page 29
Ben Ferenchak, Page 31
U.S. Department of Agriculture, Page 33
Cole Keister, Page 34
David Prasad, Page 35
Jessica Ruscello, Page 36
Mst7022, Page 37
Tom Hilton, Page 39
David Prasad, Page 40
Jan Hrdina, Page 42
Marty B, Page 43
David Prasad, Page 45
Igor Ovsyannykov, Page 47
Top middle, Matthew Hamilton, bottom middle, David Noe, Page 48
Igor Ovsyannykov, Page 50
David Prasad, Page 53
Matthew E. Cohen, Page 55
Bryce Edwards, Back Cover

Page 58