Macroecological patterns of species distribution, composition and richness of the Azorean...
14
Ecologi@, N.º 1, Janeiro – Abril 2011 ISSN: 1647-2829 http://speco.fc.ul.pt/revistaecologia.html 22 Artigos Científicos Macroecological patterns of species distribution, composition and richness of the Azorean terrestrial biota Paulo A. V. Borges 1 , Pedro Cardoso 1,2 , Regina Cunha 3 , Rosalina Gabriel 1 , Vítor Gonçalves 3 , Joaquín Hortal 1,4 , António Frias Martins 3 , Ireneia Melo 5 , Pedro Rodrigues 3 , Ana M. C. Santos 1 , Luís Silva 3 , Kostas A. Triantis 1,6 , Paulo Vieira 7 & Virgílio Vieira 1,8 1 Azorean Biodiversity Group (CITA-A), Departamento de Ciências Agrárias, Universidade dos Açores, Terra-Chã, 9701-851 Angra do Heroísmo, Portugal 2 Smithsonian Institution, National Museum of Natural History, PO Box 37012, MRC 105, Room E-509, Washington, DC 20013-7012, USA 3 CIBIO-Azores, Departamento de Biologia, Universidade dos Açores, Rua da Mãe de Deus, PT- 9501-801 Ponta Delgada, S. Miguel, Açores, Portugal 4 Dep. Biodiversidad y Biología Evolutiva, Museo Nacional de Ciencias Naturales (CSIC). C/ José Gutiérrez Abascal, 2. 28006, Madrid, Spain 5 Jardim Botânico, Museu Nacional de História Natural, Universidade de Lisboa, Centro de Biologia Ambiental, R. da Escola Politécnica, 58, 1250-102, Lisboa, Portugal 6 Biodiversity Research Group, Oxford University Centre for the Environment, South Parks Road, Oxford, OX1 3QY, UK . 7 NemaLab/ICAM, Dept. de Biologia, Universidade de Évora, 7002-554 Évora, Portugal 8 Universidade dos Açores, Departamento de Biologia, Rua de S. Gonçalo, Apartado 1422, 9501-801 Ponta Delgada, Açores, Portugal We investigate the macroecological patterns of the terrestrial biota of the Azorean archipelago, namely the species-range size distributions, the distance decay of similarity, and the island species–area relationship (ISAR). We use the most recent up-to-date checklists to describe the diversity at the island level for nine groups (Lichens, Fungi, Diatoms, Bryophytes, Vascular Plants, Nematodes, Molluscs, Arthropods, Vertebrates). The particularities of the Azorean biota result in some differences to the patterns commonly found in other oceanic archipelagos. Strikingly, bryophytes, molluscs and vertebrates show a bimodal species-range size distribution, and vascular plants a right unimodal distribution due the high numbers of widespread species. Such high compositional homogeneity between islands also results in non-significant or even negative decays of similarity with distance among islands for most groups. Dispersal ability, together with other particular characteristics of each taxon, also shapes these distributions, as well as the relationships between island species richness, and area and time. Strikingly, the degree of departure of the richness of the whole archipelago from the SAR of its constituent islands largely depends on the dispersal ability of each group. Comparative studies with other oceanic archipelagos of the globe are however needed to understand the biogeographical and evolutionary processes shaping the remarkably low diversity of the Azorean biota. Keywords: Azores, island biogeography, Macroecology, species-range size distribution, distance decay of similarity, species–area relationship, island age, dispersal ability, terrestrial biota. 1. Introduction Macroecology is a recent field of ecology devoted to the study of the patterns of species distribution, abundance and richness at large spatial and temporal scales (Brown & Maurer, 1989; Gaston, 1994, 2003; Brown, 1995; Lawton, 1999, 2000; Maurer, 1999; Gaston & Blackburn, 2000). This field of study is growing very fast and from an initially simple description of patterns there is now a growing body of literature evaluating and explaining the potential mechanisms associated with such patterns (see e.g. Holt et al., 1997; Lawton, 2000; Gaston et al., 1997, 2006; Gaston & Blackburn, 2000).
Transcript of Macroecological patterns of species distribution, composition and richness of the Azorean...
Ecologi@, N.º 1, Janeiro – Abril 2011 ISSN: 1647-2829 http://speco.fc.ul.pt/revistaecologia.html 22
Artigos Científicos
Macroecological patterns of species distribution,
composition and richness of the Azorean terrestrial
biota
Paulo A. V. Borges1, Pedro Cardoso1,2, Regina Cunha3, Rosalina Gabriel1, Vítor Gonçalves3, Joaquín Hortal1,4, António Frias Martins3, Ireneia Melo5, Pedro Rodrigues3, Ana M. C. Santos1, Luís Silva3, Kostas A. Triantis1,6, Paulo Vieira7 & Virgílio Vieira1,8
1 Azorean Biodiversity Group (CITA-A), Departamento de Ciências Agrárias, Universidade dos Açores, Terra-Chã, 9701-851 Angra do Heroísmo, Portugal 2 Smithsonian Institution, National Museum of Natural History, PO Box 37012, MRC 105, Room E-509, Washington, DC 20013-7012, USA 3 CIBIO-Azores, Departamento de Biologia, Universidade dos Açores, Rua da Mãe de Deus, PT- 9501-801 Ponta Delgada, S. Miguel, Açores, Portugal 4 Dep. Biodiversidad y Biología Evolutiva, Museo Nacional de Ciencias Naturales (CSIC). C/ José Gutiérrez Abascal, 2. 28006, Madrid, Spain 5 Jardim Botânico, Museu Nacional de História Natural, Universidade de Lisboa, Centro de Biologia Ambiental, R. da Escola Politécnica, 58, 1250-102, Lisboa, Portugal 6 Biodiversity Research Group, Oxford University Centre for the Environment, South Parks Road, Oxford, OX1 3QY, UK . 7 NemaLab/ICAM, Dept. de Biologia, Universidade de Évora, 7002-554 Évora, Portugal 8 Universidade dos Açores, Departamento de Biologia, Rua de S. Gonçalo, Apartado 1422, 9501-801 Ponta Delgada, Açores, Portugal
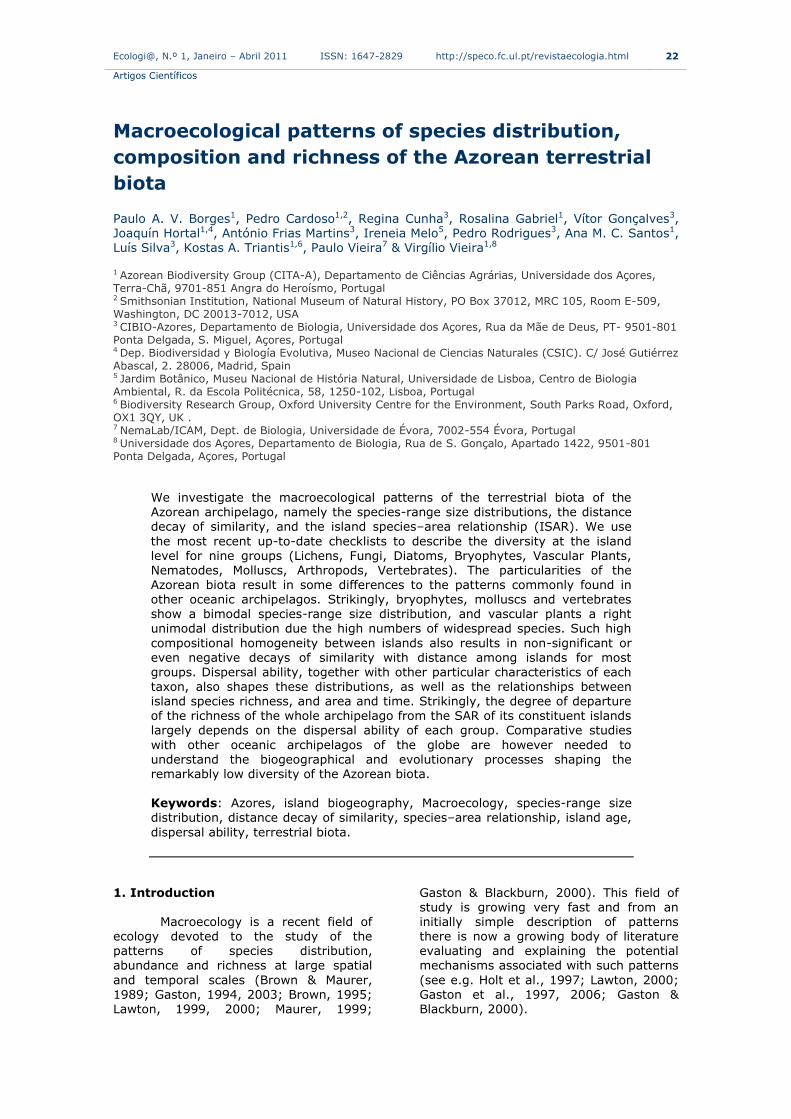
We investigate the macroecological patterns of the terrestrial biota of the Azorean archipelago, namely the species-range size distributions, the distance decay of similarity, and the island species–area relationship (ISAR). We use
the most recent up-to-date checklists to describe the diversity at the island level for nine groups (Lichens, Fungi, Diatoms, Bryophytes, Vascular Plants, Nematodes, Molluscs, Arthropods, Vertebrates). The particularities of the
Azorean biota result in some differences to the patterns commonly found in other oceanic archipelagos. Strikingly, bryophytes, molluscs and vertebrates show a bimodal species-range size distribution, and vascular plants a right unimodal distribution due the high numbers of widespread species. Such high
compositional homogeneity between islands also results in non-significant or even negative decays of similarity with distance among islands for most groups. Dispersal ability, together with other particular characteristics of each taxon, also shapes these distributions, as well as the relationships between island species richness, and area and time. Strikingly, the degree of departure of the richness of the whole archipelago from the SAR of its constituent islands largely depends on the dispersal ability of each group. Comparative studies
with other oceanic archipelagos of the globe are however needed to understand the biogeographical and evolutionary processes shaping the remarkably low diversity of the Azorean biota. Keywords: Azores, island biogeography, Macroecology, species-range size
distribution, distance decay of similarity, species–area relationship, island age,
dispersal ability, terrestrial biota.
1. Introduction
Macroecology is a recent field of ecology devoted to the study of the patterns of species distribution, abundance and richness at large spatial
and temporal scales (Brown & Maurer, 1989; Gaston, 1994, 2003; Brown, 1995; Lawton, 1999, 2000; Maurer, 1999;
Gaston & Blackburn, 2000). This field of study is growing very fast and from an initially simple description of patterns there is now a growing body of literature evaluating and explaining the potential mechanisms associated with such patterns
(see e.g. Holt et al., 1997; Lawton, 2000; Gaston et al., 1997, 2006; Gaston & Blackburn, 2000).

Ecologi@, N.º 1, Janeiro – Abril 2011 ISSN: 1647-2829 http://speco.fc.ul.pt/revistaecologia.html 23
Artigos Científicos
Some of the macroecological
patterns studied so far (reviewed in Gaston & Blackburn, 2000) are particularly
pervasive in ecological communities: i) the frequency distribution of logarithmically transformed species abundances is left-skewed; ii) the untransformed geographic ranges of species are distributed according to a "hollow curve" (Gaston, 2003), so most species have a narrow range while a
few are more widespread regardless of the analyzed extent (Gaston & Blackburn, 2000); iii) the relationship between the abundance and geographical range size of the species is positive (see e.g. Gaston et al., 2006 and Borges, 2008 for an
application with Azorean arthropods); iv)
the species richness of local communities is related to the regional richness, rather than fully dependent of local processes (see Borges & Brown, 2004 for an study conducted at the Azores); and v) the relationship between richness and area
(i.e., the species–area relationship) is positive and its slope varies within a limited set of values, in what is considered as one of the strongest patterns observed in ecology (e.g., Rosenzweig, 1995; Lawton, 1999; Gaston and Blackburn, 2000; Whittaker & Fernández-Palacios,
2007). We recently published a revised
and expanded list of Azorean terrestrial, freshwater and marine fungi, fauna and flora (Borges et al., 2010), covering all terrestrial taxonomic groups (Fungi, Lichens, Diatoms, Bryophytes, Vascular
Plants, Platyhelminthes, Annelids, Nematodes, Molluscs, Arthropods, and Vertebrates). Based on these species lists, which are the most complete that have been available for the Azores so far, we aim to provide an overview of the
distribution, composition and species richness patterns in several taxonomic groups at the Azorean archipelago. More precisely, we investigate in detail three main patterns: i) the species-range size
distributions; ii) the distance decay of similarity; and iii) the species–area
relationship. First, we evaluate whether the
species-range size distribution of indigenous (and particularly endemic) species shows a bimodal pattern, where in addition to the modal value find at the left, generated by single or few island
endemics, a right hand modal value is present, due to the existence of a large group of widespread species that occur in almost all islands. Next, we describe the compositional similarity between island biotas, by investigating the decrease in
similarity of communities with an increase
in the distance separating them (the so-called “distance decay of similarity”,
Nekola & White, 1999). We expect that taxa with high dispersal ability (e.g. fungi, lichens, bryophytes, diatoms and vertebrates) will show a bimodal species-range size distribution pattern, but not a significant decrease in similarity with increasing distance between islands. Taxa
with low dispersal ability, on the contrary, will show both a unimodal species-range size distribution pattern and a significant distance decay of similarity.
In addition, we investigate the species–area relationship (ISAR) for all
studied groups. Here, we predict that due
to its recent history, for most taxonomic groups the Azorean islands will present a positive relationship between richness of indigenous and both area and island age (see also Whittaker et al., 2008, 2009; Borges & Hortal, 2009; Cardoso et al.,
2010; Triantis et al., 2010a). In addition, we evaluate whether the Azores archipelago as a whole follows the same ISAR as its nine constituent islands (i.e., how much the archipelagic point departs from the ISAR fitted to the islands; see Santos et al., 2010). Then, we evaluate
our findings regarding the overall dispersal ability of each particular taxon.
2. Methods Data
We used the most recent
compilation of terrestrial species lists for the Azores (see Borges et al., 2010). We looked particularly to the most species rich lists, excluding platyhelminthes and annelids due to the low number of species from these two taxa inhabiting the Azores.
The following lists were used in the analyses: fungi (including Protozoa and Chromista; Melo et al., 2010); lichens (Aptroot et al., 2010); diatoms (Gonçalves et al., 2010); bryophytes (Gabriel et al.,
2010); vascular plants (i.e., Tracheobionta; Silva et al., 2010);
nematodes (Vieira et al., 2010); molluscs (Cunha et al., 2010), arthropods (Borges et al., 2010) and vertebrates (Rodrigues et al., 2010).
For each island and taxon we took into consideration only the indigenous species (i.e., archipelagic endemics plus
natives), excluding all introduced species. In addition, in the case of the molluscs, arthropods and vascular plants we compiled and recorded the numbers and percentages of endemics.

Ecologi@, N.º 1, Janeiro – Abril 2011 ISSN: 1647-2829 http://speco.fc.ul.pt/revistaecologia.html 24
Artigos Científicos
Analyses
Species range sizes Species range sizes were measured as the
number of islands occupied, with a maximum occupancy of nine. As the number of species differs between taxa, to allow comparability we used the proportion of species instead of the number of species occurring in each range size category. We evaluated the
occurrence frequency distribution of species in the various islands using the Tokeshi statistical test for bimodality (Tokeshi, 1992; Barreto et al., 2003), that allows the calculation of the probability that the data follows such distribution
under the null hypothesis of the presence
of larger numbers of species in the two extreme classes (one site only and all sites, respectively; see also Gaston & Blackburn, 2000).
The probability (P) of occurrence of a given absolute frequency f or higher
is given by the upper-probability of a binomial distribution:
N
fi
iNi hhiNi
NfFP )1(
)!(!
!)(
where F is a random variable that describes the event of a species occurring
in a given size bin with probability h of success, N is the total number of sampled species. The null hypothesis is rejected
(and thus bimodality is discarded) if the probability is smaller than a defined significance level (normally 0.05 or 0.1). Distance decay analyses For the distance decay analyses we used the complement of the β-3 index of beta
diversity for presence-absence data (i.e. 1 - β-3, see Williams, 1996; Koleff et al., 2003; Cardoso et al., 2009). In our datasets differences in species richness between islands were expected to be mainly the result of differences in area
and island age (Borges & Brown, 1999;
Borges & Hortal, 2009; Cardoso et al., 2010). Given that we wanted to study only the influence of distance between islands in their assemblage composition, not the influence of area or age, we chose the β-3 index because it is not influenced
by differences in species richness between assemblages (Cardoso et al., 2009). In addition, this index is particularly robust to comparisons of incomplete lists (Cardoso et al., 2009). With nine islands, 36 pairwise comparisons were made per each of the nine taxa. As these pairwise
values were not independent, significance
of the adjusted curves was assessed
through Mantel tests, randomizing 1000 times the similarity values. The number of
random curves with steeper slopes than the observed curve was used to calculate the latter’s significance value. Species–area relationship We applied the classical species–area model (Arrhenius, 1921) in its logarithmic
form, i.e. LogS=logc+z·logA, where S is the number of species, A area and c and z are constants. As some taxa are not recorded for all the islands we used log (species richness + 1) as the response variable when necessary. We then
evaluated the performance in analyses of
these datasets of the different mathematical formulations of the GDM - general dynamic model of oceanic island biogeography, a model that explicitly incorporates the geological history of islands in a number of variants. Although
it is expected that the number of indigenous species shows a positive relationship with area, the relationship with island age can vary according to the extent of the geological ages involved, from positive, to hump-shaped, or negative (see Triantis et al., 2010a). While
a positive relationship should be expected for island groups consisting of relatively
young islands (e.g. Azores; Borges & Hortal, 2009), a hump-shaped relationship is predicted by the theory/model when a full range of ages are present, or the relationship might even be negative if all
islands of the group are old and declining (see Whittaker et al., 2009), or if the habitats required for the group in question decline rapidly (Borges & Hortal, 2009; Triantis et al., 2010a).
We therefore evaluated three
different models for each taxon. Following Whittaker et al. (2008; see also Borges & Hortal, 2009; Triantis et al., 2010a), we assessed the performance of: (i) the A model [species richness= log (area)], (ii)
the AT model [species richness=log (area) + time], assuming a linear relationship
between time and richness, and (iii) the ATT2 model [species richness=log (area) + time - time2], which assumes that the relationship with the age of the islands is hump-shaped. We then compared the two latter models including time with the simple semi-log species–area model.
Here, the best model describing species richness was selected based on the Akaike Information Criterion (AIC) and the adjusted R2 values.
Ecologi@, N.º 1, Janeiro – Abril 2011 ISSN: 1647-2829 http://speco.fc.ul.pt/revistaecologia.html 25
Artigos Científicos
Species–area relationship and archipelagic
species richness prediction For the taxa with significant ISARs, we
generated a simple index to evaluate the departure of the archipelagic point (i.e. the point that refers to the total area and richness of the island group) from the richness predicted by extrapolating the ISAR generated from the data on the islands to the total area for the whole
archipelago, following the analyses described in Santos et al. (2010). To do so, for each taxon we estimated the species richness predicted by the ISAR regression model for the archipelago (SApred) and each of the constituent
islands’ (SIpred), using the fitted values of
the regression model in the case of the SIpred, and the total land-surface area of the archipelago as the predictor. We then calculated the residuals of the regression model (i.e., observed species richness minus SIpred) and identified their
maximum absolute value (MaxRes) that was expressed as a proportion (PropMaxRes) of SIpred. If the observed archipelagic species richness (SAobs) lies within the bounds of SApred ± (SApred x PropMaxRes), then we assume that we are not able to reject the hypothesis that the
archipelago follows the ISAR. Conversely, if SAobs was outside these bounds, we
assume that this hypothesis can be rejected, and the archipelago species richness violates its constituent islands’ SAR (for more details see Santos et al., 2010).
In order to obtain a measure of how much the archipelago departs from the ISAR, we also calculated the archipelagic residual (ArcRes) as the residual of the prediction provided be the
SAR using the total area of the
archipelago. To enable comparisons between different taxa, we standardized
this residual by dividing it by the total observed richness. We represented ArcRes as a function of the dispersal ability of each taxon (molluscs – poor; arthropods, nematodes and vascular plants – medium; bryophytes, fungi, lichens, diatoms and vertebrates – high) to explore if such trait
is related with deviations from the ISAR in the datasets that yielded significant regressions (P < 0.05) (for more details see Santos et al., 2010). No formal statistical tests were done regarding the eventual relationship between ArcRes and
dispersal ability, due to the small number
of taxa evaluated. All these analyses were carried out in STATISTICA 6.0. 3. Results
Data on a total of 3,991
indigenous species and subspecies belonging to nine groups (fungi, lichens, diatoms, bryophytes, vascular plants, nematodes, molluscs, arthropods and vertebrates) and 371 endemic species and subspecies belonging to three groups (vascular plants, molluscs and arthropods)
were evaluated. A large proportion of the indigenous species and subspecies occur
in only one island (n = 1545; 39%, see Table 1) and only 7% (n = 271) are known from all the nine islands. For the nine groups evaluated, there is a high correlation between the total diversity of
indigenous taxa and the number of taxa occurring in one island (r= 0.91; p < 0.001).
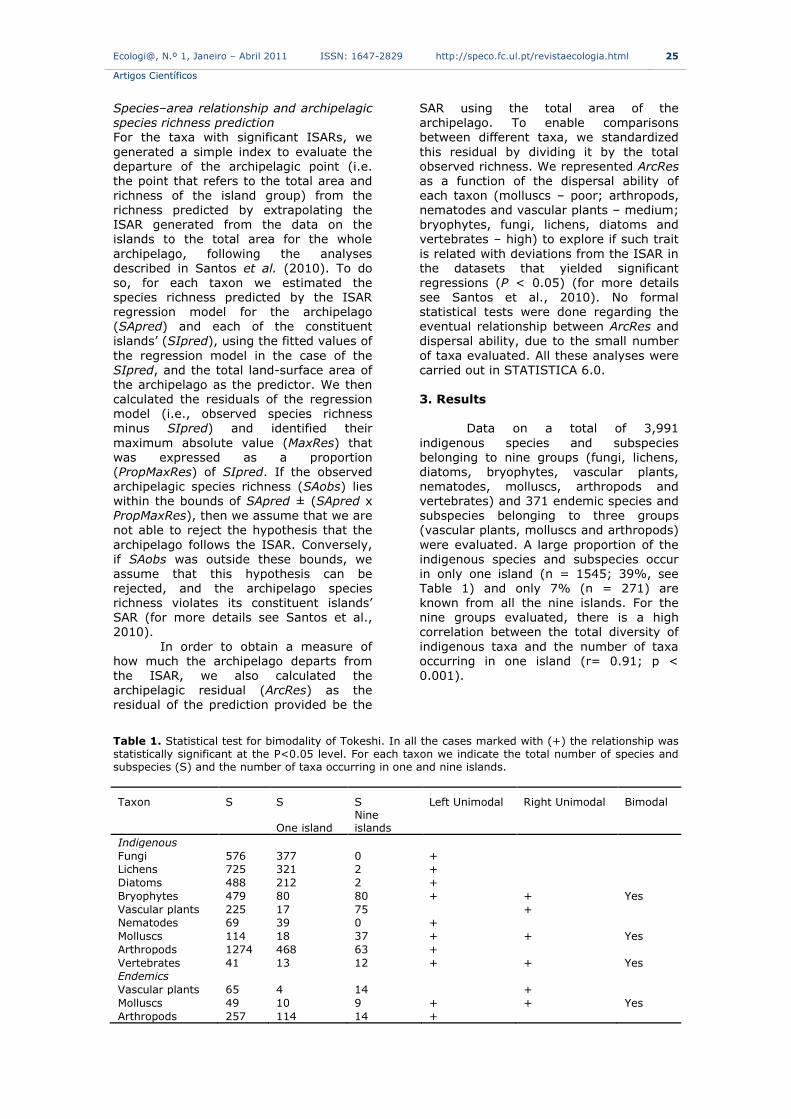
Table 1. Statistical test for bimodality of Tokeshi. In all the cases marked with (+) the relationship was statistically significant at the P<0.05 level. For each taxon we indicate the total number of species and subspecies (S) and the number of taxa occurring in one and nine islands.
Taxon S S S Left Unimodal Right Unimodal Bimodal
One island Nine islands
Indigenous
Fungi 576 377 0 + Lichens 725 321 2 +
Diatoms 488 212 2 +
Bryophytes 479 80 80 + + Yes
Vascular plants 225 17 75 + Nematodes 69 39 0 +
Molluscs 114 18 37 + + Yes
Arthropods 1274 468 63 +
Vertebrates 41 13 12 + + Yes Endemics
Vascular plants 65 4 14 +
Molluscs 49 10 9 + + Yes
Arthropods 257 114 14 +

Ecologi@, N.º 1, Janeiro – Abril 2011 ISSN: 1647-2829 http://speco.fc.ul.pt/revistaecologia.html 26
Artigos Científicos
The nine taxa studied follow three
contrasting patterns of range size distribution in the Azorean archipelago
(Table 1, Fig. 1): i) fungi, lichens, diatoms, nematodes and arthropods clearly follow a classical left unimodal distribution (i.e., a "hollow curve"), with most species having narrow ranges, and very few being more widespread; ii) bryophytes, molluscs and vertebrates, on
the contrary, follow a bimodal pattern due
to the existence of a group of widespread
species that occur in almost all islands; and finally iii) vascular plants present an
uncommon right unimodal distribution, where most species have a widespread range, while a few have a narrow range. For the taxa for which indigenous and endemics were evaluated the same result was obtained (see Table 1).
Figure 1. Frequency histogram of species distributions showing the proportion of indigenous species known in the nine Azorean islands of fungi, lichens, diatoms, bryophytes, vascular plants, nematodes, molluscs, arthropods and vertebrates.

Ecologi@, N.º 1, Janeiro – Abril 2011 ISSN: 1647-2829 http://speco.fc.ul.pt/revistaecologia.html 27
Artigos Científicos
The distance decay analyses
reveal disparate patterns between taxa (Fig. 2). Most of them do not show any
kind of correlation between distance and similarity. In contrast, Vascular plants and vertebrates show strong (especially
plants) negative correlations between
distance and similarity (Fig. 2). Lichens show a slight positive correlation, which
was unexpected and can only be explained by sampling artefacts, as some islands are better sampled than other.
Figure 2. Distance decay similarity analyses with the complement of the β-3 beta diversity index for each taxon (fungi, lichens, diatoms, bryophytes, vascular plants, nematodes, molluscs, arthropods and vertebrates). Values are for Pearson r correlations; p values were calculated from 1,000 randomizations (see methods).

Ecologi@, N.º 1, Janeiro – Abril 2011 ISSN: 1647-2829 http://speco.fc.ul.pt/revistaecologia.html 28
Artigos Científicos
The overall number of species and
subspecies occurring in only one island (Single Island Indigenous – SII) is highly
correlated with the area of the islands (r = 0.93; p<0.001), being the slope of the log-log model higher than the unity (log SII = -1.01 + 1.32 log Area) (Fig. 3). Interestingly, the density of species per
unit area is relatively even for most taxa
and islands, except for vascular plants, bryophytes, arthropods and molluscs in
Corvo, and to a less extent in Graciosa and Santa Maria (Fig. 4). These three smaller islands host comparatively much more species in relation to their size than their larger counterparts.
Figure 3. Relationship between the logarithm of the number of single island indigenous species and subspecies (SII) and the logarithm of area of the islands for the taxa pooled together.
Figure 4. Species density of all taxa in each island, measured as the number of species per unit area (i.e. km2).
The explanatory power of area alone was, in general, quite high for all the taxa considered apart from diatoms
and vertebrates, for which the relationship with area was not statistically significant
(see Table 2 and Fig. 5). Nematodes showed also a non-significant ISAR when the two islands with no species were
discarded for the analyses (see Fig. 5).
Cor
vo
Flore
s
Faial
Pico
Gra
cios
a
S.J
orge
Tercei
ra
S.M
iguel
S.M
aria
Vascular plants
Fungi
Bryophytes
Lichens
Arthropods
Molluscs
Vertebrates
0
2
4
6
8
10
12
# t
axa/s
q.k
m

Ecologi@, N.º 1, Janeiro – Abril 2011 ISSN: 1647-2829 http://speco.fc.ul.pt/revistaecologia.html 29
Artigos Científicos
Table 2. The species–area relationships for indigenous for the taxa considered. For each case the coefficient of determination (R2), the F-value and the slope of the relationship (z) is presented. In all the cases, except for diatoms and vertebrates, the relationship was statistically significant at the P<0.05 level. Nematode richness was modelled as log (S + 1).
Taxon c z R2 F
Fungi 0.577 0.922 0.688 15.443
Lichens 1.685 0.857 0.813 30.430
Diatoms - - 0.258 2.439
Bryophytes 74.535 0.241 0.679 14.778
Vascular plants 80.283 0.129 0.496 6.885
Nematodes 0.054 0.963 0.516 7.469
Molluscs 33.301 0.133 0.643 12.591
Arthropods 55.327 0.402 0.848 39.196
Vertebrates - - 0.211 1.873
Figure 5. Relationship between species richness and area for all taxa. Individual islands are represented by black circles and the archipelagos by grey triangles. The island species–area relationship (ISAR) predicted by the regression function is shown as a continuous line in each case. The interval defined by the maximum residual (see text) are represented by the dotted lines. In the case of the Nematodes, only seven islands are represented as two of them (Corvo and Graciosa) have no records for this taxon.
0.0
0.5
1.0
1.5
2.0
2.5
3.0
3.5
4.0
4.5
0.8
1.2
1.6
2.0
2.4
2.8
3.2
0.8 1.2 1.6 2.0 2.4 2.8 3.2 3.6
Fungi Lichens Diatoms
Bryophytes Vascular plants Nematodes
Molluscs Arthropods Vertebrates
0.8 1.2 1.6 2.0 2.4 2.8 3.2 3.61.2
1.6
2.0
2.4
2.8
3.2
3.6
Log Area (km2)
Lo
g S
pe
cie
s R
ichne
ss
r2 = 0.688; p = 0.006 r2 = 0.813; p < 0.001 r2 = 0.258; p = 0.162
r2 = 0.679; p = 0.006 r2 = 0.496; p = 0.034 r2 = 0.016; p = 0.811
r2 = 0.643; p = 0.009 r2 = 0.848; p < 0.001 r2 = 0.211; p = 0.213
0.8 1.2 1.6 2.0 2.4 2.8 3.2 3.6
Ecologi@, N.º 1, Janeiro – Abril 2011 ISSN: 1647-2829 http://speco.fc.ul.pt/revistaecologia.html 30
Artigos Científicos
Slope values ranged from 0.129 (vascular
plants) to 0.922 (fungi), with upper and lower quartiles being 0.744 and 0.161,
respectively, the median 0.322 and the overall mean 0.448 (Table 2). None of the
different area and area-time models
evaluated was selected as the best for all, or the majority, of the taxa considered
(Table 3).
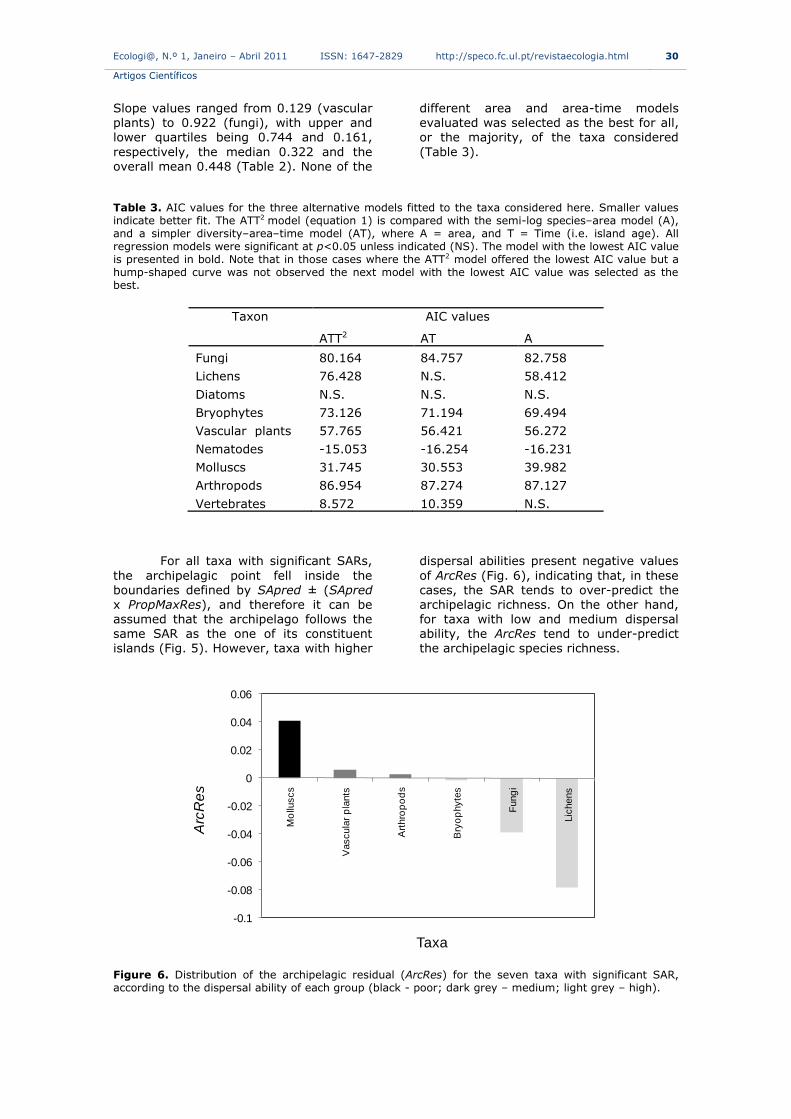
Table 3. AIC values for the three alternative models fitted to the taxa considered here. Smaller values indicate better fit. The ATT2 model (equation 1) is compared with the semi-log species–area model (A), and a simpler diversity–area–time model (AT), where A = area, and T = Time (i.e. island age). All regression models were significant at p<0.05 unless indicated (NS). The model with the lowest AIC value is presented in bold. Note that in those cases where the ATT2 model offered the lowest AIC value but a hump-shaped curve was not observed the next model with the lowest AIC value was selected as the best.
Taxon AIC values
ATT2 AT A
Fungi 80.164 84.757 82.758
Lichens 76.428 N.S. 58.412
Diatoms N.S. N.S. N.S.
Bryophytes 73.126 71.194 69.494
Vascular plants 57.765 56.421 56.272
Nematodes -15.053 -16.254 -16.231
Molluscs 31.745 30.553 39.982
Arthropods 86.954 87.274 87.127
Vertebrates 8.572 10.359 N.S.
For all taxa with significant SARs,
the archipelagic point fell inside the boundaries defined by SApred ± (SApred x PropMaxRes), and therefore it can be assumed that the archipelago follows the same SAR as the one of its constituent islands (Fig. 5). However, taxa with higher
dispersal abilities present negative values
of ArcRes (Fig. 6), indicating that, in these cases, the SAR tends to over-predict the archipelagic richness. On the other hand, for taxa with low and medium dispersal ability, the ArcRes tend to under-predict the archipelagic species richness.
Figure 6. Distribution of the archipelagic residual (ArcRes) for the seven taxa with significant SAR, according to the dispersal ability of each group (black - poor; dark grey – medium; light grey – high).
Arc
Re
s
Taxa
-0.1
-0.08
-0.06
-0.04
-0.02
0
0.02
0.04
0.06
Mo
lluscs
Vascula
r p
lants
Art
hro
po
ds
Bry
op
hyte
s
Fung
i
Lic
hens
Ecologi@, N.º 1, Janeiro – Abril 2011 ISSN: 1647-2829 http://speco.fc.ul.pt/revistaecologia.html 31
Artigos Científicos
4. Discussion
The raw macroecological analyses
presented here reveal the particularities of the Azorean biota, a highly impoverished version of some of the Macaronesian elements found in the distant mainland. Species-range size distributions rarely show a bimodal pattern (see Gaston, 1994, 2003; Brown, 1995; Lawton, 1999,
2000; Maurer, 1999; Gaston & Blackburn, 2000). Thus, the untransformed geographic ranges of some indigenous Azorean taxa are distributed following a "hollow curve" (Table 1; Fig. 1). For example, while most of the endemic
arthropod taxa (about 44%) are known
from only one island, less than 10% of the taxa occur in six or more islands (Fig. 1). However, bryophytes, vascular plants molluscs and vertebrates do not follow this pattern, with many widespread Azorean natives and endemics (see Fig.1).
Bryophytes, molluscs and vertebrates show a bimodal distribution (Fig. 1). We predicted this result for both bryophytes and vertebrates (which in the Azores are mainly birds) due to their high dispersal ability. However, the result obtained for both indigenous and endemic
molluscs comes as a surprise. Although terrestrial molluscs usually have small
ranges (Cameron, 1998), the new updated list of Azorean species and subspecies includes a large proportion of widespread taxa. This could be due to a number of reasons related with: the questionable
assignment of species to the indigenous status (i.. Helix aspersa, a species that has been introduced to many areas of the globe from its original north African distribution; see also Guiller & Madec, 2010); the ability of many Azorean
terrestrial molluscs to be passively transported by the wind or birds between islands, as species able to use these long-distance dispersal modes are prevalent in the distant Azorean archipelago (see
Gittenberger et al., 2006); and the introduction of many species, especially
slugs, to most or all the Azorean Islands through human activities. In contrast, the lack of "hollow curve" in some groups with high dispersal (e.g. fungi, lichens and diatoms) may be an artifact of the low sampling, which results in an overestimation of the left-hand modal
value. A more consistent survey of fungi, lichens and diatoms may result in these three groups will also presenting a bimodal distribution at the Azores, similar to bryophytes.
Vascular plants are, however,
quite distinct to the rest of the groups, showing a right unimodal distribution due
to the large proportion of both indigenous and endemic species occurring in most islands. This pattern is clearly generated by the high compositional uniformity of the Azorean native forest (Sjogren, 1973). Such pattern of compositional uniformity might be extensible to other groups. In
fact, the absence of some species in some of the islands is likely to be due to recent anthropogenic land-use changes and local extinctions (see e.g. Cardoso et al., 2010; Triantis et al., 2010b).
The distance decay analyses
reveal four general distribution patterns of
species among islands. First, vascular plants and vertebrates were the taxa showing negative correlations. Such correlations are due to many species being shared by neighboring groups of islands but not by the remaining
archipelago. Examples are the plants Cerastium azoricum, Euphrazia azorica or Myosotis azorica, all of which only live in Flores and Corvo, the Western group of islands, being absent from the other islands. On the contrary, the Azorean bat Nyctalus azoreum occurs on all islands but
these two. Second, molluscs and bryophytes include many species that
occupy many islands, showing no obvious patterns in a distance-decay analysis. Fungi, lichens, nematodes and diatoms have many species that only occur in a single or very few islands, but, as already
mentioned, this may be due to a lack of sampling in many islands. Undersampling may cause changes in beta diversity values and such changes possibly influence the observed distance decay curves; however, by using 1 - β-3 as a
measure of compositional similarity our analyses may be robust to these spurious effects (Cardoso et al., 2009). Because there is no spatial correlation in undersampling patterns, no corresponding
patterns in distance decay are detected. Finally, arthropods also lack a distance
decay pattern. This lack of a clear pattern may be caused by the prevalence of many species occupying a single island, most notably the single island endemics (SIE). Moreover, any previously existing pattern may have been partly masked by recent extinctions of taxa in islands with low or
even non-existing native habitat cover (see Cardoso et al., 2010, Triantis et al., 2010b). Islands with high proportions of native cover (Flores, Terceira, Pico) are near islands with no or low cover (Corvo, Graciosa and Faial respectively). If many

Ecologi@, N.º 1, Janeiro – Abril 2011 ISSN: 1647-2829 http://speco.fc.ul.pt/revistaecologia.html 32
Artigos Científicos
species have become extinct in the latter
islands but not in the former, any previously existing distance decay pattern
could break and be impossible to untangle today.
The species–area relationship has been described as one of the few rules in ecology, being widely applicable across scales and taxa (Lawton, 1999, 2000; Rosenzweig, 1995). The relationship
between species richness and area may be uneven throughout the archipelago. The three smaller islands show strikingly higher numbers of species per unit area than the rest (Fig. 4), evidencing that the accumulation of species with area is not
linear, hence being better approximated
by logarithmic or power functions (see, e.g., Rosenzweig, 1995; Lomolino, 2001; Whittaker & Fernández-Palacios, 2007). Nevertheless, area appears as a really good descriptor of the numbers of species per island at the Azores, both for all taxa
altogether and for most of them. This is with the exception of the species-poor and highly-dispersive vertebrates, and the less studied diatoms and, perhaps, nematodes (see methods), in what may be a sampling artefact, as discussed above. However, island age adds some explanatory power
to the simple area models in several groups, and in particular to fungi,
arthropods and molluscs. In these groups, the time since the arousal of each island may have been enough to allow within-island diversification due to their short generation times, and hence faster
diversification rates, in contrast to vascular plants or lichens. Similar differences in the strength and importance of the relationship between island diversity and time and area have been already shown for the Azores in particular,
and the Macaronesian archipelagos in general (Whittaker et al., 2008; Borges & Hortal, 2009; Cardoso et al., 2010; Triantis et al., 2010a). Having said this, however, we have to note that in most of
the cases the AIC values were quite similar for all three models (A, AT and
ATT2), so a clear decision about the best model could not be made (Table 3; see discussion in Burham & Anderson, 2004; Richards, 2008). Critically, the small number of islands hampers this kind of analyses, making difficult to discriminate among concurring models. Thus, although
island age seems to be as relevant as area in determining the diversity of island biotas at the Azores, the limited explanatory power of our analyses prevents from extracting definitive
conclusions about the relative importance
of each one of these factors. Although SAR are more often
described for islands within an archipelago (Rosenzweig, 1995; Whittaker & Fernández-Palacios, 2007), it is not unusual to add together the species list of all islands within and archipelago, and represent this as a single data point in a representation of the SAR (e.g. Scott,
1972; Wright, 1983; Adler et al., 1995; Carvajal & Adler, 2005; among others). Santos et al. (2010) showed that indeed, archipelagos usually follow the same SAR as their constituent islands, implying that they can be considered as distinct entities.
Our results confirm such general pattern,
since for all significant SARs the archipelago also follows its islands SAR. Although no statistical tests were used to infer the relationship between ArcRes and dispersal ability due to the small number of datasets, the different Azorean taxa
show an obvious pattern of decreasing ArcRes with increasing dispersal ability (Fig. 6). For taxa with lower dispersal ability the SAR under-predicts the archipelago species richness, while for more mobile taxa, the SAR over-predicts this variable. According to Santos et al.
(2010), the residual variation of the archipelagic data point is related to
nestedness, with departures from the SAR being expected in systems that are highly nested or not nested at all. Again, this is in agreement with our results, although in this case the departures of the archipelago
from its SAR are not large enough to make archipelagic richness significantly different from the relationship observed in the islands. However, we can relate, at least in part, the dispersal ability with nestedness; arguably, the decrease of
ArcRes with increasing dispersal ability evidences that highly mobile taxa are less nested than less mobile ones.
To summarize, the different macroecological analyses conducted on
the Azorean biota evidence that, in general, the particularities of this
archipelago result in some differences to the patterns commonly found in other oceanic archipelagos. The extreme isolation from both the mainland and between islands within the archipelago, and the young age of most of the Azorean islands configure the unique character of
the Azorean biota, which presents unusually high numbers of widespread species and low raw numbers of diversification events (and thus small numbers of single island endemics) compared to similar archipelagos (see

Ecologi@, N.º 1, Janeiro – Abril 2011 ISSN: 1647-2829 http://speco.fc.ul.pt/revistaecologia.html 33
Artigos Científicos
Borges et al., under review). Also, by
comparing an array of groups with different dispersal abilities and
evolutionary rates, our results evidence the importance of accounting for the characteristics of each particular group while studying its diversity patterns (Borges & Hortal, 2009). Critically, the differences between groups result in different relationships with space (i.e.,
species-range size distributions and distance decays of similarities), area and island age, as well as on the departure of the Archipelagic richness from the SAR measured in the islands (i.e., a raw measure of nestedness). Further studies
are however necessary to disentangle how
much of these patterns is due solely to the limited numbers of lineages that have managed to colonize this archipelago, and how much is due to the limited time that these lineages have had to diversify in most Azorean islands.
5. Acknowledgements The lists of species were performed under the support of the Project DRCT - M3.2.3/I/017B/2009. PAVB is currently being funded by the FCT Projects
(PTDC/BIA-BEC/100182/2008 and PTDC/BIA-BEC/104571/2008). PC, KT and
AMCS were supported by Fundação para a Ciência e Tecnologia (SFRH/BPD/40688/2007, SFRH/BPD/44306/2008 and SFRH/BD/21496/2005, respectively), and
JH by a CSIC JAE-Doc grant. 6. References Adler, G.H., Austin, C.C. & Dudley, R. (1995) Dispersal and speciation of skinks
among archipelagos in the tropical Pacific Ocean. Evolutionary Ecology, 9, 529-541. Aptroot, A., Gabriel, R., Rodrigues, F., Schumm, F., Câmara, S. (2010) List of
lichens and lichenicolous fungi (Fungi). In: Borges, P.A.V., Costa, A., Cunha, R.,
Gabriel, R., Gonçalves, V., Martins, A.F., Melo, I., Parente, M., Raposeiro, P., Rodrigues, P., Santos, R.S., Silva, L., Vieira, P. & Vieira, V. (eds.) A list of the terrestrial and marine biota from the Azores. pp. 65-90, Princípia, Oeiras, 455 pp.
Arrhenius O. (1921) Species and area. Journal of Ecology, 9, 95-99. Barreto, S., Borges, P.A.V. & Guo, Q. (2003) A Typing error in the TokeshiŽs
test of bimodality. Global Ecology and
Biogeography, 12, 173-174.
Borges, P.A.V. (2008) Distribution and abundance of arthropod species in pasture communities of three Azorean islands (S. Maria, Terceira and Pico). Arquipélago. Life and marine Sciences, 25, 31-41. Borges, P.A.V. & Brown, V.K. (1999)
Effect of island geological age on the arthropod species richness of Azorean pastures. Biological Journal of the Linnean Society, 66, 373-410. Borges, P.A.V. & Brown, V.K. (2004)
Arthropod community structure in
pastures of an island archipelago (Azores): looking for local-regional species richness patterns at small-scales. Bulletin of Entomological Research, 94, 111-121. Borges, P.A.V. & Hortal, J. (2009) Time,
area and isolation: Factors driving the diversification of Azorean arthropods. Journal of Biogeography, 36, 178-191. Borges, P.A.V., Costa, A., Cunha, R., Gabriel, R., Gonçalves, V., Martins, A.F., Melo, I., Parente, M., Raposeiro, P.,
Rodrigues, P., Santos, R.S., Silva, L., Vieira, P. & Vieira, V. (Eds.) (2010) A list
of the terrestrial and marine biota from the Azores. Princípia, Oeiras, 455 pp. Borges, P.A.V., Vieira, V., Amorim, I.R., Bikudo, N., Fritzén, N., Gaspar, C.,
Heleno, R., Hortal, J., Lissner, J., Logunov, D., Machado, A., Marcelino, J., Meijer, S.S., Melo, C., Mendonça, E.P., Moniz, J., Pereira, F., Santos, A.S., Torrão, E. (2010) List of arthropods (Arthropoda). In: Borges, P.A.V., Costa, A., Cunha, R.,
Gabriel, R., Gonçalves, V., Martins, A.F., Melo, I., Parente, M., Raposeiro, P., Rodrigues, P., Santos, R.S., Silva, L., Vieira, P. & Vieira, V. (eds.) A list of the terrestrial and marine biota from the
Azores. pp. 191-258, Princípia, Oeiras, 455 pp.
Borges, P.A.V., Hortal, J., Amorim, I., Cardoso, P., Silva, L., Santos, A.M.C., Gabriel, R. & Triantis, K.A. (under review) Why is the Azorean diversity so enigmatic? Too young, too small, too isolated and too homogeneous. A
response to Carine & Schaefer (2010). Journal of Biogeography. Brown, J.H. (1995) Macroecology. The University of Chicago Press, Chicago and London.
Ecologi@, N.º 1, Janeiro – Abril 2011 ISSN: 1647-2829 http://speco.fc.ul.pt/revistaecologia.html 34
Artigos Científicos
Brown, J.H. & Maurer, B.A. (1989) Macroecology: The division of food and
space among species on continents. Science, 243, 1145-1150. Burnham, K.P. & Anderson, D.R. (2004) Multimodel Inference: Understanding AIC and BIC in Model Selection. Sociological Methods Research, 33, 261-304.
Cameron, R.A.D. (1998) Dilemmas of rarity: biogeographical insights and conservation priorities for land Mollusca. Journal of Conchology Special Publication, 2, 51-60.
Cardoso, P., Arnedo, M.A., Triantis, K.A. & Borges, P.A.V. (2010) Drivers of diversity in Macaronesian spiders and the role of species extinctions. Journal of Biogeography, 37, 1034-1046.
Cardoso, P., Borges, P.A.V. & Veech, J.A. (2009) Testing the performance of beta diversity measures based on incidence data: the robustness to undersampling. Diversity and Distributions, 15, 1081-1090.
Carvajal, A. & Adler, G.H. (2005) Biogeography of mammals on tropical
Pacific islands. Journal of Biogeography, 32, 1561-1569. Cunha, R., Rodrigues, P., Martins, A.F. (2010) List of molluscs (Mollusca). In:
Borges, P.A.V., Costa, A., Cunha, R., Gabriel, R., Gonçalves, V., Martins, A.F., Melo, I., Parente, M., Raposeiro, P., Rodrigues, P., Santos, R.S., Silva, L., Vieira, P. & Vieira, V. (eds.) A list of the terrestrial and marine biota from the
Azores. pp. 177-190. Princípia, Oeiras, 455 pp. Gabriel, R., Sjögren, E., Schumacker, R., Sérgio, C., Martins, B., Homem, N. &
Aranda, S.C. (2010) List of bryophytes (Bryophyta). In: Borges, P.A.V., Costa, A.,
Cunha, R., Gabriel, R., Gonçalves, V., Martins, A.F., Melo, I., Parente, M., Raposeiro, P., Rodrigues, P., Santos, R.S., Silva, L., Vieira, P. & Vieira, V. (eds.) A list of the terrestrial and marine biota from the Azores. pp. 109-126, Princípia, Oeiras, 455 pp.
Gaston K.J. (1994) Rarity. Chapman & Hall, London.
Gaston K.J. (2003) The structure and
dynamics of geographic ranges. Oxford University Press, Oxford.
Gaston, K.J. & Blackburn, T.M. (2000) Pattern and process in macroecology. Blackwell Science, Oxford. Gaston, K.J., Borges, P.A.V., He, F &. Gaspar, C. (2006) Abundance, spatial
variance and occupancy: arthropod species distribution in the Azores. Journal of Animal Ecology, 75, 646-656. Gaston K.J., Blackburn, T.M. & Lawton, J.H. (1997) Interspecific abundance-range
size relationships: an appraisal of
mechanisms. Journal of Animal Ecology, 66, 579-601. Gittenberger, E., Groenenberg, D.S.J., Kokshoorn, B. & Preece, R.C. (2006) Molecular trails from hitch-hiking snails.
Nature, 439, 409-409. Gonçalves, V., Marques, H. & Fonseca, A. (2010) List of diatoms (Bacillariophyta). In: Borges, P.A.V., Costa, A., Cunha, R., Gabriel, R., Gonçalves, V., Martins, A.F., Melo, I., Parente, M., Raposeiro, P.,
Rodrigues, P., Santos, R.S., Silva, L., Vieira, P. & Vieira, V. (eds.) A list of the
terrestrial and marine biota from the Azores. pp. 91-108, Princípia, Oeiras, 455 pp Guiller, A. & Madec, L. (2010) Historical
biogeography of the land snail Cornu aspersum: a new scenario inferred from haplotype distribution in the Western Mediterranean basin. BMC Evolutionary Biology, 10, 18, doi:10.1186/1471-2148-10-18.
Holt, R.D., Lawton, J.H., Gaston, K.J. & Blackburn, T.M. (1997) On the relationship between range size and local abundance: back to basics. Oikos, 78, 183-190.
Koleff, P., Gaston, K.J. & Lennon, J.J.
(2003) Measuring beta diversity for presence-absence data. Journal of Animal Ecology, 72, 367-382. Lawton, J.H. (1999) Are there general laws in ecology.? Oikos, 84,177-192.
Lawton, J.H. (2000) Community ecology in a changing world. International Ecology Institute, Oldendorf/Luhe, Germany. Lomolino, M.V. (2001) The species_area relationship: new challenges for an old

Ecologi@, N.º 1, Janeiro – Abril 2011 ISSN: 1647-2829 http://speco.fc.ul.pt/revistaecologia.html 35
Artigos Científicos
pattern. Progress in Physical Geography,
25, 1-21.
Maurer, B.A. (1999) Untangling ecological complexity – The Macoscopic perspective. The University of Chicago Press, London. Melo, I, Cardoso, J., Dueñas, M., Salcedo, I., Tellería, M.T. (2010) List of fungi (Fungi). In: Borges, P.A.V., Costa, A.,
Cunha, R., Gabriel, R., Gonçalves, V., Martins, A.F., Melo, I., Parente, M., Raposeiro, P., Rodrigues, P., Santos, R.S., Silva, L., Vieira, P. & Vieira, V. (eds.) A list of the terrestrial and marine biota from the Azores. pp. 43-64, Princípia, Oeiras,
455 pp.
Nekola, J.C. & White, P.S. (1999) The distance decay of similarity in biogeography and ecology. Journal of Biogeography, 26, 867-878.
Richards, S.A. (2008) Dealing with overdispersed count data in applied ecology. Journal of Applied Ecology, 45, 218-227. Rodrigues, P., Bried, J., Medeiros, F., & Cunha, R. (2010) List of vertebrates
(Chordata). In: Borges, P.A.V., Costa, A., Cunha, R., Gabriel, R., Gonçalves, V.,
Martins, A.F., Melo, I., Parente, M., Raposeiro, P., Rodrigues, P., Santos, R.S., Silva, L., Vieira, P. & Vieira, V. (eds.) A list of the terrestrial and marine biota from the Azores. pp. 259-284, Princípia, Oeiras,
455 pp. Rosenzweig, M.L. (1995) Species diversity in space and time. Cambridge Univ. Press. Santos, A.M.C., Whittaker, R.J., Triantis,
K.A., Borges, P.A.V., Jones, O.R., Quicke, D. & Hortal, J. (2010) Are species–area relationships from entire archipelagos congruent with those of their constituent islands. Global Ecology and Biogeography,
19, 527-540.
Scott, J.A. (1972) Biogeography of Antillean butterflies. Biotropica, 4, 32-45. Silva, L., Moura. M., Schaefer, H., Rumsey, F. & Dias, E.F. (2010) List of vascular plants (Tracheobionta). In: Borges, P.A.V., Costa, A., Cunha, R.,
Gabriel, R., Gonçalves, V., Martins, A.F., Melo, I., Parente, M., Raposeiro, P., Rodrigues, P., Santos, R.S., Silva, L., Vieira, P. & Vieira, V. (eds.) A list of the terrestrial and marine biota from the
Azores. pp. 127-158, Princípia, Oeiras,
455 pp.
Sjogren, E. (1973) Recent changes in the vascular flora and vegetation of the Azores Islands. Memórias da Sociedade Broteriana, 22, 1-451 Tokeshi, M. (1992) Dynamics and distribution in animal communities; theory
and analysis. Researches in Population Ecology, 34, 249-273. Triantis, K., Borges, P.A.V., Hortal, J. & Whittaker, R.J. (2010a) The Macaronesian province: patterns of species richness and
endemism of arthropods. In A.R.M.
Serrano, P.A.V. Borges, M. Boieiro & P. Oromí (Eds.). Terrestrial arthropods of Macaronesia – Biodiversity, Ecology and Evolution. pp. 45-64. Sociedade Portuguesa de Entomologia.
Triantis, K.A., Borges, P.A.V., Ladle, R.J., Hortal, J., Cardoso, P., Gaspar, C., Dinis, F., Mendonça, E., Silveira, L.M.A., Gabriel, R., Melo, C., Santos, A.M.C., Amorim, I.R., Ribeiro, S.P., Serrano, A.R.M., Quartau, J.A. & Whittaker, R.J. (2010b) Extinction debt on oceanic islands. Ecography, 33,
285-294.
Whittaker, R.J. & Fernández-Palacios, J.M. (2007) Island biogeography: ecology, evolution, and conservation. 2nd edn. - Oxford Univ. Press.
Williams, P.H. (1996) Mapping variations in the strength and breadth of biogeographic transition zones using species turnover. Proceedings of the Royal Society of London B, 263, 579-588.
Wright, D.H. (1983) Species–energy theory – an extension of species–area theory. Oikos, 41, 496-506. Vieira, P., Sturhan, D., Barbosa, P., Padre,
L. &, Mota, M. (2010) List of nematodes (Nematoda). In: Borges, P.A.V., Costa, A.,
Cunha, R., Gabriel, R., Gonçalves, V., Martins, A.F., Melo, I., Parente, M., Raposeiro, P., Rodrigues, P., Santos, R.S., Silva, L., Vieira, P. & Vieira, V. (eds.) A list of the terrestrial and marine biota from the Azores. pp. 169-176, Princípia, Oeiras, 455 pp.