LUCRĂRI ŞTIINłIFICE - uaiasi.ro
290
ISSN–L=1454-7376 (Print)-ISSN 1454-7376 (Online)=ISSN 2069-8275 (CD-ROM) = ISSN 2069 – 847X UNIVERSITATEA DE ŞTIINłE AGRICOLE ŞI MEDICINĂ VETERINARĂ “ION IONESCU DE LA BRAD” IAŞI LUCRĂRI ŞTIINłIFICE Vol. 57 NR. 2 SERIA HORTICULTURĂ EDITURA “ION IONESCU DE LA BRAD” IAŞI 2014
-
Upload
khangminh22 -
Category
Documents
-
view
0 -
download
0
Transcript of LUCRĂRI ŞTIINłIFICE - uaiasi.ro
ISSN–L=1454-7376 (Print)-ISSN 1454-7376 (Online)=ISSN 2069-8275
(CD-ROM) = ISSN 2069 – 847X
UNIVERSITATEA DE ŞTIINłE AGRICOLE
ŞI MEDICINĂ VETERINARĂ “ION IONESCU DE LA BRAD” IAŞI
LUCRĂRI ŞTIINłIFICE
Vol. 57
NR. 2
SERIA HORTICULTURĂ
EDITURA “ION IONESCU DE LA BRAD”
IAŞI 2014

1
COLECTIVUL DE COORDONARE AL REVISTEI „LUCRĂRI ŞTIINłIFICE”
Redactor şef: Prof. dr. Vasile VÎNTU - USAMV Iaşi, Romania Redactor adjunct: Prof. dr. Constantin LEONTE - USAMV Iaşi, Romania
Membri: Prof. dr. Lucia DRAGHIA - USAMV Iaşi, Romania Prof. dr. Teodor ROBU - USAMV Iaşi, Romania Prof. dr. Liviu MIRON - USAMV Iaşi, Romania Prof. dr. Benone PĂSĂRIN - USAMV Iaşi, Romania
COLEGIUL DE REDACłIE AL SERIEI „HORTICULTURĂ”
Redactor şef: Prof. dr. Lucia DRAGHIA – USAMV Iaşi, Romania
Redactor adjunct: Prof. dr. Liliana ROTARU– USAMV Iaşi, Romania
Membri: Acad. Valeriu D. COTEA – USAMV Iaşi, Romania Prof. dr. Ibrahim BAKTIR - Akdeniz University, Faculty of Agriculture, Turkey Prof. dr. Valerian BALAN - UASM Chişinău, R. Moldova Prof. dr. Gheorghe CIMPOIEŞ - UASM Chişinău, R. Moldova Prof. dr. Monika CHRISTMANN - Forschungsamstalt Geisenheim University, Germany Prof. dr. Valeriu V. COTEA - USAMV Iaşi, România Prof. dr. Carmelo DAZZI - Università di Palermo, Italy Prof. dr. Athanasios ECONOMOU - Aristotle Univ. Thessaloniki, Greece Prof. dr. Gheorghe GLĂMAN - ASAS Bucureşti, Romania Prof. dr. Stefano GREGO - Univ. Tuscia-Viterbo, Italia Prof. dr. Gonca GÜNVER DALKILIÇ - Adnan Menderes University, Turkey Prof. dr. Neculai MUNTEANU - USAMV Iaşi, Romania Prof. dr. Vicente SOTÉS RUIZ - Universidad Politécnica de Madrid, ETSIA, Espagne Assist. Prof. dr. Zeynel DALKILIÇ - Adnan Menderes University, Turkey Conf. dr. Gheorghe NICOLAESCU - UASM Chişinău, R. Moldova Dr. Hervé QUÉNOL - CNRS - Université de Haute Bretagne - Rennes 2, France C.S. I dr. ing. Silvia AMBÃRUŞ - SCDL Bacău, Romania C.S. I dr. ing. Eugen CÂRDEI - SCDPP Iaşi, Romania C.S. I dr. ing. Doina DAMIAN - SCDVV Iaşi, Romania C.S. I dr. arh. Mariana ŞLAPAC - Institutul Patrimoniului Cultural al Academiei
de ŞtiinŃe a R. Moldova
COMISIA DE REFERENłI ŞTIINłIFICI
Prof. dr. Valeriu V. COTEA - USAMV Iaşi Prof. dr. Lucia DRAGHIA - USAMV Iaşi Prof. dr. Mihai ISTRATE - USAMV Iaşi Prof. dr. Doina JITĂREANU - USAMV Iaşi Prof. dr. Valeriu MOCA - USAMV Iaşi Prof. dr. Neculai MUNTEANU - USAMV Iaşi Prof. dr. Servilia OANCEA - USAMV Iaşi Prof. dr. Teodor ROBU- USAMV Iaşi Prof. dr. Liliana ROTARU - USAMV Iaşi Prof. dr. Mihai TĂLMACIU - USAMV Iaşi Prof. dr. Ioan łENU - USAMV Iaşi Prof. dr. Eugen ULEA - USAMV Iaşi Prof. dr. Ilie BURDUJAN - USAMV Iaşi
Prof. dr. Stej. BREZULEANU-USAMV Iaşi Prof. dr. CuliŃă SÎRBU - USAMV Iaşi Conf. dr. Doina DASCĂLU USAMV Iaşi Conf. dr. Feodor FILIPOV - USAMV Iaşi Conf. dr. Elena GÎNDU - USAMV Iaşi Conf. dr. Mihai MUSTEA - USAMV Iaşi Conf. dr. Cornelia PRISĂCARU - USAMV Iaşi Conf. dr. Lucia TRINCĂ - USAMV Iaşi Conf. dr. Mihai STANCIU - USAMV Iaşi Şef lucr. dr. Liviu IRIMIA - USAMV Iaşi Şef lucr. dr. Antoanela PATRAŞ - USAMV Iaşi Şef lucr. dr. Tatiana SANDU - USAMV Iaşi Şef lucr. dr. Alina TROFIN - USAMV Iaşi
© Editura “Ion Ionescu de la Brad” Iaşi ISSN–L=1454-7376 (Print)-ISSN 1454-7376 (Online)=ISSN 2069-8275 (CD-ROM) = ISSN 2069 – 847X
2
COORDINATOR OF JOURNAL „LUCRĂRI ŞTIINłIFICE”
Manager Editor: Prof. PhD. Vasile VÎNTU - UASVM Iasi, Romania Assistant Editor: Prof. PhD. Constantin LEONTE - UASVM Iasi, Romania
Members: Prof. PhD. Lucia DRAGHIA - UASVM Iasi, Romania Prof. PhD. Teodor ROBU - UASVM Iasi, Romania Prof. PhD. Liviu MIRON - UASVM Iasi, Romania Prof. PhD. Benone PĂSĂRIN - UASVM Iasi, Romania
EDITORIAL BOARD OF „HORTICULTURA”
Editor in chief Prof. PhD. Lucia DRAGHIA – UASVM Iasi, Romania
Assistant Editor Prof. PhD. Liliana ROTARU – UASVM Iasi, Romania
Editors: Acad. Valeriu D. COTEA – USAMV Iaşi, Romania Prof. PhD. Ibrahim BAKTIR - Akdeniz University, Faculty of Agriculture, Turkey Prof. PhD. Valerian BALAN - UASM Chişinău, R. Moldova Prof. PhD. Gheorghe CIMPOIEŞ - UASM Chişinău, R. Moldova Prof. PhD. Monika CHRISTMANN - Forschungsamstalt Geisenheim University, Germany Prof. PhD. Valeriu V. COTEA - USAMV Iaşi, România Prof. PhD. Carmelo DAZZI - Università di Palermo, Italy Prof. PhD. Athanasios ECONOMOU - Aristotle Univ. Thessaloniki, Greece Prof. PhD. Gheorghe GLĂMAN - ASAS Bucureşti, Romania Prof. PhD. Stefano GREGO - Univ. Tuscia-Viterbo, Italia Prof. PhD. Gonca GÜNVER DALKILIÇ - Adnan Menderes University, Turkey Prof. dr. Neculai MUNTEANU - USAMV Iaşi, Romania Prof. PhD. Vicente SOTÉS RUIZ - Universidad Politécnica de Madrid, ETSIA, Espagne Assist. Prof. PhD. Zeynel DALKILIÇ - Adnan Menderes University, Turkey Assist. Prof. PhD. Gheorghe NICOLAESCU - UASM Chişinău, R. Moldova Dr. Hervé QUÉNOL - CNRS - Université de Haute Bretagne - Rennes 2, France C.S. I PhD. Silvia AMBÃRUŞ - SCDL Bacău, Romania C.S. I PhD. Eugen CÂRDEI - SCDPP Iaşi, Romania C.S. I PhD. Doina DAMIAN - SCDVV Iaşi, Romania C.S. I PhD. Mariana ŞLAPAC - Institutul Patrimoniului Cultural al Academiei de
ŞtiinŃe a R. Moldova
SCIENTIFIC REVIEWERS
Prof. PhD. Valeriu V. COTEA - USAMV Iaşi Prof. PhD. Lucia DRAGHIA - USAMV Iaşi Prof. PhD. Mihai ISTRATE - USAMV Iaşi Prof. PhD. Doina JITĂREANU - USAMV Iaşi Prof. PhD. Valeriu MOCA - USAMV Iaşi Prof. PhD. Neculai MUNTEANU - USAMV Iaşi Prof. PhD. Servilia OANCEA - USAMV Iaşi Prof. PhD. Teodor ROBU- USAMV Iaşi Prof. PhD. Liliana ROTARU - USAMV Iaşi Prof. PhD. Mihai TĂLMACIU - USAMV Iaşi Prof. PhD. Ioan łENU - USAMV Iaşi Prof. PhD. Eugen ULEA - USAMV Iaşi Prof. PhD. Ilie BURDUJAN - USAMV Iaşi
Prof. PhD. Stej. BREZULEANU-USAMV Iaşi Prof. PhD. CuliŃă SÎRBU - USAMV Iaşi Rd. PhD. Doina DASCĂLU USAMV Iaşi Rd. PhD. Feodor FILIPOV - USAMV Iaşi Rd. PhD. Elena GÎNDU - USAMV Iaşi Rd. PhD. Mihai MUSTEA - USAMV Iaşi Rd. PhD. Cornelia PRISĂCARU - USAMV Iaşi Rd. PhD. Lucia TRINCĂ - USAMV Iaşi Rd. PhD. Mihai STANCIU - USAMV Iaşi Lect. PhD. Liviu IRIMIA - USAMV Iaşi Lect. PhD. Antoanela PATRAŞ - USAMV Iaşi Lect. PhD. Tatiana SANDU - USAMV Iaşi Lect. PhD. Alina TROFIN - USAMV Iaşi
“Ion Ionescu de la Brad” Publishing House Iaşi ISSN–L=1454-7376 (Print)-ISSN 1454-7376 (Online)=ISSN 2069-8275 (CD-ROM) = ISSN 2069 – 847X
3
CONTENT
1. PRISĂCARU Cornelia - Research study on the assessment of the
antitoxic action of various phytopreparates derived from the
vegetal products of Levisticum officinale ......................................... 11
2. TRINCĂ Lucia Carmen, ARITON Adina Mirela,KAYNAR Ozgur, SEZER Kenan, GUBUK Hamide, KARAKAS Barcin - Lipid fractions analysis in pork meat by High-Performance Thin
Layer Chromatography ..................................................................... 17
3. UNGUREANU Elena, TROFIN Alina, JITĂREANU Doina, POPA I.V. - Testing of adhesives capacity for some systems based
lignocellulosic composites by assessing the mechanical properties . 23
4. SLONOVSCHI A., PRUNĂ L. - E-Line, a computer program used
in E-learning ..................................................................................... 29
5. VÎNĂTORU C., SCURTU I. - Achievements and objectives for
tomato breeding in Romania ............................................................. 35
6. PÎNTEA Maria - Histochemical researches regarding abnormalies
within the development of walnut (Juglans regia L.) male
reproductive system .......................................................................... 41
7. JITĂREANU Carmenica Doina, SLABU Cristina, MARTA Alina Elena - Research study on the dynamics of the content of
photosynthetic pigments at some grapevine varieties in the
vegetation year 2013 ......................................................................... 47
8. MARTA Alina Elena, JITĂREANU Carmenica Doina, SLABU Cristina - Research conducted during the dormant period in
grapevine .......................................................................................... 53
9. STOLERU V., MUNTEANU N., STAN T., AVASILOAIEI D.I. - Study on the application of bioregulatory substances in organic
tomato crop ....................................................................................... 61
10. ISTRATE A., ROTARU Liliana, IONIȚĂ F., STOLERU V., SELLITTO V.M., HARAS Diana Gabriela - Study regarding the
farmers attitude towards organic agriculture .................................... 67
11. COJOCARU A., MUNTEANU N., STOLERU V., IPĂTIOAIEI C.D. - Influence of planting distances and mulching methods
influence on rhubarb crop ................................................................. 73
12. DOLTU Mădălina, BOGOESCU M., SORA D. - Establishment of
technology for asexual multiplying by grafting of some cultivars of
melons cultivated in Romania ...................................................... 79
13. MUNTEAN Delia, FASOLA Alexandra - Research on the
deployment of the physiological processes during the growth and
the fruiting of the Cucurbita pepo species ........................................ 85
4
14. STOLERU V., MUNTEANU N., TELIBAN G.C., HAMBURDĂ
Silvia Brînduşa - Comparative behavior for a new carrot
assortment in the NE area ................................................................. 91
15. ARHIP (ÎNSURĂȚELU) Ioana Cristina, DRAGHIA Lucia - The
influence of gibberellic acid on growth and development of callas
cultivated in the greenhouse ............................................................. 97
16. MURARIU (COJOCARIU) Mirela, DRAGHIA Lucia - The
influence of the cuttings epoch regarding the rooting at Aster
Novae-Angliae species ...................................................................... 103
17. ISTRATE M., FLOREA M., DASCALU M. - Study on
improvement of production technology by grafted walnut
seedlings ........................................................................................... 109
18. ILIE Alina, PETRIŞOR Cristina, DUMITRU Maria - Avaluation
of yield potential and fruit quality of titlu some strawberry
varieties cultivated under southeast condition of Romania .............. 115
19. SAVA Parascovia - Study on assessment of productivity of
gooseberry variety ............................................................................ 121
20. SÎRBU Sorina, IUREA Elena, CORNEANU G. - Research
concerning the influence of climate condition over the
phenological stages at walnut tree (Juglans regia L.) ...................... 127
21. SILIVĂȘAN M., BERAR C., TOłA C., MERGHEŞ P. - Study
on establishment of a crown-shaped fruit fence, palmet chandelier
with six arms and belgian fence system and how to use their in
landscaping ....................................................................................... 133
22. BEȘLEAGĂ Ramona, CÂRDEI E., CORNEANU G. - The
phytosanitary protection in cherry plantations ................................. 139
23. CORNEA V., STARCIUC Daniela, TOFAN Svetlana, BÎRSA Elena, MATEI Iraida, SAVIN Gh. - Evaluation of some
autochthonous grapevine varieties presented in the genofond of
ISPHTA ............................................................................................ 145
24. NECHITA Ancuta, SAVIN C., PAŞA Rodica, ZALDEA Gabi, DAMIAN Doina, NECHITA C. B. - Assessment of quality of
wine grapes of vine varieties grown in Iasi Copou wine center ....... 151
25. DONICI Alina, BURLACU C., HODOR Daniela, NEGRARU Ana, DAMIAN Doina, STOIAN Ileana, DUMITRU Doina - The
agrophytotech and technology study of variety Fetească regală
grown in area culture different ......................................................... 157
26. ZALDEA Gabi, NECHITA Ancuta, CODREANU Maria, DAMIAN Doina - Influence of climatic conditions on the quality
of grapes and wines obtained from Aligoté and Fetească regală
varieties cultivated in Iaşi-Copou viticultural center ........................ 163
5
27. ENACHE Viorica, DONICI Alina - Research on minimizing the
disruptive effect of climate change on viticulture by applying
adapted technologies ......................................................................... 169
28. TÃBÃRANU G., ENACHE Viorica, DONICI Alina - Influence of
climatic conditions on the incidence of the entomofauna useful on
vineyard ecosystem Dealu Bujorului ................................................ 175
29. COLIBABA Cintia, COTEA V.V., ROTARU Liliana, NICULAUA M., VARARU F., LUCHIAN Camelia - Studies of
the influence of some conditioning treatments on some volatile
compounds in Fetească albă wines ................................................... 181
30. LUCHIAN Camelia, COTEA V.V., PATRAŞ Antoanela, CODREANU Maria, COLIBABA Cintia, KOKKINOFTA Rebecca - Physico-chemical analysis of wines produced from local
varieties in Romania and Republic of Moldova ............................... 187
31. MOROȘANU Ana-Maria, COTEA V.V., NICULAUA M., COLIBABA Cintia, NECHITA C.B. TARȚIAN A. - Study of the
climatic influence on the compositional characteristics of wines
obtained in the Copou Hill vineyard ................................................. 193
32. POSTOLACHE Elena, CIUBUCĂ A., BÎRLIGA N. - Influence
of the differentiated climatic conditions on composition of wines
obtained in the Dealu Bujorului’vineyard ......................................... 199
33. TARłIAN A.C., COTEA V.V., NICULAUA M., COLIBABA Cintia, NECHITA C.B. , MOROȘANU Ana-Maria - Research on
the influence of the pedoclimatic conditions from Dealu Bujorului,
Cotnari and Iaşi vineyards on the physico-chemical characteristics
of the Fetească albă and Busuioacă de Bohotin wines ..................... 205
34. NECHITA C.B., COTEA V.V., NICULAUA M. - Using Gas -
Chromatography to distinguish the wine and still fermented
beverages .......................................................................................... 211
35. NICULAUA M., MOROȘANU Ana Maria, VĂRARU F., MORARU I., NECHITA C.B., COTEA V.V. - Volatile organic
compounds in some white wines of Iaşi vineyard ............................ 217
36. BERAR C., LISANDRU Tabita-Teodora, SILIVĂȘAN M., BĂLA Maria, TOȚA Cristina - Researches on landscape planning
of green space in the Arad county hospital ....................................... 223
37. GRIGOROVSCHI M., GHEORGHIłĂ ConstanŃa Carmina - Reshaping the cityscape through small landscape designs .............. 229
38. DUMITRAŞCU Aurora Irina, NICA R.M., CORDUBAN C.G. - Urban green - the potential of city’s residual areas .......................... 235
39. GRECU Codrina, PURCARU Andrei - Comparative analysis of
landscape design of bell-view points on the slopes of cities Lisbon
and Iassy ........................................................................................... 241
6
40. CEHAN Agata Mihaela, GHEORGHIȚĂ ConstanŃa Carmina - Ornaments of vegetal inspiration in orthodox architecture .............. 247
41. OANCEA Servilia, PÃDUREANU Silvica, CAZACU Ana, OANCEA A.V. - About the radioactivity of some agricultural
products from areas near Crucea uranium mine ............................... 253
42. MURAD E. - Applying the CHAB concept at horticultural tunnel
greenhouses heated with biomass ..................................................... 257
43. POHOAłĂ LUPU Oana, DRAGHIA Lucia - Stormwater
management: The role of urban trees ............................................... 263
44. ARHIP (ÎNSURĂȚELU) Ioana Cristina, DRAGHIA Lucia - The
influence of giberellic acid on callas grown in pots ......................... 269
45. LAMBAN Carmen, CORNEANU Margareta - Annual increases
of plants in the climatic conditions of the years 2012-2014 ............. 275
46. MORENO-GARCÍA J., DUMITRIU Georgiana-Diana, GARCÍA-MARTÍNEZ Teresa, MILLÁN M. Carmen, MAURICIO J.C., MORENO J. - Flor yeast cellular components 281
7
CUPRINS
1. PRISĂCARU Cornelia - Cercetări referitoare la evaluarea acŃiunii antitoxice ale unor fitopreparate derivate de la produse vegetale de
Levisticum officinale ......................................................................... 11 2. TRINCĂ Lucia Carmen, ARITON Adina Mirela,KAYNAR
Ozgur, SEZER Kenan, GUBUK Hamide, KARAKAS Barcin - Analiza fracŃiunilor lipidice din carnea de porc prin cromatografie în strat subŃire de inaltă performanŃă ............................................ 17
3. UNGUREANU Elena, TROFIN Alina, JITĂREANU Doina, POPA I.V. - Testarea capacitatii adezive a unor sisteme pe bază de compozite lignocelulozice prin evaluarea proprietăŃilor mecanice .. 23
4. SLONOVSCHI A., PRUNĂ L. - E-Line, un program calculator utilizat în E-learning ........................................................................ 29
5. VÎNĂTORU C., SCURTU I. - Realizări şi obiective de viitor în ameliorarea tomatelor în România ................................................... 35
6. PÎNTEA Maria - Cercetări histochimice privind la anomaliile
întâlnite în procesul dezvoltării sistemului reproductiv masculin al nucului (Juglans regia L.) ................................................................ 41
7. JITĂREANU Carmenica Doina, SLABU Cristina, MARTA Alina Elena - Cercetări privind dinamica conŃinutului de pigmenŃi
fotosintetici la unele soiuri de viŃă de vie în perioada de vegetaŃie a anului 2013 ....................................................................................... 47
8. MARTA Alina Elena, JITĂREANU Carmenica Doina, SLABU Cristina - Cercetări efectuate în timpul repausului vegetativ la viŃa de vie ........................................................................................ 53
9. STOLERU V., MUNTEANU N., STAN T., AVASILOAIEI D.I. - Studiu privind utilizarea substantelor bioregulatoare in cultura de tomate ecologică .............................................................................. 61
10. ISTRATE A., ROTARU Liliana, IONIȚĂ F., STOLERU V., SELLITTO V.M., HARAS Diana Gabriela - Studiu privind
atitudinea producătorilor faŃă de agricultura ecologică .................. 67 11. COJOCARU A., MUNTEANU N., STOLERU V., IPĂTIOAIEI
C.D. - Influența distanțelor de plantare și a mulcirii asupra
producției la revent ................................................................. 73 12. DOLTU Mădălina, BOGOESCU M., SORA D. - Stabilirea
tehnologiei de multiplicare asexuată prin altoire a unor cultivare de pepeni galbeni cultivaŃi în România ................................................. 79
13. MUNTEAN Delia, FASOLA Alexandra - Cercetări privind
desfășurarea unor procese fiziologice în timpul creșterii și fructificării speciei Cucurbita pepo................................................... 85
8
14. STOLERU V., MUNTEANU N., TELIBAN G.C., HAMBURDĂ Silvia Brînduşa - Comportarea în cultură comparativă a unui sortiment de morcov în zona de nord-est ...................................... 91
15. ARHIP (ÎNSURĂȚELU) Ioana Cristina, DRAGHIA Lucia - Influența acidului giberelic asupra creșterii și dezvoltării calelor
cultivate în seră ................................................................................ 97 16. MURARIU (COJOCARIU) Mirela, DRAGHIA Lucia - Influența
epocii de butășire asupra înrădăcinării butașilor de Aster Novae-
Angliae ........................................................................................... 103 17. ISTRATE M., FLOREA M., DASCALU M. - Studiu privind
îmbunătăŃirea tehnologiei de producere a materialului saditor prin altoire la nuc ................................................................................. 109
18. ILIE Alina, PETRIŞOR Cristina, DUMITRU Maria - Evaluarea
potenŃialului agroproductiv al calităŃii fructelor la unele soiuri de căpşun cultivate în condiŃiile din sud-estul României ...................... 115
19. SAVA Parascovia - Studiu referitor la aprecierea productivității unor soiuri de agriș ........................................................................... 121
20. SÎRBU Sorina, IUREA Elena, CORNEANU G. - Cercetări
privind influenŃa condiŃiilor climatice asupra stadiilor fenologice la nuc (Juglans regia L.) ...................................................................... 127
21. SILIVĂȘAN M., BERAR C., TOłA C., MERGHEŞ P. - Studiu privind realizarea formelor de coroană pentru garduri fructifere în sistemele palmeta candelabru cu şase brațe şi sistemul gard belgian
şi modul de utilizare a acestora în amenajări peisagistice ................ 133 22. BEȘLEAGĂ Ramona, CÂRDEI E., CORNEANU G. - Protecția
fitosanitară în plantațiile de cireș ..................................................... 139 23. CORNEA V., STARCIUC Daniela, TOFAN Svetlana, BÎRSA
Elena, MATEI Iraida, SAVIN Gh. - Evaluarea unor soiuri de viŃă de vie autohtone prezente în genofondul ISPHTA ......................... 145
24. NECHITA Ancuta, SAVIN C., PAŞA Rodica, ZALDEA Gabi, DAMIAN Doina, NECHITA C. B. - Evaluarea calitatii strugurilor pentru vin a unor soiuri de vită de vie cultivate în centrul viticol
Copou Iaşi ......................................................................................... 151 25. DONICI Alina, BURLACU C., HODOR Daniela, NEGRARU
Ana, DAMIAN Doina, STOIAN Ileana, DUMITRU Doina - Studiul agrofitotehnic şl tehnologic al soiului Fetească regală cultivat în areale diferite de cultură ................................................. 157
26. ZALDEA Gabi, NECHITA Ancuta, CODREANU Maria, DAMIAN Doina - InfluenŃa condiŃiilor climatice asupra calităŃii strugurilor şi a vinurilor din soiurile Aligoté şi Fetească regală
cultivate în centrul viticol Copou Iaşi ............................................... 163
9
27. ENACHE Viorica, DONICI Alina - Cercetări privind
minimizarea efectului perturbator al schimbărilor climatice în viticultură prin aplicarea unor tehnologii viticole adaptate .............. 169
28. TÃBÃRANU G., ENACHE Viorica, DONICI Alina - InfluenŃa condiŃiilor climatice asupra incidenŃei entomofaunei utile în
ecosistemul viticol din podgoria Dealu Bujorului ........................... 175 29. COLIBABA Cintia, COTEA V.V., ROTARU Liliana,
NICULAUA M., VĂRARU F., LUCHIAN Camelia - Studii
asupra influenței unor tratamente de condiționare asupra unor compuși volatili în vinuri de Fetească albă ..................................... 181
30. LUCHIAN Camelia, COTEA V.V., PATRAŞ Antoanela, CODREANU Maria, COLIBABA Cintia, KOKKINOFTA Rebecca - Analiza fizico-chimică a unor vinuri obținute din soiuri
autohtone din România și Republica Moldova ............................... 187 31. MOROȘANU Ana-Maria, COTEA V.V., NICULAUA M.,
COLIBABA Cintia, NECHITA C.B. TARȚIAN A. - Studiul influenței condițiilor climatice asupra caracteristiciilor compoziționale ale unor vinuri obținute în podgoria Copou ............ 193
32. POSTOLACHE Elena, CIUBUCĂ A., BÎRLIGA N. - Influenta conditiilor climatice diferenŃiate asupra compoziŃiei vinurilor
obŃinute în podgoria Dealu Bujorului ......................................... 199 33. TARłIAN A.C., COTEA V.V., NICULAUA M., COLIBABA
Cintia, NECHITA C.B. , MOROȘANU Ana-Maria - Cercetări
privind influenŃa condiŃiilor pedoclimatice din podgoria Dealu Bujorului, Cotnari şi Iaşi asupra caracteristicilor fizico-chimice ale
vinurilor de Fetească albă şi Busuioacă de Bohotin ........................ 205 34. NECHITA C.B., COTEA V.V., NICULAUA M. - Utilizarea gaz-
cromatografiei în vederea diferențierii vinurilor și băuturilor fermentate liniștit ............................................................................. 211
35. NICULAUA M., MOROȘANU Ana Maria, VĂRARU F., MORARU I., NECHITA C.B., COTEA V.V. - Compuși organici volatili la unele vinuri albe din podgoria Iași ................................. 217
36. BERAR C., LISANDRU Tabita-Teodora, SILIVĂȘAN M., BĂLA Maria, TOȚA Cristina - Cercetări privind amenajarea peisageră a spațiului verde din cadrul spitalului clinic județean
Arad .................................................................................................. 223 37. GRIGOROVSCHI M., GHEORGHIłĂ ConstanŃa Carmina -
Remodelarea peisajului urban prin amenajări peisagistice de dimensiuni reduse ............................................................................ 229
38. DUMITRAŞCU Aurora Irina, NICA R.M., CORDUBAN C.G. - Verdele urban - potențialul zonelor urbane reziduale ..................... 235
39. GRECU Codrina, PURCARU Andrei - Analiza comparativă a
amenajărilor peisagistice ale punctelor belvedere de pe versanții orașelor Lisabona și Iași .............................................................. 241
10
40. CEHAN Agata Mihaela, GHEORGHIȚĂ ConstanŃa Carmina -
Ornamente de inspirație vegetală în arhitectura spațiului de cult ortodox ............................................................................................. 247
41. OANCEA Servilia, PÃDUREANU Silvica, CAZACU Ana, OANCEA A.V. - Despre radioactivitatea unor produse agricole din
vecinãtatea minei de uraniu Crucea .................................................. 253 42. MURAD E. - Aplicarea conceptului CHAB la solariile horticole
încălzite cu biomasă .......................................................................... 257
43. POHOAłĂ LUPU Oana, DRAGHIA Lucia - Rolul arborilor urbani în gestionarea apei pluviale ................................................... 263
44. ARHIP (ÎNSURĂȚELU) Ioana Cristina, DRAGHIA Lucia - Influența acidului giberelic asupra calelor cultivate la ghivece ....... 269
45. LAMBAN Carmen, CORNEANU Margareta - Creşterile anuale
ale plantelor dendrologice în condiŃiile climatice ale anilor 2012-2014 .................................................................................................. 275
46. MORENO-GARCÍA J., DUMITRIU Georgiana-Diana, GARCÍA-MARTÍNEZ Teresa, MILLÁN M. Carmen, MAURICIO J.C., MORENO J. - Componentele celulare a
levurilor peliculare ............................................................................ 281
11
RESEARCH STUDY ON THE ASSESSMENT OF THE ANTITOXIC ACTION OF VARIOUS PHYTOPREPARATES
DERIVED FROM THE VEGETAL PRODUCTS OF LEVISTICUM OFFICINALE
CERCETĂRI REFERITOARE LA EVALUAREA ACŢIUNII
ANTITOXICE ALE UNOR FITOPREPARATE DERIVATE DE LA PRODUSE VEGETALE DE LEVISTICUM OFFICINALE
PRISĂCARU Cornelia1
e-mail: [email protected]
Abstract. The thermal processing of food leads to the formation of certain
toxins that are included on the list of the 1st group human carcinogens. Among
them we can also mention acrylamide, a substance with two unsaturation
centres and high toxicity level manifested by embryotoxicity, neurotoxicity and
carcinogenicity. The experiment included in this study is part of a wider series
of experiments that are conducted in parallel: finding the ways of shunting
(avoiding or diminishing) the formation of acrylamide and the identification of
new ways for phyto-chemoprevention in the case of acrylamide intoxication.
The present experiment was intended to test the antitoxic effect of the phthalides
form different lovage phytopreparates, being known that acrylamide manifests
its toxicity as the free radical of the major metabolite, glycidamide. The
experimental model relies on the use of four groups of white Wistar rats, which
after a subacute intoxication with acrylamide are treated with Levistici
aetheroleum, Levistici semen (infusion 5%) and Levistici herba (infusion 5%).
The results of the biochemical test battery performed at the end of the
experiment (hepatic cytolysis and proteosynthesis indicators) underline the high
antitoxic potential of the lovage volatile oil. Key words: acrylamide, glycidamide, Levistici aetheroleum, Levistici herba,
Levistici semen, hepatic cytolysis indicators, proteosynthesis indicators
Rezumat. Prelucrarea termică a alimentelor induce formarea unor toxice aflate
pe lista carcinogenilor umani de grad I. Printre acestea se află şi acrilamida,
substanţă posesoare a două centre de nesaturare şi a unei toxicităţi ridicate,
manifestate prin embriotoxicitate, neurotoxicitate şi carcinogenitate.
Experimentul descris în această lucrare este segment dintr-un lung şir de
experimente ce se desfăşoare pe două planuri paralele: găsirea unor căi de
şuntare (evitare sau diminuare) a fenomenului de formare a acrilamidei şi
descoperirea unor căi de fitochemoprevenţie a intoxicaţiei cu acrilamidă.
Prezentul experiment a avut ca scop testarea efectului antitoxic al ftalidelor din
diferite fitopreparate de leuştean, cunoscut fiind faptul că acriliamida îşi
exercită toxicitatea sub forma radicalului liber al metabolitului major,
glicidamida. Modelul experimental se bazează pe utilizarea a 5 loturi de
şobolani albi, linia Wistar, care pe fundalul unei intoxicaţii subacute cu
acrilamidă, sunt trataţi cu Levistici aetheroleum, Levistici semen (infuzie 5%)
1 University of Agricultural Sciences and Veterinary Medicine of Iasi, Romania
12
şi Levistici herba (infuzie 5%). Rezultatele bateriei de teste biochimice efectuate
la finalul experimentului (indicatori de citoliză hepatică şi de proteosinteză
hepatică) evidenţiază un puternic potenţial antitoxic pentru uleiul volatil de
Leuştean.
Cuvinte cheie: acrilamida, glicidamida, Levistici aetheroleum, Levistici herba,
Levistici semen, indicatori de citoliza hepatica, indicatori de proteosinteza
INTRODUCTION
Acrylamide, a double unsaturated chemical compound widely used in the
industry, is characterized by a powerful toxicogenic potential that manifests itself
by neurotoxicity, carcinogenicity, embryotoxicity and it influences the
reproductive system. Acrylamides originate in the thermal processing process of
food consisting of amino acids and glucides, when formed mainly from the
precursors of Maillard reaction. The high incidence of acrylic amide in basic
aliments correlated with its aggressive toxicity requires the identification of ways
to diminish the toxicity level and to prevent/limit its apparition in food (Chudaet
al., 2003). Due to the fact that acrylamide expresses its toxicity as the epoxidic
radical (Fennel et al., 2003; Sumner et al., 2003) it is considered that its toxic effects
might be diminished using various active principles of plants (Prisăcaru and Rotaru,
2008; Prisăcaru et al., 2008; Burlacu, 2009). In this context, the interest in identifying
ways of diminishing the toxicity level of acrylamide, that first manifests itself at
the level of the hepatocyte, where, at the level of the microsomes, takes place its
metabolization, might be oriented toward vegetal products that include phtalides,
substances with antitoxic role at this level (Prisăcaru, 2010). Based on this
information, actions have been taken to test the role of phtalides from lovege as
some phytopreparates: Levistici aetheroleum, Levistici herba and Levistici semen.
MATERIAL AND METHOD
The experimental model (table 1) presented in this study can be included in the category of those experiments focused on the study of the ways of reducing the toxicity level of acrylamide and it intends to assess the biochemical modifications resulted in case of intoxication caused by the administration of a dose of 50 mg acrylamide/kg body mass, as well as the assessment of the possible protective effect of some phytopreparates obtained from lovage in case of subacute acrylamide intoxication.
The experiment was conducted on 5 groups of male Wistar rats and it lasted four weeks. The first group represented the reference group and it included 5 animals that were kept in the same ecologic conditions as the rats of the other groups. The second group, consisted of the same number of animals, and provided information on the toxic effect of acrylamide, the toxic substance being administered to them in a dose of 50 mg/kg body mass. The animals from the third group (trial group 1) were given using the gavage technique, apart from the dose of acrylamide, 5 guttes of lovage volatile oil (Levistici aetheroleum). The fourth group, considered to be trial group 2, was simultaneously treated with a subacute dose of acrylic amide and 5 ml of aqueous extraction solution 5% of Levistici herba. The animals of the fifth group (trial group 3) benefited from the protection of 5 ml of extraction solution 5% of Levistici semen, the solution being administered using the gavage technique along with their
13
daily dose of acrylamide. At the end of the experiment blood samples were collected from the retroorbital plexus of the rats for biochemical analyses. These analyses consisted in assessing the liver integrity and the proteosynthetic function.
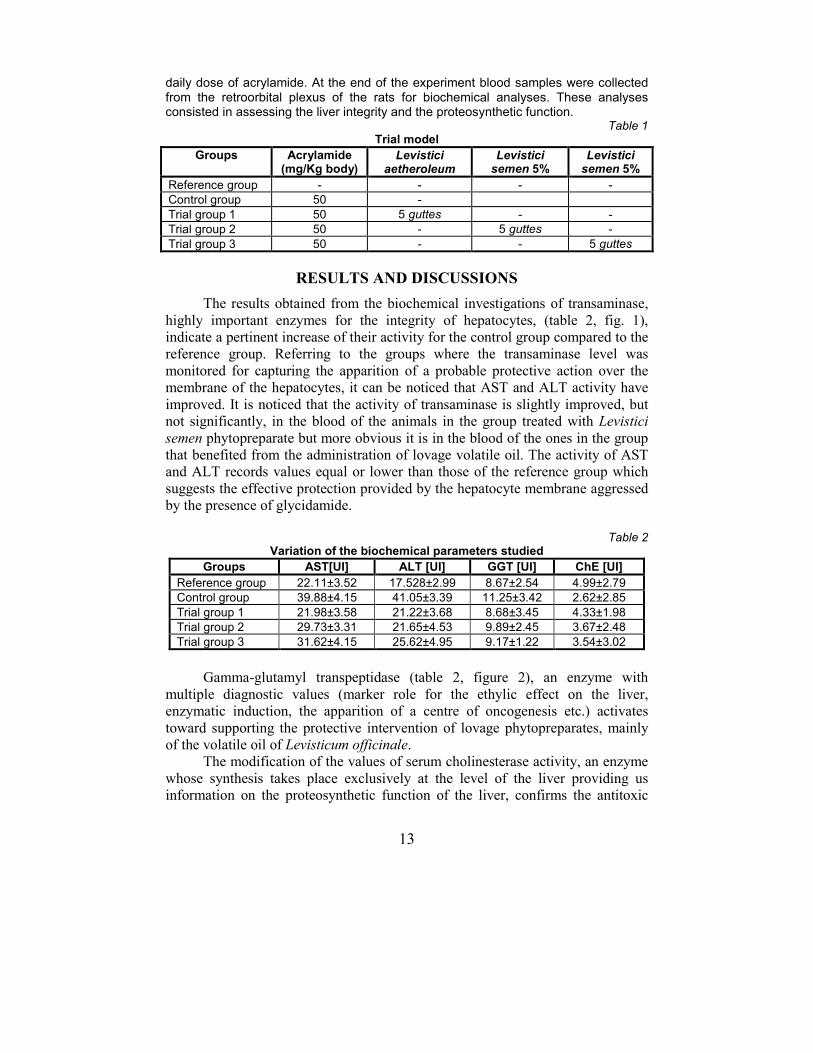
Table 1 Trial model
Groups Acrylamide (mg/Kg body)
Levistici
aetheroleum
Levistici
semen 5% Levistici
semen 5%
Reference group - - - -
Control group 50 -
Trial group 1 50 5 guttes - -
Trial group 2 50 - 5 guttes -
Trial group 3 50 - - 5 guttes
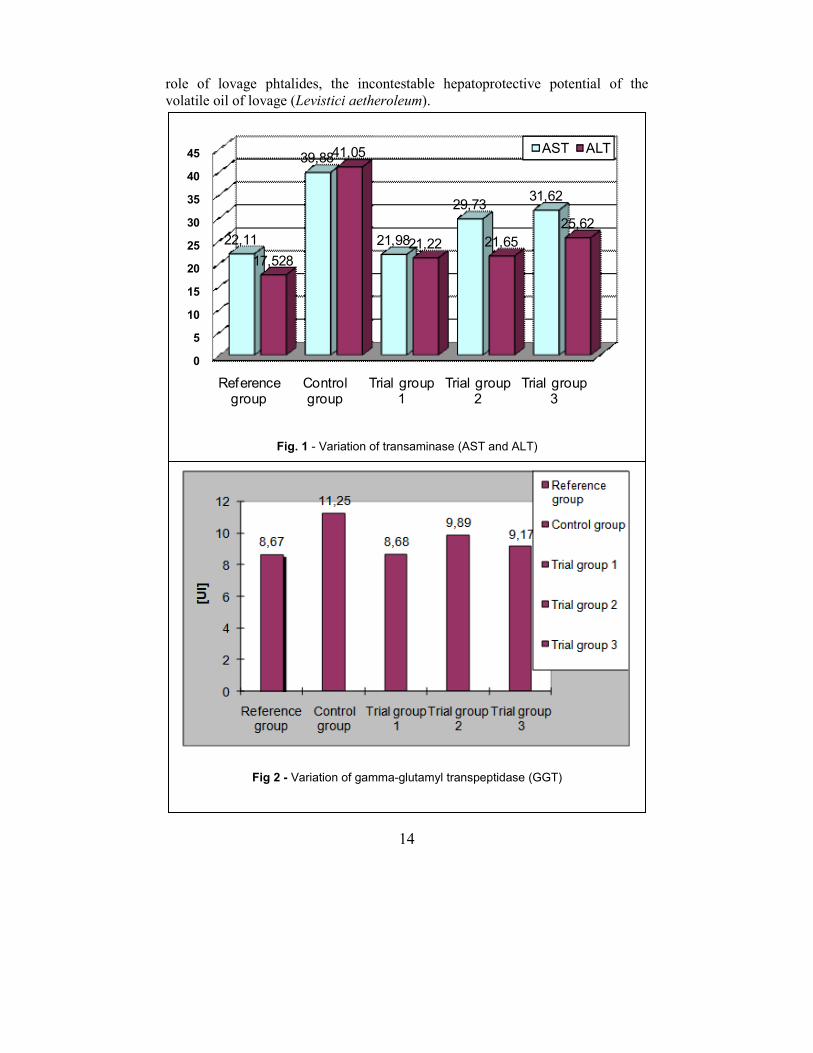
RESULTS AND DISCUSSIONS
The results obtained from the biochemical investigations of transaminase,
highly important enzymes for the integrity of hepatocytes, (table 2, fig. 1),
indicate a pertinent increase of their activity for the control group compared to the
reference group. Referring to the groups where the transaminase level was
monitored for capturing the apparition of a probable protective action over the
membrane of the hepatocytes, it can be noticed that AST and ALT activity have
improved. It is noticed that the activity of transaminase is slightly improved, but
not significantly, in the blood of the animals in the group treated with Levistici
semen phytopreparate but more obvious it is in the blood of the ones in the group
that benefited from the administration of lovage volatile oil. The activity of AST
and ALT records values equal or lower than those of the reference group which
suggests the effective protection provided by the hepatocyte membrane aggressed
by the presence of glycidamide.
Table 2
Variation of the biochemical parameters studied
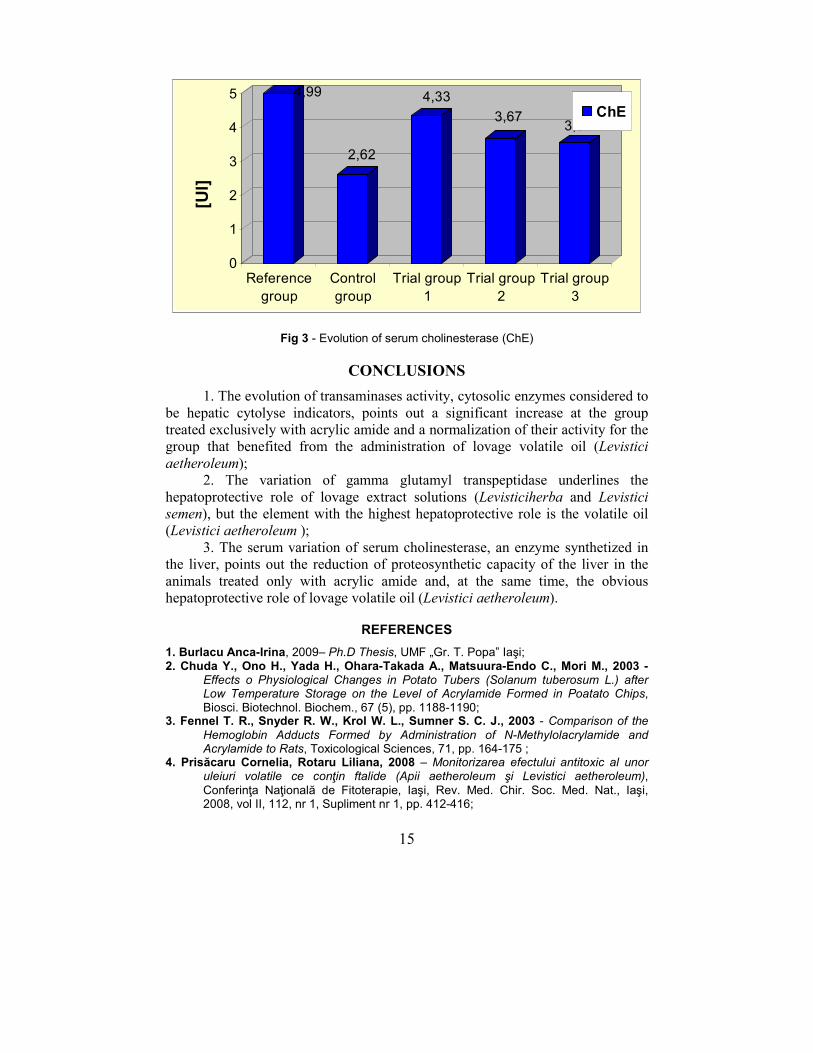
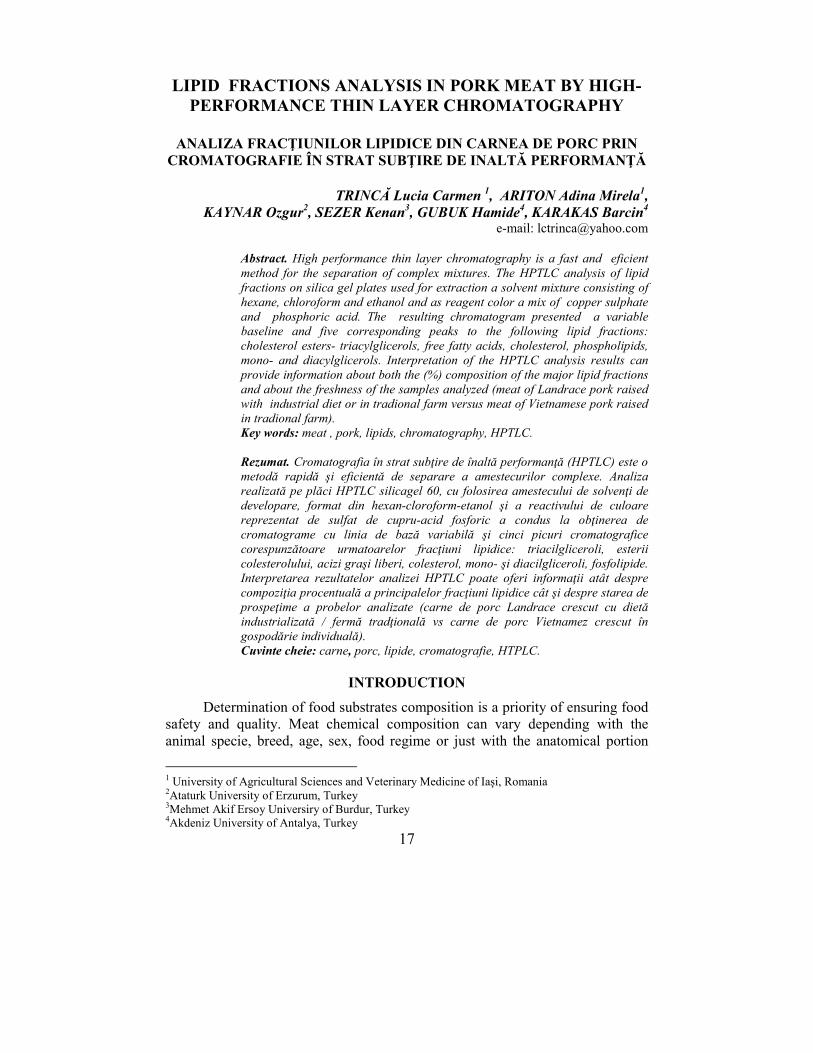
Groups AST[UI] ALT [UI] GGT [UI] ChE [UI]
Reference group 22.11±3.52 17.528±2.99 8.67±2.54 4.99±2.79
Control group 39.88±4.15 41.05±3.39 11.25±3.42 2.62±2.85
Trial group 1 21.98±3.58 21.22±3.68 8.68±3.45 4.33±1.98
Trial group 2 29.73±3.31 21.65±4.53 9.89±2.45 3.67±2.48
Trial group 3 31.62±4.15 25.62±4.95 9.17±1.22 3.54±3.02
Gamma-glutamyl transpeptidase (table 2, figure 2), an enzyme with
multiple diagnostic values (marker role for the ethylic effect on the liver,
enzymatic induction, the apparition of a centre of oncogenesis etc.) activates
toward supporting the protective intervention of lovage phytopreparates, mainly
of the volatile oil of Levisticum officinale.
The modification of the values of serum cholinesterase activity, an enzyme
whose synthesis takes place exclusively at the level of the liver providing us
information on the proteosynthetic function of the liver, confirms the antitoxic
14
role of lovage phtalides, the incontestable hepatoprotective potential of the
volatile oil of lovage (Levistici aetheroleum).
0
5
10
15
20
25
30
35
40
45
Reference group
Control group
Trial group 1
Trial group 2
Trial group 3
22,11
39,88
21,98
29,7331,62
17,528
41,05
21,22 21,65
25,62
AST ALT
Fig. 1 - Variation of transaminase (AST and ALT)
Fig 2 - Variation of gamma-glutamyl transpeptidase (GGT)
15
4,99
2,62
4,33
3,673,54
0
1
2
3
4
5
[UI]
Reference
group
Control
group
Trial group
1
Trial group
2
Trial group
3
ChE
Fig 3 - Evolution of serum cholinesterase (ChE)
CONCLUSIONS
1. The evolution of transaminases activity, cytosolic enzymes considered to
be hepatic cytolyse indicators, points out a significant increase at the group
treated exclusively with acrylic amide and a normalization of their activity for the
group that benefited from the administration of lovage volatile oil (Levistici
aetheroleum);
2. The variation of gamma glutamyl transpeptidase underlines the
hepatoprotective role of lovage extract solutions (Levisticiherba and Levistici
semen), but the element with the highest hepatoprotective role is the volatile oil
(Levistici aetheroleum );
3. The serum variation of serum cholinesterase, an enzyme synthetized in
the liver, points out the reduction of proteosynthetic capacity of the liver in the
animals treated only with acrylic amide and, at the same time, the obvious
hepatoprotective role of lovage volatile oil (Levistici aetheroleum).
REFERENCES
1. Burlacu Anca-Irina, 2009– Ph.D Thesis, UMF „Gr. T. Popa” Iaşi; 2. Chuda Y., Ono H., Yada H., Ohara-Takada A., Matsuura-Endo C., Mori M., 2003 -
Effects o Physiological Changes in Potato Tubers (Solanum tuberosum L.) after Low Temperature Storage on the Level of Acrylamide Formed in Poatato Chips, Biosci. Biotechnol. Biochem., 67 (5), pp. 1188-1190;
3. Fennel T. R., Snyder R. W., Krol W. L., Sumner S. C. J., 2003 - Comparison of the
Hemoglobin Adducts Formed by Administration of N-Methylolacrylamide and Acrylamide to Rats, Toxicological Sciences, 71, pp. 164-175 ;
4. Prisăcaru Cornelia, Rotaru Liliana, 2008 – Monitorizarea efectului antitoxic al unor uleiuri volatile ce conţin ftalide (Apii aetheroleum şi Levistici aetheroleum),
Conferinţa Naţională de Fitoterapie, Iaşi, Rev. Med. Chir. Soc. Med. Nat., Iaşi, 2008, vol II, 112, nr 1, Supliment nr 1, pp. 412-416;

16
5. Prisăcaru Cornelia, Burlacu Anca-Irina, Rotaru Liliana, 2008 – Evaluationa of
biochemical changes from oxidative stress specific to ochratoxicosis induced by Apii aetheroleum administration, Lucrări ştiinţifice USAMV, secţia Medicină Veterinară, Iaşi, vol. 51(10), pp. 140-143 ;
6. Prisăcaru Cornelia, 2010 - Monitoring the Antitoxic Effect of some Glutathione Rich
Vegetal Products, Lucrări ştiinţifice USAMV, secţia Medicină Veterinară, Iaşi, vol. 53(12), pp. 484-489;
7. Sumner S., Williams C. C., Snyder R. W., Krol W. L., Asgharian B., Fennel T. R., 2003 - Acrylamide: A Comparison of Metabolism and Hemoglobin Adducts in
Rodents following Dermal, Intraperitoneal, Oral, or Inhalation Exposure, Toxicological Science, 75, pp. 260-270;
17
LIPID FRACTIONS ANALYSIS IN PORK MEAT BY HIGH-PERFORMANCE THIN LAYER CHROMATOGRAPHY
ANALIZA FRACŢIUNILOR LIPIDICE DIN CARNEA DE PORC PRIN
CROMATOGRAFIE ÎN STRAT SUBŢIRE DE INALTĂ PERFORMANŢĂ
TRINCĂ Lucia Carmen 1, ARITON Adina Mirela1, KAYNAR Ozgur2, SEZER Kenan3, GUBUK Hamide4, KARAKAS Barcin4
e-mail: [email protected]
Abstract. High performance thin layer chromatography is a fast and eficient
method for the separation of complex mixtures. The HPTLC analysis of lipid
fractions on silica gel plates used for extraction a solvent mixture consisting of
hexane, chloroform and ethanol and as reagent color a mix of copper sulphate
and phosphoric acid. The resulting chromatogram presented a variable
baseline and five corresponding peaks to the following lipid fractions:
cholesterol esters- triacylglicerols, free fatty acids, cholesterol, phospholipids,
mono- and diacylglicerols. Interpretation of the HPTLC analysis results can
provide information about both the (%) composition of the major lipid fractions
and about the freshness of the samples analyzed (meat of Landrace pork raised
with industrial diet or in tradional farm versus meat of Vietnamese pork raised
in tradional farm).
Key words: meat , pork, lipids, chromatography, HPTLC.
Rezumat. Cromatografia în strat subţire de înaltă performanţă (HPTLC) este o
metodă rapidă şi eficientă de separare a amestecurilor complexe. Analiza
realizată pe plăci HPTLC silicagel 60, cu folosirea amestecului de solvenţi de
developare, format din hexan-cloroform-etanol şi a reactivului de culoare
reprezentat de sulfat de cupru-acid fosforic a condus la obţinerea de
cromatograme cu linia de bază variabilă şi cinci picuri cromatografice
corespunzătoare urmatoarelor fracţiuni lipidice: triacilgliceroli, esterii
colesterolului, acizi graşi liberi, colesterol, mono- şi diacilgliceroli, fosfolipide.
Interpretarea rezultatelor analizei HPTLC poate oferi informaţii atât despre
compoziţia procentuală a principalelor fracţiuni lipidice cât şi despre starea de
prospeţime a probelor analizate (carne de porc Landrace crescut cu dietă
industrializată / fermă tradţională vs carne de porc Vietnamez crescut în
gospodărie individuală).
Cuvinte cheie: carne, porc, lipide, cromatografie, HTPLC.
INTRODUCTION
Determination of food substrates composition is a priority of ensuring food
safety and quality. Meat chemical composition can vary depending with the
animal specie, breed, age, sex, food regime or just with the anatomical portion
1 University of Agricultural Sciences and Veterinary Medicine of Iaşi, Romania 2Ataturk University of Erzurum, Turkey 3Mehmet Akif Ersoy Universiry of Burdur, Turkey 4Akdeniz University of Antalya, Turkey
18
taken into consideration. In meat, the unique association of several types of
(muscle, fat, bone, loose or connective) tissues provides a solid nutritional base,
mainly because of the richness in protein and low in carbohydrate content.
Investigation of the meat’s physic + chemical properties can provide
information both on the chemical composition but also on its freshness. The new
analytical methods ensure fast accurate measurements with low reagent
consumption as compared to standard classical techniques. High performance
thin layer liquid chromatography (HTPLC) is a method certified for many
industrial biotechnological processes (Byrdwell, 2005) used for the separation of the
complex mixtures.
The aim of this study was to determine the main lipid fractions of the pork
meat (Landrace pigs raised with industrial diet, Landrace pigs raised in tradional
farm and Vietnamese pigs raised in rational farm) by HPTLC a fast, effective
(Damyanova, 2003) and accurate (Deinstrop, 2007) method that offers information
on the composition of the lipid fractions and on the freshness degree of the
analyzed samples (Fuchs et al., 2011).
MATERIAL AND METHOD
Material for analysis consisted of meat samples extracted from the same haunch area (neck muscles) of 10 adult male pigs (Landrace and Vietnamese pig) that were raised with industrial diet in individual household or in tradional farms system.
Determination of the chemical composition by HPTLC For lipids extraction, in the developing tank on the silica gel plates, a series of
solvents were used: hexane, cloform and ethanol while for developing and fixing stage, the solutions used were copper sulphate, phosphoric acid and ethanol.
By HPTLC method the main lipids fraction determined were tri-, di- and mono-acylglycerols, cholesterol, free fatty acids and phospholipids.
Procedure (Hillenkamp and Katalini , 2007; Leo and Nolet, 2007): • sample preparation for analysis (extraction): in a microtube (Fig. 2) 0.5 diluted
sample with distilled water and 1 ml solvent was inserted. Samples were weighed to determine the dilution performed (sample mass + mass of water added). The samples were subjected to centrifugation for four minutes at 4000 rotation per minut;
• preparation of chromatographic plate: 0.25 ml was taken from the clear top of the centrifuged sample. This quantity was spott using a micropipette on the plate (two points for each sample). The board was divided into a number of regions equal to the number of samples;
• plate developing: the plate with spotlights was inserted with a clip and a loop into the developing tank (Fig. 1), that contaned the developing solvent (60 ml hexane, 36 ml of chloroform and 4 ml ethanol).
After solvent migration, the chromatographic plate was removed from the tank and was washed by spraying with the developing solution (10 g CuSO4 is mixed with the H3PO4 solution in a 100 ml graduated flask).
After spraying, the plate was coated with a filter paper and kept in the oven at 120°C for five minutes in order to assure the best analysis of the major lipid fraction’s characteristic bands and spots.
19
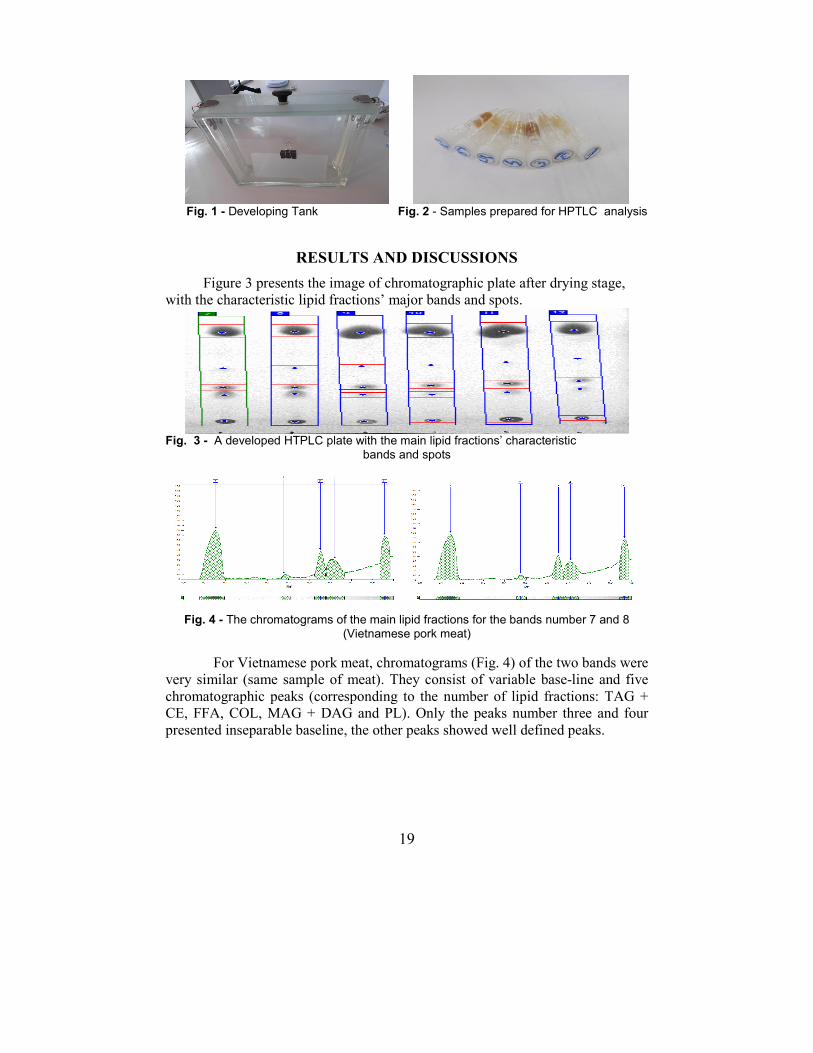
Fig. 1 - Developing Tank Fig. 2 - Samples prepared for HPTLC analysis
RESULTS AND DISCUSSIONS
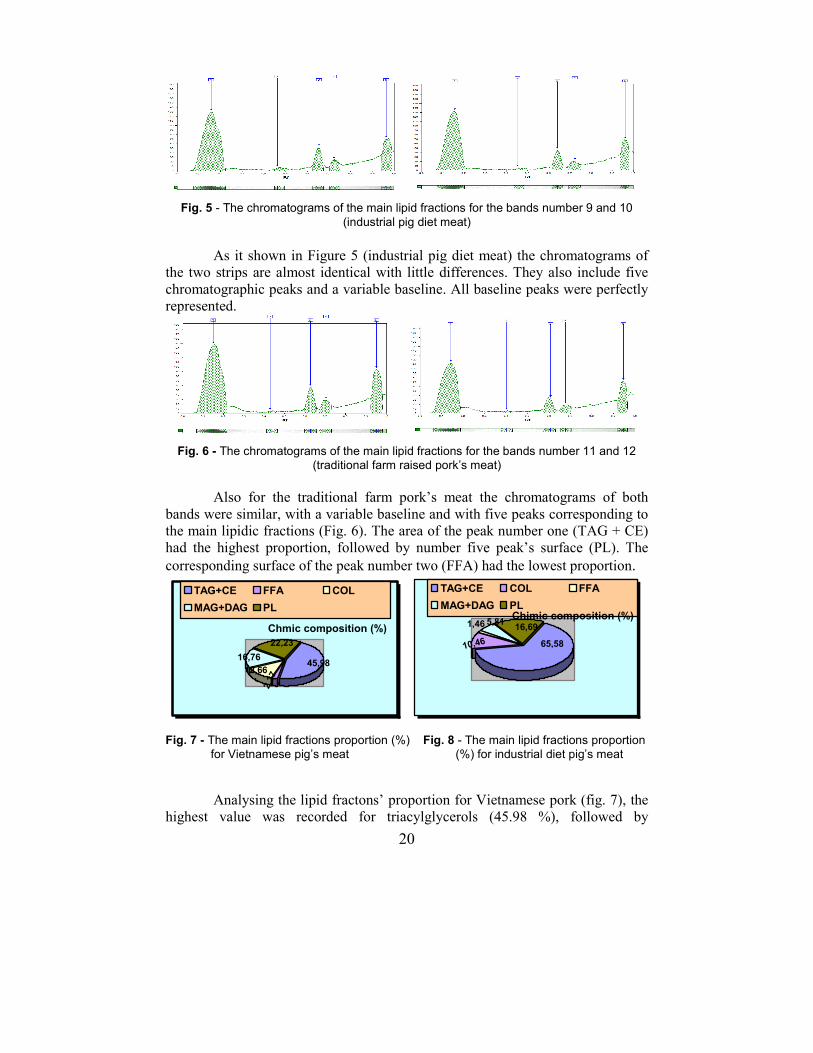
Figure 3 presents the image of chromatographic plate after drying stage,
with the characteristic lipid fractions’ major bands and spots.
Fig. 3 - A developed HTPLC plate with the main lipid fractions’ characteristic
bands and spots
Fig. 4 - The chromatograms of the main lipid fractions for the bands number 7 and 8
(Vietnamese pork meat)
For Vietnamese pork meat, chromatograms (Fig. 4) of the two bands were
very similar (same sample of meat). They consist of variable base-line and five
chromatographic peaks (corresponding to the number of lipid fractions: TAG +
CE, FFA, COL, MAG + DAG and PL). Only the peaks number three and four
presented inseparable baseline, the other peaks showed well defined peaks.
20
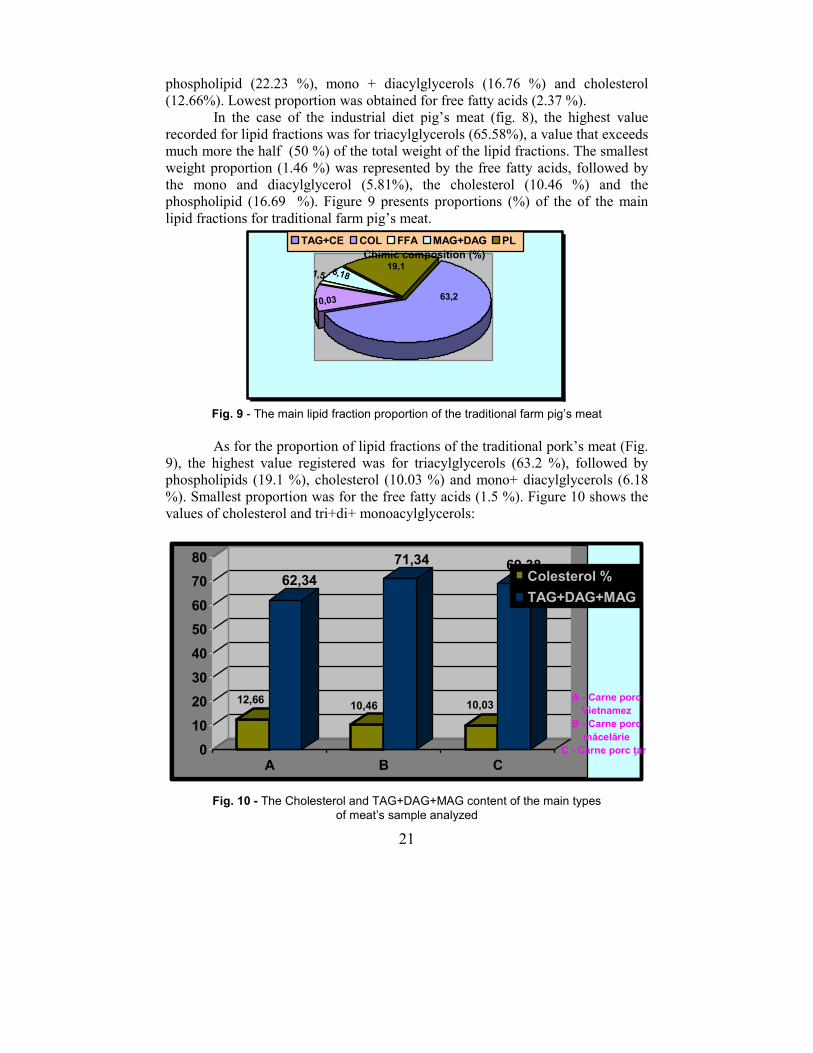
Fig. 5 - The chromatograms of the main lipid fractions for the bands number 9 and 10
(industrial pig diet meat)
As it shown in Figure 5 (industrial pig diet meat) the chromatograms of
the two strips are almost identical with little differences. They also include five
chromatographic peaks and a variable baseline. All baseline peaks were perfectly
represented.
Fig. 6 - The chromatograms of the main lipid fractions for the bands number 11 and 12
(traditional farm raised pork’s meat)
Also for the traditional farm pork’s meat the chromatograms of both
bands were similar, with a variable baseline and with five peaks corresponding to
the main lipidic fractions (Fig. 6). The area of the peak number one (TAG + CE)
had the highest proportion, followed by number five peak’s surface (PL). The
corresponding surface of the peak number two (FFA) had the lowest proportion.
2,3
7
12,66
16,76
22,23
45,98
TAG+CE FFA COL
MAG+DAG PL
Chmic composition (%)
65,58
16,695,811,46
10,46
TAG+CE COL FFA
MAG+DAG PLChimic composition (%)
Fig. 7 - The main lipid fractions proportion (%) Fig. 8 - The main lipid fractions proportion
for Vietnamese pig’s meat (%) for industrial diet pig’s meat
Analysing the lipid fractons’ proportion for Vietnamese pork (fig. 7), the
highest value was recorded for triacylglycerols (45.98 %), followed by
21
phospholipid (22.23 %), mono + diacylglycerols (16.76 %) and cholesterol
(12.66%). Lowest proportion was obtained for free fatty acids (2.37 %).
In the case of the industrial diet pig’s meat (fig. 8), the highest value
recorded for lipid fractions was for triacylglycerols (65.58%), a value that exceeds
much more the half (50 %) of the total weight of the lipid fractions. The smallest
weight proportion (1.46 %) was represented by the free fatty acids, followed by
the mono and diacylglycerol (5.81%), the cholesterol (10.46 %) and the
phospholipid (16.69 %). Figure 9 presents proportions (%) of the of the main
lipid fractions for traditional farm pig’s meat.
63,2
19,16,181,5
10,03
TAG+CE COL FFA MAG+DAG PL
Chimic composition (%)
Fig. 9 - The main lipid fraction proportion of the traditional farm pig’s meat
As for the proportion of lipid fractions of the traditional pork’s meat (Fig.
9), the highest value registered was for triacylglycerols (63.2 %), followed by
phospholipids (19.1 %), cholesterol (10.03 %) and mono+ diacylglycerols (6.18
%). Smallest proportion was for the free fatty acids (1.5 %). Figure 10 shows the
values of cholesterol and tri+di+ monoacylglycerols:
12,66
62,34
10,46
71,34
10,03
69,38
0
10
20
30
40
50
60
70
80
A B C
Colesterol %
TAG+DAG+MAG
A - Carne porc
Vietnamez
B - Carne porc
măcelărie
C - Carne porc ţară
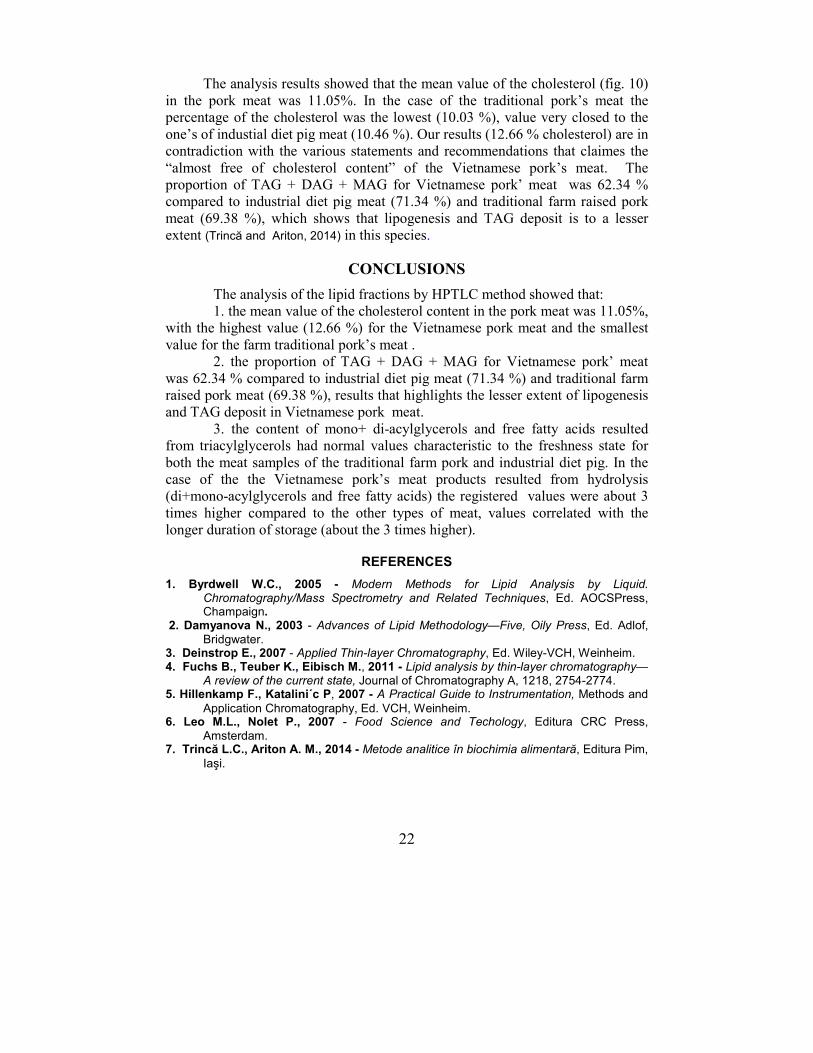
Fig. 10 - The Cholesterol and TAG+DAG+MAG content of the main types
of meat’s sample analyzed
22
The analysis results showed that the mean value of the cholesterol (fig. 10)
in the pork meat was 11.05%. In the case of the traditional pork’s meat the
percentage of the cholesterol was the lowest (10.03 %), value very closed to the
one’s of industial diet pig meat (10.46 %). Our results (12.66 % cholesterol) are in
contradiction with the various statements and recommendations that claimes the
“almost free of cholesterol content” of the Vietnamese pork’s meat. The
proportion of TAG + DAG + MAG for Vietnamese pork’ meat was 62.34 %
compared to industrial diet pig meat (71.34 %) and traditional farm raised pork
meat (69.38 %), which shows that lipogenesis and TAG deposit is to a lesser
extent (Trincă and Ariton, 2014) in this species.
CONCLUSIONS
The analysis of the lipid fractions by HPTLC method showed that:
1. the mean value of the cholesterol content in the pork meat was 11.05%,
with the highest value (12.66 %) for the Vietnamese pork meat and the smallest
value for the farm traditional pork’s meat .
2. the proportion of TAG + DAG + MAG for Vietnamese pork’ meat
was 62.34 % compared to industrial diet pig meat (71.34 %) and traditional farm
raised pork meat (69.38 %), results that highlights the lesser extent of lipogenesis
and TAG deposit in Vietnamese pork meat.
3. the content of mono+ di-acylglycerols and free fatty acids resulted
from triacylglycerols had normal values characteristic to the freshness state for
both the meat samples of the traditional farm pork and industrial diet pig. In the
case of the the Vietnamese pork’s meat products resulted from hydrolysis
(di+mono-acylglycerols and free fatty acids) the registered values were about 3
times higher compared to the other types of meat, values correlated with the
longer duration of storage (about the 3 times higher).
REFERENCES
1. Byrdwell W.C., 2005 - Modern Methods for Lipid Analysis by Liquid. Chromatography/Mass Spectrometry and Related Techniques, Ed. AOCSPress, Champaign.
2. Damyanova N., 2003 - Advances of Lipid Methodology—Five, Oily Press, Ed. Adlof,
Bridgwater. 3. Deinstrop E., 2007 - Applied Thin-layer Chromatography, Ed. Wiley-VCH, Weinheim. 4. Fuchs B., Teuber K., Eibisch M., 2011 - Lipid analysis by thin-layer chromatography—
A review of the current state, Journal of Chromatography A, 1218, 2754-2774. 5. Hillenkamp F., Katalini´c P, 2007 - A Practical Guide to Instrumentation, Methods and
Application Chromatography, Ed. VCH, Weinheim. 6. Leo M.L., Nolet P., 2007 - Food Science and Techology, Editura CRC Press,
Amsterdam. 7. Trincă L.C., Ariton A. M., 2014 - Metode analitice în biochimia alimentară, Editura Pim,
Iaşi.
23
TESTING OF ADHESIVES CAPACITY FOR SOME SYSTEMS BASED LIGNOCELLULOSIC COMPOSITES BY
ASSESSING THE MECHANICAL PROPERTIES
TESTAREA CAPACITATII ADEZIVE A UNOR SISTEME PE BAZĂ DE COMPOZITE LIGNOCELULOZICE PRIN EVALUAREA
PROPRIETĂŢILOR MECANICE
UNGUREANU Elena1, TROFIN Alina1, JITĂREANU Doina 1, POPA I.V. 2 e-mail: [email protected]
Abstract. The lignin stands out by a very large range of applications in
extremely various domains. Choosing to use the impregnation of some slips of
filter paper in the case of the method for assessing the adhesive capacity of the
resulted composite structures is justified by the necessity of pointing aut the
power of interaction of the utilized adhesives with the cellulose fibres from the
structure of the wood. In order to dispose of the dificullty concerning the
interaction of the substrate with the utilized reagents there have been used in all
the cases reference samples of the substrate which have undergone identical
treatments excepting the utilized adhesive.
Key words: adhesive systems, furan resins, furfuryl alcohol, lignin, filter paper.
Rezumat. Lignina se remarcă printr-o gamă foarte largă de aplicaţii în domenii
extrem de diverse. Opţiunea pentru utilizarea prin impregnare a unor benzi de
hârtie de filtru în cazul metodei pentru evaluarea capacităţii adezive a
structurilor compozite create, are ca justificare necesitatea evidenţierii
capacităţii de interacţiune a adezivilor utilizaţi cu fibrele celulozice din
structura lemnului. Pentru a se elimina neajunsul interacţiunii substratului cu
reactivii utilizaţi în toate cazurile s-a recurs la raportarea faţă de probe martor
ale substratului ce au fost supuse unor tratamente identice cu excepţia
adezivului investigat.
Cuvinte cheie: sisteme adezive, răşini furanice, alcool furfurilic, lignină, hârtie
de filtru.
INTRODUCTION
For a material to perform as an adhesive it must have four main requirements:
• It must "wet" the surfaces - that is it must flow out over the surfaces that are
being bonded, displacing all air and other contaminates that are present.
• It must "wet" the surfaces - that is it must flow out over the surfaces that are
being bonded, displacing all air and other contaminates that are present.
• It must adhere to the surfaces - That is after flowing over the whole surface
area it must start to adhere and stay in position and become "tacky".
1 University of Agricultural Sciences and Veterinary Medicine of Iasi, Romania
2 “Gh. Asachi” Technical University of Iasi, Romania
24
• It must develop strength - The material must now change its structure to
become strong or non-tacky but still adherent.
• It must remain stable - The material must remain unaffected by age,
environmental conditions and other factors as long as the bond is required
(Popa et al., 2007).
As an adhesive, lignin should behave similarly with the
phenolformaldehyde resin due to its polyphenolic structure. These properties are
characteristic to native lignin, whereas the technical lignins in order to be
transformed into insoluble resins have to be additionally crosslinked (Ungureanu,
2011).
The catalysts or accelerators are chemicals added in small amounts to
increase the rate of chemical reaction in the curing or hardening process. Maleic
anhydride was used as crosslinking agent.
The furan resins represent an important class of synthetic resins which
have as a starting point chemical substances having a furan type structure. Among
the basic chemical products used for the synthesis of such synthetic resins there
can be mentioned: the furan, the furfuryl aldehyde and the furfuryl alcohol.
The furan The furfuryl aldehyde The furfuryl alcohol
(C4H4O) (C6H4O2) (C5H6O2) Fig. 1 - Furan chemical products used in the synthesis of synthetic resins
With respect to the furfuryl alcohol, it is known the fact that it, can be
obtained in industry by the hydrogenation of furfuryl in the presence of the
selective nikel Ramy catalysers, platinum oxyde, which favours the
hydrogenation of the aldehyde functional group and of the furan nucleus (Yelle et
al, 2004; Meister, 1996).
Assessing the adhesive characteristics of the furfuryl alcohol and of
various furan resins, by impregnating support materials followed by the
development of some reticular reactions is not a recent technique but rather a
permanently developed perfected and up-to-date technique (Ungureanu, 2011).
MATERIAL AND METHOD
The following materials have been used: - Wheat straw lignin (L1), offered by Granit Recherché Dévelopement (relative
humidity (%) - 5.00, ash (%) – 2.30, pH in suspension- 2.70, solubility in acids (%)- 1.00);
- Furan resin BioRez91ME (R1) (resin produced by Trans Furan Chemicals, with a broad curing spectrum ranging from 130°C to 200°C , relative humidity-36%);
25
- Furfuryl alcohol (aspect – oily liqhid; colour – yellowish colourless; density, g/cm
3 – 1,1296; boiling point,
0C – 171,750; refraction index, n
20s – 1,4845;
toxicity – 50 cm3/m
3 aer), (Trans Furan Chemicals bvba);
- Maleic anhydride (Fluka) MA. Work procedure: Lignin solutions necessary for adhesive formulation were
obtained by dissolution of lignin in furfuryl alcohol (FA). It was prepared lignin solutions of different concentrations, as: 20%, 30%, 40%, 50%. The performed tests concerning the solubility of lignin in FA showed a almost complete dissolution of lignin in FA.
Lignin solutions necessary for adhesive formulation were obtained by dissolution of lignin in furfuryl alcohol (FA). It was prepared lignin solutions of different concentrations, as: 20%, 30%, 40%, 50%. The performed tests concerning the solubility of lignin in FA showed a almost complete dissolution of lignin in FA.
The alcoholic lignin solution was thoroughly mixed with a hydrophilic furan (prepolymer) BioRez 91ME with a solid content of 64% in a weight ratio 1:1. The catalyst (maleic anhydride) can be dissolved directly in furfuryl alcohol before lignin addition or it is possible to be added as the last component (powder) before adhesive application and mixed in well.
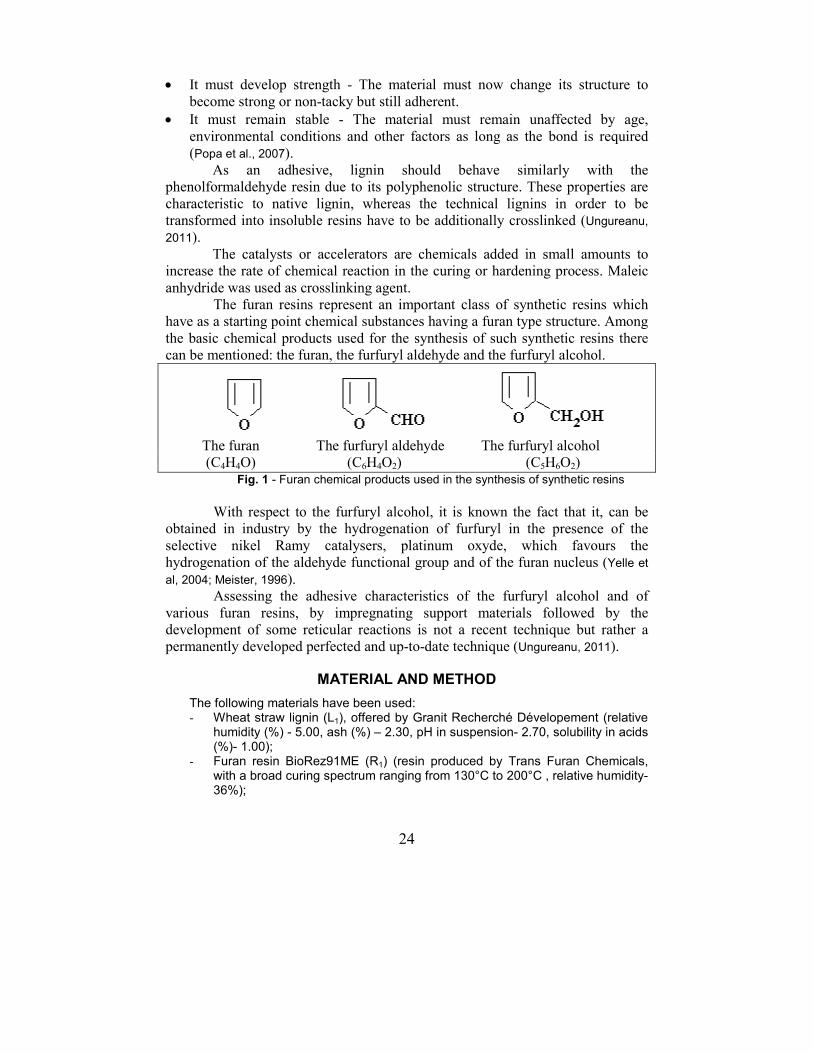
The testing procedure based on paper filter impregnation is presented in figure 2.
Fig. 2 - Testing procedure for evaluation of adhesive systems - based on paper filter
impregnation
The impregnation was followed directly by curing. Curing was done in a hot-air
oven at 130°C for 5 min. The oven dry mass of each sample of strips was determined so that adhesive uptake (wet and dry) could be determined. Finally, the samples were conditioned at 23.0 ± 1.0°C and 50.0 % ± 2.0% relative humidity until constant mass was achieved, before being tested.
The tensile strength and elongation at break of each sample were measured using an Instron Universal machine, with a cross head speed of 10 mm per min. A comparison of properties was made with the control resin. A sample of the filter paper, not impregnated by resin, was tested as an indication of the properties of the paper
Formulation of the adhesive (MA dissolution, L1 dissolution,
mixing with R1)
Paper impregnation (immersing in adhesive
for 5 min.)
Preparation of the filter paper strips
(cutting, weighing, moisture determination)
Removing of the excess adhesive
Curing
(T=130°C, 5 min.)
Testing
26
substrate. The tensile strength and elongation at break of each sample was measured.
A standard procedure has been used to determine the bending stiffness of impregnated paper strips by measuring the resistance to slight bending (Tappi Test Method T-535 cm-85 Stiffness of paperboard – resonance length method).
RESULTS AND DISCUSSIONS
In the first trials, the filter paper strips (80 g/m2) were of 200 mm long
and 80 mm width, with the length being cut along the machine direction of the
paper. For paper tensile strength test have to use 15 mm wide strips. Tensile
strength test method is very specific about sample cutting. That means to use a
special cutter for 15 mm wide samples after the curing and conditioned. However,
the extra cutting process proved to be a source of micro cracks in edge of the
impregnated paper specimens.
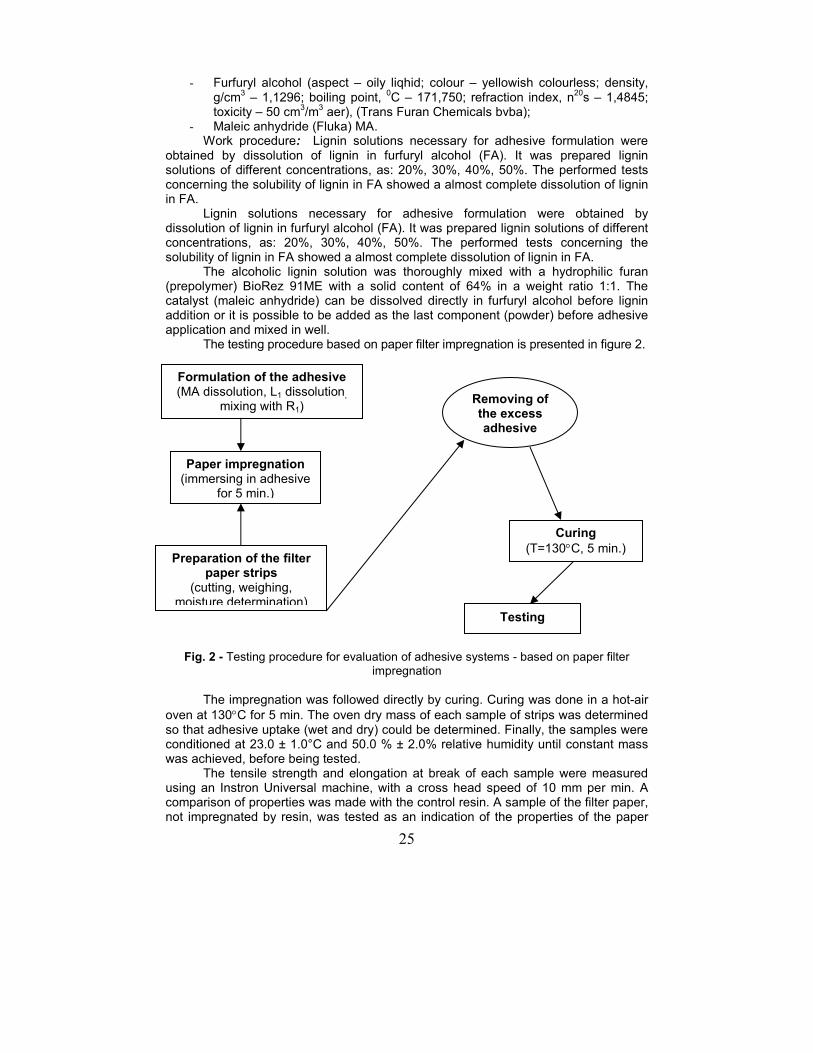
In the second series of trials we use for impregnation filter paper strips of
directly 15 mm width. The filter paper strips were impregnated with different
adhesive products and their mixtures, by completely immersing in adhesive for
300 s. The excess resin was removed from each strip by running the sample
through a 0.25 mm gap. The edge defect was removed from each strip by suction
with filter paper No crakes on the strip edges appear in this case. The appearance
of the breaking zone are normally.
Fig. 3 – Testing of mechanical properties on the filter paper impregnated with
adhesive lignocellulose systems
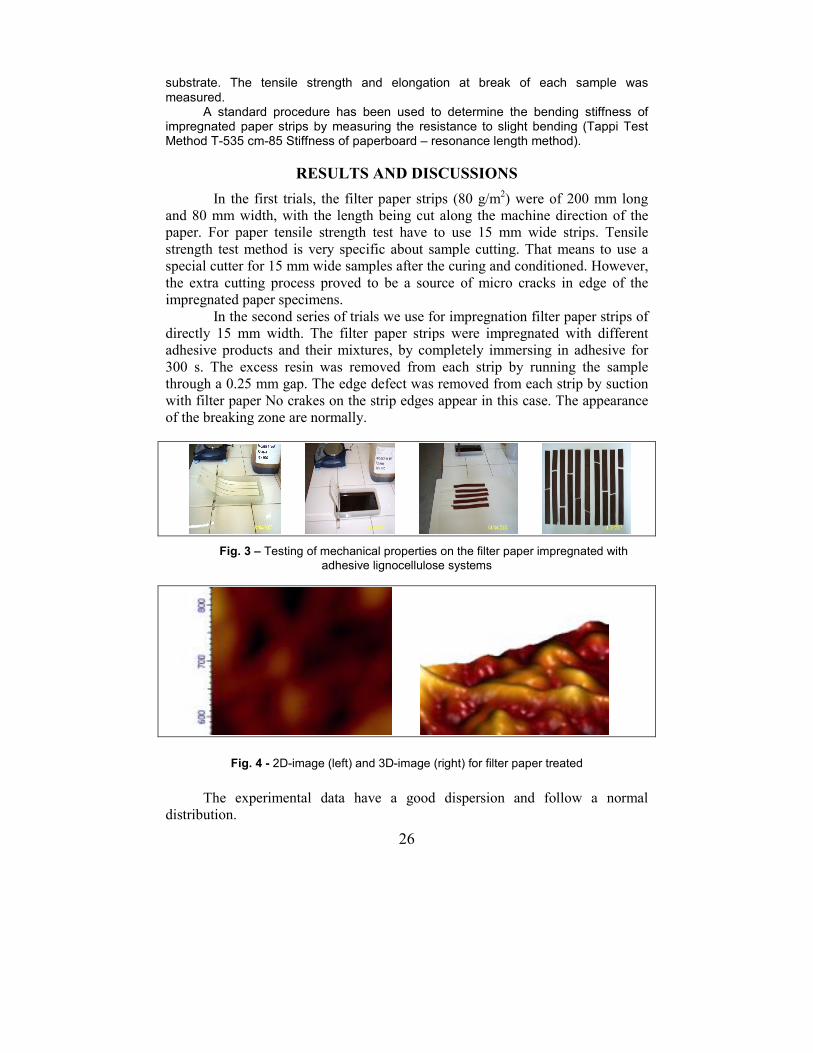
Fig. 4 - 2D-image (left) and 3D-image (right) for filter paper treated
The experimental data have a good dispersion and follow a normal
distribution.
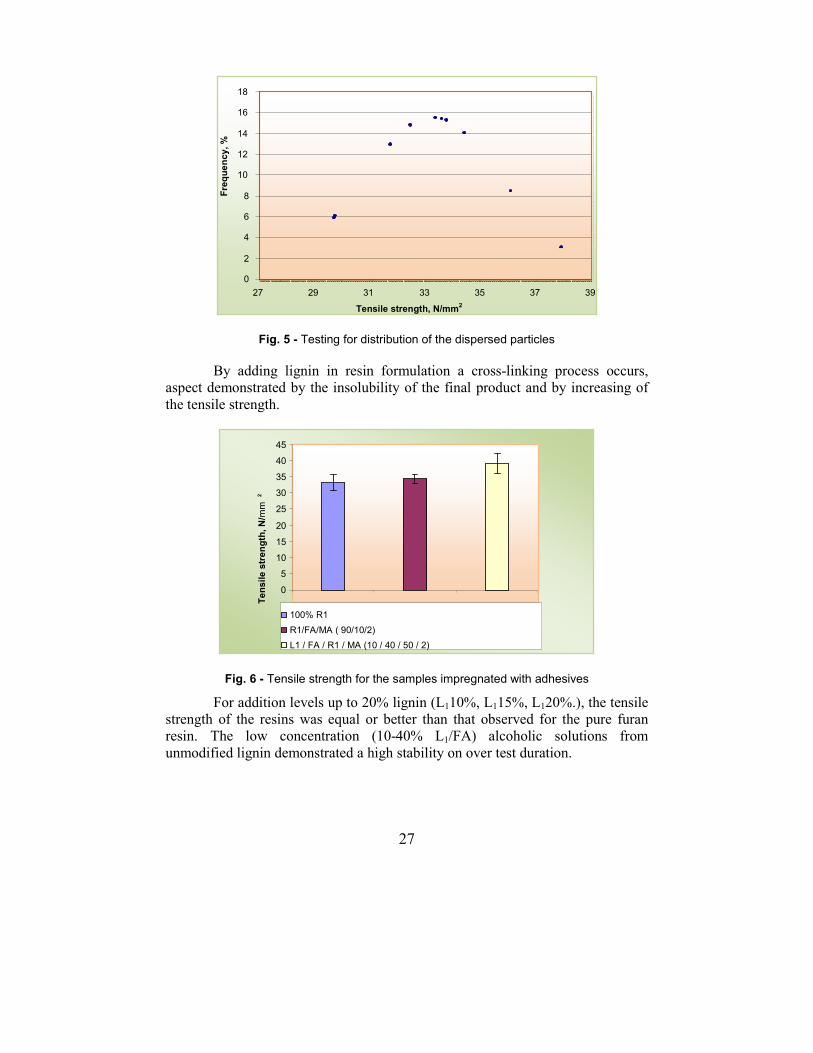
27
Fig. 5 - Testing for distribution of the dispersed particles
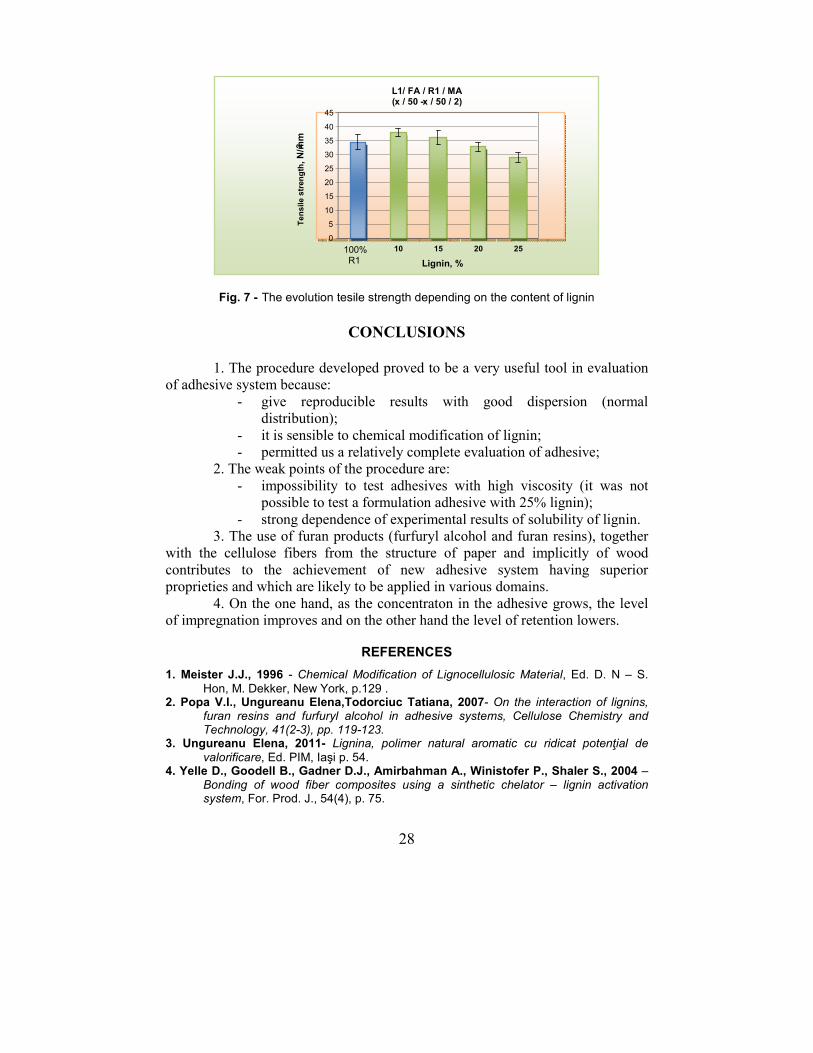
By adding lignin in resin formulation a cross-linking process occurs,
aspect demonstrated by the insolubility of the final product and by increasing of
the tensile strength.
Fig. 6 - Tensile strength for the samples impregnated with adhesives
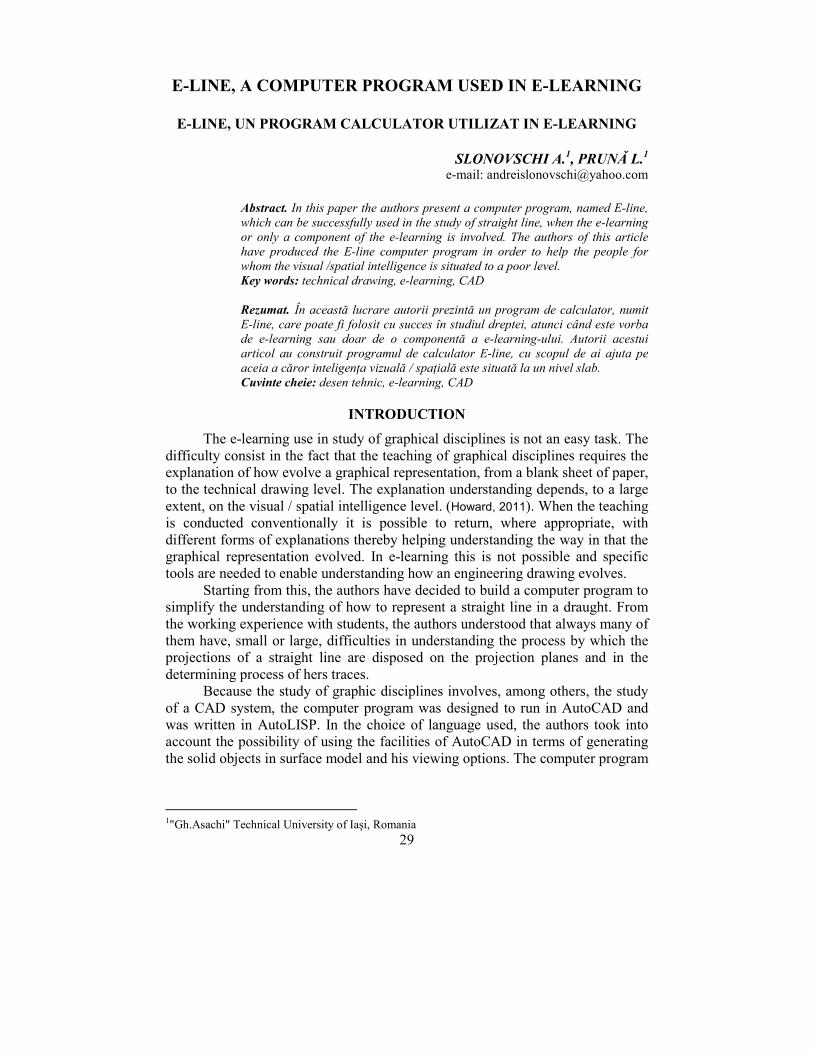
For addition levels up to 20% lignin (L110%, L115%, L120%.), the tensile
strength of the resins was equal or better than that observed for the pure furan
resin. The low concentration (10-40% L1/FA) alcoholic solutions from
unmodified lignin demonstrated a high stability on over test duration.
0 5
10
15
20
25
30
35
40
45
2
100% R1
R1/FA/MA ( 90/10/2)
L1 / FA / R1 / MA (10 / 40 / 50 / 2)
Tensile strength, N/m
m
0
2
4
6
8
10
12
14
16
18
27 29 31 33 35 37 39
Tensile strength, N/mm2
Frequency, %
28
Fig. 7 - The evolution tesile strength depending on the content of lignin
CONCLUSIONS
1. The procedure developed proved to be a very useful tool in evaluation
of adhesive system because:
- give reproducible results with good dispersion (normal
distribution);
- it is sensible to chemical modification of lignin;
- permitted us a relatively complete evaluation of adhesive;
2. The weak points of the procedure are:
- impossibility to test adhesives with high viscosity (it was not
possible to test a formulation adhesive with 25% lignin);
- strong dependence of experimental results of solubility of lignin.
3. The use of furan products (furfuryl alcohol and furan resins), together
with the cellulose fibers from the structure of paper and implicitly of wood
contributes to the achievement of new adhesive system having superior
proprieties and which are likely to be applied in various domains.
4. On the one hand, as the concentraton in the adhesive grows, the level
of impregnation improves and on the other hand the level of retention lowers.
REFERENCES
1. Meister J.J., 1996 - Chemical Modification of Lignocellulosic Material, Ed. D. N – S.
Hon, M. Dekker, New York, p.129 . 2. Popa V.I., Ungureanu Elena,Todorciuc Tatiana, 2007- On the interaction of lignins,
furan resins and furfuryl alcohol in adhesive systems, Cellulose Chemistry and Technology, 41(2-3), pp. 119-123.
3. Ungureanu Elena, 2011- Lignina, polimer natural aromatic cu ridicat potenţial de
valorificare, Ed. PIM, Iaşi p. 54. 4. Yelle D., Goodell B., Gadner D.J., Amirbahman A., Winistofer P., Shaler S., 2004 –
Bonding of wood fiber composites using a sinthetic chelator – lignin activation system, For. Prod. J., 54(4), p. 75.
L1/ FA / R1 / MA( x / 50 -x / 50 / 2)
0
5
10
15
20
25
30
35
40
45
100%R1
10 15 20 25
Lignin, %
2
Tensile strength, N/m
m
29
E-LINE, A COMPUTER PROGRAM USED IN E-LEARNING
E-LINE, UN PROGRAM CALCULATOR UTILIZAT IN E-LEARNING
SLONOVSCHI A.1, PRUNĂ L.1
e-mail: [email protected]
Abstract. In this paper the authors present a computer program, named E-line, which can be successfully used in the study of straight line, when the e-learning or only a component of the e-learning is involved. The authors of this article have produced the E-line computer program in order to help the people for whom the visual /spatial intelligence is situated to a poor level. Key words: technical drawing, e-learning, CAD Rezumat. În această lucrare autorii prezintă un program de calculator, numit E-line, care poate fi folosit cu succes în studiul dreptei, atunci când este vorba de e-learning sau doar de o componentă a e-learning-ului. Autorii acestui articol au construit programul de calculator E-line, cu scopul de ai ajuta pe aceia a căror inteligența vizuală / spațială este situată la un nivel slab. Cuvinte cheie: desen tehnic, e-learning, CAD
INTRODUCTION
The e-learning use in study of graphical disciplines is not an easy task. The
difficulty consist in the fact that the teaching of graphical disciplines requires the
explanation of how evolve a graphical representation, from a blank sheet of paper,
to the technical drawing level. The explanation understanding depends, to a large
extent, on the visual / spatial intelligence level. (Howard, 2011). When the teaching
is conducted conventionally it is possible to return, where appropriate, with
different forms of explanations thereby helping understanding the way in that the
graphical representation evolved. In e-learning this is not possible and specific
tools are needed to enable understanding how an engineering drawing evolves.
Starting from this, the authors have decided to build a computer program to
simplify the understanding of how to represent a straight line in a draught. From
the working experience with students, the authors understood that always many of
them have, small or large, difficulties in understanding the process by which the
projections of a straight line are disposed on the projection planes and in the
determining process of hers traces.
Because the study of graphic disciplines involves, among others, the study
of a CAD system, the computer program was designed to run in AutoCAD and
was written in AutoLISP. In the choice of language used, the authors took into
account the possibility of using the facilities of AutoCAD in terms of generating
the solid objects in surface model and his viewing options. The computer program
1"Gh.Asachi" Technical University of Iaşi, Romania
30
was named E-line, the authors thus trying to put together two terms "e-learning"
and "line (Byrnes, 2011).
MATERIAL AND METHOD
In the activity of analysis of the straight line representation, in double orthogonal projection, the first obstacle encountered by students undertaking this study is related to the ability to view her image in relation with the projection planes. But is not enough that this to imagine only the case where a line is placed in a certain relation with the projection planes, randomly chosen by his mind. It is essential that he may be able to build the correct mental image in which a straight line is reported to the projection planes taking into account, in the same time, the four subspaces known as dihedral. Only in this way the student gets to have a properly structured and consistent image that will play then a decisive role in understanding the graphical representations (Prună et al., 2006).
So, the first requirement for the E-line software was to being able to represent in 3D, in the surface model, the projection planes and the straight line. The surface model was chosen to give the user the ability to see the projection planes and the straight line from any angle desired and to continuously rotate the image, supplying, in this way, the deficiencies of the intelligence visual / spatial that it may have.
Also, in this stage it is good that the student to be able to create mental images of a straight line which lies in the particular position in relation to the projection planes.
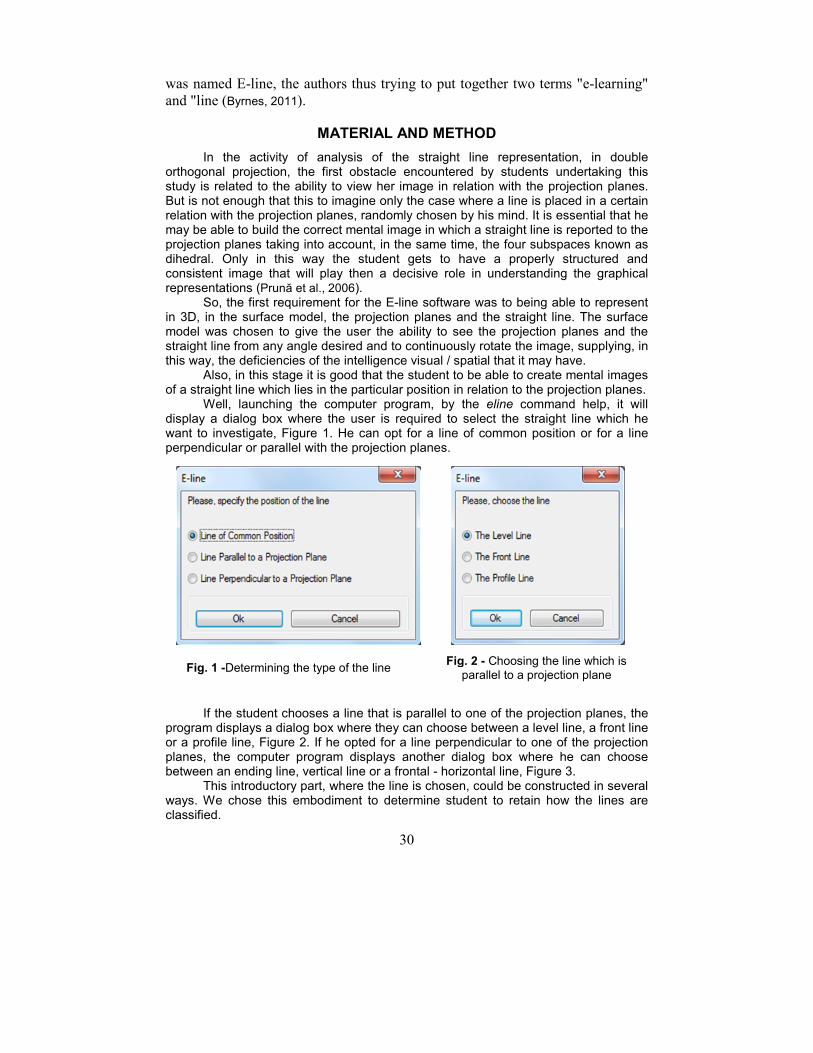
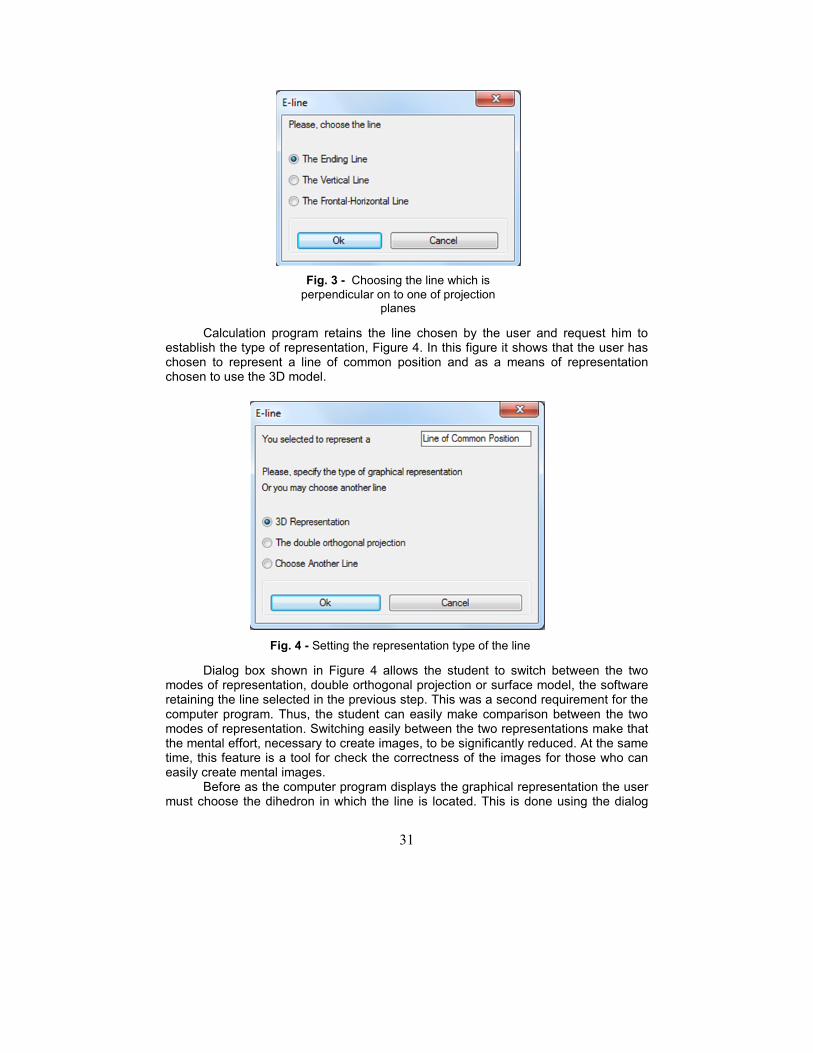
Well, launching the computer program, by the eline command help, it will display a dialog box where the user is required to select the straight line which he want to investigate, Figure 1. He can opt for a line of common position or for a line perpendicular or parallel with the projection planes.
If the student chooses a line that is parallel to one of the projection planes, the
program displays a dialog box where they can choose between a level line, a front line or a profile line, Figure 2. If he opted for a line perpendicular to one of the projection planes, the computer program displays another dialog box where he can choose between an ending line, vertical line or a frontal - horizontal line, Figure 3.
This introductory part, where the line is chosen, could be constructed in several ways. We chose this embodiment to determine student to retain how the lines are classified.
Fig. 1 -Determining the type of the line Fig. 2 - Choosing the line which is
parallel to a projection plane
31
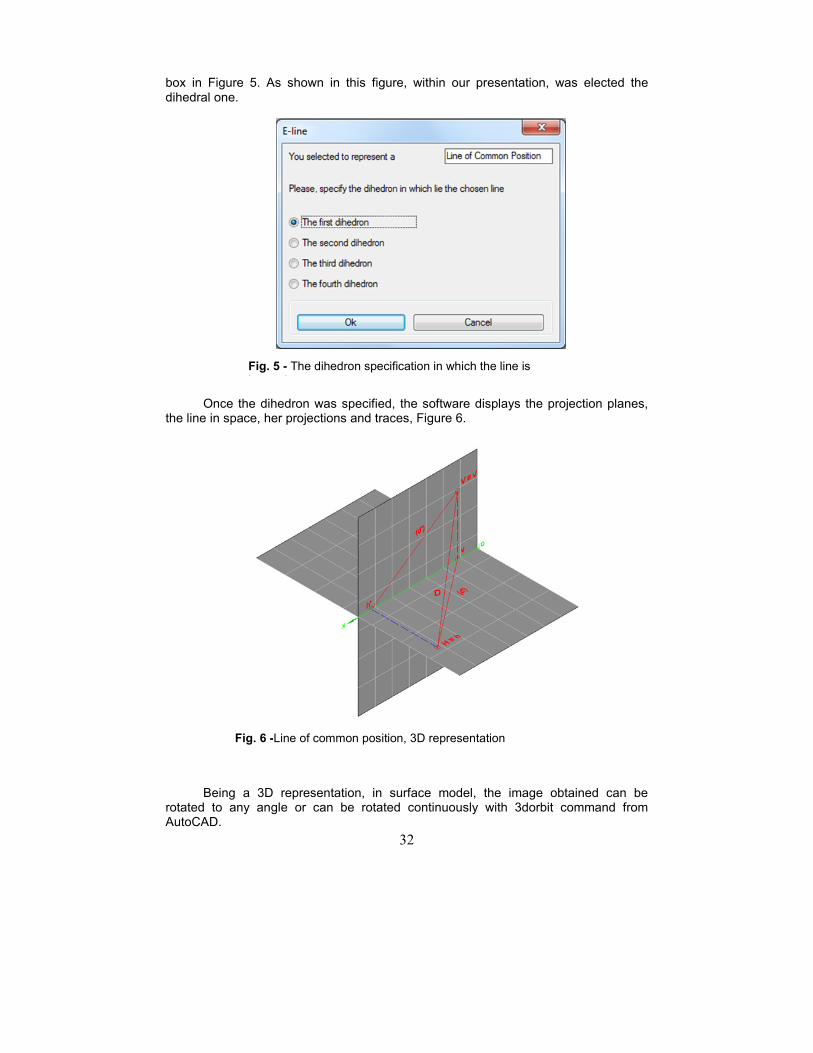
Calculation program retains the line chosen by the user and request him to establish the type of representation, Figure 4. In this figure it shows that the user has chosen to represent a line of common position and as a means of representation chosen to use the 3D model.
Dialog box shown in Figure 4 allows the student to switch between the two modes of representation, double orthogonal projection or surface model, the software retaining the line selected in the previous step. This was a second requirement for the computer program. Thus, the student can easily make comparison between the two modes of representation. Switching easily between the two representations make that the mental effort, necessary to create images, to be significantly reduced. At the same time, this feature is a tool for check the correctness of the images for those who can easily create mental images.
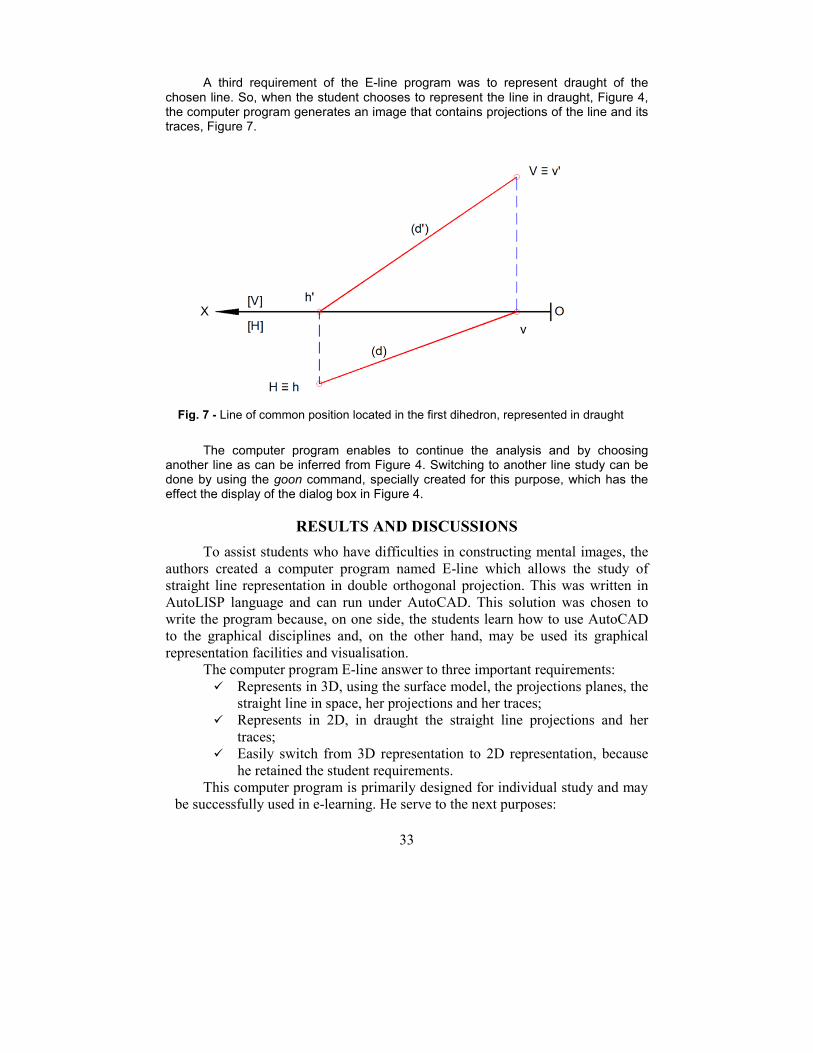
Before as the computer program displays the graphical representation the user must choose the dihedron in which the line is located. This is done using the dialog
Fig. 3 - Choosing the line which is perpendicular on to one of projection
planes
Fig. 4 - Setting the representation type of the line
32
box in Figure 5. As shown in this figure, within our presentation, was elected the dihedral one.
Once the dihedron was specified, the software displays the projection planes,
the line in space, her projections and traces, Figure 6.
Being a 3D representation, in surface model, the image obtained can be
rotated to any angle or can be rotated continuously with 3dorbit command from AutoCAD.
Fig. 6 -Line of common position, 3D representation
Fig. 5 - The dihedron specification in which the line is located.
33
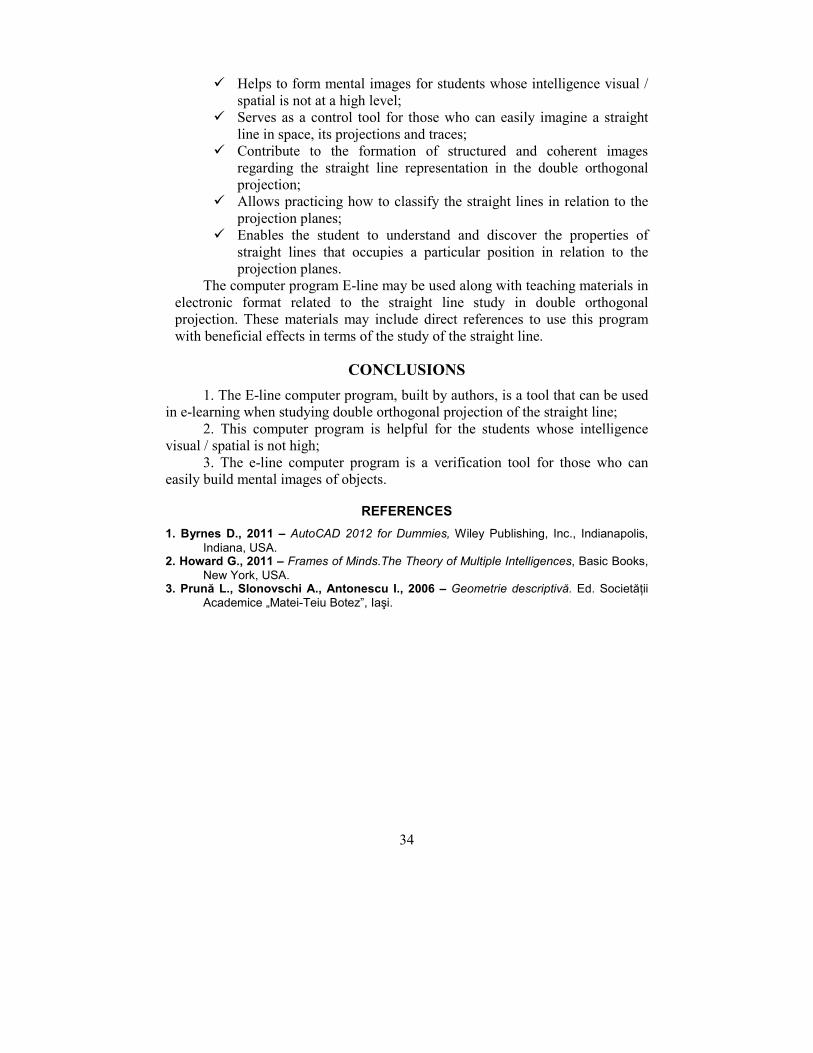
A third requirement of the E-line program was to represent draught of the chosen line. So, when the student chooses to represent the line in draught, Figure 4, the computer program generates an image that contains projections of the line and its traces, Figure 7.
The computer program enables to continue the analysis and by choosing
another line as can be inferred from Figure 4. Switching to another line study can be done by using the goon command, specially created for this purpose, which has the effect the display of the dialog box in Figure 4.
RESULTS AND DISCUSSIONS
To assist students who have difficulties in constructing mental images, the
authors created a computer program named E-line which allows the study of
straight line representation in double orthogonal projection. This was written in
AutoLISP language and can run under AutoCAD. This solution was chosen to
write the program because, on one side, the students learn how to use AutoCAD
to the graphical disciplines and, on the other hand, may be used its graphical
representation facilities and visualisation.
The computer program E-line answer to three important requirements:
� Represents in 3D, using the surface model, the projections planes, the
straight line in space, her projections and her traces;
� Represents in 2D, in draught the straight line projections and her
traces;
� Easily switch from 3D representation to 2D representation, because
he retained the student requirements.
This computer program is primarily designed for individual study and may
be successfully used in e-learning. He serve to the next purposes:
Fig. 7 - Line of common position located in the first dihedron, represented in draught
34
� Helps to form mental images for students whose intelligence visual /
spatial is not at a high level;
� Serves as a control tool for those who can easily imagine a straight
line in space, its projections and traces;
� Contribute to the formation of structured and coherent images
regarding the straight line representation in the double orthogonal
projection;
� Allows practicing how to classify the straight lines in relation to the
projection planes;
� Enables the student to understand and discover the properties of
straight lines that occupies a particular position in relation to the
projection planes.
The computer program E-line may be used along with teaching materials in
electronic format related to the straight line study in double orthogonal
projection. These materials may include direct references to use this program
with beneficial effects in terms of the study of the straight line.
CONCLUSIONS
1. The E-line computer program, built by authors, is a tool that can be used
in e-learning when studying double orthogonal projection of the straight line;
2. This computer program is helpful for the students whose intelligence
visual / spatial is not high;
3. The e-line computer program is a verification tool for those who can
easily build mental images of objects.
REFERENCES
1. Byrnes D., 2011 – AutoCAD 2012 for Dummies, Wiley Publishing, Inc., Indianapolis, Indiana, USA.
2. Howard G., 2011 – Frames of Minds.The Theory of Multiple Intelligences, Basic Books, New York, USA.
3. Prună L., Slonovschi A., Antonescu I., 2006 – Geometrie descriptivă. Ed. Societății Academice „Matei-Teiu Botez”, Iaşi.
35
ACHIEVEMENTS AND OBJECTIVES FOR TOMATO BREEDING IN ROMANIA
REALIZĂRI ŞI OBIECTIVE DE VIITOR ÎN AMELIORAREA
TOMATELOR ÎN ROMÂNIA
VÎNĂTORU C.1, SCURTU I.2 e-mail: [email protected]
Abstract. Tomatoes are the most important vegetable species, both în the world and in our country. In the last decades, the breeders have obtained hundreds of cultivars (open pollinated and hybrids) for growing in open field, plastic tunnels or glasshouse. In 1975-1990 period, at Research Institute for Vegetables and Flowers Growing were drawn up breeding teams that have achieved some new valuable cultivars. After 1990 year, breeding activity were decresed and only stayed at Research Station for Vegetable Buzău. Breeders of this station have obtained new outstanding cultivars with high yielding potential and good quality. For the future, it is necessary to form new teams well prepared and should more funds, with clear objectives in order to obtain new required cultivars for growers and consumers.The new cultivars have to be more resistent pathogens and adverse environmental conditions. Key words: breeding, F1 hybrids, new lines, cherry tomato, processing tomato Rezumat. Tomatele reprezintă cea mai importantă specie legumicolă cultivată, atât pe plan mondial cât şi în ţara noastră. În ultimele decenii, specialiştii în ameliorarea plantelor au obţinut sute de soiuri şi hibrizi destinaţi fie pentru cultura în câmp deschis, fie pentru cultura în sere sau solarii. În perioada 1975-1990, la Institutul de Cercetare-Dezvoltare şi la staţiunile de cercetări legumicole s-au format echipe de cercetare care au obţinut câteva rezultate notabile în obţinerea de soiuri noi de tomate. După 1990, activitatea de ameliorare a continuat o perioadă la ICDLF Vidra, apoi a fost transferată la SCDL Buzău. Specialiştii de aici au obţinut soiuri şi hibrizi remarcabili sub aspectul potenţialului de producţie şi al calităţii. Pentru viitor este necesar să se îmbogăţească fondul de germoplasmă, să se formeze o echipă de amelioratori bine pregătită şi să fie stabilite obiectivele de ameliorare în funcţie de destinaţie(consum proaspăt sau industrializare) şi de modul de cultivare (seră, solar sau câmp deschis). Cuvinte cheie: ameliorare, hibrizi F1, linii noi, tomate Cherry, tomate pentru industrie
INTRODUCTION
Tomatoes are the most important vegetable cultivated species, both in the world and in our country. One of the breeding purpose is to adapt to extreme environmental conditions (Atherton, 1986). A new breeding tomato strategy aim to
1 Vegetable Research and Development Station of Buzau, Romania 2,,Constantin Brancoveanu” University of Piteşti, Romania
36
obtain cultivars for proccesing, even in the off season of the classic production system (Hanson, 2013).
In recent decades, the breeders have obtained hundreds of cultivars both for open field or greenhouse and solaria crops. During 1975-1990, at the Vegetable Research and Development Station Buzau and others have formed research teams that have had some notable results in getting the new tomato varieties (Vînătoru,
2008). After 1990, the breeding work continued at a ICDLF Vidra, then was transferred to the SCDL Buzau. The breeders here have obtained remarkable hybrids and varieties in terms of yield potential and quality, a major flaw was scored at protected spaces cultivars (Scurtu,1999).
Most autochtonous varieties in this species contained in the official catalogue have generic destination for fresh consumption and processing. After 1990, when the claims consumers have increased, researchers have understood to deepen research in order to obtain new cultivars strictly specialized to match the direction of use: for fresh consumption, for pasta and tomato sauce, juice, ketchup, pickles and even ornamental and decorative (Prohens, 2008).
The aim of the work is to obtain and patent of clear destination cultivars: tomatoes for fresh consumption, processing tomato and cherry type.
MATERIAL AND METHOD
The germplasm resource of S.C.D.L. Buzău currently contains in this species a number of over 700 genotypes with distinct expressiveness. Annually,it is made an evaluation of each cultivar and the data recorded are analyzed with the aid of chromosome map. In terms of genetic stability, the material collected was grouped on the three fields as follows: segregant lines, homozygous and genetically stable lines. The stabilised genetic material was separated in two fields: the basic collection, which are kept in the maintenance the new lines and work field, which are subject to intensive breeding programme corresponding lines.
The main objectives were imposed in the experience: to obtain protected spaces cultivars for fresh consumption, obtaining processing cultivars and cherry type cultivars for fresh consumption and processing.
The genetic material used in the experience comes from the local population, romanian and foreign creations, hibridizations, segregation and mutant lines derived from different sources.
RESULTS AND DISCUSSIONS
In order to obtain hybrids for fresh consumption and for protected areas, have been detained 60 lines that have undergone the general combining ability and special combining ability. Lines that have stood the test, have been subjected to hybridization, thus achiveing 134 hybrid combinations. After the hybridization process were detained eight valuable genitors. The eight genitors were dialel crossed for testing the combining specific ability, resulting 16 simple in hybrid combinations. After a careful research of combining and specific ability on yield, earliness and yield quality were obtained the following hybrid combinations:
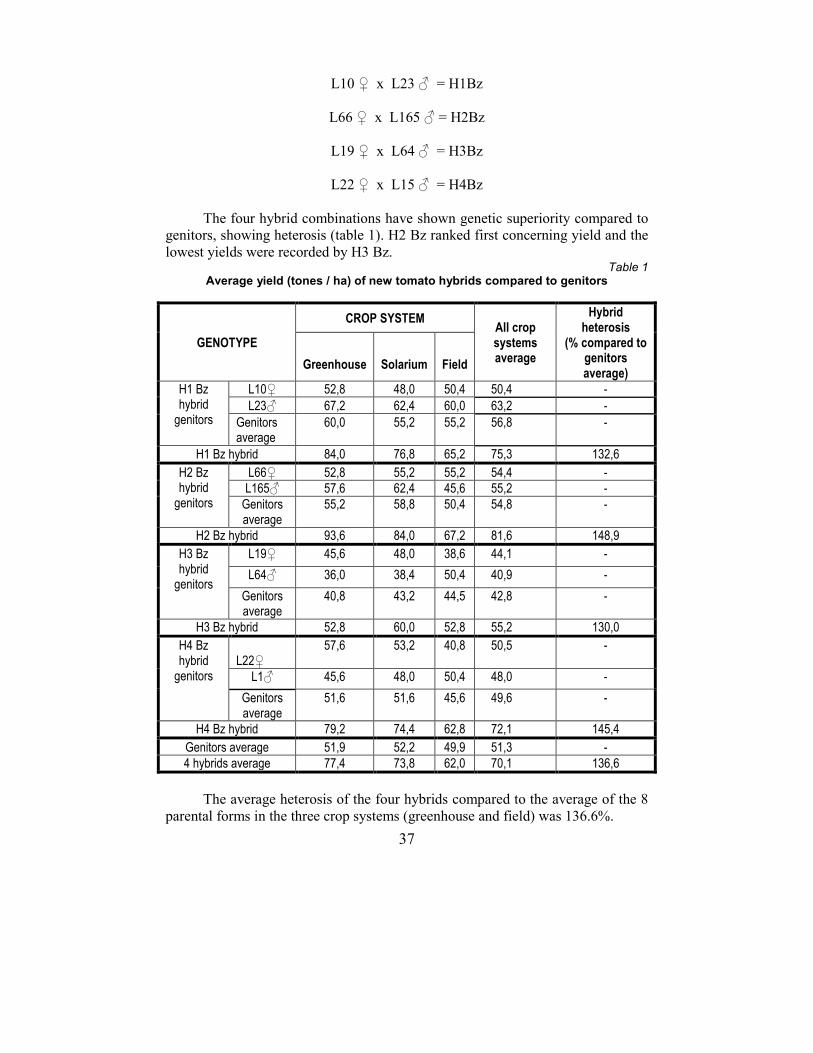
37
L10 ♀ x L23 ♂ = H1Bz
L66 ♀ x L165 ♂ = H2Bz
L19 ♀ x L64 ♂ = H3Bz
L22 ♀ x L15 ♂ = H4Bz
The four hybrid combinations have shown genetic superiority compared to genitors, showing heterosis (table 1). H2 Bz ranked first concerning yield and the lowest yields were recorded by H3 Bz.
Table 1 Average yield (tones / ha) of new tomato hybrids compared to genitors
GENOTYPE
CROP SYSTEM All crop systems average
Hybrid heterosis
(% compared to genitors average)
Greenhouse
Solarium
Field
H1 Bz hybrid
genitors
L10♀ 52,8 48,0 50,4 50,4 - L23♂ 67,2 62,4 60,0 63,2 -
Genitors average
60,0 55,2 55,2 56,8 -
H1 Bz hybrid 84,0 76,8 65,2 75,3 132,6
H2 Bz hybrid
genitors
L66♀ 52,8 55,2 55,2 54,4 - L165♂ 57,6 62,4 45,6 55,2 -
Genitors average
55,2 58,8 50,4 54,8 -
H2 Bz hybrid 93,6 84,0 67,2 81,6 148,9
H3 Bz hybrid
genitors
L19♀ 45,6 48,0 38,6 44,1 -
L64♂ 36,0 38,4 50,4 40,9 -
Genitors average
40,8 43,2 44,5 42,8 -
H3 Bz hybrid 52,8 60,0 52,8 55,2 130,0
H4 Bz hybrid
genitors
L22♀
57,6 53,2 40,8 50,5 -
L1♂ 45,6 48,0 50,4 48,0 -
Genitors average
51,6 51,6 45,6 49,6 -
H4 Bz hybrid 79,2 74,4 62,8 72,1 145,4
Genitors average 51,9 52,2 49,9 51,3 - 4 hybrids average 77,4 73,8 62,0 70,1 136,6
The average heterosis of the four hybrids compared to the average of the 8
parental forms in the three crop systems (greenhouse and field) was 136.6%.
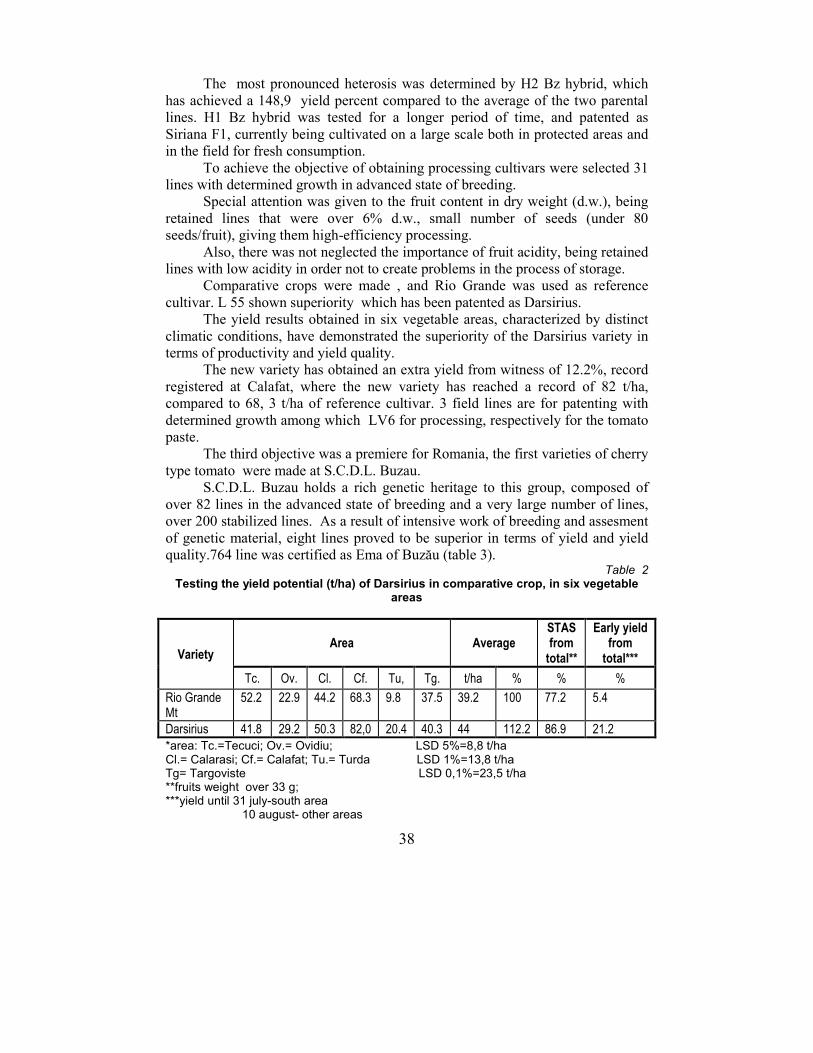
38
The most pronounced heterosis was determined by H2 Bz hybrid, which has achieved a 148,9 yield percent compared to the average of the two parental lines. H1 Bz hybrid was tested for a longer period of time, and patented as Siriana F1, currently being cultivated on a large scale both in protected areas and in the field for fresh consumption.
To achieve the objective of obtaining processing cultivars were selected 31 lines with determined growth in advanced state of breeding.
Special attention was given to the fruit content in dry weight (d.w.), being retained lines that were over 6% d.w., small number of seeds (under 80 seeds/fruit), giving them high-efficiency processing.
Also, there was not neglected the importance of fruit acidity, being retained lines with low acidity in order not to create problems in the process of storage.
Comparative crops were made , and Rio Grande was used as reference cultivar. L 55 shown superiority which has been patented as Darsirius.
The yield results obtained in six vegetable areas, characterized by distinct climatic conditions, have demonstrated the superiority of the Darsirius variety in terms of productivity and yield quality.
The new variety has obtained an extra yield from witness of 12.2%, record registered at Calafat, where the new variety has reached a record of 82 t/ha, compared to 68, 3 t/ha of reference cultivar. 3 field lines are for patenting with determined growth among which LV6 for processing, respectively for the tomato paste.
The third objective was a premiere for Romania, the first varieties of cherry type tomato were made at S.C.D.L. Buzau.
S.C.D.L. Buzau holds a rich genetic heritage to this group, composed of over 82 lines in the advanced state of breeding and a very large number of lines, over 200 stabilized lines. As a result of intensive work of breeding and assesment of genetic material, eight lines proved to be superior in terms of yield and yield quality.764 line was certified as Ema of Buzău (table 3).
Table 2 Testing the yield potential (t/ha) of Darsirius in comparative crop, in six vegetable
areas
Variety Area Average
STAS from total**
Early yield from
total***
Tc. Ov. Cl. Cf. Tu, Tg. t/ha % % %
Rio Grande Mt
52.2 22.9 44.2 68.3 9.8 37.5 39.2 100 77.2 5.4
Darsirius 41.8 29.2 50.3 82,0 20.4 40.3 44 112.2 86.9 21.2 *area: Tc.=Tecuci; Ov.= Ovidiu; LSD 5%=8,8 t/ha Cl.= Calarasi; Cf.= Calafat; Tu.= Turda LSD 1%=13,8 t/ha Tg= Targoviste LSD 0,1%=23,5 t/ha **fruits weight over 33 g; ***yield until 31 july-south area 10 august- other areas
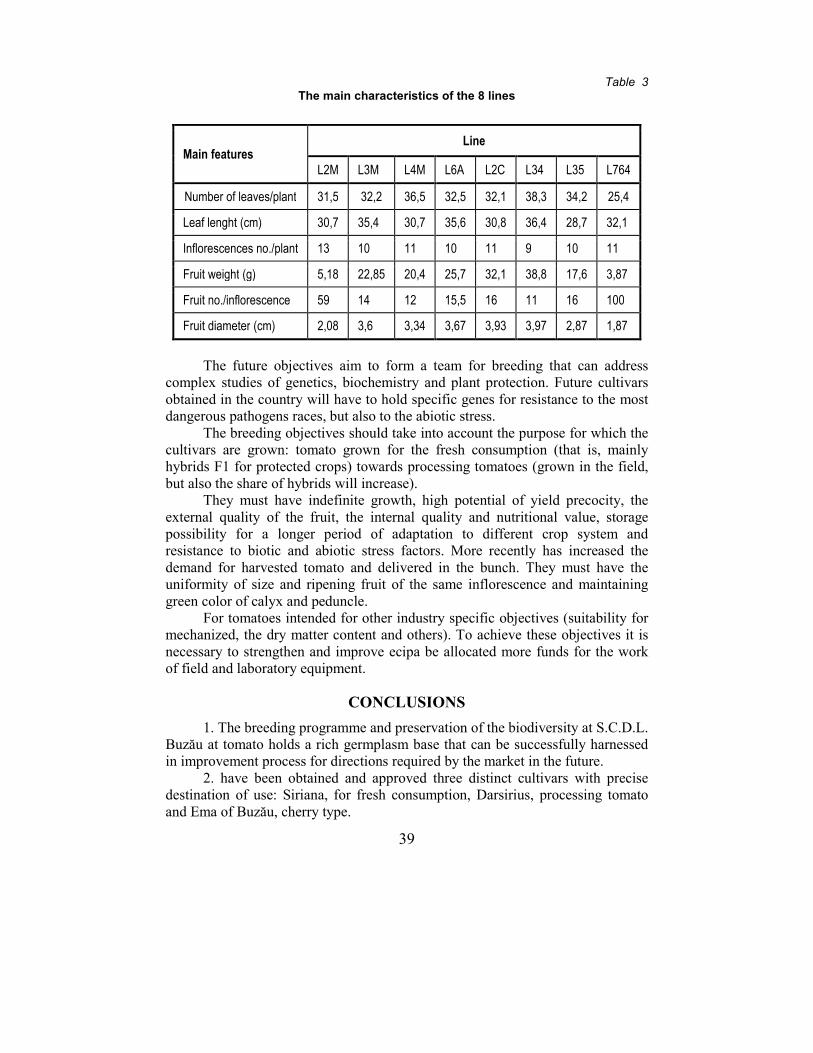
39
Table 3 The main characteristics of the 8 lines
Main features Line
L2M L3M L4M L6A L2C L34 L35 L764
Number of leaves/plant 31,5 32,2 36,5 32,5 32,1 38,3 34,2 25,4
Leaf lenght (cm) 30,7 35,4 30,7 35,6 30,8 36,4 28,7 32,1
Inflorescences no./plant 13 10 11 10 11 9 10 11
Fruit weight (g) 5,18 22,85 20,4 25,7 32,1 38,8 17,6 3,87
Fruit no./inflorescence 59 14 12 15,5 16 11 16 100
Fruit diameter (cm) 2,08 3,6 3,34 3,67 3,93 3,97 2,87 1,87
The future objectives aim to form a team for breeding that can address
complex studies of genetics, biochemistry and plant protection. Future cultivars obtained in the country will have to hold specific genes for resistance to the most dangerous pathogens races, but also to the abiotic stress.
The breeding objectives should take into account the purpose for which the cultivars are grown: tomato grown for the fresh consumption (that is, mainly hybrids F1 for protected crops) towards processing tomatoes (grown in the field, but also the share of hybrids will increase).
They must have indefinite growth, high potential of yield precocity, the external quality of the fruit, the internal quality and nutritional value, storage possibility for a longer period of adaptation to different crop system and resistance to biotic and abiotic stress factors. More recently has increased the demand for harvested tomato and delivered in the bunch. They must have the uniformity of size and ripening fruit of the same inflorescence and maintaining green color of calyx and peduncle.
For tomatoes intended for other industry specific objectives (suitability for mechanized, the dry matter content and others). To achieve these objectives it is necessary to strengthen and improve ecipa be allocated more funds for the work of field and laboratory equipment.
CONCLUSIONS
1. The breeding programme and preservation of the biodiversity at S.C.D.L. Buzău at tomato holds a rich germplasm base that can be successfully harnessed in improvement process for directions required by the market in the future.
2. have been obtained and approved three distinct cultivars with precise destination of use: Siriana, for fresh consumption, Darsirius, processing tomato and Ema of Buzău, cherry type.

40
3. Research continues through approval of strictly specialized cultivars for both different crop system and new directions of use.
REFERENCES
1. Atherton J.G.,1986 - The tomato crop, Ed. Chapman and Hall, New York, pp. 559-581. 2. Hanson P., 2013 - [email protected], www.avrdc.org/index.php?id=648 3. Prohens J., Nuez F., 2008 - Handbook of Plant Breding – Vegetables II, Springer, 4. Scurtu I.,1999 - Genetică şi ameliorare, Ameliorarea plantelor .Ed. Bioterra, Bucuresti. 5. Vînătoru C., 2000 - Producerea semințelor hibride de tomate. Ed. Teocora, Buzau,
pp.88-89.
41
HISTOCHEMICAL RESEARCHES REGARDING ABNORMALIES WITHIN THE DEVELOPMENT OF
WALNUT (JUGLANS REGIA L.) MALE REPRODUCTIVE SYSTEM
CERCETĂRI HISTOCHIMICE PRIVIND LA ANOMALIILE ÎNTÂLNITE ÎN PROCESUL DEZVOLTĂRII SISTEMULUI REPRODUCTIV
MASCULIN AL NUCULUI (JUGLANS REGIA L.)
PÎNTEA Maria1, e-mail: [email protected]
Abstract. During the development of walnut (Juglans regia L.) male sexual system the most frequently noticed anomalies there are conditioned by low temperatures (-10 - -150C) in the meiotic period (the end of March - first half of April months). As a rule in the exterior part of inflorescences of protandrous as well as of some protoginous genotypes microsporogenesis is lead rapidly. In the microspores mother cells (MMC) appear big vacuoles, pushing slowly hypertrophied nucleus to tapetal tissue. There are observed typical phenomenon of cytomixis and picnosis with passage of fragments of nucleus and nucleols from one cell to another. Tapetal tissue is affected too, but there could be founded some sectors with normal development. Vacuolization of tapetal cells is very expressed adjacency MMC , citoplasm and nucleus are moved to parietal layer. Intensity of NA, total proteins and polysaccharides test reactions there are low. Reaction of starch test is null, and for lipids –remarkably low. Anomalies there are observed more frequently for protandrous as well as protoginous genotypes with accelerated rhythm of male flower development. Key words: walnut, male flowers, microsporogenesis, abnormalies. Rezumat. Pe parcursul dezvoltării sistemului reproductiv masculin la nuc (Juglans regia L.) mai frecvent sunt depistate anomalii, provocate de temperaturile joase (-10 - -150C) în perioada meiotică (sfârşitul lunii martie-prima jumătate a lunii aprilie). Din partea exterioară a amenţilor genotipurilor protandre, precum şi ale unora protogine se derulează cu un ritm rapid microsporogeneza. În citoplasma celulelor mamă microsporale (CMM) apar vacuole mari care împing nucleul puţin hipertrofiat spre ţesutul tapetal. Este foarte frecvent fenomenul tipic al citomixiei şi picnozei, cu trecerea fragmentelor de diferite mărimi de nuclei şi nucleoli, a cromozomilor incomplet formaţi dintr-o celulă în alta. Ţesutul tapetal de asemenea este afectat, dar pot fi întâlnite şi porţiuni ce păstrează o dezvoltare normală. Vacuolizarea celulelor tapetale în vecinătatea CMM ia proporţii mari, iar citoplasma şi nucleul sunt deplasate spre stratul parietal. Intensitatea reacţiilor AN, a proteinelor sumare şi a polizaharidelor insolubile este relativ joasă. Reacţia de depistare a amidonului este nulă, iar a lipidelor deosebit de slabă. Mai frecvente sunt anomaliile observate la genotipurile protande şi cele protogine cu ritm accelerat de dezvoltare a florilor masculine. Cuvinte cheie: nuc, flori masculine, microsporogeneza, anomalii.
1Research Institute for Horticulture and Alimentary Technology , Chişinău, Republica Moldova
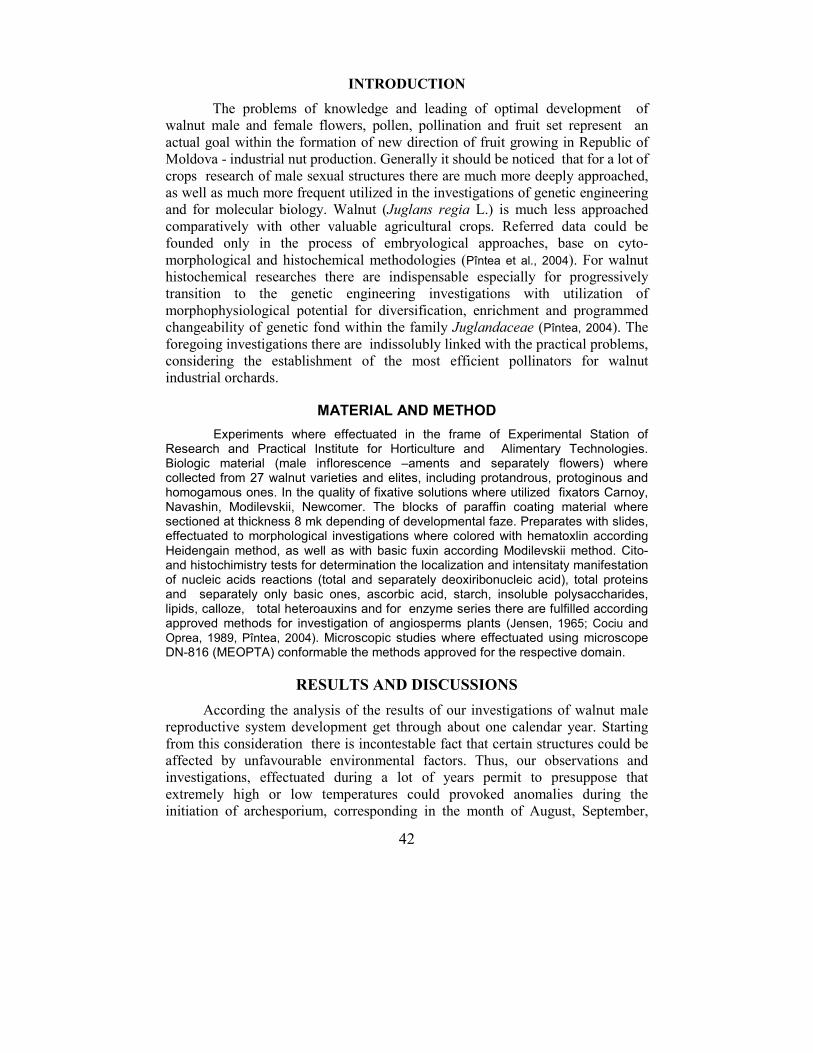
42
INTRODUCTION
The problems of knowledge and leading of optimal development of
walnut male and female flowers, pollen, pollination and fruit set represent an
actual goal within the formation of new direction of fruit growing in Republic of
Moldova - industrial nut production. Generally it should be noticed that for a lot of
crops research of male sexual structures there are much more deeply approached,
as well as much more frequent utilized in the investigations of genetic engineering
and for molecular biology. Walnut (Juglans regia L.) is much less approached
comparatively with other valuable agricultural crops. Referred data could be
founded only in the process of embryological approaches, base on cyto-
morphological and histochemical methodologies (Pîntea et al., 2004). For walnut
histochemical researches there are indispensable especially for progressively
transition to the genetic engineering investigations with utilization of
morphophysiological potential for diversification, enrichment and programmed
changeability of genetic fond within the family Juglandaceae (Pîntea, 2004). The
foregoing investigations there are indissolubly linked with the practical problems,
considering the establishment of the most efficient pollinators for walnut
industrial orchards.
MATERIAL AND METHOD
Experiments where effectuated in the frame of Experimental Station of Research and Practical Institute for Horticulture and Alimentary Technologies. Biologic material (male inflorescence –aments and separately flowers) where collected from 27 walnut varieties and elites, including protandrous, protoginous and homogamous ones. In the quality of fixative solutions where utilized fixators Carnoy, Navashin, Modilevskii, Newcomer. The blocks of paraffin coating material where sectioned at thickness 8 mk depending of developmental faze. Preparates with slides, effectuated to morphological investigations where colored with hematoxlin according Heidengain method, as well as with basic fuxin according Modilevskii method. Cito- and histochimistry tests for determination the localization and intensitaty manifestation of nucleic acids reactions (total and separately deoxiribonucleic acid), total proteins and separately only basic ones, ascorbic acid, starch, insoluble polysaccharides, lipids, calloze, total heteroauxins and for enzyme series there are fulfilled according approved methods for investigation of angiosperms plants (Jensen, 1965; Cociu and Oprea, 1989, Pîntea, 2004). Microscopic studies where effectuated using microscope DN-816 (MEOPTA) conformable the methods approved for the respective domain.
RESULTS AND DISCUSSIONS
According the analysis of the results of our investigations of walnut male
reproductive system development get through about one calendar year. Starting
from this consideration there is incontestable fact that certain structures could be
affected by unfavourable environmental factors. Thus, our observations and
investigations, effectuated during a lot of years permit to presuppose that
extremely high or low temperatures could provoked anomalies during the
initiation of archesporium, corresponding in the month of August, September,
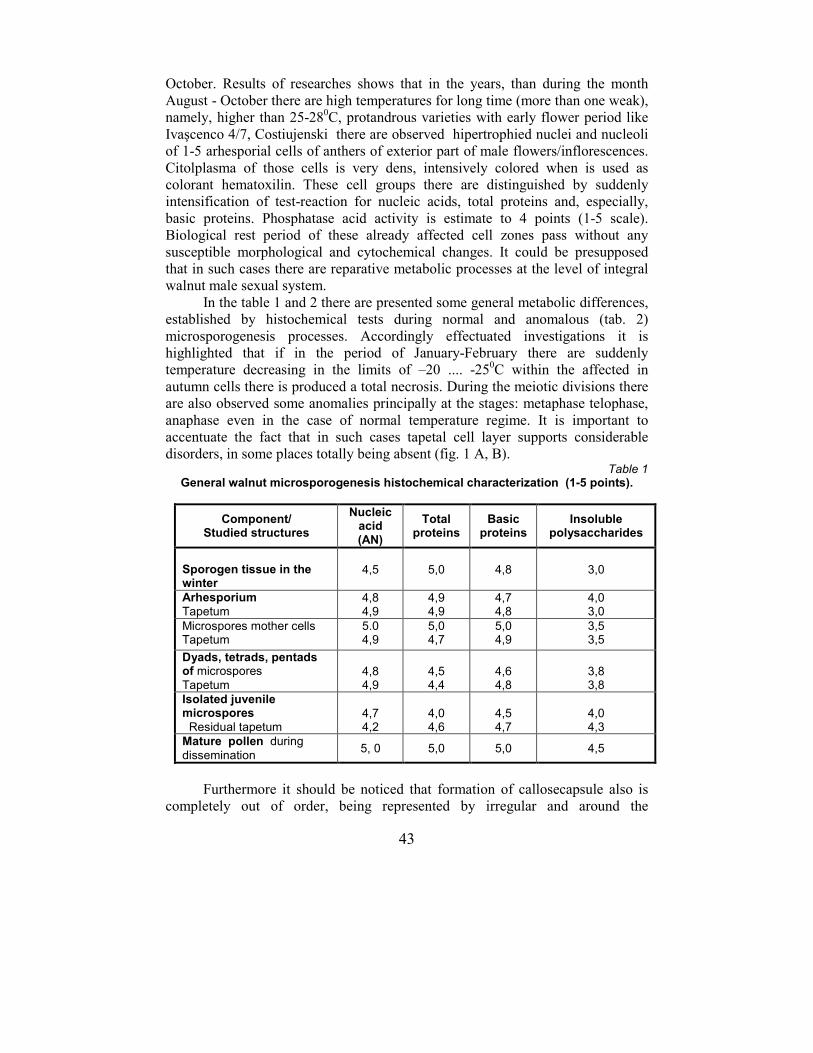
43
October. Results of researches shows that in the years, than during the month
August - October there are high temperatures for long time (more than one weak),
namely, higher than 25-280C, protandrous varieties with early flower period like
Ivaşcenco 4/7, Costiujenski there are observed hipertrophied nuclei and nucleoli
of 1-5 arhesporial cells of anthers of exterior part of male flowers/inflorescences.
Citolplasma of those cells is very dens, intensively colored when is used as
colorant hematoxilin. These cell groups there are distinguished by suddenly
intensification of test-reaction for nucleic acids, total proteins and, especially,
basic proteins. Phosphatase acid activity is estimate to 4 points (1-5 scale).
Biological rest period of these already affected cell zones pass without any
susceptible morphological and cytochemical changes. It could be presupposed
that in such cases there are reparative metabolic processes at the level of integral
walnut male sexual system.
In the table 1 and 2 there are presented some general metabolic differences,
established by histochemical tests during normal and anomalous (tab. 2)
microsporogenesis processes. Accordingly effectuated investigations it is
highlighted that if in the period of January-February there are suddenly
temperature decreasing in the limits of –20 .... -250C within the affected in
autumn cells there is produced a total necrosis. During the meiotic divisions there
are also observed some anomalies principally at the stages: metaphase telophase,
anaphase even in the case of normal temperature regime. It is important to
accentuate the fact that in such cases tapetal cell layer supports considerable
disorders, in some places totally being absent (fig. 1 A, B). Table 1
General walnut microsporogenesis histochemical characterization (1-5 points).
Component/ Studied structures
Nucleic acid (AN)
Total proteins
Basic proteins
Insoluble polysaccharides
Sporogen tissue in the winter
4,5
5,0
4,8
3,0
Arhesporium
Tapetum 4,8 4,9
4,9 4,9
4,7 4,8
4,0 3,0
Microspores mother cells Tapetum
5.0 4,9
5,0 4,7
5,0 4,9
3,5 3,5
Dyads, tetrads, pentads of microspores
Tapetum
4,8 4,9
4,5 4,4
4,6 4,8
3,8 3,8
Isolated juvenile microspores
Residual tapetum
4,7 4,2
4,0 4,6
4,5 4,7
4,0 4,3
Mature pollen during
dissemination 5, 0 5,0 5,0 4,5
Furthermore it should be noticed that formation of callosecapsule also is
completely out of order, being represented by irregular and around the
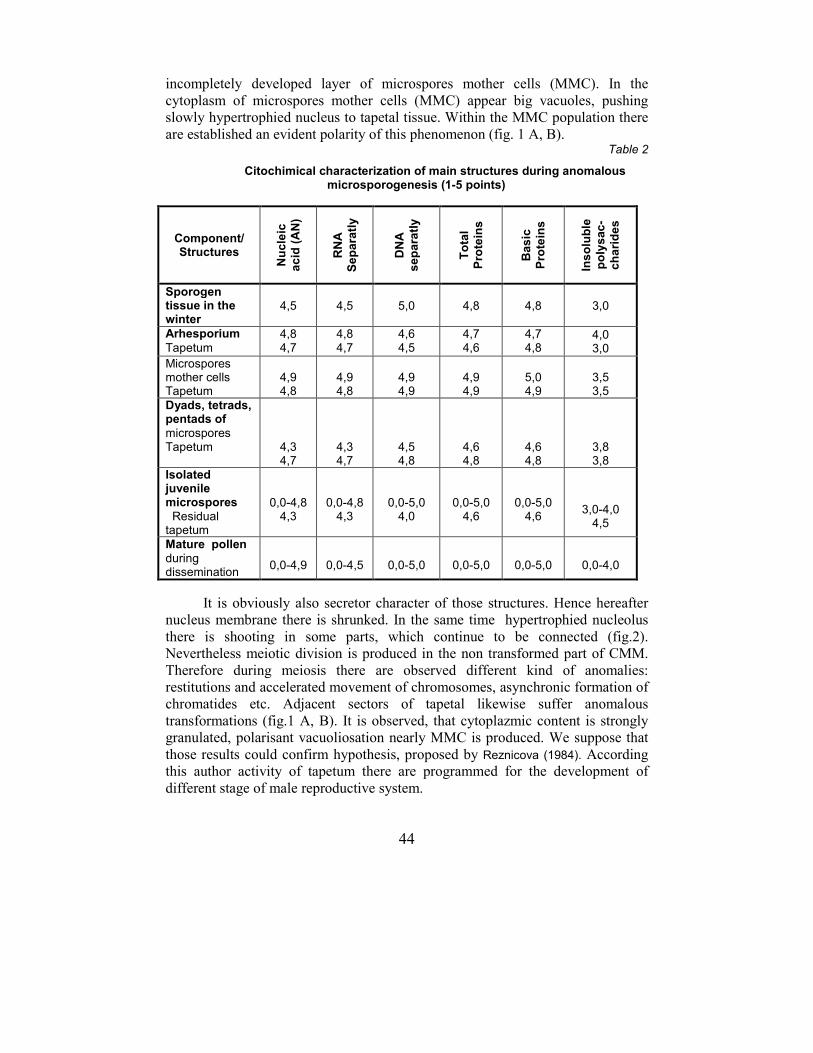
44
incompletely developed layer of microspores mother cells (MMC). In the
cytoplasm of microspores mother cells (MMC) appear big vacuoles, pushing
slowly hypertrophied nucleus to tapetal tissue. Within the MMC population there
are established an evident polarity of this phenomenon (fig. 1 A, B). Table 2
Citochimical characterization of main structures during anomalous microsporogenesis (1-5 points)
Component/ Structures
Nu
cle
ic
ac
id (
AN
)
RN
A
Se
pa
ratl
y
DN
A
se
pa
ratl
y
To
tal
Pro
tein
s
Ba
sic
Pro
tein
s
Ins
olu
ble
po
lys
ac
-
ch
ari
de
s
Sporogen tissue in the winter
4,5 4,5 5,0 4,8 4,8 3,0
Arhesporium
Tapetum 4,8 4,7
4,8 4,7
4,6 4,5
4,7 4,6
4,7 4,8
4,0 3,0
Microspores mother cells Tapetum
4,9 4,8
4,9 4,8
4,9 4,9
4,9 4,9
5,0 4,9
3,5 3,5
Dyads, tetrads, pentads of
microspores Tapetum
4,3 4,7
4,3 4,7
4,5 4,8
4,6 4,8
4,6 4,8
3,8 3,8
Isolated juvenile microspores
Residual tapetum
0,0-4,8 4,3
0,0-4,8 4,3
0,0-5,0 4,0
0,0-5,0 4,6
0,0-5,0 4,6
3,0-4,0 4,5
Mature pollen
during dissemination
0,0-4,9
0,0-4,5
0,0-5,0
0,0-5,0
0,0-5,0
0,0-4,0
It is obviously also secretor character of those structures. Hence hereafter
nucleus membrane there is shrunked. In the same time hypertrophied nucleolus
there is shooting in some parts, which continue to be connected (fig.2).
Nevertheless meiotic division is produced in the non transformed part of CMM.
Therefore during meiosis there are observed different kind of anomalies:
restitutions and accelerated movement of chromosomes, asynchronic formation of
chromatides etc. Adjacent sectors of tapetal likewise suffer anomalous
transformations (fig.1 A, B). It is observed, that cytoplazmic content is strongly
granulated, polarisant vacuoliosation nearly MMC is produced. We suppose that
those results could confirm hypothesis, proposed by Reznicova (1984). According
this author activity of tapetum there are programmed for the development of
different stage of male reproductive system.
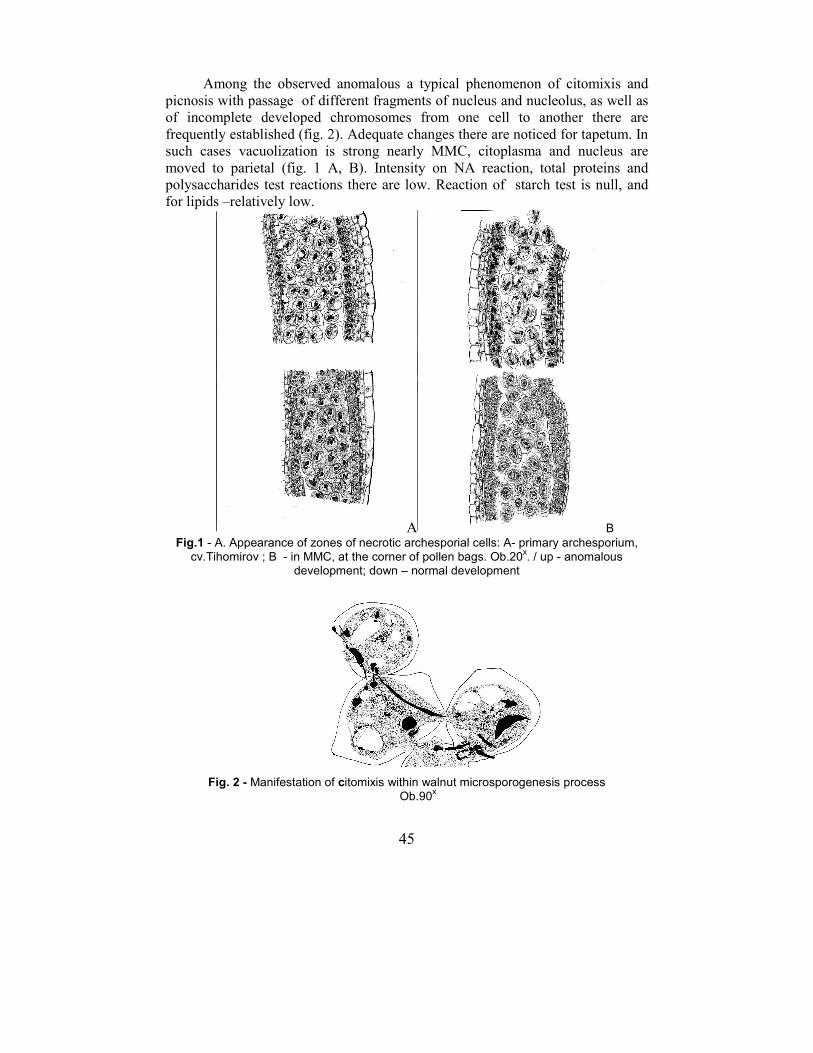
45
Among the observed anomalous a typical phenomenon of citomixis and
picnosis with passage of different fragments of nucleus and nucleolus, as well as
of incomplete developed chromosomes from one cell to another there are
frequently established (fig. 2). Adequate changes there are noticed for tapetum. In
such cases vacuolization is strong nearly MMC, citoplasma and nucleus are
moved to parietal (fig. 1 A, B). Intensity on NA reaction, total proteins and
polysaccharides test reactions there are low. Reaction of starch test is null, and
for lipids –relatively low.
A B Fig.1 - A. Appearance of zones of necrotic archesporial cells: A- primary archesporium,
cv.Tihomirov ; B - in MMC, at the corner of pollen bags. Ob.20x. / up - anomalous
development; down – normal development
Fig. 2 - Manifestation of citomixis within walnut microsporogenesis process
Ob.90x
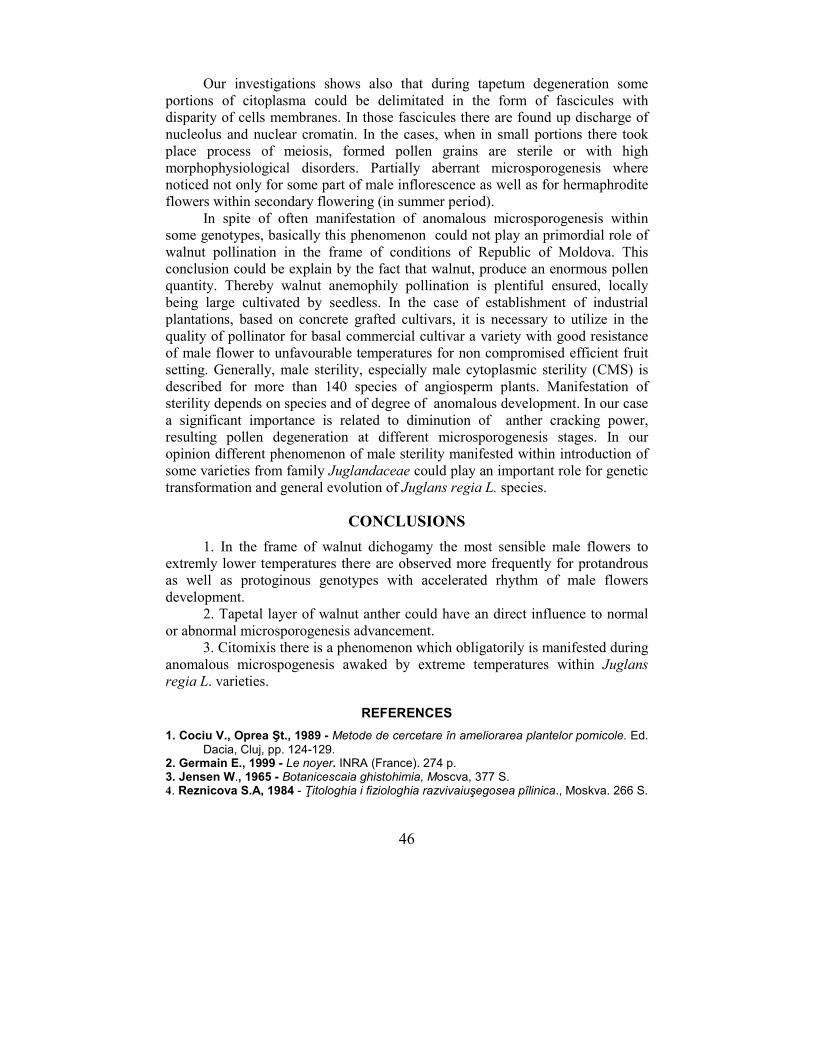
46
Our investigations shows also that during tapetum degeneration some
portions of citoplasma could be delimitated in the form of fascicules with
disparity of cells membranes. In those fascicules there are found up discharge of
nucleolus and nuclear cromatin. In the cases, when in small portions there took
place process of meiosis, formed pollen grains are sterile or with high
morphophysiological disorders. Partially aberrant microsporogenesis where
noticed not only for some part of male inflorescence as well as for hermaphrodite
flowers within secondary flowering (in summer period).
In spite of often manifestation of anomalous microsporogenesis within
some genotypes, basically this phenomenon could not play an primordial role of
walnut pollination in the frame of conditions of Republic of Moldova. This
conclusion could be explain by the fact that walnut, produce an enormous pollen
quantity. Thereby walnut anemophily pollination is plentiful ensured, locally
being large cultivated by seedless. In the case of establishment of industrial
plantations, based on concrete grafted cultivars, it is necessary to utilize in the
quality of pollinator for basal commercial cultivar a variety with good resistance
of male flower to unfavourable temperatures for non compromised efficient fruit
setting. Generally, male sterility, especially male cytoplasmic sterility (CMS) is
described for more than 140 species of angiosperm plants. Manifestation of
sterility depends on species and of degree of anomalous development. In our case
a significant importance is related to diminution of anther cracking power,
resulting pollen degeneration at different microsporogenesis stages. In our
opinion different phenomenon of male sterility manifested within introduction of
some varieties from family Juglandaceae could play an important role for genetic
transformation and general evolution of Juglans regia L. species.
CONCLUSIONS
1. In the frame of walnut dichogamy the most sensible male flowers to
extremly lower temperatures there are observed more frequently for protandrous
as well as protoginous genotypes with accelerated rhythm of male flowers
development.
2. Tapetal layer of walnut anther could have an direct influence to normal
or abnormal microsporogenesis advancement.
3. Citomixis there is a phenomenon which obligatorily is manifested during
anomalous microspogenesis awaked by extreme temperatures within Juglans regia L. varieties.
REFERENCES
1. Cociu V., Oprea Şt., 1989 - Metode de cercetare în ameliorarea plantelor pomicole. Ed.
Dacia, Cluj, pp. 124-129. 2. Germain E., 1999 - Le noyer. INRA (France). 274 p. 3. Jensen W., 1965 - Botanicescaia ghistohimia, Moscva, 377 S. 4. Reznicova S.A, 1984 - Ţitologhia i fiziologhia razvivaiuşegosea pîlinica., Moskva. 266 S.
47
RESEARCH STUDY ON THE DYNAMICS OF THE CONTENT OF PHOTOSYNTHETIC PIGMENTS AT SOME
GRAPEVINE VARIETIES IN THE VEGETATION YEAR 2013
CERCETĂRI PRIVIND DINAMICA CONŢINUTULUI DE PIGMENŢI FOTOSINTETICI LA UNELE SOIURI DE VIŢĂ DE VIE ÎN
PERIOADA DE VEGETAŢIE A ANULUI 2013
JITĂREANU Carmenica Doina1, SLABU Cristina1, MARTA Alina Elena1 e-mail: [email protected]
Abstract: Grapevine plantations and environmental conditions create an entity in
which interdependence and mutual conditioning represent a normal state of things,
the higher influence being exerted by the environmental element toward the
vegetal organisms. The modifications of environmental conditions lead to
modifications in the metabolism, the development of growth and development
processes, with positive or negative effects on both plant quality and vitality.
Atmospheric and pedological draught perturb the physiological and biochemical
processes having significant repercussions on cellular ultrastructure and
physiological processes. Climatic changes and their impact on vineyards represent
a highly important issue for the researchers of various fields of activity.
Key words: vineyard, eco-physiology, photosynthetic pigments Rezumat :Plantaţia viticolă şi condiţiile de mediu alcătuiesc o unitate, în cadrul
căreia interdependenţa şi condiţionarea reciprocă constituie o legitate, cu o
influenţă mai puternică dinspre mediu către organismele vegetale. Modificarea
condiţiilor de mediu determină schimbări în metabolism, în desfăşurarea
proceselor de creştere şi dezvoltare, cu influenţe pozitive sau negative asupra
calităţii şi vitalităţii plantelo. Seceta atmosferică şi pedologică determină
dereglarea unor procese fiziologice şi biochimice curepercusiuni importante
asupra ultrastructurii şi proceselor fiziologice din celule. Schimbările climatice
şi problema impactului acestora asupra podgoriilor reprezintă o problemă de
maximă importanţă pentru cercetătorii din diferite domenii. Cuvinte cheie: viţă de vie, eco-fiziologie, pigmenţi fotosintetici
INTRODUCTION
The particularities of the photosynthesis process for Vitis varieties and species are due to the morphological characteristics of the leaf, different from one
species to the other, or from one variety to the other, as far as the thickness of the mesophil, epidermis, cuticle and number of stomas etc. are concerned (Jones,
2006). The photosynthetic activity of the vine is influenced by the request or the need of metabolites, expressed by the production quantity. In general, fertile shoots have a more intense photosynthetic activity than the sterile ones (Bloom,
2009; Schultz, 2008). The level of metabolites the vine can provide through
1 University of Agricultural Sciences and Veterinary Medicine of Iași, Romania

48
photosynthesis is limited, and if the request is excessive it leads to a diminished
vegetative growth, slight differentiation of the productive buds, deficitary maturation of grapes and tendril wood (Chavez et al., 2010). The determinations
included in the present study are part of a wider one that includes various grapevine varieties (V1 -Fetească albă, V2 - Fetească regală, V3 - Italian Riesling,
V4 - Băbească gri, V5 - Francuşă, V6 - Grasă de Cotnari, V7 -Tămâioasă românească) cultivated in three wine regions from Moldavia: Iaşi, Cotnari and Dealu Bujorului, in the climatic conditions of 2013 (Jitareanu, 2012, 2013).
MATERIAL AND METHOD
The eco-physiological reaction of the grapevines varieties experimented in the climatic conditions induced by global warming in the wine centres of Iasi, Cotnari and Dealu Bujorului was appreciated based on the dynamics of the content of foliar pigments seen as indicators for photosynthesis processes and plants resistance to stress conditions (Steele M., Gitelson A., Rundquist D. 2008). The analyses of foliar pigments have been performed in June and July – during flowering and berry development and at the beginning of September during grape maturation, on the leaf under the cluster at the fertile shoot and on the leaf from the same level, at the sterile shoot. The leaf pigment content was analyzed spectrophotometrically, its assessment depending of the light absorption capacity of the pigment acetonic extract (1%) in the visible spectrum (400-700 nm) and close UV (320 nm). Chlorophyll a 663 can assess photosynthesis intensity in the reaction centre, while chlorophyll a 435 and chlorophyll b 453 can assess the light absorption capacity in the light absorption centre in photosynthetic systems; flavonoid pigments with close UV (320nm) absorption can evaluate plants reaction to different climatic stress factors.
RESULTS AND DISCUSSIONS
The dynamics of the average foliar pigment content In 2013 in Iasi vineyard, the content of chlorophyll a 662 -663 nm
recorded similar values at the following varieties in all three phenophases: Fetească regală, Frâncuşă, Grasă de Cotnari, Tămâioasă romănească and
Băbească gri and identical values at Fetească albă. The highest values were recorded at Băbească gri variety, leading to the highest production recorded in
this vineyard (15.8 t/ha). The values of the average chlorophyll content a 662 –
663 generally ranged between 1.1 – 1.3 u.a. demonstrating the relatively stable
character of the synthesis capacity from the reaction centres of the photosynthetic systems. A different behaviour was recorded at the Italian Riesling variety, with the lowest content of chlorophyll a 662-663, especially in the berry growth
phenophase which, combined with a minimum foliar surface on the shoot, lead to a small quantitative production, but with high sugar content; this was due to the
intense accumulation of chlorophyll a 662 – 663 in the grape maturation phenophase (fig. 1). As far as the chlorophyll a 431- 432 nm content is concerned, the main component of the absorption centre from the photosynthetic systems,
from figure 2, we can notice that the following varieties Fetească albă, Frâncuşă,
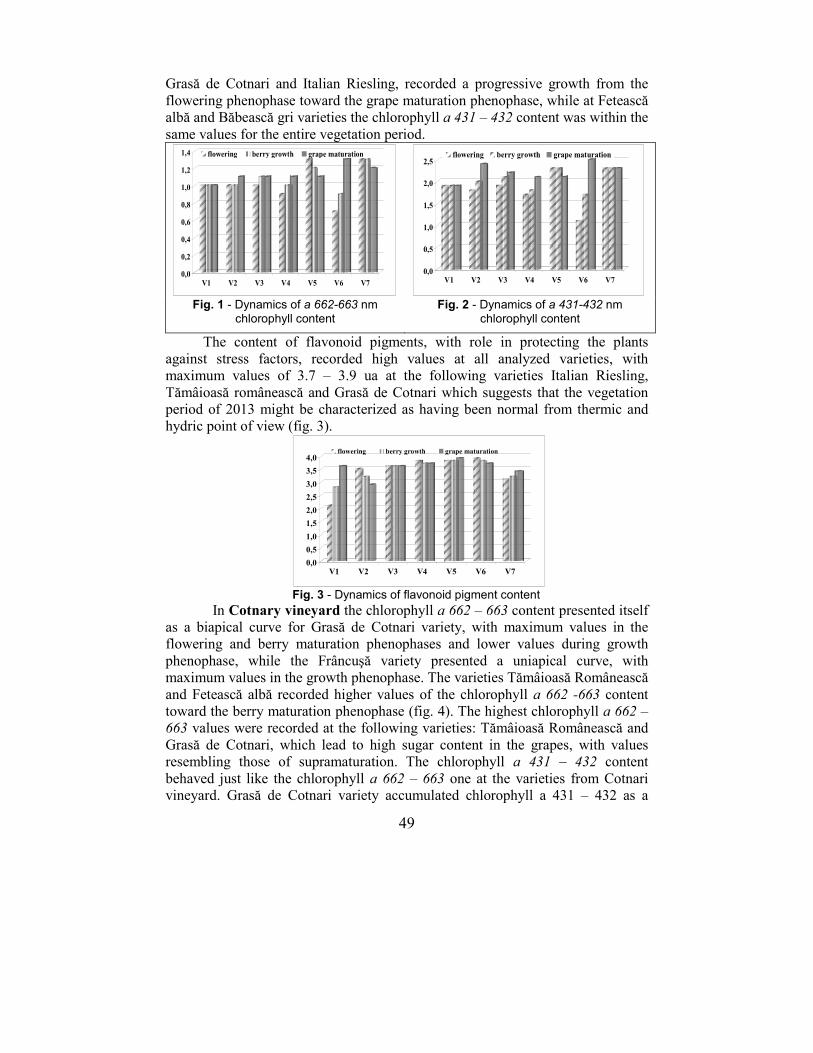
49
Grasă de Cotnari and Italian Riesling, recorded a progressive growth from the
flowering phenophase toward the grape maturation phenophase, while at Fetească albă and Băbească gri varieties the chlorophyll a 431 – 432 content was within the
same values for the entire vegetation period.
0,0
0,2
0,4
0,6
0,8
1,0
1,2
1,4
V1 V2 V3 V4 V5 V6 V7
flowering berry growth grape maturation
0,0
0,5
1,0
1,5
2,0
2,5
V1 V2 V3 V4 V5 V6 V7
flowering berry growth grape maturation
Fig. 1 - Dynamics of a 662-663 nm
chlorophyll content
Fig. 2 - Dynamics of a 431-432 nm
chlorophyll content
The content of flavonoid pigments, with role in protecting the plants
against stress factors, recorded high values at all analyzed varieties, with maximum values of 3.7 – 3.9 ua at the following varieties Italian Riesling,
Tămâioasă românească and Grasă de Cotnari which suggests that the vegetation period of 2013 might be characterized as having been normal from thermic and hydric point of view (fig. 3).
0,0
0,5
1,0
1,5
2,0
2,5
3,0
3,5
4,0
V1 V2 V3 V4 V5 V6 V7
flowering berry growth grape maturation
Fig. 3 - Dynamics of flavonoid pigment content
In Cotnary vineyard the chlorophyll a 662 – 663 content presented itself as a biapical curve for Grasă de Cotnari variety, with maximum values in the flowering and berry maturation phenophases and lower values during growth
phenophase, while the Frâncuşă variety presented a uniapical curve, with maximum values in the growth phenophase. The varieties Tămâioasă Românească
and Fetească albă recorded higher values of the chlorophyll a 662 -663 content toward the berry maturation phenophase (fig. 4). The highest chlorophyll a 662 –
663 values were recorded at the following varieties: Tămâioasă Românească and
Grasă de Cotnari, which lead to high sugar content in the grapes, with values resembling those of supramaturation. The chlorophyll a 431 – 432 content
behaved just like the chlorophyll a 662 – 663 one at the varieties from Cotnari vineyard. Grasă de Cotnari variety accumulated chlorophyll a 431 – 432 as a
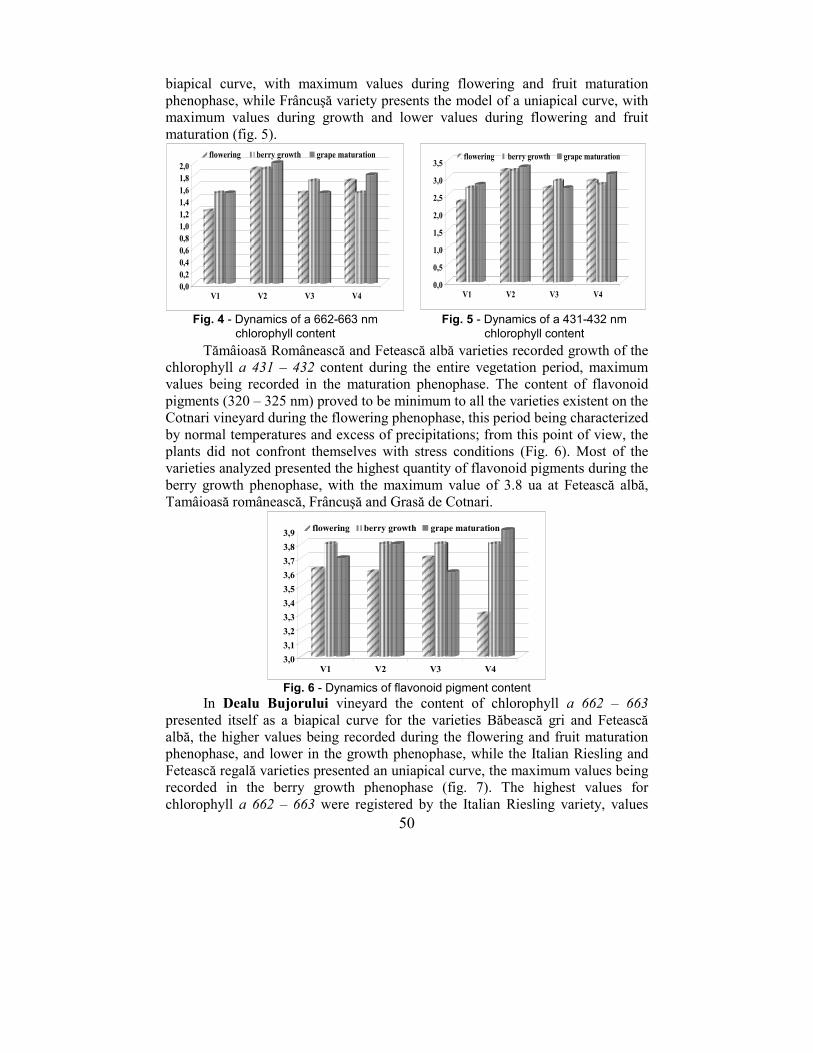
50
biapical curve, with maximum values during flowering and fruit maturation
phenophase, while Frâncuşă variety presents the model of a uniapical curve, with maximum values during growth and lower values during flowering and fruit
maturation (fig. 5).
0,00,20,40,60,81,01,21,41,61,82,0
V1 V2 V3 V4
flowering berry growth grape maturation
0,0
0,5
1,0
1,5
2,0
2,5
3,0
3,5
V1 V2 V3 V4
flowering berry growth grape maturation
Fig. 4 - Dynamics of a 662-663 nm
chlorophyll content
Fig. 5 - Dynamics of a 431-432 nm
chlorophyll content
Tămâioasă Românească and Fetească albă varieties recorded growth of the chlorophyll a 431 – 432 content during the entire vegetation period, maximum values being recorded in the maturation phenophase. The content of flavonoid
pigments (320 – 325 nm) proved to be minimum to all the varieties existent on the Cotnari vineyard during the flowering phenophase, this period being characterized
by normal temperatures and excess of precipitations; from this point of view, the plants did not confront themselves with stress conditions (Fig. 6). Most of the varieties analyzed presented the highest quantity of flavonoid pigments during the
berry growth phenophase, with the maximum value of 3.8 ua at Fetească albă, Tamâioasă românească, Frâncuşă and Grasă de Cotnari.
3,0
3,1
3,2
3,3
3,4
3,5
3,6
3,7
3,8
3,9
V1 V2 V3 V4
flowering berry growth grape maturation
Fig. 6 - Dynamics of flavonoid pigment content
In Dealu Bujorului vineyard the content of chlorophyll a 662 – 663
presented itself as a biapical curve for the varieties Băbească gri and Fetească albă, the higher values being recorded during the flowering and fruit maturation phenophase, and lower in the growth phenophase, while the Italian Riesling and
Fetească regală varieties presented an uniapical curve, the maximum values being recorded in the berry growth phenophase (fig. 7). The highest values for
chlorophyll a 662 – 663 were registered by the Italian Riesling variety, values
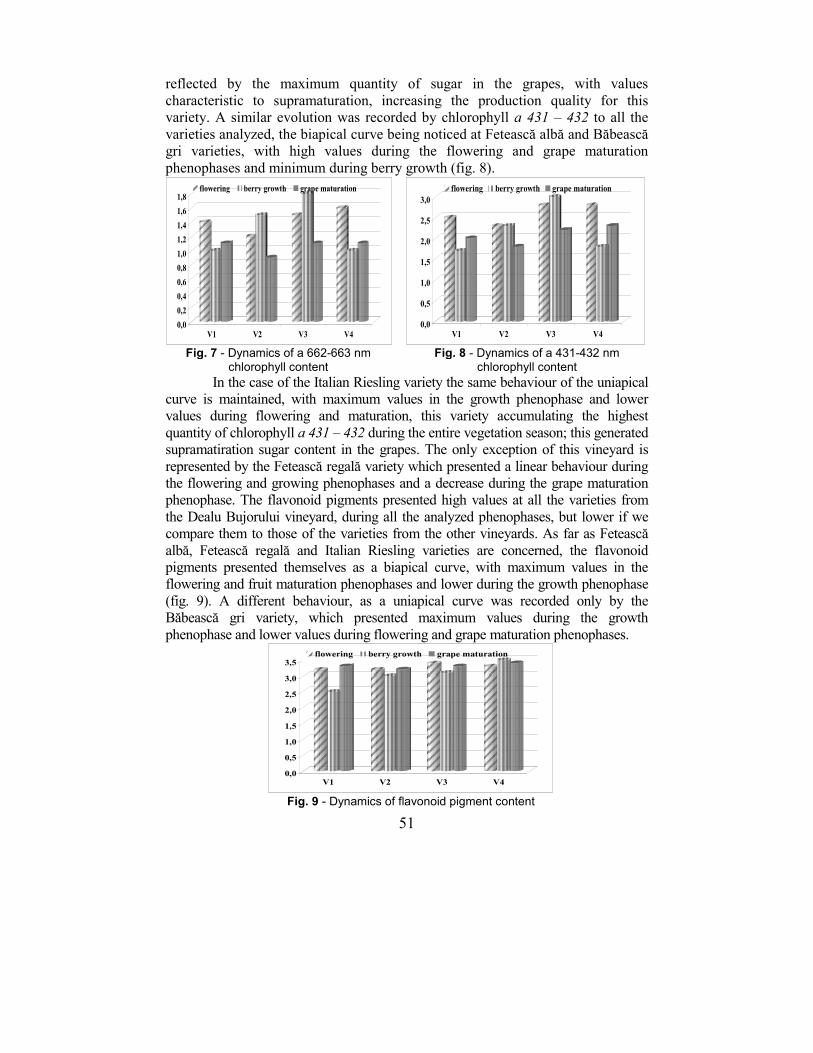
51
reflected by the maximum quantity of sugar in the grapes, with values
characteristic to supramaturation, increasing the production quality for this variety. A similar evolution was recorded by chlorophyll a 431 – 432 to all the
varieties analyzed, the biapical curve being noticed at Fetească albă and Băbească gri varieties, with high values during the flowering and grape maturation
phenophases and minimum during berry growth (fig. 8).
0,0
0,2
0,4
0,6
0,8
1,0
1,2
1,4
1,6
1,8
V1 V2 V3 V4
flowering berry growth grape maturation
0,0
0,5
1,0
1,5
2,0
2,5
3,0
V1 V2 V3 V4
flowering berry growth grape maturation
Fig. 7 - Dynamics of a 662-663 nm
chlorophyll content
Fig. 8 - Dynamics of a 431-432 nm
chlorophyll content
In the case of the Italian Riesling variety the same behaviour of the uniapical curve is maintained, with maximum values in the growth phenophase and lower values during flowering and maturation, this variety accumulating the highest
quantity of chlorophyll a 431 – 432 during the entire vegetation season; this generated supramatiration sugar content in the grapes. The only exception of this vineyard is
represented by the Fetească regală variety which presented a linear behaviour during the flowering and growing phenophases and a decrease during the grape maturation phenophase. The flavonoid pigments presented high values at all the varieties from
the Dealu Bujorului vineyard, during all the analyzed phenophases, but lower if we compare them to those of the varieties from the other vineyards. As far as Fetească
albă, Fetească regală and Italian Riesling varieties are concerned, the flavonoid pigments presented themselves as a biapical curve, with maximum values in the flowering and fruit maturation phenophases and lower during the growth phenophase
(fig. 9). A different behaviour, as a uniapical curve was recorded only by the Băbească gri variety, which presented maximum values during the growth
phenophase and lower values during flowering and grape maturation phenophases.
0,0
0,5
1,0
1,5
2,0
2,5
3,0
3,5
V1 V2 V3 V4
flowering berry growth grape maturation
Fig. 9 - Dynamics of flavonoid pigment content
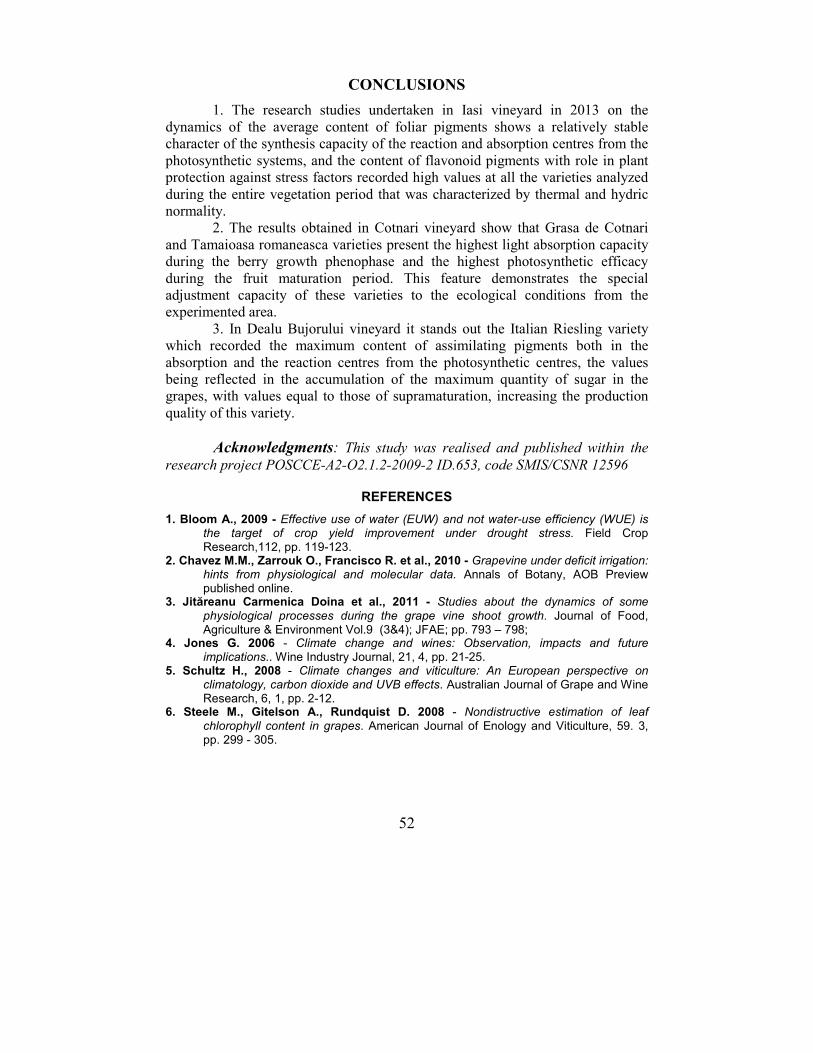
52
CONCLUSIONS
1. The research studies undertaken in Iasi vineyard in 2013 on the
dynamics of the average content of foliar pigments shows a relatively stable character of the synthesis capacity of the reaction and absorption centres from the
photosynthetic systems, and the content of flavonoid pigments with role in plant protection against stress factors recorded high values at all the varieties analyzed
during the entire vegetation period that was characterized by thermal and hydric normality.
2. The results obtained in Cotnari vineyard show that Grasa de Cotnari
and Tamaioasa romaneasca varieties present the highest light absorption capacity during the berry growth phenophase and the highest photosynthetic efficacy
during the fruit maturation period. This feature demonstrates the special adjustment capacity of these varieties to the ecological conditions from the experimented area.
3. In Dealu Bujorului vineyard it stands out the Italian Riesling variety which recorded the maximum content of assimilating pigments both in the
absorption and the reaction centres from the photosynthetic centres, the values being reflected in the accumulation of the maximum quantity of sugar in the grapes, with values equal to those of supramaturation, increasing the production
quality of this variety.
Acknowledgments: This study was realised and published within the
research project POSCCE-A2-O2.1.2-2009-2 ID.653, code SMIS/CSNR 12596
REFERENCES
1. Bloom A., 2009 - Effective use of water (EUW) and not water-use efficiency (WUE) is the target of crop yield improvement under drought stress. Field Crop Research,112, pp. 119-123.
2. Chavez M.M., Zarrouk O., Francisco R. et al., 2010 - Grapevine under deficit irrigation: hints from physiological and molecular data. Annals of Botany, AOB Preview published online.
3. Jităreanu Carmenica Doina et al., 2011 - Studies about the dynamics of some
physiological processes during the grape vine shoot growth. Journal of Food, Agriculture & Environment Vol.9 (3&4); JFAE; pp. 793 – 798;
4. Jones G. 2006 - Climate change and wines: Observation, impacts and future implications.. Wine Industry Journal, 21, 4, pp. 21-25.
5. Schultz H., 2008 - Climate changes and viticulture: An European perspective on climatology, carbon dioxide and UVB effects. Australian Journal of Grape and Wine Research, 6, 1, pp. 2-12.
6. Steele M., Gitelson A., Rundquist D. 2008 - Nondistructive estimation of leaf
chlorophyll content in grapes. American Journal of Enology and Viticulture, 59. 3, pp. 299 - 305.
53
RESEARCH CONDUCTED DURING THE DORMANT PERIOD IN GRAPEVINE
CERCETĂRI EFECTUATE ÎN TIMPUL REPAUSULUI
VEGETATIV LA VIŢA DE VIE
MARTA Alina Elena1, JITĂREANU Carmenica Doina1, SLABU Cristina1 e-mail: [email protected]
Abstract: Vine resistance over the winter is influenced by the maturation of the
shoots on the one hand, and the genetic resistance of cultivated plants, on the
other hand. A big problem is the intensity of extreme values of climate factors.
Although they were considered incidental in recent years they have become
common. Due the excessive heating of the air in winter, often producing strong
annealing, negative values occur leading to loss of viability buds (Dobreva et al.,
2006). Among the carbohydrates, starch is the most important reserve substance
of string, and the percentage that is in the string, the end of the growing
influence plant resistance to low temperatures in winter conditions. Starch
content values close to normal (3.6%) were recorded in most varieties analyzed,
except Fetească albă in Dealul Bujorului vineyard cultivated and grown cultivar
Riesling italian in Dealul Bujorului vineyards and Iasi, which starch content was
a maximum, showing that the enzymatic hydrolysis was less pronounced. Key words: vineyard, starch, low temperatures Rezumat : Rezistenţa viţei peste iarnă este influenţată de maturarea lăstarilor,
pe de o parte, şi de rezistenţa genetică a soiurilor cultivate, pe de altă parte.
O mare problemă o constituie intensitatea valorilor extreme a factorilor
climatici. Dintre aceştia, temperatura este cea mai agresivă. Pe fondul încălzirii
excesive a aerului în lunile de iarnă, care produc adesea decăliri puternice,
survin valori negative ce conduc la pierderea viabilităţii mugurilor (Dobreva et
al., 2006). Dintre hidraţii de carbon, amidonul este cea mai importantă substanţă
de rezervă din coarde, care în funcţie de procentul în care se găseşte în coarde,
la sfârşitul perioadei de vegetaţie, influenţează rezistenţa plantei în condiţiile
temperaturilor scăzute din timpul iernii. Valori ale conţinutului în amidon
apropiate de cele normale (3-6%) s-au înregistrat la majoritatea soiurilor
analizate, excepţie făcând soiurile Fetească albă cultivat în podgoria Dealu
Bujorului, precum şi soiul Riesling italian cultivat în podgoriile Dealu Bujorului
şi Iaşi, la care conţinutul de amidon a fost maxim, demonstrând că procesul de
hidroliză enzimatică a fost mai puţin intens. Cuvinte cheie: viţă de vie, amidon,temperaturi scăzute
INTRODUCTION
Shoots maturation, on the one hand, and genetic resistance of cultivated
varieties influence grapevine resistance during winter, on the other hand. Shoots
1 University of Agricultural Sciences and Veterinary Medicine of Iași, Romania
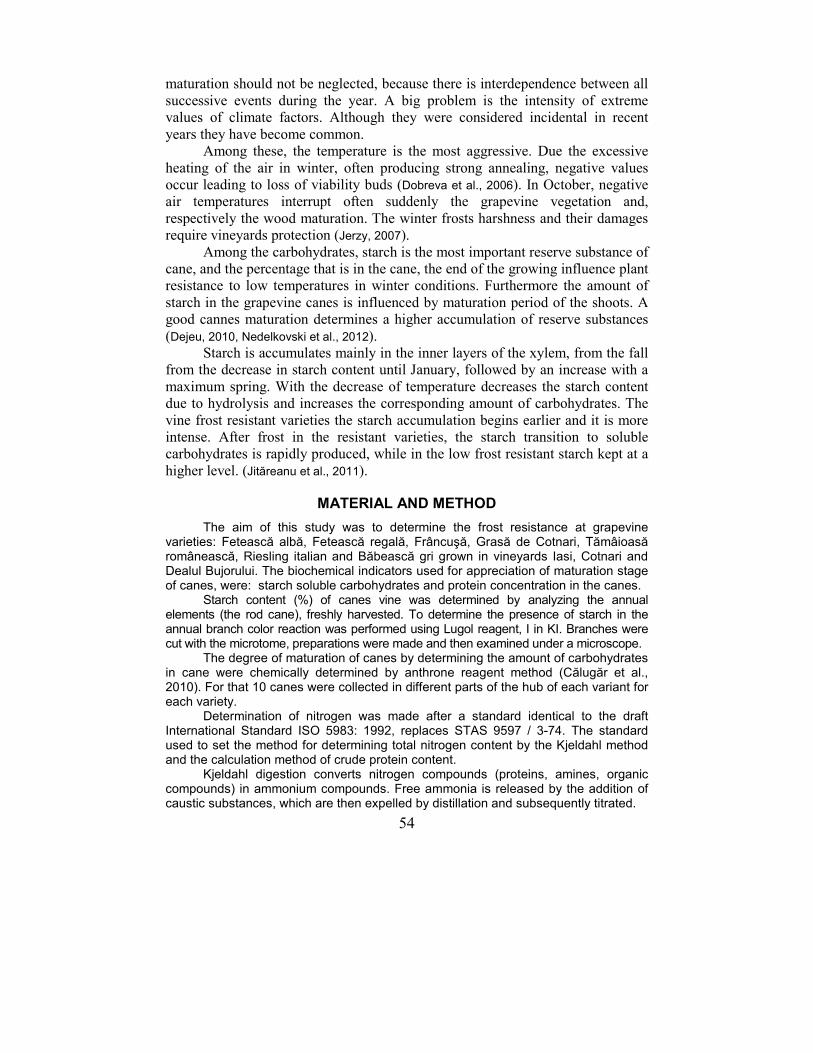
54
maturation should not be neglected, because there is interdependence between all
successive events during the year. A big problem is the intensity of extreme values of climate factors. Although they were considered incidental in recent
years they have become common. Among these, the temperature is the most aggressive. Due the excessive
heating of the air in winter, often producing strong annealing, negative values occur leading to loss of viability buds (Dobreva et al., 2006). In October, negative air temperatures interrupt often suddenly the grapevine vegetation and,
respectively the wood maturation. The winter frosts harshness and their damages require vineyards protection (Jerzy, 2007).
Among the carbohydrates, starch is the most important reserve substance of cane, and the percentage that is in the cane, the end of the growing influence plant resistance to low temperatures in winter conditions. Furthermore the amount of
starch in the grapevine canes is influenced by maturation period of the shoots. A good cannes maturation determines a higher accumulation of reserve substances
(Dejeu, 2010, Nedelkovski et al., 2012). Starch is accumulates mainly in the inner layers of the xylem, from the fall
from the decrease in starch content until January, followed by an increase with a
maximum spring. With the decrease of temperature decreases the starch content due to hydrolysis and increases the corresponding amount of carbohydrates. The
vine frost resistant varieties the starch accumulation begins earlier and it is more intense. After frost in the resistant varieties, the starch transition to soluble carbohydrates is rapidly produced, while in the low frost resistant starch kept at a
higher level. (Jităreanu et al., 2011).
MATERIAL AND METHOD
The aim of this study was to determine the frost resistance at grapevine varieties: Fetească albă, Fetească regală, Frâncuşă, Grasă de Cotnari, Tămâioasă românească, Riesling italian and Băbească gri grown in vineyards Iasi, Cotnari and Dealul Bujorului. The biochemical indicators used for appreciation of maturation stage of canes, were: starch soluble carbohydrates and protein concentration in the canes.
Starch content (%) of canes vine was determined by analyzing the annual elements (the rod cane), freshly harvested. To determine the presence of starch in the annual branch color reaction was performed using Lugol reagent, I in KI. Branches were cut with the microtome, preparations were made and then examined under a microscope.
The degree of maturation of canes by determining the amount of carbohydrates in cane were chemically determined by anthrone reagent method (Călugăr et al., 2010). For that 10 canes were collected in different parts of the hub of each variant for each variety.
Determination of nitrogen was made after a standard identical to the draft International Standard ISO 5983: 1992, replaces STAS 9597 / 3-74. The standard used to set the method for determining total nitrogen content by the Kjeldahl method and the calculation method of crude protein content.
Kjeldahl digestion converts nitrogen compounds (proteins, amines, organic compounds) in ammonium compounds. Free ammonia is released by the addition of caustic substances, which are then expelled by distillation and subsequently titrated.
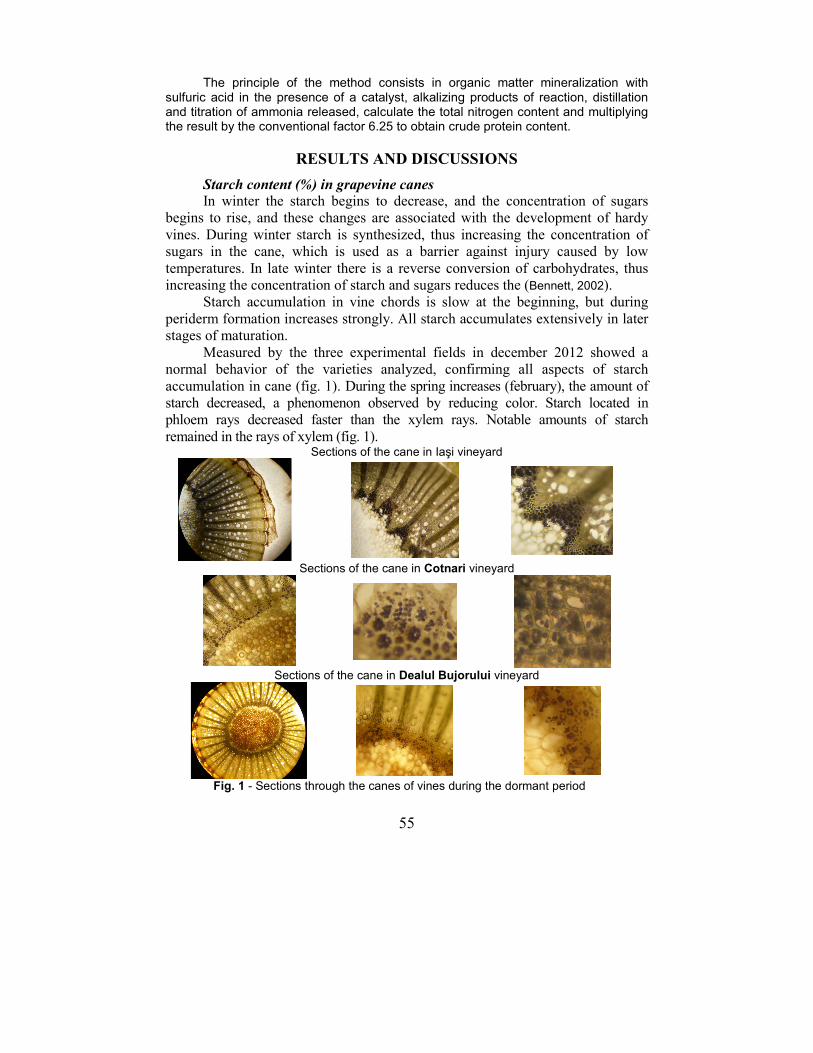
55
The principle of the method consists in organic matter mineralization with sulfuric acid in the presence of a catalyst, alkalizing products of reaction, distillation and titration of ammonia released, calculate the total nitrogen content and multiplying the result by the conventional factor 6.25 to obtain crude protein content.
RESULTS AND DISCUSSIONS
Starch content (%) in grapevine canes In winter the starch begins to decrease, and the concentration of sugars
begins to rise, and these changes are associated with the development of hardy
vines. During winter starch is synthesized, thus increasing the concentration of sugars in the cane, which is used as a barrier against injury caused by low
temperatures. In late winter there is a reverse conversion of carbohydrates, thus increasing the concentration of starch and sugars reduces the (Bennett, 2002).
Starch accumulation in vine chords is slow at the beginning, but during
periderm formation increases strongly. All starch accumulates extensively in later stages of maturation.
Measured by the three experimental fields in december 2012 showed a normal behavior of the varieties analyzed, confirming all aspects of starch
accumulation in cane (fig. 1). During the spring increases (february), the amount of starch decreased, a phenomenon observed by reducing color. Starch located in phloem rays decreased faster than the xylem rays. Notable amounts of starch
remained in the rays of xylem (fig. 1). Sections of the cane in Iaşi vineyard
Sections of the cane in Cotnari vineyard
Sections of the cane in Dealul Bujorului vineyard
Fig. 1 - Sections through the canes of vines during the dormant period
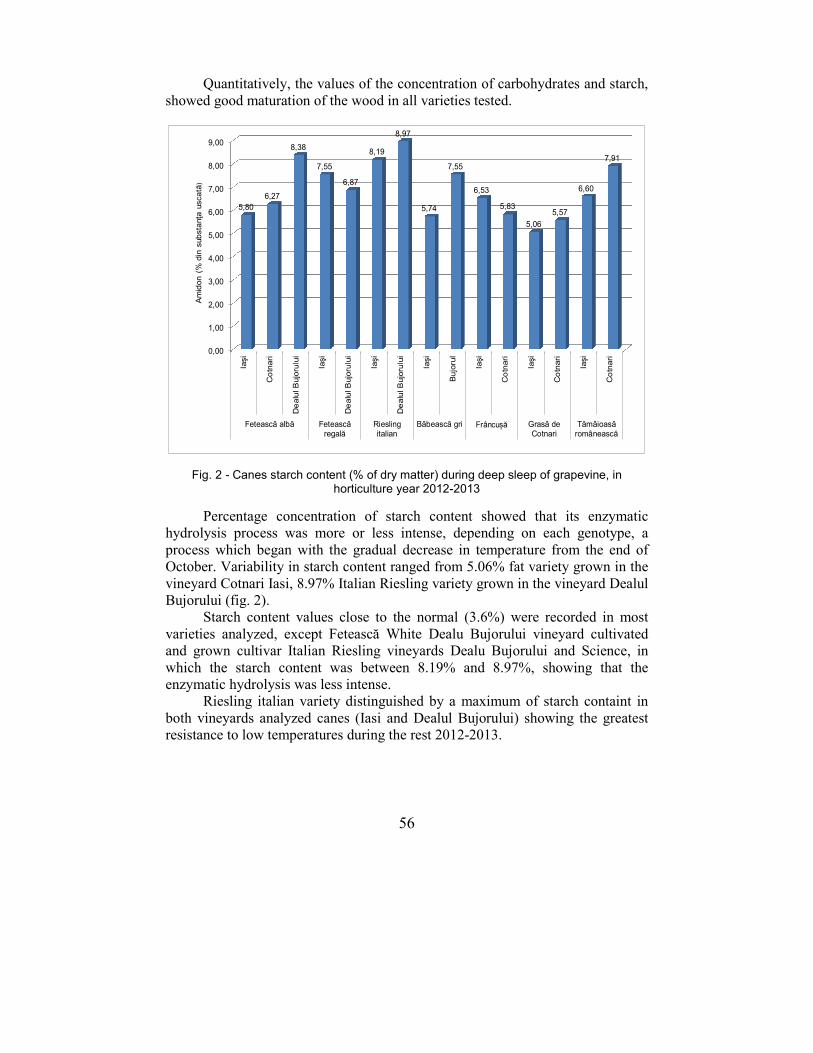
56
Quantitatively, the values of the concentration of carbohydrates and starch,
showed good maturation of the wood in all varieties tested.
0,00
1,00
2,00
3,00
4,00
5,00
6,00
7,00
8,00
9,00
Iaşi
Co
tnari
De
alu
l B
ujo
rulu
i
Iaşi
De
alu
l B
ujo
rulu
i
Iaşi
De
alu
l B
ujo
rulu
i
Iaşi
Bu
joru
l
Iaşi
Co
tnari
Iaşi
Co
tnari
Iaşi
Co
tnari
Fetească albă Feteascăregală
Rieslingitalian
Băbească gri Frâncușă Grasă deCotnari
Tămâioasăromânească
5,80
6,27
8,38
7,55
6,87
8,19
8,97
5,74
7,55
6,53
5,83
5,06
5,57
6,60
7,91
Am
idon (
% d
in s
ub
sta
nţa
usca
tă)
Fig. 2 - Canes starch content (% of dry matter) during deep sleep of grapevine, in horticulture year 2012-2013
Percentage concentration of starch content showed that its enzymatic hydrolysis process was more or less intense, depending on each genotype, a
process which began with the gradual decrease in temperature from the end of October. Variability in starch content ranged from 5.06% fat variety grown in the
vineyard Cotnari Iasi, 8.97% Italian Riesling variety grown in the vineyard Dealul Bujorului (fig. 2).
Starch content values close to the normal (3.6%) were recorded in most
varieties analyzed, except Fetească White Dealu Bujorului vineyard cultivated and grown cultivar Italian Riesling vineyards Dealu Bujorului and Science, in
which the starch content was between 8.19% and 8.97%, showing that the enzymatic hydrolysis was less intense.
Riesling italian variety distinguished by a maximum of starch containt in
both vineyards analyzed canes (Iasi and Dealul Bujorului) showing the greatest resistance to low temperatures during the rest 2012-2013.
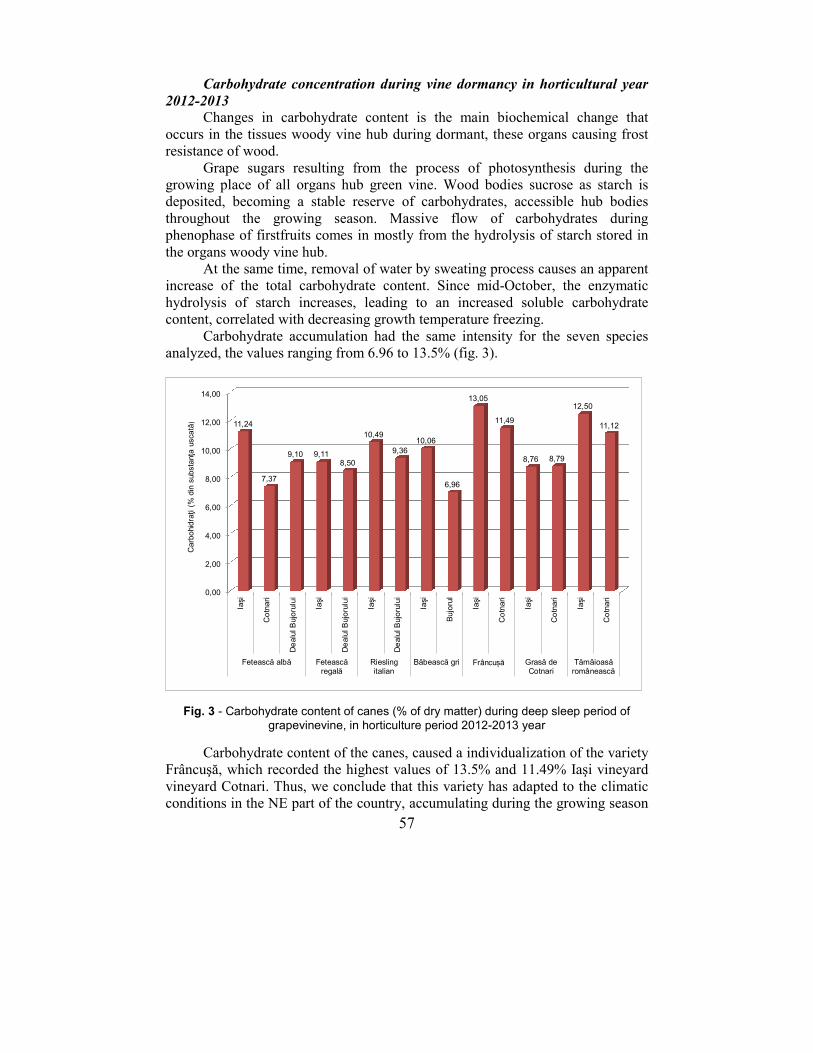
57
Carbohydrate concentration during vine dormancy in horticultural year 2012-2013
Changes in carbohydrate content is the main biochemical change that
occurs in the tissues woody vine hub during dormant, these organs causing frost resistance of wood.
Grape sugars resulting from the process of photosynthesis during the growing place of all organs hub green vine. Wood bodies sucrose as starch is deposited, becoming a stable reserve of carbohydrates, accessible hub bodies
throughout the growing season. Massive flow of carbohydrates during phenophase of firstfruits comes in mostly from the hydrolysis of starch stored in
the organs woody vine hub. At the same time, removal of water by sweating process causes an apparent
increase of the total carbohydrate content. Since mid-October, the enzymatic
hydrolysis of starch increases, leading to an increased soluble carbohydrate content, correlated with decreasing growth temperature freezing.
Carbohydrate accumulation had the same intensity for the seven species analyzed, the values ranging from 6.96 to 13.5% (fig. 3).
0,00
2,00
4,00
6,00
8,00
10,00
12,00
14,00
Iaşi
Co
tnari
De
alu
l B
ujo
rulu
i
Iaşi
De
alu
l B
ujo
rulu
i
Iaşi
De
alu
l B
ujo
rulu
i
Iaşi
Bujo
rul
Iaşi
Co
tnari
Iaşi
Co
tnari
Iaşi
Co
tnari
Fetească albă Feteascăregală
Rieslingitalian
Băbească gri Frâncușă Grasă deCotnari
Tămâioasăromânească
11,24
7,37
9,10 9,118,50
10,49
9,36
10,06
6,96
13,05
11,49
8,76 8,79
12,50
11,12
Carb
ohi
dra
ţi (%
din
substa
nţa
usca
tă)
Fig. 3 - Carbohydrate content of canes (% of dry matter) during deep sleep period of grapevinevine, in horticulture period 2012-2013 year
Carbohydrate content of the canes, caused a individualization of the variety Frâncuşă, which recorded the highest values of 13.5% and 11.49% Iaşi vineyard
vineyard Cotnari. Thus, we conclude that this variety has adapted to the climatic conditions in the NE part of the country, accumulating during the growing season
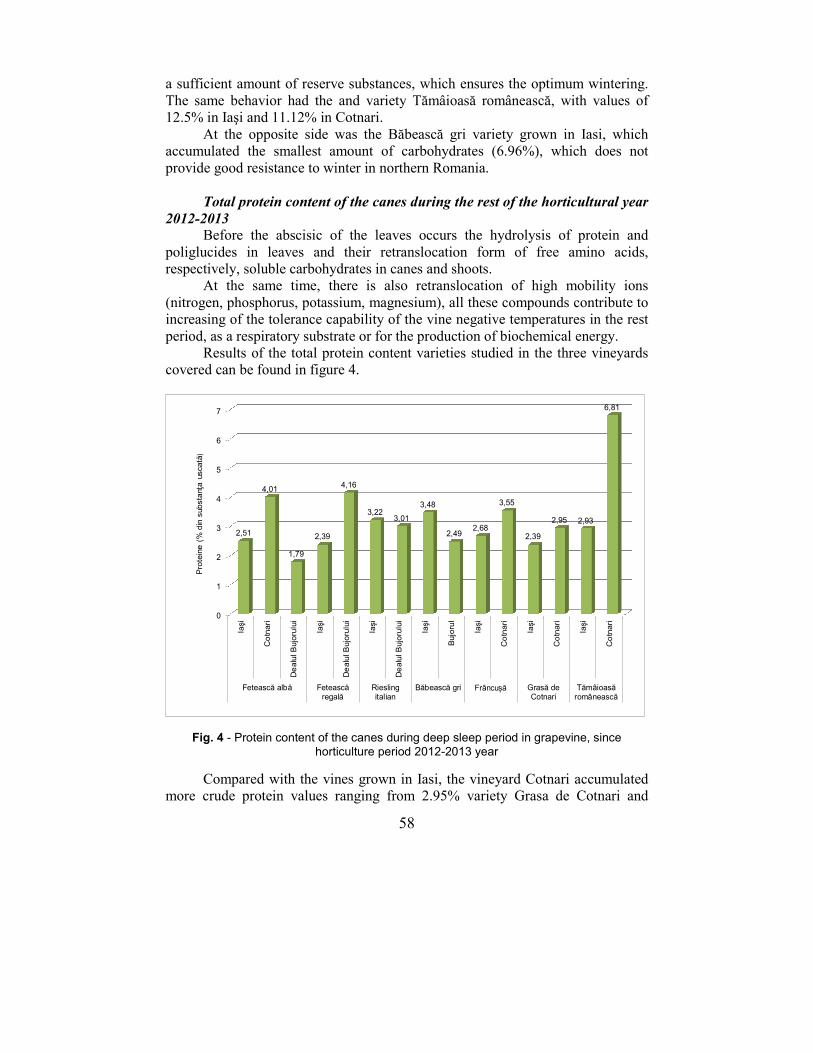
58
a sufficient amount of reserve substances, which ensures the optimum wintering.
The same behavior had the and variety Tămâioasă românească, with values of 12.5% in Iaşi and 11.12% in Cotnari.
At the opposite side was the Băbească gri variety grown in Iasi, which accumulated the smallest amount of carbohydrates (6.96%), which does not
provide good resistance to winter in northern Romania.
Total protein content of the canes during the rest of the horticultural year 2012-2013
Before the abscisic of the leaves occurs the hydrolysis of protein and
poliglucides in leaves and their retranslocation form of free amino acids, respectively, soluble carbohydrates in canes and shoots.
At the same time, there is also retranslocation of high mobility ions
(nitrogen, phosphorus, potassium, magnesium), all these compounds contribute to increasing of the tolerance capability of the vine negative temperatures in the rest
period, as a respiratory substrate or for the production of biochemical energy. Results of the total protein content varieties studied in the three vineyards
covered can be found in figure 4.
0
1
2
3
4
5
6
7
Iaşi
Co
tnari
De
alu
l B
ujo
rulu
i
Iaşi
De
alu
l B
ujo
rulu
i
Iaşi
De
alu
l B
ujo
rulu
i
Iaşi
Bujo
rul
Iaşi
Co
tnari
Iaşi
Co
tnari
Iaşi
Co
tnari
Fetească albă Feteascăregală
Rieslingitalian
Băbească gri Frâncușă Grasă deCotnari
Tămâioasăromânească
2,51
4,01
1,79
2,39
4,16
3,223,01
3,48
2,492,68
3,55
2,39
2,95 2,93
6,81
Pro
tein
e (
% d
in s
ubsta
nţa
uscată
)
Fig. 4 - Protein content of the canes during deep sleep period in grapevine, since horticulture period 2012-2013 year
Compared with the vines grown in Iasi, the vineyard Cotnari accumulated more crude protein values ranging from 2.95% variety Grasa de Cotnari and
59
6.81% in Tămâioasă românească variety, which has contributed to a better
resistance frost buds. The analysis of the varieties grown in the vineyard Dealul Bujorului
compared with those from Iasi, shows that there are significant differences in the total protein content in Fetească alba, Băbească gri, Riesling italian, with one
deviation from the Fetească regala to that reported an increase of 1.8%. These differences are positive for Fetească regală, where values ranged
from 4.16% to 2.39% in Bujorul and Iasi and Fetească albă negative values 2.51%
and 1.79% in Iasi and Bujoru, Băbească gri with a difference of 0.99%. Riesling italian variety were not significant differences depending on the vineyard (fig. 4).
The high protein concentration contributed, at the varieties from Cotnari, to a better resistance to frost of the buds, basically at these varieties there are no loss of eyes in winter.
CONCLUSIONS
1. Starch content values close to normal (3-6%) were recorded in most analyzed varieties, except Fetească albă cultivated in Dealul Bujorului vineyard
and Riesling Italian variety of Dealul Bujorului and of Iaşi vineyards to which the starch content was high, which indicates a reduced hydrolytic activity.
2. Carbohydrate content of the canes caused a individualization of the
variety Frâncuşă, which recorded the highest values in Iaşi vineyard and winery Cotnari, this variety has adapted to the climatic conditions in the NE part of the
country, accumulating during the growing amount sufficient reserve substances, which ensures the optimum wintering.
3. Compared to the vines grown in Iasi, the vineyard Cotnari crude
protein accumulated more Grasă de Cotnari and Tămâioasă românească varieties, which has contributed to a better resistance to frost of the bud. The analysis of the
varieties grown in the vineyard Dealurile Bujorului compared with those from Iasi, shows that there are significant differences in the total protein content.
Acknowledgments: This work was supported by a grant of the Romanian
National Authority for Scientific Research, CNDI-UEFISCDI, project number
PN-II-PT-PCCA-2011-3.1-0965.
REFERENCES
1. Bennett J.S., 2002 - Relationships between carbohydrate supply and reserves and the reproductive growth of grapevines, Thesis, Lincoln University
2. Călugăr Anamaria, Nastasia Pop, Mariana Farago, Anca Babeş, Daniela Hodor, C. Bunea, Florentina Ciobanu, 2010 - Buds viability and carbohydrates canes
content of some varieties created at S.C.D.V.V. Blaj, during winter 2009-2010, Lucrări ştiinţifice USAMV Bucuresti, Seria B, vol. LIV, pp. 548-553
3. Dejeu L., 2010 - Viticultură. Edit. Ceres, Bucureşti. 4. Dobreva S., Slavtcheva T., Donchev A., 2006 - Vine Resistance to Low Winter
Temperatures and Its Relation to the Main Agrobiological and Physiological

60
Characteristics, III. Resistance and Recovery from Frost Damages, Bulgarian Journal of Agricultural Science, 12, pp. 393-404
4. Jerzy Lisek, 2007 - Frost damage of grapevines in Poland following the winter of 2005/2006, Folia Horticulturae, Ann. 19/2, pp. 69-78
5. Jităreanu Carmenica Doina, Slabu Cristina, Marta Alina Elena, Pricop (Stavarache) Elena, 2011 – Cercetări privind reacţia ecofiziologică a unor soiuri de viţă de vie din podgoriile Iaşi, Cotnari şi Târgu Bujor, în perioada de repaus vegetativ. Lucrări ştiinţifice. Seria Horticultură, Vol. 54, Iaşi, ISSN 1454-7376.
6. Nedelkovski Duško, Beleski Klime, Boškov Krum, Korunovska Biljana, Milanov Goran, 2012 - Studying the content of starch correlated with resistance to low winter temperatures in some grapevine varieties, Agroznanje, vol. 13, br.4. pp. 681-686.
61
STUDY ON THE APPLICATION OF BIOREGULATORY SUBSTANCES IN ORGANIC TOMATO CROP
STUDIU PRIVIND UTILIZAREA SUBSTANTELOR
BIOREGULATOARE IN CULTURA DE TOMATE ECOLOGICĂ
STOLERU V.1, MUNTEANU N.
1, STAN T.
1, AVASILOAIEI D.I.
1
e-mail [email protected]
Abstract. In the present study, we analyze the influence of bio-active substances (stimulants) to increase the quantity and quality of tomatoes fruit. Early and total tomato yield in 2013, varied at Margarita cultivar, according to the treatment and concentration of the substances applied, yields have been statistically provided of 95%. The content of nitrates and nitrites, regardless of experimental variant was below the maximum allowed by legislation. Key words: bioactive substance, organic tomato yield, quality
Rezumat. În lucrarea de față ne-am propus să analizăm influența unor substanțe bioregulatoare de creștere (stimulatoare) asupra cantității și calității fructelor la o cultură de tomate. Producția timpurie si totala de tomate în anul 2013 a variat în cazul cultivarului de tomate Margarita F1 in functie substantele utilizate si de concentratia tratamentului aplicat, producțiile fiind asigurate statistic în procent de 95%. Continutul de nitrati si nitriti, indiferent de varianta experimentala este sub limita maxima admisa de legislatia in vigoare. Cuvinte cheie: substanțe bioactive, tomate ecologice, recoltă, calitate
INTRODUCTION
One of the objectives of agriculture in general, and specifically vegetable is
to increase production per hectare by using specific measures and technological
means. Among the measures that may increase output per hectare can include:
choice of cultivar, fertilization and chemical processing intensive mechanization,
combating diseases, pests and weeds (Stoleru, 2013).
This hypothesis stated above shall not apply to organic systems as synthetic
chemicals are banned and in the application of products to combat diseases and
pests their number is relatively small. Therefore, the increase of the production
per hectare may be achieved by means of measures and environmentally friendly
(Mustea et al., 2009 , Munteanu et al., 2009).
Using growth regulators is recommended as an alternative method to
increase the effectiveness of traditional soil fertilization. Although the efficacy
was assessed through an impressive number of studies, only a small fraction of
them have highlighted the positive effects of the use of growth regulators on the
1 University of Agricultural Sciences and Veterinary Medicine of Iasi, Romania
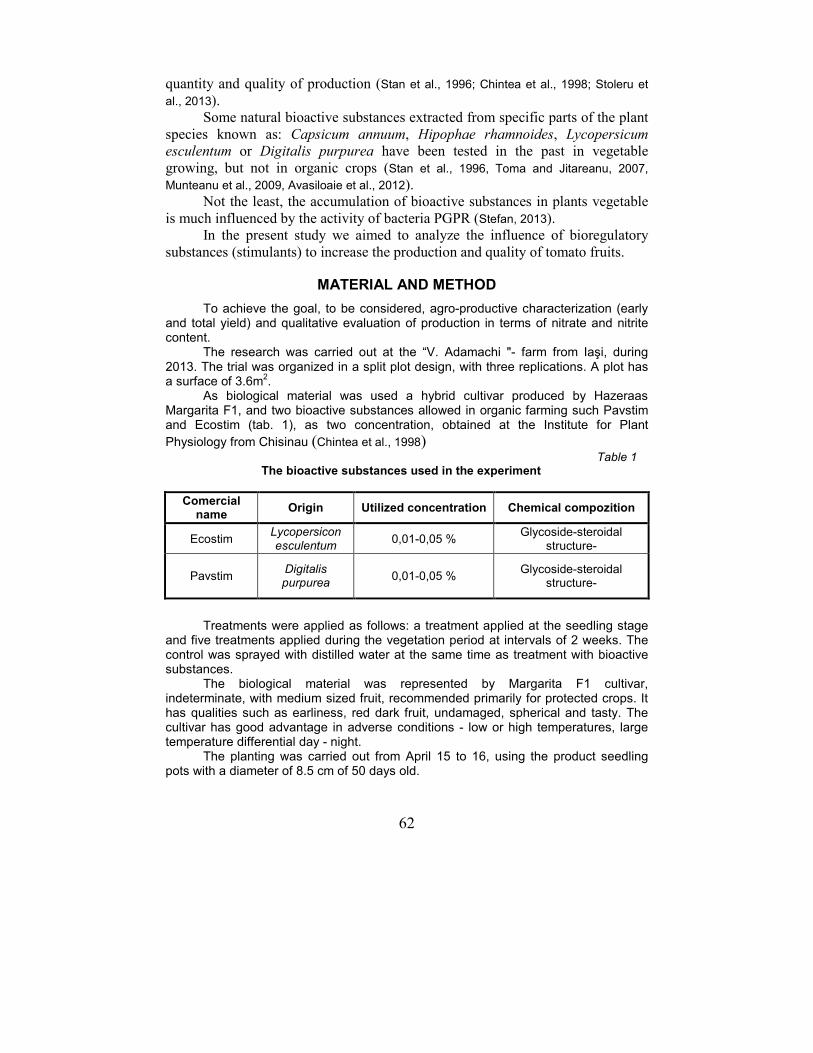
62
quantity and quality of production (Stan et al., 1996; Chintea et al., 1998; Stoleru et
al., 2013).
Some natural bioactive substances extracted from specific parts of the plant
species known as: Capsicum annuum, Hipophae rhamnoides, Lycopersicum esculentum or Digitalis purpurea have been tested in the past in vegetable growing, but not in organic crops (Stan et al., 1996, Toma and Jitareanu, 2007,
Munteanu et al., 2009, Avasiloaie et al., 2012).
Not the least, the accumulation of bioactive substances in plants vegetable
is much influenced by the activity of bacteria PGPR (Stefan, 2013).
In the present study we aimed to analyze the influence of bioregulatory
substances (stimulants) to increase the production and quality of tomato fruits.
MATERIAL AND METHOD
To achieve the goal, to be considered, agro-productive characterization (early and total yield) and qualitative evaluation of production in terms of nitrate and nitrite content.
The research was carried out at the “V. Adamachi "- farm from Iaşi, during 2013. The trial was organized in a split plot design, with three replications. A plot has a surface of 3.6m2.
As biological material was used a hybrid cultivar produced by Hazeraas Margarita F1, and two bioactive substances allowed in organic farming such Pavstim and Ecostim (tab. 1), as two concentration, obtained at the Institute for Plant
Physiology from Chisinau (Chintea et al., 1998) Table 1
The bioactive substances used in the experiment
Comercial name
Origin Utilized concentration Chemical compozition
Ecostim Lycopersicon esculentum
0,01-0,05 % Glycoside-steroidal
structure-
Pavstim Digitalis purpurea
0,01-0,05 % Glycoside-steroidal
structure-
Treatments were applied as follows: a treatment applied at the seedling stage
and five treatments applied during the vegetation period at intervals of 2 weeks. The control was sprayed with distilled water at the same time as treatment with bioactive substances.
The biological material was represented by Margarita F1 cultivar, indeterminate, with medium sized fruit, recommended primarily for protected crops. It has qualities such as earliness, red dark fruit, undamaged, spherical and tasty. The cultivar has good advantage in adverse conditions - low or high temperatures, large temperature differential day - night.
The planting was carried out from April 15 to 16, using the product seedling pots with a diameter of 8.5 cm of 50 days old.
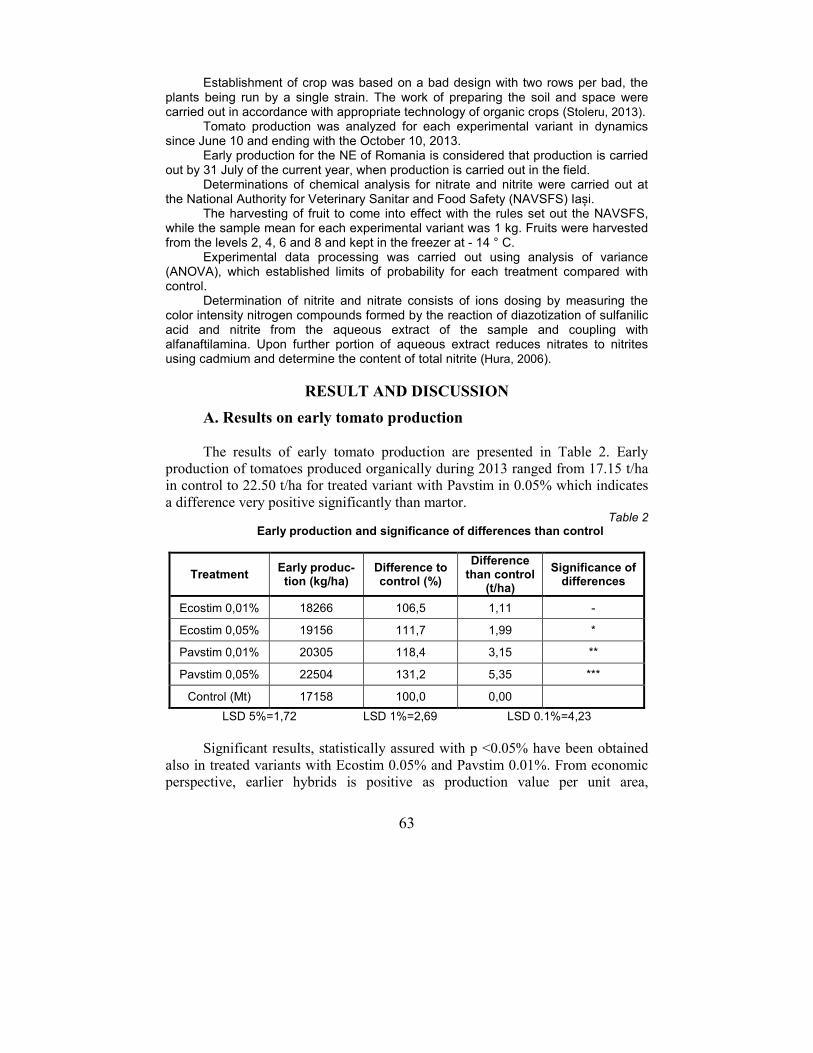
63
Establishment of crop was based on a bad design with two rows per bad, the plants being run by a single strain. The work of preparing the soil and space were carried out in accordance with appropriate technology of organic crops (Stoleru, 2013).
Tomato production was analyzed for each experimental variant in dynamics since June 10 and ending with the October 10, 2013.
Early production for the NE of Romania is considered that production is carried out by 31 July of the current year, when production is carried out in the field.
Determinations of chemical analysis for nitrate and nitrite were carried out at the National Authority for Veterinary Sanitar and Food Safety (NAVSFS) Iași.
The harvesting of fruit to come into effect with the rules set out the NAVSFS, while the sample mean for each experimental variant was 1 kg. Fruits were harvested from the levels 2, 4, 6 and 8 and kept in the freezer at - 14 ° C.
Experimental data processing was carried out using analysis of variance (ANOVA), which established limits of probability for each treatment compared with control.
Determination of nitrite and nitrate consists of ions dosing by measuring the color intensity nitrogen compounds formed by the reaction of diazotization of sulfanilic acid and nitrite from the aqueous extract of the sample and coupling with alfanaftilamina. Upon further portion of aqueous extract reduces nitrates to nitrites using cadmium and determine the content of total nitrite (Hura, 2006).
RESULT AND DISCUSSION
A. Results on early tomato production
The results of early tomato production are presented in Table 2. Early
production of tomatoes produced organically during 2013 ranged from 17.15 t/ha
in control to 22.50 t/ha for treated variant with Pavstim in 0.05% which indicates
a difference very positive significantly than martor. Table 2
Early production and significance of differences than control
Treatment Early produc-tion (kg/ha)
Difference to control (%)
Difference than control
(t/ha)
Significance of differences
Ecostim 0,01% 18266 106,5 1,11 -
Ecostim 0,05% 19156 111,7 1,99 *
Pavstim 0,01% 20305 118,4 3,15 **
Pavstim 0,05% 22504 131,2 5,35 ***
Control (Mt) 17158 100,0 0,00
LSD 5%=1,72 LSD 1%=2,69 LSD 0.1%=4,23
Significant results, statistically assured with p <0.05% have been obtained
also in treated variants with Ecostim 0.05% and Pavstim 0.01%. From economic
perspective, earlier hybrids is positive as production value per unit area,
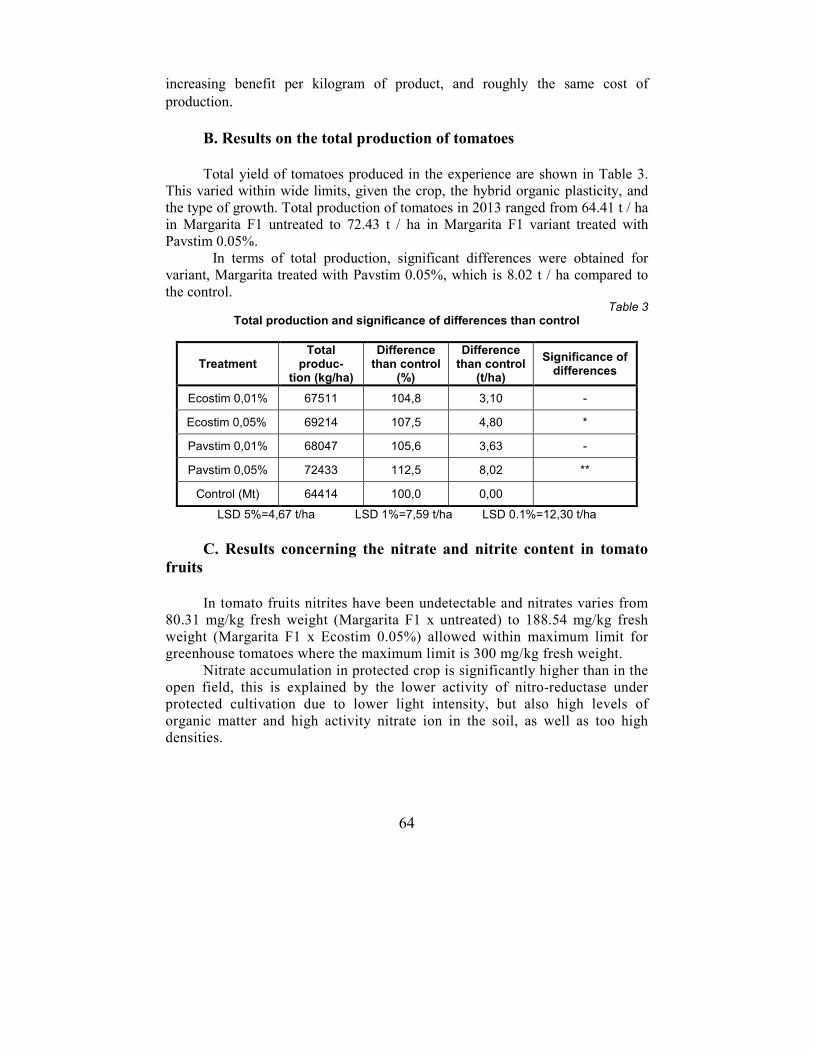
64
increasing benefit per kilogram of product, and roughly the same cost of
production.
B. Results on the total production of tomatoes Total yield of tomatoes produced in the experience are shown in Table 3.
This varied within wide limits, given the crop, the hybrid organic plasticity, and
the type of growth. Total production of tomatoes in 2013 ranged from 64.41 t / ha
in Margarita F1 untreated to 72.43 t / ha in Margarita F1 variant treated with
Pavstim 0.05%.
In terms of total production, significant differences were obtained for
variant, Margarita treated with Pavstim 0.05%, which is 8.02 t / ha compared to
the control. Table 3
Total production and significance of differences than control
Treatment Total
produc- tion (kg/ha)
Difference than control
(%)
Difference than control
(t/ha)
Significance of differences
Ecostim 0,01% 67511 104,8 3,10 -
Ecostim 0,05% 69214 107,5 4,80 *
Pavstim 0,01% 68047 105,6 3,63 -
Pavstim 0,05% 72433 112,5 8,02 **
Control (Mt) 64414 100,0 0,00
LSD 5%=4,67 t/ha LSD 1%=7,59 t/ha LSD 0.1%=12,30 t/ha
C. Results concerning the nitrate and nitrite content in tomato fruits
In tomato fruits nitrites have been undetectable and nitrates varies from
80.31 mg/kg fresh weight (Margarita F1 x untreated) to 188.54 mg/kg fresh
weight (Margarita F1 x Ecostim 0.05%) allowed within maximum limit for
greenhouse tomatoes where the maximum limit is 300 mg/kg fresh weight.
Nitrate accumulation in protected crop is significantly higher than in the
open field, this is explained by the lower activity of nitro-reductase under
protected cultivation due to lower light intensity, but also high levels of
organic matter and high activity nitrate ion in the soil, as well as too high
densities.
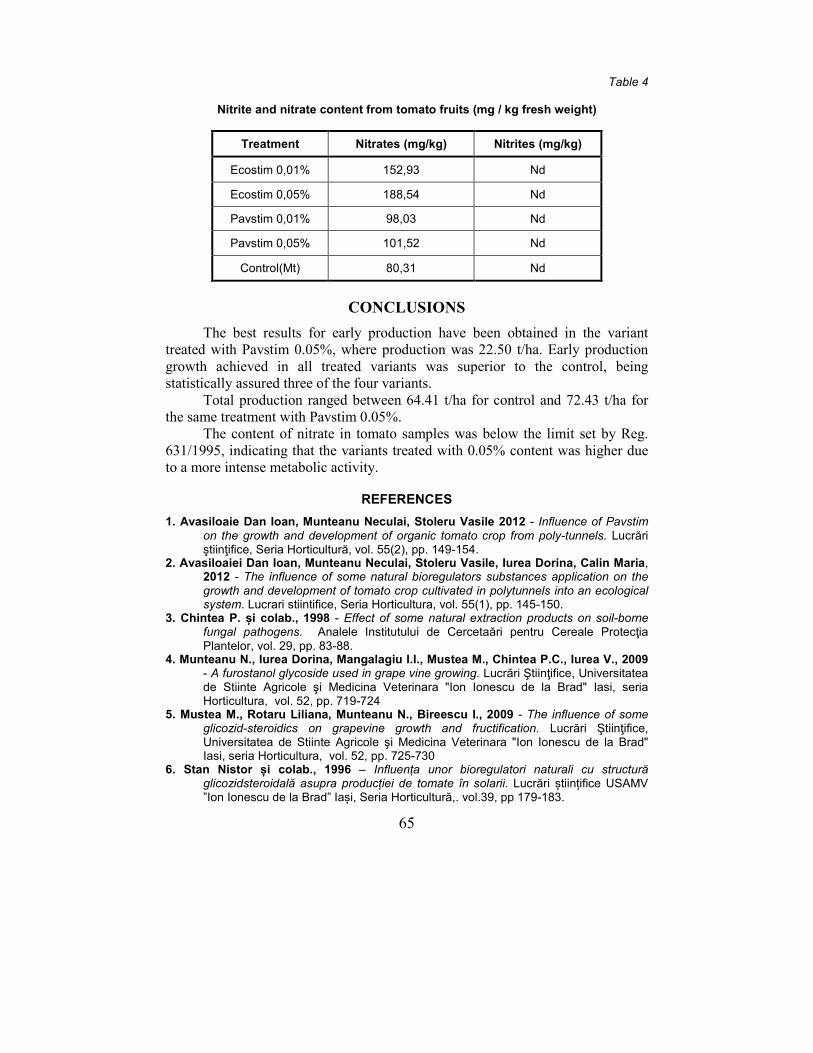
65
Table 4
Nitrite and nitrate content from tomato fruits (mg / kg fresh weight)
Treatment Nitrates (mg/kg) Nitrites (mg/kg)
Ecostim 0,01% 152,93 Nd
Ecostim 0,05% 188,54 Nd
Pavstim 0,01% 98,03 Nd
Pavstim 0,05% 101,52 Nd
Control(Mt) 80,31 Nd
CONCLUSIONS
The best results for early production have been obtained in the variant
treated with Pavstim 0.05%, where production was 22.50 t/ha. Early production
growth achieved in all treated variants was superior to the control, being
statistically assured three of the four variants.
Total production ranged between 64.41 t/ha for control and 72.43 t/ha for
the same treatment with Pavstim 0.05%.
The content of nitrate in tomato samples was below the limit set by Reg.
631/1995, indicating that the variants treated with 0.05% content was higher due
to a more intense metabolic activity.
REFERENCES
1. Avasiloaie Dan Ioan, Munteanu Neculai, Stoleru Vasile 2012 - Influence of Pavstim on the growth and development of organic tomato crop from poly-tunnels. Lucrări ştiinţifice, Seria Horticultură, vol. 55(2), pp. 149-154.
2. Avasiloaiei Dan Ioan, Munteanu Neculai, Stoleru Vasile, Iurea Dorina, Calin Maria, 2012 - The influence of some natural bioregulators substances application on the growth and development of tomato crop cultivated in polytunnels into an ecological system. Lucrari stiintifice, Seria Horticultura, vol. 55(1), pp. 145-150.
3. Chintea P. și colab., 1998 - Effect of some natural extraction products on soil-borne fungal pathogens. Analele Institutului de Cercetaări pentru Cereale Protecţia Plantelor, vol. 29, pp. 83-88.
4. Munteanu N., Iurea Dorina, Mangalagiu I.I., Mustea M., Chintea P.C., Iurea V., 2009 - A furostanol glycoside used in grape vine growing. Lucrări Ştiinţifice, Universitatea de Stiinte Agricole şi Medicina Veterinara "Ion Ionescu de la Brad" Iasi, seria Horticultura, vol. 52, pp. 719-724
5. Mustea M., Rotaru Liliana, Munteanu N., Bireescu I., 2009 - The influence of some glicozid-steroidics on grapevine growth and fructification. Lucrări Ştiinţifice, Universitatea de Stiinte Agricole şi Medicina Veterinara "Ion Ionescu de la Brad" Iasi, seria Horticultura, vol. 52, pp. 725-730
6. Stan Nistor și colab., 1996 – Influența unor bioregulatori naturali cu structură glicozidsteroidală asupra producției de tomate în solarii. Lucrări științifice USAMV ”Ion Ionescu de la Brad” Iași, Seria Horticultură,. vol.39, pp 179-183.

66
7. Stoleru Vasile, Muntenu Neculai, Avasiloaiei Dan Ioan, Florea Ana-Maria, 2013 - Influence of Moldstim on the growth and development of organic tomato crop from polytunnels. Lucrări ştiinţifice USAMV Iasi, Seria Horticultură, vol. 56(2), pp. 173-178.
8. Stoleru Vasile, 2013 – Managementul sistemelor legumicole ecologice. Editura ”Ion Ionescu de la Brad”, Iași.
9. Ştefan Marius; Munteanu, Neculai; Stoleru Vasile; Mihasan Marius, Hritcu Lucian, 2013 - Seed inoculation with plant growth promoting Rhizobacteria enhances photosynthesis and yield of runner bean (Phaseolus coccineus L.). Scientia Horticulturae, vol: 151, pp. 22-29.
10. Toma Liana Doina, Jitareanu Carmen Doina, 2007 – Fiziologie vegetala. Editura ”Ion Ionescu de la Brad”, Iași.
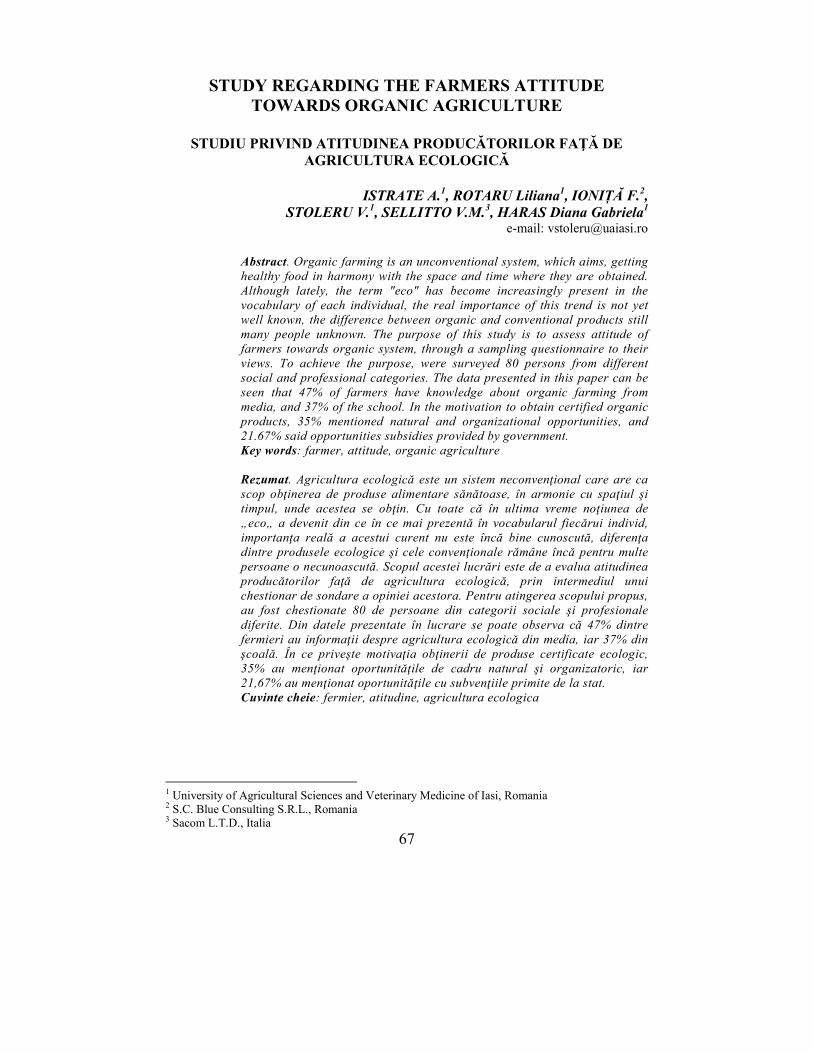
67
STUDY REGARDING THE FARMERS ATTITUDE TOWARDS ORGANIC AGRICULTURE
STUDIU PRIVIND ATITUDINEA PRODUCĂTORILOR FAŢĂ DE
AGRICULTURA ECOLOGICĂ
ISTRATE A.1, ROTARU Liliana1, IONIȚĂ F.2, STOLERU V.1, SELLITTO V.M.3, HARAS Diana Gabriela1
e-mail: [email protected]
Abstract. Organic farming is an unconventional system, which aims, getting healthy food in harmony with the space and time where they are obtained. Although lately, the term "eco" has become increasingly present in the vocabulary of each individual, the real importance of this trend is not yet well known, the difference between organic and conventional products still many people unknown. The purpose of this study is to assess attitude of farmers towards organic system, through a sampling questionnaire to their views. To achieve the purpose, were surveyed 80 persons from different social and professional categories. The data presented in this paper can be seen that 47% of farmers have knowledge about organic farming from media, and 37% of the school. In the motivation to obtain certified organic products, 35% mentioned natural and organizational opportunities, and 21.67% said opportunities subsidies provided by government. Key words: farmer, attitude, organic agriculture Rezumat. Agricultura ecologică este un sistem neconvenţional care are ca scop obţinerea de produse alimentare sănătoase, în armonie cu spaţiul şi timpul, unde acestea se obţin. Cu toate că în ultima vreme noţiunea de „eco„ a devenit din ce în ce mai prezentă în vocabularul fiecărui individ, importanţa reală a acestui curent nu este încă bine cunoscută, diferenţa dintre produsele ecologice şi cele convenţionale rămâne încă pentru multe persoane o necunoascută. Scopul acestei lucrări este de a evalua atitudinea producătorilor faţă de agricultura ecologică, prin intermediul unui chestionar de sondare a opiniei acestora. Pentru atingerea scopului propus, au fost chestionate 80 de persoane din categorii sociale şi profesionale diferite. Din datele prezentate în lucrare se poate observa că 47% dintre fermieri au informaţii despre agricultura ecologică din media, iar 37% din şcoală. În ce priveşte motivaţia obţinerii de produse certificate ecologic, 35% au menţionat oportunităţile de cadru natural şi organizatoric, iar 21,67% au menţionat oportunităţile cu subvenţiile primite de la stat. Cuvinte cheie: fermier, atitudine, agricultura ecologica
1 University of Agricultural Sciences and Veterinary Medicine of Iasi, Romania 2 S.C. Blue Consulting S.R.L., Romania 3 Sacom L.T.D., Italia
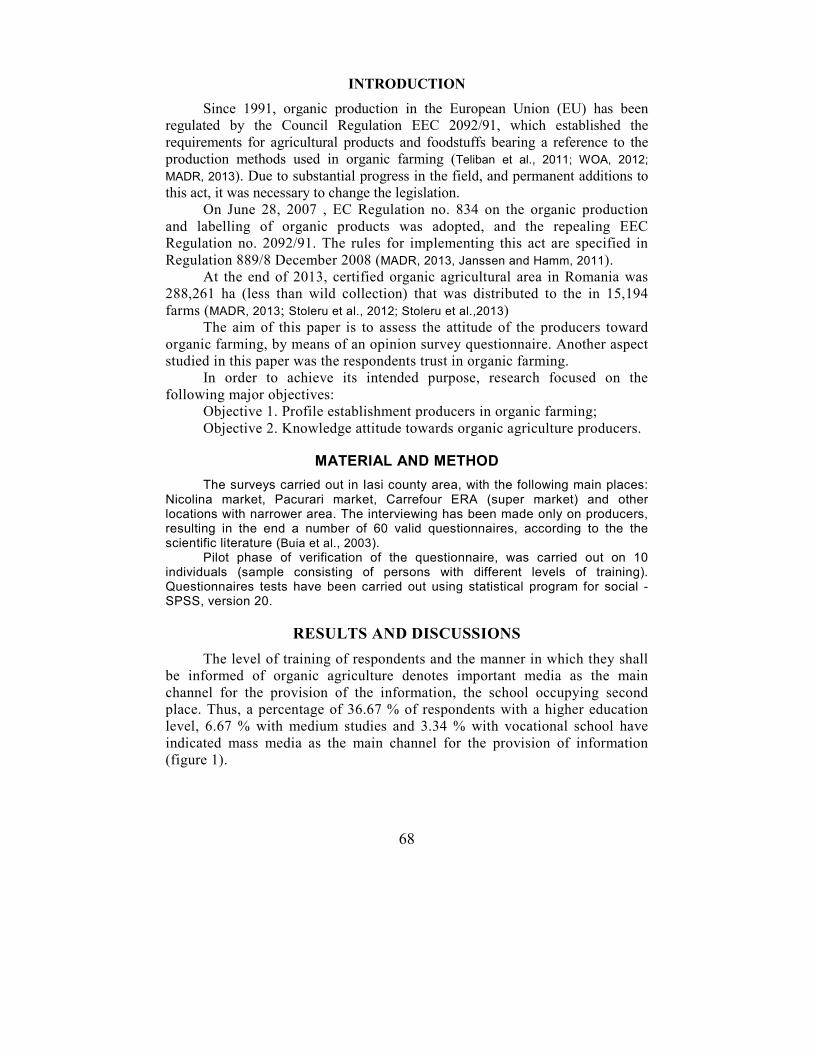
68
INTRODUCTION
Since 1991, organic production in the European Union (EU) has been
regulated by the Council Regulation EEC 2092/91, which established the
requirements for agricultural products and foodstuffs bearing a reference to the
production methods used in organic farming (Teliban et al., 2011; WOA, 2012;
MADR, 2013). Due to substantial progress in the field, and permanent additions to
this act, it was necessary to change the legislation.
On June 28, 2007 , EC Regulation no. 834 on the organic production
and labelling of organic products was adopted, and the repealing EEC
Regulation no. 2092/91. The rules for implementing this act are specified in
Regulation 889/8 December 2008 (MADR, 2013, Janssen and Hamm, 2011).
At the end of 2013, certified organic agricultural area in Romania was
288,261 ha (less than wild collection) that was distributed to the in 15,194
farms (MADR, 2013; Stoleru et al., 2012; Stoleru et al.,2013)
The aim of this paper is to assess the attitude of the producers toward
organic farming, by means of an opinion survey questionnaire. Another aspect
studied in this paper was the respondents trust in organic farming.
In order to achieve its intended purpose, research focused on the
following major objectives:
Objective 1. Profile establishment producers in organic farming;
Objective 2. Knowledge attitude towards organic agriculture producers.
MATERIAL AND METHOD
The surveys carried out in Iasi county area, with the following main places: Nicolina market, Pacurari market, Carrefour ERA (super market) and other locations with narrower area. The interviewing has been made only on producers, resulting in the end a number of 60 valid questionnaires, according to the the scientific literature (Buia et al., 2003).
Pilot phase of verification of the questionnaire, was carried out on 10 individuals (sample consisting of persons with different levels of training). Questionnaires tests have been carried out using statistical program for social - SPSS, version 20.
RESULTS AND DISCUSSIONS
The level of training of respondents and the manner in which they shall
be informed of organic agriculture denotes important media as the main
channel for the provision of the information, the school occupying second
place. Thus, a percentage of 36.67 % of respondents with a higher education
level, 6.67 % with medium studies and 3.34 % with vocational school have
indicated mass media as the main channel for the provision of information
(figure 1).
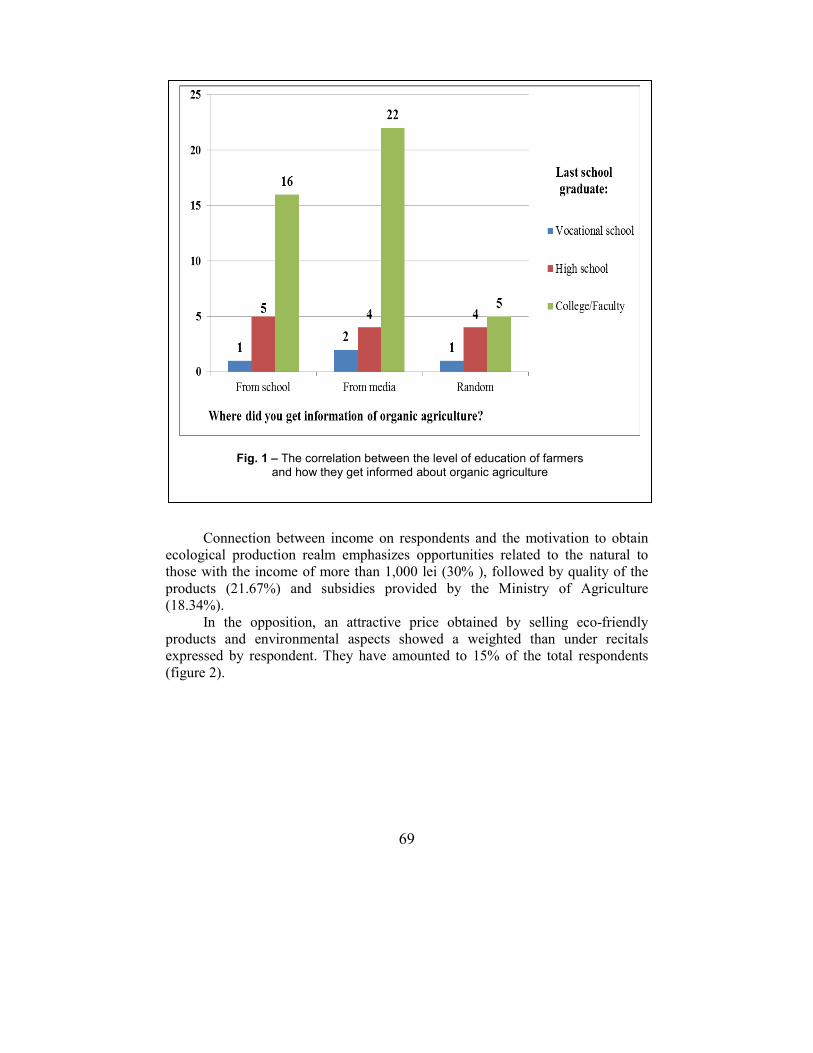
69
Connection between income on respondents and the motivation to obtain
ecological production realm emphasizes opportunities related to the natural to
those with the income of more than 1,000 lei (30% ), followed by quality of the
products (21.67%) and subsidies provided by the Ministry of Agriculture
(18.34%).
In the opposition, an attractive price obtained by selling eco-friendly
products and environmental aspects showed a weighted than under recitals
expressed by respondent. They have amounted to 15% of the total respondents
(figure 2).
Fig. 1 – The correlation between the level of education of farmers and how they get informed about organic agriculture
70
Favoring certain crops in proportion to the degree of training shows that
fruit trees, vegetables, and cereals are preferred in the culture of those with higher
education, cumulating a percentage of 56,67 % of the total respondents. However,
organic vegetable growing is favored among respondents with medium studies,
with a percentage of 11.67 % (figure 3).
Fig. 2 – The correlation between the monthly income of farmers and what is their
motivation for obtaining ecological products
Fig. 3 – The correlation between the level of education of farmers
and what crops organically exploit
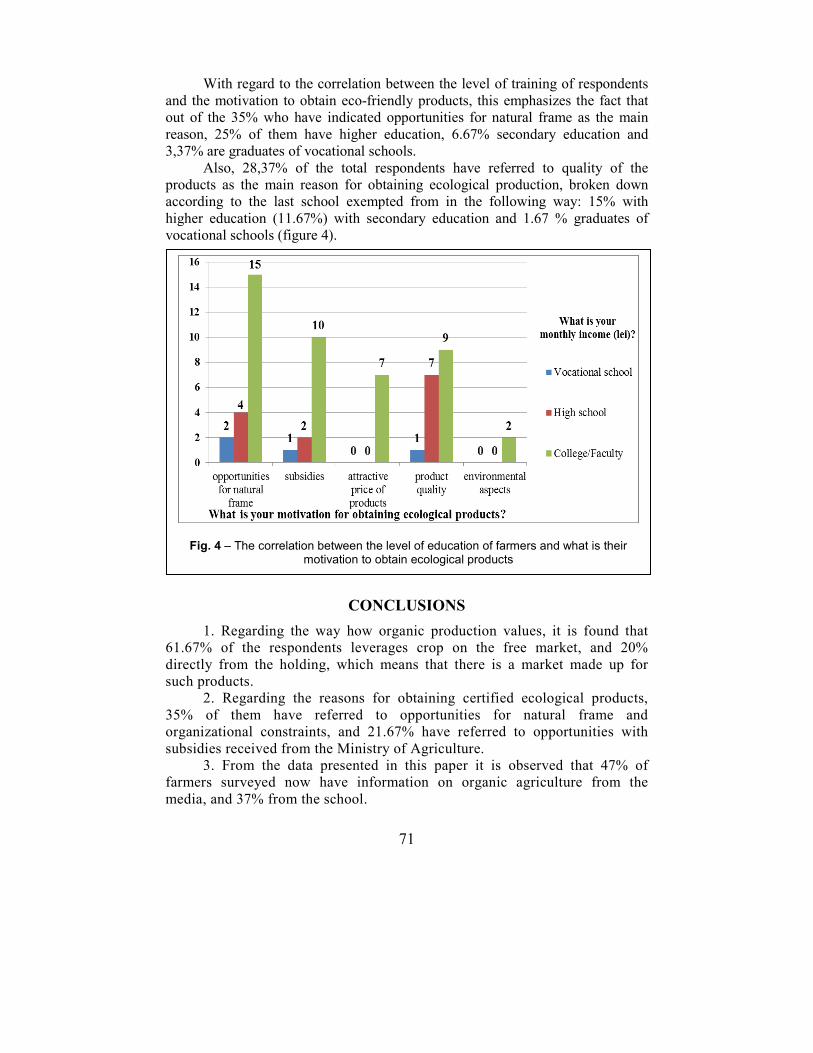
71
With regard to the correlation between the level of training of respondents
and the motivation to obtain eco-friendly products, this emphasizes the fact that
out of the 35% who have indicated opportunities for natural frame as the main
reason, 25% of them have higher education, 6.67% secondary education and
3,37% are graduates of vocational schools.
Also, 28,37% of the total respondents have referred to quality of the
products as the main reason for obtaining ecological production, broken down
according to the last school exempted from in the following way: 15% with
higher education (11.67%) with secondary education and 1.67 % graduates of
vocational schools (figure 4).
CONCLUSIONS
1. Regarding the way how organic production values, it is found that
61.67% of the respondents leverages crop on the free market, and 20%
directly from the holding, which means that there is a market made up for
such products.
2. Regarding the reasons for obtaining certified ecological products,
35% of them have referred to opportunities for natural frame and
organizational constraints, and 21.67% have referred to opportunities with
subsidies received from the Ministry of Agriculture.
3. From the data presented in this paper it is observed that 47% of
farmers surveyed now have information on organic agriculture from the
media, and 37% from the school.
Fig. 4 – The correlation between the level of education of farmers and what is their motivation to obtain ecological products
72
REFERENCES
1. Buia Ancuţa şi colab., 2003 – Statistică, vol. I, Presa Universitară Clujeană, Cluj-
Napoca; 2. Janssen M., Hamm U., 2011 - Consumer perception of different organic certification
schemes in five European countries. Organic Agriculture, vol. 1, pp. 31-43. 3. Munteanu N., Stoleru V., Stan T., Stoleru Carmen-Maria, Aldescu Teodora, 2007 -
The perspectives of organic agriculture in Romania. Lucrări ştiinţifice USAMV Iaşi, seria Horticultură, vol.50, pp. 505-508.
4. Stoleru Vasile, 2008 – Cercetări privind oportunitatea cultivării legumelor în sistem de agricultură sustenabilă, în zona de NE a României. Teză de doctorat, USAMV Iaşi;
5. Stoleru Vasile, Munteanu Neculai, Jităreanu Andy-Felix, 2012 - Consumer behavior from Moldova area towards organic food. Lucrari stiintifice USAMV Iasi, seria Agronomie, vol. 55(2), pp. 283-286.
6. Stoleru Vasile, Rihan Samah, Munteanu Neculai, Sellittou Vicenzo-Michelle, Istrate Andrei, Bârcă Sorinel-Vasile, 2013 - Consumer perception regarding the
differences between organic and conventional products, by category of characteristics. Lucrări ştiinţifice, Seria Horticultură, vol. 56(1).
7. Stoleru V., Munteanu N., Maftei A., 2012 - Consumer perceptions of organic vegetables, in Iasi. Lucrări ştiinţifice, Seria Horticultură, vol. 55(1), pp. 197-206.
8. Teliban Gabriel, Munteanu Neculai, Stoleru Vasile, Tinca Gabriela, Popa Diana, 2009 - Consumers` attitude towards the ecological vegetable yield depending on education and age. Lucrări ştiinţifice USAMV Iaşi, seria Horticultură, vol.52, pp. 387-392.
9. Teliban G. C., Munteanu N., Popa, L. D., Stoleru V.; Tincă G.; Tibulcă L., 2011 - Studies on the preferences for ecological vegetable product of the consumers from Iasi County. Lucrari Stiintifice, Universitatea de Stiinte Agricole si Medicina Veterinara "Ion Ionescu de la Brad", Iasi, Seria Horticultura, vol. 54(2), pp. 199-204.
10. The world of organic agriculture, 2012 – Statistics and Emerging trends, Internaţional Federaţion of Organic Agriculture Moverments
11. * * *, 2012 - MADR - Dinamica operatorilor si a suprafetelor in agricultura ecologica.
Accessed 13.12.2012 http://www.madr.ro/page.php?self=01andsub=0107andtz=010710>.main.php>.
73
INFLUENCE OF PLANTING DISTANCES AND MULCHING
METHODS INFLUENCE ON RHUBARB CROP
INFLUENȚA DISTANȚELOR DE PLANTARE ȘI A MULCIRII ASUPRA PRODUCȚIEI LA REVENT
COJOCARU A.1, MUNTEANU N.1, STOLERU V.1, IPĂTIOAIEI C.D.1
e-mail: [email protected]
Abstract. The aim of the present work has been to study the influence of
technological factors (planting distance and methods of mulching), on the early
and total yield of rhubarb, Victoria cultivar. Applying differential cultivation
technology, rhubarb yield varies according to mulching system and crop
density. The highest early production was obtained at density of 9090 pl.ha-1
(0,75 m x 1,1 m) and straw mulching. Statistically assured yields were also
obtained at the same density but where used biodegradable film mulching of 30
µ. Total yield varied within wide limits according to the two technological
factors, ranging from 7,817 kg.ha-1
to 42,632 kg.ha-1
.
Key words: cultivar, yield, density
Rezumat. Scopul lucrării de față a fost acela de a studia influența unor factori
tehnologici (distanțe de plantare și metode de mulcire), asupra producției
timpurii și totale de revent, in cazul cultivarului Victoria. Prin aplicarea
diferenţiată a tehnologiei de cultivare, producția de revent variază în funcție de
sistemul de mulcire și de densitatea culturii la înființare. Cea mai ridicată
producție timpurie s-a înregistrat în cazul în care mulcirea s-a realizat cu paie
iar plantarea s-a făcut la distanțe de 0,75 m x 1,1 m. Producții, de asemenea,
asigurate statistic au mai fost obținute și în cazul acelorași distanțe de plantare
dar în situația în care mulcirea s-a efectuat cu folie biodegradabilă de 30 µ.
Producția totală a variat în limite foarte largi în funcție de cei doi factori
tehnologici, variind de la 7.817 kg/ha la 42.632 kg/ha.
Cuvinte cheie: cultivar, producţie,densitate
INTRODUCTION
The rhubarb (Rheum rhabarbarum L.) is a less known and spread crop in
Romania. It is a perennial vegetable species, adapted to cold temperate climate
(Ciofu et al., 2004; Indrea et al., 2007).
Rhubarb is originated in the Himalayas, where its root was an important
medicine believed to purge the body of ill humors (Stan et al., 2003).
In our country rhubarb is more cultivated in the western part of the country
and it is used for compot, fam and other desert (Treptow, 1985).
In the last time rhubarb products are spread by the supermarket on all over
the country. So it is a good opportunity for farmers to cultivate this species also in
other parts of the country, not only in the traditional ones.
1University of Agricultural Sciences and Veterinary Medicine of Iasi, Romania
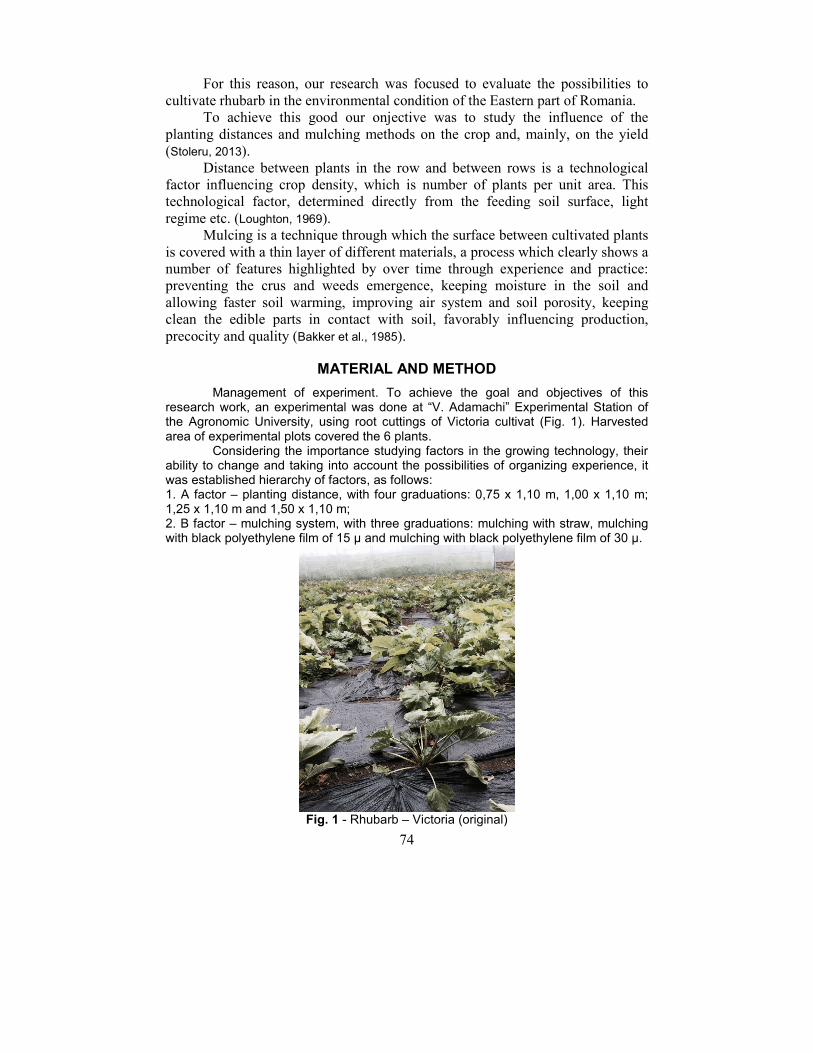
74
For this reason, our research was focused to evaluate the possibilities to
cultivate rhubarb in the environmental condition of the Eastern part of Romania.
To achieve this good our onjective was to study the influence of the
planting distances and mulching methods on the crop and, mainly, on the yield
(Stoleru, 2013).
Distance between plants in the row and between rows is a technological
factor influencing crop density, which is number of plants per unit area. This
technological factor, determined directly from the feeding soil surface, light
regime etc. (Loughton, 1969).
Mulcing is a technique through which the surface between cultivated plants
is covered with a thin layer of different materials, a process which clearly shows a
number of features highlighted by over time through experience and practice:
preventing the crus and weeds emergence, keeping moisture in the soil and
allowing faster soil warming, improving air system and soil porosity, keeping
clean the edible parts in contact with soil, favorably influencing production,
precocity and quality (Bakker et al., 1985).
MATERIAL AND METHOD
Management of experiment. To achieve the goal and objectives of this research work, an experimental was done at “V. Adamachi” Experimental Station of the Agronomic University, using root cuttings of Victoria cultivat (Fig. 1). Harvested area of experimental plots covered the 6 plants.
Considering the importance studying factors in the growing technology, their ability to change and taking into account the possibilities of organizing experience, it was established hierarchy of factors, as follows: 1. A factor – planting distance, with four graduations: 0,75 x 1,10 m, 1,00 x 1,10 m; 1,25 x 1,10 m and 1,50 x 1,10 m; 2. B factor – mulching system, with three graduations: mulching with straw, mulching with black polyethylene film of 15 µ and mulching with black polyethylene film of 30 µ.
Fig. 1 - Rhubarb – Victoria (original)
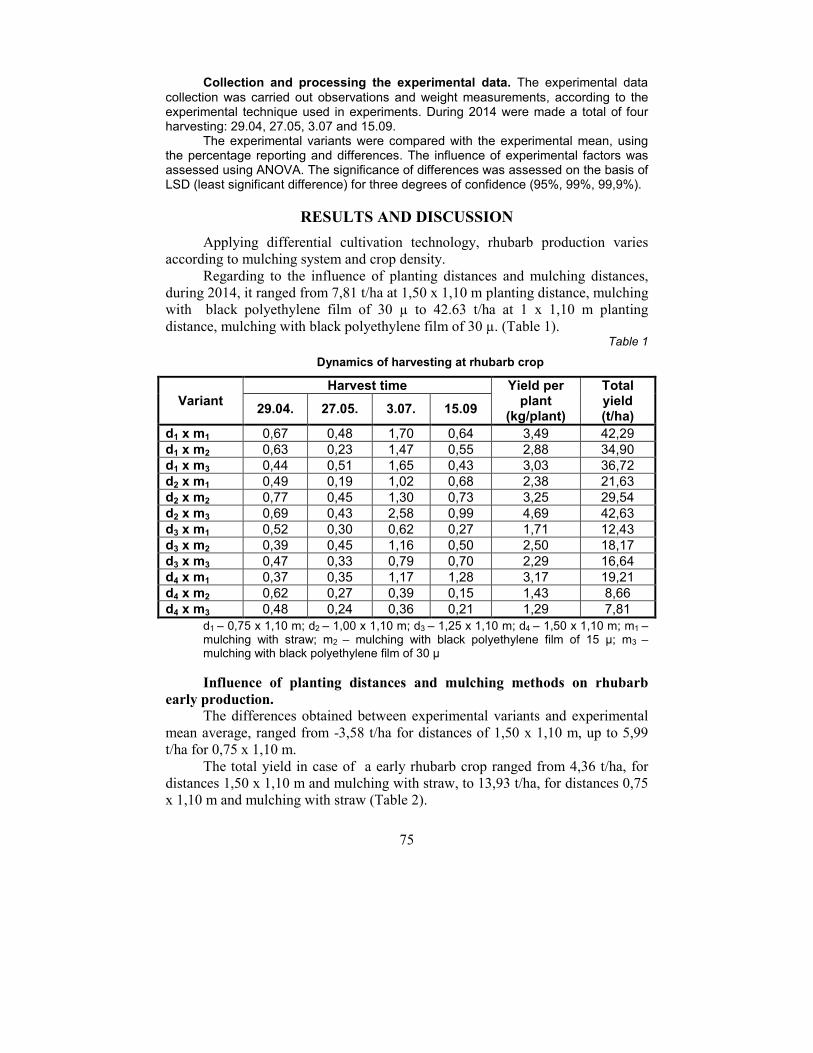
75
Collection and processing the experimental data. The experimental data
collection was carried out observations and weight measurements, according to the experimental technique used in experiments. During 2014 were made a total of four harvesting: 29.04, 27.05, 3.07 and 15.09.
The experimental variants were compared with the experimental mean, using the percentage reporting and differences. The influence of experimental factors was assessed using ANOVA. The significance of differences was assessed on the basis of LSD (least significant difference) for three degrees of confidence (95%, 99%, 99,9%).
RESULTS AND DISCUSSION
Applying differential cultivation technology, rhubarb production varies
according to mulching system and crop density.
Regarding to the influence of planting distances and mulching distances,
during 2014, it ranged from 7,81 t/ha at 1,50 x 1,10 m planting distance, mulching
with black polyethylene film of 30 µ to 42.63 t/ha at 1 x 1,10 m planting
distance, mulching with black polyethylene film of 30 µ. (Table 1). Table 1
Dynamics of harvesting at rhubarb crop
Variant Harvest time Yield per
plant (kg/plant)
Total yield (t/ha)
29.04. 27.05. 3.07. 15.09
d1 x m1 0,67 0,48 1,70 0,64 3,49 42,29
d1 x m2 0,63 0,23 1,47 0,55 2,88 34,90
d1 x m3 0,44 0,51 1,65 0,43 3,03 36,72
d2 x m1 0,49 0,19 1,02 0,68 2,38 21,63
d2 x m2 0,77 0,45 1,30 0,73 3,25 29,54
d2 x m3 0,69 0,43 2,58 0,99 4,69 42,63
d3 x m1 0,52 0,30 0,62 0,27 1,71 12,43
d3 x m2 0,39 0,45 1,16 0,50 2,50 18,17
d3 x m3 0,47 0,33 0,79 0,70 2,29 16,64
d4 x m1 0,37 0,35 1,17 1,28 3,17 19,21
d4 x m2 0,62 0,27 0,39 0,15 1,43 8,66
d4 x m3 0,48 0,24 0,36 0,21 1,29 7,81
d1 – 0,75 x 1,10 m; d2 – 1,00 x 1,10 m; d3 – 1,25 x 1,10 m; d4 – 1,50 x 1,10 m; m1 – mulching with straw; m2 – mulching with black polyethylene film of 15 µ; m3 – mulching with black polyethylene film of 30 µ
Influence of planting distances and mulching methods on rhubarb early production.
The differences obtained between experimental variants and experimental
mean average, ranged from -3,58 t/ha for distances of 1,50 x 1,10 m, up to 5,99
t/ha for 0,75 x 1,10 m.
The total yield in case of a early rhubarb crop ranged from 4,36 t/ha, for
distances 1,50 x 1,10 m and mulching with straw, to 13,93 t/ha, for distances 0,75
x 1,10 m and mulching with straw (Table 2).
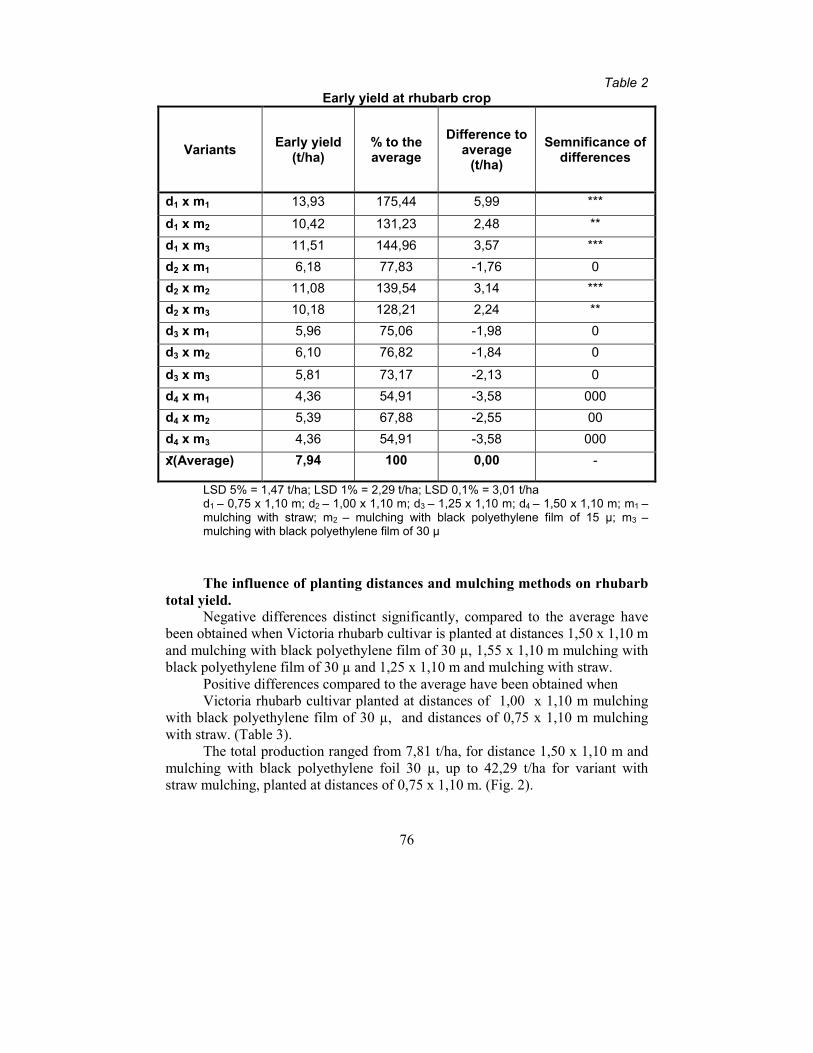
76
Table 2 Early yield at rhubarb crop
Variants Early yield (t/ha)
% to the average
Difference to average (t/ha)
Semnificance of differences
d1 x m1 13,93 175,44 5,99 ***
d1 x m2 10,42 131,23 2,48 **
d1 x m3 11,51 144,96 3,57 ***
d2 x m1 6,18 77,83 -1,76 0
d2 x m2 11,08 139,54 3,14 ***
d2 x m3 10,18 128,21 2,24 **
d3 x m1 5,96 75,06 -1,98 0
d3 x m2 6,10 76,82 -1,84 0
d3 x m3 5,81 73,17 -2,13 0
d4 x m1 4,36 54,91 -3,58 000
d4 x m2 5,39 67,88 -2,55 00
d4 x m3 4,36 54,91 -3,58 000
x ̄̄ ̄̄(Average) 7,94 100 0,00 -
LSD 5% = 1,47 t/ha; LSD 1% = 2,29 t/ha; LSD 0,1% = 3,01 t/ha d1 – 0,75 x 1,10 m; d2 – 1,00 x 1,10 m; d3 – 1,25 x 1,10 m; d4 – 1,50 x 1,10 m; m1 – mulching with straw; m2 – mulching with black polyethylene film of 15 µ; m3 – mulching with black polyethylene film of 30 µ
The influence of planting distances and mulching methods on rhubarb
total yield. Negative differences distinct significantly, compared to the average have
been obtained when Victoria rhubarb cultivar is planted at distances 1,50 x 1,10 m
and mulching with black polyethylene film of 30 µ, 1,55 x 1,10 m mulching with
black polyethylene film of 30 µ and 1,25 x 1,10 m and mulching with straw.
Positive differences compared to the average have been obtained when
Victoria rhubarb cultivar planted at distances of 1,00 x 1,10 m mulching
with black polyethylene film of 30 µ, and distances of 0,75 x 1,10 m mulching
with straw. (Table 3). The total production ranged from 7,81 t/ha, for distance 1,50 x 1,10 m and
mulching with black polyethylene foil 30 µ, up to 42,29 t/ha for variant with
straw mulching, planted at distances of 0,75 x 1,10 m. (Fig. 2).
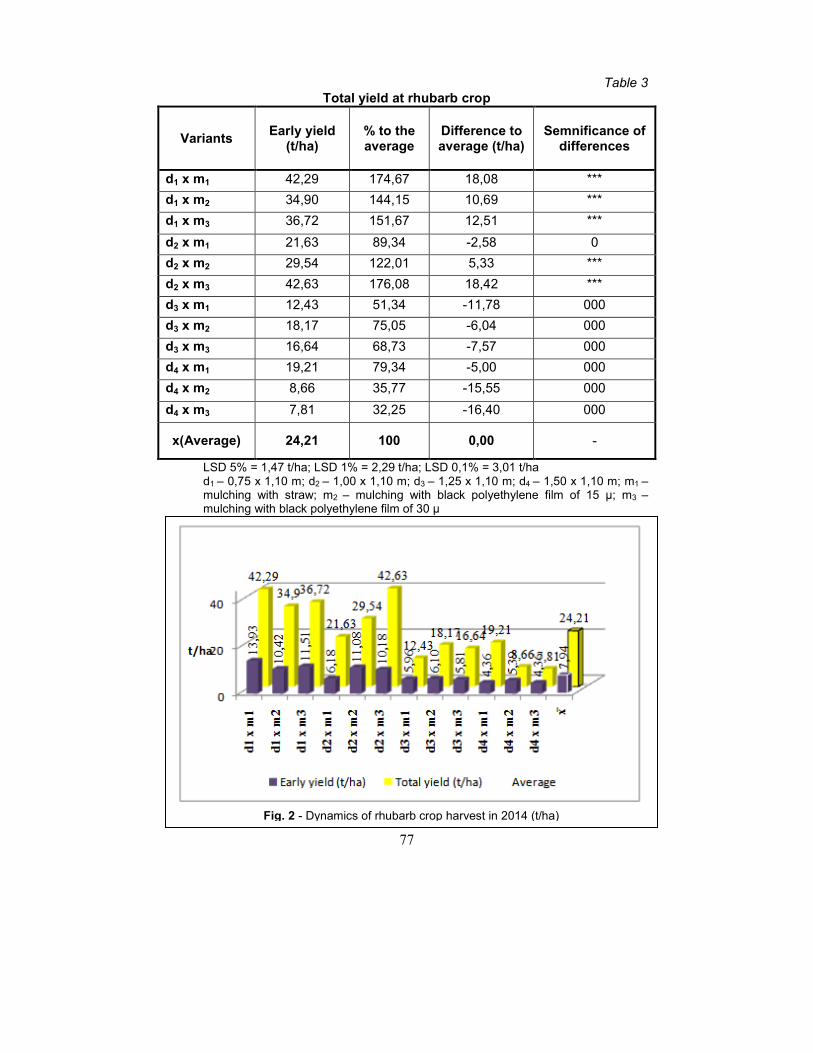
77
Table 3 Total yield at rhubarb crop
Variants Early yield (t/ha)
% to the average
Difference to average (t/ha)
Semnificance of differences
d1 x m1 42,29 174,67 18,08 ***
d1 x m2 34,90 144,15 10,69 ***
d1 x m3 36,72 151,67 12,51 ***
d2 x m1 21,63 89,34 -2,58 0
d2 x m2 29,54 122,01 5,33 ***
d2 x m3 42,63 176,08 18,42 ***
d3 x m1 12,43 51,34 -11,78 000
d3 x m2 18,17 75,05 -6,04 000
d3 x m3 16,64 68,73 -7,57 000
d4 x m1 19,21 79,34 -5,00 000
d4 x m2 8,66 35,77 -15,55 000
d4 x m3 7,81 32,25 -16,40 000
x(Average) 24,21 100 0,00 -
LSD 5% = 1,47 t/ha; LSD 1% = 2,29 t/ha; LSD 0,1% = 3,01 t/ha d1 – 0,75 x 1,10 m; d2 – 1,00 x 1,10 m; d3 – 1,25 x 1,10 m; d4 – 1,50 x 1,10 m; m1 – mulching with straw; m2 – mulching with black polyethylene film of 15 µ; m3 – mulching with black polyethylene film of 30 µ
Fig. 2 - Dynamics of rhubarb crop harvest in 2014 (t/ha)
78
CONCLUSIONS
1. Regarding the influence of planting distances and mulching methods on
rhubarb total yield during 2014, it ranged from 7,81 t/ha for distance 1,50 x 1,10
m and mulching with black polyethylene film of 30 µ, to 42,29 t/ha for variant
mulching with straw, planted at distances of 0,75 x 1,10 m.
2. The yield in case of a early rhubarb crop ranged from 4,36 t/ha for
distances 1,50 x 1,10 m and mulching with straw to 13,93 t/ha for distances 0,75 x
1,10 m mulching with straw.
REFFERENCES
1. Bakker J. J., Schroen G., Roelands C., 1985 – With rhubarb cultivars there are large differences in yield and stem colour. Groenten en Fruit, 41 (15), pp 62-65.
2. Ciofu Ruxandra, Stan N., Popescu V., Chilom P., Apahidean S., Horgos A., Berar V., Lauer K. F., Atanasiu N., 2004 – Tratat de Legumicultura. Editura Ceres
Bucuresti. 3. Indrea D., Apahidean S., Apahidean Maria, Maniutiu D., Sima Rodica, 2007 –
Cultura Legumelor. Editura Ceres, Bucuresti. 4. Loughton A.; 1969 – Rhubarb forcing. Publications. Department of Agriculture, Ontario,
346, pp 15. 5. Stan N., Munteanu N., Stan T., 2003 – Legumicultura, Vol III. Editura “ Ion Ionescu de
la Brad ”, Iasi. 6. Stoleru V., 2013 - Managementul sistemelor legumicole ecologice. Editura “Ion Ionescu
de la Brad”, Iasi. 7. Treptow H., 1985 – Rhubarb (Rheum species) and its uses. Flauss. Obst., 52(8), pp
419-422.
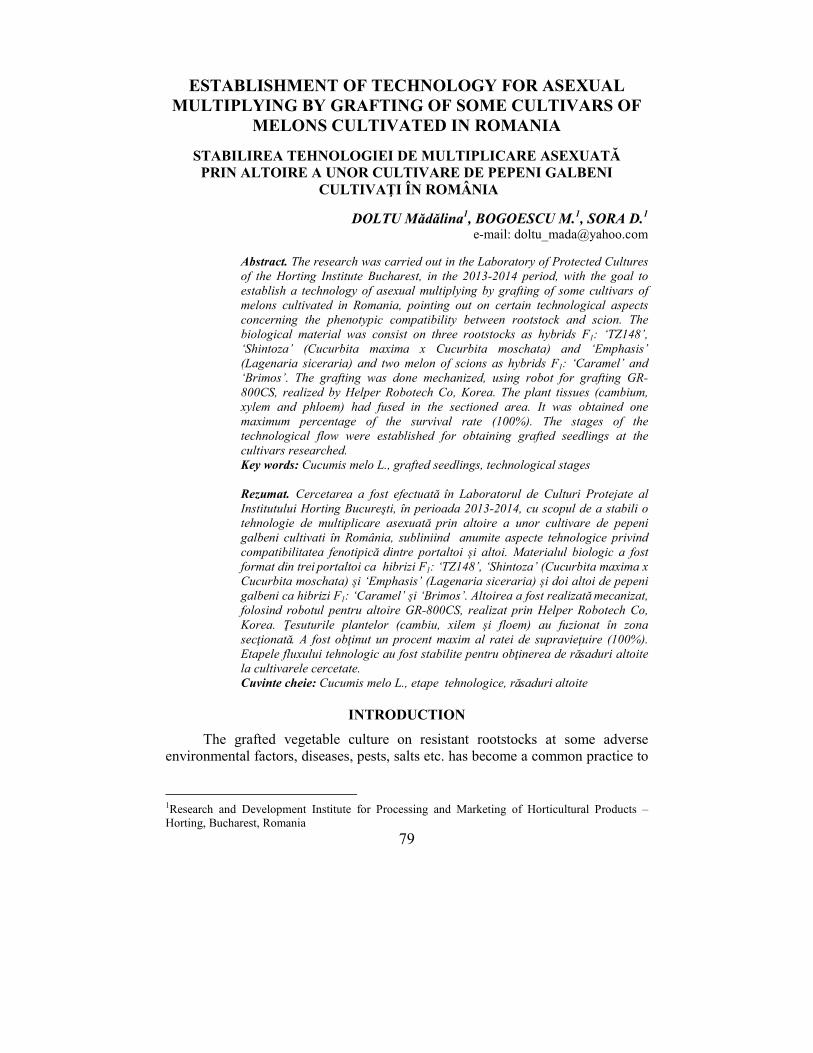
79
ESTABLISHMENT OF TECHNOLOGY FOR ASEXUAL MULTIPLYING BY GRAFTING OF SOME CULTIVARS OF
MELONS CULTIVATED IN ROMANIA
STABILIREA TEHNOLOGIEI DE MULTIPLICARE ASEXUATĂ PRIN ALTOIRE A UNOR CULTIVARE DE PEPENI GALBENI
CULTIVAŢI ÎN ROMÂNIA
DOLTU Mădălina1, BOGOESCU M.
1, SORA D.
1
e-mail: [email protected]
Abstract. The research was carried out in the Laboratory of Protected Cultures
of the Horting Institute Bucharest, in the 2013-2014 period, with the goal to
establish a technology of asexual multiplying by grafting of some cultivars of
melons cultivated in Romania, pointing out on certain technological aspects
concerning the phenotypic compatibility between rootstock and scion. The
biological material was consist on three rootstocks as hybrids F1: ‘TZ148’,
‘Shintoza’ (Cucurbita maxima x Cucurbita moschata) and ‘Emphasis’
(Lagenaria siceraria) and two melon of scions as hybrids F1: ‘Caramel’ and
‘Brimos’. The grafting was done mechanized, using robot for grafting GR-
800CS, realized by Helper Robotech Co, Korea. The plant tissues (cambium,
xylem and phloem) had fused in the sectioned area. It was obtained one
maximum percentage of the survival rate (100%). The stages of the
technological flow were established for obtaining grafted seedlings at the
cultivars researched. Key words: Cucumis melo L., grafted seedlings, technological stages
Rezumat. Cercetarea a fost efectuată în Laboratorul de Culturi Protejate al
Institutului Horting Bucureşti, în perioada 2013-2014, cu scopul de a stabili o
tehnologie de multiplicare asexuată prin altoire a unor cultivare de pepeni
galbeni cultivati în România, subliniind anumite aspecte tehnologice privind
compatibilitatea fenotipică dintre portaltoi şi altoi. Materialul biologic a fost
format din trei portaltoi ca hibrizi F1: ‘TZ148’, ‘Shintoza’ (Cucurbita maxima x
Cucurbita moschata) şi ‘Emphasis’ (Lagenaria siceraria) şi doi altoi de pepeni
galbeni ca hibrizi F1: ‘Caramel’ şi ‘Brimos’. Altoirea a fost realizată mecanizat,
folosind robotul pentru altoire GR-800CS, realizat prin Helper Robotech Co,
Korea. Ţesuturile plantelor (cambiu, xilem şi floem) au fuzionat în zona
secţionată. A fost obţinut un procent maxim al ratei de supravieţuire (100%).
Etapele fluxului tehnologic au fost stabilite pentru obţinerea de răsaduri altoite
la cultivarele cercetate.
Cuvinte cheie: Cucumis melo L., etape tehnologice, răsaduri altoite
INTRODUCTION
The grafted vegetable culture on resistant rootstocks at some adverse
environmental factors, diseases, pests, salts etc. has become a common practice to
1Research and Development Institute for Processing and Marketing of Horticultural Products –
Horting, Bucharest, Romania
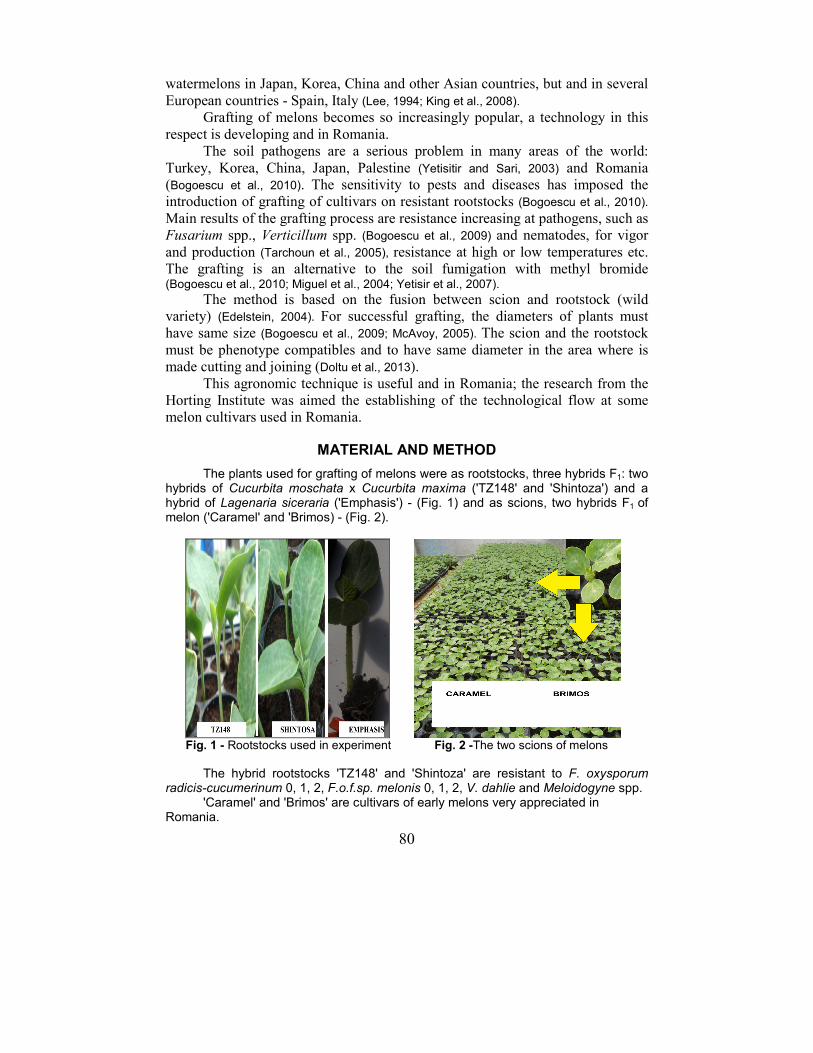
80
watermelons in Japan, Korea, China and other Asian countries, but and in several
European countries - Spain, Italy (Lee, 1994; King et al., 2008).
Grafting of melons becomes so increasingly popular, a technology in this
respect is developing and in Romania.
The soil pathogens are a serious problem in many areas of the world:
Turkey, Korea, China, Japan, Palestine (Yetisitir and Sari, 2003) and Romania
(Bogoescu et al., 2010). The sensitivity to pests and diseases has imposed the
introduction of grafting of cultivars on resistant rootstocks (Bogoescu et al., 2010).
Main results of the grafting process are resistance increasing at pathogens, such as
Fusarium spp., Verticillum spp. (Bogoescu et al., 2009) and nematodes, for vigor
and production (Tarchoun et al., 2005), resistance at high or low temperatures etc.
The grafting is an alternative to the soil fumigation with methyl bromide (Bogoescu et al., 2010; Miguel et al., 2004; Yetisir et al., 2007).
The method is based on the fusion between scion and rootstock (wild
variety) (Edelstein, 2004). For successful grafting, the diameters of plants must
have same size (Bogoescu et al., 2009; McAvoy, 2005). The scion and the rootstock
must be phenotype compatibles and to have same diameter in the area where is
made cutting and joining (Doltu et al., 2013).
This agronomic technique is useful and in Romania; the research from the
Horting Institute was aimed the establishing of the technological flow at some
melon cultivars used in Romania.
MATERIAL AND METHOD
The plants used for grafting of melons were as rootstocks, three hybrids F1: two hybrids of Cucurbita moschata x Cucurbita maxima ('TZ148' and 'Shintoza') and a hybrid of Lagenaria siceraria ('Emphasis') - (Fig. 1) and as scions, two hybrids F1 of melon ('Caramel' and 'Brimos) - (Fig. 2).
Fig. 1 - Rootstocks used in experiment Fig. 2 -The two scions of melons
The hybrid rootstocks 'TZ148' and 'Shintoza' are resistant to F. oxysporum radicis-cucumerinum 0, 1, 2, F.o.f.sp. melonis 0, 1, 2, V. dahlie and Meloidogyne spp.
'Caramel' and 'Brimos' are cultivars of early melons very appreciated in Romania.
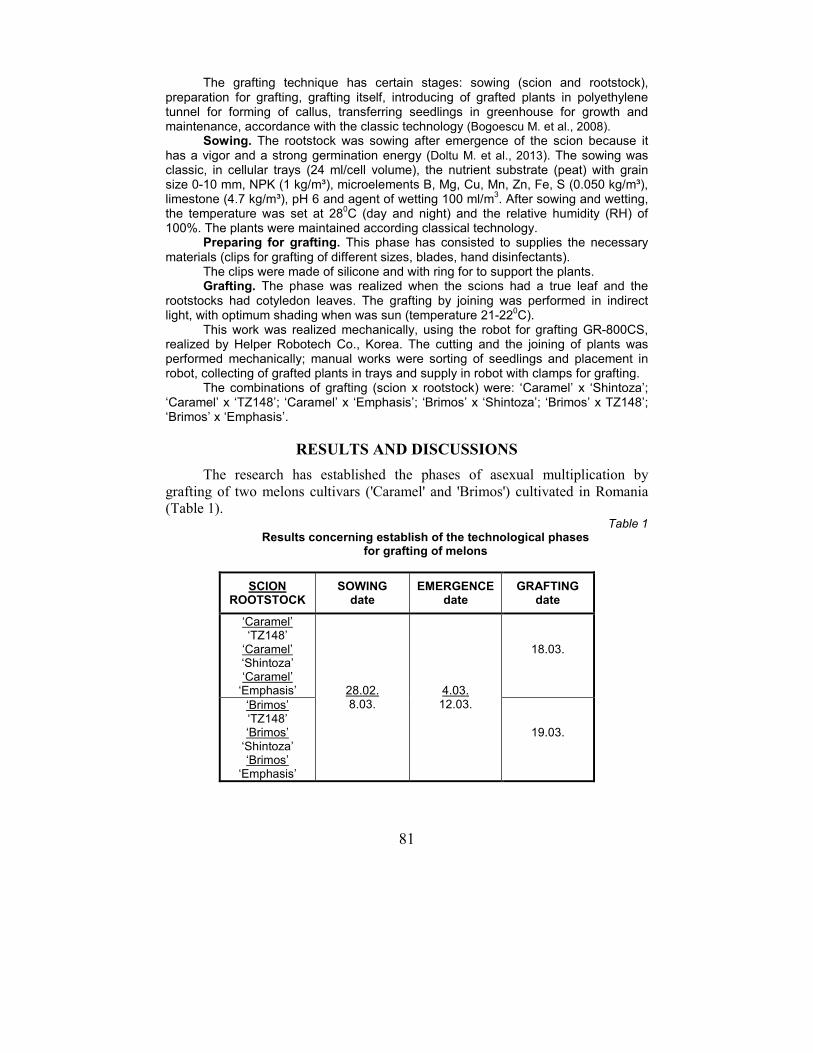
81
The grafting technique has certain stages: sowing (scion and rootstock), preparation for grafting, grafting itself, introducing of grafted plants in polyethylene tunnel for forming of callus, transferring seedlings in greenhouse for growth and maintenance, accordance with the classic technology (Bogoescu M. et al., 2008).
Sowing. The rootstock was sowing after emergence of the scion because it has a vigor and a strong germination energy (Doltu M. et al., 2013). The sowing was classic, in cellular trays (24 ml/cell volume), the nutrient substrate (peat) with grain size 0-10 mm, NPK (1 kg/m³), microelements B, Mg, Cu, Mn, Zn, Fe, S (0.050 kg/m³), limestone (4.7 kg/m³), pH 6 and agent of wetting 100 ml/m
3. After sowing and wetting,
the temperature was set at 280C (day and night) and the relative humidity (RH) of
100%. The plants were maintained according classical technology. Preparing for grafting. This phase has consisted to supplies the necessary
materials (clips for grafting of different sizes, blades, hand disinfectants). The clips were made of silicone and with ring for to support the plants. Grafting. The phase was realized when the scions had a true leaf and the
rootstocks had cotyledon leaves. The grafting by joining was performed in indirect light, with optimum shading when was sun (temperature 21-22
0C).
This work was realized mechanically, using the robot for grafting GR-800CS, realized by Helper Robotech Co., Korea. The cutting and the joining of plants was performed mechanically; manual works were sorting of seedlings and placement in robot, collecting of grafted plants in trays and supply in robot with clamps for grafting.
The combinations of grafting (scion x rootstock) were: ‘Caramel’ x ‘Shintoza’; ‘Caramel’ x ‘TZ148’; ‘Caramel’ x ‘Emphasis’; ‘Brimos’ x ‘Shintoza’; ‘Brimos’ x TZ148’; ‘Brimos’ x ‘Emphasis’.
RESULTS AND DISCUSSIONS
The research has established the phases of asexual multiplication by
grafting of two melons cultivars ('Caramel' and 'Brimos') cultivated in Romania
(Table 1). Table 1
Results concerning establish of the technological phases for grafting of melons
SCION ROOTSTOCK
SOWING date
EMERGENCE date
GRAFTING date
‘Caramel’ ‘TZ148’
‘Caramel’ ‘Shintoza’ ‘Caramel’
‘Emphasis’
28.02. 8.03.
4.03. 12.03.
18.03.
‘Brimos’ ‘TZ148’ ‘Brimos’
‘Shintoza’ ‘Brimos’
‘Emphasis’
19.03.
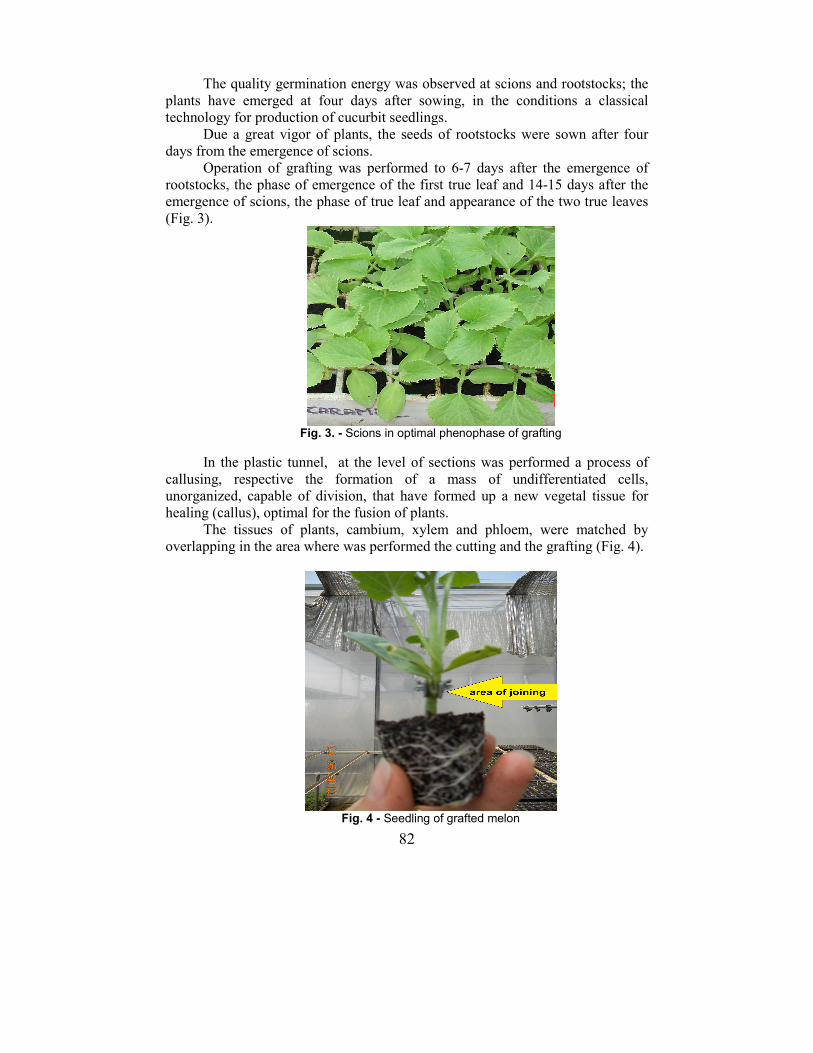
82
The quality germination energy was observed at scions and rootstocks; the
plants have emerged at four days after sowing, in the conditions a classical
technology for production of cucurbit seedlings.
Due a great vigor of plants, the seeds of rootstocks were sown after four
days from the emergence of scions.
Operation of grafting was performed to 6-7 days after the emergence of
rootstocks, the phase of emergence of the first true leaf and 14-15 days after the
emergence of scions, the phase of true leaf and appearance of the two true leaves
(Fig. 3).
Fig. 3. - Scions in optimal phenophase of grafting
In the plastic tunnel, at the level of sections was performed a process of
callusing, respective the formation of a mass of undifferentiated cells,
unorganized, capable of division, that have formed up a new vegetal tissue for
healing (callus), optimal for the fusion of plants.
The tissues of plants, cambium, xylem and phloem, were matched by
overlapping in the area where was performed the cutting and the grafting (Fig. 4).
Fig. 4 - Seedling of grafted melon
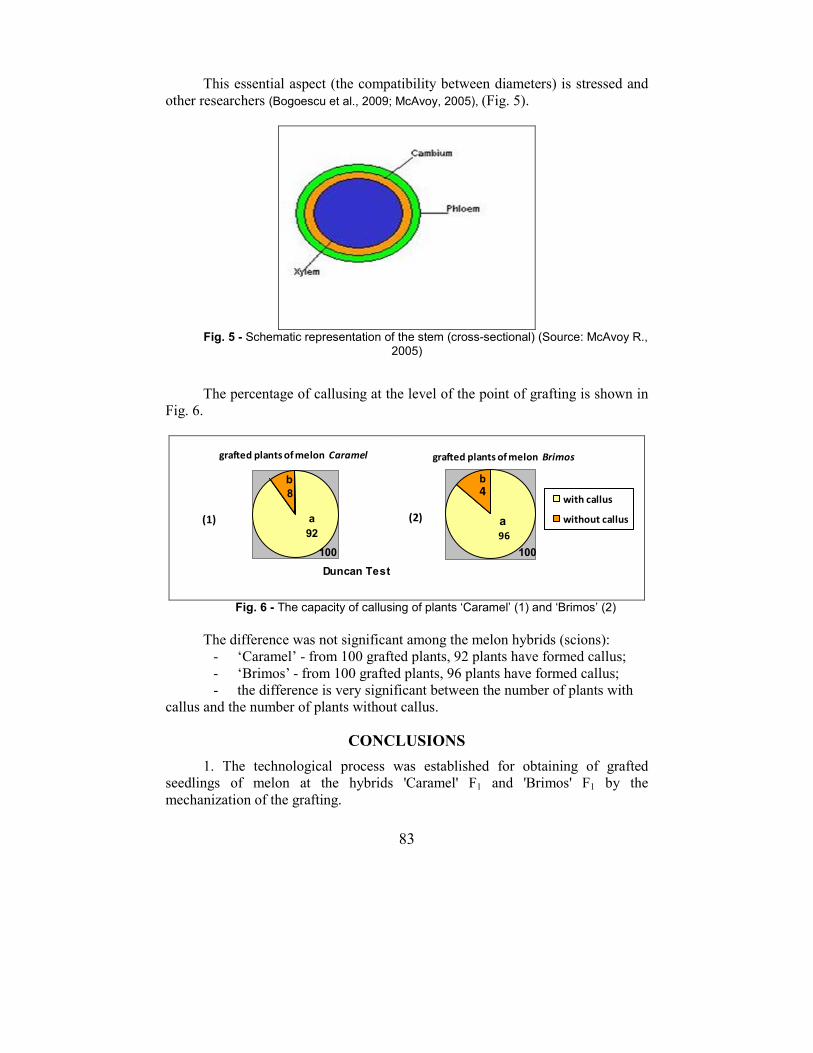
83
This essential aspect (the compatibility between diameters) is stressed and
other researchers (Bogoescu et al., 2009; McAvoy, 2005), (Fig. 5).
Fig. 5 - Schematic representation of the stem (cross-sectional) (Source: McAvoy R.,
2005)
The percentage of callusing at the level of the point of grafting is shown in
Fig. 6.
8
100
grafted plants of melon Caramel
Duncan Test
a
92
b
(1)
with callus
without callus
4
100
grafted plants of melon Brimos
b
a(2)
96
Fig. 6 - The capacity of callusing of plants ‘Caramel’ (1) and ‘Brimos’ (2)
The difference was not significant among the melon hybrids (scions):
- ‘Caramel’ - from 100 grafted plants, 92 plants have formed callus;
- ‘Brimos’ - from 100 grafted plants, 96 plants have formed callus;
- the difference is very significant between the number of plants with
callus and the number of plants without callus.
CONCLUSIONS
1. The technological process was established for obtaining of grafted
seedlings of melon at the hybrids 'Caramel' F1 and 'Brimos' F1 by the
mechanization of the grafting.
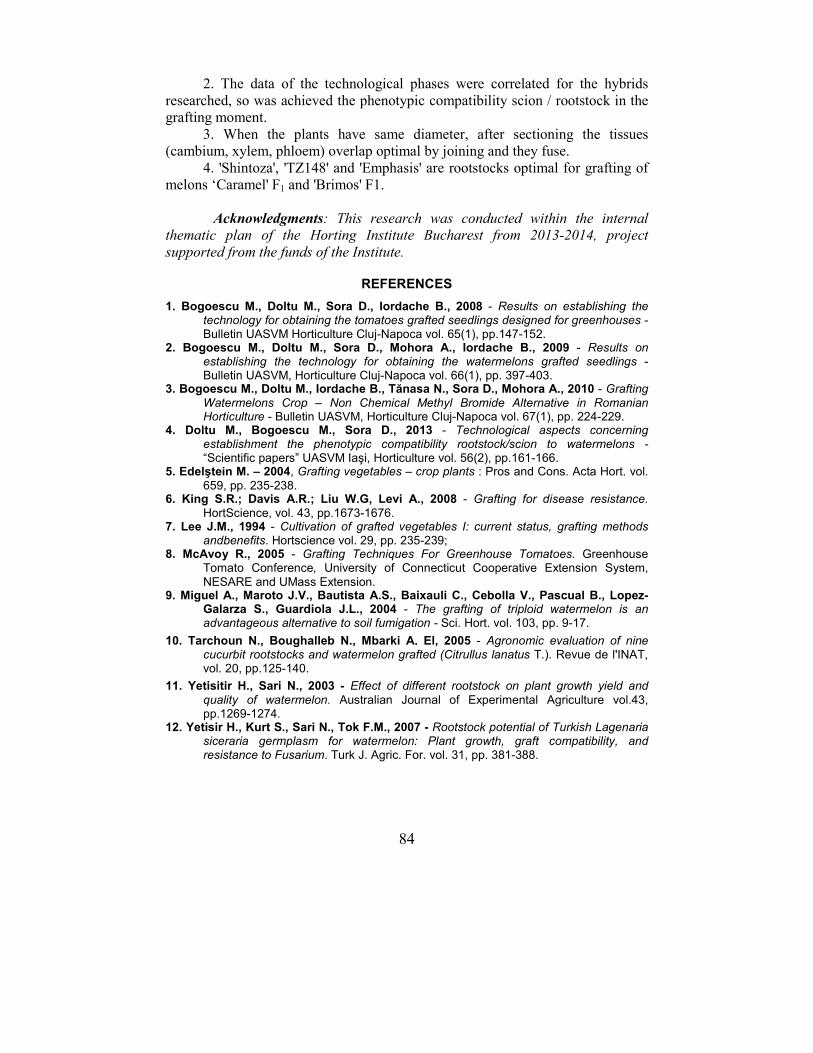
84
2. The data of the technological phases were correlated for the hybrids
researched, so was achieved the phenotypic compatibility scion / rootstock in the
grafting moment.
3. When the plants have same diameter, after sectioning the tissues
(cambium, xylem, phloem) overlap optimal by joining and they fuse.
4. 'Shintoza', 'TZ148' and 'Emphasis' are rootstocks optimal for grafting of
melons ‘Caramel' F1 and 'Brimos' F1.
Acknowledgments: This research was conducted within the internal
thematic plan of the Horting Institute Bucharest from 2013-2014, project
supported from the funds of the Institute.
REFERENCES
1. Bogoescu M., Doltu M., Sora D., Iordache B., 2008 - Results on establishing the technology for obtaining the tomatoes grafted seedlings designed for greenhouses - Bulletin UASVM Horticulture Cluj-Napoca vol. 65(1), pp.147-152.
2. Bogoescu M., Doltu M., Sora D., Mohora A., Iordache B., 2009 - Results on establishing the technology for obtaining the watermelons grafted seedlings - Bulletin UASVM, Horticulture Cluj-Napoca vol. 66(1), pp. 397-403.
3. Bogoescu M., Doltu M., Iordache B., Tănasa N., Sora D., Mohora A., 2010 - Grafting
Watermelons Crop – Non Chemical Methyl Bromide Alternative in Romanian Horticulture - Bulletin UASVM, Horticulture Cluj-Napoca vol. 67(1), pp. 224-229.
4. Doltu M., Bogoescu M., Sora D., 2013 - Technological aspects concerning establishment the phenotypic compatibility rootstock/scion to watermelons - “Scientific papers” UASVM Iaşi, Horticulture vol. 56(2), pp.161-166.
5. Edelştein M. – 2004, Grafting vegetables – crop plants : Pros and Cons. Acta Hort. vol.
659, pp. 235-238. 6. King S.R.; Davis A.R.; Liu W.G, Levi A., 2008 - Grafting for disease resistance.
HortScience, vol. 43, pp.1673-1676. 7. Lee J.M., 1994 - Cultivation of grafted vegetables I: current status, grafting methods
andbenefits. Hortscience vol. 29, pp. 235-239; 8. McAvoy R., 2005 - Grafting Techniques For Greenhouse Tomatoes. Greenhouse
Tomato Conference, University of Connecticut Cooperative Extension System,
NESARE and UMass Extension. 9. Miguel A., Maroto J.V., Bautista A.S., Baixauli C., Cebolla V., Pascual B., Lopez-
Galarza S., Guardiola J.L., 2004 - The grafting of triploid watermelon is an advantageous alternative to soil fumigation - Sci. Hort. vol. 103, pp. 9-17.
10. Tarchoun N., Boughalleb N., Mbarki A. El, 2005 - Agronomic evaluation of nine cucurbit rootstocks and watermelon grafted (Citrullus lanatus T.). Revue de l'INAT, vol. 20, pp.125-140.
11. Yetisitir H., Sari N., 2003 - Effect of different rootstock on plant growth yield and
quality of watermelon. Australian Journal of Experimental Agriculture vol.43, pp.1269-1274.
12. Yetisir H., Kurt S., Sari N., Tok F.M., 2007 - Rootstock potential of Turkish Lagenaria siceraria germplasm for watermelon: Plant growth, graft compatibility, and resistance to Fusarium. Turk J. Agric. For. vol. 31, pp. 381-388.
85
RESEARCH ON THE DEPLOYMENT OF THE PHYSIOLOGICAL PROCESSES DURING THE GROWTH
AND THE FRUITING OF THE CUCURBITA PEPO SPECIES
CERCETĂRI PRIVIND DESFĂȘURAREA UNOR PROCESE FIZIOLOGICE ÎN TIMPUL CREȘTERII ȘI FRUCTIFICĂRII SPECIEI
CUCURBITA PEPO
MUNTEAN Delia1, FASOLA Alexandra
1
e-mail: [email protected]
Abstract. In this study it was evaluated the development of the physiological characterization of Cucurbita pepo plants during their growth and development, as well as on the mode of physiological adaptation of the plants to the photosynthesis. The research was conducted in the experimental field of the Department of Horticulture , in the USAMV , V. Adamachi farm. Chlorophyll and carotenoid pigments study emphasizes quantitative and qualitative presence of these pigments as a fundamental expression of plant adaptation to environmental conditions .Among the new culture were highlighted some differences, but overall, they have a special significance, showing that some photosynthetic activity cultivation are distinctly different. More interesting are the results that show that the pigment chlorophyll a levels was the highest at the top of plant (about 0.50 equivalent units) and what is particularly interesting in binding phenophase fruit. As was natural data show that levels of chlorophyll is smaller towards the base of the plant and fruit maturity phenophase (about 0.30 equivalent units). Key words: C. pepo, phenophases, foliar pigments, chlorophyll a, an indicator sensitive.
Rezumat. În cadrul acestui studiu a fost evaluată caracterizarea fiziologică asupra evoluției plantelor de Cucurbita pepo pe parcursul creșterii și dezvoltării lor, ca și asupra modului de adaptare din punct de vedere fiziologic a plantelor la procesul de fotosinteză. Cercetările au fost efectuate în câmpul experimental al Disciplinei de Legumicultură, din cadrul USAMV IAȘI, la ferma V. Adamachi. Studiul pigmenților clorofilieni și carotenoizi pune în evidență prezența cantitativă și calitativă a acestor pigmenți, ca expresie fundamentală a adaptării plantelor la condițiile de mediu. Între cele nouă cultivare au fost puse în evidență unele diferențe, dar, în general, acestea nu au o semnificație deosebită, din care să rezulte că unele cultivare au o activitate fotosintetică în mod distinct diferit. Mai interesante sunt rezultatele care arată că pigmentul clorofilă a avut nivelele cele mai mari la vârful plantelor (circa 0,50 unități echivalente), și ceea ce este deosebit de interesant în fenofaza de legare a fructelor. Așa după cum era firesc datele arată că un nivel al clorofilei e mai mic spre baza plantei și în fenofaza de maturitate a fructelor (circa 0,30 unități echivalente). Cuvinte cheie: C. pepo, fenofaze, pigmenţi foliari, clorofila a, indicator sensibil.
1University of Agricultural Sciences and Veterinary Medicine of Iasi, Romania
86
INTRODUCTION
The vegetable production is marked by a great diversity of species,
cultivation practices and traditions of usage. The large biodiversity of vegetable
species and their great movement across the globe have allowed many usages,
besides food, such as phytotherapy, cosmetics, landscaping, etc.
The ornamental value of vegetables results from the morphological
characteristics of the plants themselves: size, general habitus of plants, shape,
appearance, size and color of the leaves, flowers and fruits.
The importance of cultivating vegetables with ornamental value originates
from the constant need of man for finding beauty. Since forever, man has been
attracted to nature. Vegetable plants with ornamental value can be considered
today as an objective necessity of life. Many people find untold joy in the
company of nature, beauty, either in their small living spaces or outside, in
gardens or parks (Arthur et al., 1987). The vegetables with ornamental value, along
with other decorative plants help fight air pollution, establishing equilibrium in
living spaces. Cultivated by man in green spaces, these plants extend their
utilitarian-social importance. The vegetation in parks, gardens, squares and roads
visibly influences the microclimate of population centers. They clear the air of
contemporary life, which, in the unprecedented development of industry, harms
the environment (Lichtenthaler and Wellburn, 1983).
MATERIAL AND METHOD
The biological material for the ornamental pumpkin consisted in seed taken from a private person’s collection in Iasi. For the physiological characterization there were used ornamental pumpkin seeds to new hybrids discussed in the study: verrucosa, Festival, Bicolor, Pear, Dinosaur Egg, Styriaca, Yugoslavian Finger, Warzen Orange, Small Warted, Custard Marrow. The material used in the ornamental squash experiment consisted in the biological material of nine hybrids.
The research was conducted between 2012-2013 in the experimental field of the Department of Horticulture, in the USAMV farm "Vasile Adamache".
The land is flat, with an average cambic chernozem leached soil, well supplied with nutrients and an average pH of about 6.5 -7.0.
Weather conditions varied a lot than the normal average temperate continental climate which characterizes the area; the temperatures and the rainfall were ranged between extremes, with high temperatures and excessive drought, which required mandatory extra provision of irrigation conditions.
The culture was established by direct sowing in the field on the 15th of May, for
all nine hybrids, placed in nests in three times. The distance between rows was of 120-140 cm and 75-80 cm distance between plants in a row.
RESULTS AND DISCUSSIONS
Measurements were made at the three phenological points: blooming,
linking fruit and fruit maturity.
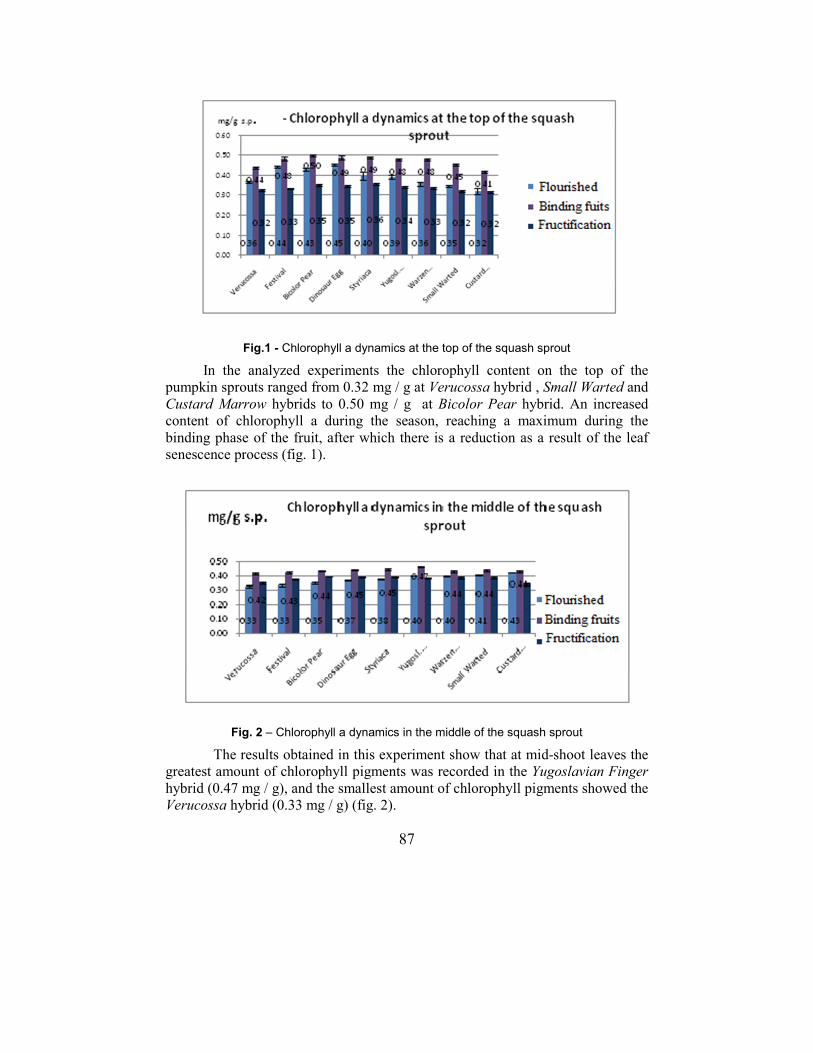
87
Fig.1 - Chlorophyll a dynamics at the top of the squash sprout
In the analyzed experiments the chlorophyll content on the top of the
pumpkin sprouts ranged from 0.32 mg / g at Verucossa hybrid , Small Warted and Custard Marrow hybrids to 0.50 mg / g at Bicolor Pear hybrid. An increased content of chlorophyll a during the season, reaching a maximum during the
binding phase of the fruit, after which there is a reduction as a result of the leaf
senescence process (fig. 1).
Fig. 2 – Chlorophyll a dynamics in the middle of the squash sprout
The results obtained in this experiment show that at mid-shoot leaves the
greatest amount of chlorophyll pigments was recorded in the Yugoslavian Finger hybrid (0.47 mg / g), and the smallest amount of chlorophyll pigments showed the
Verucossa hybrid (0.33 mg / g) (fig. 2).
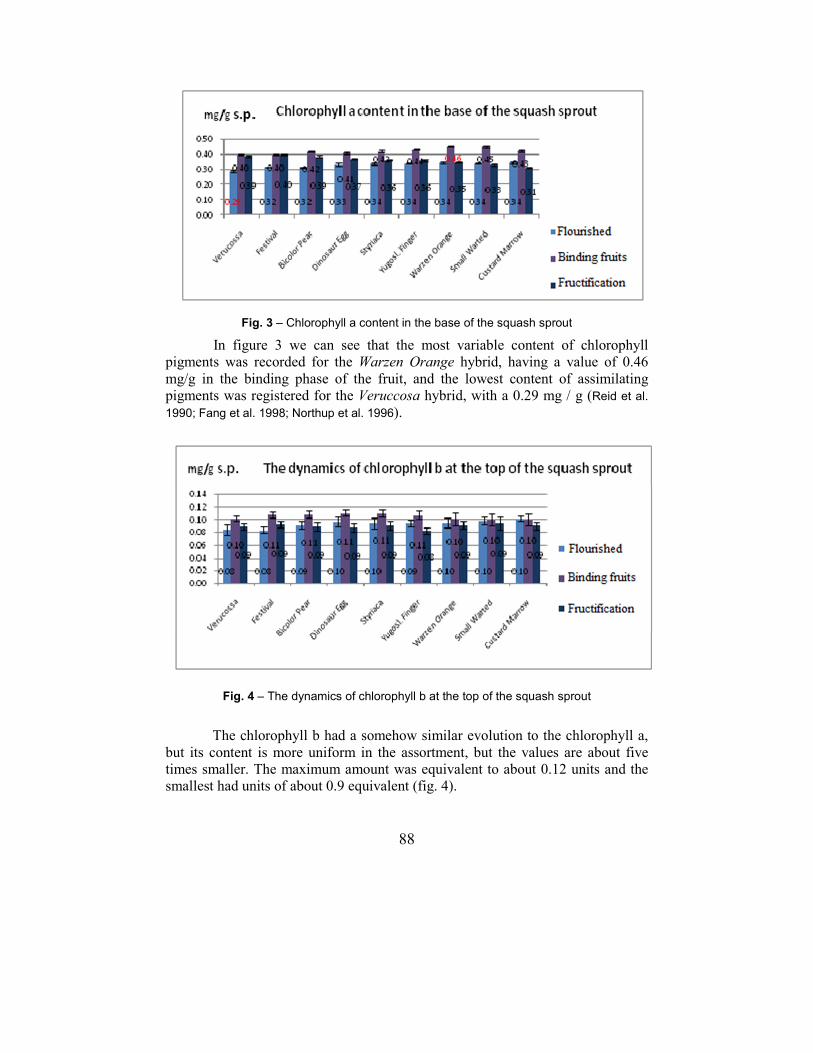
88
Fig. 3 – Chlorophyll a content in the base of the squash sprout
In figure 3 we can see that the most variable content of chlorophyll
pigments was recorded for the Warzen Orange hybrid, having a value of 0.46 mg/g in the binding phase of the fruit, and the lowest content of assimilating
pigments was registered for the Veruccosa hybrid, with a 0.29 mg / g (Reid et al. 1990; Fang et al. 1998; Northup et al. 1996).
Fig. 4 – The dynamics of chlorophyll b at the top of the squash sprout
The chlorophyll b had a somehow similar evolution to the chlorophyll a,
but its content is more uniform in the assortment, but the values are about five
times smaller. The maximum amount was equivalent to about 0.12 units and the
smallest had units of about 0.9 equivalent (fig. 4).
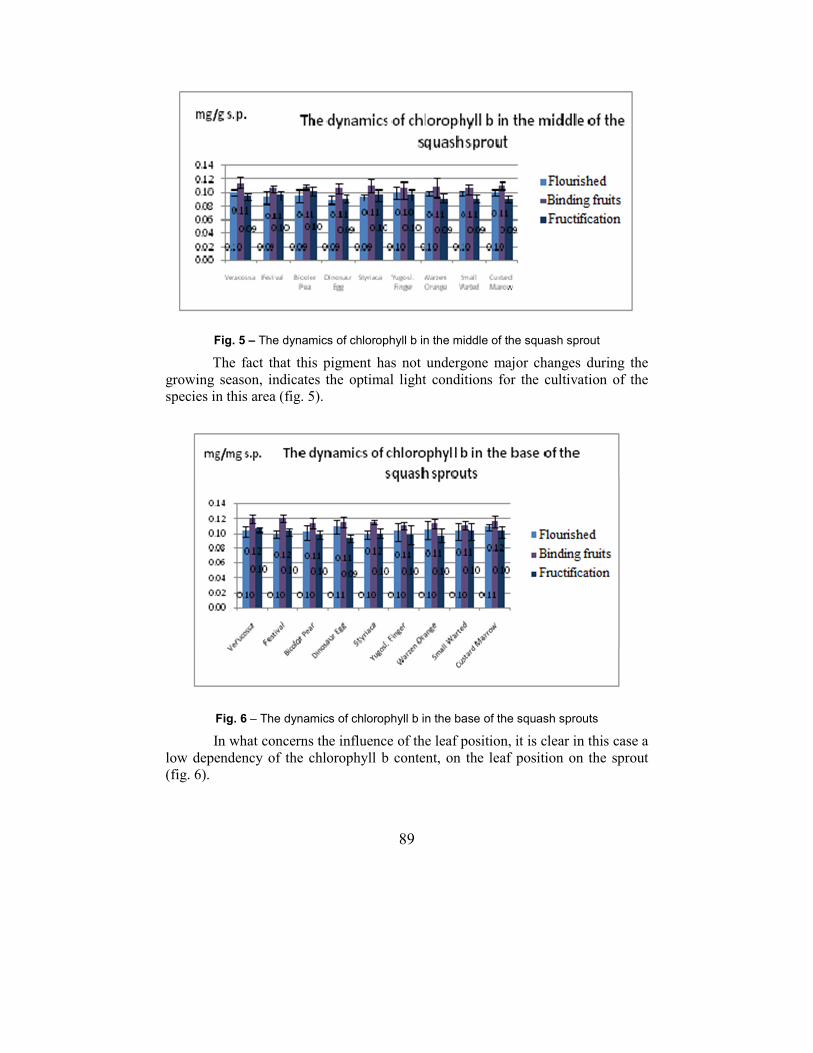
89
Fig. 5 – The dynamics of chlorophyll b in the middle of the squash sprout
The fact that this pigment has not undergone major changes during the
growing season, indicates the optimal light conditions for the cultivation of the
species in this area (fig. 5).
Fig. 6 – The dynamics of chlorophyll b in the base of the squash sprouts
In what concerns the influence of the leaf position, it is clear in this case a
low dependency of the chlorophyll b content, on the leaf position on the sprout
(fig. 6).
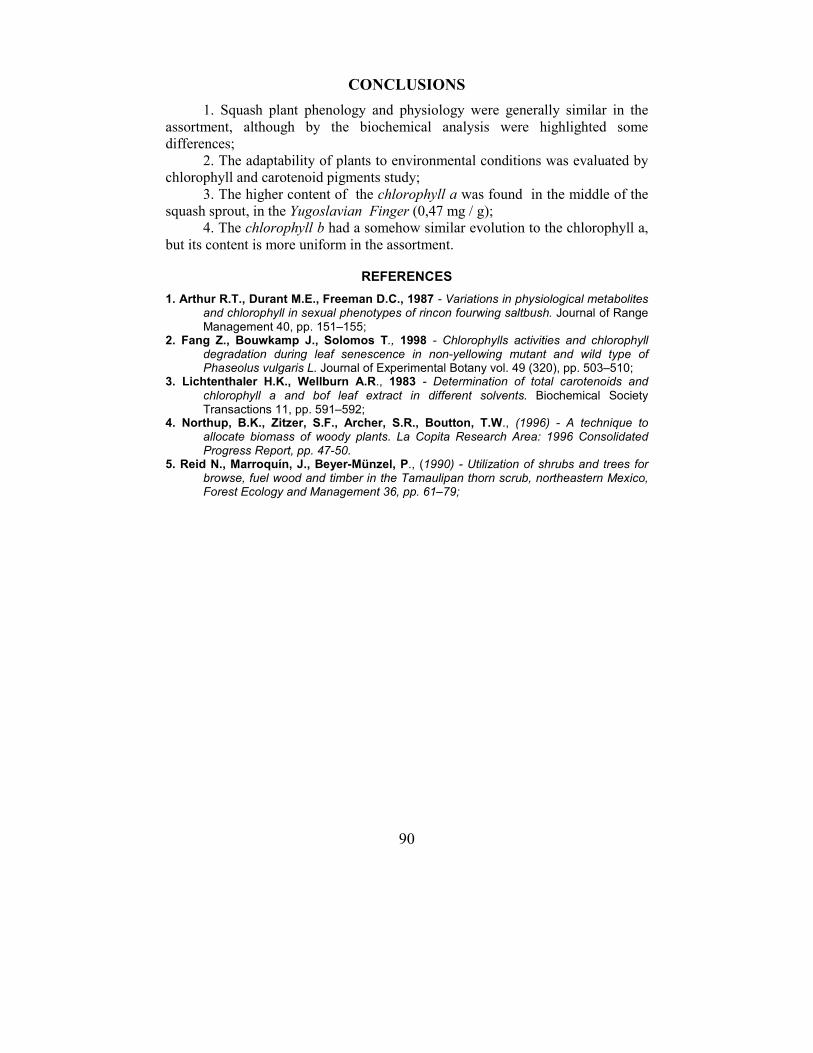
90
CONCLUSIONS
1. Squash plant phenology and physiology were generally similar in the
assortment, although by the biochemical analysis were highlighted some
differences;
2. The adaptability of plants to environmental conditions was evaluated by
chlorophyll and carotenoid pigments study;
3. The higher content of the chlorophyll a was found in the middle of the squash sprout, in the Yugoslavian Finger (0,47 mg / g);
4. The chlorophyll b had a somehow similar evolution to the chlorophyll a, but its content is more uniform in the assortment.
REFERENCES
1. Arthur R.T., Durant M.E., Freeman D.C., 1987 - Variations in physiological metabolites and chlorophyll in sexual phenotypes of rincon fourwing saltbush. Journal of Range Management 40, pp. 151–155;
2. Fang Z., Bouwkamp J., Solomos T., 1998 - Chlorophylls activities and chlorophyll degradation during leaf senescence in non-yellowing mutant and wild type of Phaseolus vulgaris L. Journal of Experimental Botany vol. 49 (320), pp. 503–510;
3. Lichtenthaler H.K., Wellburn A.R., 1983 - Determination of total carotenoids and
chlorophyll a and bof leaf extract in different solvents. Biochemical Society Transactions 11, pp. 591–592;
4. Northup, B.K., Zitzer, S.F., Archer, S.R., Boutton, T.W., (1996) - A technique to allocate biomass of woody plants. La Copita Research Area: 1996 Consolidated Progress Report, pp. 47-50.
5. Reid N., Marroquín, J., Beyer-Münzel, P., (1990) - Utilization of shrubs and trees for browse, fuel wood and timber in the Tamaulipan thorn scrub, northeastern Mexico, Forest Ecology and Management 36, pp. 61–79;

91
COMPARATIVE BEHAVIOR FOR A NEW CARROT ASSORTMENT IN THE NE AREA
COMPORTAREA ÎN CULTURĂ COMPARATIVĂ A UNUI SORTIMENT
DE MORCOV ÎN ZONA DE NORD-EST
STOLERU V.1, MUNTEANU N.1, TELIBAN G.C.1, HAMBURDĂ Silvia Brînduşa1
e-mail: [email protected]
Abstract.The purpose of this paper, is make it known for the NE area of the country, a new assortment of carrots, crossing traditional cultivars (Red Core Chantenay, Nantes) with new hybrids (Tito, Flam). The research was carried out in a Vegetable Stationary, in the climatic conditions of the Dorohoi area in Agricola Frugal farm Ltd. During the experimental period, were made observations and biometric measurements for main agro-productive properties: morphological and phenological characterization, amount of harvest and dynamics for the four cultivars. Regarding to the precocity, we can say that it ranges between 120 days (Tito F1) to 140 days Chantenay Red Core cultivar. Root length, will vary depending on the range of 14-18 cm (Chantenay Red Core) to 22 - 24 cm (Flam F1).The highest production was obtained by hybrid cultivars 34.72 t / ha at Tito and 48.15 t / ha to Flam. Key words: carrot, cultivars, yield Rezumat. Scopul lucrării de faţă este acela de a face cunoscut pentru zona de NE a ţării, un nou sortiment de morcov, combinând cultivare tradiţionale (Chantenay Red Core, Nantes) cu hibrizi noi (Tito, Flam). Cercetările au fost efectuate în cadrul unui Staţionar Legumicol Experimental, în condiţiile pedoclimatice ale zonei Dorohoi, ferma Agricola Frugal SRL. Pe parcursul perioadei experimentale s-au efectuat observaţii şi determinări biometrice pentru principalele însuşiri agroproductive: caracterizarea morfologică şi fenologică, cantitatea de recoltă şi dinamica acesteia pentru cele patru cultivare s.a. În ce priveşte precocitatea sortimentului, putem afirma că aceasta variază între 120 zile (Tito F1) până la 140 zile în cazul cultivarului Chantenay Red Core. Lungimea rădăcinii variază în funcţie de sortiment de la 14-18 cm (Chantenay Red Core) până la 22-24 cm (Flam F1). Cea mai ridicată producţie s-a înregistrat în cazul cultivarelor hibride 34,72 t/ha la Tito şi 48,15 t/ha la Flam. Cuvinte cheie: morcov, cultivare, producție
INTRODUCTION
Enhancing of vegetables production in general and organic especially
can run by providing technological measures, which involve the following
items (Dumitrescu et al., 1998; Leonte, 1997):
1 University of Agricultural Sciences and Veterinary Medicine of Iasi, Romania
92
- choosing proper land for the species to be sowing;
- choosing an appropiate cultivar that is suitable for environmental and
technological resources that can be insurance (Stoleru et al., 2012);
- compliance date of sowing, seed quantity and density, etc;
- proper maintenance;
- crop harvesting and valorisation
While promoting present vegetable growing, variety is perhaps the most
important biological factor of production, which is directly related to
ecological plasticity and consumer preference (Munteanu and Falticeanu, 2008).
At the same time, the cultivar is an element of expression biodiversity
crops, under a permanent change in the range of cultivation (Dumitrescu et al.,
1998; Hoza, 2008)
Present study submit a new assortment of carrot for high production,
which are included in the official catalog of varieties of the EU.
For evaluating the quality of carrot roots thickened was determined the
dry matter content.
The dry matter has a high importance. Every food is made up of water
and dry matter. Water, through its presence in food, determines the quality and
influence the stability of the product.
MATERIAL AND METHOD
Aim of our study was to establish the suitability of an assortment of carrot in conventional system in the conditions of Dorohoi area.
The biological material used was represented by an assortment of four cultivars of carrot: Tito, Flam, Chantenay Red Core, Nantes.
To ensure goal, was held a comparative experience as a crop we have the following objectives: morphological characterization; phenological characterization and characterization of agro productive assortment (Stan et al., 2001; Ciofu et al.,
2004). Carrot crop was established after a wheat crop. Soil preparation was
carried out in accordance with the related technologies of conventional crops, using near 400 kg of NPK. Sowing was carried out on or around 04/17/2013 using treated seed. Crop establishment was performed with a precision seeder with two rows per billon, the distance between the billons 70 cm, at a depth of 1.5 - 2 cm using a quantity 3.5 kg seed / ha.
During 2013 there were made observations and biometric measurements for achieving the general characterization of the assortment. At the end of the growing season total production was analyzed for the four carrot cultivars.
Production dates were processed by scientific methods, using analysis of variance (ANOVA), as shown by the literature (Leonte, 1997).
Determination of dry matter was made by the oven drying method at a temperature of 103 ± 2 ° C (Beceanu, 2008).
93
RESULTS AND DISCUSSION
The characterization of the assortment in the Dorohoi area A brief assortment agro biological characterization is presented in Table
1. In the assortment studied, it can be said that precocity varieties ranged from
120 days (Tito, Nantes), 130 days (Flam, Chantenay Red Core), which causes
the carrot crop conveer decrease in NE of Romania area, but in while ensuring
a concentration of production in a very short period in order to promote semi-
mechanized harvesting (Indrea et al., 2007).
Regarding to the production obtained from each cultivar, we can say
that it within biological limits, but in terms of application of technologies,
including the provision of three irrigation with rules 300 m3/ha.
The production potential varies widely from 28-32 t/ha (Chanthenay
Red Core) to 45-50 t/ha (Flam).
As for the biological characteristics of the species were traced: rosette
height (cm) and number of leaves into rosette.
Rosette height during 2013 varied in the very small limits, between 40-
45 cm (Chanteny Rred Core), 45-51 cm (Nantes), 47-52 cm (Tito), 48-55
Flam. The number of leaves from rosette varies between 17 to 21 (Chanteny
Red Core) from 21 to 24 cm (Flam).
In relation with the root form we can say that this varies from
cylindrical (Tito, Nantes) to cylindrical-conical (Flam, Chantheny Red Core).
In terms of color at maturity we can say that two cultivars are red-orange
(Flam, Chanteny Red Core), a bright orange cultivar (Tito) and an orange
cultivar (Nantes).
Regarding to the root length, this ranges from 14 to 18 cm (Chanteny
Red Core), 16-20 cm (Nantes), 20-24 cm (Tito) up to 22-24 cm (Flam).
In terms of quality, the content of dry matter varies from 9.8 (Chanteny
Red Core, Nantes) to 10.2 (Flam) to 10.3 (Tito).
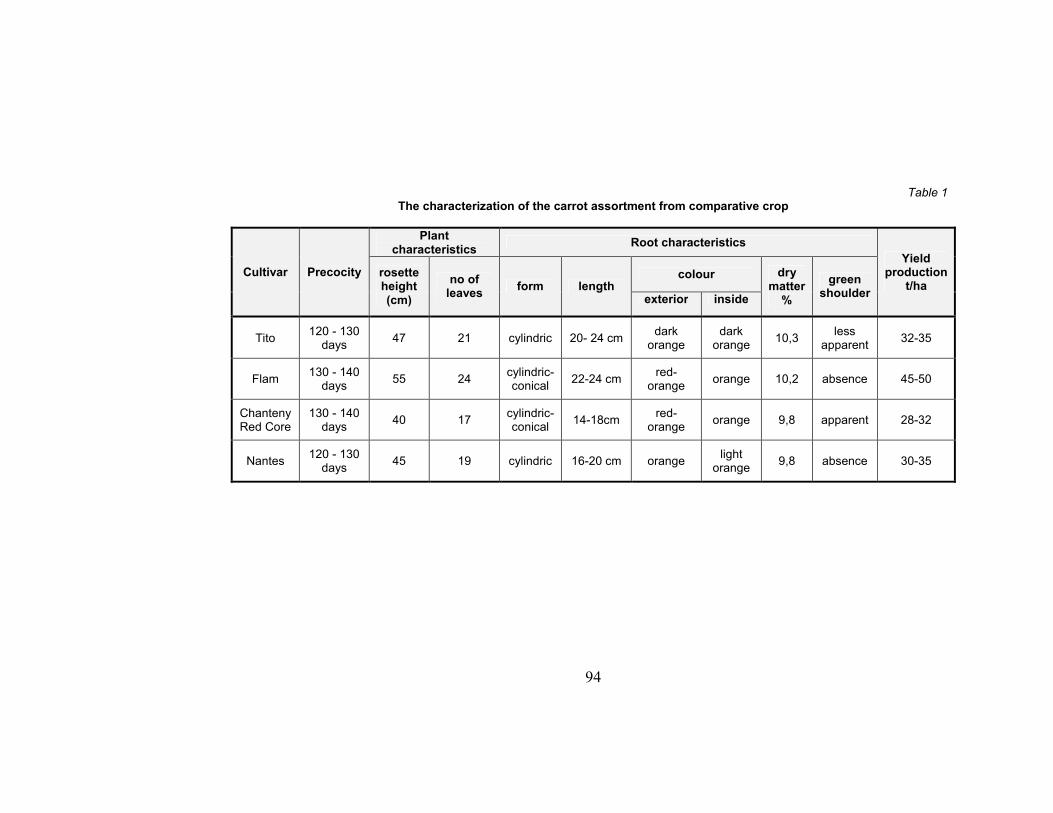
94
Table 1
The characterization of the carrot assortment from comparative crop
Cultivar Precocity
Plant characteristics
Root characteristics
Yield production
t/ha rosette height (cm)
no of leaves
form length colour dry
matter %
green shoulder
exterior inside
Tito 120 - 130
days 47 21 cylindric 20- 24 cm
dark orange
dark orange
10,3 less
apparent 32-35
Flam 130 - 140
days 55 24
cylindric-conical
22-24 cm red-
orange orange 10,2 absence 45-50
Chanteny Red Core
130 - 140 days
40 17 cylindric-conical
14-18cm red-
orange orange 9,8 apparent 28-32
Nantes 120 - 130
days 45 19 cylindric 16-20 cm orange
light orange
9,8 absence 30-35
95
Results on the total production of carrot
The total production of carrot analysed on 9/25/2013, obtained in the
conventional system, ranged from 29.46 t/ha on Chantenay Red Core variety to
48.15 t/ha in the case of hybrid Flam (Table 2). The difference compared to the
mean production from experience in this case (18.69 t/ha), is considered to be
positiv, very significant.
Chanthenay Red Core cultivar obtained the lowest production (29.46 t/ha),
the difference to the average experience (-6.67 t/ha) being negative significantly.
Negative differences from the average experience also obtained by Nantes
cultivar (-3.95 t/ha).
Cultivar Tito has achieved close to the average production experience and
production increases obtained are considered non-significant.
Table 2
Carrot production and significance of differences to control
Cultivar Production
(t/ha)
Difference to mean
(t/ha)
Relative production
(%)
Significance of
differences
Tito 34,72 -1,41 96,1 ns
Flam 48,15 12,02 133,3 ***
Chanthenay Red Core
29,46 -6,67 82,00 0
Nantes 32,18 -3,95 89,1 0
Experience mean (Control)
36,13 0 0 -
ns-non-significant LSD 5% =3,64 t/ha LSD 1% = 7,35 t/ha LSD 0,1 % =11,87 t/ha
CONCLUSIONS
The study for the carrot assortment highlight that cultivation technology
does not differ in the comparative crop in the Dorohoi conditions area, but yields
are appreciable to the upper biological potential.
From measurements made, rosette height ranged from 40 cm (Chantenay
Red Core) to 55 cm (Flam). The difference into cultivar Flam production from the
average experience (12.02 t / ha) it is considered to be positive, very significant.
Depending on the production quality, Tito cultivar presents the highest
share to preserve the winter, compared to other varieties studied, due to higher dry
matter content.
96
REFERENCES
1. Beceanu Dumitru, 2008 - Tehnologia de conservare a alimentelor. Editura PIM, Iaşi. 2. Ciofu Ruxandra, Stan N., Popescu V., Pelaghia Chilom, Apahidean S., Horgoş A.,
Berar V., Lauer K.F., Atanasiu N., 2004 - Tratat de legumicultură. Editura Ceres,
Bucureşti 3. Dumitrescu M., Scurtu I., Stoian L., Glăman Gh., Costache M., Diţu D., Roman Tr.,
Lăcătuş V., Rădoi V., Vlad C., Zăgan I., 1998 - Producerea legumelor. Editura
Bucureşti 4. Hoza Gheorghita, 2008 - Legumicultură generală. Editura Elisavaros, Bucureşti 5. Indrea D., Apahidean S. Al., Apahidean Maria, Măniuţiu D. N., Sima Rodica, 2007 –
Cultura legumelor. Editura Ceres, Bucureşti. 6. Leonte Constantin, 1997 – Ameliorarea plantelor horticole si tehnica experimentală.
Centrul de multiplicare “Ion Ionescu de la Brad”, Iaşi. 7. Munteanu N., Falticeanu Marcela, 2008 – Genetica si ameliorarea plantelor
ornamentale. Editura “Ion Ionescu de la Brad”, Iaşi. 8. Stan N., Munteanu N., 2001 - Legumicultura, vol.II. Editura “Ion Ionescu de la Brad”,
Iaşi. 9. Stoleru Vasile, Munteanu Neculai, Stoleru Carmen Maria, Rotaru Liliana, 2012 -
Cultivar Selection and Pest Control Techniques on Organic White Cabbage Yield.
Not Bot Horti Agrobo, 40(2), pp. 190-196.
97
THE INFLUENCE OF GIBBERELLIC ACID ON GROWTH AND DEVELOPMENT OF CALLAS CULTIVATED IN THE
GREENHOUSE
INFLUENȚA ACIDULUI GIBERELIC ASUPRA CREȘTERII ȘI DEZVOLTĂRII CALELOR CULTIVATE ÎN SERĂ
ARHIP (ÎNSURĂȚELU) Ioana Cristina1, DRAGHIA Lucia1
e-mail: [email protected]
Abstract. Popular plant known and used as a cut flower or as a pot plant, Calla is less pretentious to the environmental conditions and easy to grow. In this paper it is analyzed the influence of gibberellic acid (GA3) treatment on Zantedeschia (cv. 'Black Eyed - Beauty') plants grown in the greenhouse soil. Treatment with GA3 has been achieved by soaking the tubers for 30 minutes in 250 ppm solution. The start of the vegetation period and the appearance of the floral stems were favored by GA3 treatment, causing early flowering with 2-10 days. Also, the number of leaves and inflorescences increased, but the height of the plant and the floral stems was reduced. Key words: Zantedeschia, cv. ’Black – Eyed - Beauty’, gibberellic acid Rezumat. Plantă populară, cunoscută și folosită ca floare tăiată sau ca plantă la ghivece, cala este puțin pretențioasă față de condițiile de mediu și ușor de cultivat. În această lucrare este analizată influenţa tratamentelor cu acid giberelic (GA3) asupra plantelor de Zantedeschia (cv. ’Black Eyed - Beauty’), cultivate în solul serei. Tratamentul cu GA3 s-a aplicat la nivelul tuberculilor, prin îmbăierea acestora timp de 30 minute în soluţie 250 ppm. Pornirea în vegetație, și apariției tijelor florale au fost favorizate de tratamentul cu GA3,
determinând timpurietatea înfloririi cu 2-10 zile. De asemenea, a crescut numărul de inflorescenţe şi frunze formate, în schimb, s-a redus înălţimea plantelor şi a tijelor florale. Cuvinte cheie: Zantedeschia, cv. ’Black – Eyed - Beauty’, acid giberelic
INTRODUCTION
Zantedeschia (calla) is a popular ornamental plant in the international
flower market. It is cultivated as a cut flower, potted plant or as an ornamental
plant in gardens around the world and contributes to horticultural financial
income in several countries including America, Netherlands, New Zealand
(Funnell, 1993 citat de Chen, 2011; Singh, 1996).
Zantedeschia was placed in the Top 20 cut flowers sold on Dutch auction,
with over 70 million stems sold every year (Flower Council of Holland, 2005).
Callas popularity on the international flower market is due to its stylized and
distinct inflorescence and various color palettes (Singh, 1996). The inflorescence
consists of a colored spathe deployed around the spadix, which contains the real
1 University of Agricultural Sciences and Veterinary Medicine of Iaşi, Romania
98
male and female flowers. Following numerous studies conducted to date
concerning spathe color of callas, resulted a wide range of colors going from
white, yellow, red, orange, pink, cream to dark purple shades.
The genus Zantedeschia, originally from South Africa, belongs to the
family Araceae and comprises eight species distributed in two sections,
Zantedeschia and Aestivae. Section Zantedeschia consists of Z. aethiopica and Z. odorata, and Section Aestivae, also known as the "colored callas" consisting of Z. albomaculata, Z. elliotiana, Z. jucunda, Z. pentlandii, Z. rehmannii and Z valida. Z. albomaculata includes two subspecies: albomaculata and macrocarpa (Singh et
al., 1996).
In the specialized literature there are many studies regarding the increasing
production of colored callas flowers and the treatment effects with plant growth
regulators applied on Zantedeschia. (Funnell and Tjia, 1988; Corr and Widmer, 1991; Funnell et al., 1992; Dennis et al., 1994; Janowska and Krause, 2001; Janowska and
Schroeter, 2002; Janowska and Zakrzewski, 2006; Mortazavi et al., 2011). It was
nevertheless concluded that increasing the yield depends on the variety, about 120
varieties being currently recognized. The studies conducted so far has not been
shown which is the most efficient concentration of gibberellic acid for calla
treatments, used to increase productivity (Ali and Elkiey, 1995; Brooking and Cohen, 2002; Corr and Widmer, 1991; Dennis et al., 1994; Funnell et al., 1992; Funnell and Tjia, 1988; Janowska and Krause, 2001; Janowska and Schroeter, 2002; Janowska and
Zakrzewski, 2006; Reiser and Langhans, 1992; Tjia, 1987). Recommendations
concerning the concentration of GA3 solution used to treat the underground
organs of calla by soaking them are between 50 and 500 ppm (Corr and Widmer,
1991; Dennis et al., 1994; Funnell and Tjia, 1988).
MATERIAL AND METHOD
Studies were conducted during 2012 - 2014 to a calla culture, cultivar 'Black - Eyed - Beauty', established in the greenhouse soil, within the Floriculture discipline of University of Agricultural Sciences and Veterinary Medicine Iasi, Romania.
The leaves of this cultivar have upright growth, sagittal form, and many white macules and they are almost as handsome as its flowers.
The flowers that appear in late spring and maintain all summer, consist of a fine bracts (spathe), yellowish-white, wrapped around a same color spadix. A big, black, central "eye" can be seen on the inside of the spathe at the spadix based (http://www.learn2grow.com/plants/zantedeschia-black-eyed-beauty/).
Figure 1 presents some biometric data characterizing cv. 'Black - Eyed - Beauty'. The spathe has the average length of approx. 10 cm and its diameter at the upper side in fully open stage, is between 6 and 7 cm (fig. 1a). The leaves are long petiolated (stem length is 63 cm) and have a sagittal limb, with the ratio between length and width of 2.15 (28/13 cm) (fig. 1b).
As biological material for the establishment of the experimental cultures were used commercially available tubers. There were set up two experimental variants with three repetitions, the V1 variant (control) using untreated tubers and V2 variant using tubers which were treated before planting by soaking for 30 min in a solution of gibberellic acid (GA3) 250 ppm.
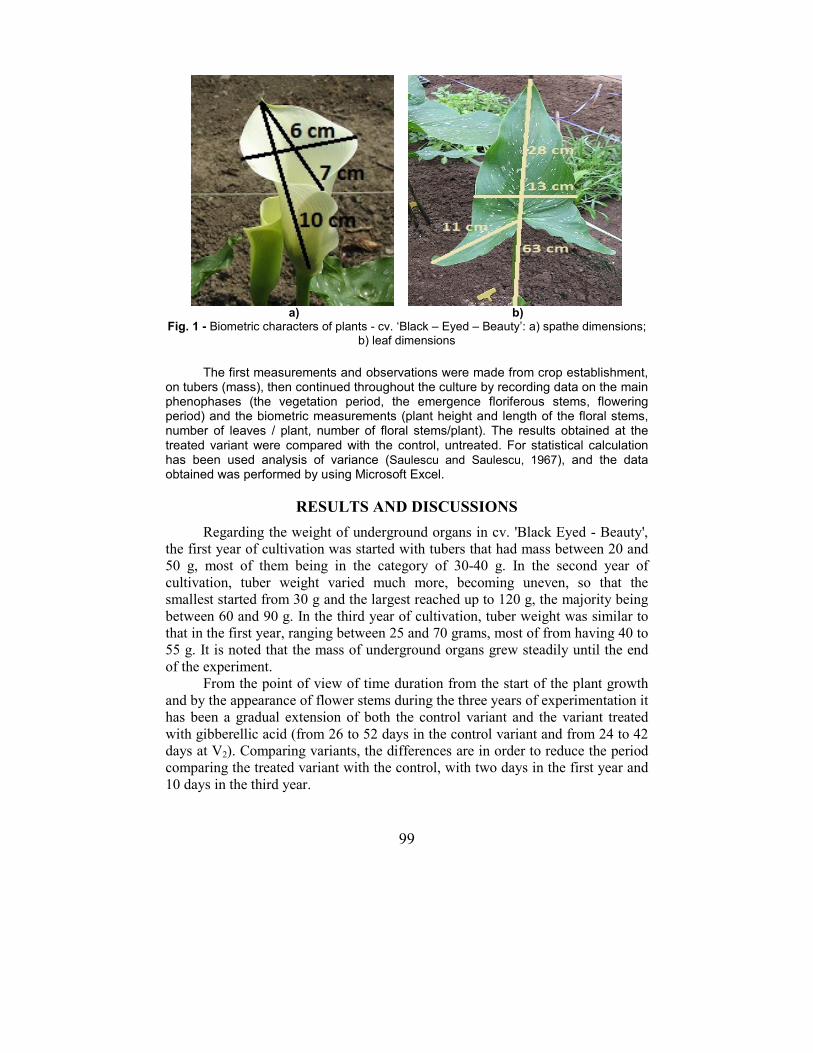
99
a) b) Fig. 1 - Biometric characters of plants - cv. ‘Black – Eyed – Beauty’: a) spathe dimensions;
b) leaf dimensions
The first measurements and observations were made from crop establishment, on tubers (mass), then continued throughout the culture by recording data on the main phenophases (the vegetation period, the emergence floriferous stems, flowering period) and the biometric measurements (plant height and length of the floral stems, number of leaves / plant, number of floral stems/plant). The results obtained at the treated variant were compared with the control, untreated. For statistical calculation has been used analysis of variance (Saulescu and Saulescu, 1967), and the data obtained was performed by using Microsoft Excel.
RESULTS AND DISCUSSIONS
Regarding the weight of underground organs in cv. 'Black Eyed - Beauty',
the first year of cultivation was started with tubers that had mass between 20 and
50 g, most of them being in the category of 30-40 g. In the second year of
cultivation, tuber weight varied much more, becoming uneven, so that the
smallest started from 30 g and the largest reached up to 120 g, the majority being
between 60 and 90 g. In the third year of cultivation, tuber weight was similar to
that in the first year, ranging between 25 and 70 grams, most of from having 40 to
55 g. It is noted that the mass of underground organs grew steadily until the end
of the experiment.
From the point of view of time duration from the start of the plant growth
and by the appearance of flower stems during the three years of experimentation it
has been a gradual extension of both the control variant and the variant treated
with gibberellic acid (from 26 to 52 days in the control variant and from 24 to 42
days at V2). Comparing variants, the differences are in order to reduce the period
comparing the treated variant with the control, with two days in the first year and
10 days in the third year.
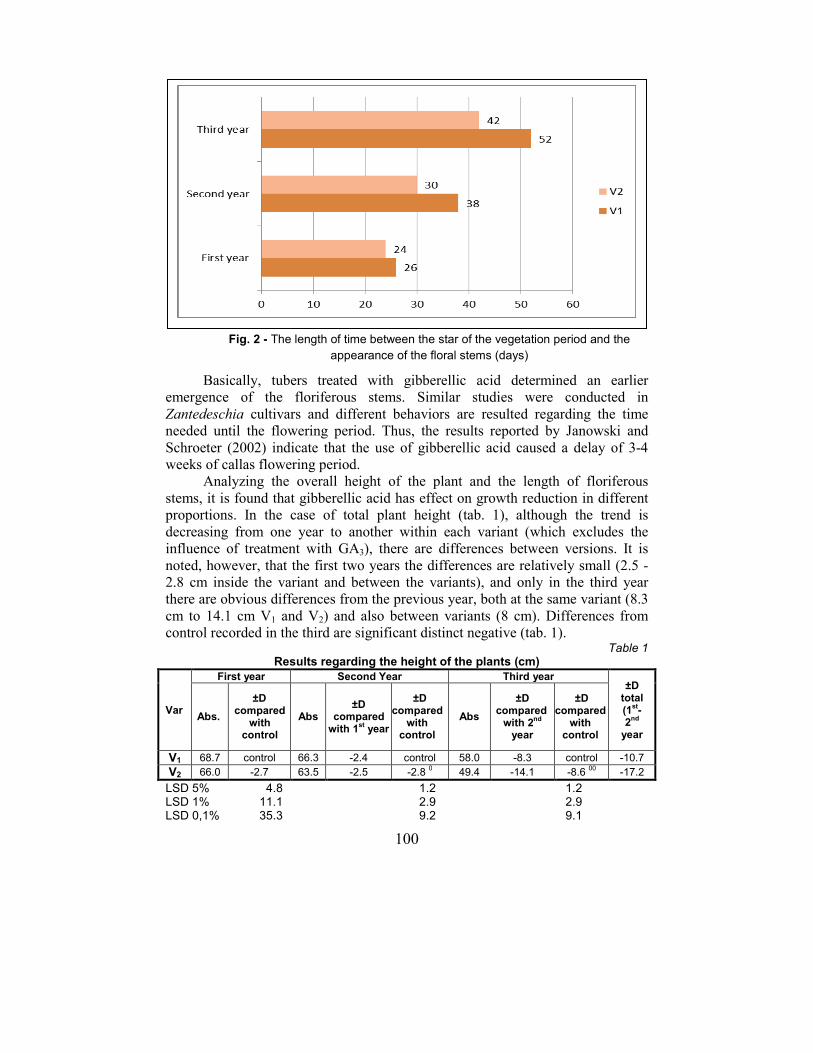
100
Basically, tubers treated with gibberellic acid determined an earlier
emergence of the floriferous stems. Similar studies were conducted in
Zantedeschia cultivars and different behaviors are resulted regarding the time
needed until the flowering period. Thus, the results reported by Janowski and
Schroeter (2002) indicate that the use of gibberellic acid caused a delay of 3-4
weeks of callas flowering period.
Analyzing the overall height of the plant and the length of floriferous
stems, it is found that gibberellic acid has effect on growth reduction in different
proportions. In the case of total plant height (tab. 1), although the trend is
decreasing from one year to another within each variant (which excludes the
influence of treatment with GA3), there are differences between versions. It is
noted, however, that the first two years the differences are relatively small (2.5 -
2.8 cm inside the variant and between the variants), and only in the third year
there are obvious differences from the previous year, both at the same variant (8.3
cm to 14.1 cm V1 and V2) and also between variants (8 cm). Differences from
control recorded in the third are significant distinct negative (tab. 1). Table 1
Results regarding the height of the plants (cm)
Var
First year Second Year Third year ±D
total (1
st-
2nd
year
Abs.
±D compared
with control
Abs ±D
compared with 1
st year
±D compared
with control
Abs
±D compared
with 2nd
year
±D compared
with control
V1 68.7 control 66.3 -2.4 control 58.0 -8.3 control -10.7
V2 66.0 -2.7 63.5 -2.5 -2.8 0 49.4 -14.1 -8.6 00 -17.2
LSD 5% 4.8 1.2 1.2 LSD 1% 11.1 2.9 2.9 LSD 0,1% 35.3 9.2 9.1
Fig. 2 - The length of time between the star of the vegetation period and the
appearance of the floral stems (days)
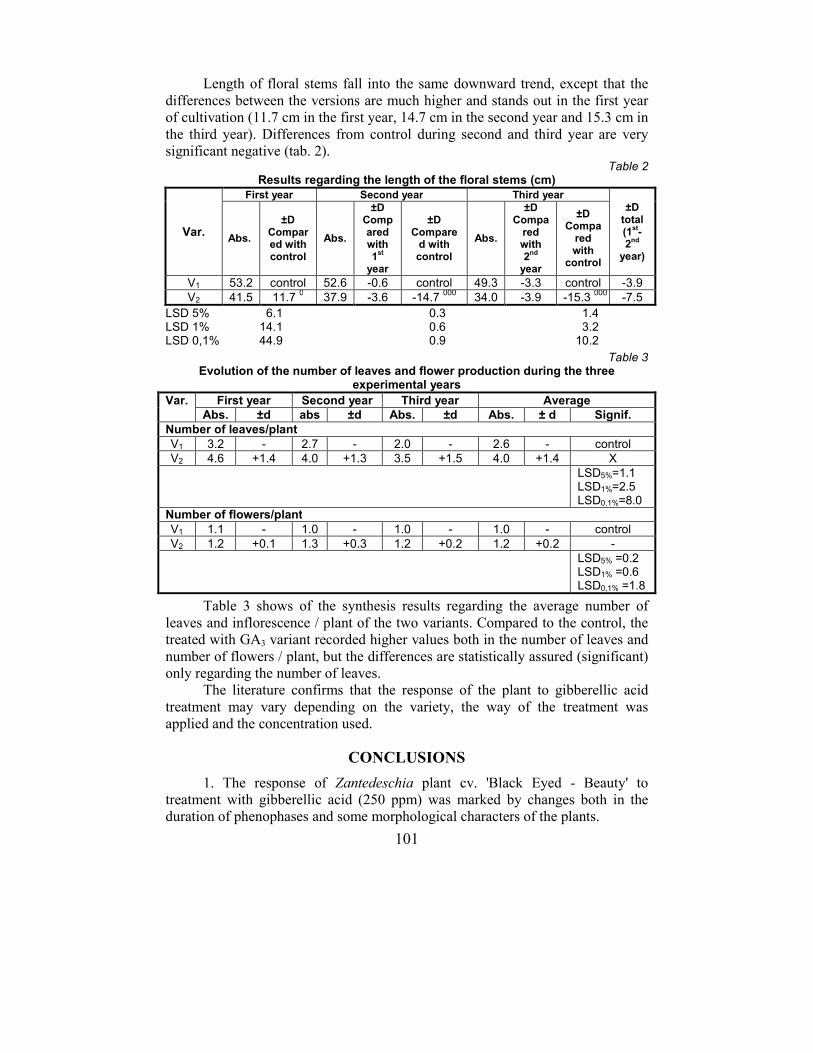
101
Length of floral stems fall into the same downward trend, except that the
differences between the versions are much higher and stands out in the first year
of cultivation (11.7 cm in the first year, 14.7 cm in the second year and 15.3 cm in
the third year). Differences from control during second and third year are very
significant negative (tab. 2). Table 2
Results regarding the length of the floral stems (cm)
Var.
First year Second year Third year ±D
total (1
st-
2nd
year)
Abs.
±D Compared with control
Abs.
±D Compared with 1
st
year
±D Compare
d with control
Abs.
±D Compa
red with 2
nd
year
±D Compa
red with
control
V1 53.2 control 52.6 -0.6 control 49.3 -3.3 control -3.9 V2 41.5 11.7
0 37.9 -3.6 -14.7
000 34.0 -3.9 -15.3
000 -7.5
LSD 5% 6.1 0.3 1.4 LSD 1% 14.1 0.6 3.2 LSD 0,1% 44.9 0.9 10.2
Table 3 Evolution of the number of leaves and flower production during the three
experimental years
Var. First year Second year Third year Average
Abs. ±d abs ±d Abs. ±d Abs. ± d Signif.
Number of leaves/plant
V1 3.2 - 2.7 - 2.0 - 2.6 - control V2 4.6 +1.4 4.0 +1.3 3.5 +1.5 4.0 +1.4 X
LSD5%=1.1 LSD1%=2.5 LSD0,1%=8.0
Number of flowers/plant
V1 1.1 - 1.0 - 1.0 - 1.0 - control V2 1.2 +0.1 1.3 +0.3 1.2 +0.2 1.2 +0.2 -
LSD5% =0.2 LSD1% =0.6 LSD0,1% =1.8
Table 3 shows of the synthesis results regarding the average number of
leaves and inflorescence / plant of the two variants. Compared to the control, the
treated with GA3 variant recorded higher values both in the number of leaves and
number of flowers / plant, but the differences are statistically assured (significant)
only regarding the number of leaves.
The literature confirms that the response of the plant to gibberellic acid
treatment may vary depending on the variety, the way of the treatment was
applied and the concentration used.
CONCLUSIONS
1. The response of Zantedeschia plant cv. 'Black Eyed - Beauty' to
treatment with gibberellic acid (250 ppm) was marked by changes both in the
duration of phenophases and some morphological characters of the plants.
102
2. Treatment of tubers determined the earlier emergence of the floriferous
stems up to 10 days.
3. Plant height, including floriferous stems was reduced under the influence
of GA3. The most obvious was the reduction of the floriferous stems length (with
approx. 15 cm from the control).
4. GA3 favored the formation of leaves and inflorescences, but the
differences were statistically assured only in the number of leaves / plant.
REFERENCES
1. Ali Y.S., Elkiey T., 1995 - Effect of chloromequat and GA3 on growth and flowering of calla (Zantedeschia rehmanii). J. King Saud Univ. Agric. Sci. 7(2), pp. 271–282.
2. Brooking J.R., Cohen D., 2002 - Gibberellin-induced flowering in small tubers of Zantedeschia ‘Black Magic’. Scientia Hortic. 95, pp. 63–67. http://dx.doi.org/10.1016/S0304-4238(02)00018-3
3. Chen J., 2011 - The Physiology and Control of Re-greening in Spathes of Zantedeschia. Massey University, Palmerston North, New Zeeland (teză de doctorat)
4. Corr B.E., Widmer R.E., 1991 - Paclobutrazol, gibberellic acid and rhizome size affect growth and flowering of Zantedeschia. Hort Science, 26, pp. 133–135
5. Dennis D., Doreen D.J., Ohteki T., 1994 - Effect of a gibberellic acid ‘quick-dip’ and storage on the yield and quality of blooms from hybrid Zantedeschia tubers. Scientia Horticulturae, 57, pp. 133–142.
6. Funnell K.A., MacKay B.R., Lawoko C.R.O., 1992 - Comparative effects of promalin and GA3 on flowering and development of Zantedeschia ‘Galaxy’. Acta Hort. 292, pp. 173–179.
7. Funnell K.A., Tjia B.O., 1988 - Effect of storage temperature, duration and gibberellic acid on the flowering of Zantedeschia elliottiana and Z. ‘Pink Satin’. Journal of the American Society for Horticultural Science, 113, pp. 860–863
8. Janowska B., Schroeter A., 2002 - The influences of gibberellic acid on flowering of Zantedeschia elliottiana (W. Wats.) Engl. ‘Black Magic’. Zeszyty Problemowe Postępów Nauk Rolniczych, 483, pp. 93–99.
9. Janowska B., Zakrzewski P., 2006 - The effect of gibberellic acid and rhizome treatment on flowering of calla lily (Zantedeschia Spreng.). Zeszyty Problemowe Postępów Nauk Rolniczych, 510, pp. 223–233.
10. Janowska B., Krause J., 2001 - The influence of tuber treatment by gibberellic acid on the flowering of Zantedeschia, Roczniki Akademii Rolniczej w Poznaniu. Ogrodnictwo, 33, pp. 61–67.
11. Mortazavi N., Naderi R. A., Majidian N., Naderi B. and Yavar Sharafi Y., 2011 - The effect of GA3 and BA on the quantitative and qualitative characteristics of calla lily (Zantedeschia aethiopica cv. Childsiana). African Journal of Microbiology Research Vol. 5(24), pp. 4190-4196.
12. Reiser R.A., Langhans R.W., 1992 - Cultivation of Zantedeschia species for potted plant production. Acta Hortic. 337, pp. 87–94.
13. Săulescu N. A., Săulescu N. N., 1967 – Câmpul de experiență. Ed. Agro Silvică, București.
14. Singh Y., 1996 - Contributions to the systematics of the genus Zantedeschia spreng. (Araceae), University of Pretoria, Pretoria (teză de masterat)
15. Singh Y., Van Wyk A.E. and Baijnath H., 1996 - Taxonomic notes on the genus Zantedeschia Spreng. (Araceae) in southern Africa. S. Afr. J. Bot. 62(6), pp. 321-324.
16. Tjia B., 1987 - Growth regulator effect on growth and flowering of Zantedeschia rehmanii. HortScience, 22, pp. 507–508.
17. *** http://www.learn2grow.com/plants/zantedeschia-black-eyed-beauty/.
103
THE INFLUENCE OF THE CUTTINGS EPOCH REGARDING THE ROOTING AT ASTER NOVAE-ANGLIAE
SPECIES
INFLUENȚA EPOCII DE BUTĂȘIRE ASUPRA ÎNRĂDĂCINĂRII BUTAȘILOR DE ASTER NOVAE-ANGLIAE
MURARIU (COJOCARIU) Mirela
1, DRAGHIA Lucia
1 e-mail: [email protected]
Abstract. Species originating in North America (southern Canada, eastern and
central USA) Aster novae-angliae L. (Symphyotrichum novae-angliae (L.) G.L.
Nesom), was introduced in Europe as an ornamental species, which became
naturalized in many countries, including Romania. Perennial and hemicriptophyte
plant, it can multiply both by seed or vegetative way. This paper aims to study the
propagation by plants cuttings from three local populations of Aster novae-angliae
identified in individual gardens from NE area of Romania, respectively in Suceava
and Botosani counties. There were made four types of stem cuttings (simple peak
cuttings, simple cuttings of stem sections with a node, simple cuttings of stem
sections with 3-5 nodes, cuttings with heel) in two epochs, using cuttings
characterized by different degree of tissues maturations (herbaceous and semi-
lignified). The results showed that for aster plants from Marginea population
are effective herbaceous cuttings, for Humoreni population are effective the
herbaceous cuttings of stem sections with one or more nodes, or semi-lignified
cuttings with heel, and for Darabani population are effective especially
herbaceous cuttings with heel.
Key words: Aster novae-angliae, vegetative propagation, cuttings, the cuttings
epoch
Rezumat. Specie originară din America de Nord (sudul Canadei, estul și centrul
SUA), Aster novae-angliae L. (Symphyotrichum novae-angliae (L.) G.L.Nesom) a
fost introdusă în Europa ca specie ornamentală devenind naturalizată în mai multe
țări, printre care și România. Plantă perenă, hemicriptofită, se înmulțește atât prin
semințe, cât și pe cale vegetativă. Lucrarea are ca scop studiul capacităţii de
înmulţire prin butaşi a plantelor aparţinând a trei populaţii locale de Aster
novae-angliae identificate în grădini individuale din zona de NE a României,
respectiv din judeţele Suceava şi Botoşani. S-au confecţionat patru tipuri de
butaşi de tulpină (simpli de vârf, simpli din tronsoane de tulpină cu un nod,
simpli din tronsoane de tulpină cu 3-5 noduri, cu călcâi), în două epoci,
folosindu-se butaşi caracterizaţi prin gradul diferit de maturare a ţesuturilor
(erbacei şi semilignificaţi). Rezultatele obţinute au demonstrat faptul că pentru
plantele de aster din populaţia de Marginea este eficientă folosirea butăşilor
erbacei, pentru cele din populaţia de Humoreni butaşii erbacei din tronsoane
de tulpină cu unul sau mai multe noduri, sau butaşi semilignificaţi cu călcâi, iar
pentru cele din populaţia de Darabani, mai ales butaşii erbacei cu călcâi.
Cuvinte cheie: Aster novae-angliae, înmulțire vegetativă, butași, epoca de butășire
1 University of Agricultural Sciences and Veterinary Medicine of Iasi, Romania
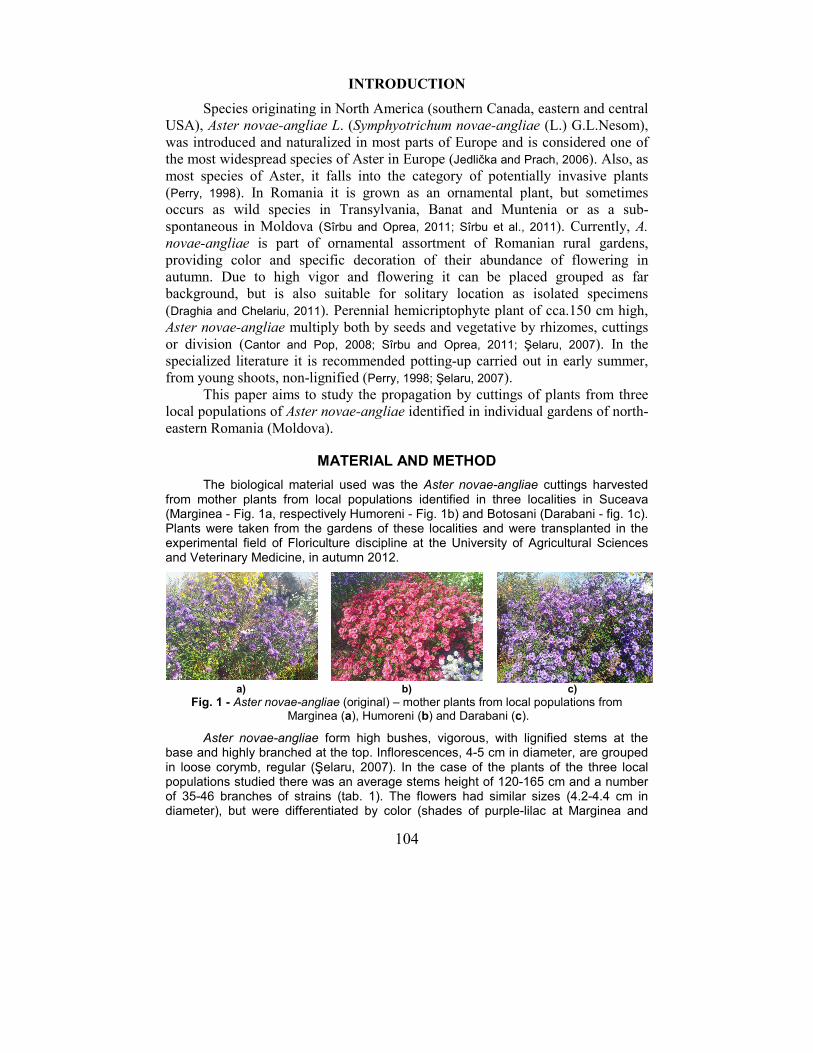
104
INTRODUCTION
Species originating in North America (southern Canada, eastern and central
USA), Aster novae-angliae L. (Symphyotrichum novae-angliae (L.) G.L.Nesom),
was introduced and naturalized in most parts of Europe and is considered one of
the most widespread species of Aster in Europe (Jedlička and Prach, 2006). Also, as
most species of Aster, it falls into the category of potentially invasive plants
(Perry, 1998). In Romania it is grown as an ornamental plant, but sometimes
occurs as wild species in Transylvania, Banat and Muntenia or as a sub-
spontaneous in Moldova (Sîrbu and Oprea, 2011; Sîrbu et al., 2011). Currently, A.
novae-angliae is part of ornamental assortment of Romanian rural gardens,
providing color and specific decoration of their abundance of flowering in
autumn. Due to high vigor and flowering it can be placed grouped as far
background, but is also suitable for solitary location as isolated specimens
(Draghia and Chelariu, 2011). Perennial hemicriptophyte plant of cca.150 cm high,
Aster novae-angliae multiply both by seeds and vegetative by rhizomes, cuttings
or division (Cantor and Pop, 2008; Sîrbu and Oprea, 2011; Şelaru, 2007). In the
specialized literature it is recommended potting-up carried out in early summer,
from young shoots, non-lignified (Perry, 1998; Şelaru, 2007).
This paper aims to study the propagation by cuttings of plants from three
local populations of Aster novae-angliae identified in individual gardens of north-
eastern Romania (Moldova).
MATERIAL AND METHOD
The biological material used was the Aster novae-angliae cuttings harvested from mother plants from local populations identified in three localities in Suceava (Marginea - Fig. 1a, respectively Humoreni - Fig. 1b) and Botosani (Darabani - fig. 1c). Plants were taken from the gardens of these localities and were transplanted in the experimental field of Floriculture discipline at the University of Agricultural Sciences and Veterinary Medicine, in autumn 2012.
a) b) c)
Fig. 1 - Aster novae-angliae (original) – mother plants from local populations from Marginea (a), Humoreni (b) and Darabani (c).
Aster novae-angliae form high bushes, vigorous, with lignified stems at the base and highly branched at the top. Inflorescences, 4-5 cm in diameter, are grouped in loose corymb, regular (Şelaru, 2007). In the case of the plants of the three local populations studied there was an average stems height of 120-165 cm and a number of 35-46 branches of strains (tab. 1). The flowers had similar sizes (4.2-4.4 cm in diameter), but were differentiated by color (shades of purple-lilac at Marginea and
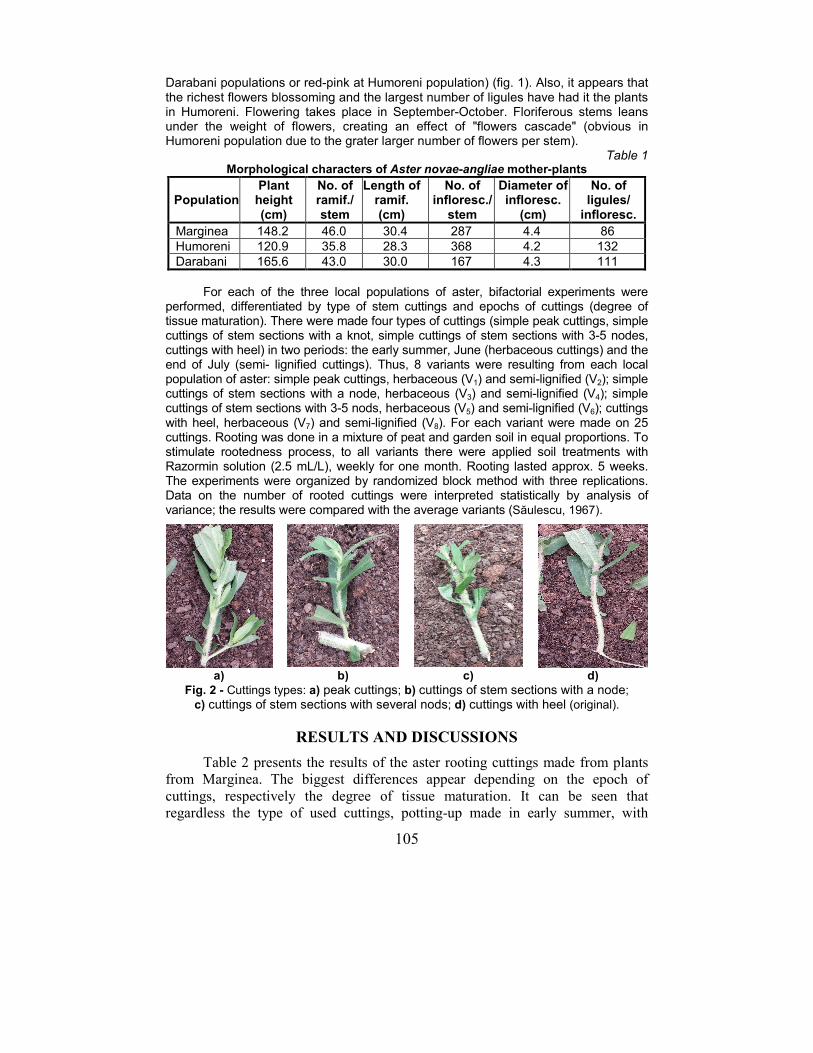
105
Darabani populations or red-pink at Humoreni population) (fig. 1). Also, it appears that the richest flowers blossoming and the largest number of ligules have had it the plants in Humoreni. Flowering takes place in September-October. Floriferous stems leans under the weight of flowers, creating an effect of "flowers cascade" (obvious in Humoreni population due to the grater larger number of flowers per stem).
Table 1 Morphological characters of Aster novae-angliae mother-plants
Population Plant
height (cm)
No. of ramif./ stem
Length of ramif. (cm)
No. of infloresc./
stem
Diameter of infloresc.
(cm)
No. of ligules/
infloresc.
Marginea 148.2 46.0 30.4 287 4.4 86 Humoreni 120.9 35.8 28.3 368 4.2 132 Darabani 165.6 43.0 30.0 167 4.3 111
For each of the three local populations of aster, bifactorial experiments were
performed, differentiated by type of stem cuttings and epochs of cuttings (degree of tissue maturation). There were made four types of cuttings (simple peak cuttings, simple cuttings of stem sections with a knot, simple cuttings of stem sections with 3-5 nodes, cuttings with heel) in two periods: the early summer, June (herbaceous cuttings) and the end of July (semi- lignified cuttings). Thus, 8 variants were resulting from each local population of aster: simple peak cuttings, herbaceous (V1) and semi-lignified (V2); simple cuttings of stem sections with a node, herbaceous (V3) and semi-lignified (V4); simple cuttings of stem sections with 3-5 nods, herbaceous (V5) and semi-lignified (V6); cuttings with heel, herbaceous (V7) and semi-lignified (V8). For each variant were made on 25 cuttings. Rooting was done in a mixture of peat and garden soil in equal proportions. To stimulate rootedness process, to all variants there were applied soil treatments with Razormin solution (2.5 mL/L), weekly for one month. Rooting lasted approx. 5 weeks. The experiments were organized by randomized block method with three replications. Data on the number of rooted cuttings were interpreted statistically by analysis of variance; the results were compared with the average variants (Săulescu, 1967).
a) b) c) d)
Fig. 2 - Cuttings types: a) peak cuttings; b) cuttings of stem sections with a node; c) cuttings of stem sections with several nods; d) cuttings with heel (original).
RESULTS AND DISCUSSIONS
Table 2 presents the results of the aster rooting cuttings made from plants
from Marginea. The biggest differences appear depending on the epoch of
cuttings, respectively the degree of tissue maturation. It can be seen that
regardless the type of used cuttings, potting-up made in early summer, with
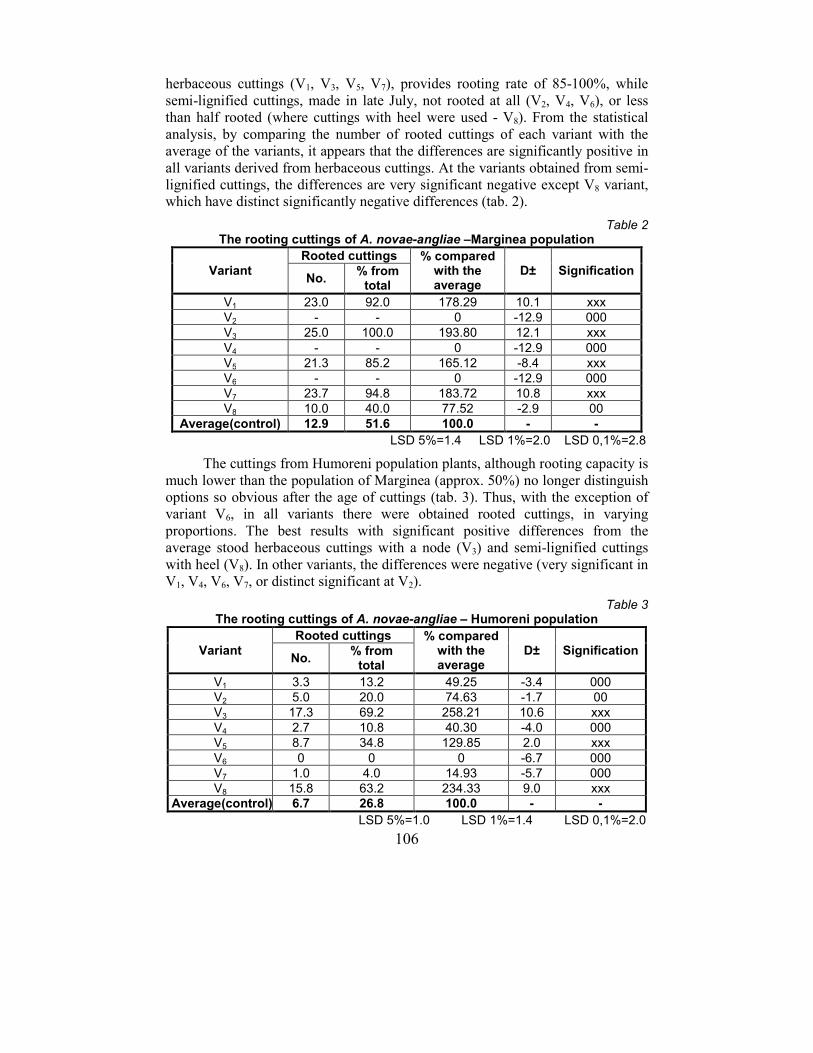
106
herbaceous cuttings (V1, V3, V5, V7), provides rooting rate of 85-100%, while
semi-lignified cuttings, made in late July, not rooted at all (V2, V4, V6), or less
than half rooted (where cuttings with heel were used - V8). From the statistical
analysis, by comparing the number of rooted cuttings of each variant with the
average of the variants, it appears that the differences are significantly positive in
all variants derived from herbaceous cuttings. At the variants obtained from semi-
lignified cuttings, the differences are very significant negative except V8 variant,
which have distinct significantly negative differences (tab. 2).
Table 2 The rooting cuttings of A. novae-angliae –Marginea population
Variant Rooted cuttings % compared
with the average
D± Signification No.
% from total
V1 23.0 92.0 178.29 10.1 xxx V2 - - 0 -12.9 000 V3 25.0 100.0 193.80 12.1 xxx V4 - - 0 -12.9 000 V5 21.3 85.2 165.12 -8.4 xxx V6 - - 0 -12.9 000 V7 23.7 94.8 183.72 10.8 xxx V8 10.0 40.0 77.52 -2.9 00
Average(control) 12.9 51.6 100.0 - -
LSD 5%=1.4 LSD 1%=2.0 LSD 0,1%=2.8
The cuttings from Humoreni population plants, although rooting capacity is
much lower than the population of Marginea (approx. 50%) no longer distinguish
options so obvious after the age of cuttings (tab. 3). Thus, with the exception of
variant V6, in all variants there were obtained rooted cuttings, in varying
proportions. The best results with significant positive differences from the
average stood herbaceous cuttings with a node (V3) and semi-lignified cuttings
with heel (V8). In other variants, the differences were negative (very significant in
V1, V4, V6, V7, or distinct significant at V2).
Table 3 The rooting cuttings of A. novae-angliae – Humoreni population
Variant Rooted cuttings % compared
with the average
D± Signification No.
% from total
V1 3.3 13.2 49.25 -3.4 000 V2 5.0 20.0 74.63 -1.7 00 V3 17.3 69.2 258.21 10.6 xxx V4 2.7 10.8 40.30 -4.0 000 V5 8.7 34.8 129.85 2.0 xxx V6 0 0 0 -6.7 000 V7 1.0 4.0 14.93 -5.7 000 V8 15.8 63.2 234.33 9.0 xxx
Average(control) 6.7 26.8 100.0 - -
LSD 5%=1.0 LSD 1%=1.4 LSD 0,1%=2.0
107
At the aster population from Darabani (tab. 4), the average number of
rooted cuttings is intermediate to those of the population from Humoreni and
Marginea. The results show a behavior closer to the Marginea population in the
sense that the June potting-up is more effective. The best rooting percentage
(100%), however they had the herbaceous cuttings with heel (V7).
Table 4 The rooting cuttings of A. novae-angliae – Darabani population
Variant
Rooted cuttings % compared with the average
D± Signification No.
% from total
V1 16.7 66.8 179.57 7.4 xxx V2 0 0 0 -9.3 000 V3 10.9 43.6 115.05 1.4 xxx V4 0 0 0 -9.3 000 V5 4.7 18.8 50.54 -4.6 000 V6 7.1 28.4 78.49 -2.0 000 V7 25.0 100.0 268.82 15.7 xxx V8 10.0 40.0 107.53 0.7 -
Average (control)
9.3 37.2 100.0 - -
LSD 5%=0.7 LSD 1%=1.0 LSD 0,1%=1.4
From the graphical representation of the results summarizing the
percentage of rooted cuttings according to origin and type of cuttings, it can be
seen that in the case herbaceous cuttings, made in June, those coming from the
Marginea responded favorably to all types of cuttings, rooting more than 85%. At
the plants from Darabani, there are highlighted only the heel cuttings (rooting 100%) and partly the peak cuttings (rooting approx. 66%). For aster plants from
Humoreni, there may be used cuttings of sections with a single node, which had
rooting rate of 69.2% (fig. 3).
92
13,2
66,8
100
69,2
43,6
85,2
34,8
18,8
94,8
4
100
0
20
40
60
80
100
Marginea Humoreni Darabani
peak cuttings
cuttings of stem sections with
a node
cuttings of stem sections with
3-5 nodes
cuttings with heel
Fig. 3 - The rooting of herbaceous cuttings (after origin and manufacturing method) %
For July potting-up with semi-lignified cuttings (fig. 4), there are
recommended only cuttings with heel, especially at plants from Humoreni
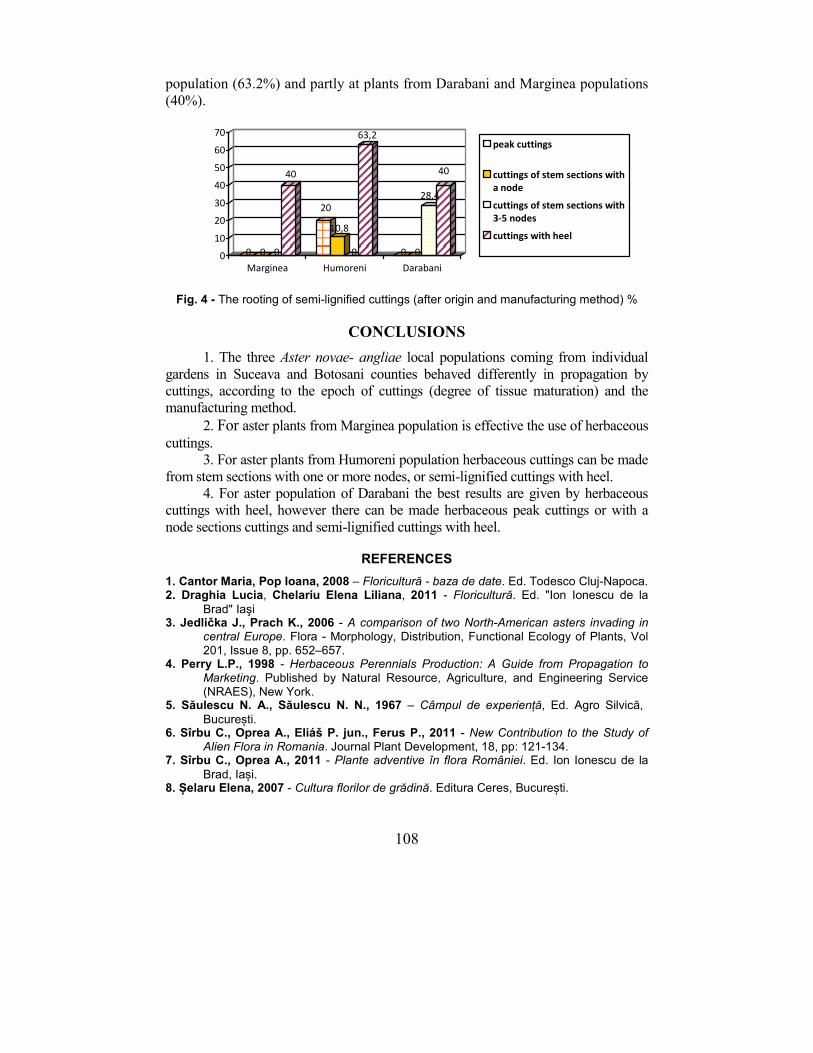
108
population (63.2%) and partly at plants from Darabani and Marginea populations
(40%).
0 0 0
40
20
10,8
0
63,2
0 0
28,4
40
0
10
20
30
40
50
60
70
Marginea Humoreni Darabani
peak cuttings
cuttings of stem sections with
a node
cuttings of stem sections with
3-5 nodes
cuttings with heel
Fig. 4 - The rooting of semi-lignified cuttings (after origin and manufacturing method) %
CONCLUSIONS
1. The three Aster novae- angliae local populations coming from individual
gardens in Suceava and Botosani counties behaved differently in propagation by
cuttings, according to the epoch of cuttings (degree of tissue maturation) and the
manufacturing method.
2. For aster plants from Marginea population is effective the use of herbaceous cuttings.
3. For aster plants from Humoreni population herbaceous cuttings can be made
from stem sections with one or more nodes, or semi-lignified cuttings with heel.
4. For aster population of Darabani the best results are given by herbaceous
cuttings with heel, however there can be made herbaceous peak cuttings or with a
node sections cuttings and semi-lignified cuttings with heel.
REFERENCES
1. Cantor Maria, Pop Ioana, 2008 – Floricultură - baza de date. Ed. Todesco Cluj-Napoca. 2. Draghia Lucia, Chelariu Elena Liliana, 2011 - Floricultură. Ed. "Ion Ionescu de la
Brad" Iaşi 3. Jedlička J., Prach K., 2006 - A comparison of two North-American asters invading in
central Europe. Flora - Morphology, Distribution, Functional Ecology of Plants, Vol 201, Issue 8, pp. 652–657.
4. Perry L.P., 1998 - Herbaceous Perennials Production: A Guide from Propagation to Marketing. Published by Natural Resource, Agriculture, and Engineering Service (NRAES), New York.
5. Săulescu N. A., Săulescu N. N., 1967 – Câmpul de experiență, Ed. Agro Silvică, București.
6. Sîrbu C., Oprea A., Eliáš P. jun., Ferus P., 2011 - New Contribution to the Study of Alien Flora in Romania. Journal Plant Development, 18, pp: 121-134.
7. Sîrbu C., Oprea A., 2011 - Plante adventive în flora României. Ed. Ion Ionescu de la Brad, Iași.
8. Șelaru Elena, 2007 - Cultura florilor de grădină. Editura Ceres, București.
109
STUDY ON IMPROVEMENT OF PRODUCTION TECHNOLOGY BY GRAFTED WALNUT SEEDLINGS
STUDIU PRIVIND ÎMBUNĂTĂŢIREA TEHNOLOGIEI DE
PRODUCERE A MATERIALULUI SADITOR PRIN ALTOIRE LA NUC
ISTRATE M.1, FLOREA M.
1, DASCALU M.
1,
e-mail: [email protected]
Abstract: The study was conducted during 2011-2013, in the climatic conditions in the Baltati region, Iasi County. The settings up of the field was done using direct seeding in the field in protected conditions (solar tunnel) using walnuts from current year production and have not undergone any treatment to stimulate germination before sowing. Seeding distance was 75 cm between rows and 10 cm on the row and sowing depth was 5 cm. For grafting was used chip budding method, grafting into two periods: August 2012 (the sleeping bud) and April 2013 (the growing bud). For grafting in August, graft branches were used, which were shaped in two different moments: removing leaves and stems, keeping a portion of 2 cm, make two months before harvesting the graft branches (V1) and trimming the leaves graft branches at harvest (V2). For grafting in April were used branches harvested in late autumn and stored over winter in deposits setpoints 2-4 ◦C (V3). The walnut germintion percentage was 61.4%, with grafting procentage of 67.8% (V1), 30.2% (V2) and 48.8% (V3) and the percentage of grafted trees STAS was 26% at Anica variety and 59% at Prezident variety. Key words: Walnut, variety, grafting, chip budding, greenhouses. Rezumat: Studiul a fost efectuat în perioada 2011-2013, în condiţiile pedoclimatice din zona Baltaţi, judetul Iaşi. Înfiiţarea câmpului I s-a realizat prin semănat direct în câmp, în condiţii protejate (solar de tip tunel) Nucile folosite provin din producţia din anul curent şi nu au fost supuse niciunui tratament pentru stimularea germinaţiei înainte de semănat. Distanţa de semănare a fost de 75 cm între rânduri şi 10 cm pe rând iar adâncimea de semănat a fost de 5 cm. Pentru altoire a fost utilizată medoda chip budding, în două perioade de altoire: august 2012 (cu mugur dormind) şi aprilie 2013 (cu mugur crescând). Pentru altoirea din august s-au folosit ramuri altoi, care au fost fasonate în două momente diferite: înlăturarea frunzelor şi menţinerea unei porţiuni de peţiol de 2 cm, efectuată cu o lună înainte de recoltarea ramurilor altoi (V1) şi respectiv, fasonarea frunzelor în momentul recoltării ramurilor altoi (V2). Pentru altoirea din aprilie s-au folosit ramuri recoltate toamna târziu şi păstrate peste iarnă în depozite la temeraturi de 2-4◦C (V3). Procentul de germinare a nucilor a fost de 61,4 %, prinderea la altoire de 67,8 % (V1), 30,2 % (V2) şi 48,8 % (V3) iar procentul de pomi altoiţi STAS a fost de 26% la soiul Anica şi 59 5 la soiul Prezident Cuvinte cheie: Nuc, soiuri, altoire, chip budding, solarii.
1 University of Agricultural Sciences and Veterinary Medicine Iasi, Romania
110
INTRODUCTION
Quality planting material used walnut plantations is essential for efficiency.
Since requests for the walnut seedlings in recent years began to grow, Romanian
markets is not sufficiently achieved by grafting seedlings and are valued at current
high prices, there is a tendency to use the material obtained by seed (Cociu et al.,
2006).
Unlike other fruit species, walnut grafting is a technological sequence
requires special conditions to get good results.
Environmental conditions during and after grafting have a very important
role in callus formation in walnut (Avanzato, 2001)
Grafting in improved copulation and forcing material into rooms after
grafting, remains one of the most used technologies but production costs quite
high (Achim and Botu, 2001).
With walnut grafting in the field, not favorable environmental conditions
are registered each year and the results are not satisfactory (Turcanu and Comanici,
2004).
The objective of this study is to highlight the possibility of walnut grafting
in protected areas.
MATERIAL AND METHOD
To establish first field, nuts were sown in November 2011 in a solar tunnel with a length of 20 m, 10 m and height of 4.5 m from the center. Nuts used come from the production of the current year and not have undergone any treatment to stimulate germination before sowing. Seed distance was 75 cm and 10 cm between rows at a time, and the depth of seeding was 5 cm.
For grafting was used chip budding method, grafting into two periods: August 2012 (with bud sleeping) and April 2013 (the bud growing).
For August grafting were used graft branches that were trimmed in two different moments: removing leaves and maintain a portion of petiole 2 cm, made a month before harvesting the graft branches respectively, trimming branches leaves at harvest. For grafting in April were used branches harvested in late autumn and stored over winter in deposits setpoints 2-4◦C.
During the period of vegetation to make specific maintenance works. Combating disease and pest control is carried out through the application of 6-8 treatments with bordeleza juice 0.5-1% or with other products mixed with copper based insecticides (Hartmann et al., 2001).
RESULTS AND DISCUSSION
The percentage of germination was 61.4 % walnut, very good results
provided that they had been previously sown with being layered (Tab. 1; Fig. 1,
Fig. 2).
Seedling diameter at a height of 10 cm from the ground when grafting was
14.2 mm and height 108.2 cm. (Tab. 1; Fig. 3, Fig. 4). Providing branch graft
quality is a key factor in the success of the walnut grafting.
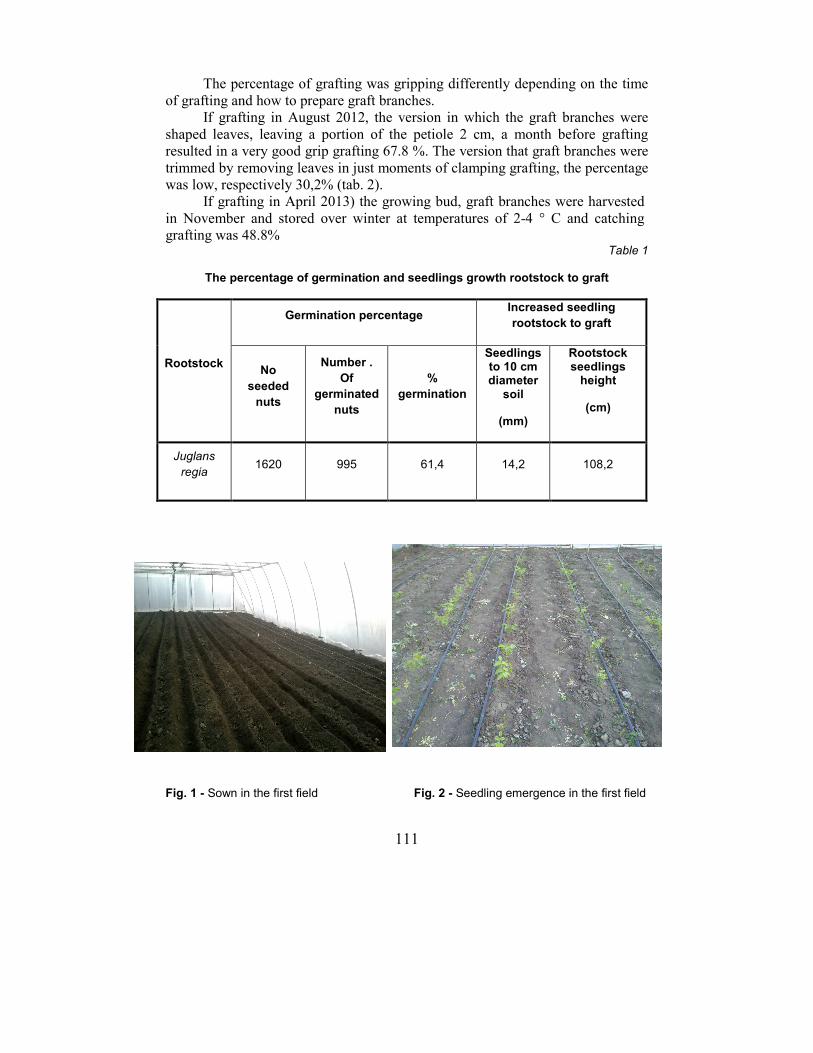
111
The percentage of grafting was gripping differently depending on the time
of grafting and how to prepare graft branches.
If grafting in August 2012, the version in which the graft branches were
shaped leaves, leaving a portion of the petiole 2 cm, a month before grafting
resulted in a very good grip grafting 67.8 %. The version that graft branches were
trimmed by removing leaves in just moments of clamping grafting, the percentage
was low, respectively 30,2% (tab. 2).
If grafting in April 2013) the growing bud, graft branches were harvested
in November and stored over winter at temperatures of 2-4 ° C and catching
grafting was 48.8% Table 1
The percentage of germination and seedlings growth rootstock to graft
Rootstock
Germination percentage Increased seedling
rootstock to graft
No
seeded
nuts
Number .
Of
germinated
nuts
%
germination
Seedlings to 10 cm diameter
soil
(mm)
Rootstock seedlings
height
(cm)
Juglans
regia 1620 995 61,4 14,2 108,2
Fig. 1 - Sown in the first field Fig. 2 - Seedling emergence in the first field
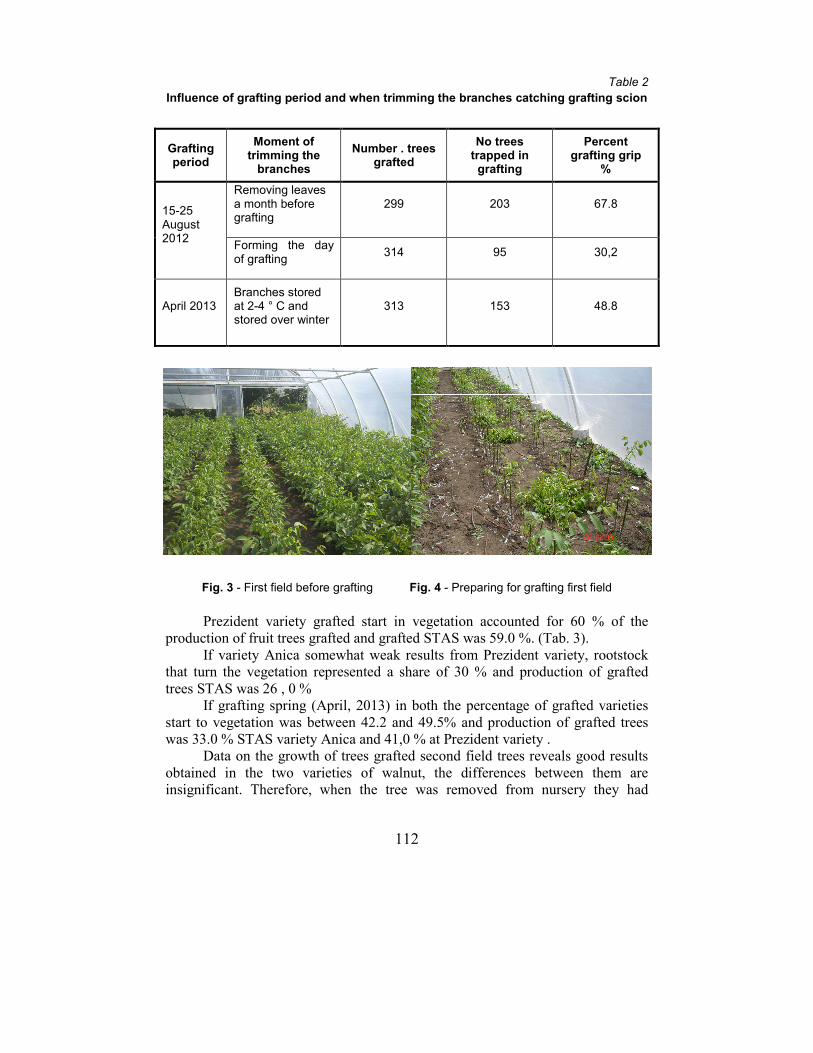
112
Table 2
Influence of grafting period and when trimming the branches catching grafting scion
Grafting period
Moment of trimming the
branches
Number . trees grafted
No trees trapped in
grafting
Percent grafting grip
%
15-25 August 2012
Removing leaves a month before grafting
299 203 67.8
Forming the day of grafting
314 95 30,2
April 2013 Branches stored at 2-4 ° C and stored over winter
313 153 48.8
Fig. 3 - First field before grafting Fig. 4 - Preparing for grafting first field
Prezident variety grafted start in vegetation accounted for 60 % of the
production of fruit trees grafted and grafted STAS was 59.0 %. (Tab. 3).
If variety Anica somewhat weak results from Prezident variety, rootstock
that turn the vegetation represented a share of 30 % and production of grafted
trees STAS was 26 , 0 %
If grafting spring (April, 2013) in both the percentage of grafted varieties
start to vegetation was between 42.2 and 49.5% and production of grafted trees
was 33.0 % STAS variety Anica and 41,0 % at Prezident variety .
Data on the growth of trees grafted second field trees reveals good results
obtained in the two varieties of walnut, the differences between them are
insignificant. Therefore, when the tree was removed from nursery they had
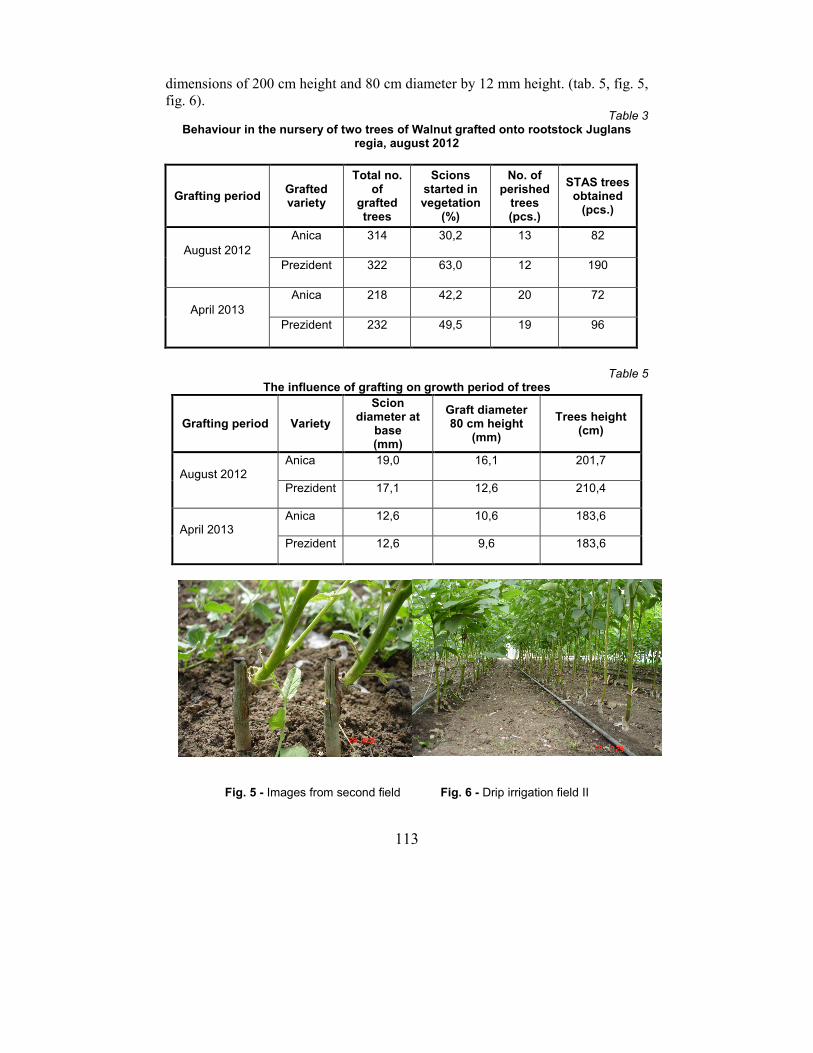
113
dimensions of 200 cm height and 80 cm diameter by 12 mm height. (tab. 5, fig. 5,
fig. 6). Table 3
Behaviour in the nursery of two trees of Walnut grafted onto rootstock Juglans regia, august 2012
Grafting period Grafted variety
Total no. of
grafted trees
Scions started in vegetation
(%)
No. of perished
trees (pcs.)
STAS trees obtained
(pcs.)
August 2012
Anica 314 30,2 13 82
Prezident 322 63,0 12 190
April 2013
Anica 218 42,2 20 72
Prezident 232 49,5 19 96
Table 5 The influence of grafting on growth period of trees
Grafting period Variety
Scion diameter at
base (mm)
Graft diameter 80 cm height
(mm)
Trees height (cm)
August 2012 Anica 19,0 16,1 201,7
Prezident 17,1 12,6 210,4
April 2013 Anica 12,6 10,6 183,6
Prezident 12,6 9,6 183,6
Fig. 5 - Images from second field Fig. 6 - Drip irrigation field II
114
CONCLUSIONS
1. Grafting at the table, in the walnut and perfected copulation forcing
material grafted into protected areas, in terms of 26° C, relative air humidity 50-
60%, for 14 days, remains the most widely used method of propagating for the
walnuts.
2. Juglans regia rootstock growth in the protected space is superior both as
force growth and the uniformity compared to the walnut rootstocks produced in the
field.
3. Ensuring quality scion branch is a key factor in the success of grafting in
walnut. The branches have been trimmed by about a month before grafting
influenced the percentage of positive grip, with the highest percentage of all
experience.
4. Setting up the solar field, and by direct seeding and grafting seedlings in
chip budding may be one of the technological sevenţele ensures seedlings grafted
both quantitatively and qualitatively, can more easily control the environmental
conditions in the protected spaces.
REFERENCES
1. Achim G., Botu I., 2001 – Results in walnut propagationn usinng different methods.
Acta Hort. 544, pp. 503-509 2. Avanzato D., 2001 – Effect of different hygro-thermic enviroments on growth of potted
walnut grafted seedlings. Acta Hort. 544, pp. 459-464. 3. Cociu si colab., 2006 – Culturile nucifere. Editura Ceres, Bucureşti 4. Hartmann H. T., Kester D. E., Davies F.T., Geneve R. L., 2001 - Plannt Propagation.
Principles and practices. 7th editionn. Pretince Hall internnationnal, Inc. NJ. 5. Ţurcanu I., Comănici I., 2004 - Nucul. F.E. P. Tipografia Centrală, Chişinău.
115
EVALUATION OF YIELD POTENTIAL AND FRUIT QUALITY OF TITLU SOME STRAWBERRY VARIETIES
CULTIVATED UNDER SOUTHEAST CONDITION OF ROMANIA
EVALUAREA POTENŢIALULUI AGROPRODUCTIV AL CALITĂŢII
FRUCTELOR LA UNELE SOIURI DE CĂPŞUN CULTIVATE ÎN CONDIŢIILE DIN SUD-ESTUL ROMÂNIEI
ILIE Alina
1, PETRIŞOR Cristina
1, DUMITRU Maria
1
e-mail: [email protected]
Abstract. Phenological and quality of seven strawberry cultivars was evaluated
in two seasons under the climatic conditions of south-east of Romania to select
some cultivars to improve assortment and using in breeding program. We
determined the blossom period, ripening period, fruit weight, soluble solids,
titratable acidity, anthocyanin level, ascorbic acid content. We also determined
the yield of fruits per plant. The highest average yield was obtained in Elsanta
cultivar followed by Marmolada cultivar. The earliest to ripen were berries of
the cultivar Premial and Coral but Bolero, Marmolada and Idea was late
ripening cultivars. The highest of vitamin C content was obtained in Elsanta
cultivar (59.8 mg/100g). Idea cultivar have a hight content of dry matter (10.9
mg/100 g). Key words: fruit, yield, quality, strawberry
Rezumat. Au fost evaluate şapte soiuri de căpşun din punct de vedere fenologic
şi calitativ pe parcursul a două sezoane în condiţiile climatice specifice zonei
sud-estice a României, pentru selectarea unor soiuri în vederea îmbunătăţirii
sortimentului şi utilizării în programele de ameliorare. S-a determinat
momentul înfloritului, stadiul de maturare a fructelor, greutatea fructelor,
substanţa uscată solubilă, aciditatea titrabilă, conţinutul în antociani,
conţinutul în acid ascorbic. De asemenea, s-a determinat producţia fructelor pe
plantă. In cazul soiului Elsanta a fost înregistrată cea mai mare producţie,
urmat de soiul Marmolada. Soiurile Premial şi Coral sunt cele mai timpurii, în
timp ce soiurile Bolero, Marmolada şi Idea sunt cu maturare târzie. Cel mai
mare conţinut în vitamina C a fost obţinut la soiul Elsanta (59.8 mg/100 g).
Soiul Idea a avut conţinutul cel mai ridicat în substanţă uscată (10.9 mg/100 g).
S-au evidenţiat ca şi conţinut de antociani soiurile Marmolada, Premial si
Korona.
Cuvinte cheie: fructe, producţie, calitate, antociani
INTRODUCTION
Strawberry (Fragaria x ananassa Duch.) is an important fruit of family
Rosaceae and occupies an important place among the small fruits (Sharma and
Thakur, 2008). Fruits can be obtained early in the season when there is no fresh
1 Research Station for Fruit Tress Growing of Băneasa, Bucharest, Romania
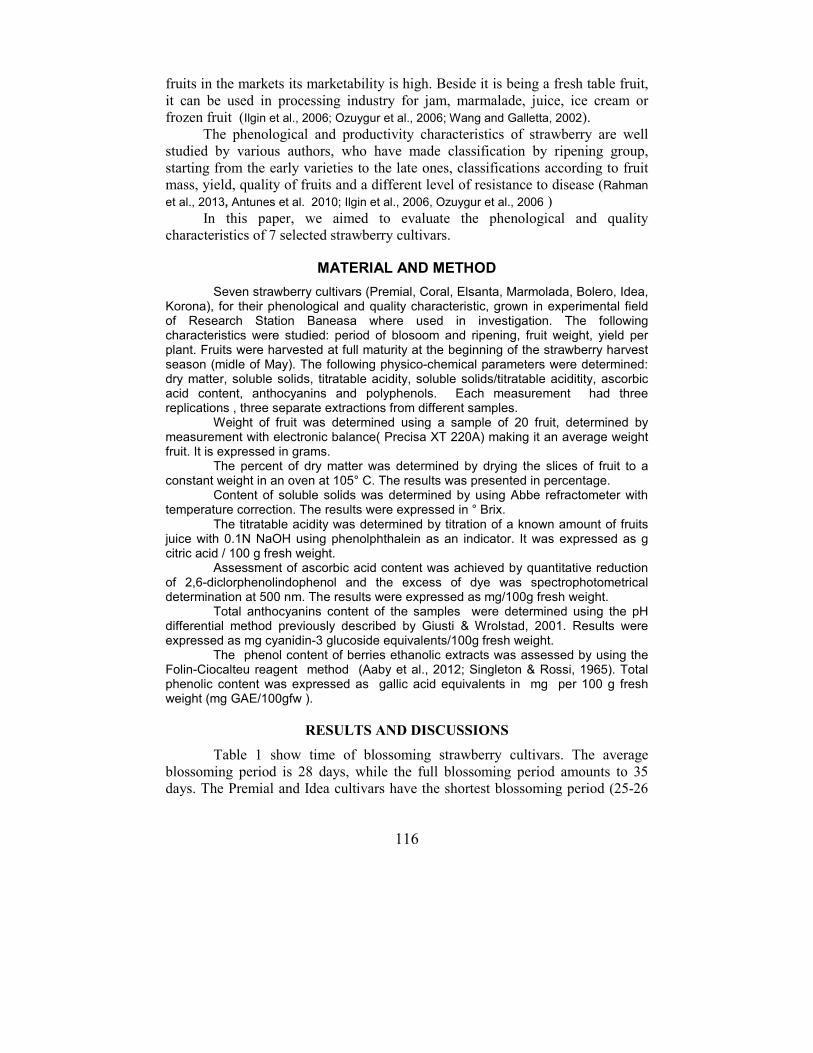
116
fruits in the markets its marketability is high. Beside it is being a fresh table fruit,
it can be used in processing industry for jam, marmalade, juice, ice cream or
frozen fruit (Ilgin et al., 2006; Ozuygur et al., 2006; Wang and Galletta, 2002).
The phenological and productivity characteristics of strawberry are well
studied by various authors, who have made classification by ripening group,
starting from the early varieties to the late ones, classifications according to fruit
mass, yield, quality of fruits and a different level of resistance to disease (Rahman
et al., 2013, Antunes et al. 2010; Ilgin et al., 2006, Ozuygur et al., 2006 )
In this paper, we aimed to evaluate the phenological and quality
characteristics of 7 selected strawberry cultivars.
MATERIAL AND METHOD
Seven strawberry cultivars (Premial, Coral, Elsanta, Marmolada, Bolero, Idea, Korona), for their phenological and quality characteristic, grown in experimental field of Research Station Baneasa where used in investigation. The following characteristics were studied: period of blosoom and ripening, fruit weight, yield per plant. Fruits were harvested at full maturity at the beginning of the strawberry harvest season (midle of May). The following physico-chemical parameters were determined: dry matter, soluble solids, titratable acidity, soluble solids/titratable aciditity, ascorbic acid content, anthocyanins and polyphenols. Each measurement had three replications , three separate extractions from different samples.
Weight of fruit was determined using a sample of 20 fruit, determined by measurement with electronic balance( Precisa XT 220A) making it an average weight fruit. It is expressed in grams.
The percent of dry matter was determined by drying the slices of fruit to a constant weight in an oven at 105° C. The results was presented in percentage.
Content of soluble solids was determined by using Abbe refractometer with temperature correction. The results were expressed in ° Brix.
The titratable acidity was determined by titration of a known amount of fruits juice with 0.1N NaOH using phenolphthalein as an indicator. It was expressed as g citric acid / 100 g fresh weight.
Assessment of ascorbic acid content was achieved by quantitative reduction of 2,6-diclorphenolindophenol and the excess of dye was spectrophotometrical determination at 500 nm. The results were expressed as mg/100g fresh weight.
Total anthocyanins content of the samples were determined using the pH differential method previously described by Giusti & Wrolstad, 2001. Results were expressed as mg cyanidin-3 glucoside equivalents/100g fresh weight.
The phenol content of berries ethanolic extracts was assessed by using the Folin-Ciocalteu reagent method (Aaby et al., 2012; Singleton & Rossi, 1965). Total phenolic content was expressed as gallic acid equivalents in mg per 100 g fresh weight (mg GAE/100gfw ).
RESULTS AND DISCUSSIONS
Table 1 show time of blossoming strawberry cultivars. The average
blossoming period is 28 days, while the full blossoming period amounts to 35
days. The Premial and Idea cultivars have the shortest blossoming period (25-26
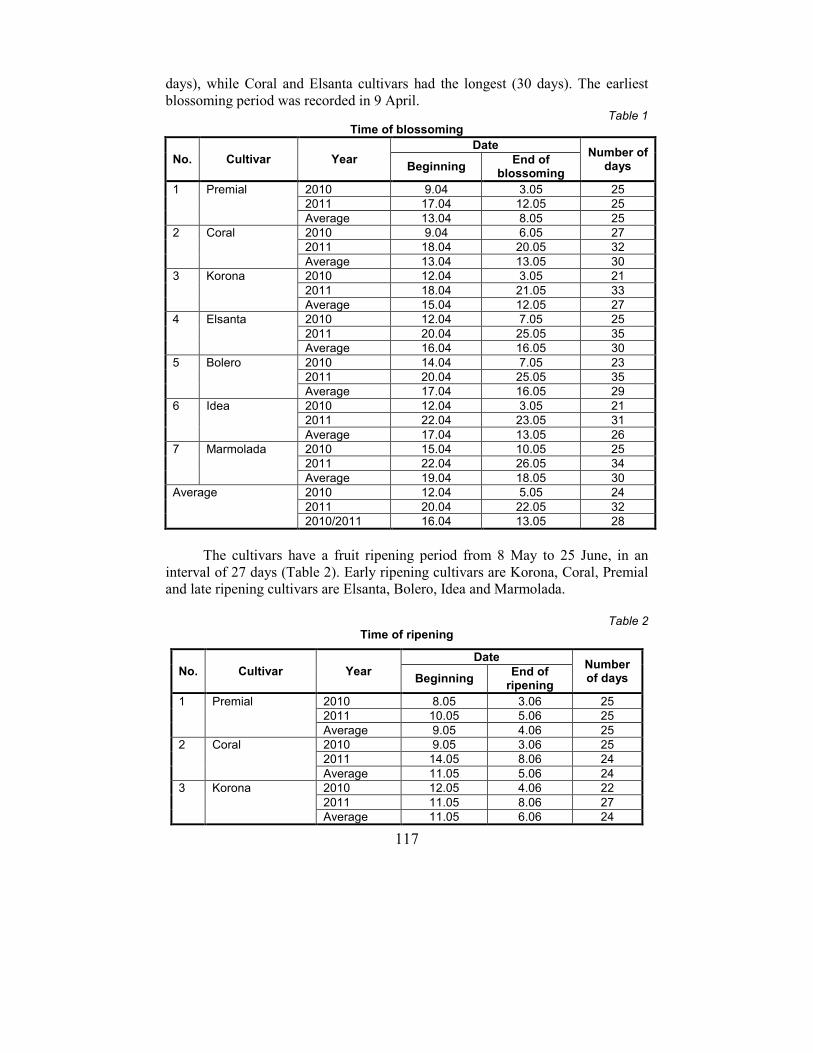
117
days), while Coral and Elsanta cultivars had the longest (30 days). The earliest
blossoming period was recorded in 9 April. Table 1
Time of blossoming
No. Cultivar Year
Date Number of
days Beginning End of
blossoming
1 Premial 2010 9.04 3.05 25
2011 17.04 12.05 25
Average 13.04 8.05 25
2 Coral 2010 9.04 6.05 27
2011 18.04 20.05 32
Average 13.04 13.05 30
3 Korona 2010 12.04 3.05 21
2011 18.04 21.05 33
Average 15.04 12.05 27
4 Elsanta 2010 12.04 7.05 25
2011 20.04 25.05 35
Average 16.04 16.05 30
5 Bolero 2010 14.04 7.05 23
2011 20.04 25.05 35
Average 17.04 16.05 29
6 Idea 2010 12.04 3.05 21
2011 22.04 23.05 31
Average 17.04 13.05 26
7 Marmolada 2010 15.04 10.05 25
2011 22.04 26.05 34
Average 19.04 18.05 30
Average 2010 12.04 5.05 24
2011 20.04 22.05 32
2010/2011 16.04 13.05 28
The cultivars have a fruit ripening period from 8 May to 25 June, in an
interval of 27 days (Table 2). Early ripening cultivars are Korona, Coral, Premial
and late ripening cultivars are Elsanta, Bolero, Idea and Marmolada.
Table 2
Time of ripening
No. Cultivar Year
Date Number of days Beginning
End of ripening
1 Premial 2010 8.05 3.06 25
2011 10.05 5.06 25
Average 9.05 4.06 25
2 Coral 2010 9.05 3.06 25
2011 14.05 8.06 24
Average 11.05 5.06 24
3 Korona 2010 12.05 4.06 22
2011 11.05 8.06 27
Average 11.05 6.06 24
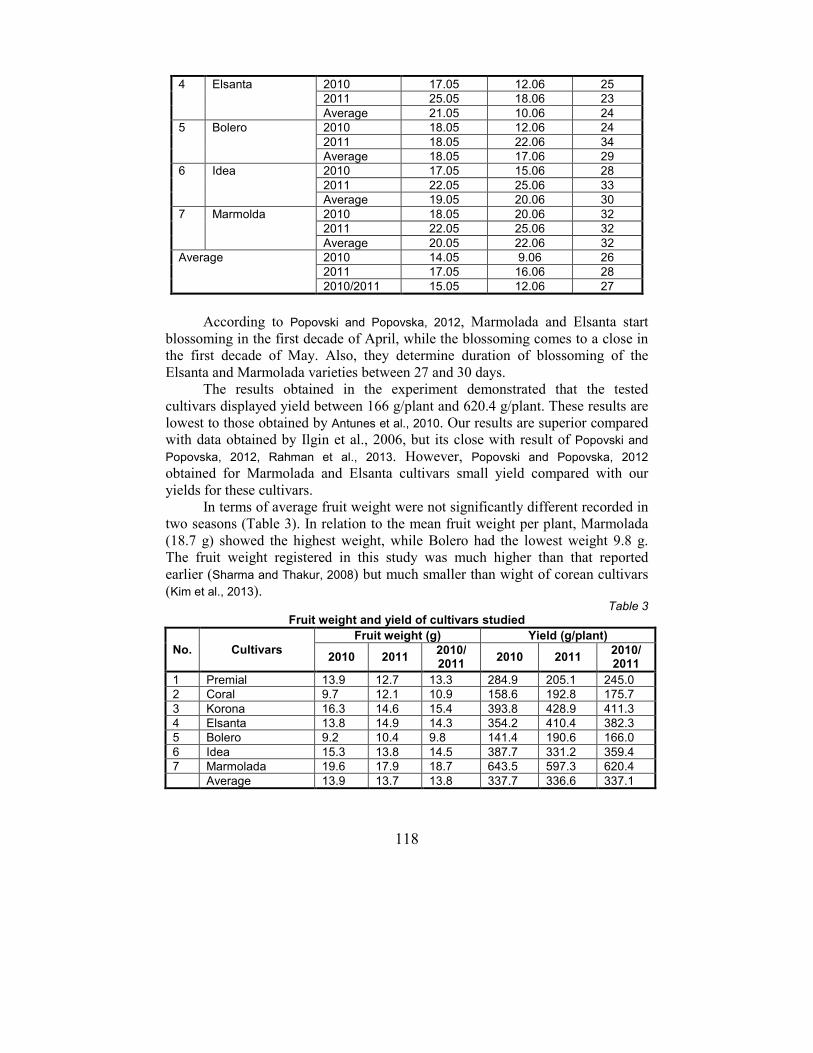
118
According to Popovski and Popovska, 2012, Marmolada and Elsanta start
blossoming in the first decade of April, while the blossoming comes to a close in
the first decade of May. Also, they determine duration of blossoming of the
Elsanta and Marmolada varieties between 27 and 30 days.
The results obtained in the experiment demonstrated that the tested
cultivars displayed yield between 166 g/plant and 620.4 g/plant. These results are
lowest to those obtained by Antunes et al., 2010. Our results are superior compared
with data obtained by Ilgin et al., 2006, but its close with result of Popovski and
Popovska, 2012, Rahman et al., 2013. However, Popovski and Popovska, 2012
obtained for Marmolada and Elsanta cultivars small yield compared with our
yields for these cultivars.
In terms of average fruit weight were not significantly different recorded in
two seasons (Table 3). In relation to the mean fruit weight per plant, Marmolada
(18.7 g) showed the highest weight, while Bolero had the lowest weight 9.8 g.
The fruit weight registered in this study was much higher than that reported
earlier (Sharma and Thakur, 2008) but much smaller than wight of corean cultivars
(Kim et al., 2013). Table 3
Fruit weight and yield of cultivars studied
No. Cultivars
Fruit weight (g) Yield (g/plant)
2010 2011 2010/ 2011
2010 2011 2010/ 2011
1 Premial 13.9 12.7 13.3 284.9 205.1 245.0
2 Coral 9.7 12.1 10.9 158.6 192.8 175.7
3 Korona 16.3 14.6 15.4 393.8 428.9 411.3
4 Elsanta 13.8 14.9 14.3 354.2 410.4 382.3
5 Bolero 9.2 10.4 9.8 141.4 190.6 166.0
6 Idea 15.3 13.8 14.5 387.7 331.2 359.4
7 Marmolada 19.6 17.9 18.7 643.5 597.3 620.4
Average 13.9 13.7 13.8 337.7 336.6 337.1
4 Elsanta 2010 17.05 12.06 25
2011 25.05 18.06 23
Average 21.05 10.06 24
5 Bolero 2010 18.05 12.06 24
2011 18.05 22.06 34
Average 18.05 17.06 29
6 Idea 2010 17.05 15.06 28
2011 22.05 25.06 33
Average 19.05 20.06 30
7 Marmolda 2010 18.05 20.06 32
2011 22.05 25.06 32
Average 20.05 22.06 32
Average 2010 14.05 9.06 26
2011 17.05 16.06 28
2010/2011 15.05 12.06 27
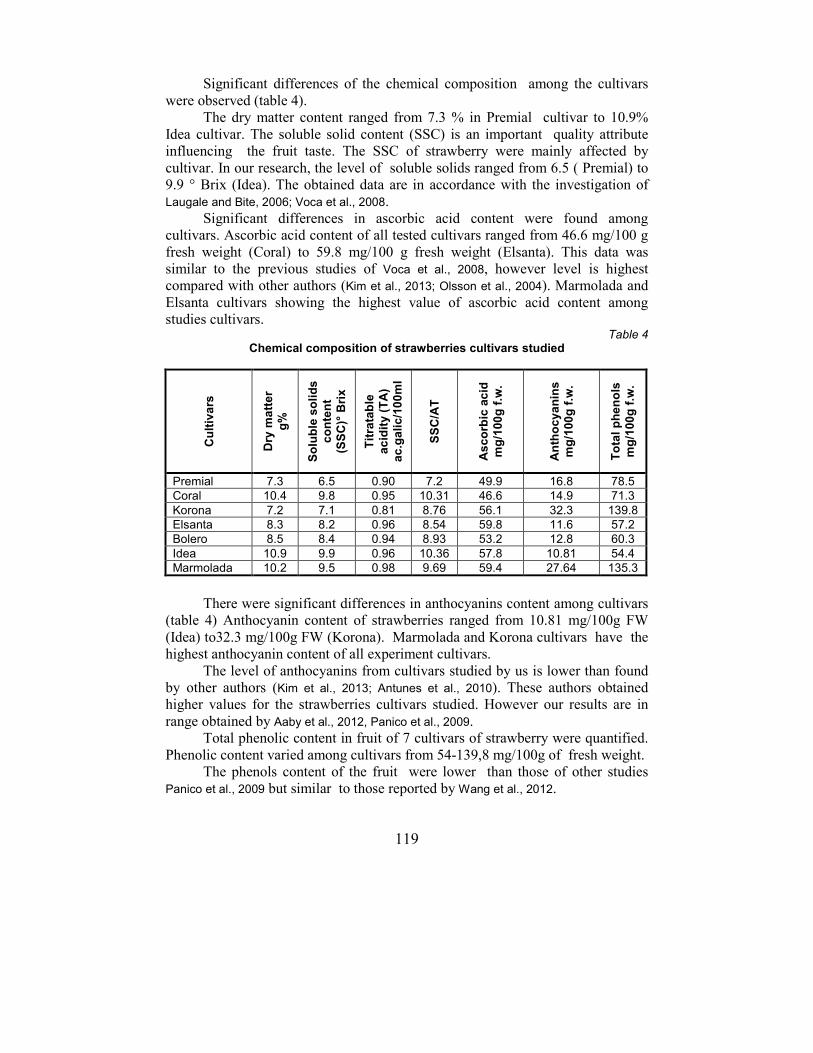
119
Significant differences of the chemical composition among the cultivars
were observed (table 4).
The dry matter content ranged from 7.3 % in Premial cultivar to 10.9%
Idea cultivar. The soluble solid content (SSC) is an important quality attribute
influencing the fruit taste. The SSC of strawberry were mainly affected by
cultivar. In our research, the level of soluble solids ranged from 6.5 ( Premial) to
9.9 ° Brix (Idea). The obtained data are in accordance with the investigation of
Laugale and Bite, 2006; Voca et al., 2008.
Significant differences in ascorbic acid content were found among
cultivars. Ascorbic acid content of all tested cultivars ranged from 46.6 mg/100 g
fresh weight (Coral) to 59.8 mg/100 g fresh weight (Elsanta). This data was
similar to the previous studies of Voca et al., 2008, however level is highest
compared with other authors (Kim et al., 2013; Olsson et al., 2004). Marmolada and
Elsanta cultivars showing the highest value of ascorbic acid content among
studies cultivars. Table 4
Chemical composition of strawberries cultivars studied
Cu
ltiv
ars
Dry
ma
tte
r
g%
So
lub
le s
oli
ds
co
nte
nt
(SS
C)°
Bri
x
Tit
rata
ble
ac
idit
y (
TA
)
ac
.ga
lic
/10
0m
l
SS
C/A
T
As
co
rbic
ac
id
mg
/100
g f
.w.
An
tho
cy
an
ins
mg
/100
g f
.w.
To
tal
ph
en
ols
mg
/100
g f
.w.
Premial 7.3 6.5 0.90 7.2 49.9 16.8 78.5
Coral 10.4 9.8 0.95 10.31 46.6 14.9 71.3
Korona 7.2 7.1 0.81 8.76 56.1 32.3 139.8
Elsanta 8.3 8.2 0.96 8.54 59.8 11.6 57.2
Bolero 8.5 8.4 0.94 8.93 53.2 12.8 60.3
Idea 10.9 9.9 0.96 10.36 57.8 10.81 54.4
Marmolada 10.2 9.5 0.98 9.69 59.4 27.64 135.3
There were significant differences in anthocyanins content among cultivars
(table 4) Anthocyanin content of strawberries ranged from 10.81 mg/100g FW
(Idea) to32.3 mg/100g FW (Korona). Marmolada and Korona cultivars have the
highest anthocyanin content of all experiment cultivars.
The level of anthocyanins from cultivars studied by us is lower than found
by other authors (Kim et al., 2013; Antunes et al., 2010). These authors obtained
higher values for the strawberries cultivars studied. However our results are in
range obtained by Aaby et al., 2012, Panico et al., 2009.
Total phenolic content in fruit of 7 cultivars of strawberry were quantified.
Phenolic content varied among cultivars from 54-139,8 mg/100g of fresh weight.
The phenols content of the fruit were lower than those of other studies
Panico et al., 2009 but similar to those reported by Wang et al., 2012.
120
CONCLUSIONS
1. Climatic and pedological from south-east of Romania are particularly
favorable for strawberry crop;
2. In terms of yield during 2010-2011 period were highlighted the cultivars:
Marmolada (620.4 g/plant), Korona (411.3 g/plant ), Elsanta (382.3 g/plant), Idea
(359.4 g/plant);
3. Regarding the chemical composition of fruit, Elsanta and Marmolada
cultivars were evidenced by the hight content of ascorbic acid.
REFERENCES
1. Aaby K., Mazur S., Nes A., Skrede G., 2012 - Phenolic compounds in strawberry fruits: composition in 27 cultivars and changes during ripening, Food Chem.,
133(1): pp. 86-97 2. Antunes L.E.C., Ristow N.C., Krolow A .C. R., Carpenedo S., Junior C. R., 2010 -
Yield and quality of strawberry cultivars. Horticultura Brasileira 28: p. 222-226. 3. Giusti M., Wrolstad R., 2001 - Characterization and measurement of anthocyanins by
UV-visible spectroscopy. Current protocols in food analytical chemistry . John Willey and Sons, New York.
4. Ilgin M., Colak A., Kaşka N., 2006 - Effects of the different growing media on the yield and quality of some strawberry (Fragaria x ananassa) cultivars. Journal of Biological
Sciences 6 (3): pp. 501-506. 5. Kim S.K., Bae R.N., Na H., Ko K. D., Chun C., 2013 - Changes in physicochemical
characteristics during fruit development in june-bearing strawberry cultivar. Hort. Environ. Biotechnol. 54(1): pp. 44-51.
6. Laugale V., Bite A., 2006 - Fresh and processing quality of different strawberry cultivars for Latvia. Acta Hortic. 708: pp. 333-336.
7. Olsson M. E., Ekvall J., Gustavsson K.E., Nilsson J., Pillai D., Sjoholm I., Svensson U., Akesson B., Nyman M.G.L., 2004 - Antioxidants, low molecular weight
carbohydrates, and total antioxidant capacity in strawberry (Fragaria x ananassa): Effects of cultivar, ripening and storage. J. Agr. Food Chem. 52: pp. 2490-2498.
8. Ozuygur M., Kargi S.P., Kafkas E., 2006 - Investigation on yield, fruit quality and plant characteristics of some local, European and American strawberry varieties and their hybrids. Agriculturae Conspectus Scientificus 71 (4): pp. 175-180.
9. Panico A.M., Garufi F., Nitto S., Mauro R.Di, Longhitano R.C., Magri G., Catalfo A., serrentino M.E., Guidi G.De, 2009 - Antioxidant activity and phenolic content of strawberry genotypes from Fragaria x ananassa. Pharmauceutical Biology, 47(3): pp. 203-208
10. Popovski B., Popovska M., 2012 - Phenological and production characteristics of some strawberry varieties in the region of Skoje. Agroznanje, 13 (4): pp. 517-525.
11. Rahman M.M., Rahman M.M., Hossain M.M., Mian M.A. K., Khaliq Q.A., 2013 - Characterization and field performance of 15 strawberry germplasm under Bangladesh conditions. SAARC J. Agri., 11 (2), pp. 81-94.
12. Singleton VL, Rossi JA, 1965 - Colorimetry of total phenolics with phoshomolybdic-phosphotungstic acid reagents. Am J Enol Vitic 16, pp. 144-158.
13. Sharma G., Thakur M.S., 2008 - Evaluation of different strawberry cultivars for yield
and quality characters in Himachal Pradesh. Agric. Sci. Digest, 28 (3), pp. 213-215; 14. Voca S., Dobricevic N., Dragovic-Uzelac V., Duralija B., Druzic J., Cmelik Z.,
Babojelic S, 2008 - Fruit quality of new early ripening strawberry cultivars in Croatia. Food Technol. Biotechnol. 46 (3): pp. 292-298.
15. Wang S.Y., Galletta G.J., 2002 - Compositional change in Colletotrichum (Antracnose) infected strawberry fruit. Acta Hort. 567, pp.815-819.
121
STUDY ON ASSESSMENT OF PRODUCTIVITY OF GOOSEBERRY VARIETY
STUDIU REFERITOR LA APRECIEREA PRODUCTIVITĂȚII UNOR
SOIURI DE AGRIȘ
SAVA Parascovia1
e-mail: [email protected]
Abstract. In the article were presented the results of our investigations during the 2011-2013 about the assessment on productivity of gooseberry variety and fruit quality appreciation of the 10 gooseberry varieties introduced in Republic of Moldova on the new soil and climatic conditions. Research has highlighted the varieties of gooseberries traits in intensive plantation, on which it was established that the average: Mass gooseberry fruit varied between 1.6-2.7g, highest yielding fruit varieties Smena, Colobok, Captivator. Production obtained from a bush ranged from 0.9 kg / bush on variety Zenit and 2.6 kg / bush on variety Colobok.. Gooseberry fruit harvest obtained ranged from 6.2 t / ha on variety Zenit and 20.4 t/ha on variety Captivator. The production proved to be varieties: Colobok, Severnai capitan, Sadko, Captivator. Key words: gooseberry, varieties, productivity, fruits.
Rezumat. În lucrare sunt prezentate rezultatele cercetarilor efectuate pe parcursul anilor 2011-2013 cu privire la acumularea substanțelor nutritive și aprecierea calității fructelor la 10 soiuri de agriș introduse în Republica Moldova în condiții noi de sol și climă. Cercetărilor efectuate au evidențiat trasaturile caracteristice soiurilor introduse de agriș într-o plantație intensivă, în baza cărora s-a stabilit că media: masei fructelor de agriş a variat între 1,6-2,7g, cele mai mari fructe obținîndu-se la soiurile Smena, Coloboc, Captivator. Producției obținute de la o tufă a variat între 0,9 kg/tufă la soiul Zenit și 2,6 kg/tufă la soiul Coloboc. Recoltei de fructe de agriș obţinută a variat între 6,2 t/ha la soiul Zenit şi 20,4 t/ha la soiul Captivator. Cele mai productive s-au dovedit a fi soiurile: Coloboc, Severnîi capitan, Sadco, Captivator. Cuvinte cheie: agriș, soiuri, productivitate, masa fructelor.
INTRODUCTION
The fruit size, although it is a characteristic trait of the variety, varies
greatly depending on the years and largely depends on the age, condition of plants
and the climatic factors during the growing season. This is why to obtain a high quality crop in plantations which are aging,
rejuvenation of the plants is required by the appropriate agrotechnical measures
(Franciuc, 1975). The average harvest of gooseberries in Russia is 15.9 q / ha, and
in some regions (North West and Centre) it is more increased (2.29 and 2.56 t /
ha). In the region of Lipetsk, the harvest varies from 3.0-4.5 to 25.0 t / ha,
sometimes even more (Luchina, 1975). Gooseberries enter early in the bearing
1 Scientific-Practical Institute For Horticulture and Technologies, Republic of Moldova
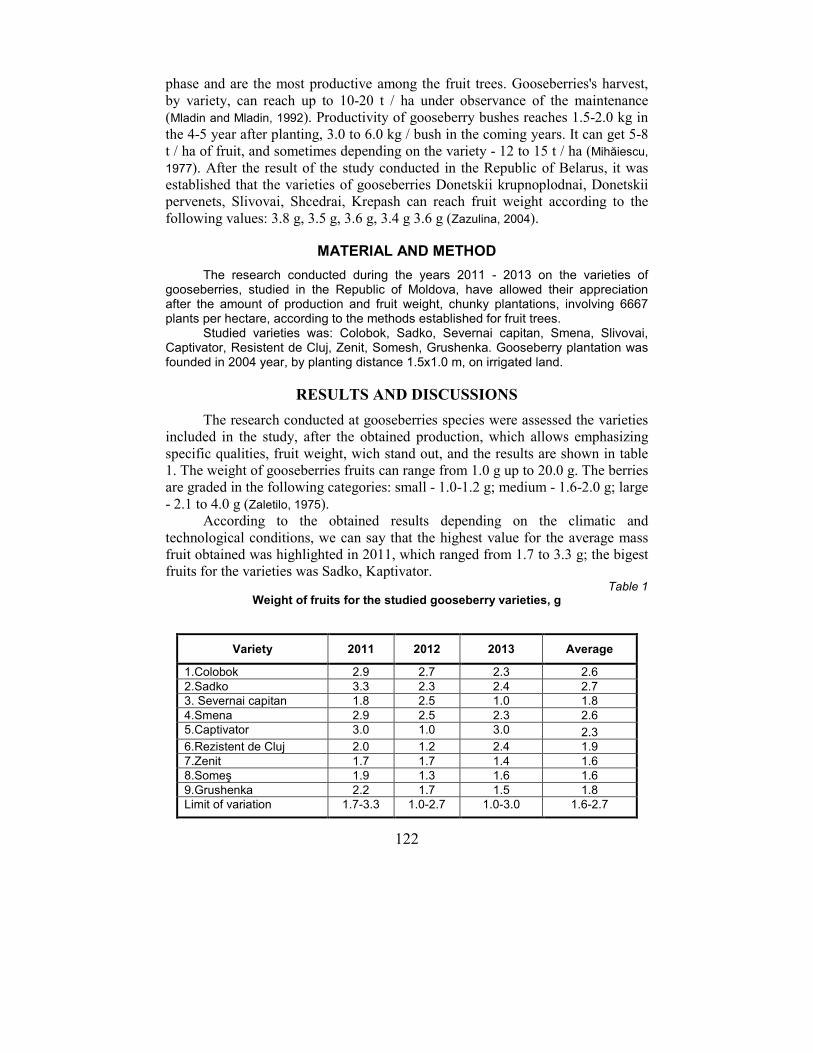
122
phase and are the most productive among the fruit trees. Gooseberries's harvest,
by variety, can reach up to 10-20 t / ha under observance of the maintenance
(Mladin and Mladin, 1992). Productivity of gooseberry bushes reaches 1.5-2.0 kg in
the 4-5 year after planting, 3.0 to 6.0 kg / bush in the coming years. It can get 5-8
t / ha of fruit, and sometimes depending on the variety - 12 to 15 t / ha (Mihăiescu,
1977). After the result of the study conducted in the Republic of Belarus, it was
established that the varieties of gooseberries Donetskii krupnoplodnai, Donetskii
pervenets, Slivovai, Shcedrai, Krepash can reach fruit weight according to the
following values: 3.8 g, 3.5 g, 3.6 g, 3.4 g 3.6 g (Zazulina, 2004).
MATERIAL AND METHOD
The research conducted during the years 2011 - 2013 on the varieties of gooseberries, studied in the Republic of Moldova, have allowed their appreciation after the amount of production and fruit weight, chunky plantations, involving 6667 plants per hectare, according to the methods established for fruit trees.
Studied varieties was: Colobok, Sadko, Severnai capitan, Smena, Slivovai, Captivator, Resistent de Cluj, Zenit, Somesh, Grushenka. Gooseberry plantation was founded in 2004 year, by planting distance 1.5x1.0 m, on irrigated land.
RESULTS AND DISCUSSIONS
The research conducted at gooseberries species were assessed the varieties
included in the study, after the obtained production, which allows emphasizing
specific qualities, fruit weight, wich stand out, and the results are shown in table
1. The weight of gooseberries fruits can range from 1.0 g up to 20.0 g. The berries
are graded in the following categories: small - 1.0-1.2 g; medium - 1.6-2.0 g; large
- 2.1 to 4.0 g (Zaletilo, 1975).
According to the obtained results depending on the climatic and
technological conditions, we can say that the highest value for the average mass
fruit obtained was highlighted in 2011, which ranged from 1.7 to 3.3 g; the bigest
fruits for the varieties was Sadko, Kaptivator. Table 1
Weight of fruits for the studied gooseberry varieties, g
Variety 2011 2012 2013 Average
1.Colobok 2.9 2.7 2.3 2.6
2.Sadko 3.3 2.3 2.4 2.7
3. Severnai capitan 1.8 2.5 1.0 1.8
4.Smena 2.9 2.5 2.3 2.6
5.Captivator 3.0 1.0 3.0 2.3
6.Rezistent de Cluj 2.0 1.2 2.4 1.9
7.Zenit 1.7 1.7 1.4 1.6
8.Someş 1.9 1.3 1.6 1.6
9.Grushenka 2.2 1.7 1.5 1.8
Limit of variation 1.7-3.3 1.0-2.7 1.0-3.0 1.6-2.7
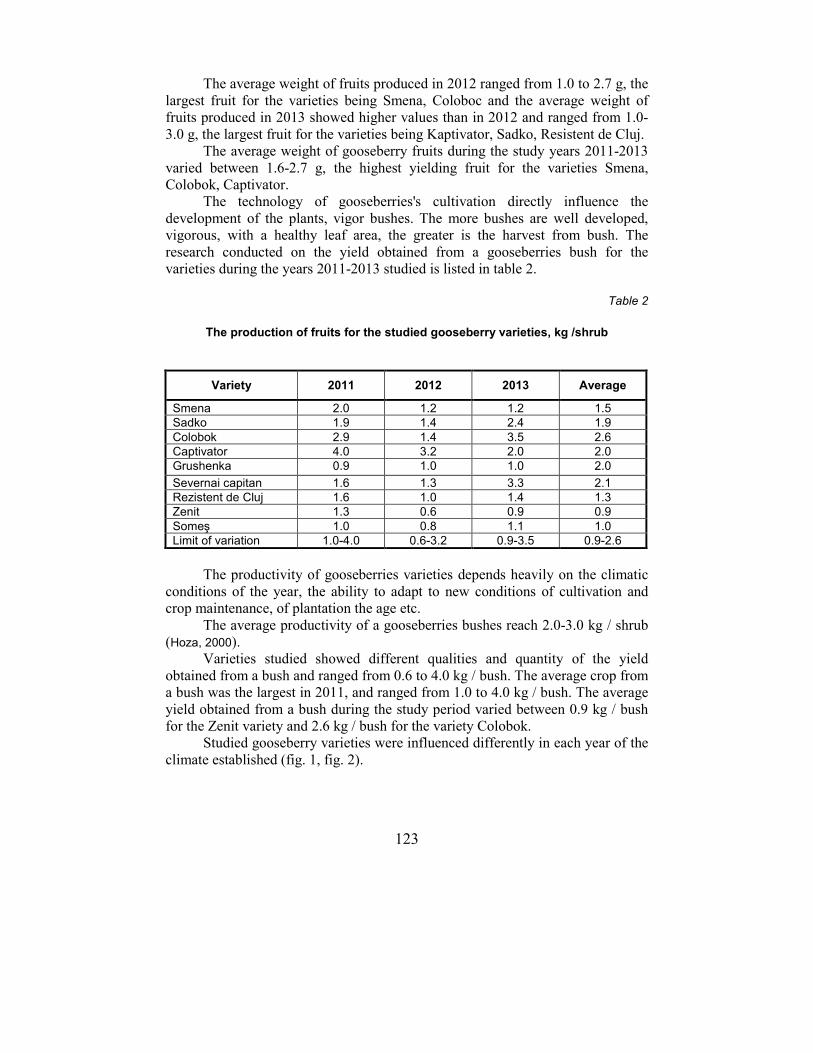
123
The average weight of fruits produced in 2012 ranged from 1.0 to 2.7 g, the
largest fruit for the varieties being Smena, Coloboc and the average weight of
fruits produced in 2013 showed higher values than in 2012 and ranged from 1.0-
3.0 g, the largest fruit for the varieties being Kaptivator, Sadko, Resistent de Cluj.
The average weight of gooseberry fruits during the study years 2011-2013
varied between 1.6-2.7 g, the highest yielding fruit for the varieties Smena,
Colobok, Captivator.
The technology of gooseberries's cultivation directly influence the
development of the plants, vigor bushes. The more bushes are well developed,
vigorous, with a healthy leaf area, the greater is the harvest from bush. The
research conducted on the yield obtained from a gooseberries bush for the
varieties during the years 2011-2013 studied is listed in table 2.
Table 2
The production of fruits for the studied gooseberry varieties, kg /shrub
The productivity of gooseberries varieties depends heavily on the climatic
conditions of the year, the ability to adapt to new conditions of cultivation and
crop maintenance, of plantation the age etc.
The average productivity of a gooseberries bushes reach 2.0-3.0 kg / shrub
(Hoza, 2000).
Varieties studied showed different qualities and quantity of the yield
obtained from a bush and ranged from 0.6 to 4.0 kg / bush. The average crop from
a bush was the largest in 2011, and ranged from 1.0 to 4.0 kg / bush. The average
yield obtained from a bush during the study period varied between 0.9 kg / bush
for the Zenit variety and 2.6 kg / bush for the variety Colobok.
Studied gooseberry varieties were influenced differently in each year of the
climate established (fig. 1, fig. 2).
Variety 2011 2012 2013 Average
Smena 2.0 1.2 1.2 1.5
Sadko 1.9 1.4 2.4 1.9
Colobok 2.9 1.4 3.5 2.6
Captivator 4.0 3.2 2.0 2.0
Grushenka 0.9 1.0 1.0 2.0
Severnai capitan 1.6 1.3 3.3 2.1
Rezistent de Cluj 1.6 1.0 1.4 1.3
Zenit 1.3 0.6 0.9 0.9
Someş 1.0 0.8 1.1 1.0
Limit of variation 1.0-4.0 0.6-3.2 0.9-3.5 0.9-2.6
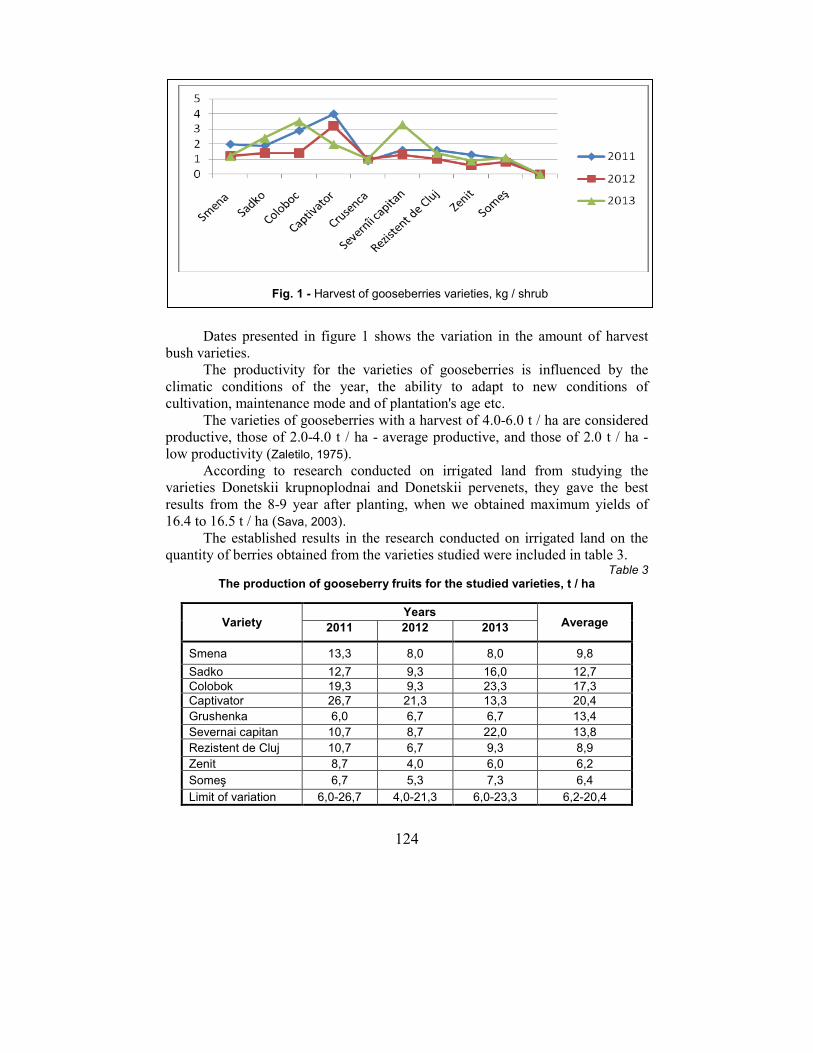
124
Dates presented in figure 1 shows the variation in the amount of harvest
bush varieties.
The productivity for the varieties of gooseberries is influenced by the
climatic conditions of the year, the ability to adapt to new conditions of
cultivation, maintenance mode and of plantation's age etc.
The varieties of gooseberries with a harvest of 4.0-6.0 t / ha are considered
productive, those of 2.0-4.0 t / ha - average productive, and those of 2.0 t / ha -
low productivity (Zaletilo, 1975).
According to research conducted on irrigated land from studying the
varieties Donetskii krupnoplodnai and Donetskii pervenets, they gave the best
results from the 8-9 year after planting, when we obtained maximum yields of
16.4 to 16.5 t / ha (Sava, 2003).
The established results in the research conducted on irrigated land on the
quantity of berries obtained from the varieties studied were included in table 3. Table 3
The production of gooseberry fruits for the studied varieties, t / ha
Variety Years
Average 2011 2012 2013
Smena 13,3 8,0 8,0 9,8
Sadko 12,7 9,3 16,0 12,7
Colobok 19,3 9,3 23,3 17,3
Captivator 26,7 21,3 13,3 20,4
Grushenka 6,0 6,7 6,7 13,4
Severnai capitan 10,7 8,7 22,0 13,8
Rezistent de Cluj 10,7 6,7 9,3 8,9
Zenit 8,7 4,0 6,0 6,2
Someş 6,7 5,3 7,3 6,4
Limit of variation 6,0-26,7 4,0-21,3 6,0-23,3 6,2-20,4
Fig. 1 - Harvest of gooseberries varieties, kg / shrub
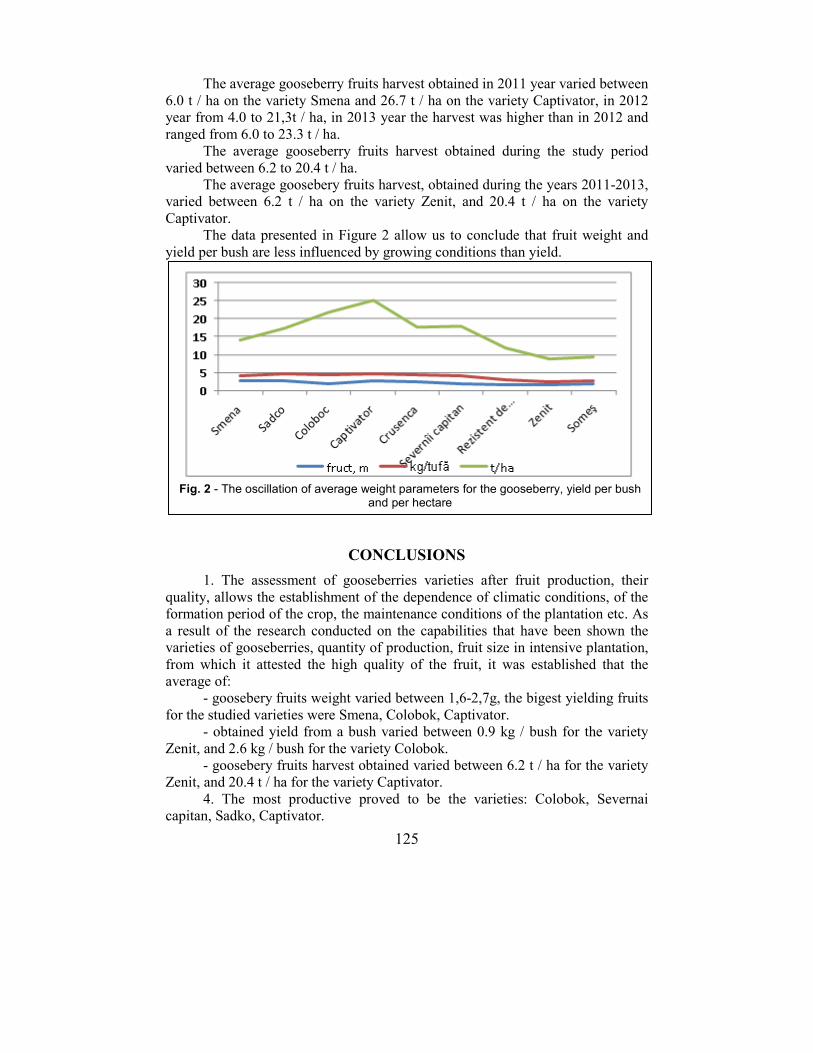
125
The average gooseberry fruits harvest obtained in 2011 year varied between
6.0 t / ha on the variety Smena and 26.7 t / ha on the variety Captivator, in 2012
year from 4.0 to 21,3t / ha, in 2013 year the harvest was higher than in 2012 and
ranged from 6.0 to 23.3 t / ha.
The average gooseberry fruits harvest obtained during the study period
varied between 6.2 to 20.4 t / ha.
The average goosebery fruits harvest, obtained during the years 2011-2013,
varied between 6.2 t / ha on the variety Zenit, and 20.4 t / ha on the variety
Captivator.
The data presented in Figure 2 allow us to conclude that fruit weight and
yield per bush are less influenced by growing conditions than yield.
CONCLUSIONS
1. The assessment of gooseberries varieties after fruit production, their
quality, allows the establishment of the dependence of climatic conditions, of the
formation period of the crop, the maintenance conditions of the plantation etc. As
a result of the research conducted on the capabilities that have been shown the
varieties of gooseberries, quantity of production, fruit size in intensive plantation,
from which it attested the high quality of the fruit, it was established that the
average of:
- goosebery fruits weight varied between 1,6-2,7g, the bigest yielding fruits
for the studied varieties were Smena, Colobok, Captivator.
- obtained yield from a bush varied between 0.9 kg / bush for the variety
Zenit, and 2.6 kg / bush for the variety Colobok.
- goosebery fruits harvest obtained varied between 6.2 t / ha for the variety
Zenit, and 20.4 t / ha for the variety Captivator.
4. The most productive proved to be the varieties: Colobok, Severnai
capitan, Sadko, Captivator.
Fig. 2 - The oscillation of average weight parameters for the gooseberry, yield per bush
and per hectare
126
REFERENCES
1. Franciuc Е., 1975 – Himico-thnologhicescaia otenca novih sortov crijovnica. VNIIS im.
V. I. Мicirina, sb.n.p., vol. 21, Мiciurinsc, ВНИИС, p. 74-82. 2. Hoza D., 2000 - Cultura căpşunului, semi-arbuştilor şi arbuştilor fructiferi, Bucureşti, pp.
184-224. 3. Luchina А., 1975 - Economicescaia efectivnosti crijovnica v RSFSR.VNIIS im. V. I.
Мicirina, sb.n.p., vol. 21, Мiciurinsc, pp. 232-235. 4. Mihăiescu G., 1977 - Pomicultura specială, Bucureşti, pp. 326-328. 5. Mladin Gh., Mladin Paulina, 1992 - Cultura arbuştilor fructiferi pe spaţii restrânse,
Bucureşti, pp. 34-39, 114, 135-149. 6. Sava Parascovia, 2003 - Contribuţii la studiul comportării unor soiuri de agriş în
Republica Moldova. Cercetări în pomicultură. ICDP Pitesti,. vol .2, pp. 151-154. 7. Zaletilo А., 1975 – Sortoizucenie crijovnica v Severo-Kazahstanscoi oblasti, VNIIS im.
I.V.Miciurina,sb.n.r. vip./21, Miciurinsc, pp.43-47. 8. Zazulina N., 2004 – Ishodnii material dlia selectii novih sortov crijovnica. Plodovodstvo.
Iagodovodstvo na sovremenom etape. Маtеr. mеjd. nauc-pract. Conf.Конф., Belorusia, nauc.тr., t.15, pp.103-106.
127
RESEARCH CONCERNING THE INFLUENCE OF CLIMATE CONDITION OVER THE PHENOLOGICAL STAGES AT
WALNUT TREE (JUGLANS REGIA L.)
CERCETĂRI PRIVIND INFLUENŢA CONDIŢIILOR CLIMATICE ASUPRA STADIILOR FENOLOGICE LA NUC (JUGLANS REGIA L.)
SÎRBU Sorina1, IUREA Elena1, CORNEANU G.1
e-mail: [email protected]
Abstract. Carrying out the phenological stages of vegetation and fruit set in walnut is determined by the cumulative action of daily average temperatures exceeding 10°C, value considered as biological limit of walnut cultivars. In climate conditions from last few years, some changes was observed about values of the sum degree of active temperature necessary onset the phenological stages of walnut tree. The research was conducted during 2009-2013 by six walnut cultivars with different fruit maturation period, existing in the experimental plot from Research Station for Fruit Growing Iaşi, Romania. The paper aims to determine the active thermal balance needed to carry out the fruiting phenophases and comparing the results with data cited in the literature. Key words: temperature, phenology, cultivars, flowering, fruiting, walnut tree.
Rezumat. Desfăşurarea fenofazelor de vegetaţie şi fructificare la nuc este determinată de acţiunea cumulată a temperaturilor medii zilnice ce depăşesc valoarea de 10°C, considerată prag biologic la specia nuc. În condiţiile climatice din ultimii ani, s-a observat o schimbare a sumei gradelor de temperatură activă necesară declanşării stadiilor fenologice la nuc. Cercetările au fost efectuate pe perioada 2009-2013 la şase soiuri de nuc cu perioada de maturare a fructului diferită, existente în lotul experimental din cadrul Staţiunii de Cercetare-Dezvoltare pentru Pomicultură, Iaşi. Lucrarea are ca obiectiv determinarea bilanţului termic activ necesar desfăşurării fenofazelor de fructificare şi compararea rezultatelor cu datele citate în literatură. Cuvinte cheie: temperatură, fenologie, soiuri, înflorire, fructificare, nuc.
INTRODUCTION
The walnut tree is a species with economic importance due to nutritional,
technological and commercial aspects of the fruits (Botu et al., 2001). In Romania,
area cultivated with walnut is about 1,500 ha with an average production of 20 t /
ha and total production of 30,500 tonnes in 2012 (FAOSTAT). In the last five years
have seen a decrease in the cultivated area with walnut trees but still a demand of
planting material from the nursery.
Study phenophases in walnut is important to determine the optimal
conditions during flowering to ensure the fruit onset. Changes current climate
conditions influences the phenological stages of plants (Inouye, 2008; Inouye et al.,
1 Research and Development Station for Fruit Tree Growing of Iaşi, Romania
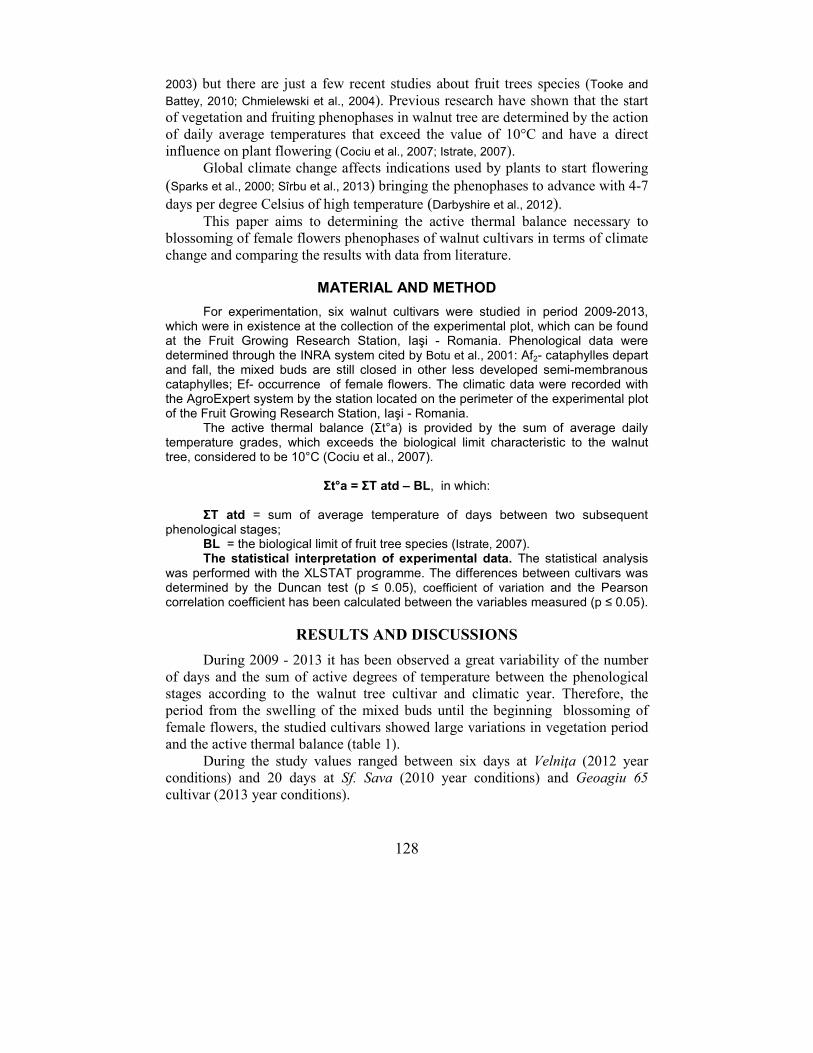
128
2003) but there are just a few recent studies about fruit trees species (Tooke and
Battey, 2010; Chmielewski et al., 2004). Previous research have shown that the start
of vegetation and fruiting phenophases in walnut tree are determined by the action
of daily average temperatures that exceed the value of 10°C and have a direct
influence on plant flowering (Cociu et al., 2007; Istrate, 2007).
Global climate change affects indications used by plants to start flowering
(Sparks et al., 2000; Sîrbu et al., 2013) bringing the phenophases to advance with 4-7
days per degree Celsius of high temperature (Darbyshire et al., 2012). This paper aims to determining the active thermal balance necessary to
blossoming of female flowers phenophases of walnut cultivars in terms of climate
change and comparing the results with data from literature.
MATERIAL AND METHOD
For experimentation, six walnut cultivars were studied in period 2009-2013, which were in existence at the collection of the experimental plot, which can be found at the Fruit Growing Research Station, Iaşi - Romania. Phenological data were determined through the INRA system cited by Botu et al., 2001: Af2- cataphylles depart and fall, the mixed buds are still closed in other less developed semi-membranous cataphylles; Ef- occurrence of female flowers. The climatic data were recorded with the AgroExpert system by the station located on the perimeter of the experimental plot of the Fruit Growing Research Station, Iaşi - Romania.
The active thermal balance (Σt°a) is provided by the sum of average daily temperature grades, which exceeds the biological limit characteristic to the walnut tree, considered to be 10°C (Cociu et al., 2007).
Σt°a = ΣT atd – BL, in which:
ΣT atd = sum of average temperature of days between two subsequent
phenological stages; BL = the biological limit of fruit tree species (Istrate, 2007). The statistical interpretation of experimental data. The statistical analysis
was performed with the XLSTAT programme. The differences between cultivars was determined by the Duncan test (p ≤ 0.05), coefficient of variation and the Pearson correlation coefficient has been calculated between the variables measured (p ≤ 0.05).
RESULTS AND DISCUSSIONS
During 2009 - 2013 it has been observed a great variability of the number
of days and the sum of active degrees of temperature between the phenological
stages according to the walnut tree cultivar and climatic year. Therefore, the
period from the swelling of the mixed buds until the beginning blossoming of
female flowers, the studied cultivars showed large variations in vegetation period
and the active thermal balance (table 1).
During the study values ranged between six days at Velniţa (2012 year
conditions) and 20 days at Sf. Sava (2010 year conditions) and Geoagiu 65
cultivar (2013 year conditions).
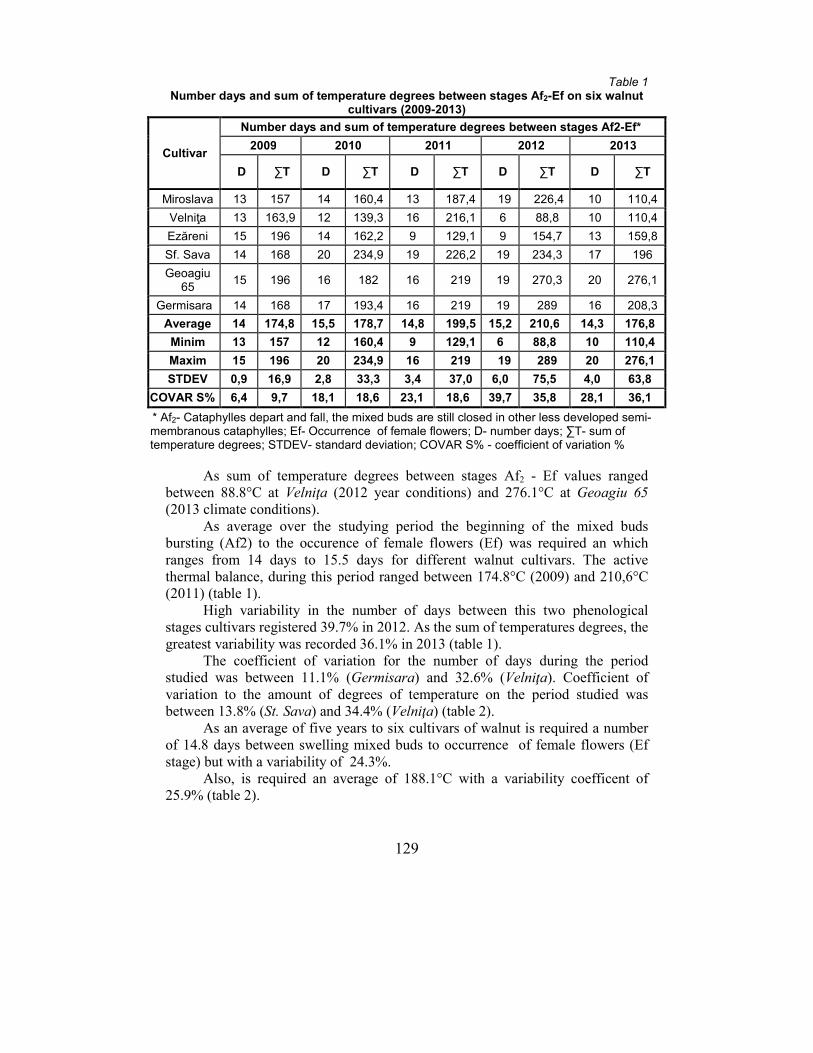
129
Table 1 Number days and sum of temperature degrees between stages Af2-Ef on six walnut
cultivars (2009-2013)
Cultivar
Number days and sum of temperature degrees between stages Af2-Ef*
2009 2010 2011 2012 2013
D ∑T D ∑T D ∑T D ∑T D ∑T
Miroslava 13 157 14 160,4 13 187,4 19 226,4 10 110,4
Velniţa 13 163,9 12 139,3 16 216,1 6 88,8 10 110,4
Ezăreni 15 196 14 162,2 9 129,1 9 154,7 13 159,8
Sf. Sava 14 168 20 234,9 19 226,2 19 234,3 17 196
Geoagiu 65
15 196 16 182 16 219 19 270,3 20 276,1
Germisara 14 168 17 193,4 16 219 19 289 16 208,3
Average 14 174,8 15,5 178,7 14,8 199,5 15,2 210,6 14,3 176,8
Minim 13 157 12 160,4 9 129,1 6 88,8 10 110,4
Maxim 15 196 20 234,9 16 219 19 289 20 276,1
STDEV 0,9 16,9 2,8 33,3 3,4 37,0 6,0 75,5 4,0 63,8
COVAR S% 6,4 9,7 18,1 18,6 23,1 18,6 39,7 35,8 28,1 36,1
* Af2- Cataphylles depart and fall, the mixed buds are still closed in other less developed semi-membranous cataphylles; Ef- Occurrence of female flowers; D- number days; ∑T- sum of temperature degrees; STDEV- standard deviation; COVAR S% - coefficient of variation %
As sum of temperature degrees between stages Af2 - Ef values ranged
between 88.8°C at Velniţa (2012 year conditions) and 276.1°C at Geoagiu 65
(2013 climate conditions).
As average over the studying period the beginning of the mixed buds
bursting (Af2) to the occurence of female flowers (Ef) was required an which
ranges from 14 days to 15.5 days for different walnut cultivars. The active
thermal balance, during this period ranged between 174.8°C (2009) and 210,6°C
(2011) (table 1).
High variability in the number of days between this two phenological
stages cultivars registered 39.7% in 2012. As the sum of temperatures degrees, the
greatest variability was recorded 36.1% in 2013 (table 1).
The coefficient of variation for the number of days during the period
studied was between 11.1% (Germisara) and 32.6% (Velniţa). Coefficient of
variation to the amount of degrees of temperature on the period studied was
between 13.8% (St. Sava) and 34.4% (Velniţa) (table 2).
As an average of five years to six cultivars of walnut is required a number
of 14.8 days between swelling mixed buds to occurrence of female flowers (Ef
stage) but with a variability of 24.3%.
Also, is required an average of 188.1°C with a variability coefficent of
25.9% (table 2).
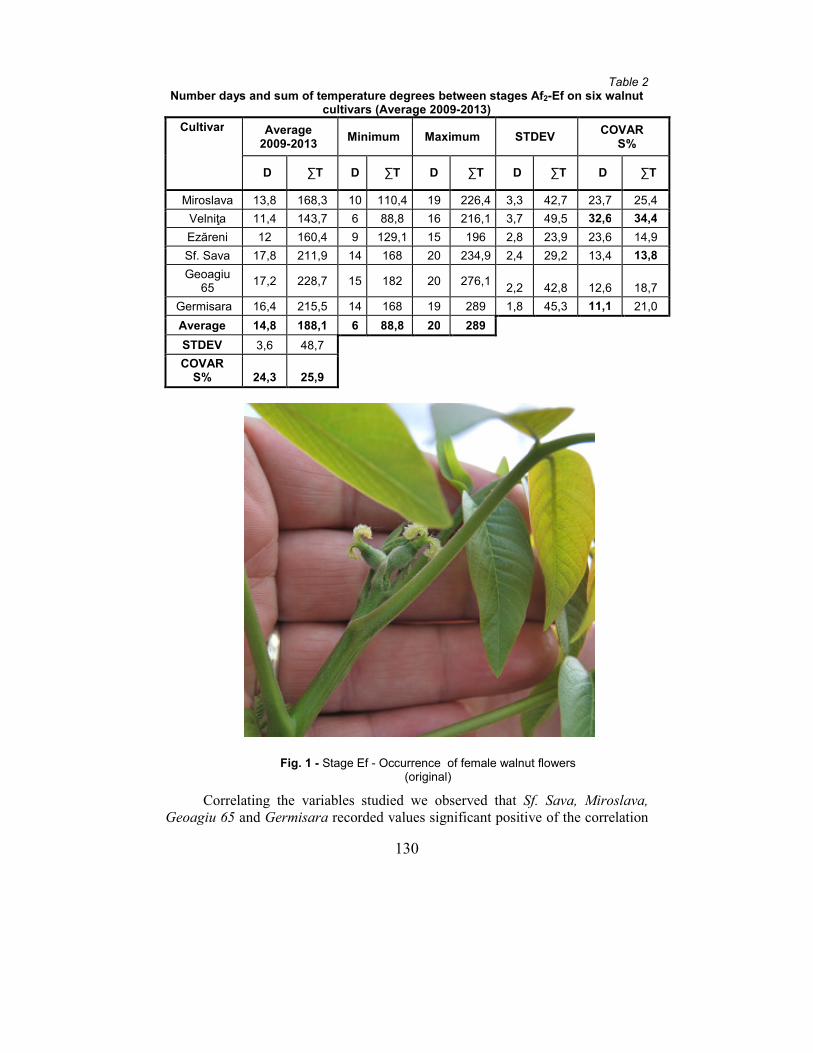
130
Fig. 1 - Stage Ef - Occurrence of female walnut flowers (original)
Table 2 Number days and sum of temperature degrees between stages Af2-Ef on six walnut
cultivars (Average 2009-2013)
Cultivar Average 2009-2013
Minimum Maximum STDEV COVAR
S%
D ∑T D ∑T D ∑T D ∑T D ∑T
Miroslava 13,8 168,3 10 110,4 19 226,4 3,3 42,7 23,7 25,4
Velniţa 11,4 143,7 6 88,8 16 216,1 3,7 49,5 32,6 34,4
Ezăreni 12 160,4 9 129,1 15 196 2,8 23,9 23,6 14,9
Sf. Sava 17,8 211,9 14 168 20 234,9 2,4 29,2 13,4 13,8
Geoagiu 65
17,2 228,7 15 182 20 276,1 2,2 42,8 12,6 18,7
Germisara 16,4 215,5 14 168 19 289 1,8 45,3 11,1 21,0
Average 14,8 188,1 6 88,8 20 289
STDEV 3,6 48,7
COVAR S% 24,3 25,9
Correlating the variables studied we observed that Sf. Sava, Miroslava, Geoagiu 65 and Germisara recorded values significant positive of the correlation
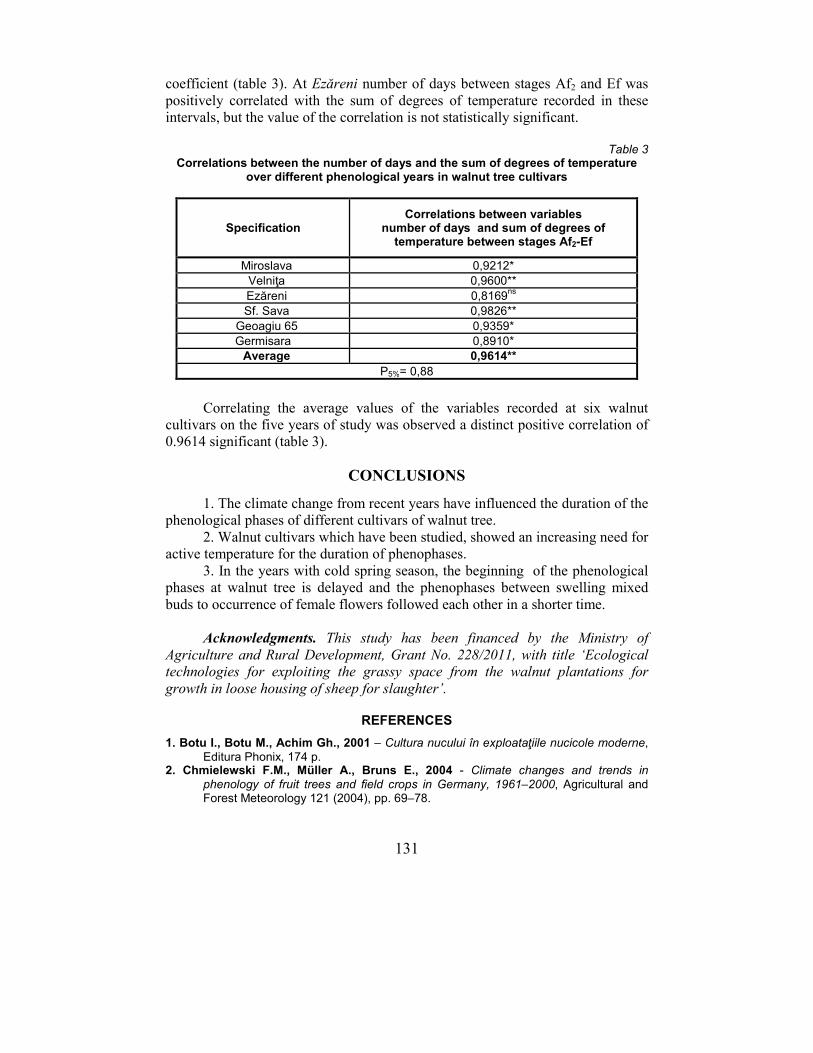
131
coefficient (table 3). At Ezăreni number of days between stages Af2 and Ef was
positively correlated with the sum of degrees of temperature recorded in these
intervals, but the value of the correlation is not statistically significant.
Table 3
Correlations between the number of days and the sum of degrees of temperature over different phenological years in walnut tree cultivars
Specification Correlations between variables
number of days and sum of degrees of temperature between stages Af2-Ef
Miroslava 0,9212*
Velniţa 0,9600**
Ezăreni 0,8169ns
Sf. Sava 0,9826**
Geoagiu 65 0,9359*
Germisara 0,8910*
Average 0,9614**
P5%= 0,88
Correlating the average values of the variables recorded at six walnut
cultivars on the five years of study was observed a distinct positive correlation of
0.9614 significant (table 3).
CONCLUSIONS
1. The climate change from recent years have influenced the duration of the
phenological phases of different cultivars of walnut tree.
2. Walnut cultivars which have been studied, showed an increasing need for
active temperature for the duration of phenophases.
3. In the years with cold spring season, the beginning of the phenological
phases at walnut tree is delayed and the phenophases between swelling mixed
buds to occurrence of female flowers followed each other in a shorter time.
Acknowledgments. This study has been financed by the Ministry of
Agriculture and Rural Development, Grant No. 228/2011, with title ‘Ecological technologies for exploiting the grassy space from the walnut plantations for growth in loose housing of sheep for slaughter’.
REFERENCES
1. Botu I., Botu M., Achim Gh., 2001 – Cultura nucului în exploataţiile nucicole moderne,
Editura Phonix, 174 p. 2. Chmielewski F.M., Müller A., Bruns E., 2004 - Climate changes and trends in
phenology of fruit trees and field crops in Germany, 1961–2000, Agricultural and Forest Meteorology 121 (2004), pp. 69–78.
132
3. Cociu V., Botu M., Achim Gh., Botu I. Preda S., Iancu M., 2007 – Nucul, alunul,
castanul şi alte nucifere, Edit. Conphys, 304 p. 4. Darbyshire R., Webb L., Goodwin I., Barlow E. W. R., 2012 - Evaluation of recent
trends in Australian pome fruit spring phenology, International Journal of Biometeorology, available as abstract on http://link.springer.com/article/1# (accessed 13.02.2013).
5. Inouye D. W., 2008 - Effects of climate change on phenology, frost damage, and floral abundance of montane wildflowers, Ecology, 89(2), 2008, pp. 353–362.
6. Inouye D. W., Saavedra F., Lee-Yang W., 2003 - Environmental influences on the
phenology and abundance of flowering by Androsace Septentrionalis (Primulaceae), American Journal of Botany 90(6), pp. 905–910.
7. Istrate M., 2007 - Pomicultură generală, Edit. Ion Ionescu de la Brad, Iaşi, 296 p. 8. Sîrbu Sorina, Iurea Elena, Corneanu Margareta, 2013 - Research concerning the
influence of current climate changes over the phenological stages at sweet cherry tree (Prunus avium L.), Lucr. st. USAMV Iaşi, Seria Horticultură, vol. 56, nr. 2, pp. 201-207.
9. Sparks TH, Jeffree EP, Jeffree CE., 2000 - An examination of the relationship between
flowering times and temperature at the national scale using long-term phenological records from the UK, International Journal of Biometeorology 44, pp. 82–87.
10. Tooke F., Battey N. H., 2010 - Temperate flowering phenology, Journal of
Experimental Botany, Vol. 61, No. 11, pp. 2853–2862. 11. http://faostat3.fao.org
133
STUDY ON ESTABLISHMENT OF A CROWN-SHAPED FRUIT FENCE, PALMET CHANDELIER WITH SIX ARMS
AND BELGIAN FENCE SYSTEM AND HOW TO USE THEIR IN LANDSCAPING
STUDIU PRIVIND REALIZAREA FORMELOR DE COROANĂ PENTRU
GARDURI FRUCTIFERE ÎN SISTEMELE PALMETA CANDELABRU CU ŞASE BRAȚE ŞI SISTEMUL GARD BELGIAN ŞI MODUL DE
UTILIZARE A ACESTORA ÎN AMENAJĂRI PEISAGISTICE
SILIVĂȘAN M.1, BERAR C.1, TOŢA C.1, MERGHEŞ P.1
e-mail: [email protected]
Abstract: The research was conducted over six years of USAMVB Didactic Timişoara. In the paper were studied two varieties of apple and two of pear, which resulted in systems palmettes crown chandelier whit 6 arms and systems fence Belgian, for making fruit fences. The method of embodiment was based on the realization of different types of forming operations such as:
- operations of changing the position of growth branches and the shoots of which we mention, operations for forming a branch and operations of pinching the branches;
- proper cutting operations of which we mention operations training of the trunk, operations of branches shortness and operations of branches notching. Key words: apple trees, landscape, pear trees, espaliered fruit trees Rezumat: Cercetările s-au efectuat pe parcursul a șase ani la Staţiunea Didactică a U.S.A.M.V.B. Timişoara. În cadrul lucrării s-au luat în studiu două soiuri de măr respective două soiuri de păr, care s-au condus în sistemele de coroană Palmeta candelabru cu 6 brate şi sitemul gard belgian, pentru realizarea unor garduri fructifere. Metoda de realizare a avut la bază realizarea diferitelor tipuri de operaţii de formare cum sunt:
- operaţii de modificare a poziţiei de creştere a ramurilor şi lăstarilor din care amintim operaţii de dresare a unei ramuri respectiv operaţii de ciupit a lăstarilor;
- operaţii de tăieri propriu-zise, cum sunt operaţiile de formare a trunchiului, operaţii de scurtarea ramurilor respective, operatii de crestarea ramurilor. Cuvinte cheie: măr, amenajare peisageră, păr, forme artistice de pomi fructifer
INTRODUCTION
In the experimental plot established in 2004 in Didactic of U.S.A.M.V.B.
Timişoara was studied two varieties of pear, Clapp's favorite, and Cüré. The
purpose of the research concern the improvement sequences from technology
1 Banat University of Agricultural Sciences and Veterinary Medicine of Timişoara, Romania

134
training, artistic crown fruit trees and the possibility of using them in green spaces
(Baciu, 2005).
In the present paper were studied several apple varieties respectively pear
and follow the behavior of these species and varieties during training the proposed
crowns.
MATERIAL AND METHOD
To obtain the desired crown shapes, and a balance vertical (between floors or between branches of the stem axis) and a horizontal balance (between branches belonging to the same floor) are required 3-4 years and during which they are carried out 2 groups of technical operations: - Operations, to amend the position of the branches and shoots growing (Manageable, bending, arching, twisting, etc.); - Cutting operations themselves.
1. Working method for directing apple varieties in crown system, Candelabra Palmette with 6 branches
To form the crown system, Candelabra Palmette with 6 branches, rods were planted at 3.5 meters on rows, and 3.5 meters between rows. Height that is short the rod to form the trunk is 40-50 cm above 2 buds oriented time. Management operations that were conducted during this period pursued to obtain branches lengths of 150 cm, to keep a distance of about 40 cm between the branches that will form on them.
2. Working method for directing apple varieties in Belgian fence crown system
The trees were planted at a distance of 80 cm in the row and 3.5 m between rows. Shortening was done immediately after planting trees at a high trunk 60-65 cm above 2 buds and place opposite the row. These works mentioned were repeated throughout the research period until the form has reached the desired height (Iordănescu, 2008).
RESULTS AND DISCUSSION
A. The dynamic growth of fruit trees driven into the " Candelabra Palmette with 6 branches " at different varieties of apple and pear
To form the crown system, palmetto candelabra with six arms, the trees
were planted at 3.5 meters along the row and 3.5 m between rows. The height to
which the trees were shortened to form trunk is 40-50 cm above 2 buds oriented
along the row.
To present form was chosen the best specimen formed. From the buds left,
during training trunk of the tree, young shoots emerged, needed, training the
branches (Drăgănescu, 2002).
These shoots were conducted in a horizontal position on the line, always
keeping the tip of them tilted obliquely for rapid elongation.
The leadership of the two horizontal arms, was done from the first year,
when their length exceeded 50 cm in length and a diameter of 0.5 mm.
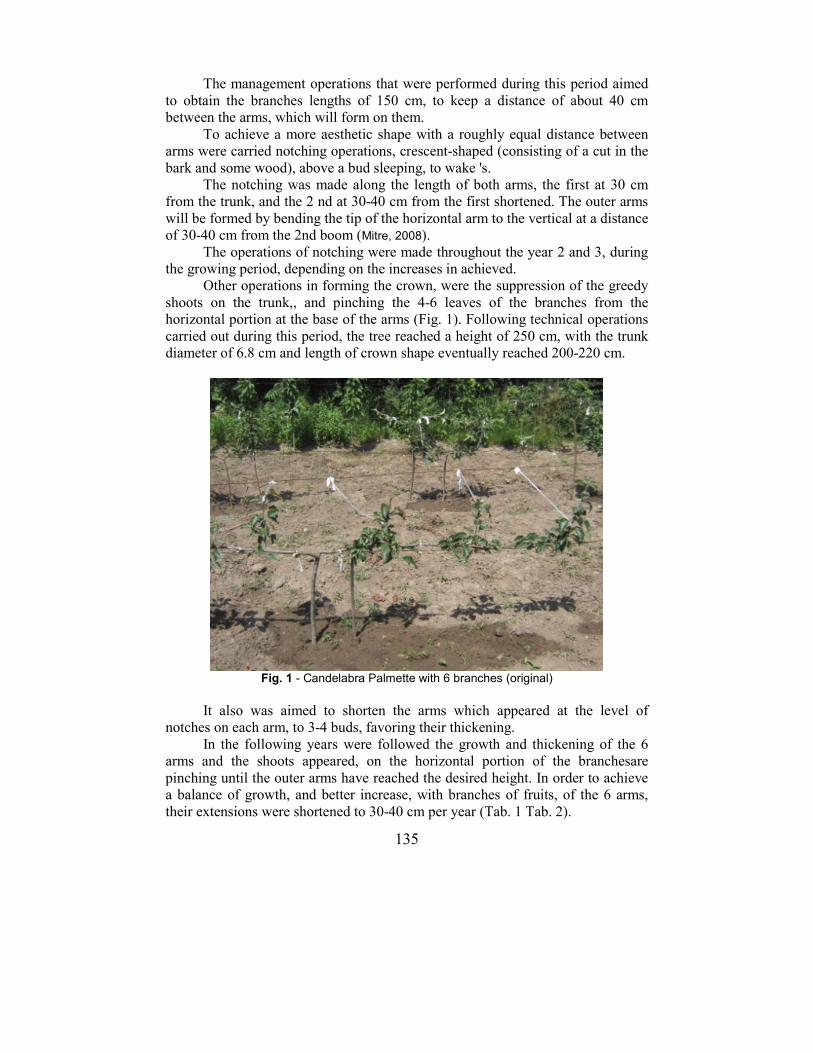
135
The management operations that were performed during this period aimed
to obtain the branches lengths of 150 cm, to keep a distance of about 40 cm
between the arms, which will form on them.
To achieve a more aesthetic shape with a roughly equal distance between
arms were carried notching operations, crescent-shaped (consisting of a cut in the
bark and some wood), above a bud sleeping, to wake 's.
The notching was made along the length of both arms, the first at 30 cm
from the trunk, and the 2 nd at 30-40 cm from the first shortened. The outer arms
will be formed by bending the tip of the horizontal arm to the vertical at a distance
of 30-40 cm from the 2nd boom (Mitre, 2008).
The operations of notching were made throughout the year 2 and 3, during
the growing period, depending on the increases in achieved.
Other operations in forming the crown, were the suppression of the greedy
shoots on the trunk,, and pinching the 4-6 leaves of the branches from the
horizontal portion at the base of the arms (Fig. 1). Following technical operations
carried out during this period, the tree reached a height of 250 cm, with the trunk
diameter of 6.8 cm and length of crown shape eventually reached 200-220 cm.
Fig. 1 - Candelabra Palmette with 6 branches (original)
It also was aimed to shorten the arms which appeared at the level of
notches on each arm, to 3-4 buds, favoring their thickening.
In the following years were followed the growth and thickening of the 6
arms and the shoots appeared, on the horizontal portion of the branchesare
pinching until the outer arms have reached the desired height. In order to achieve
a balance of growth, and better increase, with branches of fruits, of the 6 arms,
their extensions were shortened to 30-40 cm per year (Tab. 1 Tab. 2).
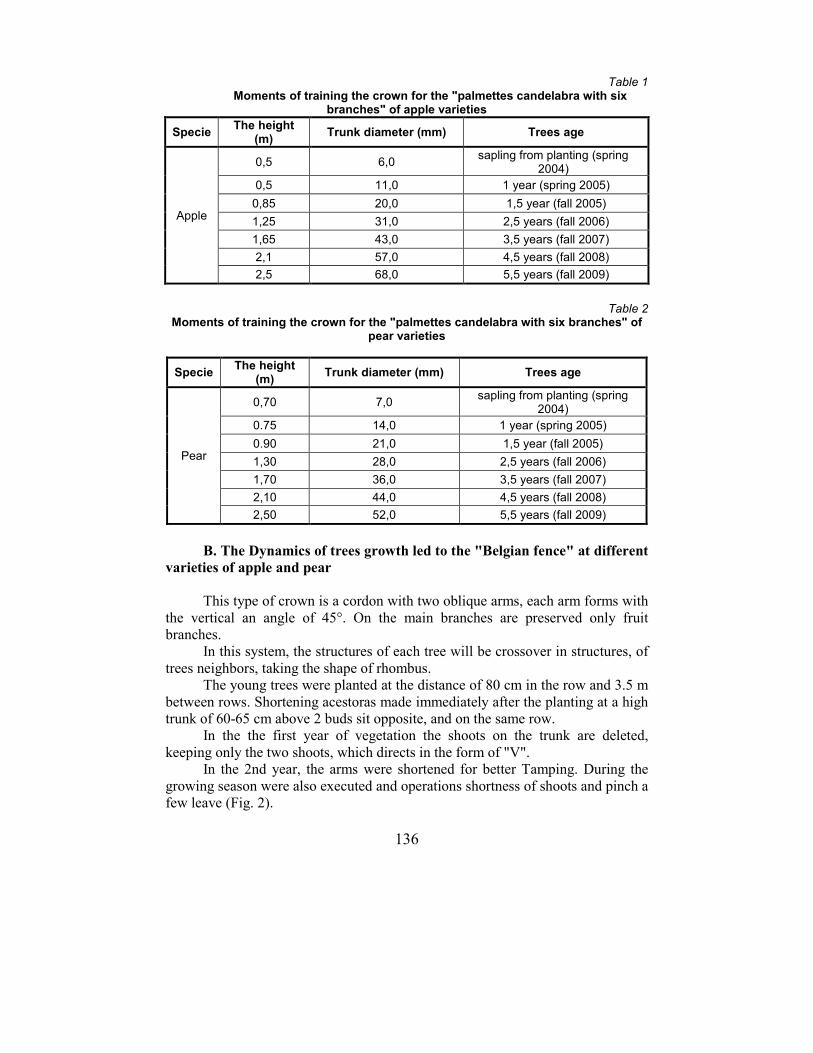
136
Table 1 Moments of training the crown for the "palmettes candelabra with six
branches" of apple varieties
Specie The height
(m) Trunk diameter (mm) Trees age
Apple
0,5 6,0 sapling from planting (spring
2004)
0,5 11,0 1 year (spring 2005)
0,85 20,0 1,5 year (fall 2005)
1,25 31,0 2,5 years (fall 2006)
1,65 43,0 3,5 years (fall 2007)
2,1 57,0 4,5 years (fall 2008)
2,5 68,0 5,5 years (fall 2009)
Table 2
Moments of training the crown for the "palmettes candelabra with six branches" of pear varieties
Specie The height
(m) Trunk diameter (mm) Trees age
Pear
0,70 7,0 sapling from planting (spring
2004)
0.75 14,0 1 year (spring 2005)
0.90 21,0 1,5 year (fall 2005)
1,30 28,0 2,5 years (fall 2006)
1,70 36,0 3,5 years (fall 2007)
2,10 44,0 4,5 years (fall 2008)
2,50 52,0 5,5 years (fall 2009)
B. The Dynamics of trees growth led to the "Belgian fence" at different
varieties of apple and pear
This type of crown is a cordon with two oblique arms, each arm forms with
the vertical an angle of 45°. On the main branches are preserved only fruit
branches.
In this system, the structures of each tree will be crossover in structures, of
trees neighbors, taking the shape of rhombus.
The young trees were planted at the distance of 80 cm in the row and 3.5 m
between rows. Shortening acestoras made immediately after the planting at a high
trunk of 60-65 cm above 2 buds sit opposite, and on the same row.
In the the first year of vegetation the shoots on the trunk are deleted,
keeping only the two shoots, which directs in the form of "V".
In the 2nd year, the arms were shortened for better Tamping. During the
growing season were also executed and operations shortness of shoots and pinch a
few leave (Fig. 2).
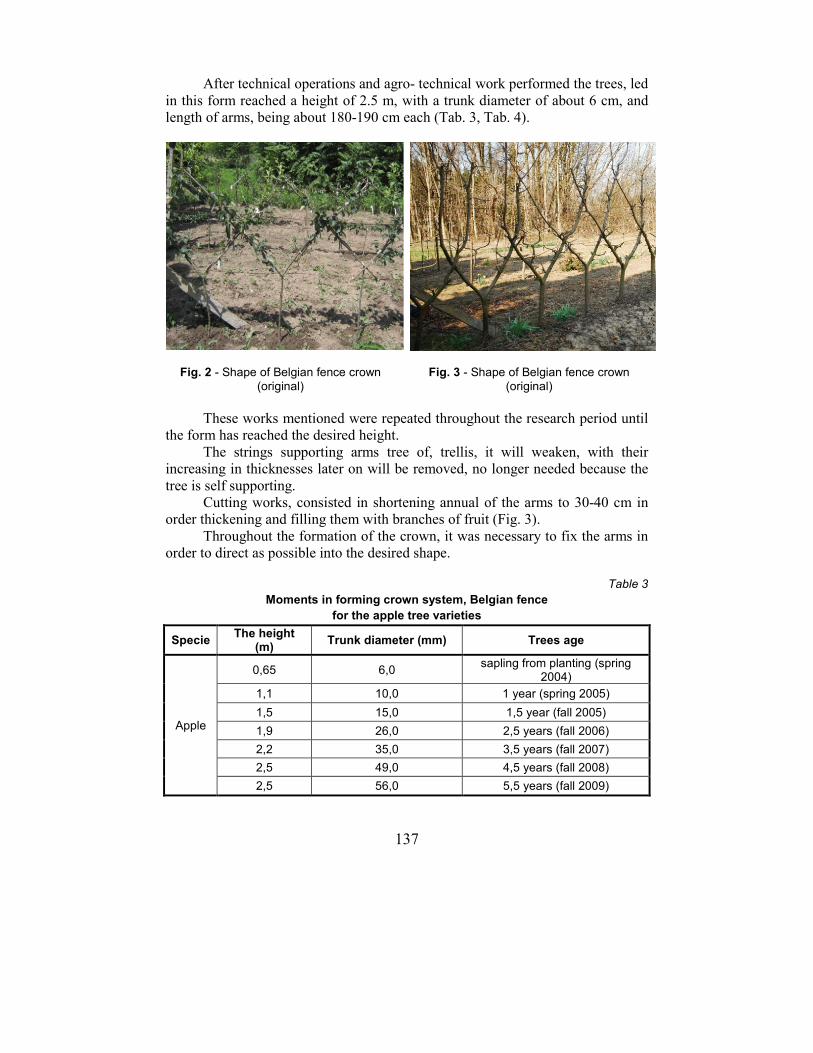
137
After technical operations and agro- technical work performed the trees, led
in this form reached a height of 2.5 m, with a trunk diameter of about 6 cm, and
length of arms, being about 180-190 cm each (Tab. 3, Tab. 4).
Fig. 2 - Shape of Belgian fence crown
(original)
Fig. 3 - Shape of Belgian fence crown
(original)
These works mentioned were repeated throughout the research period until
the form has reached the desired height.
The strings supporting arms tree of, trellis, it will weaken, with their
increasing in thicknesses later on will be removed, no longer needed because the
tree is self supporting.
Cutting works, consisted in shortening annual of the arms to 30-40 cm in
order thickening and filling them with branches of fruit (Fig. 3).
Throughout the formation of the crown, it was necessary to fix the arms in
order to direct as possible into the desired shape.
Table 3
Moments in forming crown system, Belgian fence
for the apple tree varieties
Specie The height
(m) Trunk diameter (mm) Trees age
Apple
0,65 6,0 sapling from planting (spring
2004)
1,1 10,0 1 year (spring 2005)
1,5 15,0 1,5 year (fall 2005)
1,9 26,0 2,5 years (fall 2006)
2,2 35,0 3,5 years (fall 2007)
2,5 49,0 4,5 years (fall 2008)
2,5 56,0 5,5 years (fall 2009)
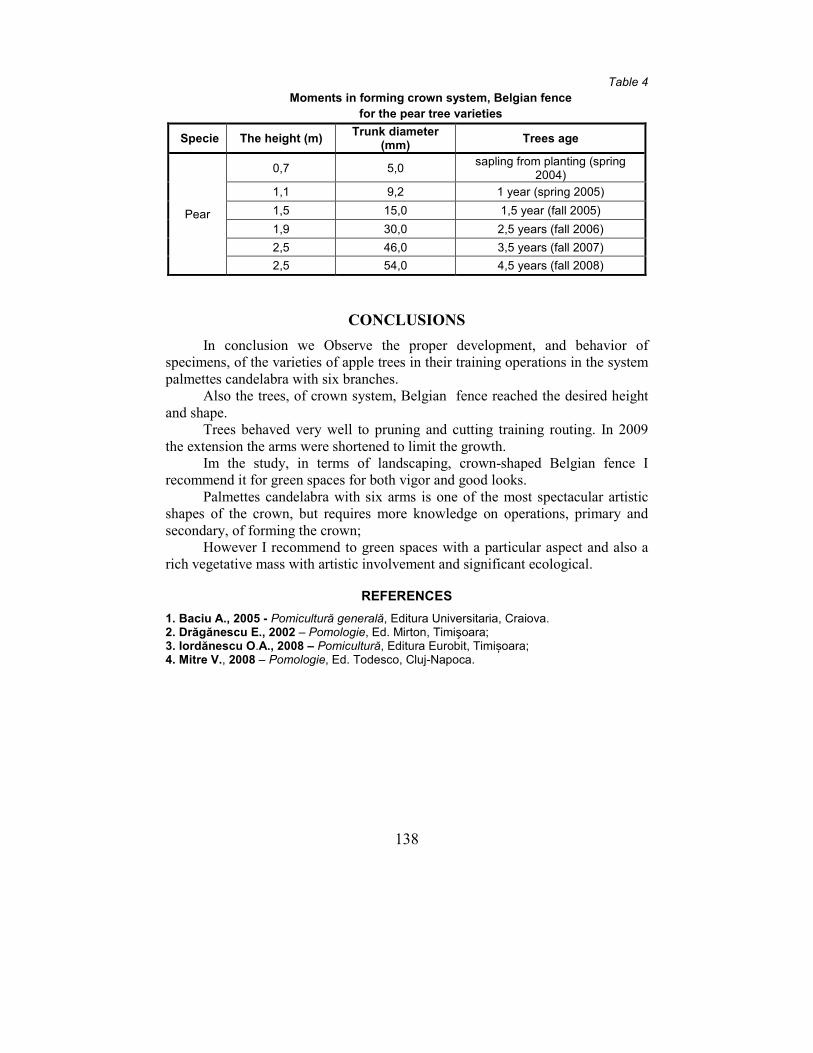
138
Table 4
Moments in forming crown system, Belgian fence
for the pear tree varieties
Specie The height (m) Trunk diameter
(mm) Trees age
Pear
0,7 5,0 sapling from planting (spring
2004)
1,1 9,2 1 year (spring 2005)
1,5 15,0 1,5 year (fall 2005)
1,9 30,0 2,5 years (fall 2006)
2,5 46,0 3,5 years (fall 2007)
2,5 54,0 4,5 years (fall 2008)
CONCLUSIONS
In conclusion we Observe the proper development, and behavior of
specimens, of the varieties of apple trees in their training operations in the system
palmettes candelabra with six branches.
Also the trees, of crown system, Belgian fence reached the desired height
and shape.
Trees behaved very well to pruning and cutting training routing. In 2009
the extension the arms were shortened to limit the growth.
Im the study, in terms of landscaping, crown-shaped Belgian fence I
recommend it for green spaces for both vigor and good looks.
Palmettes candelabra with six arms is one of the most spectacular artistic
shapes of the crown, but requires more knowledge on operations, primary and
secondary, of forming the crown;
However I recommend to green spaces with a particular aspect and also a
rich vegetative mass with artistic involvement and significant ecological.
REFERENCES
1. Baciu A., 2005 - Pomicultură generală, Editura Universitaria, Craiova. 2. Drăgănescu E., 2002 – Pomologie, Ed. Mirton, Timişoara; 3. Iordănescu O.A., 2008 – Pomicultură, Editura Eurobit, Timișoara; 4. Mitre V., 2008 – Pomologie, Ed. Todesco, Cluj-Napoca.
139
THE PHYTOSANITARY PROTECTION IN CHERRY PLANTATIONS
PROTECȚIA FITOSANITARĂ ÎN PLANTAȚIILE DE CIREȘ
BEȘLEAGĂ Ramona1, CÂRDEI E.1, CORNEANU G.1
e-mail: [email protected]
Abstract: In the period 2012-2014, at SCDP Iaşi we carried out researches regarding the control of the main pathogen agents and pests in the cherry species. The experiment took place on a cherry plantation for the breeds Van, Stela and Boambe de Cotnari. The experiments aimed at controlling anthracnose, moniliosis, the San Jose scale and the cherry fruit fly by using products for plant protection such as: Signum 0.03%, Copernico 0.2%, Funguran 0.2% Decis 25 WG 0.003%, Calypso 0.02%,Rovral 0.075%, Novadim 0.13%,Decis Mega 0.0125%. Key words: Cocomyces hiemalis, fertilizers, phytoprotection, Rhagoletis cerasi Rezumat: În perioada 2012-2014, la SCDP Iaşi s-au efectuat cercetări cu privire la combaterea principalilor patogeni şi dăunători întâlniţi la specia cireş. Experienţa s-a desfăşurat într-o plantaţie de cireş pe soiurile: Van, Stela şi Boambe de Cotnari. În cadrul experimentărilor s-a urmărit combaterea antracnozei, moniliozei şi a muştei cireşelor, utilizându-se s produse de protecţia plantelor de ultimă generaţie: Signum 0,03%, Copernico 0,2%, Funguran 0,2% Decis 25 WG 0,003%, Calypso 0,02%, Rovral 0,075%, Novadim 0,13%, Decis Mega 0,0125%. Cuvinte cheie: Cocomyces hiemalis, fertilizanţi, fitoprotecţie, Rhagoletis cerasi
INTRODUCTION
The importance of cherry culture is well known and it has a significant
weight in the Romanian pomiculture due to its large flexibility of adaptation to edaphic conditions of our country (Budan and Grădinariu, 2000, Cârdei et al., 2010).
The cherry tree like all the other fruit-growing species is attacked by
numerous pathogens and pests. In our country, in recent years, the diseases and pests having a special
economic importance for the cherry tree have been the brown rot (Monilinia fructigena), anthracnose (Coccomyces hiemalis), the cherry fruit fly (Rhagoletis cerasi) and San Jose scale (Quadraspidiotus perniciosus Comst).(Sumedrea et
al., 2009). The prevention or the reduction of losses caused by them is achieved by the application of phytosanitary hygiene, agrotechnical, biotechnical,
biological and chemical measures gathered under the name of integrated control (Cârdei, 2005, Cârdei and Rominger, 1997). Chemical control has a special role within this concept.
1 Research and Development Station for Fruit Tree Growing of Iaşi, Romania
140
MATERIAL AND METHOD
Thus, at SCDP Iași in the period 2012 - 2014, we carried out researches regarding the control of main pathogens and pests frequently encountered in the cherry species by using leading-edge products for plant protection.
The experiment was carried out in a cherry plantation for the species Van, Stela, and Boambe de Cotnari. During the experiments, we tried to control anthracnose, the brown rot, the San Jose scale and the cherry fruit fly by using leading-edge products for plant protection (table 1).
The phytosanitary treatment programme applied in the interval 2012-2014 contained 5 or even 6 treatments (in 2013), their number varying depending on the meteorological conditions that have a determining role in the evolution of pathogens and pests (table 2).
We applied 5-6 phytosanitary treatments out of which one was prefloral phase and one was postharvest. We performed observations and determinations related to the frequency, the intensity and the attack level of Coccomyces hiemalis and Monilinia fructigena fungi as well as the attack of cherry fruit fly.
As it is well known, the evolution of pathogens and pests is influenced by the climatic conditions. In the period of experiment they varied from one year to another. Despite all these, each year there were optimal conditions for the evolution of pathogens and pests.
In general, the monthly average temperatures in the period April-August fitted into the normal values, the precipitations representing the climatic element that mainly influenced the rapid evolution and attack of brown rot.
For example, in the past two years, in May-June, 293 mm (2013) and 118.2 mm (2104) were registered exactly in the period of ripening and maturation of fruits. The number of rainy days was also high varying between 8-20 days in 2013 and 8-16 days in 2014. These precipitations correlated with the high temperatures and moisture favored the evolution of diseases.
RESULTS AND DISCUSSIONS
The climatic conditions from the interval 2012-2014 were favorable for the evolution of the main diseases and pests and in the past two years they were
even very favorable for the brown rot. Thus, in the phytosanitary programme we used leading-edge products for
plant protection having a special efficacy in the control of anthracnose, brown
rot and the cherry fruit fly. Besides these pesticides, in the phytosanitary programme we also used
foliar fertilizers which have an important role in yield both from the qualitative and the quantitative viewpoints.
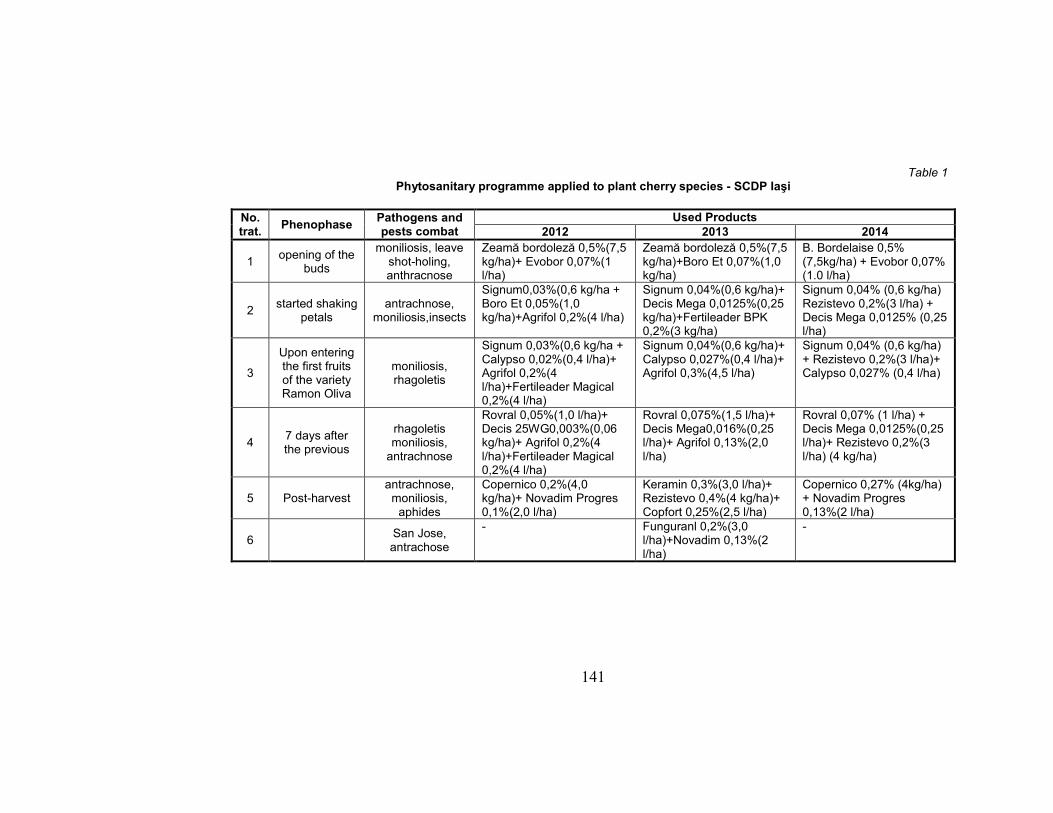
141
Table 1 Phytosanitary programme applied to plant cherry species - SCDP Iaşi
No. trat.
Phenophase Pathogens and pests combat
Used Products
2012 2013 2014
1 opening of the
buds
moniliosis, leave shot-holing, anthracnose
Zeamă bordoleză 0,5%(7,5 kg/ha)+ Evobor 0,07%(1 l/ha)
Zeamă bordoleză 0,5%(7,5 kg/ha)+Boro Et 0,07%(1,0 kg/ha)
B. Bordelaise 0,5% (7,5kg/ha) + Evobor 0,07% (1.0 l/ha)
2 started shaking
petals antrachnose,
moniliosis,insects
Signum0,03%(0,6 kg/ha + Boro Et 0,05%(1,0 kg/ha)+Agrifol 0,2%(4 l/ha)
Signum 0,04%(0,6 kg/ha)+ Decis Mega 0,0125%(0,25 kg/ha)+Fertileader BPK 0,2%(3 kg/ha)
Signum 0,04% (0,6 kg/ha) Rezistevo 0,2%(3 l/ha) + Decis Mega 0,0125% (0,25 l/ha)
3
Upon entering the first fruits of the variety Ramon Oliva
moniliosis, rhagoletis
Signum 0,03%(0,6 kg/ha + Calypso 0,02%(0,4 l/ha)+ Agrifol 0,2%(4 l/ha)+Fertileader Magical 0,2%(4 l/ha)
Signum 0,04%(0,6 kg/ha)+ Calypso 0,027%(0,4 l/ha)+ Agrifol 0,3%(4,5 l/ha)
Signum 0,04% (0,6 kg/ha) + Rezistevo 0,2%(3 l/ha)+ Calypso 0,027% (0,4 l/ha)
4 7 days after the previous
rhagoletis moniliosis,
antrachnose
Rovral 0,05%(1,0 l/ha)+ Decis 25WG0,003%(0,06 kg/ha)+ Agrifol 0,2%(4 l/ha)+Fertileader Magical 0,2%(4 l/ha)
Rovral 0,075%(1,5 l/ha)+ Decis Mega0,016%(0,25 l/ha)+ Agrifol 0,13%(2,0 l/ha)
Rovral 0,07% (1 l/ha) + Decis Mega 0,0125%(0,25 l/ha)+ Rezistevo 0,2%(3 l/ha) (4 kg/ha)
5 Post-harvest antrachnose,
moniliosis, aphides
Copernico 0,2%(4,0 kg/ha)+ Novadim Progres 0,1%(2,0 l/ha)
Keramin 0,3%(3,0 l/ha)+ Rezistevo 0,4%(4 kg/ha)+ Copfort 0,25%(2,5 l/ha)
Copernico 0,27% (4kg/ha) + Novadim Progres 0,13%(2 l/ha)
6 San Jose, antrachose
- Funguranl 0,2%(3,0 l/ha)+Novadim 0,13%(2 l/ha)
-
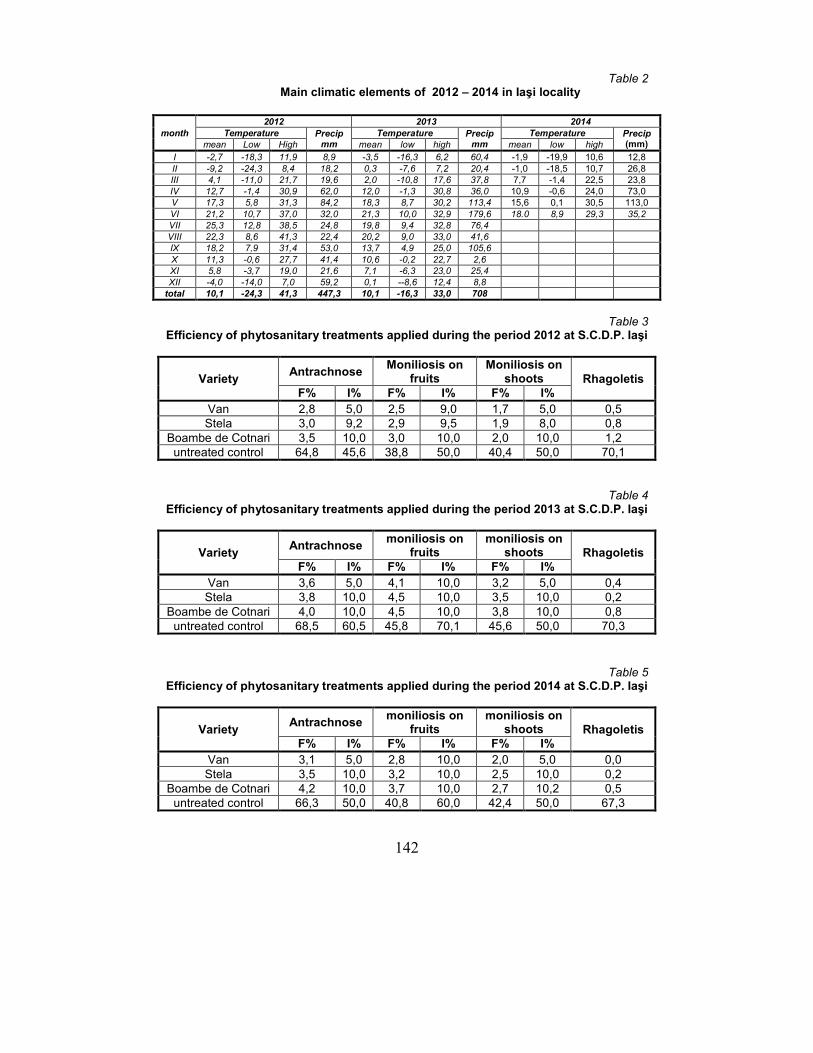
142
Table 2 Main climatic elements of 2012 – 2014 in Iaşi locality
month
2012 2013 2014
Temperature Precip
mm
Temperature Precip
mm
Temperature Precip (mm) mean Low High mean low high mean low high
I -2,7 -18,3 11,9 8,9 -3,5 -16,3 6,2 60,4 -1,9 -19,9 10,6 12,8 II -9,2 -24,3 8,4 18,2 0,3 -7,6 7,2 20,4 -1,0 -18,5 10,7 26,8 III 4,1 -11,0 21,7 19,6 2,0 -10,8 17,6 37,8 7,7 -1,4 22,5 23,8 IV 12,7 -1,4 30,9 62,0 12,0 -1,3 30,8 36,0 10,9 -0,6 24,0 73,0 V 17,3 5,8 31,3 84,2 18,3 8,7 30,2 113,4 15,6 0,1 30,5 113,0 VI 21,2 10,7 37,0 32,0 21,3 10,0 32,9 179,6 18.0 8,9 29,3 35,2 VII 25,3 12,8 38,5 24,8 19,8 9,4 32,8 76,4 VIII 22,3 8,6 41,3 22,4 20,2 9,0 33,0 41,6 IX 18,2 7,9 31,4 53,0 13,7 4,9 25,0 105,6
X 11,3 -0,6 27,7 41,4 10,6 -0,2 22,7 2,6 XI 5,8 -3,7 19,0 21,6 7,1 -6,3 23,0 25,4 XII -4,0 -14,0 7,0 59,2 0,1 --8,6 12,4 8,8 total 10,1 -24,3 41,3 447,3 10,1 -16,3 33,0 708
Table 3
Efficiency of phytosanitary treatments applied during the period 2012 at S.C.D.P. Iaşi
Variety Antrachnose
Moniliosis on fruits
Moniliosis on shoots Rhagoletis
F% I% F% I% F% I%
Van 2,8 5,0 2,5 9,0 1,7 5,0 0,5 Stela 3,0 9,2 2,9 9,5 1,9 8,0 0,8
Boambe de Cotnari 3,5 10,0 3,0 10,0 2,0 10,0 1,2 untreated control 64,8 45,6 38,8 50,0 40,4 50,0 70,1
Table 4 Efficiency of phytosanitary treatments applied during the period 2013 at S.C.D.P. Iaşi
Variety Antrachnose
moniliosis on fruits
moniliosis on shoots Rhagoletis
F% I% F% I% F% I%
Van 3,6 5,0 4,1 10,0 3,2 5,0 0,4 Stela 3,8 10,0 4,5 10,0 3,5 10,0 0,2
Boambe de Cotnari 4,0 10,0 4,5 10,0 3,8 10,0 0,8 untreated control 68,5 60,5 45,8 70,1 45,6 50,0 70,3
Table 5 Efficiency of phytosanitary treatments applied during the period 2014 at S.C.D.P. Iaşi
Variety Antrachnose
moniliosis on fruits
moniliosis on shoots Rhagoletis
F% I% F% I% F% I%
Van 3,1 5,0 2,8 10,0 2,0 5,0 0,0 Stela 3,5 10,0 3,2 10,0 2,5 10,0 0,2
Boambe de Cotnari 4,2 10,0 3,7 10,0 2,7 10,2 0,5 untreated control 66,3 50,0 40,8 60,0 42,4 50,0 67,3
143
The results related to the efficacy of the phytosanitary complex applied at
SCDP Iași in the period 2012-2014 is presented in tables 3, 4 and 5. Following the application of treatments, the products used to control
anthracnose and brown rot registered a high efficacy. At the beginning of the vegetation period (white bud phenophase) we used cupric products (Bordeaux
mixture), and then systemic products (Signum and Rovral). Thus, the attack of anthracnose produced by Cocomyces hiemalis pathogen agent encountered favorable conditions for development and attack in the experiment period
confirmed by the high values of the attack level 68.5% - 66.3% for the untreated control samples. The fungicides used in the phytosanitary programme (Signum
and Rovral) had high efficacy with frequency values of 2.8-4.2% for Van and Boambe de Cotnari species.
As for the brown rot attack, this manifested both on shoots and fruits. The
brown rot frequency on fruits for the untreated control sample ranged between 38.8-45.8% as compared to 2.5-4.5% for the treated variants (Signum and
Rovral), and on shoots the frequency was 40.4-45.6% for the untreated control sample as compared to 1.7-3.8% for the treated species.
In the 3 years of experiments, we noticed that the pathogen attack was more
intense in 2013 due to the precipitations that registered important values in this period and favored the attack of brown rot especially on shoots and fruits. For
example, in 2013, the frequency of brown rot on shoots for the treated variants of the 3 species registered values between 3.2-3.8% as compared to 2012 when the values were 1.7-2.0%. Almost the same values were also registered for the brown
rot on fruits. Although the fungicides applied were the same, the more reduced efficacy
in 2013 may be explained by the fact that in June there were heavy precipitations in the period of ripening-maturation when most cherries cracked. The fungus
formed on the lesions appeared and enjoyed of all the conditions necessary for a rapid evolution. That is why in 2013 we performed one supplementary treatment as compared to years 2012 and 2014.
The foliar fertilizers such as Feartileader BPK 0.2%, Feartileader Magical 0.2%, Boro Et 0.07%, Keramin 0.3%, Rezistevo 0.2%, Copfort 0.25% also had an
important role in the phytosanitary programme for the phenomenon of cherry cracking and the obtaining of a healthy crop. They have a high content of macro and microelements and directly influence the evolution of cultures in terms of
quality and quantity. For example, Keramin product is a nutrient and complex biostimulator improving fructification, intensifying the fruit colour, increasing the
sugar content and preventing fruit falling. At the same time, Fertileader BPK applied after the blooming phase has a high content of boron besides the macro and microelements it contains, and Fertileader Magical and Rezistevo contribute
to the prevention of fruit cracking by their high content of calcium (16%). In these very favorable conditions for the evolution of pathogens, especially
anthracnose and brown rot, fungicides Signum and Rovral were highly efficient ensuring a good yield both quantitatively and qualitatively.
144
As for Rhagoletis cerasi, in order to control it, we carried out two
phytosanitary treatments upon warning by using insecticides such as Calypso, Decis 25 WG and Decis Mega, which proved to be very efficient. The untreated
control sample registered values between 67.3-70.3% that are very high values as compared to the treated variants where the percentage was very low having values
between 0.0% in 2014 and 1.2% in 2011. After the cherries were harvested, we applied a treatment with cupric
products for the control of diseases and insecticides (Novadim progres 0.13%)
aimed at destroying the San Jose scale larvae.
CONCLUSIONS
The integrated control of cherry tree diseases and pests is and will be a
major problem especially in certain climatic conditions when certain pathogens and pests become extremely aggressive.
We used the newest products for plant protection during the experimental
period. The climatic conditions of this period were highly favorable for the
evolution of diseases (anthracnose and brown rot) and less favorable for the attack of the cherry fruit fly (Rhagoletis cerasi).
In the control of the diseases (brown rot and anthracnose), we obtained the
best results with the products Signum 0.03% (0.6 kg/ha), Rovral 0.075% (1.5 l/ha), Funguran 0.3% (4.5 kg/ha) and Copernico 0.2% (4.0 kg/ha).
At the same time, the insecticides such as Calypso 0.02% (0.4 l/ha), Decis Mega 0.016% (0.25 l/ha) and Decis 25 WG 0.03% (0.06 kg/ha) registered a high efficacy in the control of cherry fruit fly and the products Seizer and Novadim
progres helped us control the San Jose scale.
REFERENCES
1. Budan Sergiu, Gică Grădinariu, 2000 – Cireșul. Editura "Ion Ionescu de la Brad", Iași 2. Cârdei E., Rominger E., 1997 - Cercetări privind protecția fitosanitară a plantațiilor de
cireș din bazinul pomicol Iași. Cercet. Agron. in Moldova, vol. 54(3). 3. Cârdei E., 2005 – "Program de protecţie fitosanitară pentru cireş şi vişin în anul 2005".
Revista Protecţia plantelor, nr. 57. 4. Cârdei Eugen., Beşleagă Ramona, Corneanu Gelu, 2010 – Prevenirea şi combaterea
principalilor boli şi dăunători la cireş .Lucrări ştiinţifice R. I. F. G. Piteşti vol XXVI. 5. Sumedrea Mihaela, Marin F.C., Sumedrea D., Chitu E., Călinescu Mirela, Smaranda
Şt., 2009 -New phytoprotection technologies for 'Idared' cv. apple orchards. Journal of Horticulture Forestry and Biotechnology, Banat’s University of Agriculture Sciences and Veterinary Medicine Timisoara, Faculty of Horticulture, vol. 13. pp. 152-158.
145
EVALUATION OF SOME AUTOCHTHONOUS GRAPEVINE VARIETIES PRESENTED IN THE GENOFOND OF ISPHTA
EVALUAREA UNOR SOIURI DE VIŢĂ DE VIE AUTOHTONE
PREZENTE ÎN GENOFONDUL ISPHTA
CORNEA V.1, STARCIUC Daniela1, TOFAN Svetlana1, BÎRSA Elena1, MATEI Iraida1, SAVIN Gh.1
e-mail: [email protected]
Abstract. Evaluation of old autochthonous grapevine varieties, including
neglected or at risk of extinction, is actual in the perspective of use of their still
unexplored potential in the development of viticulture. Phenotyping of
autochthonous varieties presented in the Grapevine Genepool of Research and
Practical Institute for Horticulture and Food Technology (ISPHTA), in the
general context of European genetic resources, was performed in the frame of
project COST FA1003. Evaluation according unique protocol included
description of phenological stages according BBCH scale, as well as
determination of some oenocarpological parameters of some varieties grown in
industrial plantations (′Coarnă neagră′, ′Feteasca albă′, ′Rară neagră′) and of
varieties presented only in Ampelographic Collection (′Copciac′, ′Turba
plotnaia belaia′, ′Turba râhlaia belaia′, ′Maischii ciornâi′ etc.).
Key words: grapevine, old autochthonous varieties, phenotyping,
Rezumat. Evaluarea soiurilor vechi autohtone de viţă de vie, inclusiv a celor
neglijate sau supuse riscului de dispariţie, este actuală în perspectiva utilizării
potenţialului lor încă neexplorat în dezvoltarea viticulturii. Studiul fenotipic al
soiurilor autohtone prezente în fondul genetic al Institutului Ştiinţifico-Practic
de Horticultură şi Tehnologii Alimentare (ISPHTA), în contextul general al
resurselor genetice din spaţiul european, a fost efectuat în cadrul proiectului
COST FA1003. Evaluarea, conform protocolului unic, a inclus descrierea
fazelor fenologice după scara BBCH, determinarea unor parametri oeno-
carpologici atât pentru unele soiuri cultivate şi în plantaţiile industriale
(′Coarnă neagră′, ′Feteasca albă′, ′Rară neagră′), cât şi a soiurilor prezente
numai în colecţia ampelografică (′Copciac′, ′Turba plotnaia belaia′, ′Turba
râhlaia belaia′, ′Maischii ciornâi′ ş.a.).
Cuvinte cheie: viţă de vie, soiuri vechi autohtone, fenotipare
INTRODUCTION
Establishment of old autochthonous grapevine assortment occurs by sec.
XIV-XVI (Teodorescu, 1964) and it was presented in plantations mainly until the
mid of XIX century. With the invasion of pathogens and of the introduction of
American species and hybrids in Europe, assortment based on local varieties was
severely affected. In the Republic of Moldova, the presence of old autochthonous
varieties decreased over the years both as areas presented in plantation and the
1 Scientific-Practical Institute For Horticulture and Technologies, Republic of Moldova
146
number of varieties included in the assortment: in 1949 16% of the standard
assortment were old varieties, in 1964 - 10 %, from 1980s and to date – 4-5% and
currently it includes only varieties ′Coarnă neagră′, ′Fetească albă′ şi ′Rară neagră′
(′Băbească neagră′) (Savin, 2012b).
Compared to other countries, where old autochthonous assortment numbers
hundreds of varieties, here he is less numerous and, according to bibliographic
sources includes about 50 varieties representing by eco-geographical origin both
the area Proles pontica (subproles balcanica Negr. and subproles georgica Negr.)
and Proles orientalis (subproles antasiatica Negr. and subproles caspica Negr.).
Marginalization of old autochthonous varieties is an omission in the
creation of sustainable viticulture, both by their absence in plantations and by
ignoring in breeding programs their increased adaptability to local pedo-climatic
factors, resistance to pathogens as well as the diversity of their productive and
qualitative potential. Valorization on the current stage of this component of the
assortment can offers both distinctiveness, originality and attractiveness of
autochthonous production, but also serve as a source of productivity, adaptability
to local climatic conditions for future breeding programs, inclusively in the
context of “Climate Change” (Savin, 2014).
Reassessment on various aspects of the local old autochthonous assortment
for the purpose of revealing and using of their potential, in part, was initiated in
the frame of regional and international programs: inventory, description of
resource presented ex situ (Savin et al., 2008, 2012a); on farm assessment (Savin,
2010); description, diversity assessment, documentation, identification, including
the use of genetic-molecular methods (Gheţea et al., 2012; Zulj Mihaljevic et al.,
2013). Recently, in the frame of project COST FA1003
(http://users.unimi.it/grapenet/) assessments continued in the context of grapevine
genetic resources from practically the entire European area, applying phenotypic
methods (Rustioni et al., 2014) and molecular biology (De Lorenzis et al., 2014).
Some results will be presented below.
MATERIAL AND METHOD
Studies were conducted in 2012 and 2013 in the Grapevine Genepool (Genofond) of the Research and Practical Institute for Horticulture and Food Technologies located in the south of Chisinau city (46°58′39.65″ N and 28°46′21.68″ E, altitude 201 m). From all 40 old autochthonous varieties registered in Genofond in study were included four varieties for table grapes (′Coarnă albă′, ′Coarnă neagră′, ′Damaşin galben′ and ′Tâţa caprei′) and 17 varieties for wine (′Băşicată′, ′Cabasmă′, ′Fetească albă′, ′Galabura′, ′Gordin′, ′Plavaie′, ′Turba plotnaia belaia′, ′Turba râhlaia belaia′, ′Zghihară′ – with green-yellow berries and ′Brează′, ′Cabasia′, ′Ciorcuţă neagră′, ′Ciorcuţă roză′, ′Copceac′ , ′Maischii ciornâi′, ′Negru de Akerman′ - with colored berries).
According phenotyping protocol accepted in the frame of project COST FA1003 were determined: the average weight of a grape, the average weight of 10 berries, the weight of skin and seeds of 10 berries, berry length and width, sugar and acid content of must.
Years of study (2012, 2013) differs by contrasting weather conditions, especially related to rainfall, maximum temperatures recorded in summer
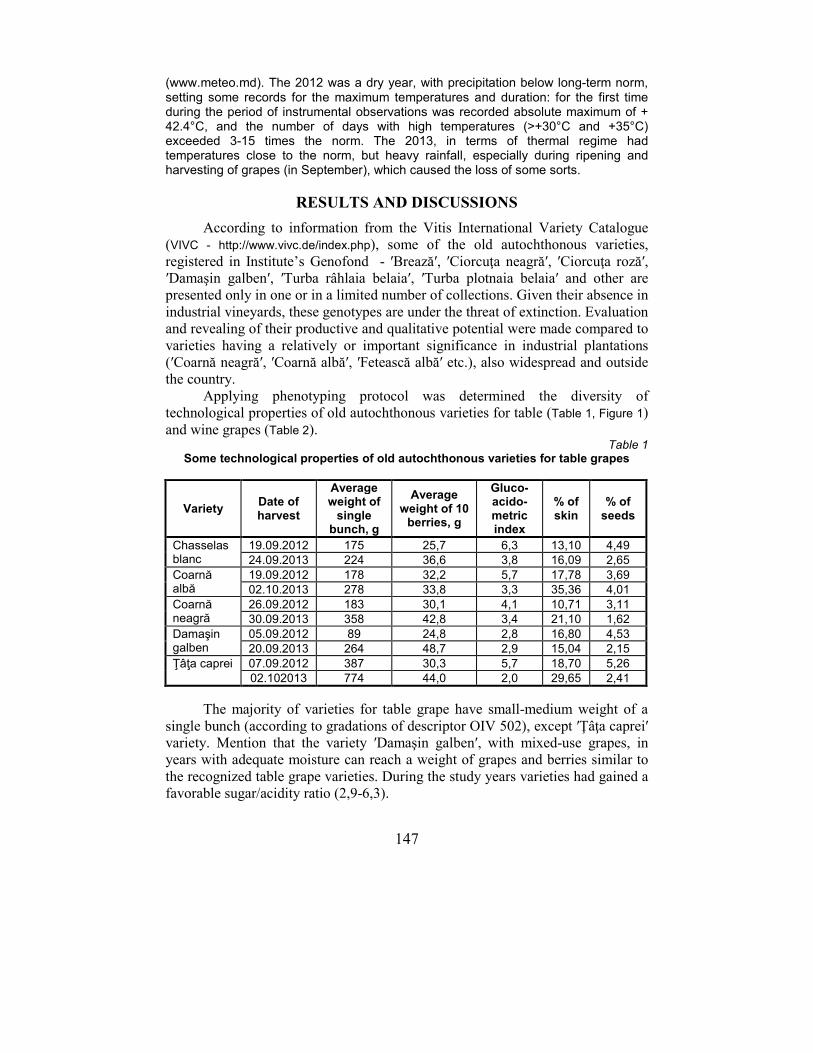
147
(www.meteo.md). The 2012 was a dry year, with precipitation below long-term norm, setting some records for the maximum temperatures and duration: for the first time during the period of instrumental observations was recorded absolute maximum of + 42.4°C, and the number of days with high temperatures (>+30°C and +35°C) exceeded 3-15 times the norm. The 2013, in terms of thermal regime had temperatures close to the norm, but heavy rainfall, especially during ripening and harvesting of grapes (in September), which caused the loss of some sorts.
RESULTS AND DISCUSSIONS
According to information from the Vitis International Variety Catalogue
(VIVC - http://www.vivc.de/index.php), some of the old autochthonous varieties,
registered in Institute’s Genofond - ′Brează′, ′Ciorcuţa neagră′, ′Ciorcuţa roză′,
′Damaşin galben′, ′Turba râhlaia belaia′, ′Turba plotnaia belaia′ and other are
presented only in one or in a limited number of collections. Given their absence in
industrial vineyards, these genotypes are under the threat of extinction. Evaluation
and revealing of their productive and qualitative potential were made compared to
varieties having a relatively or important significance in industrial plantations
(′Coarnă neagră′, ′Coarnă albă′, ′Fetească albă′ etc.), also widespread and outside
the country.
Applying phenotyping protocol was determined the diversity of
technological properties of old autochthonous varieties for table (Table 1, Figure 1)
and wine grapes (Table 2). Table 1
Some technological properties of old autochthonous varieties for table grapes
Variety Date of harvest
Average weight of
single bunch, g
Average weight of 10
berries, g
Gluco-acido-metric index
% of skin
% of seeds
Chasselas blanc
19.09.2012 175 25,7 6,3 13,10 4,49
24.09.2013 224 36,6 3,8 16,09 2,65
Coarnă albă
19.09.2012 178 32,2 5,7 17,78 3,69
02.10.2013 278 33,8 3,3 35,36 4,01
Coarnă neagră
26.09.2012 183 30,1 4,1 10,71 3,11
30.09.2013 358 42,8 3,4 21,10 1,62
Damaşin galben
05.09.2012 89 24,8 2,8 16,80 4,53
20.09.2013 264 48,7 2,9 15,04 2,15
Ţâţa caprei 07.09.2012 387 30,3 5,7 18,70 5,26
02.102013 774 44,0 2,0 29,65 2,41
The majority of varieties for table grape have small-medium weight of a
single bunch (according to gradations of descriptor OIV 502), except ′Ţâţa caprei′
variety. Mention that the variety ′Damaşin galben′, with mixed-use grapes, in
years with adequate moisture can reach a weight of grapes and berries similar to
the recognized table grape varieties. During the study years varieties had gained a
favorable sugar/acidity ratio (2,9-6,3).
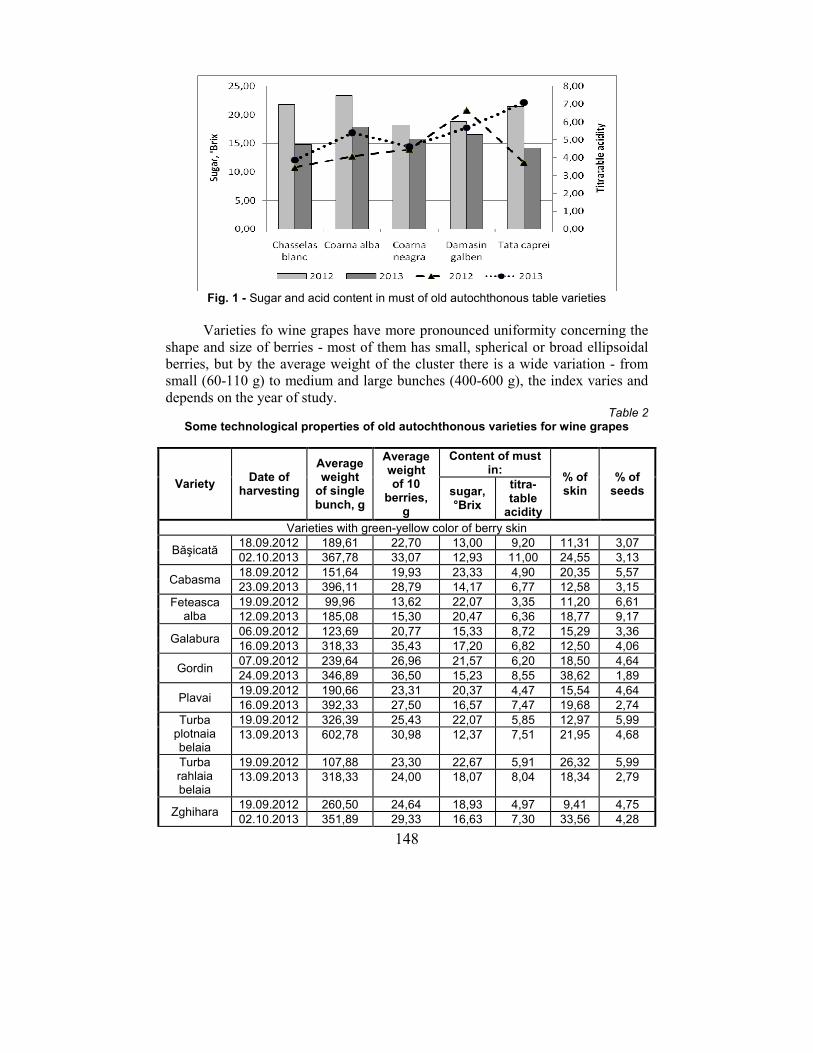
148
Fig. 1 - Sugar and acid content in must of old autochthonous table varieties
Varieties fo wine grapes have more pronounced uniformity concerning the
shape and size of berries - most of them has small, spherical or broad ellipsoidal
berries, but by the average weight of the cluster there is a wide variation - from
small (60-110 g) to medium and large bunches (400-600 g), the index varies and
depends on the year of study. Table 2
Some technological properties of old autochthonous varieties for wine grapes
Variety Date of
harvesting
Average weight
of single bunch, g
Average weight of 10
berries, g
Content of must in:
% of skin
% of seeds sugar,
°Brix
titra-table
acidity Varieties with green-yellow color of berry skin
Băşicată 18.09.2012 189,61 22,70 13,00 9,20 11,31 3,07
02.10.2013 367,78 33,07 12,93 11,00 24,55 3,13
Cabasma 18.09.2012 151,64 19,93 23,33 4,90 20,35 5,57
23.09.2013 396,11 28,79 14,17 6,77 12,58 3,15
Feteasca alba
19.09.2012 99,96 13,62 22,07 3,35 11,20 6,61
12.09.2013 185,08 15,30 20,47 6,36 18,77 9,17
Galabura 06.09.2012 123,69 20,77 15,33 8,72 15,29 3,36
16.09.2013 318,33 35,43 17,20 6,82 12,50 4,06
Gordin 07.09.2012 239,64 26,96 21,57 6,20 18,50 4,64
24.09.2013 346,89 36,50 15,23 8,55 38,62 1,89
Plavai 19.09.2012 190,66 23,31 20,37 4,47 15,54 4,64
16.09.2013 392,33 27,50 16,57 7,47 19,68 2,74
Turba plotnaia belaia
19.09.2012 326,39 25,43 22,07 5,85 12,97 5,99
13.09.2013 602,78 30,98 12,37 7,51 21,95 4,68
Turba rahlaia belaia
19.09.2012 107,88 23,30 22,67 5,91 26,32 5,99
13.09.2013 318,33 24,00 18,07 8,04 18,34 2,79
Zghihara 19.09.2012 260,50 24,64 18,93 4,97 9,41 4,75
02.10.2013 351,89 29,33 16,63 7,30 33,56 4,28
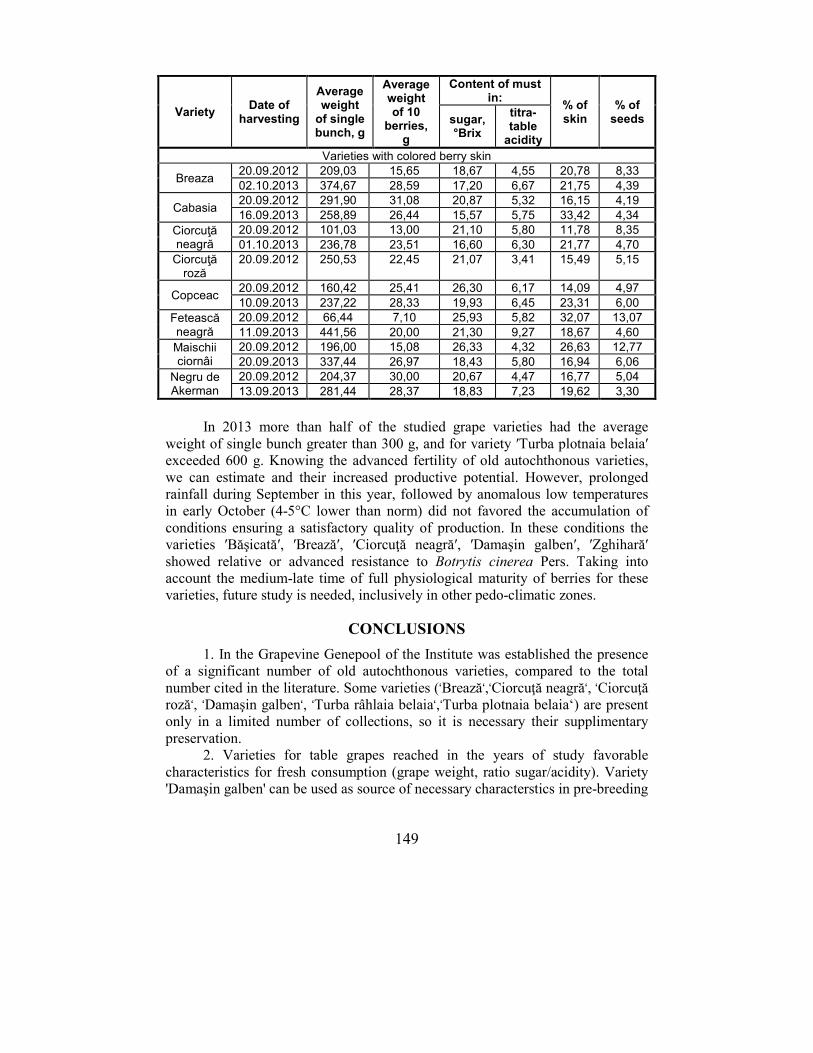
149
Variety Date of
harvesting
Average weight
of single bunch, g
Average weight of 10
berries, g
Content of must in:
% of skin
% of seeds sugar,
°Brix
titra-table
acidity Varieties with colored berry skin
Breaza 20.09.2012 209,03 15,65 18,67 4,55 20,78 8,33
02.10.2013 374,67 28,59 17,20 6,67 21,75 4,39
Cabasia 20.09.2012 291,90 31,08 20,87 5,32 16,15 4,19
16.09.2013 258,89 26,44 15,57 5,75 33,42 4,34
Ciorcuţă neagră
20.09.2012 101,03 13,00 21,10 5,80 11,78 8,35
01.10.2013 236,78 23,51 16,60 6,30 21,77 4,70
Ciorcuţă roză
20.09.2012 250,53 22,45 21,07 3,41 15,49 5,15
Copceac 20.09.2012 160,42 25,41 26,30 6,17 14,09 4,97
10.09.2013 237,22 28,33 19,93 6,45 23,31 6,00
Fetească neagră
20.09.2012 66,44 7,10 25,93 5,82 32,07 13,07
11.09.2013 441,56 20,00 21,30 9,27 18,67 4,60
Maischii ciornâi
20.09.2012 196,00 15,08 26,33 4,32 26,63 12,77
20.09.2013 337,44 26,97 18,43 5,80 16,94 6,06
Negru de Akerman
20.09.2012 204,37 30,00 20,67 4,47 16,77 5,04
13.09.2013 281,44 28,37 18,83 7,23 19,62 3,30
In 2013 more than half of the studied grape varieties had the average
weight of single bunch greater than 300 g, and for variety ′Turba plotnaia belaia′
exceeded 600 g. Knowing the advanced fertility of old autochthonous varieties,
we can estimate and their increased productive potential. However, prolonged
rainfall during September in this year, followed by anomalous low temperatures
in early October (4-5°C lower than norm) did not favored the accumulation of
conditions ensuring a satisfactory quality of production. In these conditions the
varieties ′Băşicată′, ′Brează′, ′Ciorcuţă neagră′, ′Damaşin galben′, ′Zghihară′
showed relative or advanced resistance to Botrytis cinerea Pers. Taking into
account the medium-late time of full physiological maturity of berries for these
varieties, future study is needed, inclusively in other pedo-climatic zones.
CONCLUSIONS
1. In the Grapevine Genepool of the Institute was established the presence
of a significant number of old autochthonous varieties, compared to the total
number cited in the literature. Some varieties (‘Brează‘,‘Ciorcuţă neagră‘, ‘Ciorcuţă
roză‘, ‘Damaşin galben‘, ‘Turba râhlaia belaia‘,‘Turba plotnaia belaia‘) are present
only in a limited number of collections, so it is necessary their supplimentary
preservation.
2. Varieties for table grapes reached in the years of study favorable
characteristics for fresh consumption (grape weight, ratio sugar/acidity). Variety
'Damaşin galben' can be used as source of necessary characterstics in pre-breeding
150
and breeding programs (mixed-use of grapes, medium–late time of maturity, crisp
berry, resistance to gray mold).
3. Varieties for wine represents a wide diversity concerning the average
weight of the grape and berry. The quality of some varieties were strongly
affected by adverse environmental conditions (rainfall, lower temperatures etc.),
but varieties 'Băşicată', 'Brează', 'Ciorcuţă neagră', 'Zghihară' had shown resistance
to Botrytis cinerea Pers.
Acknowledgments: The studies were conducted in the frame of European
project COST FA1003.
REFERENCES
1. De Lorenzis G., Biagini B., Failla O., Maghradze D., Melyan G.H., Musayev M., Savin G., 2014 - Molecular investigation of Caucazian and Eastern European Grapevine Genetic Resources (V. Vinifera L.) by microsatelites. Acta Hort. (ISHS), 1032, pp. 99-104.
2. Gheţea L.G., Moţoc R.M., Popescu C.F., Barbacar N., Bărbării L.E., Constantinescu C.M., Iancu D., Bătrînu T., Bivol I., Baca I., Savin Gh., 2012 - Assessment of Diversity in Grapevine Gene Pools from Romania and Republic of Moldova, Based on SSR Markers Analysis. In: A.I. Maldonado (ed.): Horticulture [online]. InTech, pp. 43-60.
3. Rustioni L., Cola G., Fiori S., Failla O., Bacilieri R., Maul, E., Eiras Dias J.E., Brazão J., Kocsis L., Lorenzini F., Maghradze D., Chipashvili R., Maletic E., Preiner D., Molitor D., Muljukina N., Muñoz-Organero G., Musayev M., Nikolaou N., Risovanna V., Ruisa S., Salimov V., Savin G., Cornea V., Savvides S., Schneider A., Skala O., Ujmajuridze L., 2014 - Application of standard methods for the grapevine (V. Vinifera L.) phenotypic diversity exploration: phenological traits. Acta Hort. (ISHS). 1032, pp. 253-260.
4. Savin Gh., Popov A., Cornea V., 2008 - Vitis genetic resources in the Republic of
Moldova. Report of Working Group on Vitis. First Meeting, pp. 88-92.12-14 June 2003, Palic, Serbia and Montenegro. Bioversity International, Rome, Italy.
5. Savin Gh., Cornea V., Bejan A., Istrati V., 2010 - Preliminary on-farm estimation of old autochthonous varieties in Republic of Moldova. Lucrări ştiinţifice, Universitatea de Ştiinţe Agricole şi Medicină Veterinară „Ion Ionescu de la Brad” Iaşi, Seria Horticultură, pp. 403-406.
6. Savin G., 2012a - Viticulture and Winemaking in Moldova. In: Maghradze D. et al.
(eds.). Caucasus and Northern Black Sea Region Ampelography. COST, Vitis, Special Issue, JKI - Julius Kühn-Institut, 2012, pp. 241-272.
7. Savin Gh., 2012b - Ameliorarea sortimentului viticol al Republicii Moldova. Ch. : S.n.,
(Tipogr. AŞM). 260 p. 8. Savin Gh., 2014 - Fondul genetic al viţei de vie – precondiţie strategică a vitviniculturii
sustenabile. Akademos, 1(32), pp. 74-82 9. Teodorescu I.C., Teodorescu Şt.C., Mihalca Gh., 1966 - Viţa de vie şi vinul de-a
lungul veacurilor. Bucureşti: Edit. Agro-Silvică. 480 p. 10. Žulj Mihaljević M., Šimon S., Pejić I., Carka F., Sevo R., Kojić A., Gaši F., Tomić L.,
Jovanović Cvetković T., Maletić E., Preiner D., Božinović Z., Savin G., Cornea V., Maraš V., Tomić M., Botu M., Popa A., Beleski K., 2013 - Molecular characterization of old local grapevine varieties from South East European countries. Vitis, 52, pp. 69-76.
151
ASSESSMENT OF QUALITY OF WINE GRAPES OF VINE VARIETIES GROWN IN IASI COPOU WINE CENTER
EVALUAREA CALITATII STRUGURILOR PENTRU VIN A UNOR SOIURI DE VITĂ DE VIE CULTIVATE ÎN
CENTRUL VITICOL COPOU IAŞI
NECHITA Ancuta1, SAVIN C.
1, PAŞA Rodica
1,
ZALDEA Gabi1, DAMIAN Doina
1, NECHITA C. B.
2
e-mail: [email protected]
Abstract. Grape quality in terms of composition and their chemical composition
is essential for obtaining quality wines, able to cope with increasingly fierce
competition. The research was conducted on some varieties recommended and
authorized culture from viticultural area Copou Iasi: six varieties for white
wine (Aligoté, Chardonnay, Fetească albă, Fetească regală, Riesling italian
and Sauvignon blanc), a variety for red wines (Cabernet Sauvignon) and two
aromatic wine varieties (Busuioacă Bohotin and Muscat Ottonel). The
researches were focused on the evolution of ripening grapes, quantity and
quality achieved. The grape harvests from 2012 and 2013 where of good quality
varieties reaching specific parameters analyzed for DOC wine production type,
IGR, and VM, not necessary approval enrichment operation sugar musts. Key words: grapes, ripening, climatic factors, quality
Rezumat. Calitatea strugurilor sub aspectul alcătuirii şi compozitiei lor
chimice este esenţială pentru obţinerea unor vinuri de calitate, capabile să facă
faţă unei concurenţe tot mai acerbe. Cercetările s-au efectuat asupra unor
soiuri recomandate şi autorizate în cultură în arealul viticol Copou Iaşi, şi
anume: şase soiuri pentru vinuri albe (Aligoté, Chardonnay, Fetească albă,
Fetească regală, Riesling italian şi Sauvignon blanc); un soi pentru vinuri roşii
(Cabernet Sauvignon) şi două soiuri pentru vinuri aromate (Busuioacă Bohotin
şi Muscat Ottonel). Acestea au vizat aspecte referitoare la evoluţia maturării
strugurilor, cantitatea şi calitatea producţiei obţinute. Atât în anul 2012 cât şi
2013, recolta de struguri a fost bună calitativ, soiurile analizate atingând
parametrii specifici pentru producţia de vinuri de tip DOC, IGR, şi VM, nefiind
necesară aprobarea operaţiei de îmbogatire în zaharuri a musturilor.
Cuvinte cheie: struguri, maturare, factori climatici, calitate
INTRODUCTION
The potential quality of different varieties grape depending on the area
where it is grown, largely influenced by culture technology used and climatic
conditions (Pomohaci et.al., 2000). Recommended varieties in a certain area are
those that exploit in the highest degree both environmental conditions within a
wine center and the with a potential corresponding qualitative objective pursued
(Cotea et.al., 2009). Grape quality is the determining factor for achieving balanced
1Station of Research and Development for Winegrowing and Wine Production of Iaşi, Romania 2 Oenological Research Center, Iasi Branch of the Romanian Academy, Iasi, Romania
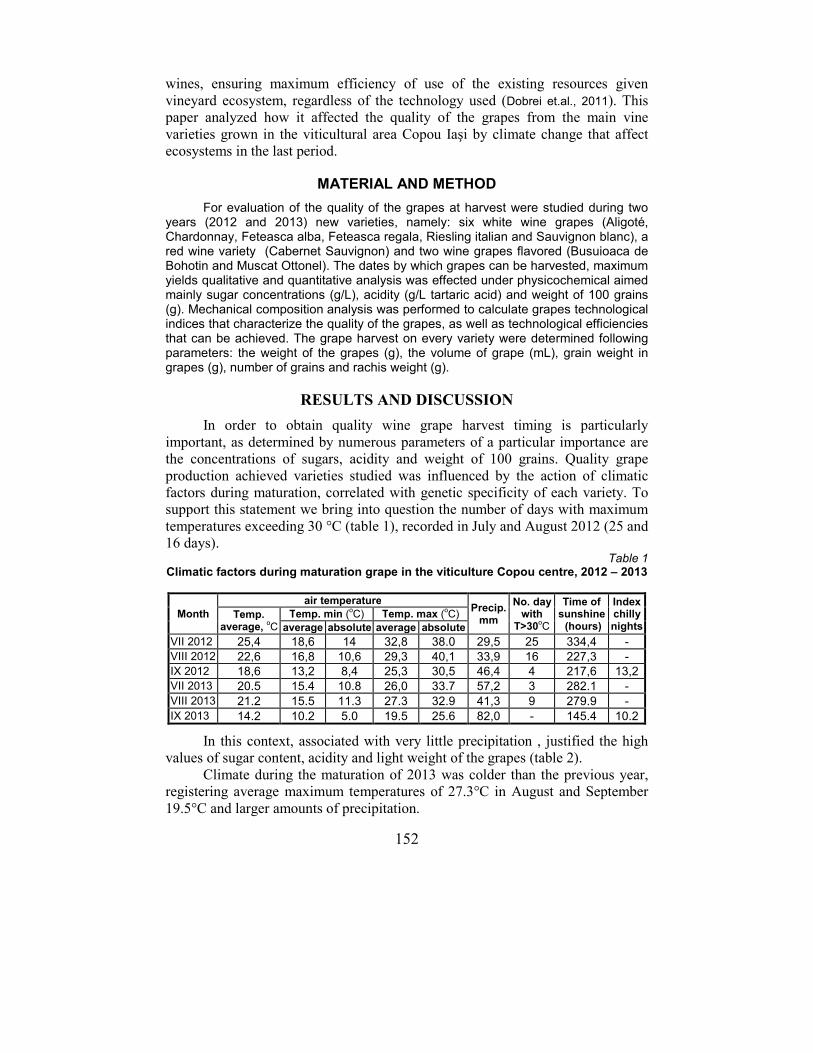
152
wines, ensuring maximum efficiency of use of the existing resources given
vineyard ecosystem, regardless of the technology used (Dobrei et.al., 2011). This
paper analyzed how it affected the quality of the grapes from the main vine
varieties grown in the viticultural area Copou Iaşi by climate change that affect
ecosystems in the last period.
MATERIAL AND METHOD
For evaluation of the quality of the grapes at harvest were studied during two years (2012 and 2013) new varieties, namely: six white wine grapes (Aligoté, Chardonnay, Feteasca alba, Feteasca regala, Riesling italian and Sauvignon blanc), a red wine variety (Cabernet Sauvignon) and two wine grapes flavored (Busuioaca de Bohotin and Muscat Ottonel). The dates by which grapes can be harvested, maximum yields qualitative and quantitative analysis was effected under physicochemical aimed mainly sugar concentrations (g/L), acidity (g/L tartaric acid) and weight of 100 grains (g). Mechanical composition analysis was performed to calculate grapes technological indices that characterize the quality of the grapes, as well as technological efficiencies that can be achieved. The grape harvest on every variety were determined following parameters: the weight of the grapes (g), the volume of grape (mL), grain weight in grapes (g), number of grains and rachis weight (g).
RESULTS AND DISCUSSION
In order to obtain quality wine grape harvest timing is particularly
important, as determined by numerous parameters of a particular importance are
the concentrations of sugars, acidity and weight of 100 grains. Quality grape
production achieved varieties studied was influenced by the action of climatic
factors during maturation, correlated with genetic specificity of each variety. To
support this statement we bring into question the number of days with maximum
temperatures exceeding 30 °C (table 1), recorded in July and August 2012 (25 and
16 days). Table 1
Climatic factors during maturation grape in the viticulture Copou centre, 2012 – 2013
Month
air temperature Precip.
mm
No. day with
T>30oC
Time of sunshine (hours)
Index chilly nights
Temp. average,
oC
Temp. min (oC) Temp. max (
oC)
average absolute average absolute
VII 2012 25,4 18,6 14 32,8 38.0 29,5 25 334,4 -
VIII 2012 22,6 16,8 10,6 29,3 40,1 33,9 16 227,3 -
IX 2012 18,6 13,2 8,4 25,3 30,5 46,4 4 217,6 13,2
VII 2013 20.5 15.4 10.8 26,0 33.7 57,2 3 282.1 -
VIII 2013 21.2 15.5 11.3 27.3 32.9 41,3 9 279.9 -
IX 2013 14.2 10.2 5.0 19.5 25.6 82,0 - 145.4 10.2
In this context, associated with very little precipitation , justified the high
values of sugar content, acidity and light weight of the grapes (table 2).
Climate during the maturation of 2013 was colder than the previous year,
registering average maximum temperatures of 27.3°C in August and September
19.5°C and larger amounts of precipitation.
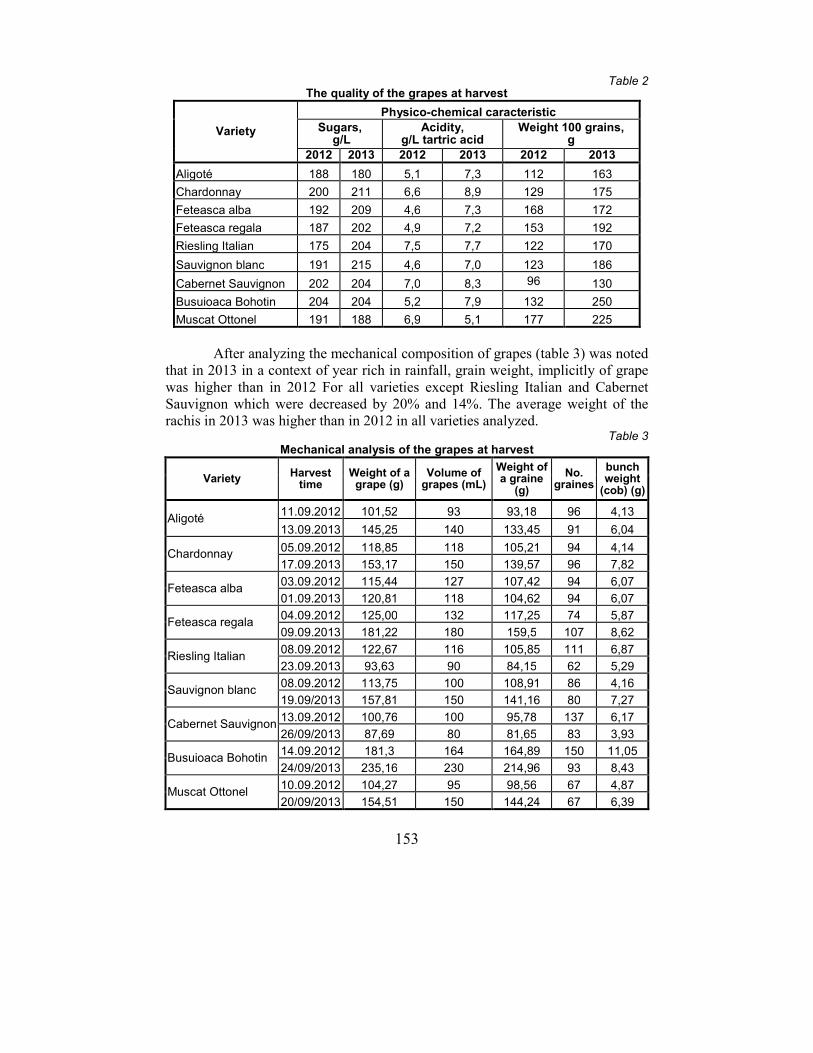
153
Table 2 The quality of the grapes at harvest
Variety
Physico-chemical caracteristic
Sugars, g/L
Acidity, g/L tartric acid
Weight 100 grains, g
2012 2013 2012 2013 2012 2013
Aligoté 188 180 5,1 7,3 112 163
Chardonnay 200 211 6,6 8,9 129 175
Feteasca alba 192 209 4,6 7,3 168 172
Feteasca regala 187 202 4,9 7,2 153 192
Riesling Italian 175 204 7,5 7,7 122 170
Sauvignon blanc 191 215 4,6 7,0 123 186
Cabernet Sauvignon 202 204 7,0 8,3 96 130
Busuioaca Bohotin 204 204 5,2 7,9 132 250
Muscat Ottonel 191 188 6,9 5,1 177 225
After analyzing the mechanical composition of grapes (table 3) was noted
that in 2013 in a context of year rich in rainfall, grain weight, implicitly of grape
was higher than in 2012 For all varieties except Riesling Italian and Cabernet
Sauvignon which were decreased by 20% and 14%. The average weight of the
rachis in 2013 was higher than in 2012 in all varieties analyzed. Table 3
Mechanical analysis of the grapes at harvest
Variety Harvest
time Weight of a
grape (g) Volume of
grapes (mL)
Weight of a graine
(g)
No. graines
bunch weight
(cob) (g)
Aligoté 11.09.2012 101,52 93 93,18 96 4,13
13.09.2013 145,25 140 133,45 91 6,04
Chardonnay 05.09.2012 118,85 118 105,21 94 4,14
17.09.2013 153,17 150 139,57 96 7,82
Feteasca alba 03.09.2012 115,44 127 107,42 94 6,07
01.09.2013 120,81 118 104,62 94 6,07
Feteasca regala 04.09.2012 125,00 132 117,25 74 5,87
09.09.2013 181,22 180 159,5 107 8,62
Riesling Italian 08.09.2012 122,67 116 105,85 111 6,87
23.09.2013 93,63 90 84,15 62 5,29
Sauvignon blanc 08.09.2012 113,75 100 108,91 86 4,16
19.09/2013 157,81 150 141,16 80 7,27
Cabernet Sauvignon 13.09.2012 100,76 100 95,78 137 6,17
26/09/2013 87,69 80 81,65 83 3,93
Busuioaca Bohotin 14.09.2012 181,3 164 164,89 150 11,05
24/09/2013 235,16 230 214,96 93 8,43
Muscat Ottonel 10.09.2012 104,27 95 98,56 67 4,87
20/09/2013 154,51 150 144,24 67 6,39
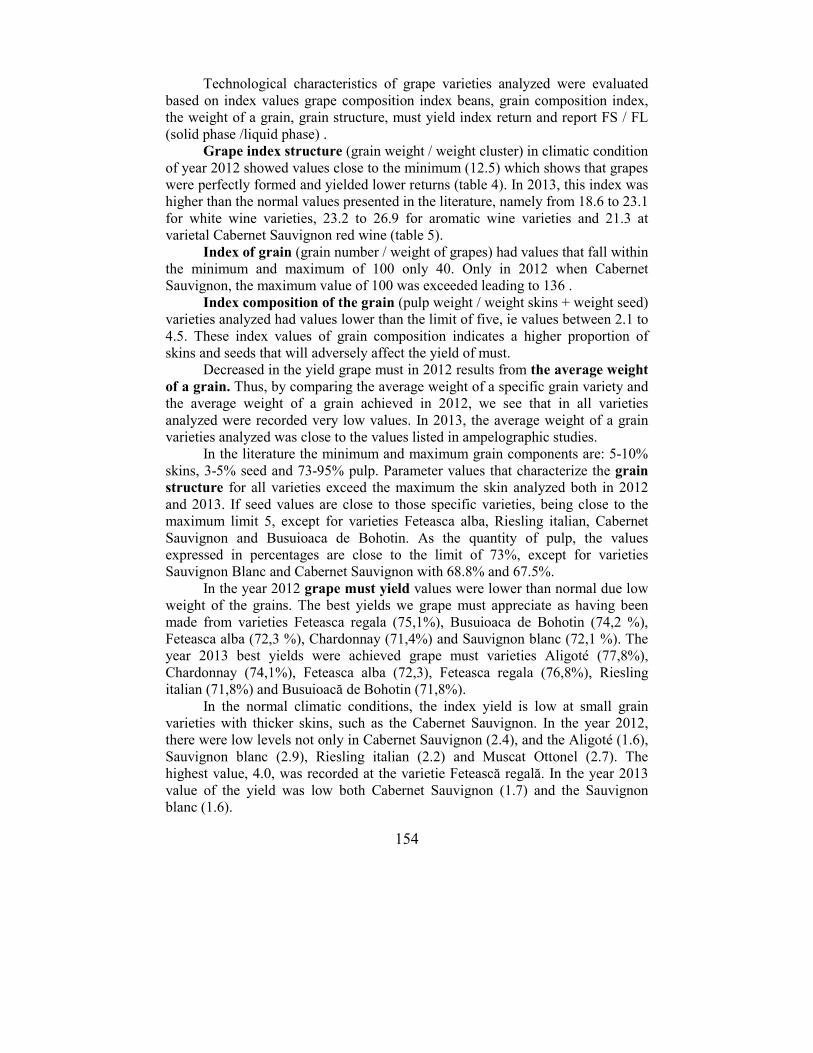
154
Technological characteristics of grape varieties analyzed were evaluated
based on index values grape composition index beans, grain composition index,
the weight of a grain, grain structure, must yield index return and report FS / FL
(solid phase /liquid phase) .
Grape index structure (grain weight / weight cluster) in climatic condition
of year 2012 showed values close to the minimum (12.5) which shows that grapes
were perfectly formed and yielded lower returns (table 4). In 2013, this index was
higher than the normal values presented in the literature, namely from 18.6 to 23.1
for white wine varieties, 23.2 to 26.9 for aromatic wine varieties and 21.3 at
varietal Cabernet Sauvignon red wine (table 5).
Index of grain (grain number / weight of grapes) had values that fall within
the minimum and maximum of 100 only 40. Only in 2012 when Cabernet
Sauvignon, the maximum value of 100 was exceeded leading to 136 .
Index composition of the grain (pulp weight / weight skins + weight seed)
varieties analyzed had values lower than the limit of five, ie values between 2.1 to
4.5. These index values of grain composition indicates a higher proportion of
skins and seeds that will adversely affect the yield of must.
Decreased in the yield grape must in 2012 results from the average weight of a grain. Thus, by comparing the average weight of a specific grain variety and
the average weight of a grain achieved in 2012, we see that in all varieties
analyzed were recorded very low values. In 2013, the average weight of a grain
varieties analyzed was close to the values listed in ampelographic studies.
In the literature the minimum and maximum grain components are: 5-10%
skins, 3-5% seed and 73-95% pulp. Parameter values that characterize the grain structure for all varieties exceed the maximum the skin analyzed both in 2012
and 2013. If seed values are close to those specific varieties, being close to the
maximum limit 5, except for varieties Feteasca alba, Riesling italian, Cabernet
Sauvignon and Busuioaca de Bohotin. As the quantity of pulp, the values
expressed in percentages are close to the limit of 73%, except for varieties
Sauvignon Blanc and Cabernet Sauvignon with 68.8% and 67.5%.
In the year 2012 grape must yield values were lower than normal due low
weight of the grains. The best yields we grape must appreciate as having been
made from varieties Feteasca regala (75,1%), Busuioaca de Bohotin (74,2 %),
Feteasca alba (72,3 %), Chardonnay (71,4%) and Sauvignon blanc (72,1 %). The
year 2013 best yields were achieved grape must varieties Aligoté (77,8%),
Chardonnay (74,1%), Feteasca alba (72,3), Feteasca regala (76,8%), Riesling
italian (71,8%) and Busuioacă de Bohotin (71,8%).
In the normal climatic conditions, the index yield is low at small grain
varieties with thicker skins, such as the Cabernet Sauvignon. In the year 2012,
there were low levels not only in Cabernet Sauvignon (2.4), and the Aligoté (1.6),
Sauvignon blanc (2.9), Riesling italian (2.2) and Muscat Ottonel (2.7). The
highest value, 4.0, was recorded at the varietie Fetească regală. In the year 2013
value of the yield was low both Cabernet Sauvignon (1.7) and the Sauvignon
blanc (1.6).
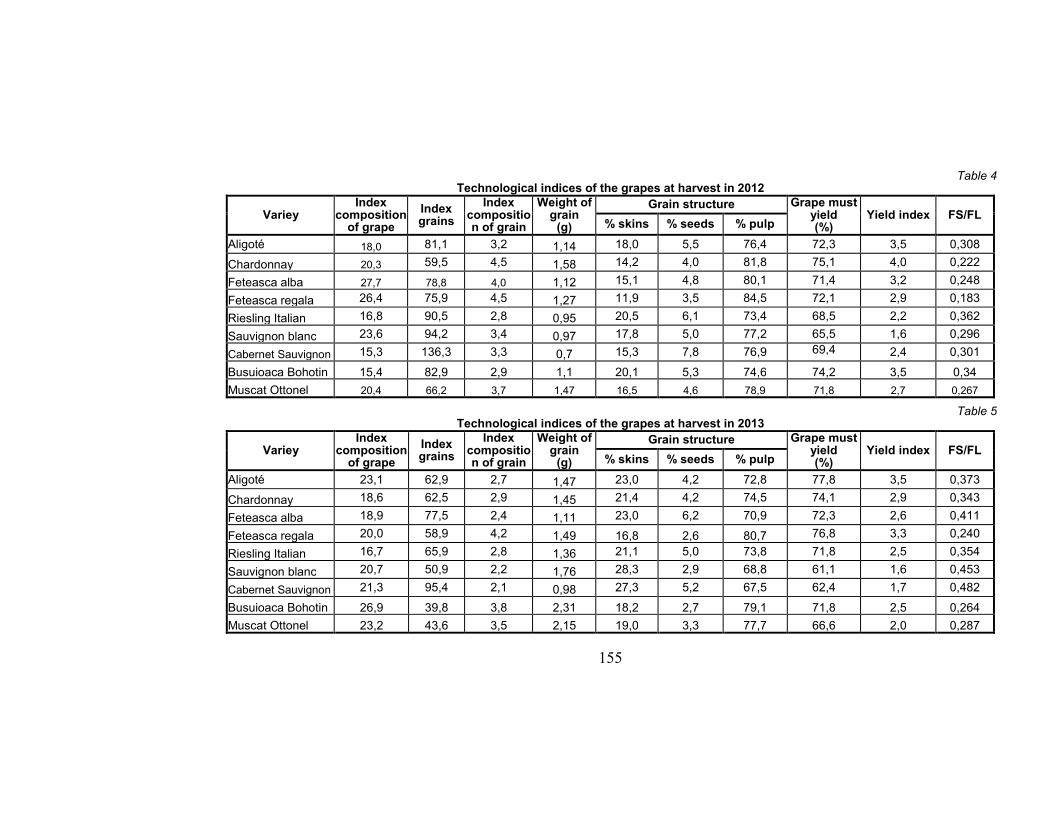
155
Table 4 Technological indices of the grapes at harvest in 2012
Variey Index
composition of grape
Index grains
Index composition of grain
Weight of grain
(g)
Grain structure Grape must yield (%)
Yield index FS/FL % skins % seeds % pulp
Aligoté 18,0 81,1 3,2 1,14 18,0 5,5 76,4 72,3 3,5 0,308
Chardonnay 20,3 59,5 4,5 1,58 14,2 4,0 81,8 75,1 4,0 0,222
Feteasca alba 27,7 78,8 4,0 1,12 15,1 4,8 80,1 71,4 3,2 0,248
Feteasca regala 26,4 75,9 4,5 1,27 11,9 3,5 84,5 72,1 2,9 0,183
Riesling Italian 16,8 90,5 2,8 0,95 20,5 6,1 73,4 68,5 2,2 0,362
Sauvignon blanc 23,6 94,2 3,4 0,97 17,8 5,0 77,2 65,5 1,6 0,296
Cabernet Sauvignon 15,3 136,3 3,3 0,7 15,3 7,8 76,9 69,4 2,4 0,301
Busuioaca Bohotin 15,4 82,9 2,9 1,1 20,1 5,3 74,6 74,2 3,5 0,34
Muscat Ottonel 20,4 66,2 3,7 1,47 16,5 4,6 78,9 71,8 2,7 0,267
Table 5 Technological indices of the grapes at harvest in 2013
Variey Index
composition of grape
Index grains
Index composition of grain
Weight of grain
(g)
Grain structure Grape must yield (%)
Yield index FS/FL % skins % seeds % pulp
Aligoté 23,1 62,9 2,7 1,47 23,0 4,2 72,8 77,8 3,5 0,373
Chardonnay 18,6 62,5 2,9 1,45 21,4 4,2 74,5 74,1 2,9 0,343
Feteasca alba 18,9 77,5 2,4 1,11 23,0 6,2 70,9 72,3 2,6 0,411
Feteasca regala 20,0 58,9 4,2 1,49 16,8 2,6 80,7 76,8 3,3 0,240
Riesling Italian 16,7 65,9 2,8 1,36 21,1 5,0 73,8 71,8 2,5 0,354
Sauvignon blanc 20,7 50,9 2,2 1,76 28,3 2,9 68,8 61,1 1,6 0,453
Cabernet Sauvignon 21,3 95,4 2,1 0,98 27,3 5,2 67,5 62,4 1,7 0,482
Busuioaca Bohotin 26,9 39,8 3,8 2,31 18,2 2,7 79,1 71,8 2,5 0,264
Muscat Ottonel 23,2 43,6 3,5 2,15 19,0 3,3 77,7 66,6 2,0 0,287
156
High values were recorded varieties Aligoté (3.5) and Feteasca regala (3.3).
The other varieties analyzed this index had values from 2.0 to 2.9.
Based on the data presented we can say that production of grapes in 2012
and 2013 in the area of Iaşi Copou wine center was good qualitative reaching
specific parameters analyzed varieties for wine production type DOC, IGR and
VM is not necessary approval enrichment operation sugars musts.
CONCLUSIONS
1. The climate of the ripening period in 2012 can be considered canicular,
dry, and in 2013 the normal heat, but moist
2. Analysis of mechanical composition of grapes in 2012 shows that in
general, the weight of the grapes slightly exceeded the limit specified minimum
average each variety. Because of the drought conditions, mechanical parameters
of the structure of the grapes had lower values than normal, which resulted in a
lower yield of grape must. In 2013, all varieties were classified in terms of
mechanical composition within ampelographic average values, showing higher
values than those obtained in the previous year.
3. Quality characteristics of the grape harvest in 2012 and 2013 in the area
of wine center Copou Iaşi were different in the nature of assortment variety and
wine have led to type DOC, IGR, şi VM.
Acknowledgments: The work was developed under the Sectorial Plan of
the ADER 2020 PS 6.1.1 entitled "Study and analysis for decision making wine
sector in the implementation of CAP restrictions for the wine sector"
REFERENCES
1. Cotea D.V., 1985 – Tratat de oenologie, Ed. Ceres, Bucureşti, vol I, pag. 35-81. 2. Cotea V.D., Zănoagă C.V., Cotea V.V., 2009 – Tratat de oenochimie, Editura
Academiei Române, vol.I, Bucureşti, 2. Dobrei A., Ghiţă Alina, Mălăescu Mihaela, Cristea T., 2011 – Calitate strugurilor
condiţie esenţială pentru obţinerea unor vinuri competitive. Buletinul Agir nr. 2/2011, pp. 49 – 52
3. Pomohaci N., Stoian V., Gheorghită M., Sîrghi C., Cotea V.V., Nămoloşanu I, 2000 – Oenologie, vol I. Prelucrarea strugurilor şi producerea vinurilor, Ed. Ceres,
Bucureşti, pp. 77-105. 4. Ţârdea C., 2007 – Chimia şi analiza vinului. Editura “Ion Ionescu de la Brad”, Iasi.
157
THE AGROPHYTOTECH AND TECHNOLOGY STUDY OF VARIETY FETEASCA REGALA GROWN IN AREA
CULTURE DIFFERENT
STUDIUL AGROFITOTEHNIC Şl TEHNOLOGIC AL SOIULUI FETEASCĂ REGALĂ CULTIVAT ÎN AREALE DIFERITE DE
CULTURĂ
DONICI Alina1, BURLACU C.
2, HODOR Daniela
3, NEGRARU Ana
4,
DAMIAN Doina5, STOIAN Ileana
6, DUMITRU Doina
7
e-mail: [email protected]
Abstract. In Romania, white wine the assortment is composed essentially of Fetească regală (17.9%), Fetească albă (10.9%), Riesling Italian (10%), Aligoté (6.5%). Fetească regală is with the widely spread variety in Romanian vineyards. Is equally vineyards in Moldova (Covurlui, Odobeşti, Iasi, Cotesti, Panciu, Vaslui), in Muntenia (Big Hill, Stefanesti-Arges) in Transylvania (Tarnave Sebes, Aiud), and others. Starting from the premise that climatic factors have a role in the success of the culture and quality of wines produced was considered Fetească regală evaluation in terms of tolerance to a biotic and biotic the stress factors. The research was made in 2012, atypical year for the vines, in seven viticulture areas RDSVV Bujoru, RDSVV Iasi RDIVV Valea Călugărească, RDSVV Odobesti, RDSVV Pietroasele, and RDSVV Murfatlar RDSVV Blaj. Key words: abiotic stress, production, quality, adaptability Rezumat. În România, sortimentul pentru vinuri albe este alcătuit, în principal, din soiurile Fetească regală (17,9%), Fetească albă (10,9%), Riesling italian (10%),Aligoté (6,5%). Soiul Fetească regală este soiul cu cea mai largă răspândire în podgoriile româneşti. Se găseste în egală măsură în podgorii din Moldova (Covurlui, Odobesti, Iaşi, Cotesti, Panciu, Vaslui,), in Muntenia (Dealul Mare, Stefanesti-Arges), in Transilvania (Tarnave, Sebes, Aiud), şi altele. Plecând de la premiza că factorii climatici au un rol determinant în reuşita culturii şi a calităţii vinurilor obţinute, s-a avut în vedere evaluarea soiului Fetească regală din punct de vedere al toleranţei la factorii de stres abiotici. Cercetările au fost realizate în anul 2012, an atipic pentru cultura viţei de vie, în şapte areale viticole SCDVV Bujoru, SCDVV Iaşi, ICDVV Valea Călugărească, SCDVV Odobesti, SCDVV Pietroasele, SCDVV Murfatlar, SCDVV Blaj. Cuvinte cheie: stres abiotic, producţie, calitate, adaptabilitate
1Vine and Wine Research and Development Station of Bujoru, Romania 2Researche and Development Institute for Viticulture and Vinification Valea Călugărească, Romania 3Vine and Wine Research and Development Station of Blaj, Romania 4 Vine and Wine Research and Development Station of Murfatlar, Romania
5 Vine and Wine Research and Development Station of Iasi, Romania
6 Vine and Wine Research and Development Station of Odobesti, Romania
7 Vine and Wine Research and Development Station of Pietroasele, Romania
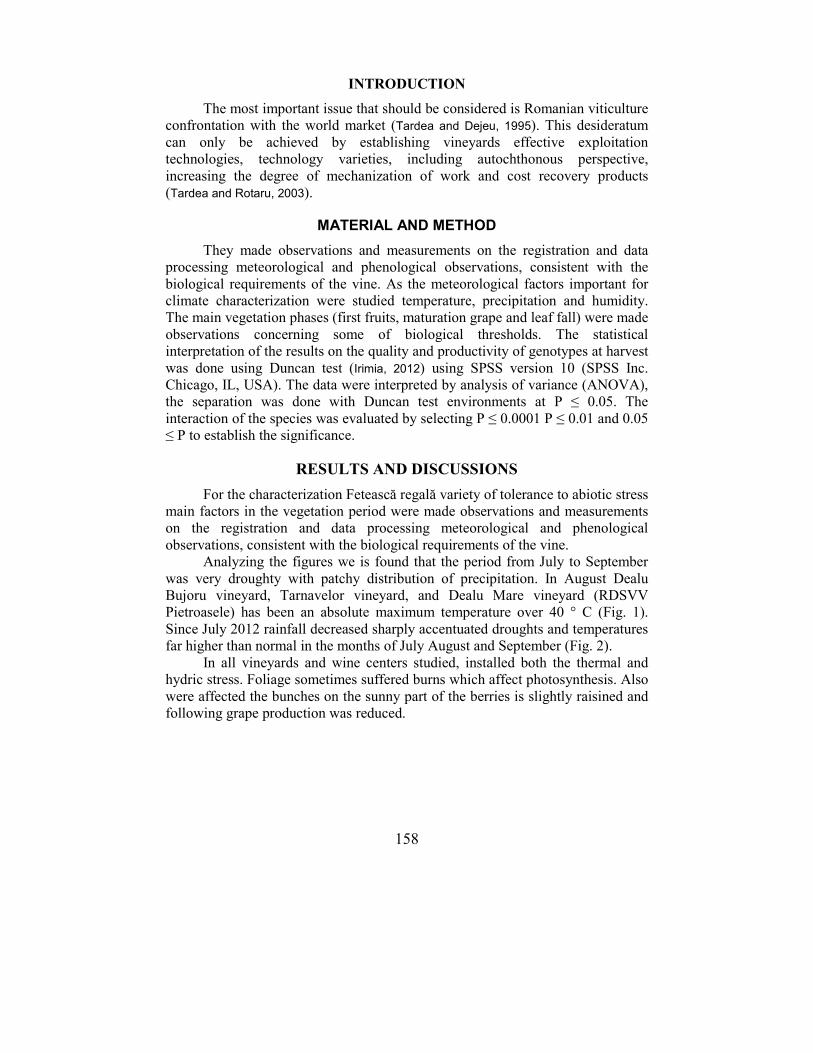
158
INTRODUCTION
The most important issue that should be considered is Romanian viticulture
confrontation with the world market (Tardea and Dejeu, 1995). This desideratum
can only be achieved by establishing vineyards effective exploitation
technologies, technology varieties, including autochthonous perspective,
increasing the degree of mechanization of work and cost recovery products
(Tardea and Rotaru, 2003).
MATERIAL AND METHOD
They made observations and measurements on the registration and data
processing meteorological and phenological observations, consistent with the
biological requirements of the vine. As the meteorological factors important for
climate characterization were studied temperature, precipitation and humidity.
The main vegetation phases (first fruits, maturation grape and leaf fall) were made
observations concerning some of biological thresholds. The statistical
interpretation of the results on the quality and productivity of genotypes at harvest
was done using Duncan test (Irimia, 2012) using SPSS version 10 (SPSS Inc.
Chicago, IL, USA). The data were interpreted by analysis of variance (ANOVA),
the separation was done with Duncan test environments at P ≤ 0.05. The
interaction of the species was evaluated by selecting P ≤ 0.0001 P ≤ 0.01 and 0.05
≤ P to establish the significance.
RESULTS AND DISCUSSIONS
For the characterization Fetească regală variety of tolerance to abiotic stress
main factors in the vegetation period were made observations and measurements
on the registration and data processing meteorological and phenological
observations, consistent with the biological requirements of the vine.
Analyzing the figures we is found that the period from July to September
was very droughty with patchy distribution of precipitation. In August Dealu
Bujoru vineyard, Tarnavelor vineyard, and Dealu Mare vineyard (RDSVV
Pietroasele) has been an absolute maximum temperature over 40 ° C (Fig. 1).
Since July 2012 rainfall decreased sharply accentuated droughts and temperatures
far higher than normal in the months of July August and September (Fig. 2).
In all vineyards and wine centers studied, installed both the thermal and
hydric stress. Foliage sometimes suffered burns which affect photosynthesis. Also
were affected the bunches on the sunny part of the berries is slightly raisined and
following grape production was reduced.
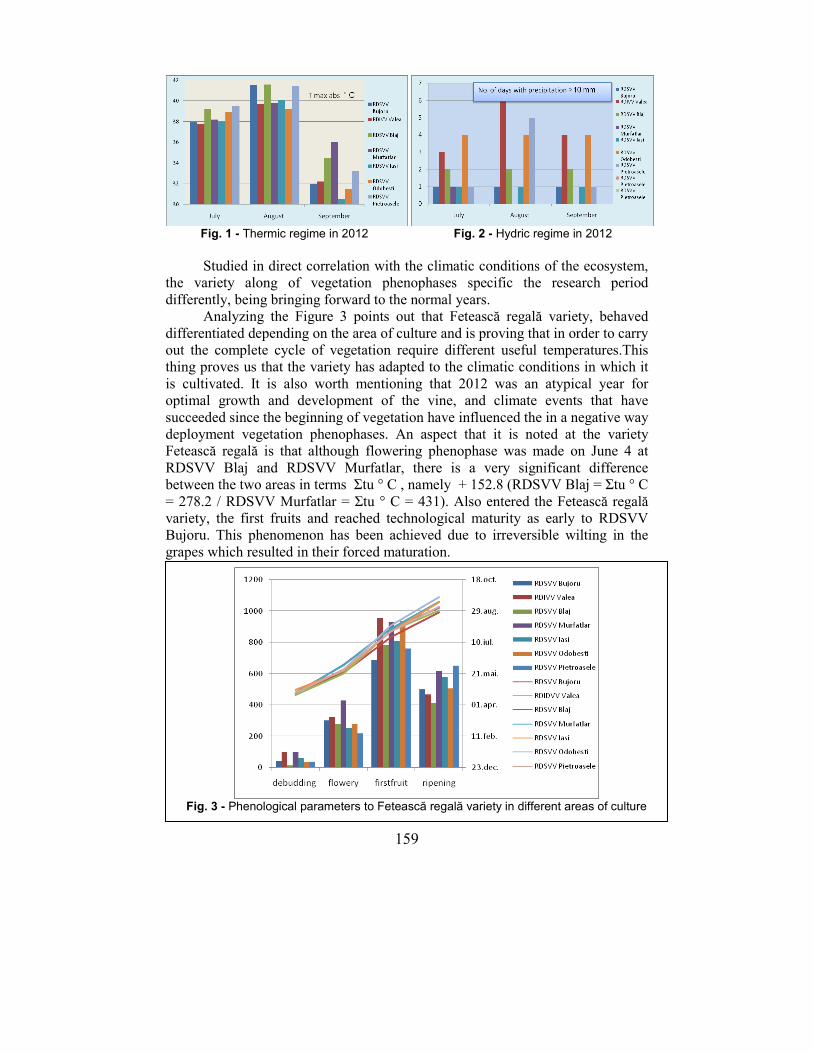
159
Fig. 1 - Thermic regime in 2012 Fig. 2 - Hydric regime in 2012
Studied in direct correlation with the climatic conditions of the ecosystem,
the variety along of vegetation phenophases specific the research period
differently, being bringing forward to the normal years.
Analyzing the Figure 3 points out that Fetească regală variety, behaved
differentiated depending on the area of culture and is proving that in order to carry
out the complete cycle of vegetation require different useful temperatures.This
thing proves us that the variety has adapted to the climatic conditions in which it
is cultivated. It is also worth mentioning that 2012 was an atypical year for
optimal growth and development of the vine, and climate events that have
succeeded since the beginning of vegetation have influenced the in a negative way
deployment vegetation phenophases. An aspect that it is noted at the variety
Fetească regală is that although flowering phenophase was made on June 4 at
RDSVV Blaj and RDSVV Murfatlar, there is a very significant difference
between the two areas in terms Σtu ° C , namely + 152.8 (RDSVV Blaj = Σtu ° C
= 278.2 / RDSVV Murfatlar = Σtu ° C = 431). Also entered the Fetească regală
variety, the first fruits and reached technological maturity as early to RDSVV
Bujoru. This phenomenon has been achieved due to irreversible wilting in the
grapes which resulted in their forced maturation.
Fig. 3 - Phenological parameters to Fetească regală variety in different areas of culture
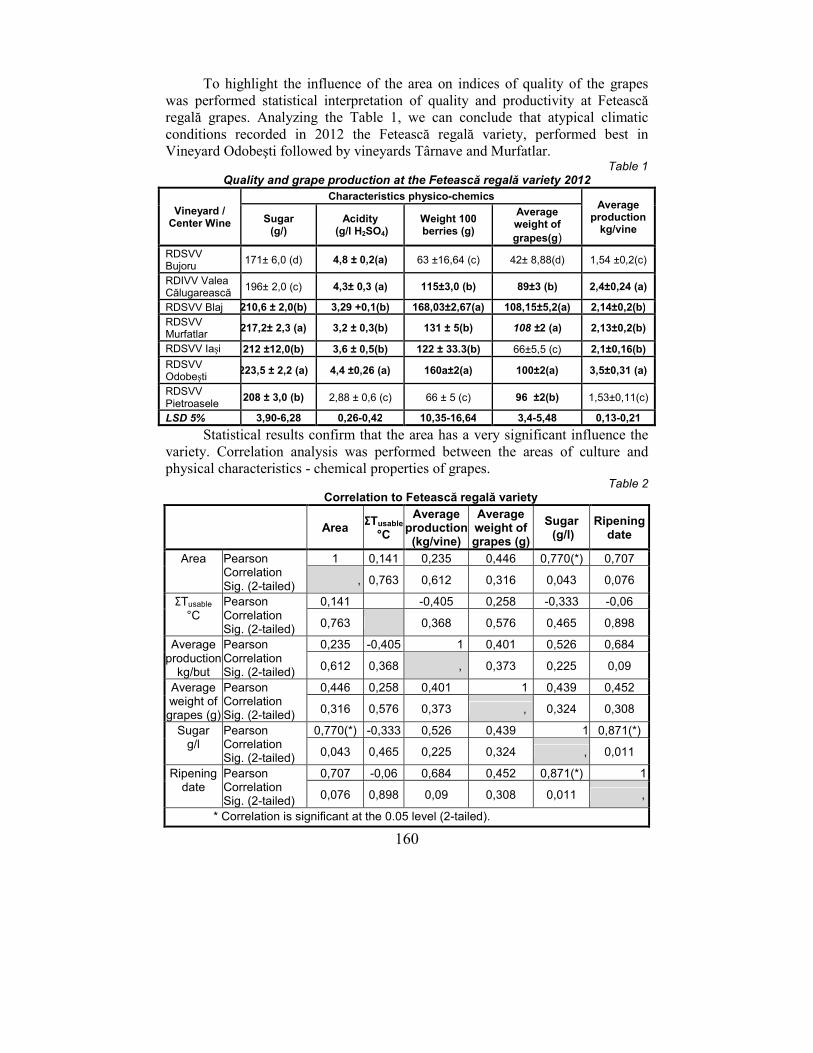
160
To highlight the influence of the area on indices of quality of the grapes
was performed statistical interpretation of quality and productivity at Fetească
regală grapes. Analyzing the Table 1, we can conclude that atypical climatic
conditions recorded in 2012 the Fetească regală variety, performed best in
Vineyard Odobeşti followed by vineyards Târnave and Murfatlar. Table 1
Quality and grape production at the Fetească regală variety 2012
Vineyard / Center Wine
Characteristics physico-chemics Average
production kg/vine
Sugar (g/)
Acidity (g/l H2SO4)
Weight 100 berries (g)
Average weight of
grapes(g)
RDSVV Bujoru
171± 6,0 (d) 4,8 ± 0,2(a) 63 ±16,64 (c) 42± 8,88(d) 1,54 ±0,2(c)
RDIVV Valea Călugarească
196± 2,0 (c) 4,3± 0,3 (a) 115±3,0 (b) 89±3 (b) 2,4±0,24 (a)
RDSVV Blaj 210,6 ± 2,0(b) 3,29 +0,1(b) 168,03±2,67(a) 108,15±5,2(a) 2,14±0,2(b)
RDSVV Murfatlar
217,2± 2,3 (a) 3,2 ± 0,3(b) 131 ± 5(b) 108 ±2 (a) 2,13±0,2(b)
RDSVV Iaşi 212 ±12,0(b) 3,6 ± 0,5(b) 122 ± 33.3(b) 66±5,5 (c) 2,1±0,16(b)
RDSVV Odobeşti
223,5 ± 2,2 (a) 4,4 ±0,26 (a) 160a±2(a) 100±2(a) 3,5±0,31 (a)
RDSVV Pietroasele
208 ± 3,0 (b) 2,88 ± 0,6 (c) 66 ± 5 (c) 96 ±2(b) 1,53±0,11(c)
LSD 5% 3,90-6,28 0,26-0,42 10,35-16,64 3,4-5,48 0,13-0,21
Statistical results confirm that the area has a very significant influence the
variety. Correlation analysis was performed between the areas of culture and
physical characteristics - chemical properties of grapes. Table 2
Correlation to Fetească regală variety
Area ΣTusable
°C
Average production
(kg/vine)
Average weight of grapes (g)
Sugar (g/l)
Ripening date
Area Pearson Correlation Sig. (2-tailed)
1 0,141 0,235 0,446 0,770(*) 0,707
, 0,763 0,612 0,316 0,043 0,076
ΣTusable
°C Pearson Correlation Sig. (2-tailed)
0,141 -0,405 0,258 -0,333 -0,06
0,763 0,368 0,576 0,465 0,898
Average production
kg/but
Pearson Correlation Sig. (2-tailed)
0,235 -0,405 1 0,401 0,526 0,684
0,612 0,368 , 0,373 0,225 0,09
Average weight of grapes (g)
Pearson Correlation Sig. (2-tailed)
0,446 0,258 0,401 1 0,439 0,452
0,316 0,576 0,373 , 0,324 0,308
Sugar g/l
Pearson Correlation Sig. (2-tailed)
0,770(*) -0,333 0,526 0,439 1 0,871(*)
0,043 0,465 0,225 0,324 , 0,011
Ripening date
Pearson Correlation Sig. (2-tailed)
0,707 -0,06 0,684 0,452 0,871(*) 1
0,076 0,898 0,09 0,308 0,011 ,
* Correlation is significant at the 0.05 level (2-tailed).
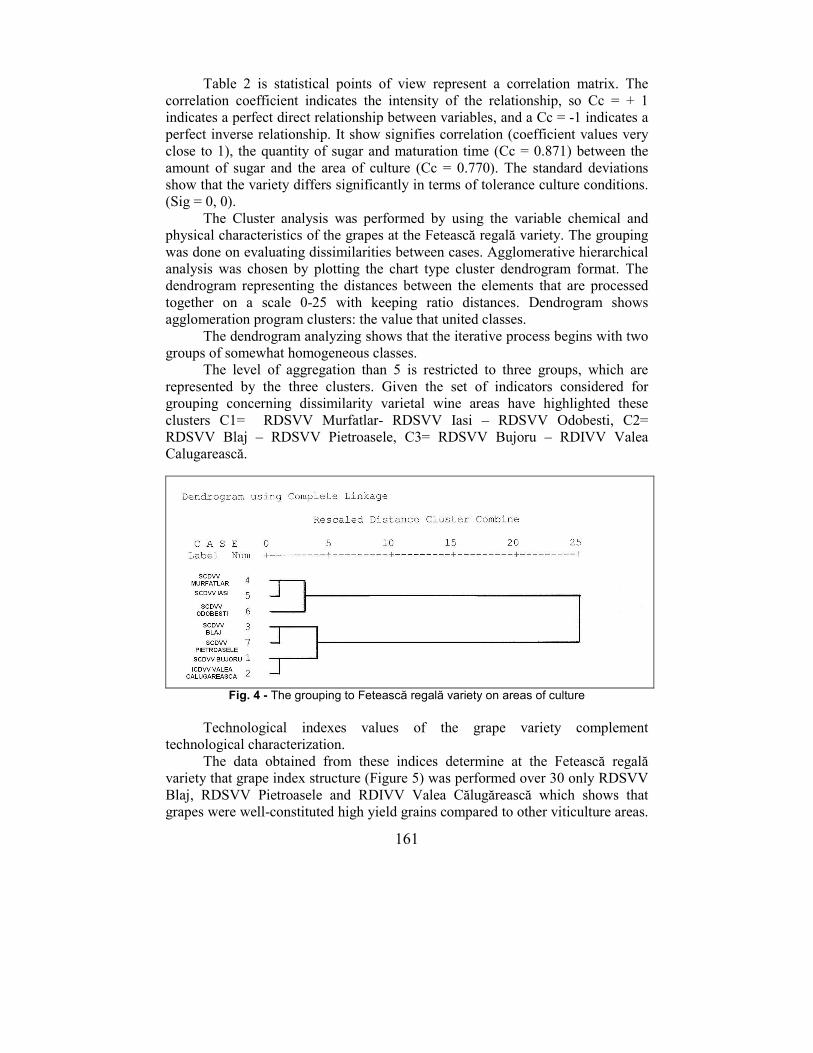
161
Table 2 is statistical points of view represent a correlation matrix. The
correlation coefficient indicates the intensity of the relationship, so Cc = + 1
indicates a perfect direct relationship between variables, and a Cc = -1 indicates a
perfect inverse relationship. It show signifies correlation (coefficient values very
close to 1), the quantity of sugar and maturation time (Cc = 0.871) between the
amount of sugar and the area of culture (Cc = 0.770). The standard deviations
show that the variety differs significantly in terms of tolerance culture conditions.
(Sig = 0, 0).
The Cluster analysis was performed by using the variable chemical and
physical characteristics of the grapes at the Fetească regală variety. The grouping
was done on evaluating dissimilarities between cases. Agglomerative hierarchical
analysis was chosen by plotting the chart type cluster dendrogram format. The
dendrogram representing the distances between the elements that are processed
together on a scale 0-25 with keeping ratio distances. Dendrogram shows
agglomeration program clusters: the value that united classes.
The dendrogram analyzing shows that the iterative process begins with two
groups of somewhat homogeneous classes.
The level of aggregation than 5 is restricted to three groups, which are
represented by the three clusters. Given the set of indicators considered for
grouping concerning dissimilarity varietal wine areas have highlighted these
clusters C1= RDSVV Murfatlar- RDSVV Iasi – RDSVV Odobesti, C2=
RDSVV Blaj – RDSVV Pietroasele, C3= RDSVV Bujoru – RDIVV Valea
Calugarească.
Fig. 4 - The grouping to Fetească regală variety on areas of culture
Technological indexes values of the grape variety complement
technological characterization.
The data obtained from these indices determine at the Fetească regală
variety that grape index structure (Figure 5) was performed over 30 only RDSVV
Blaj, RDSVV Pietroasele and RDIVV Valea Călugărească which shows that
grapes were well-constituted high yield grains compared to other viticulture areas.
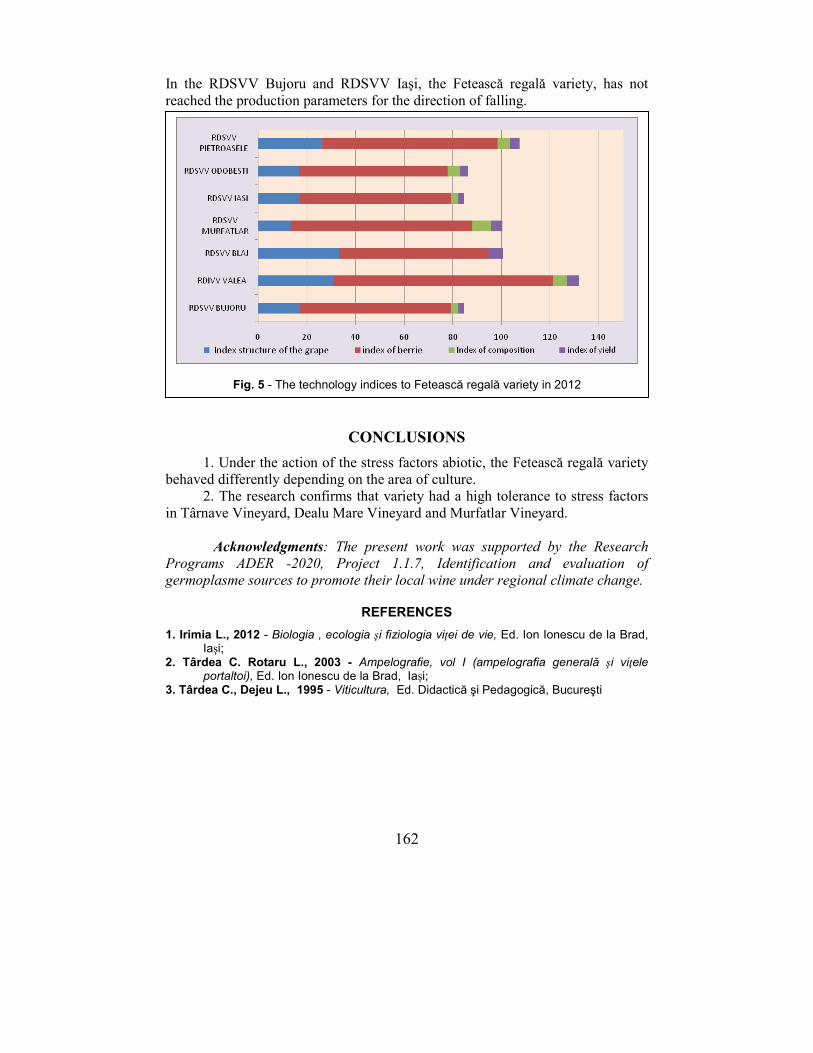
162
In the RDSVV Bujoru and RDSVV Iaşi, the Fetească regală variety, has not
reached the production parameters for the direction of falling.
CONCLUSIONS
1. Under the action of the stress factors abiotic, the Fetească regală variety
behaved differently depending on the area of culture.
2. The research confirms that variety had a high tolerance to stress factors
in Târnave Vineyard, Dealu Mare Vineyard and Murfatlar Vineyard.
Acknowledgments: The present work was supported by the Research Programs ADER -2020, Project 1.1.7, Identification and evaluation of germoplasme sources to promote their local wine under regional climate change.
REFERENCES
1. Irimia L., 2012 - Biologia , ecologia şi fiziologia viţei de vie, Ed. Ion Ionescu de la Brad, Iaşi;
2. Târdea C. Rotaru L., 2003 - Ampelografie, vol I (ampelografia generală şi viţele portaltoi), Ed. Ion Ionescu de la Brad, Iaşi;
3. Târdea C., Dejeu L., 1995 - Viticultura, Ed. Didactică şi Pedagogică, Bucureşti
Fig. 5 - The technology indices to Fetească regală variety in 2012
163
INFLUENCE OF CLIMATIC CONDITIONS ON THE QUALITY OF GRAPES AND WINES OBTAINED FROM
ALIGOTÉ AND FETEASCĂ REGALĂ VARIETIES CULTIVATED IN IAŞI-COPOU VITICULTURAL CENTER
INFLUENŢA CONDIŢIILOR CLIMATICE ASUPRA CALITĂŢII STRUGURILOR ŞI A VINURILOR DIN SOIURILE ALIGOTÉ ŞI
FETEASCĂ REGALĂ CULTIVATE ÎN CENTRUL VITICOL COPOU IAŞI
ZALDEA Gabi
1, NECHITA Ancuta
1, CODREANU Maria
1, DAMIAN Doina
1
e-mail: [email protected]
Abstract. In recent years there have been increasingly frequent extreme weather: frost, prolonged drought , heavy rains during flowering, which have an adverse impact on the vine. Recorded heavy rainfall in May and June of 2013, more than double compared to normal values during flowering and heavy rainfall and a climate cool in September, helped decrease the quantity and quality. This paper presents the values of climatic factors and their impact on the quality of grapes and wines from varieties Aligoté and Fetească regală cultivated in Iasi - Copou viticultural center Key words: climatic conditions, grape, wine Rezumat. În ultimii ani s-au înregistrat tot mai frecvent fenomene climatice extreme: îngheţ, secetă prelungită, ploi abundente în perioada înfloritului, care au un impact nefavorabil asupra viţei de vie. Precipitaţiile abundente înregistrate în lunile mai şi iunie din anul 2013, mai mult decât dublu comparativ cu valorile normale, din perioada înfloritului precum şi ploile abundente şi instalarea unui climat răcoros în luna septembrie, au contribuit la diminuarea producţiilor cantitativ şi calitativ. În lucrare sunt prezentate valorile factorilor climatici şi impactul acestora asupra calităţii strugurilor şi a vinurilor din soiurile Aligoté şi Fetească regală cultivate în centrul viticol Copou Iaşi Cuvinte cheie: condiţii climatice, struguri, vin
INTRODUCTION
Vineyards in the north-east of Moldova at the northern limit of the
culture of the vine are more affected by climate change occurring in the last
decades.
Temperatures rising in recent years (average, maximum) in late April
and early May led an earlier phenophases vegetation vine and wine
appearance of disturbances in ecosystems viticols (Zaldea et.al., 2013).
Also, it was found, in recent years, a trend of forced ripening grapes
unwanted repercussions on the quantity and quality of grapes (Vasile et.al.,
2010).
1Station of Research and Development for Winegrowing and Wine Production of Iaşi, Romania
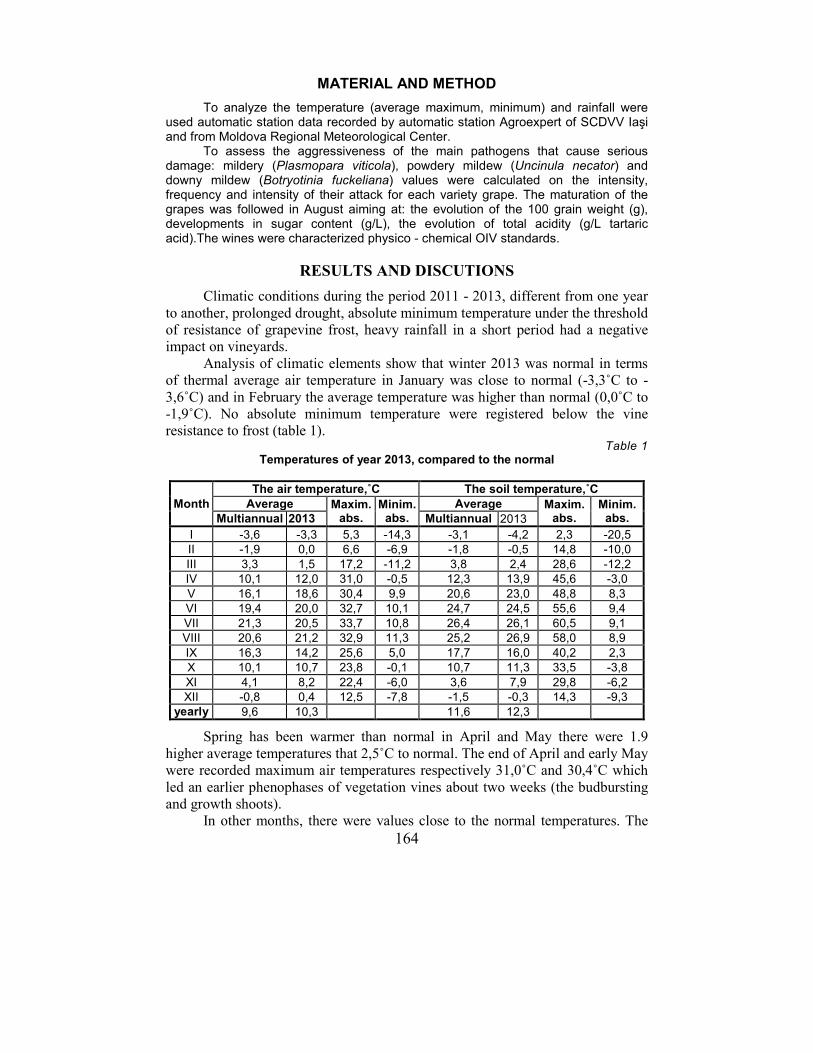
164
MATERIAL AND METHOD
To analyze the temperature (average maximum, minimum) and rainfall were used automatic station data recorded by automatic station Agroexpert of SCDVV Iaşi and from Moldova Regional Meteorological Center.
To assess the aggressiveness of the main pathogens that cause serious damage: mildery (Plasmopara viticola), powdery mildew (Uncinula necator) and downy mildew (Botryotinia fuckeliana) values were calculated on the intensity, frequency and intensity of their attack for each variety grape. The maturation of the grapes was followed in August aiming at: the evolution of the 100 grain weight (g), developments in sugar content (g/L), the evolution of total acidity (g/L tartaric acid).The wines were characterized physico - chemical OIV standards.
RESULTS AND DISCUTIONS
Climatic conditions during the period 2011 - 2013, different from one year
to another, prolonged drought, absolute minimum temperature under the threshold
of resistance of grapevine frost, heavy rainfall in a short period had a negative
impact on vineyards.
Analysis of climatic elements show that winter 2013 was normal in terms
of thermal average air temperature in January was close to normal (-3,3˚C to -
3,6˚C) and in February the average temperature was higher than normal (0,0˚C to
-1,9˚C). No absolute minimum temperature were registered below the vine
resistance to frost (table 1). Table 1
Temperatures of year 2013, compared to the normal
Month
The air temperature,˚C The soil temperature,˚C
Average Maxim. abs.
Minim. abs.
Average Maxim. abs.
Minim. abs. Multiannual 2013 Multiannual 2013
I -3,6 -3,3 5,3 -14,3 -3,1 -4,2 2,3 -20,5
II -1,9 0,0 6,6 -6,9 -1,8 -0,5 14,8 -10,0
III 3,3 1,5 17,2 -11,2 3,8 2,4 28,6 -12,2
IV 10,1 12,0 31,0 -0,5 12,3 13,9 45,6 -3,0
V 16,1 18,6 30,4 9,9 20,6 23,0 48,8 8,3
VI 19,4 20,0 32,7 10,1 24,7 24,5 55,6 9,4
VII 21,3 20,5 33,7 10,8 26,4 26,1 60,5 9,1
VIII 20,6 21,2 32,9 11,3 25,2 26,9 58,0 8,9
IX 16,3 14,2 25,6 5,0 17,7 16,0 40,2 2,3
X 10,1 10,7 23,8 -0,1 10,7 11,3 33,5 -3,8
XI 4,1 8,2 22,4 -6,0 3,6 7,9 29,8 -6,2
XII -0,8 0,4 12,5 -7,8 -1,5 -0,3 14,3 -9,3
yearly 9,6 10,3 11,6 12,3
Spring has been warmer than normal in April and May there were 1.9
higher average temperatures that 2,5˚C to normal. The end of April and early May
were recorded maximum air temperatures respectively 31,0˚C and 30,4˚C which
led an earlier phenophases of vegetation vines about two weeks (the budbursting
and growth shoots).
In other months, there were values close to the normal temperatures. The
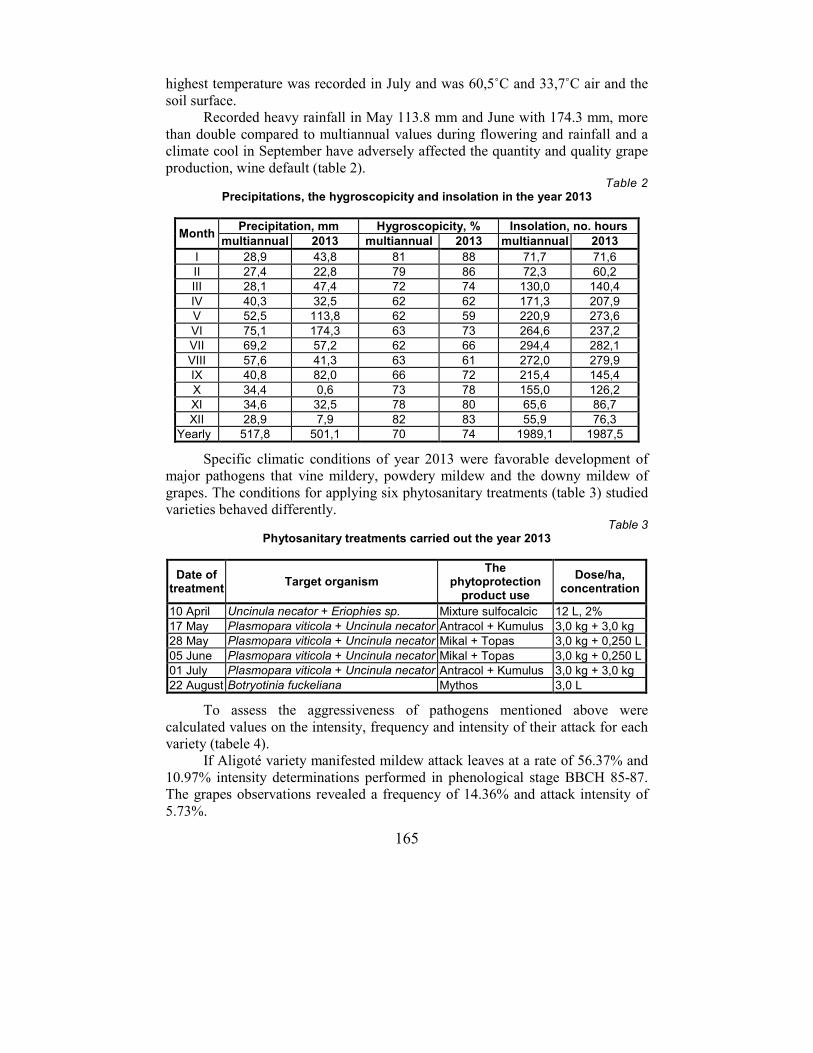
165
highest temperature was recorded in July and was 60,5˚C and 33,7˚C air and the
soil surface.
Recorded heavy rainfall in May 113.8 mm and June with 174.3 mm, more
than double compared to multiannual values during flowering and rainfall and a
climate cool in September have adversely affected the quantity and quality grape
production, wine default (table 2). Table 2
Precipitations, the hygroscopicity and insolation in the year 2013
Month Precipitation, mm Hygroscopicity, % Insolation, no. hours
multiannual 2013 multiannual 2013 multiannual 2013
I 28,9 43,8 81 88 71,7 71,6
II 27,4 22,8 79 86 72,3 60,2
III 28,1 47,4 72 74 130,0 140,4
IV 40,3 32,5 62 62 171,3 207,9
V 52,5 113,8 62 59 220,9 273,6
VI 75,1 174,3 63 73 264,6 237,2
VII 69,2 57,2 62 66 294,4 282,1
VIII 57,6 41,3 63 61 272,0 279,9
IX 40,8 82,0 66 72 215,4 145,4
X 34,4 0,6 73 78 155,0 126,2
XI 34,6 32,5 78 80 65,6 86,7
XII 28,9 7,9 82 83 55,9 76,3
Yearly 517,8 501,1 70 74 1989,1 1987,5
Specific climatic conditions of year 2013 were favorable development of
major pathogens that vine mildery, powdery mildew and the downy mildew of
grapes. The conditions for applying six phytosanitary treatments (table 3) studied
varieties behaved differently. Table 3
Phytosanitary treatments carried out the year 2013
Date of treatment
Target organism The
phytoprotection product use
Dose/ha, concentration
10 April Uncinula necator + Eriophies sp. Mixture sulfocalcic 12 L, 2%
17 May Plasmopara viticola + Uncinula necator Antracol + Kumulus 3,0 kg + 3,0 kg
28 May Plasmopara viticola + Uncinula necator Mikal + Topas 3,0 kg + 0,250 L
05 June Plasmopara viticola + Uncinula necator Mikal + Topas 3,0 kg + 0,250 L
01 July Plasmopara viticola + Uncinula necator Antracol + Kumulus 3,0 kg + 3,0 kg
22 August Botryotinia fuckeliana Mythos 3,0 L
To assess the aggressiveness of pathogens mentioned above were
calculated values on the intensity, frequency and intensity of their attack for each
variety (tabele 4).
If Aligoté variety manifested mildew attack leaves at a rate of 56.37% and
10.97% intensity determinations performed in phenological stage BBCH 85-87.
The grapes observations revealed a frequency of 14.36% and attack intensity of
5.73%.
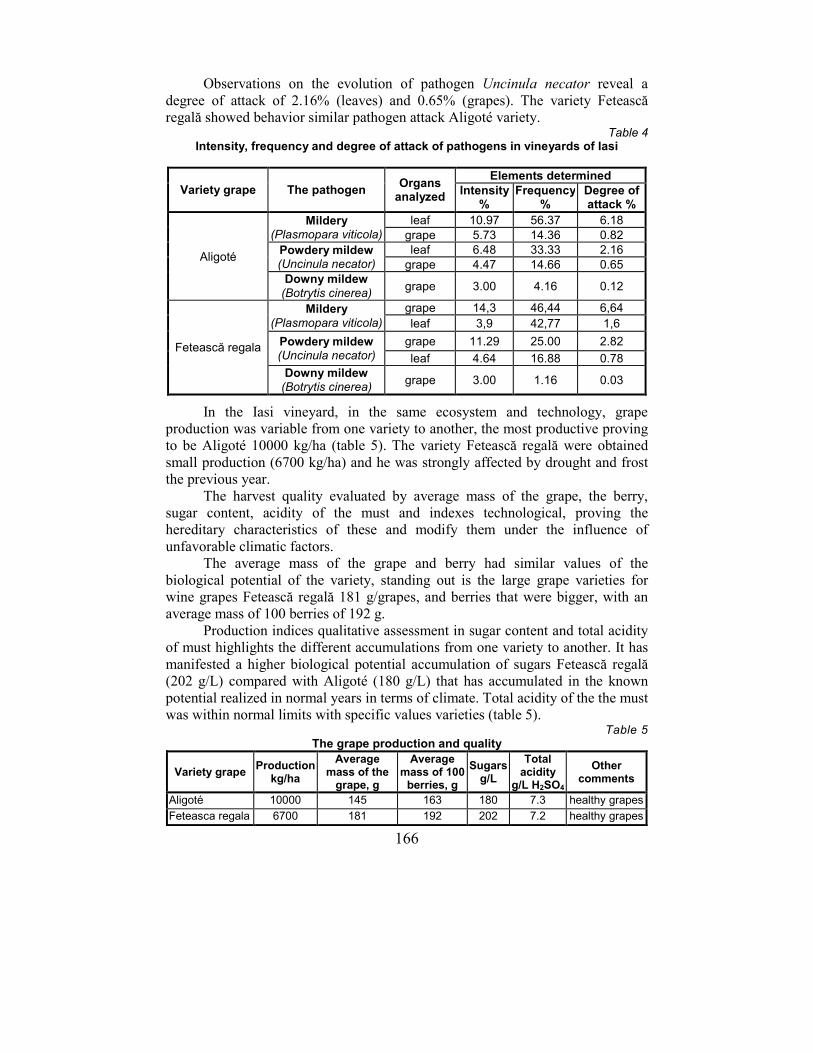
166
Observations on the evolution of pathogen Uncinula necator reveal a
degree of attack of 2.16% (leaves) and 0.65% (grapes). The variety Fetească
regală showed behavior similar pathogen attack Aligoté variety. Table 4
Intensity, frequency and degree of attack of pathogens in vineyards of Iasi
Variety grape The pathogen Organs
analyzed
Elements determined
Intensity %
Frequency %
Degree of attack %
Aligoté
Mildery (Plasmopara viticola)
leaf 10.97 56.37 6.18
grape 5.73 14.36 0.82
Powdery mildew (Uncinula necator)
leaf 6.48 33.33 2.16
grape 4.47 14.66 0.65
Downy mildew
(Botrytis cinerea) grape 3.00 4.16 0.12
Fetească regala
Mildery (Plasmopara viticola)
grape 14,3 46,44 6,64
leaf 3,9 42,77 1,6
Powdery mildew (Uncinula necator)
grape 11.29 25.00 2.82
leaf 4.64 16.88 0.78
Downy mildew (Botrytis cinerea)
grape 3.00 1.16 0.03
In the Iasi vineyard, in the same ecosystem and technology, grape
production was variable from one variety to another, the most productive proving
to be Aligoté 10000 kg/ha (table 5). The variety Fetească regală were obtained
small production (6700 kg/ha) and he was strongly affected by drought and frost
the previous year.
The harvest quality evaluated by average mass of the grape, the berry,
sugar content, acidity of the must and indexes technological, proving the
hereditary characteristics of these and modify them under the influence of
unfavorable climatic factors.
The average mass of the grape and berry had similar values of the
biological potential of the variety, standing out is the large grape varieties for
wine grapes Fetească regală 181 g/grapes, and berries that were bigger, with an
average mass of 100 berries of 192 g.
Production indices qualitative assessment in sugar content and total acidity
of must highlights the different accumulations from one variety to another. It has
manifested a higher biological potential accumulation of sugars Fetească regală
(202 g/L) compared with Aligoté (180 g/L) that has accumulated in the known
potential realized in normal years in terms of climate. Total acidity of the the must
was within normal limits with specific values varieties (table 5). Table 5
The grape production and quality
Variety grape Production
kg/ha
Average mass of the
grape, g
Average mass of 100
berries, g
Sugars g/L
Total acidity
g/L H2SO4
Other comments
Aligoté 10000 145 163 180 7.3 healthy grapes
Feteasca regala 6700 181 192 202 7.2 healthy grapes
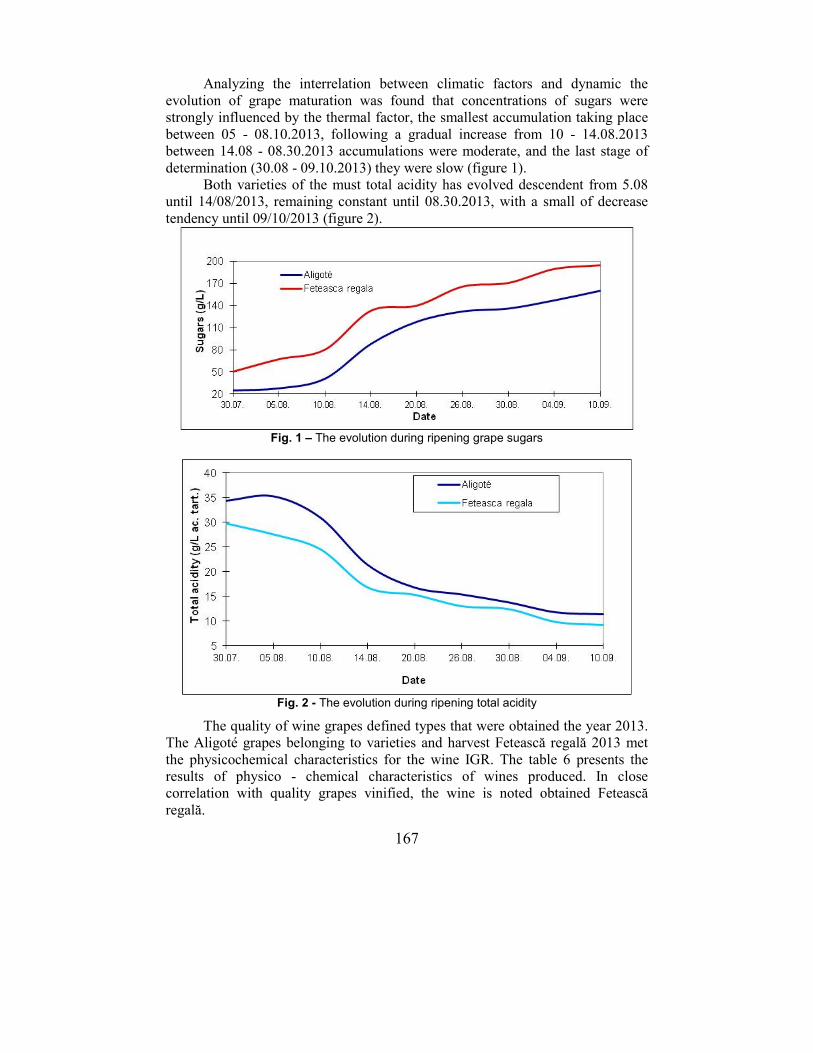
167
Analyzing the interrelation between climatic factors and dynamic the
evolution of grape maturation was found that concentrations of sugars were
strongly influenced by the thermal factor, the smallest accumulation taking place
between 05 - 08.10.2013, following a gradual increase from 10 - 14.08.2013
between 14.08 - 08.30.2013 accumulations were moderate, and the last stage of
determination (30.08 - 09.10.2013) they were slow (figure 1).
Both varieties of the must total acidity has evolved descendent from 5.08
until 14/08/2013, remaining constant until 08.30.2013, with a small of decrease
tendency until 09/10/2013 (figure 2).
Fig. 1 – The evolution during ripening grape sugars
Fig. 2 - The evolution during ripening total acidity
The quality of wine grapes defined types that were obtained the year 2013.
The Aligoté grapes belonging to varieties and harvest Fetească regală 2013 met
the physicochemical characteristics for the wine IGR. The table 6 presents the
results of physico - chemical characteristics of wines produced. In close
correlation with quality grapes vinified, the wine is noted obtained Fetească
regală.
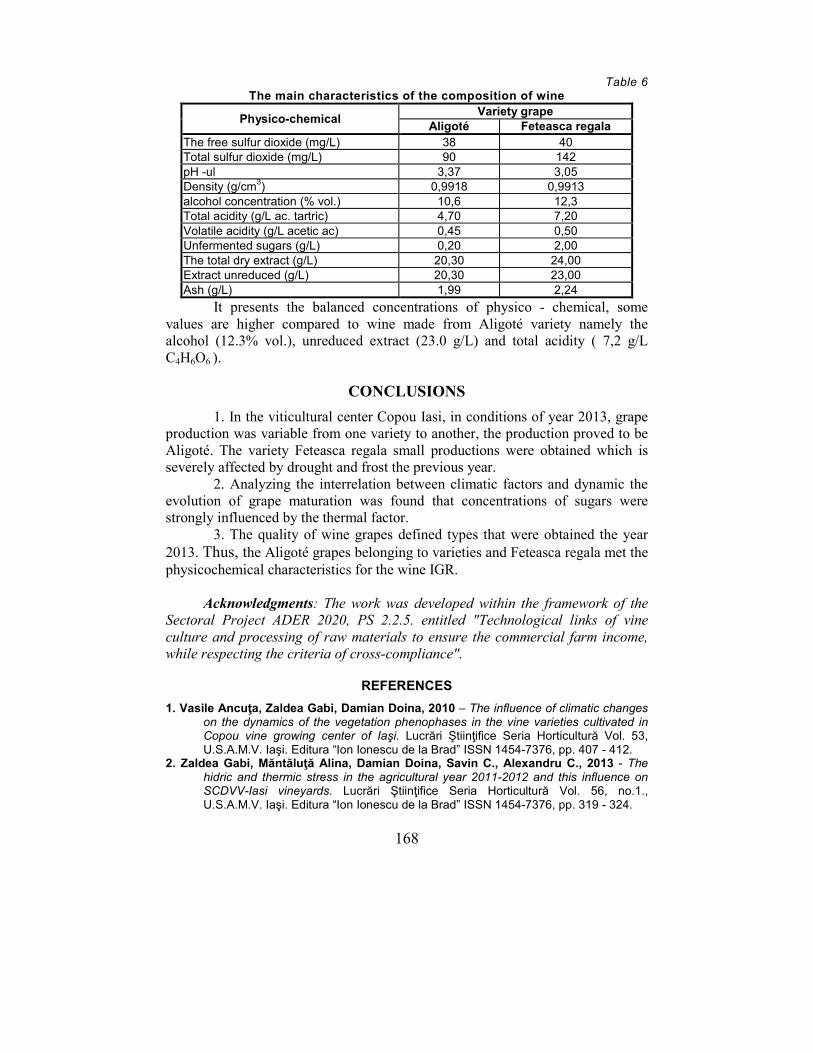
168
Table 6 The main characteristics of the composition of wine
Physico-chemical Variety grape
Aligoté Feteasca regala
The free sulfur dioxide (mg/L) 38 40
Total sulfur dioxide (mg/L) 90 142
pH -ul 3,37 3,05
Density (g/cm3) 0,9918 0,9913
alcohol concentration (% vol.) 10,6 12,3
Total acidity (g/L ac. tartric) 4,70 7,20
Volatile acidity (g/L acetic ac) 0,45 0,50
Unfermented sugars (g/L) 0,20 2,00
The total dry extract (g/L) 20,30 24,00
Extract unreduced (g/L) 20,30 23,00
Ash (g/L) 1,99 2,24
It presents the balanced concentrations of physico - chemical, some
values are higher compared to wine made from Aligoté variety namely the
alcohol (12.3% vol.), unreduced extract (23.0 g/L) and total acidity ( 7,2 g/L
C4H6O6 ).
CONCLUSIONS
1. In the viticultural center Copou Iasi, in conditions of year 2013, grape
production was variable from one variety to another, the production proved to be
Aligoté. The variety Feteasca regala small productions were obtained which is
severely affected by drought and frost the previous year.
2. Analyzing the interrelation between climatic factors and dynamic the
evolution of grape maturation was found that concentrations of sugars were
strongly influenced by the thermal factor.
3. The quality of wine grapes defined types that were obtained the year
2013. Thus, the Aligoté grapes belonging to varieties and Feteasca regala met the
physicochemical characteristics for the wine IGR.
Acknowledgments: The work was developed within the framework of the Sectoral Project ADER 2020, PS 2.2.5. entitled "Technological links of vine culture and processing of raw materials to ensure the commercial farm income, while respecting the criteria of cross-compliance".
REFERENCES
1. Vasile Ancuţa, Zaldea Gabi, Damian Doina, 2010 – The influence of climatic changes on the dynamics of the vegetation phenophases in the vine varieties cultivated in Copou vine growing center of Iaşi. Lucrări Ştiinţifice Seria Horticultură Vol. 53, U.S.A.M.V. Iaşi. Editura “Ion Ionescu de la Brad” ISSN 1454-7376, pp. 407 - 412.
2. Zaldea Gabi, Măntăluţă Alina, Damian Doina, Savin C., Alexandru C., 2013 - The hidric and thermic stress in the agricultural year 2011-2012 and this influence on SCDVV-Iasi vineyards. Lucrări Ştiinţifice Seria Horticultură Vol. 56, no.1., U.S.A.M.V. Iaşi. Editura “Ion Ionescu de la Brad” ISSN 1454-7376, pp. 319 - 324.
169
RESEARCH ON MINIMIZING THE DISRUPTIVE EFFECT
OF CLIMATE CHANGE ON VITICULTURE BY APPLYING
ADAPTED TECHNOLOGIES
CERCETĂRI PRIVIND MINIMIZAREA EFECTULUI PERTURBATOR
AL SCHIMBĂRILOR CLIMATICE ÎN VITICULTURĂ PRIN
APLICAREA UNOR TEHNOLOGII VITICOLE ADAPTATE
ENACHE Viorica1, DONICI Alina
1
e-mail: [email protected]
Abstract. The research was conducted within SCDVV Bujoru, Galati county in the climatic conditions of the years 2012 to 2013. Experienced technological factors (soil system maintenance and fruit load) differentially influenced the intensity of physiological and biochemical processes with direct consequences for grape production and quality. A stronger positive influence on the production of grap, to exercise maintenance system, ground biggest productions were obtained when total mulching with straw. High temperatures combined with poor rainfall during the growing season and diurnal average consumption vine led to soil moisture differentiated soil in system maintenance. In a dry year, grape production was influenced by soil maintenance system, the maximum yield for variant partial mulching. In a normal year in terms of climate stands out partial mulching option, followed by mulching total. Systems maintenance of soil by mulching (total or partial) and minimum tillage exerted a positive influence on the quality of grape production. The reduction of the load of the fruit (20 and 40%) resulted in the maintenance of the systems of the soil to increase the content of sugar in the grapes and a decrease in acidity of the must, which yielded high values of the index gluco-acidimetric, adverse obtaining quality wines and typical. Key words: vine, moisture, grape marc, mulching total, minimum tillage
Rezumat. Cercetările s-au efectuat în cadrul SCDVV Bujoru, jud. Galaţi în condiţiile climatice ale anilor 2012-2013. Factorii tehnologici experimentaţi (sistem de întreţinere al solului şi încărcătura de rod) au influenţat în mod diferenţiat intensitatea proceselor fiziologice si biochimice cu consecinţe directe asupra producţiei de struguri şi a calităţii acesteia. O influenţă pozitivă pregnantă asupra producţiei de struguri a exercita sistemul de întreţinere al solului, producţiile cele mai mari s-au obţinut în cazul mulcirii totale cu paie. Temperaturile ridicate, cumulat cu precipitaţiile deficitare din perioada de vegetaţie şi consumul mediu diurn al viţei de vie au condus la umidităţi ale solului diferenţiate în funcţie de sistemul de intreţinere al solului. Într-un an secetos, producţia de struguri a fost influenţată de sistemul de întreţinere al solului, maximul obţinându-se în cazul variantei mulcire parţială. Într-un an normal din punct de vedere climatic se evideţiază varianta mulcire parţială, urmată de mulcirea totală. Sistemele de întreţinere a solului prin mulcire (totală sau parţială) şi minimum tillage au exercitat o influenţă pozitivă asupra calităţii producţiei de struguri. Reducerea încărcăturii de rod (cu 20 şi 40%) a
1 Vine and Wine Research and Development Station of Bujoru, Romania
170
determinat în cazul tuturor sistemelor de întreţinere a solului o creştere a conţinutului de zahăr în struguri şi o scădere a acidităţii mustului, fapt ce a condus la obţinerea unor valori ridicate ale indicelui glucoacidimetric, nefavorabile obţinerii unor vinuri tipice şi de calitate. Cuvinte cheie: viţă de vie, umiditate, tescovină compostată, mulcire totală, minimum tillage
INTRODUCTION
Climate change occurred mainly in the last decade have affected
increasingly more vineyards in Moldavia, mainly in the south. Water regime of
the vine is the whole process of absorption of moisture from the environment,
moving them into the plant and its elimination in the external environment, in the
context of creating and maintaining an ecological balance, ameliorative
permanent, not upset at all dynamics of soil, water and plants. Water regime is
represented by the biology of the species and varieties of vines to the water
necessary for growth, fruiting and ripening (varieties differ greatly from one to
another with regard to water consumption), the climatic characteristics of the area,
soil properties and applied technology (Alexandrescu et al. 1994). Alternative
techniques vine culture and especially the use of biological methods of culture,
contributes to ease the long monoculture. They tend to establish a new balance in
the ecosystem components are considered more natural that respects life and the environment. The vine is developed as a result of growth unit is a water consuming. It has great possibilities for water supply and precipitation conditions
of about 450 mm / year since it has a developed root system, physiological and
ecological plasticity large, high root pressure and high suction force leaves (Liviu
Dejeu et al. 1997). The vine has a growth device developed as result is a consumer high of water. It has great possibilities for water and precipitation conditions of
about 450 mm / year since it has a developed root system, physiological and
ecological plasticity large, high root pressure and high suction force leaves (Dejeu
et. al., 1997).
MATERIAL AND METHOD
The experience was done in the experimental polygon Bujoru RDS VV planted with Merlot. The research was conducted over the period 2012-2013 and taking into account the intended purpose in the study were the following aspects:
Factor A – soil maintenance system with graduations: a1 – black field (autumn plowing, spring plowing, hoeing mechanical interval 5, 5 manual hoeing a row, fertilization with N, P, K optimal dose) (fig. 1); a2 – total mulching with crop residues/straw (straw spread over a time interval and
layer thickness of 10 cm, fertilization with N, P, K optimal dose), (fig. 2); a3 – partial mulching interval with grape marc composted (composted pomace spread within the thickness of 10 cm on all post-emergent herbicide - 2 herbicides, fertilization with N, P, K at a dose reduced by 50%), (fig. 3). a4 –minimum tillage(autumn plowing, hoeing deep mechanical spring post emergence
herbicide total 2-3 herbicide, fertilization with N, P, K optimal dose) (fig.4). Factor B – fruit load with graduations:
b1 – Recommended fruit load (36 eye / hub)
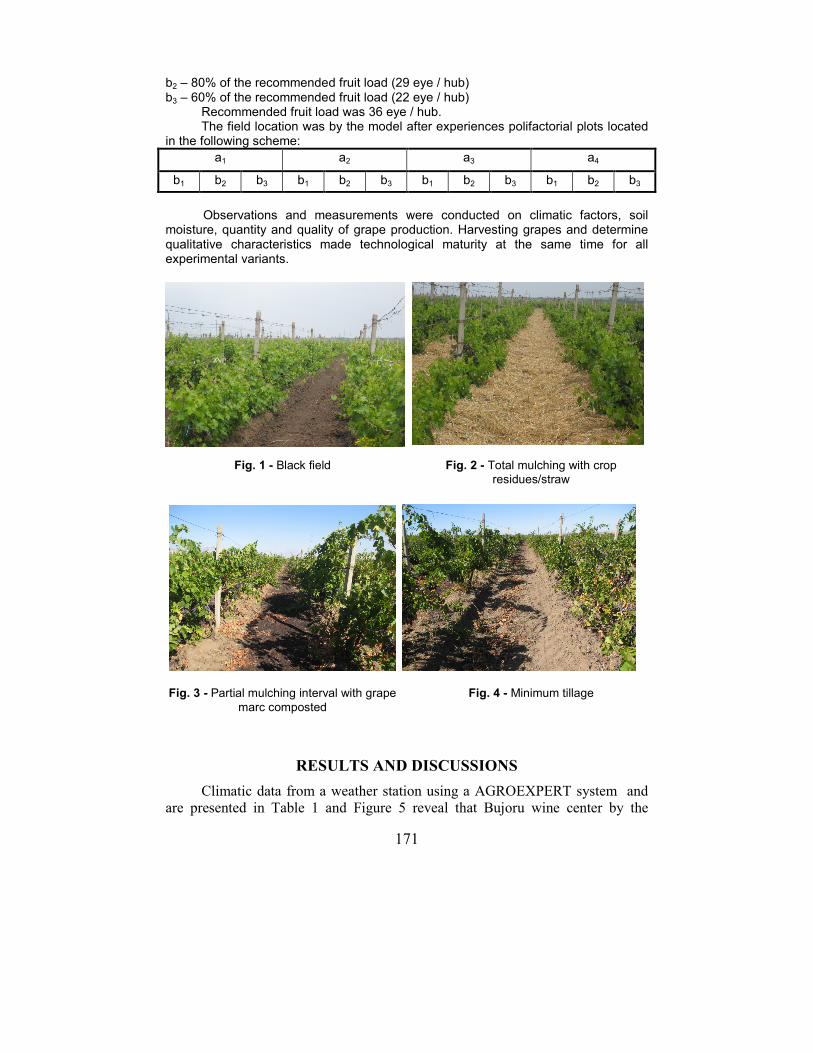
171
b2 – 80% of the recommended fruit load (29 eye / hub) b3 – 60% of the recommended fruit load (22 eye / hub)
Recommended fruit load was 36 eye / hub. The field location was by the model after experiences polifactorial plots located
in the following scheme:
a1 a2 a3 a4
b1 b2 b3 b1 b2 b3 b1 b2 b3 b1 b2 b3
Observations and measurements were conducted on climatic factors, soil
moisture, quantity and quality of grape production. Harvesting grapes and determine qualitative characteristics made technological maturity at the same time for all experimental variants.
Fig. 1 - Black field Fig. 2 - Total mulching with crop
residues/straw
Fig. 3 - Partial mulching interval with grape
marc composted
Fig. 4 - Minimum tillage
RESULTS AND DISCUSSIONS
Climatic data from a weather station using a AGROEXPERT system and
are presented in Table 1 and Figure 5 reveal that Bujoru wine center by the
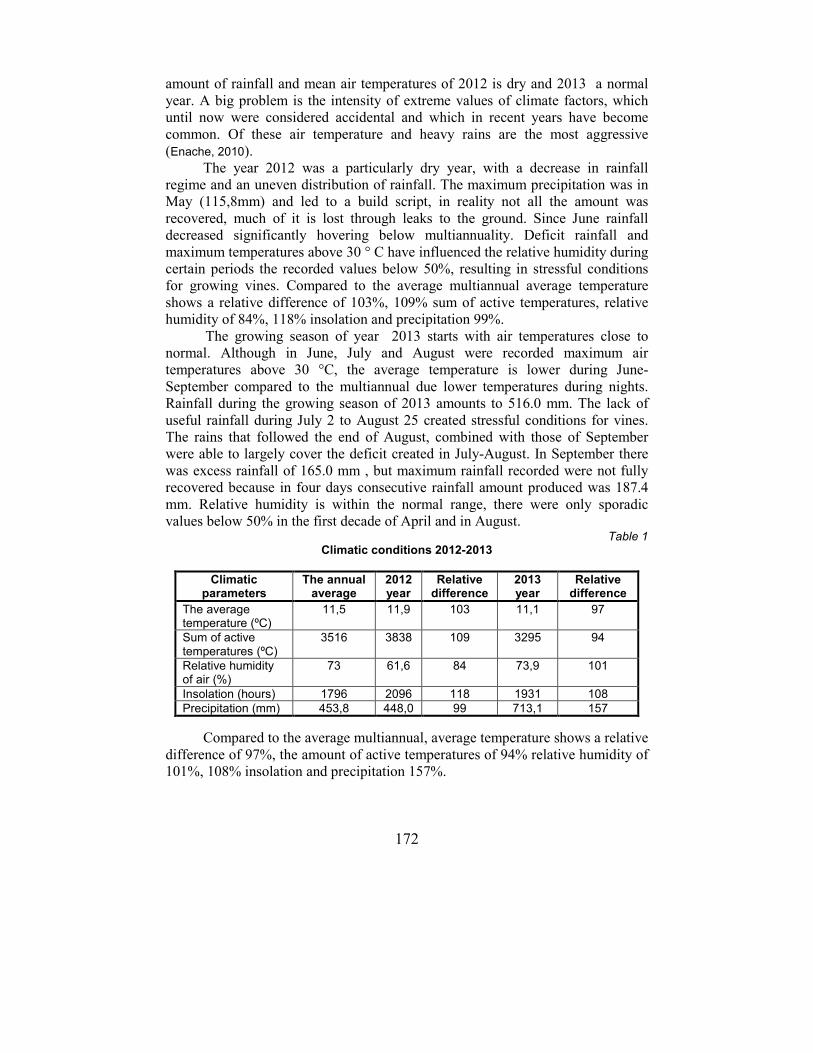
172
amount of rainfall and mean air temperatures of 2012 is dry and 2013 a normal
year. A big problem is the intensity of extreme values of climate factors, which
until now were considered accidental and which in recent years have become
common. Of these air temperature and heavy rains are the most aggressive
(Enache, 2010).
The year 2012 was a particularly dry year, with a decrease in rainfall
regime and an uneven distribution of rainfall. The maximum precipitation was in
May (115,8mm) and led to a build script, in reality not all the amount was
recovered, much of it is lost through leaks to the ground. Since June rainfall
decreased significantly hovering below multiannuality. Deficit rainfall and
maximum temperatures above 30 ° C have influenced the relative humidity during
certain periods the recorded values below 50%, resulting in stressful conditions
for growing vines. Compared to the average multiannual average temperature
shows a relative difference of 103%, 109% sum of active temperatures, relative
humidity of 84%, 118% insolation and precipitation 99%.
The growing season of year 2013 starts with air temperatures close to
normal. Although in June, July and August were recorded maximum air
temperatures above 30 °C, the average temperature is lower during June-
September compared to the multiannual due lower temperatures during nights.
Rainfall during the growing season of 2013 amounts to 516.0 mm. The lack of
useful rainfall during July 2 to August 25 created stressful conditions for vines.
The rains that followed the end of August, combined with those of September
were able to largely cover the deficit created in July-August. In September there
was excess rainfall of 165.0 mm , but maximum rainfall recorded were not fully
recovered because in four days consecutive rainfall amount produced was 187.4
mm. Relative humidity is within the normal range, there were only sporadic
values below 50% in the first decade of April and in August. Table 1
Climatic conditions 2012-2013
Climatic parameters
The annual average
2012 year
Relative difference
2013 year
Relative difference
The average temperature (ºC)
11,5 11,9 103 11,1 97
Sum of active temperatures (ºC)
3516 3838 109 3295 94
Relative humidity of air (%)
73 61,6 84 73,9 101
Insolation (hours) 1796 2096 118 1931 108
Precipitation (mm) 453,8 448,0 99 713,1 157
Compared to the average multiannual, average temperature shows a relative
difference of 97%, the amount of active temperatures of 94% relative humidity of
101%, 108% insolation and precipitation 157%.
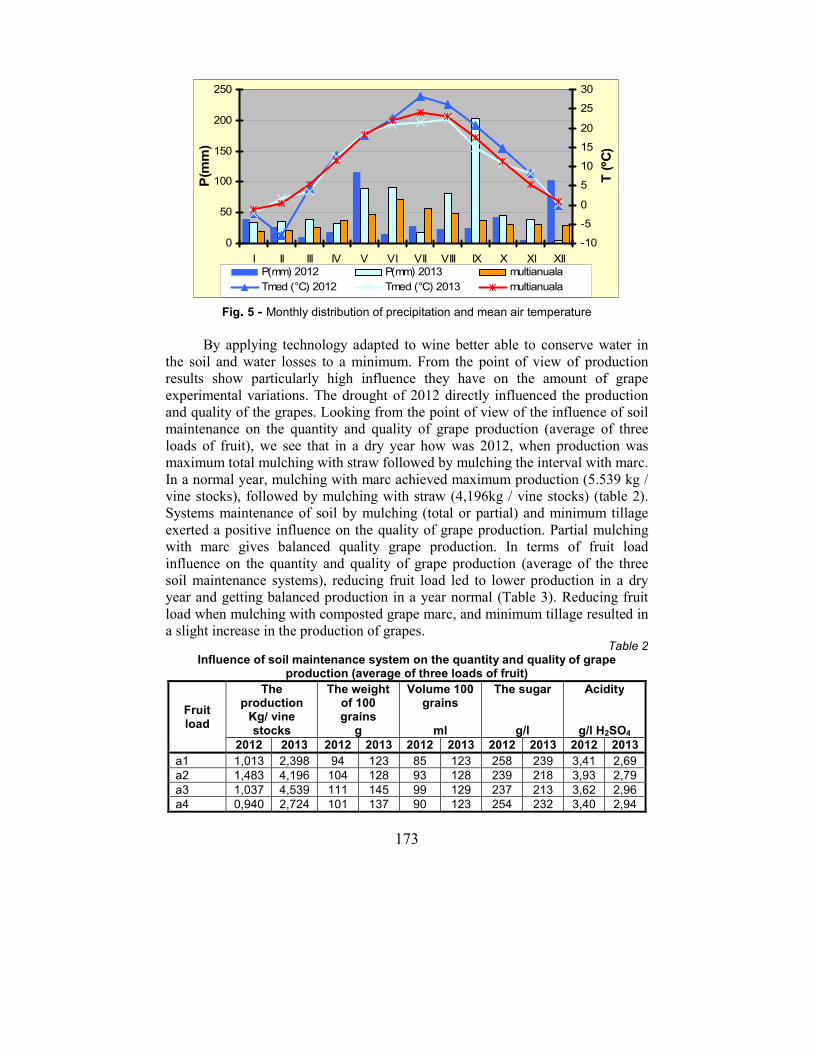
173
0
50
100
150
200
250
I II III IV V VI VII VIII IX X XI XII
P(m
m)
-10
-5
0
5
10
15
20
25
30
T (
ºC)
P(mm) 2012 P(mm) 2013 multianuala
Tmed (°C) 2012 Tmed (°C) 2013 multianuala
Fig. 5 - Monthly distribution of precipitation and mean air temperature
By applying technology adapted to wine better able to conserve water in
the soil and water losses to a minimum. From the point of view of production
results show particularly high influence they have on the amount of grape
experimental variations. The drought of 2012 directly influenced the production and quality of the grapes. Looking from the point of view of the influence of soil
maintenance on the quantity and quality of grape production (average of three
loads of fruit), we see that in a dry year how was 2012, when production was
maximum total mulching with straw followed by mulching the interval with marc.
In a normal year, mulching with marc achieved maximum production (5.539 kg /
vine stocks), followed by mulching with straw (4,196kg / vine stocks) (table 2).
Systems maintenance of soil by mulching (total or partial) and minimum tillage
exerted a positive influence on the quality of grape production. Partial mulching
with marc gives balanced quality grape production. In terms of fruit load
influence on the quantity and quality of grape production (average of the three
soil maintenance systems), reducing fruit load led to lower production in a dry
year and getting balanced production in a year normal (Table 3). Reducing fruit load when mulching with composted grape marc, and minimum tillage resulted in
a slight increase in the production of grapes. Table 2
Influence of soil maintenance system on the quantity and quality of grape production (average of three loads of fruit)
Fruit load
The production
Kg/ vine stocks
The weight of 100 grains
g
Volume 100 grains
ml
The sugar
g/l
Acidity
g/l H2SO4
2012 2013 2012 2013 2012 2013 2012 2013 2012 2013
a1 1,013 2,398 94 123 85 123 258 239 3,41 2,69
a2 1,483 4,196 104 128 93 128 239 218 3,93 2,79
a3 1,037 4,539 111 145 99 129 237 213 3,62 2,96
a4 0,940 2,724 101 137 90 123 254 232 3,40 2,94
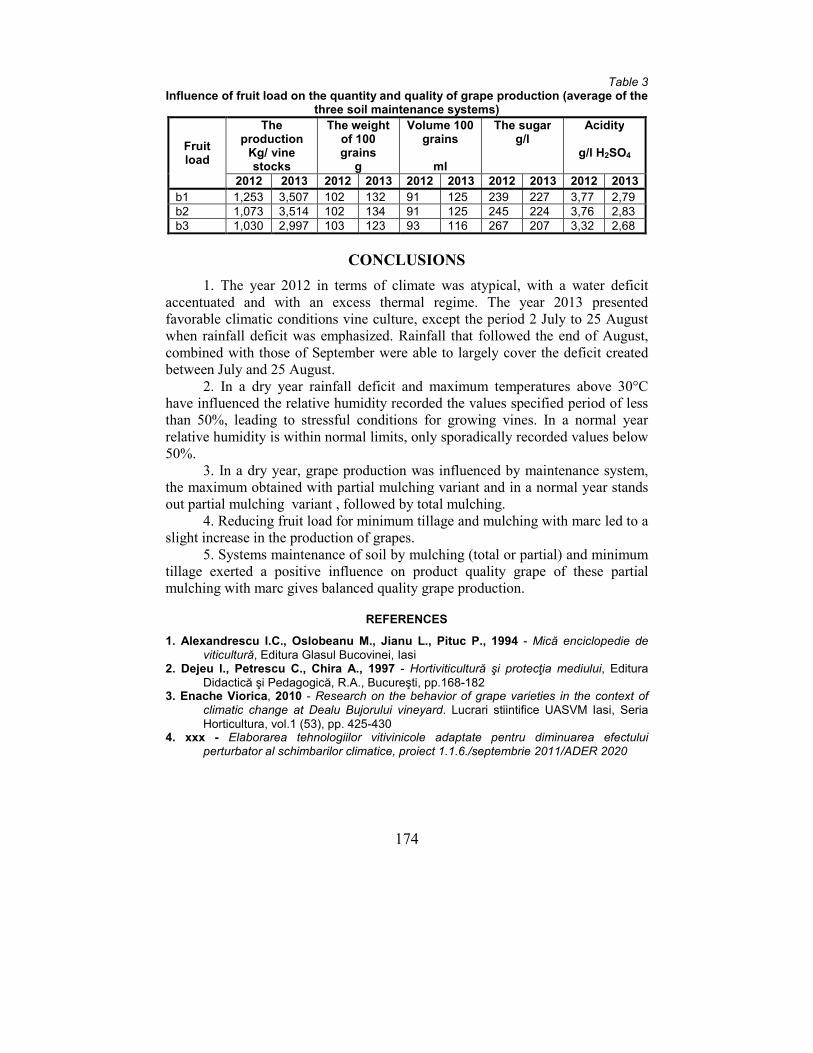
174
Table 3 Influence of fruit load on the quantity and quality of grape production (average of the
three soil maintenance systems)
Fruit load
The production
Kg/ vine stocks
The weight of 100 grains
g
Volume 100 grains
ml
The sugar g/l
Acidity
g/l H2SO4
2012 2013 2012 2013 2012 2013 2012 2013 2012 2013
b1 1,253 3,507 102 132 91 125 239 227 3,77 2,79
b2 1,073 3,514 102 134 91 125 245 224 3,76 2,83
b3 1,030 2,997 103 123 93 116 267 207 3,32 2,68
CONCLUSIONS
1. The year 2012 in terms of climate was atypical, with a water deficit
accentuated and with an excess thermal regime. The year 2013 presented
favorable climatic conditions vine culture, except the period 2 July to 25 August
when rainfall deficit was emphasized. Rainfall that followed the end of August,
combined with those of September were able to largely cover the deficit created
between July and 25 August.
2. In a dry year rainfall deficit and maximum temperatures above 30°C
have influenced the relative humidity recorded the values specified period of less
than 50%, leading to stressful conditions for growing vines. In a normal year
relative humidity is within normal limits, only sporadically recorded values below
50%.
3. In a dry year, grape production was influenced by maintenance system,
the maximum obtained with partial mulching variant and in a normal year stands
out partial mulching variant , followed by total mulching.
4. Reducing fruit load for minimum tillage and mulching with marc led to a
slight increase in the production of grapes.
5. Systems maintenance of soil by mulching (total or partial) and minimum
tillage exerted a positive influence on product quality grape of these partial
mulching with marc gives balanced quality grape production.
REFERENCES
1. Alexandrescu I.C., Oslobeanu M., Jianu L., Pituc P., 1994 - Mică enciclopedie de viticultură, Editura Glasul Bucovinei, Iasi
2. Dejeu l., Petrescu C., Chira A., 1997 - Hortiviticultură şi protecţia mediului, Editura
Didactică şi Pedagogică, R.A., Bucureşti, pp.168-182 3. Enache Viorica, 2010 - Research on the behavior of grape varieties in the context of
climatic change at Dealu Bujorului vineyard. Lucrari stiintifice UASVM Iasi, Seria
Horticultura, vol.1 (53), pp. 425-430 4. xxx - Elaborarea tehnologiilor vitivinicole adaptate pentru diminuarea efectului
perturbator al schimbarilor climatice, proiect 1.1.6./septembrie 2011/ADER 2020
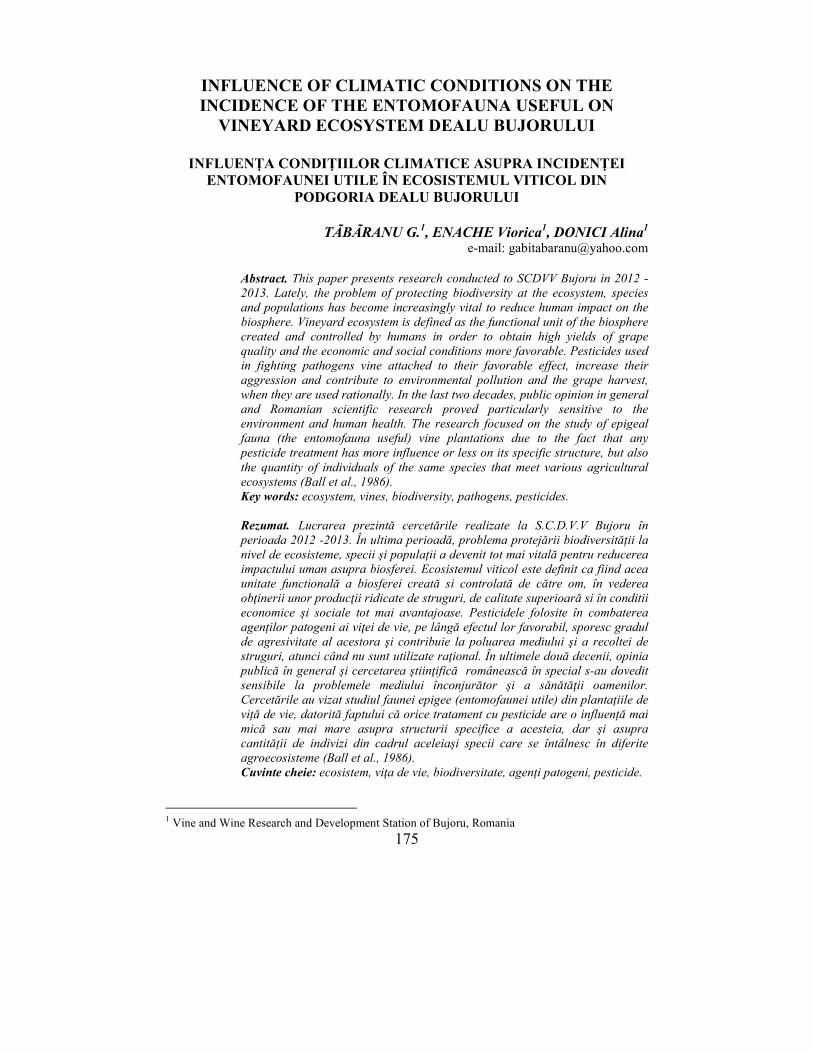
175
INFLUENCE OF CLIMATIC CONDITIONS ON THE INCIDENCE OF THE ENTOMOFAUNA USEFUL ON
VINEYARD ECOSYSTEM DEALU BUJORULUI
INFLUENŢA CONDIŢIILOR CLIMATICE ASUPRA INCIDENŢEI ENTOMOFAUNEI UTILE ÎN ECOSISTEMUL VITICOL DIN
PODGORIA DEALU BUJORULUI
TÃBÃRANU G.1, ENACHE Viorica1, DONICI Alina1
e-mail: [email protected]
Abstract. This paper presents research conducted to SCDVV Bujoru in 2012 -2013. Lately, the problem of protecting biodiversity at the ecosystem, species and populations has become increasingly vital to reduce human impact on the biosphere. Vineyard ecosystem is defined as the functional unit of the biosphere created and controlled by humans in order to obtain high yields of grape quality and the economic and social conditions more favorable. Pesticides used in fighting pathogens vine attached to their favorable effect, increase their aggression and contribute to environmental pollution and the grape harvest, when they are used rationally. In the last two decades, public opinion in general and Romanian scientific research proved particularly sensitive to the environment and human health. The research focused on the study of epigeal fauna (the entomofauna useful) vine plantations due to the fact that any pesticide treatment has more influence or less on its specific structure, but also the quantity of individuals of the same species that meet various agricultural ecosystems (Ball et al., 1986). Key words: ecosystem, vines, biodiversity, pathogens, pesticides. Rezumat. Lucrarea prezintă cercetările realizate la S.C.D.V.V Bujoru în perioada 2012 -2013. În ultima perioadă, problema protejării biodiversității la nivel de ecosisteme, specii și populații a devenit tot mai vitală pentru reducerea impactului uman asupra biosferei. Ecosistemul viticol este definit ca fiind acea unitate functională a biosferei creată si controlată de către om, în vederea obţinerii unor producţii ridicate de struguri, de calitate superioară si în conditii economice şi sociale tot mai avantajoase. Pesticidele folosite în combaterea agenților patogeni ai viţei de vie, pe lângă efectul lor favorabil, sporesc gradul de agresivitate al acestora şi contribuie la poluarea mediului şi a recoltei de struguri, atunci când nu sunt utilizate raţional. În ultimele două decenii, opinia publică în general şi cercetarea ştiinţifică românească în special s-au dovedit sensibile la problemele mediului înconjurător şi a sănătăţii oamenilor. Cercetările au vizat studiul faunei epigee (entomofaunei utile) din plantațiile de viță de vie, datorită faptului că orice tratament cu pesticide are o influență mai mică sau mai mare asupra structurii specifice a acesteia, dar şi asupra cantității de indivizi din cadrul aceleiași specii care se întâlnesc în diferite agroecosisteme (Ball et al., 1986). Cuvinte cheie: ecosistem, viţa de vie, biodiversitate, agenţi patogeni, pesticide.
1 Vine and Wine Research and Development Station of Bujoru, Romania
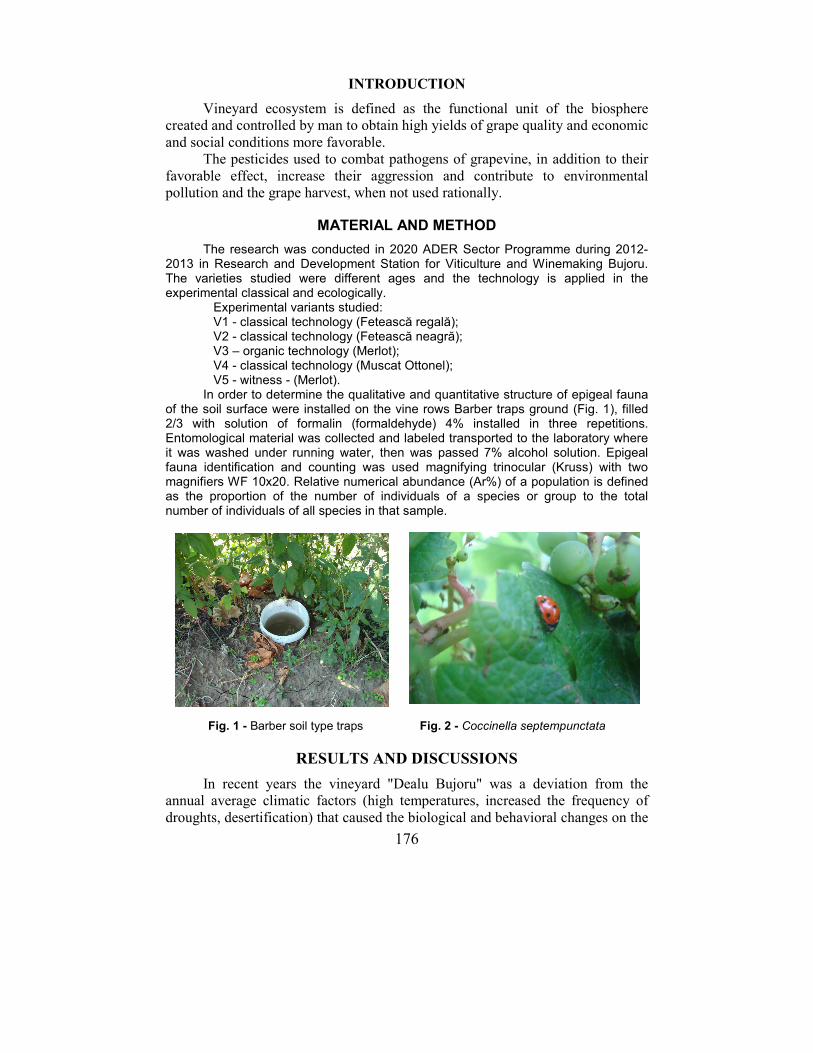
176
INTRODUCTION
Vineyard ecosystem is defined as the functional unit of the biosphere
created and controlled by man to obtain high yields of grape quality and economic
and social conditions more favorable.
The pesticides used to combat pathogens of grapevine, in addition to their
favorable effect, increase their aggression and contribute to environmental
pollution and the grape harvest, when not used rationally.
MATERIAL AND METHOD
The research was conducted in 2020 ADER Sector Programme during 2012-2013 in Research and Development Station for Viticulture and Winemaking Bujoru. The varieties studied were different ages and the technology is applied in the experimental classical and ecologically.
Experimental variants studied: V1 - classical technology (Fetească regală); V2 - classical technology (Fetească neagră); V3 – organic technology (Merlot); V4 - classical technology (Muscat Ottonel); V5 - witness - (Merlot).
In order to determine the qualitative and quantitative structure of epigeal fauna of the soil surface were installed on the vine rows Barber traps ground (Fig. 1), filled 2/3 with solution of formalin (formaldehyde) 4% installed in three repetitions. Entomological material was collected and labeled transported to the laboratory where it was washed under running water, then was passed 7% alcohol solution. Epigeal fauna identification and counting was used magnifying trinocular (Kruss) with two magnifiers WF 10x20. Relative numerical abundance (Ar%) of a population is defined as the proportion of the number of individuals of a species or group to the total number of individuals of all species in that sample.
Fig. 1 - Barber soil type traps Fig. 2 - Coccinella septempunctata
RESULTS AND DISCUSSIONS
In recent years the vineyard "Dealu Bujoru" was a deviation from the
annual average climatic factors (high temperatures, increased the frequency of
droughts, desertification) that caused the biological and behavioral changes on the
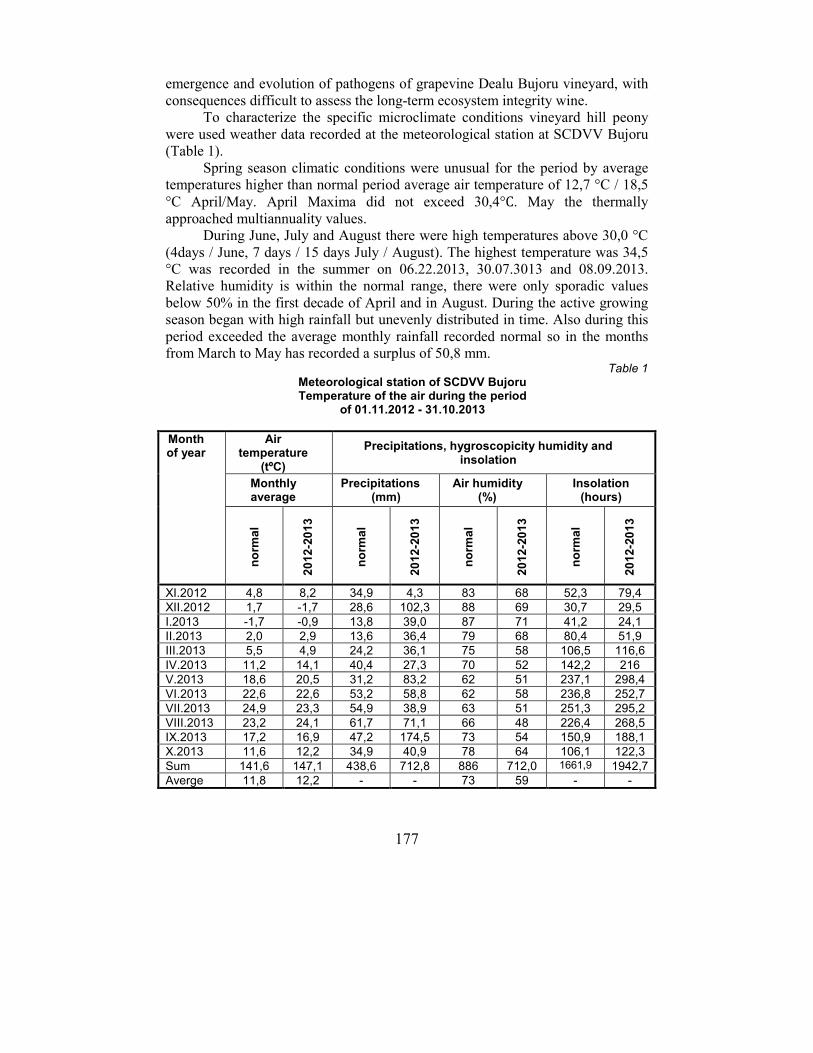
177
emergence and evolution of pathogens of grapevine Dealu Bujoru vineyard, with
consequences difficult to assess the long-term ecosystem integrity wine.
To characterize the specific microclimate conditions vineyard hill peony
were used weather data recorded at the meteorological station at SCDVV Bujoru
(Table 1).
Spring season climatic conditions were unusual for the period by average
temperatures higher than normal period average air temperature of 12,7 °C / 18,5
°C April/May. April Maxima did not exceed 30,4°C. May the thermally
approached multiannuality values.
During June, July and August there were high temperatures above 30,0 °C
(4days / June, 7 days / 15 days July / August). The highest temperature was 34,5
°C was recorded in the summer on 06.22.2013, 30.07.3013 and 08.09.2013.
Relative humidity is within the normal range, there were only sporadic values
below 50% in the first decade of April and in August. During the active growing
season began with high rainfall but unevenly distributed in time. Also during this
period exceeded the average monthly rainfall recorded normal so in the months
from March to May has recorded a surplus of 50,8 mm. Table 1
Meteorological station of SCDVV Bujoru Temperature of the air during the period
of 01.11.2012 - 31.10.2013
Month of year
Air temperature
(tºC)
Precipitations, hygroscopicity humidity and insolation
Monthly average
Precipitations (mm)
Air humidity (%)
Insolation (hours)
no
rma
l
20
12
-20
13
no
rma
l
20
12
-20
13
no
rma
l
20
12
-20
13
no
rma
l
20
12
-20
13
XI.2012 4,8 8,2 34,9 4,3 83 68 52,3 79,4
XII.2012 1,7 -1,7 28,6 102,3 88 69 30,7 29,5
I.2013 -1,7 -0,9 13,8 39,0 87 71 41,2 24,1
II.2013 2,0 2,9 13,6 36,4 79 68 80,4 51,9
III.2013 5,5 4,9 24,2 36,1 75 58 106,5 116,6
IV.2013 11,2 14,1 40,4 27,3 70 52 142,2 216
V.2013 18,6 20,5 31,2 83,2 62 51 237,1 298,4
VI.2013 22,6 22,6 53,2 58,8 62 58 236,8 252,7
VII.2013 24,9 23,3 54,9 38,9 63 51 251,3 295,2
VIII.2013 23,2 24,1 61,7 71,1 66 48 226,4 268,5
IX.2013 17,2 16,9 47,2 174,5 73 54 150,9 188,1
X.2013 11,6 12,2 34,9 40,9 78 64 106,1 122,3
Sum 141,6 147,1 438,6 712,8 886 712,0 1661,9 1942,7
Averge 11,8 12,2 - - 73 59 - -
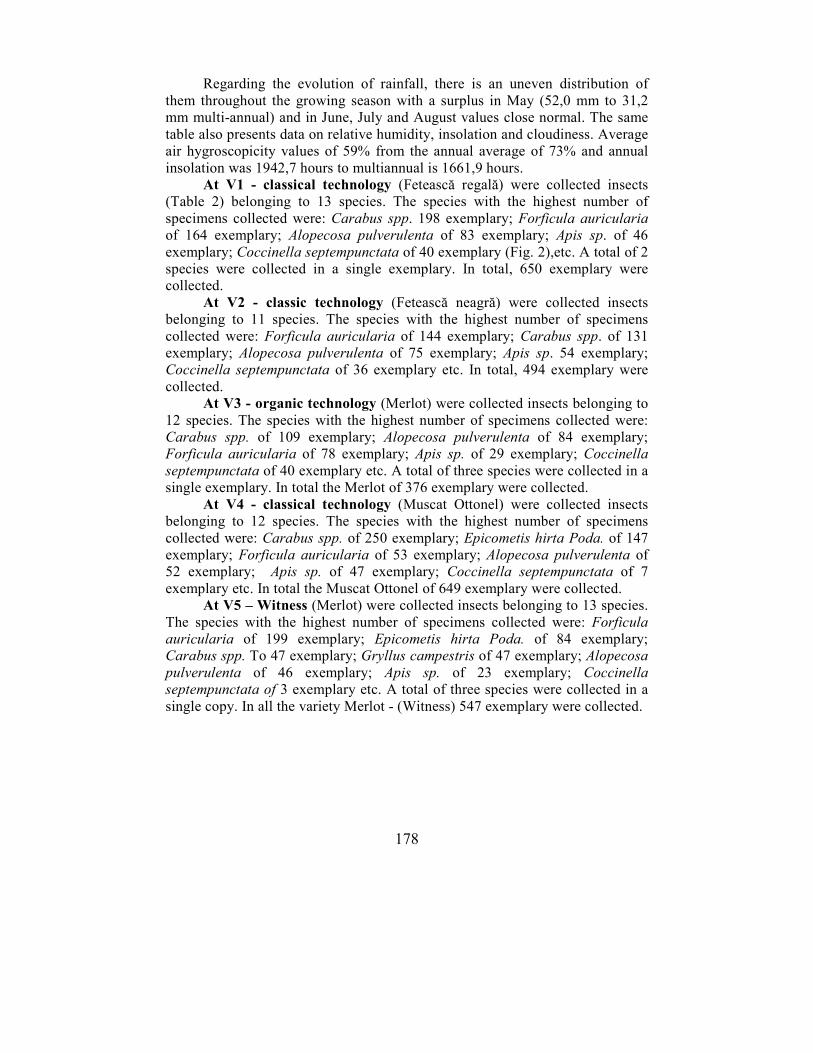
178
Regarding the evolution of rainfall, there is an uneven distribution of
them throughout the growing season with a surplus in May (52,0 mm to 31,2
mm multi-annual) and in June, July and August values close normal. The same
table also presents data on relative humidity, insolation and cloudiness. Average
air hygroscopicity values of 59% from the annual average of 73% and annual
insolation was 1942,7 hours to multiannual is 1661,9 hours.
At V1 - classical technology (Fetească regală) were collected insects
(Table 2) belonging to 13 species. The species with the highest number of
specimens collected were: Carabus spp. 198 exemplary; Forficula auricularia of 164 exemplary; Alopecosa pulverulenta of 83 exemplary; Apis sp. of 46
exemplary; Coccinella septempunctata of 40 exemplary (Fig. 2),etc. A total of 2
species were collected in a single exemplary. In total, 650 exemplary were
collected.
At V2 - classic technology (Fetească neagră) were collected insects
belonging to 11 species. The species with the highest number of specimens
collected were: Forficula auricularia of 144 exemplary; Carabus spp. of 131
exemplary; Alopecosa pulverulenta of 75 exemplary; Apis sp. 54 exemplary;
Coccinella septempunctata of 36 exemplary etc. In total, 494 exemplary were
collected.
At V3 - organic technology (Merlot) were collected insects belonging to
12 species. The species with the highest number of specimens collected were:
Carabus spp. of 109 exemplary; Alopecosa pulverulenta of 84 exemplary;
Forficula auricularia of 78 exemplary; Apis sp. of 29 exemplary; Coccinella septempunctata of 40 exemplary etc. A total of three species were collected in a
single exemplary. In total the Merlot of 376 exemplary were collected.
At V4 - classical technology (Muscat Ottonel) were collected insects
belonging to 12 species. The species with the highest number of specimens
collected were: Carabus spp. of 250 exemplary; Epicometis hirta Poda. of 147
exemplary; Forficula auricularia of 53 exemplary; Alopecosa pulverulenta of
52 exemplary; Apis sp. of 47 exemplary; Coccinella septempunctata of 7
exemplary etc. In total the Muscat Ottonel of 649 exemplary were collected.
At V5 – Witness (Merlot) were collected insects belonging to 13 species.
The species with the highest number of specimens collected were: Forficula auricularia of 199 exemplary; Epicometis hirta Poda. of 84 exemplary;
Carabus spp. To 47 exemplary; Gryllus campestris of 47 exemplary; Alopecosa
pulverulenta of 46 exemplary; Apis sp. of 23 exemplary; Coccinella septempunctata of 3 exemplary etc. A total of three species were collected in a
single copy. In all the variety Merlot - (Witness) 547 exemplary were collected.
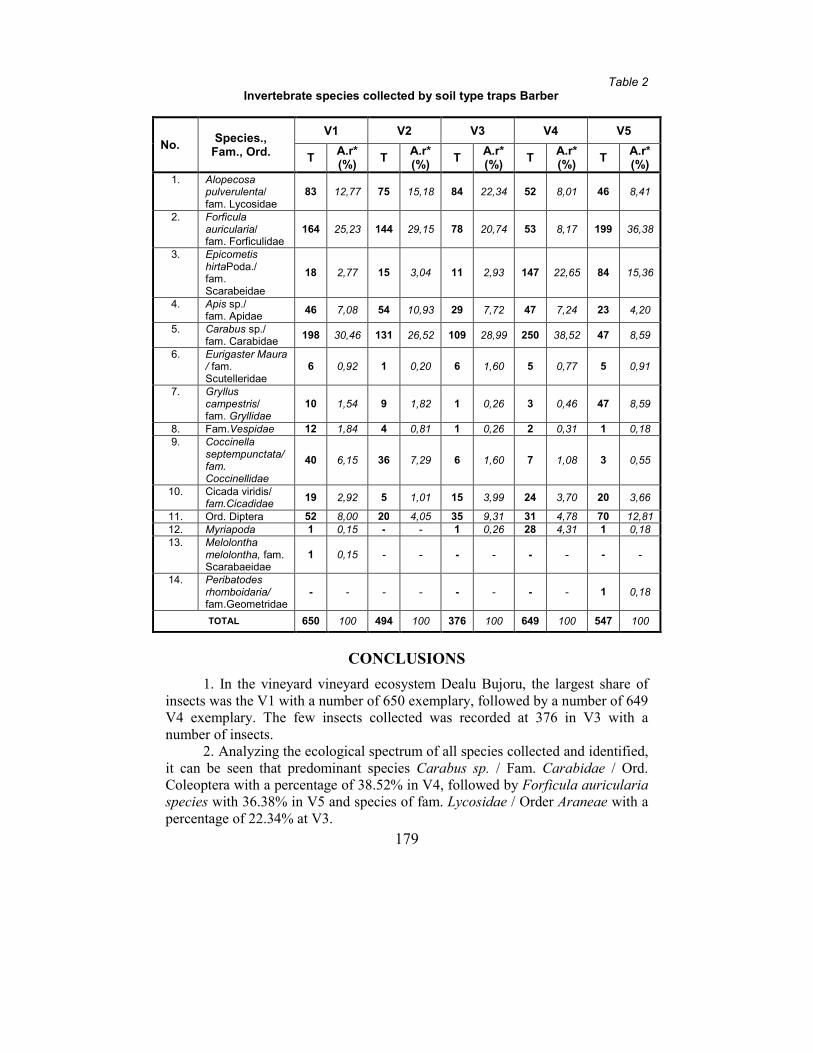
179
Table 2 Invertebrate species collected by soil type traps Barber
No. Species.,
Fam., Ord.
V1 V2 V3 V4 V5
T A.r* (%)
T A.r* (%)
T A.r* (%)
T A.r* (%)
T A.r* (%)
1. Alopecosa pulverulenta/ fam. Lycosidae
83 12,77 75 15,18 84 22,34 52 8,01 46 8,41
2. Forficula auricularia/ fam. Forficulidae
164 25,23 144 29,15 78 20,74 53 8,17 199 36,38
3. Epicometis hirtaPoda./ fam. Scarabeidae
18 2,77 15 3,04 11 2,93 147 22,65 84 15,36
4. Apis sp./ fam. Apidae
46 7,08 54 10,93 29 7,72 47 7,24 23 4,20
5. Carabus sp./ fam. Carabidae
198 30,46 131 26,52 109 28,99 250 38,52 47 8,59
6. Eurigaster Maura / fam. Scutelleridae
6 0,92 1 0,20 6 1,60 5 0,77 5 0,91
7. Gryllus campestris/ fam. Gryllidae
10 1,54 9 1,82 1 0,26 3 0,46 47 8,59
8. Fam.Vespidae 12 1,84 4 0,81 1 0,26 2 0,31 1 0,18
9. Coccinella septempunctata/ fam. Coccinellidae
40 6,15 36 7,29 6 1,60 7 1,08 3 0,55
10. Cicada viridis/ fam.Cicadidae
19 2,92 5 1,01 15 3,99 24 3,70 20 3,66
11. Ord. Diptera 52 8,00 20 4,05 35 9,31 31 4,78 70 12,81
12. Myriapoda 1 0,15 - - 1 0,26 28 4,31 1 0,18
13. Melolontha melolontha, fam. Scarabaeidae
1 0,15 - - - - - - - -
14. Peribatodes rhomboidaria/ fam.Geometridae
- - - - - - - - 1 0,18
TOTAL 650 100 494 100 376 100 649 100 547 100
CONCLUSIONS
1. In the vineyard vineyard ecosystem Dealu Bujoru, the largest share of
insects was the V1 with a number of 650 exemplary, followed by a number of 649
V4 exemplary. The few insects collected was recorded at 376 in V3 with a
number of insects.
2. Analyzing the ecological spectrum of all species collected and identified,
it can be seen that predominant species Carabus sp. / Fam. Carabidae / Ord.
Coleoptera with a percentage of 38.52% in V4, followed by Forficula auricularia species with 36.38% in V5 and species of fam. Lycosidae / Order Araneae with a
percentage of 22.34% at V3.
180
3. Entomofauna useful was the Coccinella septempunctata / fam.
Coccinellidae / Ord. Coleoptera with a rate of 7.29% to V2, and the lowest
percentage, 0.55% to V5.
REFERENCES
1. Baal D., Tapp L., Gordon F., Potter D.A., 1986 - Effects of pesticides on earhworm populations in Kentucky Bluegrass Insescticide and Acaricide Tests, pp. 395.
2. Enache Viorica, Simion Cristina, Popescu Agatha, Tabaranu G., Donici Alina, 2012 - Implicaţiile schimbărilor climatice globale asupra ecosistemului viticol din zona
colinară, Editura Eikon, Cluj Napoca coeditoare cu Editura Rawex Coms București 3. Roşca I., Rada Istrate, Margarit G., Maria Neamţu, 2008 - Studii privind biodiversitatea
faunei epigee din plantația de măr de la S.C.D.P. Băneasa, Analele Institutului de
Cercetare - Dezvoltare pentru Protecția Plantelor, vol. XXXV, pp. 29-37 4. Tălmaciu M., Georgescu T., Mitrea I., Filipescu C., Bădeanu Marilena, Radu C.,
1996 - Contributions to the knowing of the carabid fauna of the vine plantation in
Huși vineyard, Vaslui District, Lucrări științifice, vol. 39, Seria Horticultură,
U.Ș.A.M.V. Iași, pp. 267 - 271 5. Tălmaciu M., Georgescu T., Filipescu C., Badeanu Marinela, 1996 - Studii asupra
structurii şi abundenței speciilor de carabide din cultura viţei de vie, Revista
Agronomice în Moldova, vol. I., II., Iași. 6. Tălmaciu M., Georgescu T., 1998 - Fauna de carabide (Coleoptere - Carabidae) din
plantatiile de viță de vie din Moldova, Editura "Ion Ionescu de la Brad" Iași
181
STUDIES OF THE INFLUENCE OF SOME CONDITIONING TREATMENTS ON SOME VOLATILE COMPOUNDS IN
FETEASCĂ ALBĂ WINES
STUDII ASUPRA INFLUENȚEI UNOR TRATAMENTE DE CONDIȚIONARE ASUPRA UNOR COMPUȘI VOLATILI ÎN VINURI DE
FETEASCĂ ALBĂ
COLIBABA Cintia1, COTEA V. V.
1, ROTARU Liliana
1, NICULAUA M.
2,
VARARU F. 1, LUCHIAN Camelia
1
e-mail: [email protected]
Abstract. Volatile compounds of Romanian wines made from local grape
varieties considered neutral from a sensorial point of view are not sufficiently
studied. This article mainly aims at underlining the influence of
conditioning/fining treatments of wines, specifically their influence on physico-
chemical composition and aroma profile of Fetească albă wines in Cotnari
vineyard. Five experimental samples were obtained as follows: FA M - raw new
wine before fining; FA V1- after treatment with potassium sorbate, FA V2 –
cross-flow filtration, FA V3 after treatment with gum Arabic, FA V4- after
treatment with cellulose gum CELSTAB®. The fining treatments applied to
Fetească albă wines lead to changes in the concentration of flavor compounds
through their adsorption or catalyse reactions leading to the formation of
higher weight molecular compounds with a different sensory impression.
Key words: local grape varieties, aroma compounds, fining treatments
Rezumat. Compușii volatili din vinurile românești obținute din soiuri de
struguri autohtoni considerați neutri din punct de vedere senzorial nu sunt
suficient studiați. Articolul de faţă are ca scop principal redarea importanței
tratamentelor de condiționare și stabilizare a vinului, în mod specific, influența
acestora asupra compoziției fizico-chimice și a profilului de aromă asupra
vinurilor obţinute din struguri de Fetească albă, din podgoria Cotnari. Au fost
obținute 5 probe experimentale, astfel: FA M – vin nou brut, înainte de cleire;
FA V1- după tratamentul cu sorbat de potasiu; FA V2 - după filtrarea
tangenţială; FA V3 - după tratamentul cu guma arabică; FA V4- după
tratamentul cu guma celulozica CELSTAB® . Tratamentele de condiționare
aplicate vinurilor de Fetească albă conduc la modificarea concentrațiilor
compușilor de aromă, prin adsorbția lor sau prin catalizarea unor reacții de
formare de compuși cu moleculă mai mare, cu amprentă senzorială diferită
Cuvinte cheie: vinuri locale, compuşi de aromă, tratamente de condiționare
INTRODUCTION
The wines of Cotnari have so far been praised by personalities from various fields of activity and will be praised still. This is also due to the fact that Cotnari
1 University of Agricultural Sciences and Veterinary Medicine of Iasi, Romania 2 Oenological Research Center, Iasi Branch of the Romanian Academy, Iasi, Romania
182
is a region full of culture, history and traditions. Cotnari winery is the only winery
in Romania that has not changed its range of (local) wine varieties after the invasion of phylloxera, namely: Frâncuşă, Fetească albă, .Grasă de Cotnari and
Tămâioasă românească (Cotea, 1985). Fetească albă has always been considered a grape variety that produces
neutral wines. However, studies have shown that terpenic compounds can be found in both grapes and wines from the mentioned grape variety (Nechita, 2010).
MATERIAL AND METHOD
The main purpose of this research was to emphasize the importance of fining treatments in wines and mainly their influence upon some aroma compounds of wines obtained from Fetească albă grape variety from Cotnari winery.
FA M – new wine, before clearing; FA V1- after treatment with potassium sorbate; FA V2- after cross flow filtration; FA V3- after treatment with Arabic gum; FA V4- after treatment with cellulose gum CELSTAB®. Gas-chromatography conditions 1000 µL extract, splitless were injected in the GC column: Parameters of analisys was: 1. GC: - oven temperature: 35 °C - injector temperature: 220 °C - injection mode: splitless - gas: He - gas flow: 1 mL/min - temperature program of oven: 35 °C for 5 minutes, with a rate of 4 °C / minute up to 250 °C for 13,25 minutes - ion temperature source: 250 °C - interface temperature: 250 °C - detector sensibility: 1,05 V 2.Injection parameters: - 10 µL syringe - prewashing syringe with solvent 3 times - filling volume of syringe: 5 µL - prewashing syringe with sample 2 times - postwashing syringe with solvent 5 times
RESULTS AND DISCUSSIONS
Table 1 presents the values for some of the volatile compounds quantified in Fetească albă wine samples.
In the case of esters, the highest values is in the case of diethyl ester of butanedioic acid, with a slightly fruity aroma, of baked apples and ylang, as follows Fa M - 800,1 µg, Fa V1 - 1445,7 µg, Fa V2 - 1352,3 µg, Fa V3 - 1473,8
µg and Fa V4 - 856,2 µg. Ethyl ester of hexanoic acid, with a slightly sweet fruity, apples and bananas odour (Fa M - 274,6 µg, Fa V1 - 103,8279 µg, Fa V2 -
183
181,2402 µg, Fa V3 - 102,3366 µg and Fa V4 - 158,9186 µg), ethyl ester of
octanoic acid (Fa M - 406,1 µg, Fa V1 - 225,3 µg, Fa V2 - 387,4 µg, Fa V3 - 212,7 µg și Fa V4 - 316,3 µg) and ethyl ester of decanoic acid (Fa M - 59,7 µg, Fa
V1 - 81,2 µg, Fa V2 - 109,4 µg, Fa V3 – 72 µg and Fa V4 - 85,2 µg) are enzimatically formed during yeast fermentation as well as during acylCoA
ethanolysis, that is formed during fatty acids synthesis or degradation. Their concentration is dependent on several factors, mainly: yeast strain, fermentation temperature, aeration degree and sugar content (Etievant, 1991; Bakker and Clarke,
2011). Quantified acetate esters are: isoamyl acetate (Fa M - 1289 µg, Fa V1-
819,3 µg, Fa V2 - 3040,6 µg, Fa V3 - 1802,1 µg, Fa V4 - 2066,9 µg) and hexyl ester of acetic acid, that was under the detection limit. They are the result of the eaction of acetyl-CoA with alcohols and are formed from degradation of amino
acids acids and carbohydrates (Etievant, 1991). In general, acetate and ethyl esters contribute to the fruity aroma of wine (Gurbuz et al., 2006; Peinado et al., 2004; Tao
and Zhang, 2010). The acids with the highest concentrations were : acetic acid, butanoic acid,
hexanoic acid (Fa M - 1392,2 µg, Fa V1- 691 µg, Fa V2 - 1161,1 µg, Fa V3 -
806,1 µg, Fa V4 - 1251 µg). Volatile acids are produced during alcoholic fermentation and the contribution for the aroma depends on their concentration
range in wine (Etievant, 1991). Shinohara (1985) showed that at concentrations of up to 10mgL-1,C6 to C10 acids provide mild and pleasant aroma to wine. However, the impact of the presence of volatile acids may be negative when the
concentration of these compounds is greater than 20 mg L-1 (Shinohara, 1985). In this study, no acids were found in concentrations that may negatively affect the
wine aroma. The terpenes analysed in Fetească albă wines were linalool (Fa M - 24,7
µg, Fa V1 - 16,4 µg, Fa V2 - 12,5 µg, Fa V3 - 12,04425 µg, Fa V4 - nd), beta-ionone (Fa M - 69,0214 µg). The absence of linalool in the last sample, the one treated with cellulosic gum CELSTAB®., is an alarm signal that must be pulled
quickly. The presence of beta-ionone only in the control sample Fa M leads to the conclusion that the fining treatments have a negative influence on its presence.
These compounds tend to contribute positively to the floral aromas to wine aroma and their odor description is also reported in Table 1. Terpenes and C13-norisoprenoids are part of the grape varietal aroma and may undergo fermentation
without substantial changes. They may be found in grape skins and maceration is essential for the extraction of these compounds to the grape must (Bakker and
Clarke, 2004). The presence of terpenic compounds in musts that are considered neutral should be the first step in re-thinking the classification of grape varieties from a sensorial point of view.
Among phenols, eugenol and isoeugenol were quantified, both having a spicy hue and nutmeg.
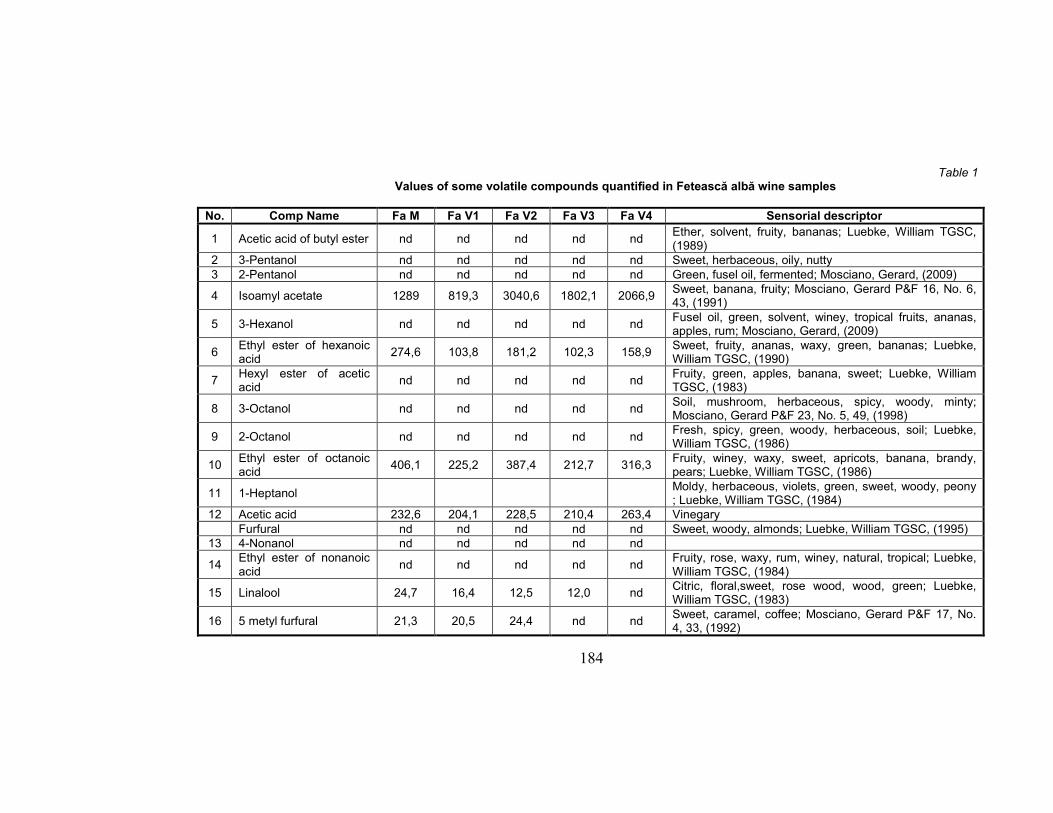
184
Table 1 Values of some volatile compounds quantified in Fetească albă wine samples
No. Comp Name Fa M Fa V1 Fa V2 Fa V3 Fa V4 Sensorial descriptor
1 Acetic acid of butyl ester nd nd nd nd nd Ether, solvent, fruity, bananas; Luebke, William TGSC, (1989)
2 3-Pentanol nd nd nd nd nd Sweet, herbaceous, oily, nutty
3 2-Pentanol nd nd nd nd nd Green, fusel oil, fermented; Mosciano, Gerard, (2009)
4 Isoamyl acetate 1289 819,3 3040,6 1802,1 2066,9 Sweet, banana, fruity; Mosciano, Gerard P&F 16, No. 6, 43, (1991)
5 3-Hexanol nd nd nd nd nd Fusel oil, green, solvent, winey, tropical fruits, ananas, apples, rum; Mosciano, Gerard, (2009)
6 Ethyl ester of hexanoic acid
274,6 103,8 181,2 102,3 158,9 Sweet, fruity, ananas, waxy, green, bananas; Luebke, William TGSC, (1990)
7 Hexyl ester of acetic acid
nd nd nd nd nd Fruity, green, apples, banana, sweet; Luebke, William TGSC, (1983)
8 3-Octanol nd nd nd nd nd Soil, mushroom, herbaceous, spicy, woody, minty; Mosciano, Gerard P&F 23, No. 5, 49, (1998)
9 2-Octanol nd nd nd nd nd Fresh, spicy, green, woody, herbaceous, soil; Luebke, William TGSC, (1986)
10 Ethyl ester of octanoic acid
406,1 225,2 387,4 212,7 316,3 Fruity, winey, waxy, sweet, apricots, banana, brandy, pears; Luebke, William TGSC, (1986)
11 1-Heptanol Moldy, herbaceous, violets, green, sweet, woody, peony ; Luebke, William TGSC, (1984)
12 Acetic acid 232,6 204,1 228,5 210,4 263,4 Vinegary
Furfural nd nd nd nd nd Sweet, woody, almonds; Luebke, William TGSC, (1995)
13 4-Nonanol nd nd nd nd nd
14 Ethyl ester of nonanoic acid
nd nd nd nd nd Fruity, rose, waxy, rum, winey, natural, tropical; Luebke, William TGSC, (1984)
15 Linalool 24,7 16,4 12,5 12,0 nd Citric, floral,sweet, rose wood, wood, green; Luebke, William TGSC, (1983)
16 5 metyl furfural 21,3 20,5 24,4 nd nd Sweet, caramel, coffee; Mosciano, Gerard P&F 17, No. 4, 33, (1992)
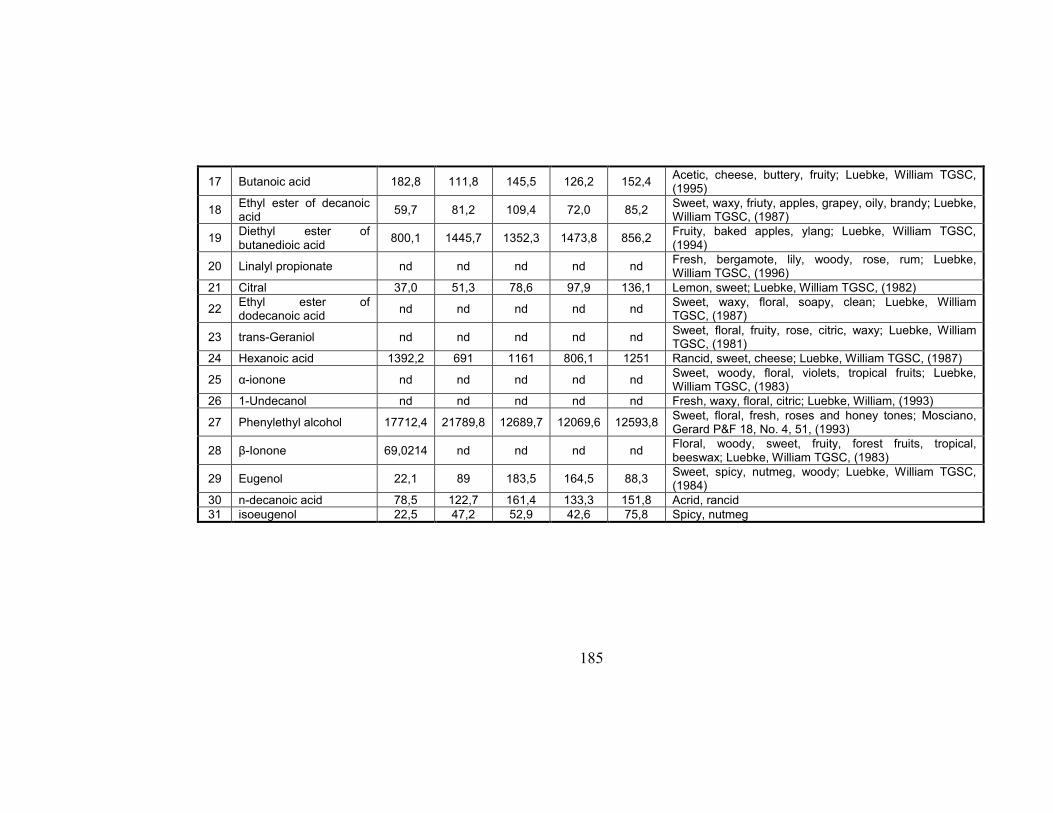
185
17 Butanoic acid 182,8 111,8 145,5 126,2 152,4 Acetic, cheese, buttery, fruity; Luebke, William TGSC, (1995)
18 Ethyl ester of decanoic acid
59,7 81,2 109,4 72,0 85,2 Sweet, waxy, friuty, apples, grapey, oily, brandy; Luebke, William TGSC, (1987)
19 Diethyl ester of butanedioic acid
800,1 1445,7 1352,3 1473,8 856,2 Fruity, baked apples, ylang; Luebke, William TGSC, (1994)
20 Linalyl propionate nd nd nd nd nd Fresh, bergamote, lily, woody, rose, rum; Luebke, William TGSC, (1996)
21 Citral 37,0 51,3 78,6 97,9 136,1 Lemon, sweet; Luebke, William TGSC, (1982)
22 Ethyl ester of dodecanoic acid
nd nd nd nd nd Sweet, waxy, floral, soapy, clean; Luebke, William TGSC, (1987)
23 trans-Geraniol nd nd nd nd nd Sweet, floral, fruity, rose, citric, waxy; Luebke, William TGSC, (1981)
24 Hexanoic acid 1392,2 691 1161 806,1 1251 Rancid, sweet, cheese; Luebke, William TGSC, (1987)
25 α-ionone nd nd nd nd nd Sweet, woody, floral, violets, tropical fruits; Luebke, William TGSC, (1983)
26 1-Undecanol nd nd nd nd nd Fresh, waxy, floral, citric; Luebke, William, (1993)
27 Phenylethyl alcohol 17712,4 21789,8 12689,7 12069,6 12593,8 Sweet, floral, fresh, roses and honey tones; Mosciano, Gerard P&F 18, No. 4, 51, (1993)
28 β-Ionone 69,0214 nd nd nd nd Floral, woody, sweet, fruity, forest fruits, tropical, beeswax; Luebke, William TGSC, (1983)
29 Eugenol 22,1 89 183,5 164,5 88,3 Sweet, spicy, nutmeg, woody; Luebke, William TGSC, (1984)
30 n-decanoic acid 78,5 122,7 161,4 133,3 151,8 Acrid, rancid
31 isoeugenol 22,5 47,2 52,9 42,6 75,8 Spicy, nutmeg
186
Among the quantified superior alcohols, phenylethylalcohol has strong
nuances of roses and honey and registered the following values: Fa M - 17712,4 µg, Fa V1 - 21789,8 µg, Fa V2 - 12689,7 µg, Fa V3 - 12069,6 µg, Fa V4 -
12593,8 µg.
CONCLUSIONS
The fining treatments lead to a change in the aroma compoundsț
concentrations, through their adsorbtion or through the catalysis of some new reactions that form bigger molecule compounds, with a different sensorial print.
In the case of Fetească albă wine samples, phenylethylalcohol registers the
highest concentration in the sample where pottasium sorbate treatment was applied (FA V1 – 22 mg).
The terpene β-Ionone quantified in Fetească albă wine samples is only present in the control samples, thus an alarm signal appears regarding the dosage of the fining treatments.
Acknowledgments. The publishing of this study was made possible with the
help of the USAMV internal research grant 5526/25.04.2013.
REFERENCES
1. Bakker J., Clarke, R., 2011 - Wine: Flavour chemistry (2nd ed.). Oxford: Wiley-
Blackwell. 2. Cotea V.D., Sauciuc J. , 1988 - Tratat de Oenologie, vol. 2, Ed. Ceres, Bucureşti. 3. Cotea V.D., 1985 - Tratat de enologie, vol. 1, Ed. Ceres, Bucureşti. 4. Etiévant P.X.,1991 - Wine. In H. Maarse (Ed.), Volatile compounds in foods and
beverages (pp. 483–546). New York: Dekker. 5. Gurbuz O., Rouseff J. M., Rouseff R. L., 2006 - Comparison of aroma volatiles in
commercial Merlot and Cabernet Sauvignon wines using gas chromatography olfactometry and gas chromatography mass spectrometry, Journal of Agricultural
Food Chemistry, 54, pp. 3990–3996. 6. Nechita C. B., 2010 - Contribuţii la studiul compuşilor volatili din strugurii şi vinurile
obţinute în podgoria Cotnari, Teză de doctorat, USAMV Iasi. 7. Peinado R., Moreno J. A., Muñoz D., Medina M., Moreno, J., 2004 - Gas
chromatographic quantification of major volatile compounds and polyols in wine by direct injection, Journal of Agricultural and Food Chemistry, 52, pp. 6389–6393.
8. Tao Y., Zhang L., 2010 - Intensity prediction of typical aroma characters of Cabernet
sauvignon wine in Changli County (China), LWT Food Science and Technology, 43, pp. 1550–1556.
9. OIV, 2013 - Compendium of international methods of wine and must analysis volume 1 and 2, Paris.
187
PHYSICO-CHEMICAL ANALYSIS OF WINES PRODUCED FROM LOCAL VARIETIES IN ROMANIA AND REPUBLIC
OF MOLDOVA
ANALIZA FIZICO-CHIMICĂ A UNOR VINURI OBȚINUTE DIN SOIURI AUTOHTONE DIN ROMÂNIA ȘI REPUBLICA MOLDOVA
LUCHIAN Camelia
1, COTEA V.V.
1, PATRAŞ Antoanela
1, CODREANU
Maria1, COLIBABA Cintia
1, KOKKINOFTA Rebecca
2
e-mail: [email protected]
Abstract. The natural conditions extremely favorable from Romania and Republic of Moldova, near the Danube Delta and the Black Sea, in latitudes similar to those in France, have favored over the time an expansion of lands cultivated with vines. Viticulture and wine production were basic occupations of people from this territory. Over time under the influence of many climatics, economics and historicals factors were obtained grape varieties adapted to the local conditions. Certain viticultural practices have been developed who contributed to the individualisation of wine from two different geographical areas. Wine made from Băbească neagră and Fetească neagră two local varieties cultivated in Romania and Republic of Moldova differentiates both by physicochemical and organoleptic characteristics, the aim of this paper being a comparative analysis of physicochemical composition and organoleptic properties of these wines. As a result for physico-chemical and organoleptic assays of Fetească neagră si Babească neagră wines from Iasi and Chateau Vartely vineyards, significant differences were identified. Key words: wine, alcohol concentration, physicochemical analysis, organoleptic characteristics
Rezumat. Condițiile naturale deosebit de prielnice din Romania și Republica Moldova, apropierea de Delta Dunării și Marea Neagră, situarea la latitudini similare cu cele din Franța, au favorizat o extindere a suprafețelor cultivate cu viță de vie de-a lungul timpului. Sub influența a numeroși factori de ordin climatic, economic și istoric s-au obținut anumite soiuri de struguri care s-au adaptat la condițiile locale. S-au înrădăcinat practici de cultură care contribuie la individualizarea vinurilor obținute din cele două spații geografice diferite. Vinul obtinut din Băbească Neagră si Feteasca Neagră, două soiuri autohtone cultivate in România și în Republica Moldova diferă atât prin caracteristici fizico-chimice cât și organoleptice, scopul acestei lucrări fiind analiza comparativă a compoziției fizico chimice a acestor vinuri. În urma determinărilor fizico-chimice și senzoriale ale vinurilor din soiurile Fetească neagră și Băbească neagră din podgoriile Iași și Chateau Vartely s-au observat diferențe semnificative. Cuvinte cheie: vin, concentraţia alcoolică, analize fizico-chimice, caracteristici organoleptice
1University of Agricultural Sciences and Veterinary Medicine of Iasi, Romania 2 State General Laboratory, Ministry of Health, Nicosia, Cipru
188
INTRODUCTION
The very favourable environmental conditions for vine culture led to its continuous development in the right and left side of Prut river, so vine
growing and wine making became one of the main basic tasks of the inhabitants.
The viticultural assortment of Romania and the Republic of Moldova has some very valuable local grape varieties, the following being the most widely cultivated in both countries:
-for white wines: Fetească albă, Fetească regală -for red wines: Băbească neagră (also known as Rară neagră in the
Republic of Moldova), Fetească neagră -for aromatic wines: Tămâioasă romanească, Busuioacă de Bohotin. It should be mentioned that in Romania indigenous varieties are grown
extensively, while in Moldova there is a rather narrow range in trade meeting is mainly red wines made from varieties Rară neagră (Băbească neagră) and
Fetească neagră. According to data from 2011, Romania is the 7th largest grape producer
in Europe. In 2011 there were 8,5 million quintals, both grapes and wine.
While Romanian production is influenced by many factors, climatic conditions remain one of the most important: wine production was very low in 2005 and
2010 due to very severe climate of Eastern Europe. Moreover, a general downward trend can be observed in 2006. This trend is due to the restructuring of vineyards - direct producing hybrid varieties are gradually replaced by Vitis vinifera L. offering less yield but high quality wines.
Romania is one of the top ten wine producing countries in the world and
one of the top six in Europe, along with France, Spain, Italy, Germany and Portugal. Wine production follows the same trends as grape production
(Arvanitoyannis et al., 1999). Difficult weather conditions halved wine production in 2010.
Moldovan wine sector has been and continues to be one of the most
important agricultural subsectors in a predominantly agricultural economy. As an industry, it represents 5% of GDP, around 25% of exports, and 8% of total
agricultural land in production. The total area of vineyards registered in Moldova was 156 400 ha in 2007, including 141,200 ha in production. In 2007, 5,700 hectares of new plantations of vines were recorded, a record
compared to only 460 ha in 2001. On the market in Moldova are about 150 wine producing companies.
Although there are many data regarding the characteristics of local grape varieties, a comparative analysis of the characteristics of wines traditionally obtained on both sides of the Prut river is strongly required in order to identify
similarities and differences that are unique to those wines.
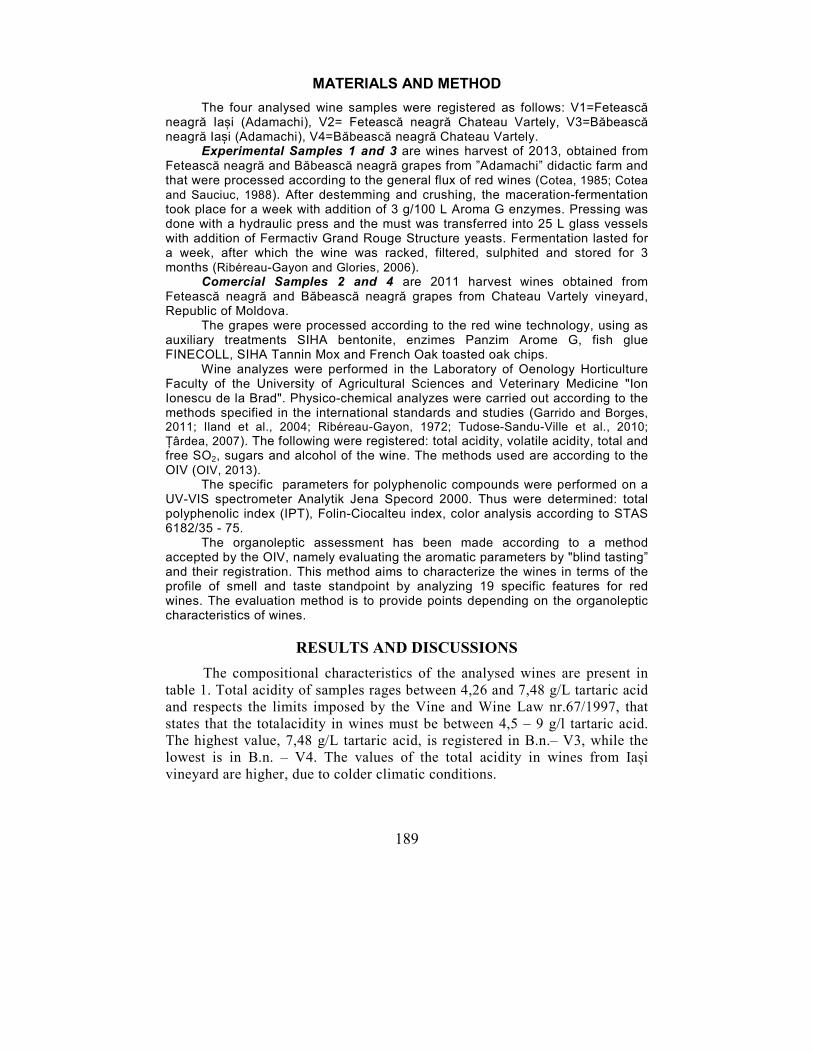
189
MATERIALS AND METHOD
The four analysed wine samples were registered as follows: V1=Fetească neagră Iași (Adamachi), V2= Fetească neagră Chateau Vartely, V3=Băbească neagră Iași (Adamachi), V4=Băbească neagră Chateau Vartely.
Experimental Samples 1 and 3 are wines harvest of 2013, obtained from Fetească neagră and Băbească neagră grapes from ”Adamachi” didactic farm and that were processed according to the general flux of red wines (Cotea, 1985; Cotea and Sauciuc, 1988). After destemming and crushing, the maceration-fermentation took place for a week with addition of 3 g/100 L Aroma G enzymes. Pressing was done with a hydraulic press and the must was transferred into 25 L glass vessels with addition of Fermactiv Grand Rouge Structure yeasts. Fermentation lasted for a week, after which the wine was racked, filtered, sulphited and stored for 3 months (Ribéreau-Gayon and Glories, 2006).
Comercial Samples 2 and 4 are 2011 harvest wines obtained from Fetească neagră and Băbească neagră grapes from Chateau Vartely vineyard, Republic of Moldova.
The grapes were processed according to the red wine technology, using as auxiliary treatments SIHA bentonite, enzimes Panzim Arome G, fish glue FINECOLL, SIHA Tannin Mox and French Oak toasted oak chips.
Wine analyzes were performed in the Laboratory of Oenology Horticulture Faculty of the University of Agricultural Sciences and Veterinary Medicine "Ion Ionescu de la Brad". Physico-chemical analyzes were carried out according to the methods specified in the international standards and studies (Garrido and Borges, 2011; Iland et al., 2004; Ribéreau-Gayon, 1972; Tudose-Sandu-Ville et al., 2010; Țârdea, 2007). The following were registered: total acidity, volatile acidity, total and free SO2, sugars and alcohol of the wine. The methods used are according to the OIV (OIV, 2013).
The specific parameters for polyphenolic compounds were performed on a UV-VIS spectrometer Analytik Jena Specord 2000. Thus were determined: total polyphenolic index (IPT), Folin-Ciocalteu index, color analysis according to STAS 6182/35 - 75.
The organoleptic assessment has been made according to a method accepted by the OIV, namely evaluating the aromatic parameters by "blind tasting” and their registration. This method aims to characterize the wines in terms of the profile of smell and taste standpoint by analyzing 19 specific features for red wines. The evaluation method is to provide points depending on the organoleptic characteristics of wines.
RESULTS AND DISCUSSIONS
The compositional characteristics of the analysed wines are present in
table 1. Total acidity of samples rages between 4,26 and 7,48 g/L tartaric acid and respects the limits imposed by the Vine and Wine Law nr.67/1997, that
states that the totalacidity in wines must be between 4,5 – 9 g/l tartaric acid. The highest value, 7,48 g/L tartaric acid, is registered in B.n.– V3, while the lowest is in B.n. – V4. The values of the total acidity in wines from Iași
vineyard are higher, due to colder climatic conditions.

190
Table 1 Physical-chemical analysis of studied wines
Samples
Volatile acidity
(g/L acetic acid)
Total acidity
(g/L tartaric acid)
Alcoholic conc. (%)
Density (g/L)
Remanent sugars
(g/L)
Free SO2
(mg/L)
Total SO2
(mg/L)
V1 0,31 5,24 12,31 0,9920 3,86 11,45 53,88
V2 0,51 4,7 14,5 0,9916 4,51 18,58 98,16
V3 0,27 7,48 11,60 0,9961 7,20 8,36 63,79
V4 0,39 4,26 14,5 0,9907 4,13 26,94 118,60
Table 2
Values of D280 and IFC
Parameters V1 V2 V3 V4
D280 17,06 51,42 9,97 56,67
IFC g/l 18,08 48,37 11,98 54,40
According to the table 1, the highest values of alcoholic concentration were
recorded in samples Fn-V2- and Bn- V4, that, due to the technological process for obtaining these wines.
After analysis we can see that IFC index has values of 48,37 in Fn-V2 and
54,40 in Bn-V4, which gives better sensorial stability and conservability to wines during maturation and aging (table 2).
Table 3 Values of chromatic parameters of wines obtained from
Fetească neagră and Băbească neagră
Parameter
Sample
L a b C Hº I N Computerised colour simulation
V1 45,78 52,681 15,186 54,826 16,080 2,055 0,612
V2 9,272 36,326 15,308 39,420 22,851 8,218 1,138
V3 50,75 45,868 4,885 46,127 6,079 1,238 0,515
V4 21,242 50,836 35,280 61,879 34,760 6,918 1,058
The values of the chromatic parameters show in table 3 the influence of the
technological process used in Chateau Vartely and Iași. The L index has values of 9,27 in Fetească neagra wine and 21,24 in Babeasca neagra wine compared to the
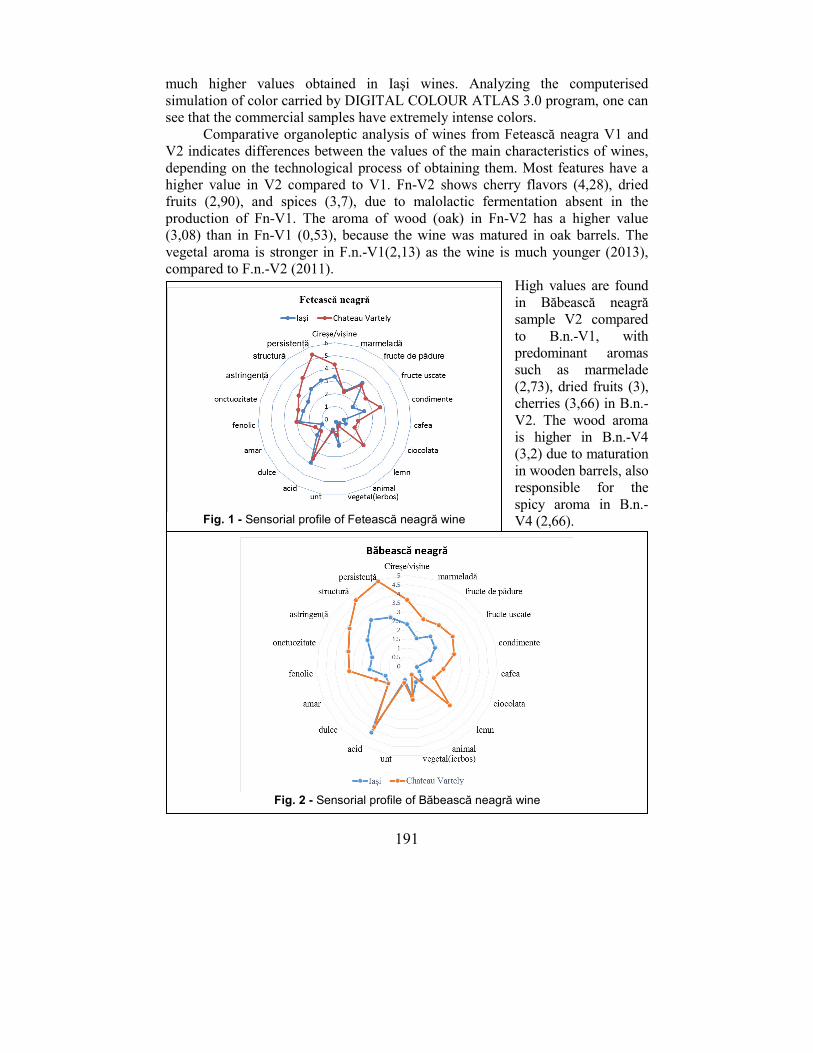
191
much higher values obtained in Iaşi wines. Analyzing the computerised
simulation of color carried by DIGITAL COLOUR ATLAS 3.0 program, one can see that the commercial samples have extremely intense colors.
Comparative organoleptic analysis of wines from Fetească neagra V1 and V2 indicates differences between the values of the main characteristics of wines,
depending on the technological process of obtaining them. Most features have a higher value in V2 compared to V1. Fn-V2 shows cherry flavors (4,28), dried fruits (2,90), and spices (3,7), due to malolactic fermentation absent in the
production of Fn-V1. The aroma of wood (oak) in Fn-V2 has a higher value (3,08) than in Fn-V1 (0,53), because the wine was matured in oak barrels. The
vegetal aroma is stronger in F.n.-V1(2,13) as the wine is much younger (2013), compared to F.n.-V2 (2011).
High values are found
in Băbească neagră sample V2 compared
to B.n.-V1, with predominant aromas such as marmelade
(2,73), dried fruits (3), cherries (3,66) in B.n.-
V2. The wood aroma is higher in B.n.-V4 (3,2) due to maturation
in wooden barrels, also responsible for the
spicy aroma in B.n.-V4 (2,66).
Fig. 1 - Sensorial profile of Fetească neagră wine
Fig. 2 - Sensorial profile of Băbească neagră wine
192
CONCLUSIONS
The studied wines can be classified as quality DOC wines, due to their
physical – chemical characteristics (alcoholic ocncentration that ranges between 11,60% in V3 and 14,5% in V2 and V4).
The organoleptic evaluation of experimental Fetească neagră samples indicate forest fruit notes and cherries/sourcherries pits, as well as
vegetal/herbeceous notes. In experimental Băbească neagră samples, notes of dried fruits and cherries are predominant.
In Chateau Vartely wines, the oak and spice aroma is pronounced, due to
the wood contact during wine maturation.
Acknowledgments: The research was funded by the grant no. 5525/25.04.2013 of USAMV Iasi and the PN-II-RO-CY-2013-1 project, nr. 764/2014.
REFERENCES
1. Arvanitoyannis I. S., Katsota M. N., Psarra E. P., Soufleros E. H., Kallithraka S., 1999 - Application of quality control methods for assessing wine authenticity: use of multivariate analysis (chemometrics). Trends Food Sci. Technol., 10, pp. 321–336.
2. Cotea V. D., 1985 - Tratat de Oenologie, vol. I .Vinificația și biochimia vinului. Editura Ceres, București.
3. Cotea V. D., Sauciuc J., 1988 - Tratat de oenologie , vol. II – Limpezirea, stabilizarea și îmbutelierea vinului. Editura Ceres, București;
4. Garrido J., Borges F, 2011 - Wine and grape polyphenols -a chemical perspective, Food Res. Int. 44, pp. 3134–3148.
5. Iland P., Bruer N., Ewart A., Markides A., Sitters J., 2004 - Monitoring the winemaking process from grapes to wine techniques and concepts. Patrick Iland Wine Promotions PTY LTD, Cambelltown, SA 5074 Australia.
6. Ribéreau-Gayon J., 1972 - Evolution des composes phenolique en cours de la maturation du raisins. Conn. Vigne. Vin.
7. Ribéreau-Gayon P. and Glories Y., 2006 - Handbook of Enology. The Chemistry of Wine Stabilization and Treatments. 2nd Edition, Editura John Wiley & Sons, West Sussex, England.
8. Tudose-Sandu-Ville Ș., Cotea V. V., Colibaba Cintia, Nechita B., Lăcureanu G., Mogârzan Cristina, 2009 - Study of phenolic compounds in red wines obtained in Iaşi vineyard by different maceration-fermentation methods. Lucrări ştiinţifice USAMV Iaşi, seria Horticultură, vol. 52, pp. 805-810.
9. Țârdea C., 2007 - Chimia și analiza vinului. Editura Ion Ionescu de la Brad, Iași. 10. *** OIV, 2013 - Recueil des methodes internationales d’analyse des vins et des mouts.
Office International de la Vigne et du Vin, Editura O.I.V., Edition Officielle, Paris.
193
STUDY OF THE CLIMATIC INFLUENCE ON THE COMPOSITIONAL CHARACTERISTICS OF WINES
OBTAINED IN THE COPOU HILL VINEYARD
STUDIUL INFLUENȚEI CONDIȚIILOR CLIMATICE ASUPRA CARACTERISTICIILOR COMPOZIȚIONALE ALE UNOR VINURI
OBȚINUTE ÎN PODGORIA COPOU
MOROȘANU Ana-Maria1, COTEA V.V.1, NICULAUA M.,2 COLIBABA Cintia1, NECHITA C.B.1 TARȚIAN A.1
e-mail: [email protected]
Abstract: Climate changes is a real impact factor for any form of agriculture and subsequently for grapes, but also for the quality of wines. The present study has as its main axis of research: observation of the influence of climatic conditions on the quality of wine mainly analysed. In order to accomplish this, we will study the wines from Copou vineyard obtained from the following varieties: Pinot gri, Fetească albă and Băbească gri, provided that they have undergone the same process of vinification in white. The study is based on the existing differences at physico-chemical level and chromatic characteristics of the analyzed wines in order to make correlations between the mainly wines features and weather conditions during the reference period 2012-2013. Key words: white whines, climatic changes, spectrofotometry, compositional characteristics
Rezumat: Schimbările climatice reprezintă un factor de real impact pentru orice formă de agricultură și prin urmare și pentru struguri, dar și pentru calitatea vinurilor. Studiul de față are ca principală axă de cercetare: observarea influenței condițiilor climatice asupra calității compoziționale a vinurilor analizate. În vederea îndeplinirii acestui deziderat, se vor studia vinuri obținute în podgoria Copou din soiurile: Fetească albă, Pinot gri și Băbească gri, cu mențiunea că au fost supuse aceluiași procedeu de vinificare în alb. Studiul se bazează pe evidențierea diferențelor existente la nivelul fizico-chimic și al caracteristiciilor cromatice pentru vinurile analizate încercând realizarea unor corelații între caracteristiciile compoziționale și variația condițiilor climatice în perioada de referință 2012-2013. Cuvinte cheie : vinuri albe, schimbări climatice, spectrofotometrie, caracteristici compoziționale
INTRODUCTION
Climate is an omnipresent factor in the success of all farming systems, with
a major influence in determining crop for a given region, is a measure of quality
control of plant products and management of economic sustainability (Jones, 2008;
Irmia et al., 2013).
1 University of Agricultural Sciences and Veterinary Medicine of Iasi, Romania 2 Oenological Research Center, Iasi Branch of the Romanian Academy, Iasi, Romania
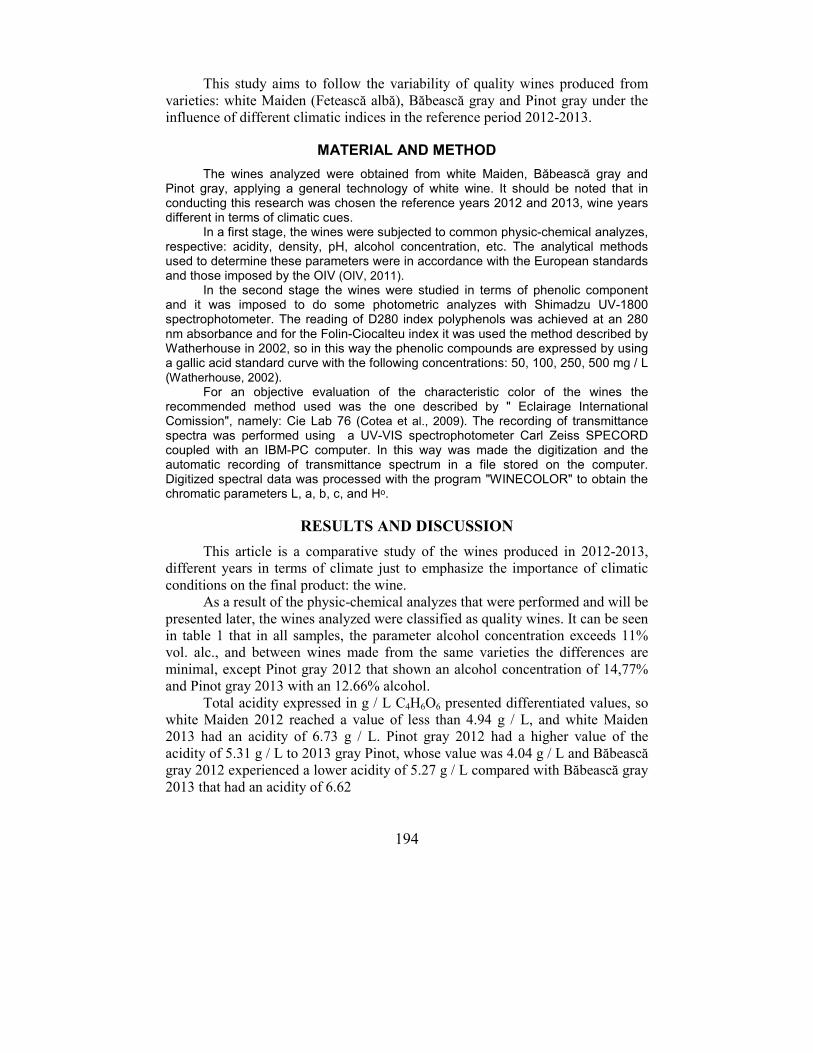
194
This study aims to follow the variability of quality wines produced from
varieties: white Maiden (Fetească albă), Băbească gray and Pinot gray under the
influence of different climatic indices in the reference period 2012-2013.
MATERIAL AND METHOD
The wines analyzed were obtained from white Maiden, Băbească gray and Pinot gray, applying a general technology of white wine. It should be noted that in conducting this research was chosen the reference years 2012 and 2013, wine years different in terms of climatic cues.
In a first stage, the wines were subjected to common physic-chemical analyzes, respective: acidity, density, pH, alcohol concentration, etc. The analytical methods used to determine these parameters were in accordance with the European standards and those imposed by the OIV (OIV, 2011).
In the second stage the wines were studied in terms of phenolic component and it was imposed to do some photometric analyzes with Shimadzu UV-1800 spectrophotometer. The reading of D280 index polyphenols was achieved at an 280 nm absorbance and for the Folin-Ciocalteu index it was used the method described by Watherhouse in 2002, so in this way the phenolic compounds are expressed by using a gallic acid standard curve with the following concentrations: 50, 100, 250, 500 mg / L (Watherhouse, 2002).
For an objective evaluation of the characteristic color of the wines the recommended method used was the one described by " Eclairage International Comission", namely: Cie Lab 76 (Cotea et al., 2009). The recording of transmittance spectra was performed using a UV-VIS spectrophotometer Carl Zeiss SPECORD coupled with an IBM-PC computer. In this way was made the digitization and the automatic recording of transmittance spectrum in a file stored on the computer. Digitized spectral data was processed with the program "WINECOLOR" to obtain the chromatic parameters L, a, b, c, and Hᵒ.
RESULTS AND DISCUSSION
This article is a comparative study of the wines produced in 2012-2013,
different years in terms of climate just to emphasize the importance of climatic
conditions on the final product: the wine.
As a result of the physic-chemical analyzes that were performed and will be
presented later, the wines analyzed were classified as quality wines. It can be seen
in table 1 that in all samples, the parameter alcohol concentration exceeds 11%
vol. alc., and between wines made from the same varieties the differences are
minimal, except Pinot gray 2012 that shown an alcohol concentration of 14,77%
and Pinot gray 2013 with an 12.66% alcohol.
Total acidity expressed in g / L C4H6O6 presented differentiated values, so
white Maiden 2012 reached a value of less than 4.94 g / L, and white Maiden
2013 had an acidity of 6.73 g / L. Pinot gray 2012 had a higher value of the
acidity of 5.31 g / L to 2013 gray Pinot, whose value was 4.04 g / L and Băbească
gray 2012 experienced a lower acidity of 5.27 g / L compared with Băbească gray
2013 that had an acidity of 6.62
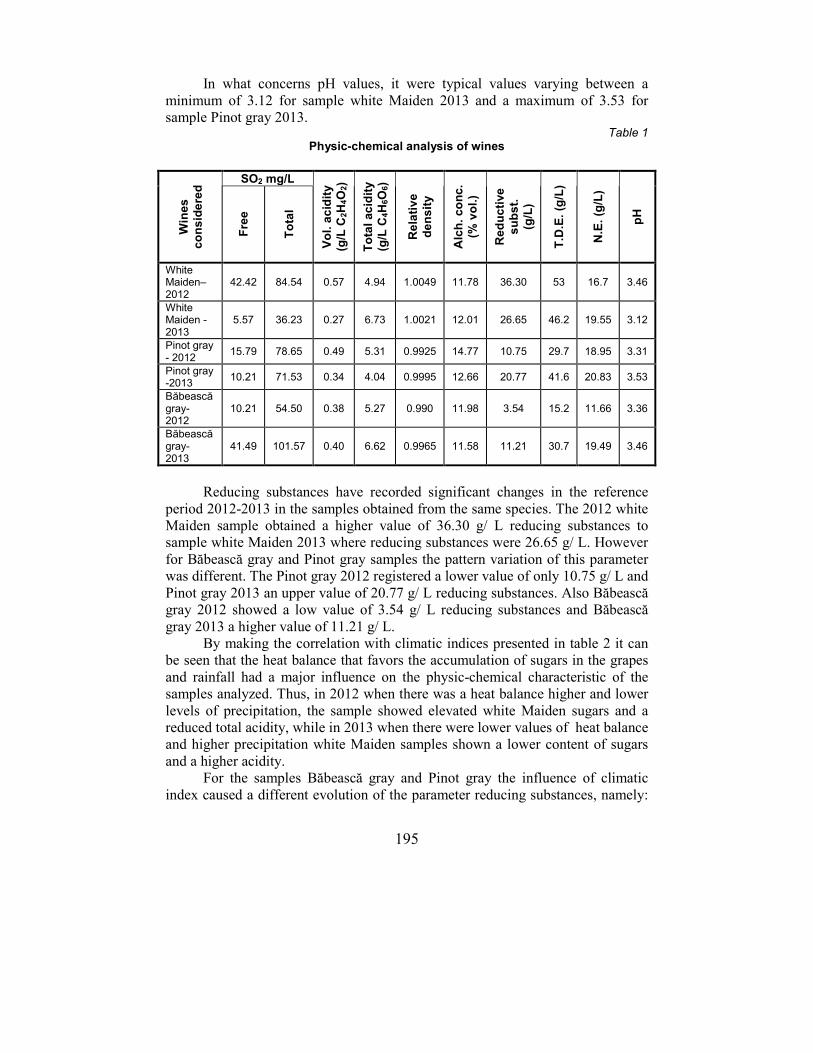
195
In what concerns pH values, it were typical values varying between a
minimum of 3.12 for sample white Maiden 2013 and a maximum of 3.53 for
sample Pinot gray 2013. Table 1
Physic-chemical analysis of wines
Win
es
c
on
sid
ere
d SO2 mg/L
Vo
l. a
cid
ity
(g/L
C2H
4O
2)
To
tal
ac
idit
y
(g/L
C4H
6O
6)
Re
lati
ve
de
ns
ity
Alc
h.
co
nc
. (%
vo
l.)
Re
du
cti
ve
su
bs
t.
(g/L
)
T.D
.E.
(g/L
)
N.E
. (g
/L)
pH
Fre
e
To
tal
White Maiden–2012
42.42 84.54 0.57 4.94 1.0049 11.78 36.30 53 16.7 3.46
White Maiden - 2013
5.57 36.23 0.27 6.73 1.0021 12.01 26.65 46.2 19.55 3.12
Pinot gray - 2012
15.79 78.65 0.49 5.31 0.9925 14.77 10.75 29.7 18.95 3.31
Pinot gray -2013
10.21 71.53 0.34 4.04 0.9995 12.66 20.77 41.6 20.83 3.53
Băbească gray- 2012
10.21 54.50 0.38 5.27 0.990 11.98 3.54 15.2 11.66 3.36
Băbească gray- 2013
41.49 101.57 0.40 6.62 0.9965 11.58 11.21 30.7 19.49 3.46
Reducing substances have recorded significant changes in the reference
period 2012-2013 in the samples obtained from the same species. The 2012 white
Maiden sample obtained a higher value of 36.30 g/ L reducing substances to
sample white Maiden 2013 where reducing substances were 26.65 g/ L. However
for Băbească gray and Pinot gray samples the pattern variation of this parameter
was different. The Pinot gray 2012 registered a lower value of only 10.75 g/ L and
Pinot gray 2013 an upper value of 20.77 g/ L reducing substances. Also Băbească
gray 2012 showed a low value of 3.54 g/ L reducing substances and Băbească
gray 2013 a higher value of 11.21 g/ L.
By making the correlation with climatic indices presented in table 2 it can
be seen that the heat balance that favors the accumulation of sugars in the grapes
and rainfall had a major influence on the physic-chemical characteristic of the
samples analyzed. Thus, in 2012 when there was a heat balance higher and lower
levels of precipitation, the sample showed elevated white Maiden sugars and a
reduced total acidity, while in 2013 when there were lower values of heat balance
and higher precipitation white Maiden samples shown a lower content of sugars
and a higher acidity.
For the samples Băbească gray and Pinot gray the influence of climatic
index caused a different evolution of the parameter reducing substances, namely:
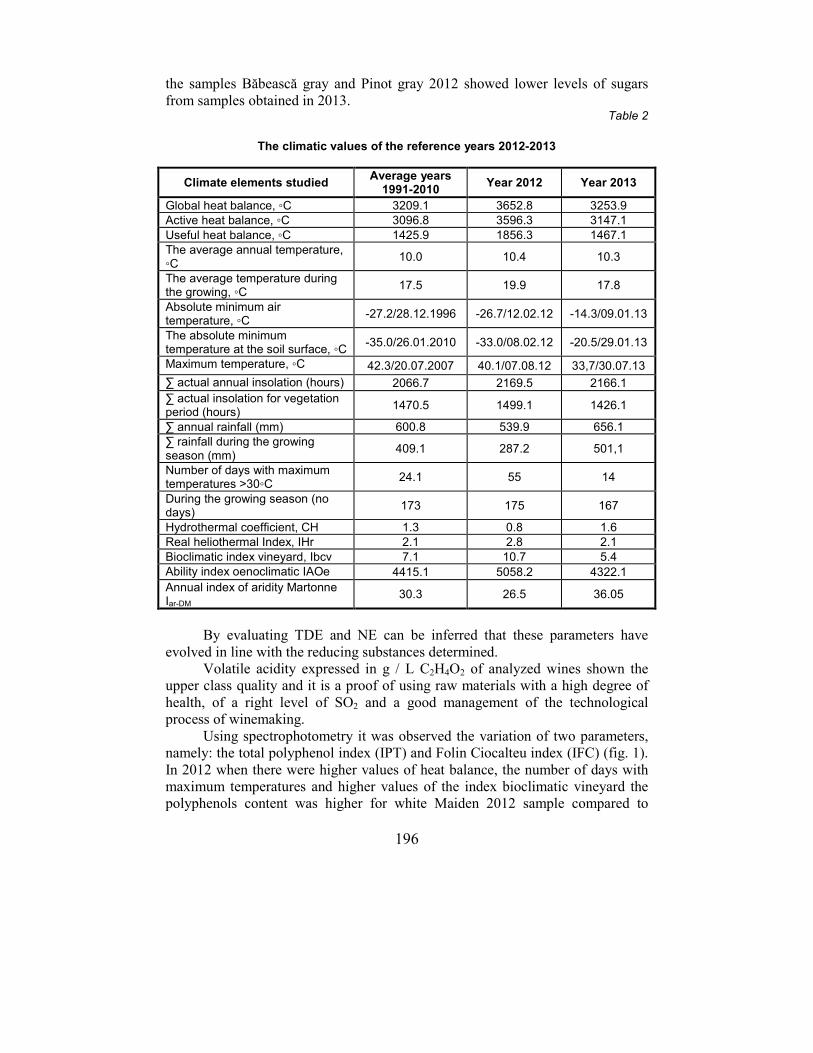
196
the samples Băbească gray and Pinot gray 2012 showed lower levels of sugars
from samples obtained in 2013. Table 2
The climatic values of the reference years 2012-2013
Climate elements studied Average years
1991-2010 Year 2012 Year 2013
Global heat balance, ◦C 3209.1 3652.8 3253.9 Active heat balance, ◦C 3096.8 3596.3 3147.1 Useful heat balance, ◦C 1425.9 1856.3 1467.1 The average annual temperature, ◦C
10.0 10.4 10.3
The average temperature during the growing, ◦C
17.5 19.9 17.8
Absolute minimum air temperature, ◦C
-27.2/28.12.1996 -26.7/12.02.12 -14.3/09.01.13
The absolute minimum temperature at the soil surface, ◦C
-35.0/26.01.2010 -33.0/08.02.12 -20.5/29.01.13
Maximum temperature, ◦C 42.3/20.07.2007 40.1/07.08.12 33,7/30.07.13
∑ actual annual insolation (hours) 2066.7 2169.5 2166.1
∑ actual insolation for vegetation period (hours)
1470.5 1499.1 1426.1
∑ annual rainfall (mm) 600.8 539.9 656.1 ∑ rainfall during the growing season (mm)
409.1 287.2 501,1
Number of days with maximum temperatures ˃30◦C
24.1 55 14
During the growing season (no days)
173 175 167
Hydrothermal coefficient, CH 1.3 0.8 1.6 Real heliothermal Index, IHr 2.1 2.8 2.1 Bioclimatic index vineyard, Ibcv 7.1 10.7 5.4 Ability index oenoclimatic IAOe 4415.1 5058.2 4322.1
Annual index of aridity Martonne Iar-DM
30.3 26.5 36.05
By evaluating TDE and NE can be inferred that these parameters have
evolved in line with the reducing substances determined.
Volatile acidity expressed in g / L C2H4O2 of analyzed wines shown the
upper class quality and it is a proof of using raw materials with a high degree of
health, of a right level of SO2 and a good management of the technological
process of winemaking.
Using spectrophotometry it was observed the variation of two parameters,
namely: the total polyphenol index (IPT) and Folin Ciocalteu index (IFC) (fig. 1).
In 2012 when there were higher values of heat balance, the number of days with
maximum temperatures and higher values of the index bioclimatic vineyard the
polyphenols content was higher for white Maiden 2012 sample compared to
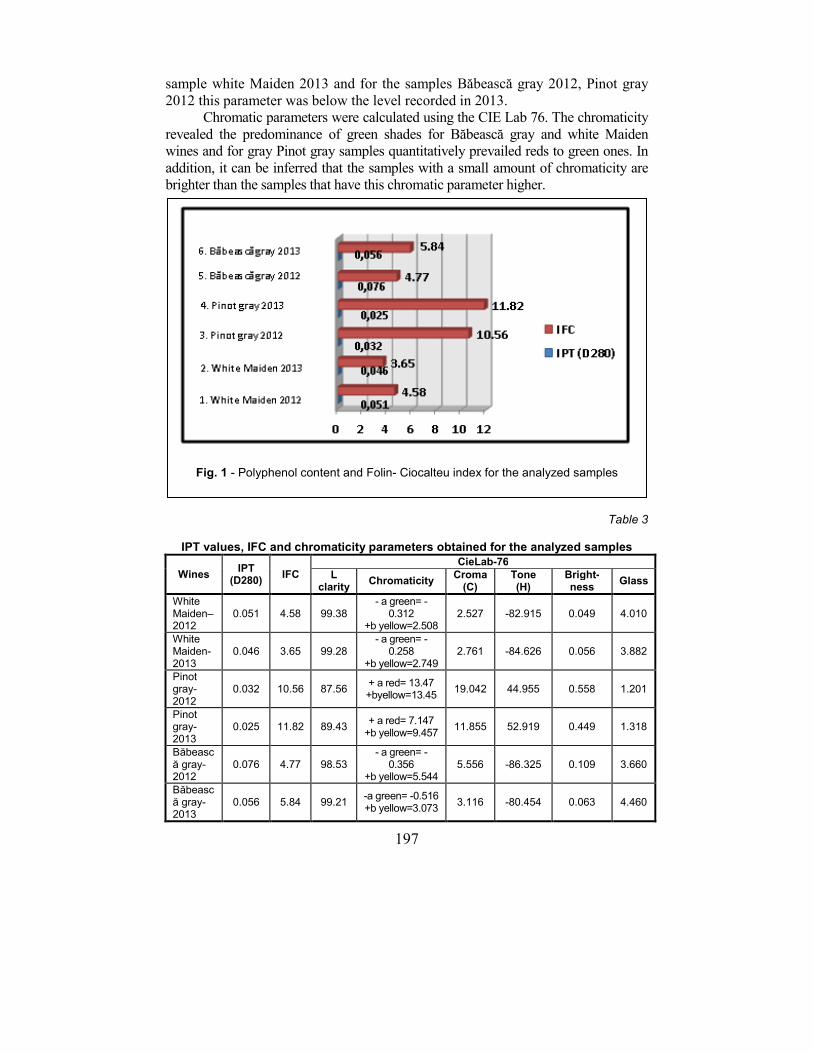
197
sample white Maiden 2013 and for the samples Băbească gray 2012, Pinot gray
2012 this parameter was below the level recorded in 2013.
Chromatic parameters were calculated using the CIE Lab 76. The chromaticity
revealed the predominance of green shades for Băbească gray and white Maiden
wines and for gray Pinot gray samples quantitatively prevailed reds to green ones. In
addition, it can be inferred that the samples with a small amount of chromaticity are
brighter than the samples that have this chromatic parameter higher.
Table 3
IPT values, IFC and chromaticity parameters obtained for the analyzed samples
Wines IPT
(D280) IFC
CieLab-76 L
clarity Chromaticity
Croma (C)
Tone (H)
Bright-ness
Glass
White Maiden–2012
0.051 4.58 99.38 - a green= -
0.312 +b yellow=2.508
2.527 -82.915 0.049 4.010
White Maiden- 2013
0.046 3.65 99.28 - a green= -
0.258 +b yellow=2.749
2.761 -84.626 0.056 3.882
Pinot gray- 2012
0.032 10.56 87.56 + a red= 13.47 +byellow=13.45
19.042 44.955 0.558 1.201
Pinot gray- 2013
0.025 11.82 89.43 + a red= 7.147
+b yellow=9.457 11.855 52.919 0.449 1.318
Băbească gray- 2012
0.076 4.77 98.53 - a green= -
0.356 +b yellow=5.544
5.556 -86.325 0.109 3.660
Băbească gray- 2013
0.056 5.84 99.21 -a green= -0.516 +b yellow=3.073
3.116 -80.454 0.063 4.460
Fig. 1 - Polyphenol content and Folin- Ciocalteu index for the analyzed samples
198
Analyzing the tone parameter (H) shown in table 3 is understandable that
wines Băbească gray and white Maiden with higher values are visually perceived
with yellow-green shadows and the Pinot gray wines where this parameter was
between 44,955 and 52,919 it was perceived the presence of reds shadows.
CONCLUSIONS
Following the compositional evolution of wine samples analyzed and
compared with the variation in climatic factors it can be deduced that these factors
exert their influence in a different way on grape varieties and thus on the final
product: wine.
So for the wines made from white Maiden variety the year 2012 was a
better one in terms of quality than 2013, but for the wines made from Pinot gray
and Băbească gray varieties, 2013 it was a differential one because there were
obtained wines with a higher quality.
In order to obtain a characteristic production and for the improvement of
quality wines is necessary to create future strategies for adapting to climate
change factors, to apply a senior management and to improve wine grape
varieties.
REFERENCES
1. Cotea V.D. și colab., 2009- Tratat de Oenochimie- vol.1, Editura Academiei Române, București
2. Irimia L., Patriche C.V., Quenol H., 2013 - Viticultural zoning- a comparative study regarding the accuracy of different approches in vineyards climate suitability assessment, Rev. Cercetări Agronomice în Moldova, vol. XLVI, nr. 3 (155)
3. Jones V. Gregory et al., 2005 - Climatic change and global wine quality” vol.73, nr. 3 pp. 319-343, Editura Kleuwer Academic Publishers
4. Watherhouse A. L., 2002 - Polyphenolics: Determination of Total Phenolics: Current Protocols in Food Analytical Chemistry, Wroistad, R.E (Ed.) John Willey and Sons, Inc. New York, ISBN:0471325651, pp. 1-4
5. OIV, 2011 - International Code of Oenological Practices, 2011 edition, Organisation International de la Vigne et du Vin, Paris
199
INFLUENCE OF THE DIFFERENTIATED CLIMATIC CONDITIONS ON COMPOSITION OF WINES OBTAINED
IN THE DEALU BUJORULUI VINEYARD
INFLUENTA CONDITIILOR CLIMATICE DIFERENŢIATE ASUPRA COMPOZIŢIEI VINURILOR OBŢINUTE ÎN
PODGORIA DEALU BUJORULUI
POSTOLACHE Elena1, CIUBUCĂ A.1, BÎRLIGA N.1
e-mail: [email protected]
Abstract. The climatic conditions influence the characteristics of the grape and
wine composition. Plus sufficient rainfall above average and monthly
distribution in 2013 have increased the potential specific grain variety and
obtaining alcoholic wine than in May 2012 (severe drought) when grapes are
left underdeveloped by blocking photosynthesis (high temperature, foliar burn)
with negative repercussions on the accumulation of sugars without affecting
color compounds. Wines of 2012 compared to the year 2013 are less alcoholic
but with high bet on anthocyanins, polyphenols extract unreduced and staining
intensity. In terms of organoleptic wine of the year 012 are higher than those in
2013 by extractivity, orietal flavors and brightly colored.
Key words: grapes, wine, acidity, anthocyanins, polyphenols Rezumat. Condițiile climatice îsi pun amprenta asupra caracteristicilor de
compoziție a strugurilor și vinurilor. Precipitațiile suficiente cu plus peste
medie și repartiție lunară din anul 2013 au dus la creșterea boabelor specific
potentialului de soi și la obținerea de vinuri mai alcoolice decât în anul
2012(extrem de secetos) când boabele de struguri au rămas nedezvoltate prin
blocarea fotosintezei(temperaturi ridicate, arderea aparatului foliar) cu
repercursiuni negative asupra acumulărilor de zaharuri fără să afecteze
compușii de culoare. Vinurile din 2012 comparativ cu cele din anul 2013 sunt
mai puțin alcoolice dar cu conținut ridicat în antociani, polifenoli totali, extract
nereducător și intensitate colorantă. Sub aspect organoleptic vinurile obtinute
din anul 2012 sunt superioare celor din 2013 prin extractivitate, aromă
specifică de soi și intensitate colorantă.
Cuvinte cheie: Cuvinte cheie: struguri, must, aciditate ,antociani, polifenoli
INTRODUCTION
The research conducted over the years have shown that goods quality wines
are given by the diversity of natural conditions and intake also reflecting
technological factor that contribute to their achievement (Postolache et al., 1994).
Top features of the composition of the wines were published starting 1992
(Ciubucă and Postolache, 1992) until now (Postolache et al., 2013). Research focused
knowledge physico-chemical composition wines by analyzes of record, also was
1 Research and Development Station for Viticulture and Vinification Bujoru, România
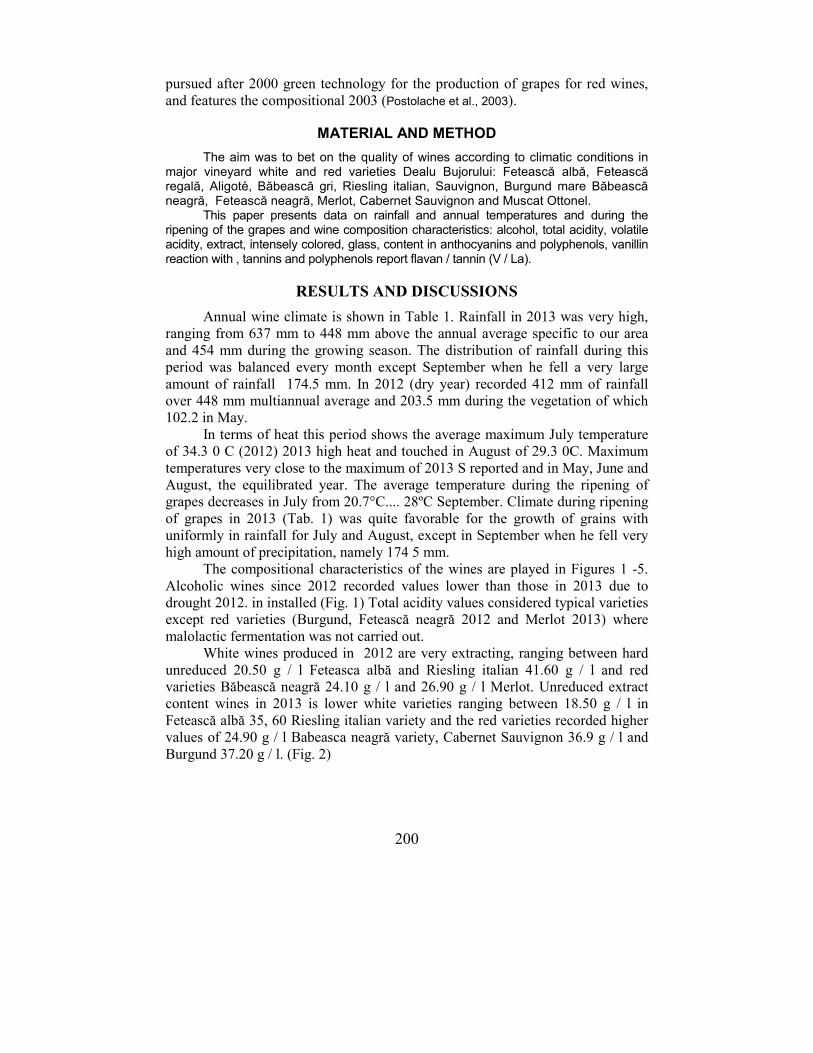
200
pursued after 2000 green technology for the production of grapes for red wines,
and features the compositional 2003 (Postolache et al., 2003).
MATERIAL AND METHOD
The aim was to bet on the quality of wines according to climatic conditions in major vineyard white and red varieties Dealu Bujorului: Fetească albă, Fetească regală, Aligoté, Băbească gri, Riesling italian, Sauvignon, Burgund mare Băbească neagră, Fetească neagră, Merlot, Cabernet Sauvignon and Muscat Ottonel.
This paper presents data on rainfall and annual temperatures and during the ripening of the grapes and wine composition characteristics: alcohol, total acidity, volatile acidity, extract, intensely colored, glass, content in anthocyanins and polyphenols, vanillin reaction with , tannins and polyphenols report flavan / tannin (V / La).
RESULTS AND DISCUSSIONS
Annual wine climate is shown in Table 1. Rainfall in 2013 was very high,
ranging from 637 mm to 448 mm above the annual average specific to our area
and 454 mm during the growing season. The distribution of rainfall during this
period was balanced every month except September when he fell a very large
amount of rainfall 174.5 mm. In 2012 (dry year) recorded 412 mm of rainfall
over 448 mm multiannual average and 203.5 mm during the vegetation of which
102.2 in May.
In terms of heat this period shows the average maximum July temperature
of 34.3 0 C (2012) 2013 high heat and touched in August of 29.3 0C. Maximum
temperatures very close to the maximum of 2013 S reported and in May, June and
August, the equilibrated year. The average temperature during the ripening of
grapes decreases in July from 20.7°C.... 28ºC September. Climate during ripening
of grapes in 2013 (Tab. 1) was quite favorable for the growth of grains with
uniformly in rainfall for July and August, except in September when he fell very
high amount of precipitation, namely 174 5 mm.
The compositional characteristics of the wines are played in Figures 1 -5.
Alcoholic wines since 2012 recorded values lower than those in 2013 due to
drought 2012. in installed (Fig. 1) Total acidity values considered typical varieties
except red varieties (Burgund, Fetească neagră 2012 and Merlot 2013) where
malolactic fermentation was not carried out.
White wines produced in 2012 are very extracting, ranging between hard
unreduced 20.50 g / l Feteasca albă and Riesling italian 41.60 g / l and red
varieties Băbească neagră 24.10 g / l and 26.90 g / l Merlot. Unreduced extract
content wines in 2013 is lower white varieties ranging between 18.50 g / l in
Fetească albă 35, 60 Riesling italian variety and the red varieties recorded higher
values of 24.90 g / l Babeasca neagră variety, Cabernet Sauvignon 36.9 g / l and
Burgund 37.20 g / l. (Fig. 2)
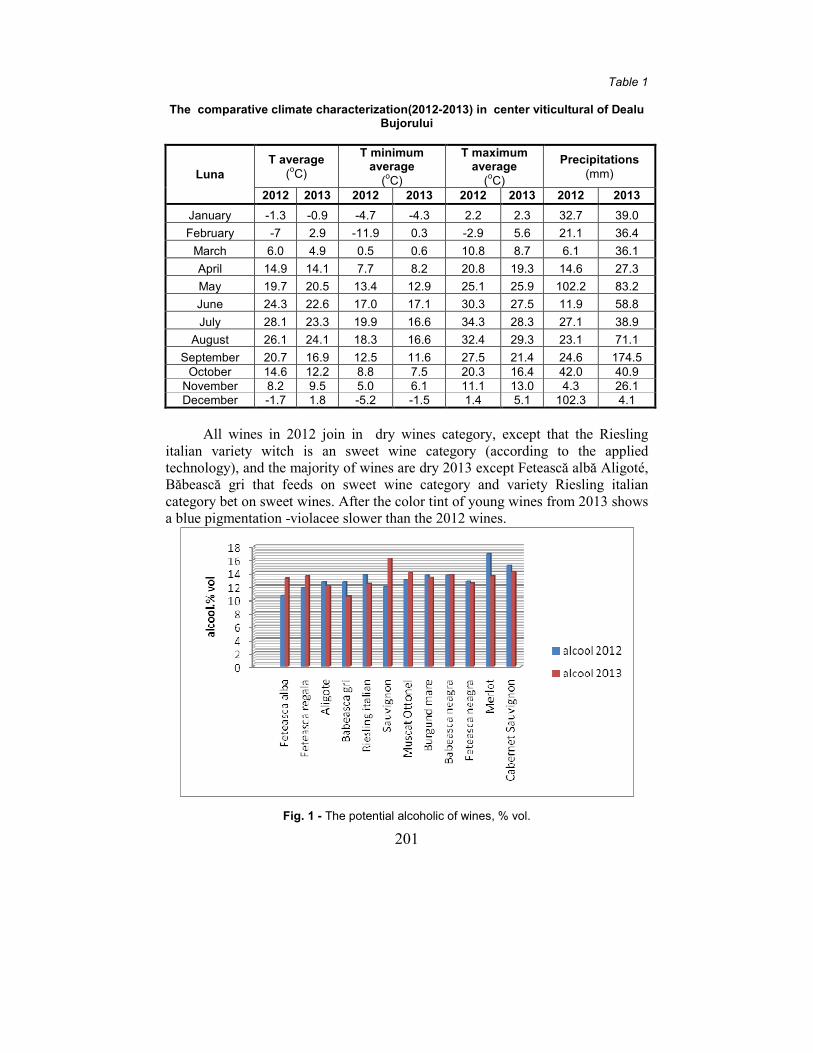
201
Table 1 The comparative climate characterization(2012-2013) in center viticultural of Dealu
Bujorului
Luna
T average
(oC)
T minimum average
(oC)
T maximum average
(oC)
Precipitations
(mm)
2012 2013 2012 2013 2012 2013 2012 2013
January -1.3 -0.9 -4.7 -4.3 2.2 2.3 32.7 39.0
February -7 2.9 -11.9 0.3 -2.9 5.6 21.1 36.4
March 6.0 4.9 0.5 0.6 10.8 8.7 6.1 36.1
April 14.9 14.1 7.7 8.2 20.8 19.3 14.6 27.3
May 19.7 20.5 13.4 12.9 25.1 25.9 102.2 83.2
June 24.3 22.6 17.0 17.1 30.3 27.5 11.9 58.8
July 28.1 23.3 19.9 16.6 34.3 28.3 27.1 38.9
August 26.1 24.1 18.3 16.6 32.4 29.3 23.1 71.1
September 20.7 16.9 12.5 11.6 27.5 21.4 24.6 174.5
October 14.6 12.2 8.8 7.5 20.3 16.4 42.0 40.9
November 8.2 9.5 5.0 6.1 11.1 13.0 4.3 26.1
December -1.7 1.8 -5.2 -1.5 1.4 5.1 102.3 4.1
All wines in 2012 join in dry wines category, except that the Riesling
italian variety witch is an sweet wine category (according to the applied
technology), and the majority of wines are dry 2013 except Fetească albă Aligoté,
Băbească gri that feeds on sweet wine category and variety Riesling italian
category bet on sweet wines. After the color tint of young wines from 2013 shows
a blue pigmentation -violacee slower than the 2012 wines.
Fig. 1 - The potential alcoholic of wines, % vol.
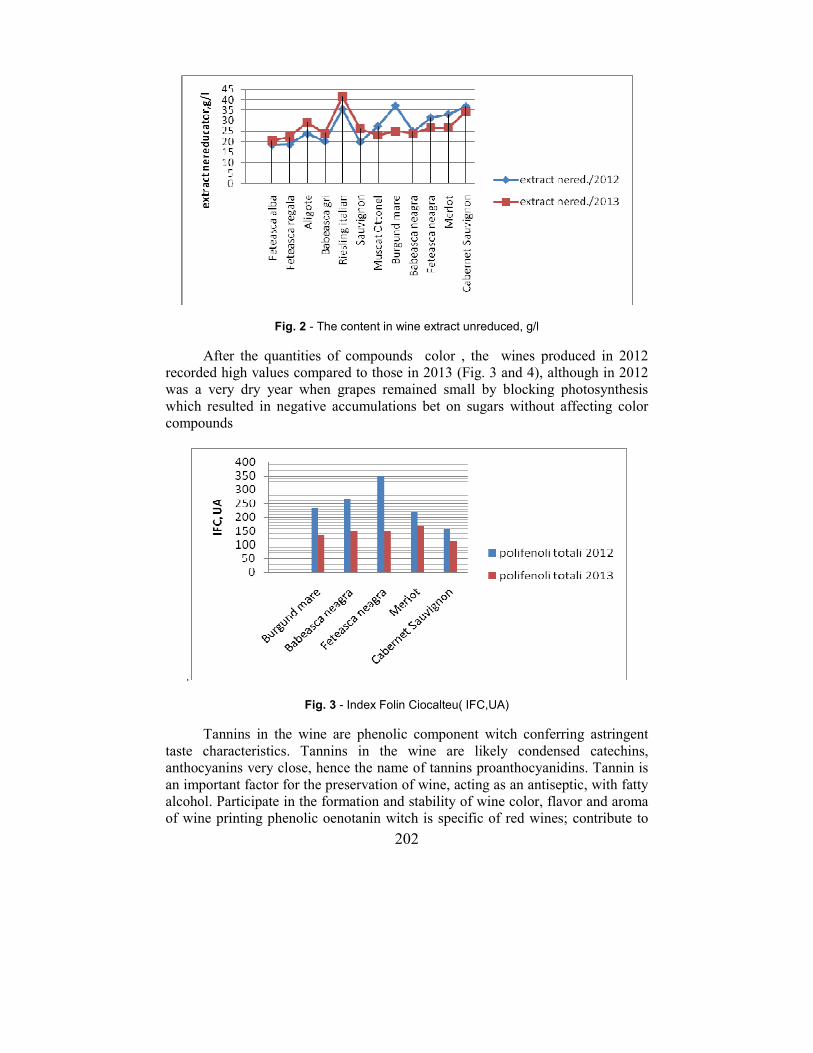
202
Fig. 2 - The content in wine extract unreduced, g/l
After the quantities of compounds color , the wines produced in 2012
recorded high values compared to those in 2013 (Fig. 3 and 4), although in 2012
was a very dry year when grapes remained small by blocking photosynthesis
which resulted in negative accumulations bet on sugars without affecting color
compounds
.
Fig. 3 - Index Folin Ciocalteu( IFC,UA)
Tannins in the wine are phenolic component witch conferring astringent
taste characteristics. Tannins in the wine are likely condensed catechins,
anthocyanins very close, hence the name of tannins proanthocyanidins. Tannin is
an important factor for the preservation of wine, acting as an antiseptic, with fatty
alcohol. Participate in the formation and stability of wine color, flavor and aroma
of wine printing phenolic oenotanin witch is specific of red wines; contribute to
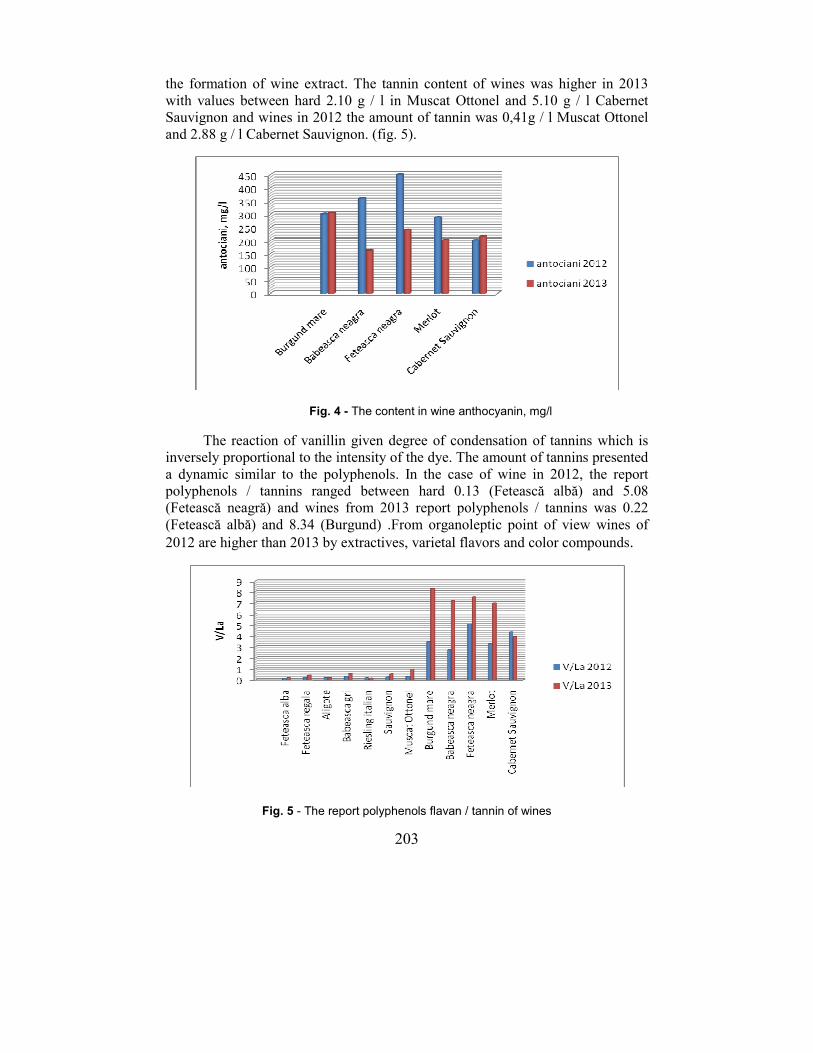
203
the formation of wine extract. The tannin content of wines was higher in 2013
with values between hard 2.10 g / l in Muscat Ottonel and 5.10 g / l Cabernet
Sauvignon and wines in 2012 the amount of tannin was 0,41g / l Muscat Ottonel
and 2.88 g / l Cabernet Sauvignon. (fig. 5).
Fig. 4 - The content in wine anthocyanin, mg/l
The reaction of vanillin given degree of condensation of tannins which is
inversely proportional to the intensity of the dye. The amount of tannins presented
a dynamic similar to the polyphenols. In the case of wine in 2012, the report
polyphenols / tannins ranged between hard 0.13 (Fetească albă) and 5.08
(Fetească neagră) and wines from 2013 report polyphenols / tannins was 0.22
(Fetească albă) and 8.34 (Burgund) .From organoleptic point of view wines of
2012 are higher than 2013 by extractives, varietal flavors and color compounds.
Fig. 5 - The report polyphenols flavan / tannin of wines
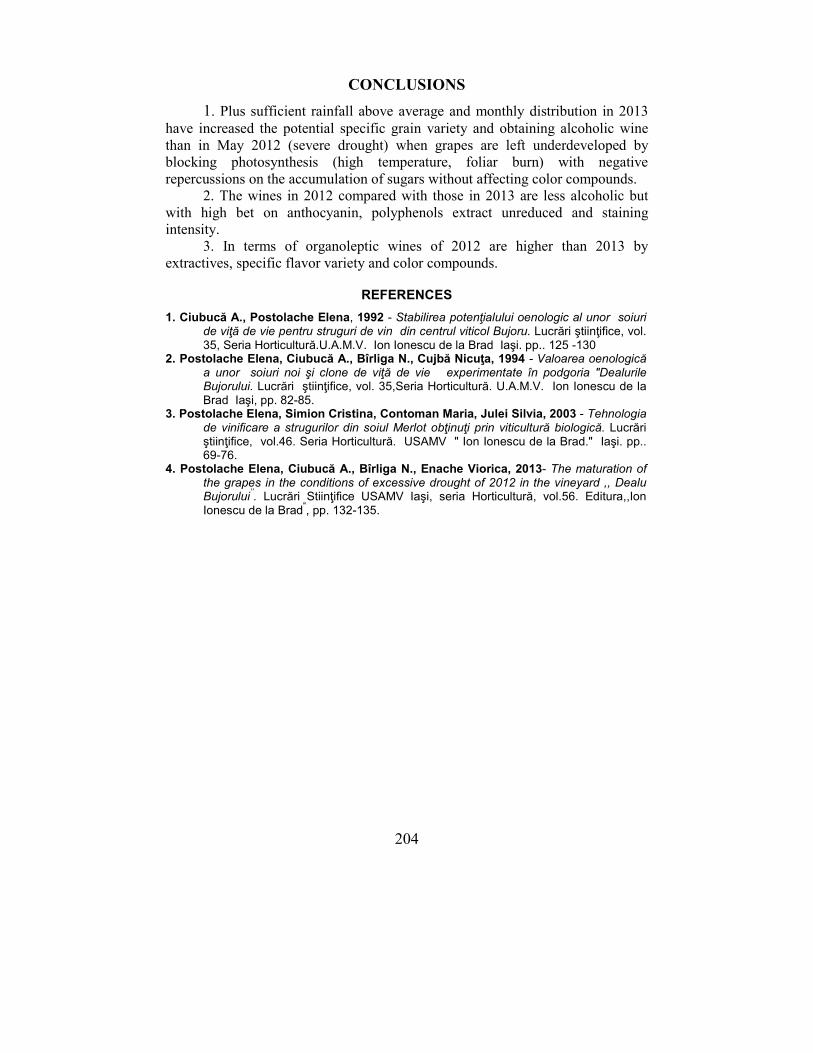
204
CONCLUSIONS
1. Plus sufficient rainfall above average and monthly distribution in 2013
have increased the potential specific grain variety and obtaining alcoholic wine
than in May 2012 (severe drought) when grapes are left underdeveloped by
blocking photosynthesis (high temperature, foliar burn) with negative
repercussions on the accumulation of sugars without affecting color compounds.
2. The wines in 2012 compared with those in 2013 are less alcoholic but
with high bet on anthocyanin, polyphenols extract unreduced and staining
intensity.
3. In terms of organoleptic wines of 2012 are higher than 2013 by
extractives, specific flavor variety and color compounds.
REFERENCES
1. Ciubucă A., Postolache Elena, 1992 - Stabilirea potenţialului oenologic al unor soiuri de viţă de vie pentru struguri de vin din centrul viticol Bujoru. Lucrări ştiinţifice, vol. 35, Seria Horticultură.U.A.M.V. Ion Ionescu de la Brad Iaşi. pp.. 125 -130
2. Postolache Elena, Ciubucă A., Bîrliga N., Cujbă Nicuţa, 1994 - Valoarea oenologică a unor soiuri noi şi clone de viţă de vie experimentate în podgoria "Dealurile Bujorului. Lucrări ştiinţifice, vol. 35,Seria Horticultură. U.A.M.V. Ion Ionescu de la Brad Iaşi, pp. 82-85.
3. Postolache Elena, Simion Cristina, Contoman Maria, Julei Silvia, 2003 - Tehnologia de vinificare a strugurilor din soiul Merlot obţinuţi prin viticultură biologică. Lucrări ştiinţifice, vol.46. Seria Horticultură. USAMV " Ion Ionescu de la Brad." Iaşi. pp.. 69-76.
4. Postolache Elena, Ciubucă A., Bîrliga N., Enache Viorica, 2013- The maturation of the grapes in the conditions of excessive drought of 2012 in the vineyard ,, Dealu Bujorului
’’. Lucrări Stiinţifice USAMV Iaşi, seria Horticultură, vol.56. Editura,,Ion
Ionescu de la Brad", pp. 132-135.
205
RESEARCH ON THE INFLUENCE OF THE PEDOCLIMATIC CONDITIONS FROM DEALU
BUJORULUI, COTNARI AND IAŞI VINEYARDS ON THE PHYSICO-CHEMICAL CHARACTERISTICS OF THE
FETEASCĂ ALBĂ AND BUSUIOACĂ DE BOHOTIN WINES CERCETĂRI PRIVIND INFLUENŢA CONDIŢIILOR PEDOCLIMATICE
DIN PODGORIA DEALU BUJORULUI, COTNARI ŞI IAŞI ASUPRA CARACTERISTICILOR FIZICO-CHIMICE ALE VINURILOR DE
FETEASCĂ ALBĂ ŞI BUSUIOACĂ DE BOHOTIN
TARŢIAN A.C.1, COTEA V.V1, NICULAUA M.,2 COLIBABA Cintia1, NECHITA C.B.1 , MOROȘANU Ana-Maria1
e-mail:tarţ[email protected]
Abstract. This study pursues the influence of the pedoclimatic conditions on the physico-chemical characteristics of the wines obtained in “Vasile Adamachi” Research Station of Iaşi.Fetească albă and Busuioacă de Bohotin wines were obtained by the same wine-making technologies and in the same year of production (2012 for Fetească albă wine and 2013 for Busuioacă de Bohotin wine). Therefore, it can be followed only the influence of the pedoclimatic conditions from the vineyards where the grapes were used for winemaking. The main parameters that will be followed to determine the physico-chemical composition of wines studied are: sulfur dioxide, volatile acidity, total acidity, density, concentration of alcohol, reducing sugars, total dry extract, non-reductive extract, phenolic compounds and chromatic characteristics. By analyzing these parameters it can be established the degree of influence that have the pedoclimatic conditions on typicity of the grape variety and on the quality of wines produced from them. Key words: pedoclimatic conditions, tipicity, spectrofotometry, compositional characteristics. Rezumat. In studiul de faţă se va urmări influenţa condiţiilor pedoclimatice asupra caracteristicilor fizico-chimice ale vinurilor obţinute în Staţiunea didactică experimentală “Vasile Adamachi” din Iaşi. Vinurile de Fetească albă şi Busuioacă de Bohotin au fost obţinute prin aceleaşi tehnologii de vinificaţie, având acelaşi an de producţie (2012 pentru vinul de Fetească alba şi 2013 pentru vinul de Busuioacă de Bohotin). În acest mod se poate urmări influenţa pe care o au doar condiţiile pedoclimatice ale podgoriilor de unde s-au utilizat strugurii pentru vinificaţie. Principalii parametrii care se vor urmări pentru determinarea compoziţiei fizico-chimice ale vinurilor studiate sunt: dioxidul de sulf, aciditatea volatilă, aciditatea totală, densitatea, concentraţia alcoolică, zaharurile reducătoare, extractul sec total, extractul nereducător, compuşii fenolici şi caracteristicile cromatice. Prin analizarea acestor parametrii se va
1 University of Agricultural Sciences and Veterinary Medicine of Iasi, Romania 2 Oenological Research Center, Iasi Branch of the Romanian Academy, Iasi, Romania
206
putea stabili şi gradul de influenţă pe care îl au condiţiile pedoclimatice asupra tipicităţii soiului precum şi asupra calităţii vinurilor obţinute din acestea. Cuvinte cheie: condiţii pedoclimatice, tipicitate, spectrofotometrie, caracteristici compoziţionale.
INTRODUCTION
You can not mention the climatic conditions of a vineyard without
remembering about the concept of terroir (Olteanu et al., 2002). Terroir is a highly
important concept in viticulture because it relates the sensory attributes of wine to
the environmental conditions in which the grapes are grown (Van Leeuwen et al.,
2004). However, terroir is difficult to study on a scientific basis because many
factors are involved, including climate, soil, cultivar and human practices, and
these factors interact. (Van Leeuwen and Seguin, 2006).
MATERIAL AND METHOD
Fetească albă wines were obtained by applying the general techology in white wine and for Busuioacă de Bohotin wines were applyed the specific technology for the aromatic wines, therefore was included and the technological stage of maceration (Cotea et al., 2009).
Analysis of the usual physico-chemical parameters (sulfure dioxide, volatile and total acidity, relative density, concentration of alcohol, reducing sugars etc.) were made in conformity with european standards and the norms set by the O.I.V (OIV, 2011).
Phenolic compounds in the studied wines were determinated using total poliphenolic index (I.P.T or D280) and Folin Ciocâlteu Index (I.F.C).
IPT expresses the total contentof phenolic compounds (phenolic acids, tannins and dyeing substances) of the wines and is based on the level of ultraviolet light absorbance at 280 nm of the benzene nuclei of the specific phenolic compounds.
Folin-Ciocâlteu Index it is specific to phenolic compounds with reducing properties and it is based on the fact that in medium basic and in the presence of the phenols, the mixture of phosphotungistic and phospho molybdic acids are reduced to blue oxides of tungisten and molybdenum and its reading is performed at 720 nm.
The two indices were determined using Shimadzu UV-1800 spectrophotometer (Watherhouse, 2002).
The determination of the chromatic parameters was performedaccording to the method CIELab76 (depending on their absorption spectrum) using UV-VIS spectrophotometer Carl Zeiss SPECORD coupled with an IBM-PC computer.
Therefore, was made the automatic numbering and recording of the spectrum absorption on a file stored on the computer. Digitized spectral data were processed with the program"VINCO" to obtain the chromatic parameters L, a,b, c, and Hᵒ.
RESULTS AND DISCUSSIONS
In this article were studied wines that were obtained from two different
varietes (Fetească albă and Busuioacă de Bohotin), each variety having different
years of production (2012 and 2013), and the grapes were harvested from
different vineyards, therefore, it was followed the influence of the vineyards on
the typicity and quality of these wines.
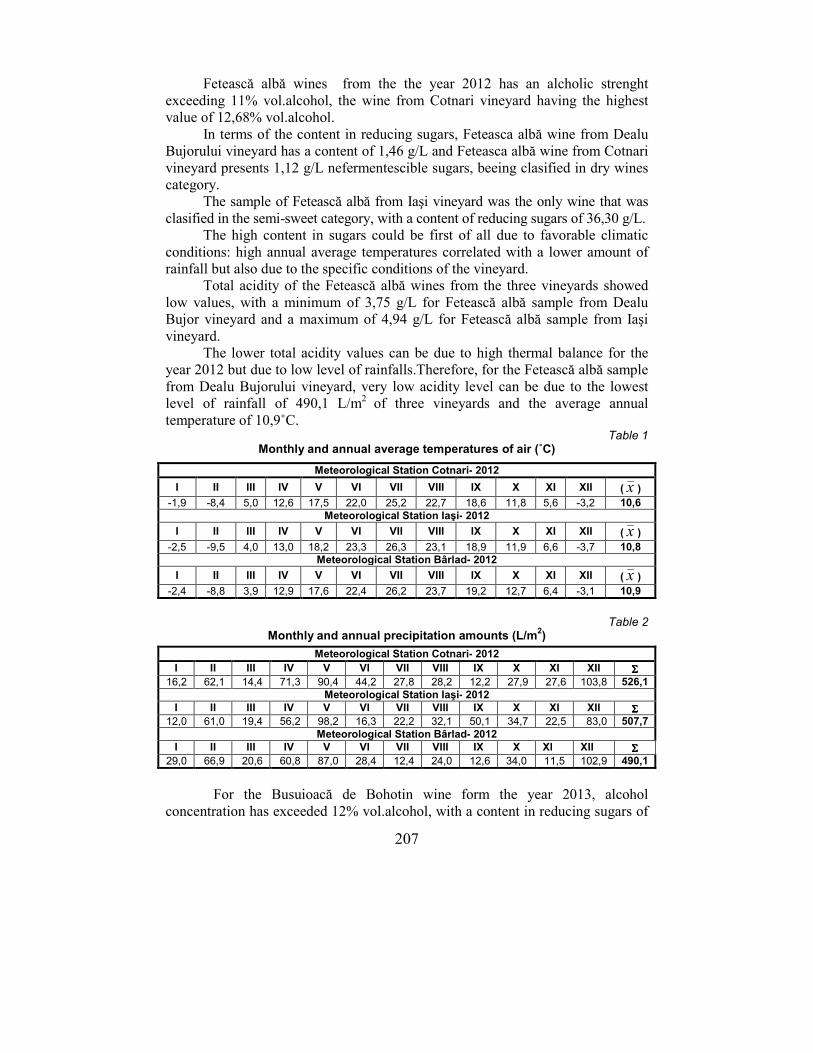
207
Fetească albă wines from the the year 2012 has an alcholic strenght
exceeding 11% vol.alcohol, the wine from Cotnari vineyard having the highest
value of 12,68% vol.alcohol.
In terms of the content in reducing sugars, Feteasca albă wine from Dealu
Bujorului vineyard has a content of 1,46 g/L and Feteasca albă wine from Cotnari
vineyard presents 1,12 g/L nefermentescible sugars, beeing clasified in dry wines
category.
The sample of Fetească albă from Iaşi vineyard was the only wine that was
clasified in the semi-sweet category, with a content of reducing sugars of 36,30 g/L.
The high content in sugars could be first of all due to favorable climatic
conditions: high annual average temperatures correlated with a lower amount of
rainfall but also due to the specific conditions of the vineyard.
Total acidity of the Fetească albă wines from the three vineyards showed
low values, with a minimum of 3,75 g/L for Fetească albă sample from Dealu
Bujor vineyard and a maximum of 4,94 g/L for Fetească albă sample from Iaşi
vineyard.
The lower total acidity values can be due to high thermal balance for the
year 2012 but due to low level of rainfalls.Therefore, for the Fetească albă sample
from Dealu Bujorului vineyard, very low acidity level can be due to the lowest
level of rainfall of 490,1 L/m2
of three vineyards and the average annual
temperature of 10,9˚C.
Table 1 Monthly and annual average temperatures of air (˚C)
Table 2 Monthly and annual precipitation amounts (L/m2)
For the Busuioacă de Bohotin wine form the year 2013, alcohol
concentration has exceeded 12% vol.alcohol, with a content in reducing sugars of
Meteorological Station Cotnari- 2012
I II III IV V VI VII VIII IX X XI XII ( x )
-1,9 -8,4 5,0 12,6 17,5 22,0 25,2 22,7 18,6 11,8 5,6 -3,2 10,6 Meteorological Station Iaşi- 2012
I II III IV V VI VII VIII IX X XI XII ( x )
-2,5 -9,5 4,0 13,0 18,2 23,3 26,3 23,1 18,9 11,9 6,6 -3,7 10,8 Meteorological Station Bârlad- 2012
I II III IV V VI VII VIII IX X XI XII ( x )
-2,4 -8,8 3,9 12,9 17,6 22,4 26,2 23,7 19,2 12,7 6,4 -3,1 10,9
Meteorological Station Cotnari- 2012
I II III IV V VI VII VIII IX X XI XII ΣΣΣΣ 16,2 62,1 14,4 71,3 90,4 44,2 27,8 28,2 12,2 27,9 27,6 103,8 526,1
Meteorological Station Iaşi- 2012 I II III IV V VI VII VIII IX X XI XII ΣΣΣΣ
12,0 61,0 19,4 56,2 98,2 16,3 22,2 32,1 50,1 34,7 22,5 83,0 507,7 Meteorological Station Bârlad- 2012
I II III IV V VI VII VIII IX X XI XII ΣΣΣΣ 29,0 66,9 20,6 60,8 87,0 28,4 12,4 24,0 12,6 34,0 11,5 102,9 490,1
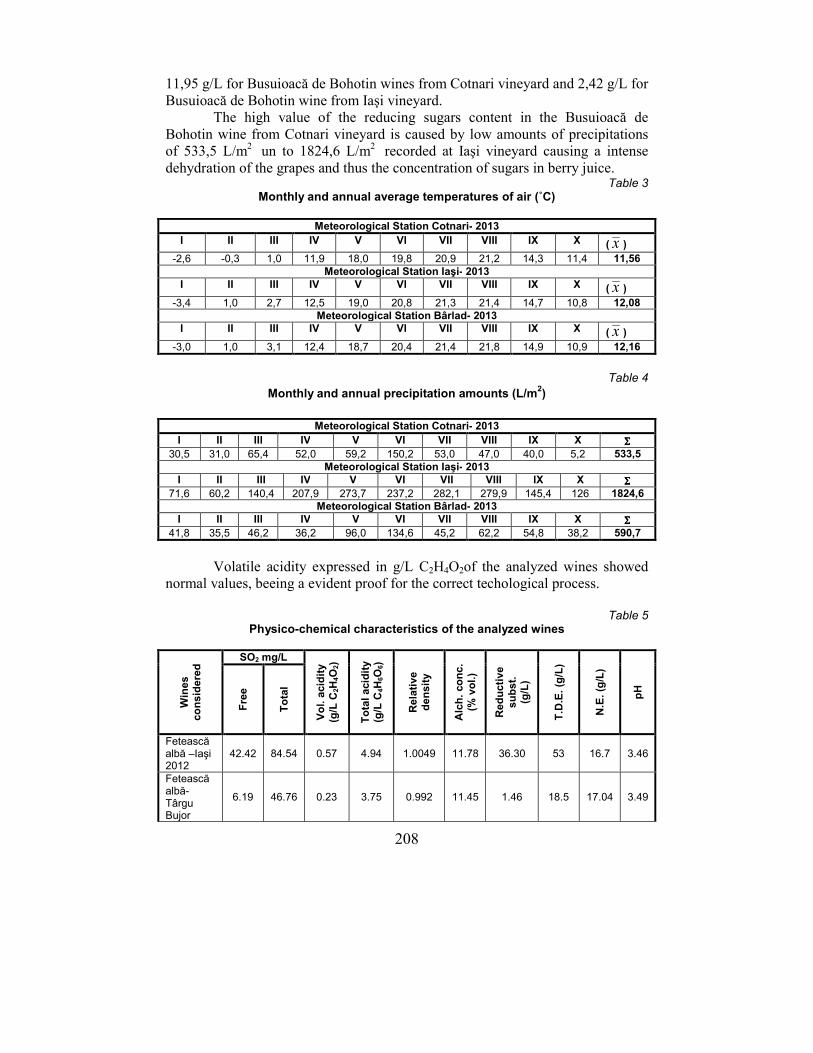
208
11,95 g/L for Busuioacă de Bohotin wines from Cotnari vineyard and 2,42 g/L for
Busuioacă de Bohotin wine from Iaşi vineyard.
The high value of the reducing sugars content in the Busuioacă de
Bohotin wine from Cotnari vineyard is caused by low amounts of precipitations
of 533,5 L/m2
un to 1824,6 L/m2
recorded at Iaşi vineyard causing a intense
dehydration of the grapes and thus the concentration of sugars in berry juice. Table 3
Monthly and annual average temperatures of air (˚C)
Table 4
Monthly and annual precipitation amounts (L/m2)
Volatile acidity expressed in g/L C2H4O2of the analyzed wines showed
normal values, beeing a evident proof for the correct techological process.
Table 5
Physico-chemical characteristics of the analyzed wines
Win
es
co
nsid
ere
d SO2 mg/L
Vo
l. a
cid
ity
(g/L
C2H
4O
2)
To
tal
acid
ity
(g/L
C4H
6O
6)
Rela
tive
den
sit
y
Alc
h.
co
nc.
(% v
ol.
)
Red
ucti
ve
su
bst.
(g
/L)
T.D
.E. (g
/L)
N.E
. (g
/L)
pH
Fre
e
To
tal
Fetească albă –Iaşi 2012
42.42 84.54 0.57 4.94 1.0049 11.78 36.30 53 16.7 3.46
Fetească albă-Târgu Bujor
6.19 46.76 0.23 3.75 0.992 11.45 1.46 18.5 17.04 3.49
Meteorological Station Cotnari- 2013
I II III IV V VI VII VIII IX X ( x )
-2,6 -0,3 1,0 11,9 18,0 19,8 20,9 21,2 14,3 11,4 11,56 Meteorological Station Iaşi- 2013
I II III IV V VI VII VIII IX X ( x )
-3,4 1,0 2,7 12,5 19,0 20,8 21,3 21,4 14,7 10,8 12,08 Meteorological Station Bârlad- 2013
I II III IV V VI VII VIII IX X ( x )
-3,0 1,0 3,1 12,4 18,7 20,4 21,4 21,8 14,9 10,9 12,16
Meteorological Station Cotnari- 2013
I II III IV V VI VII VIII IX X ΣΣΣΣ 30,5 31,0 65,4 52,0 59,2 150,2 53,0 47,0 40,0 5,2 533,5
Meteorological Station Iaşi- 2013 I II III IV V VI VII VIII IX X ΣΣΣΣ
71,6 60,2 140,4 207,9 273,7 237,2 282,1 279,9 145,4 126 1824,6 Meteorological Station Bârlad- 2013
I II III IV V VI VII VIII IX X ΣΣΣΣ 41,8 35,5 46,2 36,2 96,0 134,6 45,2 62,2 54,8 38,2 590,7
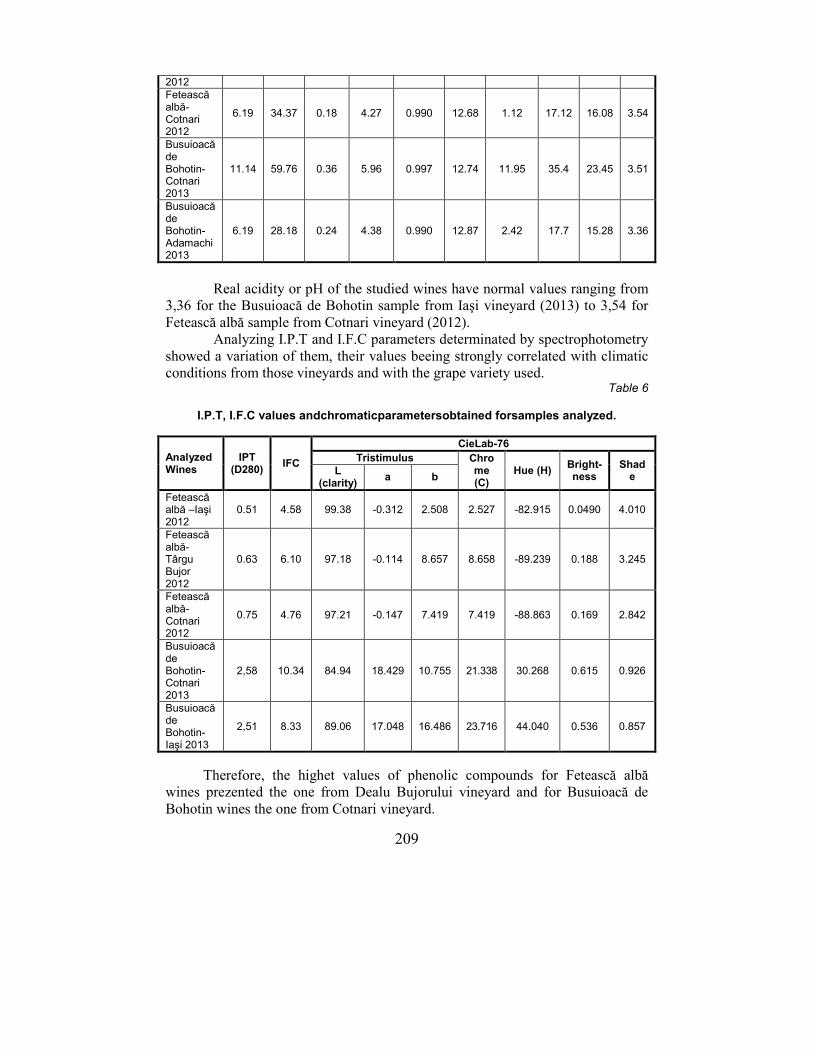
209
2012 Fetească albă-Cotnari 2012
6.19 34.37 0.18 4.27 0.990 12.68 1.12 17.12 16.08 3.54
Busuioacă de Bohotin-Cotnari 2013
11.14 59.76 0.36 5.96 0.997 12.74 11.95 35.4 23.45 3.51
Busuioacă de Bohotin- Adamachi 2013
6.19 28.18 0.24 4.38 0.990 12.87 2.42 17.7 15.28 3.36
Real acidity or pH of the studied wines have normal values ranging from
3,36 for the Busuioacă de Bohotin sample from Iaşi vineyard (2013) to 3,54 for
Fetească albă sample from Cotnari vineyard (2012).
Analyzing I.P.T and I.F.C parameters determinated by spectrophotometry
showed a variation of them, their values beeing strongly correlated with climatic
conditions from those vineyards and with the grape variety used. Table 6
I.P.T, I.F.C values andchromaticparametersobtained forsamples analyzed.
Analyzed Wines
IPT (D280)
IFC
CieLab-76
Tristimulus Chrome (C)
Hue (H) Bright-ness
Shade
L (clarity)
a b
Fetească albă –Iaşi 2012
0.51 4.58 99.38 -0.312 2.508 2.527 -82.915 0.0490 4.010
Fetească albă-Târgu Bujor 2012
0.63 6.10 97.18 -0.114 8.657 8.658 -89.239 0.188 3.245
Fetească albă-Cotnari 2012
0.75 4.76 97.21 -0.147 7.419 7.419 -88.863 0.169 2.842
Busuioacă de Bohotin-Cotnari 2013
2,58 10.34 84.94 18.429 10.755 21.338 30.268 0.615 0.926
Busuioacă de Bohotin-Iaşi 2013
2,51 8.33 89.06 17.048 16.486 23.716 44.040 0.536 0.857
Therefore, the highet values of phenolic compounds for Fetească albă
wines prezented the one from Dealu Bujorului vineyard and for Busuioacă de
Bohotin wines the one from Cotnari vineyard.
210
After analyzing chromatic parameters it was found that Fetească albă wines
from Iaşi vineyard and Busuioacă de Bohotin wines from Cotnari vineyard had
the best colour features.
Parameter a, which represent the coordonate of the complementary colours
of red and green has frequently negative values for white wines that are dominant
green tones and pozitive values for red wines from which red tones are in
majority.
Parameter b, is the coordonate of the complementary colours of yellow and
blue; for wines, the values of this parameter are often pozitive, because yellow
shades prevail against the blue.
Chroma it is in correlation with parameter b, and the tone is in correlation
with parameter a, having the same variation tendencies.
Parameters a and b varies inversely proportional with clarity (L) beeing
strongly correlated with the content in phenolic compounds, therefore, Busuioacă
de Bohotin wine (2013) from Cotnari vineyard has the lowest value of clarity
(84.94) in comparison with Fetească albă wine from Iaşi vineyard (99.38).
CONCLUSIONS
Analyzing the wines taken in this study it was observed a major influence
of the pedoclimatic conditions of the each vineyard on their qualitative
characteristics.
Therefore, for Fetească albă wines, the wine with the best compositional
characteristics it is the one from Iasi vineyard and for Busuioacă de Bohotin
wines, the one from Cotnari vineyard.
REFERENCES
1. Cotea D.V. și colab., 2009 - Tratat de Oenochimie- vol.1, Editura Academiei Române, București.
2. Olteanu I., Daniela Chichi, Costea D.C., Mărăcineanu L.C., 2002 - Viticultură specială, Zonarea, Ampelografia, Tehnologii specifice. Editura Universitaria, Craiova, 473 p.
3. Van Leeuwen C., Seguin G., 2006 -The Concept of Terroir in Viticulture, Journal of Wine Research, vol. 17, No. 1, pp. 1–10.
4. Van Leeuwen.C., Friant P., Choné X., Tregoat O., Koundouras S., Dubordieu D., 2004-Influence of climate, soil, and cultivar on terroir, Am. J. Enol. Vitic. 55(3), pp. 207-217.
5. Watherhouse A. L., 2002- Polyphenolics: Determination of Total Phenolics: Current Protocols in Food Analytical Chemistry, Wroistad, R.E (Ed.) John Willey and Sons, Inc. New York, ISBN:0471325651, pp. 1-4.
6. OIV, 2011 - International Code of Oenological Practices, 2011 edition, Organisation International de la Vigne et du Vin, Paris.
211
USING GAS - CHROMATOGRAPHY TO DISTINGUISH THE WINE AND STILL FERMENTED BEVERAGES
UTILIZAREA GAZ-CROMATOGRAFIEI ÎN VEDEREA
DIFERENȚIERII VINURILOR ȘI BĂUTURILOR FERMENTATE LINIȘTIT
NECHITA C. B.
1, COTEA V.V.
1, NICULAUA M.
2,
e-mail: [email protected]
Abstract. For several years, in order to harmonize the Romanian legislation
with the European one, was introduced the notion of "still fermented
beverages". This is a beverage obtained by fermentation, but it is not
explanained what raw materials are used in the production process and their
contribution to the alcoholic strength of the final product. For this reason, some
manufacturers are tempted to sell such drinks as the wine. We conducted a
series of refermentation of pomace from red and white winemaking and volatile
compoundsfrom these drinks were analyzed by gas chromatography coupled
with mass spectrometry. The mass spectra of the compounds were compared
with the spectra from Wiley and other libraries. We made an identification of
volatile components comparing them with those identified in wine.
Key words: wine, fermented beverages, gas chromatography
Rezumat. De câțiva ani, în vederea armonizării legislației românești cu cea
europeană, a fost introdusă noțiunea de "băutură fermentată liniștit". Conform
definiției este o băutură obținută prin fermentare, dar nu există precizari din
punct de vedere al materiilor prime utilizate în procesul de producție și de
aportul acestora în concentrația alcoolică a produsului finit. Din acest motiv,
unii producători sunt tentați de a comercializa aceste băuturi sub numele de
vin. Pentru diferențierea acestora s-au efectuat o serie de refermentări ale
boștinei provenite din vinificația în alb și în roșu, iar compușii volatili din
aceste băuturi au fost analizați prin gaz-cromatografie cuplată cu
spectrometria de masă. Spectrele de masă ale compușilor au fost comparate cu
librăriile de spectre Willey și NIST. S-a efectuat o identificare a componenților
volatili și compararea lor cu cei identificați în vinuri.
Cuvinte cheie: vin, băuturi fermentate, gaz cromatografie
INTRODUCTION
Being an enjoyable beverage, wine enjoyed its fair share of attention from
people, either positively or negatively. The positive aspect has resulted in optimization of wine making technologies, focusing especially on storage conditions, maturation, stabilization and conditioning.
The negative aspect materialized in producing fake wines for money purposes. The authors Baxter et. al, 1997; Mihalca et al, 2002; Nămăloşanu et al, 2005;
Bulancea et al, 2009 present the most common used practices in faking wines, both
1University of Agricultural Sciences and Veterinary Medicine of Iasi, Romania 2 Oenological Research Center, Iasi Branch of the Romanian Academy, Iasi, Romania
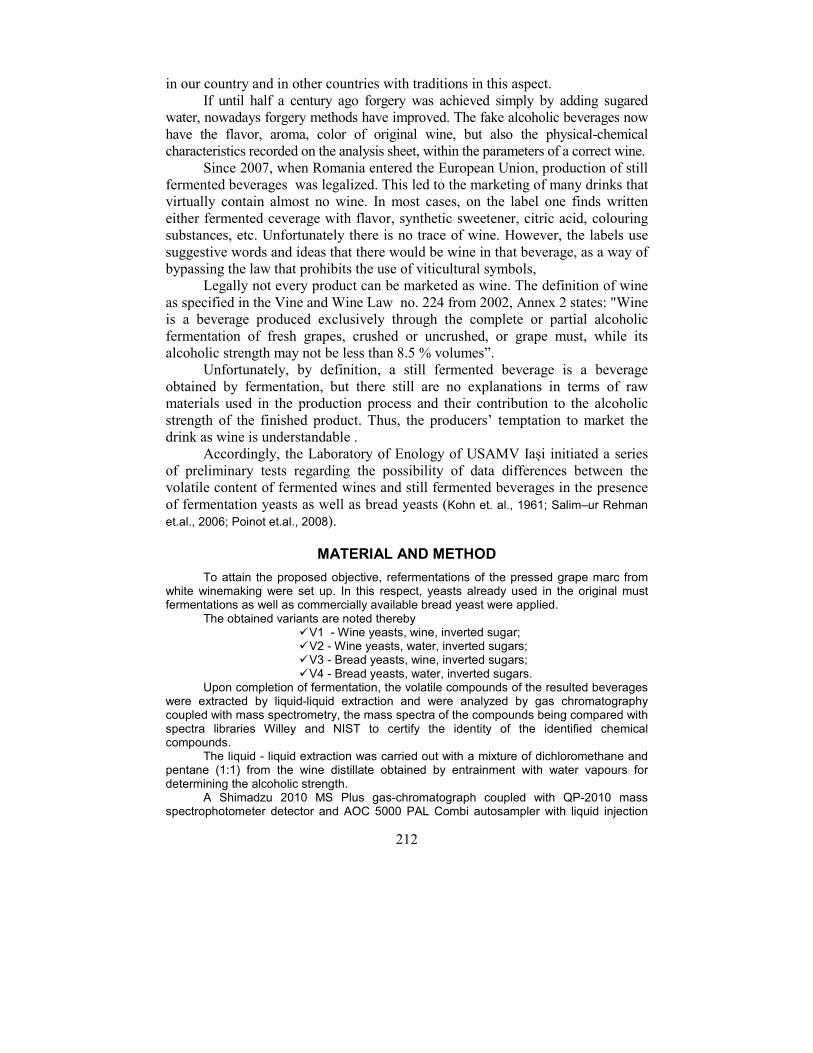
212
in our country and in other countries with traditions in this aspect.
If until half a century ago forgery was achieved simply by adding sugared water, nowadays forgery methods have improved. The fake alcoholic beverages now
have the flavor, aroma, color of original wine, but also the physical-chemical characteristics recorded on the analysis sheet, within the parameters of a correct wine.
Since 2007, when Romania entered the European Union, production of still fermented beverages was legalized. This led to the marketing of many drinks that virtually contain almost no wine. In most cases, on the label one finds written
either fermented ceverage with flavor, synthetic sweetener, citric acid, colouring substances, etc. Unfortunately there is no trace of wine. However, the labels use
suggestive words and ideas that there would be wine in that beverage, as a way of bypassing the law that prohibits the use of viticultural symbols,
Legally not every product can be marketed as wine. The definition of wine
as specified in the Vine and Wine Law no. 224 from 2002, Annex 2 states: "Wine is a beverage produced exclusively through the complete or partial alcoholic
fermentation of fresh grapes, crushed or uncrushed, or grape must, while its alcoholic strength may not be less than 8.5 % volumes”.
Unfortunately, by definition, a still fermented beverage is a beverage
obtained by fermentation, but there still are no explanations in terms of raw materials used in the production process and their contribution to the alcoholic
strength of the finished product. Thus, the producers’ temptation to market the drink as wine is understandable .
Accordingly, the Laboratory of Enology of USAMV Iași initiated a series
of preliminary tests regarding the possibility of data differences between the volatile content of fermented wines and still fermented beverages in the presence
of fermentation yeasts as well as bread yeasts (Kohn et. al., 1961; Salim–ur Rehman
et.al., 2006; Poinot et.al., 2008).
MATERIAL AND METHOD
To attain the proposed objective, refermentations of the pressed grape marc from white winemaking were set up. In this respect, yeasts already used in the original must fermentations as well as commercially available bread yeast were applied.
The obtained variants are noted thereby � V1 - Wine yeasts, wine, inverted sugar; � V2 - Wine yeasts, water, inverted sugars; � V3 - Bread yeasts, wine, inverted sugars; � V4 - Bread yeasts, water, inverted sugars.
Upon completion of fermentation, the volatile compounds of the resulted beverages were extracted by liquid-liquid extraction and were analyzed by gas chromatography coupled with mass spectrometry, the mass spectra of the compounds being compared with spectra libraries Willey and NIST to certify the identity of the identified chemical compounds.
The liquid - liquid extraction was carried out with a mixture of dichloromethane and pentane (1:1) from the wine distillate obtained by entrainment with water vapours for determining the alcoholic strength.
A Shimadzu 2010 MS Plus gas-chromatograph coupled with QP-2010 mass spectrophotometer detector and AOC 5000 PAL Combi autosampler with liquid injection
213
system was used for separation and identification of the volatile compounds. The column used was formed from two connected columns. First column was AT-
Wax from Alltech-Grace – polar (lenght 30 m, diameter 0,25 mm, film thickness 0,25 µm) and second was SolGel mS from SGE – non-polar (lenght 60 m, diameter 0,25 mm, film thickness 0,25 µm).
The GC conditions were as follows: injection temperature 250°C; oven: initial temperature 35°C, equilibration time 5 minutes, temperature program 2 °C/minute up to 100°C, equilibration time 15 minutes, temperature program 3 °C/minute up to 150°C, equilibration time 15 minutes, temperature program 4 °C/minute up to 200°C, equilibration time 15 minutes, temperature program 4 °C/minute up to 220°C, equilibration time 60 minutes; flow controller: splitless. MS and qualitative parameters were as follows: EI acquisition: 0.85 kV, mass range 50-300 m/z, in order to be able to confirm the identified heavy compounds.
RESULTS AND DISCUSSION
Identification of volatile compounds in the four variants of beverages was based on chromatograms. A compound was considered identified if the probability indicated by the software was higher than 90%, and the confirmation
of the compound’s identity was made by AMDIS software, provided by NIST library.
As it is registered, and as it was expected, in the case of variants V3 and V4, where bread yeasts were used, a lower number of compounds were identified than in the variants where selected yeasts for winemaking were used. Also, the
intensity of the signals in the chromatogram was much lower in the variants with bread yeast.
In the variants V2 and V4, where bread yeast, water and sugar were used, the number of identified compounds was lower than the variants where water was
replaced with wine. The identified compounds have been divided into classes for ease of
analysis. Their quantification was performed by using the area percentage of each
compound (Tables 1, 2, 3 and 4). The alcohols composition of the samples, Table 1 proves the fact that the
refermented wines, regardless of the yeast type (V1 and V3) will ultimately lead to the production of a wider range of alcohols, in contrast to the variants in which only fermentation of yeast bread with water and sugar occurred.
Among these, 3-methyl-1-butanol and 2-methyl-1-butanol are identified, as alcohols that appear always during fermentations. Benzylic alcohol was identified
only in the case of fermentations with bread yeast, while leaf alcohol (3-hexen-1-ol) was recorded only in the case of refermented wines. This aspect can lead to finding a first difference between refermented wines and fermenting a mixture of
yeasts, water and glucose/fructose. Analysing the acid composition (table 2) of the studied samples, one
registers the major component represented by acetic acid in the case of fermented mixture of water and glucides (V2 and V4) while in the case of refermented wines, this acid is barely detectable.
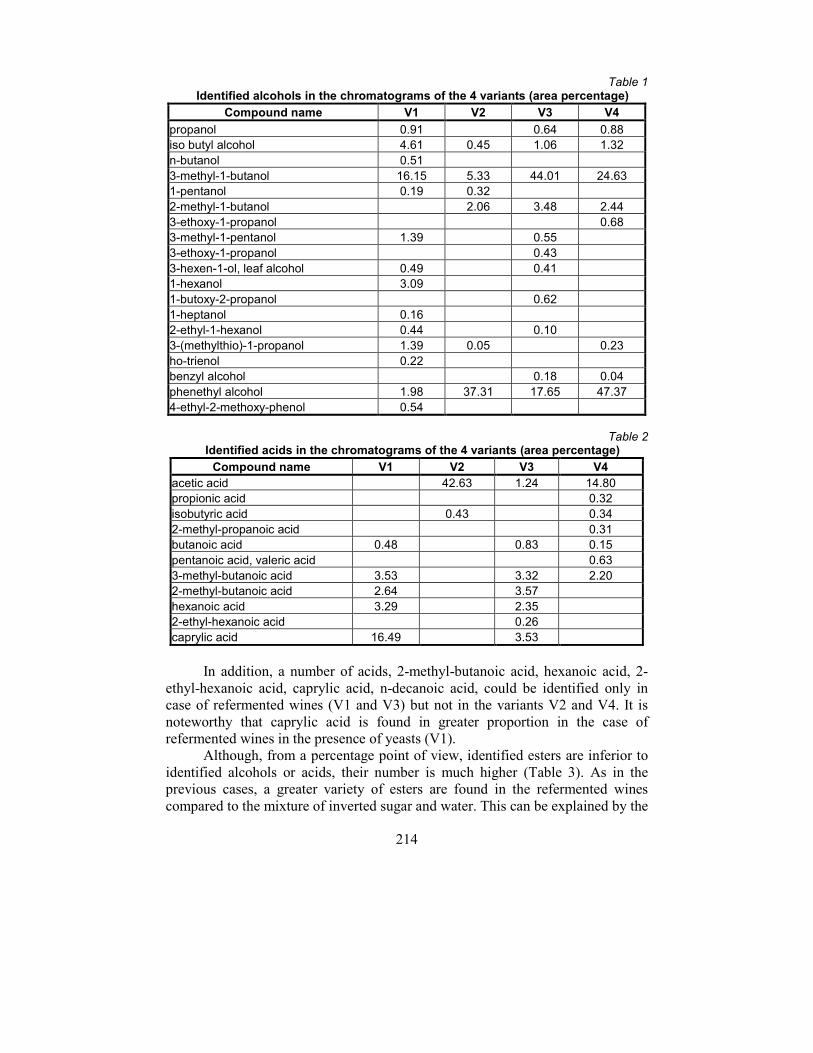
214
Table 1 Identified alcohols in the chromatograms of the 4 variants (area percentage)
Compound name V1 V2 V3 V4
propanol 0.91 0.64 0.88
iso butyl alcohol 4.61 0.45 1.06 1.32
n-butanol 0.51
3-methyl-1-butanol 16.15 5.33 44.01 24.63
1-pentanol 0.19 0.32
2-methyl-1-butanol 2.06 3.48 2.44
3-ethoxy-1-propanol 0.68
3-methyl-1-pentanol 1.39 0.55
3-ethoxy-1-propanol 0.43
3-hexen-1-ol, leaf alcohol 0.49 0.41
1-hexanol 3.09
1-butoxy-2-propanol 0.62
1-heptanol 0.16
2-ethyl-1-hexanol 0.44 0.10
3-(methylthio)-1-propanol 1.39 0.05 0.23
ho-trienol 0.22
benzyl alcohol 0.18 0.04
phenethyl alcohol 1.98 37.31 17.65 47.37
4-ethyl-2-methoxy-phenol 0.54
Table 2
Identified acids in the chromatograms of the 4 variants (area percentage)
Compound name V1 V2 V3 V4
acetic acid 42.63 1.24 14.80
propionic acid 0.32
isobutyric acid 0.43 0.34
2-methyl-propanoic acid 0.31
butanoic acid 0.48 0.83 0.15
pentanoic acid, valeric acid 0.63
3-methyl-butanoic acid 3.53 3.32 2.20
2-methyl-butanoic acid 2.64 3.57
hexanoic acid 3.29 2.35
2-ethyl-hexanoic acid 0.26
caprylic acid 16.49 3.53
In addition, a number of acids, 2-methyl-butanoic acid, hexanoic acid, 2-
ethyl-hexanoic acid, caprylic acid, n-decanoic acid, could be identified only in case of refermented wines (V1 and V3) but not in the variants V2 and V4. It is
noteworthy that caprylic acid is found in greater proportion in the case of refermented wines in the presence of yeasts (V1).
Although, from a percentage point of view, identified esters are inferior to
identified alcohols or acids, their number is much higher (Table 3). As in the previous cases, a greater variety of esters are found in the refermented wines
compared to the mixture of inverted sugar and water. This can be explained by the
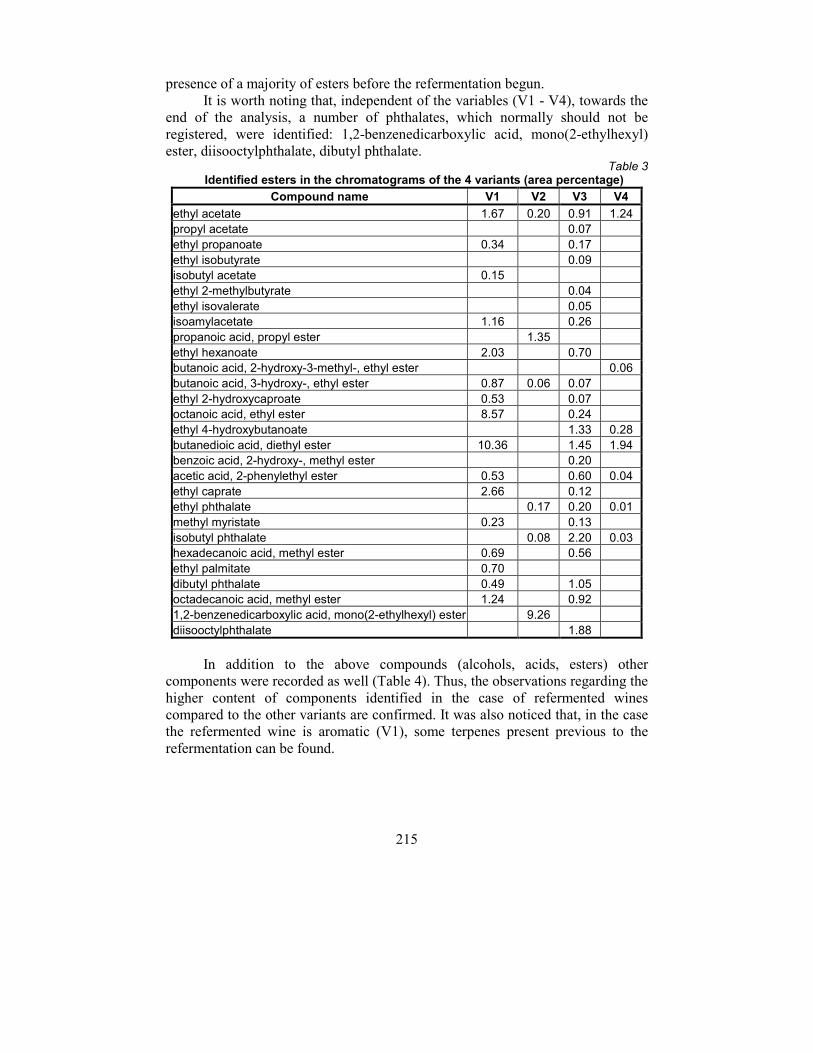
215
presence of a majority of esters before the refermentation begun.
It is worth noting that, independent of the variables (V1 - V4), towards the end of the analysis, a number of phthalates, which normally should not be
registered, were identified: 1,2-benzenedicarboxylic acid, mono(2-ethylhexyl) ester, diisooctylphthalate, dibutyl phthalate.
Table 3 Identified esters in the chromatograms of the 4 variants (area percentage)
Compound name V1 V2 V3 V4
ethyl acetate 1.67 0.20 0.91 1.24
propyl acetate 0.07
ethyl propanoate 0.34 0.17
ethyl isobutyrate 0.09
isobutyl acetate 0.15
ethyl 2-methylbutyrate 0.04
ethyl isovalerate 0.05
isoamylacetate 1.16 0.26
propanoic acid, propyl ester 1.35
ethyl hexanoate 2.03 0.70
butanoic acid, 2-hydroxy-3-methyl-, ethyl ester 0.06
butanoic acid, 3-hydroxy-, ethyl ester 0.87 0.06 0.07
ethyl 2-hydroxycaproate 0.53 0.07
octanoic acid, ethyl ester 8.57 0.24
ethyl 4-hydroxybutanoate 1.33 0.28
butanedioic acid, diethyl ester 10.36 1.45 1.94
benzoic acid, 2-hydroxy-, methyl ester 0.20
acetic acid, 2-phenylethyl ester 0.53 0.60 0.04
ethyl caprate 2.66 0.12
ethyl phthalate 0.17 0.20 0.01
methyl myristate 0.23 0.13
isobutyl phthalate 0.08 2.20 0.03
hexadecanoic acid, methyl ester 0.69 0.56
ethyl palmitate 0.70
dibutyl phthalate 0.49 1.05
octadecanoic acid, methyl ester 1.24 0.92
1,2-benzenedicarboxylic acid, mono(2-ethylhexyl) ester 9.26
diisooctylphthalate 1.88
In addition to the above compounds (alcohols, acids, esters) other components were recorded as well (Table 4). Thus, the observations regarding the
higher content of components identified in the case of refermented wines compared to the other variants are confirmed. It was also noticed that, in the case the refermented wine is aromatic (V1), some terpenes present previous to the
refermentation can be found.
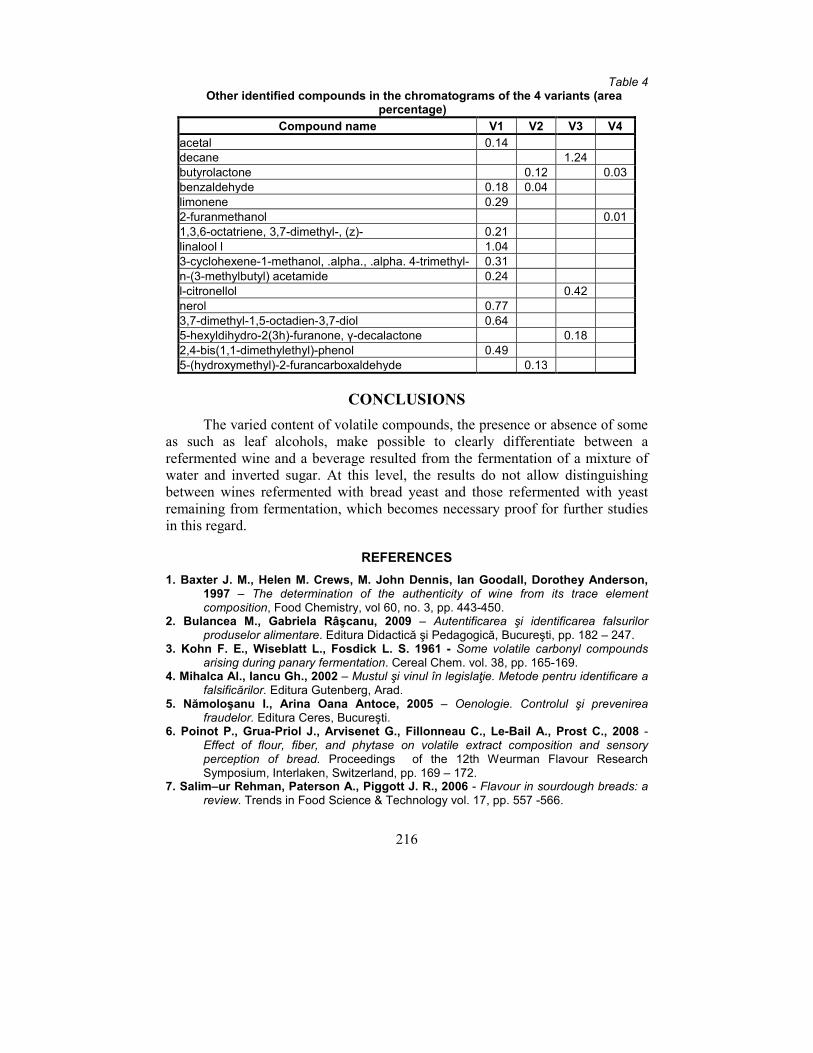
216
Table 4 Other identified compounds in the chromatograms of the 4 variants (area
percentage)
Compound name V1 V2 V3 V4
acetal 0.14
decane 1.24
butyrolactone 0.12 0.03
benzaldehyde 0.18 0.04
limonene 0.29
2-furanmethanol 0.01
1,3,6-octatriene, 3,7-dimethyl-, (z)- 0.21
linalool l 1.04
3-cyclohexene-1-methanol, .alpha., .alpha. 4-trimethyl- 0.31
n-(3-methylbutyl) acetamide 0.24
l-citronellol 0.42
nerol 0.77
3,7-dimethyl-1,5-octadien-3,7-diol 0.64
5-hexyldihydro-2(3h)-furanone, γ-decalactone 0.18
2,4-bis(1,1-dimethylethyl)-phenol 0.49
5-(hydroxymethyl)-2-furancarboxaldehyde 0.13
CONCLUSIONS
The varied content of volatile compounds, the presence or absence of some as such as leaf alcohols, make possible to clearly differentiate between a
refermented wine and a beverage resulted from the fermentation of a mixture of water and inverted sugar. At this level, the results do not allow distinguishing between wines refermented with bread yeast and those refermented with yeast
remaining from fermentation, which becomes necessary proof for further studies in this regard.
REFERENCES
1. Baxter J. M., Helen M. Crews, M. John Dennis, Ian Goodall, Dorothey Anderson, 1997 – The determination of the authenticity of wine from its trace element composition, Food Chemistry, vol 60, no. 3, pp. 443-450.
2. Bulancea M., Gabriela Râşcanu, 2009 – Autentificarea şi identificarea falsurilor produselor alimentare. Editura Didactică şi Pedagogică, Bucureşti, pp. 182 – 247.
3. Kohn F. E., Wiseblatt L., Fosdick L. S. 1961 - Some volatile carbonyl compounds arising during panary fermentation. Cereal Chem. vol. 38, pp. 165-169.
4. Mihalca Al., Iancu Gh., 2002 – Mustul şi vinul în legislaţie. Metode pentru identificare a falsificărilor. Editura Gutenberg, Arad.
5. Nămoloşanu I., Arina Oana Antoce, 2005 – Oenologie. Controlul şi prevenirea fraudelor. Editura Ceres, Bucureşti.
6. Poinot P., Grua-Priol J., Arvisenet G., Fillonneau C., Le-Bail A., Prost C., 2008 - Effect of flour, fiber, and phytase on volatile extract composition and sensory perception of bread. Proceedings of the 12th Weurman Flavour Research Symposium, Interlaken, Switzerland, pp. 169 – 172.
7. Salim–ur Rehman, Paterson A., Piggott J. R., 2006 - Flavour in sourdough breads: a review. Trends in Food Science & Technology vol. 17, pp. 557 -566.
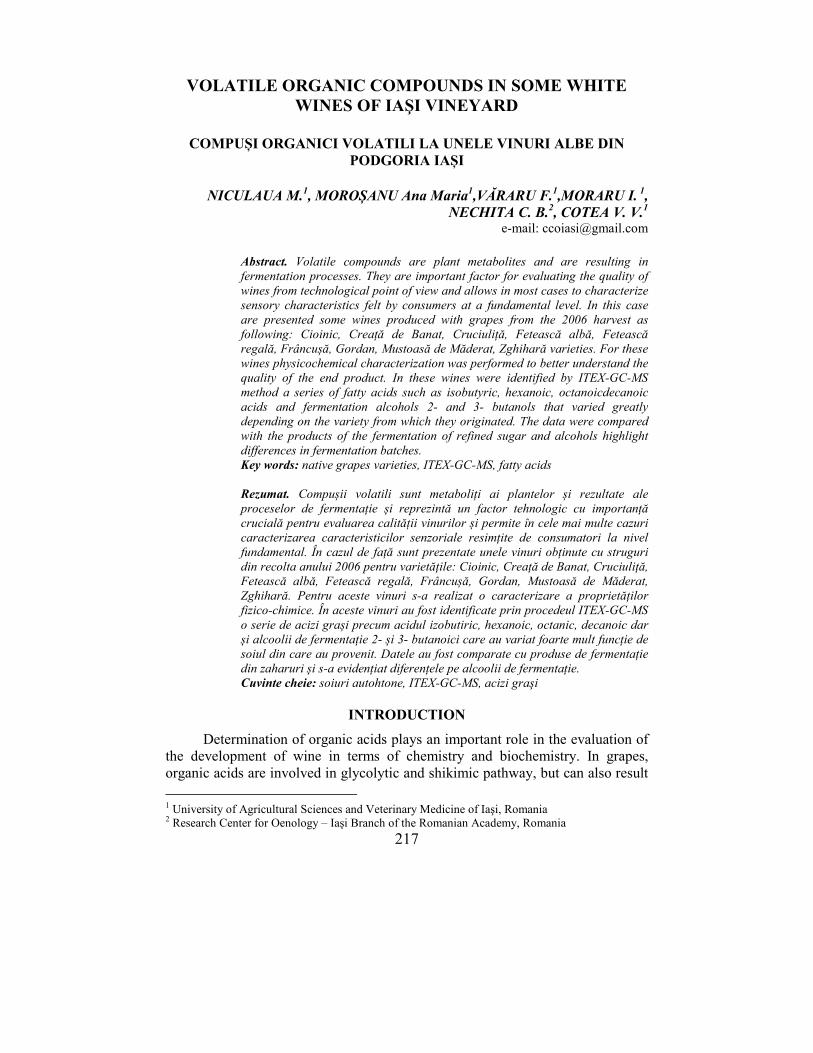
217
VOLATILE ORGANIC COMPOUNDS IN SOME WHITE
WINES OF IAŞI VINEYARD
COMPUȘI ORGANICI VOLATILI LA UNELE VINURI ALBE DIN
PODGORIA IAȘI
NICULAUA M.1, MOROȘANU Ana Maria1,VĂRARU F.1,MORARU I. 1,
NECHITA C. B.2, COTEA V. V.1 e-mail: [email protected]
Abstract. Volatile compounds are plant metabolites and are resulting in fermentation processes. They are important factor for evaluating the quality of wines from technological point of view and allows in most cases to characterize sensory characteristics felt by consumers at a fundamental level. In this case are presented some wines produced with grapes from the 2006 harvest as following: Cioinic, Creață de Banat, Cruciuliță, Fetească albă, Fetească regală, Frâncușă, Gordan, Mustoasă de Măderat, Zghihară varieties. For these wines physicochemical characterization was performed to better understand the quality of the end product. In these wines were identified by ITEX-GC-MS method a series of fatty acids such as isobutyric, hexanoic, octanoicdecanoic acids and fermentation alcohols 2- and 3- butanols that varied greatly depending on the variety from which they originated. The data were compared with the products of the fermentation of refined sugar and alcohols highlight differences in fermentation batches. Key words: native grapes varieties, ITEX-GC-MS, fatty acids Rezumat. Compușii volatili sunt metaboliți ai plantelor și rezultate ale proceselor de fermentație și reprezintă un factor tehnologic cu importanță crucială pentru evaluarea calității vinurilor și permite în cele mai multe cazuri caracterizarea caracteristicilor senzoriale resimțite de consumatori la nivel fundamental. În cazul de față sunt prezentate unele vinuri obținute cu struguri din recolta anului 2006 pentru varietățile: Cioinic, Creață de Banat, Cruciuliță, Fetească albă, Fetească regală, Frâncușă, Gordan, Mustoasă de Măderat, Zghihară. Pentru aceste vinuri s-a realizat o caracterizare a proprietăților fizico-chimice. În aceste vinuri au fost identificate prin procedeul ITEX-GC-MS o serie de acizi grași precum acidul izobutiric, hexanoic, octanic, decanoic dar și alcoolii de fermentație 2- și 3- butanoici care au variat foarte mult funcție de soiul din care au provenit. Datele au fost comparate cu produse de fermentație din zaharuri și s-a evidențiat diferențele pe alcoolii de fermentație. Cuvinte cheie: soiuri autohtone, ITEX-GC-MS, acizi graşi
INTRODUCTION
Determination of organic acids plays an important role in the evaluation of the development of wine in terms of chemistry and biochemistry. In grapes,
organic acids are involved in glycolytic and shikimic pathway, but can also result
1 University of Agricultural Sciences and Veterinary Medicine of Iaşi, Romania 2 Research Center for Oenology – Iaşi Branch of the Romanian Academy, Romania
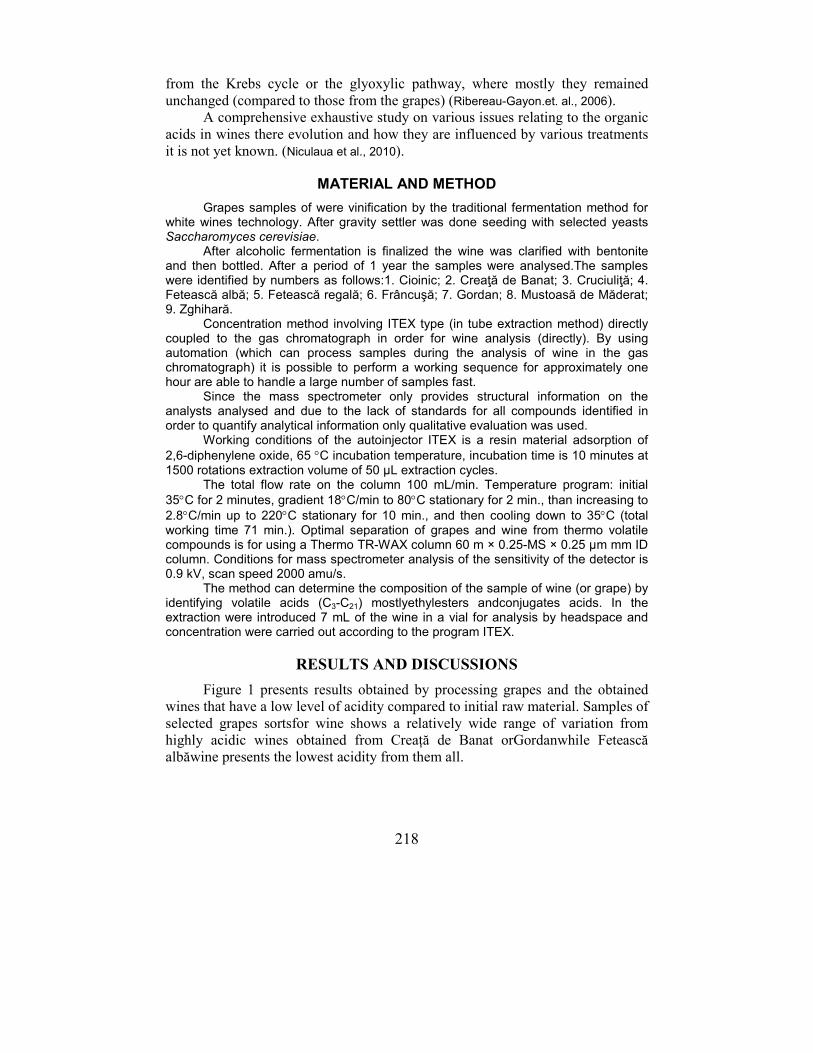
218
from the Krebs cycle or the glyoxylic pathway, where mostly they remained
unchanged (compared to those from the grapes) (Ribereau-Gayon.et. al., 2006). A comprehensive exhaustive study on various issues relating to the organic
acids in wines there evolution and how they are influenced by various treatments it is not yet known. (Niculaua et al., 2010).
MATERIAL AND METHOD
Grapes samples of were vinification by the traditional fermentation method for white wines technology. After gravity settler was done seeding with selected yeasts Saccharomyces cerevisiae.
After alcoholic fermentation is finalized the wine was clarified with bentonite and then bottled. After a period of 1 year the samples were analysed.The samples were identified by numbers as follows:1. Cioinic; 2. Creaţă de Banat; 3. Cruciuliţă; 4. Fetească albă; 5. Fetească regală; 6. Frâncuşă; 7. Gordan; 8. Mustoasă de Măderat; 9. Zghihară.
Concentration method involving ITEX type (in tube extraction method) directly coupled to the gas chromatograph in order for wine analysis (directly). By using automation (which can process samples during the analysis of wine in the gas chromatograph) it is possible to perform a working sequence for approximately one hour are able to handle a large number of samples fast.
Since the mass spectrometer only provides structural information on the analysts analysed and due to the lack of standards for all compounds identified in order to quantify analytical information only qualitative evaluation was used.
Working conditions of the autoinjector ITEX is a resin material adsorption of
2,6-diphenylene oxide, 65 °C incubation temperature, incubation time is 10 minutes at 1500 rotations extraction volume of 50 µL extraction cycles.
The total flow rate on the column 100 mL/min. Temperature program: initial
35°C for 2 minutes, gradient 18°C/min to 80°C stationary for 2 min., than increasing to
2.8°C/min up to 220°C stationary for 10 min., and then cooling down to 35°C (total working time 71 min.). Optimal separation of grapes and wine from thermo volatile compounds is for using a Thermo TR-WAX column 60 m × 0.25-MS × 0.25 µm mm ID column. Conditions for mass spectrometer analysis of the sensitivity of the detector is 0.9 kV, scan speed 2000 amu/s.
The method can determine the composition of the sample of wine (or grape) by identifying volatile acids (C3-C21) mostlyethylesters andconjugates acids. In the extraction were introduced 7 mL of the wine in a vial for analysis by headspace and concentration were carried out according to the program ITEX.
RESULTS AND DISCUSSIONS
Figure 1 presents results obtained by processing grapes and the obtained wines that have a low level of acidity compared to initial raw material. Samples of
selected grapes sortsfor wine shows a relatively wide range of variation from highly acidic wines obtained from Creață de Banat orGordanwhile Fetească albăwine presents the lowest acidity from them all.
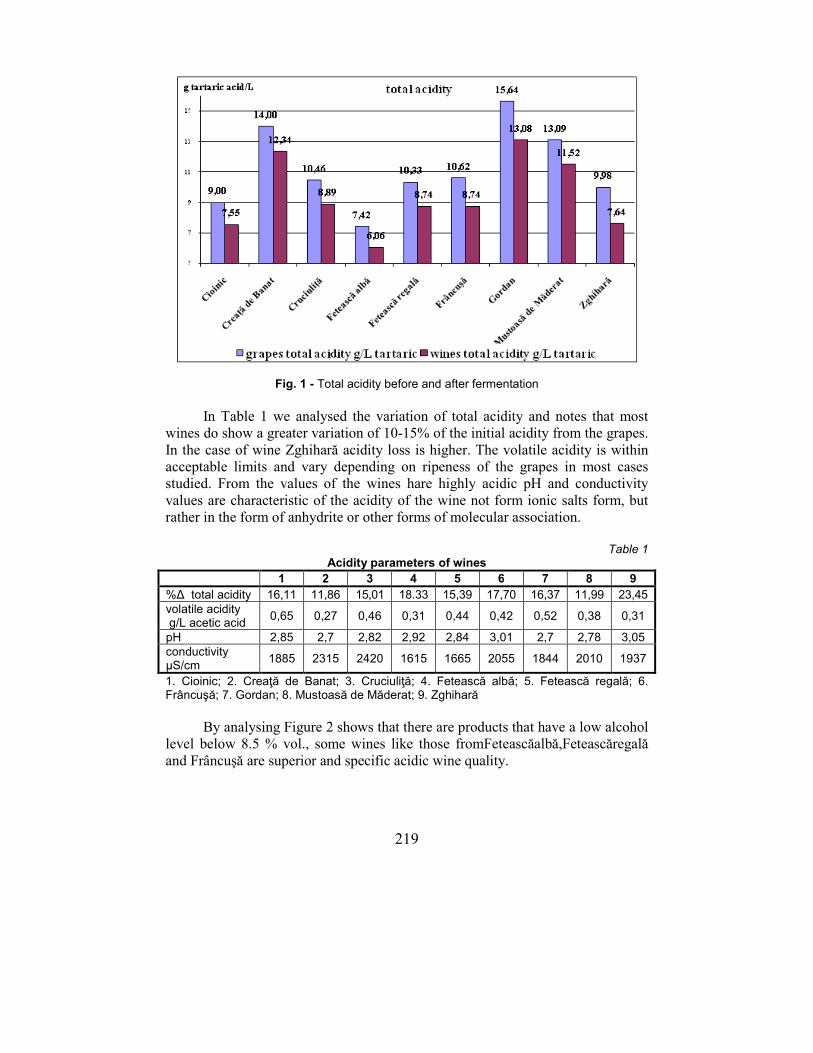
219
Fig. 1 - Total acidity before and after fermentation
In Table 1 we analysed the variation of total acidity and notes that most wines do show a greater variation of 10-15% of the initial acidity from the grapes.
In the case of wine Zghihară acidity loss is higher. The volatile acidity is within acceptable limits and vary depending on ripeness of the grapes in most cases studied. From the values of the wines hare highly acidic pH and conductivity
values are characteristic of the acidity of the wine not form ionic salts form, but rather in the form of anhydrite or other forms of molecular association.
Table 1
Acidity parameters of wines
1 2 3 4 5 6 7 8 9
%∆ total acidity 16,11 11,86 15,01 18.33 15,39 17,70 16,37 11,99 23,45
volatile acidity g/L acetic acid
0,65 0,27 0,46 0,31 0,44 0,42 0,52 0,38 0,31
pH 2,85 2,7 2,82 2,92 2,84 3,01 2,7 2,78 3,05
conductivity µS/cm
1885 2315 2420 1615 1665 2055 1844 2010 1937
1. Cioinic; 2. Creaţă de Banat; 3. Cruciuliţă; 4. Fetească albă; 5. Fetească regală; 6. Frâncuşă; 7. Gordan; 8. Mustoasă de Măderat; 9. Zghihară
By analysing Figure 2 shows that there are products that have a low alcohol
level below 8.5 % vol., some wines like those fromFeteascăalbă,Feteascăregală
and Frâncuşă are superior and specific acidic wine quality.
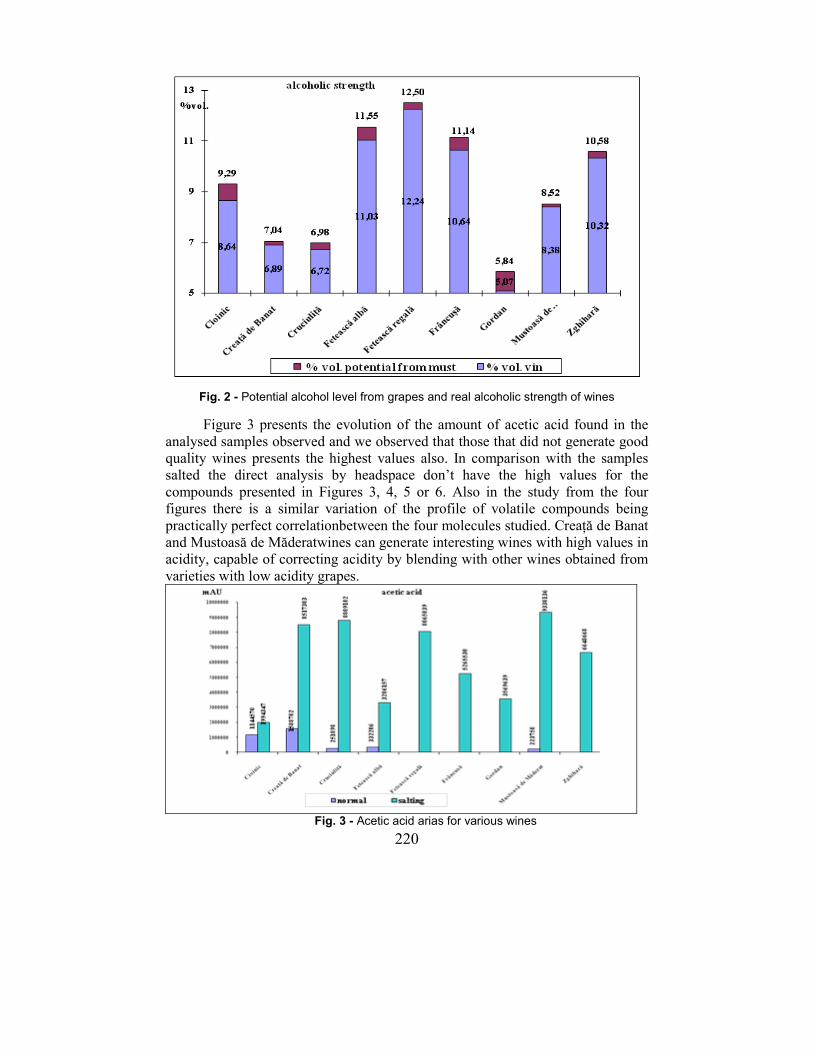
220
Fig. 2 - Potential alcohol level from grapes and real alcoholic strength of wines
Figure 3 presents the evolution of the amount of acetic acid found in the
analysed samples observed and we observed that those that did not generate good quality wines presents the highest values also. In comparison with the samples salted the direct analysis by headspace don’t have the high values for the
compounds presented in Figures 3, 4, 5 or 6. Also in the study from the four figures there is a similar variation of the profile of volatile compounds being
practically perfect correlationbetween the four molecules studied. Creață de Banat and Mustoasă de Măderatwines can generate interesting wines with high values in acidity, capable of correcting acidity by blending with other wines obtained from
varieties with low acidity grapes.
Fig. 3 - Acetic acid arias for various wines
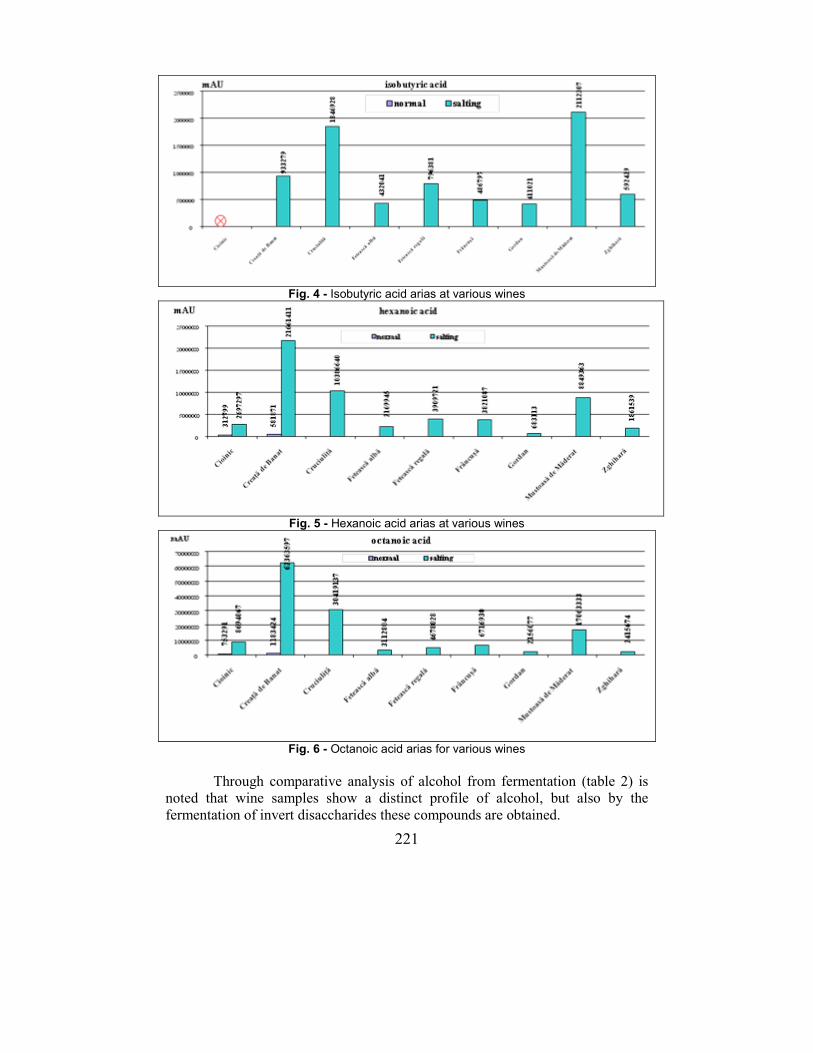
221
Fig. 4 - Isobutyric acid arias at various wines
Fig. 5 - Hexanoic acid arias at various wines
Fig. 6 - Octanoic acid arias for various wines
Through comparative analysis of alcohol from fermentation (table 2) is noted that wine samples show a distinct profile of alcohol, but also by the
fermentation of invert disaccharides these compounds are obtained.
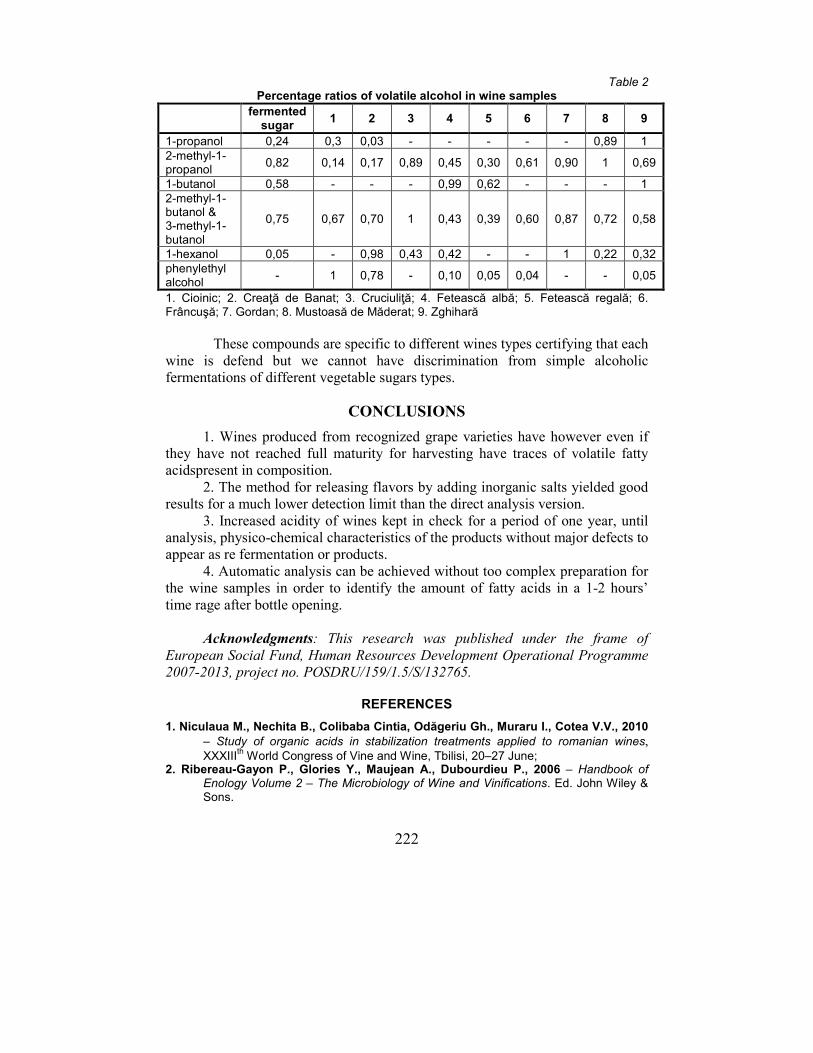
222
Table 2 Percentage ratios of volatile alcohol in wine samples
fermented sugar
1 2 3 4 5 6 7 8 9
1-propanol 0,24 0,3 0,03 - - - - - 0,89 1
2-methyl-1-propanol
0,82 0,14 0,17 0,89 0,45 0,30 0,61 0,90 1 0,69
1-butanol 0,58 - - - 0,99 0,62 - - - 1
2-methyl-1-butanol & 3-methyl-1-butanol
0,75 0,67 0,70 1 0,43 0,39 0,60 0,87 0,72 0,58
1-hexanol 0,05 - 0,98 0,43 0,42 - - 1 0,22 0,32
phenylethyl alcohol
- 1 0,78 - 0,10 0,05 0,04 - - 0,05
1. Cioinic; 2. Creaţă de Banat; 3. Cruciuliţă; 4. Fetească albă; 5. Fetească regală; 6. Frâncuşă; 7. Gordan; 8. Mustoasă de Măderat; 9. Zghihară
These compounds are specific to different wines types certifying that each
wine is defend but we cannot have discrimination from simple alcoholic fermentations of different vegetable sugars types.
CONCLUSIONS
1. Wines produced from recognized grape varieties have however even if they have not reached full maturity for harvesting have traces of volatile fatty acidspresent in composition.
2. The method for releasing flavors by adding inorganic salts yielded good results for a much lower detection limit than the direct analysis version.
3. Increased acidity of wines kept in check for a period of one year, until analysis, physico-chemical characteristics of the products without major defects to appear as re fermentation or products.
4. Automatic analysis can be achieved without too complex preparation for the wine samples in order to identify the amount of fatty acids in a 1-2 hours’
time rage after bottle opening. Acknowledgments: This research was published under the frame of
European Social Fund, Human Resources Development Operational Programme 2007-2013, project no. POSDRU/159/1.5/S/132765.
REFERENCES
1. Niculaua M., Nechita B., Colibaba Cintia, Odăgeriu Gh., Muraru I., Cotea V.V., 2010
– Study of organic acids in stabilization treatments applied to romanian wines, XXXIII
th World Congress of Vine and Wine, Tbilisi, 20–27 June;
2. Ribereau-Gayon P., Glories Y., Maujean A., Dubourdieu P., 2006 – Handbook of Enology Volume 2 – The Microbiology of Wine and Vinifications. Ed. John Wiley & Sons.
223
RESEARCHES ON LANDSCAPE PLANNING OF GREEN SPACE IN THE ARAD COUNTY HOSPITAL
CERCETĂRI PRIVIND AMENAJAREA PEISAGERĂ A SPAȚIULUI
VERDE DIN CADRUL SPITALULUI CLINIC JUDEȚEAN ARAD
BERAR C.1, LISANDRU Tabita-Teodora1, SILIVĂȘAN M1., BĂLA Maria1, TOȚA Cristina1
e-mail: [email protected]
Abstract: In the planning proposal for green space in the Arad County Hospital left the idea of creating an environment specifically designed to provide favorable conditions for the recovery of health and recovery of people in distress. Elements were used to give patients a state of putting the fore chosen vegetation and its effects on people. Plants create an environment of welfare reducing blood pressure, stress and giving a general state of good health physically and mentally. This was done by choosing vegetation for the effects it has on the environment and on people. Species were used for air filtration and solar radiation. The arrangement was based on the ability of the hospital to receive a large mass of people. Resting places are in high numbers, the spread over the entire surface and paths linking all hospital bodies. Key words: landscape planning, trees, hospital, Arad Rezumat: În propunerea de amenajare peisageră a spațiului verde din cadrul Spitalului Clinic Judeţean Arad s-a plecat de la ideea creării unui mediu special conceput pentru asigurarea condiţiilor prielnice de refacere a sănătăţii şi de recuperare a oamenilor aflaţi în suferinţă. Au fost folosite elemente care să le dea pacienţilor o stare de bine, punând în prim plan vegetaţia aleasă şi efectele acesteia asupra oamenilor. Plantele crează un mediu de bunăstare reducând tensiunea arterială, stresul şi dând o stare generală de sănatate bună fizică şi psihică. Acest lucru s-a făcut prin alegerea vegetaţiei în funcţie de efectele pe care le are asupra mediului şi asupra oamenilor. S-au folosit specii pentru filtrarea aerului și împotriva radiaţiei solare. Amenajarea s-a făcut în funcţie de capacitatea spitalului, pentru a primi o masă mare de oameni. Locurile pentru odihnă sunt în număr ridicat, fiind răspândite pe întreaga suprafaţă, iar aleile fac legătură între toate corpurile spitalului. Cuvinte cheie: amenajare peisageră, arbori, spital, Arad
INTRODUCTION
The Arad County Hospital covers a surface of 40,805 m2 and is one of a
kind in the entire county, with a 700 bed capacity. The hospital may take over about 2000 consults/day. Of the 40,805m2, approximately 12,000 m2 represent
green space. The largest share of the surface is situated in front of the hospital and covers about 11,700 m2 of the entire surface, regarded by the landscape planning proposition.
1 Banat University of Agricultural Sciences and Veterinary Medicine of Timişoara, Romania
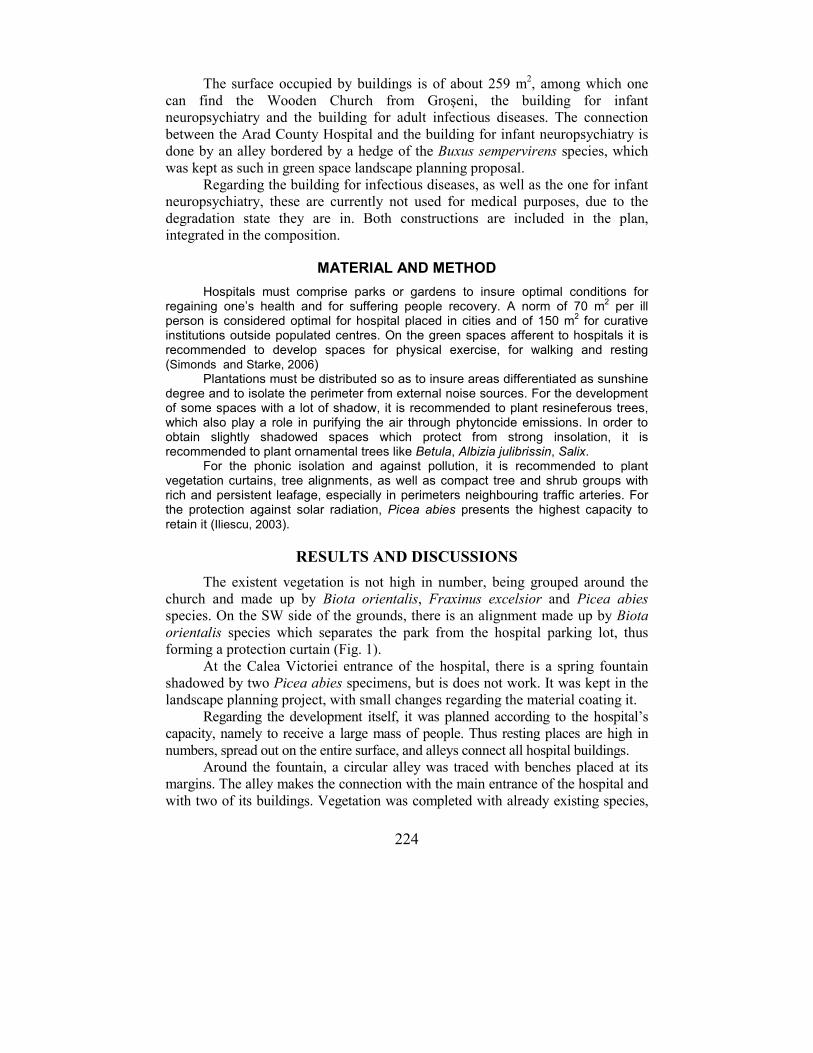
224
The surface occupied by buildings is of about 259 m2, among which one
can find the Wooden Church from Groșeni, the building for infant neuropsychiatry and the building for adult infectious diseases. The connection
between the Arad County Hospital and the building for infant neuropsychiatry is done by an alley bordered by a hedge of the Buxus sempervirens species, which
was kept as such in green space landscape planning proposal. Regarding the building for infectious diseases, as well as the one for infant neuropsychiatry, these are currently not used for medical purposes, due to the
degradation state they are in. Both constructions are included in the plan, integrated in the composition.
MATERIAL AND METHOD
Hospitals must comprise parks or gardens to insure optimal conditions for regaining one’s health and for suffering people recovery. A norm of 70 m
2 per ill
person is considered optimal for hospital placed in cities and of 150 m2 for curative
institutions outside populated centres. On the green spaces afferent to hospitals it is recommended to develop spaces for physical exercise, for walking and resting (Simonds and Starke, 2006) Plantations must be distributed so as to insure areas differentiated as sunshine degree and to isolate the perimeter from external noise sources. For the development of some spaces with a lot of shadow, it is recommended to plant resineferous trees, which also play a role in purifying the air through phytoncide emissions. In order to obtain slightly shadowed spaces which protect from strong insolation, it is recommended to plant ornamental trees like Betula, Albizia julibrissin, Salix. For the phonic isolation and against pollution, it is recommended to plant vegetation curtains, tree alignments, as well as compact tree and shrub groups with rich and persistent leafage, especially in perimeters neighbouring traffic arteries. For the protection against solar radiation, Picea abies presents the highest capacity to retain it (Iliescu, 2003).
RESULTS AND DISCUSSIONS
The existent vegetation is not high in number, being grouped around the church and made up by Biota orientalis, Fraxinus excelsior and Picea abies species. On the SW side of the grounds, there is an alignment made up by Biota orientalis species which separates the park from the hospital parking lot, thus forming a protection curtain (Fig. 1).
At the Calea Victoriei entrance of the hospital, there is a spring fountain shadowed by two Picea abies specimens, but is does not work. It was kept in the landscape planning project, with small changes regarding the material coating it.
Regarding the development itself, it was planned according to the hospital’s capacity, namely to receive a large mass of people. Thus resting places are high in
numbers, spread out on the entire surface, and alleys connect all hospital buildings. Around the fountain, a circular alley was traced with benches placed at its margins. The alley makes the connection with the main entrance of the hospital and
with two of its buildings. Vegetation was completed with already existing species,
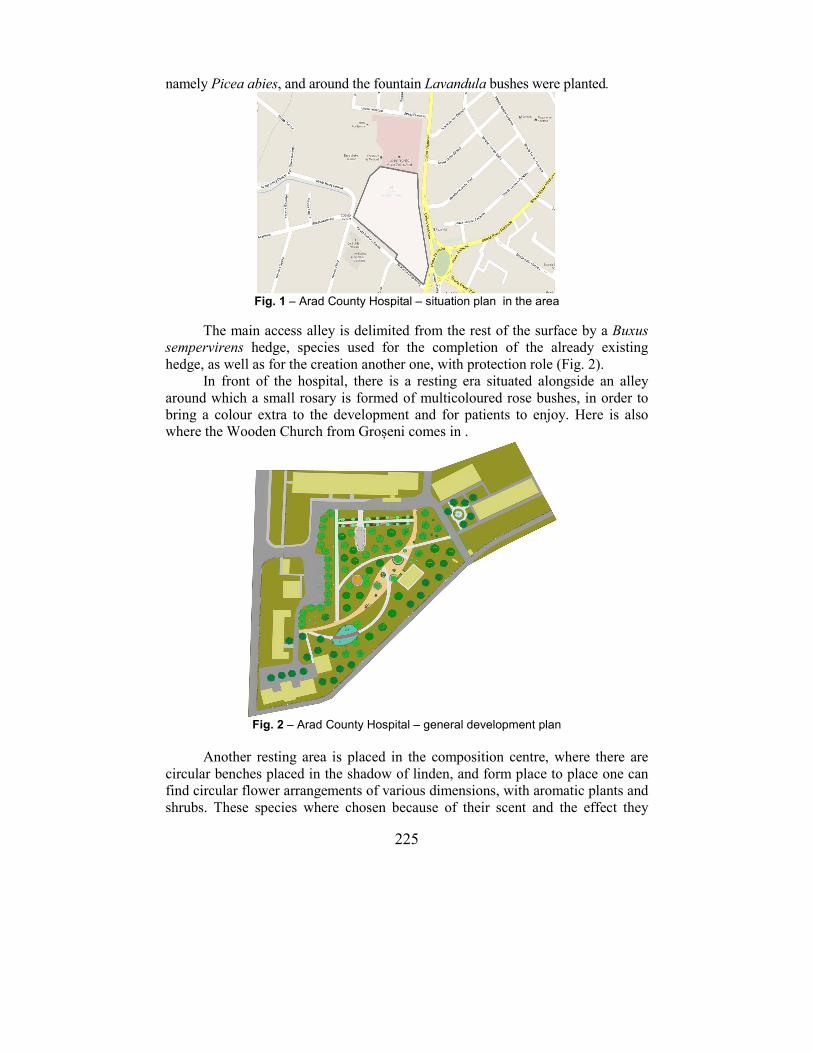
225
namely Picea abies, and around the fountain Lavandula bushes were planted.
Fig. 1 – Arad County Hospital – situation plan in the area
The main access alley is delimited from the rest of the surface by a Buxus sempervirens hedge, species used for the completion of the already existing
hedge, as well as for the creation another one, with protection role (Fig. 2). In front of the hospital, there is a resting era situated alongside an alley
around which a small rosary is formed of multicoloured rose bushes, in order to bring a colour extra to the development and for patients to enjoy. Here is also where the Wooden Church from Groșeni comes in .
Fig. 2 – Arad County Hospital – general development plan
Another resting area is placed in the composition centre, where there are
circular benches placed in the shadow of linden, and form place to place one can find circular flower arrangements of various dimensions, with aromatic plants and
shrubs. These species where chosen because of their scent and the effect they
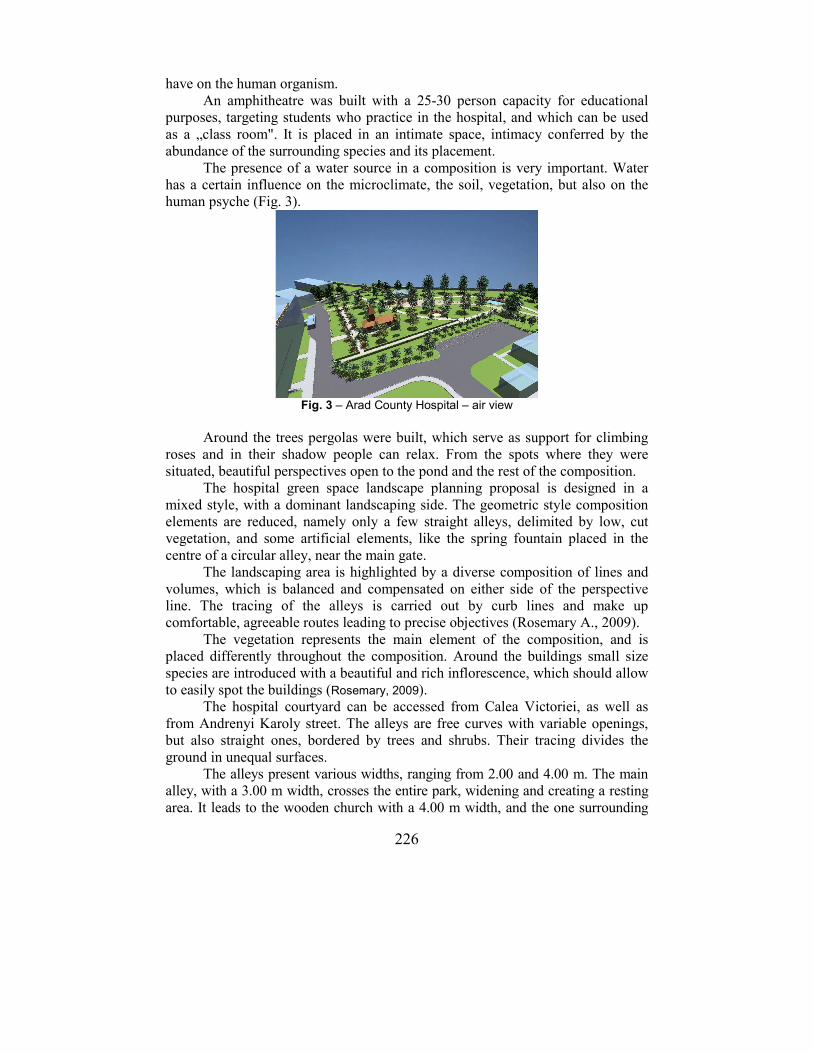
226
have on the human organism.
An amphitheatre was built with a 25-30 person capacity for educational purposes, targeting students who practice in the hospital, and which can be used
as a „class room". It is placed in an intimate space, intimacy conferred by the abundance of the surrounding species and its placement.
The presence of a water source in a composition is very important. Water has a certain influence on the microclimate, the soil, vegetation, but also on the human psyche (Fig. 3).
Fig. 3 – Arad County Hospital – air view
Around the trees pergolas were built, which serve as support for climbing roses and in their shadow people can relax. From the spots where they were
situated, beautiful perspectives open to the pond and the rest of the composition. The hospital green space landscape planning proposal is designed in a
mixed style, with a dominant landscaping side. The geometric style composition elements are reduced, namely only a few straight alleys, delimited by low, cut vegetation, and some artificial elements, like the spring fountain placed in the
centre of a circular alley, near the main gate. The landscaping area is highlighted by a diverse composition of lines and
volumes, which is balanced and compensated on either side of the perspective line. The tracing of the alleys is carried out by curb lines and make up comfortable, agreeable routes leading to precise objectives (Rosemary A., 2009).
The vegetation represents the main element of the composition, and is placed differently throughout the composition. Around the buildings small size
species are introduced with a beautiful and rich inflorescence, which should allow to easily spot the buildings (Rosemary, 2009). The hospital courtyard can be accessed from Calea Victoriei, as well as
from Andrenyi Karoly street. The alleys are free curves with variable openings, but also straight ones, bordered by trees and shrubs. Their tracing divides the
ground in unequal surfaces. The alleys present various widths, ranging from 2.00 and 4.00 m. The main alley, with a 3.00 m width, crosses the entire park, widening and creating a resting
area. It leads to the wooden church with a 4.00 m width, and the one surrounding
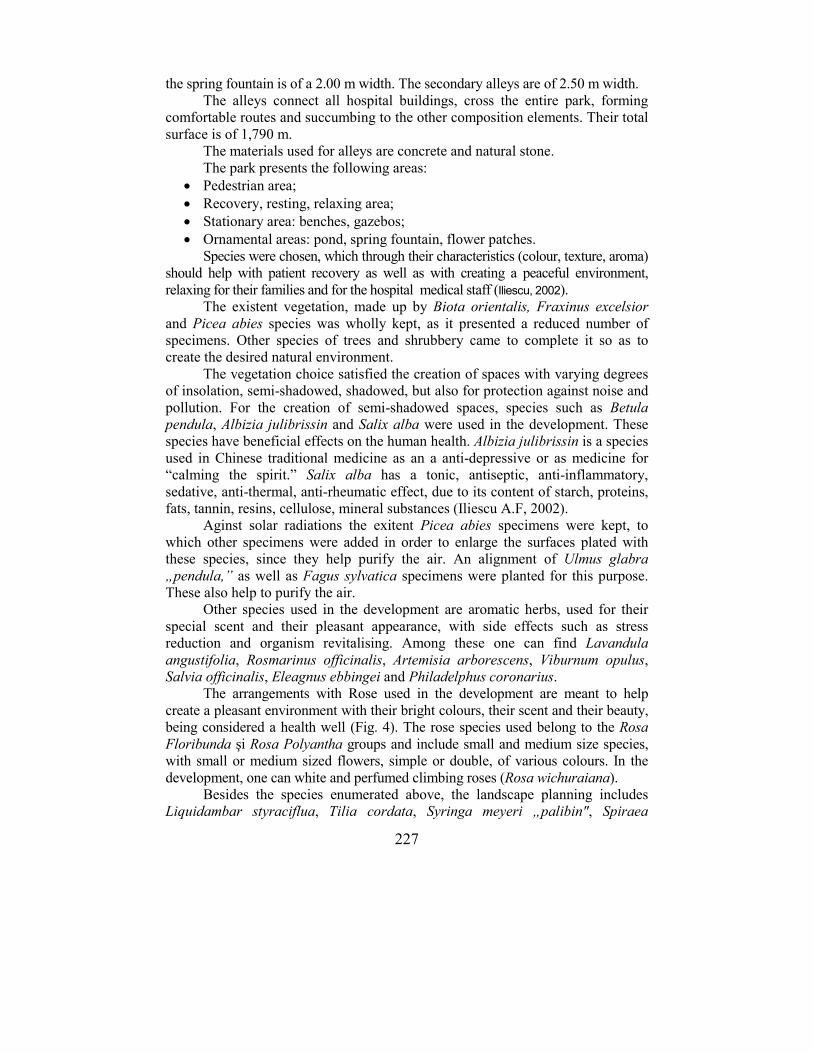
227
the spring fountain is of a 2.00 m width. The secondary alleys are of 2.50 m width.
The alleys connect all hospital buildings, cross the entire park, forming comfortable routes and succumbing to the other composition elements. Their total
surface is of 1,790 m. The materials used for alleys are concrete and natural stone.
The park presents the following areas:
• Pedestrian area;
• Recovery, resting, relaxing area;
• Stationary area: benches, gazebos;
• Ornamental areas: pond, spring fountain, flower patches.
Species were chosen, which through their characteristics (colour, texture, aroma) should help with patient recovery as well as with creating a peaceful environment,
relaxing for their families and for the hospital medical staff (Iliescu, 2002). The existent vegetation, made up by Biota orientalis, Fraxinus excelsior
and Picea abies species was wholly kept, as it presented a reduced number of specimens. Other species of trees and shrubbery came to complete it so as to create the desired natural environment.
The vegetation choice satisfied the creation of spaces with varying degrees of insolation, semi-shadowed, shadowed, but also for protection against noise and
pollution. For the creation of semi-shadowed spaces, species such as Betula pendula, Albizia julibrissin and Salix alba were used in the development. These species have beneficial effects on the human health. Albizia julibrissin is a species
used in Chinese traditional medicine as an a anti-depressive or as medicine for “calming the spirit.” Salix alba has a tonic, antiseptic, anti-inflammatory,
sedative, anti-thermal, anti-rheumatic effect, due to its content of starch, proteins, fats, tannin, resins, cellulose, mineral substances (Iliescu A.F, 2002). Aginst solar radiations the exitent Picea abies specimens were kept, to
which other specimens were added in order to enlarge the surfaces plated with these species, since they help purify the air. An alignment of Ulmus glabra „pendula,” as well as Fagus sylvatica specimens were planted for this purpose. These also help to purify the air. Other species used in the development are aromatic herbs, used for their
special scent and their pleasant appearance, with side effects such as stress reduction and organism revitalising. Among these one can find Lavandula angustifolia, Rosmarinus officinalis, Artemisia arborescens, Viburnum opulus, Salvia officinalis, Eleagnus ebbingei and Philadelphus coronarius. The arrangements with Rose used in the development are meant to help
create a pleasant environment with their bright colours, their scent and their beauty, being considered a health well (Fig. 4). The rose species used belong to the Rosa Floribunda şi Rosa Polyantha groups and include small and medium size species, with small or medium sized flowers, simple or double, of various colours. In the
development, one can white and perfumed climbing roses (Rosa wichuraiana). Besides the species enumerated above, the landscape planning includes Liquidambar styraciflua, Tilia cordata, Syringa meyeri „palibin", Spiraea
228
bumalda, Spiraea vanhouttei, Osmanthus x burkwoodii and Buxus sempervirens specimens.
Fig. 4 – Arad County Hospital – rose alley perspective
We added the water plants used for the development of the pond, such as:
Iris pseudacorus, Glyceria maxima "variegata", Lythrum salicaria, Nymphaea alba and Pontederia cordata. Teh lawned surface which covers 8,783 m2 is made up
by mixtures of Festuca rubra, Lollium perene and Poa pratensis. The ornamental facilities are represented by benches, pergolas, garbage
cans and lamps. Benches are made up of concrete posts and wooden seats, being elegant, comfortable and endurable in time. There are 20 pieces, with 1.80 m length, 0.50 m width and 0.60 m height. We also designed circular wooden
benches placed around trees and wooden benches on concrete structures. The pergola, through its presence in the composition, confers it a unique,
warm note, constituting an attraction point and customizing the space. It is built around trees, serving as support for climbing roses, and is made up of thin seamed pipes, with a 3m height. Garbage cans are cylindrical, from steel platband plated
with wood ledgers, of 0.40 m diameter, 0.60 m height and a 50 litre capacity.
CONCLUSIONS
We believe that our research has proved that it is necessary to develop the
green space afferent to the Arad County Hospital, since it is very important in order to improve the health of the patients. A harmoniously developed space creates a good state of mind, for the patients as well as for the hospital staff
members. The maintenance of the green space is easily done and the expenses allotted to this process are reduced.
REFERENCES
1. Iliescu A.F., 2003 – Arhitectură peisageră, Editura Ceres, Bucuresti 2. Iliescu A.F, 2002 - Cultura arborilor și arbuștilor ornamentali, Editura Ceres, Bucuresti 3. Rosemary A., 2009 - The essential garden design workbook, Timber Press; 4.Simonds J.O.,Starke B.W., 2006 – Landscape architecture – a manual of environmental
planning and design, The McGraw and Hill Companies.
229
RESHAPING THE CITYSCAPE THROUGH SMALL
LANDSCAPE DESIGNS
REMODELAREA PEISAJULUI URBAN PRIN AMENAJĂRI
PEISAGISTICE DE DIMENSIUNI REDUSE
GRIGOROVSCHI M.1,GHEORGHIŢĂ Constanţa Carmina1
e-mail: [email protected]
Abstract. The landscape-designs within the city need to fulfill a number of conditions in order to meet the essential purpose of increasing the quality of life and to contribute towards increasing the urban comfort. In the urban texture of Iasi city a multitude of abandoned, undeveloped, deconstructed public spaces can be found, which, besides a poor quality urban image and can become unsafe for the public. We will refer mainly to the spaces related to the pedestrian traffic and those located in their immediate vicinity, spaces of small dimensions, unutilized, without a precise destination, with a predominantly mineral structure and with constitutive elements (fronts, surroundings, pavements, constructions etc.) without special volumetric, architectural and artistic qualities, or even completely deconstructed. Through this paper we aim to identify such areas in Iasi and propose small landscape-designs who will increase the quality of urban space, will favor social contact, and will generate an improved image quality of unused and abandoned urban spaces. Key words: urban landscape, urban public space, small gardens, abandoned places, deconstructed spaces Rezumat. Pentru a-şi îndeplini scopul esenţial de creştere a calităţii vieţii locuitorilor și acela de a contribui la sporirea confortului urban, amenajările peisagistice în oraş trebuie să îndeplinească o serie de condiții. În textura urbană a municipiului Iaşi se regăsește o multitudine de spaţii publice abandonate, neamenajate, destructurate, care, pe lângă o imagine urbană de slabă calitate pot deveni nesigure pentru public. Ne vom referi în principal la spaţiile afectate circulaţiei pietonale şi la cele situate în imediata lor apropiere, de mici dimensiuni, neutilizate, cu structură predominant minerală şi cu elemente constitutive (fronturi, împrejmuiri, pavimente, construcţii etc.) fără calităţi spaţial volumetrice, arhitecturale şi plastice deosebite sau chiar complet destructurate. Prin acest studiu ne propunem identificarea unor astfel de spaţii în municipiul Iaşi şi propunerea unor amenajări peisagistice de mici dimensiuni care să ofere un plus de calitate mediului urban, să favorizeze contactul social și în același timp să genereze o imagine urbană de calitate unor spaţii neutilizate şi abandonate. Cuvinte cheie: peisaj urban, spaţiu public, grădini mici, spaţiu abandonat, spaţiu destructurat
1 „Gh. Asachi” Technical University of Iasi, Romania
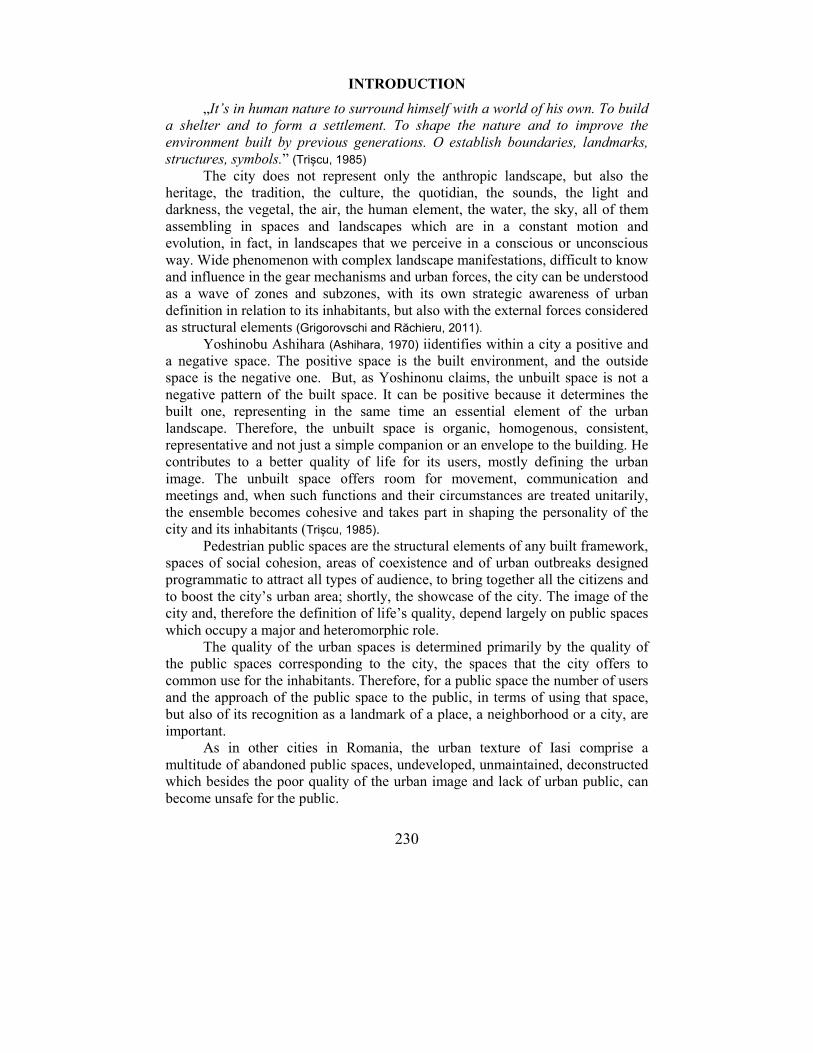
230
INTRODUCTION
„It’s in human nature to surround himself with a world of his own. To build a shelter and to form a settlement. To shape the nature and to improve the environment built by previous generations. O establish boundaries, landmarks, structures, symbols.” (Trișcu, 1985)
The city does not represent only the anthropic landscape, but also the
heritage, the tradition, the culture, the quotidian, the sounds, the light and
darkness, the vegetal, the air, the human element, the water, the sky, all of them
assembling in spaces and landscapes which are in a constant motion and
evolution, in fact, in landscapes that we perceive in a conscious or unconscious
way. Wide phenomenon with complex landscape manifestations, difficult to know
and influence in the gear mechanisms and urban forces, the city can be understood
as a wave of zones and subzones, with its own strategic awareness of urban
definition in relation to its inhabitants, but also with the external forces considered
as structural elements (Grigorovschi and Răchieru, 2011).
Yoshinobu Ashihara (Ashihara, 1970) iidentifies within a city a positive and
a negative space. The positive space is the built environment, and the outside
space is the negative one. But, as Yoshinonu claims, the unbuilt space is not a
negative pattern of the built space. It can be positive because it determines the
built one, representing in the same time an essential element of the urban
landscape. Therefore, the unbuilt space is organic, homogenous, consistent,
representative and not just a simple companion or an envelope to the building. He
contributes to a better quality of life for its users, mostly defining the urban
image. The unbuilt space offers room for movement, communication and
meetings and, when such functions and their circumstances are treated unitarily,
the ensemble becomes cohesive and takes part in shaping the personality of the
city and its inhabitants (Trișcu, 1985).
Pedestrian public spaces are the structural elements of any built framework,
spaces of social cohesion, areas of coexistence and of urban outbreaks designed
programmatic to attract all types of audience, to bring together all the citizens and
to boost the city’s urban area; shortly, the showcase of the city. The image of the
city and, therefore the definition of life’s quality, depend largely on public spaces
which occupy a major and heteromorphic role.
The quality of the urban spaces is determined primarily by the quality of
the public spaces corresponding to the city, the spaces that the city offers to
common use for the inhabitants. Therefore, for a public space the number of users
and the approach of the public space to the public, in terms of using that space,
but also of its recognition as a landmark of a place, a neighborhood or a city, are
important.
As in other cities in Romania, the urban texture of Iasi comprise a
multitude of abandoned public spaces, undeveloped, unmaintained, deconstructed
which besides the poor quality of the urban image and lack of urban public, can
become unsafe for the public.
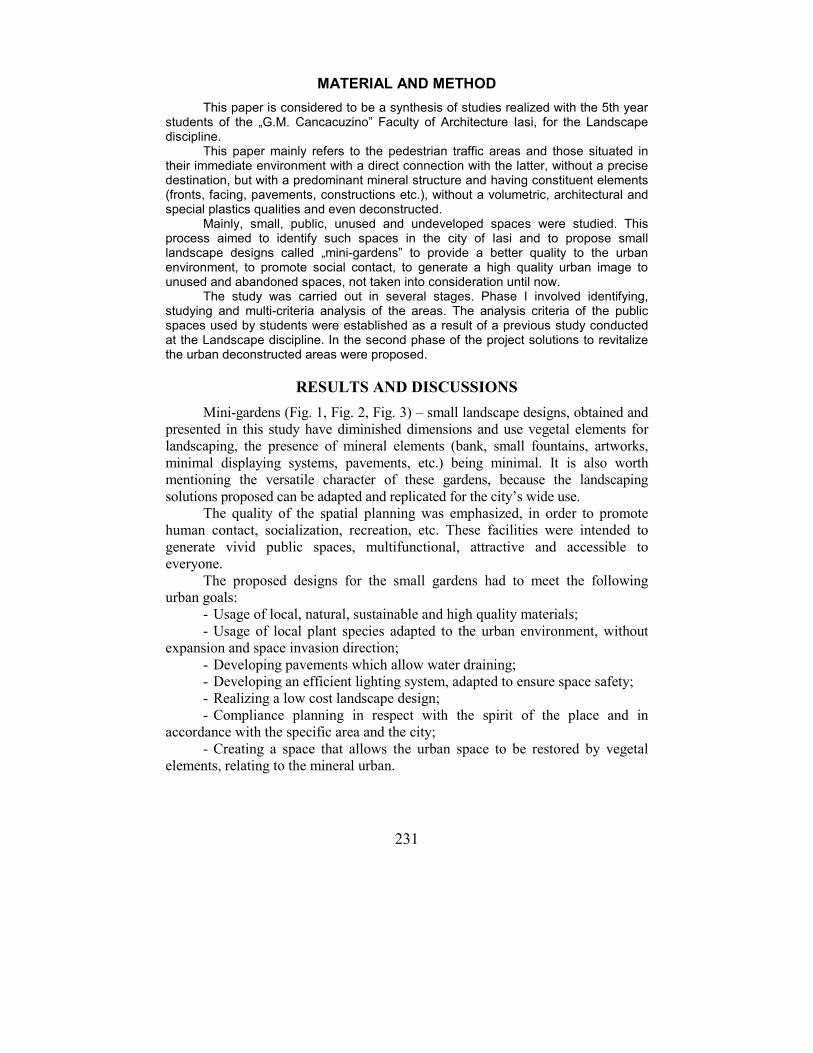
231
MATERIAL AND METHOD
This paper is considered to be a synthesis of studies realized with the 5th year students of the „G.M. Cancacuzino” Faculty of Architecture Iasi, for the Landscape discipline.
This paper mainly refers to the pedestrian traffic areas and those situated in their immediate environment with a direct connection with the latter, without a precise destination, but with a predominant mineral structure and having constituent elements (fronts, facing, pavements, constructions etc.), without a volumetric, architectural and special plastics qualities and even deconstructed.
Mainly, small, public, unused and undeveloped spaces were studied. This process aimed to identify such spaces in the city of Iasi and to propose small landscape designs called „mini-gardens” to provide a better quality to the urban environment, to promote social contact, to generate a high quality urban image to unused and abandoned spaces, not taken into consideration until now.
The study was carried out in several stages. Phase I involved identifying, studying and multi-criteria analysis of the areas. The analysis criteria of the public spaces used by students were established as a result of a previous study conducted at the Landscape discipline. In the second phase of the project solutions to revitalize the urban deconstructed areas were proposed.
RESULTS AND DISCUSSIONS
Mini-gardens (Fig. 1, Fig. 2, Fig. 3) – small landscape designs, obtained and
presented in this study have diminished dimensions and use vegetal elements for
landscaping, the presence of mineral elements (bank, small fountains, artworks,
minimal displaying systems, pavements, etc.) being minimal. It is also worth
mentioning the versatile character of these gardens, because the landscaping
solutions proposed can be adapted and replicated for the city’s wide use.
The quality of the spatial planning was emphasized, in order to promote
human contact, socialization, recreation, etc. These facilities were intended to
generate vivid public spaces, multifunctional, attractive and accessible to
everyone.
The proposed designs for the small gardens had to meet the following
urban goals:
- Usage of local, natural, sustainable and high quality materials;
- Usage of local plant species adapted to the urban environment, without
expansion and space invasion direction;
- Developing pavements which allow water draining;
- Developing an efficient lighting system, adapted to ensure space safety;
- Realizing a low cost landscape design;
- Compliance planning in respect with the spirit of the place and in
accordance with the specific area and the city;
- Creating a space that allows the urban space to be restored by vegetal
elements, relating to the mineral urban.
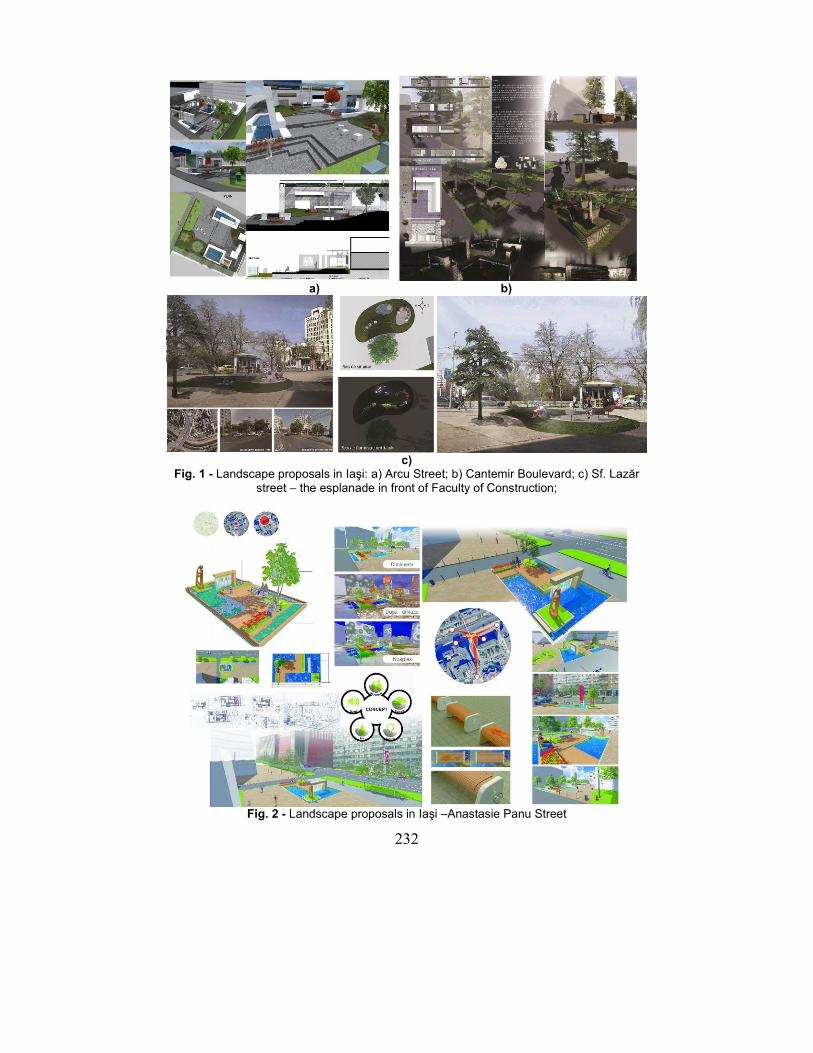
232
a) b)
c)
Fig. 1 - Landscape proposals in Iaşi: a) Arcu Street; b) Cantemir Boulevard; c) Sf. Lazăr street – the esplanade in front of Faculty of Construction;
Fig. 2 - Landscape proposals in Iaşi –Anastasie Panu Street
233
a)
b)
Fig. 3 - Landscape proposals in Iaşi –a) Sf. Lazăr Street; b) Tătăraşi – Vasile Lupu Street
234
CONCLUSIONS
The city, although a coherent whole, appears as a complicated
agglomeration in a continuous transformation.
Landscape designs in the city must meet the following conditions in order
to fulfil the essential purpose of raising the quality of life of the human settlement
residents:
a) To be equally through the city;
b) To be qualitative;
c) To be accessible to all residents and city visitors.
If these conditions are satisfied, urban landscaping design will have a
social, economic and ecological impact contributing to increase the urban
comfort.
REFERENCES
1. Ashisara Y., 1970 - Extern Design in Architecture, Van Nostrand Reinhold Company, New York, Cincinnatti, Toronto, Londra, Melbourne
2. Grigorovschi M., Răchieru V., 2011 – Curs de peisagistică vol. I Peisajul. Editura Societății Academice ”Matei Teiu Botez”, Iași, p. 54
3. Trișcu A., 1985 – Spații urbane pietonale. Ed. Tehnică, București, p. 15
235
URBAN GREEN
THE POTENTIAL OF CITY’S RESIDUAL AREAS
VERDELE URBAN POTENȚIALUL ZONELOR URBANE REZIDUALE
DUMITRAŞCU Aurora Irina
1, NICA R.M.
1, CORDUBAN C.G.
1
e-mail: [email protected]
Abstract. Nowadays, the contemporary cities are evolving at an accelerated
pace, aspect that brings forward new sets of problems to be dealt with. Among
the most common urban issues we can identify the lack of high quality public
spaces, insufficient parking spaces, and the presence of decommissioned
(disused) industrial sites that fragment the overall appearance of the residential
areas. Regarding the aforementioned issues, this paper will focus on the
opportunity to provide potential directions of development for urban landscape
through the increasing of green areas. As such, the existing residual urban
spaces can provide a solid framework for future opportunities and the
increasing of green areas per citizen can be applied for a sustainable urban
recovery and reconversion.
Key words: urban green, urban rehabilitation, residual green space
Rezumat. La momentul actual, ansamblurile urbane evoluează în ritm alert,
aspect care aduce în discuție noi seturi de probleme. Printre acestea putem
identifica lipsa spațiilor publice de calitate, insuficiența locurilor de parcare și
prezența siturilor industriale dezafectate, care fragmentează percepția unei
imagini urbane unitare. Considerând aspectele menționate mai sus, această
lucrare se va concentra asupra direcțiilor potențiale de dezvoltare ale peisajului
urban, în special prin extinderea spațiilor verzi. Astfel, zonele urbane
rezidențiale pot oferi un cadru benefic pentru viitoarele oportunități, iar
suplimentarea suprafeței spațiilor verzi poate fi privită ca un proces sustenabil
de reconversie urbană.
Cuvinte cheie: verdele urban, reabilitare urbană, spații verzi reziduale.
INTRODUCTION
Worldwide researches regarding the future trends in architecture and urban
planning take into account aspects related to new space theories and establishing
connections between architecture and related scientific fields such as computer
science, artificial intelligence, landscaping, biology, philosophy etc., all of which
are subordinated to the evolutions of technological and digital industries.
Together with the progresses of exact science fields, the majority of traditional
architectural concepts are redefined. The same is valid for the contemporary
urbanism, which strives to develop new ways of living, highly dependent upon
the environment component.
1„Gh. Asachi” Technical University of Iasi, Romania
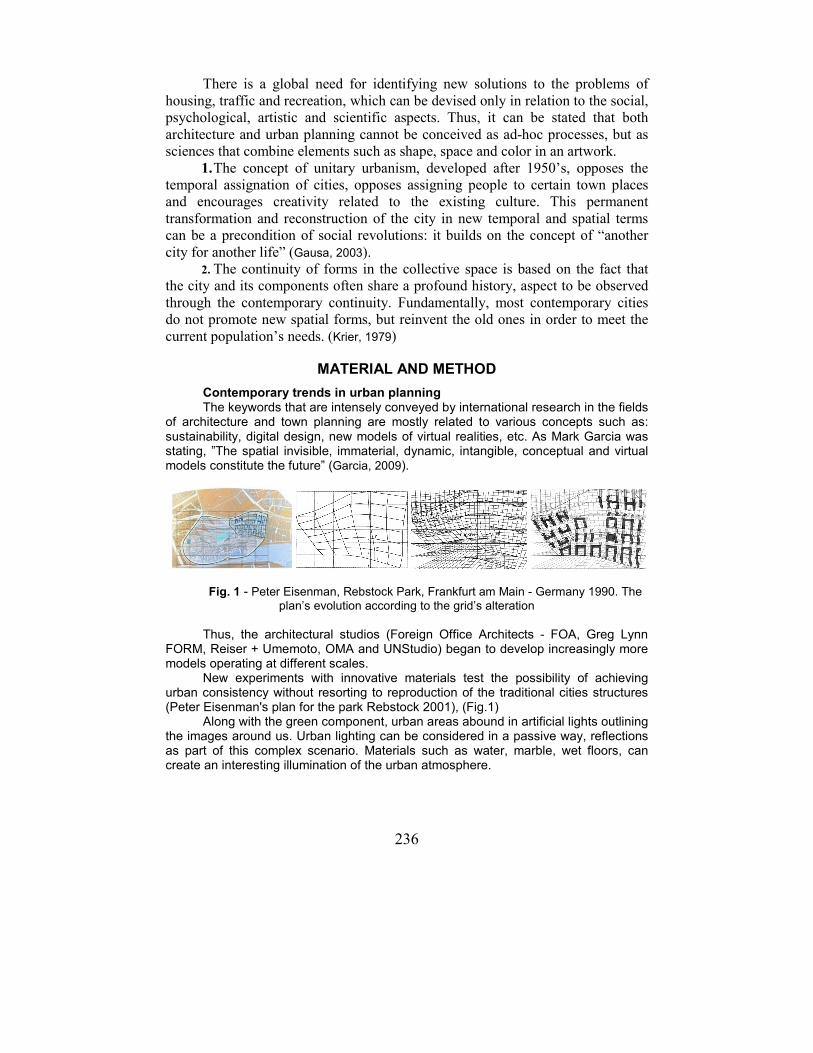
236
There is a global need for identifying new solutions to the problems of
housing, traffic and recreation, which can be devised only in relation to the social,
psychological, artistic and scientific aspects. Thus, it can be stated that both
architecture and urban planning cannot be conceived as ad-hoc processes, but as
sciences that combine elements such as shape, space and color in an artwork.
1. The concept of unitary urbanism, developed after 1950’s, opposes the
temporal assignation of cities, opposes assigning people to certain town places
and encourages creativity related to the existing culture. This permanent
transformation and reconstruction of the city in new temporal and spatial terms
can be a precondition of social revolutions: it builds on the concept of “another
city for another life” (Gausa, 2003).
2. The continuity of forms in the collective space is based on the fact that
the city and its components often share a profound history, aspect to be observed
through the contemporary continuity. Fundamentally, most contemporary cities
do not promote new spatial forms, but reinvent the old ones in order to meet the
current population’s needs. (Krier, 1979)
MATERIAL AND METHOD
Contemporary trends in urban planning The keywords that are intensely conveyed by international research in the fields
of architecture and town planning are mostly related to various concepts such as: sustainability, digital design, new models of virtual realities, etc. As Mark Garcia was stating, ”The spatial invisible, immaterial, dynamic, intangible, conceptual and virtual models constitute the future” (Garcia, 2009).
Fig. 1 - Peter Eisenman, Rebstock Park, Frankfurt am Main - Germany 1990. The
plan’s evolution according to the grid’s alteration
Thus, the architectural studios (Foreign Office Architects - FOA, Greg Lynn FORM, Reiser + Umemoto, OMA and UNStudio) began to develop increasingly more models operating at different scales.
New experiments with innovative materials test the possibility of achieving urban consistency without resorting to reproduction of the traditional cities structures (Peter Eisenman's plan for the park Rebstock 2001), (Fig.1)
Along with the green component, urban areas abound in artificial lights outlining the images around us. Urban lighting can be considered in a passive way, reflections as part of this complex scenario. Materials such as water, marble, wet floors, can create an interesting illumination of the urban atmosphere.

237
RESULTS AND DISCUSSIONS
Urban rehabilitation through landscaping Generally, when the problem of urban rehabilitation comes into discussion,
there are multiple directions to be considered:
1. Preservation of historic cultural heritage;
2. Renovation of the public spaces (Preservation and protection of the
existing markets and public gardens, the main purpose being to ensure a
sustainable development of the city; designing new green spaces in order to
increase the percentage of green areas per citizen; planting trees on the side
streets; a better organization of the adjacent tree alignments in order to improve
the ecological conditions of the residential areas and the urban microclimate);
3. Implementation of an integrated traffic concept;
4. Promoting the development of shopping streets and historic areas;
5. Expansion of the cultural and touristic offer;
6. Improvement of the education and social services;
7. Stimulation of the population’s civic spirit. (Gehl, 2011)
In order to emphasize the potential of urban rehabilitation for residual
spaces and their transformation into parks, there will be presented an analysis and
a proposal that involves the area surrounding the Public Bath and the Turkish
Bath from Iasi.
Following the study are identified a series of benefits for landscape
rehabilitation:
- proximity to the historical cultural centre of Iasi and its major pedestrian
routes;
- the existence of landmark buildings in the area (Public Bath, Turkish
Bath, Mitropolitan Cathedral, Rosnovanu Palace etc.) (fig. 2, fig.3);
- existence of an undeveloped interstitial space that offers a panoramic
perspective over the city.
The main weaknesses of the site are:
- the total lack of a landscape design;
- the area is flanked by blind walls pertaining to the surrounding buildings;
- the presence of improvised decrepit buildings (fig. 6).
After the urban analysis are underlined a series of opportunities, such as:
- the architectural and historical value of the buildings can be exploited by
transforming the area into a polarizing landmark for the southern side of Sf.
Andrei Street;
- designing of a park, with low costs, for its residents,
- a landscaping project that offers public spaces for different social and
cultural activities, such as temporary exhibitions and an amphitheatre for movie
projections and outdoor gatherings.
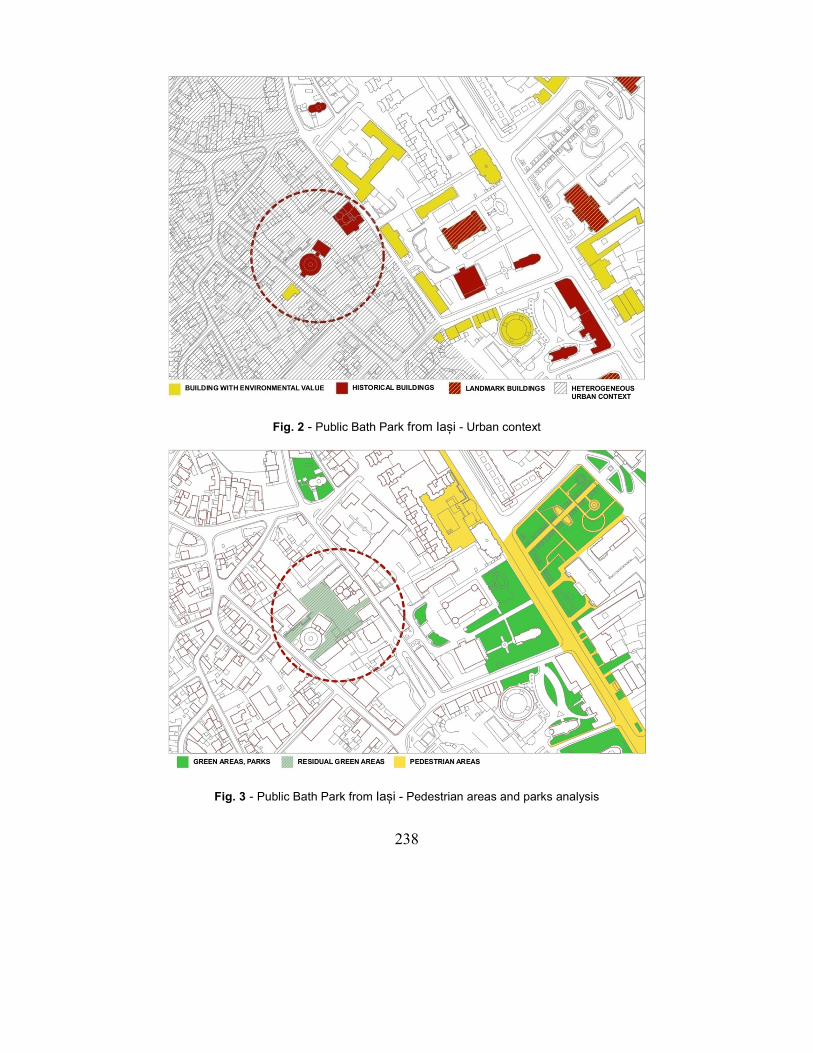
238
Fig. 2 - Public Bath Park from Iași - Urban context
Fig. 3 - Public Bath Park from Iași - Pedestrian areas and parks analysis
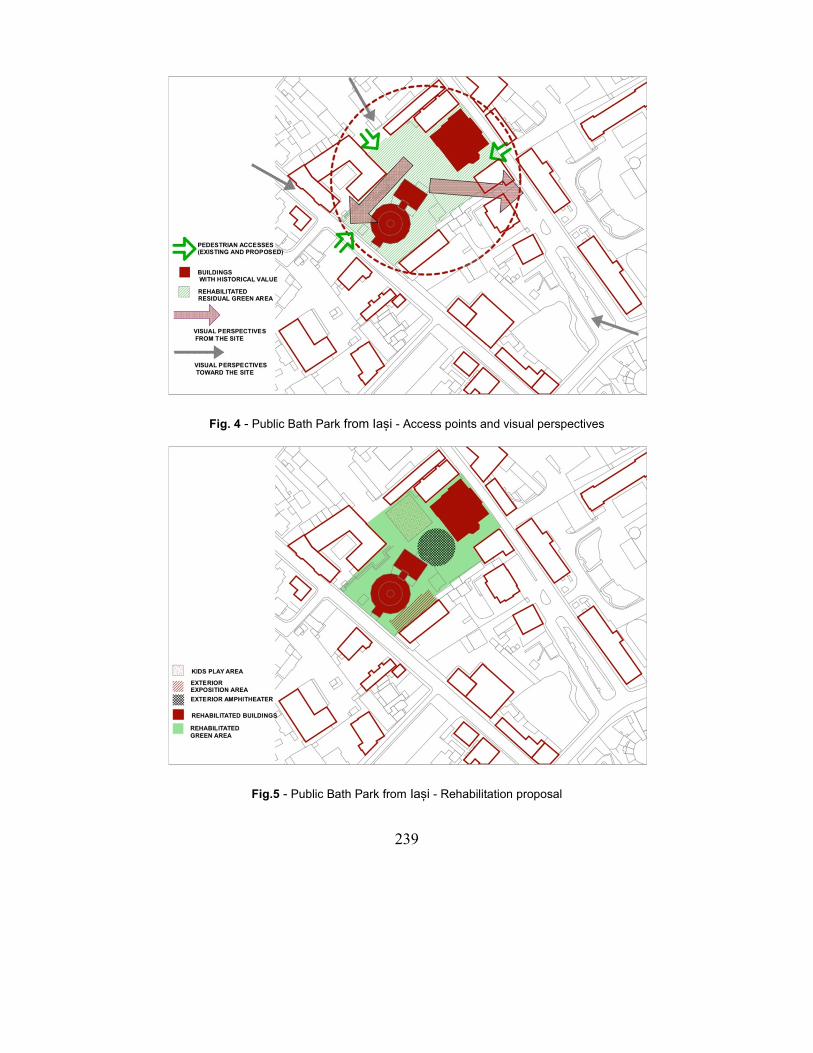
239
Fig. 4 - Public Bath Park from Iași - Access points and visual perspectives
Fig.5 - Public Bath Park from Iași - Rehabilitation proposal
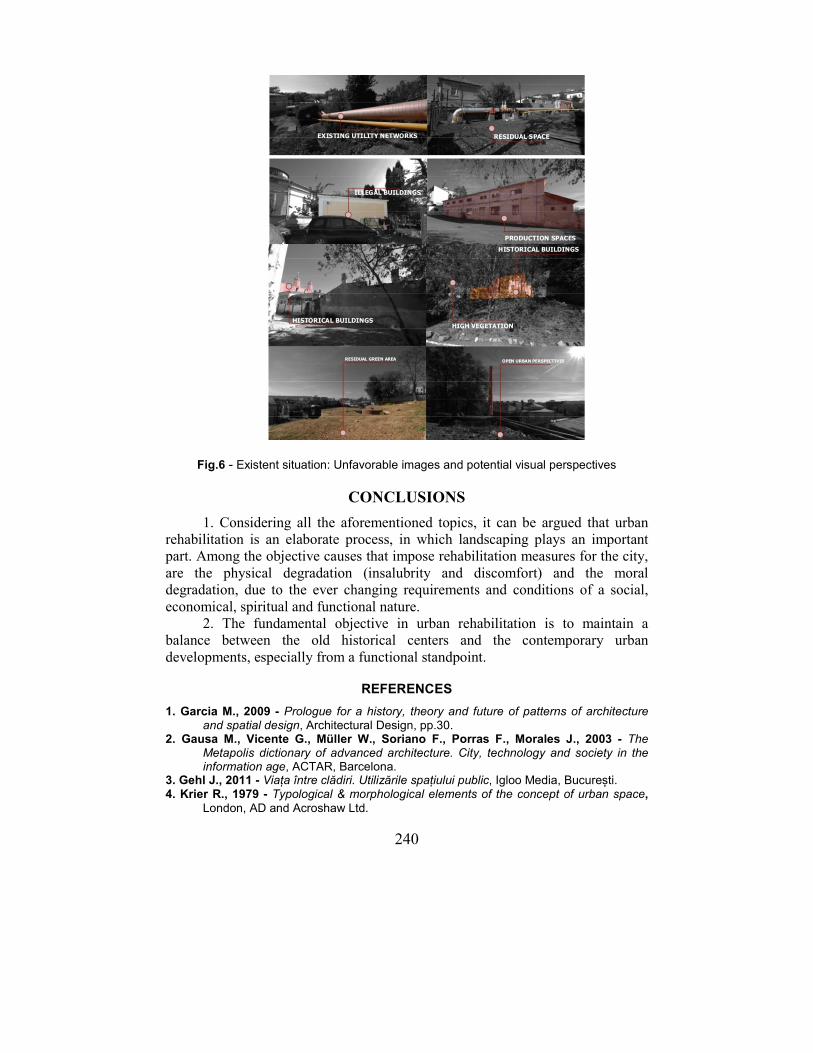
240
Fig.6 - Existent situation: Unfavorable images and potential visual perspectives
CONCLUSIONS
1. Considering all the aforementioned topics, it can be argued that urban
rehabilitation is an elaborate process, in which landscaping plays an important
part. Among the objective causes that impose rehabilitation measures for the city,
are the physical degradation (insalubrity and discomfort) and the moral
degradation, due to the ever changing requirements and conditions of a social,
economical, spiritual and functional nature.
2. The fundamental objective in urban rehabilitation is to maintain a
balance between the old historical centers and the contemporary urban
developments, especially from a functional standpoint.
REFERENCES
1. Garcia M., 2009 - Prologue for a history, theory and future of patterns of architecture and spatial design, Architectural Design, pp.30.
2. Gausa M., Vicente G., Müller W., Soriano F., Porras F., Morales J., 2003 - The Metapolis dictionary of advanced architecture. City, technology and society in the information age, ACTAR, Barcelona.
3. Gehl J., 2011 - Viața între clădiri. Utilizările spațiului public, Igloo Media, București. 4. Krier R., 1979 - Typological & morphological elements of the concept of urban space,
London, AD and Acroshaw Ltd.
241
COMPARATIVE ANALYSIS OF LANDSCAPE DESIGN OF BELL-VIEW POINTS ON THE SLOPES OF CITIES LISBON
AND IASSY
ANALIZA COMPARATIVĂ A AMENAJĂRILOR PEISAGISTICE ALE PUNCTELOR BELVEDERE DE PE VERSANȚII ORAȘELOR
LISABONA ȘI IAȘI
GRECU Codrina1, PURCARU Andrei
2
e-mail: [email protected]
Abstract. In this paper are proposed for analysis and comparison, in terms of landscaping bell-views of the slopes, two European cities, situated in hilly terrain with spectacular breaks, capitals with historical, cultural and touristic true value: Lisbon - the administrative capital of Portugal, and Iassy - the historic capital of Moldavia and an important university center of Romania. Key words: bellvedere, amenajare peisageră, relief colinar
Rezumat. În această lucrare sunt propuse spre analiză şi comparaţie din punct de vedere al amenajărilor peisagere ale versanţilor, două oraşe europene, situate într-un relief colinar, cu ruperi spectaculoase de relief, capitale istorice, culturale şi turistice de mare valoare: Lisabona – capitala administrativă a Portugaliei, şi Iaşi – capitala istorică a Moldovei şi un important centru universitar al României. Cuvinte cheie: bellview, landscape design, sloped relief
INTRODUCTION
In all major cities of the world there are points or buildings, witch are
turistic, cultural or economic attraction. But there are not as many cities that
provide a variety of views over the city, the harmonious blending of natural forms
of relief with landscape forms built by man.
Joining and analysis of the two cities comes from the similarity discovered
from knowing them by affiliation with the author's native city of Iasi, or her
temporary adoption in Lisbon.
MATERIAL AND METHOD
Both in Lisbon and Iasi, bellview points today were originally important centers of spiritual, cultural or administrative symbols of state power (royal or princely), or religious power, representing palaces or fortresses, towers and defensive walls, fortified monasteries or churches. Thus in Iasi Palace of Culture, former administrative palace, built in the early twentieth century, in the Gothic style, over the ruins of the old royal palace, is the building whose image has become the emblem of the city (Fig. 1-left). Similarly, Sao Jorge Castle, a landmark of the city Lisbon is strategically located
1 University of Agricultural Sciences and Veterinary Medicine of Iasi, Romania 2 “Gh. Asachi” Technical University of Iasi, Romania
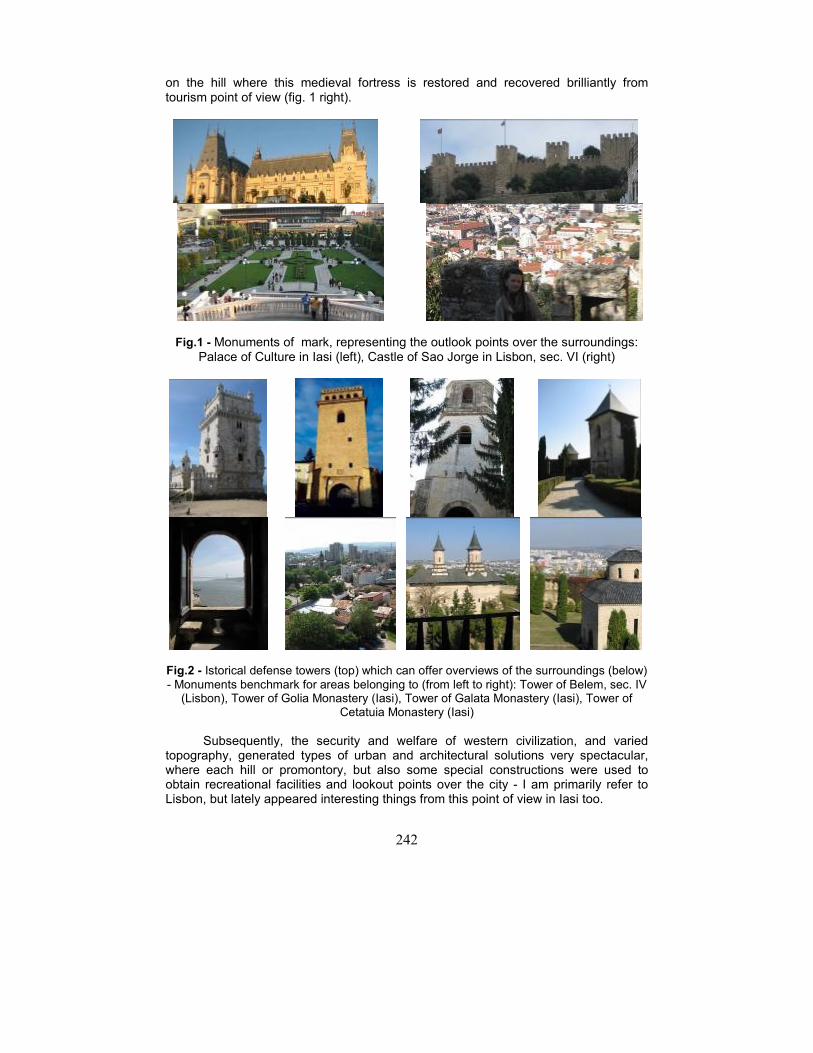
242
on the hill where this medieval fortress is restored and recovered brilliantly from tourism point of view (fig. 1 right).
Fig.1 - Monuments of mark, representing the outlook points over the surroundings: Palace of Culture in Iasi (left), Castle of Sao Jorge in Lisbon, sec. VI (right)
Fig.2 - Istorical defense towers (top) which can offer overviews of the surroundings (below) - Monuments benchmark for areas belonging to (from left to right): Tower of Belem, sec. IV
(Lisbon), Tower of Golia Monastery (Iasi), Tower of Galata Monastery (Iasi), Tower of Cetatuia Monastery (Iasi)
Subsequently, the security and welfare of western civilization, and varied
topography, generated types of urban and architectural solutions very spectacular, where each hill or promontory, but also some special constructions were used to obtain recreational facilities and lookout points over the city - I am primarily refer to Lisbon, but lately appeared interesting things from this point of view in Iasi too.
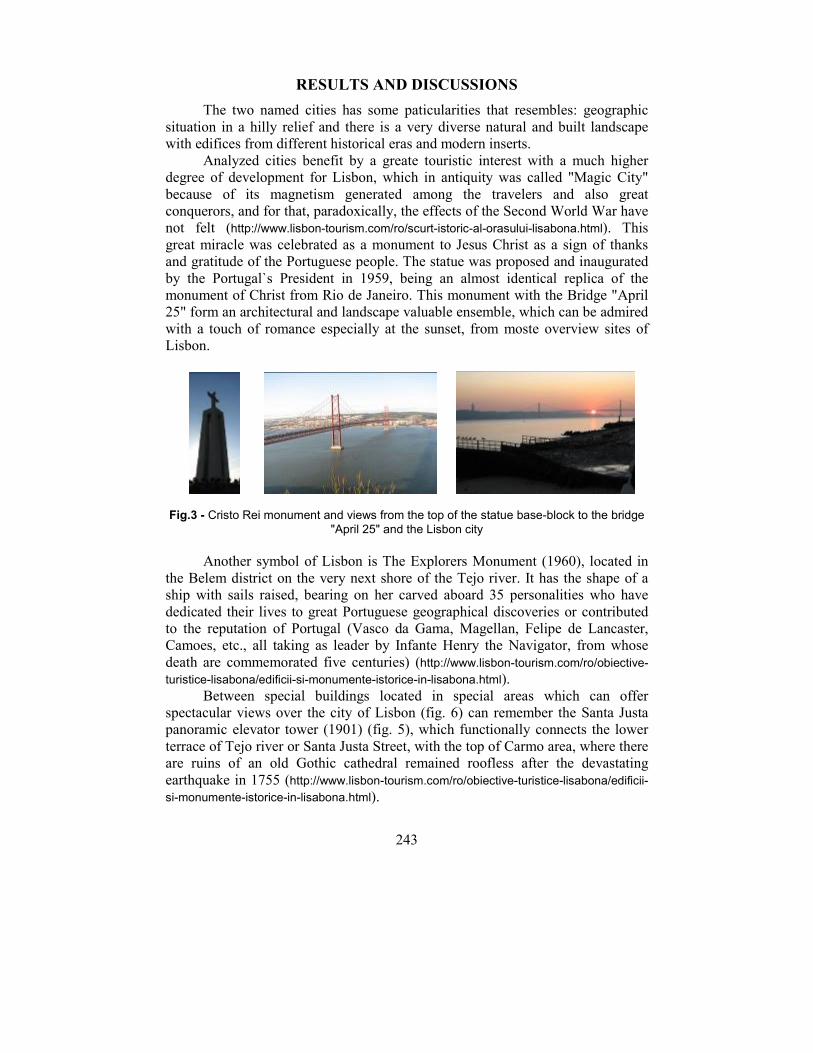
243
RESULTS AND DISCUSSIONS
The two named cities has some paticularities that resembles: geographic
situation in a hilly relief and there is a very diverse natural and built landscape
with edifices from different historical eras and modern inserts.
Analyzed cities benefit by a greate touristic interest with a much higher
degree of development for Lisbon, which in antiquity was called "Magic City"
because of its magnetism generated among the travelers and also great
conquerors, and for that, paradoxically, the effects of the Second World War have
not felt (http://www.lisbon-tourism.com/ro/scurt-istoric-al-orasului-lisabona.html). This
great miracle was celebrated as a monument to Jesus Christ as a sign of thanks
and gratitude of the Portuguese people. The statue was proposed and inaugurated
by the Portugal`s President in 1959, being an almost identical replica of the
monument of Christ from Rio de Janeiro. This monument with the Bridge "April
25" form an architectural and landscape valuable ensemble, which can be admired
with a touch of romance especially at the sunset, from moste overview sites of
Lisbon.
Fig.3 - Cristo Rei monument and views from the top of the statue base-block to the bridge "April 25" and the Lisbon city
Another symbol of Lisbon is The Explorers Monument (1960), located in
the Belem district on the very next shore of the Tejo river. It has the shape of a
ship with sails raised, bearing on her carved aboard 35 personalities who have
dedicated their lives to great Portuguese geographical discoveries or contributed
to the reputation of Portugal (Vasco da Gama, Magellan, Felipe de Lancaster,
Camoes, etc., all taking as leader by Infante Henry the Navigator, from whose
death are commemorated five centuries) (http://www.lisbon-tourism.com/ro/obiective-
turistice-lisabona/edificii-si-monumente-istorice-in-lisabona.html).
Between special buildings located in special areas which can offer
spectacular views over the city of Lisbon (fig. 6) can remember the Santa Justa
panoramic elevator tower (1901) (fig. 5), which functionally connects the lower
terrace of Tejo river or Santa Justa Street, with the top of Carmo area, where there
are ruins of an old Gothic cathedral remained roofless after the devastating
earthquake in 1755 (http://www.lisbon-tourism.com/ro/obiective-turistice-lisabona/edificii-
si-monumente-istorice-in-lisabona.html).
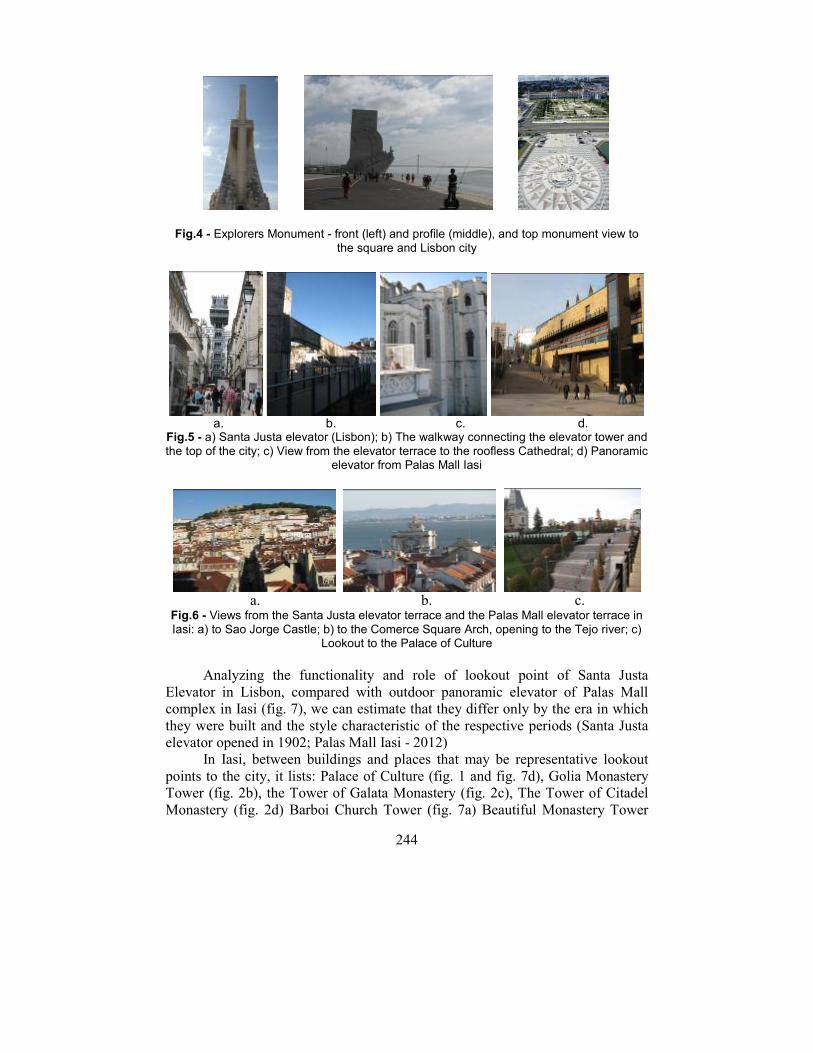
244
Fig.4 - Explorers Monument - front (left) and profile (middle), and top monument view to the square and Lisbon city
a. b. c. d.
Fig.5 - a) Santa Justa elevator (Lisbon); b) The walkway connecting the elevator tower and the top of the city; c) View from the elevator terrace to the roofless Cathedral; d) Panoramic
elevator from Palas Mall Iasi
a. b. c.
Fig.6 - Views from the Santa Justa elevator terrace and the Palas Mall elevator terrace in Iasi: a) to Sao Jorge Castle; b) to the Comerce Square Arch, opening to the Tejo river; c)
Lookout to the Palace of Culture
Analyzing the functionality and role of lookout point of Santa Justa
Elevator in Lisbon, compared with outdoor panoramic elevator of Palas Mall
complex in Iasi (fig. 7), we can estimate that they differ only by the era in which
they were built and the style characteristic of the respective periods (Santa Justa
elevator opened in 1902; Palas Mall Iasi - 2012)
In Iasi, between buildings and places that may be representative lookout
points to the city, it lists: Palace of Culture (fig. 1 and fig. 7d), Golia Monastery
Tower (fig. 2b), the Tower of Galata Monastery (fig. 2c), The Tower of Citadel
Monastery (fig. 2d) Barboi Church Tower (fig. 7a) Beautiful Monastery Tower
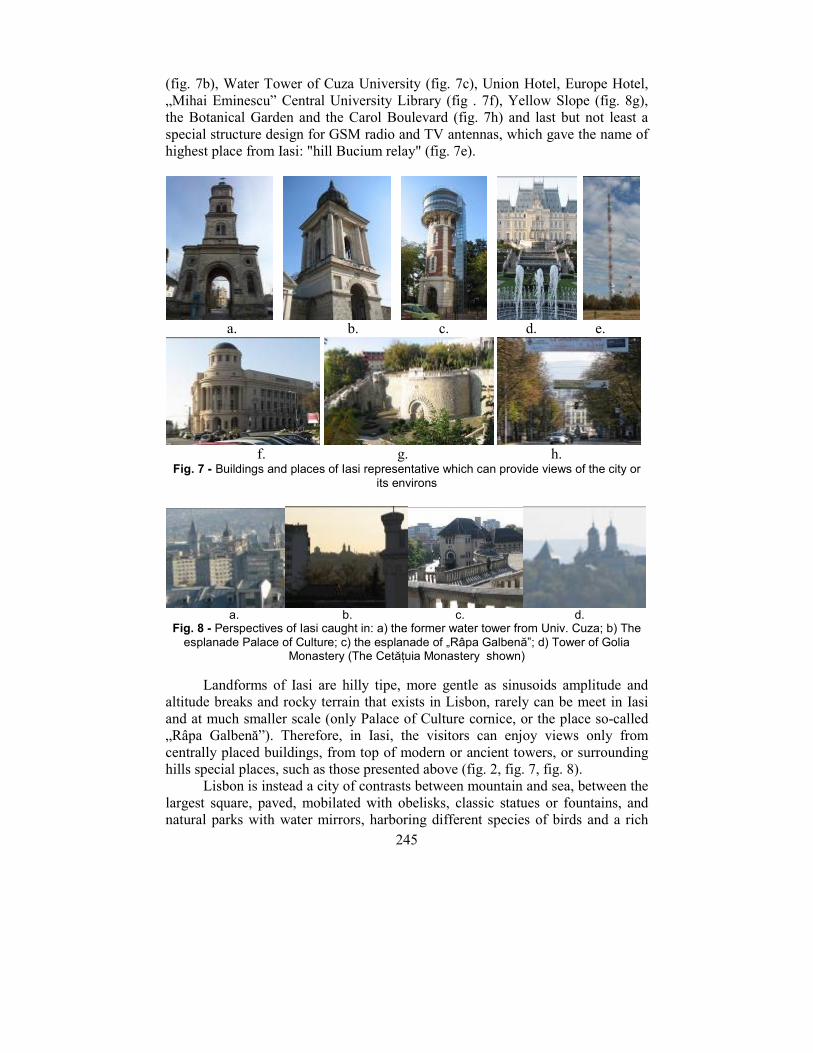
245
(fig. 7b), Water Tower of Cuza University (fig. 7c), Union Hotel, Europe Hotel,
„Mihai Eminescu” Central University Library (fig . 7f), Yellow Slope (fig. 8g),
the Botanical Garden and the Carol Boulevard (fig. 7h) and last but not least a
special structure design for GSM radio and TV antennas, which gave the name of
highest place from Iasi: "hill Bucium relay" (fig. 7e).
a. b. c. d. e.
f. g. h.
Fig. 7 - Buildings and places of Iasi representative which can provide views of the city or its environs
a. b. c. d.
Fig. 8 - Perspectives of Iasi caught in: a) the former water tower from Univ. Cuza; b) The esplanade Palace of Culture; c) the esplanade of „Râpa Galbenă”; d) Tower of Golia
Monastery (The Cetățuia Monastery shown)
Landforms of Iasi are hilly tipe, more gentle as sinusoids amplitude and
altitude breaks and rocky terrain that exists in Lisbon, rarely can be meet in Iasi
and at much smaller scale (only Palace of Culture cornice, or the place so-called
„Râpa Galbenă”). Therefore, in Iasi, the visitors can enjoy views only from
centrally placed buildings, from top of modern or ancient towers, or surrounding
hills special places, such as those presented above (fig. 2, fig. 7, fig. 8).
Lisbon is instead a city of contrasts between mountain and sea, between the
largest square, paved, mobilated with obelisks, classic statues or fountains, and
natural parks with water mirrors, harboring different species of birds and a rich
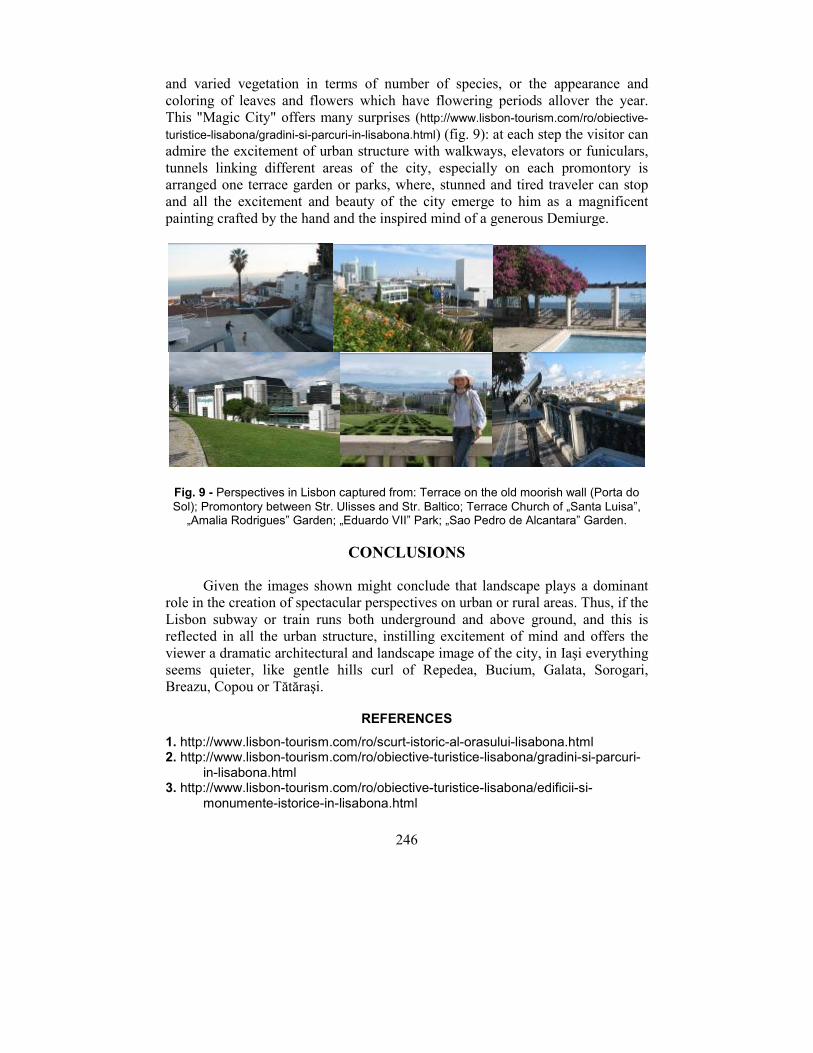
246
and varied vegetation in terms of number of species, or the appearance and
coloring of leaves and flowers which have flowering periods allover the year.
This "Magic City" offers many surprises (http://www.lisbon-tourism.com/ro/obiective-
turistice-lisabona/gradini-si-parcuri-in-lisabona.html) (fig. 9): at each step the visitor can
admire the excitement of urban structure with walkways, elevators or funiculars,
tunnels linking different areas of the city, especially on each promontory is
arranged one terrace garden or parks, where, stunned and tired traveler can stop
and all the excitement and beauty of the city emerge to him as a magnificent
painting crafted by the hand and the inspired mind of a generous Demiurge.
Fig. 9 - Perspectives in Lisbon captured from: Terrace on the old moorish wall (Porta do Sol); Promontory between Str. Ulisses and Str. Baltico; Terrace Church of „Santa Luisa”,
„Amalia Rodrigues” Garden; „Eduardo VII” Park; „Sao Pedro de Alcantara” Garden.
CONCLUSIONS
Given the images shown might conclude that landscape plays a dominant
role in the creation of spectacular perspectives on urban or rural areas. Thus, if the
Lisbon subway or train runs both underground and above ground, and this is
reflected in all the urban structure, instilling excitement of mind and offers the
viewer a dramatic architectural and landscape image of the city, in Iaşi everything
seems quieter, like gentle hills curl of Repedea, Bucium, Galata, Sorogari,
Breazu, Copou or Tătăraşi.
REFERENCES
1. http://www.lisbon-tourism.com/ro/scurt-istoric-al-orasului-lisabona.html 2. http://www.lisbon-tourism.com/ro/obiective-turistice-lisabona/gradini-si-parcuri-
in-lisabona.html 3. http://www.lisbon-tourism.com/ro/obiective-turistice-lisabona/edificii-si-
monumente-istorice-in-lisabona.html
247
ORNAMENTS OF VEGETAL INSPIRATION IN ORTHODOX ARCHITECTURE
ORNAMENTE DE INSPIRAȚIE VEGETALĂ ÎN ARHITECTURA
SPAȚIULUI DE CULT ORTODOX
CEHAN Agata Mihaela1,GHEORGHIȚĂ Constanţa Carmina1
e-mail: [email protected]
Abstract. The Church is the only architectural program able to illustrate the
cohesion between matter and spirit. Faith acts as a binder of the relationship
between religious experiences, aesthetic emotions and rational solutions. The
structure materializes the sacred, while the accompanying associated arts
assigns aesthetic and spiritual meanings. Worship spaces consist on the basis of
rigorous canons which are founded on symbolic meanings. Regarding these
religious ideologies, the vision of these spaces is probative for revealing their
concept of life, world and divinity. The symbol, a link between visible and
imaginary, between concrete and intuitive, expresses clearly the relation
between divine and world. It and represents an indicator to what is beyond it,
but remains always linked in the present reality. This paper aims recognizing
and interpreting the symbolic elements of vegetable inspiration used in the
Orthodox worship spaces, metaphorical images of archetypal space.
Key words: motif, nature, symbol, church, decor Rezumat. Biserica reprezintă singurul program arhitectural capabil să
ilustreze coeziunea dintre materie și spirit. Credința joacă rolul de liant al
legăturii complexe dintre trăiri religioase, estetice și soluții raționale. Structura
materializează sacrul, în timp ce artele conexe ce o însoțesc îi atribuie acesteia
valențe estetice şi spirituale. Spaţiile de cult ortodoxe sunt alcătuite pe baza
unor canoane riguroase ce au la bază semnificaţii simbolice. Conceperea
acestor spaţii este edificatoare în ce priveşte ideologiile religioase respective,
dezvăluind concepţia lor despre viaţă, lume şi divinitate. Simbolul, punte de
legătură între vizibil şi imaginar, între concret şi intuitiv, exprimă cel mai
evident raport dintre divinitate şi lume, constituind un indicator spre ceea ce
este dincolo de el, dar raportat mereu la realitatea prezentă. Lucrarea de faţă
îşi propune recunoaşterea şi interpretarea elementelor simbol de inspirație
vegetală folosite în spaţiile de cult ortodoxe, imagini metaforice ale spaţiului
arhetipal.
Cuvinte cheie: motiv, natură, simbol, biserică, decor
INTRODUCTION
The Church is the only architectural program capable to illustrate the
cohesion between matter and spirit. Faith acts like a bond between the complex
religious experiences, aesthetics and rational solutions. The structure materializes
the sacred, while the related arts assign aesthetic and spiritual meanings.
1„Gh. Asachi” Technical University of Iasi,”G.M. Cantacuzino” Faculty of Architecture, Romania
248
Orthodox worship spaces are composed after rigorous criteria based on
symbolic meanings. Designing these spaces is edifying for the respective religious
ideologies and revealing their conception about life, world and divine.
After Franz Sales Meyer, ornament in its narrower sense, includes elements
of decoration which derive from the natural foliage form. He classifies geometric
elements as non-organic ones, as long as they are organic – have stems, flowers,
leaves, etc. When it is only drawn on paper, a vegetal motif it is abstractly
considered an “ornament”, but when it’s applied in order to embellish an object, it
becomes a “decorative element” or a “motif”. (Meyer, 1988)
MATERIAL AND METHOD
Leading cultural centre and capital of Moldova, Iasi is the keeper of some if the ecclesiastical assemblies, churches and monasteries of great importance for the Romanian history and the Romanian Orthodox Church. This paper examines different churches and monasteries in Iasi, from the perspective of decorative vegetal elements. It aims to identify and interpret symbol elements used in the Orthodox worship spaces, metaphorical images of the archetypal spaces.
As research methods were used: theoretical and photographic documentation, observation and case study.
Architectural monuments analysed are: Galata Monastery Church, Golia Monastery Church, Three Hierarchs Church, Cetatuia Monastery Church, Saint Spridon Church and Frumoasa Monastery Church.
Towards the end of the XVIth century, a new Byzantine influence infiltrates to Moldova. This influence it is felt both in form and in the construction processes. The monument which sets the tone of these new influences is Galata Monastery Church, founded by Petru Schiopul in 1584 (Ionescu, 2007).
The Three Hierarchs Church (1637 -1639) and Golia Monastery (1650-1660), built by Vasile Lupu, are essential and representative monuments of the Moldavian feudal architecture from the first half of the XVIIth century. In this period there is a new orientation of the ecclesiastical architecture, determined by the Wallachian architecture, and by new decorative formulas with Oriental (Georgian or Armenian) or Occidental origins from Poland and Russia (Ionescu, 1981).
Some of the most important monuments through size, but not as significant as originality, mark the ecclesiastic architecture of the second half of the 18 century. They generally reproduce, more or less exactly, representative monuments built by mid-century: Three Hierarchs Monastery and Golia. Thereby, in 1672 Ion Duca Voda builds a monastery, after Three Hierarchs model, called after the name of the hill on which is situated: Cetatuia Monastery (Ionescu, 2007).
Towards the 18th century second half, a new trend emerges to Moldova through Russia – the Italian Neocalssical (Balş, 1933). This period won’t last for long and among its remarcable representatives we can consider Saint Spiridon Church from Iasi, rebuit in 1804 and the Church of Cetatuia Monastery (1836) (Ionescu, 2007).
RESULTS AND DISCUSSIONS
The ornaments analysis focused on the elements that generate the orthodox
architectural space; facades, interior wall decorations, iconostasis, doors and
windows were studied. Also it was studied the decorative elements of the
religious furniture – generating the atmosphere in the Orthodox worship space

249
(stalls, bishop chairs, etc.). Stylized or represented by imitation, singulars or in
groups, the vegetal inspiration assemblies are composed of elements which recall
the acanthus leaf, tulip, rose, pine cone, vines (leaf and fruit), ragged palm leaf,
lotus flower, etc.
a) b) c)
Fig. 1 - Stylized Acanthus - Galata Monastery – details a), b) –-iconostasis; c) – door
a.) b.) c.)
Fig. 2 - Stylized Acanthus –Sf. Spiridon Church – details a) iconostasis; , b), c) – interior fresco
a.) b.)
Fig. 3 - Grapevine – 3 Hierarchs Church a), b) – exterior details
a) b) c)
Fig. 4 - Frumoasa Church – a) ornament on the iconostasis b) interior ornament
Acanthus (Fig. 1 a.,b.,c., Fig. 2 a.,b.,c.,), present as bundles of leaves is the
most present vegetal motif used in architecture and it had never received a
250
symbolic meaning; its frequent and variant applications are due to the ornamental
possibilities and the foliage beauty (Meyer, 1988). The spiral stalk with tendrils is
an invention of the artists because the natural plant is way much simple. Often,
the spindle is completed by other plants such as: laurel, oak, ivy etc., or along its
course it is decorated with various flowers and calyx with acanthus leaf end seen
from aside.
Grape vine (Fig. 3 a., b.), a very popular element, it is adopted by the
religious art as a decorative motif along wheat ears as a symbol of Jesus Christ
(Meyer, 1988). Considering how important agriculture was in all ages, it was
nearly impossible for the decorative art to disregard the cereal plants, although
their poor ornamental possibilities prevented a broad application. Cereal ears
along other motifs were used in various styles.
Laurel and olive (Fig. 4 a.) were introduced into ornaments due to their
symbolic significance. Laurel was consecrated to Apollo and olive to Athens.
Symbol of redemption and reconciliation, laurel leaves were used to crown
victorious heroes. In Ancient Rome the victorious hero was crowned with laurels
and welcomed by slaves who wore olive branches in their hands, when returning
home (Meyer, 1988,). In a similar sense, nowadays, laurel is considered a symbol
of glory and the olive branch a symbol of peace, fertility, purification, victory,
glory and reward. Olive is considered a symbol of eternal life, not only because of
its ever green leaves, but also because it was a source of oil with many uses. In
the Hebrew and Christian tradition, olive is a sacred tree and in the same time a
symbol of peace: the dove brought an olive branch to Noah at the end of the
flood, Jessus’s cross was made from olive and cedar wood – in this way the olive
tree it is associated with the tree of life (Evseev, 1994).
Lotus and papyrus leaves (Fig. 4 b, c.) are symbols of fertility and
immortality. The palm tree (Fig. 4 b.), plays an important role in the ornamental
art. Leafs or branches were used for kings entering in temples in Jerusalem, at
Osiris feasts in Egypt, for the Olympic Games in Greece, and for the triumphal
processions in Ancient Rome. In the Christian church rituals, the palm tree is a
symbol of victory and eternal peace (Meyer,1988).
Flowers, the most beautiful product of the vegetal world, enjoyed, in all
ages the popularity of ornamental art. Whether as plain ornament or relief, they
were used in multiple forms such as bouquets, festoons, garlands etc. or as parts
of floral string courses. Tulips, carnations, roses, lotus flowers are all carrying an
entire universe of decorative styles which are specific to the Romanian Orthodox
worship space, reminiscent of the beauty of the Garden of Eden.
The lotus flower is present in the most of the solar-floral discs which
belong to the second string course of the Three Hierarchs (Fig. 4 a) and reveals
not only the artistic value but in the same time the numerous one – the motif is
present in almost each of the 63 pieces that organize the facades composition.
Having 8 petals, the lotus flower blooms are placed in the first corolla register -
rarely in the second, of the disc. As semantic-symbolic significance, the motif
approaches the Padma lotus (pink lotus) significance – solar emblem (Chevalier
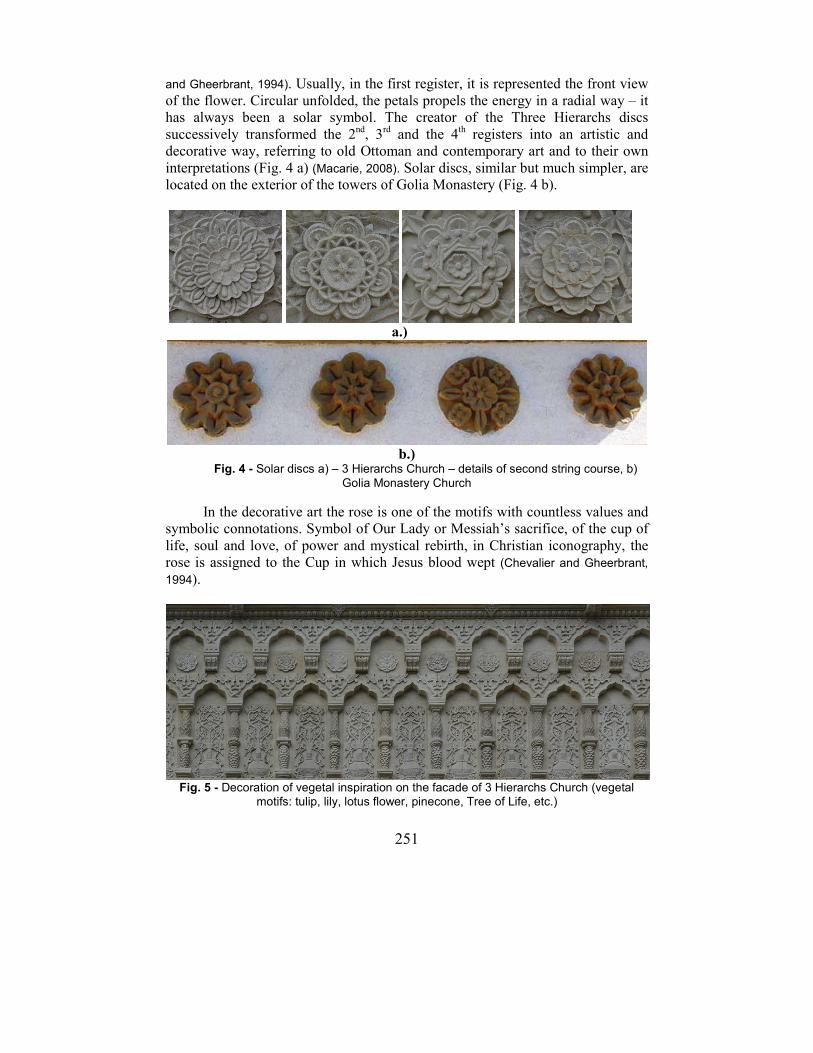
251
and Gheerbrant, 1994). Usually, in the first register, it is represented the front view
of the flower. Circular unfolded, the petals propels the energy in a radial way – it
has always been a solar symbol. The creator of the Three Hierarchs discs
successively transformed the 2nd, 3
rd and the 4
th registers into an artistic and
decorative way, referring to old Ottoman and contemporary art and to their own
interpretations (Fig. 4 a) (Macarie, 2008). Solar discs, similar but much simpler, are
located on the exterior of the towers of Golia Monastery (Fig. 4 b).
a.)
b.) Fig. 4 - Solar discs a) – 3 Hierarchs Church – details of second string course, b)
Golia Monastery Church
In the decorative art the rose is one of the motifs with countless values and
symbolic connotations. Symbol of Our Lady or Messiah’s sacrifice, of the cup of
life, soul and love, of power and mystical rebirth, in Christian iconography, the
rose is assigned to the Cup in which Jesus blood wept (Chevalier and Gheerbrant,
1994).
Fig. 5 - Decoration of vegetal inspiration on the facade of 3 Hierarchs Church (vegetal
motifs: tulip, lily, lotus flower, pinecone, Tree of Life, etc.)
252
In the Three Hierarchs Church lunettes arches, stylized tulips and lilies with
long rods grouped in clusters, are carved in flat relief, while the entire range of
niches are decorated with floral motifs, joined symmetrically and planted in pots
and amphorae (Ionescu, 1981), recalling the Tree of Life (Fig. 5). There is a
discreet and thoughtful fusion between the pagan motif of tree of life and the
Christian cross, perpetuating an only aesthetic syncretism (Macarie, Gh., 2008, p.
205). The lily means purity, innocence, virginity while in Christianity is the
symbol of the Holy Virgin (Evseev, 1999; Chevalier and Gheerbrant, 1994).
CONCLUSIONS
Along time, the vegetal world has been a constant source of inspiration for
the building’s ornamental registers. Flowers or parts of them, trees or just
branches, leaves and/or fruits, alone or in various combinations have been
adopted as decorations through imitation or stylization. Generally, plants chosen
for decorations were peculiar through their beautiful form (leaf outline, branch
delicacy etc.) and by the fact that they have a symbolic meaning- sacred or
profane.
REFERENCES
1. Balş Gh., 1933 – Biserici moldovenești din veacurile al XVII-lea și al XVIII-lea, Institutul de arte grafice „E.Marvan”, București, pp. 281-284
2. Chevalier J., Gheerbrant A., 1994 – Dicționar de simboluri, vol. I, București, Editura Artemis, p. 387
3. Chevalier J., Gheerbrant A., 1994 – Dicționar de simboluri, vol. II, București, Editura Artemis, p. 232
4. Chevalier J., Gheerbrant A., 1994 – Dicționar de simboluri, vol. III, București, Editura Artemis, p.176-177
5. Evseev I, 1994 - Dicționar de simboluri și arhetipuri culturale, editura Amarcond, Timișoara, pp. 102-103
6. Ionescu G., 1981 – Arhitectura României de-a lungul veacurilor, Editura Academiei Republicii Socialiste România, Bucureşti, p. 333
7. Ionescu G., 2007 – Istoria arhitecturii româneşti din cele mai vechi timpuri până la 1900, Editura Capitel, România, Bucureşti, p. 311
8. Macarie, Gh., 2008 – Trăire şi reprezentare. Barocul în artele vizuale ale moldovei secolului al XVII-lea, Editura TehnoPress, Iaşi, p. 216-217
9. Meyer F. S., 1988 – Ornamentica. O gramatică a formelor decorative, vol I, Ed. Meridiane, Bucureşti, p. 27
253
ABOUT THE RADIOACTIVITY OF SOME AGRICULTURAL
PRODUCTS FROM AREAS NEAR CRUCEA URANIUM
MINE
DESPRE RADIOACTIVITATEA UNOR PRODUSE AGRICOLE DIN
VECINÃTATEA MINEI DE URANIU CRUCEA
OANCEA Servilia1, PÃDUREANU Silvica1, CAZACU Ana1, OANCEA A.V.2
e-mail: [email protected]
Abstract. Events like the nuclear accidents that occured at Cernobyl in Ukraine
and Fukushima in Japan have raised public awareness to the many dangers of
working with radioactive elements. When using nuclear energy it is well known
that any controlable nuclear source can in certain circumstances become
uncrontrollable. As a result the radiological monitoring of the enivironment has
increased both in the vicinity of nuclear plants and of uranium mines. The aim
of this paper is the study of local products sampled from areas near the Crucea
uranium mine found in the county of Suceava. The results of our measurements
show that the radioactive activity of mushrooms is significantly higher than the
cosmic background showing that mushrooms have the potential of being used as
bioindicators for radioactivity.
Key words: uranium mine, bioindicators for radioactivity
Rezumat. O serie de evenimente cu un puternic impact asupra oamenilor, cum
a fost accidentul nuclear de la Cernobîl din Ucraina sau cel de la Fukushima
din Japonia, au zguduit opinia publică prin efectele sale. Aceste accidente au
arătat că există pericole în cazul utilizării energiei nucleare şi că orice sursă
controlabilă poate deveni, la un moment dat, necontrolabilă. De aceea s-a
intensificat controlul radioactivitatii mediului in vecinatatea centralelor
nucleare ca şi în vecinătatea minelor de uraniu. Scopul acestei lucrări este
studiul radiactivităţii unor produse agricole prelevate din vecinătate minei de
uraniu Crucea din judeţul Suceava. Rezultatele măsurătorilor noastre arată că
activitatea radioactivă a ciupercilor este semnificativ crescută în raport cu
fondul natural şi acest fapt arată că ciupercile pot fi bioindicatori ai activităţii
radioactive.
Cuvinte cheie: mina de uraniu, bioindicatori pentru radioactivitate
INTRODUCTION
People are exposed to artificial and natural radionuclides that come from
diverse environmental compartments such as air, soil, rivers, vegetables etc.; these
radionuclides come from background radiation or from human activity. Events
like the nuclear accidents that occured at Cernobyl in Ukraine and Fukushima in
Japan have raised public awareness to the many dangers of working with
radioactive elements. In both accidents, most of the radioactivity released was due
1 University of Agricultural Sciences and Veterinary Medicine of Iasi, Romania 2 Erasmus Mundus Advanced Spectroscopy in Chemistry Master, Bologna University, Italy
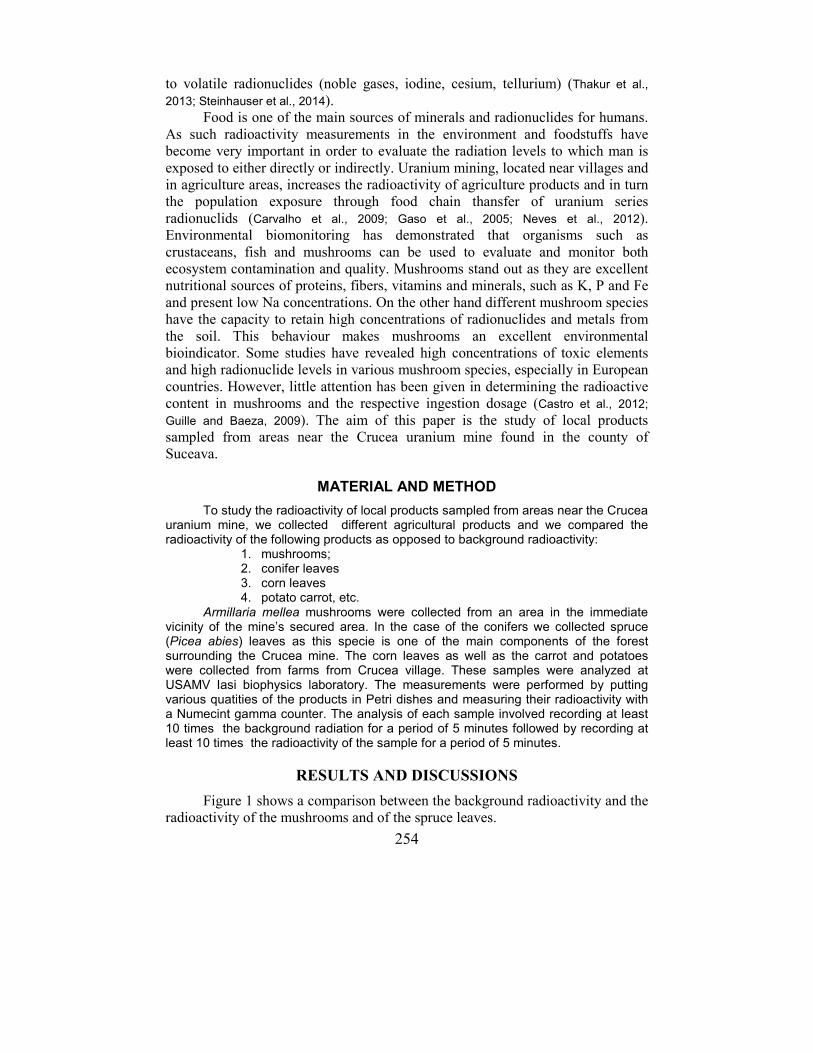
254
to volatile radionuclides (noble gases, iodine, cesium, tellurium) (Thakur et al.,
2013; Steinhauser et al., 2014).
Food is one of the main sources of minerals and radionuclides for humans.
As such radioactivity measurements in the environment and foodstuffs have
become very important in order to evaluate the radiation levels to which man is
exposed to either directly or indirectly. Uranium mining, located near villages and
in agriculture areas, increases the radioactivity of agriculture products and in turn
the population exposure through food chain thansfer of uranium series
radionuclids (Carvalho et al., 2009; Gaso et al., 2005; Neves et al., 2012).
Environmental biomonitoring has demonstrated that organisms such as
crustaceans, fish and mushrooms can be used to evaluate and monitor both
ecosystem contamination and quality. Mushrooms stand out as they are excellent
nutritional sources of proteins, fibers, vitamins and minerals, such as K, P and Fe
and present low Na concentrations. On the other hand different mushroom species
have the capacity to retain high concentrations of radionuclides and metals from
the soil. This behaviour makes mushrooms an excellent environmental
bioindicator. Some studies have revealed high concentrations of toxic elements
and high radionuclide levels in various mushroom species, especially in European
countries. However, little attention has been given in determining the radioactive
content in mushrooms and the respective ingestion dosage (Castro et al., 2012;
Guille and Baeza, 2009). The aim of this paper is the study of local products
sampled from areas near the Crucea uranium mine found in the county of
Suceava.
MATERIAL AND METHOD
To study the radioactivity of local products sampled from areas near the Crucea uranium mine, we collected different agricultural products and we compared the radioactivity of the following products as opposed to background radioactivity:
1. mushrooms; 2. conifer leaves 3. corn leaves 4. potato carrot, etc.
Armillaria mellea mushrooms were collected from an area in the immediate vicinity of the mine’s secured area. In the case of the conifers we collected spruce (Picea abies) leaves as this specie is one of the main components of the forest surrounding the Crucea mine. The corn leaves as well as the carrot and potatoes were collected from farms from Crucea village. These samples were analyzed at USAMV Iasi biophysics laboratory. The measurements were performed by putting various quatities of the products in Petri dishes and measuring their radioactivity with a Numecint gamma counter. The analysis of each sample involved recording at least 10 times the background radiation for a period of 5 minutes followed by recording at least 10 times the radioactivity of the sample for a period of 5 minutes.
RESULTS AND DISCUSSIONS
Figure 1 shows a comparison between the background radioactivity and the
radioactivity of the mushrooms and of the spruce leaves.
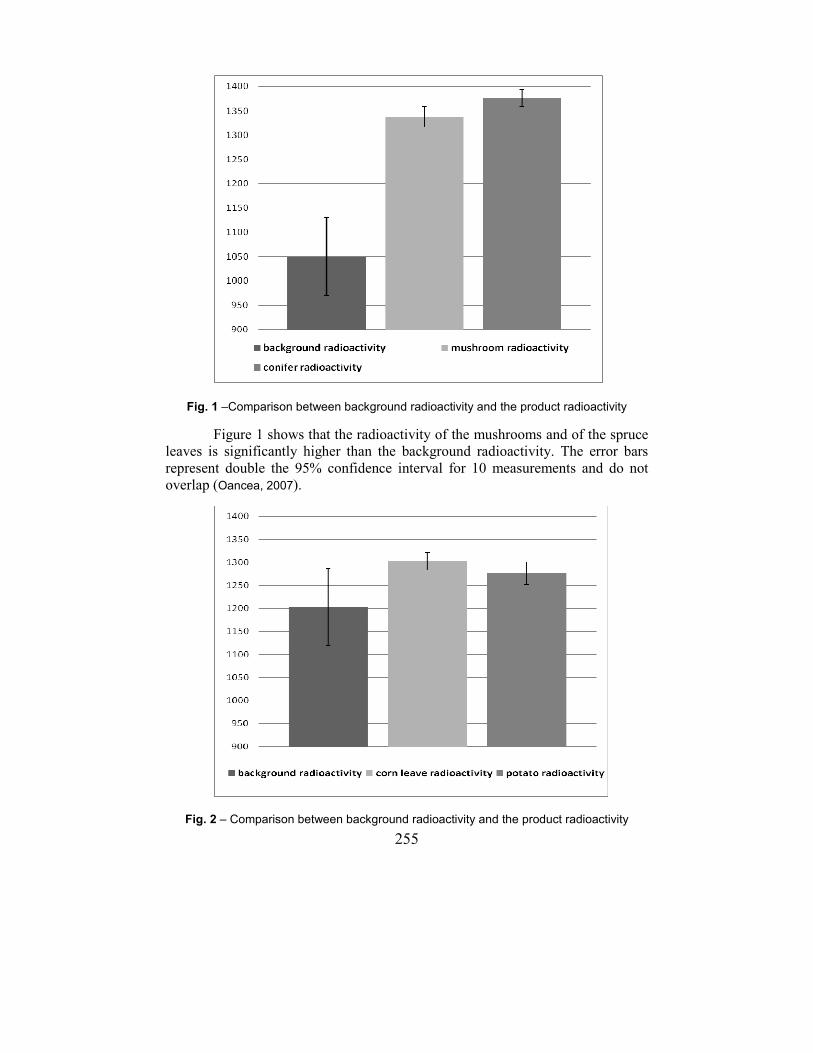
255
Fig. 1 –Comparison between background radioactivity and the product radioactivity
Figure 1 shows that the radioactivity of the mushrooms and of the spruce
leaves is significantly higher than the background radioactivity. The error bars
represent double the 95% confidence interval for 10 measurements and do not
overlap (Oancea, 2007).
Fig. 2 – Comparison between background radioactivity and the product radioactivity
256
By contrary, figure 2 shows that the radioactivity of the potato is not
significantly different as opposed to the background radioactivity because the
errors bars overlap. The same results can be found in the case of the radioactivity
of the carrot (not present in this figure). We suggest that the potato and carrot
grow in soil and the maximum of absorption is for volatile radionuclids from the
air, which are deposited on plant surfaces. This is the reason why the radioactivity
of corn leaves is higher than the radioactivity of the potato. At the same time the
radioactivity of corn leaves, which had a short exposure time of a few months, is
lower than the radioactivity of the spruce leaves which had a much longer
exposure time.
CONCLUSIONS
The radioactivity measurements of local products sampled from areas near
the Crucea uranium mine show that the mushroom have an increased
radioactivity. Mushrooms have the capacity to retain high concentrations of
radionuclides especially from the atmosphere due to the great surface of
absorbtion. This makes mushrooms useful in the evaluation and monitoring of
environmental contamination and quality. Because mushrooms represent one of
the common constituents in the nutrition of the citizens of Crucea village, the
monitoring of the radioactivity of these products is necessary in order to insure
the health and safety of these people.
REFERENCES
1. Carvalho F.P., Oliveira J.M., Malta M., 2009 - Analyses of radionuclides in soil, water and products near the Ugeirica uranium mine in Portugal, J.Radioanal. Nucl.
Chem., vol. 281, pp. 479-484 2. Castro de L.P., Maihara V.A., Silva P.S.C., Figueira R.C.L., 2012 – Artificial and
natural radioactivity in edible mushrooms from Sao Paulo, Brazil, Journal of Environmental Radioactivity, vol. 113, pp. 150-154
3. Gaso M.I., Segovia N., Morton O., 2005 – Environmental impact assessment of uranium ore mining and radioactive waste around a storage centre from Mexico, Radioprotection, Suppl. 1, 40, pp. S739-S745
4. Guillen J., Baeza A., 2009 – Radioactivity in mushrooms: A health hazard?, Food
Chemistry, vol. 154, pp. 14-25 5. Neves M.O., Abreu M.M., Figueiredo V., 2012 – Uranium in vegetable foodstuffs:
should residents near the Cunha Baixa uranium mine site (Central Northern Portugal) be concerned?, Environ. Geochem. Health, vol. 34(2), pp. 181-189
6. Oancea S., 2007 – Ghid de prelucrare rapidă a datelor experimentale, Editura
Performantica, Iasi 7. Steinhauser G., Brandl A., Johnson T.E, 2014 – Comparison of the Cernobyl and
Fukushima nuclear accidents: A review of the environmental impacts, Science of Total Environment, vol. 470-471, pp. 800-817
8. Thakur.P., Ballard S., Nelson R., 2013 – An overview of Fukushima radionuclids measured in the northerm emisphere, Science of Total Environment, vol. 458-460, pp. 577-613
257
APPLYING THE CHAB CONCEPT AT
HORTICULTURAL TUNNEL GREENHOUSES HEATED
WITH BIOMASS
APLICAREA CONCEPTULUI CHAB LA SOLARIILE HORTICOLE
ÎNCĂLZITE CU BIOMASĂ
MURAD E.
1
e-mail: [email protected]
Abstract: For heating tunnel horticultural greenhouses in cold season applies
the concept CHAB (Combined Heat And Biochar production) which
synergistically incorporating thermal energy and biochar production from
biomass gasified with TLUD process that produces fuel gas and 12..15 %
biochar. Biochar is a vegetal active carbon, sterile, pH > 9 and a high
adsorption capacity, used as agricultural amendment and carbon sequestration.
Sold with 400...1000 €/t can get zero or negative costs for heat produced.
Simulate experiments were performed to a model of the 200 m2 tunnel
greenhouses are grown tomatoes. For heating in four cold months consumed 13
t chopped and dried tomato stalks and resulting 1.8 t biochar which
incorporated in the ground leads to a negative balance of -6.34 t.CO2/year.
Average daily cost for fuel is 5,91 €/day without a biochar recovery and -4.78
€/day for a biochar recovery with price of 680 €/t in EU.
Keywords: tunnel greenhouse, biomass, CHAB, biochar, simulation
Rezumat: Pentru încălzirea solariilor tunel în lunile mai reci se aplică
conceptul CHAB (Combined Heat And Biochar production), care încorporează
sinergic producerea de energie termică şi biochar din biomasa gazeificată cu
procedeul TLUD care produce gaz combustibil şi biochar. Biocharul este un
cărbune activ, steril, cu pH > 9 şi cu o mare capacitate de adsorbţie, utilizabil
ca amendament agricol şi pentru sechestrarea carbonului în sol. Comercializat
la 400..1000 €/t se pot obţine costuri zero sau negative pentru energia termică
produsă. Experimentele simulate s-au efectuat cu un modelul de solariu de 200
m2 în care se cultivă tomate. Pentru încălzirea în patru luni reci se consumă 13
t vrejuri de tomate, tocare si uscate, din care rezultă 1,8 t biochar care introdus
în sol duce la un bilanţ negativ de -6.34 t.CO2 /an. Costul zilnic pentru biomasa
este de 5.91 €/zi fără valorificare biochar, iar prin valorificarea biocharului cu
680 €/t este de – 4.78 €/zi.
Cuvinte cheie: solariu, biomasă, CHAB, biochar, simulare
INTRODUCTION
It is essential for the health of the population increase zonal production of
vegetables for consum all winter. In Romania cold season vegetable production
comes about 2/3 of unheated greenhouses. To increase the production of
vegetables in cold season, by increasing the use time of tunnel greenhouses, is
1 University "Politehnica" of Bucuresti, Romania
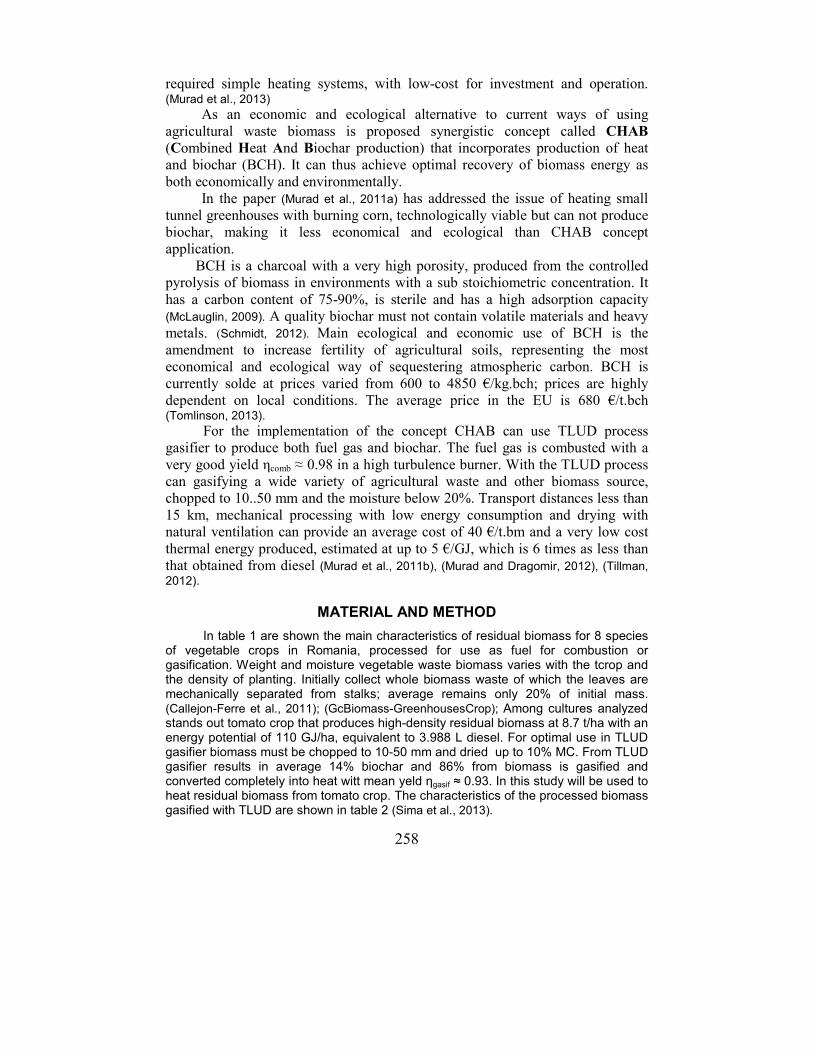
258
required simple heating systems, with low-cost for investment and operation. (Murad et al., 2013)
As an economic and ecological alternative to current ways of using
agricultural waste biomass is proposed synergistic concept called CHAB
(Combined Heat And Biochar production) that incorporates production of heat
and biochar (BCH). It can thus achieve optimal recovery of biomass energy as
both economically and environmentally.
In the paper (Murad et al., 2011a) has addressed the issue of heating small
tunnel greenhouses with burning corn, technologically viable but can not produce
biochar, making it less economical and ecological than CHAB concept
application.
BCH is a charcoal with a very high porosity, produced from the controlled
pyrolysis of biomass in environments with a sub stoichiometric concentration. It
has a carbon content of 75-90%, is sterile and has a high adsorption capacity
(McLauglin, 2009). A quality biochar must not contain volatile materials and heavy
metals. (Schmidt, 2012). Main ecological and economic use of BCH is the
amendment to increase fertility of agricultural soils, representing the most
economical and ecological way of sequestering atmospheric carbon. BCH is
currently solde at prices varied from 600 to 4850 €/kg.bch; prices are highly
dependent on local conditions. The average price in the EU is 680 €/t.bch (Tomlinson, 2013).
For the implementation of the concept CHAB can use TLUD process
gasifier to produce both fuel gas and biochar. The fuel gas is combusted with a
very good yield ηcomb ≈ 0.98 in a high turbulence burner. With the TLUD process
can gasifying a wide variety of agricultural waste and other biomass source,
chopped to 10..50 mm and the moisture below 20%. Transport distances less than
15 km, mechanical processing with low energy consumption and drying with
natural ventilation can provide an average cost of 40 €/t.bm and a very low cost
thermal energy produced, estimated at up to 5 €/GJ, which is 6 times as less than
that obtained from diesel (Murad et al., 2011b), (Murad and Dragomir, 2012), (Tillman,
2012).
MATERIAL AND METHOD
In table 1 are shown the main characteristics of residual biomass for 8 species of vegetable crops in Romania, processed for use as fuel for combustion or gasification. Weight and moisture vegetable waste biomass varies with the tcrop and the density of planting. Initially collect whole biomass waste of which the leaves are mechanically separated from stalks; average remains only 20% of initial mass. (Callejon-Ferre et al., 2011); (GcBiomass-GreenhousesCrop); Among cultures analyzed stands out tomato crop that produces high-density residual biomass at 8.7 t/ha with an energy potential of 110 GJ/ha, equivalent to 3.988 L diesel. For optimal use in TLUD gasifier biomass must be chopped to 10-50 mm and dried up to 10% MC. From TLUD gasifier results in average 14% biochar and 86% from biomass is gasified and converted completely into heat witt mean yeld ηgasif ≈ 0.93. In this study will be used to heat residual biomass from tomato crop. The characteristics of the processed biomass gasified with TLUD are shown in table 2 (Sima et al., 2013).
259
To carry out experiments to simulate especially a tunnel greenhouse consists of 28 QUONSET-Metric type base module 6 m, 3 m high, 1.2 m pitch, which has a ground area of 200 m
2, and a volume of 475 m
3. It is covered with a double foil of
polyethylene, inflatable and high thermal resistance (Murad et al., 2013).
In greenhouse grown tomatoes varieties Romanian-VIDRA, for which is experimental data for breath and sweating. In order to protect the plants from contact with air currents too hot, the maximum temperature of the jets is limited to 40°C, which required a constant rate Dav = 2300 m
3/h air which is heated tunnel greenhouse
(Murad et al., 2013).
Figure 1 shows the block diagram of the heated solarium with a hot air system that uses two modules BGM (Biomass-Gasification-Module). The two modules are coupled to the input heat exchanger operating at a constant flow rate of the heated air and consequently has a minimum yield of 85%.
Table 1. Processed biomass from greenhouses crop residues
Crop Species
BM sorted (dm)
LHV (dm)
Moist-ure
LHV (wet)
BM sorted (wet)
BCH (mean)
LHV BCH
(mean)
LHV BM
(gasif)
Energy content (gasif)
t/ha MJ/kg % MJ/kg t/ha % MJ/kg MJ/kg GJ/ha
Courgette 3.20 14.67 10.00 13.20 3.56 14.00 18.50 12.34 37.74
Cucumber 3.84 14.36 10.00 12.92 4.27 14.00 18.50 12.02 44.09
Aubergine 4.32 19.27 10.00 17.34 4.80 14.00 18.50 17.15 70.81
Tomato 7.84 17.14 10.00 15.43 8.71 14.00 18.50 14.93 111.82
Bean 3.68 19.86 10.00 17.87 4.09 14.00 18.50 17.77 62.49
Green pepper 4.48 17.69 10.00 15.92 4.98 14.00 18.50 15.50 66.36
Water melon 3.84 16.42 10.00 14.78 4.27 14.00 18.50 14.17 52.00
Melon 5.28 15.49 10.00 13.94 5.87 14.00 18.50 13.20 66.59
Mean 4.56 16.86 10.00 15.18 5.07 14.00 18.50 14.64 63.99
Table 2
Processed tomato wastes from gasification
Features UM Input
Biomass Biochar
Gasified Biomass
Relative mass % 100.00 14.00 86.00
Oxygen % 40.98 3.70 47.05
Hydrogen % 5.98 2.10 6.62
Ash % 2.74 19.50 0.00
Water % 10.00 0.00 11.63
LHV MJ/kg 15.20 18.60 14.64
Average bed density kg/m3 225.00 180.00 -
Procesed biomass t/ha 8.70 1.22 7.48
CO2 balance t/ha 0.00 -3.34 0.00
Two module BGM type GAZMER
T-31/100 are used, the size of the reactors
was determined by the possibility of using chopped biomass with bed density of 200..300 kg/m
3. Rated power module is 23 ± 3 kW. (Murad and Dragomir, 2012)
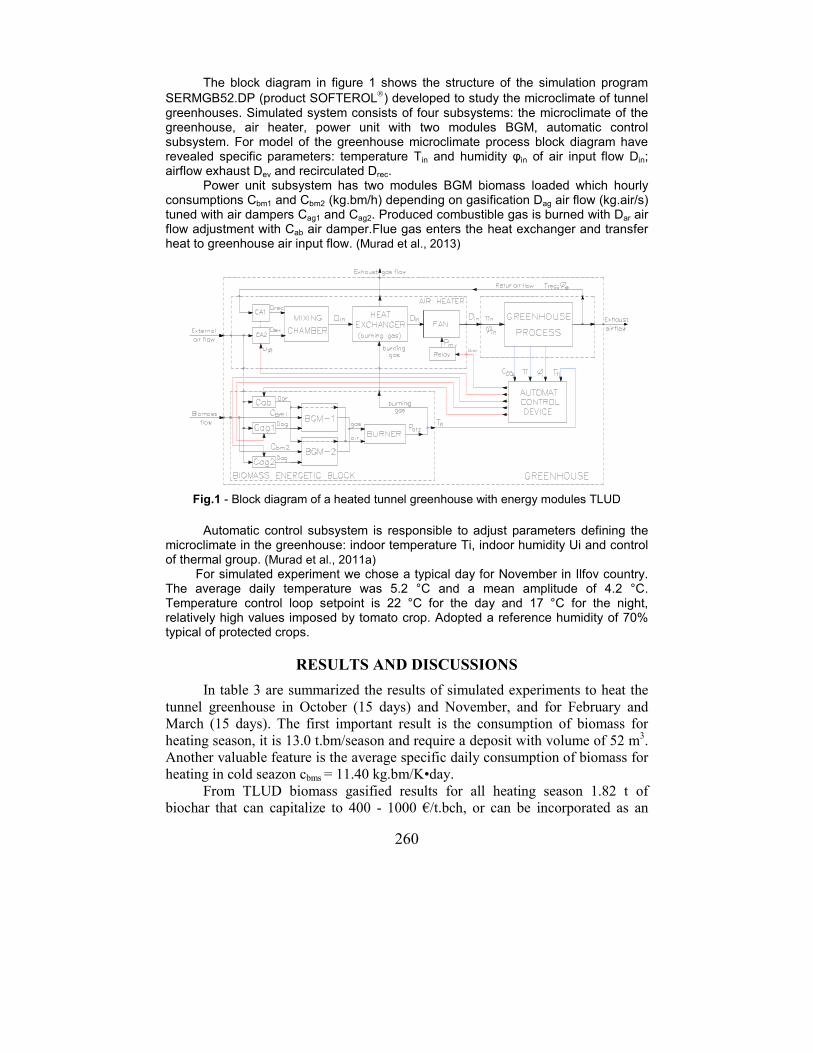
260
The block diagram in figure 1 shows the structure of the simulation program
SERMGB52.DP (product SOFTEROL) developed to study the microclimate of tunnel
greenhouses. Simulated system consists of four subsystems: the microclimate of the greenhouse, air heater, power unit with two modules BGM, automatic control subsystem. For model of the greenhouse microclimate process block diagram have revealed specific parameters: temperature Tin and humidity φin of air input flow Din; airflow exhaust Dev and recirculated Drec.
Power unit subsystem has two modules BGM biomass loaded which hourly consumptions Cbm1 and Cbm2 (kg.bm/h) depending on gasification Dag air flow (kg.air/s) tuned with air dampers Cag1 and Cag2. Produced combustible gas is burned with Dar air flow adjustment with Cab air damper.Flue gas enters the heat exchanger and transfer heat to greenhouse air input flow. (Murad et al., 2013)
Fig.1 - Block diagram of a heated tunnel greenhouse with energy modules TLUD
Automatic control subsystem is responsible to adjust parameters defining the microclimate in the greenhouse: indoor temperature Ti, indoor humidity Ui and control of thermal group. (Murad et al., 2011a)
For simulated experiment we chose a typical day for November in Ilfov country. The average daily temperature was 5.2 °C and a mean amplitude of 4.2 °C. Temperature control loop setpoint is 22 °C for the day and 17 °C for the night, relatively high values imposed by tomato crop. Adopted a reference humidity of 70% typical of protected crops.
RESULTS AND DISCUSSIONS
In table 3 are summarized the results of simulated experiments to heat the
tunnel greenhouse in October (15 days) and November, and for February and
March (15 days). The first important result is the consumption of biomass for
heating season, it is 13.0 t.bm/season and require a deposit with volume of 52 m3.
Another valuable feature is the average specific daily consumption of biomass for
heating in cold seazon cbms = 11.40 kg.bm/K•day.
From TLUD biomass gasified results for all heating season 1.82 t of
biochar that can capitalize to 400 - 1000 €/t.bch, or can be incorporated as an
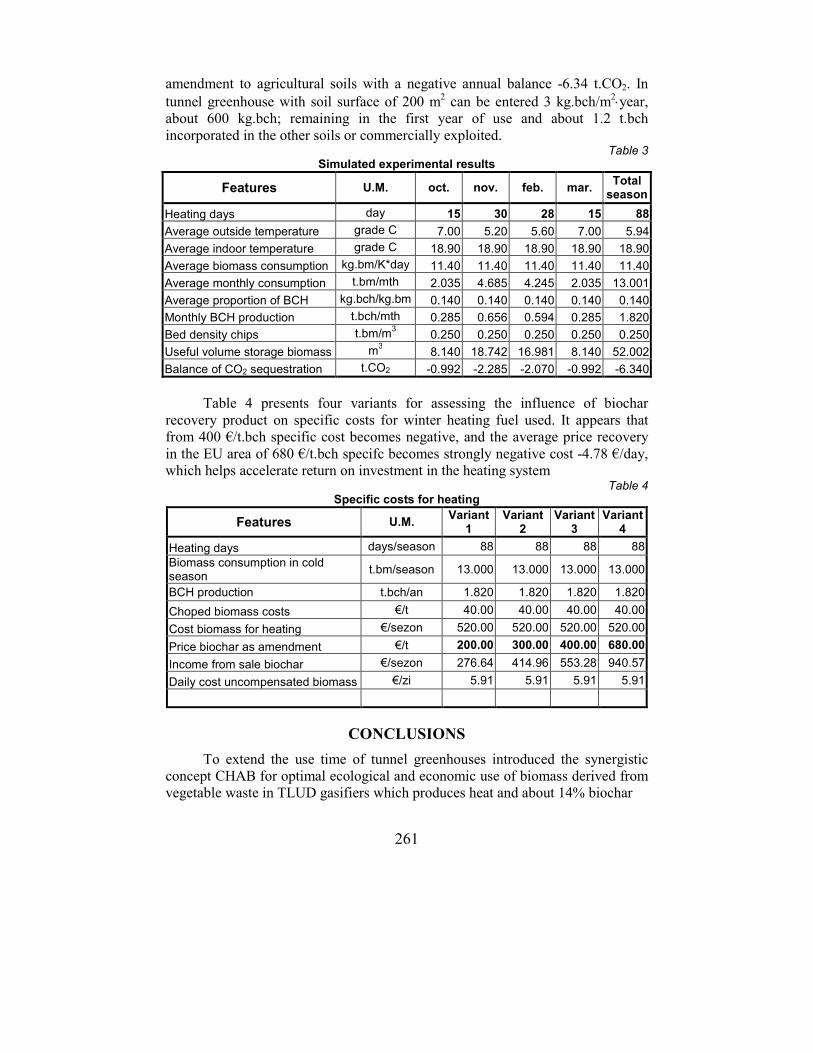
261
amendment to agricultural soils with a negative annual balance -6.34 t.CO2. In
tunnel greenhouse with soil surface of 200 m2 can be entered 3 kg.bch/m
2⋅year,
about 600 kg.bch; remaining in the first year of use and about 1.2 t.bch
incorporated in the other soils or commercially exploited. Table 3
Simulated experimental results
Features U.M. oct. nov. feb. mar. Total
season
Heating days day 15 30 28 15 88
Average outside temperature grade C 7.00 5.20 5.60 7.00 5.94
Average indoor temperature grade C 18.90 18.90 18.90 18.90 18.90
Average biomass consumption kg.bm/K*day 11.40 11.40 11.40 11.40 11.40
Average monthly consumption t.bm/mth 2.035 4.685 4.245 2.035 13.001
Average proportion of BCH kg.bch/kg.bm 0.140 0.140 0.140 0.140 0.140
Monthly BCH production t.bch/mth 0.285 0.656 0.594 0.285 1.820
Bed density chips t.bm/m3 0.250 0.250 0.250 0.250 0.250
Useful volume storage biomass m3 8.140 18.742 16.981 8.140 52.002
Balance of CO2 sequestration t.CO2 -0.992 -2.285 -2.070 -0.992 -6.340
Table 4 presents four variants for assessing the influence of biochar
recovery product on specific costs for winter heating fuel used. It appears that
from 400 €/t.bch specific cost becomes negative, and the average price recovery
in the EU area of 680 €/t.bch specifc becomes strongly negative cost -4.78 €/day,
which helps accelerate return on investment in the heating system Table 4
Specific costs for heating
Features U.M. Variant
1 Variant
2 Variant
3 Variant
4
Heating days days/season 88 88 88 88
Biomass consumption in cold season
t.bm/season 13.000 13.000 13.000 13.000
BCH production t.bch/an 1.820 1.820 1.820 1.820
Choped biomass costs €/t 40.00 40.00 40.00 40.00
Cost biomass for heating €/sezon 520.00 520.00 520.00 520.00
Price biochar as amendment €/t 200.00 300.00 400.00 680.00
Income from sale biochar €/sezon 276.64 414.96 553.28 940.57
Daily cost uncompensated biomass €/zi 5.91 5.91 5.91 5.91
CONCLUSIONS
To extend the use time of tunnel greenhouses introduced the synergistic
concept CHAB for optimal ecological and economic use of biomass derived from
vegetable waste in TLUD gasifiers which produces heat and about 14% biochar
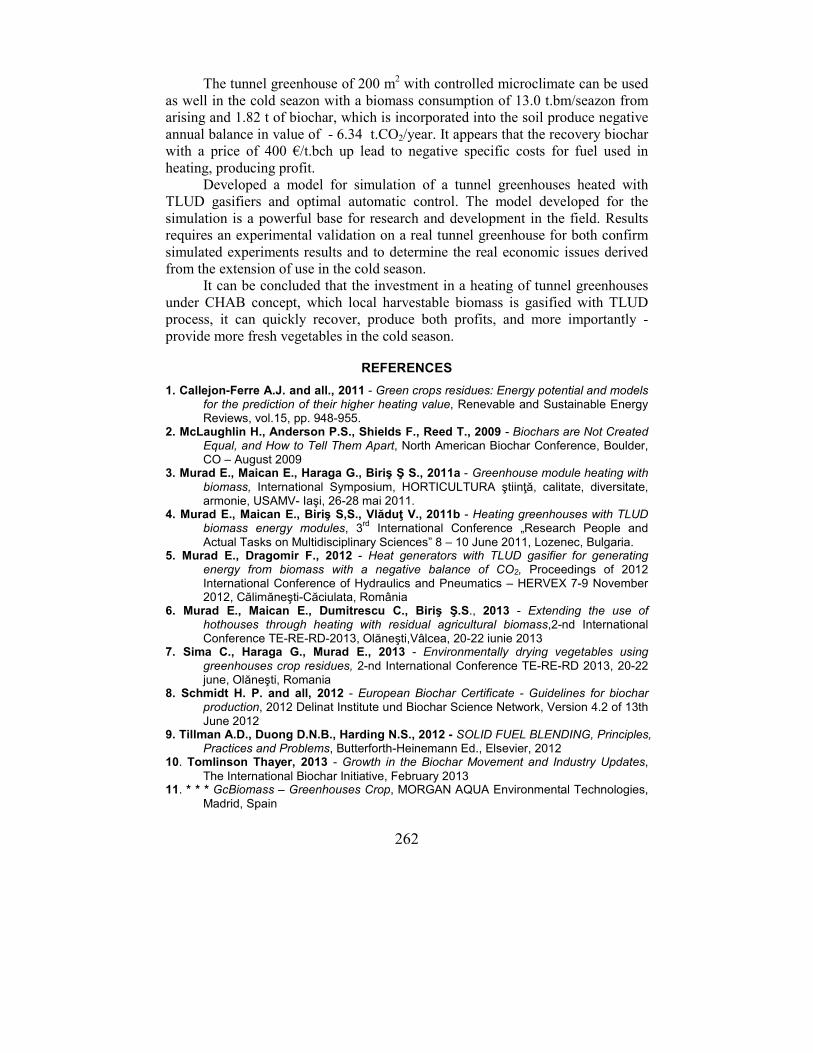
262
The tunnel greenhouse of 200 m2 with controlled microclimate can be used
as well in the cold seazon with a biomass consumption of 13.0 t.bm/seazon from
arising and 1.82 t of biochar, which is incorporated into the soil produce negative
annual balance in value of - 6.34 t.CO2/year. It appears that the recovery biochar
with a price of 400 €/t.bch up lead to negative specific costs for fuel used in
heating, producing profit.
Developed a model for simulation of a tunnel greenhouses heated with
TLUD gasifiers and optimal automatic control. The model developed for the
simulation is a powerful base for research and development in the field. Results
requires an experimental validation on a real tunnel greenhouse for both confirm
simulated experiments results and to determine the real economic issues derived
from the extension of use in the cold season.
It can be concluded that the investment in a heating of tunnel greenhouses
under CHAB concept, which local harvestable biomass is gasified with TLUD
process, it can quickly recover, produce both profits, and more importantly -
provide more fresh vegetables in the cold season.
REFERENCES
1. Callejon-Ferre A.J. and all., 2011 - Green crops residues: Energy potential and models for the prediction of their higher heating value, Renevable and Sustainable Energy Reviews, vol.15, pp. 948-955.
2. McLaughlin H., Anderson P.S., Shields F., Reed T., 2009 - Biochars are Not Created Equal, and How to Tell Them Apart, North American Biochar Conference, Boulder, CO – August 2009
3. Murad E., Maican E., Haraga G., Biriş Ş S., 2011a - Greenhouse module heating with
biomass, International Symposium, HORTICULTURA ştiinţă, calitate, diversitate, armonie, USAMV- Iaşi, 26-28 mai 2011.
4. Murad E., Maican E., Biriş S,S., Vlăduţ V., 2011b - Heating greenhouses with TLUD biomass energy modules, 3
rd International Conference „Research People and
Actual Tasks on Multidisciplinary Sciences” 8 – 10 June 2011, Lozenec, Bulgaria. 5. Murad E., Dragomir F., 2012 - Heat generators with TLUD gasifier for generating
energy from biomass with a negative balance of CO2, Proceedings of 2012 International Conference of Hydraulics and Pneumatics – HERVEX 7-9 November 2012, Călimăneşti-Căciulata, România
6. Murad E., Maican E., Dumitrescu C., Biriş Ş.S., 2013 - Extending the use of hothouses through heating with residual agricultural biomass,2-nd International Conference TE-RE-RD-2013, Olăneşti,Vâlcea, 20-22 iunie 2013
7. Sima C., Haraga G., Murad E., 2013 - Environmentally drying vegetables using
greenhouses crop residues, 2-nd International Conference TE-RE-RD 2013, 20-22 june, Olăneşti, Romania
8. Schmidt H. P. and all, 2012 - European Biochar Certificate - Guidelines for biochar production, 2012 Delinat Institute und Biochar Science Network, Version 4.2 of 13th
June 2012 9. Tillman A.D., Duong D.N.B., Harding N.S., 2012 - SOLID FUEL BLENDING, Principles,
Practices and Problems, Butterforth-Heinemann Ed., Elsevier, 2012 10. Tomlinson Thayer, 2013 - Growth in the Biochar Movement and Industry Updates,
The International Biochar Initiative, February 2013 11. * * * GcBiomass – Greenhouses Crop, MORGAN AQUA Environmental Technologies,
Madrid, Spain
263
STORMWATER MANAGEMENT: THE ROLE OF URBAN TREES
ROLUL ARBORILOR URBANI ÎN GESTIONAREA APEI PLUVIALE
POHOAłĂ LUPU Oana 1, DRAGHIA Lucia1
e-mail: [email protected]
Abstract. The influence of urban trees in management of stormwater is to
moderate the microclimate, to reduce the ”urban heat island” (UHI) through
shading and evaporative cooling and also, by reducing glare and insolation.
Trees intercept a portion of rainfall that evaporates and never reaches the
ground. Surface runoff is avoided when precipitation is held on foliage until it
returns into the atmosphere. The capacity of water interception is influenced by
biological and structural characteristics of the trees (species-specific factors),
and by climatic conditions (site-specific factors). The purpose of this paper is to
study the water storage and evaporation capacity of the three important tree
species identified in a typical urban of Iași: Acer platanoides L., Aesculus
hippocastanum L. and Tilia sp.
Key words: surface runoff, rainfall interception, stormwater management
Rezumat. Arborii din peisajul urban contribuie la gestionarea apelor pluviale
prin aportul lor în ceea ce privește ameliorarea microclimatică, diminuarea
efectelor datorate fenomenului denumit ”insulă de căldură” prin umbrire și
evaporare și, de asemenea, prin reducerea iluminării excesive și a insolației.
Arborii interceptează în coronament o parte din volumul de precipitații și îl
redă atmosferei prin evaporare. Componentele structurale ale arborilor rețin
apa care astfel nu ajunge pe suprafața solului, evitându-se scurgerile.
Capacitatea de interceptarea a apei din precipitații este influențată de
caracteristicile biologice și structurale (factori de specie) și de condițiile
climatice (factori de sit). Lucrarea de față analizează capacitatea de stocare și
evaporare a apei pluviale prin intermediul a trei dintre cele mai utilizate specii
arboricole din mediul urban Iași: Acer platanoides L., Aesculus hippocastanum
L. şi Tilia sp.
Cuvinte cheie: scurgerea de suprafață, interceptarea apei din precipitații,
managementul apelor pluviale
INTRODUCTION
Surface stormwater runoff is a cause for concern in many urban areas.
Urbanization alters flow pathways, water storage, rates of evaporation, groundwater
recharge, surface runoff, the timing and extent of flooding. Trees reduce stormwater
runoff by their canopy cover, which saves city stormwater management costs.
1University of Agricultural Sciences and Veterinary Medicine Iasi, Romania
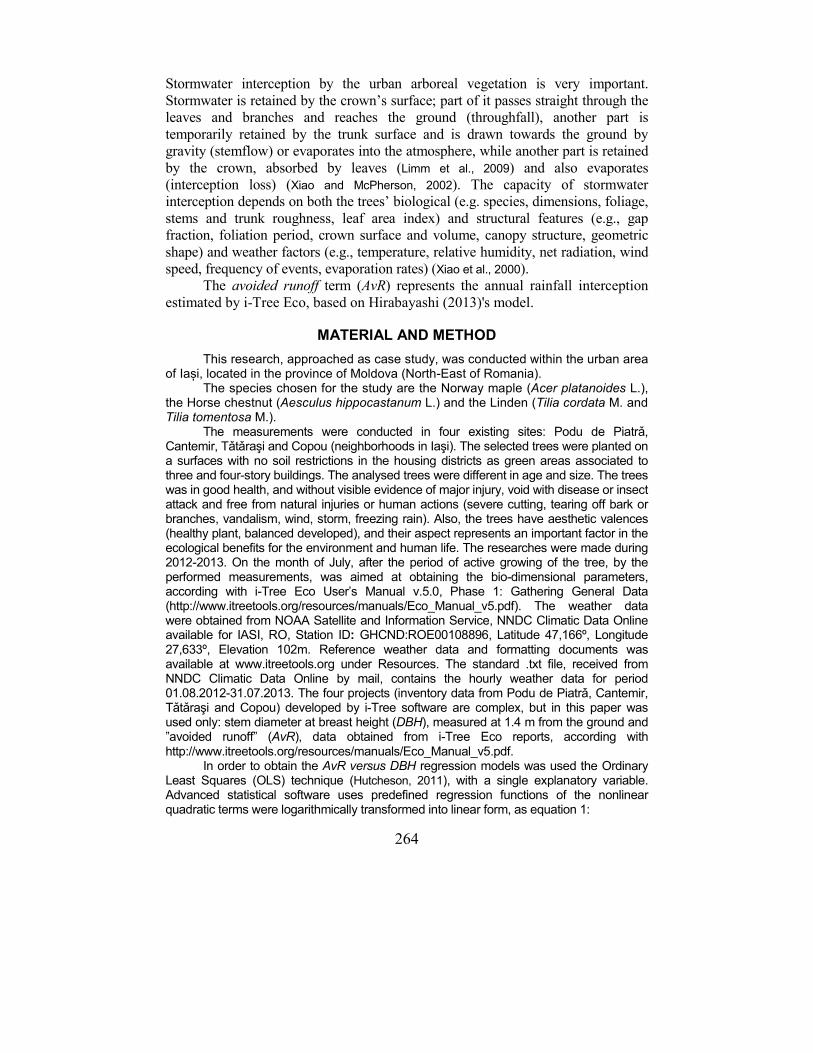
264
Stormwater interception by the urban arboreal vegetation is very important.
Stormwater is retained by the crown’s surface; part of it passes straight through the
leaves and branches and reaches the ground (throughfall), another part is
temporarily retained by the trunk surface and is drawn towards the ground by
gravity (stemflow) or evaporates into the atmosphere, while another part is retained
by the crown, absorbed by leaves (Limm et al., 2009) and also evaporates
(interception loss) (Xiao and McPherson, 2002). The capacity of stormwater
interception depends on both the trees’ biological (e.g. species, dimensions, foliage,
stems and trunk roughness, leaf area index) and structural features (e.g., gap
fraction, foliation period, crown surface and volume, canopy structure, geometric
shape) and weather factors (e.g., temperature, relative humidity, net radiation, wind
speed, frequency of events, evaporation rates) (Xiao et al., 2000).
The avoided runoff term (AvR) represents the annual rainfall interception
estimated by i-Tree Eco, based on Hirabayashi (2013)'s model.
MATERIAL AND METHOD
This research, approached as case study, was conducted within the urban area of Iași, located in the province of Moldova (North-East of Romania).
The species chosen for the study are the Norway maple (Acer platanoides L.), the Horse chestnut (Aesculus hippocastanum L.) and the Linden (Tilia cordata M. and Tilia tomentosa M.).
The measurements were conducted in four existing sites: Podu de Piatrǎ, Cantemir, Tǎtǎraşi and Copou (neighborhoods in Iaşi). The selected trees were planted on a surfaces with no soil restrictions in the housing districts as green areas associated to three and four-story buildings. The analysed trees were different in age and size. The trees was in good health, and without visible evidence of major injury, void with disease or insect attack and free from natural injuries or human actions (severe cutting, tearing off bark or branches, vandalism, wind, storm, freezing rain). Also, the trees have aesthetic valences (healthy plant, balanced developed), and their aspect represents an important factor in the ecological benefits for the environment and human life. The researches were made during 2012-2013. On the month of July, after the period of active growing of the tree, by the performed measurements, was aimed at obtaining the bio-dimensional parameters, according with i-Tree Eco User’s Manual v.5.0, Phase 1: Gathering General Data (http://www.itreetools.org/resources/manuals/Eco_Manual_v5.pdf). The weather data were obtained from NOAA Satellite and Information Service, NNDC Climatic Data Online available for IASI, RO, Station ID: GHCND:ROE00108896, Latitude 47,166º, Longitude 27,633º, Elevation 102m. Reference weather data and formatting documents was available at www.itreetools.org under Resources. The standard .txt file, received from NNDC Climatic Data Online by mail, contains the hourly weather data for period 01.08.2012-31.07.2013. The four projects (inventory data from Podu de Piatrǎ, Cantemir, Tǎtǎraşi and Copou) developed by i-Tree software are complex, but in this paper was used only: stem diameter at breast height (DBH), measured at 1.4 m from the ground and ”avoided runoff” (AvR), data obtained from i-Tree Eco reports, according with http://www.itreetools.org/resources/manuals/Eco_Manual_v5.pdf.
In order to obtain the AvR versus DBH regression models was used the Ordinary Least Squares (OLS) technique (Hutcheson, 2011), with a single explanatory variable. Advanced statistical software uses predefined regression functions of the nonlinear quadratic terms were logarithmically transformed into linear form, as equation 1:
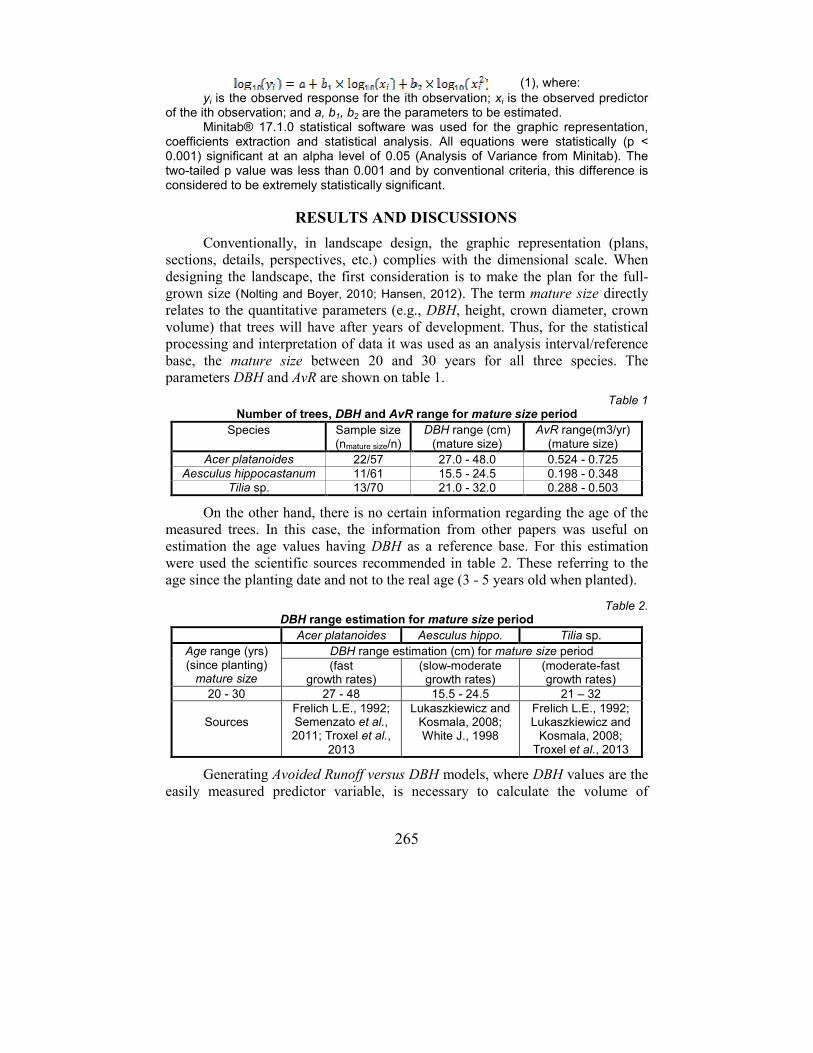
265
(1), where: yi is the observed response for the ith observation; xi is the observed predictor
of the ith observation; and a, b1, b2 are the parameters to be estimated. Minitab® 17.1.0 statistical software was used for the graphic representation,
coefficients extraction and statistical analysis. All equations were statistically (p < 0.001) significant at an alpha level of 0.05 (Analysis of Variance from Minitab). The two-tailed p value was less than 0.001 and by conventional criteria, this difference is considered to be extremely statistically significant.
RESULTS AND DISCUSSIONS
Conventionally, in landscape design, the graphic representation (plans,
sections, details, perspectives, etc.) complies with the dimensional scale. When
designing the landscape, the first consideration is to make the plan for the full-
grown size (Nolting and Boyer, 2010; Hansen, 2012). The term mature size directly
relates to the quantitative parameters (e.g., DBH, height, crown diameter, crown
volume) that trees will have after years of development. Thus, for the statistical
processing and interpretation of data it was used as an analysis interval/reference
base, the mature size between 20 and 30 years for all three species. The
parameters DBH and AvR are shown on table 1.
Table 1 Number of trees, DBH and AvR range for mature size period
Species Sample size (nmature size/n)
DBH range (cm) (mature size)
AvR range(m3/yr) (mature size)
Acer platanoides 22/57 27.0 - 48.0 0.524 - 0.725 Aesculus hippocastanum 11/61 15.5 - 24.5 0.198 - 0.348
Tilia sp. 13/70 21.0 - 32.0 0.288 - 0.503
On the other hand, there is no certain information regarding the age of the
measured trees. In this case, the information from other papers was useful on
estimation the age values having DBH as a reference base. For this estimation
were used the scientific sources recommended in table 2. These referring to the
age since the planting date and not to the real age (3 - 5 years old when planted).
Table 2. DBH range estimation for mature size period
Acer platanoides Aesculus hippo. Tilia sp.
Age range (yrs) (since planting) mature size
DBH range estimation (cm) for mature size period (fast
growth rates) (slow-moderate growth rates)
(moderate-fast growth rates)
20 - 30 27 - 48 15.5 - 24.5 21 – 32
Sources Frelich L.E., 1992; Semenzato et al., 2011; Troxel et al.,
2013
Lukaszkiewicz and Kosmala, 2008; White J., 1998
Frelich L.E., 1992; Lukaszkiewicz and
Kosmala, 2008; Troxel et al., 2013
Generating Avoided Runoff versus DBH models, where DBH values are the
easily measured predictor variable, is necessary to calculate the volume of
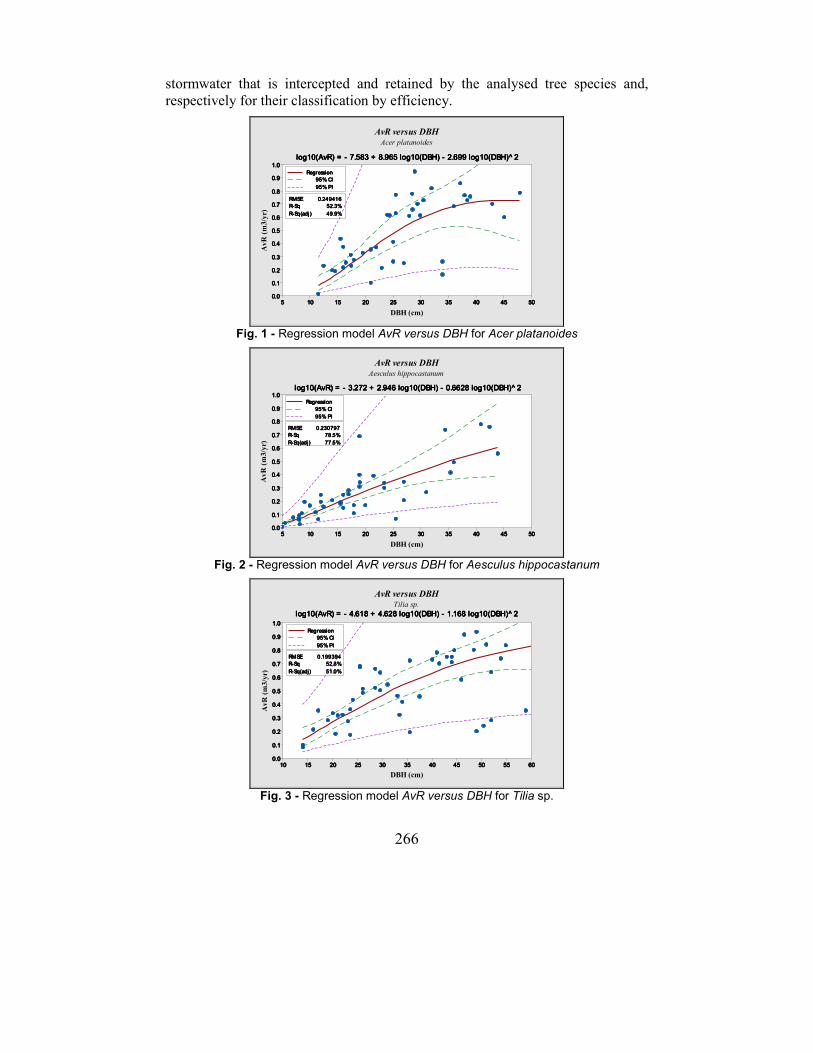
266
stormwater that is intercepted and retained by the analysed tree species and,
respectively for their classification by efficiency.
5555000044445555444400003333555533330000222255552222000011115555111100005555
1111....0000
0000....9999
0000....8888
0000....7777
0000....6666
0000....5555
0000....4444
0000....3333
0000....2222
0000....1111
0000....0000
RRRRMMMMSSSSEEEE 0000....222244449999444411116666
RRRR----SSSSqqqq 55552222....3333%%%%
RRRR----SSSSqqqq((((aaaaddddjjjj )))) 44449999....9999%%%%
DBH (cm)
AvR
(m3/yr
)
RRRReeeeggggrrrr eeeessssssssiiii oooonnnn
99995555%%%% CCCCIIII
99995555%%%% PPPPIIII
AvR versus DBHAcer platanoides
lllloooogggg11110000((((AAAAvvvvRRRR)))) ==== ---- 7777....555588883333 ++++ 8888....999966665555 lllloooogggg11110000((((DDDDBBBBHHHH)))) ---- 2222....666699999999 lllloooogggg11110000((((DDDDBBBBHHHH))))^̂̂̂ 2222
Fig. 1 - Regression model AvR versus DBH for Acer platanoides
5555000044445555444400003333555533330000222255552222000011115555111100005555
1111....0000
0000....9999
0000....8888
0000....7777
0000....6666
0000....5555
0000....4444
0000....3333
0000....2222
0000....1111
0000....0000
RRRRMMMMSSSSEEEE 0000....222233330000777799997777
RRRR----SSSSqqqq 77778888....5555%%%%
RRRR----SSSSqqqq((((aaaadddd jjjj )))) 77777777....5555%%%%
DBH (cm)
AvR
(m3/yr
)
RRRReeeeggggrrrreeeessssssssiiii oooonnnn
99995555%%%% CCCCIIII
99995555%%%% PPPPIIII
AvR versus DBHAesculus hippocastanum
lllloooogggg11110000((((AAAAvvvvRRRR)))) ==== ---- 3333....222277772222 ++++ 2222....999944446666 lllloooogggg11110000((((DDDDBBBBHHHH)))) ---- 0000....6666666622228888 lllloooogggg11110000((((DDDDBBBBHHHH))))^̂̂̂ 2222
Fig. 2 - Regression model AvR versus DBH for Aesculus hippocastanum
6666000055555555555500004444555544440000333355553333000022225555222200001111555511110000
1111....0000
0000....9999
0000....8888
0000....7777
0000....6666
0000....5555
0000....4444
0000....3333
0000....2222
0000....1111
0000....0000
RRRRMMMMSSSSEEEE 0000....111199999999333399994444
RRRR----SSSSqqqq 55552222....8888%%%%
RRRR----SSSSqqqq((((aaaaddddjjjj )))) 55551111....0000%%%%
DBH (cm)
AvR
(m3/yr
)
RRRReeeeggggrrrreeeessssssssiiii oooonnnn
99995555%%%% CCCCIIII
99995555%%%% PPPPIIII
AvR versus DBHTilia sp.
lllloooogggg11110000((((AAAAvvvvRRRR)))) ==== ---- 4444....666611118888 ++++ 4444....666622228888 lllloooogggg11110000((((DDDDBBBBHHHH)))) ---- 1111....111166668888 lllloooogggg11110000((((DDDDBBBBHHHH))))^̂̂̂ 2222
Fig. 3 - Regression model AvR versus DBH for Tilia sp.
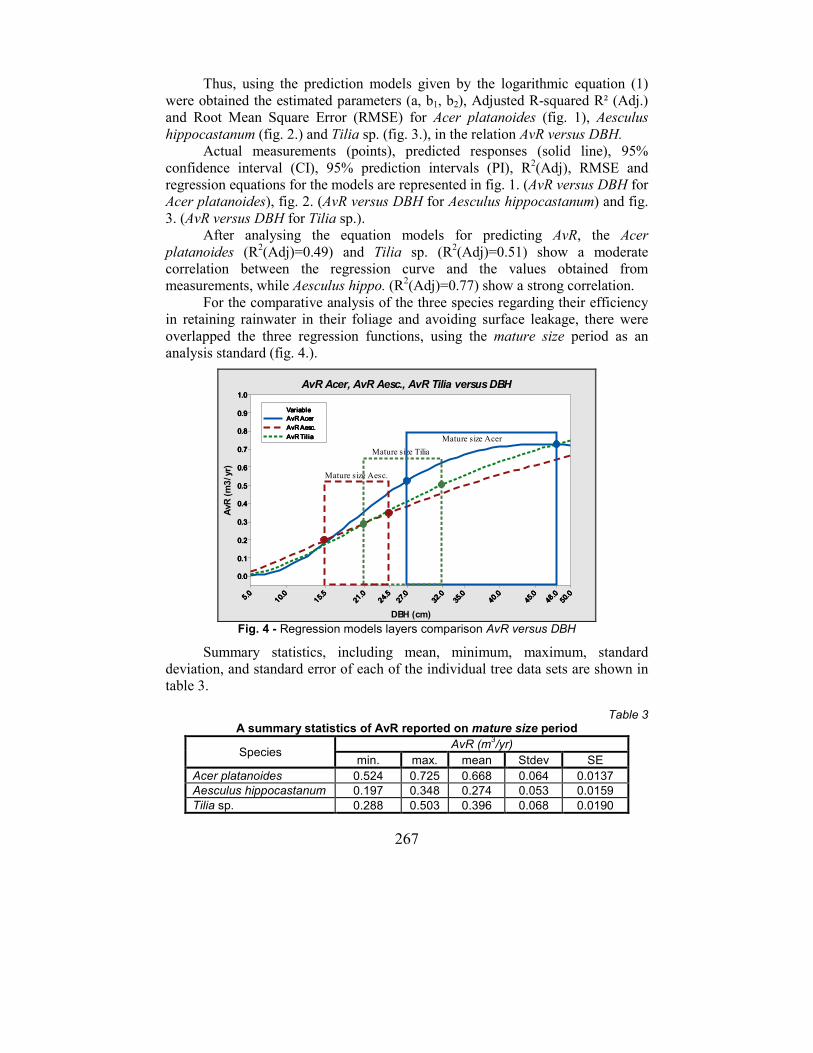
267
Thus, using the prediction models given by the logarithmic equation (1)
were obtained the estimated parameters (a, b1, b2), Adjusted R-squared R² (Adj.)
and Root Mean Square Error (RMSE) for Acer platanoides (fig. 1), Aesculus
hippocastanum (fig. 2.) and Tilia sp. (fig. 3.), in the relation AvR versus DBH.
Actual measurements (points), predicted responses (solid line), 95%
confidence interval (CI), 95% prediction intervals (PI), R2(Adj), RMSE and
regression equations for the models are represented in fig. 1. (AvR versus DBH for
Acer platanoides), fig. 2. (AvR versus DBH for Aesculus hippocastanum) and fig.
3. (AvR versus DBH for Tilia sp.).
After analysing the equation models for predicting AvR, the Acer
platanoides (R2(Adj)=0.49) and Tilia sp. (R
2(Adj)=0.51) show a moderate
correlation between the regression curve and the values obtained from
measurements, while Aesculus hippo. (R2(Adj)=0.77) show a strong correlation.
For the comparative analysis of the three species regarding their efficiency
in retaining rainwater in their foliage and avoiding surface leakage, there were
overlapped the three regression functions, using the mature size period as an
analysis standard (fig. 4.).
55550000....0000
44448888....0000
44445555....0000
44440000 ....000033335555
....000033332222
.... 000022227777....
000022224444....
555522221111
....000011115555....5555
11110000....00005555 ....0000
1111....0000
0000....9999
0000....8888
0000....7777
0000....6666
0000....5555
0000....4444
0000....3333
0000....2222
0000....1111
0000....0000
DBH (cm)
AvR (m3/yr)
AAAAvvvvRRRR AAAAcccceeeerrrr
AAAAvvvvRRRR AAAAeeeesssscccc....
AAAAvvvvRRRR TTTTiiii llll iiii aaaa
VVVVaaaarrrr iiii aaaabbbbllll eeee
Mature size Acer
AvR Acer, AvR Aesc., AvR Tilia versus DBH
Mature size Tilia
Mature size Aesc.
Fig. 4 - Regression models layers comparison AvR versus DBH
Summary statistics, including mean, minimum, maximum, standard
deviation, and standard error of each of the individual tree data sets are shown in
table 3.
Table 3 A summary statistics of AvR reported on mature size period
Species AvR (m
3/yr)
min. max. mean Stdev SE
Acer platanoides 0.524 0.725 0.668 0.064 0.0137 Aesculus hippocastanum 0.197 0.348 0.274 0.053 0.0159 Tilia sp. 0.288 0.503 0.396 0.068 0.0190
268
CONCLUSIONS
1. The results obtained within this experiment by using three species with
different individual characteristics (Acer platanoides, Aesculus hippocastanum
and Tilia sp.), show a different response on the reduction of the level of avoided
runoff by bio-retention.
2. The tree species have different contributions on stormwater retention in
their foliage:
- Acer platanoides has the highest contribution (0.668±0.014 m3/yr);
- Aesculus hippocastanum (0.274±0.016 m3/yr) is the least efficient; the
retained volume represents 41% of the volume retained by Acer platanoides;
- Tilia sp. (0.396±0.019 m3/yr) has an intermediate yield, approx. 60% of
the Acer platanoides and 45% higher than the Aesculus hippocastanum.
3. The results provide explicit information about the contribution of each
species in the stormwater management, with a practical use in the landscape
design of urban green spaces.
REFERENCES
1. Frelich L.E., 1992 - Predicting dimensional relationship for Twin Cities shade trees. University of Minnesota, Department of Forest Resources, St. Paul, Minnesota, USA, pp:4-7.
2. Hansen G., 2012 - Landscape design: Drawing a Planting Plan. Environmental Horticulture Department, Florida Cooperative Extension Service, Institute of Food and Agricultural Sciences, University of Florida, USA, p. 10, http://edis.ifas.ufl.edu.
3. Hutcheson G.D., 2011 - Ordinary Least-Squares Regression. In: Moutinho L., Hutcheson G.D., The SAGE Dictionary of Quantitative Management Research, Sage Publications, pp. 224-228.
4. Limm E.B., Simonim K.A., Bothman A.G., Dawson T.E., 2009 - Foliar water uptake: a common water acquisition strategy for plants of the redwood forest. Oecologia, 161(3), pp. 449–459.
5. Lukaszkiewicz J., Kosmala M., 2008 - Determining the Age of Streetside Trees with Diameter at Breast Height-based Multifactorial Model. Arboriculture & Urban Forestry, 34(3), pp. 137–143.
6. Nolting E., Boyer C., 2010 - Landscape Design. Kansas State University, Agricultural Experiment Station and Cooperative Extension Service, p.16, www.ksre.ksu.edu.
7. Semenzato P., Cattaneo D., Dainese M., 2011 - Growth prediction for five tree species in an Italian urban forest, Urban Forestry & Urban Greening, 10(3), pp.169–176.
8. Troxel B., Piana M., Ashton M.S., Murphy-Dunning C., 2013 - Relationships between bole and crown size for young urban trees in the northeastern USA. Urban Forestry & Urban Greening, 12(2), pp.144-153.
9. White J., 1998 - Estimating the Age of Large and Veteran Trees in Britain. Forestry Commission Information Note 12, Edinburgh, UK, pp. 1-8.
10. Xiao Q., McPherson E. G., Ustin S.L., Grismer M.E., 2000 - A new approach to modeling tree rainfall interception. Journal of Geophysical Research, 105(D23):29173-29188.
11. Xiao Q., McPherson E.G., 2002 - Rainfall interception by Santa Monica’s municipal urban forest. Urban Ecosystems, 6(4): 291–302.
12. ***, 2013- i-Tree: Tools for assessing and managing community forests. i-Tree Eco User’s Manual v.5.0., http://www.itreetools.org/resources/manuals/Eco_Manual_v5.pdf.
269
THE INFLUENCE OF GIBERELLIC ACID ON CALLAS
GROWN IN POTS
INFLUENȚA ACIDULUI GIBERELIC ASUPRA CALELOR CULTIVATE LA GHIVECE
ARHIP (ÎNSURĂȚELU) Ioana Cristina1, DRAGHIA Lucia1
e-mail: [email protected]
Abstract. This paper presents four Zantedeschia cultivars ('Cameo', 'Black Star', 'Picasso', 'Black Eyed Beauty') grown in pots, to which determinations and observations were made on the effect of treatment with gibberellins. Treatments were applied to the tubers, before planting, with 250 ppm GA3 solution. The results revealed that treatment with GA3 had different impact on the studied cultivars: at the cv. 'Cameo' the emergence of floral stem was delayed, the growing season was shortened and the length of floriferous stems was shorter; at the cv. 'Picasso' they shortened the vegetation period and increased the number of flowers / plant; at the cv. 'Black Star' they led to early flowering, shortening the growing season and increasing the number of flowers / plant; at the cv. 'Black Eyed Beauty' they caused earlier flowering and shorten the length of the flower stems. Keywords: Zantedeschia, pot cultivation, GA3
Rezumat. În această lucrare sunt prezentate patru cultivare de Zantedeschia (’Cameo’, ’Black Star’, ’Picasso’, ’Black Eyed Beauty’) cultivate la ghivece asupra cărora s-au făcut determinări și observații privind efectul tratamentelor cu gibereline. Tratamentele s-au aplicat tuberculilor, înainte de plantare, cu soluŃii 250 ppm GA3. Rezultatele obținute au scos în evidență faptul că tratamentele cu GA3 au avut influenŃă diferită asupra cultivarelor studiate: la cv. ’Cameo’ au determinat întârzierea apariŃiei tijelor florale, scurtarea perioadei de vegetaŃie şi scurtarea lungimii tijelor florifere; la cv. ’Picasso’ au scurtat perioada de vegetaŃie şi au mărit numărul de flori/plantă; la ’Black Star’ au dus la timpurietatea înfloririi, scurtarea perioadei de vegetaŃie şi creŃterea numărului de flori/plantă; la cv. ’Black Eyed Beauty’ a determinat înflorirea mai timpurie şi scurtarea lungimii tijelor florale. Cuvinte cheie: Zantedeschia, cultură la ghivece, GA3
INTRODUCTION
Zantedeschia is a tropical plant native to South Africa. The genus
Zantedeschia, which belongs to the Araceae family, was given to callas by Sprengel, in 1826, in honor of the Italian botanist Giovanni Zantedeschi (Letty,
1973). The genus Zantedeschia consists of eight species distributed in two sections, Zantedeschia and Aestivae. Section Zantedeschia consists of Z. aethiopica and Z. odorata, and Section Aestivae also found under the name of
1 University of Agricultural Sciences and Veterinary Medicine of Iasi, Romania
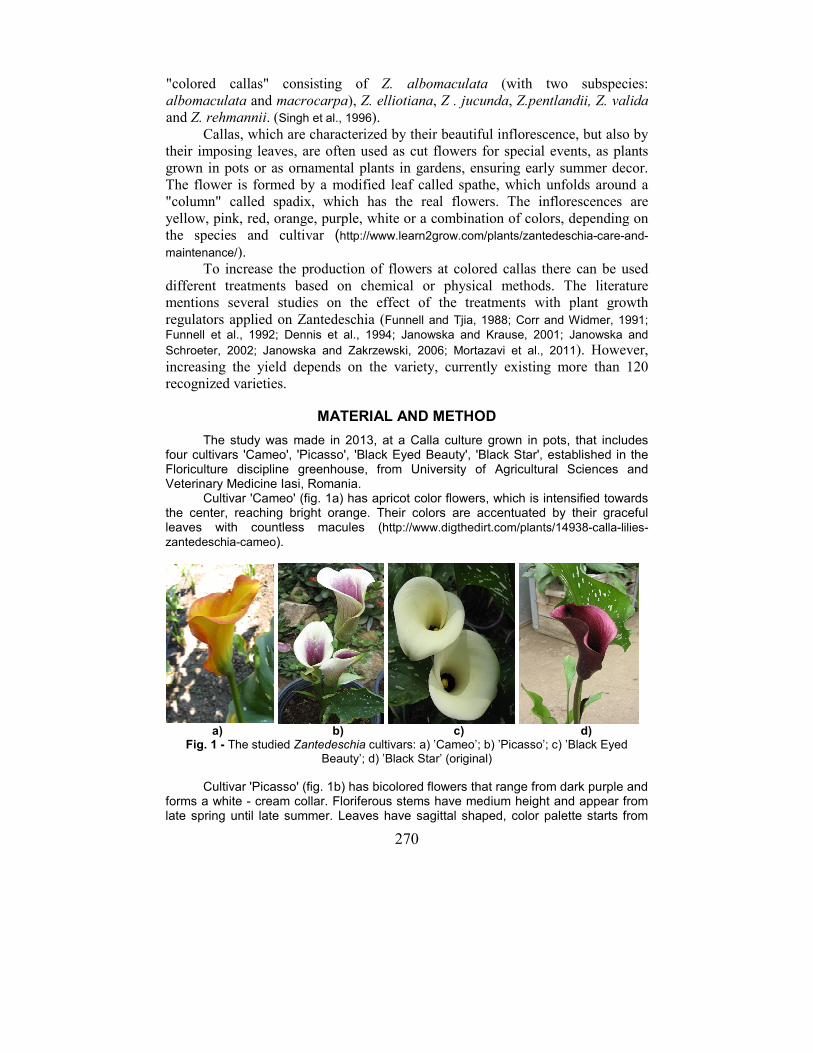
270
"colored callas" consisting of Z. albomaculata (with two subspecies: albomaculata and macrocarpa), Z. elliotiana, Z . jucunda, Z.pentlandii, Z. valida and Z. rehmannii. (Singh et al., 1996).
Callas, which are characterized by their beautiful inflorescence, but also by
their imposing leaves, are often used as cut flowers for special events, as plants
grown in pots or as ornamental plants in gardens, ensuring early summer decor.
The flower is formed by a modified leaf called spathe, which unfolds around a
"column" called spadix, which has the real flowers. The inflorescences are
yellow, pink, red, orange, purple, white or a combination of colors, depending on
the species and cultivar (http://www.learn2grow.com/plants/zantedeschia-care-and-
maintenance/).
To increase the production of flowers at colored callas there can be used
different treatments based on chemical or physical methods. The literature
mentions several studies on the effect of the treatments with plant growth
regulators applied on Zantedeschia (Funnell and Tjia, 1988; Corr and Widmer, 1991;
Funnell et al., 1992; Dennis et al., 1994; Janowska and Krause, 2001; Janowska and
Schroeter, 2002; Janowska and Zakrzewski, 2006; Mortazavi et al., 2011). However,
increasing the yield depends on the variety, currently existing more than 120
recognized varieties.
MATERIAL AND METHOD
The study was made in 2013, at a Calla culture grown in pots, that includes four cultivars 'Cameo', 'Picasso', 'Black Eyed Beauty', 'Black Star', established in the Floriculture discipline greenhouse, from University of Agricultural Sciences and Veterinary Medicine Iasi, Romania.
Cultivar 'Cameo' (fig. 1a) has apricot color flowers, which is intensified towards the center, reaching bright orange. Their colors are accentuated by their graceful leaves with countless macules (http://www.digthedirt.com/plants/14938-calla-lilies-
zantedeschia-cameo).
a) b) c) d)
Fig. 1 - The studied Zantedeschia cultivars: a) ’Cameo’; b) ’Picasso’; c) ’Black Eyed
Beauty’; d) ’Black Star’ (original)
Cultivar 'Picasso' (fig. 1b) has bicolored flowers that range from dark purple and forms a white - cream collar. Floriferous stems have medium height and appear from late spring until late summer. Leaves have sagittal shaped, color palette starts from
271
olive to dark green and they have many white macules (http://www.learn2grow.com/plants/zantedeschia-picasso-pp15282/).
Cultivar 'Black Eyed Beauty' (fig. 1c) has upright growing leaves, sagittal form, with many white macules and they are almost as handsome as its flowers. Flowers, white to yellowish, have a big, black, "eye", located centrally on the inside of the spathe, at base of the spadix (http://www.learn2grow.com/plants/zantedeschia-black-
eyed-beauty/). Cultivar 'Black Star' (fig. 1d) is well named because the spathe creates the
impression that is black; but actually has a dark blood-red color. The spathe appears in late spring, above the compact bush, contrasting with lush leaves that have white macules; the plant has medium size (Hanneke van Dijk, Mineke Kurpershoek, 2001).
Experimental cultures were established with tubers purchased from a specialized firm from the Netherlands. There were set up two experimental variants with three repetitions, the control variant (V1) using untreated tubers and V2 variant where tubers were immersed in a solution of gibberellic acid (GA3), 250 ppm for 30 min, before planting.
The substrate used for the establishment of the cultures, to all four cultivars, both variants was constituted of a mixture consisting of garden soil, flower soil (Florisol), peat and sand in volume ratio of 2:2:1:0,05. Culture was established in plastic pots of 20 cm diameter (5 L), on 30 of April 2013.
The organization of the experience was made by the randomized blocks method with three replications. Determinations and observation were made on the starting of the vegetation period, emergence of the floral stems and the end of the growing season, the number of flowers / plant and the floral stems length. The data were interpreted statistically by the analysis of variance; the results were compared with the control value (V1) from each cultivar.
RESULTS AND DISCUSSIONS
The main technical and phenological data which were recorded at Calla
crops grown in pots are shown in table 1. With the exception of cv. 'Cameo',
where the start of the vegetation period was delayed by GA3 treatment with
approx. one week, at the other cultivars the start of the vegetation period was
achieved without differences between variants.
Table1 Technological and phenological data
Cultivar Crop
establishment
Start of the vegetation period
Appearance of the floral steams
End of vegetation period
V1 V2 V1 V2 V1 V2
‚Cameo’ 30
th of
April 12
th of
May 20
th of
May 15
th of
June 19
th of
June 20
th of
August 14
th of
August
‚Picasso’ 30
th of
April 14
th of
May 14
th of
May 5
th of
June 5
th of
June 10
th of
Sep. 5
h of
Sep.
‚Black- Eyed-
Beauty’
30th
of April
19th
of May
19th
of May
23rd
of June
19th
of June
17th
of Sep.
17th
of Sep.
‚Black Star’
30th
of April
12th
of May
12th
of May
8th
of June
5th
of June
16th
of Sep.
10th
of Sep.
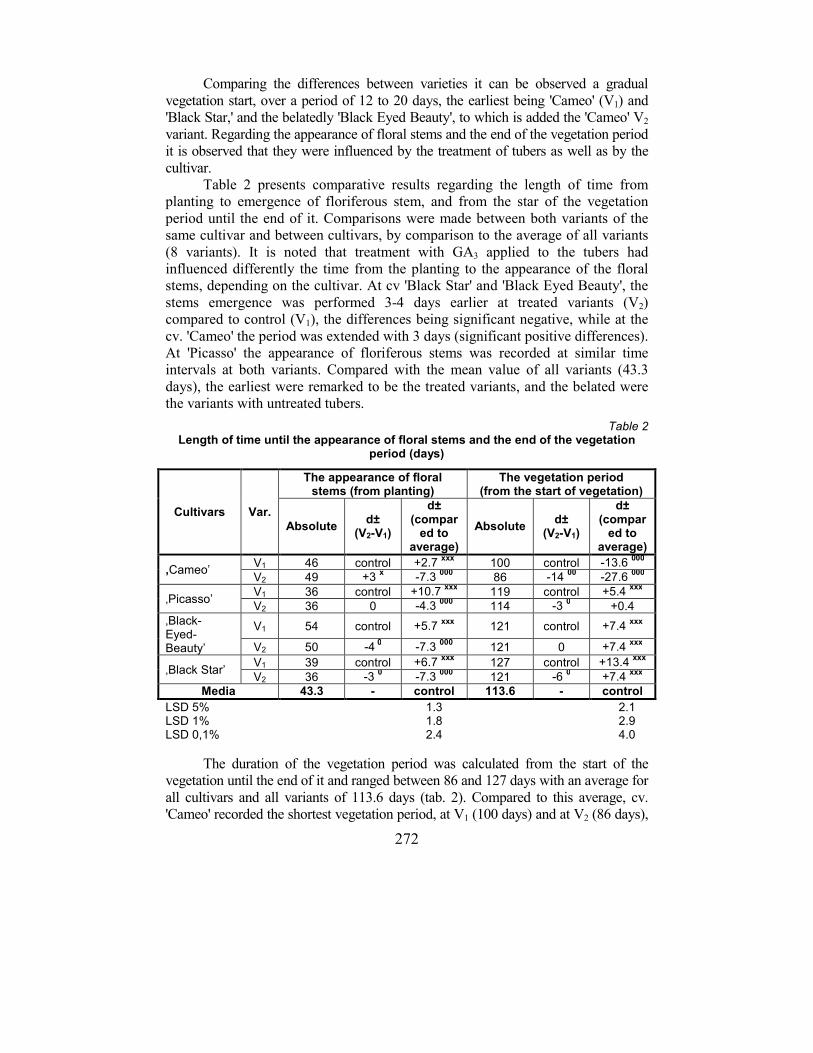
272
Comparing the differences between varieties it can be observed a gradual
vegetation start, over a period of 12 to 20 days, the earliest being 'Cameo' (V1) and
'Black Star,' and the belatedly 'Black Eyed Beauty', to which is added the 'Cameo' V2
variant. Regarding the appearance of floral stems and the end of the vegetation period
it is observed that they were influenced by the treatment of tubers as well as by the
cultivar.
Table 2 presents comparative results regarding the length of time from
planting to emergence of floriferous stem, and from the star of the vegetation
period until the end of it. Comparisons were made between both variants of the
same cultivar and between cultivars, by comparison to the average of all variants
(8 variants). It is noted that treatment with GA3 applied to the tubers had
influenced differently the time from the planting to the appearance of the floral
stems, depending on the cultivar. At cv 'Black Star' and 'Black Eyed Beauty', the
stems emergence was performed 3-4 days earlier at treated variants (V2)
compared to control (V1), the differences being significant negative, while at the
cv. 'Cameo' the period was extended with 3 days (significant positive differences).
At 'Picasso' the appearance of floriferous stems was recorded at similar time
intervals at both variants. Compared with the mean value of all variants (43.3
days), the earliest were remarked to be the treated variants, and the belated were
the variants with untreated tubers.
Table 2 Length of time until the appearance of floral stems and the end of the vegetation
period (days)
Cultivars Var.
The appearance of floral stems (from planting)
The vegetation period (from the start of vegetation)
Absolute d±
(V2-V1)
d± (compared to
average)
Absolute d±
(V2-V1)
d± (compared to
average)
‚Cameo’ V1 46 control +2.7
xxx 100 control -13.6
000
V2 49 +3 x
-7.3 000
86 -14 00
-27.6 000
‚Picasso’ V1 36 control +10.7
xxx 119 control +5.4
xxx
V2 36 0 -4.3 000
114 -3 0
+0.4
‚Black- Eyed- Beauty’
V1 54 control +5.7 xxx
121 control +7.4 xxx
V2 50 -4 0
-7.3 000
121 0 +7.4 xxx
‚Black Star’ V1 39 control +6.7
xxx 127 control +13.4
xxx
V2 36 -3 0
-7.3 000
121 -6 0 +7.4
xxx
Media 43.3 - control 113.6 - control
LSD 5% 1.3 2.1 LSD 1% 1.8 2.9 LSD 0,1% 2.4 4.0
The duration of the vegetation period was calculated from the start of the
vegetation until the end of it and ranged between 86 and 127 days with an average for
all cultivars and all variants of 113.6 days (tab. 2). Compared to this average, cv.
'Cameo' recorded the shortest vegetation period, at V1 (100 days) and at V2 (86 days),
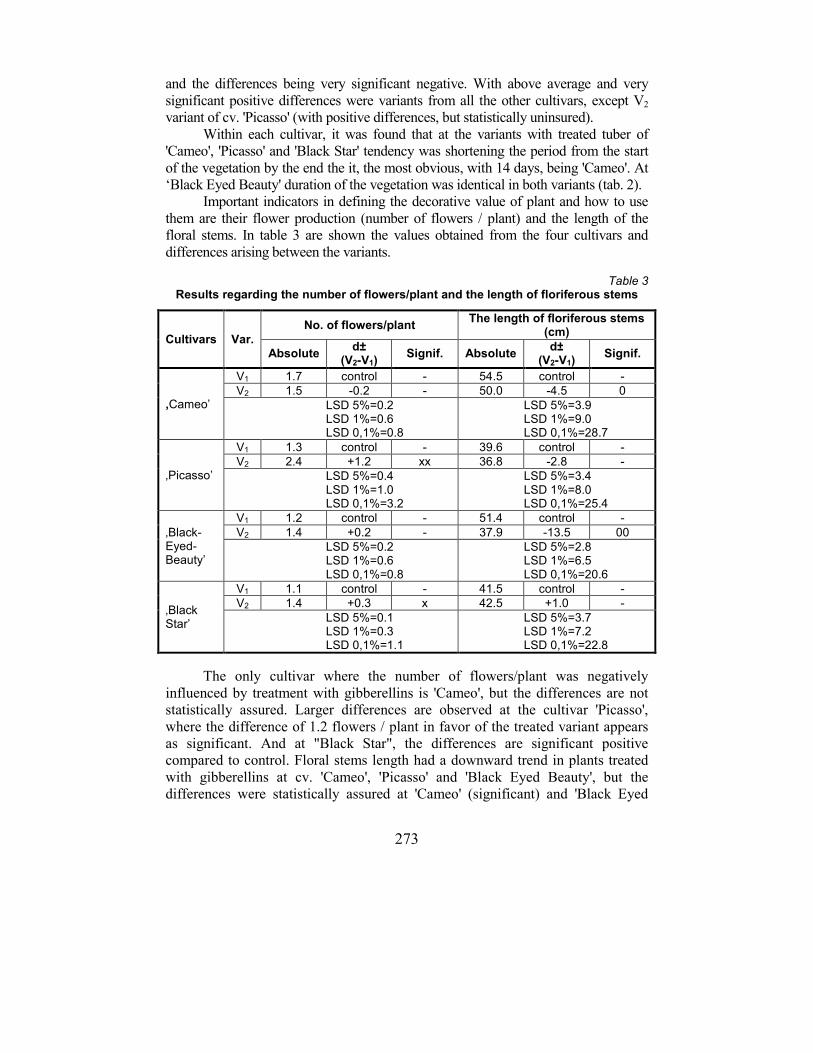
273
and the differences being very significant negative. With above average and very
significant positive differences were variants from all the other cultivars, except V2
variant of cv. 'Picasso' (with positive differences, but statistically uninsured).
Within each cultivar, it was found that at the variants with treated tuber of
'Cameo', 'Picasso' and 'Black Star' tendency was shortening the period from the start
of the vegetation by the end the it, the most obvious, with 14 days, being 'Cameo'. At
‘Black Eyed Beauty' duration of the vegetation was identical in both variants (tab. 2).
Important indicators in defining the decorative value of plant and how to use
them are their flower production (number of flowers / plant) and the length of the
floral stems. In table 3 are shown the values obtained from the four cultivars and
differences arising between the variants.
Table 3 Results regarding the number of flowers/plant and the length of floriferous stems
Cultivars Var.
No. of flowers/plant The length of floriferous stems
(cm)
Absolute d±
(V2-V1) Signif. Absolute
d± (V2-V1)
Signif.
‚Cameo’
V1 1.7 control - 54.5 control -
V2 1.5 -0.2 - 50.0 -4.5 0
LSD 5%=0.2 LSD 1%=0.6 LSD 0,1%=0.8
LSD 5%=3.9 LSD 1%=9.0 LSD 0,1%=28.7
‚Picasso’
V1 1.3 control - 39.6 control -
V2 2.4 +1.2 xx 36.8 -2.8 -
LSD 5%=0.4 LSD 1%=1.0 LSD 0,1%=3.2
LSD 5%=3.4 LSD 1%=8.0 LSD 0,1%=25.4
‚Black- Eyed- Beauty’
V1 1.2 control - 51.4 control -
V2 1.4 +0.2 - 37.9 -13.5 00
LSD 5%=0.2 LSD 1%=0.6 LSD 0,1%=0.8
LSD 5%=2.8 LSD 1%=6.5 LSD 0,1%=20.6
‚Black Star’
V1 1.1 control - 41.5 control -
V2 1.4 +0.3 x 42.5 +1.0 -
LSD 5%=0.1 LSD 1%=0.3 LSD 0,1%=1.1
LSD 5%=3.7 LSD 1%=7.2 LSD 0,1%=22.8
The only cultivar where the number of flowers/plant was negatively
influenced by treatment with gibberellins is 'Cameo', but the differences are not
statistically assured. Larger differences are observed at the cultivar 'Picasso',
where the difference of 1.2 flowers / plant in favor of the treated variant appears
as significant. And at "Black Star", the differences are significant positive
compared to control. Floral stems length had a downward trend in plants treated
with gibberellins at cv. 'Cameo', 'Picasso' and 'Black Eyed Beauty', but the
differences were statistically assured at 'Cameo' (significant) and 'Black Eyed
274
Beauty' (significantly distinct). At cv. 'Black Star', although it has a slight
decrease in stems length, 1 cm difference is not statistically assured.
CONCLUSIONS
1. At plants variants treated with GA3, emergence of floriferous stems was
delayed at cv. 'Cameo', but they appeared earlier at cv. 'Black Eyed Beauty' and
'Black Star' (at 'Picasso' there were no changes), and the vegetation period was
shortened in all cultivars except cv. 'Black Eyed Beauty'.
2. The number of flowers / plant tended to increase at plants whose tubers
were treated with gibberellins, at cultivars 'Picasso', 'Black Star' and 'Black Eyed
Beauty', but a downward trend was noted at cv. 'Cameo'. The differences were
statistically assured only at 'Picasso' and 'Black Star'.
3. The length of floriferous stems had a tendency to decrease, with
statistically assured differences only at cultivars 'Cameo' and 'Black Eyed Beauty'.
REFERENCES
1. Corr B.E., Widmer R.E., 1991 - Paclobutrazol, gibberellic acid and rhizome size affect growth and flowering of Zantedeschia. Hort Science, 26, pp. 133–135
2. Dennis D., Doreen D.J., Ohteki T., 1994 - Effect of a gibberellic acid ‘quick-dip’ and storage on the yield and quality of blooms from hybrid Zantedeschia tubers. Scientia Horticulturae, 57, pp. 133–142.
3. Funnell K.A., MacKay B.R., Lawoko C.R.O., 1992 - Comparative effects of promalin and
GA3 on flowering and development of Zantedeschia ‘Galaxy’. Acta Hort. 292:, pp.173–179.
4. Funnell K.A., Tjia B.O., 1988 - Effect of storage temperature, duration and gibberellic acid on the flowering of Zantedeschia elliottiana and Z. ‘Pink Satin’. Journal of the American
Society for Horticultural Science, 113, pp. 860–863 5. Hanneke van Dijk, Mineke Kurpershoek, 2001 – The complete encyclopedia of bulbs and
tubers, Rebo Publishers, Lisse, The Netherlands 6. Janowska B., Schroeter A., 2002 - The influences of gibberellic acid on flowering of
Zantedeschia elliottiana (W. Wats.) Engl. ‘Black Magic’. Zeszyty Problemowe Postępów Nauk Rolniczych, 483, pp. 93–99.
7. Janowska B., Zakrzewski P., 2006 - The effect of gibberellic acid and rhizome treatment on flowering of calla lily (Zantedeschia Spreng.). Zeszyty Problemowe Postępów Nauk
Rolniczych, 510, pp. 223–233. 8. Janowska B.,Krause J., 2001 - The influence of tuber treatment by gibberellic acid on the
flowering of Zantedeschia, Roczniki Akademii Rolniczej w Poznaniu. Ogrodnictwo, 33, pp. 61–67.
9. Letty C., 1973 - The genus Zantedeschia. Bothalia 11, 1 and 2, pp. 5–26 10. Mortazavi N., Naderi R. A., Majidian N., Naderi B. and Yavar Sharafi Y., 2011 - The
effect of GA3 and BA on the quantitative and qualitative characteristics of calla lily (Zantedeschia aethiopica cv. Childsiana). African Journal of Microbiology Research Vol.
5(24), pp. 4190-4196. 11. Singh Y., Van Wyk A.E., Baijnath H., 1996 - Taxonomic notes on the genus Zantedeschia
Spreng. (Araceae) in southern Africa. S. Afr. J. Bot. 62(6), pp. 321-324. 12. *** http://www.learn2grow.com/plants/zantedeschia-care-and-maintenance/ 13. *** http://www.learn2grow.com/plants/zantedeschia-picasso-pp15282/ 14. *** http://www.learn2grow.com/plants/zantedeschia-black-eyed-beauty/ 15. *** http://www.digthedirt.com/plants/14938-calla-lilies-zantedeschia-cameo
275
ANNUAL INCREASES OF PLANTS IN THE CLIMATIC CONDITIONS OF THE YEARS 2012-2014
CREŞTERILE ANUALE ALE PLANTELOR DENDROLOGICE ÎN
CONDIłIILE CLIMATICE ALE ANILOR 2012-2014
LAMBAN Carmen1, CORNEANU Margareta
1 e-mail: [email protected]
Abstract. The paper presents some aspects regarding the influence of climatic
conditions (temperature, precipitation, humidity, etc.), the annual increases in
some species of ornamental woody plants. The objective was to determine the
legth of annual increases in climatic conditions from Iasi of theyears 2012-
2014.
Key words: trees, shrubs, annual growth, climatic conditions.
Rezumat. Lucrarea prezintă câteva aspecte privind influenŃa condiŃiilor
climatice (temperatură, precipitaŃii, umiditate etc.), asupra creşterilor anuale la
unele specii de plante lemnoase ornamentale. Obiectivul urmărit a fost
determinarea lungimii creşterilor anuale în condiŃiile climatice de la Iaşi ale
anilor 2012 – 2014.
Cuvinte cheie: arbori, arbuşti, creşteri anuale, condiŃii climatice.
INTRODUCTION
Knowing how the growth of ornamental plants has a special importance
for multiplying species, this being influenced by environmental conditions
(temperature, precipitation, humidity etc.), aimed at providing branches for a
large number of skilled plant cuttings, as well as a large number of seedlings
(Bernardis, 2012; Clinovschi, 2005; Draghia, 2000; Iliescu, 2002; Sandu, 2009).
Phenological observations and measurements were made on existing plants in
dendrological plantation of Research and Development of Fruit Growing Iasi.
MATERIAL AND METHOD
Biological material used in the making of this works were coniferous species of three botanical families (Cupresaceae, Pinaceae, Taxaceae), belonging to the genera (7 species of Thuja, 5 species of Juniperus, 6 species of Chamaecyparis, 3 species of Picea, and only one species of Pinus, Taxus, Pseudotzuga, Abies). Measurements relating to annual increases in the length of the plants were made in the first decade of the month of november, when the plants have gone dormant.
During a calendar year three were carried out measurements of annual increases then the media was made. The working method is that of randomized blocks placed on a single line. We analyzed the meteorological factors, reaction to climatic conditions in the years 2012-2014 annual increases in length.
1The Research and Development of Fruit Growing Iasi, Romania
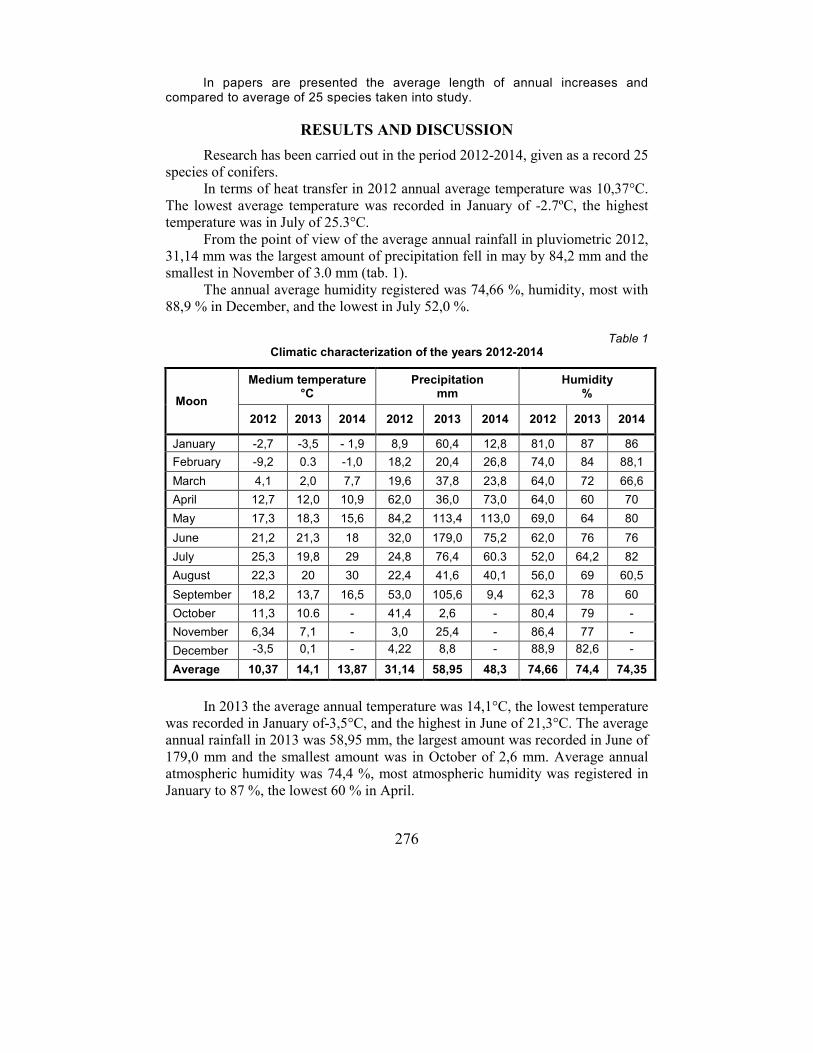
276
In papers are presented the average length of annual increases and compared to average of 25 species taken into study.
RESULTS AND DISCUSSION
Research has been carried out in the period 2012-2014, given as a record 25
species of conifers.
In terms of heat transfer in 2012 annual average temperature was 10,37°C.
The lowest average temperature was recorded in January of -2.7ºC, the highest
temperature was in July of 25.3°C.
From the point of view of the average annual rainfall in pluviometric 2012,
31,14 mm was the largest amount of precipitation fell in may by 84,2 mm and the
smallest in November of 3.0 mm (tab. 1).
The annual average humidity registered was 74,66 %, humidity, most with
88,9 % in December, and the lowest in July 52,0 %.
Table 1
Climatic characterization of the years 2012-2014
Moon
Medium temperature °C
Precipitation mm
Humidity %
2012 2013 2014 2012 2013 2014 2012 2013 2014
January -2,7 -3,5 - 1,9 8,9 60,4 12,8 81,0 87 86
February -9,2 0.3 -1,0 18,2 20,4 26,8 74,0 84 88,1
March 4,1 2,0 7,7 19,6 37,8 23,8 64,0 72 66,6
April 12,7 12,0 10,9 62,0 36,0 73,0 64,0 60 70
May 17,3 18,3 15,6 84,2 113,4 113,0 69,0 64 80
June 21,2 21,3 18 32,0 179,0 75,2 62,0 76 76
July 25,3 19,8 29 24,8 76,4 60.3 52,0 64,2 82
August 22,3 20 30 22,4 41,6 40,1 56,0 69 60,5
September 18,2 13,7 16,5 53,0 105,6 9,4 62,3 78 60
October 11,3 10.6 - 41,4 2,6 - 80,4 79 -
November 6,34 7,1 - 3,0 25,4 - 86,4 77 -
December -3,5 0,1 - 4,22 8,8 - 88,9 82,6 -
Average 10,37 14,1 13,87 31,14 58,95 48,3 74,66 74,4 74,35
In 2013 the average annual temperature was 14,1°C, the lowest temperature
was recorded in January of-3,5°C, and the highest in June of 21,3°C. The average
annual rainfall in 2013 was 58,95 mm, the largest amount was recorded in June of
179,0 mm and the smallest amount was in October of 2,6 mm. Average annual
atmospheric humidity was 74,4 %, most atmospheric humidity was registered in
January to 87 %, the lowest 60 % in April.
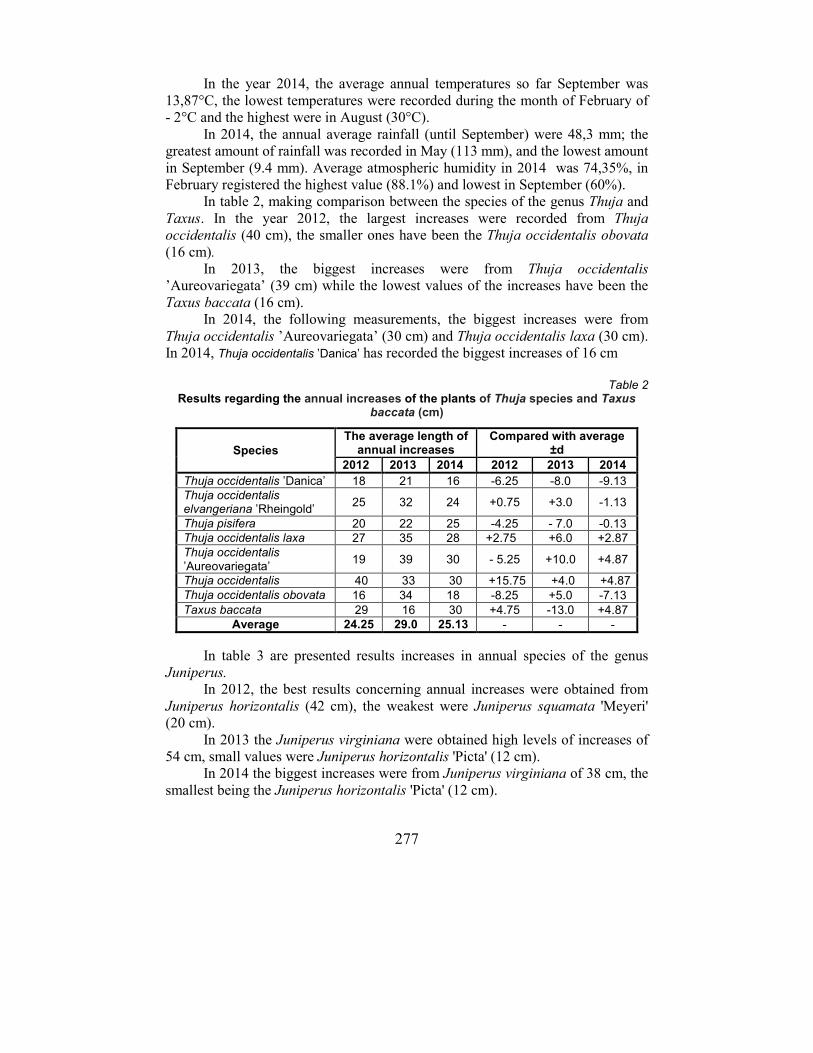
277
In the year 2014, the average annual temperatures so far September was
13,87°C, the lowest temperatures were recorded during the month of February of
- 2°C and the highest were in August (30°C).
In 2014, the annual average rainfall (until September) were 48,3 mm; the
greatest amount of rainfall was recorded in May (113 mm), and the lowest amount
in September (9.4 mm). Average atmospheric humidity in 2014 was 74,35%, in
February registered the highest value (88.1%) and lowest in September (60%).
In table 2, making comparison between the species of the genus Thuja and
Taxus. In the year 2012, the largest increases were recorded from Thuja
occidentalis (40 cm), the smaller ones have been the Thuja occidentalis obovata
(16 cm).
In 2013, the biggest increases were from Thuja occidentalis
’Aureovariegata’ (39 cm) while the lowest values of the increases have been the
Taxus baccata (16 cm).
In 2014, the following measurements, the biggest increases were from
Thuja occidentalis ’Aureovariegata’ (30 cm) and Thuja occidentalis laxa (30 cm).
In 2014, Thuja occidentalis ’Danica’ has recorded the biggest increases of 16 cm
Table 2
Results regarding the annual increases of the plants of Thuja species and Taxus baccata (cm)
Species
The average length of annual increases
Compared with average ±d
2012 2013 2014 2012 2013 2014
Thuja occidentalis ’Danica’ 18 21 16 -6.25 -8.0 -9.13 Thuja occidentalis elvangeriana ’Rheingold’
25 32 24 +0.75 +3.0 -1.13
Thuja pisifera 20 22 25 -4.25 - 7.0 -0.13 Thuja occidentalis laxa 27 35 28 +2.75 +6.0 +2.87 Thuja occidentalis ’Aureovariegata’
19 39 30 - 5.25 +10.0 +4.87
Thuja occidentalis 40 33 30 +15.75 +4.0 +4.87 Thuja occidentalis obovata 16 34 18 -8.25 +5.0 -7.13 Taxus baccata 29 16 30 +4.75 -13.0 +4.87
Average 24.25 29.0 25.13 - - -
In table 3 are presented results increases in annual species of the genus
Juniperus.
In 2012, the best results concerning annual increases were obtained from
Juniperus horizontalis (42 cm), the weakest were Juniperus squamata 'Meyeri'
(20 cm).
In 2013 the Juniperus virginiana were obtained high levels of increases of
54 cm, small values were Juniperus horizontalis 'Picta' (12 cm).
In 2014 the biggest increases were from Juniperus virginiana of 38 cm, the
smallest being the Juniperus horizontalis 'Picta' (12 cm).

278
Table 3
Results regarding the annual increases of the plants of Juniperus species (cm)
Species
The average length of annual increases
Compared with average ±d
2012 2013 2014 2012 2013 2014 Juniperus horizontalis ’Picta’ 23 12 12 -8 - 19.8 -13.6 Juniperus horizontalis 42 36 28 +11 +4.2 +2.4 Juniperus virginiana 38 54 38 +7 +22.2 +12.4 Juniperus scopulorum ’Skyrocket’
32 36 28 +1 +4.2 +2.4
Juniperus squamata ’Meyeri’ 20 21 22 -11 -10.8 -3.6
Average 31.0 31.8 25.6 - - -
The species in the genus Chamaecyparis (tab. 4), in 2012 was with
Chamaecyparis semperauraea increases of 32 cm, Chamaecyparis
lawsoniana 'Ellwoody Gold', only with rises of 6 cm. Also, in 2013
Chamaecyparis lawsoniana semperauraea had the highest values of
increases of 38 cm and Chamaecyparis lawsoniana 'Ellwoody Gold' 10 cm.
In 2014 Chamaecyparis lawsoniana registered the biggest increases
(30 cm) and the smaller ones have been on Chamaecyparis lawsoniana
'Ellwoody Gold' (9 cm).
Table 4
Results regarding the annual increases of the plants of Chamaecyparis species (cm)
Species
The average length of annual increases
Compared with average
±d
2012 2013 2014 2012 2013 2014
Chamaecyparis lawsoniana 30 26 30 -10.0 +3.5 +12.0
Chamaecyparis lawsoniana ’Alumii Gold’
25 30 20 -5.0 +7.5 +2.0
Chamaecyparis lawsoniana semperauraea
32 38 23 +12.0 +15.5 +5.0
Chamaecyparis lawsoniana ’Ellwoody Gold’ 6 10 9 -14.0 -12.5 -9.0
Chamaecyparis pisifera ’Boullevard’
10 14 10 -10.0 -8.5 -8.0
Chamaecyparis pisifera
’Plumosa’ 17 17 16 -3.0 -5.5 -2.0
Average 20.0 22.5 18.0 - - -
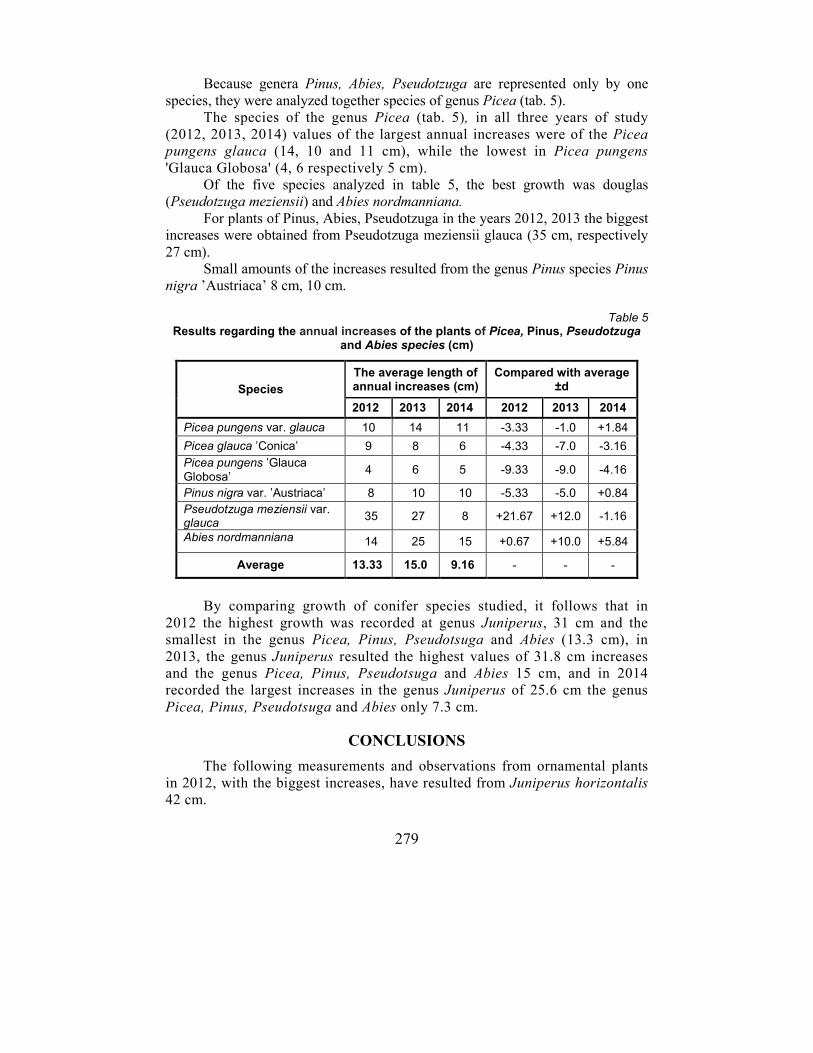
279
Because genera Pinus, Abies, Pseudotzuga are represented only by one
species, they were analyzed together species of genus Picea (tab. 5). The species of the genus Picea (tab. 5), in all three years of study
(2012, 2013, 2014) values of the largest annual increases were of the Picea
pungens glauca (14, 10 and 11 cm), while the lowest in Picea pungens
'Glauca Globosa' (4, 6 respectively 5 cm).
Of the five species analyzed in table 5, the best growth was douglas
(Pseudotzuga meziensii) and Abies nordmanniana.
For plants of Pinus, Abies, Pseudotzuga in the years 2012, 2013 the biggest
increases were obtained from Pseudotzuga meziensii glauca (35 cm, respectively
27 cm).
Small amounts of the increases resulted from the genus Pinus species Pinus
nigra ’Austriaca’ 8 cm, 10 cm.
Table 5
Results regarding the annual increases of the plants of Picea, Pinus, Pseudotzuga and Abies species (cm)
Species
The average length of annual increases (cm)
Compared with average ±d
2012 2013 2014 2012 2013 2014
Picea pungens var. glauca 10 14 11 -3.33 -1.0 +1.84
Picea glauca ’Conica’ 9 8 6 -4.33 -7.0 -3.16
Picea pungens ’Glauca Globosa’
4 6 5 -9.33 -9.0 -4.16
Pinus nigra var. ’Austriaca’ 8 10 10 -5.33 -5.0 +0.84
Pseudotzuga meziensii var. glauca
35 27 8 +21.67 +12.0 -1.16
Abies nordmanniana 14 25 15 +0.67 +10.0 +5.84
Average 13.33 15.0 9.16 - - -
By comparing growth of conifer species studied, it follows that in
2012 the highest growth was recorded at genus Juniperus, 31 cm and the
smallest in the genus Picea, Pinus, Pseudotsuga and Abies (13.3 cm), in
2013, the genus Juniperus resulted the highest values of 31.8 cm increases
and the genus Picea, Pinus, Pseudotsuga and Abies 15 cm, and in 2014
recorded the largest increases in the genus Juniperus of 25.6 cm the genus
Picea, Pinus, Pseudotsuga and Abies only 7.3 cm.
CONCLUSIONS
The following measurements and observations from ornamental plants
in 2012, with the biggest increases, have resulted from Juniperus horizontalis
42 cm.
280
In the years 2013, 2014, good results concerning annual increases were
obtained from Juniperus virginiana 54 cm, 38 cm respectively.
Of the genera of plants, which have been taken into account more than
three species, where the average annual increases were observed in the years
2012, 2013, 2014, genus Juniperus recorded the highest average increases of
31 cm, 31.8 cm and 25.6 cm.
In conclusion, in 2012, 2013, 2014, of species with very good results
concerning annual increases were obtained from Juniperus horizontalis and
Juniperus virginiana, and between genera of plants, which have had more than
3 species, the best results were from the genus Juniperus, in genres that had
only a single species, good results were achieved at like Pseudotzuga.
REFERENCES
1. Bernardis R.R., 2012 – Arboricultură ornamentală. Vol. 3. Ed. „Ion Ionescu de la Brad” Iaşi.
2. Clinovschi F., 2005 – Dendrologie. Editura UniversităŃii Suceava. 3. Draghia Lucia, 2000 – Producerea materialului săditor dendrologic. Ed. „Ion Ionescu de
la Brad” Iaşi. 4. Iliescu Ana-Felicia, 2002 – Cultura arborilor şi arbuştilor ornamentali. Ed. Ceres,
Bucureşti. 5. Sandu Tatiana, 2009 – Arboricultură ornamentală. Ed. „Ion Ionescu de la Brad” Iaşi.
281
FLOR YEAST CELLULAR COMPONENTS
COMPONENTELE CELULARE A LEVURILOR PELICULARE
MORENO-GARCÍA J.1, DUMITRIU Georgiana-Diana2, GARCÍA-MARTÍNEZ Teresa1, MILLÁN M. Carmen1, MAURICIO J.C.1, MORENO J.3
e-mail: [email protected]
Abstract. Flor yeast develops a biofilm on the wine surface after the alcoholic
fermentation of grape which remains during the “biological aging” process in
the elaboration of Sherry wines. The aim of this study is to identify cellular
components which role might be essential for the yeast survival under this
process. A proteome analysis was carried out for a flor yeast grown in a biofilm
forming and in a reference non-biofilm forming conditions and proteins
annotations to cellular components were performed by using the SGD database.
Higher abundant proteins in the biological aging condition localized mostly in
the cell wall, extracellular region and peroxisome; in the reference condition
higher abundant proteins belong to the cellular bud and site of polarized
growth. Further works dealing with genetics, and also utilization of different
flor yeast strains could be considered and aimed to improve the quality of
Sherry wines in a near future. Key words: Flor yeast, proteome, cellular components
Rezumat. Levurile peliculare (Flor yeasts) formează un biofilm pe suprafața
vinului după fermentația alcoolică, biofilm care rămâne în timpul procesului de
“maturare biologică“ in elaborarea vinurilor de tip Sherry. Scopul acestui
studiu este de a identifica componentele celulare care ar putea avea un rol
esential pentru supravietuirea levurile sub acest proces. O analiză proteomică a
fost efectuată pentru o levură peliculară crescută într-un mediu sintetic de
maturare biologică și în condiții fermentative de referință. 4Adnotarea
proteinelor la componentele celulare a fost efectuata utilizând baza de date
SGD. Cantitati mai mari de proteine au fost localizate în regiunea
extracelulară, peretele celular și peroxizomi in conditii de maturare biologica;
în condiții fermentative de referință cantitati mai mari de proteine aparțin
veziculelor legate de membrana citoplasmatica, citoschelet și cortexul celulei.
Studii ulterioare legate de genetica, precum si utilizarea a diferite suse de
levuri peliculare pot fi considerate pentru îmbunătățirea calitatii vinurilor de
tip Sherry.
Cuvinte cheie: Levuri peliculare, proteomul, componente celulare.
INTRODUCTION
Flor yeasts are Saccharomyces cerevisiae strains whose interest within the
enological field lies in their influence on the sensorial properties of a special type
1 Department of Microbiology, University of Córdoba, Spain
2 University of Agricultural Sciences and Veterinary Medicine of Iaşi, Romania
3 Department of Agricultural Chemistry, University of Córdoba, Spain
282
of wine, so-called “Sherry wines”. This organoleptic change takes place during a
process known as “biological aging” which is carried in many different areas
around the world (Spain, France, Italy, South Africa, Armenia, California and
southern Australia).
During the biological aging process harsh conditions prevail (low oxygen
concentration, high ethanol concentration, low pH, etc.) and most organisms aside
from flor yeasts are not able to survive and proliferate.
It is known that the flor yeast ability to float on the surface of the wine and
form a biofilm or “flor” is essential for its survival. It allows the yeast to reach an
oxygen-rich zone where it is possible to catalyze ethanol or glycerol. This
property was first attributed to a high cell surface hydrophobicity (Martinez et al.,
1997c) which would be due to a specific cell wall composition. Reynolds and Fink
(2001) among other authors showed that the Flo11p cell wall protein is involved in
yeast biofilm formation.
Another feature that needs to be mentioned is an efficient proteomic
antioxidant defense system. In aerobic conditions such as the biological aging,
ethanol affects respiratory chain function in yeast mitochondria, leading to
substantial increases in the amounts of reactive oxygen species (ROS).
Organelles or cellular components such as the flor yeast cell wall or
mitochondria, play an important role in their survival under a harsh condition like
biological aging. In order to detect another cellular components important to survive
under this environment, a proteome analysis have been carried out of a flor yeast
grown in a biofilm forming condition (BFC) and in a non-biofilm forming condition
(NBFC) for comparison and a database search has been performed in order to relate
proteins with the cellular component where they are localized.
MATERIAL AND METHOD
Flor yeast Saccharomyces cerevisiae G1 strain (ATCC: MYA-2451), was used in this work. A population of 1 x 10
6 cells/mL was inoculated in a biofilm formation
medium or BFC (0,67% (w/v) YNB without amino acids (Difco), 1% w/v glycerol, 10 mM of glutamic acid and 10% (v/v) ethanol without shaking during 29 days) and in the non-biofilm formation medium or NBFC (0,67% (w/v) YNB without amino acids (Difco), 17% glucose and 10 mM of glutamic acid). The process was carried out at 21 ºC. All media were autoclaved at 120 ºC for 20 minutes. Cells from the biofilm were harvested by suction and from the non-biofilm culture by centrifugation both in a initial phase when the cell viability was higher than 90%. The resulting cellular pellet from each condition was resuspended in 1 mL extraction buffer supplemented with Protease Inhibitor Cocktail tablets, and cell wall was broken by vortexing in a Vibrogen Cell Mill. Glass beads as well as cell debris were discarded by centrifugation. Protein precipitation was carried out by overnight incubation at -20 °C after addition of 10% w/v of trichloroacetic acid (TCA) and 4 volumes of ice-cold acetone to the supernatant. After incubation, samples were centrifuged and the protein pellet was vacuum dried and then resuspended in solubilization buffer. Protein concentration was estimated by Bradford assay (1976) and samples stored at -80 °C until proteins analysis.
The OFFGEL High Resolution kit pH 3−10 was used for protein preparative isoelectric focusing (IEF) in solution. Protein samples (450 ± 50 µg) were solubilized in Protein OFFGEL fractionation buffer, glycerol, and buffer with ampholytes and aliquots
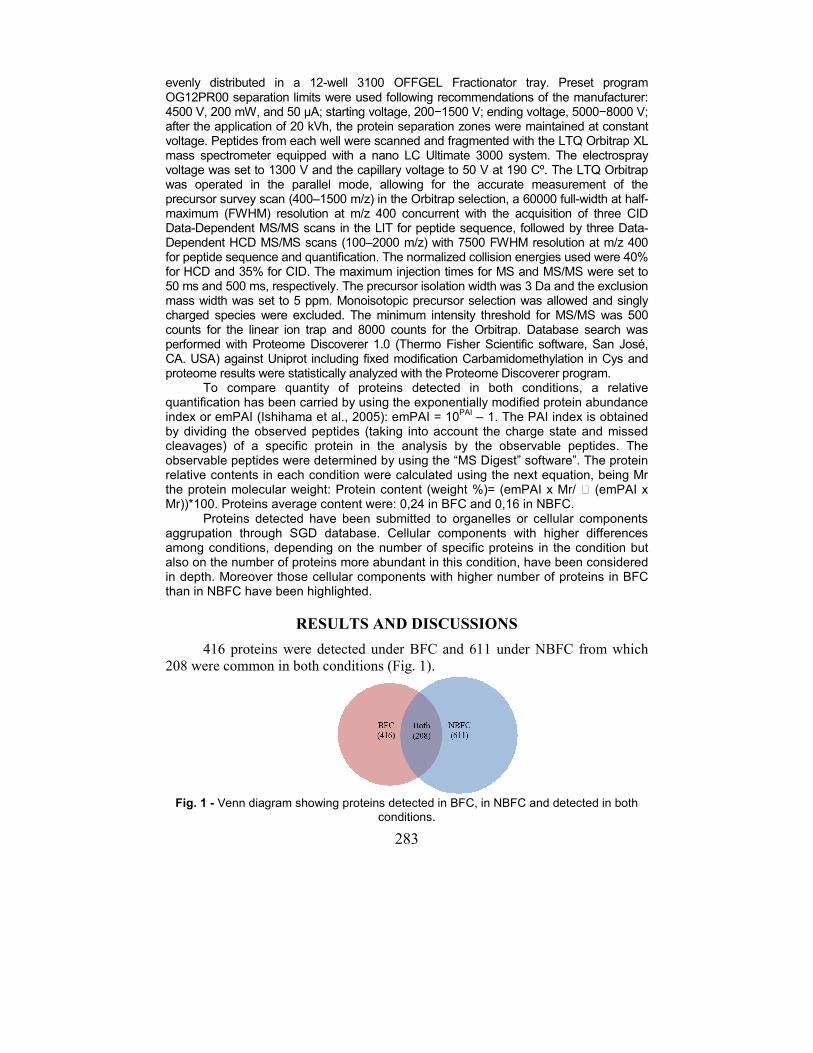
283
evenly distributed in a 12-well 3100 OFFGEL Fractionator tray. Preset program OG12PR00 separation limits were used following recommendations of the manufacturer: 4500 V, 200 mW, and 50 µA; starting voltage, 200−1500 V; ending voltage, 5000−8000 V; after the application of 20 kVh, the protein separation zones were maintained at constant voltage. Peptides from each well were scanned and fragmented with the LTQ Orbitrap XL mass spectrometer equipped with a nano LC Ultimate 3000 system. The electrospray voltage was set to 1300 V and the capillary voltage to 50 V at 190 Cº. The LTQ Orbitrap was operated in the parallel mode, allowing for the accurate measurement of the precursor survey scan (400–1500 m/z) in the Orbitrap selection, a 60000 full-width at half-maximum (FWHM) resolution at m/z 400 concurrent with the acquisition of three CID Data-Dependent MS/MS scans in the LIT for peptide sequence, followed by three Data-Dependent HCD MS/MS scans (100–2000 m/z) with 7500 FWHM resolution at m/z 400 for peptide sequence and quantification. The normalized collision energies used were 40% for HCD and 35% for CID. The maximum injection times for MS and MS/MS were set to 50 ms and 500 ms, respectively. The precursor isolation width was 3 Da and the exclusion mass width was set to 5 ppm. Monoisotopic precursor selection was allowed and singly charged species were excluded. The minimum intensity threshold for MS/MS was 500 counts for the linear ion trap and 8000 counts for the Orbitrap. Database search was performed with Proteome Discoverer 1.0 (Thermo Fisher Scientific software, San José, CA. USA) against Uniprot including fixed modification Carbamidomethylation in Cys and proteome results were statistically analyzed with the Proteome Discoverer program.
To compare quantity of proteins detected in both conditions, a relative quantification has been carried by using the exponentially modified protein abundance index or emPAI (Ishihama et al., 2005): emPAI = 10
PAI – 1. The PAI index is obtained
by dividing the observed peptides (taking into account the charge state and missed cleavages) of a specific protein in the analysis by the observable peptides. The observable peptides were determined by using the “MS Digest” software”. The protein relative contents in each condition were calculated using the next equation, being Mr the protein molecular weight: Protein content (weight %)= (emPAI x Mr/ Ʃ (emPAI x Mr))*100. Proteins average content were: 0,24 in BFC and 0,16 in NBFC.
Proteins detected have been submitted to organelles or cellular components aggrupation through SGD database. Cellular components with higher differences among conditions, depending on the number of specific proteins in the condition but also on the number of proteins more abundant in this condition, have been considered in depth. Moreover those cellular components with higher number of proteins in BFC than in NBFC have been highlighted.
RESULTS AND DISCUSSIONS
416 proteins were detected under BFC and 611 under NBFC from which
208 were common in both conditions (Fig. 1).
Fig. 1 - Venn diagram showing proteins detected in BFC, in NBFC and detected in both
conditions.
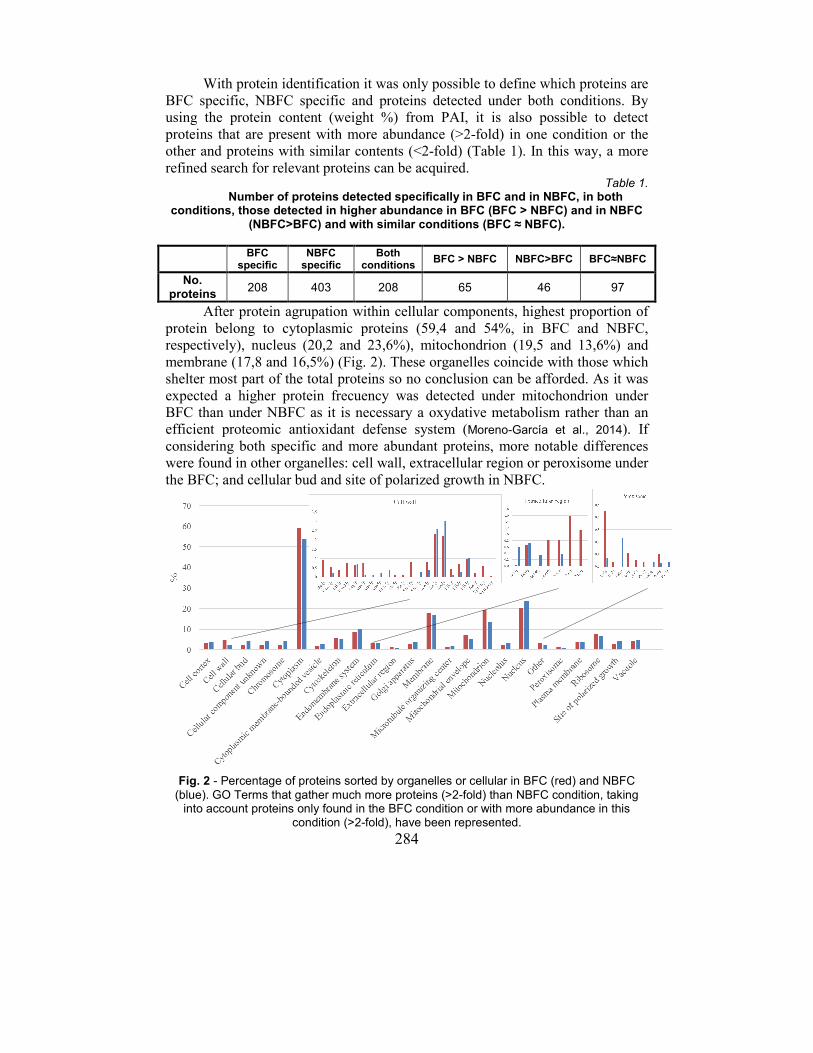
284
With protein identification it was only possible to define which proteins are
BFC specific, NBFC specific and proteins detected under both conditions. By
using the protein content (weight %) from PAI, it is also possible to detect
proteins that are present with more abundance (>2-fold) in one condition or the
other and proteins with similar contents (<2-fold) (Table 1). In this way, a more
refined search for relevant proteins can be acquired. Table 1.
Number of proteins detected specifically in BFC and in NBFC, in both conditions, those detected in higher abundance in BFC (BFC > NBFC) and in NBFC
(NBFC>BFC) and with similar conditions (BFC ≈ NBFC).
BFC
specific NBFC
specific Both
conditions BFC > NBFC NBFC>BFC BFC≈NBFC
No. proteins
208 403 208 65 46 97
After protein agrupation within cellular components, highest proportion of
protein belong to cytoplasmic proteins (59,4 and 54%, in BFC and NBFC,
respectively), nucleus (20,2 and 23,6%), mitochondrion (19,5 and 13,6%) and
membrane (17,8 and 16,5%) (Fig. 2). These organelles coincide with those which
shelter most part of the total proteins so no conclusion can be afforded. As it was
expected a higher protein frecuency was detected under mitochondrion under
BFC than under NBFC as it is necessary a oxydative metabolism rather than an
efficient proteomic antioxidant defense system (Moreno-García et al., 2014). If
considering both specific and more abundant proteins, more notable differences
were found in other organelles: cell wall, extracellular region or peroxisome under
the BFC; and cellular bud and site of polarized growth in NBFC.
Fig. 2 - Percentage of proteins sorted by organelles or cellular in BFC (red) and NBFC
(blue). GO Terms that gather much more proteins (>2-fold) than NBFC condition, taking into account proteins only found in the BFC condition or with more abundance in this
condition (>2-fold), have been represented.
285
From the 22 cell wall proteins detected in the study, 14 were more
abundant or specific in BFC, some of them related to the conjugation process
(Scw4p and Scw10p), protein glycosylation (Psa1p) which is linked to the cell
surface hydrophobicity (Alexandre et al., 2000) and to the resistance to ethanol
(Ecm33p). Although not detected Flo11p, probably because is mostly expressed
during the stationary phase (Aragon et al., 2008), other cell wall proteins involved in
the biofilm formation were detected, Tdh1p (4-fold higher in BFC) and Ssa2p
(similar contents in both conditions). Extracellular proteins, Suc2p and Ygp1p,
were found in BFC with a very elevated content and none under NBFC. Suc2p is
related to oligosaccharide consumption as glucose starvation response (Taussig
and Carlson, 1983) while Ygp1p, a cell wall-related secretory glycoprotein, is
involved in the cell wall assembly process (Pardo et al., 1999). At last, peroxisome,
a small organelle that contains peroxidases and other enzymes involved in a
variety of metabolic processes including free radical detoxification and hydrogen
peroxide metabolism, also shelter a high number of BFC proteins specific or with
more abundance in comparation with NBFC. In BFC, the role of this organelle is
important as degradation of ROS are required for the yeast to survive in such an
oxidative metabolism condition (Mauricio et al., 1997). Two proteins related to the
resistance to oxidative stress, Hyr1p and Pnc1p, were quantified under BFC
specifically and with a higher content than in NBFC, respectively. Aat2p (6-fold
higher under BFC) and Pex1p (BFC exclusive) increase ethanol resistance. This
second protein has also been related to the biofilm formation whereas no
peroxisome proteins were related to this phenotype in NBFC. In NBFC, another
ethanol resistance-related protein was detected only under this condition, Pex19p.
Cit2p only in BFC is implicated in the glyoxilate cycle, essential pathway for a
growing yeast in a two-carbon compounds such as ethanol or glycerol.
In the case of NBFC, organelles as cellular bud and site polarized growth
grouped a high number of more abundant and specific proteins if compared with
BFC. These two cellular components clearly play an important role in the yeast
cells when dividing. This mean that this process is not as relevant in the BFC
condition as in NBFC.
CONCLUSIONS
1. In a flor yeast proteome analysis, 416 proteins were detected under a
biofilm forming condition and 611 under a reference non-biofilm forming
condition.
2. Considering relevant those cellular components or organelles with an
elevated number of proteins, mitochondrion, cell wall, extracellular region and
peroxisome were found to perform an important role in the biofilm forming
condition while not as important organelles like cellular bud or site polarized
growth.
286
Acknowledgments: Spain's Ministry of Economy and Competitiveness and
the European Community (FEDER), Grant RTA2011-00020-C02-02, MINECO-
INIA-CCAA.
REFERENCES
1. Aragon A. D., Rodriguez A. L., Meirelles O., Roy S., Davidson G. S., Tapia P. H., Allen C., Joe R., Benn D., Werner-Washburne M., 2008 - Characterization of Differentiated Quiescent and Nonquiescent Cells in Yeast Stationary-Phase Cultures. Mol Biol Cell, 3, pp. 1271-1280.
2. Alexandre H., Blanchet S., Charpentier C., 2000 - Identification of a 49 Kda Hydrophobic Cell Wall Mannoprotein Present in Velum Yeast which may be Implicated in Velum Formation. FEMS Microbiol, 185, pp. 147 - 150.
4. Ishihama Y., Oda Y., Tabata T., Sato T., Nagasu T., Rappsilber J., Mann M., 2005 - Exponentially Modified Protein Abundance Index (Empai) for Estimation of Absolute Protein Amount in Proteomics by the Number of Sequenced Peptides per Protein. Mol Cell Proteomics, 4.9, pp. 1265 - 1272.
5. Martinez P., Perez-Rodriguez L., Benitez T., 1997 - Velum Formation by Flor Yeasts Isolated from Sherry Wines. Am J Enol Viticult, 48, pp. 55 - 62.
6. Mauricio J.C., Moreno J., Ortega J.M., 1997 - In Vitro Specific Activities of Alcohol and Aldehyde Dehydrogenases from Two Flor Yeasts during Controlled Wine Aging. J. Agric. Food Chem, 45, pp. 1967–1971.
7. Moreno-García J., García-Martínez T., Moreno J., Millán M. C., Mauricio J. C., 2014 -
A Proteomic and Metabolomic Approach for Understanding the Role of the Flor Yeast Mitochondria in the Velum Formation. Int J Food Microbiol, 172, pp. 21-29.
8. Pardo M, Monteoliva L., Pla J., Sánchez M., Gil C., Nombela C., 1999 - Two-Dimensional Analysis of Proteins Secreted by Saccharomyces Cerevisiae Regenerating Protoplasts: a Novel Approach to Study the Cell Wall. Yeast 15, pp. 459-472.
9. T.B. Fink G.R., 2001 - Bakers' Yeast, a Model for Fungal Biofilm Formation. Science 291, pp. 878 - 881.
10. Taussig R., Carlson M., 1983 - Nucleotide sequence of the yeast SUC2 gene for invertase. Nucleic Acids Res, 11, pp. 1943-1954.
Consilier editorial: Vasile VÎNTU Tehnoredactori: Liliana ROTARU Liliana Elena CHELARIU Corectori: Lucia DRAGHIA Liliana ROTARU Bun de tipar: 10.12.2014 Apărut: 2014 Format: 61x86/16 Editura: „Ion Ionescu de la Brad” Iaşi Aleea M. Sadoveanu, 3 Tel.: 0232-218300 e-mail: [email protected] ISSN–L=1454-7376
(Print)-ISSN 1454-7376
(Online)=ISSN 2069-8275
(CD-ROM) = ISSN 2069 – 847X
PRINTED IN ROMANIA
Editorial Consultant: Vasile VÎNTU Technical Editors: Liliana ROTARU Liliana Elena CHELARIU Readers: Lucia DRAGHIA Liliana ROTARU Imprimatur: 10.12.2014 Published: 2014 Format: 61x86/16 Publishing House: „Ion Ionescu de la Brad” Iaşi Aleea M. Sadoveanu, 3 Tel.: 0232-218300 e-mail: [email protected] ISSN–L=1454-7376
(Print)-ISSN 1454-7376
(Online)=ISSN 2069-8275
(CD-ROM) = ISSN 2069 – 847X
PRINTED IN ROMANIA