Long-term assessment of the wet precipitation chemistry in Austria (1984–1999
15
Long-term assessment of the wet precipitation chemistry in Austria (1984–1999) H. Puxbaum a , V. Simeonov b, * , M. Kalina a , S. Tsakovski b , H. L€ offler c , G. Heimburger d , P. Biebl e , A. Weber f , A. Damm g a Institute for Analytical Chemistry, Vienna University of Technology, Getreidemarkt 9/151, A-1060 Vienna, Austria b Chair of Analytical Chemistry, Faculty of Chemistry, University of Sofia ‘‘St. Kl. Okhridski’’, J. Bourchier Blvd. 1, 1164 Sofia, Bulgaria c Department of Environmental Protection, City of Vienna, Rinnb€ ockstraße 15, A-1100 Vienna, Austria d Department of Environmental Protection and Engineering, Carinthian Regional Government, Flatschacherstraße 70, A-9021 Klagenfurt, Austria e Amt der Salzburger Landesregierung, Abteilung Umweltschutz, Ulrich Schreier Straße 18, A-5020 Salzburg, Austria f Amt der Tiroler Landesregierung, Landesforstdirektion Tirol, B€ urgerstraße 36, A-6020 Innsbruck, Austria g Amt der Nieder€ osterreichische Landesregierung, Abteilung WA5, Landhausplatz 1, A-3109 St. P€ olten, Austria Received 6 July 2001; received in revised form 15 February 2002; accepted 13 March 2002 Abstract The aim of the present study was to determine the long-time trends in concentrations and depositions of major ions in wet precipitation samples collected at 11 sampling sites from the Austrian precipitation chemistry network in the period 1984–1999. The analytical results were treated by the use of least square linear regression method. It is shown that a serious decrease of sulfate (between 30% and 60% for the period) and hydrogen ion (between 60% and 102% for the period) concentrations and depositions is achieved at almost all sampling sites and in most of these cases the linear trend proves to be statistically significant. Nitrogen containing ions and base cations do not reveal a distinct trend of changing and in the majority of the sites the linear models are not adequate. In principle, an overall slight concentration and deposition decrease for these major ions is observed (up to 30% for the period of observation) but some substantial exceptions are also found (site Haunsberg or site Lobau). The changes in chloride concentration and deposition, too, do not indicate significant linear trend and, in general, are decreasing for the period of monitoring. In order to give some explanation of the exceptional behaviour of some of the major ions in several sites, an additional comparison with Austrian emission data (sulfur dioxide, nitrogen oxides, ammonium) and with data from five EMEP sites from neighbouring countries is performed. A significant West–East trend of acidity increase is found as well as a good correlation with the emission trends. Therefore, both transboundary and specific local factors could be substantial factors in the wet precipitation chemistry in the region. Ó 2002 Elsevier Science Ltd. All rights reserved. Keywords: Trend analysis; Wet precipitation; Chloride; Nitrate; Sulfate; Ammonium; Sodium; Potassium; Calcium; Magnesium; Acidity; Austrian precipitation chemistry network 1. Introduction The Austrian Precipitation Sampling Network was established in the early 80s based on daily sampling ac- tivity with wet only collectors with seven sampling sites in Tyrol, Salzburg and Burgenland counties followed Chemosphere 48 (2002) 733–747 www.elsevier.com/locate/chemosphere * Corresponding author. Fax: +359-296-25438. E-mail address: [email protected]fia.bg (V. Simeo- nov). 0045-6535/02/$ - see front matter Ó 2002 Elsevier Science Ltd. All rights reserved. PII:S0045-6535(02)00125-X
Transcript of Long-term assessment of the wet precipitation chemistry in Austria (1984–1999

Long-term assessment of the wet precipitation chemistryin Austria (1984–1999)
H. Puxbaum a, V. Simeonov b,*, M. Kalina a, S. Tsakovski b, H. L€ooffler c,G. Heimburger d, P. Biebl e, A. Weber f, A. Damm g
a Institute for Analytical Chemistry, Vienna University of Technology, Getreidemarkt 9/151, A-1060 Vienna, Austriab Chair of Analytical Chemistry, Faculty of Chemistry, University of Sofia ‘‘St. Kl. Okhridski’’, J. Bourchier Blvd. 1, 1164 Sofia, Bulgaria
c Department of Environmental Protection, City of Vienna, Rinnb€oockstraße 15, A-1100 Vienna, Austriad Department of Environmental Protection and Engineering, Carinthian Regional Government, Flatschacherstraße 70,
A-9021 Klagenfurt, Austriae Amt der Salzburger Landesregierung, Abteilung Umweltschutz, Ulrich Schreier Straße 18, A-5020 Salzburg, Austria
f Amt der Tiroler Landesregierung, Landesforstdirektion Tirol, B€uurgerstraße 36, A-6020 Innsbruck, Austriag Amt der Nieder€oosterreichische Landesregierung, Abteilung WA5, Landhausplatz 1, A-3109 St. P€oolten, Austria
Received 6 July 2001; received in revised form 15 February 2002; accepted 13 March 2002
Abstract
The aim of the present study was to determine the long-time trends in concentrations and depositions of major ions
in wet precipitation samples collected at 11 sampling sites from the Austrian precipitation chemistry network in the
period 1984–1999. The analytical results were treated by the use of least square linear regression method. It is shown
that a serious decrease of sulfate (between 30% and 60% for the period) and hydrogen ion (between 60% and 102% for
the period) concentrations and depositions is achieved at almost all sampling sites and in most of these cases the linear
trend proves to be statistically significant. Nitrogen containing ions and base cations do not reveal a distinct trend of
changing and in the majority of the sites the linear models are not adequate. In principle, an overall slight concentration
and deposition decrease for these major ions is observed (up to 30% for the period of observation) but some substantial
exceptions are also found (site Haunsberg or site Lobau). The changes in chloride concentration and deposition, too, do
not indicate significant linear trend and, in general, are decreasing for the period of monitoring. In order to give some
explanation of the exceptional behaviour of some of the major ions in several sites, an additional comparison with
Austrian emission data (sulfur dioxide, nitrogen oxides, ammonium) and with data from five EMEP sites from
neighbouring countries is performed. A significant West–East trend of acidity increase is found as well as a good
correlation with the emission trends. Therefore, both transboundary and specific local factors could be substantial
factors in the wet precipitation chemistry in the region.
� 2002 Elsevier Science Ltd. All rights reserved.
Keywords: Trend analysis; Wet precipitation; Chloride; Nitrate; Sulfate; Ammonium; Sodium; Potassium; Calcium; Magnesium;
Acidity; Austrian precipitation chemistry network
1. Introduction
The Austrian Precipitation Sampling Network was
established in the early 80s based on daily sampling ac-
tivity with wet only collectors with seven sampling sites
in Tyrol, Salzburg and Burgenland counties followed
Chemosphere 48 (2002) 733–747
www.elsevier.com/locate/chemosphere
*Corresponding author. Fax: +359-296-25438.
E-mail address: [email protected] (V. Simeo-
nov).
0045-6535/02/$ - see front matter � 2002 Elsevier Science Ltd. All rights reserved.
PII: S0045-6535 (02 )00125-X

by the other federal counties (BMGU, 1984; Gehak and
Chalupa, 1985; Kalina and Puxbaum, 1996). But syste-
matic studies of the rainwater composition began much
earlier with only one station as part of the European
Air Chemistry Network (EACN) and of the World
Meteorological Organization (WMO) Background Air
Pollution Monitoring Network (BAPMON). In the de-
veloped framework of the national monitoring system
more and more stations were developed and engaged
with the assessment of the wet precipitation chemistry.
Now 33 sampling stations are available, three of which
are also part of the EMEP Network (co-operative pro-
gramme for monitoring and evaluation of long-range
transmission of air pollutants in Europe). Due to the
complex terrain in Austria the altitudes of the sampling
sites from the net reach from 155 m asl in the East to
3106 m asl at high elevation sites in the Central Alps and
the annual precipitation amounts range from 260 to
2100 mm.
In its integrity the Austrian Precipitation Sampling
Network is designed to estimate the wet deposition loads
of the wet precipitation major ions and to determine the
trends in all chemical components of the rainwater for
Austria. The wet precipitation data collection is impor-
tant not only for evaluation of the soil and forest con-
ditions in the country, but also for comparison of time
trends in the precipitation chemistry in Austria and
other countries from Central and Western Europe and
North America. In several already published studies
during the 80s and 90s (Granat, 1978; Rohde and
Granat, 1984; Hedin et al., 1987; Dillon et al., 1988;
Puxbaum et al., 1988; Erisman et al., 1989; Fay et al.,
1989; Schulze et al., 1990; Fricke and Beilke, 1993; Ru-
ijgork and R€oomer, 1993; Hedin et al., 1994; Lynch et al.,1995; Sanusi et al., 1995; West and Feagley, 1995; Avila,
1996; Hovmad and Kemp, 1996; Lynch et al., 1996) it
was found by all authors despite the differences in time
periods of sampling and in sampling locations that the
overall pH values increase and sulfate concentrations
decrease in the wet precipitation. This is considered as
the reason for the total acid deposition decrease in
countries like USA, Canada, The Netherlands, Den-
mark, Germany, France, Spain, Switzerland, Sweden,
Norway, Finland and Austria. In most of the cited
studies the time trends are determined just for a limited
number of sites and for time intervals not exceeding
a decade. Besides, there is a lack of reliable information
about the relationships between locally observed trends
in the major ion concentrations and additional sub-
stantial components of the environment like total
emission amount for a certain pollutant or influence of
emissions from neighbouring regions. Only the careful
consideration of observation over a really long time
period and over a large part of the sampling net and
successive linking of the observed trends in the wet
precipitation major ions with local and more global in-
fluences gives a chance to interpret in a reliable way the
wet precipitation chemistry on a national scale. Since
many local institutions in Austria are interested of the
preservation of a clean environment, another significant
purpose of a large-scale trend study is to present in a
simple way an environment situation dated more than a
decade ago and the present one with some future per-
spectives.
The aim of the present study is perform trend anal-
ysis of wet precipitation data collections from 11 sam-
pling sites all over Austria (Tyrol, Salzburg, Lower
Austria, Carinthia and Vienna counties) for the period
1984–1999. Additionally, the trend analysis results will
be compared and interpreted with respect to data from
the total emission loads of pollutants in Austria for the
same period (sulfur dioxide, ammonia, nitrogen oxides)
and from EMEP sampling stations located in the neigh-
bouring countries Switzerland, Germany, Hungary,
Czech Republic and Italy.
2. Experimental
2.1. Sampling sites
Eleven sampling sites (Reutte, Kufstein, Innervill-
graten, Haunsberg, Werfenweng, Sonnblick, Nasswald,
Litschau, Lunz, Nassfeld and Lobau) were chosen from
the Austrian Wet Only Precipitation Network as they
provide almost complete data collections for a long
sampling period (between 9 and 16 years within the time
interval 1984–1999 as follows: 16 years of monitoring
for the sites Haunsberg and Werfenweng; 15 years of
monitoring for the sites Reutte, Kufstein and Innervill-
graten; 12 years of monitoring for the sites Sonnblick
and Lobau; 11 years of monitoring for site Nasswald;
nine years of monitoring for the rest of the sites Nass-
feld, Lunz and Litschau). Additionally, the trend anal-
ysis for each site and each major ion was performed for
that particular period for which no missing data were
found. Thus, each linear model is calculated for the
specific time period assuring a complete data set. The
first three sites are located in the Austrian province
Tyrol, the next three in Salzburg, the following three
in Lower Austria, Nassfeld in Carinthia and the last,
Lobau, in Vienna region. The sampling site locations
(all of them background stations) are presented in
Fig. 1. Additionally, the location of five sites from the
EMEP measurement network (T€aanikon––Switzerland,Brotjacklriegel––Germany, Kosetice––Czech Republic,
Ispra––Italy and K-puszta––Hungary) is given for com-
parison of wet precipitation data and trends with the
Austrian sites. Some location characteristics of all Aus-
trian sites are given in Table 1 (co-ordinates and alti-
tude).
734 H. Puxbaum et al. / Chemosphere 48 (2002) 733–747

2.2. Sampling equipment
The Austrian Wet Only Precipitation Network is
equipped with the wet and dry only precipitation sam-
pler (WADOS) (Winkler et al., 1989). A slightly heated
resistance sensor coupled to a lid ensures the collection
of wet only precipitation samples in sampling bottles
protected from the light. Local observers carry out the
daily control of the samples usually in the morning
hours. The collection procedure is performed according
to the recommendation of the Austrian Ministry of
Health and Environment (BMGU, 1984). The samples
are transferred and stored in polyethylene bottles at 0–4
�C, transported in biweekly intervals to the Institute of
Analytical Chemistry, Vienna University of Technology,
and analysed generally within 1–4 weeks after receipt.
The sampler efficiency was determined to be 96% in an
international comparison test (Winkler et al., 1989), and
there is a good correlation between the amount of rain
sampled by WADOS and the total amount of rain in the
respective region determined by the meteorological
teams (r ¼ 0:96). Missing data are evaluated by checking
Fig. 1. Location of the sampling sites in the Austrian precipitation-monitoring network (legend to the sites: 11, Reutte; 13, Kufstein;
14, Innervillgraten; 21, Haunsberg; 25, Werfenweng; 27, Sonnblick; 32, Nasswald; 33, Litschau; 36, Lunz; 61, Nassfeld; 43, Lobau).
Table 1
Characteristics of the sampling sites
Site code Site Longitude (E) Latitude (N) Altitude (asla) Period
Tyrol
11 Reutte 10�4005400 47�2901100 930 1984–1999
13 Kufstein 12�1303800 47�3904700 680 1984–1999
14 Innervillgraten 12�2101000 46�4900600 1730 1984–1999
Salzburg
21 Haunsberg 13�0100000 47�5702300 520 1984–1999
25 Werfenweng 13�1501200 47�2501800 940 1984–1999
27 Sonnblick 12�5703200 47�0301500 3106 1987–1998
Lower Austria
32 Nasswald 15�4202600 47�4600400 600 1988–1999
33 Litschau 15�0202000 48�5702000 560 1989–1998
36 Lunz 15�0400700 47�5101800 618 1990–1998
Vienna
43 Lobau 16�3005100 48�1101500 155 1987–1998
Carinthia
61 Nassfeld 13�1603300 46�3303700 1530 1990–1997
a asl: above sea-level.
H. Puxbaum et al. / Chemosphere 48 (2002) 733–747 735

the precipitation data (precipitation amount) from the
meteorological service to evaluate the rain event and ion
concentrations are calculated by regression analysis
from already available measurements. The missing ion
concentrations were estimated only for samples with
partial analysis.
2.3. Chemical analysis
The samples were analysed for the anions chloride,
nitrate and sulfate and the monovalent cations ammo-
nium, sodium and potassium by ion chromatography
(IC) as described by Kalina and Puxbaum (Kalina and
Puxbaum, 1996). The system was a Dionex-Quc Ana-
lyser for cations and a Dionex GMP-2 for anions. The
columns were Dionex Ion Pac CS 12 and AS4A-SC,
respectively, with precolumns CG 12 and AG4A-SC.
The eluents used were 17 mM methane sulfonic acid
(MSA) (cations) or 1.8 mM sodium carbonateþ 1:7mM sodium bicarbonate (anions). Respective suppres-
sors were Dionex CSRS I 4 mm or ASRS I 4 mm
(electrochemical). Detection was performed through
conductivity measurements. Sample loop volumes were
20 or 30 ll, respectively. The divalent cations calcium
and magnesium were determined by atomic absorp-
tion spectroscopy (Perkin–Elmer 403, flame atomizer,
photomultiplier PM detector). The pH was determined
electrochemically according to the procedure of the
Austrian Ministry of Health and Environment (BMGU,
1984).
The detection limits calculated according to the three
standard deviations of the blank values were 0.01 lg l�1
for ammonium, chloride, magnesium, potassium and
sodium, 0.02 lg l�1 for calcium and 0.03 lg l�1 for ni-
trate and sulfate.
Quality control of the analytical data was performed
by comparing calculated vs. measured conductivities and
by cation vs. anion balances of the individual samples.
If the differences were less than 10%, it was assumed that
all major ions had been analysed. The majority of the
samples presented an anion deficit, probably due to the
lack of bicarbonate and the quantity of short-chain or-
ganic acids (Puxbaum et al., 1991).
The wet precipitation weighted annual mean con-
centrations for all major ions measured at all sampling
sites in the periods of observation are available at re-
quest from the authors. The analytical measurements
and the precipitation amount values were used for the
trend study both for major ion concentrations and de-
positions.
2.3.1. Statistical data treatment
The trend analysis was performed by the use of
least-squares linear regression approach to the non-
normalized raw data (both for mean annual weighted
concentrations and depositions). Squaring of the re-
gression coefficient performs the goodness of fit, thus
presenting the percent of variance explained. The
regression coefficient significance was determined after
estimation of their standard errors at p < 0:05 and
p < 0:01 and respective estimation of the residuals by
F-test. The validity of the linear model was checked by
the value of r2.
3. Results and discussion
The most important features of the trend analysis are
presented in Tables 2 and 3 for concentrations and de-
positions, respectively. In the tables the changes (total
and per year in %) in major ion concentrations and
depositions for the period of monitoring are given for
each site. The quality of the model fit is illustrated by the
value of the r2, whose value indicates the percentage ofexplained variance.
3.1. Trend analysis of concentrations
It was of substantial interest to determine the changes
in major ion concentrations for each sampling site
from the Austrian wet precipitation-monitoring net-
work. These results could be readily compared to previ-
ously published data of acidic reduction in Western
Europe and North America like studies for Spain (19%
decrease of sulfate concentrations and depositions for
five years means and median pH increase from 4.74 to
5.50 for 10 years, Avila, 1996); for Canada (average
annual decrease in sulfate concentrations in the period
of 10 years of 29%, Dillon et al., 1988); for The Neth-
erlands (decrease in total acid deposition nearly 19%
for five-year period, Erisman et al., 1989); for USA
(approximately 28% sulfate decrease and 40% hydrogen
decrease within period of 13 years of observation); for
Germany (up to 50% acidity decrease) etc. Most of the
cited studies are limited with respect to time period of
monitoring or number of sites under observation or even
discussion about the concentration changes of all major
ions of the wet precipitation, just to mention the general
comment that base cation changes are out of the scope
of the trend study.
In the present study an effort is done to summarize
the trend of all major ions in the wet precipitation at a
large number of sites and for a relative long time period.
This approach reveals a more complete and reliable as-
sessment of the wet precipitation chemistry in Austria.
3.2. Hydrogen
As a whole, significant linear trends are found for
hydrogen ion concentrations at 7 out of 11 sites (at
Litschau the trend is calculated as statistically significant
736 H. Puxbaum et al. / Chemosphere 48 (2002) 733–747

Table 2
Summary for major ion concentration (mg l�1) changes and trend significance at all sites
Ion/site Predicted first
year
Predicted final
year
Total change
in %
Change per year
in %
R2 and trend
significance
Hþ
Reutte 0.02 0.005 �77.7 �5.2 0.43
Kufstein 0.04 0.01 �68.5 �4.6 0.66
Innervillgraten 0.02 0.002 �91.0 �6.1 0.64
Haunsberg 0.03 0.004 �85.4 �5.4 0.71
Werfenweng 0.02 0.0006 �102.9 �6.4 0.69
Sonnblick 0.02 0.01 �64.0 �5.3 0.63
Nasswald 0.02 0.03 60.6 5.5 0.14 (n.s.)
Litschau 0.04 0.01 �63.7 �6.4 0.61
Lunz 0.032 0.03 �6.9 �0.8 0.01 (n.s.)
Lobau 0.02 0.003 �85.7 �7.1 0.41
Nassfeld 0.01 0.02 6.5 0.8 0.01 (n.s.)
NHþ4
Reutte 0.43 0.428 �0.3 0.02 0.01 (n.s.)
Kufstein 0.60 0.64 7.2 0.5 0.03 (n.s.)
Innervillgraten 0.41 0.47 16.7 1.1 0.05 (n.s.)
Haunsberg 0.95 0.84 �11.4 �0.7 0.03 (n.s.)
Werfenweng 0.59 0.40 �31.0 �1.9 0.14 (n.s.)
Sonnblick 0.36 0.19 �46.9 �3.9 0.56
Nasswald 0.50 0.49 �1.6 �0.2 0.01 (n.s.)
Litschau 1.27 0.79 �38.2 �3.8 0.49
Lunz 0.71 0.53 �25.8 �2.9 0.36
Lobau 1.19 0.52 �56.4 �4.7 0.74
Nassfeld 0.63 0.55 �12.5 �1.6 0.02 (n.s.)
Cl�
Reutte 0.56 0.34 �38.6 �2.6 0.07 (n.s.)
Kufstein 0.36 0.25 �31.0 �2.1 0.20 (n.s.)
Innervillgraten 0.30 0.25 �15.8 �1.1 0.01 (n.s.)
Haunsberg 0.50 4.07 720.5 45.0 0.22 (n.s.)
Werfenweng 0.66 0.35 �47.5 �3.0 0.49
Sonnblick 0.39 0.20 �47.2 �3.9 0.24 (n.s.)
Nasswald 1.59 0.44 �72.2 �6.6 0.59
Litschau 0.70 0.85 22.1 2.2 0.01 (n.s.)
Lunz 0.36 0.21 �42.2 �4.7 0.36 (n.s.)
Lobau 1.06 0.18 �83.4 �7.0 0.61
Nassfeld 0.99 0.41 �58.8 �7.4 0.61
Naþ
Reutte 0.23 0.11 �52.0 �3.5 0.08 (n.s.)
Kufstein 0.14 0.13 �7.7 �0.5 0.01 (n.s.)
Innervillgraten 0.104 0.096 �7.9 �0.5 0.01 (n.s.)
Haunsberg 0.25 0.36 45.3 3.0 0.03 (n.s.)
Werfenweng 0.45 0.21 �53.5 �3.8 0.49
Sonnblick 0.11 0.19 71.9 6.0 0.14 (n.s.)
Nasswald 0.21 0.24 14.5 1.3 0.01 (n.s.)
Litschau 0.12 0.32 179.4 17.9 0.40 (n.s.)
Lunz 0.15 0.12 �19.7 �2.2 0.14 (n.s.)
Lobau 0.21 0.17 �17.1 �1.4 0.05 (n.s.)
Nassfeld 0.53 0.28 �47.7 �6.0 0.24 (n.s.)
Kþ
Reutte 0.10 0.07 �33.9 �2.3 0.04 (n.s.)
Kufstein 0.07 0.06 �7.1 �0.5 0.01 (n.s.)
Innervillgraten 0.05 0.10 93.4 6.2 0.20 (n.s.)
Haunsberg 0.15 0.16 5.0 0.3 0.01 (n.s.)
Werfenweng 0.17 0.15 �14.1 �1.0 0.01 (n.s.)
(continued on next page)
H. Puxbaum et al. / Chemosphere 48 (2002) 733–747 737
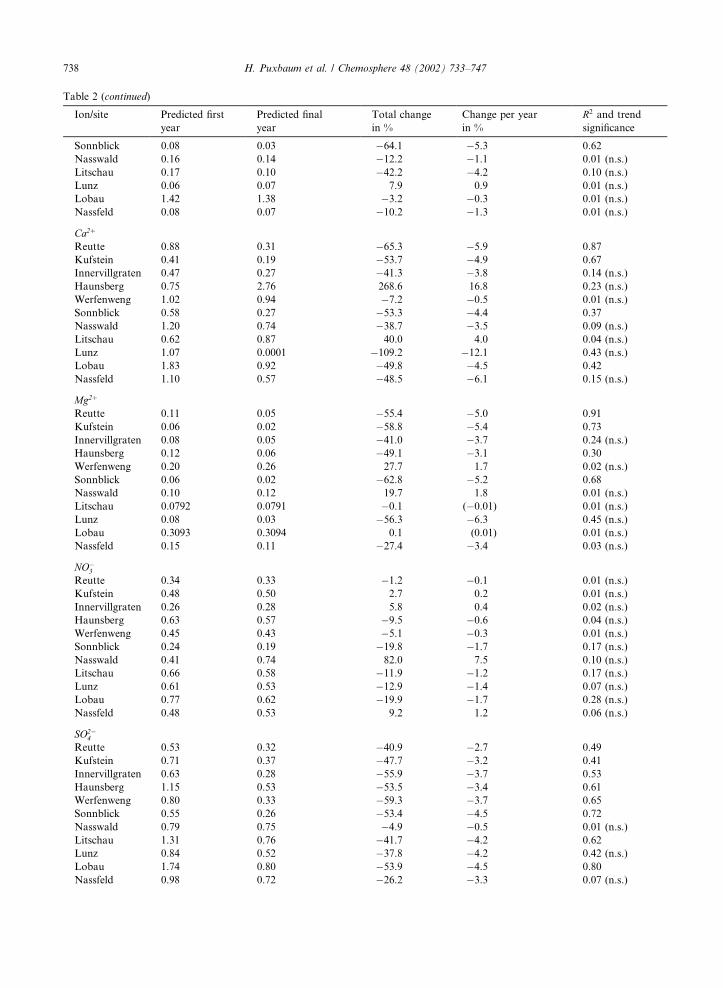
Table 2 (continued)
Ion/site Predicted first
year
Predicted final
year
Total change
in %
Change per year
in %
R2 and trend
significance
Sonnblick 0.08 0.03 �64.1 �5.3 0.62
Nasswald 0.16 0.14 �12.2 �1.1 0.01 (n.s.)
Litschau 0.17 0.10 �42.2 �4.2 0.10 (n.s.)
Lunz 0.06 0.07 7.9 0.9 0.01 (n.s.)
Lobau 1.42 1.38 �3.2 �0.3 0.01 (n.s.)
Nassfeld 0.08 0.07 �10.2 �1.3 0.01 (n.s.)
Ca2þ
Reutte 0.88 0.31 �65.3 �5.9 0.87
Kufstein 0.41 0.19 �53.7 �4.9 0.67
Innervillgraten 0.47 0.27 �41.3 �3.8 0.14 (n.s.)
Haunsberg 0.75 2.76 268.6 16.8 0.23 (n.s.)
Werfenweng 1.02 0.94 �7.2 �0.5 0.01 (n.s.)
Sonnblick 0.58 0.27 �53.3 �4.4 0.37
Nasswald 1.20 0.74 �38.7 �3.5 0.09 (n.s.)
Litschau 0.62 0.87 40.0 4.0 0.04 (n.s.)
Lunz 1.07 0.0001 �109.2 �12.1 0.43 (n.s.)
Lobau 1.83 0.92 �49.8 �4.5 0.42
Nassfeld 1.10 0.57 �48.5 �6.1 0.15 (n.s.)
Mg2þ
Reutte 0.11 0.05 �55.4 �5.0 0.91
Kufstein 0.06 0.02 �58.8 �5.4 0.73
Innervillgraten 0.08 0.05 �41.0 �3.7 0.24 (n.s.)
Haunsberg 0.12 0.06 �49.1 �3.1 0.30
Werfenweng 0.20 0.26 27.7 1.7 0.02 (n.s.)
Sonnblick 0.06 0.02 �62.8 �5.2 0.68
Nasswald 0.10 0.12 19.7 1.8 0.01 (n.s.)
Litschau 0.0792 0.0791 �0.1 (�0.01) 0.01 (n.s.)
Lunz 0.08 0.03 �56.3 �6.3 0.45 (n.s.)
Lobau 0.3093 0.3094 0.1 (0.01) 0.01 (n.s.)
Nassfeld 0.15 0.11 �27.4 �3.4 0.03 (n.s.)
NO�3
Reutte 0.34 0.33 �1.2 �0.1 0.01 (n.s.)
Kufstein 0.48 0.50 2.7 0.2 0.01 (n.s.)
Innervillgraten 0.26 0.28 5.8 0.4 0.02 (n.s.)
Haunsberg 0.63 0.57 �9.5 �0.6 0.04 (n.s.)
Werfenweng 0.45 0.43 �5.1 �0.3 0.01 (n.s.)
Sonnblick 0.24 0.19 �19.8 �1.7 0.17 (n.s.)
Nasswald 0.41 0.74 82.0 7.5 0.10 (n.s.)
Litschau 0.66 0.58 �11.9 �1.2 0.17 (n.s.)
Lunz 0.61 0.53 �12.9 �1.4 0.07 (n.s.)
Lobau 0.77 0.62 �19.9 �1.7 0.28 (n.s.)
Nassfeld 0.48 0.53 9.2 1.2 0.06 (n.s.)
SO2�4
Reutte 0.53 0.32 �40.9 �2.7 0.49
Kufstein 0.71 0.37 �47.7 �3.2 0.41
Innervillgraten 0.63 0.28 �55.9 �3.7 0.53
Haunsberg 1.15 0.53 �53.5 �3.4 0.61
Werfenweng 0.80 0.33 �59.3 �3.7 0.65
Sonnblick 0.55 0.26 �53.4 �4.5 0.72
Nasswald 0.79 0.75 �4.9 �0.5 0.01 (n.s.)
Litschau 1.31 0.76 �41.7 �4.2 0.62
Lunz 0.84 0.52 �37.8 �4.2 0.42 (n.s.)
Lobau 1.74 0.80 �53.9 �4.5 0.80
Nassfeld 0.98 0.72 �26.2 �3.3 0.07 (n.s.)
738 H. Puxbaum et al. / Chemosphere 48 (2002) 733–747

Table 3
Summary for major ion deposition (kg ha�1) changes and trend significance at all sites
Ion/site Predicted first
year
Predicted final
year
Total change
in %
Change per year
in %
R2 and trend
significance
Hþ
Reutte 0.23 0.06 �75.6 �5.0 0.43
Kufstein 0.39 0.13 �66.3 �4.4 0.53
Innervillgraten 0.16 0.01 �92.8 �6.2 0.46
Haunsberg 0.25 0.02 �93.9 �5.8 0.74
Werfenweng 0.14 0.01 �95.3 �6.0 0.64
Sonnblick 0.18 0.09 �48.1 �4.0 0.33 (n.s.)
Nasswald 0.19 0.22 13.7 1.3 0.01 (n.s.)
Litschau 0.15 0.07 �50.1 �5.0 0.37 (n.s.)
Lunz 0.35 0.39 10.7 1.2 0.01 (n.s.)
Lobau 0.09 0.01 �90.5 �7.5 0.36
Nassfeld 0.21 0.20 �0.3 (�0.03) 0.01 (n.s.)
NHþ4
Reutte 0.2 0.1 �26.0 �1.7 0.01 (n.s.)
Kufstein 5.9 6.5 8.7 0.6 0.03 (n.s.)
Innervillgraten 2.8 2.5 �12.2 �0.8 0.03 (n.s.)
Haunsberg 8.0 5.5 �31.1 �1.9 0.25
Werfenweng 3.6 3.1 �15.9 �1.0 0.08 (n.s.)
Sonnblick 3.7 3.0 �17.8 �1.5 0.03 (n.s.)
Nasswald 5.2 3.0 �41.3 �3.8 0.37
Litschau 5.7 3.9 �31.3 �3.1 0.18 (n.s.)
Lunz 8.2 7.3 �11.9 �1.3 0.04 (n.s.)
Lobau 4.0 2.2 �45.6 �3.8 0.35
Nassfeld 8.3 6.5 �21.8 �2.7 0.12 (n.s.)
(continued on next page)
Table 2 (continued)
Ion/site Predicted first
year
Predicted final
year
Total change
in %
Change per year
in %
R2 and trend
significance
NHþ4 þ NO�
3
Reutte 0.92 0.90 �2.2 �0.1 0.01 (n.s.)
Kufstein 1.08 1.14 5.6 0.4 0.01 (n.s.)
Innervillgraten 0.67 0.75 11.9 0.8 0.03 (n.s.)
Haunsberg 1.58 1.41 �10.8 �0.7 0.04 (n.s.)
Werfenweng 1.04 0.84 �19.2 �1.3 0.06 (n.s.)
Sonnblick 0.50 0.38 �24.0 �2.0 0.49
Nasswald 0.91 1.21 33.0 3.0 0.17 (n.s.)
Litschau 1.93 1.37 �29.0 �3.8 0.26 (n.s.)
Lunz 1.32 1.05 �20.5 �2.6 0.17 (n.s.)
Lobau 1.95 1.15 �41.0 �3.4 0.50
Nassfeld 1.05 1.06 1.0 0.1 0.01 (n.s.)
Base cations
Reutte 0.94 0.38 �60.0 �5.5 0.64
Kufstein 0.56 0.44 �21.8 �2.0 0.12 (n.s.)
Innervillgraten 0.68 0.51 �15.7 �1.4 0.09 (n.s.)
Haunsberg 2.36 4.52 91.8 6.1 0.32 (n.s.)
Werfenweng 1.75 1.03 �42.8 �3.1 0.09 (n.s.)
Sonnblick 0.74 0.61 �17.3 �1.4 0.24 (n.s.)
Nasswald 1.48 0.50 �66.8 �6.1 0.65
Litschau 1.29 1.80 39.4 4.4 0.01 (n.s.)
Lunz 0.91 0.25 �73.3 �9.2 0.31 (n.s.)
Lobau 1.41 0.94 �33.6 �3.1 0.01 (n.s.)
Nassfeld 2.27 1.32 �41.7 �5.2 0.33 (n.s.)
n.s. means non-significant trend.
H. Puxbaum et al. / Chemosphere 48 (2002) 733–747 739

Table 3 (continued)
Ion/site Predicted first
year
Predicted final
year
Total change
in %
Change per year
in %
R2 and trend
significance
Cl�
Reutte 6.6 3.9 �40.7 �2.7 0.07 (n.s.)
Kufstein 3.5 2.4 �30.6 �2.0 0.17 (n.s.)
Innervillgraten 1.9 0.9 �50.2 �3.4 0.43
Haunsberg 4.8 29.3 505.9 31.6 0.11 (n.s.)
Werfenweng 4.7 2.3 �52.2 �3.3 0.24 (n.s.)
Sonnblick 4.2 3.1 �27.1 �2.3 0.08 (n.s.)
Nasswald 15.5 1.2 �92.1 �8.4 0.76
Litschau 3.4 4.3 28.5 2.9 0.01 (n.s.)
Lunz 4.7 2.4 �49.7 �5.5 0.22 (n.s.)
Lobau 3.6 0.4 �90.0 �7.5 0.60
Nassfeld 15.1 5.5 �63.4 �7.9 0.46 (n.s.)
Naþ
Reutte 0.2 0.1 �26.4 �1.8 0.01 (n.s.)
Kufstein 1.2 1.2 4.0 0.3 0.01 (n.s.)
Innervillgraten 0.7 0.4 �36.0 �2.4 0.25 (n.s.)
Haunsberg 2.2 2.6 18.3 1.2 0.01 (n.s.)
Werfenweng 3.3 1.1 �66.0 �4.4 0.36
Sonnblick 1.0 2.8 194.7 16.2 0.30 (n.s.)
Nasswald 2.1 1.3 �36.6 �3.3 0.14 (n.s.)
Litschau 0.4 1.5 280.7 28.1 0.35 (n.s.)
Lunz 1.53 1.54 0.2 (0.02) 0.01 (n.s.)
Lobau 0.7 0.5 �20.3 �1.7 0.11 (n.s.)
Nassfeld 6.7 3.6 �46.3 �5.8 0.19 (n.s.)
Kþ
Reutte 1.2 0.8 �34.5 �2.3 0.05 (n.s.)
Kufstein 0.7 0.6 �5.3 �0.4 0.01 (n.s.)
Innervillgraten 0.3 0.5 76.4 5.1 0.11 (n.s.)
Haunsberg 1.2 0.9 �25.4 �1.7 0.04 (n.s.)
Werfenweng 1.3 0.9 �27.5 �1.8 0.06 (n.s.)
Sonnblick 0.8 0.5 �41.3 �3.4 0.21 (n.s.)
Nasswald 1.5 0.8 �44.1 �4.0 0.25 (n.s.)
Litschau 0.8 0.4 �53.4 �5.3 0.12 (n.s.)
Lunz 0.5 1.0 106.3 11.8 0.34 (n.s.)
Lobau 1.4 1.3 �3.2 �0.3 0.01 (n.s.)
Nassfeld 1.2 0.7 �37.4 �4.7 0.09 (n.s.)
Ca2þ
Reutte 10.3 3.6 �64.6 �5.4 0.71
Kufstein 3.8 2.2 �41.5 �3.8 0.48
Innervillgraten 2.4 1.6 �33.1 �3.0 0.14 (n.s.)
Haunsberg 7.2 19.1 165.8 10.4 0.10 (n.s.)
Werfenweng 7.5 6.6 �11.4 �0.7 0.01 (n.s.)
Sonnblick 5.9 3.9 �34.3 �2.9 0.20 (n.s.)
Nasswald 11.5 3.0 �74.2 �6.8 0.50
Litschau 2.8 4.0 46.3 4.6 0.04 (n.s.)
Lunz 16.3 0.01 �116.3 �12.9 0.34 (n.s.)
Lobau 5.9 3.1 �46.5 �4.2 0.23 (n.s.)
Nassfeld 12.7 7.4 �41.9 �5.2 0.14 (n.s.)
Mg2þ
Reutte 1.1 0.6 �48.4 �4.0 0.53
Kufstein 0.5 0.3 �49.2 �4.5 0.64
Innervillgraten 0.3 0.2 �26.6 �2.4 0.15 (n.s.)
Haunsberg 0.9 0.4 �57.7 �3.6 0.49
Werfenweng 1.4 1.2 �13.2 �0.8 0.01 (n.s.)
Sonnblick 0.5 0.3 �39.8 �3.3 0.35
740 H. Puxbaum et al. / Chemosphere 48 (2002) 733–747

Table 3 (continued)
Ion/site Predicted first
year
Predicted final
year
Total change
in %
Change per year
in %
R2 and trend
significance
Nasswald 1.0 0.4 �58.4 �5.3 0.53
Litschau 0.4 0.3 �0.8 �0.1 0.01 (n.s.)
Lunz 0.9 0.4 �52.7 �5.9 0.25 (n.s.)
Lobau 1.0 0.9 �9.9 �0.9 0.01 (n.s.)
Nassfeld 1.4 1.0 �28.2 �3.5 0.09 (n.s.)
NO�3
Reutte 3.7 3.8 2.0 0.1 0.01 (n.s.)
Kufstein 4.5 4.7 5.6 0.4 0.01 (n.s.)
Innervillgraten 1.7 1.4 �19.1 �1.3 0.11 (n.s.)
Haunsberg 5.5 3.4 �38.2 �2.4 0.48
Werfenweng 3.0 2.7 �10.1 �0.6 0.06 (n.s.)
Sonnblick 2.5 2.8 14.4 1.2 0.07 (n.s.)
Nasswald 4.1 3.4 �17.3 �1.6 0.10 (n.s.)
Litschau 2.6 2.5 �3.7 �0.4 0.01 (n.s.)
Lunz 6.4 7.2 12.5 1.4 0.04 (n.s.)
Lobau 2.5 2.1 �15.2 �1.3 0.04 (n.s.)
Nassfeld 5.3 5.2 �0.7 �0.1 0.01 (n.s.)
SO2�4
Reutte 6.1 3.6 �41.7 �2.8 0.44
Kufstein 7.1 3.7 �47.1 �3.1 0.36
Innervillgraten 4.5 1.5 �67.4 �4.5 0.57
Haunsberg 9.7 3.1 �67.7 �4.2 0.81
Werfenweng 5.8 2.2 �61.6 �3.9 0.65
Sonnblick 5.4 4.0 �25.4 �2.1 0.32 (n.s.)
Nasswald 8.5 4.3 �49.4 �4.5 0.49
Litschau 5.7 3.3 �41.3 �4.1 0.53
Lunz 10.3 6.8 �33.9 �3.8 0.18 (n.s.)
Lobau 6.1 3.0 �50.9 �4.2 0.48
Nassfeld 11.2 9.8 �12.9 �1.6 0.01 (n.s.)
NHþ4 þ NO�
3
Reutte 8.7 8.8 0.9 0.1 0.01 (n.s.)
Kufstein 10.4 11.2 7.4 0.5 0.02 (n.s.)
Innervillgraten 4.5 3.8 �14.8 �1.0 0.12 (n.s.)
Haunsberg 13.5 8.9 �34.0 �2.1 0.37
Werfenweng 6.6 5.7 �13.3 �0.8 0.09 (n.s.)
Sonnblick 9.0 7.0 �22.3 �1.9 0.24 (n.s.)
Nasswald 9.3 6.5 �30.6 �2.8 0.28 (n.s.)
Litschau 8.4 6.5 �22.6 �2.3 0.15 (n.s.)
Lunz 14.6 14.4 �1.3 �0.1 0.01 (n.s.)
Lobau 6.5 4.3 �33.8 �2.8 0.23 (n.s.)
Nassfeld 13.5 11.7 �13.7 �1.7 0.04 (n.s.)
Base cations
Reutte 16.5 4.7 �71.4 �6.5 0.64
Kufstein 6.0 4.5 �24.4 �2.2 0.14 (n.s.)
Innervillgraten 3.6 2.9 �20.3 �1.9 0.08 (n.s.)
Haunsberg 12.0 23.0 92.3 6.2 0.06 (n.s.)
Werfenweng 14.9 9.3 �37.7 �2.7 0.04 (n.s.)
Sonnblick 12.4 10.6 �14.9 �1.2 0.06 (n.s.)
Nasswald 16.0 5.5 �65.7 �6.0 0.55
Litschau 4.3 6.3 45.3 4.53 0.07 (n.s.)
Lunz 19.3 0.3 �98.4 �10.9 0.31 (n.s.)
Lobau 9.3 5.8 �37.9 3.4 0.15 (n.s.)
Nassfeld 22.1 12.7 �42.1 �5.3 0.18 (n.s.)
n.s means non-significant trend.
H. Puxbaum et al. / Chemosphere 48 (2002) 733–747 741

due to one outlier, the rest of the average annual con-
centrations for the site show very close values). In all
cases (except for the sites Nasswald and Nassfeld) a se-
rious hydrogen ion concentration decrease is found
varying between 7% and 102% for the whole period of
monitoring (or between 0.8% and 6.5% per year). If the
extremely low change at site Lunz is eliminated as well
as the increasing statistically non-significant trends at
Nasswald and Nassfeld, then an average hydrogen
concentration decrease of about 80% for the period of
monitoring is observed. It means a annual decrease of
�5%. It is worth noting that the increase at the site
Nassfeld is relatively small (6.5% for the whole period or
0.8% per year; it could be stated that no real change is
observed) and the only substantial exception in the ob-
served overall tendency is the hydrogen ion concentra-
tion increase at the site Nasswald (over 60% for the
period or 5.5% per year). In principle, a serious free
acidity reduction is constantly observed at sites located
in the Western part of Austria (Reutte, Kufstein, In-
nervillgraten, Sonnblick, Haunsberg, Werfenweng from
counties Salzburg and Tyrol) since at sites located in the
middle of the country or its eastern part the free acidity
reduction is either less or no significant change is regis-
tered.
3.3. Sulfate
The sulfate ion concentration decreases at all 11 sites.
Statistically significant linear trend is found at eight
of the sites, exceptions are only Nasswald, Lunz and
Nassfeld being sites located in the eastern part of the
country. The concentration decrease ranges between 5%
and 60% for the period of observation (average annual
change between 0.5% and 4.5%). This is a very con-
vincing illustration of the overall acidity decrease in
many countries from Western Europe and North Amer-
ica. On the other hand, it is important confirmation of
the long postulated influence of emissions from Eastern
European countries, which although seriously reduced
in the last decade, still determine the relatively higher
wet precipitation acidity in Eastern Austria. However,
the differences in the predicted with respect to the linear
regression model sulfate concentrations (1999) between
these two major conditionally separated Austrian re-
gions do not exceed a factor of 2.5.
3.4. Ammonium and nitrate
The linear regression analysis for both major ions has
indicated that no serious changes in their concentrations
throughout the long-time period of observation could be
found. For instance, ammonium concentrations exhibit
a slight decrease (between 0.3% and 55% for the whole
period of monitoring) at almost all sites except for
Kufstein and Innervillgraten, where an increase is found
of about 7% and 17%, respectively. The linear models,
however, are statistically significant only at Sonnblick,
Litschau and Lobau, indicating in this way that the ob-
served changes are rather sporadic fluctuations around
a average value than a serious linear trend. Again, the
maximal differences in the concentration values for the
period of monitoring are around 2–2.5.
For nitrate ions the situation seems even more con-
stant. No statistically significant trend is proved for any
of the sites and the calculated concentration changes are
in fact result of the non-adequateness of the linear
regression models and indicate a relative stability over
a long-time observation. The appearance of outliers
among the average annual concentrations leads some-
times to estimation of overall increase or decrease (e.g.
about 82% increase at Nasswald or 20% decrease at
Lobau for the whole period).
For both ions could be concluded that the long-term
assessment reveals an almost constant level of their
concentrations in the wet precipitation. This is proved
by the simultaneous regression of the ammonium and
nitrate concentrations (sum of both N-containing ion
concentrations). Again, no statistically significant linear
trend is found for 10 out of all 11 sites.
3.5. Chloride
Chloride concentration decreases at 10 out of 11 sites
(between 1% and 7% per year). At four sites the trend is
significant. This situation indicates that the chloride
concentration, similar to those of ammonium and ni-
trate is relatively constant over the long time period of
observation. The chloride concentration increases only
at Haunsberg (with 45% per year) and this is obviously
due to specific local conditions. The slight chloride
concentration decrease is in good agreement with the
estimated trend in USA for an earlier period (up to
1992).
3.6. Base cations (sodium, potassium, calcium, magne-
sium)
In a previously published study on long-term trend
determination of wet precipitation data from the USA,
Lynch et al. found a decrease in the base cations con-
centration (between 2% and 3% per year) in various
sampling sites. In Europe similar trends was detected in
Sweden and The Netherlands. Due to this situation
Lynch postulated a base cations ‘‘offset’’ including the
combined effect of the changes in cation and anion
concentrations.
In this study a slight base cation concentration de-
crease is observed in almost all sampling sites (ex-
ceptions are Haunsberg and Litschau) with changes
742 H. Puxbaum et al. / Chemosphere 48 (2002) 733–747

between 1% and 10% per year. The concentration
increase for the two sites mentioned above is between
4% and 6% per year. Since the statistically signifi-
cant linear trend is calculated only at 2 out of 11 sites, it
may be accepted that in fact the real changes are small
and represent rather the unavoidable concentration
fluctuations caused by local factors than a stable time
trend.
Nevertheless, some important assumptions about
role of different local factors in the acidity decrease
could be suggested. Three main groups of sites are
formed with respect to the changes in sulfate and hy-
drogen concentrations. The first group includes sites
with relatively higher level of hydrogen ion concentra-
tion decrease as compared to the sulfate ion concentra-
tion decrease (Innervillgraten, Haunsberg, Werfenweng,
Nasswald). In the second group (Luntz, Nassfeld,
Lobau) exactly the opposite situation is observed. This
second case indicates that for such a situation, the base
cation ‘‘offset’’ influences the acidity changes. In the
third group (Reutte, Kufstein, Sonnblick, Litschau) the
free acidity decrease is probably due to the overall
reduction of the sulfur oxide emissions in Europe.
3.7. Trend analysis of depositions
The results from the linear regression analysis of data
for the changes in deposition are presented in Table 3.
The deposition data reflect with higher level of signifi-
cance the changes in the overall acidity, base cations and
nitrogen containing ions from the wet precipitation data
since they take into account the precipitation amount
throughout the monitoring.
3.8. Hydrogen
As it could be readily seen, the trend observed for the
concentrations at the different sampling sites is almost
the same for the hydrogen deposition. Statistically
significant decline is proved for 6 out of 11 sites and it
varies between 4% and 7% decrease per year. Exceptions
are sites Lunz and Sonnblick with a statistically non-
significant hydrogen ion deposition increase of about 1%
per year, which is an indication for deposition stability
all over the monitoring period.
3.9. Sulfate
Again, a very dominant decreasing trend for sulfate
depositions at all sampling sites is observed (varying
between 1.6% and 4.5% per year). The trend is statisti-
cally significant in 8 out of 11 sites (Lunz and Nassfeld
are again sites with non-significant linear trend as it
was in the concentration estimation; instead of site
Sonnblick indicating non-significant trend for sulfate
concentration change, Nasswald is the site with non-
significance of the deposition trend).
The substantial decrease of the overall acidity for the
whole net of sampling sites in case of deposition change
estimation is an indication that the precipitation amount
is not the factor, which influences substantially the trend
of the acidity reduction.
3.10. Ammonium and nitrate
No differences are observed in comparison with the
concentration considerations. The statistical significance
of the linear trend for the majority of the sites is absent
and it is an indication for a relatively constant level of
the deposition amount over the years of monitoring for
almost all sampling sites. The deposition amount tends
to a slight decrease and the same holds true for the sum
of both nitrogen-containing ions.
3.11. Chloride
The only exceptions of the observed chloride depo-
sition changes are at sites Haunsberg and Litschau
where a significant increase of chloride deposition for
the period of monitoring is found (totally over 500% or
about 30% per year for Haunsberg and much less but
still exceptional for Litschau––28% totally and about 3%
per year). This is an indication for specific local condi-
tions since at all other sampling sites (although rarely
possessing linear trend significance) a deposition de-
crease (between 2% and 8% per year). It is important to
note that this specific increase is related to the deposition
increase of base cations at the same sampling sites
confirming in this way the local factor influence.
3.12. Base cations (sodium, potassium, calcium, magne-
sium)
In general, the base cations deposition changes cor-
respond closely to the deposition changes of chlo-
ride––statistically non-significant trend of decrease in 9
out of 11 sites (significant linear trend is found only for
Reutte and Nasswald, both cases with decreasing de-
positions) and for two sites (Haunsberg and Litschau)
base cation deposition increase (6% and 4.5% per year,
respectively). As mentioned above, this is an indication
for specific local conditions.
3.13. Site identity
The overall changes in major ion concentrations and
depositions of the wet precipitation monitoring data
from the Austrian monitoring network need a more
careful discussion with respect to the sampling site lo-
cation. It is obvious that, on one side, the global ten-
dency of acidic reduction is followed but, on the other
H. Puxbaum et al. / Chemosphere 48 (2002) 733–747 743

side, local conditions also determine the wet precipita-
tion chemistry. It was assumed that the summarizing of
several possible reasons for influences on the chemical
content of the wet precipitation in the region of interest
could be of use.
In Fig. 2 the changes in the emissions from SO2, NOx
and NH3 during the last 20 years for Austria (Um-
weltbundesamt, 2001) are presented.
The rapid decrease of the sulfur dioxide emissions
after the mid 80s are well documented and it corre-
sponds very close with the sulfate concentration and
deposition changes in all sampling sites (in Fig. 3a and b
the changes in site Sonnblick and site Werfenweng are
presented as representative for the region of interest).
If the gross annual average data (for the whole period
of monitoring) for concentrations or depositions at each
site are simultaneously plotted, one could easily cluster
the sampling sites into three main groups depending on
the average values of concentrations or depositions. The
first group is formed by the sites with relatively highest
levels of concentrations or depositions (Haunsberg and
Lobau); the second group contains sites with middle
levels of concentrations or depositions (Litschau, Luntz,
Nasswald, Nassfeld and Werfenweng); the last cluster
includes the sites with lowest average concentrations
and depositions (Reutte, Innervillgraten, Sonnblick and
Kufstein). It could be concluded that the sites from the
Tyrol county are clustered separately and represent a
region with lower level of atmospheric pollution since
the site Lobau, which is located far east is with highest
level of pollution.
This situation required a more careful consideration
of the dependence of the chemical composition of the
wet precipitation with the special location of the sam-
pling sites. It was also interesting to compare the annual
average values for the long-term trends with values from
sites from neighbouring countries, which could influence
the atmospheric state through transboundary transfer
Fig. 2. Trend in air polluting emissions of SO2, NOx and NH3 in Austria (1980–1999).
Fig. 3. (a) Trend in sulfate concentration at site Sonnblick
(1987–1998). (b) Trend in sulfate concentration at site Wer-
fenweng (1984–1999).
744 H. Puxbaum et al. / Chemosphere 48 (2002) 733–747

processes. Five sites from the EMEP network (co-
operative programme for monitoring and evaluation
of long range transmission of air pollutants in Eu-
rope) located in Switzerland (T€aanikon), Czech Republic
(Kosetice), Hungary (K-puszta), Germany (Brotjackl-
riegel) and Italy (Ispra) were considered as suitable and
data for average monthly and annual concentrations
and depositions were compared with the gross average
values for the Austrian sites (Meteorological Synthesiz-
ing Centre-West of EMEP, 2000). The plotting is per-
formed with respect to the geographical location of each
sampling site. A very distinctive West–East decreasing
trend was observed (Fig. 4a and b) for sulfate concen-
trations and depositions. The linear trend is statistically
significant and the regression line is presented on the
plot for comparison.
This confirms to high extent the clustering of the
Austrian sampling sites into three well-defined groups.
The Alpine character of the western background sites
supposes a lower level of acidic components in the wet
precipitation since the transboundary atmospheric trans-
fer causes enhanced acidification of the eastern Austrian
sites.
A more special case in this configuration is site
Haunsberg. The site is located in Salzburg county and
lies closer to the western sites than to the eastern ones.
Nevertheless, the levels of acidic components, N-con-
taining ions and base cations are much higher than those
of the neighbouring sites and resemble more the eastern
sites than the local stations. Obviously, as already men-
tioned above, quite specific local factors determine the
wet chemistry at this site, e.g. building activities, crustal
influences etc.
3.14. Regional patterns and trends
If the different counties are separately considered,
it could be concluded that (in case of concentration
changes; same trend is kept for the deposition changes)
that the highest level of acidity decrease (hydrogen and
sulfate concentration per year) is found for the Vienna
site Lobau (nearly 7% and 4.5% per year, respectively).
All other counties (Tyrol, Salzburg, Lower Austria and
Carinthia) have similar figures for mean annual acidity
decrease of about 5% per year for hydrogen and about
3–3.5% per year for sulfate (average for the whole re-
gion). The Tyrol and Salzburg sites as a whole indicate
quite similar trends. The same holds true for site simi-
larity from Lower Austria and the Carinthian site
Nassfeld. But local influences and factors create differ-
ences in the site concentration or deposition patterns like
strongly enhanced potassium concentration at Innerv-
illgraten more than 6% per year, very high levels of
chloride and calcium with strongly increasing trend at
Haunsberg (up to 45% per year and over 17% per year,
respectively), serious acidity increase at Nasswald (about
5% per year as hydrogen ion concentration) and high
sodium increasing trend at Litschau (about 18% per
year). These typical ‘‘outliers’’ in the data set, which
influence the general patterns of site similarities, have to
be carefully treated in final decision making.
As seen from the trend Tables 2 and 3 the lowest
average acidic (sulfate) concentrations and depositions
for the whole period of monitoring are in Tyrolean and
Salzburg sites and the highest––in Vienna region. The
same holds true for the N-containing ions and base ca-
tions. This is another confirmation of the West–East
acidity increasing trend for the whole region.
4. Conclusions
The trend study of the rainwater data sets made it
possible to determine the trend of the major ion con-
centrations and depositions over a long period of mon-
itoring (1984–1999) for 11 sampling sites of the Austrian
monitoring network. The choice of the time period was a
result of the availability of data with good quality and
Fig. 4. (a) West–East acidity increasing trend (sulfate concen-
trations). (b) West–East acidity increasing trend (sulfate depo-
sitions). Legend: CH, Switzerland; H, Hungary; G, Germany;
CZ, Czech Republic; I, Italy; RE, Reutte; KU, Kufstein; IN,
Innervillgraten; HA, Haunsberg; WE, Weerfenweng; SB, Son-
nblick; NW, Nasswald; LI, Litschau; LU, Lunz; NF, Nassfeld;
LO, Lobau.
H. Puxbaum et al. / Chemosphere 48 (2002) 733–747 745
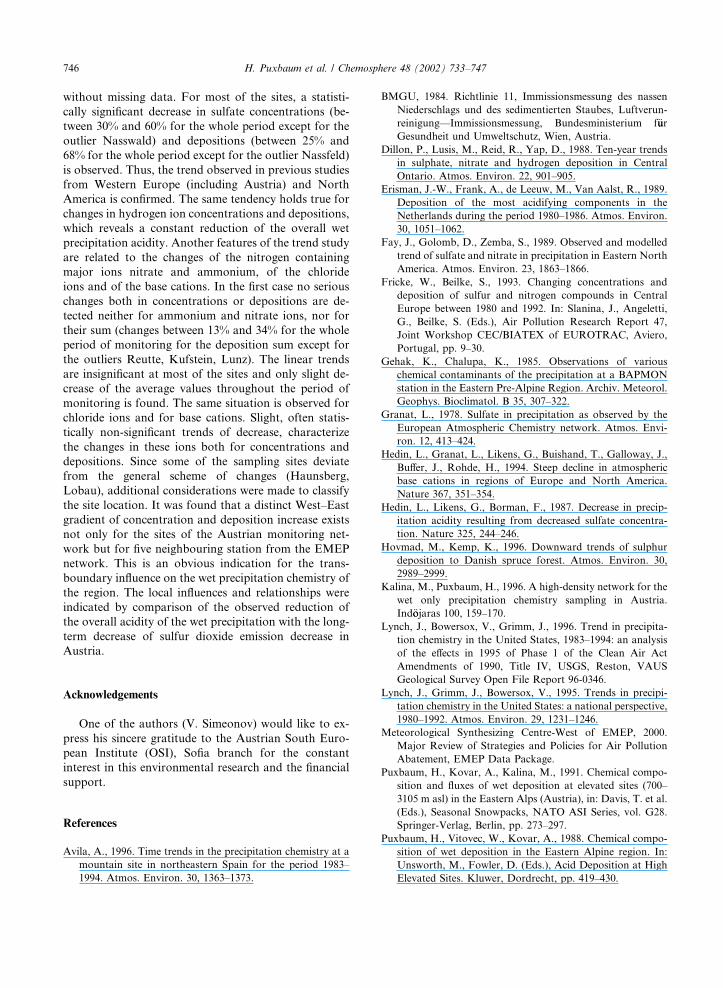
without missing data. For most of the sites, a statisti-
cally significant decrease in sulfate concentrations (be-
tween 30% and 60% for the whole period except for the
outlier Nasswald) and depositions (between 25% and
68% for the whole period except for the outlier Nassfeld)
is observed. Thus, the trend observed in previous studies
from Western Europe (including Austria) and North
America is confirmed. The same tendency holds true for
changes in hydrogen ion concentrations and depositions,
which reveals a constant reduction of the overall wet
precipitation acidity. Another features of the trend study
are related to the changes of the nitrogen containing
major ions nitrate and ammonium, of the chloride
ions and of the base cations. In the first case no serious
changes both in concentrations or depositions are de-
tected neither for ammonium and nitrate ions, nor for
their sum (changes between 13% and 34% for the whole
period of monitoring for the deposition sum except for
the outliers Reutte, Kufstein, Lunz). The linear trends
are insignificant at most of the sites and only slight de-
crease of the average values throughout the period of
monitoring is found. The same situation is observed for
chloride ions and for base cations. Slight, often statis-
tically non-significant trends of decrease, characterize
the changes in these ions both for concentrations and
depositions. Since some of the sampling sites deviate
from the general scheme of changes (Haunsberg,
Lobau), additional considerations were made to classify
the site location. It was found that a distinct West–East
gradient of concentration and deposition increase exists
not only for the sites of the Austrian monitoring net-
work but for five neighbouring station from the EMEP
network. This is an obvious indication for the trans-
boundary influence on the wet precipitation chemistry of
the region. The local influences and relationships were
indicated by comparison of the observed reduction of
the overall acidity of the wet precipitation with the long-
term decrease of sulfur dioxide emission decrease in
Austria.
Acknowledgements
One of the authors (V. Simeonov) would like to ex-
press his sincere gratitude to the Austrian South Euro-
pean Institute (OSI), Sofia branch for the constant
interest in this environmental research and the financial
support.
References
Avila, A., 1996. Time trends in the precipitation chemistry at a
mountain site in northeastern Spain for the period 1983–
1994. Atmos. Environ. 30, 1363–1373.
BMGU, 1984. Richtlinie 11, Immissionsmessung des nassen
Niederschlags und des sedimentierten Staubes, Luftverun-
reinigung––Immissionsmessung, Bundesministerium f€uur
Gesundheit und Umweltschutz, Wien, Austria.
Dillon, P., Lusis, M., Reid, R., Yap, D., 1988. Ten-year trends
in sulphate, nitrate and hydrogen deposition in Central
Ontario. Atmos. Environ. 22, 901–905.
Erisman, J.-W., Frank, A., de Leeuw, M., Van Aalst, R., 1989.
Deposition of the most acidifying components in the
Netherlands during the period 1980–1986. Atmos. Environ.
30, 1051–1062.
Fay, J., Golomb, D., Zemba, S., 1989. Observed and modelled
trend of sulfate and nitrate in precipitation in Eastern North
America. Atmos. Environ. 23, 1863–1866.
Fricke, W., Beilke, S., 1993. Changing concentrations and
deposition of sulfur and nitrogen compounds in Central
Europe between 1980 and 1992. In: Slanina, J., Angeletti,
G., Beilke, S. (Eds.), Air Pollution Research Report 47,
Joint Workshop CEC/BIATEX of EUROTRAC, Aviero,
Portugal, pp. 9–30.
Gehak, K., Chalupa, K., 1985. Observations of various
chemical contaminants of the precipitation at a BAPMON
station in the Eastern Pre-Alpine Region. Archiv. Meteorol.
Geophys. Bioclimatol. B 35, 307–322.
Granat, L., 1978. Sulfate in precipitation as observed by the
European Atmospheric Chemistry network. Atmos. Envi-
ron. 12, 413–424.
Hedin, L., Granat, L., Likens, G., Buishand, T., Galloway, J.,
Buffer, J., Rohde, H., 1994. Steep decline in atmospheric
base cations in regions of Europe and North America.
Nature 367, 351–354.
Hedin, L., Likens, G., Borman, F., 1987. Decrease in precip-
itation acidity resulting from decreased sulfate concentra-
tion. Nature 325, 244–246.
Hovmad, M., Kemp, K., 1996. Downward trends of sulphur
deposition to Danish spruce forest. Atmos. Environ. 30,
2989–2999.
Kalina, M., Puxbaum, H., 1996. A high-density network for the
wet only precipitation chemistry sampling in Austria.
Ind€oojaras 100, 159–170.
Lynch, J., Bowersox, V., Grimm, J., 1996. Trend in precipita-
tion chemistry in the United States, 1983–1994: an analysis
of the effects in 1995 of Phase 1 of the Clean Air Act
Amendments of 1990, Title IV, USGS, Reston, VAUS
Geological Survey Open File Report 96-0346.
Lynch, J., Grimm, J., Bowersox, V., 1995. Trends in precipi-
tation chemistry in the United States: a national perspective,
1980–1992. Atmos. Environ. 29, 1231–1246.
Meteorological Synthesizing Centre-West of EMEP, 2000.
Major Review of Strategies and Policies for Air Pollution
Abatement, EMEP Data Package.
Puxbaum, H., Kovar, A., Kalina, M., 1991. Chemical compo-
sition and fluxes of wet deposition at elevated sites (700–
3105 m asl) in the Eastern Alps (Austria), in: Davis, T. et al.
(Eds.), Seasonal Snowpacks, NATO ASI Series, vol. G28.
Springer-Verlag, Berlin, pp. 273–297.
Puxbaum, H., Vitovec, W., Kovar, A., 1988. Chemical compo-
sition of wet deposition in the Eastern Alpine region. In:
Unsworth, M., Fowler, D. (Eds.), Acid Deposition at High
Elevated Sites. Kluwer, Dordrecht, pp. 419–430.
746 H. Puxbaum et al. / Chemosphere 48 (2002) 733–747

Rohde, H., Granat, L., 1984. An evaluation of sulfate in
European precipitation 1955–1982. Atmos. Environ. 18,
2627–2639.
Ruijgork, W., R€oomer, F., 1993. Aspects of wet acidification
deposition in Arnheim: source regions correlation and
trends (1984–1991). Atmos. Environ. 27A, 637–653.
Sanusi, A., Worthham, H., Miller, M., Mirabel, P., 1995.
Chemical composition of rainwater in Eastern France.
Atmos. Environ. 30, 59–71.
Schulze, E.-D., De Vries, W., Hauhs, M., Rosen, K., Rasmu-
sen, I., Tamm, C., Nilsson, J., 1990. Critical loads for
nitrogen deposition on forest ecosystems. Water Air Soil
Pollut. 48, 451–454.
Umweltbundesamt, 2001. In: Ritter, M., Poupa, S., Waitz, E.
(Eds.), Aktualisierung der Luftschadstoff-Trends in €OOsterr-eich 1980–1999. Umweltbundesamt Verlag, Wien.
West, L., Feagley, S., 1995. The chemical composition of
atmospheric deposition collected from six Louisiana sites
from 1983 to 1992. Atmos. Environ. 29, 1211–1217.
Winkler, P., Jobst, S., Harder, C., 1989. Meteorologische
Pr€uufung und Beurteilung von Sammelger€aaten f€uur nasse
Deposition, BTP-Bericht 1/89, GSF, M€uunchen, Germany.
H. Puxbaum et al. / Chemosphere 48 (2002) 733–747 747