LIVE d-MOVI~ - NSE
60
5 th August, 2019 The Secretary BSE Limited P J Towers Dalal Street Mumbai – 400 001 Scrip Code: 532706 The Manager National Stock Exchange of India Limited Exchange Plaza, 5th Floor, Plot No C/1 G Block, Bandra-Kurla Complex Bandra (East), Mumbai – 400 051 Scrip Code: INOXLEISUR Dear Sir / Madam, Sub: Disclosure of Material Events / Information under Regulation 30 of SEBI (Listing Obligations and Disclosure Requirements) Regulations, 2015 - Schedule of Analysts / Investors Meetings. Pursuant to Regulation 30 of the Securities and Exchange Board of India (Listing Obligations and Disclosure Requirements) Regulations, 2015, we would like to inform you that the Company has scheduled Analysts / Investors Meetings as per details given below: Date Event Interaction with Type of Meeting City August 6, 2019 – August 8, 2019 Non-Deal Road Show with HSBC Various Analysts / Investors One on One / Group Meetings Hong Kong / Singapore Please note that no unpublished price sensitive information is proposed to be shared during the meeting(s). A copy of the Investor Presentation prepared by the Company which we propose to make to the Analysts / Investors during the above Investor Conference is enclosed and the said Investor Presentation has also been uploaded on the Company’s Website at https://www.inoxmovies.com/Corporate.aspx?Section=3 Note: The above schedule may undergo changes due to exigencies on the part of the Analysts / Investors or the Company. You are requested to take the same on record. Thanking you, Yours faithfully, For INOX Leisure Limited Parthasarathy Iyengar Company Secretary INOXLEISURE LTO. 51!1Floor,VW11j1-1;,Nu1t1Ardllllflyower.Wft1em~H,gllwlyAnttolri(Eall~J.tJml:ial "IXI093,lnl;l,a. Titl(9122}40626900 · Fa (ll122).Wll999 · E. ~.oom•-Jnomo,,,N.oom it.gillel'l'CIOlfic• :"8STOW9tl,OldP..:l,.Ro.d,'hdoda'IIJ90007•Ttll(91265}61911111 • Fa(ll1265)Z310312 • CIN. l921119GJ11199Plco,i..o.&5 LIVE d- MOVI~
-
Upload
khangminh22 -
Category
Documents
-
view
0 -
download
0
Transcript of LIVE d-MOVI~ - NSE

5th August, 2019 The Secretary BSE Limited P J Towers Dalal Street Mumbai – 400 001
Scrip Code: 532706
The Manager National Stock Exchange of India Limited Exchange Plaza, 5th Floor, Plot No C/1 G Block, Bandra-Kurla Complex Bandra (East), Mumbai – 400 051 Scrip Code: INOXLEISUR
Dear Sir / Madam, Sub: Disclosure of Material Events / Information under Regulation 30 of
SEBI (Listing Obligations and Disclosure Requirements) Regulations, 2015 - Schedule of Analysts / Investors Meetings.
Pursuant to Regulation 30 of the Securities and Exchange Board of India (Listing Obligations and Disclosure Requirements) Regulations, 2015, we would like to inform you that the Company has scheduled Analysts / Investors Meetings as per details given below:
Date Event Interaction with
Type of Meeting
City
August 6, 2019 – August 8, 2019
Non-Deal Road Show with HSBC
Various Analysts / Investors
One on One / Group Meetings
Hong Kong / Singapore
Please note that no unpublished price sensitive information is proposed to be shared during the meeting(s). A copy of the Investor Presentation prepared by the Company which we propose to make to the Analysts / Investors during the above Investor Conference is enclosed and the said Investor Presentation has also been uploaded on the Company’s Website at https://www.inoxmovies.com/Corporate.aspx?Section=3 Note: The above schedule may undergo changes due to exigencies on the part of the Analysts / Investors or the Company. You are requested to take the same on record. Thanking you, Yours faithfully, For INOX Leisure Limited
Parthasarathy Iyengar Company Secretary
INOXLEISURE LTO. 51!1Floor,VW11j1-1;,Nu1t1Ardllllflyower.Wft1em~H,gllwlyAnttolri(Eall~J.tJml:ial "IXI093,lnl;l,a. Titl(9122}40626900 · Fa (ll122).Wll999 · E.~.oom•-Jnomo,,,N.oom ~
it.gillel'l'CIOlfic• :"8STOW9tl,OldP..:l,.Ro.d,'hdoda'IIJ90007•Ttll(91265}61911111 • Fa(ll1265)Z310312 • CIN. l921119GJ11199Plco,i..o.&5
LIVE d-MOVI~

I nve st or
P re se nt at ion
August 2019

Disclaimer
2
This presentation and the following discussion may contain “forward looking statements” by Inox Leisure Limited (“ILL” or “theCompany”) that are not historical in nature. These forward looking statements, which may include statements relating to future stateof affairs, results of operations, financial condition, business prospects, plans and objectives, are based on the current beliefs,assumptions, expectations, estimates, and projections of the management of ILL about the business, industry and markets in which ILLoperates.
These statements are not guarantees of future performance, and are subject to known and unknown risks, uncertainties, and otherfactors, some of which are beyond ILL’s control and difficult to predict, that could cause actual results, performance or achievementsto differ materially from those in the forward looking statements.
Such statements are not, and should not be construed, as a representation as to future performance or achievements of ILL. Inparticular, such statements should not be regarded as a projection of future performance of ILL. It should be noted that the actualperformance or achievements of ILL may vary significantly from such statements.
Due to rounding-off, figures presented throughout this document may not add up precisely to the totals provided and percentagesmay not precisely reflect the rounded-off figures.
FY15 financial figures are as per IGAAP and for FY16 and thereafter are as per IND-AS. Revenues for FY15 are shown net ofentertainment tax, to be consistent with the revenues under IND-AS for FY16 onwards

3
D I S C U S S I O N S U M M A R Y
I N D U S T R Y O V E R V I E W
C O M P A N Y O V E R V I E W
C O M P E T I T I V E A D V A N T A G E & O U T L O O K
A N N E X U R E
1Ne ·x BRINGS TO YOU
SPECTACULAR CINEMA FORMATS

4
INDUSTRY OVERVIEW

Strong Fundamentals & Huge Growth Potential
5
125
95 80
60 57 40 37
26 25 12 10 8
US France Spain UK Germany South Korea China Japan Taiwan Thailand Brazil India
H o w e v e r , I n d i a ’ s S c r e e n D e n s i t y i s O n e o f t h e L o w e s t
Screens / Million population
Source: CRISIL Report, http://uis.unesco.org/en/news/cinema-data-release (2015), Industry sources and internal calculations
2,178 1,930
1,364
208 197 176 171 169 156 146
China India US France Mexico UK Japan S. Korea Germany Russia
2 n d H i g h e s t N u m b e r O f T h e a t r e F o o t f a l l s i n t h e W o r l d
Footfalls in Million2,000
791686
581
300 298 269 255 226 185
-4 00
100
600
1,10 0
1,60 0
2,10 0
India US China Japan France UK S. Korea Spain Germany Italy
H i g h e s t N u m b e r o f F i l m P r o d u c e d i n t h e W o r l d
.,1 .I .1 I : , ____ .,
,l ,I
1 .• , ■ , • . • . •
1 . ■ . ■ . ■ . ■ - r -
• r •
I I I I I I , ____ .,

Steady Performance and Resilience
6
96.3 102.1 110.0130.0
155.5174.5
194.2
236.1
0.0
50.0
100.0
150.0
200.0
250.0
2017 2018 2019E 2021EDomestic Theatrical Overseas Theatrical Broadcast rights Digital/OTT rights In-cinema advertising Home Video
In Rs. Billion
I n d i a n F i l m I n d u s t r y D i s p l a y s S t e a d y P e r f o r m a n c e T r e n d s
D o m e s t i c T h e a t r i c a l s C o n s t i t u t e s 5 9 % O f T o t a l F i l m I n d u s t r y
Source: FICCI-EY 2019 Report
59%
17%
12%
8% 4% 0%
Domestic Theatrical
Overseas Theatrical
Broadcast rights
Digital/OTT rights
In-cinema advertising
Home Video
2018
■
IN
_________________________________ CA.GB~1% -------------------------------+ --■
■
■
■
■
■
X

Multiplexes Witnessing Rapid Growth
7
FACTORS DRIVING GROWTH IN
MULTIPLEXES:
Strong demographics, rising disposable
incomes and discretionary spends.
Superior location, destination and
parking facilities.
Multiple screens in one location offer a
wider variety of content to the patrons.
Different screen sizes provide
programming flexibility. This results in
higher occupancy ratios.
State of art equipment (high quality
video and audio), superior interiors,
ambience and service.
Source: FICCI-EY Report 2018 & 2019
M u l t i p l e x e s c u r r e n t l y a c c o u n t f o r ~ 3 1 % m a r k e t s h a r e o f t h e s c r e e n s ,
h o w e v e r t h e y a c c o u n t f o r ~ 5 5 % o f b o x o f f i c e c o l l e c t i o n s
Number of Screens
9,710 9,121 8,451 7,400 7,031 6,780 6,651
925 1,225
1,500 2,100 2,450 2,750 2,950
10,635 10,346 9,951 9,500 9,481 9,530 9,601
-
2,00 0
4,00 0
6,00 0
8,00 0
10,0 00
12,0 00
14,0 00
16,0 00
2009 2011 2013 2015 2016 2017 2018
Single Screens Multiplexes
T T T
■

Increasing Number Of INR 1bn + Movies
8
1,000 1,598
2,065 2,101 2,638
3,014 3,446 3,359
5,200 4,500
5,300
6,500
4,500
6,900
-
1,00 0
2,00 0
3,00 0
4,00 0
5,00 0
6,00 0
7,00 0
8,00 0
3 Idiots(2009)
Dabaang(2010)
Bodyguard(2011)
Ek Tha Tiger(2012)
Dabaang 2(2012)
ChennaiExpress(2013)
Dhoom 3(2013)
Kick(2014)
P.K(2014)
BajrangiBhaijaan(2015)
Dangal(2016)
Bahubali 2 -The
Conclusion(2017)
Tiger ZindaHai (2017)
2.0 (2018)
1 2
5 9
6 7 5
8 7 10
5
1
2 1 1
- 1
2
3
- --
-
-- 1
1
2 2
3
1
-
2
4
6
8
10
12
14
2008 2009 2010 2011 2012 2013 2014 2015 2016 2017 2018 Jul-19
INR 1Bn to 1.99Bn INR 2Bn to 2.99 Bn INR 3Bn and above
Wider Screen Releases
Higher Number Of INR 1 Bn + MoviesINCREASING NUMBER OF
MOVIES ARE GENERATING
MORE THAN RS 1 BN IN NET
BOX OFFICE COLLECTIONS
DRIVEN BY WIDER SCREEN
RELEASES AND FACILITATED BY
DIGITISATION OF CONTENT
DELIVERY
Source: Industry
■ ■ ■

I n d i a ’ s C o n s u m p t i o n S t o r y
9Source: Mckinsey - Tracking the growth of Indias Middle Class - 2017
6148 39 30
3952 61 70
1995 2005 2015 2025
Necessities Discretionary
%Share of Average Annual Household Consumption
%Share of Population by Income Bracket
9380
54
3522
618
41
43
36
1 25
22
42
0
10
20
30
40
50
60
70
80
90
100
1985 1995 2005 2015 2025
Lower Class Lower Middle Class Middle & Affluent Class
755 928
1,107 1,278
1,429
-
200
400
600
800
1,00 0
1,20 0
1,40 0
1,60 0
1985 1995 2005 2015 2025
Population of India (Million)
Based on Annual Household Income: Lower Class: < Rs.90,000 , Lower Middle Class: Rs.90,000 to Rs.199,999 , Middle & Affluent Class: > Rs.200,000
702 742 598
447 314
45 167 454
550
514
8
19
55 281 600
-
200
400
600
800
1,000
1,200
1985 1995 2005 2015 2025
Lower Class Lower Middle Class Middle & Affluent Class
Share of Population by Income Bracket (Million)
■ ■ ■
■ ■ ■
■ ■
IN
.------.
-----.
t •= I I
it I --1 -I I I I
X

10
Company Overview
INOX Nehru Place, Delhi
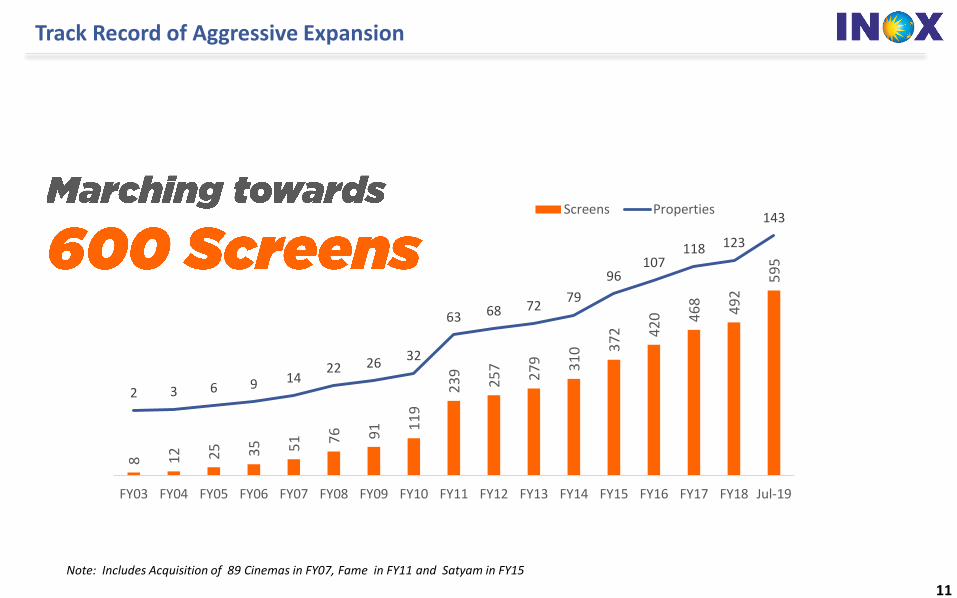
Track Record of Aggressive Expansion
11
Note: Includes Acquisition of 89 Cinemas in FY07, Fame in FY11 and Satyam in FY15
8 12 25 35 51 7
6 91 1
19
23
9
25
7
27
9 31
0 37
2 42
0 46
8
49
2
59
5
2 3 6 9 1422 26
32
63 68 7279
96107
118 123
143
-50
0
50
100
150
200
0
100
200
300
400
500
600
700
800
900
1000
FY03 FY04 FY05 FY06 FY07 FY08 FY09 FY10 FY11 FY12 FY13 FY14 FY15 FY16 FY17 FY18 Jul-19
Screens PropertiesMarching towards - -600Screens
- - - ■ ■ I I I I I

PAN India Presence
12
ONE OF THE LARGEST MULTIPLEX CHAIN OPERATOR IN INDIA
* Includes 8 management properties with 29 screens and 7,370 seats
KERALA |1 Property | 6 Screens
19States
67Cities
143Properties
595Screens
139,797Seats
JHARKHAND | 1 Property | 4 Screens
WEST BENGAL | 15 Properties | 59 Screens
ODISHA | 4 Property | 14 Screens
CHHATTISGARH | 2 Properties | 8 Screens
TELANGANA | 3 Properties | 19 Screens
ANDHRA PRADESH | 8 Properties | 33 ScreensKARNATAKA |12 Properties | 49 Screens
GOA | 4 Properties | 14 Screens
MAHARASHTRA | 28 Properties | 130 Screens
GUJARAT | 20 Properties | 81 Screens
MADHYA PRADESH | 5 Properties | 22 Screens
RAJASTHAN | 13 Properties | 47 Screens
HARYANA | 6 Properties | 19 Screens
TAMIL NADU | 5 Properties | 31 Screens
UTTAR PRADESH | 8 Properties | 31 Screens
DELHI | 5 Properties | 16 Screens
PUNJAB | 2 Property | 10 Screens
Assam | 1 Property | 2 Screens
IN X

13
INSIGNIA – LUXURY MOVIE
WATCHING EXPERIENCE
R-City Ghatkopar, Mumbai

14
Atria, Worli, Mumbai

15
CR2, Nariman Point, Mumbai

16
Atria, Worli, Mumbai

17
R-City, Ghatkopar, Mumbai

18
Palm Beach, Navi Mumbai
19
INOX Epicuria, Delhi

20
INOX Metro, Mumbai

21
INOX GT Central, Jaipur

22
INOX Malad, Mumbai

23
INOX Marina Mall, Chennai

24
IN• :X L I V E IAt M O V I E
~ -x~eeclf.#t; expectationsc' ..
MOST AWARDED MULTIPLEX OF THE YEAR INOX LEISURE
ET BEST BRANDS
2018-19
BEST TECHNOLOGY OFTHEYEAR
t IMAX BIG CINE AWARDS
2018
POPULAR MULTIPLEX
TIMES RETAIL ICON AWARDS
2018-19
BEST MARKETED
BRAND KOTLER AWARD OF EXCELLENCE
2018-19
MULTIPLEX CHAIN OFTHEYEAR
AT IMAX BIG CINE AWARDS
2018
HIGHEST LUXURY STANDARDS
AT INTERNATIONAL FILM BUSINESS AWARDS2018
MOST ADMIRED MULTIPLEX OF THE
YEAR AT ET NOW GLOBAL AWARDS
FOR RETAIL EXCELLENCE
BEST EMPLOYER OFTHEYEAR
AT EMPLOYER BRANDING AWARDS 2018-19

25
Highest “EBITDA to Capital
Invested” Ratio in the Industry
Highest PAT Margin
in the Industry - Q1FY20
Highest Ad Revenue Growth
Rate in the Industry for
Highest Q1FY20 Footfalls
Growth in the Industry
First National Chain
in the Industry to be
Excludes Ind AS 116 impact
8%
9 Consecutive Quarters
Net Debt Free
CORDS CONSISTENTLY

26
Revenue
Rs.493crs
19%YoY
EBITDA
Rs.89crs
6%YoY
PAT
Rs.41crs
11%YoY
Footfalls
1.73crs
11%YoY
SPH
Rs.816%YoY
Excludes impact of Ind AS 116 Excludes impact of Ind AS 116
Ad Sales
Rs.47crs
18%YoY

27
INHGNIA ,~ors SIi.NATURE
EXPERIEIICE
BRINGS YOU
SCAEEN:xt: Onyx 'Di11ef WOltUl'S MOST IIIMfRSl'IE
MOVIE EnRAVAGANZA! IKlll.l'S FIRST M:UO CINEl\lA
ntAT 5nMULATES All YOUR SENSES
LASER 30if., BRIGHTER
IIIDIA'S FIRST 270 DE~REE l'Jl1'01tAM-IC
MOYIE WATCIUKG EXPERIENCE
AFFDROAlllf LUXURY ntf LARC.E SCREEN EXPERIENCE
ANO SHARPER Pi<OJECTlON FOIi THE $MARTIR GENERATION DEDICATEll llD'S
P\AY ZONE
MUllll.til'S FIRST LED SPECJACIJLAl'I SCREEN

Overview of IND AS-116 “Leases”
28
New Accounting Standard-116 on Leases is effective from 1st April 2019
No Distinction between Finance and Operating Lease now.
All Leases to be recognised in financials as assets and liabilities (No off-BalanceSheet Rights/Obligations) with exceptions available for immaterial leases andshort term leases (less than 12 month)
Calculation of Assets (Rights) and Liabilities (Obligations)- Lease liability- Calculates Net Present Value (NPV) of lease rent
payment over full lease tenure (discounted at incremental borrowingrate ).
Right of use (ROU)-Initially measured at the amount of lease liabilityadjusted for lease prepayments if any. ROU is depreciated over leaseterm on straight line basis.
Lease liability and ROU will be NIL at the end of the Lease term.
Impact on Profit and Loss Statement - Operating lease expense (fixed part) willbe replaced by depreciation and interest cost, impacting EBITDA, EBIT, PBT andPAT.
Transitional Approach- Company has followed Modified Retrospective approachfor transition to IND AS-116. This approach does not require restatement ofcomparative information for earlier period. The cumulative effect of initiallyapplying the standard is recognized as an adjustment in retained earnings netof deferred taxes.
Ind AS 116 Transitional Impact on Balance SheetAs on 1st April 2019
Right of Use - Assets Rs.1,663Crs.
Lease Liability Rs.2,192Crs.
Impact on Retained EarningsRs.344Crs.
Impact on Deferred Tax AssetRs.185Crs.
LIVE l'/4 MOVIE

Q1FY20 P&L Impact Analysis of Ind AS 116
29
INR Crs.
ParticularsQ1FY20
Reported
Ind AS 116
Impact
Q1FY20
Without
Ind AS 116
Q1FY19 YoY%
Revenue from Operations 493 493 415 19%
Total Expenses * 343 61 404 331 22%
EBITDA 150 -61 89 83 6%
EBITDA Margin(%) 30% 18% 20% -2%
[-]Depreciation 61 -35 26 23 14%
EBIT 89 -26 63 61 3%
[-]Interest 51 -48 3 7 -62%
[+]Other Income 3 3 3 10%
PBT 42 22 63 57 12%
[-] Tax 15 8 22 20 12%
PAT 27 14 41 37 11%
PAT Margin(%) 5% 8% 9% -1%
Basic EPS (Rs.) 2.75 1.45 4.19 4.03 4%
*Ind AS 116 - Rent Impact
IN LIVE l'/4 MOVIE

30
ICC WORLD CUP LIVE SCREENING
AT INOX
INOX PARTNERS WITH IPL RAJASTHAN
INOX ROYALS TEAM PARTNERS WITH INDIAN NATIONAL
RALLY CAMPIONSHIP lFMSCIJ
INOX PARTNERS WITH
RP-SG MAVERICKS FOR
ULTIMATE TABLE TENNIS

R e v e n u e f r o m O p e r a t i o n s
31
All figures in INR Crs., unless specified
415 493
-
100
200
300
400
500
600
Q1FY19 Q1FY20
19%
26%
1,348 1,692
-
200
400
600
800
1,00 0
1,20 0
1,40 0
1,60 0
1,80 0
FY18 FY19
895
1,161 1,221 1,348
1,692
FY15 FY16 FY17 FY18 FY19
t
t

E a r n i n g s B e f o r e I n t e r e s t , Ta x ,D e p r e c i a t i o n a n d A m o r t i z a t i o n [ E B I T D A ]
32
All figures in INR Crs., unless specified
123
189
146
210
309
14%
16%
12%
16%
18%
0%
2%
4%
6%
8%
10%
12%
14%
16%
18%
20%
FY15 FY16 FY17 FY18 FY19
EBITDA EBITDA Margin %
83 89
20% 18%
0%
5%
10%
15%
20%
25%
-
10
20
30
40
50
60
70
80
90
100
Q1FY19 Q1FY20
EBITDA EBITDA Margin
210 309
16%
18%
0%
2%
4%
6%
8%
10%
12%
14%
16%
18%
20%
-
50
100
150
200
250
300
350
FY18 FY19
EBITDA EBITDA Margin
47%
Note: EBITDA excludes Other Income (non-operating)
6%
Excludes Ind AS 116
__ .. GO "'lf,0/o --------
c~ I''"----------------
---
-t
- -

P r o f i t a f t e r t a x [ PAT ]
33
20
81
31
115
133
2%
7%
3%
9%8%
-10.0%
-8.0%
-6.0%
-4.0%
-2.0%
0.0%
2.0%
4.0%
6.0%
8.0%
10.0%
-
20
40
60
80
100
120
140
FY15 FY16 FY17 FY18 FY19
PAT PAT Margin %
37 41
9% 8%
0.0%
1.0%
2.0%
3.0%
4.0%
5.0%
6.0%
7.0%
8.0%
9.0%
10.0%
-
5
10
15
20
25
30
35
40
45
50
Q1FY19 Q1FY20
PAT PAT Margin
16%
115 133
9% 8%
0%
1%
2%
3%
4%
5%
6%
7%
8%
9%
10%
-
20
40
60
80
100
120
140
160
FY18 FY19
PAT PAT Margin
All figures in INR Crs., unless specified# Includes tax write back of Rs.54crs (FY18) and Rs.5crs (FY19)
11%
# #
Excludes Ind AS 116
.,,.. .,,. .,,,. .,,.. --- -
-
,:_'I ol - - ... c~GR u.1.70 - - - - - - - - - -- ---.,,...,.,..,,.--
-
IN
-t =
-t

R e v e n u e s - S e g m e n t B r e a k u p
34
All figures in INR Crs., unless specified
552 713 748 802
975 191
266 284
306
436
81
91 96
139
176
71
91 92 101
105
895
1,161 1,221
1,348
1,692
-
200
400
600
800
1,00 0
1,20 0
1,40 0
1,60 0
1,80 0
2,00 0
FY15 FY16 FY17 FY18 FY19
NBOC F & B Advertising Others
242287
111
13240
4722
26415
493
0
100
200
300
400
500
600
Q1FY19 Q1FY20
802975
306
436139
176
101
105
1348
1692
0
200
400
600
800
100 0
120 0
140 0
160 0
180 0
200 0
FY18 FY19
3%
27%
42%
22%
22%
18%
19%
19%
ol - -Go \11° ____ _
c.~ ·" --------
■ ■ ■ ■
• • • •
• • • •

F o o t f a l l s a n d O c c u p a n c y R a t e
35
All figures in Lakhs, unless specified
156 173
29% 30%
3%
8%
13%
18%
23%
28%
33%
80
100
120
140
160
180
200
Q1FY19 Q1FY20
533 625
26%28%
3%
8%
13%
18%
23%
28%
33%
-
100
200
300
400
500
600
700
FY18 FY19
11%
17%
411
534 537 533625
25%
29%28%
26%
28%
0%
5%
10%
15%
20%
25%
30%
0
100
200
300
400
500
600
700
800
FY15 FY16 FY17 FY18 FY19
Footfalls Occ%
__ .,. ol -----
Go" 'l,:10 _ - - - -c~ "~-----
~ --- ----- I ----------t
- t

A v e r a g e T i c k e t P r i c e [ AT P ]
36
164 170 178193 197
FY15 FY16 FY17 FY18 FY19
All figures in INR, unless specified
199 198
-
20
40
60
80
100
120
140
160
180
200
Q1FY19 Q1FY20
193 197
-
20
40
60
80
100
120
140
160
180
200
FY18 FY19
-0.4%
2%
*W.e.f 1st Jan 2019, GST rate on tickets is reduced from 28%/18% to 18%/12%, thereby affecting the YoY ATP growth.
-_,. 0 so/o - - - - - - - -
c~G"_ ---------------------
t

S p e n d P e r H e a d [ S P H ]
37
55 58 62 6674
FY15 FY16 FY17 FY18 FY19
All figures in INR, unless specified
76 81
-
10
20
30
40
50
60
70
80
90
100
Q1FY19 Q1FY20
66 74
-
10
20
30
40
50
60
70
80
FY18 FY19
6%
11%
-~
t
t

F & B C o n t r i b u t i o n
38
41 44
47 50
55 74.1% 75.0% 76.0% 75.7%74.2%
0.0%
10.0%
20.0%
30.0%
40.0%
50.0%
60.0%
70.0%
80.0%
-
10
20
30
40
50
60
FY15 FY16 FY17 FY18 FY19
SPH Contribution (Rs.)
F & B Contribution (%)
57 61
75.6% 74.9%
0.0 %
10. 0%
20. 0%
30. 0%
40. 0%
50. 0%
60. 0%
70. 0%
80. 0%
-
10
20
30
40
50
60
70
Q1FY19 Q1FY20
50 55
75.7% 74.2%
0.0 %
10. 0%
20. 0%
30. 0%
40. 0%
50. 0%
60. 0%
70. 0%
80. 0%
-
10
20
30
40
50
60
FY18 FY19
5%
9%
All figures in INR, unless specified
SPH Contribution (Rs.) = SPH (Rs.) x F&B Contribution (%)
c~GRS°lo ---------~
------------------------------
•---
t
- t -+-

A d v e r t i s e m e n t R e v e n u e
39
81 91 96
139
176
25 2522
30
34
-
5.0
10.0
15.0
20.0
25.0
30.0
35.0
40.0
FY15 FY16 FY17 FY18 FY19
Advertising Rev (Rs Crs)
Advertising Rev Per Screen (Rs Lakhs)
40 47
8 8
-
1.0
2.0
3.0
4.0
5.0
6.0
7.0
8.0
9.0
-
10
20
30
40
50
60
70
Q1FY19 Q1FY20
18%
139
176
30
34
-
5.0
10.0
15.0
20.0
25.0
30.0
35.0
40.0
-
20
40
60
80
100
120
140
160
180
200
FY18 FY19
27%
IN X
t
t

e
O t h e r O p e r a t i n g I n c o m e P e r S c r e e n
40
21.9 24.6
22.7 23.1 21.3
FY15 FY16 FY17 FY18 FY19
All figures in INR Lakhs, unless specified
4.7 4.8
-
1.0
2.0
3.0
4.0
5.0
6.0
Q1FY19 Q1FY20
23.1 21.3
-
5.0
10.0
15.0
20.0
25.0
FY18 FY19
2%
-8%
t
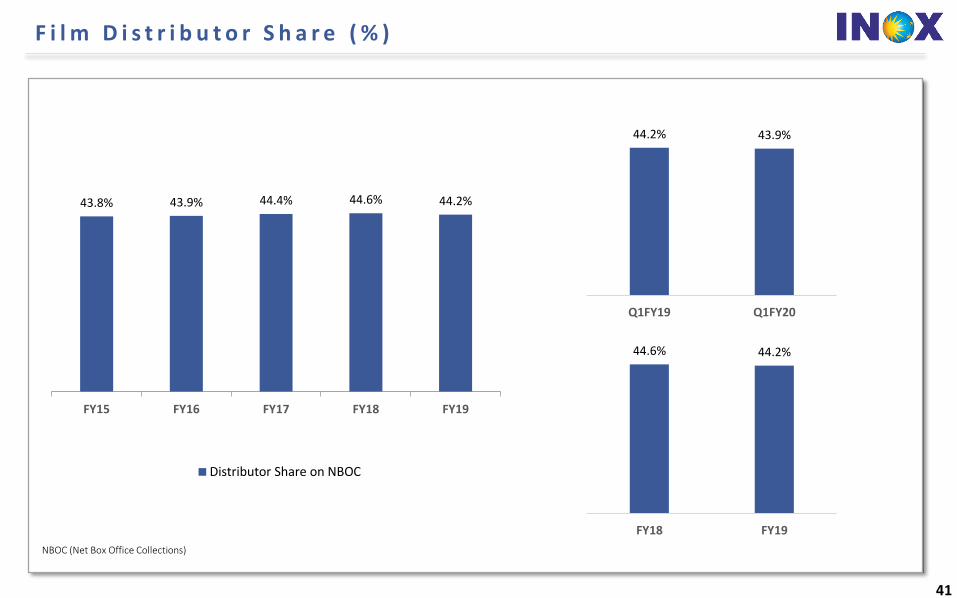
F i l m D i s t r i b u t o r S h a r e ( % )
41
43.8% 43.9% 44.4% 44.6% 44.2%
0.0 %
5.0 %
10. 0%
15. 0%
20. 0%
25. 0%
30. 0%
35. 0%
40. 0%
45. 0%
50. 0%
FY15 FY16 FY17 FY18 FY19
Distributor Share on NBOC
NBOC (Net Box Office Collections)
44.2% 43.9%
0.0 %
5.0 %
10. 0%
15. 0%
20. 0%
25. 0%
30. 0%
35. 0%
40. 0%
45. 0%
50. 0%
Q1FY19 Q1FY20
44.6% 44.2%
0.0 %
5.0 %
10. 0%
15. 0%
20. 0%
25. 0%
30. 0%
35. 0%
40. 0%
45. 0%
50. 0%
FY18 FY19
■

O t h e r O v e r h e a d s P e r O p e r a t i n g S c r e e n
42
20.3 20.1 21.2 22.1 23.5
41.3 44.0 45.6 46.7 50.8
40.8 45.5 42.9 43.1 43.2
43.447.5 52.7 47.5
50.9
145.8157.1 162.4 159.4
168.3
FY15 FY16 FY17 FY18 FY19
Employee BenefitsLease Rental & Hire ChargesCAM, Power & Fuel, R&MOther Overheads
All figures in INR Lakhs, unless specified
22.0 23.5
46.6 50.8
43.1 43.2
47.5 50.9
159.3 168.3
-
20.0
40.0
60.0
80.0
100.0
120.0
140.0
160.0
180.0
200.0
FY18 FY19
5.7 6.4
12.6 12.7
11.6 11.9
12.6 13.0
42.6 44.0
(5.0)
5.0
15.0
25.0
35.0
45.0
55.0
Q1FY19 Q1FY20
3.5%
2.3%
0.5%
11.4%
7.1%
0.2%
8.9%
6.4%
Excludes Ind AS 116
-- - ----- ----
■
■
■
■
----CAGR4% -------------► --------- t
t t t
t t t t

43
Compet i t ive Advantage• R e c o g n i s e d A n d T r u s t e d C o r p o r a t e
G r o u p
• W e l l D i v e r s i f i e d P r e s e n c e A c r o s s I n d i a
• S t r o n g N e w S c r e e n s P i p e l i n e
• S t r o n g B r a n d P a r t n e r s h i p s
• S t r o n g B a l a n c e S h e e t
• S t a t e O f T h e A r t T e c h n o l o g y , U n m a t c h e d
S e r v i c e A n d A m b i e n c e
INOX Nehru Place, Delhi

44
•
•
•
•
Erstwhile INOX
Fluorochemicals Limited
Largest producer of
Chloromethanes,
refrigerants and
Polytetrafluoroethylene in
India.
Fully integrated player in
the wind energy market
State-of-the-art
manufacturing plants near
Ahmedabad (Gujarat), Una
(Himachal Pradesh) and
Barwani (Madhya Pradesh).
Our Madhya Pradesh
facility is one of the largest
in Asia
Ability to provide end-to-end
turnkey solutions for wind
farms
One of the largest
multiplex chains in India
In the business of setting
up, operating and
managing a national
chain of multiplexes
under the brand name
‘INOX’
Present in 67 cities with
143 multiplexes and 595
screens
Largest producer of
cryogenic liquid storage
and transport tanks in
India
Offers comprehensive
solutions in cryogenic
storage, vaporization and
distribution engineering
Has operations in India,
USA, Netherlands and
Brazil
50:50 joint venture with
Air Products Inc., USA
Largest producer of
industrial gases in
India
40 plants spread
throughout the
country
Erstwhile Gujarat
Fluorochemicals
Limited
Holding company of
INOX Wind and INOX
Leisure Ltd.
INOX Wind Limited INOX Leisure Limited Gujarat Fluorochemicals
Limited
INOX Air Products
Private LimitedINOX India
Private Limited
ANNEXURE: RECOGNISED AND TRUSTED CORPORATE GROUP
LISTED COMPANIES
GFLLimited IN X LIVE b'w MOVIE
90 Year track record of consistent business growth USO $3 Billion lnox Group diversified across 7 different businesses
OTHER KEY COMPANIES
Q INOXAIR ✓,:.. ~ PRODUCTS~ INOX:CVA
10,000+ employees at 150+ business units across India Distribution network spread over 50+ countries

W e l l D i v e r s i f i e d P r e s e n c e A c r o s s I n d i a
45
East; 23; 16%
West, 57, 40%
North, 34, 24%
South, 29, 20%East; 10; 15%
West, 23, 34%
North, 20, 30%
South, 14, 21%
East; 87; 15%
West, 247, 41%North, 123, 21%
South, 138, 23%
East, 21,702 , 15%
West, 57,819 , 41%North; 28,783 ; 21%
South; 31,493 ; 23%
Well DiversifiedDistribution of
Multiplexesacross India
Access toWide Variety of
Regional Content
Lower Dependencyon Hindi and English
Content
Includes 8 management properties with 29 screens and 7,370 seats
143 Properties 67 Citiess
595 Screens 139,797 Seat
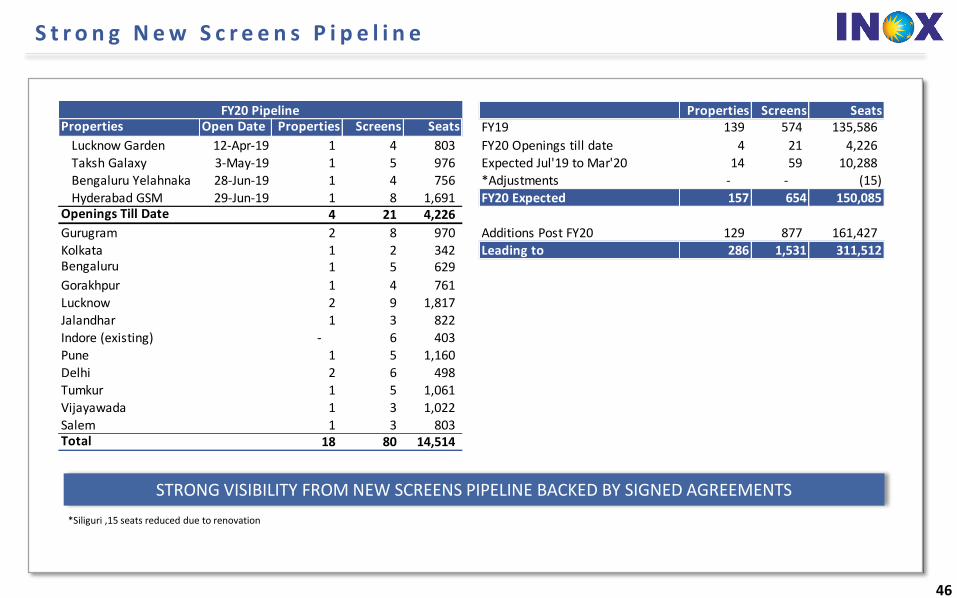
S t r o n g N e w S c r e e n s P i p e l i n e
46
STRONG VISIBILITY FROM NEW SCREENS PIPELINE BACKED BY SIGNED AGREEMENTS
Properties Screens SeatsProperties Open Date Properties Screens Seats FY19 139 574 135,586
Lucknow Garden 12-Apr-19 1 4 803 FY20 Openings till date 4 21 4,226
Taksh Galaxy 3-May-19 1 5 976 Expected Jul'19 to Mar'20 14 59 10,288 Bengaluru Yelahnaka 28-Jun-19 1 4 756 *Adjustments - - (15)
Hyderabad GSM 29-Jun-19 1 8 1,691 FY20 Expected 157 654 150,085 Openings Till Date 4 21 4,226
Gurugram 2 8 970 Additions Post FY20 129 877 161,427 Kolkata 1 2 342 Leading to 286 1,531 311,512 Bengaluru 1 5 629
Gorakhpur 1 4 761
Lucknow 2 9 1,817 Jalandhar 1 3 822
Indore (existing) - 6 403 Pune 1 5 1,160
Delhi 2 6 498 Tumkur 1 5 1,061
Vijayawada 1 3 1,022 Salem 1 3 803 Total 18 80 14,514
FY20 Pipeline
*Siliguri ,15 seats reduced due to renovation
---------

CONSUMER DURABLES GEC
BFSI
17%
OTHERSAUTOMOBILESECOMMERCE &TELECOMM.FMCG
S t r o n g B r a n d P a r t n e r s h i p s
I.~ l'T• J I
P&G
" HAVELLS
IDFC LIMITED
Rojoigaodbo
HONDA
TOYOTA
~
'~ ◄
He a
TATA ~ aaTTeries -·-~ svGAsA ,. ... ~
INOIA Kl BATTERY
£airbnb
STAR * PaY1'm
JJw,cK~ colors
v 1ac0M i!J - ,, HUAWEI
aiPhone
@l xiaomi (;) PhonePe H><b'sPsy-~IOApp
Justdial
h!HN,i
e Lufthansa
IN X
TURKISH f'i'\ AIRLINES ~
~c Ill Emirates •• _..,_
ft R iance 1 ... ... ... . , -. r .• i1 ■ , i1 .. ,I
Khadlm·s 1.11:x:® INNERWEAR
.x. WROGN
~ Tim Tl~IF,S OF INl)IA Kaj~rla
Siyarams·

S t r o n g B a l a n c e S h e e t
48
Potential To Grow Aggressively Without Any
Stress On Balance Sheet
Particulars (INR Crs.) Mar-19 Mar-18
Share Capital 102.6 96.2
Other Equity 893.9 606.1
Interest in Inox Benefit Trust, at cost (32.7) (32.7)
Total Shareholder funds 963.8 669.6
Non-Controlling Interest 0.01 0.01
Total Equity 963.8 669.6
Total Debt 110.0 291.9
Other Non-Current Liabilities 90.7 88.9
Total Sources of Funds 1,164.5 1,050.4
Fixed Assets 986.1 825.7
Other Non-Current Assets 341.3 315.8
Current Assets 137.6 116.5
Cash & Cash Equivalents 13.7 26.9
Less: Current Liabilities 314.3 234.6 Net Current Assets (163.0) (91.1)
Total Assets 1,164.5 1,050.4
Key Balance sheet Ratios Mar-19 Mar-18
Net Debt : Equity 0.10 0.40
Return on Equity (ROE)# 16.3% 18.8%
Return on Capital Employed (ROCE) 20.9% 13.2%
Low Leverage Net D/E:
Treasury Stock in Inox Benefit Trust
Promoters Stake
Strong Balance Sheet
Real Estate on Balance Sheet
INR 350 Crs.
128 INR Crs.As on 31-Jul-19
0.10x
51.9%
ROE (TTM): PAT/Avg. Equity, ROCE (TTM): EBIT/Avg. Capital Employed (Capital Employed = Equity + Total Debt)#Includes Tax write back pertaining to earlier years of Rs.53.7 crs.(FY18) and Rs.4.6crs (FY19)
--

S t a t e o f t h e A r t Te c h n o l o g y, U n m a t c h e d S e r v i c e & A m b i e n c e
49
Focus On Technology
ILL is the first multiplex chain to implement SAP HANA with all integrated functions
Focus on ensuring transparency with regulatory agencies and distributors through daily performance analysis reports
The Network Operations Centre (NOC) in Mumbai enables continuous monitoring, control and reporting of information on all digital systems across the
country. Advertisers can track their advertisement screening at various multiplexes on real-time basis leading to improved transparency and higher advertising
revenues for ILL
ILL stands for the best in LUXURY, SERVICE and TECHNOLOGY and keeping this core in mind; INOX has tied up with IMAX for the best in cinema viewing
experience for 10 screens.
ILL has pioneered Laser projection across the country including India’s first Laserplex.
ILL has tied up with Samsung for its ONYX Cinema LED screen technology.
ILL has tied up with MX4D for providing exciting in-cinema 4D effects to its Patrons.
ILL has tied up with ScreenX to provide a 270 degree viewing experience on 3 walls of the theatre enabled through multi-projection system.
Focus on high quality video and audio
ILL operates high quality DCI Compliant 2K & 4K Digital Projection Systems across all the screens in India
High-definition picture quality, strong 3D capabilities and high frame rate (HFR) (can go up to 60 fps)
ILL has been one of the early adopters of Dolby ATMOS sound technology. Excellent acoustic systems and distortion free sound
Focus on service and ambience:
Focus on providing world class ambience.
ILL with its in-app F&B ordering and Qbuster service, is able to considerably reduce its queue size and transaction time
Emphasis on safety, comfort and convenience
Focus On Strong Technology, Unmatched Service And Ambience

Content pipeline Aug 2019
50
Batla House
Release Date:15th August 2019Cast: John Abraham, Mrunal ThakurDirector: Nikhil AdvaniBanner: T-Series Super Cassettes Industries Ltd., Emmay Entertainment Pvt. Ltd, JA Entertainment Pvt. Ltd.
Hobbs & Shaw
Release Date: 2nd August 2019Cast: DwayneJohnson, Idris Elba, Eiza GonzálezDirector: David LeitchBanner: Universal Pictures
Made in China
Release Date:30th August 2019Cast: RajKummar Rao, Mouni RoyDirector: MikhilMusaleBanner: Maddock Films
Mission Mangal
Release Date:15th August 2019Cast: Akshay Kumar, Vidya Balan, TaapseePannuDirector: Jagan ShaktiBanner: Cape of Good Films, Fox Star Studios
Saaho
Release Date:30th August 2019Cast: Prabhas, Shraddha KapoorDirector: SujeethBanner: UV Creations, T-Series, Dharma Productions
Jabariya jodi
Release Date:9th August 2019Cast: SidharthMalhotra, ParineetiChopraDirector: PrashantSinghBanner: BalajiTelefilms, Karma Media
IN X
Hp1ss _.'HAW
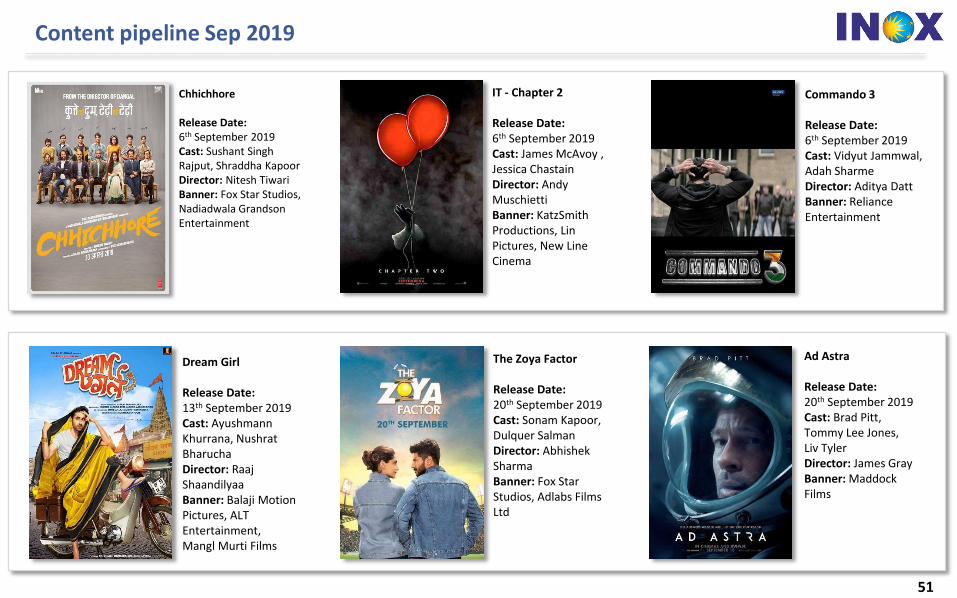
Content pipeline Sep 2019
51
Commando 3
Release Date: 6th September 2019Cast: Vidyut Jammwal, Adah SharmeDirector: Aditya DattBanner: RelianceEntertainment
IT - Chapter 2
Release Date: 6th September 2019Cast: James McAvoy , Jessica Chastain Director: Andy MuschiettiBanner: KatzSmithProductions, Lin Pictures, New Line Cinema
Ad Astra
Release Date:20th September 2019Cast: Brad Pitt, Tommy Lee Jones, Liv TylerDirector: James GrayBanner: Maddock Films
Dream Girl
Release Date:13th September 2019Cast: AyushmannKhurrana, NushratBharuchaDirector: RaajShaandilyaaBanner: Balaji Motion Pictures, ALT Entertainment,Mangl Murti Films
The Zoya Factor
Release Date:20th September 2019Cast: Sonam Kapoor, Dulquer SalmanDirector: AbhishekSharmaBanner: Fox Star Studios, Adlabs Films Ltd
Chhichhore
Release Date: 6th September 2019Cast: Sushant Singh Rajput, Shraddha KapoorDirector: Nitesh TiwariBanner: Fox Star Studios, Nadiadwala GrandsonEntertainment
IN

Content pipeline Oct 2019
52
JokerRelease Date:4th October 2019Cast: Robert De Niro, Joaquin PhoenixDirector: Todd PhillipsBanner: BRON Studios, Creative Wealth Media Finance, DC Comics
Marjaavaan
Release Date: 2nd October 2019Cast: Sidharth Malhotra, Riteish Deshmukh, Tara Sutaria, Rakul Preet Singh, Nushrat BharuchaDirector: Milap ZaveriBanner: T-Series Super Cassettes Industries Ltd., Emmay Entertainment Pvt. Ltd.
War
Release Date: 2nd October 2019Cast: Hrithik Roshan, Tiger Shroff, VaniKapoorDirector: SiddharthAnandBanner: Yash Raj Films
Housefull 4
Release Date:25th October 2019Cast: Akshay Kumar, Riteish Deshmukh, Abhishek BachchanDirector: Farhad SamjiBanner: NadiadwalaGrandson Entertainment
The Sky is Pink
Release Date:11th October 2019Cast: Priyanka Chopra Jonas, Farhan AkhtarDirector: Shonali BoseBanner: RSVP, Roy Kapur Films, Ivanhoe Pictures
Gemini Man
Release Date:11th October 2019Cast: Will Smith, Mary Elizabeth Winstead, Clive OwenDirector: Ang LeeBanner: Fosun Group Forever Pictures, Jerry Bruckheimer Films
IN X

Content pipeline Nov 2019
53
BHOOT: Part One –The Haunted Ship
Release Date:15th November 2019Cast: Vicky Kaushal, Bhumi PednekarDirector: Bhanu PratapSinghBanner: Dharma Productions
Pagalpanti
Release Date: 8th November 2019Cast: John Abraham, Ileana D'CruzDirector: Anees BazmeeBanner: Panorama Studios, T-Series Super Cassettes Industries Ltd
Terminator: Dark Fate
Release Date: 1st November 2019Cast: Mackenzie Davis, Arnold Schwarzenegger, Linda HamiltonDirector: Tim MillerBanner: Paramount Pictures, Twentieth Century Fox, SkydanceMedia
Frozen 2
Release Date:29th November 2019Cast: Kristen Bell, Evan Rachel Wood, Jonathan GroffDirector: Chris Buck, Jennifer LeeBanner: Walt Disney Animation Studios, Walt Disney Pictures
Bala
Release Date:22nd November 2019Cast: AyushmannKhurrana, BhumiPednekarDirector: Amar KaushikBanner: Jio Studios,Maddock Films
Dil Bechara
Release Date:29th November 2019Cast: Sushant Singh Rajput, Sanjana SanghiDirector: MukeshChhabraBanner: Fox Star Studios
---DINESHVIJAN'S------i
AIIISHMANNKIIURRAMA , BHUMI PEDNEKAR , !AMI GAUTAM SAURABH SHUKLA • JAVED IAFIREY • SIEMA PAIIWA
lllfm11AMARKAUSHIK
IN X
·' --"? FY7F.:" N ' • I
NOVEMDER 201<> I I N .Nl,\ l \11 , III N~: T::,~~ ANO I IIU(,U
I

54
Annexure
INOX Metro, Mumbai
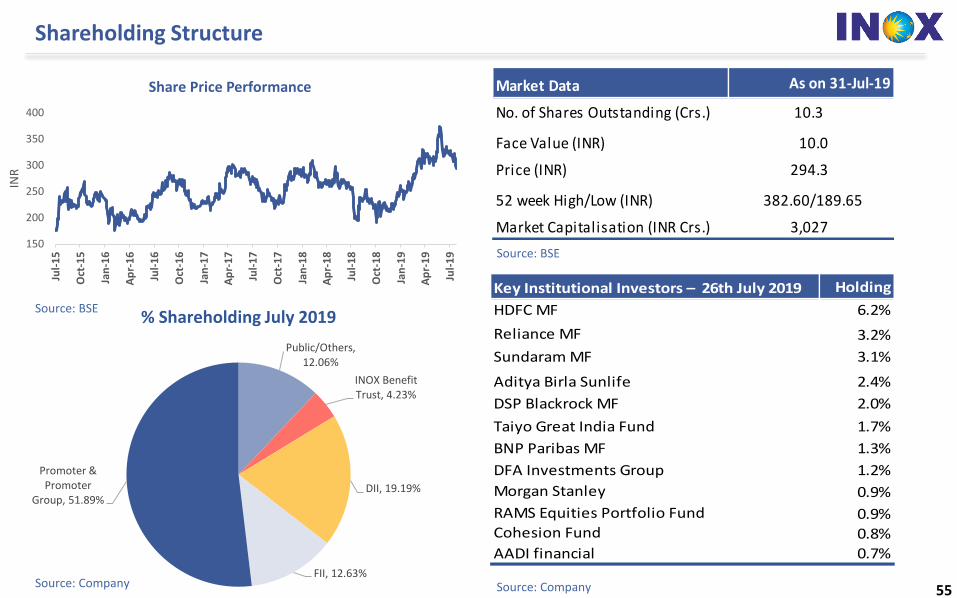
Shareholding Structure
55
Source: BSE
Source: Company Source: Company
Source: BSE
Market Data As on 31-Jul-19
No. of Shares Outstanding (Crs.) 10.3
Face Value (INR) 10.0
Price (INR) 294.3
52 week High/Low (INR) 382.60/189.65
Market Capitalisation (INR Crs.) 3,027
Key Institutional Investors – 26th July 2019
%
Holding
HDFC MF 6.2%
Reliance MF 3.2%
Sundaram MF 3.1%
Aditya Birla Sunlife 2.4%
DSP Blackrock MF 2.0%
Taiyo Great India Fund 1.7%
BNP Paribas MF 1.3%
DFA Investments Group 1.2%
Morgan Stanley 0.9%
RAMS Equities Portfolio Fund 0.9%Cohesion Fund 0.8%
AADI financial 0.7%
150
200
250
300
350
400
Jul-
15
Oct
-15
Jan
-16
Ap
r-1
6
Jul-
16
Oct
-16
Jan
-17
Ap
r-1
7
Jul-
17
Oct
-17
Jan
-18
Ap
r-1
8
Jul-
18
Oct
-18
Jan
-19
Ap
r-1
9
Jul-
19
INR
Share Price Performance
Public/Others, 12.06%
INOX Benefit Trust, 4.23%
DII, 19.19%
FII, 12.63%
Promoter & Promoter
Group, 51.89%
% Shareholding July 2019
r r r r r r r
-
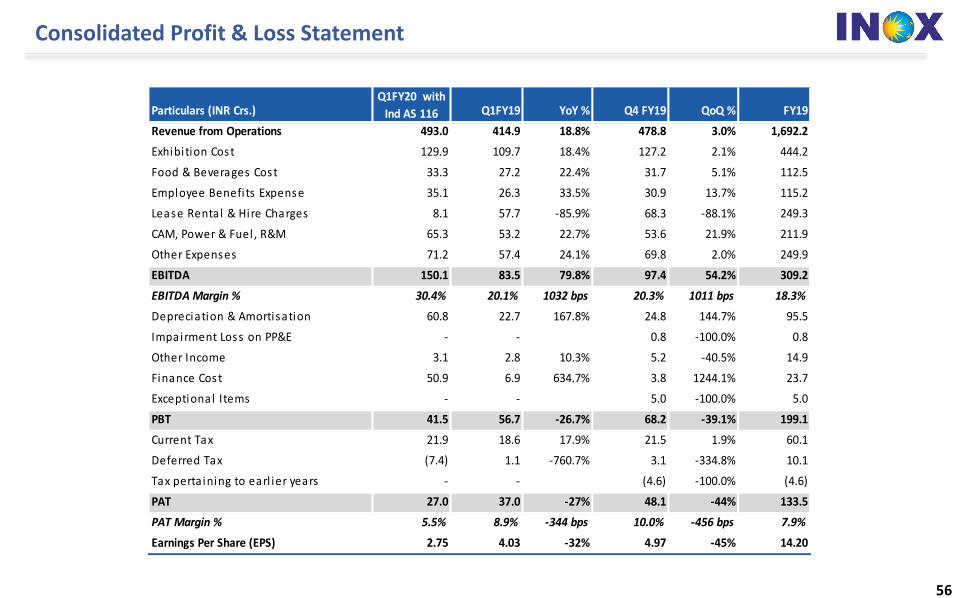
Consolidated Profit & Loss Statement
56
Particulars (INR Crs.)Q1FY20 with
Ind AS 116 Q1FY19 YoY % Q4 FY19 QoQ % FY19
Revenue from Operations 493.0 414.9 18.8% 478.8 3.0% 1,692.2
Exhibi tion Cost 129.9 109.7 18.4% 127.2 2.1% 444.2
Food & Beverages Cost 33.3 27.2 22.4% 31.7 5.1% 112.5
Employee Benefi ts Expense 35.1 26.3 33.5% 30.9 13.7% 115.2
Lease Rental & Hire Charges 8.1 57.7 -85.9% 68.3 -88.1% 249.3
CAM, Power & Fuel , R&M 65.3 53.2 22.7% 53.6 21.9% 211.9
Other Expenses 71.2 57.4 24.1% 69.8 2.0% 249.9
EBITDA 150.1 83.5 79.8% 97.4 54.2% 309.2
EBITDA Margin % 30.4% 20.1% 1032 bps 20.3% 1011 bps 18.3%
Depreciation & Amortisation 60.8 22.7 167.8% 24.8 144.7% 95.5
Impairment Loss on PP&E - - 0.8 -100.0% 0.8
Other Income 3.1 2.8 10.3% 5.2 -40.5% 14.9
Finance Cost 50.9 6.9 634.7% 3.8 1244.1% 23.7
Exceptional Items - - 5.0 -100.0% 5.0
PBT 41.5 56.7 -26.7% 68.2 -39.1% 199.1
Current Tax 21.9 18.6 17.9% 21.5 1.9% 60.1
Deferred Tax (7.4) 1.1 -760.7% 3.1 -334.8% 10.1
Tax perta ining to earl ier years - - (4.6) -100.0% (4.6)
PAT 27.0 37.0 -27% 48.1 -44% 133.5
PAT Margin % 5.5% 8.9% -344 bps 10.0% -456 bps 7.9%
Earnings Per Share (EPS) 2.75 4.03 -32% 4.97 -45% 14.20
------
------------
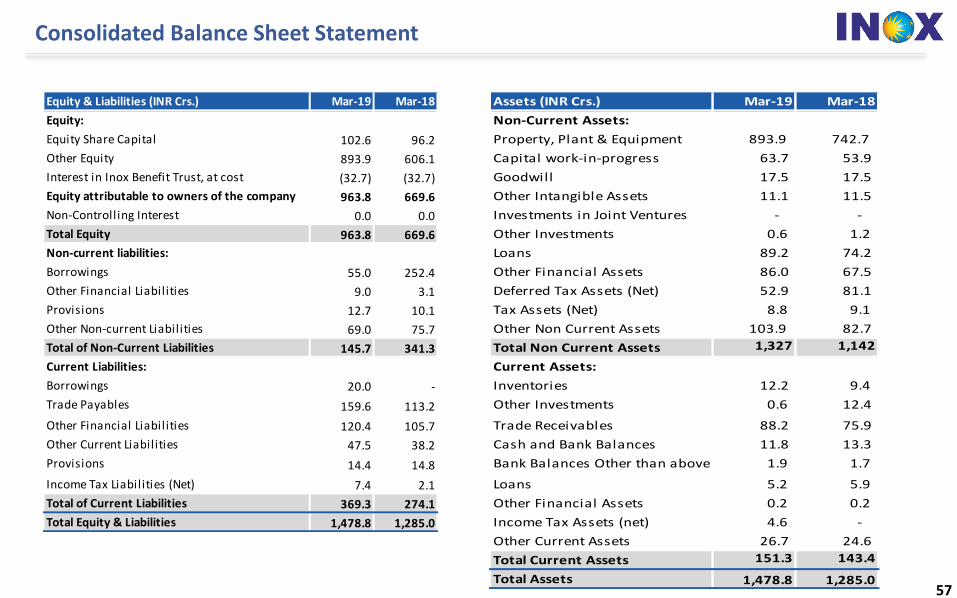
Consolidated Balance Sheet Statement
57
Equity & Liabilities (INR Crs.) Mar-19 Mar-18
Equity:
Equity Share Capital 102.6 96.2
Other Equity 893.9 606.1
Interest in Inox Benefit Trust, at cost (32.7) (32.7)
Equity attributable to owners of the company 963.8 669.6
Non-Controlling Interest 0.0 0.0
Total Equity 963.8 669.6
Non-current liabilities:
Borrowings 55.0 252.4
Other Financial Liabilities 9.0 3.1
Provisions 12.7 10.1
Other Non-current Liabilities 69.0 75.7
Total of Non-Current Liabilities 145.7 341.3
Current Liabilities:
Borrowings 20.0 -
Trade Payables 159.6 113.2
Other Financial Liabilities 120.4 105.7
Other Current Liabilities 47.5 38.2
Provisions 14.4 14.8
Income Tax Liabilities (Net) 7.4 2.1
Total of Current Liabilities 369.3 274.1
Total Equity & Liabilities 1,478.8 1,285.0
Assets (INR Crs.) Mar-19 Mar-18
Non-Current Assets:
Property, Plant & Equipment 893.9 742.7
Capital work-in-progress 63.7 53.9
Goodwill 17.5 17.5
Other Intangible Assets 11.1 11.5
Investments in Joint Ventures - -
Other Investments 0.6 1.2
Loans 89.2 74.2
Other Financial Assets 86.0 67.5
Deferred Tax Assets (Net) 52.9 81.1
Tax Assets (Net) 8.8 9.1
Other Non Current Assets 103.9 82.7
Total Non Current Assets 1,327 1,142
Current Assets:
Inventories 12.2 9.4
Other Investments 0.6 12.4
Trade Receivables 88.2 75.9
Cash and Bank Balances 11.8 13.3
Bank Balances Other than above 1.9 1.7
Loans 5.2 5.9
Other Financial Assets 0.2 0.2
Income Tax Assets (net) 4.6 -
Other Current Assets 26.7 24.6
Total Current Assets 151.3 143.4
Total Assets 1,478.8 1,285.0
-- ------ --
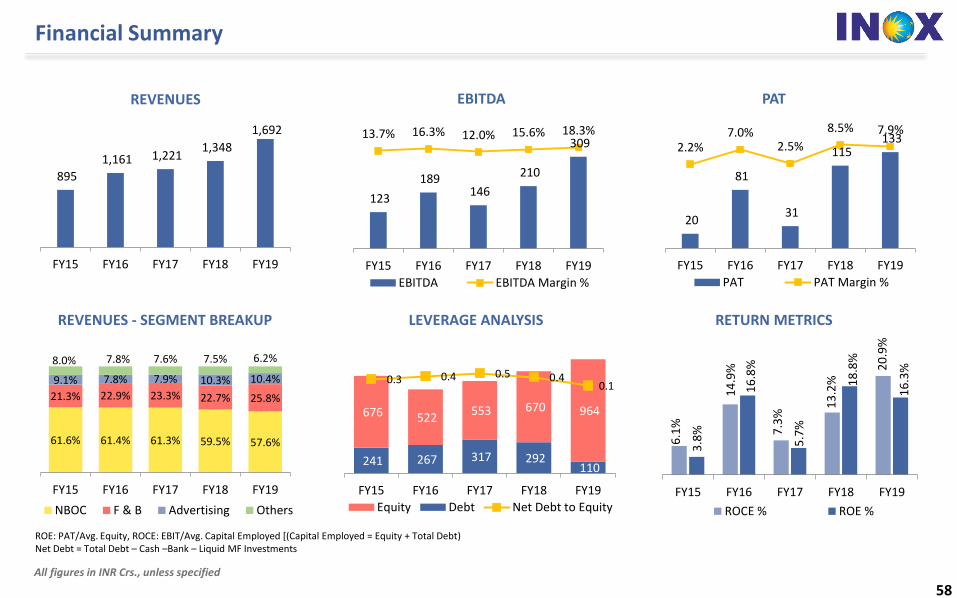
Financial Summary
58
895
1,161 1,221 1,348
1,692
FY15 FY16 FY17 FY18 FY19
123
189 146
210
309 13.7% 16.3% 12.0% 15.6% 18.3%
FY15 FY16 FY17 FY18 FY19
EBITDA EBITDA Margin %
20
81
31
115 133
2.2%7.0%
2.5%
8.5% 7.9%
-25.0%
-20.0%
-15.0%
-10.0%
-5.0%
0.0 %
5.0 %
10. 0%
-
20
40
60
80
100
120
140
FY15 FY16 FY17 FY18 FY19
PAT PAT Margin %
241 267 317 292 110
676 522 553 670 964
0.3 0.4 0.5 0.4 0.1
FY15 FY16 FY17 FY18 FY19
Equity Debt Net Debt to Equity
61.6% 61.4% 61.3% 59.5% 57.6%
21.3% 22.9% 23.3% 22.7% 25.8%
9.1% 7.8% 7.9% 10.3% 10.4%
8.0% 7.8% 7.6% 7.5% 6.2%
FY15 FY16 FY17 FY18 FY19
NBOC F & B Advertising Others
ROE: PAT/Avg. Equity, ROCE: EBIT/Avg. Capital Employed [(Capital Employed = Equity + Total Debt)Net Debt = Total Debt – Cash –Bank – Liquid MF Investments
REVENUES EBITDA PAT
REVENUES - SEGMENT BREAKUP LEVERAGE ANALYSIS RETURN METRICS
All figures in INR Crs., unless specified
6.1
%
14
.9%
7.3
%
13
.2%
20
.9%
3.8
%
16
.8%
5.7
%
18
.8%
16
.3%
0.0 %
5.0 %
10. 0%
15. 0%
20. 0%
25. 0%
FY15 FY16 FY17 FY18 FY19
ROCE % ROE %
IN X
- - - -
■ ■ ■ ■ - - - ■ ■

59
Thank YouBalesh Talapady
AVP – Business Analysis
INOX Leisure Ltd.
Contact+91-22-4062 6927
Email: [email protected]