Learning to read and spell in Albanian, English and Welsh
372
Learning to read and spell in Albanian, English and Welsh: the effect of orthographic transparency Lorenc Hoxhallari This thesis is submitted in total fulfilment of the requirements of the degree of Doctor of Philosophy School of Psychology, University of Wales, Bangor, UK. May, 2006
-
Upload
khangminh22 -
Category
Documents
-
view
3 -
download
0
Transcript of Learning to read and spell in Albanian, English and Welsh

Learning to read and spell in Albanian, English and Welsh: the effect of
orthographic transparency
Lorenc Hoxhallari
This thesis is submitted in total fulfilment of the requirements of the degree of Doctor of
Philosophy
School of Psychology,
University of Wales, Bangor, UK.
May, 2006

iii
Abstract
Effects of orthographic transparency on literacy acquisition were examined by comparing data from children
learning to read in Albanian, Welsh, and English. The Welsh and especially Albanian orthographies are
extremely transparent, whereas the English orthography is notorious for its lack of transparency.
In the pilot study, twenty Year I Albanian children were given a reading test consisting of a 100-word stratified
sample of decreasing written frequency. These children were able to read accurately 80% of the words; reading
latency was a direct effect of word length (R2 =. 89); and errors tended to be mispronunciations rather than real
word replacements, with hardly any null responses. These results were compared with Ellis and Hooper (2001),
where the same design was used with English and Welsh children of the same age, but with one more year of
formal reading instruction. The Albanian children read more words than the English and Welsh children, but
they had longer reading latencies. Like the Welsh children, but unlike the English children, the Albanian
children made more nonword errors. These results suggest that children acquire reading faster the more
transparent the orthography, and that shallow orthographies promote an initial reliance on a phonological
recoding strategy.
The main study examined reading, spelling, phonological and orthographic skills of 6-, 8- and 10-year old
Albanian, English and Welsh children. No cross-language differences were found in reading. In spelling,
however, Albanian children could spell significantly more words correctly than the Welsh children, who in turn
could spell more words than the English children. Furthermore, the youngest Albanian children outperformed
same-age English and Welsh children in the Phoneme Deletion task and Nonword Spelling. English children,
however, were extremely fast and accurate on the Wordchains task, whereas Albanian children were not. These
results suggest that children acquire spelling faster the more transparent the orthography, and that shallow
orthographies promote a fine-grained level of phonological awareness in young children. Deep orthographies
encourage children to rely more on strategies based on word-level orthographic representations.
Finally, regression analyses, revealed that phonological skills predicted early reading ability of Albanian and
Welsh children only. Orthographic skills predicted skilled reading, however, the contribution of these skills
was much stronger for the older English group. In spelling, phonological skills were the only predictor in
Albanian across the three age groups. For the English sample, phonological skills predicted early spelling and
orthographic skills were the best predictors of spelling ability in older children. The Welsh age-groups showed
mixed patterns. These findings, suggest the contribution of phonological and orthographic skills to reading and
spelling development is dependent on orthographic transparency.

iv
Acknowledgments
I would like to begin by thanking my supervisor Prof. Nick Ellis, for his input, advice and support. Without
your help and clear thinking, I would still be very confused about many issues on literacy acquisition. Also, I
would like to thank my former supervisor, Dr. Victor van Daal, who helped me initiate this work.
I would like to thank teachers and parents from `Sotir Gura' school, Korce, Albania, and especially children
who participated in this study, for kindly letting me take up so much of their time, and for the interest they
expressed in my work. Also, I would like to thank the Welsh Dyslexia project for allowing me to use my tasks
in their research and have access to the data collected.
I would like to thank the School of Psychology, UWB, for providing financial support to carry out this research.
Thank you to all the support / technical staff for all your help with my never-ending computer enquiries. Thank
you Guillaume for your continuous encouragement over the last four years; it has been invaluable. Many
thanks to all the people from the buildings in College Road. It has been great to have known you all-drinking
fresh coffee with you has been the highlight of the day on many occasions. During the last 4 years, I have had
the privilege and the opportunity to teach in many modules-it has been great fun and a very good and valid
distraction from my PhD work.
I owe my family and close relatives a great deal, probably more than I am able to express here. A special
thank you goes to: my father and my sister-in-law Mirela for helping with the project arrangements in Albania;
to all the grandparents and parents -in-law for being so encouraging; Petal and Linda who very bravely agreed to
read this work and to correct the spelling, grammar and punctuation errors; and Marilyn, Llinos, Jarrad and
Tamar for their feedback. You have all been a true inspiration.
Alison this is for you: thank you for being such a supporting and patient wife-without you it could have never
happened.

V
Table of Contents
Abstract List of Figures List of Tables References List ofAppendices
Chapter 1: English, Welsh and Albanian orthographies 1.1 Introduction 1.2 The history of the writing systems development
1.2.1 Pictographic writing system 1.2.2 Logographic writing system 1.2.3 Syllabic writing systems 1.2.4 Alphabetic writing systems
1.3 The Albanian language and orthography 1.3.1 Dialects of Albanian Language 1.3.2 History of written Albanian 1.3.3 The sounds and syllable structure of Albanian 1.3.4 GP and PG correspondences in Albanian 1.3.5 Vocabulary 1.3.6 Primary education system in Albania 1.3.7 Teaching methods in Albanian primary schools
1.4 The English language and orthography 1.4.1 GP and PG correspondences in English 1.4.2 Primary education system in England
1.5 The Welsh language and orthography 1.5.1 Vocabulary 1.5.2 Dialects of Welsh 1.5.3 GP and PG correspondences in Welsh 1.5.4 Primary education system in Wales
1.6 Differences and similarities between Albanian, English and Welsh 1.7 Final summary
Chapter 2: Reading and spelling development 2.1 Introduction 2.2 The dual-route model of reading 2.3 Developmental models of learning to read 2.4 Dual-route model of spelling 2.5 Developmental models of spelling 2.6 Cross-linguistic research on literacy development 2.7 Methods of cross-linguistic reading comparison 2.8 Final summary
iii ix
xii 292 315
Chapter 3: The contribution of phonological and orthographic skills to reading and spelling development
3.1 Introduction 3.2 Phonological skills
3.2.1 The development of phonological awareness 3.2.2 Phonological awareness and literacy development 3.2.3 Phonological awareness in different orthographies
3.3 Naming speed 3.4 Orthographic Skills
32 32 34 37 40 42 45 59 65
66 66 66 67 69 71 78 82

vi
3.5 Hypotheses and predictions 90
Chapter 4: Materials and procedure 92 4.1 Introduction 92
4.2 Pilot study on learning to read and spell in Albanian 92 4.2.1 Measurement tools 92 4.2.2 Data collection 100 4.2.3 Reliability analysis 101
4.3 Main study materials: Albanian, English and Welsh 102 4.3.1 Measurement tools 102
4.3.2 Data collection with the Albanian sample 110 4.3.3 Reliability analysis for the Albanian tasks 111 4.3.4 Data collection for the English and Welsh samples 111
Chapter 5: Pilot study In Reading and Spelling Development In Albanian 5.1 Introduction
5.1.2 Balancing for frequency 5.2 Aims and Hypothesis
5.2.1 Hypotheses concerning the Ellis and Hooper study 5.2.2 Hypotheses related to Year 1,2, and 3 Albanian children 5.2.3 Age differences
5.3 Method for comparing with Ellis and Hooper study (2001) 5.3.1 Participants 5.3.2 Materials 5.3.3 Procedure
5.4 Results 5.5 Cross-sectional data on literacy development (Albanian)
5.5.1 Participants 5.5.2 Test Materials and Procedure 5.5.3 Reading, Word Comprehension and Spelling tests 5.5.4 Phonological awareness tasks 5.5.5 Orthographic awareness task 5.5.6 Vocabulary knowledge. 5.5.7 General ability
5.6 Results 5.6.1 Descriptive Statistics. 5.6.2 Serial naming measures
5.7 Analysis for the Year 1,2, and 3 Albanian data 5.7.1 Reading Aloud Accuracy 5.7.2 Reading Aloud Latency 5.7.3 Reading Latencies as a function of word length 5.7.4 Word comprehension 5.7.5 Reading Errors 5.7.6 Spelling Errors 5.7.7 Reading and spelling comparisons
5.8 Regression analyses for Reading and Spelling abilities. 5.8.1 Reading 5.8.2 Spelling
5.9. Discussion 5.9.1 Ellis and Hooper study comparisons 5.9.2 Reading and spelling ability for Albanian Year 1,2 and 3. 5.9.3 Reading and spelling comparisons 5.10. Skills involved in learning to read and spell
5.11 Conclusions
Chapter 6: Reading and Spelling development in Albanian: Main Study 152

Vll
6.1 Introduction H. 1. General hypotheses. H. 2. Reading hypotheses H. 3. Spelling hypothesis H. 4. Predictors of reading ability H. 5. Predictors of spelling ability H. 6. Reading and spelling comparisons 6.2 Method
6.2.1 Participants 6.2.2 Test Materials
6.3 Results 6.3.1 Descriptive statistics. 6.3.2 ANOVAS comparing Age Groups 6.3.3 Test of the Reading Hypotheses 6.3.4 Test of the Spelling Hypotheses 6.3.5 Reading and Spelling predictors 6.3.6 Regression analysis for Reading related tasks for all Albanian children 6.3.6 Factor analysis 6.3.7 Regression analysis for Reading related tasks for Year 1 Albanian children 6.3.8 Regression analysis for Reading related tasks for Year 3 Albanian children 6.3.9 Regression analysis for Reading related tasks for Year 5 Albanian children 6.3.10 Conclusion on Predictors of Reading 6.3.11 Comparison of patterns for the three reading relating variables 6.3.12 Regression analysis for Spelling related tasks for all Albanian children. 6.3.13 Regression analysis for Spelling related tasks for Year I Albanian children. 6.3.14 Regression analysis for Spelling related tasks for Year 3 Albanian children. 6.3.15 Regression analysis for Spelling related tasks for Year 5 Albanian children. 6.3.16 Conclusion on Predictors of Spelling. 6.3.17 Reading and spelling comparisons
6.4. Discussion 6.4.1. Reading 6.4.2 Predictors of reading development 6.4.3 Two reading tests: different predictors. 6.4.4 Conclusions on reading development 6.4.5 Spelling 6.4.6 Predictors of spelling ability 6.4.7 Reading and Spelling comparisons. 6.8.8 Conclusions
Chapter 7: Cross-language comparisons 236 7.1. Introduction 236
H. 7.1. Reading Hypotheses 236 H. 7.2. Spelling Hypotheses 237 H. 7.3. Sub-skills Hypotheses 237
7.2. Participants 238 7.3. Materials 238 7.4. Results 238
7.3.1. Reading hypothesis 242
7.3.2 Spelling hypothesis 245 7.3.3 Sub-skills hypotheses 247 7.3.4 Word Comprehension 251 7.3.5 Second language reading and spelling 252 7.3.6 Reading and Spelling predictors 253
7.5. Discussion 257 7.5.1 Reading and spelling across languages 258 7.5.2 Awareness of the structure of the spoken language 261

viii
7.4.3 RAN tasks 264
7.5.4 Second language reading and spelling 265
7.5.5 Word Comprehension 265
7.5.6 Predicting patterns for OMRT 266
7.5.7 Conclusion 269
Chapter 8: Final Discussion 271
8.1. Introduction 271
8.2. General Discussion 271
8.2.1 Pilot study: Reading rate 272 8.2.2 Pilot study: Reading strategy 272 8.2.3 Pilot study: Word Comprehension 273
8.2.4 Main study: Reading rate 274 8.2.5 Main study: Word Comprehension 275 8.2.6 Main study: Spelling rate 276 8.2.7 Awareness of the structure of the spoken language 277 8.2.8 The contribution of phonological and orthographic skills to literacy development 279
8.3 Current limitations and suggestions for future research 282 8.3.1. Current limitations 282
8.5. Final conclusions 289
ix
List of Tables
Table 1.1. - Dialectical differences between Gheg and Tosk (Source: Lloshi, 1999). Table 1.2. Vowel sounds of the Albanian language. Table 1.3. The classification of consonant sounds of the Albanian language. Table 1.4. The percentage of the literary language phonemes according to their position in words. Table 1.5. The absolute and relative frequency of i-syllable words of Albanian. Table 1.6. Albanian alphabet and word examples. Table 1.7. The educational system in Albania. Table 1.8. Differences and similarities between Albanian, English and Welsh. Table 2.1. Frith (1985) literacy development theory Table 4.1. Word length and the frequency for the Albanian, English and Welsh reading test. Table 4.2. Sessions and number of items for each task Table 4.3. Cronbach's alpha values for newly developed tests. Table 4.4. Session and number of items for each task Table 4.5. Reliability analysis for the main study's Albanian materials. Table 5.1. Frequency of error types for Albanian, Welsh and English children.
Table 5.2. Example of error types.
Table 5.3. Mean and standard deviations for age; and gender distributions for years 1,2, and 3.
Table 5.4. Descriptive statistics for Year 1,2, and 3 Albanian children. Table 5.5. Crosses indicate significant pairwise comparisons. Table 5.6. Means and st. deviation for serial naming tasks.
Table 5.7. Pearson Correlations for serial naming tasks.
Table 5.8. Error types for each year and column percentages in Reading.
Table 5.9. Error types for each year and column percentages in Spelling.
Table 5.10. Correlation matrix for all the variables for Albanian children. Table 5.11. B coefficient values, standard errors of B, beta values, and t-scores of the predicting variables where the dependent variable is Reading using Full Entry regression . Note: *p<. 05. Table 5.12. Summary of Stepwise Regression Analysis for variables predicting Reading ability in Albanian. Table 5.13. B coefficient values, standard errors of B, beta values, and t-scores of the predicting variables where the dependent variable is spelling. Note: *p<. 05, ** p<. 001. Table 5.14. Summary of Stepwise Regression Analysis for variables predicting Spelling ability in Albanian. Table 6.1. Mean and standard deviations for age; and gender distributions for years 1,3, and 5. Table 6.2. Descriptive statistics for all variables used in the analysis of the Albanian data. Table 6.3. ANOVAs and Bonferroni tests for the between year comparisons for all variables. Table 6.4. Reading latencies for Year I as a function of word length and LoglO Frequency. Table 6.5. Reading latencies for Year 3 as a function of word length and LoglO Frequency. Table 6.6. Reading latencies for Year 5 as a function of word length and Log10 Frequency. Table 6.7. R2 values from stepwise regressions on reading latencies as a function of Log 10 frequency and Word length. Note: ** p<. 001. Table 6.8. Classification of the reading errors made by Year 1,3, and 5 Albanian children. Table 6.9. Classification of the spelling errors made by Year 1,3, and 5 Albanian children. Table 6.10. Correlation matrix for all the variables for all the Albanian children (n=180). Table 6.11. Correlation matrix for all the variables for Year 1 Albanian children (n=60). Table 6.12. Correlation matrix for all the variables for Year 3 Albanian children (n=60). Table 6.13. Correlation matrix for all the variables for Year 5 Albanian children (n=60). Table 6.14. Summary of Stepwise Regression Analysis for variables predicting reading ability in Albanian using Reading 100 as the dependent variable. Table 6.15. Summary of Full Entry Regression Analysis for variables predicting reading ability in Albanian using Reading 100 as the dependent variable [R2=. 52, F(9,170)=20.31**]. Table 6.16. Summary of Stepwise Regression Analysis for variables predicting reading ability in Albanian using reading Latencies as the dependent variable.
12 13 15 15 19 21 30 44 95 101 102 110 111
123
124
125
128
129
130
130
134
135
137
138
138
139
139 156 161 163 167 168 168
168 169 174 179 179 180 180
181
182
183
Table 6.17. Summary of Full Entry Regression Analysis for variables predicting reading ability in Albanian using reading Latencies as the dependent variable [R2= . 71, F(9,170)=46.24**]. 183
Table 6.18. Summary of Stepwise Regression Analysis for variables predicting reading ability in Albanian using the OMRT as the dependent variable. 184 Table 6.19. Summary of Full Entry Regression Analysis for variables predicting reading ability in
Albanian using the OMRT as the dependent variable [R2=. 75, F(9,156)=52.93]. 184 Table 6.20. PCA using Varimax rotaion for the Albanian variables. Note: Coefficients smaller than . 300 are not presented. 185
Table 6.21. Regression analysis for Latency 100, controlling for Generic Speed. 186
Table 6.22. Regression analysis for OMRT, controlling for Generic Speed. 187 Table 6.23. Summary of Stepwise Regression Analysis for variables predicting reading ability in
Year 1 Albanian children using Reading 100 as the dependent variable. 188 Table 6.24. Summary of Full Entry Regression Analysis for variables predicting reading ability in
Year 1 Albanian children using Reading 100 as the dependent variable 188 Table 6.25. Summary of Stepwise Regression Analysis for variables predicting reading ability in Year I Albanian children using Reading Latency as the dependent variable. 189
Table 6.26. Summary of Full Entry Regression Analysis for variables predicting reading ability in Year 1 Albanian children using Reading Latency as the dependent variable[ 190 Table 6.27. Summary of Stepwise Regression Analysis for variables predicting reading ability in
Year 1 Albanian children using OMRT as the dependent variable. 190 Table 6.28. Summary of Full Entry Regression Analysis for variables predicting reading ability in Year 1 Albanian children using OMRT as the dependent variable [R2=. 71, F(9,42)=11.59**]. 191 Table 6.29. Summary of Stepwise Regression Analysis for variables predicting reading ability in Year 3 Albanian children using Reading 100 as the dependent variable. 192 Table 6.30. Summary of Full Entry Regression Analysis for variables predicting reading ability in
Year 3 Albanian children using Reading 100 as the dependent variable [R2=. 54, F(9,50)=6.51**]. 192 Table 6.31. Summary of Stepwise Regression Analysis for variables predicting reading ability in Year 3 Albanian children using Reading Latency as the dependent variable. 193 Table 6.32. Summary of Full Entry Regression Analysis for variables predicting reading ability in Year 3 Albanian children using Reading Latency as the dependent variable [R2=. 57, F(9,50)=7.35**]. 193 Table 6.33. Summary of Stepwise Regression Analysis for variables predicting reading ability in
Year 3 Albanian children using OMRT as the dependent variable. 194
Table 6.34. Summary of Full Entry Regression Analysis for variables predicting reading ability in Year 3 Albanian children using OMRT as the dependent variable [R2=. 65, F(9,49)=10.22**). 194 Table 6.35. Summary of Stepwise Regression Analysis for variables predicting reading ability in Year 5 Albanian children using Reading 100 as the dependent variable. 195 Table 6.36. Summary of Full Entry Regression Analysis for variables predicting reading ability in
Year 5 Albanian children using Reading 100 as the dependent variable [R2=. 59, F(9,50)=8.09**]. 195 Table 6.37. Summary of Stepwise Regression Analysis for variables predicting reading ability in Year 5 Albanian children using Reading Latency as the dependent variable. 196 Table 6.38. Summary of Full Entry Regression Analysis for variables predicting reading ability in Year 5 Albanian children using Reading Latency as the dependent variable [R2=. 71, F(9,50)=13.84**]. 196 Table 6.39. Summary of Stepwise Regression Analysis for variables predicting reading ability in Year 5 Albanian children using OMRT as the dependent variable. 197 Table 6.40. Summary of Full Entry Regression Analysis for variables predicting reading ability in Year 5 Albanian children using OMRT as the dependent variable [R2=. 71, F(9,45)=l 1.93**). 197
Table 6.41. Summary of significant predictors for reading and spelling variables for Albanian
children. Note: * p=. 05. 201 Table 6.42. Summary of Stepwise Regression Analysis for variables predicting spelling ability in Albanian using Spelling 100 as the dependent variable. 202
Table 6.43. Summary of Full Entry Regression Analysis for variables predicting spelling ability in Albanian using Spelling 100 as the dependent variable [R2= . 67,. F(9,170)=37.96**]. 203 Table 6.44. Summary of Stepwise Regression Analysis for variables predicting spelling ability in Albanian using the SPELLING 50 as the dependent variable. 203
Table 6.45. Summary of Full Entry Regression Analysis for variables predicting spelling ability in Albanian using the SPELLING 50 as the dependent variable [R2=. 61, F(9,156)=26.85**]. 204
Table 6.46. Summary of Stepwise Regression Analysis for variables predicting spelling ability in Year I Albanian children using Spelling 100 as the dependent variable.
205
Table 6.47. Summary of Full Entry Regression Analysis for variables predicting spelling ability in
Year I Albanian children using Spelling 100 as the dependent variable [R2=. 69, F(9,50)=12.50**]. 205

xi
Table 6.48. Summary of Stepwise Regression Analysis for variables predicting spelling ability in Year 1 Albanian children using SPELLING 50 as the dependent variable. 205 Table 6.49. Summary of Full Entry Regression Analysis for variables predicting spelling ability in Year 1 Albanian children using SPELLING 50 as the dependent variable [R2=. 64, F(9,42)=8.44**]. 206 Table 6.50. Summary of Stepwise Regression Analysis for variables predicting spelling ability in Year 3 Albanian children using Spelling 100 as the dependent variable. 207 Table 6.51. Summary of Full Entry Regression Analysis for variables predicting spelling ability in Year 3 Albanian children using Spelling 100 as the dependent variable [R2=. 54, F(9,50)=6.44**]. 207 Table 6.52. Summary of Stepwise Regression Analysis for variables predicting spelling ability in Year 3 Albanian children using SPELLING 50 as the dependent variable. 207 Table 6.53. Summary of Full Entry Regression Analysis for variables predicting spelling ability in Year 3 Albanian children using SPELLING 50 as the dependent variable [R2=. 44, F(9,49)=4.30**]. 208 Table 6.54. Summary of Stepwise Regression Analysis for variables predicting spelling ability in Year 5 Albanian children using Spelling 100 as the dependent variable. 209 Table 6.55. Summary of Full Entry Regression Analysis for variables predicting spelling ability in Year 5 Albanian children using Spelling 100 as the dependent variable [R2=. 84, F(9,50)=28.44**]. 209 Table 6.56. Summary of Stepwise Regression Analysis for variables predicting spelling ability in Year 5 Albanian children using SPELLING 50 as the dependent variable. 210 Table 6.57. Summary of Full Entry Regression Analysis for variables predicting spelling ability in Year 5 Albanian children using SPELLING 50 as the dependent variable [R2=. 78, F(9,45)=18.13**]. 210 Table 6.58. Correlation values between Reading and Spelling scores for the 100-word tests. Note: ** P<. 001. 214 Table 7.1. Mean age for each age-group and St. deviation across languages. 238 Table 7.2. Adjusted means and st. deviations of the literacy related variables for each age-group across languages (controlling for Generic Speed and CPM). 241 Table 7.3. Means and St. Deviations of OMRT Errors for each language and Age-group. Note: a, b, For comparisons within each year group, means with different letters were statistically significantly different. 243 Table 7.4. Predicting patterns of OMRT and Spelling 50 for each language and age-group. 257
X11
List of figures
Figure 2.1. Syllable structure (Source: Seymour, Duncan & Bolik, 1997). 33 Figure 2.2. A simple version of the dual-route model of reading. 35 Figure 4.1. Distribution of the Albanian test words depending on length and log 10 frequency. 96
Figure 5.1. Reading latencies for correctly read words in Albanian, English and Welsh. 120
Figure 5.2. Latency as a function of word length for words correctly read aloud. 121
Figure 5.3. Reading and Word comprehension scores for English, Welsh and Albanian. 122
Figure 5.4. Reading latency for the test items correctly read aloud in Year 1,2, and 3. 131
Figure 5.5. Latency as a function of word length for words correctly read aloud in Year 1.2 and 3. 132 Figure 5.6. Reading and word comprehension mean scores for Year 1,2, and 3. 133
Figure 5.7. Frequencies for each error type committed by each group. 134
Figure 5.8. The number of errors made in reading and spelling for each error type. 135 Figure 6.1. Frequency effect on reading latencies for each Year. 165 Figure 6.2. Reading latencies as a function of word length for each Year. 166 Figure 6.3. Mean number of words read per second and Standard Deviations (SDs) for each Year in the OMRT. 171 Figure 6.4. Mean number of errors made by each year group in the OMRT. 171 Figure 6.5. Means and Standard Errors of the Mean (SEM) for reading rate and nonword reading within each Year. 172 Figure 6.6. Means and SEM for Spelling 50 and NWS. 175 Figure 6.7. Boxplots to show the distributions of scores for the 100-word reading and spelling tests. (The middle line indicates the median and the higher and lower hinges represent the extreme scores) 213 Figure 6.8. Reading and spelling scores for the 100-word tests. 214 Figure 6.9. Means and S. E. Mean for Reading 100 and Spellingl OO for each year group. 215 Figure 6.10. Error types and frequencies made during the reading and spelling tests for each year group. 217 Figure 7.1. Means and St. Deviation of the CPM for the three year groups in Albanian, English and Welsh. 239 Figure 7.2. Means and St. Deviation of the Generic Speed for the three year groups in Albanian, English and Welsh. 240 Figure 7.3. OMRT means and SEM for each age-group across languages. 243 Figure 7.4. NWR means and SEM for each age-group across languages. 244 Figure 7.5. Spelling 50 means and SEM for each age-group across languages. 245 Figure 7.6. NWS means and SEM for each age-group across languages. 247 Figure 7.7. Phoneme Deletion means and SEM for each age-group across languages. 248 Figure 7.8. RAN Alphanumeric means and SEM for each age-group across languages. 249 Figure 7.9. RAN Objects and Colours means and SEM for each age-group across languages. 250 Figure 7.10. Wordchains means and SEM for each age-group across languages. 251 Figure 7.11. Word comprehension means and SEM for each age-group across languages. 252 Figure 7.12. Line graph of correlation coefficients for OMRT. 254 Figure 7.13. Line graph of correlation coefficients for Spelling 50. 254

Chapter 1
Chapter 1: English, Welsh and Albanian
orthographies
1.1 Introduction
1
In today's modern society, being able to read and write means that one is
better equipped to achieve personal, cultural and professional success. Reading and
writing skills (together with arithmetic) are probably the most important skills that
children acquire in the first years of formal education and the development of these
skills has raised much interest among researchers. Indeed, the acquiring of such skills
is associated with many cognitive and biological changes of higher mental and neural
processes.
In order to read and understand written text, one must be able to recognise the
characters and letters, the individual meaning of words and integrate them into
meaningful sentences. According to Gough & Tunmer (1986), reading skills can be
described as the product of decoding and linguistic comprehension skills. However,
some people fail to learn to read and write not because of a lack 'of opportunities but
because of some kind of difficulty that considerably slows down and even prevents
the learning process. Furthermore, speed of learning to read and write and strategies
involved in these processes differ across languages. This thesis examines the effects
of orthographic transparency on literacy acquisition were examined by comparing
data from children learning to read in Albanian, Welsh, and English. The Welsh and
especially Albanian orthographies are extremely regular, whereas the English
orthography is not. These differences are discussed in detail in the following sections.

Chapter 1 2
Before such differences are discussed a description of the history of the development
of writing systems is presented.
1.2 The history of the writing systems development
A writing system is a set of visible or tactile signs that represent units of
language in a systematic way (Coulman, 1996). Several writing systems developed
independently at different periods in different parts of the world (Crystal, 1987). The
earliest and most primitive written records discovered are pictographic. Pictographs
developed into ideographic, logographic, syllabic, and finally into alphabetic writing
systems. Pictographic and ideographic systems are regarded as forerunners of
alphabetic systems. The earliest written signs represent the form of objects and are
usually recorded on natural materials.
1.2 1 Pictographic writing system
Pictographs were used to record language by the means of simple pictures.
Pictures of familiar entities, for example that of animals, were easily identified. Thus,
pictures represented spoken words. However, pictographs that were used to represent
complex or abstract ideas, especially when out of context, proved difficult to
understand. In addition, the reader had to remember a great number of symbols.
1.2.2 Logographic writing system
The writing system used by the Sumerians, who lived between the Euphrates
and Tiger'rivers circa 3500 B. C., consisted of a series of simplified pictures-
otherwise known as Togographs-that were presented on clay tablets. One word or

Chapter 1
idea was noted down by one logograph. In addition to information about entities, the
Sumerian system was able to represent abstract ideas: it did this through ideographs.
Hieroglyphs on the other hand, initially used by ancient Egyptians, contain
3
three different types of writing symbols: (a) ideograms (these represent whole words)
(b) phonograms (these represent a few consonants), and (c) determinative symbols
(these have no phonetic value and tell the reader what kind of meaning the word has).
Thus pictographic writing systems developed into logographic systems; in
logographic systems each symbol represents an individual word. This development is
also known as logographic writing, where one symbol represents a single word.
Logographic and ideographic writing systems are limited in their expressive
range (languages have thousands of words; moreover, the grammatical structure of all
languages is sophisticated), and many pictures can be ambiguous. Therefore, a large
number of symbols are needed to represent the words, ideas and grammatical
structure of the language.
Although logographic writing dates back many centuries, it is still used in
some languages (e. g. modem Chinese and Japanese Kanji). In Chinese, each
logograph represents one word; these words tend to be momsyllabic.
1.2.3 Syllabic writing systems
The logographic writing systems developed into systems that had fewer
symbols and that incorporated phonology into graphemic characters: these new
systems were syllabic writing systems. In these, the symbols represent sounds of the
language at the syllabic level; they do not rely on pictures of real objects (Adams,
1990). Although syllabic logographs do not employ pictures of entities, the number
of symbols they use is significantly smaller than the number in logographic writing

Chapter 1
systems in which thousands of symbols represent the thousands of words of the
language.
4
The Japanese syllabary Kana has two written forms, Katakana and Hiragana.
Each form has 47 basic signs; however, the number of signs increases to 60-70 if
redundant phonetic information is presented (Henderson, 1982).
1.2.4 Alphabetic writing systems
After adaptations from the syllabic writing systems, the ancient Phoenicians
began to use symbols in which only the first consonant of a syllable was represented
in writing. The ancient Greeks adapted the Phoenician writing system and developed
the first alphabet in which each symbol (or grapheme) represented one sound of the
spoken language. Many, though not all, modern languages use an alphabetic writing
system. Logographic and syllabic languages are still used by millions of people. For
example, modem Chinese and Japanese Kanji are logographic, and Japanese
Katakana is syllabic. Although the Chinese writing system has around 10,000
symbols, most Chinese people know between only 2,000 and 3,000-this suffices for
normal written communication. There are other languages where only certain
categories of sounds of the spoken language are represented in writing. For example,
in Hebrew only the consonants are spelled; the vowels are indicated by special
marking-diacritics-or omitted from written text.
Writing began with pictographic and ideographic symbols. These systems
were followed by logographic, syllabic, and alphabetic writing systems. During this
development, although the number of symbols within each writing system decreased,
each system became more abstract in the sense that they used no resemblance
between the visual appearances of symbols and the words they represented.

Chapter 1 5
Letters and Sounds. Reading and writing abilities are not innate. The
convention between symbols and sounds has to be learned in order to make sense of
written language. Writing is a product of human intellect developed over a long
period of time in order to pass information through the use of visual symbols. Daniels
and Bright (1996) define writing as a system of more or less permanent marks that are
used to present an utterance in such a way that it can be recovered more or less
exactly without the intervention of the reader.
According to this definition, pictographic and ideographic systems are not true
writing systems; this is because they do not represent individual sounds (Gelb, 1963).
In contrast, the ancient Greek writing system was based upon symbols that represent
the phonology of the language. Phonology comprises the different sounds or
phonemes of a language. Orthography comprises the written symbols (letters, or
graphemes), that represent the sounds (the phonology) of a language.
An alphabetic writing system has its advantages and disadvantages. Firstly, the
assignment of the sounds to the letters is arbitrary. Secondly, visually similar
graphemes such as 'b'and 'd' or p' and 'q', can be easily confused. Finally, in many
languages the correspondences between letters and sounds are not always consistent.
A good example of consistent correspondences in English comes from the letter B as
it is almost always pronounced as the sound /b/. Letter i on the other hand, can be
read in different ways depending upon the position in the word and its neighbours
(e. g., bird /ba: d/, give /giv/, and life /laif/).
By definition, writing systems that have a large number of inconsistent
correspondences between letters and sounds are regarded as deep orthographies (in
literature also referred to as not transparent or not phonetic). Writing systems, in

Chapter 16
which correspondences between letters and sounds are highly consistent are regarded
as shallow orthographies (also referred to as transparent or phonetic orthographies).
The present research investigated the effect of orthographic depth on the
literacy development of young children learning to read and spell in Albanian,
English, and Welsh. Orthographic depth is the consistency of the relationship between
the orthography and the phonology of the written language. All three languages use an
alphabetic writing system in which the graphemes (letters) come from the Latin
alphabet. The English orthography is considered as having a deep orthography-its
Grapheme-Phoneme (PG) and Phoneme-Grapheme (GP) correspondences are
inconsistent. The Welsh and Albanian orthographies are considered as shallow (their
GP and PG correspondences are regular).
1.3 The Albanian language and orthography
Albanian forms a single branch of the Indo-European family of languages
(Bopp, 1854) and is spoken by more than seven million people, of whom almost three
and half million live in Albania (the rest in parts of the Kosovo, Greece, Macedonia,
Germany, USA, Switzerland and Italy). Albanian has an extremely phonetically
transparent orthography. Other orthographies like Italian, German, Greek, Dutch,
French, and Spanish are transparent but not to the extent of Albanian.
1.3.1 Dialects of Albanian Language
Albanian has two dialects: Gheg dialect (spoken north of the Shkumbini
River) and Tosk (spoken south of the same river). Both dialects are subdivided into
minor dialect (Lloshi, 1999). The most striking differences between the major
dialects are presented in Table 1.1.

Chapter 1
Differences Gegh Tosk nasal vowels in Gheg, missing in Tosk bä bei "I do' e (schwa) very frequent in Tosk and also hän heue ̀ moon' stressed at times, missing in spoken Gheg and replaced with the nasal d ue diphthong or long u in Gheg, corresponds to due du - dua `I want' ua in Tosk (and from uo>o grue gru - grua `woman' di hthon isation) the initial vo- in Gheg in a very small number voj vaj `oil' of cases, corresponds to va- in Tosk the intervocalic -n- in Gheg, to which Tosk rane Rere `sand' corresponds with rhotacism -r- vene vere `wine' terminal voiced consonants in Gheg are heard kalb kalp `make rotten' devoiced in Tosk i madh i math 'big' the consonant clusters mb, nd, ng, ngj in Tosk mush mbush `fill' are heard as distinct sounds, while ven vend `place' reduced to m, n, nj in Gheg nas ngas `tease'
n "esh n 'esh ̀ ress' intervocalic nj in Tosk is reduced in j in Gheg rrä " rren "e ̀ root' imperfect tense forms ending in -sha, -she in punojsha punonja `I worked' Ghe have Tosk correspondences -n "a, -n je Turkish loan-words in Gheg are paroxytonic, käfe Kafe `coffee' in Tosk oxytonic difference in the definite forms of the nouns in thue - thoni Thua - thoi `finger-nail' ue/ua: Gheg preserves the endings of verbs with un hapi une hap `I open' consonantal stem, Tosk omits the endings Tosk preserves the endings of the participles, Hap Hapur `opened' Gheg omits the endings la lard - `washed' presence of the reflexive pronoun i vet 'his own' in Ghe , missing in Tosk; presence of an infinitive form in Gheg replaced me shkue per to shkuar ̀ to go' by a circumlocution in Tosk long vowels in Gheg with phonological values, missing in Tosk presence in Gheg of a future tense with the kam me shkue `I will go' present of the auxiliary "to have" plus the infinitive of the verb, missing in Tosk deverbative adjectives in Gheg, absent in Tosk, ipunuem ipunueshem cultivable expressing possibility with the suffix - `cultivated' shem, different from passive participial adjectives
Table 1.1. Dialectical differences between Gheg and Tosk (Source: Lloshi, 1999).

Chapter 1
1.3.2 History of written Albanian
The first written Albanian text dates back to the 15`h century. This is a baptismal
formula written with Latin letters in 1462 by the Archbishop of Durres, Pal Engjelli.
The first printed book in Albanian, documented so far, under the title Meshari
(Missal), was published in 1555 by Gjon Buzuku (Skendi, 1967). During the 17th
century a number of other works on didactic religious themes were published; these
include a bilingual Latin-Albanian dictionary put together by Frang Bardhi in 1635.
Between the 15 ̀h and early 20th century Albania was under Ottoman
occupation. Teaching of the language or publishing of any literature in Albanian was
strictly forbidden. As a result, the struggle for the establishment of an Albanian
alphabet which began in the early 19`h century continued until the early part of the
200' century. The development of the alphabet went through extensive changes and
revisions, and required the efforts of many distinguished leaders and scholars of
Albania (Skendi, 1967). Geographically, activities on behalf of a unified Albanian
alphabet extended to the Albanian communities of Manastir in the north, Thessalonica
in the east, and Saranda in the south with major alphabet contributions from Tirana
(the capital city), Elbasan, and Korce.
The first significant movement for the construction of a common Albanian
alphabet was undertaken in 1824 by Naum Veqilharxhi. He believed that the Greek,
Latin, and Arabic alphabets used during that period, not only did not correspond to
Albanian sounds but for religious reasons would not be accepted by all Albanians. He
also believed that Albanian, as an independent language, should have its own script so
that foreign scripts would not be carriers of foreign political influences. By
borrowing elements from old Latin alphabets, Veqilharxhi formed a new 33-letter
Chapter 1
alphabet which was used for a primer published in 1844 under the title EVETOR.
This was received with enthusiasm and widely adopted in southern Albania.
Nevertheless, the Arabic, Greek and Latin scripts continued to be used; many
Albanian intellectuals of the time could not agree on which script to use because of
different historical, political and religious reasons. An alphabet used by the Catholic
north and by the Arbereshe (Italo-Albanians), referred to as the Catholic Alphabet,
was restricted in scope and proved to be inconvenient because it utilized the
complicated alphabet of the Ancient Writers of the North (such as Bud i, Bardhi,
Bogdani).
The Istanbul Society for the Printing of Albanian Writings adopted a new
alphabet devised by Sami Frasheri (famous Albanian Renaissance writer). The
majority of the letters were borrowed from the Latin script; certain Greek characters
9
and some of his own inventions were implemented for Albanian sounds that the Latin
alphabet could not convey. This alphabet was founded on the principle of one letter
for one sound. Known as the Istanbul alphabet, it spread widely in a short time
because several Albanian educational books were printed utilizing it. Different reports
show that by 1905 the Istanbul alphabet was used by the majority of the Albanian
population, Christian and Muslim.
An Albanian literary society Bashkimi (The Union), based in Shkoder in
northern Albania, in collaboration with the Albanian Catholic clergy, particularly the
Franciscan brothers, set as its first task the formation of a simpler alphabet. This
alphabet was based on Latin characters; in addition, compound letters, known as
diagraphs, were introduced (the second letter was always `h ). It was named the
Bashkimi alphabet and several textbooks for Catholic schools were printed in it. This
was subsidized by the Austro-Hungarian government.
Chapter 1 10
In 1901, Dom Ndre Mjeda, a Catholic clergyman, who also was a philologist
and a poet, formed in Shkoder another literary society Agimi (The Dawn). He devised
a new script using Latin letters, but contrary to the Bashkimi alphabet, he used
diacritical marks (°) for Albanian sounds; the one letter for one sound principle was
employed. This alphabet, known as the Agimi alphabet, found approval in the 1902
International Congress of Orientalists, held in Hamburg, Germany, and in the
meetings of May, 1902 the majority of the higher Catholic clergy in Shkoder were in
favour of it.
Whilst these alphabets helped the Albanian people preserve their national
identity, culture and traditions under Ottoman occupation, they caused division
amongst the nation. In November 1908, the first Alphabet Congress was held in
Manastir (in Macedonia); this was attended by delegates from Albanian clubs and
societies, towns and schools, both from Albania proper and from Albanian colonies
abroad. After many discussions, the Congress decided that the Istanbul alphabet alone
would be sufficient to answer the needs of the Albanian nation, but in order to have
books printed abroad and telegrams, a purely Latin alphabet was necessary. Thus, two
alphabets were accepted for future use: the Istanbul one and a new Latin one. This
was a significant step toward the unification of education and the union of the
Albanians. Although an ideal solution was not found, it opened the way for a new
single alphabet to be used by all Albanian speakers.
In a second congress held in Elbasan a year later, it was decided that it was the
duty of the Manastir club to introduce the Albanian language in all the schools of
Albania; this also meant the introduction of one single alphabet-Latin. It was further
decided to request that all the Albanian publicists and journalists use only the dialect
of Elbasan, as it was intelligible to both Ghegs in the north and Tosks in the south,

Chapter 1 11
and it was thought that it would form a link between the north and the south (Skendi,
1967).
This decision received mixed reactions throughout Albania and Albanian
communities abroad. However, in March, 1911, a circular from Turkey's Ministry of
the Interior in Istanbul was forwarded to the various Albanian districts ordering the
re-opening of Albanian schools and allowing use of the Latin alphabet. Eventually all
Greek characters which represented certain sounds of the Albanian language were
discarded and a much-revised version of the Bashkimi alphabet, which was always
considered very close to the Istanbul alphabet, appears to be the one currently in use
(Skendi, 1967).
Nevertheless, because of two main dialectical differences of spoken Albanian,
the standard orthography and standard spoken Albanian proved difficult to establish.
The establishment of the communist dictatorship in Albania after the World War II,
had a significant impact in the Standard written Albanian. The recommendations set
up by the National Conference on Orthography in 1953 implied that literary Albanian
should be based on the Tosk modified orthographic variant. The most effective step
towards standardization was taken in 1967 with the publication of a set of
orthographic rules: Rregullat e drejtshkrimit to shqipes (The rules of the Albanian
orthography), aiming to represent a uniform standard national language. The
Linguistic Conference of Prishtina, Kosovo in 1968, adopted the literary language in
use in Albania. Finally, the Congress of Orthography in 1972 in Tirana, is considered
the turning point in the standardization of the Albanian language where the use of the
uniform standard language became obligatory and new literary texts were no longer
printed in the Gheg dialect. The 1972 Congress had immediate effects throughout the
Chapter 1 12
entire Albanian-speaking world and the use of the standard Albanian became widely
accepted.
To conclude, north-south divisions, and the prolonged Turkish rule had a
profound effect in the development of the Albanian alphabet. The modern Albanian
alphabet is Latin-based; it comprises 36 letters.
1.3.3 The sounds and syllable structure ofAlbanian
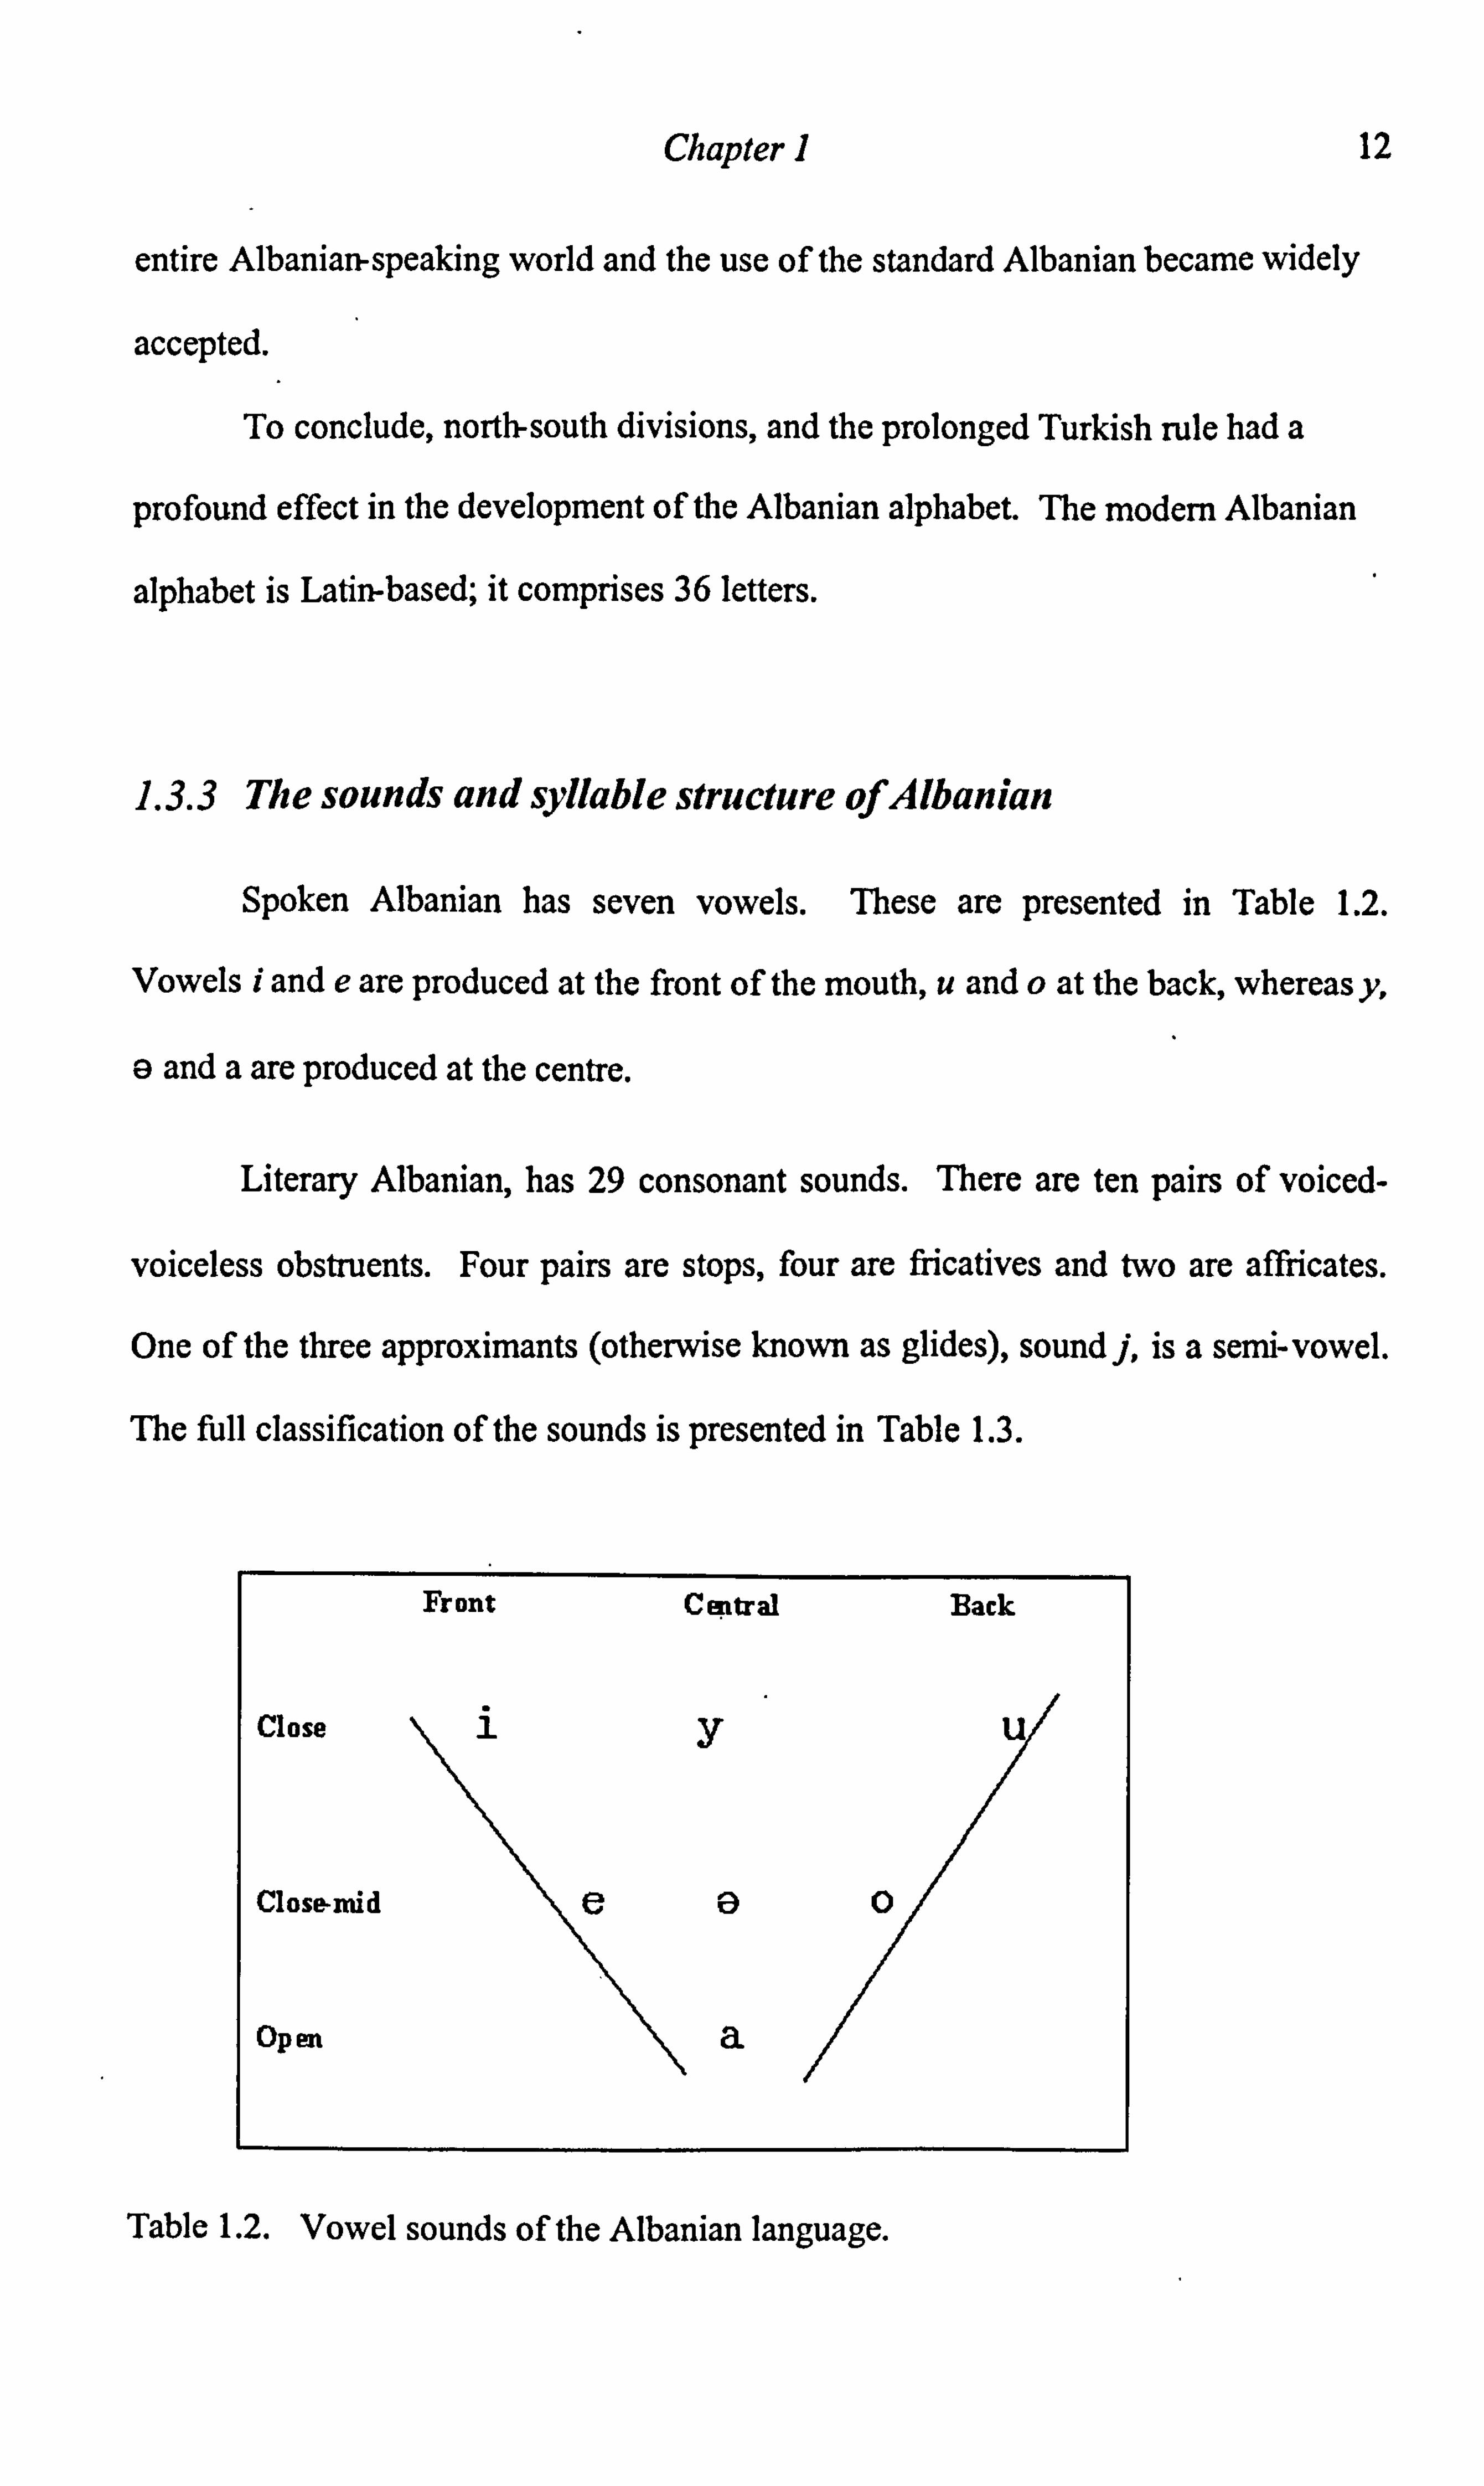
Spoken Albanian has seven vowels. These are presented in Table 1.2.
Vowels i and e are produced at the front of the mouth, u and o at the back, whereas y,
a and a are produced at the centre.
Literary Albanian, has 29 consonant sounds. There are ten pairs of voiced-
voiceless obstruents. Four pairs are stops, four are fricatives and two are affricates.
One of the three approximants (otherwise known as glides), sound j, is a semi-vowel.
The full classification of the sounds is presented in Table 1.3.
Front Central Back
Close 1yu
Close-mid eaO
Open a
Table 1.2. Vowel sounds of the Albanian language.

Chapter 1 13
.. y
4 oQ 44
,. a m C)
Voiceless p t C k STOPS
Voiced b d 3- g
NASALS M. n fl
Voiceless f. $ SS h FRICATIVES
Voiced v0 3
Voiceless ts ts S AFRICATE
Voiced dz d3 APPR OXIMANTS ' J
LATERAL =. 1 L APPR OXIMANTS
r JRI L'
r
Table 1.3. The classification of consonant sounds of the Albanian language.

Chapter 1 14
Syllable structure. The most frequent form of the syllable structure is open ended
(CV). However, there are other forms that appear in the spoken language. Other
frequert forms include VC (e. g., yt `yours'), CVC (e. g., ata `they'), CCV (e. g., shko
`go'), CCVCC (e. g., shkemb `rock'). In addition there are words were CCCV syllable
structure is present but these words rather infrequent (e. g., zmberthej `take appart').
Word final closed syllables usually end with one consonant (e. g., enderr
`dream', gezim `joy'), and on rare occasions they end with a double consonant (e. g.,
komb `nation', peng `hostage' ).
Unfortunately, a full inventory of the syllable structures does not yet exist in
Albanian. A few attempts to statistically analyse written word forms were carried out
in late 1960s and early 1970s. Basho (1974) analysed the phonemic and graphic
system of written Albanian. The proportions of the literary language phonemes
according to their position in words are presented in Table 1.4. According to his
analysis, for all the words that contain phoneme a, for example, 11% of these words
will start with phoneme a, 59.9% will have this phoneme in the body, and 29% will
end with this phoneme. Furthermore, 0.5% of the time this will appear alone (as an
article). For all the words that contain phoneme b, 60% of the time b will appear on
an initial position, 39% in the body, and only 1% on a final position. This indicates
that very few Albanian words end with the phoneme b. Phonemes c, x, xh, zh, on the
other hand, never appear in a word-final position.
In an earlier study, Basho (1969) was able to carry out syllable analysis of the
Albanian language. Table 1.5 gives the absolute and relative frequencies of the
number syllables within words. One-syllable words are the most frequent words
(46.4%), followed by two syllable words (36.1%) and so on.

Ü
dý" N' ý [ýtr) N'
N Mý'
Ný NN ' ß' -' M ýO 00
'. M 'n V-1
: ýpM O Mp
'o ý.., 00 r+ ý{
v') V1 :: r- C-4
Mý M- NON N. --ý :
%0 M' v1 d' Oý I tn tn W-1
cq It en op
p O1 N dam' N
U. tn Mý Nn M 111' N
V Nl- tf) M- h Mtn -
M '"' : ''ý
tn 00 r- -4 -4
't It
N
0 -'Q Np . - N00 en r- mýW., :
4)
oclo st motr
N
ö
Fr
0 Coll
CA 4.
O
0
0 on
O U U
E O
N bA
Q
F. N
N .O w
O N bA
O N
cl E-
o ö w° 00
0 C> 0 ö 11 t- [N o Cd
AG o ö 0
o
, ýo ö4
bö Q tn 0 U, 0
rr °
a3i
-
M (6 z
O
-Ü
27, M
NMÖO
> Ö c3
V-. 4 tn C;
"Cl
cd ti
QÖ
0
tn
cts
N
z¢x H
Chapter 1 16
Stress pattern. Generally, the Albanian language has a fixed stress during
inflection. For word stems the stress falls mainly on the last syllable (Bevington,
1974; Newmark, 1998), whereas for inflected words, (especially in the noun system)
stress falls mainly on the penultimate syllable (Dodi & Gjinari, 1983). For example,
for word forms mal `mountain', male `mountains' and mäleve `of the mountains' the
stress remains on the sound a.
Word stress is not marked in written Albanian orthography.
Morphology. Albanian is a highly inflected language. Nouns are inflected for
number (singular, plural), case (nominative, dative, accusative, ablative) and
definiteness. An unusual feature is that nouns are further inflected obligatorily with
suffixes to show definite or indefinite meaning.
For example; tavoline "table" => tavolina "the table. "
Noun plurals are also remarkable for the irregularity of a large number of
stems. When a definite noun or one taken as already known is the direct object of the
sentence, a pronoun in the objective case that repeats this information must also be
inserted in the verb phrase. For example, fa dhashe topin ate is literally translated
"him-it I-gave the-ball to-him, " which in literary English would be "I gave the ball to
him. "
Verbs have roughly the number and variety of forms found in French or Italian
and are highly inflected and quite irregular in forming their stems. There are five
different tenses, two different voices (passive and active) and 5 moods (indicative,
subjunctive, optative, imperative and admirative).
Adjectives-except numerals and certain quantifying expressions-and
dependent nouns follow the noun they modify. Furthermore, they are notable in
requiring a particle preceding them that agrees with the noun. Thus, in nje burre i

Chapter 1
madh "a big man" the word burre "man" is modified by madh "big, " which is
preceded by i, and which agrees with the term for "man". Likewise, in dy burra to
medhenj "two big men, " medhenj, which is the plural masculine form for "big, "
follows the noun burra "men" and is preceded by a particle to that agrees with the
noun.
1.3.4 GP and PG correspondences in Albanian
The writing system is young, hence its transparency (Crystal, 1987). The
17
official Albanian language is based on the Tosk dialect, which is spoken in the south
of the country. Standard Albanian alphabet has 36 graphemes: 29 representing
consonants and seven representing vowels. Twenty of the consonants are individually
represented by Latin graphemes; five in combinations with h (dh, sh, th, xh, zh), two
with j (g/, nj); two are doubled (11, rr); and one with diacritic (c for /t$/). The
consonants are further divided into the voiced (b, v, d, z, x, xh, zh, dh, gi, g), unvoiced
s, c, c, sh, th, q, k, h), and sonorants (m, n, nj, r, rr, 1,10. The alphabet has 7
simple vowels (a, e, e, i, o, u, y) and a diacritic is used for the schwa e. The Albanian
alphabet does not have the letter w.
The nine consonants presented in the alphabet as bigraphs (dh, g/, 11, nj, rr, sh,
th, xh, zh) are explicitly taught to the children as separate graphemes of the alphabet
and if they appear together are never considered as separate letters (this rule does not
apply to compound words, which occur rather infrequently). The bi-directional
grapheme-phoneme and phoneme-grapheme mapping is consistent for both
consonants and vowels. This is illustrated in Table 1.6 which shows examples of
words for each letter of the alphabet. Each letter maps to the same sound regardless

Chapter 1 18
of whether it is placed initially, medially, or finally, and each sound maps to the same
letter regardless of its position in the word.
The Albanian orthography is extremely transparent and inconsistencies
between the official spoken language and the written language are very rare. In some
textbooks and dictionaries (Bevington, 1974; Drizari, 1975; Newmark, 1998) one may
find that the schwa 'e' is dropped at word endings and that sounds like /b/ and /d/ in
final positions are devoiced to /p/ and /t/, respectively. The first phenomenon relates
to the spoken dialect of the North, whereas the second is only used in colloquial
speech, mainly in the South. Similarly to Finnish, another highly transparent
orthography, occasionally, the pronunciation of `n' changes from /n/ to /rj/ if it is
followed by g.

Chapter 1 19
Phonemes and
Graphemes Word initial Word medial Word final
/al a Ia'ni, jelanije 'boat' I'kapfkap 'catch' 1'kangal kenga'thesong'
fbl b I' buka/ buke 'bread I'mbil rrbi 'over' 1'kcrnblkomb 'nation'
ltsl c I, tsen'trallcentral'central' $'rnatsatmace'cat' /rne'mG slmemec'mute' ItIl 4 It3a'tilgati'roof' /fu'ttilfugi 'barrel' I'Lat'Illaq'mortar'
Idl d I'detldet 'sea' Ika'ndojlkerdoj 'tosing' 1a'tsidracid'acid'
1W /'&f dhe 'earth' I'barödbaxdhe 'white' I'ndodindodh 'happen' IQ/ e PG, ralere 'wind' la'dre, sa! adrese 'address' Isa'psdsepse 'because'
Ja1 ä I' andQrJ enderr 'dream' ISta'pilshtepi 'house' 1'af ta/eshte 'is' Ifl f 1' fuS alfushe 'field' Idi' sf a, taldisfatä 'defeat' i. 3Gr' 3Gfl gjergef'embroidery frame' 1gl g ! ga'zirrdgezim 'joy' la'gimlagim 'dawn' /'zoglzog 'bbd'
13.1 d I'}akIgak bbod' I, diri'J. entJdirigjent'corductor' 1'1131 hg 'law'
fhl h $'hanalhene 'moon' I'ftohto/flohte 'cold J'mpreh/mpreh 'tosharperi lit i /in, sti'tut/institut 'institute' Ii'riciiriq 'hedgehog Ika'Lilkalli 'spike'
Ijl j /' jetaljete life' /'Raft Injejte 'identical' 1'rnbajlmbaj 'to hold' Ikl k I'kohalkohe 'time' I'tsikallcikel 'cycle' I'sok/shok'fiiend' 111 1 I' lurna/lumä 'river' I'lulGllule 'flower' /mall mal 'mountain' ILl ll /'Lath IIlag'mortar' Ipa'Lurnb! p61umb 'dove' I'pys. lpyll 'forest'
Iml m /'rnirolmire 'good' I'fama/farm 'fame' I'kOimfkthim 'return'
/nl it 1' natalnate 'night' Ika' nalikanal 'canal' lli'rnon/ limon lemon IRI r9 ARG' ri I njeri 'man' /as' clalasnje 'one' 1' OoRI thonj 'finger-rails'
Id 0 Io'rizloriz 'rice' I'fkor. arshkolle 'school' Ikor'kd kerlao 'seek' $p/ p ! 'pornoipeme'tree' l'siparlsiper'above' 1'pleplplep'poplar' ICI q I' csnlgen 'dog' Jbu' ce, ta/buletä bunch' /1' ricliriq 'hedgehog'
frl r Irr' ni/rini 'youth' /ba' rilbari 'shepherd' 1'murl mir 'wall'
Ir! rr Ir: a'ziklrrezik'danger' I'bur: afburre'man' I'ziariziarr 'fire'
Isf s I' skit ski 'ski' Idi' sf a, t of disfate 'defeat' Isi' pa st sipas 'according to'
131 sh Isto'pifshtepi 'home' 1'baf katbashke 'together' I'3ys1 gysh 'grandfather' it/ t 1'topltop ball' I'dita/dito 'chy' l'reStlresht 'line' Ia/ th /'O. cn/t1em 'to say' /Spar'Girnlshperthän breaking' I'm akOfmakth 'nightmare'
lul u I' uJ; W uje 'water' I' buku rlbukia beautiful' Pul Ld ulu 'seat down'
IV/ v 1'vezalveze 'egg' I fsi'villcivll 'civil' I fe'ktivlefectiv 'ef active' Of x I'dzicfz I xixe 'spark' I'ncFzehlnxeh 'to hit' I'erzin(TzJ xinx 'male firefly' M& xh $'d3ap'xhep'pocket' /o'd akloxhak 'chimney' /'d3udi xhuxh 'dwarf
/y/ y lyl' be rl ylber'rainbow' /' g ryk al gryke 'throat' I' syl sy 'eye' Iz/ z lzo. marfzemer'heart' Jga'zirn1gezim'joy' Ifi'liztfiliz'tendershoot' 131 zh 13vi' L iml zhvillim'developrnent' Jva3' d ojl vazhdoj `to continue' Jpai' z eil peäazh landscape'
Please note that (') is used to indicate stressed sylables, and(, ) is used to indicate semi-stressed syllables.
Grapheme x /dzf does not occur in final position (&e example given here is a colloquial word, which does not
appe ar in any of the Albanian dictionaries).
Table 1.6. Albanian alphabet and word examples.

Chapter 1
1.3.5 Vocabulary
Albanian has many loan words, relatively few short words and many
compound words. It is assumed that the majority of the words (Bloomfield, 1933)
used today are borrowed from Latin, ancient and modem Greek, Slavic languages,
and Turkish. More recently Italian, French, and English loan words have been
included in the written language in order to satisfy the needs of modern technology,
science, politics, media, culture and art. The number of modem international loan
20
words in Albanian is of similar quantity to that of other European languages (Lleshi,
1999). Despite the numerous borrowings, the language has retained its originality as a
separate Indo-European language.
1.3.6 Primary education system in Albania
About one quarter of the Albanian population are either teachers or students
(ACER, 2002). The overall ratio of students to teachers in Albania is normal but the
number of teachers is relatively high in rural areas and low in urban areas. In order to
cope with limited teaching and classroom capacity, many schools, especially in urban
areas, have two or three shifts of students in a day with short class periods.
The literacy rate in Albania is similar to the Southeast European average rate.
Literacy is lower for those living in the North, and those living in rural areas, and
those over the age of 50 (ACER, 2002). Differences between men and women are not
substantial except among those over 50 years old. Overall, eight percent of males and
22% of females over the age of 15 are illiterate.
Normally, Albanian children begin their primary education at the age of six
(see Table 1.7). Few of these children experience pre-school education. In recent
years the number of pre-schoolers attending kindergartens has decreased. Many,

Chapter 1 21
though not all, of these Albanian kindergartens are similar in ethos to the Austrian
ones described by Wimmer and Hummer (1990), where activities such as word
exposure and letter recognition are explicitly discouraged. The consequence is that
most first graders in Albania enter school without letter or written word awareness
(Hoxhallari, 2000).
Age group Years Level Up to 6 Kindergarten 6-14 1-8 Primary 14-18 9-12 High School 14-18 9-12 (or 13) TechnicalNocational 18-23 1-4 (or 5) University
Table 1.7. The educational system in Albania.
1.3.7 Teaching methods in Albanian primary schools
When considering the nature of the orthography-Grapheme to Phoneme (GP)
and Phoneme to Grapheme (PG) correspondences are regular-it would be reasonable
to assume that the primary education for literacy should be based on a phonics
approach. However, during the last decade's educational reform, the Albanian
government has recently proscribed a whole word-method, known as the Global
Method for all state schools in the country. The most likely reason for this change is
to copy the methods that are ̀ fashionable' in more advanced western countries (e. g.,
Great Britain, USA, France). However, due to a lack of relevant research concerning
the literacy acquisition in Albanian the official proscribing such a teaching method are
not aware that the orthography of these western countries is rather different to that of
Albanian; hence, unaware that a teaching method used in country may not be suitable
for another. Many of the newly trained Albanian teachers use the new method,
whereas most of the experienced teachers who used to teach a phonics method

Chapter 1
(including the teachers who taught the children who participated in the present
research), use a mix of the whole-word and phonics methods.
1.4 The English language and orthography
English is an Indo-European language. It is known as the international
language of business, technology and politics: it is spoken by millions worldwide.
There are many varieties of English (e. g. British English, American English,
22
Australian English, New Zealand English, South-African English, etc. ), which differ
in word pronunciation, word stress, and vocabulary. The origins of the language trace
back to the Anglo-Saxons, Germanic people who settled in Britain 15 centuries ago.
The Germanic Anglo-Saxons used a runic script (Daniels and Bright, 1996). The first
written English dates back to the 7th century in Latin Church documents. At the time
the language was spelled the way it was pronounced; thus it was highly transparent
The Anglo-Saxon's original language is not the only influence of the modem
spoken and written English language (Crystal, 1987). The most influential events that
shaped the English language were the invasions from Danish and other Scandinavian
tribes during the 9th and 10th century, and the arrival of the French-speaking Normans
in early 11th century. The influence of Roman languages had a significant impact in
the vocabulary of the language. These events also affected the written language.
Many foreign words adopted in English maintained the original spelling thus reducing
the transparency of the language. A large number of loan words were introduced
during the Renaissance period from Latin and Greek-this was done in order to
satisfy the needs of education, art, science, industry and technology development.
Another reason that accounts for the lack of transparency relates to the introduction of

Chapter 1 23
printing. Different printers, who usually were foreigners (Dutch), began to add letters
to English words which reflected similarities of their own languages (e. g., `yacht'
replaced the native spelling `yott'). In addition efforts made by different people who
tried to reform the English spelling, and, the `great vowel shift' of Middle English
also `disturbed' the clear waters of the written language.
The first dictionaries appeared in the 15th century, subsequently establishing
the way the English words were spelled. One of the most influential of these
dictionaries was the one compiled by Samuel Johnson-this was published in 1755.
1.4.1 GP and PG correspondences in English
The English alphabet has 26 letters', of which 20 represent the consonants and
six the vowels of the language (a, e, i, o, u, y). The consonants can be voiced or
unvoiced and the vowels can be long (e. g., beat) and short (e. g., bit).
The English orthography is notorious for its lack of transparency. There are
52 major spellings: 32 for consonants and 20 for vowels, representing over forty
phonemes (Venezky, 1976). The simple GP correspondences may me all 26 letters,
thus overlapping in spelling and reading pattern occur. There are multi-letter
graphemic units for both consonants and vowels, for example digraphs (e. g., 'ch, 'sh,
'oo , `au'), and trigraphs (e. g., 'sch', and 'tch'). These graphemes are regarded as
digraphs or trigraphs as correspondences cannot be predicted from their separate
letters (Venezky, 1995). Consonant clusters such as `br' are not regarded as digraphs
because the same rules that predict the phonemes these letters correspond to on their
own, also apply to the combination of these letters.
1 The 26 letters of the English alphabet are used to create graphemes, which in turn are used to represent the phonemes of the language. For example, the two letters s and h are combined into a digraph sh to represent a single phoneme / $/. Graphemes can consist of single letter, double letters (e. g.,
ee), or letter corrhinations (e. g., ck, th, sh etc. ).
Chapter 1 24
In addition, there are single letters or digraphs which have multiple
pronunciations (e. g., 'c, V, `gh, 'e', can be read in different ways). The
orthography also has phonemes which can be represented by more than one
graphemic unit (e. g If/ => f, ff' and `ph )(Adams, 1990). Thus, the bi-directional GP
and PG mappings can be inconsistent for both consonants, and vowels. In addition to
this, there are many exception words such as yacht, and pint, and there are words
which have silent letters (e. g. comb, sing, etc).
Even though the English orthography can be irregular at the GP or PG level, it
can be highly regular and predictable for larger spelling units such as at the
morphemic level (Chomsky & Halle, 1968; Venezky, 1970). For example, the -ing
word ending is always read the same way.
In some cases, the lack of one-to-one correspondences may be justified and
even seen as advantageous. Firstly, when considering silent letters, if these are to be
dropped completely, as in sign but not in signature, the relationship between these
two words which belong to the same family may be obscured. Thus, for the sake of
the semantic relations, phonological regularity is sacrificed. Secondly, different
spelling can help identify between homophones. And finally, the graphic form of
certain morphemes can help the reader identify the relevant syntactic class. For
instance, words that end with the morpheme -ed, indicate the past tense, even though
the -ed ending may differ phonemically (talked /to: kt/ and moved /mu: vd/). The
same applies to the morpheme -s at the end of words: whether it sound like /s/ or /z/ it
usually indicates the plural syntactic feature of the word (e. g. houses /hauziz/ and
doors /do-so.
Stress placement in English is highly complex. Stress depends on the
morphological structure (whether there are affixes or not), word category (nouns,

Chapter 1 25
verbs, or adjectives), number of syllables in a word, and the phonological structure of
the syllable (Roach, 1983).
1.4.2 Primary education system in England
English children start their primary education at the age of four or five years
old. Before they enter primary education they have the opportunity to attend nursery
school; this is not compulsory.
The primary education system is divided into two parts, infants (Key Stage 1)
and juniors (Key Stage 2) (DIES, 2003). During the first year of primary (infant)
school the main focus is placed upon phonic awareness, where children become
familiar with the letters of the alphabet and their individual sounds. In later years, as
they progress through Key Stage 1 and 2, their literacy skills develop further. Most
schools use a mixed method approach, where both phonics and whole word methods
are consistently employed in teaching literacy.
1.5 The Welsh language and orthography
The modem Welsh language is of Celtic origin; it is identified as a member of
the Brythonic division, part of the Indo-European languages (Ball, 1988). The Welsh
language has seen major changes over five distinct periods in the last 12 centuries
(Evans & Tomas, 1953). `Early Welsh' dates back to late 8th century (the language
developed from Brythonic). From the beginning of 9th century until the end of l lth
century the `Early Welsh' developed into `Old Welsh', which was followed by
`Medieval Welsh' (between 12th and end of 14th century). `Early Modern Welsh'
developed from the 14th to the 16th century.. This led to the `Late Modern Welsh',
which is the language spoken at present in Wales.

Chapter 1 26
The modem Welsh orthography is transparent. Between 6 ̀h and 16th century
the standard literary orthography was maintained. However, in the 14 tß' century the
standard orthography began to deviate. In 1567, William Salisbury in his translation
of the New Testament in Welsh began to use spelling that resembled Latin words
(Jones, 1988b). This translation was not widely used, but it served as the basis for the
new translation made by Bishop William Morgan in 1588, who instead of Salisbury's
Latin spellings, used the formal literary Welsh. This proved to be crucial for the'
future of the Welsh language (Nash, 1991). A later adaptation of this translation in
1620, replaced some of the dialectical words but the spelling of Bishop Morgan was
maintained. The Bible was recognized as the standard orthography until William
Owen Pugh changed the spelling of hundreds of words in his dictionary in 1803.
From this point forward the Welsh orthography began to lose its transparency.
It was the Dafydd ap Gwilym Society which throughout the 19th century made many
attempts to establish a standard Welsh orthography. The Celtic Information Board of
the University of Wales, continued this work and in 1977, the Information Board
reformed some of the irregular spellings which were still in use. In 1983, the Orgaff
yr Iaith Gymraeg `The Welsh Orthography' was published; this was based on
phonetic principles, that conformed more to the archaic pronunciation rather than to
the various vowel pronunciations of contenporary Welsh (the contemporary Welsh
varied considerably from north to south (Spencer, 2000)).
1.5.1 Vocabulary
The Welsh language has inherited many of the old Brythonic words (Lewis,
1943). Old Welsh borrowed many Latin words, especially religious words. For
example the Welsh word ysbryd `spirit', comes from the Latin word spiritus (Lewis,

Chapter 1
1943). Also it borrowed many English words, words from Old Norse, and a few
French words, which entered the language due to the English influence.
1.5.2 Dialects of Welsh
Four main dialects were identified by Evans and Thomas (1953); these are
spoken in North Wales, North-East and Mid-Wales, South-West Wales and South-
East Wales. The most major differences lay between the North and Soiith dialects.
27
For example, in North Walian the word `out' is allan, whereas in South Walian `out'
is mas (Spencer, 2000).
The Welsh Academy is the main organization which promotes and assists to
maintain the standards of the literature in Wales (The Welsh Academy, 1999). The
standardization of the literary Welsh (Jones, 1988b) is influenced by the fact that it is
recognized as the official and business language; it is used as the medium of teaching
in the Welsh education system; it is used by media broadcasting organizations, such
as the BBC Wales and S4C; and it is used to publish a variety of books in Wales.
1.5.3 GP and PG correspondences in Welsh
The Welsh alphabet has 29 graphemes (28 if the `j', which comes from
borrowed English words, is not included), of which seven are vowels (a, e, i, o, q w,
y). Vowels' pronunciation-depending on the position-may be short, medium, or
long. The alphabet, like the Albanian alphabet, includes several digraphs (dd, ff, ng,
11, ph, rh, th). These digraphs are explicitly taught to children as single units. There
are very few exception words where these digraphs are read as two separate letters;
for example in Bangor the `ng' is not pronounced as the usual /rj / but as two separate
sounds /n/ and /g/.

Chapter 1 28
The Welsh orthography, unlike English, is highly transparent, enough at least
that Welsh dictionaries do not need to illustrate the pronunciation of words using a
phonetic notation (Ellis & Hooper, 2001). Nevertheless, certain features of the
orthography obscure its transparency. For example, some written vowels in Welsh
map to more than one sound the language. Orthographic "y", may be realised as a
schwa in nor-final syllables of polysyllables; it may also represent the first non-
vocalic part of a diphthong ("yw", /iu/), or the second consonantal part of the
diphthong ("wy", '/ui/). Welsh also permits epenthetic vowels, these being vowels
which are pronounced but which are not shown in the orthography. The graphemes "i"
and "w" are also variable - "i" can be either a long or short vowel (/ii/, /i1), or the
palatal glide /j/. The grapheme "w" is the hardest to realise with four or five possible
interpretations. Hence, the Welsh writing system is not as transparent as the Albanian
writing system, where each grapheme corresponds only to one sound.
Another interesting feature of the Welsh languages is the mutation system.
There are three kinds of mutations: soft, nasal and aspirate. The consonants ̀ p' /p/, `t'
/t/, and `c' /k/, undergo all three changes; ̀ b' /b/, `d' /d/, and `g' /g/ undergo two
changes (soft and nasal); and `11' /1/, `m' /m/, and `rh' /rh/ can have only aspirated
changes. In words of more than one syllable, stress will usually fall on the penultimate
syllable. Evans & Thomas (1953) identified many words-especially verb nouns and
emphatic personal pronouns-that are stressed on the last syllable, whereas words
borrowed from English are stressed as they are in English.
1.5.4 Primary education system in Wales
In terms of starting age and teaching methods, primary education in Wales is
similar to the English primary education. However, Wales is a bilingual country,

Chapter 1 29
where both Welsh and English are spoken in many areas. Welsh is a compulsory
subject for all pupils in Wales. This means that all pupils in Wales study Welsh (either
as a first or a second language) for 11 years, from the ages of 5 to 16.
The 1988 Education Reform Act included Welsh in the National Curriculum.
In Welsh-speaking schools, Welsh is a core subject; in other schools it is taught as a
foundation subject (Baker, 1993). The language policy adapted from LEAs can vary
depending on whether Welsh is the mother tongue or not. In 1929, the Board of
Education suggested that the language spoken at home should be the medium of
instruction in primary schools; thus, in areas where Welsh is predominant, the
medium of instruction should be in Welsh-English should be taught as a secondary
language. The opposite applied for areas where English is predominant. The
Education Act of 1944 allowed LEAs to consider opening Welsh-medium schools.
The first Welsh-medium state primary school was established in Llanelli in 1947.
Initially, these schools catered for children whose Welsh was their first language but
by the 1960s increasing numbers of pupils in Welsh-medium education came from
non-Welsh speaking homes (Baker, 1993)..
In 2000/200 1, over 25% of children in Wales were attending Welsh-medium
schools. The majority of these pupils came from non-Welsh-speaking homes. There
were 440 Welsh-medium or bilingual primary schools, and 51,087 primary pupils
were mainly taught through the medium of Welsh. A further 6,860 pupils were taught
a percentage of their curriculum through the medium of Welsh and 223,328 pupils
were taught Welsh as a second language. Of the 229 secondary schools maintained
by LEAs in Wales, 72 taught Welsh as a first and second language and the remaining
157 schools taught Welsh as a second language only. According to the Welsh
Language Board (2003), a total of 52 secondary schools were defined as Welsh-

Chapter 1 30
speaking schools. Finally, with regard to the instructional approach, most schools use
a mixed method approach, where both phonics and whole word methods are
consistently employed in teaching literacy.
1.6 Differences and similarities between Albanian, English
and Welsh
Table 1.8 shows the differences and similarities between the three languages
described above. All three scripts are alphabetic: the base of each alphabet is the
Latin alphabet (but the Albanian alphabet has a higher number of graphemes, 36).
The instruction in primary education in all three countries is mixed; phonics and
whole word approaches are used. However, Albanian children do not start school
until they are six years old whereas the English and Welsh children start at around
five. Similarly, Wimmer and Hummer (1994), who examined the nonword reading of
English speaking and German speaking children, pointed out the same problem with
the children's ages. The English children were approximately 10 months younger than
their Austrian counterparts.
Albanian Welsh English
Script Alphabetic
G-P mapping Consistent Consistent Inconsistent
P-G mappings Consistent Few inconsistencies Inconsistent
Irregular words A few foreign words A few Many
Instruction Mixed
School entry Not before 6 y. o. Around 5 yo.
Table 1.8. Differences and similarities between Albanian, English and Welsh.

Chapter 1 31
Finally, the Albanian orthography seems to be the most consistent where a
one-to-one mapping exists for both GP and PG correspondences; Welsh is highly
phonetic, especially for the GP correspondences, whereas the English orthography is
extremely irregular.
Rules of graphemic parsing are easier in Albanian and Welsh where most
digraphs are part of the alphabet.
1.7 Final summary
In this chapter a description of the historical development of written language
has been presented. The current thesis aimed at examining the literacy development
of Albanian, English and Welsh children. These languages differ in the degree to
which sounds of the language are presented in written symbols. Welsh and especially
Albanian orthographies are highly transparent, whereas the English orthography is
highly inconsistent and has many irregular words.
Research has shown that orthographic depth affects the literacy development
across languages. The next chapter reviews various theoretical models of reading and
spelling development and cross- linguistic research in literacy development.

Chapter 2
Chapter 2: Reading and spelling development
2.1 Introduction
Reading and writing, unlike spoken language, are formally taught at a young
age. No one would be able to independently decipher a script. The reading process
allows the reader to visually identify, comprehend, and convert written symbols to
sound. The visual recognition deals with constraints such as shape of individual
letters and spatial variability. Based on the visual characteristics the reader can gain
32
access to stored information about the pronunciation and meaning of individual words.
These processes lead to comprehension or understanding the message in its relevant
context (Ellis, 1993).
In spelling, words, and smaller language units (e. g., syllables and single
sounds, see Figure 2.1), are converted into print based on the phonological and
orthographic representations stored in the mental lexicon (Ellis, 1993). Words can be
divided into smaller sound segments. The first level is the syllable. This divides into
onset and rime: onset is the initial consonant (or consonant cluster); the rime includes
the vowel and the remaining consonants. The rime is further subdivided into the peak
(the vowel) and coda (the end consonants). The division of the initial and final
consonants into single phoneme is the final level.

Chapter 2
Body, ltwi!
Onset ! tw!
Phoneme Phoneme Al Iw!
Syllable / /twist/
Rime Astl
Peak Coda tJ lsV
Phoneme Phoneme Phoneme ! il Ist Al
Figure 2.1. Syllable structure (Source: Seymour, Duncan & Bolik, 1997).
Many researchers have tried to provide literacy development models. These
33
have proved difficult to apply universally because literacy development depends upon:
(1) the type of script-logographic versus alphabetic (Wang & Geva, 2003);
(2) transparency of the orthography (Wimmer & Goswami, 1994; Öney &
Durgunoglu, 1997; Ellis & Hooper, 2001; Spencer & Hanley, 2003);
(3) syllable structure of the spoken language (Seymour, Aro and Erskine
(2003);
(4) teaching methods-phonics versus whole word approaches (Lundberg,
Frost & Petersen, 1988);
(5) children's starting age of formal education: there are differences between
countries (Seymour et al., 2003);
(6) individual differences in general ability and strategy employed-visual
versus phonological (Goswami & Bryant, 1990; Ellis & Hooper, 2001; Spencer &
Hanley, 2003);
(7) socio-economic background (SES) (Duncan and Seymour, 2000; Lundberg,
2002); and
(8) learning disabilities (e. g dyslexia and dysgraphia).

Chapter 2 34
Nevertheless, many of the traditional stage models of reading and spelling
development outline various distinct stages, through which children progress. These
models have been mainly based on the error types that children make and strategies
they use as their literacy skills develop. Models of reading and spelling have been
developed in a parallel fashion and include similar characteristics: they emphasise the
crucial role that phonological skills play in the initial stages of literacy acquisition and
the development and reliance upon orthographic knowledge in the final stages.
Next, the dual-route model of word recognition and developmental models of
reading acquisition are presented. These are followed by a review on spelling
development.
2.2 The dual-route model of reading
The dual-route model (Coltheart, 1978,1982; Coltheart, Curtis, Atkins, &
Haller, 1993) proposes two separate ways of processing orthographic (written) and
phonological (spoken) information. A simple version of this model is presented in
Figure 2.2. The lexical route is a direct route where high frequency, familiar words
are recognised from LTM. The alternative sub-lexical route employs GP conversions
to recognise new words, where individual sounds are assembled into phonologically
plausible pronunciations.

Chapter 2
Figure 2.2. A simple version of the dual-route model of reading.
35
Paap and Noel (1991) have suggested that a competition exits between routes.
Words are processed by both routes but the lexical route is much faster in recognition
familiar words, therefore, usually wining the competition. The sub-lexical route is
slower but GP conversions are important for learning new words.
Supporting evidence for the existence of these two distinct routes comes from
studies with from normal and disabled readers. Paap and Noel (1991) assuming that
the sub- lexical route is more demanding on memory than the direct lexical route,
predicted that if the sub-lexical route is disrupted by high memory. load, then the
lexical route should continue to operate in isolation. In order to test this prediction
they asked the subjects to retain either five digits or one digit while performing a
reading task. They found that naming latencies for low. frequency orthographically

Chapter 2 36
irregular words were faster when holding five single-digit numerals in STM than
when holding only one. Given that low- frequency (LF) words take longer to name,
even if retrieved from the mental lexicon, the phonological route becomes more
competitive for retrieving these words. In this case the output from both routes can be
the same. However, orthographically irregular words can result in false output by the
phonological route. Thus low-frequency orthographically irregular words cause a
conflict between the incorrect output of the phonological route and the correct output
of the lexical route. In order to solve this conflict additional time is required, leading
to very long latencies for words of the low- frequency orthographically irregular words.
This lead Paap and Noel to suggest that when STM is occupied, the indirect
phonological route will slow down even further, thus allowing the lexical route with
the correct output to win the race.
Contrasting cases of phonological dyslexia and surface dyslexia have been
reported by several researchers. Patient WB (Funnell, 1983) could read regular and
irregular words (with accuracy 90% and 80% respectively) but reading of non-words
was severely impaired (0% correct). The case of WB reflects phonological dyslexia.
Contrary to this, McCarthy and Warrington (1986) reported the case of KT whose real
word reading and nonword reading was intact (96% and 100% correct respectively)
but very poor at reading of low- frequency irregular words (26% correct). The case of
KT reflects surface dyslexia. This double dissociation in reading ability seems to
confirm the existence of the two distinct routes in word recognition
However, the dual route model has received criticism. Glushko (1979) found
that reading time for non-words is affected by the pronunciation of similar real word.
For example, `zaid' which has two body neighbours that differ in pronunciation
(`raid' and `said) is read more slowly than `prink' which shares a body with consistent

Chapter 2 37
pronunciation ('pink' and `clink'). The same effect was found for real words; words
which share a `consistent' body pronunciation are read faster than regular words
whose body pronunciation varies. These findings led Glushko (1979) to suggest the
concept of `reading by analogy' and that grapheme to phoneme conversions may not
be as simple as suggested by the simple dual-route model of reading.
To summarise, evidence form normal reader studies and neuropsycological
research suggests a modular system of reading with separate orthographic and
phonological lexicons, which are bi-directionally connected to each-other. These
lexicons are both connected to the semantic lexicon, and that a separate non- lexical
route is responsible for the application of rules used in converting graphemes to
phonemes.
2.3 Developmental models of learning to read
Over the years, knowledge on the acquisition of reading in English has accumulated.
First, children learn to associate a printed word with its sound. Then they are taught
the correspondences between letters and sounds. Words are then read by blending
letters and sounds and recognising a word sound. With much practice, children learn
to recognise words quickly. Various stage models have been developed to explain
developmental processes in young readers (Ellis, 1993).
The developmental reading model first proposed by Marsh, Friedman, Welch,
and Desberg (1981), identifies four developmental stages. In the first stage, linguistic
substitution, children begin reading by learning rote association between
unsynthesised visual stimuli and unanalyzed oral responses. Thus, words are read as
logographs. In the second stage, discrimination net substitutions, children begin to
use context in combination with linguistic cues and rudimentary analogies are made in

Chapter 2 38
order to spot similarities between new words and familiar ones. In the third stage,
sequential decoding, in order to analyse words into phonemes and employ grapheme-
phoneme correspondences to decode new words they use combinatorial rules. In the
forth and final stage, hierarchical decoding, children are able to use higher order
conditional rules. For example, the pronunciation of `c' is conditional upon the
following grapheme.
Marsh's theory has its limitations: children's early phonological skills such as
rhyme awareness and associations of larger speech units such as rimes with letter
sequences are ignored. Frith (1985) modified Marsh's developmental model by
devising a three-stage theory of reading development: (i) logographic, (2) alphabetic
and (iii) orthographic. Each stage is a stepping-stone which is needed before the next
stage can be achieved. In the first stage children read words as logographs
(logographic stage). For example, the Coca-Cola trademark can be easily recognised
by young children; however, if they are presented with the words Coca-Cola in a
different format they fail to recognise these words.
In the second stage, alphabetic stage, the reader uses a sequential decoding
system, thus applying grapheme-phoneme conversion rules to read new words. While
in this stage the child is likely to make nonword errors, the readers begin to
understand the basic grapheme-phoneme relationship. For example, if the letter ̀ a' is
given to a child and they were asked what the letter was, the child would be able to
give the phonetic sound for /a/.
The alphabetic stage gives way to the orthographic stage, the final stage of the
model. In the orthographic stage the reader is able to recognise the words through
' direct access of the orthographic word recognition and include the use of
morphological spelling patterns. The process of word identification differs from the

Chapter 2 39
logographic stage because words are analysed in terms of orthographic properties and
not visual properties. This stage also differs from the alphabetic stage in the sense
that word recognition can follow directly from orthographic analysis not requiring
phonological mediation
There are several issues that limit the strengths of such stage models. For
example: the mechanisms responsible for the transitions between the stages are not
described (Snowling & Hulme, 1999); reading strategies children adopt depend upon
the language the children learn (Wimmer & Hummer, 1990) and different teaching
methods (Johnson & Thompson, 1989); and children with developmental dyslexia
could skip the alphabetic stage and reach later stages of the reading development
(Snowling, Hulme & Goulandris, 1994). Furthermore, Seymour (1990,1993,1997)
proposed a `dual foundation' model of learning to read. In his model, the logographic
lexicon and the alphabetic system merge into one orthographic system and the reading
difficulties can be regarded as difficulties within the first or the second sub-system.
In a more recent reconsideration of Frith's model, Ehri (1999) argues that the
term logographic is misleading because true logographic readers (e. g. of Chinese)
remember all of the visual forms of the sight words as unified wholes, whereas
English children remember only selected visual cues of the written word. Therefore,
each logograph is represented by one symbol. Further, she suggests that the term
orthographic is inadequate and ambiguous and that the Use of this term for the final
stage greatly underplays the role of phonology in skilled reading. Such considerations
motivate her model of the developments of sight word reading which describes the
processes by which words are read by accessing them from memory (Ehri,
1992,1999).

Chapter 2 40
Ehri (1999) developmental model comprises four phases characterized by the
degree of involvement of the alphabetic system: (i) pre-alphabetic, where one or more
visual cues of the word are remembered; (ii) partial alphabetic, where one or few
letters, which correspond to the appropriate sounds detected in pronunciations, are
used to recognize a written word; (iii) full alphabetic, where connections are created
between graphemes in spelling and phonemes in pronunciation of the words; and (iv)
consolidated alphabetic, where written words become sight words, which means that
letter patterns recurring in different words become consolidated into larger
pronunciation units (e. g., syllabic and sub-syllabic units).
All the developmental models of reading described above share common
features. For example, they regard reading development as a series of discrete steps;
they propose that initially children read and spell in a logographic manner; and that
after adopting an alphabetic decoding strategy, children master complex, phonological
and orthographic rules that allow them to read and spell by using direct lexical access.
2.4 Dual-route model of spelling
In comparison to reading there has been less research in spelling processes and
spelling development. Spelling involves producing the correct order of graphemes in
a word. Individual words and smaller language units (e. g., syllables and single sounds)
are converted into print based on the phonological and orthographic representations
stored in the mental lexicon (Ellis, 1993).
Similarly to reading, a dual-route model of spelling has been suggested (Barry,
1994). The first route, also known as the lexical route, uses direct processes for
spelling letter sequences of already memorised words in the orthographic lexicon.
During spelling, a spoken word would activate its representation in the orthographic

Chapter 2 41
lexicon via the word's meaning or via its phonology (Barry, 1994). The lexical route
is used for irregular words as well as for familiar regular words already stored in the
lexicon. Theoretically, this route cannot be used to spell non-words because they have
never been encountered previously: word-specific knowledge is built up over
exposures to print. The second route, also known as the phonological route, is used
to produce the spelling of words by breaking up the word's individual phonemes and
then using the knowledge of sound to spelling correspondences to assemble the
correct spelling (e. g. /d/ `d', /o/ `o', /g/ `g' is assembled into the correct spelling for
`dog). During spelling, the phonological form of a spoken word is held in the
phonological temporary buffer in short term memory whilst the PG conversion rules
are applied (Barry, 1994). The phonological route would always produce the correct
spelling of regular words. The use of this route may result in plausible spellings of
unfamiliar words and nonwords.
Supporting evidence for the dual processing model of spelling comes from
cognitive neuropsychological research. Beauvois and Derouesne (1981) presented the
selective impairment case of RG who had no difficulty in producing plausible
nonword spellings, whereas the spelling of real words was severely impaired,
especially for ambiguous, low, frequency words. After taking into account that RG's
spoken and written comprehension were normal and the similar pattern of
performance in all spelling tasks regardless of the input modality, it has been argued
that damage to the orthographic lexicon is responsible for this kind of errors. This
case is referred to as surface dysgraphia.
In contrast to the case described above, following brain damage, patient PR
(Shallice, 1981) could correctly spell 94% of the real words (regular and irregular),
and only 18% of the non-words. More interestingly, PR was also poor at spelling

Chapter 2
single phonemes (56% correct), suggesting that knowledge of PG mappings was
damaged. This patient is referred to as suffering from phonological dysgraphia.
However, similar to the dual-route model of reading, evidence from spelling
by analogy remains a problem (Campbell, 1983,1985). Campbell (1983) presented
participants with lists of spoken words, and asked them to spell the nonwords only.
She found that nonword spelling of children and adults was influenced by prior
knowledge of real words.
2.5 Developmental models of spelling
For a long period of time, it was thought that children learn to spell by using
serial learning of letter strings and rote memorisation of whole words. However,
42
Read (1971,1975,1986) after careful examination of children's invented spelling in
naturalistic settings and spelling errors from experimental research, viewed spelling as
a linguistic process in which sounds are grouped together in print according to shared
phonetic cues. Following this theoretical framework, and further research by
Henderson and Beers (1980) and Bissex (1980), Gentry (1982) suggested a five stage
model of spelling development. In the first stage, the precommunicative stage,
children write strings of letters in a random fashion. For example, the word `monster'
may be spelled as `btrss', which reflects a complete lack of letter-sound or letter-name
knowledge (Ellis, 1993). Next, in the semiphonetic stage children begin to
understand that individual letters correspond to individual sounds (which make up
each word). The letters used in spelling reflect partial mapping of the phonetic
representation of spelled words and letter names are used to represent whole words or
syllables (e. g `u' for `you). When reaching the third state, the phonetic stage,
children's phonological segmentation becomes evident, therefore, the spelling of
words has the complete sequence of sounds in pronunciations. All surface features of

Chapter 2 43
words are represented in spelling and certain details of phonetic forms (e. g. -ed
endings, preconsonantal nasal, tenseness of vowels, etc. ) are systematically
represented with particular spellings. Children assign letters on the basis of sound
regardless of spelling conventions of the English orthography and acceptable letter
sequences. In the transitional stage, children adhere to the more basic conventions of
the English orthography (e. g., vowels appear in every syllable; specific letter
sequences, etc. ). Children move away from the letter-name strategy, and begin to use
the relations of word meanings to help them with their spelling. The final stage of
Gentry's model is called the correct stage. In this stage the knowledge acquired
above in combination with knowledge of the structure of English words writing
system allows children to spell multi-syllable words.
Gentry's (1982) model suggests that spelling development is essentially
separate from reading development. Research (Ehri, 1979,1984; Ellis & Cataldo,
1990) has shown that improvements in phonological awareness on which reading
development depends are themselves a consequence of how single sound segments of
words are spelled conventionally (Ellis, 1994). Therefore, Ehri (1986,1997) and
Frith (1985) have suggested models where reading and spelling are integrated. Ehri's
model or reading and spelling development suggests that children's spelling
progresses through four stages. The first three stages, semiphonetic, phonetic,
morphemic are similar to Gentry's semiphonetic, phonetic and transitional stages. In
the fourth stage Ehri (1997) combines all advanced levels in one stage. She describes
three processes by which words may be spelled. Firstly, spelling by analogy requires
the speller to recognise the phonological similarity between the target word and other
known words. During spelling by analogy parts of the known spellings that represent
the similarity between the words are transferred to the new spelling. Secondly,
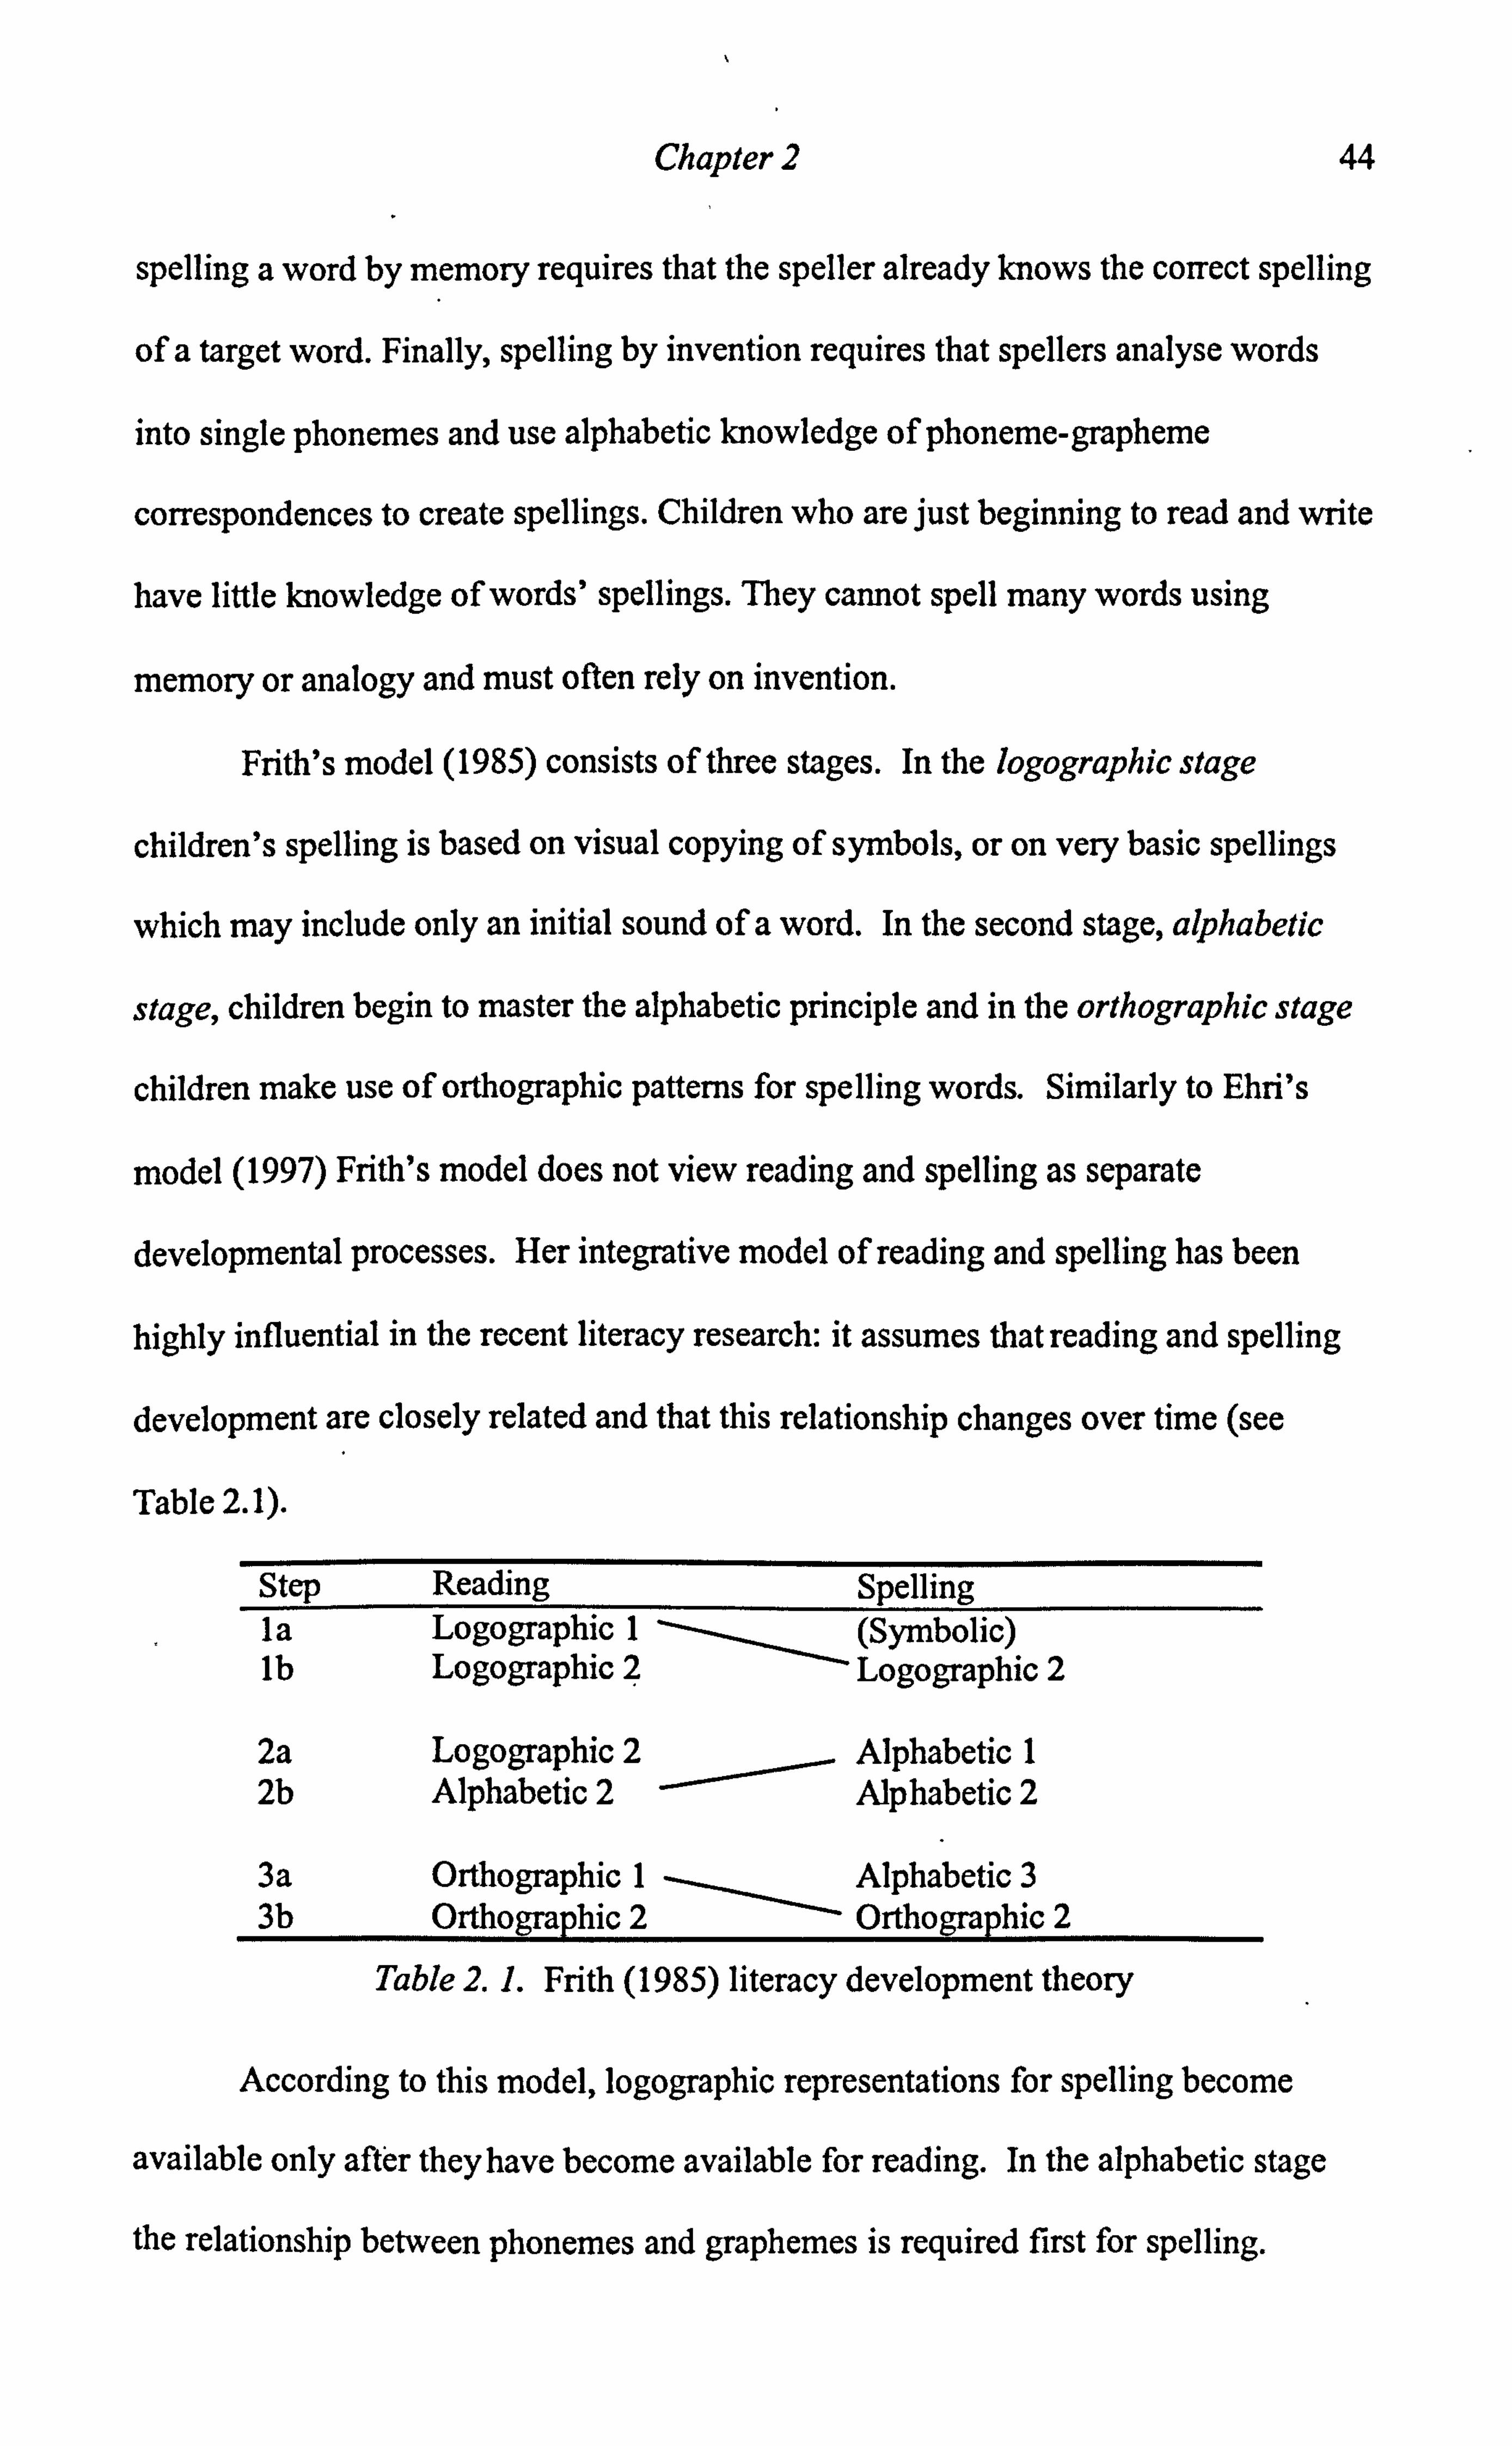
Chapter 2 44
spelling a word by memory requires that the speller already knows the correct spelling
of a target word. Finally, spelling by invention requires that spellers analyse words
into single phonemes and use alphabetic knowledge of phoneme-grapheme
correspondences to create spellings. Children who are just beginning to read and write
have little knowledge of words' spellings. They cannot spell many words using
memory or analogy and must often rely on invention.
Frith's model (1985) consists of three stages. In the logographic stage
children's spelling is based on visual copying of symbols, or on very basic spellings
which may include only an initial sound of a word. In the second stage, alphabetic
stage, children begin to master the alphabetic principle and in the orthographic stage
children make use of orthographic patterns for spelling words. Similarly to Ehri's
model (1997) Frith's model does not view reading and spelling as separate
developmental processes. Her integrative model of reading and spelling has been
highly influential in the recent literacy research: it assumes that reading and spelling
development are closely related and that this relationship changes over time (see
Table 2.1).
Step Reading Spelling la Logographic 1 (Symbolic) lb Logographic 2 Logographic 2
2a Alphabetic I 2b Alphabetic
12 2 ý- Alphabetic 2
3a Orthographic 1 Alphabetic 3 3b Orthographic 2 Orthographic 2
Table 2.1. Frith (1985) literacy development theory
According to this model, logographic representations for spelling become
available only after they have become available for reading. In the alphabetic stage
the relationship between phonemes and graphemes is required first for spelling.

Chapter 2 45
Desire to write and the knowledge that writing represents sounds of the language
encourages children to spell. Once the alphabetic principle is achieved for spelling, it
serves as the pacemaker of alphabetic reading.
During the orthographic stage, increasing experience- with the orthography
gives the child the opportunity to understand the regularities and spelling patterns of
the language. The reading process becomes non-phonological as the spelling patterns
become larger orthographic units in the mental lexicon. These larger units are then
used in the spelling process. Hence, orthographic reading serves as a pacemaker of
orthographic spelling.
2.6 Cross-linguistic research on literacy development
The developmental and dual-route models of literacy described above capture
the way children learn to read English. The question is: How well do these models
account for the acquisition of reading and spelling in more transparent languages?
The following sections evidence from Serbo-Croatian, Italian, German, Welsh,
Finnish and Turkish.
Serbo-Croatian and Orthographic Depth Hypothesis (OHD)
The Serbo-Croatian writing system is bi-directionally transparent. The syllable
structure of Serbo-Croatian is simple (open syllables) and its morphology is highly
inflected. The writing system is unusual because it uses two partially overlapping
alphabets to represent the spoken form-Roman and Cyrillic. Each alphabet has 30
letters and in both alphabets each letter corresponds to only one sound. Most of the
letters are unique, however, there are seven common letters (A, E, 0, J, K, and M)
which represent the same phonemes and four letters which are ambiguous (Roman

Chapter 2 46
alphabet: H /h/, P /p/, C /ts/ and B /b/; Cyrillic alphabet: H /n/, P In, C /s/, and B NO.
Given the properties of these two alphabets, it is possible to generate letter strings that
can be legally read in more than one way (Lukatela, Lukatela, Carello & Turvey,
1999). For example, the word `wind' is written as BETAP /vetar/ in the Cyrillic
alphabet and VETAR /vetar/ in the Roman alphabet. The Cyrillic spelling BETAP can
be read using the Roman letters but this would be a nonword and would sounds as
/betap/. The Roman spelling would be impossible to read when using the Cyrillic
alphabet. The important aspect here is that BETAP is phonologically ambiguous
because letters B and P correspond to the sounds /v/ and /r/ when the Cyrillic alphabet
is used and to the sounds /b/ and /p/ when the Roman alphabet is used.
Feldman, Kostic, Lukatela, and Turvey (1983) and Feldman and Turvey
(1983) exploited these properties of the Serbo-Croatian by conducting lexical-
decision tasks with bi-alphabetic readers. They found that words which contained
letters pronounceable in both alphabets took longer to read than words with unique
letters. The phonological ambiguity effect was present in words as well as in
nonwords, but the effect was larger for words. Furthermore, they found that the
magnitude of the effect depended on the number and distribution of the ambiguous
letters in ambiguous letters strings. These findings lead Feldman and Turvey (1983)
to propose that for fluent readers phomlogical analysis is mandatory in the visual
recognition of Serbo-Croatian words, hence, readers of transparent orthographies rely
exclusively on the assembled route which is non-lexical. According to these findings,
the dual-route model does not fully apply to readers of transparent orthographies as
only one of the routes is necessary; the direct lexical route is not required.
Although various researchers have argued against this claim (e. g., Hung and
Tzeng, 1981; Besner & Smith, 1994; Baluch & Besner, 1991; Besner, Patterson, Lee,
Chapter 2 47
& Hilderbrandt, 1992) here it is assumed that this modification of the dual route
model applies to beginning readers of transparent orthographies because word
representations are not yet established in the orthographic memory. Turvey, Feldman
and Lukatela (1984) suggested that in the extremely transparent orthography of
Serbo-Croatian for beginning and fluent readers there are few enticements to try other
strategies than the phonologically analytic one, because this strategy is economical,
efficient and most benefiting. -Frost, Katz and Bentin (1987) proposed that children
learning to read in transparent orthographies may find it easier to do so than children
learning to read in more deep orthographies. They examined the effect of
orthographic depth on visual word recognition by comparing readers of Hebrew,
English and Serbo-Croatian. In Hebrew consonants are presented by letters where as
vowels by diacritical marks. Although, both consonants and diacritical marks are
taught in the first two years of schooling the former are omitted in literature,
newspapers etc. As a result, the adult reader is exposed to an unvowelised writing
system. This makes the Hebrew orthography extremely ambiguous many words share
the same consonantal patterns but depending on the context many of these words may
have different pronunciations. Thus, the phonemic code is less transparent than in
English and Serbo-Croatian. In order to examine the effect of orthographic depth in
these languages Frost et al (1987) conducted three experiments. In the first
experiment, they compared reaction times for lexical decision and naming of high
frequency words, low frequency words and nonwords in, Hebrew, English and Serbo-
Croatian The results showed that the type of stimulus (high frequency, low
frequency or nonword) affected naming speed in Hebrew more than in English, and in
English more than in Serbo-Croatian. The effect of lexical decision due to the type of
stimulus was observed only in Hebrew.

Chapter 2 48
In the second experiment Frost et al. (1987) examined the effect of semantic
priming in naming. They argued that semantic priming facilitates lexical access,
therefore, given the different orthographic depth of these three languages, semantic
priming should facilitate naming more in Hebrew than in English and More in English
than in Serbo-Croatian. The results supported this hypothesis: a strong semantic
facilitating effect was found in Hebrew, a small but significant effect was found in
English but no facilitation in Serbo-Croatian.
In the third and final experiment, Frost et al. (1987) gave participants from
each language group a list of 160 items which contained both words and nonwords.
They found that non- lexical items (nonwords) affected reading of real words in
Hebrew and English, but not in Serbo-Croatian suggesting that when reading words
and nonwords in transparent orthographies only one strategy is used (translation from
graphemes to phonemes) where in deep orthographies there is a cost in switching
strategies to deal with words and nonwords. The findings from all three experiments
were used as evidence for the OHD, which proposes that in transparent orthographies
phonology is generated directly from print (non- lexical route), whereas in deep
orthographies it is derived from the internal lexicon.
Italian
The Italian orthography has 28 letters, five of which are vowels (a, e, i, o, u).
The orthography is highly transparent: all of the vowels and most of the consonants
correspond to one sound only and vice versa. A few of the consonants may
correspond to more than one sound if followed by certain vowels. For example, letters
`g' + `a' are pronounced as /ga/ where as ̀ g' + `i' are pronounced as /d3 i/. In
addition, when sound /k/ is followed by the vowel sound /u/ it can be spelled in

Chapter 2 49
different ways (e. g., quadro /kuardo/ `picture', cuore /kuore/ `heart', and acqua
/akua/ `water'). Occasionally, the voiceless palatal AS [and the fricative /S/ before the
vowel /e/ may have unpredictable spelling (e. g., celeste AS eleste/ `light blue' and
cielo AS elo/ ̀ sky', scena IS ena/ ̀ scene' and scienza IS entsa/ ̀science). Except these
irregularities the Italian GP and PG correspondences are bi-directionally transparent
(Cossu, 1999). The syllable structure is predominantly open (CV, VCV, CVCV,
CVCVCVC, etc. ) with relatively few variations (Carlson, Elenius, Granstrom &
Hunnicut, 1985, as cited in Cossu, 1999). Although, word stress is placed mainly on
the penultimate syllable, it is not fully predictable. The displacement of word stress
can affect meaning of a word (e. g., fini `aims' andfini `he/she ended up'. Word stress
is not assigned in writing therefore the reader relies upon the context and lexical
knowledge.
Cossu, Gugliotta and Marshall (1995) examined reading and writing abilities
of first and second grade primary school children. All children were individually
tested and were presented with the same list of words and nonwords for both reading
and writing. Each list contained 15 items. They found that for first grade children,
reading accuracy for short words and nonwords was 95.2% and 85.1% correct,
respectively, whereas writing accuracy was 90.6% and 82.1% correct, respectively.
With regards to long words, reading accuracy for words and nonwords was 92.7% and
78.5% correct, respectively, whereas writing accuracy was 55.2% and 44.1% correct,
respectively. This results show that length had a major impact on performance in the
writing but on the reading task. The performance of second grade childrenwas often
close to ceiling, nevertheless, Cossu et al (1995) report that spelling of long nonwords
was significantly different to the spelling of real words (69.5% and 92.7%,

Chapter 2 50
respectively). These findings confirm that in the highly transparent orthography of
Italian a high degree of reading and writing accuracy can be achieved following a
brief period of teaching and that reading and writing development have partially
asynchronous trajectories.
In another study by Thorstad (1991), it was found that Italian children learn to
read in approximately one year, whereas English children take three to five years.
She examined the effect of orthographic regularity on the acquisition of literacy skills
by comparing the reading and spelling of 70 Italian childreA aged 6-11 years, with
that of 90 English children learning to read in the traditional orthography and 33
children, aged 6-7 years, learning to read English with the Initial Teaching Alphabet
(ITA). The English children were taught the letter names and basic vocabulary using
the traditional orthography. In ITA, the existing English alphabet was reduced to 23
letters by excluding k, q, and x and then extended by adding 17 new characters: five
long vowels, six diphthongs and six consonant digraphs (Downing, 1962; Pitman,
1969). ITA was thus designed to be an orthographically transparent script for
English. A difficult passage of 56 words, taken from an Italian journal for adults, was
translated into English to be used as a reading and spelling test. The Italian children
read these materials earlier than the English children learning to read in the traditional
orthography, but not any earlier than the English children learning to read with ITA.
Similarly, the Italian children could spell most of the words that they could read and
some words that they could not read, whereas the English children could read more
words than they could spell. Finally, the English children read quickly and made
many mistakes, whereas the Italian children read more slowly than the English
children and made fewer mistakes. Thorstad concluded that in a transparent
orthography where the spelling sound and sound-spelling correspondences are

Chapter 2 51
predictable and invariant, children can rapidly learn these correspondences and then
use a systematic, phonological strategy to learn to read and spell.
German
Like the English alphabet, the German alphabet has 26 letters. The German
orthography is considered to be more transparent than English (but not as transparent
as Italian, Finnish or Serbo-Croatian). For example, the letter a in the words Ball,
Garten, Hand, and Katze is always pronounced in the same way, /a/, whereas the for
the corresponding English words ball, garden, hand and cat the pronunciation of this
letter differs. In addition to the 26 letters of the alphabet, German orthography
includes umlauts graphemes ä, ö, ü, but these are not reagarded as part of the
alphabet'. The umlaouts graphemes broaden the orthographic vowel presentation,
thus, contribute to the consistency of the orthgoraphy (Wimmer, Lander', & Frith,
1999). For example, they allow the preservation of morpheme identity and mark
morphological vowel changes such as in pluralisation (e. g., Hand, Hände). However,
vowel length representation can be more of an issue in German because several ways
can be used to indicate that a vowel is long (e. g., /a/ can be spelled a, aa, or ah). With
regard to consonants phoneme /S /can be spelled in two different ways sch and s. In
addition, consonant doubling is common-this usually occurs after short vowels (e. g.,
Sommer). These incosistencies do not affect reading as there is enough information
for word recognition but may be a problem when writing as almost all sounds can be
spelled in more than one way.
The development model suggested by Frith (1985) proposes that in the first
stage of reading development children read words as logographs. Wimmer and
Albanian also uses diacritics e and p but these are included in the official alphabet.

Chapter 2 52
Hummer (1990) examined reading and spelling strategies of German-speaking
children in relation to this developmental model. They administered reading and
spelling tasks to delayed and normally processing first grade children. They found
that both normally developing and delayed Austrian children (who learn to read in
German) seem to assemble pronunciation from grapheme-phoneme correspondences
from the very beginning of reading. More specifically, they found that (a) most
children could read and, to a lesser extent, spell most of the word and nonword items;
(b) nonword reading and nonword spelling highly correlated with real word reading
and real word spelling scores; (c) reading errors consisted mainly of the nonwords
beginning with the initial letters of the target word items whereas most of the spelling
errors were partially phonetically correct; (d) reading scores depended on word
exposure time; and (e) both reading and spelling were strongly predicted by the
knowledge of GP correspondences. These findings strongly suggest that the
importance of the logographic strategy is limited in orthographies where the GP
correspondences are highly transparent. In terms of Ehri's model, beginning readers
in the shallow orthography of German completely skip the pre-alphabetic phase,
spend little time in the partial alphabetic phase, and quickly move on to the full
alphabetic phase. Such cross- linguistic research suggests that stage models of reading
need modification to deal with reading development in shallow orthographies.
Wimmer and Goswami (1994) suggest that initial differences in reading
strategy are determined by the nature of the orthography. They gave groups of 7-, 8-,
and 9-year-old German and English children a numeral reading task, a number
reading task, and a nonsense word reading task. They found that, for both
orthographies, the reading time and error rates in numeral and number word reading
were similar, whereas for the nonsense reading task, even the youngest German

Chapter 2 53
children (7 year olds) made significantly less errors than the older English children (9-
year-olds). English children read more accurately and were faster at reading nonsense
words with a familiar rime than nonsense words with an unfamiliar rime. Wimmer
and Goswami (1994) suggested that at the beginning of the reading process, English
children use this larger- grain phonological access strategy based on onset/rime,
whereas German-speaking children begin learning to read by using the finer- grained
grapheme-phoneme conversions. Austrian children begin to use the onset/rime
strategy later on. Recent support for the strategy used in beginning reading comes
from Landerl (2000) who examined English-speaking children being taught
exclusively via a phonics approach. She found that these children were much better at
reading non-words than the children in the Wimmer and Goswami's study who were
not taught via a phonics approach. A second finding from Landerl's study, similar to
that of Wimmer and Goswami, was that found that German-speaking children had
substantially higher scores for pseudoword reading tasks than English children,
suggesting that German-speaking children can learn to read faster than English-
speaking children..
Turkish
Turkish is an extreme case of a transparent orthography. The orthography has
29 Roman letters (8 vowels and 21 consonants) where each letter in the alphabet
directly corresponds to a single phoneme and each phoneme is represented by a single
letter. Turkish, like Albanian, is characterised by total bi-directional transparency in
reading and spelling. There are no silent letters in Turkish and word stress is always
assigned on the penultimate syllable of multisyllabic words. A further unusual
linguistic property of Turkish is its agglutinative morphology. In Turkish there are
many multisyllabic words composed of linear sequences of morphemes. For example,

Chapter 2 54
from the word kal `stay', typical derivations due to changes in tense and person would
be kal-mi yor ` he/she is not staying', and kal-mi-yor-lar `they are not staying' (Ilhan
& Brendan, 2005). Thus Turkish orthography is also predictable at the morpheme
level with clearly defined syllable boundaries. Turkish words are constructed using a
simple set of seven syllable types (V, CV, VC, CVC, VCC, CCVC and CVCC).
. Öney and Goldman (1984), investigated decoding and comprehension skills of
Turkish and American (English speaking) first and third grade children. Both groups
of children were asked to read the same list of 84 pseudowords pronounceable in both
languages2. For the comprehension task children in each language group had to
answer. questions on two paragraphs of text in their respective language. They found
that Turkish children were faster and more accurate on the pseudoword decoding task
than the American children at the first grade level and faster but equally accurate at
the third-grade level. In a second study, Öney and Durguno glu (1997) investigated
the early literacy acquisition of first grade children learning to read in Turkish at the
beginning, middle, and end of the school year. Among other tests children were
administered two word recognition tests, one consisting of 20 real word and the other
of 20 pseudowords, and two spelling tests, one consisting of 8 real word and the other
of 8 pseudowords. They found that by the end of the school year these children
reached ceiling levels for both word recognition (93% correct) and spelling test (93%
correct).
Welsh
As already discussed in detail in Chapter 1, the Welsh orthography is highly
transparent. Spencer and Hanley (2003) compared children who were educated in
Wales but were wither taught to read in Welsh or read in English. Children of each

Chapter 2 55
language were asked to read a list of single words. The Welsh-and English single
word reading tasks included 30 one-syllable highly familiar real words-these were
given in a random order. Half of the English words were regular and half were
irregular. The English words were between two and five letters long, and had at least
45 appearances per million (Kucera & Francis, 1982). The Welsh words contained
significantly more phonemes and syllables than the English words (3.87 versus 2.93
and 1.20 versus 1.03 respectively). Spencer and Hanley found that children learning
to read in Welsh performed significantly better at reading both real words and
nonwords than matched children learning to read in English. Hanley, Masterson,
Spencer and Evans (2004) re-examined reading abilities of English and Welsh
children (Spencer & Hanley, 2003) who had been in formal schooling for six years.
They found that, when reading regular words, most of the English children had caught
up with children learning to read Welsh; thus, an advantage of learning to read in a
transparent orthography becomes absent for 10-year-olds.
In another study by Ellis and Hooper (2001), using word-lists matched for
written frequency as reading tests they determined that (i) Welsh children were able to
read aloud accurately significantly more of their language (61% of tokens, 1821
types) than were English children (52% tokens, 716 types); (ii) the reading latencies
for Welsh children were longer than for English children; (iii) the error patterns
differed, with English children producing more visually similar real word
substitutions, whereas Welsh children produced more non-word type
mispronunciations; and (iv) reading latency was a clear function of word length in
Welsh but not in English. These findings suggest that the transparency of the
orthography has an effect on reading development. Furthermore, longer reading
2 These were generated by changing the initial consonants of syllables.
Chapter 2 56
latencies and the higher rate of nonword errors indicate that Welsh children read by a
grapheme-phoneme synthetic strategy. Significantly shorter latencies together with a
higher proportion of real word replacement errors indicate that English children rely
on lexical retrieval on the basis of partial visual analysis of the written words.
Finnish
Like Albanian, the Finnish orthography is extremely transparent: each letter
represents one phoneme and is pronounced consistently in the same way. The
alphabet consists of 21 letters (13 consonants and 8 vowels; Kyöstiö 1980; Müller,
Brady, 2001). Each phoneme can be either short or long and this is marked in writing
by one versus two letters and the duration of a phoneme affects the meaning of the
word (e. g., tuli `fire', tuuli `wind', and tulli `customs').
Standard Finnish syllables, with the exception to a few words borrowed from
other languages (e. g., traktori `tractor'), do not have cluster onsets, but can end with
two-consonant clusters. Syllables can be open, closed or they can consist of a single
vowel. The syllable types of the Finnish language are: V, VV, VC, CV, VVC, CVV,
CVC, VCC, CVCC, CVVC. Finnish is an agglutinating language where only about
50 words are monosyllabic and word stress always occurs on the first syllable.
Given the extreme transparency of the Finnish orthography once children learn
how to decode, they are able to read virtually any word or nonword equally well (e. g.,
Holopainen, Ahonen, Tolvanen, & Lyytinen, 2000). Cross-linguistic research fully
support this suggestion. Aro and Wimmer (2003), compared reading performance of
Finnish children in years 1-4 with reading performance of German-, Dutch-,
Swedish-, French-, Spanish-, and English-speaking children at the same grade levels.
Participants from each language group were presented with three different tasks:
pseudoword reading, numeral reading, and number word reading. Aro and Wimmer

Chapter 2 57
found that within each year-group Finnish children outperformed English children in
the nonword reading task
Instead of absolute time scores for nonword reading, a reading time ratio was
used to control for language and developmental differences in the speed with which
children performed on the numeral reading task. Data from numeral reading task was
used to create a new score to represent reading speed--pseudoword reading time was
divided by numeral reading time. Aro and Wimmer argue that this method cross-
language control is important as, due to the long number words, the Finnish children
showed slower numeral reading speed in comparison to the children of the other
languages (e. g, for each school year mean reading times per numeral were: English
children 0.69,0.61,0.52, and 0.45 seconds; Finnish children, 1.08,0.80,0.78, and
0.68 seconds). They found that reading fluency scores were the highest for the Finish
group and lowest for the English group (Finnish years 1-4,2.55,1.87,1.80,1.69
seconds; English years 1-4,4.60,3.00,3.58,2.29 seconds).
A similar reading time ratio was created using number word reading. Once
again Finish children were much faster than the English children (Finnish years 1-4,
1.55,0.86,0.85,0.90; English years 1-4,2.12 , 1.11 , 1.64,1.01 seconds). In fact, it
was found that in comparison to the other languages examined in this study English
children had the lowest scores for every year group. Aro and Wimmer concluded that
with the exception of English, the translation of new letter strings into correct
pronunciations is easily acquired in all alphabetic orthographies involved in this
study.
The most ambitious cross-linguistic study or reading development has been
conducted by the European Concerted Action on Learning Disorders as a Barrier to
Human Development (Seymour, Aro, & Erskine, 2003). Seymour et al, investigated

Chapter 2 58
early reading acquisition through assessment of letter knowledge, familiar word
reading, and simple nonword reading by measuring accuracy, speed, and error types
in 13 different orthographies including Finnish and English. Children read 18
familiar high frequency content words and 18 function words in their language. The
results revealed that children who were learning to read in orthographically consistent
languages (Finnish, Greek, German, Italian, Spanish) were close to ceiling in word
reading by the middle of first grade. French (79% correct), Portuguese (73% correct),
and Danish (71% correct) children showed lower levels of recoding accuracy; this is
in line with the reduced transparency of these languages. The rate of reading
development in English was more than twice as slow (34% correct) as in more
orthographically transparent orthographies. Seymour et al., (2003) argue that syllabic
complexity and orthographic depth are responsible for the cross-language differences.
Conclusions
The developmental models of literacy development capture the way children
learn to read English, an orthographically opaque script, but they do not do full justice
to children learning to read transparent languages (Wimmer & Hummer, 1990;
Wimmer & Goswami, 1994). Even the dual route model of reading (Coltheart, 1982;
Feldman, Kostic, Lukatela, & Turvey, 1983; and Feldman & Turvey, 1983),
developed as an account for English language processing, may not fully apply to
beginning readers of highly transparent orthographies. The ODH suggests that
reading development depends on the consistency of the orthography (Frost, Kats &
Bentin, 1987; Lukatela, Carello, Shankweiler & Liberman, 1995). Furthermore,
Goswami, Gombert and De Barrera (1998) and Ellis and Hooper (2001), have
suggested that writing system differences between languages may affect (i) the rate of
reading acquisition, (ii) young children's awareness of the structure of their spoken
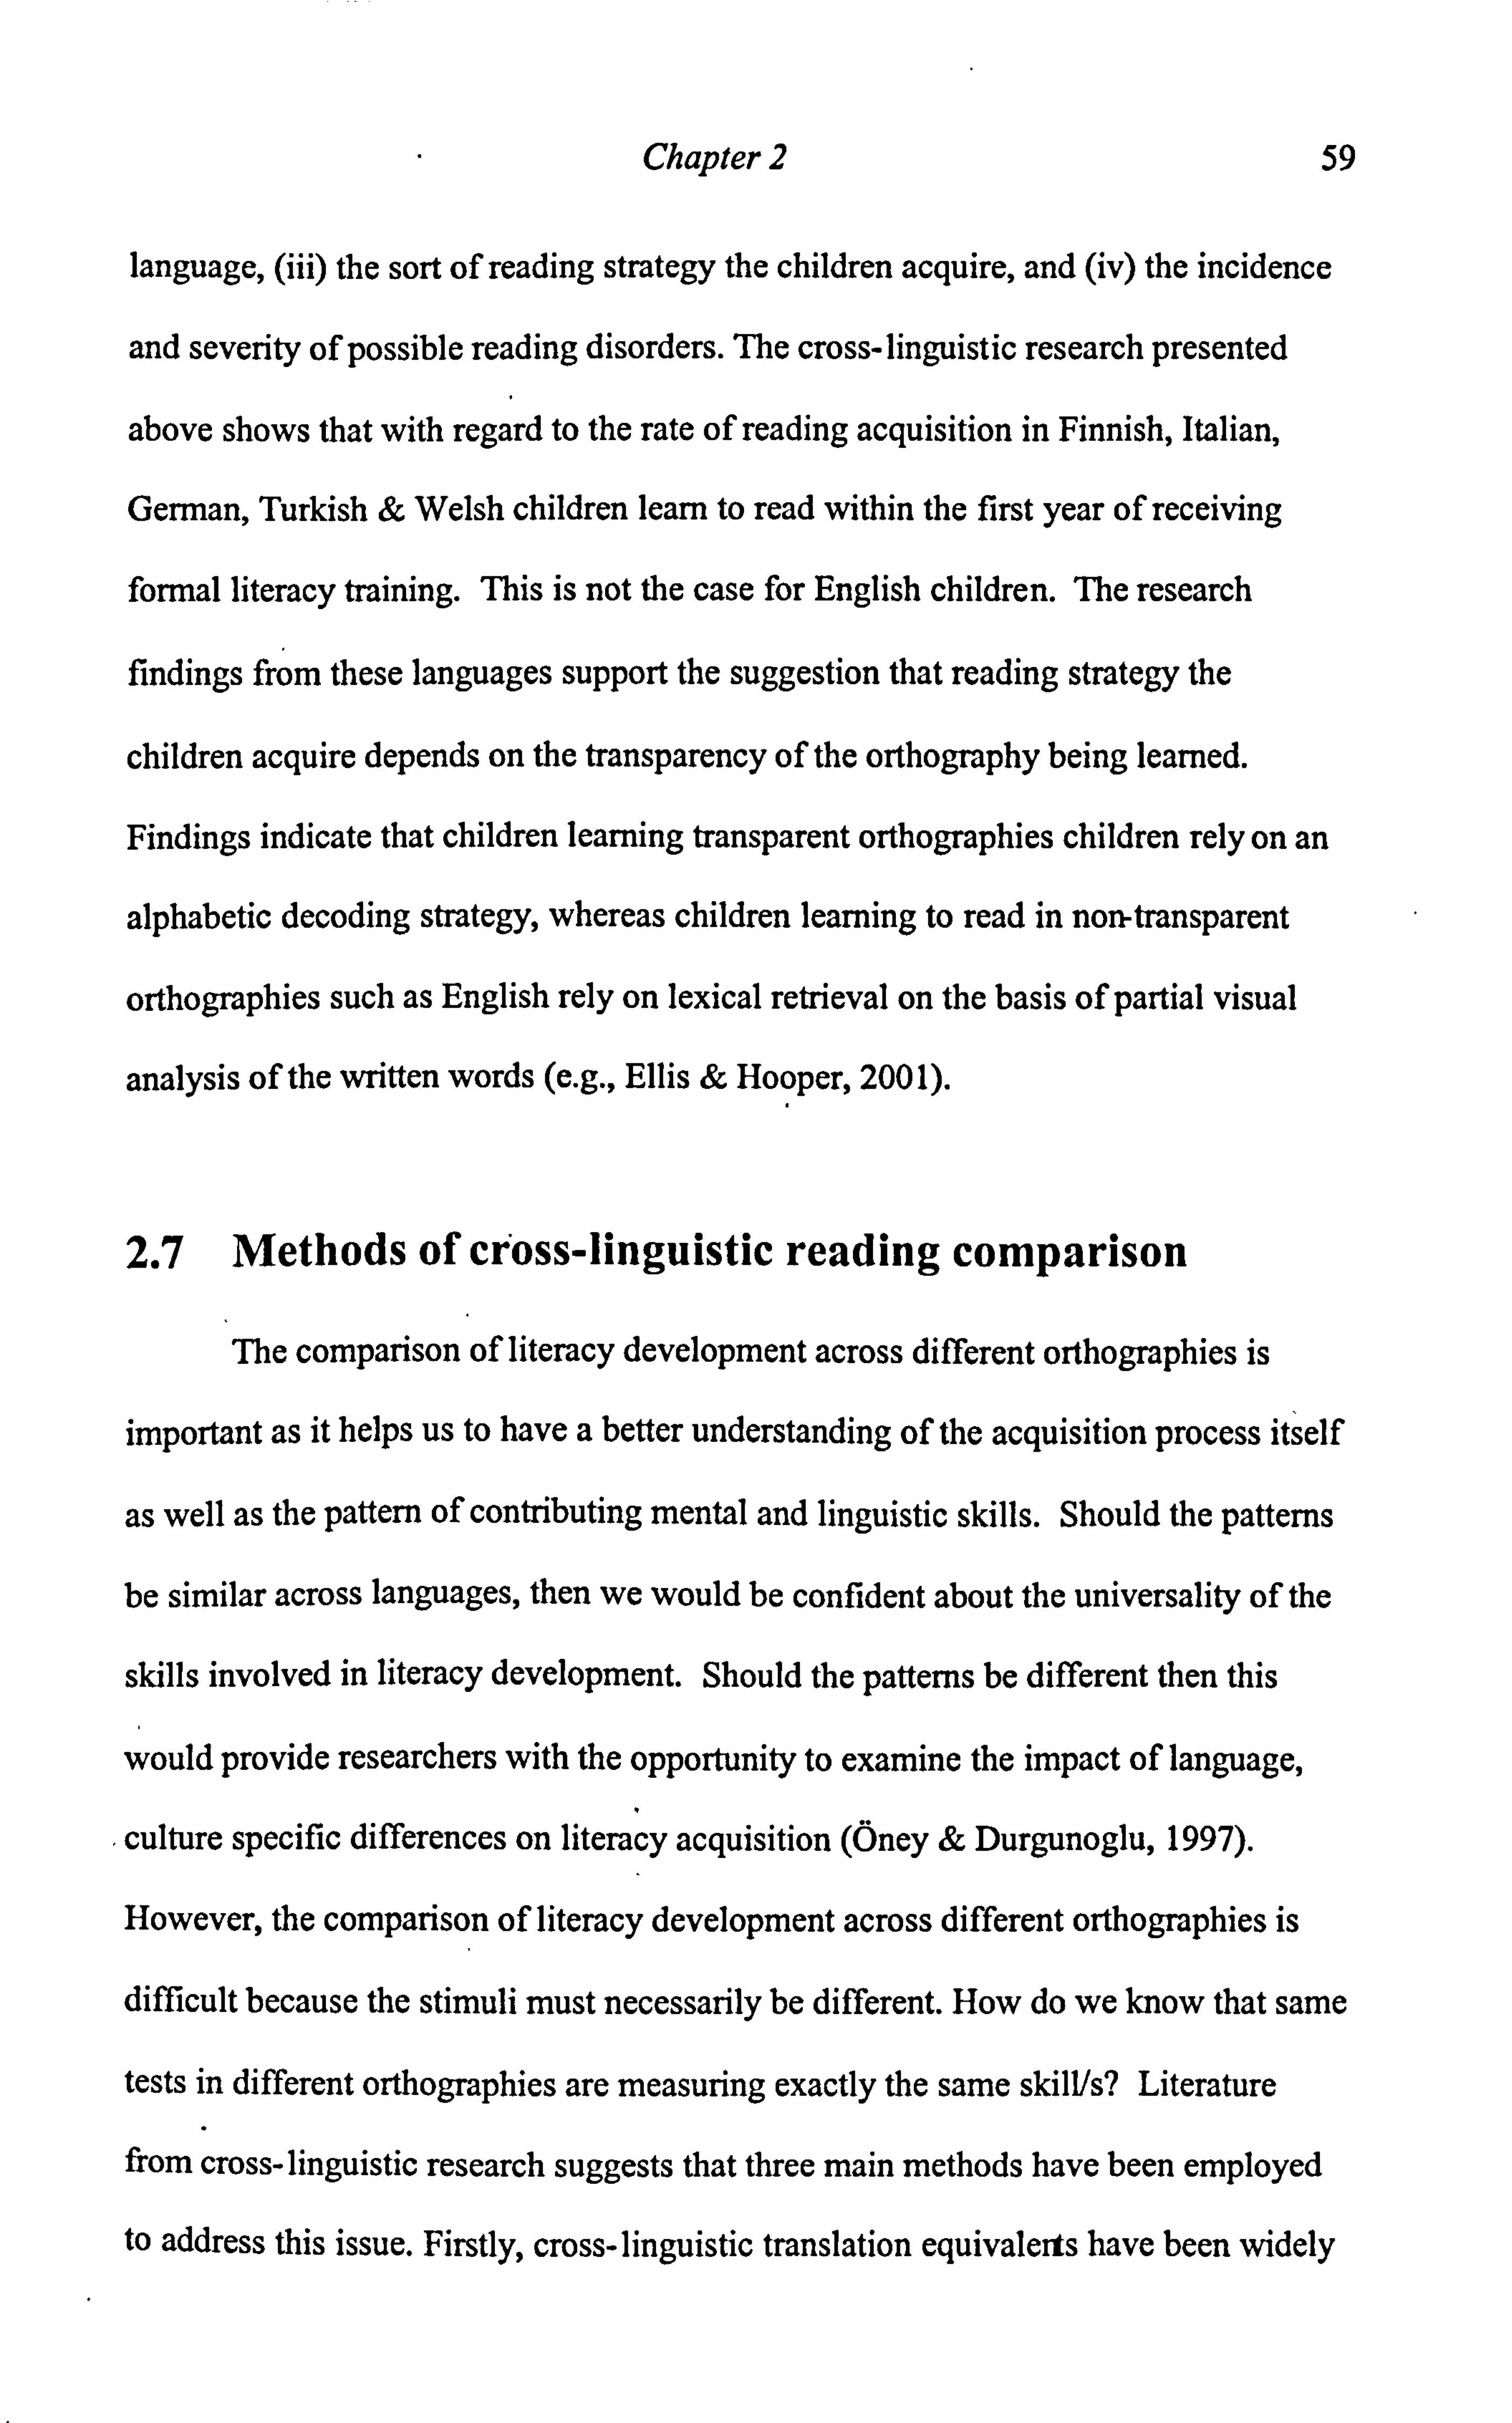
Chapter 2 59
language, (iii) the sort of reading strategy the children acquire, and (iv) the incidence
and severity of possible reading disorders. The cross-linguistic research presented
above shows that with regard to the rate of reading acquisition in Finnish, Italian,
German, Turkish & Welsh children learn to read within the first year of receiving
formal literacy training. This is not the case for English children. The research
findings from these languages support the suggestion that reading strategy the
children acquire depends on the transparency of the orthography being learned.
Findings indicate that children learning transparent orthographies children rely on an
alphabetic decoding strategy, whereas children learning to read in non-transparent
orthographies such as English rely on lexical retrieval on the basis of partial visual
analysis of the written words (e. g., Ellis & Hooper, 2001).
2.7 Methods of cross-linguistic reading comparison
The comparison of literacy development across different orthographies is
important as it helps us to have a better understanding of the acquisition process itself
as well as the pattern of contributing mental and linguistic skills. Should the patterns
be similar across languages, then we would be confident about the universality of the
skills involved in literacy development. Should the patterns be different then this
would provide researchers with the opportunity to examine the impact of language,
culture specific differences on literacy acquisition (Öney & Durgunoglu, 1997).
However, the comparison of literacy development across different orthographies is
difficult because the stimuli must necessarily be different. How do we know that same
tests in different orthographies are measuring exactly the same skill/s? Literature
from cross- linguistic research suggests that three main methods have been employed
to address this issue. Firstly, cross- linguistic translation equivalerts have been widely

Chapter 2 60
used in comparing reading in different languages. Frith et al. (1998) examined
nonword reading in 7-, 8-, and 9-year-old English and German children. The
advantage in using translated items in these two languages is that they have similar
phonology and orthography. For example, the words `park' and `hand' exist in both
languages. However, these two languages are that opposite ends of the transparency
spectrum-German is highly transparent and English is not. Frith et al. found that
German children's of nonword reading scores were close to ceiling after only 1 year
of formal reading instruction whereas the English children did not achieve similar
levels until they had experienced 3 years of formal instruction. Similarly, Thorstad
(1991) translated into English a difficult passage of 56 words, which was taken from
an Italian journal for adults-this was used as a reading and spelling test.
A problem with these comparisons across languages is that it is difficult to
control for educational, social and cultural differences. There are differences in
educational curricula, teaching methods, and demographic patterns. Spencer and
Hanley (2003) addressed this issue by comparing children who were educated in
Wales but were wither taught to read in Welsh or read in English. Children of each
language were asked to read a list of single words. The Welsh word items for the
single word reading tasks were translations from the English word reading tasks.
Spencer and Hanley argue that is extremely important because the words are matched
in familiarity. Given the geographical proximity, as, well as cultural, educational,
socio-economic, similarities between England and Wales, matching for familiarity is
very likely to be reliable. However, translated items are not always equivalent in
either the relative frequencies of words or symbols or their range of usage in the
respective languages. This is more of a problem for languages that do not share the
Welsh/English similarities mentioned above.

Chapter 2 61
Secondly, nonwords can be used to compare children learning to read across
languages. Wimmer and Goswami (1994) derived nonwords from number words
(e. g., vechs and zieben from sechs and sieben for German; tix and feven from six and
seven for English). They found that German speaking children read more of these
nonwords than English speaking children. This method provides an index of
children's decoding abilities for novel material; however, nonwords themselves may
not be good indicators of skill at reading real words.
Thirdly, sampling high frequency3 words from children's school reading
schemes has been widely employed in literacy research. Goswami et al. (1998), for
example, compared English, French, and Spanish 7-, 8-, and 9-year-old children
matched for standardized reading age. They found that Spanish children were able to
read more items from a task of 8 monosyllabic and 8 disyllabic words than were
English or French children. Seymour, Aro and Erskine (2003), also mentioned earlier,
examined reading skill of children during their first year of education from 14
European countries. Children read 18 familiar high frequency content words and 18
function words in their language. The words were sampled from the reading material
3 Morton (1969), suggested that word frequency affects the process of word identification. He
designed a logogen model where the logogens represented the recognition units for individual words;
these gathered information on the occurrences of the words from the relevant context and physical
stimulus. Each time a logogen's threshold is reached, the threshold is slightly lowered; thus, logogens
with high frequency words have a lower threshold than logogens for words with lower frequency. As a
result less sensory resources are required to identify high frequency words. Effects of word frequency
have been reported for: word naming (Preston, 1935); lexical decision task (Rubenstein, Garfield &
Millikan, 1970; Rubenstein, Lewis & Rubenstein, 1971; and Forster & Chambers (1973); duration of
eye fixation while reading text (Just & Carpenter, 1980; Rayner & Duffy, 1986); and on the speed of
accessing words' meanings (Monsell, Doyle & Haggard, 1989; Landauer, Ross & Didner, 1979).

Chapter 2 62
used in the early stage of primary schooling in each language. They found that
children from a majority of the European countries became fluent and accurate before
the end of the first school year. These findings were not present for children learning
to read in French, Portuguese, Danish, and particularly in English. The problem with
this method is that although the sampling of test items from typical school textbooks
is a reasonable start at controlling exposure factors, textbook writers tune their books
to their audience and to the difficulty of the task which their readers are faced with, so
there is no guarantee that a reading text in one language is equivalent for comparable
children in another language.
To conclude, all three methods mentioned above have their advantages as well
as their limitations. This shows that comparing reading development across
languages is not straightforward. One may suggest that comparison of performance on
standardized reading tests in different languages can also be employed but this is
unlikely to give satisfactory outcomes as the standardizations of test items are made
with reference to large samples of readers of one language only. A new approach has
been employed by Ellis & Hooper (2001). They suggest that reading tests must be
constructed so that the items are equally representative across languages, and that
children of the same age should have an equal opportunity to experience the parallel
reading items. According to the sampling theory, representative samples must be
randomly selected. The accuracy of these samples can be further increased by
stratifying on important potential independent variables. Given that word frequency is
directly related to reading experience, reading tests should be constructed as random
selections of each language's lexis. These lexis should be stratified by frequency, and
then pairs of items can be selected in the two languages concerned. The matching
process itself, must not control for any other factors, such as word length,

Chapter 2 63
imageability, morphological complexity, syntactic role, semantic richness,
orthographic complexity, sound-symbol consistency, or any other intrinsic aspect of
the languages under study or their learnability. Thus, any factors related to language
should be freed to vary, whereas everything related to learning opportunity should be
matched.
The rationale for these tests is based on input-driven perspectives of language
acquisition. Kempe and MacWhinney (1996), who examined cross-linguistic
vocabulary knowledge, were first to use this principle in the construction of matched
lexical decision tests based on log frequency stratified samples from frequency counts
of German and Russian. The learnability of an item is largely dependent upon the
amount of experience a learner has with it and with similar items. Thus, if children of
two different languages start learning to read at the same time, have roughly
equivalent time-on-task, and the two orthographies are equally difficult to learn,
normally developing children of similar experience should be able to read words at
roughly similar levels of frequency.
In Ellis and Hooper (2001) study, word types that composed a representative
corpus of a million written words of Welsh (Ellis, O'Dochartaigh, Hicks, Morgan &
Laporte, 2001) and English (Baayen, Piepenbrock & Van Rijn, 1995) were sorted in
decreasing frequency of occurrence and sampled so that a test word was selected at
every decreasing step of 10,000 word tokens or its nearest approximation. A list of
100 words, one for each language, was then used as frequency- matched sample of
written English and Welsh. Ellis et al. (2004) argue that there are several advantages
to this method. Firstly, reading tests obtained this way are matched in a principled
fashion for input frequency. Secondly, because it generates a broad range of
frequencies of items, from approximately 60,000 words per million to just 1 per

Chapter 2 64
million, it can discriminate for learners at different stages of proficiency. Finally, this
method is psychophysically scaled. Psycholinguistic experimentation shows that there
is more of a linear relationship between proficiency and log exposure than between
proficiency and exposure (Zipf, 1965). The word sampling method'used by Ellis and
Hooper was successful in providing items representing log frequency strata. Hence,
this sampling procedure guarantees that the test words used in each language are
highly representative of that language.
The main concern here is that word frequencies will vary according to the type
of written material they are based upon. Thus, if word frequencies for one language
are based on scientific books and on classic literature for a second language, then the
word items selected using the above method will be unrepresentative of the languages
concerned and probably resulting in false paired tests items. With regard to
investigating cross-linguistic literacy development, given their advantages and
limitations, it is important to highlight that there is a role for all types of methods
mentioned above. This thesis attempts to examine how much of their own language
can children of English, Welsh and Albanian read, therefore, it takes the alternative
approach to the issue of whether it is easier to learn to read in one language than
another. In order to address this issue parallel reading tests for which the items were
matched for word frequency were developed for the three languages concerned-
Albanian, English and Welsh. It is clear that this method serves a different purpose to
a factorially controlled experiment. This different purpose is the point. It is what
allows a true comparison of two or more scripts, rather than the investigation of
matched fragments of two or more languages which are themselves almost certainly
not representative of those two languages.

Chapter 2
2.8 Final summary
This chapter reviews various models of literacy development. Many of the
65
traditional stage models of reading and spelling development outline various distinct
stages, through which children progress. These models have proved difficult to apply
universally because literacy development depend on various factors such as the type
of script, structure of the spoken language, teaching methods, learning disabilities,
SES, etc. One of the factors of main interest is orthographic depth. Research from
transparent orthographies like Serbo-Croatian, Italian, and Finnish has shown that
children learning to read in such languages do so faster than children learning to read
in deep orthographies like English and Danish. In order to increase the external
validity of previous cross- linguistic research as we to further examine the universality
features of literacy development further evidence is required. Therefore, the primary
aim of the current research is to introduce a new language to the current cross-
linguistic field. Albanian like Serbo-Croatian and Finnish has an extremely
transparent orthography. First, almost 80 % of reading research comes from Angld-
Saxon countries (Davis, 2005), therefore it would be beneficial to see whether
findings from ongoing research in transparent orthographies can be generalised for
Albanian. Secondly, as findings from research of this kind in Albanian have not been
reported, policy makers and education professionals are missing out knowledge and
information that can prove vital in identifying best practices and strategies in primary
education. The final aim of this thesis was to examine how much of their own
language can be read by English, Welsh and Albanian children thus allowing a direct
examination of the effect of orthographic depth on literacy development.

Chapter 3
Chapter 3: The contribution of phonological and
orthographic skills to reading and spelling
development
3.1 Introduction
Various cognitive and linguistic skills can affect reading and spelling
66
acquisition. However, it is the contribution of phonological and orthographic skills to
literacy development that has received a large amount of attention as these are thought
to be the most important skills for successful learning of reading and spelling.
3.2 Phonological skills
Broadly speaking, phonological skills (or abilities) refer to the sensitivity to
the basic sound elements of the spoken word, and the ability to make use of these
elements (Mann & Ditunno, 1990; Wagner & Torgesen, 1987).
Implicit phonological (epi-linguistic) awareness appears to arise
spontaneously and is necessary for the later development of explicit awareness but
does not normally seem to be sufficient to determine the course of learning to read.
Implicit phonological awareness corresponds to the awareness of syllables, onsets and
rimes (Gombert, 1992). Explicit phonological (meta- linguistic) awareness only
develops in response to some external demand and appears to be related to learning to
read (Gombert, 1992). Explicit awareness requires the identification and production
of phonemic segments (see Figure 2.1 in Chapter 2).

Chapter 3 67
Researchers have devised various tasks to measure implicit and explicit
phonological awareness. In a tapping task children are given a wooden dowel and are
asked to tap out the number of sounds or syllables in words: this can be used to
measure the development of phonological awareness at the syllable and phoneme
level (Liberman, Shankweiler, Fischer, & Carter, 1974). Another implicit
phonological task is the oddity task: it aims to measure the awareness of onset and
rimes (Bradley & Bryant, 1983). During this task, children are presented with a set of
spoken works and are required to identify the `odd' word out (e. g. `bus', `bun', `rug').
Trieman and Zukowski (1991) employed a same/dJ erent judgement task, which was
used to measure the development of phonological awareness at syllable, onset-rime
and phoneme level. Here children were presented with pairs of spoken words and
asked to judge whether they share a sound/syllable/onset-rime or not (e. g. `broom',
`brand'). There are several tasks that measure explicit phonological awareness (at the
phoneme level). For example, in a blending task children are required to form a word
from isolated sounds, whereas in a segmenting task children are required to break
down whole words into single sounds (Fox & Routh, 1976,1984). Another effective
task that measure phoneme awareness is the phoneme deletion task (Bruce, 1964).
Participants are asked to delete an initial, medial or final phoneme of a given word
(e. g. `fan' without /f/, remains as /an/).
3.2.1 The development of phonological awareness
Lexical restructuring theory proposes that during the normal course of
language development, phonological representation of spoken words is re-represented
several times (Fowler, 1991; Metsala & Walley, 1998; Walley, 1993). Initially, when
the vocabulary size is small, the representations are thought to be holistic, but as
vocabulary size increases, holistic representations are gradually restructured into

Chapter 3 68
smaller segments such as syllables, and ultimately phonemes. The phoneme
representation is not an integral part of speech processing, hence its representation in
early infancy is not necessary, and it emerges as a representational unit via increasing
experience of spoken language (Eimas, Siqueland, Jusczyk, & Vigorito, 1971). The
main development period for this restructuring is thought to be in middle childhood
when the size of spoken vocabulary increases exponentially (Metsala & Walley,
1998)
Many studies have shown that the development of phonological awareness .
progresses from the syllable level via the onset and rime level to the phoneme level
(Treiman, 1987; Goswami & Bryant, 1990). Goswami and Bryant have suggested that
the syllable awareness arises at the age of 3 years, whereas an awareness of onset and
rimes emerges at the of 4-5 years. Liberman et al. (1974) devised and employed a
tapping task to measure the development of phonological awareness. They presented
4 to 6-year-old English children with words that had either one syllable or phoneme
(e. g., `dog' and `I'), two syllables or phonemes (e. g., `dinner' and `my'), and three
syllables or phonemes. They asked these children to tap once for each syllable or
phoneme in the words, and used a criterion of 6 consecutive correct responses as
evidence of segmentation ability. Liberman et al. (1974) found that 46% of the
youngest children could segment words into syllables, but none of the children could
reach the criterion for the phoneme tasks. Five year olds performed slightly better,
48% and 17% respectively. Six year old children showed the highest level of success
for both segmentation tasks with 90% of them reaching the criterion for syllables and
70% reaching the criterion for phonemes.
Studies in other languages like Italian, German and Czech show similar results:
syllabic and onset/rime awareness appear to be present at a young age before reading

Chapter 3 69
is taught (Cossu, Shankweiler, Liberman, Katz & Tola, 1988; Wimmer, Landed &
Schneider, 1994; Caravolas & Bruck, 1993). Cossu et al. (1988) were able to replicate
the Liberman et al. study with Italian speaking children. They found that 67% of the
4-year-old children reached the criterion at the syllable level, and only 13% for the
phoneme level. For the 5-year-old the figures were 80% and 27%, whereas for a
school-age sample the figures were 100% and 97% respectively.
3.2.2 Phonological awareness and literacy development
The main argument for the lexical restructuring theory is based on the
emergence of phonemic representations as a result of spoken vocabulary growth.
However, from the perspective of literacy acquisition, it seems more likely that
phonological awareness at the phoneme level is acquired and developed through
explicit literacy instruction and experience. Studies from Liberman et al. (1974) and
Cossu et al. (1988), presented earlier, indicate that fine grained phonological
awareness may be a consequence of literacy instruction. However, the lack of a
control group, in this case a group of illiterate children, makes these findings
suggestive but not convincing. A better picture of the effect of literacy on
phonological awareness has emerged from two research areas: alphabetic versus non-
alphabetic literates and literate versus illiterate adults.
Firstly, the standard Chinese orthography (for Mandarin and Cantonese) is
logographic. However, there is also an alphabetic script which is taught in China-
Hanyu Pinyin. In a study by Read, Zhang, Nie, and Ding (1986) two groups of
participants were compared: one that could read the standard logographic script and
one who could read both logographic and Hanyu Pinyin. The group who could read
only the logograms performed poorly on the phonemic awareness tasks, while the
group who could read both scripts preformed very vml1 on the same tasks. Similarly,

Chapter 3
Huang and Hanley (1997) found that phonological awareness skills of Chinese-
speaking children improved considerably after the children had learnt to read in an
alphabetic script.
Secondly, Morais, Cary, Alegria and Bertelson (1979) examined phonemic
awareness with illiterate adults participants and found that these adults could not
delete or add phonemes to nonwords. More recently, Mann and Wimmer (2002)
70
compared German and American children on a phoneme identity judgement and on a
phoneme deletion task. Young German children who lacked literacy exposure were
outperformed by the American English-speaking children, whereas first and second
graders performed as well as their American counterparts. These findings in pre-
literate children suggest that lexical restructuring largely take the form of
phonological representations that correspond to syllables, onsets and rimes. Thus, this
restructuring is implicit, involving epi-linguistic representation (Gombert, 1992).
Explicit restructuring involving meta- linguistic representation occurs following
literacy exposure.
However, Stanovich (1986) suggests that the relationship between
phonological awareness and reading is not unidirectional but reciprocal in nature-
early reading is dependent on having some understanding of the internal structure of
words, and explicit instruction in phonological awareness skills is very effective in
promoting early reading. Liberman (1985) proposed that there is a relationship
between phonological development and learning to read. Lundberg, Frost, and
Petersen (1988) suggest that children who are good at phonemic segmentation skills
had an advantage in learning to read and spell. Maclean, Bryant and Bradley (1987)
found that knowledge of nursery rhymes at the age of 3, highly predicts later reading

Chapter 3 71
and spelling ability. Indeed, many researchers have proposed that learning to read
enhances phonemic awareness (Bryant & Goswami, 1987; Morais, Alegria & Content,
1987), and that training in phonological skills prior to formal reading instruction has
positive effect on early reading acquisition (Bradley & Bryant, 1985; Brady, Fowler,
Stone & Windbury, 1994; Byrne & Fielding Barnsley, 1993,1995).
3.2.3 Phonological awareness in different orthographies
The present literature indicates that phonological awareness develops
sequentially from large to small units (from syllable to onset/rime and finally to
phoneme awareness) and that literacy instruction affects phonological awareness.
Nevertheless, the transparency of the orthography that children learn to read and spell
can have a profound effect on the early development of phonological awareness.
From the lexical restructuring theory point of view the consistency of the feedback
from reading and spelling plays a very important role in the speed of restructuring. In
deep orthographies, children might take longer to restructure their phonological
representation even for words with dense phonological neighbourhoods where
phonological similarity should heavily pressure toward phoneme-level restructuring
(Goswami, 2000). Children who are learning to read and spell in transparent
orthographies like Finnish, Albanian, Serbo-Croatian, where feedforward (spelling-to-
sound) and feedbackward (sound-to-spelling) consistency is high, might acquire
phoneme-level representations much faster than children who are learning to read in
deep orthographies.
Caravolas and Bruck (1993) tested 101 English-speaking (Canadian) and 100
Czech first grade children in a range of phoneme awareness tasks. Children in each
1 Please note that these illiterate participants are adults who had never been exposed to literacy instruction, as opposed to adult participants who failed in acquiring literacy skills.

Chapter 3 72
language group were given three tasks using nonwords: a same/different judgment
task using consonant clusters onsets, an initial phoneme isolation and a phoneme
deletion task requiring children to delete the initial phoneme of a nonword. In the
first task, both language groups performed at a similar level-91% correct. However,
in the second and third tasks Czech children (98% and 86% correct) performed better
than Canadian children (89% and 39% correct). Durgunoglu and'Öney (1999)
compared Turkish and American English-speaking children. Three tasks were used to
assess phoneme awareness: a phoneme tapping task, an initial phoneme deletion, and
a final phoneme deletion task (For the phoneme deletion tasks CVC nonwords were
used. ). Turkish children's scores for all three tasks were significantly higher that
scores of American children. These studies clearly suggest that phonemic awareness
emerges more quickly in learning to read in transparent orthographies.
According to the onset and rime principle (Goswami, 1986; Goswami &
Bryant, 1990) even the very beginning English readers can read new words by
analogy. These analogies are based on the graphemic clusters that correspond to
onset and rime sub-syllabic units. Through experience of reading they become aware
of the phonemic basis of an alphabetic script and this allows them to begin to segment
words. For example, if children are taught beak, they can apply the sound of the rime
eak when reading a new word such peak. Goswami and Mead (1992) found than
children's use of onset and rime analogies correlated with their awareness of rhyme.
The onset and part of the rime analogies were more strongly related to their awareness
of phonemes. Decoding larger `chunks' reduces memory load involved in
phonological units which have to be assembled in pronouncing whole words. When
taking into account the greater orthographic regularity of English at the rime level,

Chapter 3
teaching larger units may prove more efficient in learning to read2 (Treiman,
Mullennix, Bijeljac-Babic & Richmond-Welty, 1995).
Therefore, explicit awareness of phonemes may be irrelevant to the acquisition of
73
literacy skills for English-speaking children3 (Goswami and Bryant, 1990; *Cossu and
Marshall, 1990).
Further evidence for the predictive relations between onset/rime awareness
and reading acquisition for English comes from Bradley and Bryant (1983), who in a
longitudinal study used one alliteration and two oddity tasks to investigate the
relationship between phonological awareness and the acquisition of literacy skills. In
this study they followed the progress of almost 400 children from the age of 4 years
old. They found that that there was a strong relationship between children's
sensitivity to rhyme and alliteration when they begin school and their progress in
learning to read and spell over the following three years, even when the effects of
2 This contradicts the hypothesis put forward by Marsh et. al. (1981) and Frith (1985), that
proposes that analogies can only be used at the final stage of learning to read. Indeed, Stuart and
Coltheart (1998) suggest that it is incorrect to assume that the first stage of reading development
involves non-phonological procedures (such as logographic processing) and that phonological skills
play a vital role with the phonologically adept children.
3 In contrast, Morais, Mousty and Kolinsky (1998), argue that awareness at the phonemic level
plays an important role in reading development. Their argument is based on two strands of evidence:
first, explicit teaching of phoneme awareness, combined with training in segmentation skills, has a
positive effect in reading development (Lundberg et. al., 1988; Hatcher, Hulme & Ellis, 1995); second,
explicit phonemic awareness is necessary for irregular word reading-phonological decoding skills
help irregular word reading. Morais et al. (1998) argue that because explicit awareness of phonemic
presentation forms the basis for explicit awareness of higher-order GP rules, children who know these
rules are in a better position to identify words which depart form these rules.

Chapter 3 74
intelligence, memory and economic class were controlled for. Other researchers,
independent of Bryant and colleagues have reported similar results (e. g. Ellis and
Large, 1987; Bowey & Francis, 1991; Chaney, 1994; Greaney, Tunmer, & Chapman,
1997). In spelling, however, it has been suggested phoneme awareness plays an
important role. Cataldo and Ellis (1988) found that explicit phoneme awareness
predicted spelling ability during the first three years of schooling, with its influence
increasing over time, but predicted reading only in second year.
In transparent languages like Swedish and Norwegian only weak predictive
correlations have been found between reading development and onset/rime awareness
(Hoien, Lundberg, Stanovich, & Bjaalid, 1995; Lundberg, Olofsson, & Wall, 1980),
whereas in German no early predictive relations have been found (Wimmer, Lander,
& Schneider, 1994). Geudens and Sandra (1999) compared the speed of naming
nonwords (e. g. `wot'), with the speed of naming onset-rime (e. g. `w ot') or body-coda
(e. g. `wo t') segmentations in beginning readers of Dutch. Unlike English (Treiman et
al., 1995), the Dutch orthography is transparent at the grapheme-phoneme level. They
found that the naming of onset-rime items covaried with reading: it had an inhibitory
effect for good readers but a facilitatory effect for poor readers. This suggests that
onset and rime units in reading phonologically transparent writing systems may not be
very helpful to the reading process of good Dutch readers.
In transparent orthographies, phoneme awareness appears to be the best
predictor of reading development. Öney and Durgunoglu (1997), for example,
investigated the early literacy acquisition of first grade children learning to read in
Turkish at the beginning, middle, and end of the school year (the Turkish orthography
is very transparent) by assessing their phonological awareness, letter recognition,
word and pseudoword recognition, syntactic awareness, spelling ability, and listening

Chapter 3 75
comprehension. They found that phonological awareness was the best predictor of
reading skill, however, this was limited to the early stages of reading acquisition.
They suggest that for transparent orthographies, an emphasis on developing decoding
proficiency may be unnecessary because the systematicity of the written language
facilitates decoding proficiency. This may not be the case for more irregular
orthographies and developing decoding proficiency through instruction may facilitate
reading comprehension.
Although, the relationship between reading and phonological awareness has
been extensively researched, the relationship between phonological awareness and
spelling skills has attracted less attention. As mentioned previously, children's ability
to segment phonemically is a subsequent result of learning to read-during this
learning process knowledge that printed graphemes represent speech segments of
spoken language is gained. Therefore, young children cannot use phonological
spelling until they receive formal teaching instruction.
In the early stages of spelling acquisition, English-speaking children tend to
rely on knowledge of letter names. They are inclined to use one letter (usually an
initial consonant, and occasionally a final one) to represent a word (Treiman, 1994).
Treiman (1993) analysed children's free writing during their first year in school. She
found that from the beginning of literacy instruction children relied upon phonology,
and soon replacing the strategy of spelling by letter names with that of spelling using
letter sounds.
Furthermore, spelling of words and nonwords that contain consonant clusters
proves difficult for young children. Treiman (1985) reported that 27% of the errors
made by first- grade children affected initial consonant clusters. They were prone to
omitting the last consonant of the cluster (usually the second phoneme for CC onset,

Chapter 3 76
and the third phoneme for CCC onsets). In addition, the first graders showed a
tendency to omit one of the phonemes from the final consonant clusters. For example,
bank was spelled as bak. The tendency to reduce final consonant clusters persists for
a longer period of time than the tendency to reduce initial clusters. These findings
reflect the level of awareness of phonological representations of spoken words. These
error types indicate immature segmentation strategies; however, as children learn
more about the written language, their spelling becomes more accurate in terms of
phonological content.
Goswami and Bryant (1990) argue that the ability to segment spoken words
into phonemes is a critical skill for spelling development. Burns and Richgel (1989)
assessed invented spellings of 4-year-old children for phonological plausibility.
These children who could produce invented spellings were compared with children
who could not spell on a battery of tests comprising reading skill, letter knowledge
and phoneme segmentation. The non-spellers were inferior to their peers who were
inventive spellers in letter-sound knowledge, and segmentation skills, although only
44% of later group could read. Burns and Richgels (1989) concluded that in the early
stage of literacy development, phonemic segmentation and letter-sound knowledge
were vital precursors of spelling ability, whereas reading was a related but separate
skill from word writing.
Further evidence about the relationship of phonological awareness and reading
in different orthographies comes from dyslexic children. Many studies have shown
that an impaired performance on phonological awareness tasks is evident in English
dyslexic children (Bradley & Bryant 1978; Olson, Wise, Connors, Rack, 1990; Bruck
& Treiman 1990; Snowling, & Olson, 1992). Phonological deficits in dyslexia are
less marked in children who learn to read in more transparent orthographies. For

Chapter 3 77
example, Landerl, Wimmer and Frith (1997) showed that German speaking children
perform much better at reading nonwords words than English dyslexics. Wimmer
(1993) found that compared to normal readers, instead of an impairment for nonword
reading accuracy, German children show a speed deficit. Furthermore, De Gleder and
Vroomen (1991) presented 11-year-old Dutch dyslexic children with phonological
tasks at the syllable, rhyme and phonemic level. In comparison to chronological-age
and reading- level matched controls, the phonological deficit was evident only at the
phonemic level. English dyslexic children find the final tasks extremely difficult
(Bruck, 1992; Rack, Snowling, & Olson, 1992)
Finally, phonological decoding (recoding) functions as an independent self-
teaching mechanism, which enables the reader to acquire visual patterns of words.
(Share, 1995; Share & Stanovich, 1995). The self-teaching mechanism hypothesis
suggests that that low frequency words require phonological recoding because they
are not recognised visually. In contrast, high frequency words do not require
phonological recoding because, because they are stored in the mental lexicon and
hence are recognised visually (Share, 1995).
To summarize: Research has shown that: (1) the representation phonological
units develop from large to small as result of the effect of vocabulary growthon
lexical restructuring; (2) explicit phonological awareness at the phoneme level is a
subsequent result of exposure to print and formal instruction; (3) the relationship
between phonological awareness and reading is reciprocal; (4) the consistency of the
orthography can affect the awareness of the structure of the spoken language
(references); and (5) phonological skills can serve as reliable predictors of reading and
spelling skill

Chapter 3 78
In the main study of this thesis, nonword reading, nonword spelling and
phoneme deletion tasks will be administered to Albanian, English and Welsh speaking
children. First, if the nature of the written orthography has an effect on the awareness
of spoken language then young Albanian and Welsh children should perform better at
this task than English children. Second, according to Frith's model, phonological
tasks should be the best predictors of both reading and spelling in the early stages of
literacy development. However, in transparent orthographies of Albanian and Welsh
phonological skills should be best predictors of reading only in the first years of
schooling.
3.3 Naming speed
Wagner and Torgesen (1987) identified three types of phonological ability:
phonological awareness (already discussed in the above sections), phonological
coding in short term memory, and retrieval of codes from long term memory.
Phonological coding in short term memory has been further denoted as verbal
working memory and is related to the temporary storage of verbal information. To
date, findings suggest that the relation between working memory and word decoding
is correlational. Wagner et al. (1997) found that the effects of verbal working
memory on word recognition were small and could be fully accounted for by
phonological awareness. In addition, dyslexic children generally perform at the same
level as that of their age-matched reading controls on these measures (Siegel & Ryan,
1988; de Jong, 1998) and the effects of training of verbal working memory on reading
development have not been reported. Therefore, in this thesis only the first and the
last type of phonological ability were measured.

Chapter 3 79
The third type of phonological ability, retrieval of codes from long term
memory, has been further denoted as rapid naming and concerns the speed of access
to the pronunciation of digits, letters and words. Naming skill, which is the fluent
retrieval of verbal labels, is also very important in the process of reading acquisition
(De Jong & Van der Leij, 1999). Denckla (1972), and Denckla and Rudel (1974,
1976), found that the speed with which the names of colours were retrieved, rather
than accuracy, differentiated between dyslexics and normal readers. The Rapid
Automised Naming (RAN) task, designed by Denckla (1972), consists of 50 stimuli
(e. g. five single digits, five letters, five colours, or five pictures of familiar objects
repeated 10 times on a board). Mayer, Wood, Hart and Felton (1998) propose that
numbers and letter naming speed are more likely to reflect the impact of early
learning to read (including alphabet mastery), whereas colour and object naming
speed are not very well related to prior alphabet or reading mastery. According to Van
den Bos, Zijlstra and Spelberg (2002), this could be due to elementary education, as
both reading and arithmetic practice interacts with naming speed development of
numbers and letters. Indeed, they did go on to find that there was a relationship
between word-reading and naming speed of letters and numbers-this was not the
case with the naming of colours and objects.
Bowers and Wolf (1993; Wolf & Bowers, 1999) argue that RAN tasks assess
the functioning of a precise timing mechanism that is important in the process of
amalgamation of phonological and visual representations into orthographic codes for
words. Upon this assumption, they proposed the Double Deficit Hypothesis (DDH),
which is based on the finding that the correlations between rapid naming and
phonological awareness are modest in dyslexics and that dyslexics can exhibit both
phonological and naming difficulties. These two independent sources of reading

Chapter 3 80
dysfunction can result in three dyslexia subtypes-two single deficits and one double
deficit. Thus, some dyslexics with a single phonological deficit have only
phonological processing difficulties but no or little naming deficit whereas dyslexics
with single naming speed difficulties have naming speed problems only. The double-
deficit subtype is characterised by both deficits; this represents the most severely
dyslexic readers. In fact it was Lovett (1987) who first distinguished between poor
readers who had a reading rate difficulty and those who had a reading accuracy
difficulty. Reading-rate disabled children exhibited a naming speed deficit only.
Reading-accuracy disabled children (who also showed a rate difficulty) exhibited a
phonological awareness deficit as well as a naming speed deficit.
Bowers, Golden, Kennedy, and Young (1994) suggested that rapid naming
deficits are directly related to variation in orthographic skill. They found that rapid
naming accounted for independent variance in orthographic skills that was not
explained by print exposure. Bowers et al. (1994) argued that beginning readers who
are slow at identifying letters in a printed word do not activate letters stored in
memory close enough in time to encode combinations of letters that occur most
frequently in print. As a result, children with a naming speed deficit may be slow in
gaining knowledge of orthographic patterns and/or forming orthographic
representations of written words. Sunseth and Bowers (1997), found that children
with a single naming deficit and children with a double-deficit were impaired on
measures of orthographic skills relative to children with a single phonological deficit,
thus, further supporting the hypothesis that naming speed deficits are directly related
to variation in orthographic skill.
However, naming deficits are often overlooked in the diagnoses of English-
speaking dyslexics because their word recognition is very poor (Compton & Carlisle,

Chapter 3 81
1994). In other languages where the grapheme phoneme mappings are more
consistent, naming deficits are found to be more useful in identifying reading
disorders. This is because even poor readers can rely on the very regular GP
conversions, which results in high accuracy (Klicpera & Schabmann, 1993). There is
ample research which shows that dyslexic children learning to read in transparent
orthographies show high accuracy for both word and nonword reading (German,
Landerl et al., 1997 and Wimmer, 1993; Spanish, Rodrigo & Jimenez, 1999; Dutch,
Van den Bos, 1998; and Italian, Zoccolotti, De Luca, Di Pace, Judica, Orlandi, &
Spinelli, 1999). Their main problem is slow decoding for words that are read rapidly
by normally reading children. In such transparent ortingraphies, naming speed seems
to be a better predictor of reading ability than phonological awareness (Torgesen,
Wagner, Rashotte, Burgess, & Hecht, 1997; Wolf & Bowers, 1999). The opposite
stands for the English language, where phonological and decoding skills may be
better predictors.
It has been documented that the contribution of rapid naming is present during
the initial stages of reading acquisition-later on, this contribution is reduced
considerably (Torgesen, et al., 1997; Wagner et al., 1997; Walsh, Price, & Gillingham,
1988). These findings are not consistent with the DDH. In a recent longitudinal study,
for example, De Jong and van der Leij (1999) examined the effect of phonological
abilities on early reading acquisition. Kindergarten and Grade 1 Dutch children were
assessed on various cognitive measures including rapid naming tasks (RAN). They
found that the contribution of rapid naming was limited from kindergarten to the end
of first grade. However, in this study only rapid naming of objects was used. In a
follow up study naming of letters and digits were included in the RAN tasks (de Jong
& van der Leij, 2002). The results confirmed the previous study's finding that the

Chapter 3 82
contribution of RAN was limited to Grade 1, thus supporting previous findings that
the contribution of rapid naming is only present during the initial stages of reading
acquisition.
These research findings indicate that results may depend on type of RAN task
used. In order to avoid such problems, in this thesis seven types of RAN tasks were
employed (rapid naming of letters, digits, words, numerals, colour names, boxes of
colours, and pictures) and two composite scores were formed for subsequent analysis:
the first consisted of all the alphanumeric stimuli (RAN Alphanumeric) whereas the
second consisted of actual colours and pictures of familiar objects (RAN Object and
Colours). Presently, RAN is viewed as part of the phonological abilities family
(Wagner & Torgesen, 1987), hence, the main hypothesis concerning naming speed is
that the contribution of RAN tasks will be significant only the initial stages of reading
acquisition.
As mentioned above, Van den Bos et al. (2002) found a relationship between
word-reading and naming speed of letters; thus, a second hypothesis with relation to
rapid naming that is assessed in this thesis is that RAN Alphanumeric but not RAN
Objects and Colours will be associated with measures reading ability.
3.4 Orthographic Skills
During the early stages of reading, words are primarily decoded
phonologically. Following print exposure, children begin to recognise familiar
spelling patterns. With increasing exposure, the reader may automatically recognise
these familiar patterns. Unfamiliar orthographic patterns, however, would still be
processed phonologically. Furthermore, deep orthographies like English have a
number of irregular words which cannot be decoded on the basis of phonology alone

Chapter 3 83
(Venezky, 1976; Ziegler & Goswami, 2005). Words that have irregular spellings have
to be recognised using specific orthographic knowledge.
Orthographic knowledge-the retrieval and use of knowledge about the
orthographic representation of words (Barron, 1994)-involves a complex set of skills,
including both knowledge of the spelling of particular words; and higher-level
conceptual skills, such as the recognition of the properties of words (e. g. word length,
consonant-vowel structure, syllabic structure, morphological complexity, meaning),
letter sequences, and common letter positions in words.
Frith's (1985) model of reading development considers orthographic
processing skills as an independent source of variance in word recognition ability.
Developmental arrest prior to or during the start of alphabetic stage would result in
poor readers who are deficient with spelling-to-sound decoding or phonological skills.
Developmental arrest at the orthographic stage would result in reading problems
related to orthographic processing skills. This suggests that phonological skills are
necessary but not sufficient for the development of fluent word recognition.
Stanovich and West (1989) investigated whether orthographic processing
ability accounted for variance in reading and spelling in 241 undergraduates. In
addition to phonological tasks, two orthographic processing measures were used:
orthographic choice task and homophone choice task. On the orthographic choice task,
subjects viewed pairs of letter strings that sounded alike (e. g., rume/room) and were
asked to indicate which one was spelled correctly by pressing one of two buttons on a
computer keyboard. On the homophone choice task, questions were read orally (e. g.,
`Which is a fruit? '), immediately followed by the visual presentation of two
homophones (e. g., pair/pear). Subjects pressed a computer key to decide between the
alternatives. The subjects' performance on the orthographic choice task and the

Chapter 3
homophone choice task was thought to reflect the quality and accessibility of their
orthographic representations because phonological processing of the letter strings
could not answer the questions adequately. They found that the orthographic tasks
accounted for additional variance in reading and spelling, after the effect of
phonological tasks was partialled out-these results have been replicated by other
investigators (Barker, Torgesen, & Wagner, 1992; Braten, Lie, Andreassen, &
84
Olaussen, 1999; McBride-Chang, Manis, Seidenberg, Custodio, & Doi, 1993; Olson,
Forsberg, & Wise, 1994, Cunningham, Perry, & Stanovich, 2001).
Other types of tasks have been used to measure orthographic skills. For
example, knowledge of word-specific information such as correct spelling of irregular
words, has been used in several studies to measure orthographic skills (Bruck &
Waters, 1988; Lennox & Siegel, 1993). Olson, Kliegl, Davidson and Foltz (1985),
used a word pseudohomphone choice tasks-Stanovich and West (1989) used a
similar version of this task. The participants were presented with 80 pairs of
homophones (e. g., rain/rane) on a computer screen and had to respond as quickly as
possible by pressing a left/right button. Participants had to recognise the correct
orthographic pattern independent of words' phonology. They found that dyslexic
participants were more accurate and faster than reading control group and that the
correlation between orthographic and phonological factors was lower for disabled
readers than for controls. This suggests that orthographic processing plays a greater
role in word recognition for disabled readers and that for these readers there is less
impairment in orthographic factors than in phonological factors.
According to Lennox and Siegel (1998), an alternative way to measure
orthographic skills, which is different from knowledge of word-specific information,
involves the ability to determine whether a specific letter combination is allowed in

Chapter 3 85
the language or not (Pennington, McCabe, Lefly, Bookman, Kimberlin, & Lubs, 1986;
Siegel, 1994; Siegel, Geva & Share, 1990; Siegel, Share & Geva, 1995). The
orthographic awareness task designed by Siegel et al. (1995) has 17 pairs of nonsense
words; for each pair, one member contained an orthographic sequence that never
occurs in English or that occurs with an extremely low frequency. This task was used
to assess the development of the orthographic skills in dyslexics and normal readers.
Here the participants have to identify the word that looks more like a real word (e. g
file and fl/k). Many studies (Bradley & Bryant 1978; Olson, Wise, Connors, Rack,
1990; Bruck & Treiman 1990; Snowling, & Olson, 1992) have shown that dyslexics
have phonological awareness difficulties. The finding of Siegel et al (1995) study
supported this-dyslexic subjects performed significantly worse than normally
developing children but they also found that dyslexic readers performed better on the
orthographic awareness task than the normal readers. Therefore they suggest that the
dyslexic readers may use a different processing mechanism in reading.
In the orthographic verification task (Manis, Szeszulski, Holt, & Graves,
1990), participants listen to a word, then are asked to indicate which printed word is
spelled correctly (e. g., `street': street and streat). Similarly, the Peabody Individual
Achievement Test (PIAT) for spelling (Dunn & Markwardt, 1970) is another task that
has been used to measure orthographic skills. A target word is presented orally,
followed by a presentation in a sentence, and finally is presented individually.
Participants have to make a selection by choosing one of the four similar alternatives
printed on a card (e. g., `cloudy': clowdy cloady cloudy cloudley).
Most of the tasks described above are forced-choice tasks and there is a debate
whether these can be fully dissociated by phonological skills (Foorman, 1994).
Researchers that support the dissociation between these two measure emphasize the
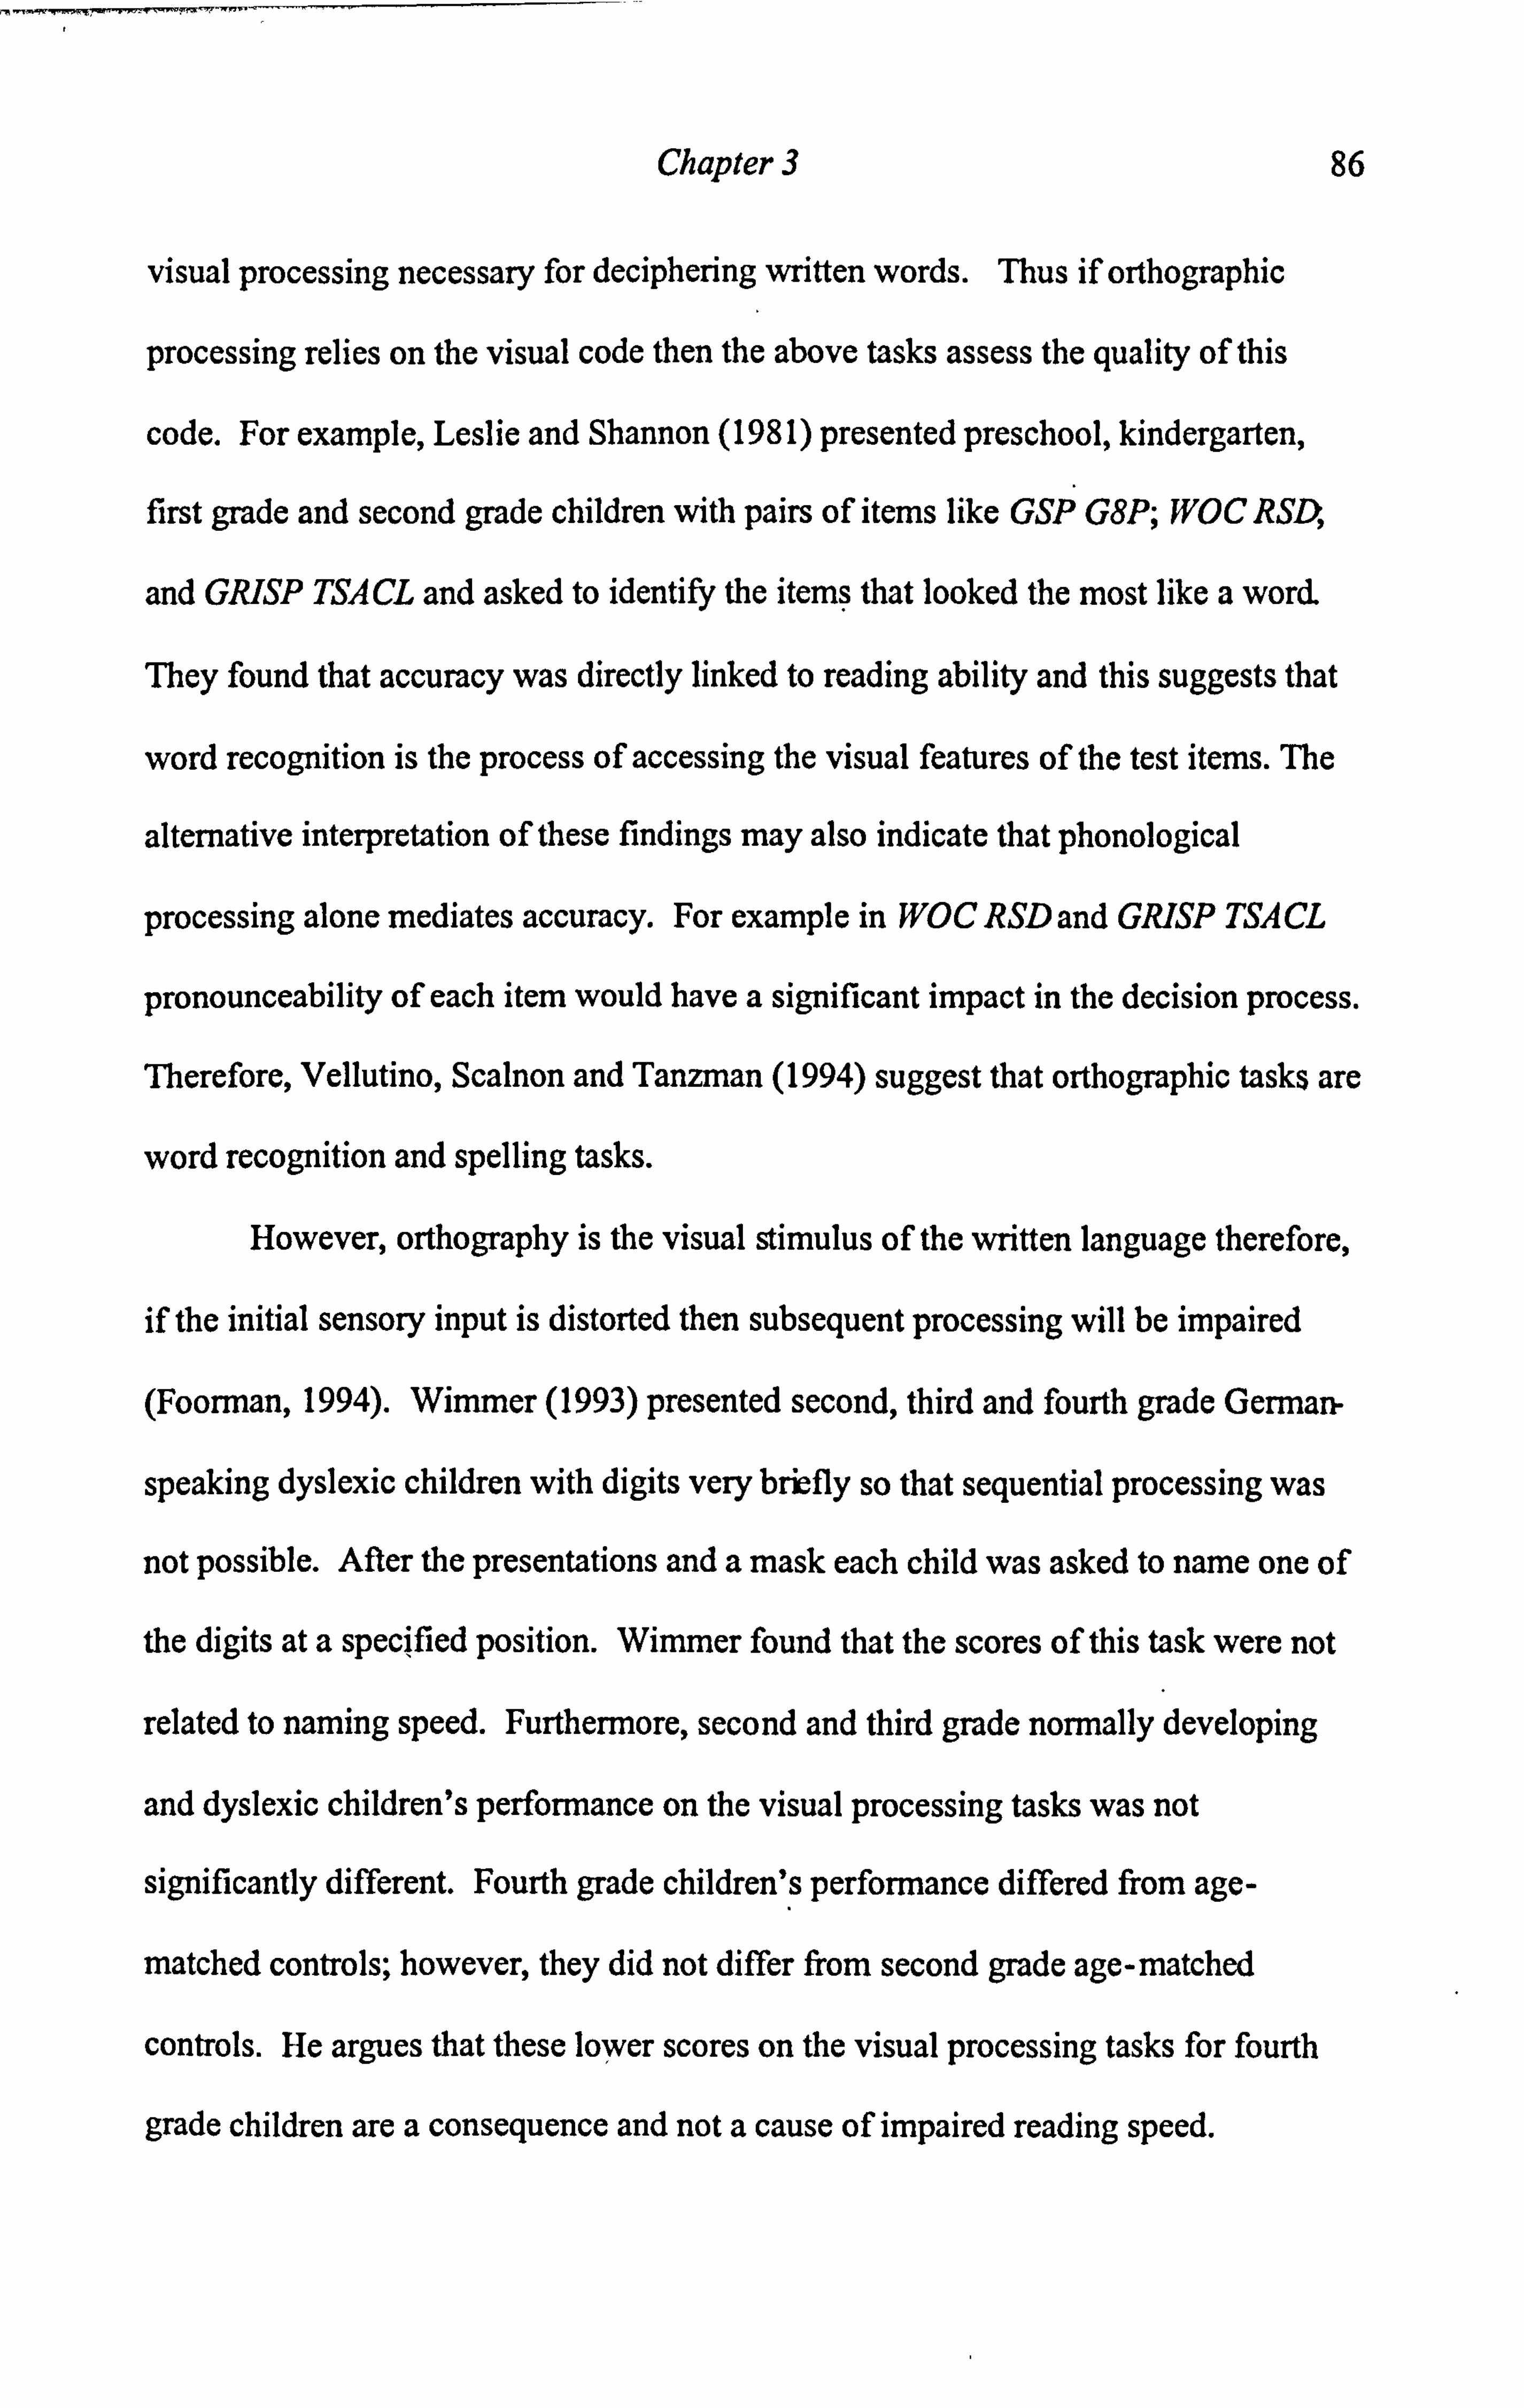
Chapter 3
visual processing necessary for deciphering written words. Thus if orthographic
processing relies on the visual code then the above tasks assess the quality of this
code. For example, Leslie and Shannon (1981) presented preschool, kindergarten,
first grade and second grade children with pairs of items like GSP G8P; WOC RSD,
and GRISP TSACL and asked to identify the items that looked the most like a word.
86
They found that accuracy was directly linked to reading ability and this suggests that
word recognition is the process of accessing the visual features of the test items. The
alternative interpretation of these findings may also indicate that phonological
processing alone mediates accuracy. For example in WOC RSD and GRISP TSACL
pronounceability of each item would have a significant impact in the decision process.
Therefore, Vellutino, Scalnon and Tanzman (1994) suggest that orthographic tasks are
word recognition and spelling tasks.
However, orthography is the visual stimulus of the written language therefore,
if the initial sensory input is distorted then subsequent processing will be impaired
(Foorman, 1994). Wimmer (1993) presented second, third and fourth grade German-
speaking dyslexic children with digits very briefly so that sequential processing was
not possible. After the presentations and a mask each child was asked to name one of
the digits at a specified position. Wimmer found that the scores of this task were not
related to naming speed. Furthermore, second and third grade normally developing
and dyslexic children's performance on the visual processing tasks was not
significantly different. Fourth grade children's performance differed from age-
matched controls; however, they did not differ from second grade age-matched
controls. He argues that these lower scores on the visual processing tasks for fourth
grade children are a consequence and not a cause of impaired reading speed.

Chapter 3 87
Frith (1985) suggests that the deficit in forming orthographic representations
may be due to global processing that has insufficient attention to individual letters or
group of letters. Perfetti (1992) argues that these insufficient orthographic
representations are caused by the poor quality of the underlying phonological
representations. This goes against the view of full dissociation between phonological
and orthographic processes. However, Olson et al (1994) who presented dyslexics
with test items like sammon salmon found that they performed worse than younger
normally developing readers, but on nonword choice tasks (e. g., fily filk) dyslexic
children were comparable or even better than younger children. This is because the
second task does not require a response to a real word. The phonological processes
are dissociated in these tasks they tap on a general level of orthographic processing.
In addition, the effect of forced-choice measures that evaluate orthographic
skills has not been reliability observed and some of the conclusions are incompatible.
Considering the nature of these tasks, Stanovich, West and Cunningham (1991), have
suggested that deficiencies in orthographic processing skills may be characteristic of
poor readers. On the contrary, Siegel et al. (1995) reported a better performance on
the orthographic awareness task for dyslexics than for normal readers, whereas Olson,
Wise, Connor and Rack (1990) report comparable levels of performance between
reading level matched poor and normal readers on the orthographic choice task.
These different findings undermine the validity of the orthographic tasks.
Vellutino, Scanlon, and Chen (1995) point out that in addition to orthographic skills,
these discrimination tasks may also measure word identification or word spelling
skills; and Olson et al (1993) indicate that these tasks can be highly vulnerable to
guessing strategies. Further, Willows & Geva (1995) suggest that homophones can be
challenging and confusing (e. g., Which is a fruit? pair or pear), especially when

Chapter 3 88
phonological representation is underdeveloped, and sometimes it may be difficult to
separate meaning from graphic information.
An alternative to the tests presented above is the Wordchains task. Jacobson
and Lundberg's (2000) study, aimed at predicting individual growth in reading in
disabled and normal school boys. They used a wordchains task on three occasions to
assess word decoding performance (The Wordchains task has been adapted in English
by Miller-Guron, 1998). A wordchain consists of a three or four words linked
together (e. g. `sandcoffeeblue') and participants are required to identify all words
within a chain by separating them with a pencil slash (e. g. `sand/coffee/blue'). The
participants have to divide as many chains as possible within 3 minutes. Very young
children have to sound out each letter before they can identify each word, whereas
older children and adults can identify words by using immediate lexical access based
on rapid recognition of orthographic patterns (Jacobson & Lundberg, 2000).
Although originally this task was designed to measure word recognition ability, it
may also serve as a good measure of orthographic skill. As this is a time-limited test,
performance is enhanced if children have accurate orthographic representation of the
words stored in memory. A lack of orthographic representations would result in low
socres.
In this thesis two orthographic knowledge tests will be used to measure
orthographic skills in Albanian, Welsh and English children: the orthographic
awareness (Siegel et al., 1990) and wordchains (Miller-Guron, 1998). The first task
is popular in the ongoing literacy research. However, given the limitations of force-
choice tasks wordchains will also be used.
Treiman's (1993), who examined young children's spelling errors, suggests
that young children are sensitive to orthographic conventions from an early stage.

Chapter 3
They rarely violated constraints on the positions of graphemic patterns in spelling.
For example, they might have spelled `cake' as `kack' but never as `ckak'. In
addition, the spelling of `-ed' endings was soon learned, regardless of the
pronunciation (e. g. `jumped' which ends with the sound /t/ and `liked' which ends
with the sound /d/).
89
Furthermore, Ellis and Cataldo (1990) found that the contribution of phonemic
awareness to spelling increases over time, whereas Sprenger-Charrolles, Siegel, and
Bechennec (1997) show that during literacy development even in highly opaque
French, the role of the orthographic skills was secondary to the role of phonological
skills, which increased as a function of age. On the contrary, stage models of reading
and spelling suggest that children initially rely on phonological skills but later move
onto an orthographic strategy. Stanovich (1986) found that phonemic awareness
accounts for variance only in beginning stages of reading development, and Juel,
Griffith, and Gough (1986) argue that following literacy exposure, there is indeed a
shift from phonological to orthographic skills in reading and writing.
The main hypothesis emerging from the literature is based upon the
assumptions of Frith's model: orthographic knowledge will be the best contributor
only in the later stages reading and spelling development. Thus orthographic tasks are
expected to be significant predictors only for older children who have been exposed to
print for several years.

Chapter 3
3.5 Hypotheses and predictions
90
From the literature reviewed in Chapters 1 and 2, a number of hypotheses4 and
predictions emerge. These relate to the rate of reading and spelling development and
the strategies employed by young native children learning to read and spell in these
languages.
First, orthographic depth will have a significant impact on reading accuracy.
In more transparent the orthographies reading accuracy will be higher than in less
transparent orthographies. More precisely, it is predicted that Albanian and Welsh
should be able to read more words of their language than English children.
Second, orthographic depth will affect the strategy used by learners in
different orthographies. Young Albanian and Welsh children will rely on an
alphabetic decoding strategy, whereas English children will rely on lexical retrieval
on the basis of partial visual analysis of the written words.
The third hypothesis concerns spelling skills. Children learning to spell in
shallow orthographies will be more accurate than children learning to spell in deep
orthographies. It is predicted that Albanian will have higher spelling accuracy scores
than Welsh children, who in turn will show better scores than English children.
A fourth and final hypothesis emerges from the description of the Albanian
orthography where the bi-directional relationship between letters and sounds is
extremely transparent. If Albanian children rely on alphabetic decoding skills then
there should be no discrepancy between their reading and spelling accuracy scores.
The developmental reading and spelling models presented in Chapter 3
propose that children initially rely on phonological skills but with print exposure they
4A more detailed list of hypotheses and predictions is presented at the beginning of each experimental chapter.

Chapter 3 91
move on to an orthographic strategy. The current research presented in this thesis
tries to examine this using various tasks, tapping phonological, orthographic, and
other cognitive skills. Following previous research findings, the hypotheses presented
below have been set for examination.
1. It is predicted that both reading and spelling phonological skills will
contribute to early literacy development. Following print exposure and formal
teaching instruction orthographic skills will soon be acquired-these will allow the
learners to become more confident readers and spellers. In transparent orthographies
of Albanian and Welsh explicit phonological skills should be best predictors of
reading only in the first years of schooling.
2. If the nature of the written orthography has an effect on the awareness of
spoken language then young Albanian and Welsh children should perform better at
phonological tasks than English children.
3. The contribution of RAN tasks will be significant only the initial stages of
reading acquisition
4. RAN Alphanumeric but not RAN Objects and Colours will be associated
with measures reading ability.
5. Orthographic tasks are expected to be significant predictors only for the
older children who have been exposed to print for several years.

Chapter 4 92
Chapter 4: Materials and procedure
4.1 Introduction
This chapter describes the test materials and the procedures for each task employed in
this thesis. Materials used in the pilot study are presented first these are followed by
the description of materials used in the main study which compares literacy
development in Albanian, English and Welsh in three different age-groups.
4.2 Pilot study on learning to read and spell in Albanian
4.2.1 Measurement tools
4.2.1.1 Compilation of word-lists
In the first part of the pilot study, an attempt was made to extend the findings
of the Ellis and Hooper (2001) study. They compared the rate of literacy acquisition
in Year 2 English and Welsh children matched for reading instruction, background,
locale, and maths ability. Twenty children from each language group were given a
word reading test, where reading accuracy, reading latencies (using a stopwatch), and
word error types were assessed. In order to do this, lists of 100 test-words for English
and Welsh were designed by taking the word types that composed million token word
frequency counts for English (CELEX, Baayen, Piepenbrock & Van Rijn, 1995) and
Welsh (Ellis, O'Dochartaigh, Hicks, Morgan & Laporte, 2001), sorting them in
decreasing frequency of occurrence, and sampling them so that a test word was
selected which matched (roughly) every decreasing step of 10,000 word tokens.

Chapter 4 93
Eighty words were selected following this procedure and another 20 words were
randomly selected from words with a frequency of one per million.
The Albanian reading test was designed by randomly sampling one word from
each of 100 successive strata of decreasing loglO written word frequencies from an
Albanian Text Corpus (ATC) created by the author of this thesis, comprising just over
one million words, from a novel, the New Testament from the Christian Bible, one
children's book, one on-line Albanian newspaper (dates ranging form early January to
late February 2001), and two short passages from books advertised on the internet.
This method is broadly equivalent to the 1 in 10,000 token sampling method used by
Ellis and Hooper, but slightly improves upon it in that it produces strata which are
separated by equal intervals of log10 frequency. The most frequent word of the list
was to `you' with frequency 67713 in a million, and one of the last words was
shkumes `chalk' which occurred only once. The Albanian test words and their
frequencies are shown alongside those for English and Welsh in Appendix 1.
The reason for this adaptation is that the original method used by Ellis and
Hooper (2001), although broadly satisfactory in producing equal strata in terms of
log 10 frequencies, at lower frequencies it did cause some deviation from linearity (as
already mentioned above, the last 20 words were randomly selected from words with
a frequency of one per million). The adaptation corrects for this lack of linearity,
however, this resulted in slightly higher frequencies for Albanian word-items. This
may undermine direct comparisons between the concerned languages and thus any
possible findings may be difficult to interpret. This is a problem in the pilot study, and
in order to verify any possible effects of language on accuracy are not due to minor
differences between the token frequency distributions of the parallel test items in the

Chapter 4 94
three languages, ANCOVAs with Iog10 frequency as the covariate will be run along
regular ANOVAs.
4.2.1.2 100-word reading
The lists were printed in decreasing frequency order with 17 words per A4
page, double-spaced, centred in bold lower case 20 point Times font.
The children were tested individually in a quiet room. They were asked to read
the words and to speak loudly and clearly because they would be recorded. A piece of
plain card was used to cover the list. The child was asked to move the card down
when the experimenter said `next', and to read the word immediately. A stop watch
was used to record reaction times, from the onset of word presentation to the response
onset. If the child made no response after 15 seconds, the experimenter would ask
them to try the next word. All children were given a few practice trials to show that
they understood the instructions. The reading test was discontinued if five consecutive
errors were made. The maximum score for this test was 100 and the reading errors
were recorded on a separate sheet by the experimenter.
Table 4.1 shows the frequency distribution of the length of the words for the
three languages and shows that the lists are well matched in their sampling for word
length [Albanian M= 5.36, SD = 2.94; English M= 5.84, SD = 3.14; Welsh M= 5.60,
SD = 2.97; F (2,98) = 1.47, n. s. ]. For the subsequent Albanian analyses, words
containing less than four letters are regarded as short words, whereas words
containing five letters or more are regarded as long words. There are 51 short words
and 49 long ones.

Chapter 4
Word
length Frequency
number of letters Albanian English Welsh
1 4 2 5
2 15 12 11
3 11 12 12
4 18 14 9
5 10 16 16
6 10 7 11
7 8 10 13
8 7 5 7
9 6 6 7
10 5 6 4
11 2 5 2
12 3 2 0
13 1 2 1
14 0 0 1
15 0 1 0
16 0 0 1
Table 4.1.. Word length and the frequency for the Albanian, English and Welsh reading test.
95
Figure 4.1 reveals the distribution of the Albanian test words as a function of
word length and log10 frequency. It is clear that the relationship is as predicted by
Zipf's law (Zipf, 1965): longer words are less frequent than shorter words (B = -0.34,
SE B=0. O30, ß = -0.756, F (1,98) = 130.9, p<. 001).

Chapter 4
5.00
4.50
4.00
3.50
3.00
2.50
2.00
1.50
1.00 LL LL
. 50
0.00
p p 0
p8°
e° ogö0
0ö00 Bp° 0
° oBo
8 - o ° ° ° 0 °
° ö o ý
B 8
0 0 0 0 0
0 0 0
2 3, 4 5 6 7 8 9 10 11 12 1
Word Length
Figure 4.1. Distribution of the Albanian test words depending on length and log10 frequency.
4.2.1.3 Word Comprehension test
96
After the reading test was completed, in order to assess word comprehension
ability, each child was asked to explain the meaning of each word by giving a
synonym, an explanation, or a correct usage in a sentence. Each word was presented
visually and was also read aloud by the experimented. The responses were noted on a
separate sheet. If more than five consecutive meaning errors were made the test was
discontinued.
4.2.1.4. Spelling test
The 100-word reading test list was also used as a spelling test. The words
were administered to the same children approximately one week later. It was hoped
that by administering the test a week later memory effects would be minimised.
Given that the word list has 100 items it was very unlike that the children remembered
every test item. Nevertheless, this issue should have been taken into consideration
during the testing period. For example, the experimenter could have counterbalanced
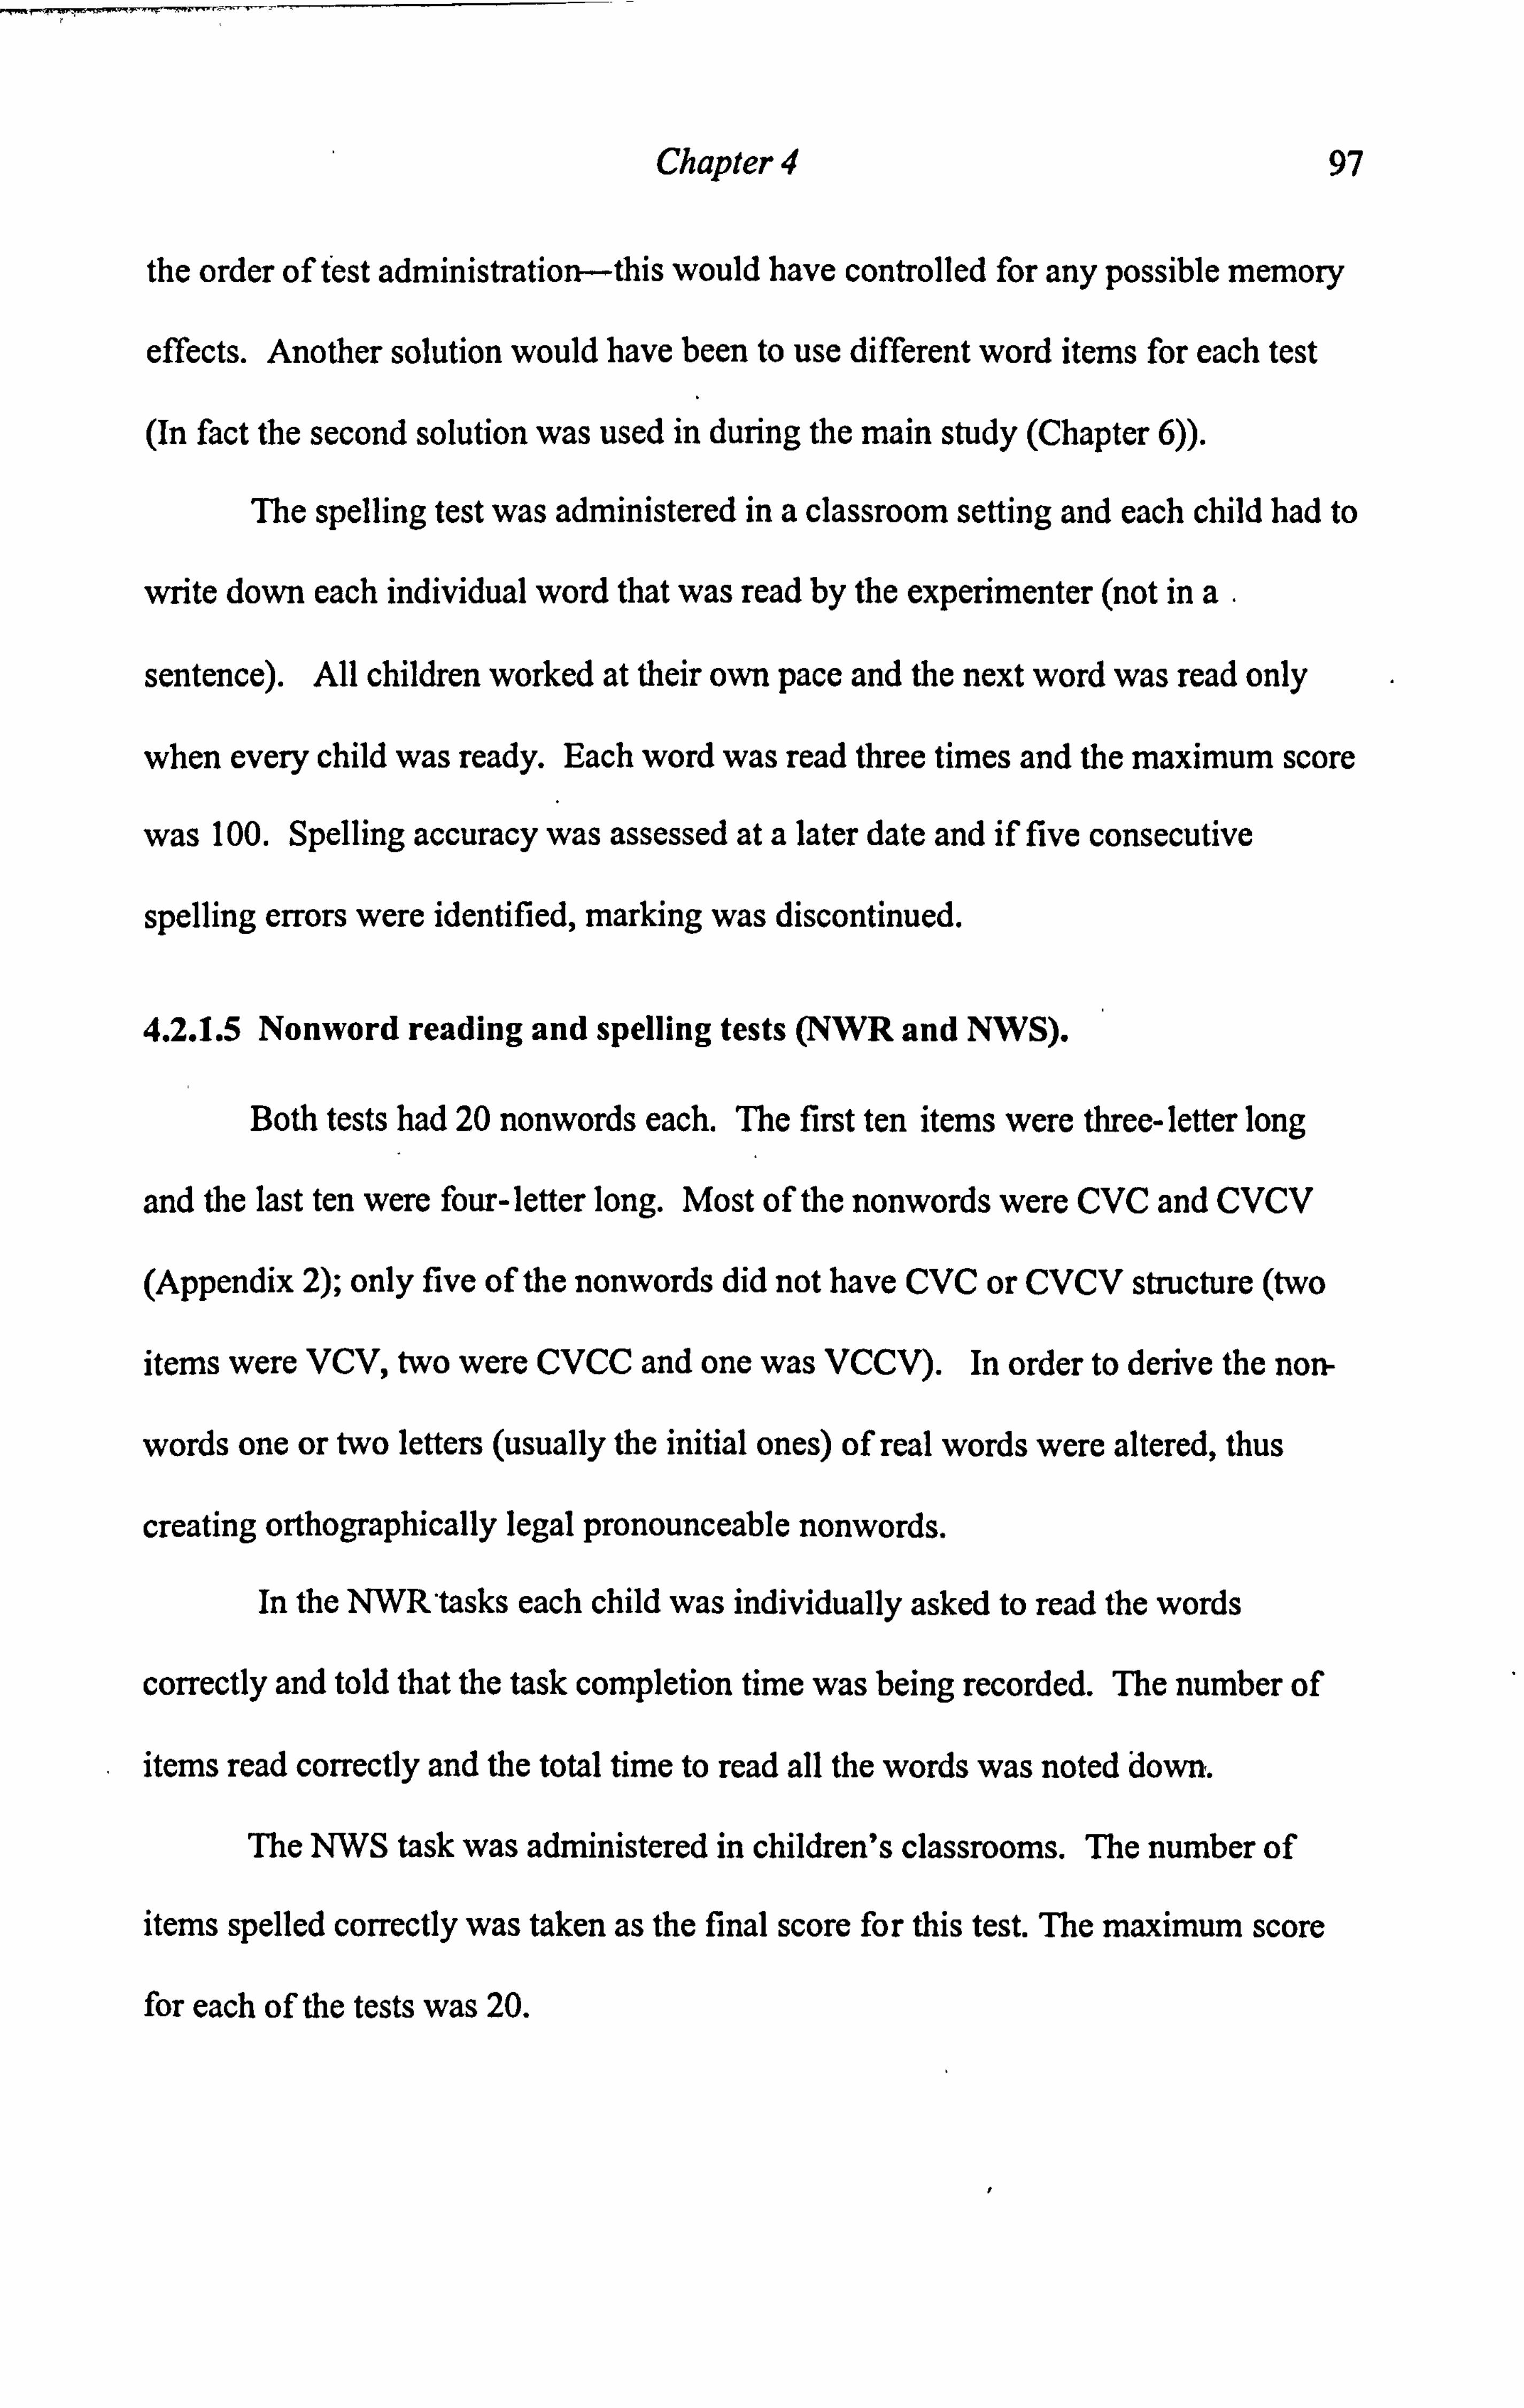
Chapter 4 97
the order of test administration-this would have controlled for any possible memory
effects. Another solution would have been to use different word items for each test
(In fact the second solution was used in during the main study (Chapter 6)).
The spelling test was administered in a classroom setting and each child had to
write down each individual word that was read by the experimenter (not in a.
sentence). All children worked at their own pace and the next word was read only
when every child was ready. Each word was read three times and the maximum score
was 100. Spelling accuracy was assessed at a later date and if five consecutive
spelling errors were identified, marking was discontinued.
4.2.1.5 Nonword reading and spelling tests (NWR and NWS).
Both tests had 20 nonwords each. The first ten items were three- letter long
and the last ten were four-letter long. Most of the nonwords were CVC and CVCV
(Appendix 2); only five of the nonwords did not have CVC or CVCV structure (two
items were VCV, two were CVCC and one was VCCV). In order to derive the non-
words one or two letters (usually the initial ones) of real words were altered, thus
creating orthographically legal pronounceable nonwords.
In the NWR'tasks each child was individually asked to read the words
correctly and told that the task completion time was being recorded. The number of
items read correctly and the total time to read all the words was noted down.
The NWS task was administered in children's classrooms. The number of
items spelled correctly was taken as the final score for this test. The maximum score
for each of the tests was 20.

Chapter 4 98
4.2.1.6. The phonological awareness tasks
In order to assess phonological skills at the phoneme level, segmenting and
blending tasks were employed. Both tasks, which were administered individually,
consisted of 16 different word-items of increasing length, starting with three-letter
words and ending with thirteen-letter words (See Appendix 3). In the segmenting task
each child was asked to separate the individual sounds of each word they heard (e. g.
ata `them' segmented into /a/, /t/, /a/). In the blending task the children were required
to do the opposite of the segmenting task; the sound segments were provided by the
experimenter and children had to pronounce the correct word (e. g. /d/, /u/, /a/, blended
into dua `want'). For both tasks the children were given a few examples followed by
one or two practice items until they showed understanding of what was required from
them. The maximum score for each of the tasks was 16.
4.2.1.7 Orthographic Awareness Task (OAT).
In this task participants were given 17 pairs of pronounceable pseudowords.
For each pair, one item contained a bigram that never occurs in Albanian in the initial
or final position, and the other item contained a bigram at the same position, which
does occur in the language in that position (See Appendix 4). The participants had to
circle on the answer sheet the member of each pair that "looked like a word" or
"could be a word". For example, for the pair stal and mtal, the first word should be
circled as the st bigram is legal in an initial position in Albanian, whereas mt is not.
The test was administered in a classroom setting and the score was the numbers of
correct responses.

Chapter 4
4.2.1.8 Serial naming speed.
99
Four measures of naming speed were adapted from Van den Bos et. al. (2002).
The tasks involved serial naming of digits, letters, colours, and objects (Appendix 5).
Each task contained 50 items and was presented in five columns and ten rows on A4
sheets. Each item occurred ten times in the set of 50 items, which were presented in a
random order. The serial digit naming task contained the numbers 1,2,4,7, and 9;
the serial letter naming task contained the letters A, E, P, T, and S (all in capitals); the
serial colour naming contained yellow, blue, red, green, and black squares; and the
object naming task contained drawings of a ball top, tree peme, bird zog, watch ore,
and dog qen (all these words are short and easy to pronounce). To start with, the first
four columns were covered, and participants practiced with the fifth column of each
task. After the practice trial they were asked to name the items on each sheet as fast as
they could without making errors. A stopwatch was used to record the overall time on
each list. Errors were not recorded. For these tasks, all children were tested
individually in a quiet room in their school.
4.2.1.9 Vocabulary knowledge
The second edition of The British Picture Vocabulary Scale (BPVS II, Dunn,
Dunn, Whetton, & Burley, 1997) was translated into Albanian. The translated test
uses only the first 144 items of the BPVS II. Each item consist öf four pictures, one of
which has to be chosen that best matches the given word, which was read by the
experimenter. Each participant had a short practice session until they showed full
understanding of the instructions given. The 144 items, which increase in difficulty,
are divided into 12 sets containing 12 items each. The administration of the test was
stopped when the child failed to identify eight items within a set. The maximum score
was 144 (See Appendix 6). The children were tested individually in a quiet room.

Chapter 4 100
Following the administration guidelines of the BPVS II, the starting set was
dependent upon participant's age. The testing for 6-7 y. o. began at set 3, for 8-9 y. o.
began at set 4, and for 10-11y. o. at set 5.
4.2.1.10 Non-verbal intelligence
All the items from sets A, An, and B from the Coloured Progressive Matrices
(CPM) (Raven, 1958) were presented on an overhead projector in participants'
classrooms. For each item there are six possible answers, which were represented on
the answer sheet with numbers 1 to 6. The participants were required to circle one of
the numbers (Appendix 7). A new item was presented when all the pupils Ind made a
choice. The maximum score was 36.
4.2.1.11 Generic Speed
On an A4 sheet, 25 additions and 25 subtractions of one-digit numbers were
presented. The additions were in separate columns from the subtractions, and all the
calculations resulted in one-digit numbers (Appendix 8). First, the participants were
asked to write down as many calculations as possible on the addition column within a
time interval of 20 seconds. Then, they were asked to do the same for the second
column, which contained the stbtractions. The maximum score was 50.
4.2.2 Data collection
The data were collected in four different sessions one month before the end of
the school year. See Table 4.2 for a summary of the tests administered within each
session and the number of items for each test.

Chapter 4
Session 1 (Group testing) Number of items
Orthographic Awareness 17
Generic Speed 50
Non-verbal IQ 36
NWS 20
Sessions 2 and 3 (Individual testing)
Word Reading 100 100
Word Comprehension 100
NWR 20
Blending 16
Segmenting 16
Vocabulary Knowledge 144
Serial Naming of digits 50
Serial Naming of letters 50
Serial Naming of colours 50
Serial Naming of objects 50
Session 4 (Group Testing)
Word Spelling 100 100
Table 4.2. Sessions and number of items for each task
4.2.3 Reliability analysis
101
Table 4.3 shows the Cronbach's alpha for the tests for which it was possible to
calculate it. The alpha level was very low for the OAT, Blending and Segmenting
tasks. This means that these tasks may not be very reliable; thus analyses which
include the results from these tasks should be carefully interpreted.
One reason as to why Cronbach's alpha is low for the OAT is that during the
time the test was administered some of the children seemed very confused as to what
they were supposed to do. As a result most of them went on selecting an item at
random. Also it was noticed that with the Blending and Segmenting tasks some of the

Chapter 4 102
final words were rather obscure, infrequent and proved to be rather long for younger
age group. Given these problems it is not surprising that OAT, Blending and
Segmenting tasks are not as reliable as the rest of the test used in the pilot study.
Tasks Cronbach's a Number of test items
Word reading . 86 100
NWR . 70 20
Word spelling . 93 100
NWS . 86 20
Non-verbal IQ . 90 36 OAT . 59 17
Segmenting . 58 16
Blending . 67 16
Table 4.3. Cronbach's alpha values for newly developed tests.
4.3 Main study materials: Albanian, English and Welsh
4.3.1 Measurement tools
4.3.1.1 Compilation of word-lists
Four lists' of 100 test words for Albanian, English and Welsh were designed
by taking the word types that composed million token word frequency counts for
Albanian (ATC), English (CELEX, Baayen, Piepenbrock & Van Rijn, 1995) and
Welsh (Ellis, O'Dochartaigh, Hicks, Morgan & Laporte, 2001), sorting them in
decreasing frequency of occurrence, and randomly sampling one word from each of
100 successive strata of decreasing Iog10 written word frequency. Next, starting from
the first word every other word was selected: this method resulted in four word lists
matched for frequency with 50 words each. The first word- list was used for the

Chapter 4
reading tasks (OMRT); the second was used for the spelling task (Spelling 50); the
third was used to devise nonwords for the NWR tasks; and the fourth was used to
devise nonwords for the NWS tasks.
All 12 word lists resulted in comparable log 10 frequency and word length
(Frequency, F(11,39)=1.46, ns; Length F(11,39)=. 90, ns).
4.3.1.2 One Minute Reading Test (OMRT)
103
Within each language the first word list was used as a one minute reading test.
All 50 words were presented on two columns on an A4 sheet (See Appendix 10).
Children were asked to read the words presented in each column as quickly as .
possible. The number of words read in a minute and the number of errors made were
recorded on a separate sheet. The final score consisted of the number of words read
per second.
4.3.1.3 Word comprehension test
After the OMRT was completed, in order to assess the word comprehension
level on the computerised reading tests, Welsh and English children were asked to
explain the meaning of each word by giving a synonym, an explanation, or a correct
usage in a sentence. The responses were noted on a separate sheet. Please note that
the Albanian children were asked to give the meaning of the complete 100-word list.
This is because prior to OMRT Albanian children received a 100-word reading test.
Therefore, two scoring methods were used. The first scoring method consisted of
responses for every other item, thus creating a score for Word Comprehension 50.
The second scoring method is described in 4.3.1.11 and was used for additional
analysis within Albanian language.
In order to generate four similar word lists for each language, the first 20 most frequent words were

Chapter 4
4.3.1.4 Spelling 50
104
Within each language2 the second 50-item word list was used as a spelling test.
The spelling test was administered in a classroom setting and each child had to write
down each word that was read by the experimenter. All children worked at their own
pace and the next word was read aloud only when all the children were ready. Each
word was repeated twice in isolation, and once in a sentence. The maximum score
was 50.
4.3.1.5 Nonword Reading (NWR) and Nonword Spelling (NWS)
Within each language, the two remaining 50-item word lists were used to
devise a nonword reading and a nonword spelling task. In order to devise the non-
words, for each word in the 50-item lists, one or two letters (usually the initial ones)
were altered, resulting in orthographically legal pronounceable nonwords for all
Albanian and Welsh items. However, experimenter errors occurred when creating the
English nonwords. Many of the items contained illegal combinations of letters (e. g.,
sver, srice and sroop). As a result English children's scores will be negatively
affected as they will be less accurate and will spend more time on each of the items
that contain illegal combinations. These errors will have a severe impact on the
interpretations of the results. The actual nonwords for both tasks are presented in
Appendix 12.
The NWS task was administered in children's classrooms. Children were
asked to write down the word they heard. Each non-word was read twice. The total
not selected. 2 Please note that the Albanian children spelled 100 word-items but afterwards two scoring methods were used. The first scoring method consisted of responses for every other item, thus creating a score for Spelling 50. The second scoring method is described in 4.3.1.11 and was used for additional analysis within Albanian language.

Chapter 4 105
score consisted of the number of words correctly spelled and the maximum score is
50.
The NWR task was a time-limited test children had to read as many
nonwords as possible in a one-minute period. The 50 nonwords were presented in
two columns on an A4 sheet. If the children read all fifty non-words within 1 minute,
the completion time was noted. The total score consisted of non-words read per
second.
4.3.1.6 Non-verbal intelligence
All the items from sets A, As, and B from the Coloured Progressive Matrices
(CPM) (Raven, 1958) were presented on A3 size sheets in children's classrooms. For
each item there were six possible answers. The participants were required to write
down the number that corresponded to the correct answer. A new item was presented
when all the pupils had made a choice. The maximum score was 36 (see Appendix
13).
4.3.1.7 RAN .
Seven measures of naming speed were adapted from Van den Bos et. al.
(2002). The tasks involved serial naming of digits, numeral, letters, colours, colour
names, objects and object names (Appendix 14). Each task included 50 items and was
presented in five columns and ten rows on A4 sheets. Each item occurred ten times in
the set of 50 and was presented in a random order.
In all three languages the serial digit naming task contained the numbers 1,2,
3,5, and 8; the serial numerals naming tasks contained numerals one, two, three, five
and eight; the serial letter naming task contained the letters A, E, P, T, and S (all in
capitals).
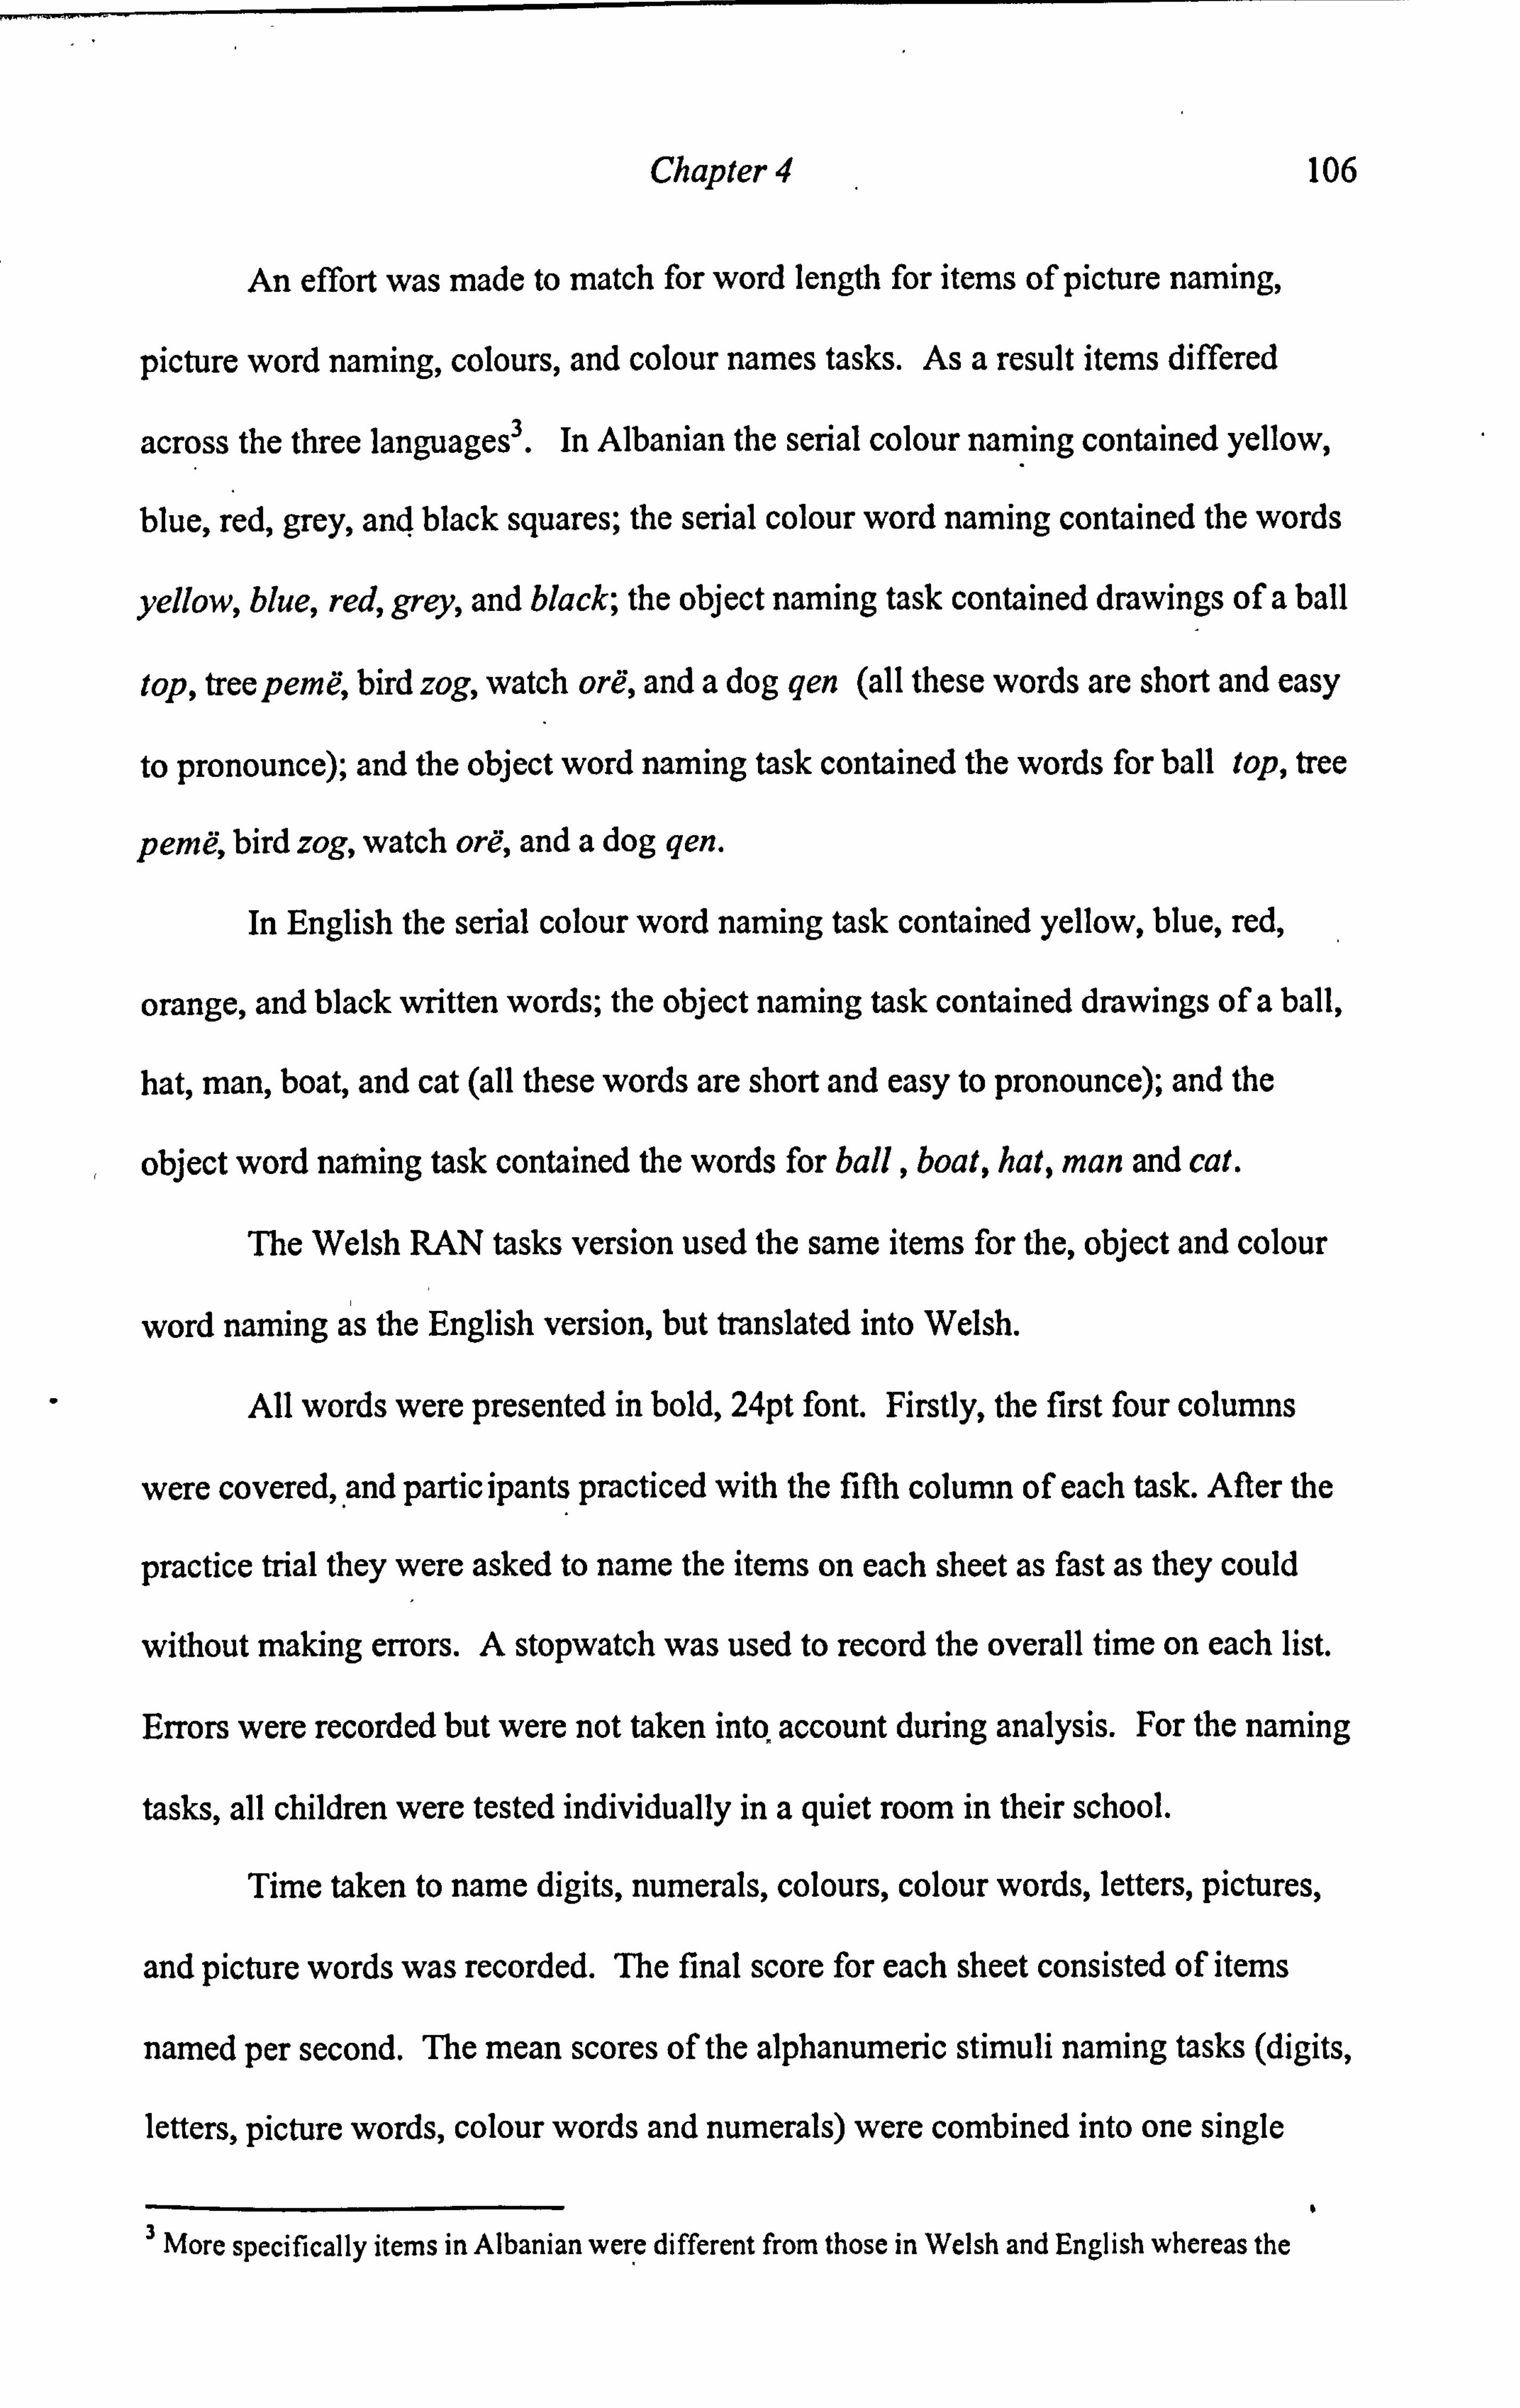
Chapter 4 106
An effort was made to match for word length for items of picture naming,
picture word naming, colours, and colour names tasks. As a result items differed
across the three languages3. In Albanian the serial colour naming contained yellow,
blue, red, grey, and black squares; the serial colour word naming contained the words
yellow, blue, red, grey, and black; the object naming task contained drawings of a ball
top, tree peme, bird zog, watch ore, and a dog qen (all these words are short and easy
to pronounce); and the object word naming task contained the words for ball top, tree
peme, bird zog, watch ore, and a dog qen.
In English the serial colour word naming task contained yellow, blue, red,
orange, and black written words; the object naming task contained drawings of a ball,
hat, man, boat, and cat (all these words are short and easy to pronounce); and the
object word naming task contained the words for ball, boat, hat, man and cat.
The Welsh RAN tasks version used the same items for the, object and colour
word naming as the English version, but translated into Welsh.
All words were presented in bold, 24pt font. Firstly, the first four columns
were covered, and participants practiced with the fifth column of each task. After the
practice trial they were asked to name the items on each sheet as fast as they could
without making errors. A stopwatch was used to record the overall time on each list.
Errors were recorded but were not taken into account during analysis. For the naming
tasks, all children were tested individually in a quiet room in their school.
Time taken to name digits, numerals, colours, colour words, letters, pictures,
and picture words was recorded. The final score for each sheet consisted of items
named per second. The mean scores of the alphanumeric stimuli naming tasks (digits,
letters, picture words, colour words and numerals) were combined into one single
3 More specifically items in Albanian were different from those in Welsh and English whereas the

Chapter 4 107
variable-RAN Alphanumeric. Mean scores of object and colour naming tasks were
combined into a second single variable-RAN Objects and Colours.
4.3.1.8 Phoneme deletion
The phoneme deletion test consisted of 30 items. After a word has been orally
presented, the participant is asked to delete an initial, medial or final phoneme
pronounced by the experimenter. There were ten initial, ten medial and ten final
phoneme deletions (Appendix 15). All participants were given a few practice trials to
ensure that they understood the instructions. The final score consisted of the number
of correct responses. The maximum score was 30.
4.3.1.9 Generic Speed
This is the same as in the pilot study materials (see section 4.2.1.11) with one
change in the final score. The data was converted into number of correct calculations
per second. This was done to match the final measurement used in Reading 50 and
RAN tasks.
4.3.1.10 Wordchains
The Wordchains task was used to measure orthographic knowledge. This test
consists of 120 word-chains (Miller-Guron, 1998). A word chain consists of a three
or four words linked together (e. g. `sandcoffeeblue') and participants are required to
identify all words within a chain by separating them with a pencil slash (e. g.
`sand/coffee/blue'). This test was translated in Albanian and Welsh: the original
words were replaced with words that had similar meaning and comparable word
length (see Appendices 16,17 and 18).
Welsh and English items were the same

Chapter 4 108
All participants were given a few practice trials. This is a timed test and after
a practice session, the participants have to divide as many chains as possible within 3
minutes. The total score consists of the number of correctly divided chains.
4.3.1.11 Additional reading and spelling tests for Albanian
No known studies have yet been conducted on the acquisition of reading in the
Albanian language, therefore additional efforts. were made to examine the
development of literacy skills in Albanian in as much depth as possible. In addition to
the tests described above, Albanian children received three more tests: Reading 100,
Spelling 100 and Word Comprehension 100.
Reading 100: Reading 100 was a computerised reading test and consisted of
100 words of decreasing frequency presented on a portable Macintosh Power PC
computer screen4. For this reading test, all 100 items of the first word list were used
(see section 4.3.1.1. )
The items in the reading word-list ranged in frequency from 1973 ate `that'
down to 1 goma `tyre' (see Appendix 9).
All children were tested individually in a large, quiet room. They were asked
to read the words that appeared on the computer screen and to speak loudly and
clearly because they would be recorded. If the child made no response after 15
seconds, the experimenter would ask them to try the next word. Each child was given
four practice words. The reading test was discontinued if 5 consecutive errors were
made. The maximum score for this test was 100 and the reading errors were recorded
on a separate sheet by the experimenter. In order to avoid possible environmental
noise effects, latency values below 300ms were excluded from the analysis. This
resulted in only 126 latency values being excluded. Please note that the Albanian

Chapter 4 109
children also received a 50 word reading test (OMRT). For the OMRT every other
word item of Reading 100 was used. However, the OMRT was administered several
weeks later, thus minimising or even avoiding any possible carry over effects.
Although, the OMRT was a time-limited test (1 minute), memory effects might have
affected the Albanian children's scores. A solution to this problem would have to
been to either used different word items matched for frequency and word length or to
use counterbalancing techniques.
Comprehension 100: After Reading 100 and OMRT were completed, in order
to assess the word comprehension level on the computerised reading tests, each child
was asked to explain the meaning of each word by giving a synonym, an explanation,
or a correct usage in a sentence. The responses were noted on a separate sheet. All
items were presented to all children however, for scoring purposes a cut-off point of
five consecutive errors was used.
Spelling 100: The second 100-word list generated for Albanian (see section
4.3.1.1) was used as a spelling test. The word items in the spelling word-list ranged in
frequency from 1972ju `you' down to 1 bujk `peasant'. This test was matched for
Iog10 frequency to Reading 100 word list and resulted in comparable word lengths.
All the items of the spelling test were administered in a classroom setting and
each child had to write down each word that was read by the experimenter. All
children worked at their own pace and the next word was read only when each child
was ready. Each word was repeated twice individually, and once in a sentence (see
Appendix 11). During the scoring process, a cut-off point of five consecutive errors
was used. The maximum score was 100.
4 The computer was programmed using SuperLab, Version 1.03 (Abboud & Sugar, 1997).

Chapter 4 110
4.3.2 Data collection with the Albanian sample
Albanian data were collected in three different sessions one to two months
before the end of the school year. See Table 4.4 for a summary of the tests
administered within each session and the number of items in each test.
Session 1 (Group testing) Number of items Time limit
Word Spelling
NWS
Wordchains
Non-verbal IQ
Generic Speed
100
50
120
36
50
3 mins
40 secs
Session 2 (individual testing)
Word Reading 100 100
Word Comprehension 100
NWR 20 1 min Phoneme Deletion 30
Serial Naming of digits 50
Serial Naming of numerals 50
Serial Naming of letters 50
Serial Naming of colours 50
Serial Naming of colour names 50
Serial Naming of objects 50
Serial Naming of object names 50
Session 3 (individual testing)
OMRT 50 1 min
Table 4.4. Session and number of items for each task

Chapter 4 111
4.3.3 Reliability analysis for the Albanian tasks
Table 4.5 shows Chronbach's alpha values for the tests5 used in the main study. All
variables presented below have a high alpha value.
Tests Chronbach's alpha Number of test items
Reading 100 . 81 100
OMRT . 78 50
NWR . 93 50
Spelling 100 . 89 100
Spelling 50 . 93 50
NWS . 87 50 Word Comprehension 100 . 85 100
Word Comprehension 50 . 84 50
CPM . 87 36
Table 4.5. Reliability analysis for the main study's Albanian materials.
4.3.4 Data collection for the English and Welsh samples
Data for the English and Welsh parts of the main study come from a larger
study-Welsh Dyslexia Project6-carried out by the Dyslexia Unit and the School of
Psychology, U. W. Bangor. Only total scores for each test have been teed for the
following analysis; individual item data was not available for examination.
s Chronbach's alpha was calculated only where item data was available. 6 The author of this thesis was actively involved with the design and the data collection of this project.

Chapter 5 112
Chapter 5: Pilot study in Reading and Spelling
Development in Albanian
5.1 Introduction
Recent research has begun to look at differences in the development of reading
and writing skills across languages and at the different writing systems, that is, ways
in which sounds represent letters in spelling and letters represent sounds in reading. It
is thought that differences in writing systems may affect the rate of reading and
spelling acquisition, the development of phonological and other language skills, the
sort of reading strategy the children will acquire and the incidence and severity of
reading disorders (Goswami et al., 1998).
No known studies have yet been conducted on the acquisition of reading in the
Albanian language. It is important to examine learning to read in Albanian, because
this language is a very special one in several respects. It forms a single branch of the
Indo-European family, spoken by over 3 million people in Albania, and parts of the
former republic of Yugoslavia, Greece and Italy. Because the writing system is
relatively young, it is highly transparent. Indeed it has few competitors in this respect
(e. g., Finnish, Serbo-Croatian and Hangul, the Korean script, match its transparency).
Thus Albanian provides a perfect test-bed to further extend existing findings on the
acquisition of literacy in a perfectly transparent writing system.
This thesis attempts to examine how much of their own language can English,
Welsh and Albanian children read. Therefore, the methodology used here is based
upon the one used by Ellis and Hooper (2001). The pilot study reported' here aims to
Findings from this chapter are published in (1) Hoxhallari, van Daal and Ellis (2004) and (2) Ellis, Natsume, Stavropoulou,, Hoxhallari , Van Daal, Polyzoe, Tsipa, and Petalas (2004).

Chapter 5 113
extend the. Ellis and Hooper (2001) findings. Using word-lists matched for written
frequency as reading tests they determined that: (i) Welsh children were able to read
aloud accurately significantly more of their language (61% of tokens, 1821 types)
than were English children (52% tokens, 716 types); (ii) the reading latencies for
Welsh children were longer than for English children; (iii) the error patterns differed,
with English children producing more visually similar real word substitutions,
whereas Welsh children produced more non-word type mispronunciations; and (iv)
reading latency was a clear function of word length in Welsh but not in English.
These findings suggest that the transparency of the orthography has an effect on
reading development and that Welsh children read by a GP synthetic strategy,
whereas English children rely on lexical retrieval on the basis of partial visual
analysis of the written words.
5.1.2 Balancing for frequency
The main method employed in the present study is the balancing of reading
and spelling materials on frequency. Ellis and Hooper (2001) argued that once
frequency is taken into account, the matching process should not control for other
factors such as imageability, word length, utility, morphological complexity,
orthographic complexity, etc., because ̀ everything to do with learning opportunity
should be matched; everything to do with language should be freed to vary' (Ellis &
Hooper, 2001, p. 577).

Chapter 5
5.2 Aims and Hypothesis
The first aim of the pilot study was to extend the work done by Ellis and
Hooper (2001) with same age Year 1 Albanian children. Thus data collected from
Albanian children is compared with Ellis & Hooper's (2001) data.
In addition, the present research takes into account the development of
spelling as well as the development of reading ability. The pilot study aimed at
assessing reading and spelling abilities of Albanian primary school children from
114
Years 1,2 and 3; and carry out exploratory analysis in identifying skills involved in
learning to read and to spell in Albanian.
5.2.1 Hypotheses concerning the Ellis and Hooper study
H. 5.2.1.1. The first hypothesis is that Year 1 Albanian children will be reading
more words than English children, because they are expected to use the grapheme-
phoneme conversions which are very regular for the Albanian orthography.
H. 5.2.1.2. Following the first hypothesis, it expected that word latencies for
the Year 1 Albanian children will be longer than the latencies for the English children.
H. 5.2.1.3. Ellis and Hooper (2001) found that Welsh children read
significantly more words than the English children; however, they knew fewer word-
meanings than the English children. They suggest that this may have resulted as a
consequence of their bilingualism. If that is the case, then the monolingual Albanian
children are expected to know more word meanings than the Welsh children.
H. 5.2.1.4. The next hypothesis concerns the error types. Ellis and Hooper
(2001) found that English children producing more visually similar real word
substitutions, whereas Welsh children produced more non-word type
Chapter 5
mispronunciations. It is predicted that errors made by Albanian will be more non-
word type errors, than word replacement.
5.2.2 Hypotheses related to Year 1,2, and 3 Albanian children
H. 5.2.2.1. Within the Albanian sample, due to the amount of literacy
115
instruction received, it is expected that older children will perform better than younger
ones in reading, spelling and all the sub skills tasks.
H. 5.2.2.2. The Albanian orthography is highly transparent bi-directionally,
therefore there should be no discrepancy between children's reading and spelling
scores.
H. 5.2.2.3. With regard to the RAN tasks, rapid naming of digits and letters
should be more related to reading than rapid naming of objects and colours.
5.2.3 Age differences
The children participating in the present study are of the same chronological
age as the English and Welsh children of Ellis and Hooper (2001). However, it
should be noted that most English and Welsh children go to nursery school and play
groups at the age of 3-4, where they are taught literacy skills such as letter knowledge
and sound awareness. Thus, by the time English and Welsh children enter formal
education at the age of '5, they already have some knowledge of the letters and the
alphabet. In Albania, programs similar to the nursery schools of England and Wales
do not exist, and only a minority of preschoolers go to kindergarten. Many, though
not all, of these Albanian kindergartens are similar in ethos to the Austrian ones
described by Wimmer and Hummer (1990), where activities such as word exposure
and letter recognition are explicitly discouraged. The consequence is that most first
graders in Albania enter school without letter or written word awareness (Hoxhallari,

Chapter 5" 116
2000). Thus the three language groups are matched for chronological age but the
Albanian children have had less print exposure and less reading instruction. These
aspects of the design thus bias against any literacy advantage in the Albanian group.
Similarly, although SES was not assessed, Albania is a much less wealthy country
than Britain with concomitantly less resources to invest in education and health. This
is another factor which would bias against the hypothesis.
5.3 Method for comparing with Ellis and Hooper study
(2001)
5.3.1 Participants
In order to compare reading accuracy of Albanian children with that of
English and Welsh children from the Ellis and Hooper study, 20 monolingual
Albanian children from a primary school located in a city in south-east Albania took
part in the experiment. The participants were medium-achieving pupils on the most
recent maths test administered by the classroom teacher, a method, employed by Bast
and Reitsma (1997), to exclude the worst and best students from the study, Although
this selection procedure differed from that of Ellis and Hooper who examined whole
classes, the results are still comparable as average achievements are examined and not
at the range of individual differences. It should be noted that the sizes Albanian
classess were much larger (over 30 children per class) than those of Ellis and Hooper.
Thus the process of selecting the middle 20 achieving children in a maths test serves
as a random selection process.
Despite the fact that the Albanian orthography is extremely transparent and
used to be taught with a phonics method, the Albanian government has recently

Chapter 5 117
prescribed a whole word method, known as the Global method (Xhumari, 2003) for
all state schools in the country. Therefore many experienced teachers, including the
teacher who taught the children who participated in the present research, use a mix of
the global/whole word and phonics method. Thus, the teaching method used to teach
literacy to the Albanian children who participated in this research is similar to
teaching method employed in English and Welsh schools in that it is a mixture of
techniques. Again, contra the hypothesis, any predominance of the Albanian national
curriculum should bias towards a whole-word rather than an alphabetic reading
strategy.
There were eight boys and twelve girls, with a group mean age of 7 years and
6 months (SD =6 months). According to the classroom teacher, all the participants
were normally developing children with no reading or spelling difficulties, and they
came from a mix of social backgrounds. There is no reason to believe that the school
attended by the children was either a very good or a very poor performing school. We
believe therefore that the participants are a representative sample of Albanian school
children. Prior to testing the Albanian children had received formal reading
instruction for 8 months. The data collected from the Albanian children was compared .
to the existing data from Ellis and'Hooper. In their study 20 Welsh children were
selected from the Welsh primary schools and 20 English children from English
schools. There were 17 girls and 23 boys. They were either 6 or 7 years old and
attended Year 2. The two groups were matched with regard to their participants'
exposure to reading, with the majority having only been introduced to reading at
school. Testing was carried out during the second semester of the school year.

Chapter 5
5.3.2 Materials
The Albanian 100-word reading test is described in detail in Chapter 4,
sections 4.2.1.1 and 4.2.1.2.
5.3.3 Procedure
Each participant was tested by a pair of experimenters. Three pairs of
118
experimenters worked in one large room, far from each other, so that the participants
could not disturb each other. The word reading procedure was identical to the Ellis
and Hooper study. The participants were asked to read the words and to speak loudly
and clearly because they would be recorded on a tape. The tape was used as a backup
in case the experimenter missed the timing of the response. A piece of plain card was
used to cover the list, and the child was asked to move the card down when the first
experimenter said `next', and to read the following word immediately. A stopwatch
was used to record latencies, 'from the onset of word presentation to the response
onset. Using a stopwatch like this provides sufficient reliability to clearly discriminate
individual differences between readers and between words-for example, the inter-
observer correlation between the reaction times measured by two separate
experimenters measuring the word-readings of the same child was highly significant
(r=0.93, p<0.01). If the child made no response after 15 seconds, the experimenter
would ask them to try the next word. Each child was given up to four practice trials
to show that they understood the instructions. The reading test was discontinued if
five consecutive errors were made. The reading errors were written down on a
separate sheet by the second experimenter.
After the reading test was completed each child was asked to explain the
meaning of each word by giving a synonym, an explanation, or a correct usage in a
Chapter 5
sentence. Each word was presented visually and was also read aloud by the
experimenter. The responses were noted on a separate sheet. If more than 5
consecutive meaning errors were made the test was discontinued.
5.4 Results
119
Reading accuracy. The Albanian children read on average up to the 80th word
from the reading list (SD = 16.42). In the Ellis and Hooper study the English children
read on average up to the 52"d word (SD = 11.7), and the Welsh children read up to
the 61St word (SD = 16.2). These group differences are significant (by itemF(2,98) _
40.4, p < 0.001; by subject F(2,38) = 20.7l, p<0.001). Post-hoc Bonferroni test
showed that the Albanian children were significantly better at reading accuracy than
both the English and the Welsh children.
In order to verify these effects are not due to minor differences between the.
token frequency distributions of the parallel test items in the three languages, effects
of language on accuracy using ANCOVAs with 1og10 frequency as the covariate were
assessed. The language group differences remained highly significant F (2,95) =
33.80, p < 0.001. Post-hoc Bonferroni test showed that the Albanian children were
significantly better at reading accuracy than both the English and the Welsh children.
For the Albanian sample gender ratio had no effect on reading accuracy
t(18)=-0.56, n. s. (by subject analysis).
Reading latency. Albanian children read on average with a pace of 2.66
sec/word (SD = 1.58), with the short words being read at an average pace of 1.49
sec/word (SD = 0.65) and long words at 3.87 sec/word (SD = 1.33). The English
children read on average at 1.41 sec/word (SD = 1.13), and the Welsh children at
1.85sec/word (SD = 1.11). These group differences are significant (by item F(2,98)

Chapter 5 120
= 16.8, p < 0.001; by subject F(2,38) = 24.69, p < 0.001). Post-hoc Bonferroni test
showed that the Albanian children's reading latencies were significantly longer than
both English and Welsh children's reading latencies. These effects of language group
on latency remain significant when tested by ANCOVA with loglO frequency as the
covariate F (2,95) =15.13, p<0.001. Again, post-hoc Bonferroni test showed that
the Albanian children's reading latencies were significantly longer than both English
and Welsh children's reading latencies.
Regression analysis for the Albanian group relating latency of correct
responding to loglO frequency shows that that reading latency increases by 0.89 units
for each decreasing loglO frequency step (B = -0.89, SE B=0.079, ß = -0.75, F (1,
98) = 124, p <. 01).
Figure 5.1 depicts the reading latencies for correctly read items in Albanian,
Welsh and English. It is clear that for the first 30 to 40 items the latencies for all
groups are not very different. The main differences in word latencies appear to be for
the last 50 items, especially between the English and Albanian children. A regression
of reading latencies on test word number resulted in the following functions for the
Albanian children y=0.041x + 0.579, English children y=0.013x + 0.863, and
Welsh children y=0.021x + 0839 (Albanian B=0.041, SE B=0. O04, ß = 0.75, F (l,
98) = 128, p <. 0001, RZ = 0.56; English B'= 0.013, SE B=0.005, ß = 0.30, F (1,98)
=7.7l, p<. 01, R2=0.087; Welsh B= 0.021, SEB=0.03, ß=0.58, F(1,98)=
48.6 < . 001, R2 = 0.33). Using the z-statistic (Sachs, 1982, p. 430) it was found
that the R2 s differ significantly from each other between all three language groups (all
z>1.96, p<0.05).

Chapter 5
8
7
6
5 Co C v4 u) CI)
.S3 U C a) 2 . a. (0
J C)
N NO
A
°
°
o °
p °o
pp°
R 100 12 e
�wen gui,
ja
°o ýS
*ý *ppýE
pp
121
Albanian reading latency y=0.041x+0.579
English reading latency y=0.013x+0.863
Welsh reading latency y=0.021x+0839
13 Albanian
* Welsh
o English
0 20 40 60 80 100
Test Word Number
Figure 5.1. Reading latencies for correctly read words in Albanian, English and
Welsh.
Reading latencies as a function of word length. Regression analysis reveals
that for the Albanian children, reading latency is a function of word length B= -0.50,
SE B=O. 021, ß = -0.93, F (1,98) = 587, p< . 001. Figure 5.2 shows that reading
latency for correct responses is more a linear increasing function of word length for
the Albanian children (R2 =. 86) than for the English (R2 =. 22) and the Welsh
children (R2=. 68). Using the z-statistic it was found that the R2 s differ significantly
from each other between all three language groups (all z>1.96, p<0.05).

.ý
Chapter 5
6
5 0) v C 04 U 4)
CO
.ý3 U C N2 (0
Q) C_ l N UQ
8
7 a
D D
D,
D
*D iE #0
,
40 °D
D6D """
D pi 4. ß''ö o "'
o "$ "
.n°S°
0 Albanian
* Welsh
.... A English
o2468 10 12 14 16
Word Length
Figure 5.2. Latency as a function of word length for words correctly read aloud.
122
Word comprehension. On average, the Albanian children gave accurate
definitions or appropriate usages for 50% (SD = 11.09) words of the reading list.
Compared to Ellis and Hooper, where the word comprehension results for the English
and Welsh children were 45% and 36 % respectively, the scores for the Albanian
sample are higher (F (2,98) = 50.1, p<0.001). Post-hoc Bonferroni tests showed
that Welsh children had significantly lower word comprehension scores than English
and Albanian children; no significant differences were found between Albanian and
English children. ANCOVAs with Iog10 frequency as the covariate revealed similar
results-the language group differences remained significant F (2,95) = 3.69, p<
0.05. Post-hoc Bonferroni tests showed that for reading comprehension, there were
significant differences between the Albanian and Welsh children but not between
Albanian and English children.

Chapter 5 123
In Figure 5.3 reading and word comprehension scores för Fnglish, Welsh and
Albanian are presented. It is clear that Albanian children read more words than
English and Welsh children, and that word comprehension scores are much lower for
the Welsh group. As already reported above these differences were fiOund to he
significantly different (Post-hoc Bonferroni tests). When the ratio ofwords
comprehended and word read is considered, Year 1 Albanian children could read
beyond their comprehension level. Their reading accuracy: word comprehension
ratio was 1.61. This ratio is similar to the Welsh ratio 1.68, but not to the Fnglish
ratio 1.16. This indicates that both Albanian and Welsh children could accurately
read more words that they could comprehend, whereas I nglish children could read
only a little beyond their word comprehension level.
90
80
70
60
0 L 50 :::
omprehenson v
30
20
10
0 English Welsh Albanian
Languages
/figure 5.3. Reading and Word comprehension scores for English, Welsh and
Albanian.
Reading Errors. In total 296 errors were made by the Albanian children. I'hc
errors shown in "Table 5.1 were classified as null responses (no response within 15
seconds), word replacements, or other attempts, which resulted in non- ord

Chapter 5 124
responses. Examples of error types made by the participants in each language are
presented in Table 5.2. Most of the errors made by the Albanian children were non-
word errors (64.9%), whereas null responses were very rare (only 4.4%). Whole
word substitutions (30.7%) were not as frequent as nonword errors. Table 5.1 also
shows the distributions of Welsh and English errors. Overall, the error rates suggest
that Albanian and Welsh error patterns are very similar, whereas the English errors
are quite differently distributed. Univariate ANOVA revealed significant differences
between languages for each of the three error types. Post hoc Bonferroni tests
revealed that Albanian and Welsh children had significantly fewer null responses
(4.4% and 13.7% respectively) than English children (30.8%) (p<. 01). Furthermore,
Albanian and Welsh children commit more non-word errors (64.9% and 72.5%
respectively) than the English children (24.5%) (p<. 01). However, English children
tend to make significantly more real word replacement errors (44.8%) (p<. Ol) than
Albanian and Welsh children (30.7% and 24.3%). All the differences between the
Albanian and Welsh children's errors were non- significant (p>. 01).
Albanian Welsh English
Error Type N%N%N"% Total ANOVA Null responses 13 4.4 a 52 13.7 a 112 30.8 b 177 F(2,57)=12.97,
P<. 001 Word 91 30.7 a 92 24.3 a 163 44.8 b 346 F(2,57)=7.25,
replacements p<. 01 Non-word errors 192 64.9 a 235 62.0 a 89 24.5 b 516 F(2,57)=27.27,
P<. 001 Total 296 379 364 1039
Table 5.1. Frequency of error types for Albanian, Welsh and English children. Note. a, b: Different letters show significantly different proportions for each error type
across the year-groups (using the Post-hoc Bonferroni test).

Chapter 5 125
Nonword errors Whole word replacements
Target Error Target Error
Albanian lidhur lidhrur ndan mban
duke bukre nuk ku
English political polluska though thought through
cryptic crypitic quick queen Welsh prydyddion ptydyddio dwy dwi
segurdod segurdob caeodd creodd
Table 5.2. Example of error types.
5.5 Cross-sectional data on literacy development (Albanian)
Next, the literacy development of Year 1,2, and 3 monolingual Albanian
children was examined.
S. S. 1 Participants
Participants were 60 monolingual Albanian children from a primary school
located in a city in south-east Albania. There was an equal number of children from
year one, two, and three (n=20). The 20 middle students, based on the most recent
maths test results, were selected by the teacher of each class as participants.
Following this method, which was first used by Bast and Reitsma (1997), the worst
and best students were excluded from the study. As presented in Figure 5.3, there
were selected 8 boys and 12 girls in Year 1 (M=7 years and 6 months, SD =6
months), 13 boys and 7 girls in Year 2 (M= 8 years and 4 months), and 10 boys and
10 girls in Year 3 (M= 9 years and 4 months).

Chapter 5 126
Mean age SD Gender
Years : months months # Males # Females
Year 1 7: 668 12
Year 2 8: 4 4.4 13 7
Year 3 9: 4 5.3 10 10
Table 5.3. Mean and standard deviations for age; and gender distributions for years 1,
2, and 3.
5.5.2 Test Materials and Procedure
All tests materials have been described in detail the Chapter 4, Section 4.2.
However, a very short description of each task is presented below.
5.5.3 Reading, Word Comprehension and Spelling tests
100-word reading and spelling test. The same reading test that was used in
the cross- language comparison for Albanian was administered to all children across
the three Albanian year-groups.
After the reading test was completed, in order to assess the Reading
Comprehension level, each child was asked to explain the meaning of each word by
giving a synonym, an explanation, or a correct usage in a sentence. The responses
were noted on a separate sheet. If more than 5 consecutive meaning errors were made
the test was discontinued. Inter-observer reliability analysis showed no differences
between the scores of two different rates on the same child (Kappa=. 95, p<. 001).
The word list for the reading test was also used as a spelling test administered
to the same children approximately one week later. The spelling test was
administered in a classroom setting and each child had to write down each word that
was read by the experimenter. All children worked at their own pace and the next

Chapter 5 127
word was read only when each child was ready. Each word was repeated three times
and the maximum score was 100.
Nonword reading and spelling tests (NWR and NWS). Both tests had 20 non-
words each (Appendix 2). In the NWR tasks each child was individually asked to
read the words and told that the task completion time was being recorded.
5.5.4 Phonological awareness tasks
Segmenting and blending tasks were employed. Both tasks, which were
administered individually, had 16 different words of increasing length and difficulty,
starting with three-letter words and ending with thirteen-letter words (Appendix 3).
Rapid naming. Four measures of naming speed were adapted from Van den
Bos et. al. (2002). The tasks involved serial naming of digits, letters, colours, and
objects. Each task had 50 items and was presented in 5 columns and 10 rows in A4
sheets. Each item occurred 10 times in the set of 50 and was presented in a random
order (Appendix 5).
5.5.5 Orthographic awareness task
In this task participants were given 17 pairs of pronounceable pseudowords.
For each pair, one item contained a bigram that never occurs in Albanian in the initial
or final position, and the other item contained a bigram at the same position, which
does occur in the language in that position (See Appendix 4). The participants had to
circle on the answer sheet the member of each pair that "looked like a word" or
"could be a word".

Chapter 5
5.5.6 Vocabulary knowledge
128
The second edition of The British Picture Vocabulary Scale (BPSV II, Dunn,
Dunn, Whetton, & Burley, 1997) was translated and adapted into Albanian. The
adapted test uses only the first 144 items of the BPSV II (Appendix 6).
5.5.7 General ability
Non-verbal intelligence (Coloured Progressive Matrices, Raven, 1958) and Generic
Speed were used to assess general abilities of all children (Appendices 6 and 7).
5.6 Results
5.6.1 Descriptive Statistics.
The means and the standard deviations for the three year groups on all tests are
presented in Table 5.1. As expected, for most of the tests, the mean performance
increases as a function of age. For NWR, and Segmenting the mean performance is
slightly higher for Year 1 than Year 2 but these differences are not significantly
different. The mean performance for the blending task between the three year-groups
in not significantly different F(59) = 0.60, p>0.5, although the mean scores are in the
expected direction.

Chapter 5 129
Test Year 1
(n=20)
Year 2
(n=20)
Year 3
(n=20)
F (2,57)
Mean SD Mean SD Mean SD
Word Reading 100 79.55 16.42 86.20 10.81 93.70 4.73 7.35**
Reading Latency 2.95 1.12 1.23 . 45 . 89 . 26 42.35** (in seconds)
Word Comprehension 49.60 18.91 71.95 7.76 84.35 9.11 103.56**
Word Spelling 100 74.55 12.74 84.20 5.23 94.30 3.54 56.66**
NWR 16.55 2.89 16.40 2.84 18.50 1.82 4.18*
NWS 12.15 3.47 18.55 1.00 19.05 . 89 64.30**
OAT 9.90 2.75 12.40 2.46 12.90 2.17 8.45**
Generic Speed 12.15 4.11 19.55 4.85 26.40 4.63 49.31**
Non-verbal IQ 13.45 6.67 16.90 4.20 25.70 4.71 28.38**
Digit naming (in seconds) 35.00 6.42 27.70 4.46 24.80 2.93 23.76**
Letter naming (in seconds) 36.15 10.86 27.95 5.17 26.55 6.74 8.49**
Colour naming 67.33 12.24 54.10 10.36 45.55 10.77 19.41 ** (in seconds) i Object naming 58.05 14.81 48.30 10.47 45.40 8.10 6.68** (in seconds) Segmenting - 11.95 1.93 11.35 2.01 13.80 1.88 8.66**
Blending 11.80 2.46 11.95 2.14 12.55 2.24 0.60
Vocabulary Knowledge 76.45 26.26 93.95 22.96 107.85 19.52 9.29**
Table 5.4. Descriptive statistics for Year 1,2, and. 3 Albanian children.
Note: ** p<. 01, * p<. 05
Post-hoc tests indicate that older children (especially Year 3 children) are
much better than younger children. Most of the significant differences are between
years 1 and 3, except in Word comprehension and NWR (see Table 5.5). Year 1 and
2 differ significantly from each other in many of the tasks except in Reading, Word
comprehension, NWR, Nor-verbal IQ, Segmenting and Vocabulary knowledge.
Significant differences between years 2 and 3, are only in Word Comprehension,
Spelling, NWR, Generic speed, Non-verbal IQ, and Segmentation task.

Chapter 5
Year 1 v. 2 Year! v. 3 Year 2 v. 3
Word Reading 100 x
Reading Latency x x
Word comprehension x x x
Word Spelling 100 x x x
NWR x
Non-words read/second x x x
NWS x x
OAT x x
Generic Speed x x x Non-verbal IQ x x Digit naming x x
Letter naming x x
Colour naming x x
Object naming x x Segmenting xx
Vocabulary Knowledge x
Table S. S. Crosses indicate significant pairwise comparisons.
5.6.2 Serial naming measures
Table 5.6 shows that the means for Serial Digit and Letter Naming are very
close to each-other. The same applies to Serial Colour and Objects naming. Also,
correlations are relatively high . 75 and . 70 (Table 5.7). Therefore, it would be
reasonable to combine digit and letter naming into a new variable and Colour and
Object naming into another variable. This would increase the reliability of these
130
variables.

Chapter 5
n=60 Mean Std. Deviation
Digit naming Letter naming
29.17
30.22
6.42
8.91
Colour naming 55.67 14.21 Object naming 50.58 12.52
Table 5.6. Means and st. deviation for serial naming tasks.
Digits Letters Colours Objects
Digits
Letters 0.76** Colours 0.63** 0.32*
Objects 0.55** 0.30* 0.70**
Table 5.7. Pearson Correlations for serial naming tasks. Note: **p<0.01 level (2-tailed), * p< b. 05 level (2-tailed).
5.7 Analysis for the Year 1,2, and 3 Albanian data
5.7.1 Reading Aloud Accuracy
131
There is a significant difference between the groups in the reading task. The
Bonferroni test in Table 5.4 reveals that there is a significant difference between
Years 1 and 3, but not between Year 2 and 1, and 2 and 3. These differences can be
seen as the approximately 80th word from the reading list for Year 1 children, 86th for
Year 2, and 94th for Year 3. Only five Year 1 children, and one Year 2 child, reached
the cut-off criterion of 5 consecutive errors.
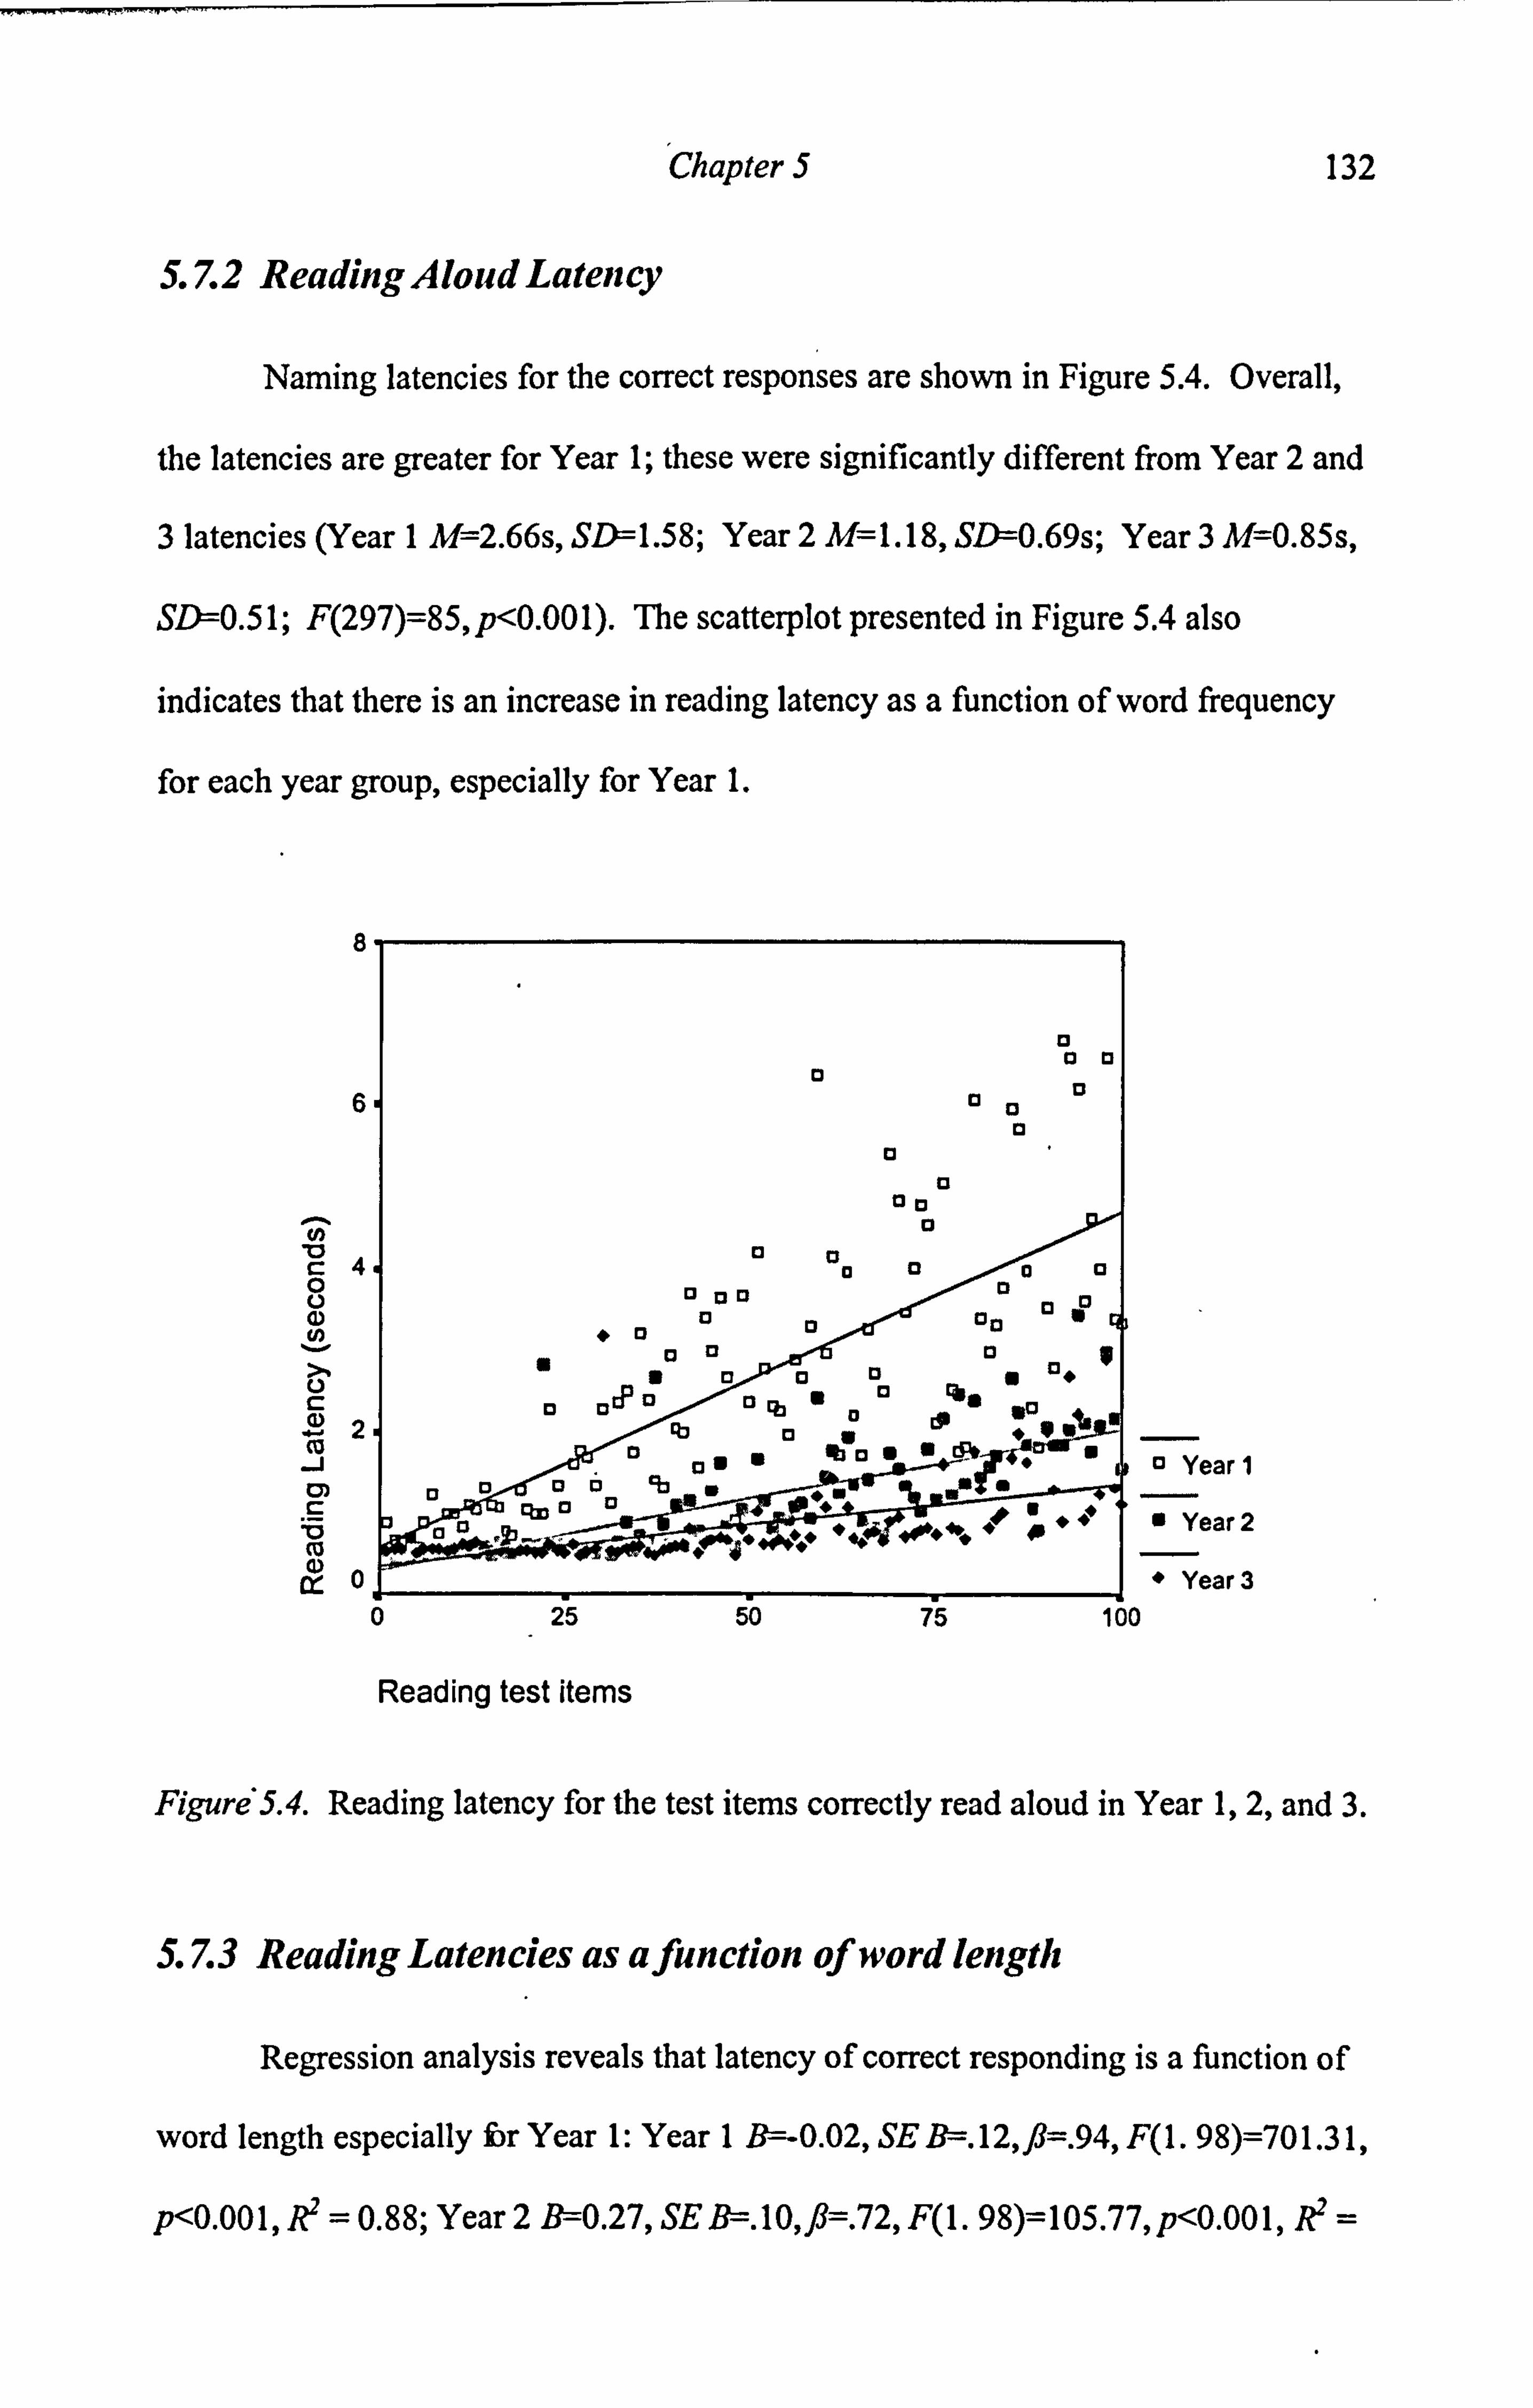
Chapter 5
5.7.2 Reading Aloud Latency
132
Naming latencies for the correct responses are shown in Figure 5.4. Overall,
the latencies are greater for Year 1; these were significantly different from Year 2 and
3 latencies (Year 1 M=2.66s, SD 1.58; Year 2 M=1.18, SD=O. 69s; Year 3 M=0.85s,
SI=0.51; F(297)=85, p<0.001). The scatterplot presented in Figure 5.4 also
indicates that there is an increase in reading latency as a function of word frequency
for each year group, especially for Year 1.
8
6
N c4
0 U
C N2 Co J Q) C
G) ty
0
0 13 Year 1
" Year 2
" Year 3 0 25 50 75 100
0 a
op 0
0 00 0 00
0
oa °0
°O o"
°
I: b " 80
cp*
Reading test items
Figure 5.4. Reading latency for the test items correctly read aloud in Year 1,2, and 3.
S. 7.3 Reading Latencies as a function of word length
Regression analysis reveals that latency of correct responding is a function of
word length especially for Year 1: Year 19-0.02, SE B=. 12, ß=. 94, F(1.98)=701.31,
p<0.001, R2 = 0.88; Year 2 B=0.27, SE B=. l0, ß=. 72, F(1.98)=105.77, p<0.001, R2 =
a °°°
°° fo
o° ""oo°
DODD 13 43 °
°"U R3"°
4noýlý ý"

Chapter 5 133
0.52; and Year 3 B=0.24, SE B=. 08, ß=. 67, F(1.98)=77.97, p<0.001, R2 =. 44.
Figure 5.5 shows the relationship between average reading latencies and word length.
This function seems to be more linear for Yearl than Years 2 and 3.
8
co 4 U 4)
N U)
C 4? 2 N m r-
'0
a)
6
" ,.
.. "'.. . .. 0
Year 1
Year 2 ... .
Year 3 123456789 10 11 12
Word length (letters)
Figure S. S. Latency as a function of word length for words correctly read aloud in
Year 1.2 and 3.
5.7.4 Word comprehension
Year 3 pupils show the highest performance in this test. There is a significant
difference between the groups [F(57)=103.56, p<0.001J, and the Bonferroni test
reveals that there is a significant difference between all three years. Figure 5.6
indicates that Year 1 children read just a little beyond their comprehension level. On
average, Year 1 children gave correct definitions approximately for 50% of the words, Year 2 children 72%, and Year 3 children 84%. The reading aloud and
comprehension ratio for Year 1 is 1.61, whereas the ratio for Year 2 is 1.20, and Year
3 isl. l 1.

Chanter 5
Figure 5.6. Reading and word comprehension mean scores for Year 1,2, and 3.
5.7.5 Reading Errors
134
As in the Ellis and Hooper (2001) study, the reading test was discontinued ii'a
child made 5 consecutive errors. This resulted in 296 errors tör Year I children, 253
Ihr Year 2, and 126 errors for Year 3. The errors shown in Table 5.8 were classified
as null response (no response within 15 seconds), whole word substitutions, and other
attempts which resulted in non-word responses. Year I children made most errors Ihr
all the types and Year 3 children make the least amount oferrors. All three Albanian
groups commit mostly non-word errors (Figure 5.7).
The proportion of nonword errors and whole word replacements made did not
differ across the three year-groups (F<1, n. s. ). The only difference was found with
the null responses: Year 1 children made 13 of error type whereas Year 2 and 3
children made none (Bonferroni post- hoc test, p<001).

Chapter 5
Year 1 Year 2 Year 3 Error Type N "'o N % N `%o "Dotal ANOVA Null responses 13 4.4' 0 O
-Oh 0 0.0' 13 /'(2,57)=8.80, p<. 001
Word replacements 91 30.7 73 26.1 41 22.2 205 F<1 Non-word errors 192 64.9 180 73.9 85 67.8 457 F<1
126
Table 5.8. Error types for each year and column percentages in Reading.
Note. a. h. c: Different letters show significantly different proportions For each error type across the year-groups (using the Post-hoc Hon(crroni test).
250
200
150
100
i;
YEAR
D d1 1
QYýýar2
"Year 3
0
W
w- 50 O L^,
W
Zý Noll LiGelneflts No ii w(ud ý finis
ERROR TYPE
Cases weighted by READING
Figure 5.7. Frequencies for each en-or type committed by cacti group.
-5.7.6 Spelling Errors
All children were asked to spell all words, however, marking was discontinued
if live consecutive errors were made. Results for these tests were similar to the
reading test in that most errors were committed by the younger children (Year I, N=
509, Year 2, N= 31 G; and Year 3, N= 114) and that nonword errors were the most

Charter 5
common type of error for all groups (see 'T'able 5.9). I lowever, none of the
proportions across the year groups were significantly different.
º. cý
Year 1 Year 2 Year 3
ký
I'n-orType N `, 0 N `N, N `; '.. fatal ANOVA Null responses 11 2.60 5 1.70 -- 16 /(2,57)=226,
fr. S. Word 65 15.40 57 18.90 22 19.30 144 /'(2,57)=. 66, ii.. ti". replacements Non-word errors 346 82.00 240 79.50 92 80.70 678 /, (2,57)=1.28,
ir.. s. "Total 422 302 114 838
Male 5.9. Error types for each year and column percentages in Spelling.
From Figure 5.8 it is clear that the number of' null responses für both reading
and spelling is quite similar. There is a small difference in word replacements, where
more errors of this type are made in reading. The difference of non-word errors is
higher with more errors made in the spelling test.
300
200
100
rZ . READING
2E 0 SPELLING Null responses WoiJJ I; . ýý_r ments Non-word errors
Error Types
Figur-c 5.8. The number of errors made in reading and spelling tier each error type.

Chapter 5 137
Overall, more errors were made in spelling than reading. Most word
replacements were made in reading and most non-word errors were made in spelling.
5.7.7 Reading and spelling comparisons
It was predicted that in the highly transparent Albanian orthography there
should be no discrepancy between children's reading and spelling scores. A 2x3
repeated measures ANOVA failed to find an interaction between Task (Reading and
Spelling) and Year (3 year groups). A main effect for Age was present F(2,18)=33.70,
p<. 001, but not for type of task. This suggests that within each age-group Albanian
children read and spelled at similar levels.
5.8 Regression analyses for Reading and Spelling abilities.
In this section it was intended to carry out exploratory (regression) analysis
within each Year group. However, given the small number of participants within
each Year (n=20) and the large number of the predicting variables2 (sub-skills
assessed, n=11) this analysis was not possible. Instead, regression analysis was
carried out for the entire sample (all three years combined, n=60). This gives only a
general picture of the contribution of various sub-skills (e. g. phonological and
orthographic skills) to reading and spelling ability.
Correlation analysis for the entire sample revealed that Reading was
substantially correlated with all variables except OAT (See Table 5.10). Reading
ability was most strongly correlated with Spelling, NWR, and RAN Alphanumeric.
2 An attempt was made to reduce the number of the sub-skill variables by collapsing the scores of Blending and Segmenting tasks into a composite score variable-Phonological Tasks.

Chapter 5 138
Spelling was significantly correlated with all the remaining variables. Spelling ability
was most strongly correlated with CPM, NWS, and Reading, and least correlated with
OAT. There are two reasons that might be responsible for these low correlations
between OAT and reading and spelling ability: (i) orthographic knowledge does not
contribute much to reading and spelling in the transparent Albanian orthography; (2)
OAT might not be a very good measure of orthographic skills. Supporting evidence
comes from the reliability analysis-Chronbach's alpha value was very low3 (a =
. 59)
With regard to the rapid naming tasks, RAN Alphanumeric has higher
correlation values with reading and spelling that RAN Objects and Colours. This
supports the hypothesis that rapid naming of digits and letters should be more related
to reading than rapid naming of objects and colours.
1 2 3 4 5 6 7 89 10 1 Reading 2 Meaning .
55** 3 Spelling . 69** .
65** 4 NWR . 59** . 46** . 61** 5 NWS . 41** . 56** .
67** . 55**
6 OAT . 21
. 32* . 40**
. 36**
. 42**
7 Generic Speed . 46** . 62** . 65**
. 51** . 63** . 32*
8 CPM . 53** . 65** . 76** . 52** . 60** . 40** . 57** 9 RAN Alphanumeric -. 63** -. 52** -. 62** -. 68** -. 63** -. 31* -. 62** -. 48**
10 RAN Colours & Objects -. 40** -. 31* -. 44** -. 42** -. 62** -. 26* -. 54** -. 48** . 49**
11 Phonological tasks . 36** . 31* . 44** . 29* . 23 . 14 . 12 . 38** -. 32* -. 04
Table 5.10. Correlation matrix for all the variables for Albanian children.
5.8.1 Reading
Two regression methods were used for each regression analysis: Enter and
Stepwise method. Table 5.11 shows the variables entered in the regression analysis in
which Reading ability was entered in the model as the dependent variable. The
In order to have a'reliable measure, Chronbach's alpha level needs to be closer to 1.

Chapter 5 139
model explained 58 % of the variance (R2=. 58), and Spelling was the only significant
predictor. Stepwise regression (Table 5.12) revealed that Spelling and RAN
Alphanumeric were the only significant predictors of reading ability. This result
indicates that in transparent orthographies rapid naming of alphanumeric stimuli is a
better predictor of reading acquisition than phonological tasks
B Std. Error Beta NWR 6.91 5.31 0.18 RAN Alphanumeric -0.46 0.26 -0.26 RAN Colours & Objects -0.09 0.13 -0.08 Vocabulary -0.03 0.06 -0.06 Phonological Tasks 0.29 0.80 0.04 CPM -0.01 0.26 -0.01 Generic'Speed -0.18 0.25 -0.10 OCT -0.54 0.48 -0.12 Spelling 0.51 0.17 0.51 *
Table 5.11. B coefficient values, standard errors of B, beta values, and t-scores of the
predicting variables where the dependent variable is Reading using Full Entry
regression. Note: *p<. 05.
B Std. Error Beta Step 1 Spelling 0.70 0.10 0.695**
Step 2 Spelling 0.50 0.12 0.498** RAN Alphanumeric -0.56 0.20 -0.316*
Table 5.12. Summary of Stepwise Regression Analysis for variables predicting Reading ability in Albanian.
Note: R2= . 38 for Step 1; ? R2=. 55, p<. 001 for Step 2. *p<. 05, ** p<. 001.

Chapter 5
5.8.2 Spelling
Table 5.13 shows the variables entered in the regression analysis in which
Spelling was the dependent variable. This resulted in CPM, Reading and Generic
140
Speed as the best predictors of Spelling. These model accounted for approximately
76% of the variance (R2=. 76). Stepwise regression revealed similar results with CPM
being the best predictor followed by Reading and Generic Speed in steps 2 and 3. In
step 4 the contribution of Phonological Tasks was also significant (Table 5.14).
B Std. Error Beta NWS 2.62 4.02 0.07 RAN Alphanumeric -0.05 0.20 -0.03 RAN Colours & Objects 0.03 0.10 0.03 Vocabulary -0.02 0.04 -0.05 Segmentation 1.04 0.58 0.15 CPM 0.62 0.18 0.36** Generic Speed 0.44 0.18 0.25* OCT 0.36 0.36 0.08 Reading 0.28 0.10 0.29**
Table 5.13. B coefficient values, standard errors of B, beta values, and t-scores of the
predicting variables where the dependent variable is spelling. Note: *p<. 05, **
p<. 001.
B Std. Error Beta Step 1 CPM 1.317 0.149 0.757** Step 2 CPM 0.942 0.15 0.542** READING 0.407 0.086 0.409** Step 3 CPM 0.758 0.157 0.436** READING 0.353 0.084 0.355** Generic Speed 0.413 0.15 0.238** Step 4 CPM 0.661 0.16 0.38** READING 0.313 0.084 0.315** Generic Speed 0.468 0.149 0.269* Phonological Tasks 1.063 0.522 0.154*
Table 5.14. Summary of Stepwise Regression Analysis for variables predicting Spelling ability in Albanian. Note: R2= . 57 for Step 1; ? R2= . 68, p<. 001 for Step 2;
? R2= . 72, p<. 001 for Step 3; ? R2= . 73, p<. 001 for Step 4. Note: *p<. 05, ** p<. 001.

Chapter 5
5.9. Discussion
5.9.1 Ellis and Hooper study comparisons
These data triangulate and confirm conclusions of Ellis and Hooper (2001)
with respect to the effect of orthographic transparency on the rate of reading
141
acquisition and the strategies children use in the beginning stages of learning to read.
The rate of reading acquisition is faster the shallower the orthography: Year 1
Albanian children were able to read correctly more words than the Welsh and far
more words than the English children of Ellis and Hooper (2001), with Albanian
children reading approximately 80% of the reading test items of their language after
just one year of school education. This percentage covers the 8021 most frequent
word types of Albanian (equvalent to approximately 87% of written Albanian tokens),
whereas from the Ellis and Hooper study, English children could read only about 52%
of the English test items, a coverage generated by the 716 most frequent word types
(approximately 64% of written English tokens). Comparable Welsh children read
approximately 61% of their test, a coverage generated by the 1821 most frequent
word types of Welsh (approximately 81% of tokens). This finding is consistent with
other studies of the effect of transparency on rate of acquisition including Wimmer
and Goswami (1994), Öney and Durgunoglu (1997), Seymour et al., (2003) and
Spencer and Hanley (2003).
Two strands of evidence show that beginning readers (Year 1 children) in the
shallow orthography of Albanian rely on a GP conversion strategy: (i) the strong
effect of word length on their reading latency, and (ii) their high proportion of non-
word errors.

Chapter 5 142
Albanian children's reading latencies were greatly affected by word length (R2
_ . 89). This is consistent with their attempting to pronounce long, novel or infrequent
words by phonological recoding using a leftto-right parse, thus, the more the letters
in a row, the longer the production time. This finding is reaffirmed by the fact that
Albanian children's latencies were longer than English children's, and also longer
even than the Welsh children's. This suggests that the greater the orthographic
transparency, the more likely a phonological reading strategy is to be consistently
employed. One might have expected that Albanian and Welsh would be more or less
similar in this respect, since both orthographies are highly transparent, yet the
complete transparency of Albanian ties children's reading latencies even more tightly
to word length. Latency differences across the groups cannot be attributed to word
length. Word length differences are non-significant; the difference for the last 60
words is also non-significant. However, it should be remembered that there are fewer
correct responses in the English group; indeed there were 17 words for which there
were no correct responses for the English group. Thus, the Welsh and especially
Albanian latencies are penalized by the presence of a greater number of low-
frequency data points. Albanian children went further in the lists than did the other
children; they were particularly slow on hard words. Higher latencies for Albanian
children could also be due to comparably less practice as they were only in the first
year of primary education.
The second strand of evidence that beginning readers in the shallow
orthography of Albanian rely on a GP conversion strategy comes from error analyses.
Unlike their English counterparts, Year 1 Albanian children made more non-word
errors than any other kind of error. This high proportion of non-word errors suggests
that their reading strategy relies heavily on alphabetic recoding, as demonstrated for

Chapter 5 143
reading of other transparent scripts by Wimmer and Hummer (1990), Spencer and
Hanley (2003), Seymour et al., (2003), and Ellis and Hooper (2001). When
phonological recoding goes wrong, the likely pronunciation error is a nonword; when
whole-word lexical access on the basis of partial visual analysis goes wrong or when
partial phonetic cueing is employed, the likely result is a word. A phonological
reading strategy also means that children are prepared to `have a go' at reading any
word: despite the fact that the Albanian children have had less time on task of reading
than the English children, they tended to make very few null responses. Regularity of
orthography gives children greater confidence in trying to read new words. Following
this strategy they will develop a `self-teaching' mechanism, which allows them to
enlarge their sight-word reading lexicon (Share, 1995).
Finally, the word comprehension level of the Year 1 Albanian children was
superior to that of Welsh children. SES was not assessed therefore the comprehension
results may be difficult to interpret. Nevertheless, Albanian children gave accurate
definitions for 50% of the words, compared to the English children 45%, and Welsh
children 36%. The finding that the Year 1 monolingual Albanian children performed
better in word comprehension than did Year 2 bilingual Welsh children of the same
age is consistent Ellis and Hooper's (2001) suggestion that their Welsh children's low
comprehension scores was a consequence of bilingualism.
Orthographic depth also had an effect on reading comprehension. The reading
comprehension level of the Year 1 Albanian children was superior to that of the
English and Welsh children. Albanian children gave accurate definitions for 50% of
the words, compared to the English children 45%, and Welsh children 36%. Of
course the design used in the pilot study also tested whether children knew the
meanings of words they could not read aloud correctly. However, a hypothesis

Chapter 5 144
worthy of further testing is that compared to their English counterparts, the ability to
easily decode new words allowed the Albanian children to read more words and thus
to further develop their vocabulary knowledge. It is generally argued that a reciprocal
relationship exists between reading ability and vocabulary knowledge: well developed
vocabulary knowledge, allows good reading comprehension (Beck, Perfetti, &
McKeown, 1982; McKeown, Beck, Omason, & Perfetti, 1983; Stahl, 1983); reading
experience allows children to infer the meanings of new words in context and so to
expand their vocabulary (Stanovich, 2000). Stanovich has called such phenomenon
whereby the rich get richer "Matthew effects" (Stanovich, 1986; Stanovich & West,
1989; Stanovich, 2000). The finding that the Year 1 monolingual Albanian children
performed better in reading comprehension than did Year 2 bilingualWelsh children
of the same age is also consistent Ellis and Hooper's speculation that their Welsh
children's low comprehension scores was a consequence of bilingualism.
5.9.2 Reading and spelling ability for Albanian Year 1,2 and 3.
Older Albanian children performed better than the 1st and 2 "d year children at
the reading, spelling and sub-skills tests. This age effect is not surprising and it is due
to cognitive maturity and literacy. Research has shown that variation in print
exposure is related to differences in reading comprehension and word recognition
ability (West & Stanovich, 1989; Cunningham & Stanovich, 1990,1993; Koolstra,
Van der Voort & Vooijs, 1991; Cipielewski & Stanovich, 1992; Anderson, Wilson &
Fielding, 1988).
5.9.2.1. Reading
Reading ability, for all three Albanian groups, is more developed than their
comprehension level.
Chapter 5 145
Naming latencies for correct responses for Year 1 were higher than the
latencies of Year 2 and 3 (Year 1, R2=. 88; Year 2, R2=. 52; and Year 3, R2=. 44
Reading latencies for correct responses for Year 1 were higher than the latencies of
Year 2 and 3 and the word length effect is slightly stronger in Year 1 than in Year 2
and Year 3. This suggests that the reading fluency in Year 1 children is not as well
developed as the fluency of older children. However, this indicates that younger
children rely more heavily on grapheme-phoneme conversion reading strategy,
whereas older children rely on bigger units, such as onset, rime, whole word
recognition. The developmental models of Frith (1980) and Ehri (1992)-which have
been proposed for learning to lead in English-generalise here. Thus, young Albanian
children start at the alphabetic stage and following print exposure, reach the final
orthographic stage or use sight word reading. The sight word reading model (Ehri,
1999), predicts that the strength of the effect of word-length on reading latency in
Year 1 should diminish as reading becomes skilled. Further exposure to print should
allow Albanian children to soon move into the consolidated alphabetic phase, where
written words become sight words, and where letter patterns recurring in different
words become consolidated into larger pronunciation units. Such whole word reading
strategies involve a shift from serial to parallel access, and thus the word length effect
should become less evident in skilled readers with well-developed orthographic
lexicons. More recent reading research with German speakers (Ziegler, Perry, Jacobs
& Braun, 2001) suggests that the word length effect persists even in adulthood.
Nevertheless, the German orthography is not as consistent as the Albanian
orthography.
When the reliance on an alphabetic reading fails, the likely pronunciation is a
nonword. Indeed, the highest proportion of nonword errors was made by Year 1

Chapter 5 146
children, the least by Year 3. When reliance on lexical access by means of partial
visual analysis or partial phonetic cueing fails, the likely result is a real word. In
reverse pattern, Year 1 children made the smallest proportion of whole-word
replacement errors, whereas Year 3 children had the highest proportion. Once again,
these findings suggest that younger children rely more heavily on grapheme-phoneme
conversion reading strategy, whereas older children rely on bigger units, such as onset,
rime, or sight word recognition as suggested by the developmental models of Frith
and Ehri. These findings are also supported by the self-teaching mechanism suggested
by Share (1995), in which phonological recoding allows children to store the
representation of a word in the orthographic lexicon and use these representations for
fast and successful reading.
5.9.2.2 Spelling
In spelling similar error patterns to reading emerged for each year- group: very
few null responses, a few real word replacements, and many nonword errors. The
error pattern suggests that young Albanian children rely on a phonological recoding
strategy from phoneme to grapheme level when spelling. Most of the nonword errors
were made by Year 1 children and the least amount of these errors was made by Year
3 children. Year 1 children made the smallest proportion of whole-word replacement
errors, whereas Year 3 children had the highest proportion. Even though in both cases
ANOVA did not show significant differences, the emerging pattern points to the right
direction. The Albanian children have the advantage of using the letter names to spell
correctly. This advantage is mediated by the fact that the letter names in the alphabet
correspond to the phonetic pronunciation (even though most people, when
pronouncing the consonants from the alphabet, tend to add a schwa at the end of some
letter names/sounds, this does not appear to be an obvious problem in spelling or

Chapter 5 147
reading). Older children might rely on larger units for spelling, however, given the
extremely transparent orthography, relying on a phonological recoding strategy from
phoneme to grapheme level when spelling seems a sensible strategy to use regardless
of literacy experience.
The pattern that results from nonword errors across the ages for the reading
and spelling tests is of theoretical importance. For spelling there is a steady decrease
of nonword errors as a function of age. For reading, there is a small difference
between Year 1 and Year 2, followed by a drastic drop from Year 2 to Year 3 (Figure
5.6). This could be due to print exposure; however, there must be something more to
it. Older children's ability to use context information is another factor that could be
responsible for this sudden change in nonword error rate. Stanovich's interactive-
compensatory model (Stanovich, 1980) takes into account the context effect. The
interactive part of the model assumes that word recognition is based on information
provided from different knowledge sources, whereas the compensatory part assumes
that a deficit in any knowledge source is compensated by greater use of information
form other sources. Thus, a poor reader who has difficulties with word analysis skills
might make a better use of the contextual effects. Although the test items in the
present study were presented individually - therefore, making it impossible to use
context information - previous word recognition experience, and especially a larger
orthographic lexicon and better reading comprehersion abilities serve as a
compensatory tool for Year 3 children in individual word recognition tasks.
5.9.3 Reading and spelling comparisons
Research has shown that in English, at least, spelling is more difficult than
reading: in the first years of formal education, spelling ability tends to develop at a
slower rate than reading ability, dyslexic children have more problems with spelling

Chapter 5 148
than with reading tasks (Frith, 1985; Treiman, 1997), and spelling is more resistant to
treatment than reading (Bruck, 1990). Yet perhaps this is the case only in deep
orthographies. One issue raised in this pilot study is as follows: if the bi-directional
relationship between letters and sounds is extremely. transparent in the Albanian
orthography and Albanian children rely on alphabetic decoding skills for both reading
and spelling, then there should be no discrepancy between their reading and spelling
accuracy scores. Indeed, in the present study reading and spelling scores were at
similar levels within each of the three age groups examined, suggesting that in bi-
directionally transparent orthographies, reliance on alphabetic skills for reading and
spelling results in similar levels of success. However, the current findings do not
suggest that reliance on alphabetic skills is the only strategy that used by children
learning to read in transparent orthographies. A lexical decoding strategy can also be
used for familiar words for which mental representations are already in the mental
lexicon. Thus when reading the 100 items of the word list, Albanian children can use
lexical decoding for familiar words and alphabetic decoding for unfamiliar words. In
this pilot study small latencies for high frequency words and large latencies for low
frequency words were found. This indicates that accuracy is affected by both
strategies.
5.10. Skills involved in learning to read and spell
The second part of this pilot study was concerned with the skills that can
contribute to the reading acquisition process in a transparent orthography such as
Albanian. The main hypothesis concerning the skills involved in the reading
acquisition process was that the combined variable for the serial naming of alpha-
numeric items would be a better predictor of reading level than the phonological
awareness tasks, and serial naming of colours and objects. The finding of this study

Chapter 5 149
clearly supports this hypothesis: in a transparent orthography digit and letter naming
is a better predictor of reading acquisition. Object and colour rapid naming was not a
good predictor, thus supporting findings from previous research (Van den Bos et al.
(2002).
It was predicted that phonological and orthographic tasks would explain a
good proportion of reading variance; but none of the phonological and orthographic
awareness measures were significant predictors in the regression analyses.
Nevertheless, correlation analysis revealed significant correlations between reading
and NWR, and Reading and RAN Alphanumeric, whereas the correlation between
Reading and OAT was not significant. This suggests that phonological skills may be
more important to reading in the first three years of formal education than
orthographic skills. Nevertheless, one should bear in mind that the reliability tests
showed that these tasks were not highly reliable. Should these be used again, it would
necessary to increase the number of items.
Spelling was also a significant predictor of Reading. The contribution of
spelling to reading has also been identified in previous research (e. g., Ellis and
Cataldo 1990).
Further, exploratory analysis using regression analysis was performed in order
to see if which skills predicted spelling ability. When all the relevant variables were
entered in the model, it was found that, CPM, Generic speed, Reading and
Phonological tasks were significant predictors. One might have expected that NWS
would have been a good predictor of the Spelling task. From the analysis, the NWS
test was found to be highly reliable (Cronbach's a= . 86) and the post-hoc tests
revealed that Year 1 children had significantly lower scores than Year 2 and Year 3
children. Developmental models of spelling development (e. g., Frith, 1895) suggest

Chapter 5 150
that NWS should be a significant predictor. Correlation analysis revealed that NWS
was significantly correlated with CPM, Generic Speed and Reading tasks, suggesting
that the variability explained by NWS may have been already accounted for in the
regression analysis by these three variables. However, the interpretation of the
exploratory analysis on reading and spelling skills of Albanian children may be
difficult. One major issue that needs to be taken into account is the way the children
were selected. The samples in the present study consisted of the 20 middle achieving
children, thus excluding the worst and the best pupils. This restriction of range could
have consequences for the regression analyses, which are based on correlations: one
might end up with no inflated correlation. If the participants were selected at random
then the results of the regression analyses might have shown a very different pattern.
5.11 Conclusions
First, from the comparison of the Albanian findings with those of the Ellis and
Hooper it can be concluded that children learn to read an orthographically transparent
script wry quickly. Their reading accuracy is high. They quickly adopt a
phonological reading strategy that ties reading latency to word length, that generates
errors that tend to be nonword pronunciations, and that gives these children
confidence in `having a go' at new words. Word comprehension of Albanian children
was better than that of Welsh children, thus supporting the Ellis and Hooper
suggestion that word comprehension of Welsh children is a consequence of their
bilingualism
Second, older Albanian children performed better than younger children: they
received formal instruction longer. The highly transparent Albanian orthography
4 To avoid this problem, in the main study (Chapters 6 and 7) this selection procedure is not employed.

Chapter 5 151
allows Albanian children to rapidly master the alphabetic code, causing a fast reading
acquisition process. Reading and spelling processes in bi-directionally transparent
Albanian orthography are parallel: these processes seem to become parallel from the
start of the literacy acquisition as a result of successful reliance on alphabetic
decoding skills for both reading and spelling.
Third, in the transparent Albanian orthography RAN Alphanumeric and
Spelling were best predictors of reading acquisition. In spelling CPM, Generic speed
Reading, and Phonological tasks'the best predictors. Whilst some indication on the
relation between phonological awareness skills and literacy skills was evident, no
such indication was found for the relation of the orthographic and literacy skills.
Finally, the findings of the pilot study on the development of literacy skills in
Albanian should be carefully considered because several tests showed low reliability
(e. g., OAT, Blending, and Segmenting and the translation of the BPVS II), sample
size was small and the participant selection procedure was not suitable for the
exploratory regression analysis.

Chapter 6
Chapter 6: Reading and Spelling development in
Albanian: Main Study
6.1 Introduction
152
The pilot study presented in the previous chapter extended the findings of Ellis
and Hooper (2001) by examining monolingual children who were learning to read and
write in the very transparent orthography of Albanian. Data from Year 1 Albanian
was compared to the data from Ellis and Hooper. It was found that Albanian children
could read more of their language than English and Welsh children. This suggests
that that the rate of reading acquisition is faster the shallower the orthography.
The second part of the pilot study attempted to examine reading and spelling
development of Year 1,2, and 3 Albanian children. As expected, there was an age
effect on reading and spelling tests, but no differences were found between reading
and spelling accuracy scores within each year group. Overall, Spelling, and RAN
Alphanumeric were the best predictors of reading ability. Nonverbal IQ, Generic
speed, and Phonological tasks were the best predictors of spelling.
Following the pilot study, the next step was to increase sample size, and to
manipulate and improve some of the tests that had a low reliability.
Two types of real word reading tests were used. The first type was similar to
the 100-word reading test used in the pilot study. The second was a One Minute
Reading Test (OMRT) consisting of 50 words. The second test was comparable' to
the tests used in the English and Welsh research presented in the next chapter.
1 They were matched for frequency.

Chapter 6 153
The present study investigated reading and spelling development of Year 1,3,
and 5 Albanian children. It was thought that by examining the literacy skills of older
children would be possible to get a fuller picture of the development of specific
linguistic skills (e. g., phonological and orthographic awareness) and their
contributions to the literacy development.
Based upon the literature review presented in Chapters 1,2 and 3, and the
findings from the pilot study (Chapter 5) the following hypotheses were generated.
H. 1. General hypotheses.
H. I. I. Older children should perform better than younger children in all the sub-skills
tasks.
H. 2. Reading hypotheses
H. 2.1. Reading accuracy. Year 1 children will be less accurate readers than Year 3
and 5 children.
H. 2.2. Reading strategy. Younger children will rely more heavily on a GP
conversion reading strategy, whereas the older children will whereas older children
rely more partial visual analysis, partial phonetic cueing or sight word recognition
H. 2.2.1. Year 1 children will have longer word reading latencies than Year 3
and 5 children.
H. 2.2.2. Log 10 frequency effect on reading latency will be greater for younger
children than older children.
H. 2.2.3. The word length effect on reading latency will be greater for younger
children than older children.

Chapter 6 154
H. 2.2.4. Both word length and log 10 frequency will be significant predictors
of reading latency.
H. 2.2.5. It is expected that nonword errors will be the most frequent error type.
H. 2.2.6. The types of errors and their proportions will change over the years:
Year 1 children will make more nonword errors than Year 3 and 5 children (Age x
Type interaction).
H. 2.3. Reading rate. Year 1 children will have lower reading rates in the OMRT than
their Year 3 and 5 counterparts.
H. 2.3.1. During the OMRT younger children will make more reading errors
than older children.
H. 3. Spelling hypothesis
H. 3.1. Spelling accuracy. Younger children will be less accurate than older children
in the 100-word spelling task.
H. 3.2. Spelling strategy. Younger children will rely more heavily on phoneme-
grapheme conversion spelling strategy, whereas the older children will rely on bigger
units, such as onset, rime, and whole word spelling from memory.
H. 3.2.1. It is expected that nonword errors will be the most frequent error type.
The types of errors and their proportions will change over the years: Year 1 children
will make more nonword errors than Year 3 and 5 children (Age x Type interaction).
If the spelling strategy changes as children become more experience with print then it
should also be expected that the proportion of whole word replacements will be larger
in Year 5 than in years 1 and 3.

Chapter 6 155
H. 4. Predictors of reading ability
H. 4.1. Phonological awareness. NWR and Phoneme deletion will be the main
predictors of reading ability in Year 1.
H. 4.2. RAN. Like NWR and Phoneme deletion, the contribution of RAN to reading
will be present only in Year 1.
H. 4.3. Orthographic knowledge. Wordchains will become a good predictor of
reading ability in later years.
H. 5. Predictors of spelling ability
H. S. I. Phonological awareness. NWS and Phoneme deletion will be the main
predictors of spelling ability in Year 1.
H. S. 2. Orthographic knowledge. It is expected that Wordchains will become the
main predictor of spelling ability in later years.
H. 6. Reading and spelling comparisons
H. 6.1. The Albanian orthography is highly transparent bi-directionally, therefore there
should be no discrepancy between children's reading and spelling scores. This
hypothesis was supported in the pilot study with Year 1,2 and 3 children, however, it
e would be of interest to see of this hypothesis holds for a different sample.
H. 6.2. The frequency of the three error types should be the same for both reading and
spelling.
H. 6.3. Due to the similar orthographic complexity for reading and spelling, the
relative contribution of phonological and orthographic skills should show similar
patterns for both reading and spelling development.

Chapter 6
6.2 Method
6.2.1 Participants
Sixty monolingual Albanian children for each year group were selected
156
randomly from Year 1, Year 3 and Year 5 in a primary school in south-east Albania.
Mean and standard deviations for age are presented in Table 6.1. The number
of male and female participants was fairly balanced.
Mean age SD Gender
months months Males Females
Year 1 86.77 4.34 29 31
Year 3 112.10 5.16 30 30
Year 5 135.65 4.80 29 31
Table 6.1. Mean and standard deviations for age; and gender distributions for years
1,3, and5.
6.2.2 Test Materials
The test materials and procedures used in the main Albanian study are briefly
summarised below. They are described in detail in Chapter 4.
6.2.2.1 Reading, Word Compression and Spelling tasks
Reading 100 (Computerised Reading Test). Most of the tasks used in the pilot
study were also used here. However, in order to increase the reliability of the latencies,
the 100-word reading test was computerised. The 100-test items of decreasing
frequency were presented on a portable Macintosh PowerPC computer screen. In
2 Note that 'different' sample in this case does not refer only to the sample size but also to the

Chapter 6 157
addition to reading accuracy, the computer's microphone was used to measure reading
latencies.
OMRT. Albanian children were also given a one-minute 50-word reading tests.
The words were selected from the 100 words used in the computerised reading test:
every other word was selected. The 50-words were presented on an A4 sheet in two
columns. The number of words read in a minute and the number of errors made were
recorded on a separate sheet.
Word comprehension test. After the 100 reading test was completed, in order
to assess the Word Comprehension level on the computerised reading tests, each child
was asked to explain the meaning of each word by giving a synonym, an explanation,
or a correct usage in a sentence. All the test words were administered and the
responses were noted on'a separate sheet.
Two methods of scoring were used. In the first scoring method for the 100-
word comprehension tests a cut-off point of five consecutive errors was used.
For the second scoring method, the number of word items was reduced to 50.
Every other word of the 100-word comprehension test was scored but the cut-off
point of five consecutive errors was not applied. This was done in order to match the
50-word reading, 50-word spelling and 50-word comprehension tests administered in
the Welsh and English schools.
Spelling 100. A 100-word spelling test was administered. This test was
matched for log10 frequency to the reading test but uses different words. A t-test on
word length differences resulted in a non-significant result t(99)=. 65. All the items
were administered. Two methods of scoring were used. In the first scoring method
for the 100-word Spelling tests a cut-off point of five consecutive errors was used.
participant selection method. In the pilot study only the middle achieving pupils were selected.

Chapter 6 158
For the second scoring method, the number of word items was reduced to 50.
This was done by scoring every other word of the 100-word spelling tests. Here, the
cut off point of five consecutive errors was not applied.
Nonword reading (NWR) and nonword spelling (NWS). The nonwords for
both NWR and NWS were selected from word lists matched for frequency and length
to the real word reading and spelling test. For the nonword tests, first, every other
word was selected. In order to derive the nonwords one or two letters (usually the
initial ones) were altered, thus creating orthographically legal pronounceable
nonwords.

Chapter 6 159
6.2.2.2 Phonological awareness tasks
Phoneme deletion. The phoneme deletion test consists of 30 items. After a
word had been orally presented, the participant was asked to delete an initial, medial
or final phoneme pronounced by the experimenter. There were 10 initial phoneme
deletions, 10 medial and 10 final and the maximum score was 30 (Appendix 15).
RapidAutomized Naming. Seven measures of naming speed were adapted
from Van den Bos et. al. (2002). The tasks involved serial naming of digits, numeral,
letters, colours, colour names, objects and object names (Appendix 9). Each task had
50 items and was presented in 5 columns and 10 rows on A4 sheets. Each item
occurred 10 times in the set of 50 and was presented in a random order. Time taken
to name all the items was measured using a stopwatch. The digit, letter, word,
numeral and colour word naming scores were combined into a new variable called
Alphanumeric naming. Colour and picture naming scores were combined into one
variable (Appendix 14).
6.2.2.3 Orthographic skills
Wordchains. This test consists of 120 word-chains. This test is a translation
of the English version of Wordchains Test (Miller-Guron, 1998). The original words
were replaced with Albanian words: they had similar meaning and comparable word
length. This is a timed test and after a practice session, the participants had to divide
as many words as possible in a three minute period. The final score consisted of the
correct number of Wordchains identified within 3 minutes.
6.2.2.4 General ability
Non-verbal intelligence. All the items from sets A, AB, and B from the
Coloured Progressive Matrices (Raven, 1958) were presented on A3 size sheets in

Chapter 6 160
children's classrooms. For each item there were six possible answers. The
participants were required to write down the number that corresponded to the correct
answer. A new item was presented when all the pupils had made a choice. The
maximum score was 36.
Generic Speed. On an A4 sheet, 25 additions and 25 subtractions of one-digit
numbers were presented. The additions were in separate columns from the
subtractions and all the calculations resulted in one-digit numbers. The total score was
50.
6.3 Results
6.3.1 Descriptive statistics.
Table 6.2 summarises the children's performance on the reading,. spelling and
sub-skills tests.

Chapter 6 161
Year 1 Year 3 Year 5. Mean SD Mean SD Mean SD
Reading 100 (number of words read 79.88 15: 60 87.10 10.16 91.18 10.90 correctly out of 100) Reading latency (reading latencies 2.87 0.96 1.51 0.62 1.17 0.39 in seconds for the Reading 100 test) OMRT (number of words correctly 0.48 (n=52) 0.14 0.71(n=59) 0.23 1.. 01 (n=55) 0.42 read per second) OMRT Errors (total number of 2.77 (n=52) 2.06 6.78 (n=59) 5.31 5.80 (n=55) 4.06 errors made in the OMRT) NWR (nonwords read per second) 0.27 0.11 0.46 0.17 0.59 0.23 Spelling 100 (number of words 73.62 17.67 81.62 14.18 88.32 13.74 spelled correctly out of 100) Spelling 50 (number of words spelled 39.35 7.39 42.53 5.36 45.23 6.42 correctly out of 50 ) NWS (number of nonwords spelled 35.38 7.18 37.77 7.28 39.38 7.66 correctly out of 50) Word Comprehension 100 (number 66.13 13.01 77.00 10.58 88.07 4.41 of correct word meanings out of 100) Word Comprehension 50 (number of 34.39 (n=57) 3.95 38.61 (n=59) 4.00' 43.07 (n=59) 2.69 correct word meaning out of 50) Alphanumeric naming 1.22 0.28 1.89 0.33 2.21 0.40 (items named per second)
Digit naming 1.45 0.26 2.04 0.35 2.33 0.43 Numeral naming 1.13 0.37 1.89 0.41 2.31 0.47 Colour Word naming 0.91 0.31 1.69 0.33 2.02 0.40 Picture words naming 1.08 0.33 1.85 0.35 2.09 0.43 Letter naming 1.53 0.33 1.96 0.40 2.31 0.44
Colour and picture naming 0.87 0.18 1.06 0.17 1.29 0.22 (items named per second) , Colour naming 0.79 0.21 1.02 0.21 1.28 0.22
Picture naming 0.95 0.20 1.10 0.18 1.30 0.28 Phoneme Deletion Total 25.78 4.51 26.65 3.30 27.32 3.49 (number of correct deletions out of 30)
Phoneme Deletion Initial out of 10 8.48 1.42 8.78 1.11 9.02 1.24
Phoneme Deletion Final out of 10 9.07 1.59 9.43 1.16 9.65 1.01
Phoneme Deletion Medial out of 10 8.23 2.45 8.43 1.83 8.65 2.05
Wordchains (number of correct 17.63 8.22 36.15 22.27 57.92 20.03 splits completed in 3 minutes) Generic Speed (number of correct 0.31 0.09 0.61 0.17 0.90 0.24 calculations per second)
Generic speed: Additions 0.40 0.11 0.69 0.23 1.03 0.25
Generic speed: Subtractions 0.22 0.11 0.52 0.18 0.76 0.30
CPM (out of 36) 16.95 5.75 22.95 5.27 28.05 4.51
Table 6.2. Descriptive statistics for all variables used in the analysis of the Albanian
data. Note: For each group N=60 unless otherwise stated.

Chapter 6 162
6.3.2 ANOVAS comparing Age Groups
As this chapter examines many questions, the rest of the results is hypothesis
driven (Hypothesis presented first followed by the relevant analysis).
IH 1.1. Older children should perform better than younger children in all the sub-skills
tasks.
A series of one-way ANOVA's and Bonferroni post hoc tests were conducted
to investigate possible differences between the three Albanian year groups. Table 6.3
shows that overall, older children perform better than younger children in most of the
sub-skills tasks. There are no differences for the Phoneme deletion task. Looking at
Table 6.2 it is clear that the means and standard deviations for each year are very
close to each other as well as very close to the maximum score. Thus, the lack of
significant differences in the Phoneme deletion task may be due to possible ceiling
effects. However, overall the findings presented in Tables 6.2 and 6.3 support
hypothesis H. M.

Chapter 6
F(2,57) Year 1 Year 1 Year 3 by subject vs. vs. vs. analysis Year 3 Year 5 Year 5
Reading 100 12.66** xx xx Reading Latency 84.69** xx xx xx OMRT 45.49** xx xx xx OMRT errors 14.10** xx xx NWR 51.07** xx xx xx Word Comprehension 100 71.96** xx xx xx Word Comprehension 50 84.58** xx xx xx Spelling 100 13.89** x xx Spelling 50 12.53** x xx NWS 4.14* x Alphanumeric naming 130.73** xx xx xx Digit naming 96.82** xx xx xx Numeral naming 120.65** xx xx xx Col. Word naming 158.13** xx xx xx Letter naming 57.82** xx xx xx Picture words naming 121.52** xx xx x Colour and picture naming 71.48** xx xx xx Picture naming 37.10** xx xx xx Colour naming 77.28** xx xx xx Phoneme deletion 2.45 n. s. Wordchains 122.82** xx xx xx Generic speed 161.80** xx xx xx CPM 68.43** xx xx xx
163
Table 6.3. ANOVAs and Bonferroni tests for the between year comparisons for all
variables. Note: ** p<. 001; xxp<. 001; xp<. 05.
6.3.3 Test of the Reading Hypotheses
H. 2.1. Reading accuracy. Year 1 children will be less accurate readers than Year 3
and 5 children.
Group differences for Reading 100 were assessed using ANOVAs. ANOVA
testing shows significant differences between year groups [F(2,297)= 17.80, p<. 00 1,
by item; F(2,57)=12.66, p<. 001, by subject]. Bonferroni tests show that Year 1
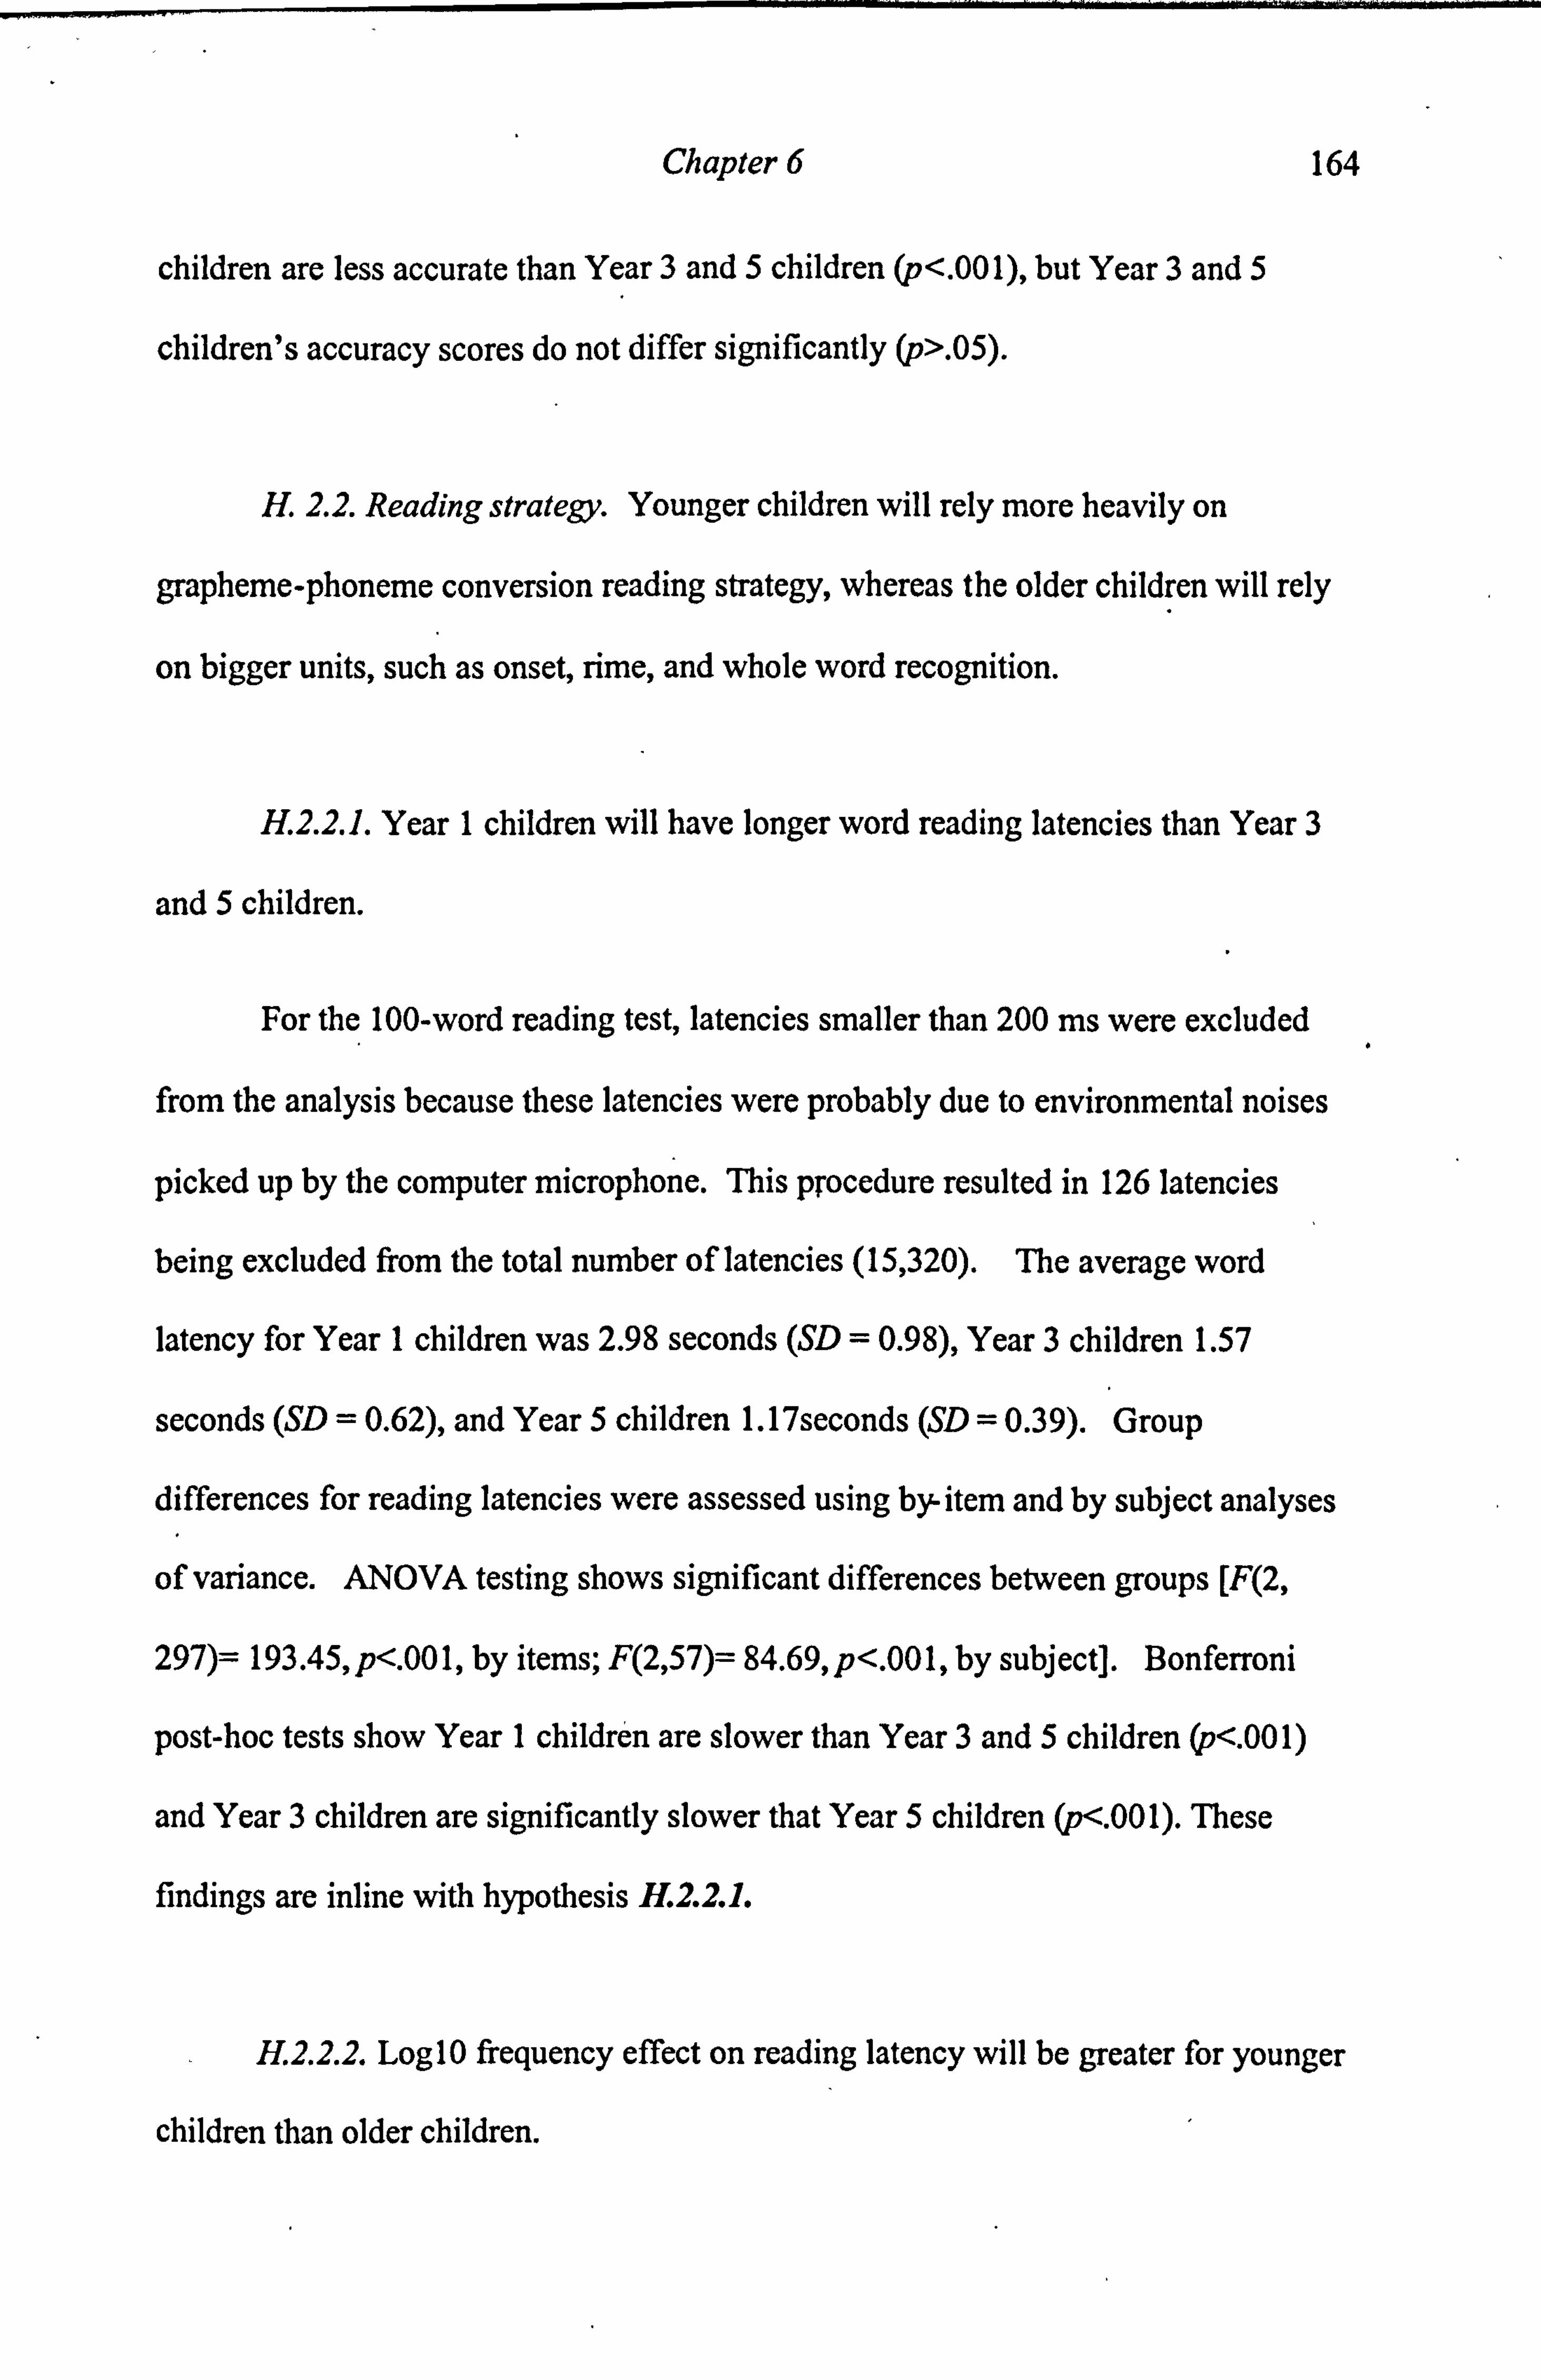
Chapter 6 164
children are less accurate than Year 3 and 5 children (p<. 001), but Year 3 and 5
children's accuracy scores do not differ significantly (p>. 05).
H. 2.2. Reading strategy. Younger children will rely more heavily on
grapheme-phoneme conversion reading strategy, whereas the older children will rely
on bigger units, such as onset, rime, and whole word recognition.
H. 2.2.1. Year 1 children will have longer word reading latencies than Year 3
and 5 children.
For the 100-word reading test, latencies smaller than 200 ms were excluded
from the analysis because these latencies were probably due to environmental noises
picked up by the computer microphone. This procedure resulted in 126 latencies
being excluded from the total number of latencies (15,320). The average word
latency for Year 1 children was 2.98 seconds (SD = 0.98), Year 3 children 1.57
seconds (SD = 0.62), and Year 5 children 1.17seconds (SD=0.39). Group
differences for reading latencies were assessed using by- item and by subject analyses
of variance. ANOVA testing shows significant differences between groups [F(2,
297)= 193.45, p<. 001, by items; F(2,57)= 84.69, p<. 001, by subject]. Bonferroni
post-hoc tests show Year 1 children are slower than Year 3 and 5 children (p<. 001)
and Year 3 children are significantly slower that Year 5 children (p<. 001). These
findings are inline with hypothesis H. M.
H. 2.2.2. Log 10 frequency effect on reading latency will be greater for younger
children than older children.
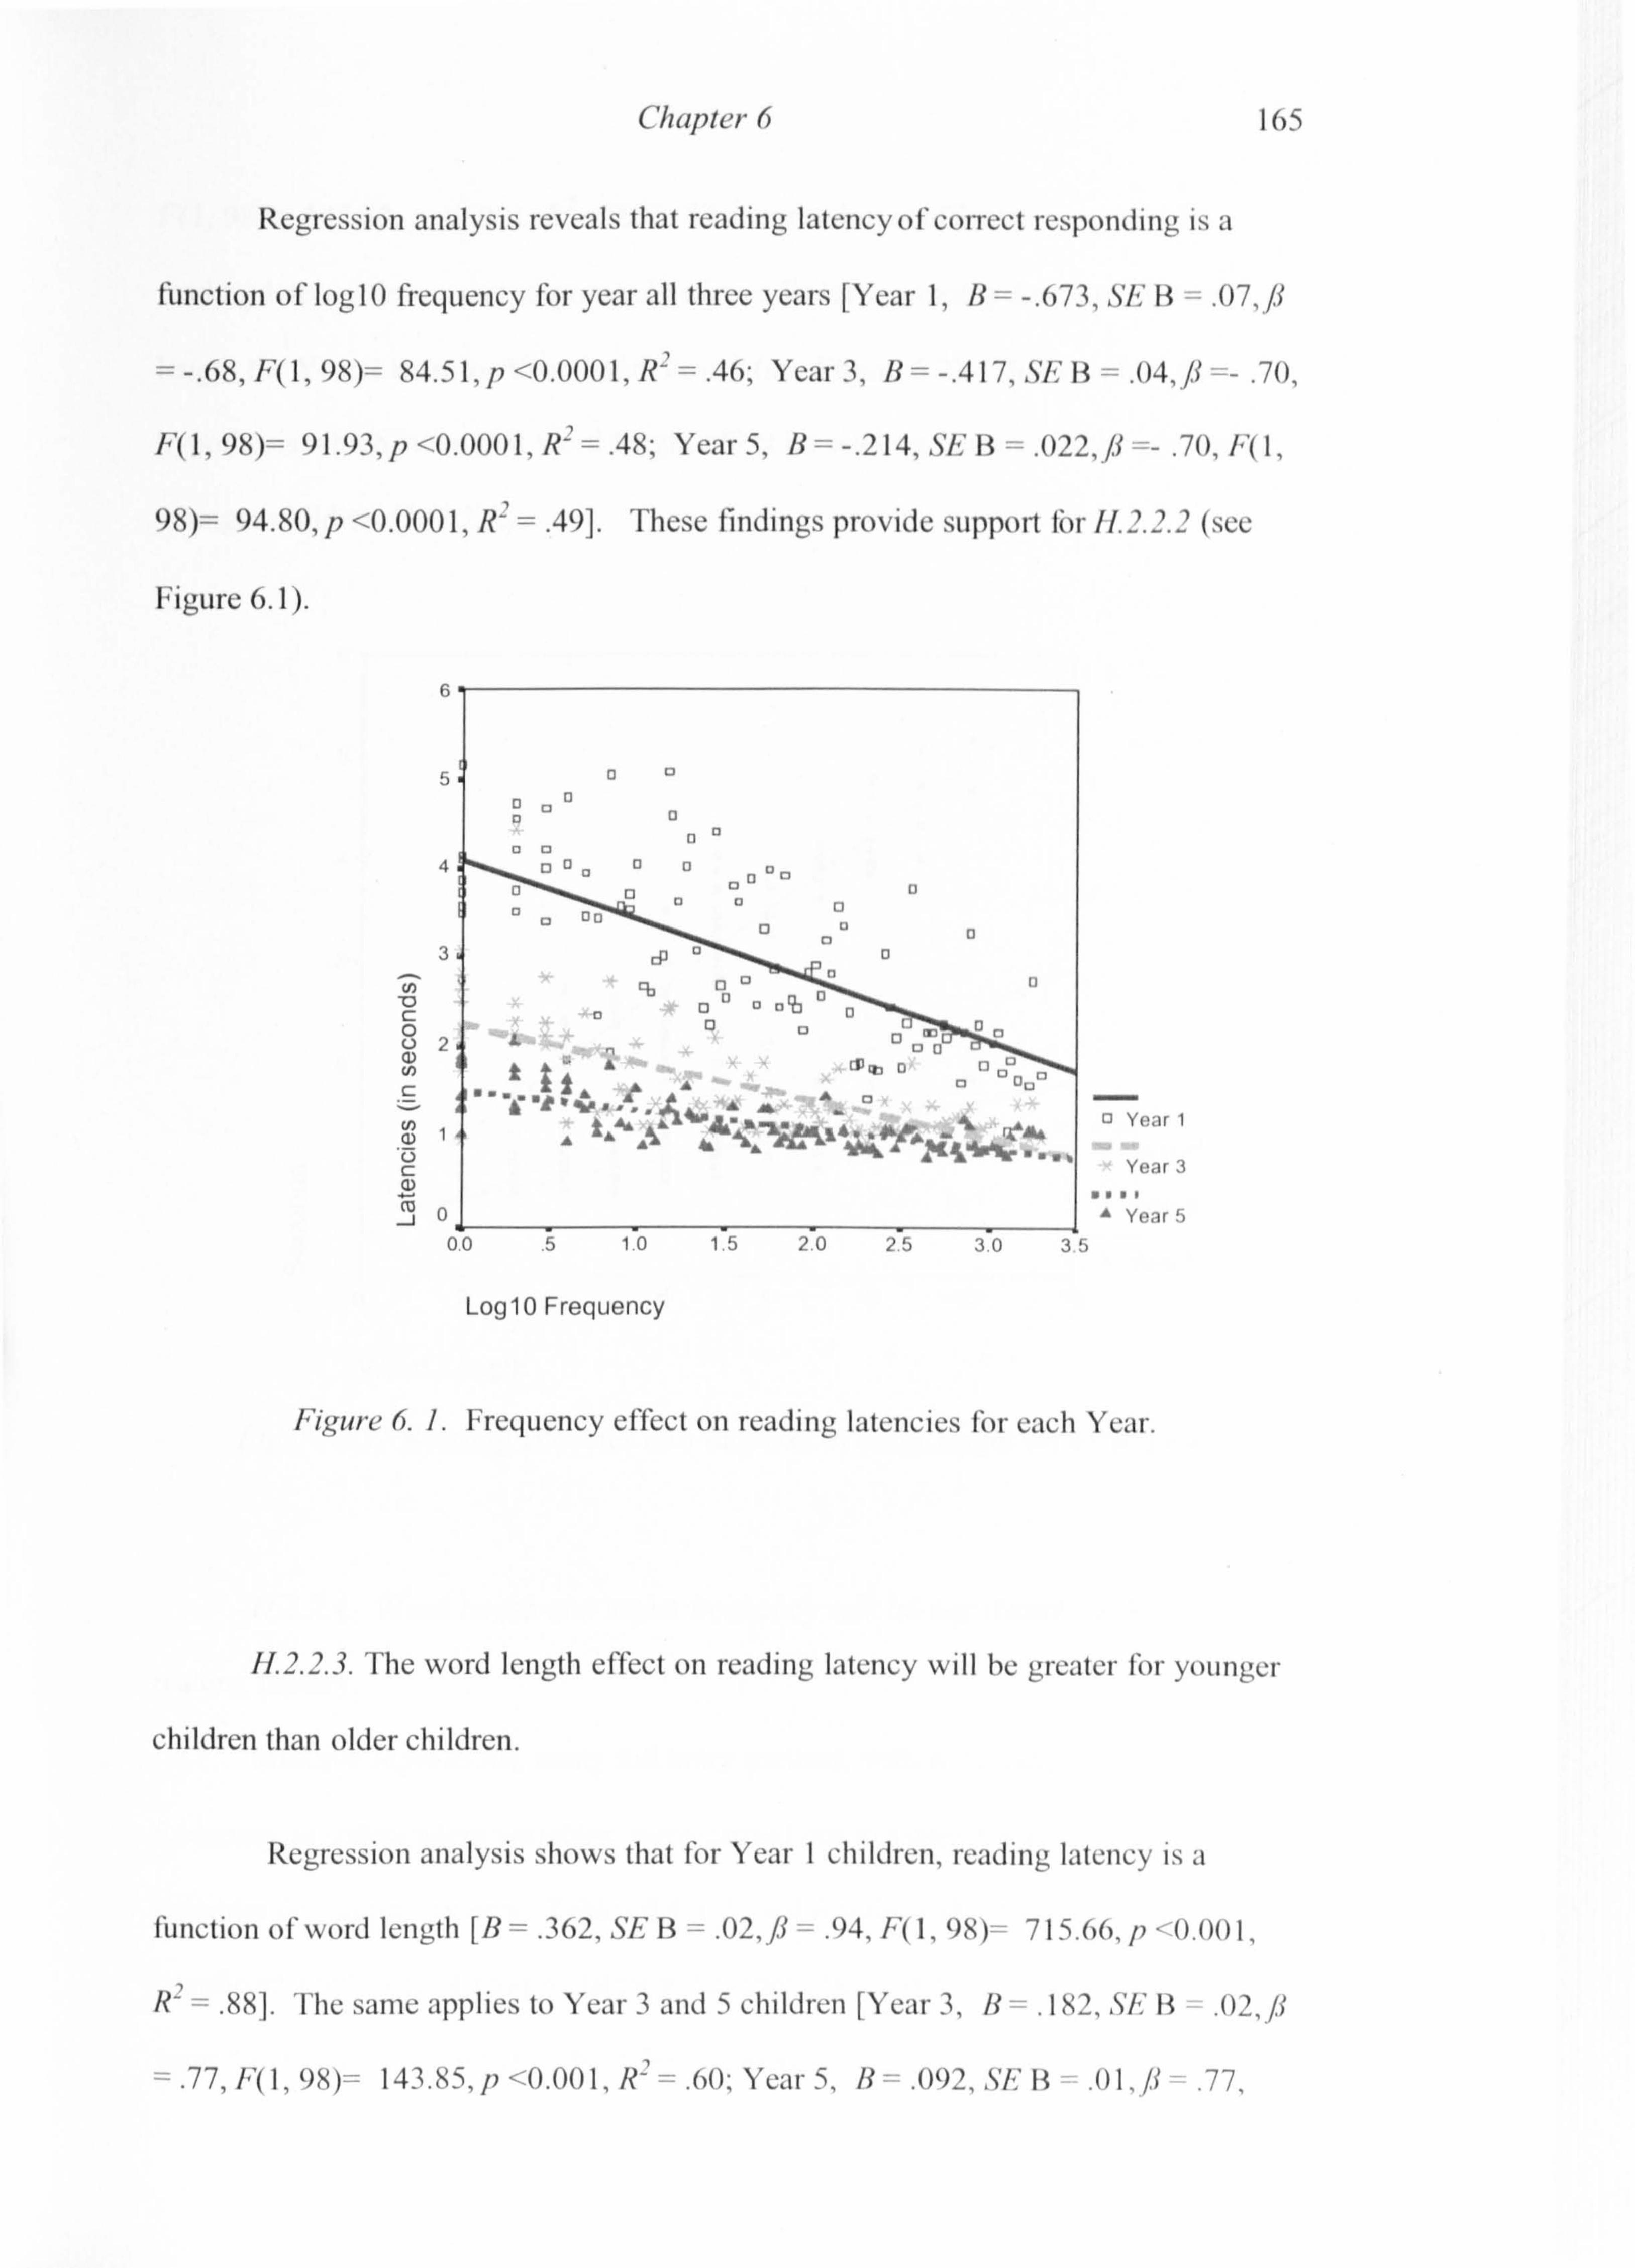
Chapter 6 165
Regression analysis reveals that reading latencyofcorrect responding is a
function of log 10 frequency for year all three years [Year 1, B=-. 673, SE F3 .07,
/I
_ -. 68, F(l, 98)= 84.5 1, p <0.0001, R- . 46; Year 3, l3 = -. 417, SE H=
. 04, /i
. 70,
F(I, 98)= 91.93, p <0.0001, R2_ . 48; Year 5, B=-. 214, SE B=
. 022, # =- .
70, E( 1,
98)= 94.80, p <0.0001, R2 = . 49]. These findings provide support kor 1/.
. 2. ' (see
Figure 6.1).
6
5
4
3
D c 0 U2 a) U, C
U N
C Q) co J
a° o p°0
Op 0 oapaQa pQ
0 13
o 1) 00 QaQ ° Qa
Qa
QU
0 El 13 D)
DQQ
"! 'ýýý ''lýr r'-'f.
ý
w� o
Year 1
Year 3
" Year 5 00 .51.0 1.5 2.0 2.5 3.0 35
Log 10 Frequency
Figure 6. I. Frequency effect on reading latencies für each Year.
11.2.2.3. The word length effect on reading latency will be greater tier younger
children than older children.
Regression analysis shows that for Year I children, reading latency is a
lünction of word length [B = . 362, SE B=
. 02, ß=
. 94, E(1,98)= 715.66,1) 0.00 1,
2 R= . 88]. The sane applies to Year 3 and 5 children [Year 3, R
. 182, SF, B
. 02,. #
= . 77, F(I, 98)= 143.85,1) <0.00 1, R'
. 60, Year 5, B=
. 092, SE B
.01, /. f
. 77,

Chapter 6 166
F(l, 98)= 145.82, p <0.001, R2 = . 60]. The regression coefficents suggest that
reading latency for correct responses is more a linear increasing function of word
length for Year I than for Year 3 and Year 5 (see Figure 6.2). This supports the
hypothesis which states that word length effect on reading latency will he greater for
younger children (H. 2.2.3. ).
6
5
4
3
2
y1 ü c 0 U N
f . z'
f fj
3 !
" Year 1
Year 3
" Year 5
02468 10 12 14
Word Length
Figure 6.2. Reading latencies as a function of word length for each Year.
11.2.2.4. Word length and log10 frequency will be significant predictors of
reading latency.
Multiple regressions, using full entry method, with word length and log l0
frequency as independent variables, were carried out to assess the effect of' both
variables on reading latency. Tables 6.4,6.5, and 6.6 show that both variables are
significant predictors of reading latency, however, because I. oglO Frequency and
word length are confounded in the Albanian words these results are difficult to

Chapter 6 167
interpret. Therefore, stepwise regressions were carried out where the order of
variables entered in the regression analysis was controlled. In the initial regression
analysis, LoglO frequency was entered first in the model and word length second.
This was followed by a second set of regression analysis where the dependent
variables were entered in opposite order. Both sets of regressions were run for each
year. The R2s for each model are presented in Table 6.7. For Year 1, when Log 10
was entered first in the model 46% of reading latencies variability was accounted for.
When word length was entered in the second step a further 45 % of the variability was
explained. However, when Word length was entered first in the model it accounted
for 88% of the variability. The introduction of LoglO frequency added very little to
the final model (R2 increases by only 3%). This indicates that word length was the
best predictor of reading latency and that the effects of Log 10 frequency diminished
after word length was controlled for. Regression analysis for Years 3 and 5 revealed
similar patterns in that word length was the best predictor. However, the R2 values for
word length were not as large as in Year 1, whereas R2 values for Log 10 frequency
were slightly higher that in Year 1. This indicates that the contribution of frequency
increases with practice. To conclude, (1) word length is the best predictor within each
year group, and (2) the word length effect seems to be especially large for Year 1.
These findings support hypothesis H. 2.2.
B Std. Error Beta (Constant) 1.220 0.15 Log10 Frequency -0.194 0.04 -0.20** Word Length 0.318 0.01 0.82**
Table 6.4. Reading latencies for Year 1 as a function of word length and Log 10
Frequency [R2=. 95, F(2,97)-460.86, p<. 001 ].

Chapter 6
B Std. Error Beta (Constant) 1.077 0.16 Log10 Frequency -0.233 0.04 -0.37** Word Length 0.130 0.02 0.55**
168
Table 6.5. Reading latencies for Year 3 as a function of word length and Log 10
Frequency [R2=. 68, F(2,97)=105.08, p<. 001].
B Std. Error Beta (Constant) 0.923 0.08 LoglO Frequency -0.115 0.02 -0.38** Word Length 0.066 0.01 0.55**
Table 6.6. Reading latencies for Year 5 as a function of word length and LoglO
Frequency (R2=. 69, F(2,97)= 108.28, p<. 001).
Year 1 Year 3 Year 5 Order RZ RZ R2 R2 RZ RZ
change change change 15 Log10 freq. . 46** . 48** . 49** 2nd Word length . 91** . 45** . 68** . 20** . 69** . 20**
Ist Word length . 88** . 60** . 59** 2nd Log 10 freq. . 91** . 03** . 68** . 08** . 69** . 10**
Table 6.7. R2 values from stepwise regressions on reading latencies as a function of
Log10 frequency and Word length. Note: **p<. 001.
H. 2.2.5. It is expected that nonword errors will be the most frequent error type.
H. 2.2.6. The types of errors and their proportions will change over the years:
Year 1 children will make more nonword errors than Year 3 and 5 children (Age x
Type interaction).

Chapter 6 169
In total 1995 errors were made by the Albanian children. The errors shown in
Table 6.8 are classified as null responses (no response within 15 seconds or when the
children could not read the word), word replacements, or other attempts, which
resulted in nonword responses. The error patterns are very similar for all three year
groups, in the sense that most of the errors are nonword errors, followed by whole-
word replacements, and null responses.
There is a significant interaction between error types and Year groups
F(4,352)=6.20, p<0.001.
Year 1 Year 3 Year 5 Total
or type N Column % N Column % N Column % N Anova
Null responses 16 1.81 6 0.90 1 0.23 23 F<3, n. s.
Word replacements 175 19.77' 175' 26.16 166 37.64b 516 F(2,177)=10.78, p<. 001
Nonword errors 694 78.42' 488' 72.94 274 62.13b 1456 F(2,177)=13.8, p<. 001
Total 885 669 441 1995
Table 6.8. Classification of the reading errors made by Year 1,3, and 5 Albanian
children. Note: a, b: Different letters show significantly different porportions for each
error type across the year-groups (using the Post hoc Bonferroni test).
Most of the errors made by the Year 1 children were nonword errors (78.42%),
whereas whole word substitutions (19.77%) were not as frequent as nonword errors.
Null responses were very rare (only 1.81%). For Year 3 children 72.94% of errors
were nonword errors, 26.15% were whole word replacements errors, 6% were null
response error type, and for Year 5 children 62.13% of errors were nonword errors,
37.64% were whole word replacements errors, and 0.23% were null response error
type.
The proportion of whole word replacements increases as children get older
(Year 1 19.77%, Year 3 26.16%, and Year 5 37.64%) (F(2,177)=10.78, p<. 001),

Chapter 6 170
whereas the proportion of nonword errors decreases (Year 1 78.42%, Year 3 72.94,
and Year 5 62.13%) [F(2,177)=13.8, p<. 001 ]. For both types of errors post-hoc
Bonferroni test revealed a significant difference between years 1 and 3 (p<. 05) but no
difference between Year 3 and any of the other two age-groups. These findings
confirm hypotheses H. 2.2.5. and H. 2.2.6.
The results from reading latencies and error analysis are supportive of H. 2.2.
H. 2.3. Reading rate. Year 1 children will have lower reading rates in the OMRT than
their Year 3 and 5 counterparts.
Figure 6.3 suggests that reading rate improves with age [F(2,177)=45.49,
p<. 001]. Post-hoc Bonferroni tests revealed that differences between every group
were significantly different from each other (p<. 001). This supports hypothesis
H. 2.3.1.
H. 2.3.1. During the OMRT young children will make more reading errors
than older children.
Figure 6.4 shows that number of errors is different across the year- groups [F(2,
57)=14.10, p<. 001]. Post-hoc Bonferroni tests revealed significant differences
between Year 1 and 3, and between Year 1 and 5 (p<00.1). The number of errors was
not different for Years 3 and 5 (p<. 00 1). These findings go against hypothesis
H. 2.3.1.

Chapter 6 171
Figure 6.3. Mean number of words read per second and Standard Deviations (SI)s)
for each Year in the OMRT.
Figure 6.4. Mean number oferrors made by each year group in the OMR'I.
6.3.3.1. Lexicality effects in reading
Lexicality effect in reading was examined by comparing NWR and OMR T
tasks. Repeated measures ANOVA revealed a significant two-way interaction

Chapter 6 172
between Year and Task [F(2,98)=9.28, p<. 001, by item; F(2,98)=12.74, p--. 001, by
subject]. Significant main effects were found for Year [F(2,98)=108.32, p<. 001, by
item; F(2,118)=64.53, p<. 001, by subject] and Task [F(2,98)=73.28, p<. 001, by item;
1, '(2,118)=274.19, p<. 001, by subject]. Overall, real word reading was easier than
nonword reading [Year 1, t(51)=16.66, p<. 001; Year 3,1(58)=12.3 I, p<. 001, Year 5,
t(54)=11.49, p<. 001). Figure 6.5 depicts the lexicality effects in reading. 'Ehe
significant main interaction between Year and Task (see Figure 6.5) suggests that the
lexicality effect is stronger for older children than younger ones.
Figure 6.5. Means and Standard Errors of the Mean (SEM) for reading rate and
nonword reading within each Year.
6.3.4 Test of the Spelling Hhpotheses
11.3.1. Spelling accuracy. Younger children will be less accurate than older children
in the 100-word spelling task.
Group differences for Spelling 100 were assessed using by-item and by
subject ANOVAs. ANOVA testing shows significant diilcrences between year
groups [F(2,297)=17.12, p<. 001, by item analysis; F(2,57)= 13.89,1)<. 001, by suhjcct
analysis]. Post-hoc Bonferroni tests show that Year 1 children are less accurate

Chapter 6 173
spellers than Year 3 and 5 children (Year 1 vs Year 3, p<. 05; Year lvs Year 5,
p<. 001). This supports hypothesis H. 3.1. The spelling score of Year 3 children is not
different from that of Year 5 children (p>. 05).
H. 3.2. Spelling strategy. Younger children will rely more heavily on phoneme-
grapheme conversion spelling strategy, whereas older children will rely on bigger
units, such as onset, rime, and whole word spelling from memory.
H. 3.2.1. It is expected that nonword errors will be the most frequent error type.
The types of errors and their proportions will change over the years: Year 1 children
will make more nonword errors than Year 3 and 5 children (Age x Type interaction).
In total 2722 spelling errors were made by the Albanian children. The errors
shown in Table 6.9 were classified as null responses, word replacements, or other
attempts, which resulted in nonword responses. Most errors were made by the Year 1
children, and least errors were made by Year 5 children. There is a similar spelling
error pattern to reading for all three year groups: most of the errors are nonword
errors, followed by whole-word replacements, and null responses (see Table 6.9).
The proportion of null responses did not differ across the year-groups. However, there
were significant differences for the proportions of nonword errors and whole word
replacements. Bonferroni post-hoc tests revealed Year 1 children made more nonword
type errors and whole word replacements errors than Year 5 children (p<. O 1). Year'2
children proportions of error types did not differ significantly from the other age-
groups (p>. 05).

Chapter 6 174
Year 1 Year 3 Year 5
Error type N Column % N Column % N Column % ANOVA
Null responses 23 2.00 10 1.08 9 1.39 F<3, n. s.
Word replacements 158 13.70 a 174 18.87 120 18.55 b F(2,177)=8.50, p<. 001
Nonword errors 972 84.30 a 738 80.04 518 80.06 b F(2,177)=6.42, p<. 001
Total 1153 922 647
Table 6.9. Classification of the spelling errors made by Year 1,3, and 5 Albanian
children. Note: a°b, c Different show significantly different proportions letters for each
error type across the year-groups (using the Post hoc Bonferroni test).
For all three year groups most of the errors are nonword errors, followed by
whole-word replacements and null responses. As children grow older, the percentage
of whole word replacements increases, and the percentage of nonword errors
decreases. Overall, there is a significant interaction between spelling error types and
year groups F(4,354)=4.32, p<0.01. These decreases are not as large as in reading.
Therefore, for spelling, Albanian children rely heavily on phoneme-grapheme
conversions even in later years. This is not entirely supportive of hypotheses H. 3.2.
and H. 3.2.1.
63.4.1 Lexicality effects in spelling
Lexicality effect in spelling was examined by comparing NWS and Spelling
50. Figure 6.6 shows that spelling scores are slightly higher than NWS scores.
Furthermore, lexicality effects in spelling seem to be slightly smaller for Year 1
children than for older children. Repeated measures ANOVA revealed a non-
significant two-way interaction between Year and Task [F(2,98)<1, by item;
F(2,98)<2, by subject]. However, there were main effects of Year [F(Z, 98)=12.75,
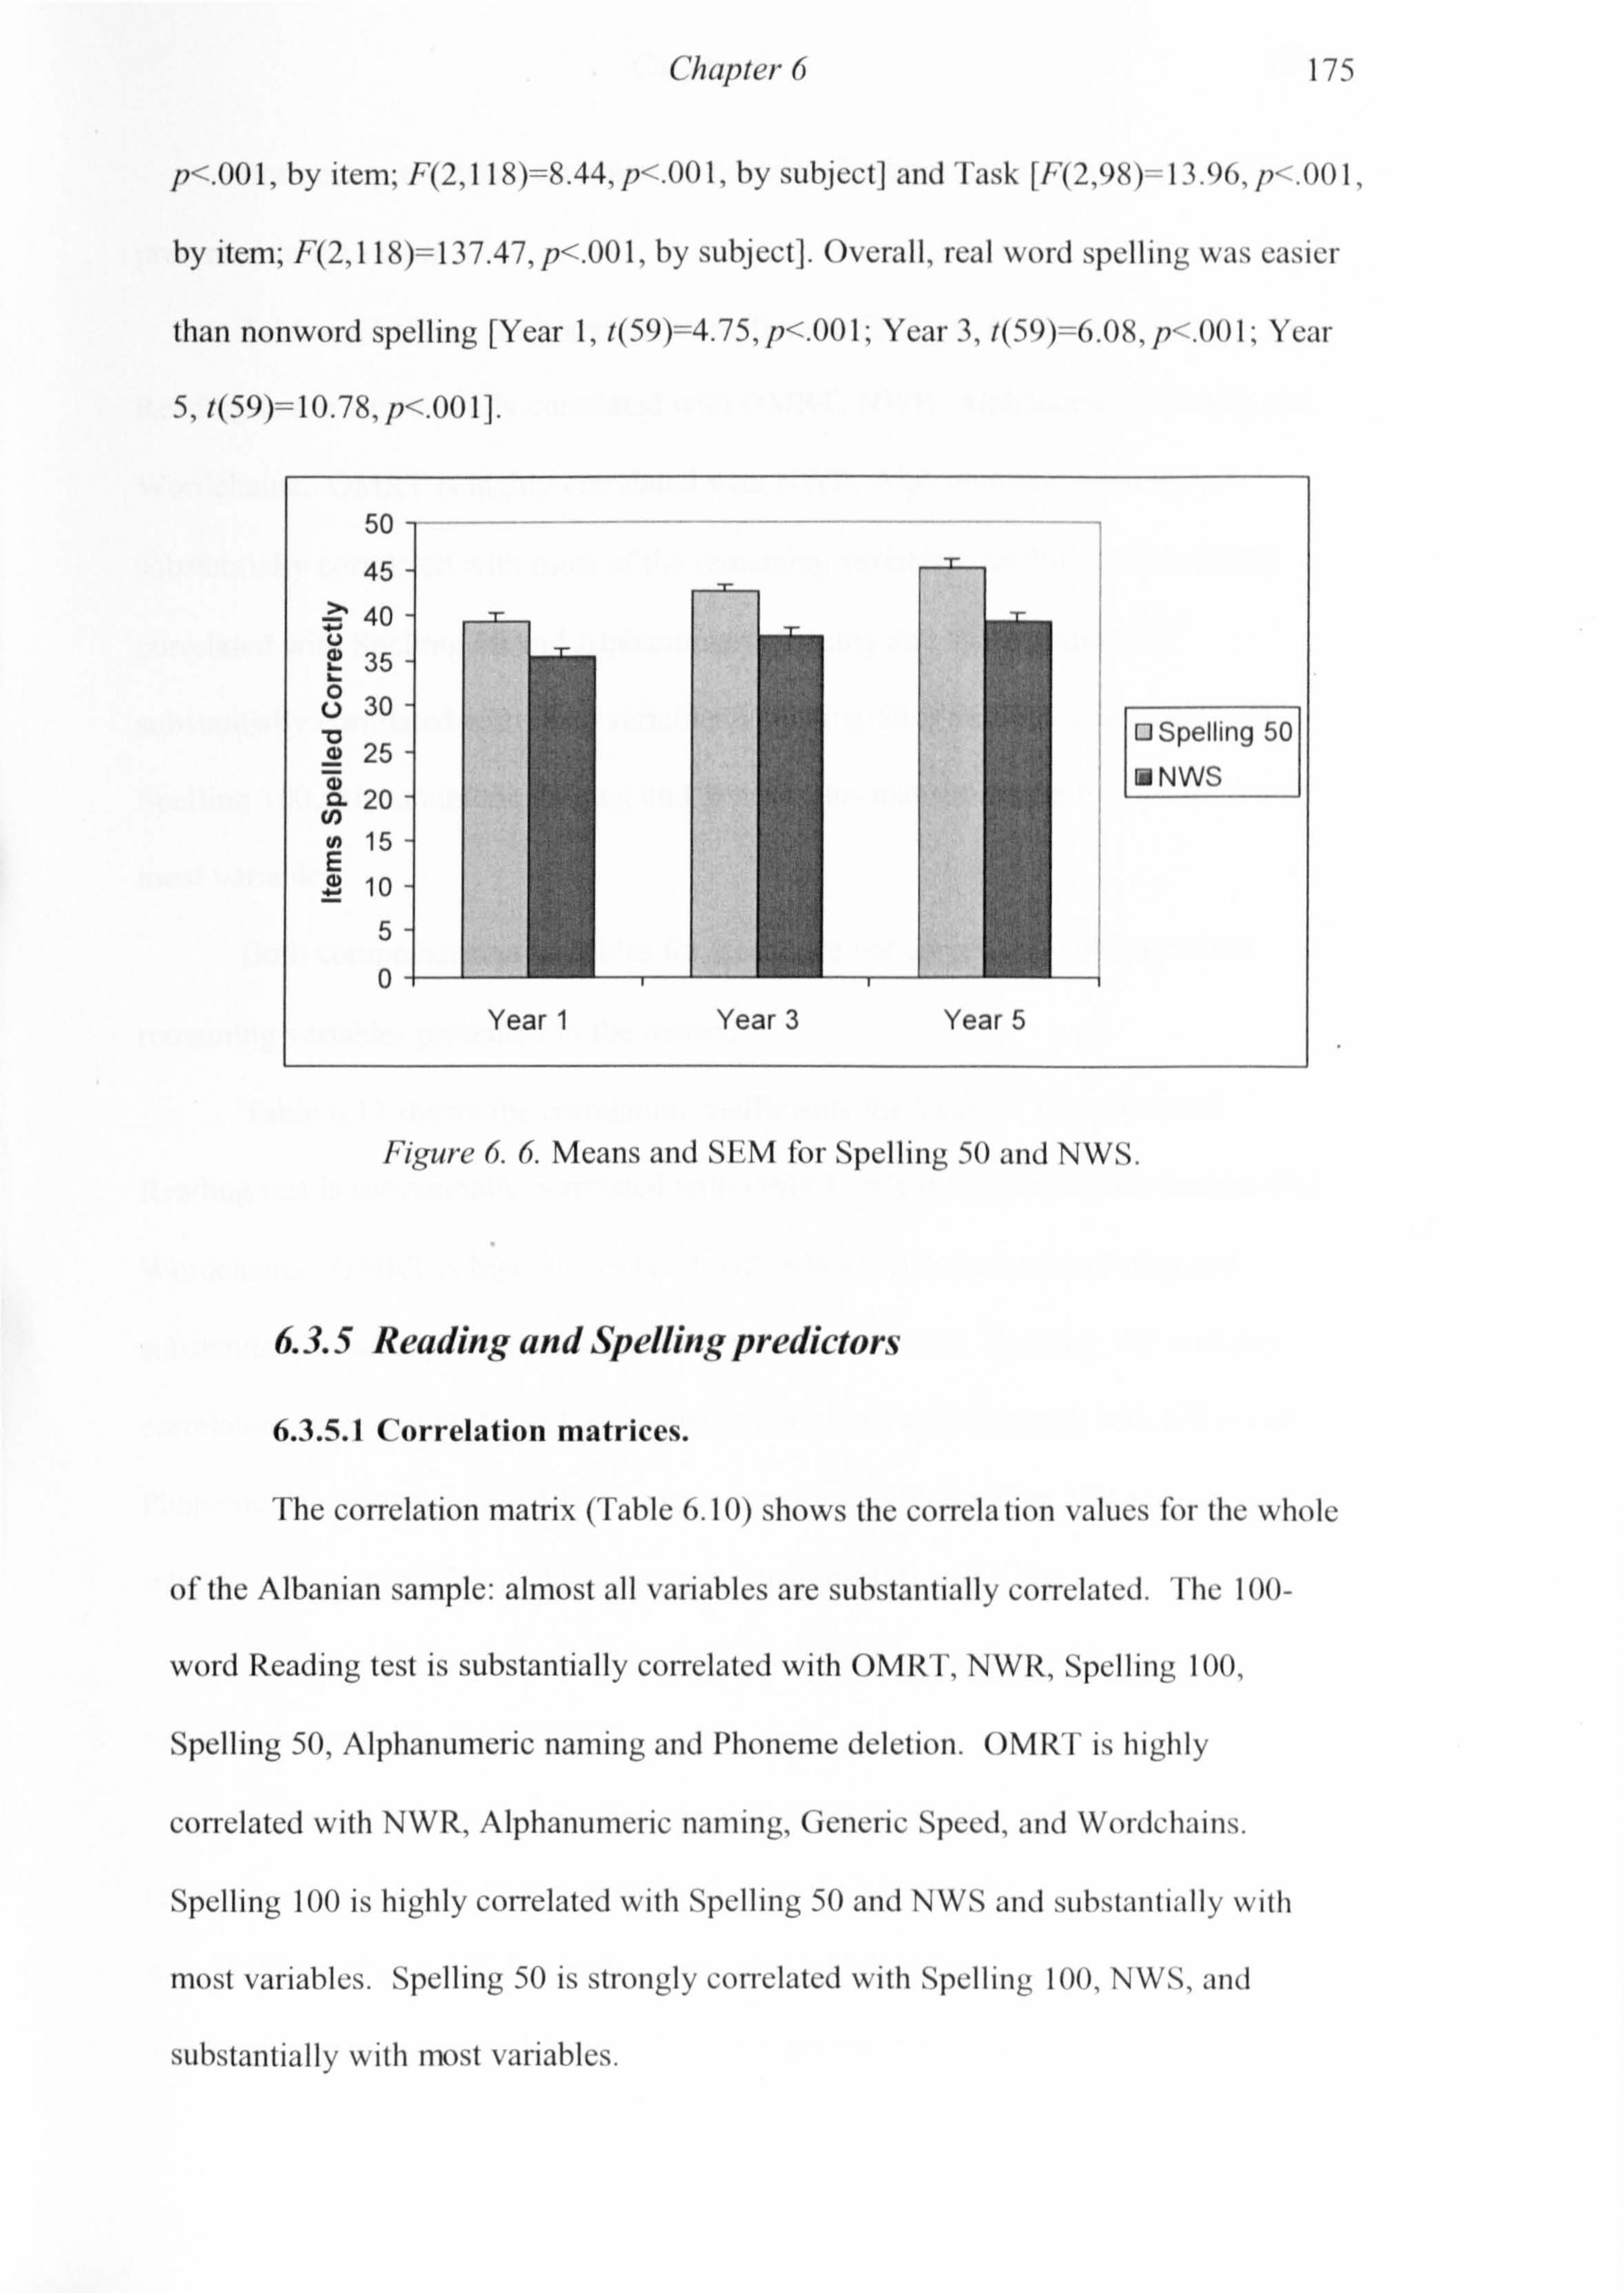
Chapter 6 175
p<. 00 1, by item; F(2,118)=8.44, p<. 001, by subject] and Task [E(2,98) 13.96, p<. 001,
by item; F(2,118)=137.47, p<. 001, by subject]. Overall, real word spelling was easier
than nonword spelling [Year 1,1(59)=4.75, p<. 001; Year 3,1(59)=6. O8, p<. 001, Year
5, t(59)=10.78, p<. 001].
50
45
40
35 Ü 30
25 Q Spelling 50
CL 20 ®NWS
co 2_wl 15
E . 10
5
0 -ý Year 1 Year 3 Year 5
Figure 6.6. Means and SFM for Spelling 50 and NWS.
6.3.5 Reading and Spelling predictors
6.3.5.1 Correlation matrices.
The correlation matrix (Table 6.10) shows the correlation values fier the whole
of'the Albanian sample: almost all variables are substantially correlated. The 100-
word Reading test is substantially correlated with OMR'I', NWR, Spelling 100,
Spelling 50, Alphanumeric naming and Phoneme deletion. OMR"I' is highly
correlated with NWR, Alphanumeric naming, Generic Speed, and Wordehains.
Spelling 100 is highly correlated with Spelling 50 and NWS and substantially with
most variables. Spelling 50 is strongly correlated with Spelling 100, NWS, and
substantially with most variables.

Chapter 6 176
Both comprehension variables are correlated substantially with most variables
presented in the matrix.
Table 6.11 shows the correlation coefficients for Year 1. The 100-word
Reading test is substantially correlated with OMRT, NWR, Alphanumeric naming and
Wordchains. OMRT is highly correlated with NWR, Alphanumeric naming and
substantially correlated with most of the remaining variables. Spelling 100 is highly
correlated with Spelling 50 and Alphanumeric naming and Wordchains and
substantially correlated with most variables. Spelling 50 is strongly correlated with
Spelling 100, Alphanumeric naming and Wordchains and substantially correlated with
most variables
Both comprehension variables for Year Tare not correlated with any of the
remaining variables presented in the matrix.
Table 6.12 shows the correlation coefficients for Year 3. The 100-word
Reading test is substantially correlated with OMRT, NWR, Alphanumeric naming and
Wordchains. OMRT is highly correlated with NWR, Alphanumeric naming and
substantially correlated with most of the remaining variables. Spelling 100 is highly
correlated with Spelling 50 and substantially correlated with Reading 100, NWS and
Phoneme deletion. Spelling 50 is strongly correlated with Spelling 100 and
substantially correlated with Alphanumeric, Reading 100 and NWS.
Both comprehension variables for Year 5 hardly correlate with any of the
variables presented in the matrix.
Table 6.13 shows the correlation coefficients for Year 5. The 100-word
reading test is substantially correlated with most variables in the matrix, especially
with NWR (r=. 66). OMRT is highly correlated with Reading Latencies for the 100-
word reading test, Spelling 100 and 50, Alphanumeric naming and Wordchains and

Chapter 6 177
substantially correlated with most of the remaining variables. Spelling 100 is highly
correlated with Reading Latencies for the 100-word reading test, Spelling 50, NWS,
and Alphanumeric naming and substantially correlated with most of the remaining
variables. Spelling 50 is strongly correlated with Reading Latencies for the 100-word
reading test and Spelling 100 and substantially correlated with most of the remaining
variables.
For Year 5 there is little correlation between the comprehension variables and
the rest of the variables.
Reading 100 and OMRT purport to measure reading skills. Overall, they
substantially correlate with each other, but, OMRT is even more correlated with the
reading latency of the 100-word reading tests. The correlations between these
variables increase as children get older; however, by the end of Year 5 OMRT highly
correlates with Reading 100 latency. Thus it is clear that performance on the OMRT
strongly reflects a speed factor.
The two spelling tests on the other hand, are highly correlated across the years,
suggesting that they do indeed measure similar skills.
Correlation coefficients for Years 1,3, and 5 show that the two word
comprehension measures hardly correlate with the rest of the variables. Previous
studies have found high correlations between comprehension and IQ. This is not the
case in this study. However, the IQ measure used here measures non-verbal IQ
(Raven's Matrices), therefore the lack of correlations is understandable.
The overall pattern for the whole sample (Table 6.10) is that CPM correlation
coefficients are relatively lower than rest of the coefficients. Across the years the
predicting power of CPM scores decreases.

Chapter 6 178
Finally, the correlation between NWS and the other variables increases as
children get older indicating that ability to spell nonwords maybe closely related to
the general literacy skills in older children.

rn N
M . -r
ýi
21
r-
10
LJ
N1
-I
0 00
rn* rn M M
041) 00 N 110
t-1: oq
Iý N "-+ M vl W)v1NIO"D
iE iE ik 9F iF ik MNd'üINen
N It MMM .r
i*E i*F i*F i*F i*F : *F
i*F W-) Cý C) 00 CN M V1 o ct
r w!
W) 00 rnc.. --o00 ON ýo en W) W) W) It kn
d* W) COen en l-10 N vl 00 I'D Iýh ýG 00
.'
Mrq--0OÖMNÖ>Ö
00 h V! 1 ýt e 00 'o 't IO 00
r+ 000
M- ry
V1 cý - pp
MN
ON 00 n V1
o*O CS 00 00 'T 'IT cl vl 1t p ,O llO
C)C>M N w1 %D li W) Vl M V'" 00 \"M ýo (I
iiiiiiiiiiii
CD .NON C\ ý--ý N VI 00 't NM ýh MM V1 \O V1 ýýM Vl ýt vl ýf N
C
yi
U UÖ
z 0
OO Cý U
ý ° v ami °2 0 (L) 3
93. 0. i pö 9ö
-4 N (n le v) \O t- 00 C% O . -+ Nm ýt v'i
ti 0 v
0 0 v
of
0 00 II
U
.. y
Cd it
w
N
_N .D Cý
i N
Cd
O U
1ý
04
IC)
100
iii
cn
LO i
MI
NI
'-i
tn
co N
N
M ý. O OM n 'tý Wi llý
M [- M VII M NNNNý--ý
00 V1
00 N v)
I'D 00 10 ON Vl N Oý ON V1 M \O Vl "tt ýo
Ir, _* vlnoo. ýrn
M(>00Me ýo. \ol- 10 V' M l- vl 'tt wi l,
00 1- Me 00\O00 rn -+
CN N N0001%0ý -40-4-4-4 0000ý-+0ýý--: OHO
ipF it iF dt * it 9t t- ß t-- O wl W Ö ýO v'1 V. N ý.
' iiiiiii"ii".
*** it iF iE 9F iF ýF aF aF it iF
rý OM VM1 NMMNÖ 00 cl 00 10 C'I
tq
CD
aý a, o
oAää CD o c u ßa00 0o o ý V, -0 q a, §g ý,. '
u ° ä iu°O a xx33o c, n rA,
ý ö ýö Pf U: ¢Uäc
--ýNM'tvi1 o l- oocý CD --
V1
vi 0 V
V
III
45
U
W
y U
N
cd w. w
0 0
aý 0 U
h

0 00
C,, Tl-
N T-
0
00
ti
CD',
b
M
M It
%. 0 00 Oe'?
N r-
00 00 ýG N ul It K7 l-
MVII NOýO 0-0ON
Ö
t'- en <0 00 00 00 C'4
iF ipF
C> ff) tcfl,
NOON V100
ýÖNN00 ýýC>[, ý
"MMM "'" NN
mpg"0 "r,
pNep00M
N000o0en O 00l- (-4 CD OR N--; NN Ný--ýON
ÖO W) GMK: een -.
ýO N4 en wl
MN t- Cý tel
W) tq vi
00 Vom, Vw1.
ý
öo 'ý 04
r- 50 ý. ý. Q oZ 15 _ y0 aýi
00 0
aý
ý5 lu °° 0Ä o C) Q'ö, 0 0 xx330 výý UdUaC73 NMv1 ýO [ý 00 01 O. - N M- -n
vi 0 v
0 0 V
e u
g .. C
M
J) U
0 0
äý
0 U N ti b
D ti
ýt
M T"
N
O r.
rn'
' 00
r-
CD I
U, i
Ict i
cI
04 I
00 tr!
* * N
* 9F O
9F it iF dt **** ý "--ý v1 41
NýpMý
* 9F iE if it ýi
Mr. - ýQ O*ONV1 V) oON'D'-t W! 'It '0
00 ýo C7,0 C\ fl 0ý 09 IR w! "I 'q:
00 00 N 1O to r- eý ýO Vl Iti Vl N lý th lý
o*o en ö
ON *v ö-
r- [ý V1 N qq: Mh',,:
or l! 1 Vl ID
iF 9F
NNOÖSýÖa NN
ýiii
ÖN VI sO NýDý-N ýo Nt--, f ýd: ý'ý? OMNOONM
qq--4C> IC Itt Nennt -Ole
C) C) 01% 10 CN qt 00 CA rn
öO .2 4 1- vi
=
2rz .
bA c2.9 to to 2 U ý
ný 5
xx33o rArA ¢cgäc73 ý--ý NM 'i' vl 'O I- 00 Cý 0 ý-+ NM-
I vi V
O O V
45
.D
N
4. 40.
m
J N
co 11r
w
0
aý 0
U rºi e oý
"o ti

Chapter 6
6.3.6 Regression analysis for Reading related tasks for all Albanian
children
For each regression analysis reported below, two methods were used:
Stepwise and Full Entry. For each year, the full list of variables entered in these to
methods is shown in the Full Entry table.
6.3.6.1 Reading accuracy
181
According to the stepwise regression analysis (Table 6.14), for the whole of
the Albanian sample, NWR, Phoneme Deletion and Objects and Colours rapid
naming are the best predictors of reading ability. The increase of R2 in the Stepwise
regression in the final step is very small (R2 change = . 03). As a result, Objects and
Colours rapid naming is no longer a significant predictor in the Full Entry model. The
best predictors of reading using the Full Entry regression analysis are NWR, Phoneme
Deletion and Spelling 100 (Table 6.15).
B Std. Beta change Error
Step 1 NWR 37.591 3.63 0.61** . 38 Step 2 NWR 27.095 3.83 0.44** . 47 . 09 Phoneme Deletion 1.218 0.22 0.35** Step 3 NWR 17.881 4.86 0.29** . 50 . 03 Phoneme Deletion 1.271 0.21 0.37** RAN Objects and Colours 11.074 3.72 0.21**
Table 6.14. Summary of Stepwise Regression Analysis for variables predicting
reading ability in Albanian using Reading 100 as the dependent variable. Note: *
p<. 05, **P<. 001.
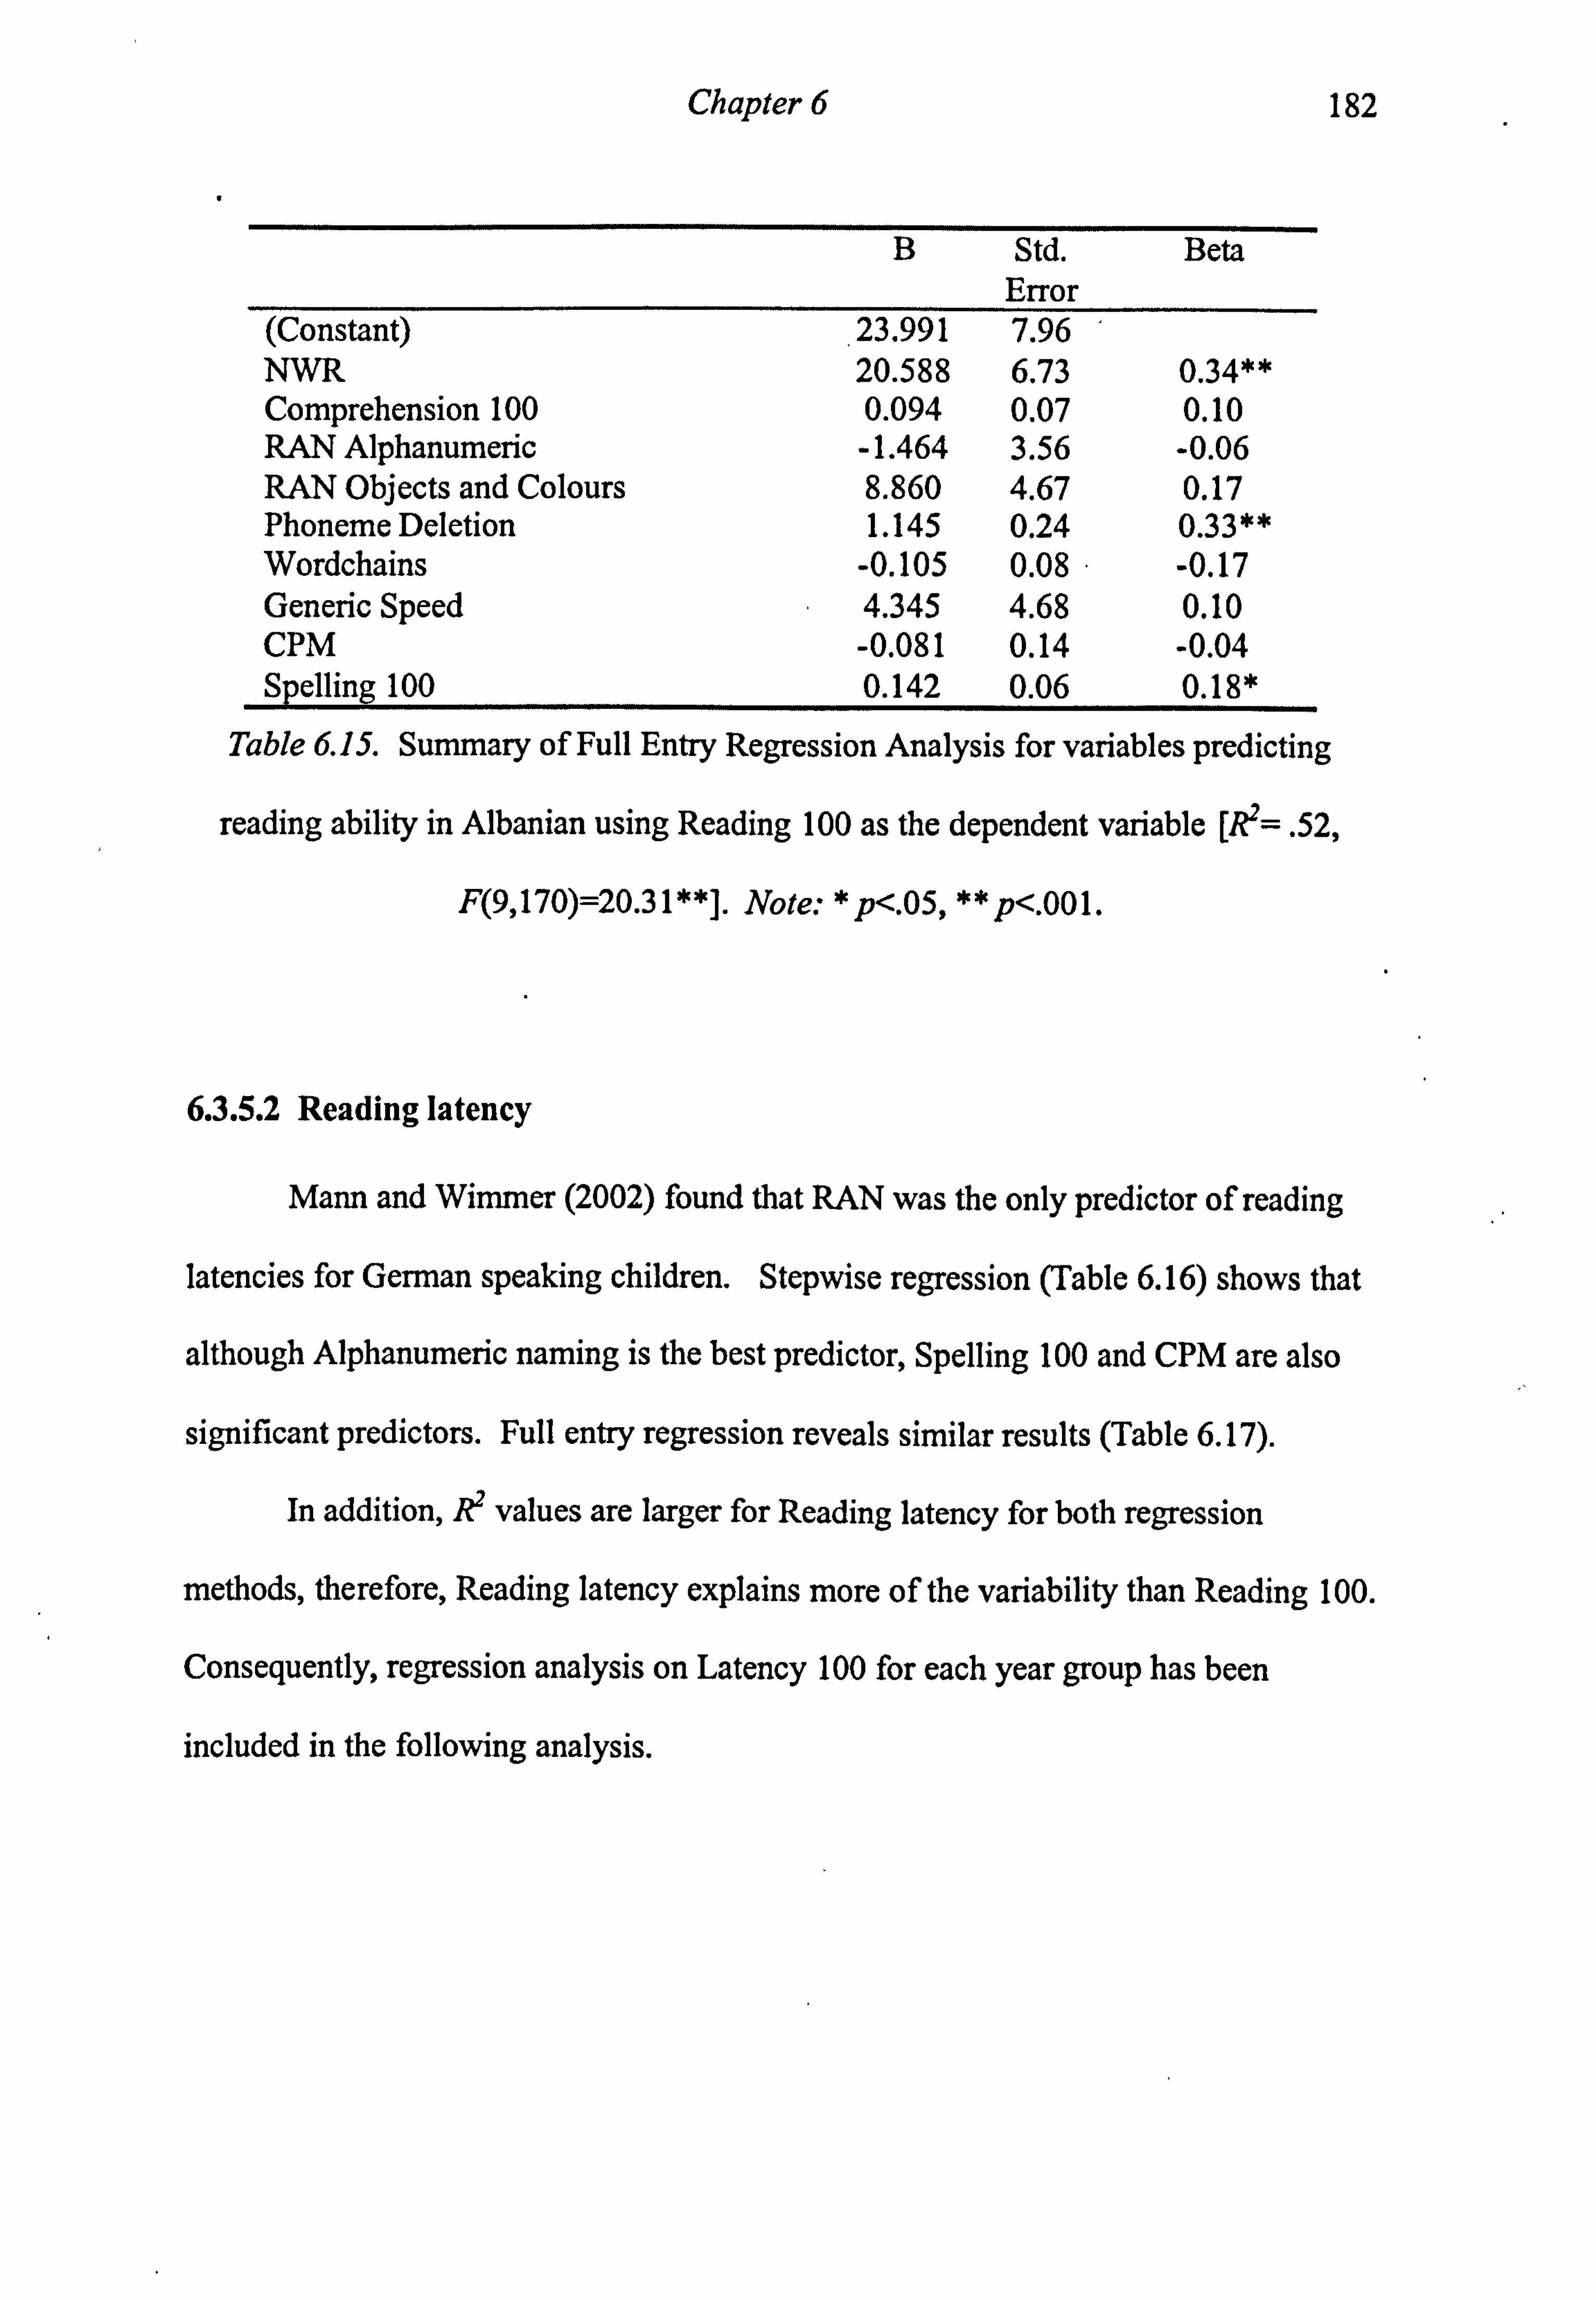
Chapter 6 182
B Std. Error
Beta
(Constant) 23.991 7.96 NWR 20.588 6.73 0.34** Comprehension 100 0.094 0.07 0.10 RAN Alphanumeric -1.464 3.56 -0.06 RAN Objects and Colours 8.860 4.67 0.17 Phoneme Deletion 1.145 0.24 0.33** Wordchains -0.105 0.08 -0.17 Generic Speed 4.345 4.68 0.10 CPM -0.081 0.14 -0.04 Spelling 100 0.142 0.06 0.18*
Table 6.1 S. Summary of Full Entry Regression Analysis for variables predicting
reading ability in Albanian using Reading 100 as the dependent variable [R2=. 52,
F(9,170)=20.31**]. Note: * p<. 05, **p<. 001.
6.3.5.2 Reading latency
Mann and Winuner (2002) found that RAN was the only predictor of reading
latencies for German speaking children. Stepwise regression (Table 6.16) shows that
although Alphanumeric naming is the best predictor, Spelling 100 and CPM are also
significant predictors. Full entry regression reveals similar results (Table 6.17).
In addition, R2 values are larger for Reading latency for both regression
methods, therefore, Reading latency explains more of the variability than Reading 100.
Consequently, regression analysis on Latency 100 for each year group has been
included in the following analysis.

Chapter 6 183
B Std. Error
Beta change
Step 1 RAN Alphanumeric -1.555 0.08 -0.82** . 67 Step 2 5.068- 0.22 RAN Alphanumeric -1.374 0.10 -0.73** . 69 . 02 Spelling 100 -0.010 0.00 -0.16* Step 3 5.234 0.22 RAN Alphanumeric -1.241 0.11 -0.65** . 70 . 01 Spelling 100 -0.009 0.00 -0.15* CPM -0.020 0.01 -0.14*
Table 6.16. Summary of Stepwise Regression Analysis for variables predicting
reading ability in Albanian using reading Latencies as the dependent variable. Note: *
p<. 05, ** p<. 001.
B Std. Error
Beta
(Constant) 4.885 0.47 NWR -0.421 0.40 -0.09 Comprehension 100 -0.001 0.00 -0.02 RAN Alphanumeric -1.266 0.21 -0.67** RAN Objects and Colours 0.517 0.28 0.13 Phoneme Deletion 0.008 0.01 0.03 Wordchains 0.000 0.00 -0.01 Generic Speed 0.005 0.28 0.00 CPM -0.020 0.01 -0.14* Spelling 100 -0.010 0.00 -0.16*
Table 6.17. Summary of Full Entry Regression Analysis for variables predicting
reading ability in Albanian using reading Latencies as the dependent variable [R2= . 71,
F(9,170)=46.24**]. Note: * p<. 05, ** p<. 001.

Chapter 6
6.3.5.3 OMRT
184
Using the OMRT as the dependent variable, it was found that NWR was the
best predictor of OMRT and Wordchains was the second best predictor, using both
regression methods (Tables 6.18 and 6.19).
"B Std. Error Beta change
Step 1 NWR 1.398 0.07 0.83** . 69 Step 2 NWR 0.879 0.11 0.52** . 74 . 05 Wordchains 0.007 0.00 0.39**
Table 6.18. Summary of Stepwise Regression Analysis for variables predicting
reading ability in Albanian using the OMRT as the dependent variable. Note: * p<. 05,
** p<. 001.
B Std. Beta Error
(Constant) -0.116 0.20 NWR 0.732 0.13 0.43** Comprehension 50 0.001 0.00 0.01 RAN Alphanumeric 0.066 0.07 0.10 RAN Colours and Objects 0.067 0.09 0.05 Phoneme Deletion 0.005 0.00 0.06 Wordchains 0.005 0.00 0.28* Generic Speed 0.111 0.09 0.09 CPM -0.002 0.00 -0.05 Spelling 50 0.000 0.00 -0.01
Table 6.19. Summary of Full Entry Regression Analysis for variables predicting
reading ability in Albanian using the OMRT as the dependent variable [R2=. 75,
F(9,156)=52.93]. Note: * p<. 05, **p<. 001.

Chapter 6
6 . 3.6 Factor analysis
Exploratory analysis was carried out to examine how the variables grouped
185
together. Principal Component Analysis, using Varimax rotation, revealed two main
components. A large number of variables load mostly on the first component; they
seem to indicate a general ability factor (Table 6.20). Reading and spelling variables
together with Phoneme Deletion load mostly on the second component, indicating a
literacy factor. However, there are several variables, such as Latency 100, OMRT,
and NWR, that have high loadings on both components. OMRT and NWR are very
similar and are both speeded tests, whereas Latency 100 is a pure speed measure. Are
the above regression results for the entire Albanian sample due to a generic speed
effect or due to the content of the predictors? In order to assess this, two Hierarchical
regressions were carried out where the effect of Generic Speed was controlled for.
Variables Com ponent 1 2
Reading 100 0.344 0.618 OMRT 0.683 0.504 NWR 0.655 0.568 Latency 100 -0.697 -0.445 Comprehension 100 0.850 Comprehension 50 0.879 Spelling 100 0.872 Spelling 50 0.862 NWS 0.766 RAN Alphanumeric 0.782 0.505 RAN Colours and Objects 0.679 0.401 Phoneme Deletion 0.700 Wordchains 0.798 0.432 Generic Speed 0.831 CPM 0.692
Table 6.20. PCA using Varimax rotaion for the Albanian 'variables. Note:
Coefficients smaller than . 300 are not presented.

Chapter 6 186
In the first regression, with Latency 100 as the dependent variable, Generic
Speed was entered first in the model. The best predictors of Latency 100 form the
regression results presented in Table 6.16 (RAN Alphanumeric, Spelling 100, and
CPM) were entered in the second step. The results, presented in Table 6.21, show that
the R2 for the Generic Speed variable was large (R2=. 44). In the following steps, the
rest of the predictors explained a further 26% of the Latency 100 variance, indicating
that for the initial Latency 100 regression analysis results were due to the content of
the significant predictors.
B Std. Beta change Error
Step 1 Generic Speed -2.244 0.19 -0.66 . 44 'Step 2 Generic Speed -0.120 0.24 -0.04 . 67 . 23 RAN Alphanumeric -1.502 0.13 -0.79 Step 3 Generic Speed -0.201 0.23 -0.06 . 69 . 02 RAN Alphanumeric -1.279 0.15 -0.67 Spelling 100 -0.010 0.00 ' -0.16 Step 4 Generic Speed 0.027 0.25 0.01 . 70 . 01 RAN Alphanumeric -1.252 0.15 -0.66 Spelling 100 -0.009 0.00 -0.14 CPM -0.020 0.01 -0.14
Table 6.21. Regression analysis for Latency 100, controlling for Generic Speed.
Note: * p<. 05, ** p<. 001.
In the second regression, with OMRT as the dependent variable, once again
Generic Speed was entered first in the model. The best predictors of OMRT form the
regression results presented in Table 6.18 (NWR and Wordchains) were entered in the
second step. The results, presented in Table 6.22, show that the R2 for the Generic
Speed variable was quite large (R2=. 48). However, in the following steps, the rest of
the predictors explained a further 27% of the OMRT variance, indicating that for the

Chapter 6 187
initial OMRT regression analysis results were due to the content of the significant
predictors. Hence, dependent variables that have a speed aspect, such as Latency 100
and OMRT, are not purely affected by a generic speed factor, but by the real cortents
of the predictors.
B Std. Beta change Error
Step 1 Generic Speed 0.830 0.07 0.69 . 48 Step 2 Generic Speed 0.313 0.07 0.26 . 72 . 24 NWR items/sec 1.110 0.09 0.66 Step 3 Generic Speed 0.130 0.08 0.11 . 75 . 03 NWR 0.866 0.11 0.51 Wordchains 0.005 0.00 0.31
Table 6.22. Regression analysis for OMRT, controlling for Generic Speed. Note: *
p<. 05, ** p<. 001.
6.3.7 Regression analysis for Reading related tasks for Year 1
Albanian children
6.3.7.1 Reading accuracy
The final step of stepwise regression (Table 6.23) reveals Phoneme Deletion
and RAN Colours and Objects as the best predictors of Reading 100 for Year 1.
Surprisingly, NWR was the best predictor in Steps 1 and 2 but was not significant in
Step 3, hence, was removed in Step 4. The finding of the final step is supported by
the results of the Full Entry regression analysis (Table 6.24), in which only Phoneme
Deletion and RAN Colours and Objects were significant predictors. NWR and RAN
Colour and Objects are substantially correlated (r=. 55), and this might explain why

Chapter 6 188
NWR is removed in the stepwise regression and does not appear in the Full Entry
method.
B Std. Beta change Error
Step 1 NWR 81.805 16.01 0.56** . 31 Step 2 NWR 57.474 18.19 0.39** . 38 . 05 Phoneme Deletion 1.066 0.43 0.31* Step 3 NWR 29.900 19.99 0.20 n. s. . 45 . 07 Phoneme Deletion 1.178 0.41 0.34* RAN Colours and Objects 27.323 10.02 0.32* Step 4 Phoneme Deletion 1.491 0.35 0.43** . 43 -. 02 RAN Colours and Objects 34.900 8.73 0.41**
Table 6.23. Summary of Stepwise Regression Analysis for variables predicting
reading ability in Year 1 Albanian children using Reading 100 as the dependent
variable. Note: * p<. 05, ** p<. 001.
B Std. Error Beta (Constant) 16.273 14.60 NWR 40.213 24.96 0.27 Comprehension 100 0.022 0.13 0.02 RAN Alphanumeric -6.793 13.38 -0.12 RAN Colour and Object 29.900 13.17 0.35* Phoneme deletion 1.427 0.47 0.41 * Wordchains -0.179 0.28 -0.09 Generic Speed 17.707 21.62 0.10 CPM -0.469 0.30 -0.17 Spelling 100 0.033 0.14 0.04
Table 6.24. Summary of Full Entry Regression Analysis for variables predicting
reading ability in Year 1 Albanian children using Reading 100 as the dependent
variable [R2=. 49, F(9,50)=5.43**]. Note: * p<. 05, ** p<. 001.
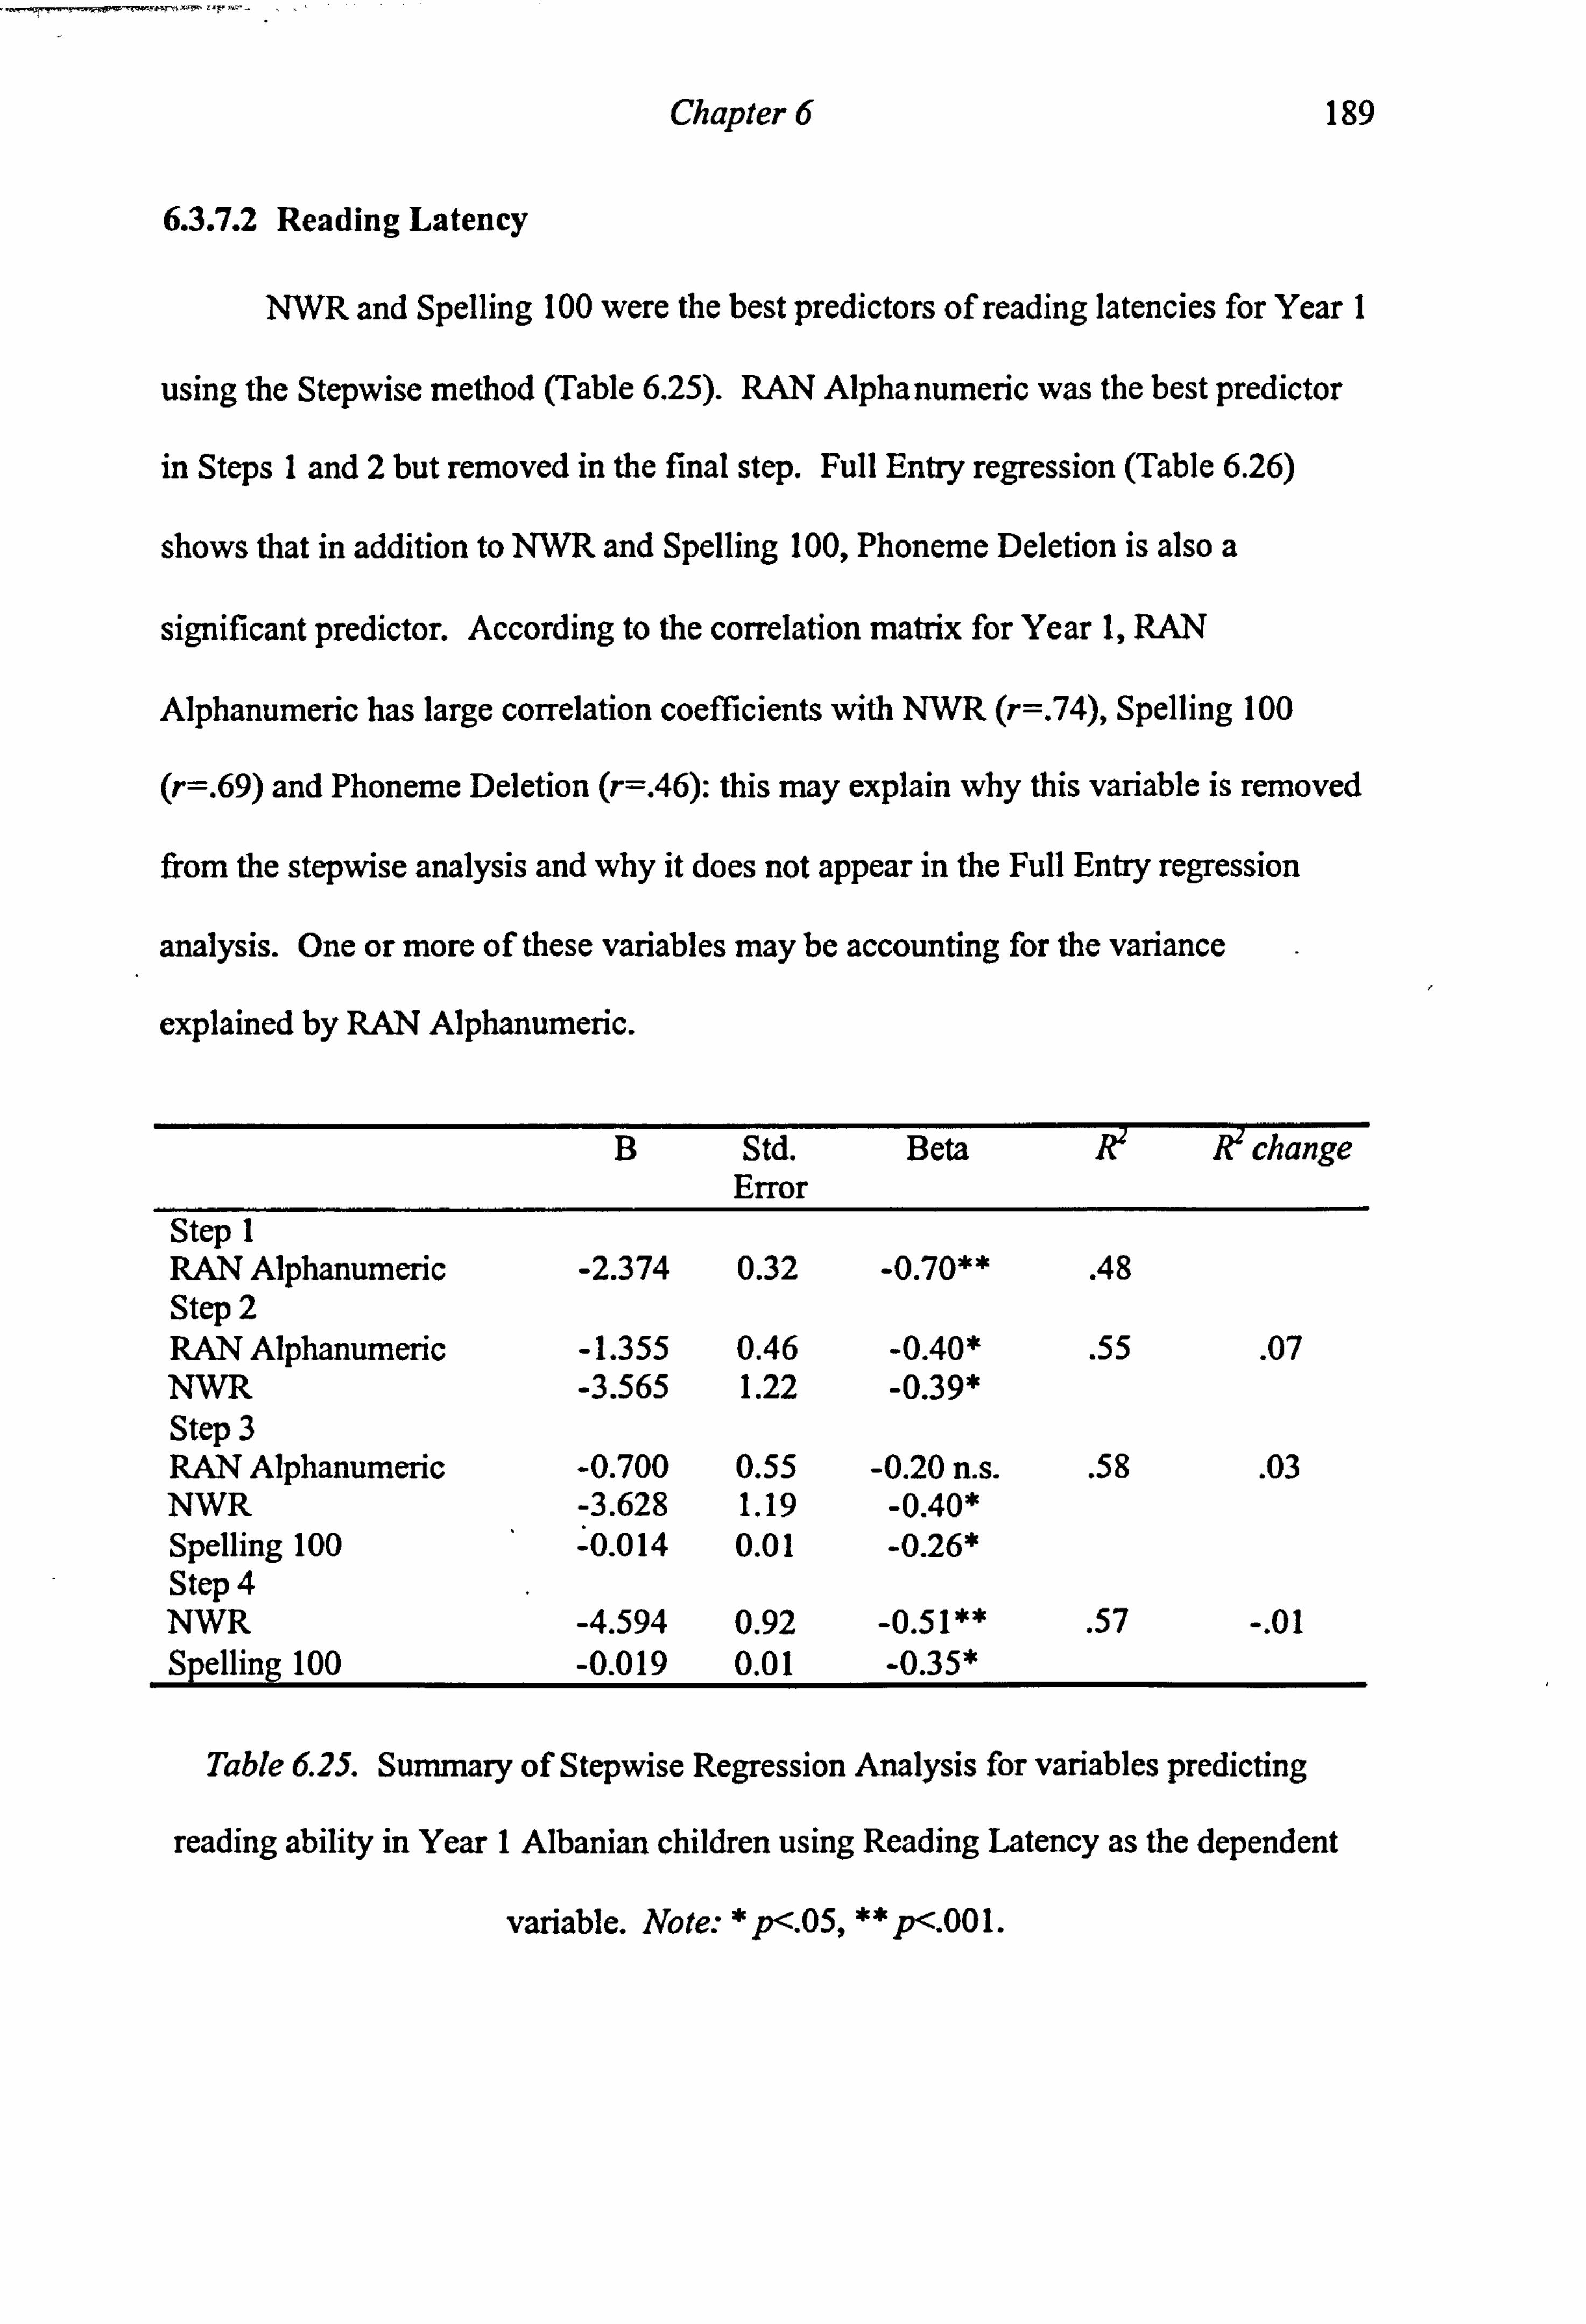
Chapter 6
6.3.7.2 Reading Latency
189
NWR and Spelling 100 were the best predictors of reading latencies for Year 1
using the Stepwise method (Table 6.25). RAN Alphanumeric was the best predictor
in Steps 1 and 2 but removed in the final step. Full Entry regression (Table 6.26)
shows that in addition to NWR and Spelling 100, Phoneme Deletion is also a
significant predictor. According to the correlation matrix for Year 1, RAN
Alphanumeric has large correlation coefficients with NWR (r=. 74), Spelling 100
(r=. 69) and Phoneme Deletion (r=. 46): this may explain why this variable is removed
from the stepwise analysis and why it does not appear in the Full Entry regression
analysis. One or more of these variables may be accounting for the variance
explained by RAN Alphanumeric.
B Std. Error
Beta change
Step 1 RAN Alphanumeric -2.374 0.32 -0.70** . 48 Step 2 RAN Alphanumeric -1.355 0.46 -0.40* . 55 . 07 NWR -3.565 1.22 -0.39* Step 3 RAN Alphanumeric -0.700 0.55 -0.20 n. s. . 58 . 03 NWR -3.628 1.19 -0.40* Spelling 100 -0.014 0.01 -0.26* Step 4 NWR -4.594 0.92 -0.51** . 57 -. 01 Spelling 100 -0.019 0.01 -0.35*
Table 6.25. Summary of Stepwise Regression Analysis for variables predicting
reading ability in Year 1 Albanian children using Reading Latency as the dependent
variable. Note: * p<. 05, ** p<. 001.

Chapter 6
B Std. Error Beta (Constant) 4.716 0.75 NWR -4.388 1.28 -0.49* Comprehension 100 -0.004 0.01 -0.06 RAN Alphanumeric -1.187 0.69 -0.35 RAN Colour and Object 1.172 0.68 0.22 Phoneme deletion 0.058 0.02 0.27* Wordchains -0.010 0.01 -0.08 Generic Speed 0.955 1.11 0.09 CPM -0.009 0.02 -0.05 Spelling 100 -0.019 0.01 -0.36*
190
Table 6.26. Summary of Full Entry Regression Analysis for variables predicting
reading ability in Year 1 Albanian children using Reading Latency as the dependent
variable [R2=. 65, F(9,50)=10.14**]. Note: * p<. 05, ** p<. 001.
6.3.7.3 OMRT
When the OMRT was used as the dependent variable, NWR and Spelling 50
were found to be significant in the stepwise regression, and NWR alone in the Full
Entry method (Tables 6.27 and 6.28).
B Std. Error
Beta change
Step 1 NWR 0.981 0.12 0.76** . 58 Step 2 NWR 0.801 0.12 0.62** . 67 . 09 Spelling 50 0.007 0.00 0.34**
Table 6.27. Summary of Stepwise Regression Analysis for variables predicting
reading ability in Year 1 Albanian children using OMRT as the dependent variable.
Note: * p<. 05, ** p<. 001.
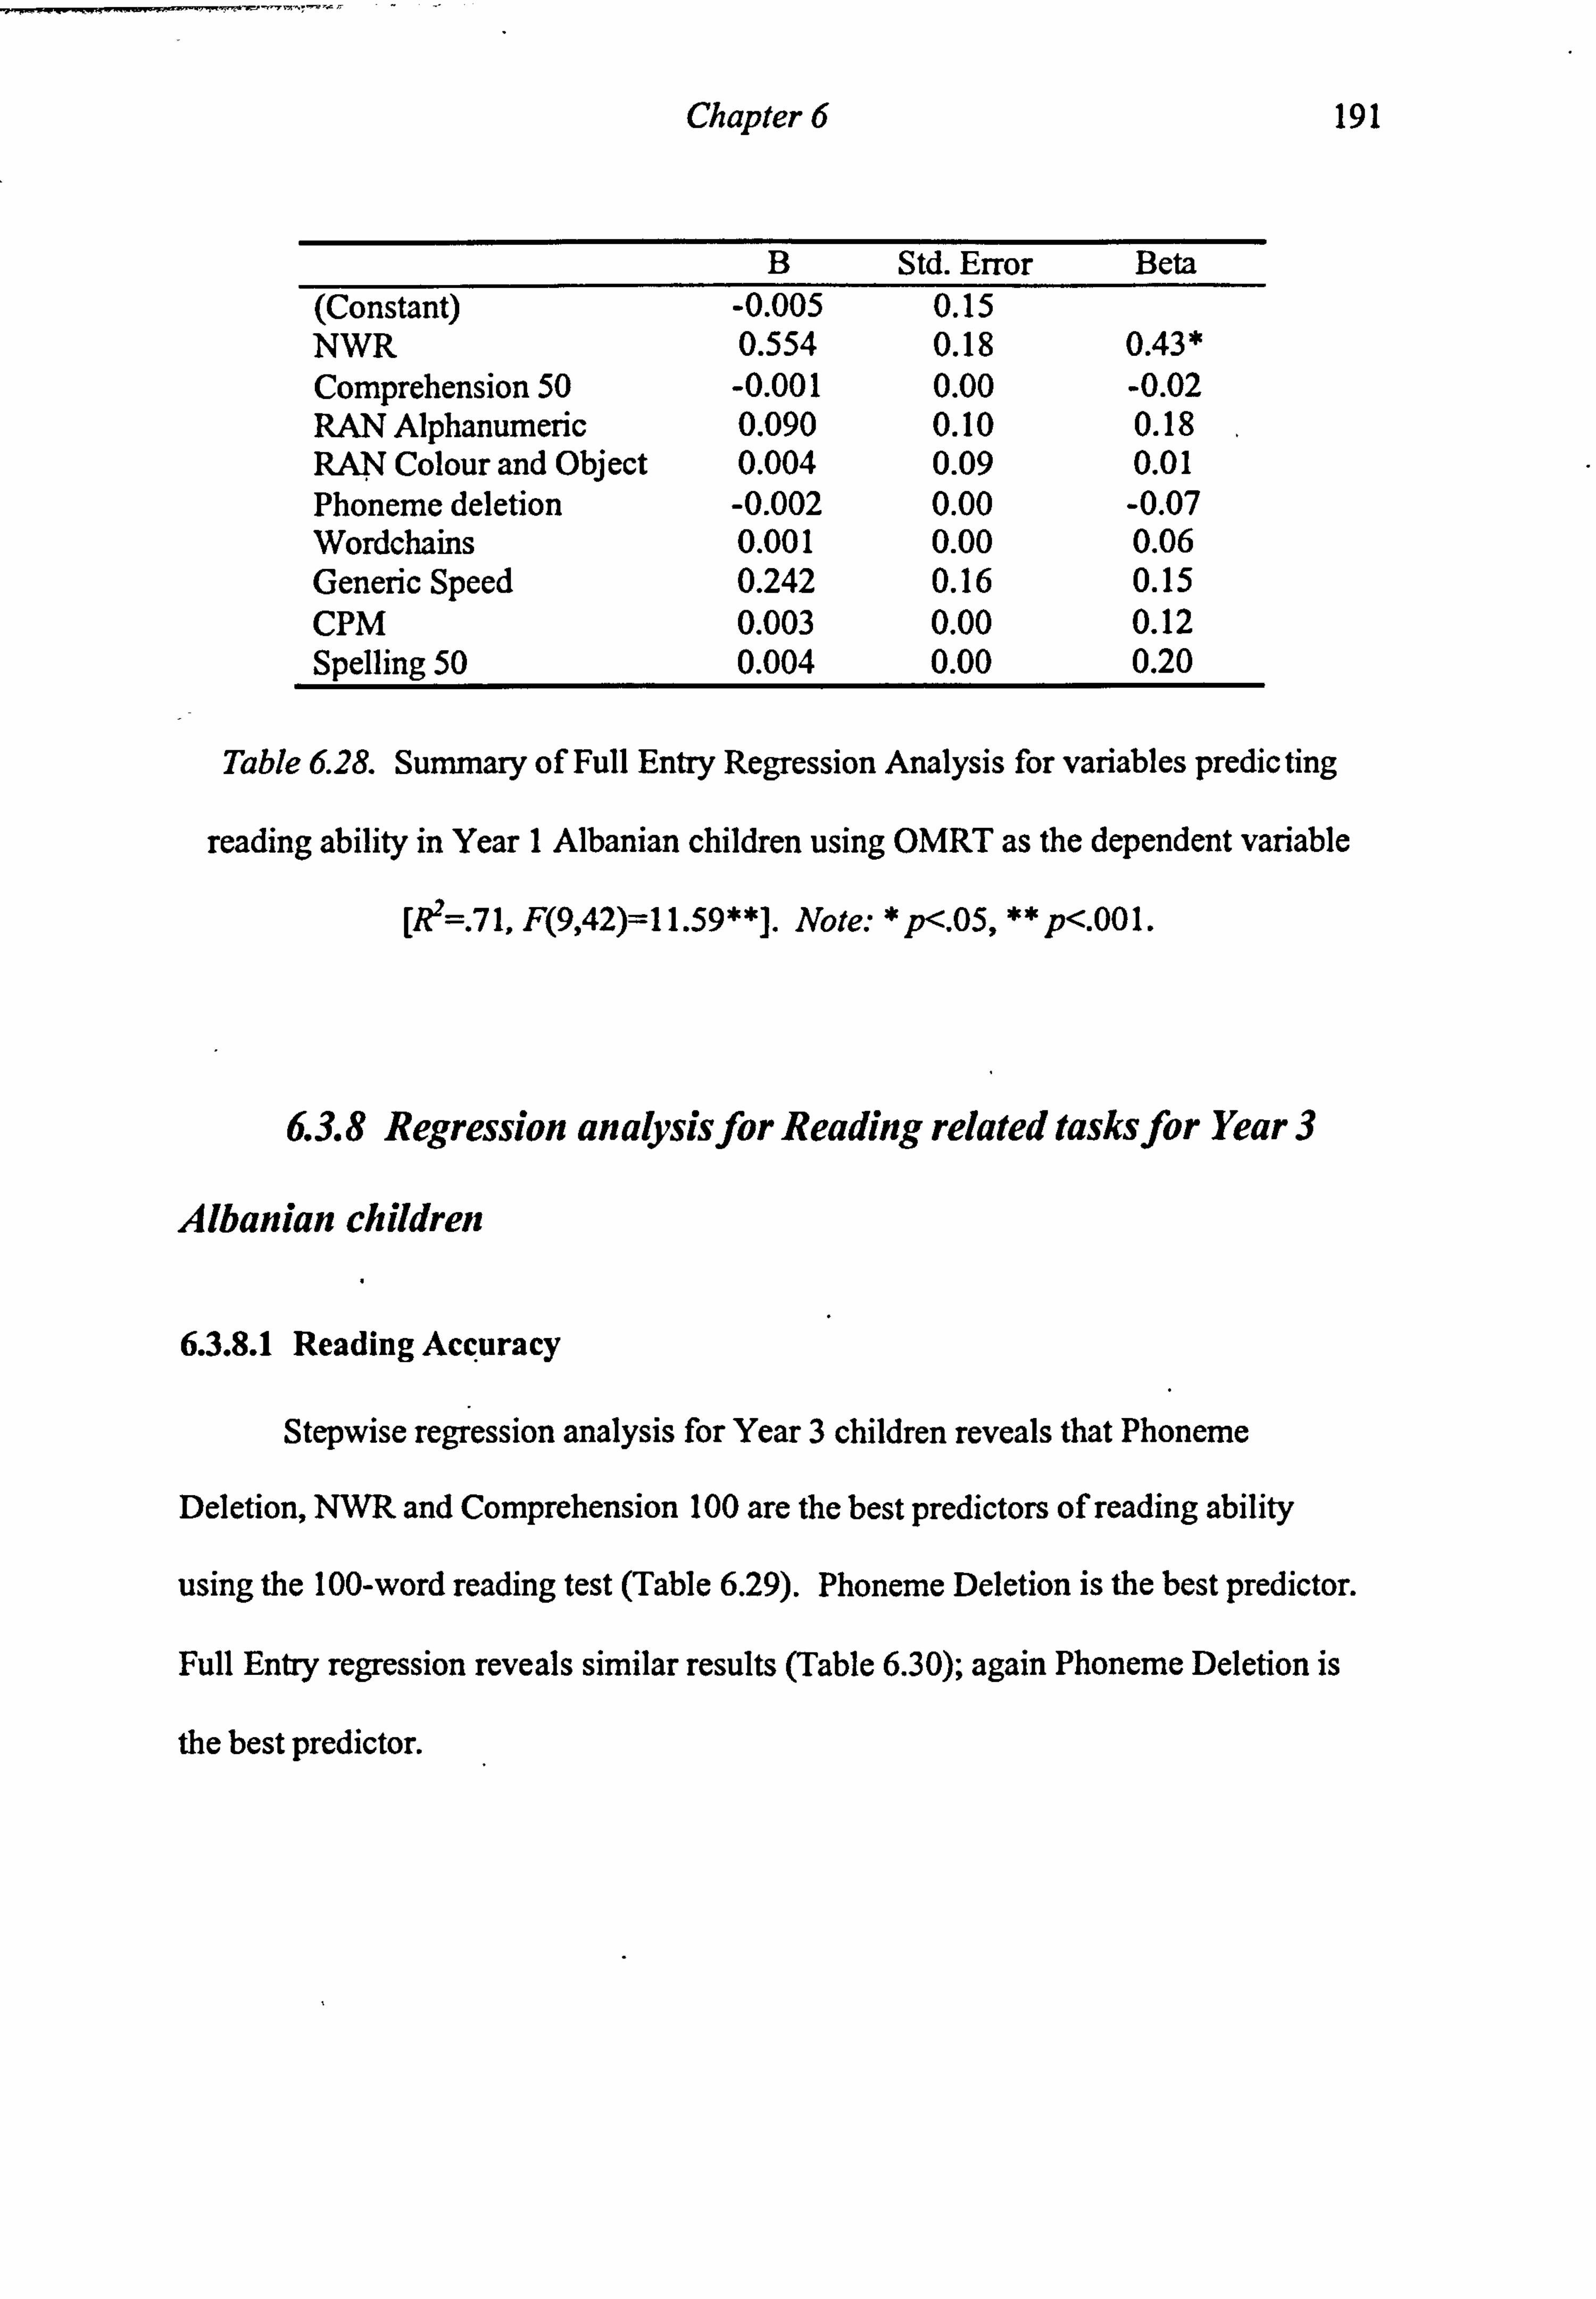
Chapter 6
B Std. Error Beta (Constant) -0.005 0.15 NWR 0.554 0.18 0.43* Comprehension 50 -0.001 0.00 -0.02 RAN Alphanumeric 0.090 0.10 0.18 RAN Colour and Object 0.004 0.09 0.01 Phoneme deletion -0.002 0.00 -0.07 Wordchains 0.001 0.00 0.06 Generic Speed 0.242 0.16 0.15 CPM 0.003 0.00 0.12 Spelling 50 0.004 0.00 0.20
191
Table 6.28. Summary of Full Entry Regression Analysis for variables predicting
reading ability in Year 1 Albanian children using OMRT as the dependent variable
[R2=. 71, F(9,42)=11.59**]. Note: * p<. 05, ** p<. 001.
6.3.8 Regression analysis for Reading related tasks for Year 3
Albanian children
6.3.8.1 Reading Accuracy
Stepwise regression analysis for Year 3 children reveals that Phoneme
Deletion, NWR and Comprehension 100 are the best predictors of reading ability
using the 100-word reading test (Table 6.29). Phoneme Deletion is the best predictor.
Full Entry regression reveals similar results (Table 6.30); again Phoneme Deletion is
the best predictor.

Chapter 6 192
B Std. Error
Beta change
Step 1 Phoneme Deletion 1.762 0.33 0.57** . 33 Step 2 Phoneme Deletion 1.232 0.35 0.40* . 43 . 10 NWR 21.915 6.98 0.36* Step 3 Phoneme Deletion 1.339 0.34 0.44** . 47 . 04 NWR 18.430 6.96 0.30* Comprehension 100 0.207 0.10 0.22*
Table 6.29. Summary of Stepwise Regression Analysis for variables predicting
reading ability in Year 3 Albanian children using Reading 100 as the dependent
variable. Note: * p<. 05, ** p<. 001.
B Std. Error Beta (Constant) 15.002 -13.75 NWR 22.468 9.58 0.37* Comprehension 100 0.254 0.11 0.26* RAN Alphanumeric 0.458 6.44 0.01 RAN Colour and Object -1.977 7.34 -0.03 Phoneme deletion 1.234 0.40 0.40* Wordchains -0.177 0.14 -0.20 Generic Speed -0.866 6.79 -0.01 CPM 0.335 0.20 0.17 Spelling 100 0.120 0.09 0.17
Table 6.30. Summary of Full Entry Regression Analysis for variables predicting
reading ability in Year 3 Albanian children using Reading 100 as the dependent
variable [R2=. 54, F(9,50)--6.51**]. Note: *p<05, **p<. 001.
6.3.8.2 Reading Latency
When regression analysis was carried out with reading latency as the
dependent variable NWR reading was a predictor in Stepwise and Full Entry
regression, whereas Wordchains variable was a predictor in Stepwise regression
(Table 6.31) but was replaced by RAN Alphanumeric in Full entry method (Table
6.32). From the correlation matrix for Year 3, RAN Alphanumeric and Wordchains

Chapter 6 193
are highly correlated (R2=. 73); this may explain why Wordchains are replaced by
RAN Alphanumeric.
B Std. Error
Beta change
Step 1 NWR -2.501 0.36 -0.67** . 45 Step 2 NWR -1.869 0.44 -0.50** . 50 . 05 Wordchains -0.015 -0.01 -0.28*
Table 6.31. Summary of Stepwise Regression Analysis for variables predicting
reading ability in Year 3 Albanian children using Reading Latency as the dependent
variable. Note: * p<. 05, **p<. 001.
B Std. Error Beta (Constant) 3.183 0.81 NWR -1.197 0.57 -0.32* Comprehension 100 0.008 0.01 0.14 RAN Alphanumeric -0.778 0.38 -0.41* RAN Colour and Object 0.691 0.43 0.19 Phoneme deletion -0.009 0.02 -0.05 Wordchains -0.009 0.01 -0.17 Generic Speed -0.031 0.40 -0.01 CPM -0.015 0.01 -0.13 Spelling 100 -0.001 0.01 -0.02
Table 6.32. Summary of Full Entry Regression Analysis for variables predicting
reading ability in Year 3 Albanian children-using Reading Latency as the dependent
variable [R2=. 57, F(9,50)=7.35**]. Note: * p<. 05, ** p<. 001.
6.3.8.3 OMRT
Stepwise regression presented in Table 6.33 reveals that NWR, Wordchains
and CPM are the best predictors of OMRT for Year 3 children. NWR and CPM are
best predictors of OMRT when Full Entry regression was carried out (Table 6.34),
with Wordchains almost significant (p=. 05).
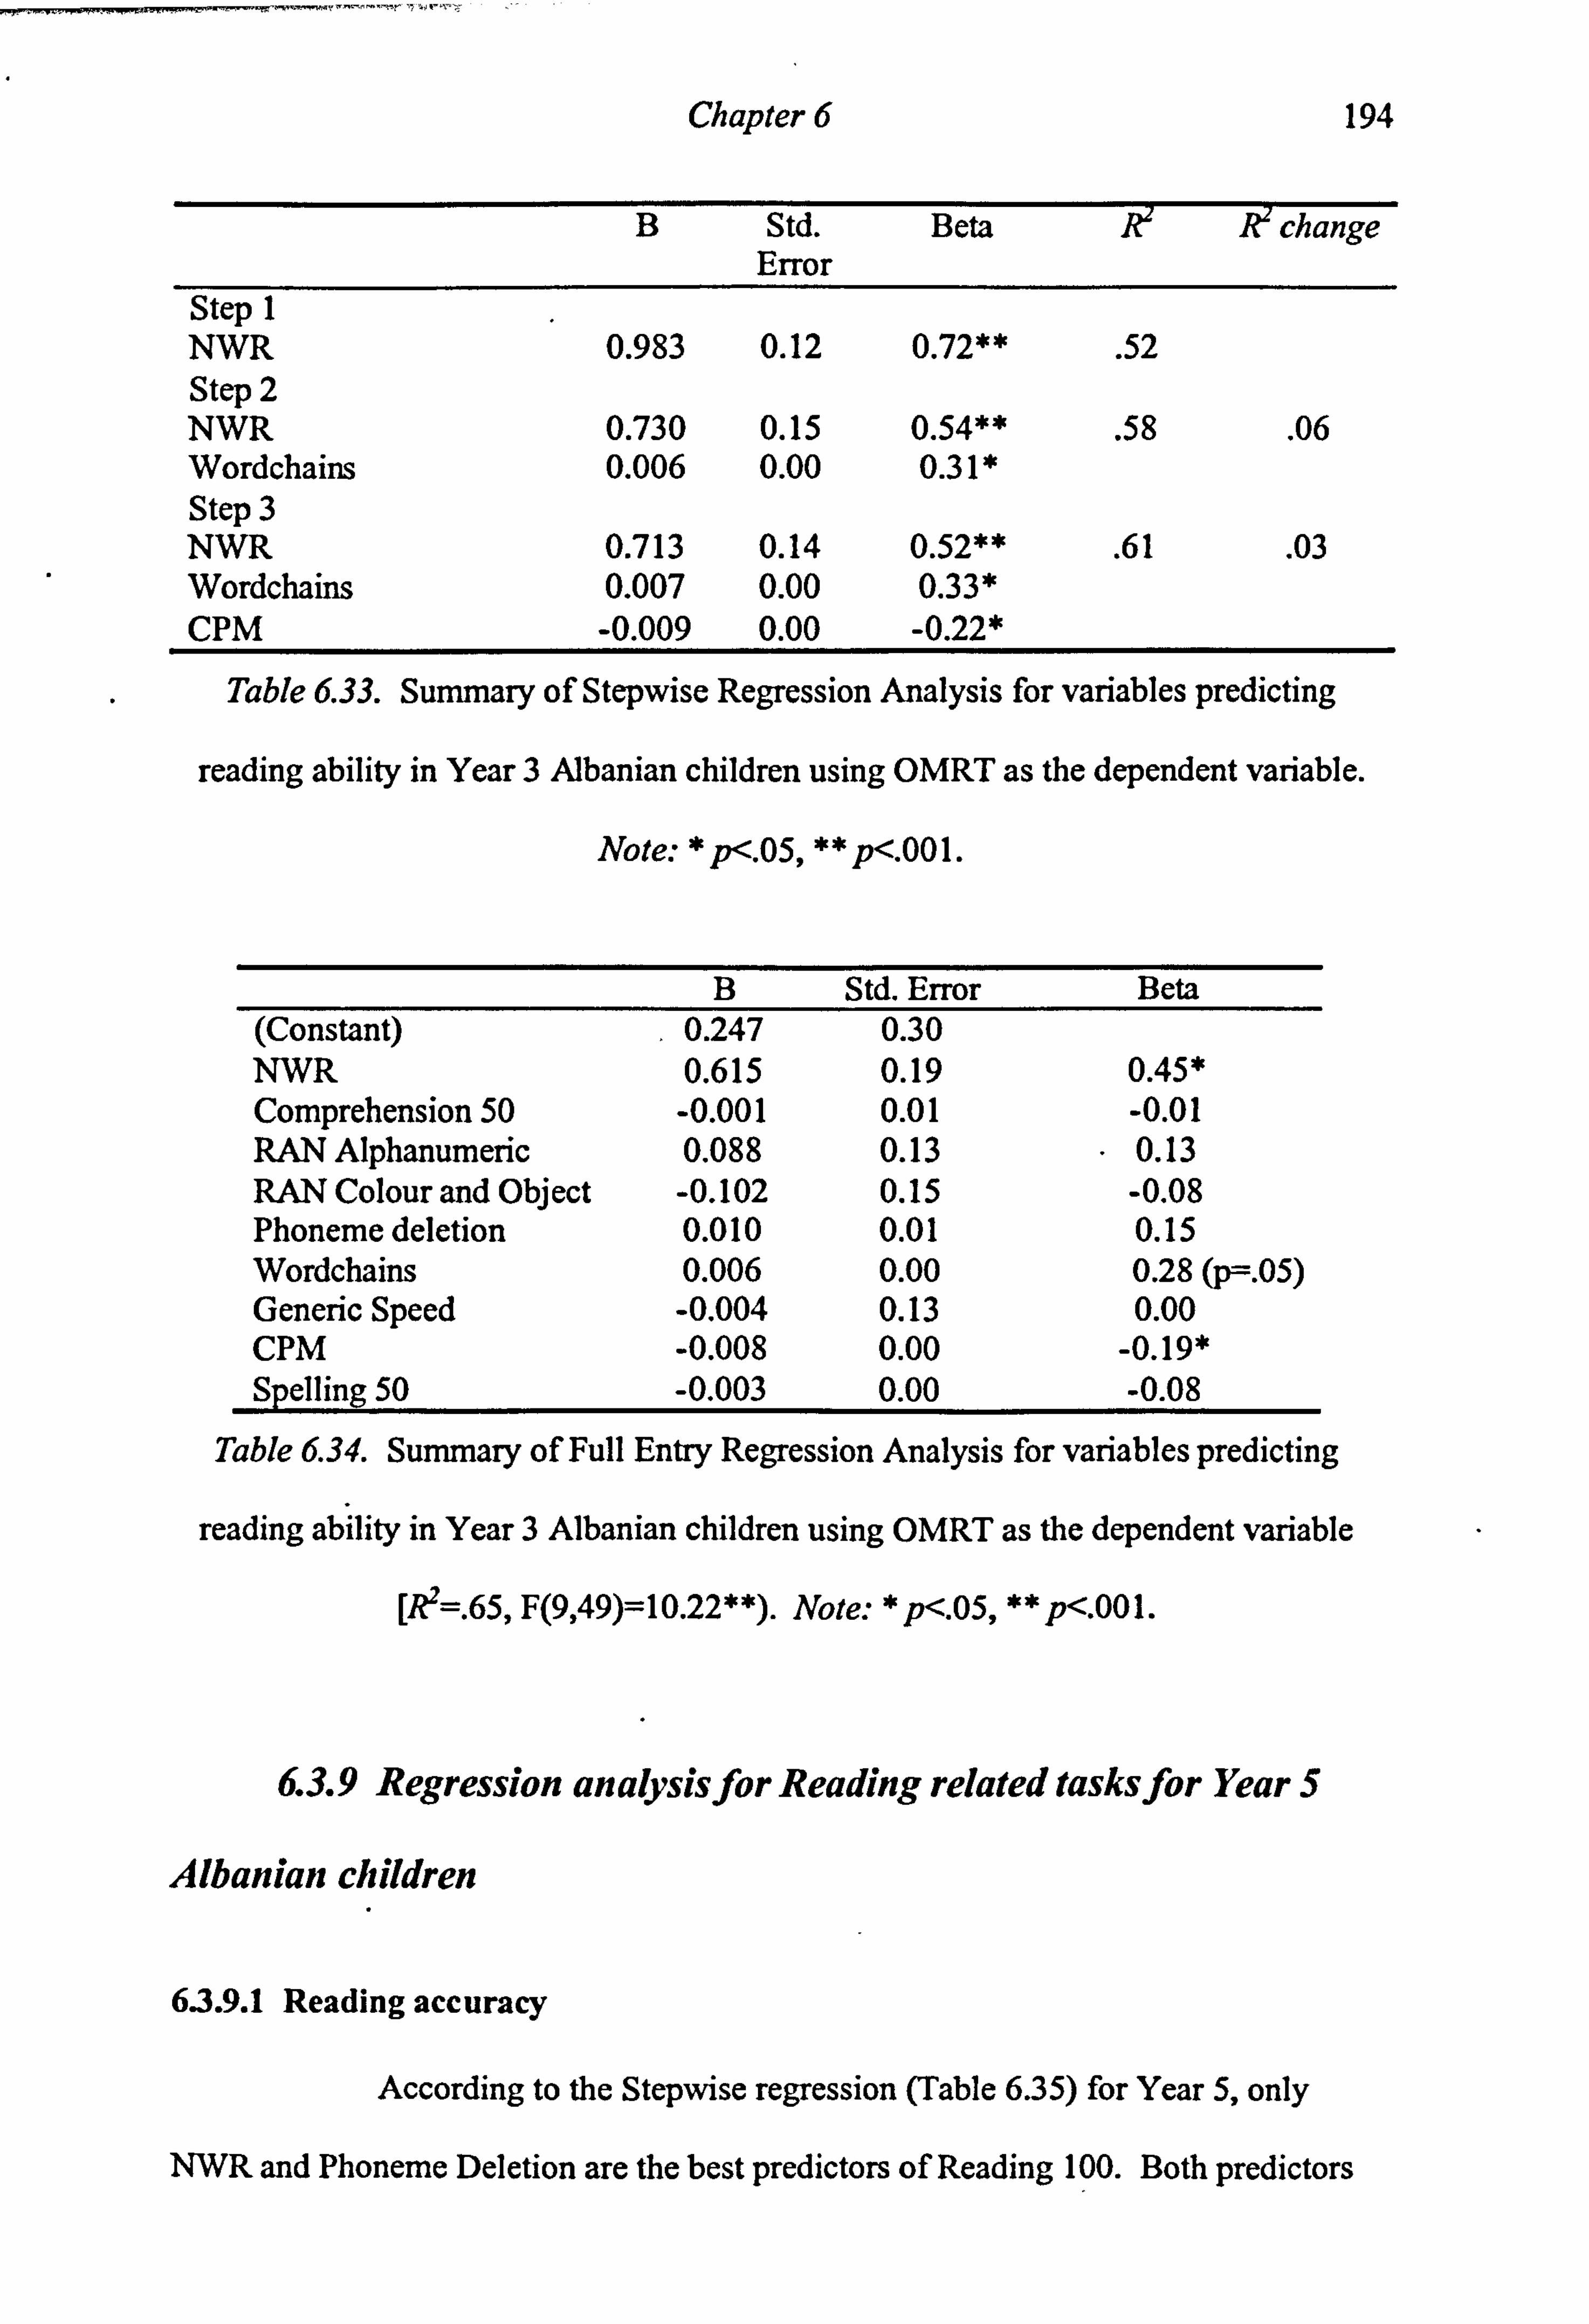
Chapter 6 194
B Std. Error
Beta change
Step 1 NWR 0.983 0.12 0.72** . 52 Step 2 NWR 0.730 0.15 0.54** . 58 . 06 Wordchains 0.006 0.00 0.31* Step 3 NWR 0.713 0.14 0.52** . 61 . 03 Wordchains 0.007 0.00 0.33* CPM -0.009 0.00 -0.22*
Table 6.33. Summary of Stepwise Regression Analysis for variables predicting
reading ability in Year 3 Albanian children using OMRT as the dependent variable.
Note: * p<. 05, ** p<. 001.
B Std. Error Beta (Constant) 0.247 0.30 NWR 0.615 0.19 0.45* Comprehension 50 -0.001 0.01 -0.01 RAN Alphanumeric 0.088 0.13 0.13 RAN Colour and Object -0.102 0.15 -0.08 Phoneme deletion 0.010 0.01 0.15 Wordchains 0.006 0.00 0.28 (p=. 05) Generic Speed -0.004 0.13 0.00 CPM -0.008 0.00 -0.19* Spelling 50 -0.003 0.00 -0.08
Table 6.34. Summary of Full Entry Regression Analysis for variables predicting
reading ability in Year 3 Albanian children using OMRT as the dependent variable
[R2=. 65, F(9,49)=10.22**). Note: * p<. 05, ** p<. 001.
6.3.9 Regression analysis for Reading related tasks for Year 5
Albanian children
6.3.9.1 Reading accuracy
According to the Stepwise regression (Table 6.35) for Year 5, only
NWR and Phoneme Deletion are the best predictors of Reading 100. Both predictors

Chapter 6 195
are substantially correlated (r. 57) and Full Entry regression (Table 6.36) reveals that
only Phoneme Deletion variable is the best predictor.
B Std. Beta change Error
Step 1 NWR 31.730 4.80 0.66** . 43 Step 2 NWR 22.532 5.49 0.47** . 51 . 08 Phoneme Deletion 1.040 0.35 0.33*
Table 6.35. Summary of Stepwise Regression Analysis for variables predicting
reading ability in Year 5 Albanian children using Reading 100 as the dependent
variable. Note: * p<. 05, ** p<. 001.
B Std. Error Beta (Constant) -13.055 27.32 NWR 10.808 8.24 0.22 Comprehension 100 0.440 0.26 0.18 RAN Alphanumeric 0.845 4.42 0.03 RAN Colour and Object 8.162 6.08 0.16 Phoneme deletion 1.139 0.40 0.37* Wordchains -0.064 0.09 -0.12 Generic Speed 5.053 5.45 0.11 CPM 0.188 0.25 0.08 Spelling 100 0.108 0.12 0.14
Table 6.36. Summary of Full Entry Regression Analysis for variables predicting
reading ability in Year 5 Albanian children using Reading 100 as the dependent
variable [R2=. 59, F(9,50)=8.09**]. Note: * p<. 05, **p<. 001.
6.3.9.2 Reading latency
Using reading latencies as the dependent variable, Stepwise regression (Table
6.37) showed that Spelling 100, Wordchains and Phoneme Deletion were the best
predictors. Regression analysis using Full Entry method (Table 6.38) revealed that
only Spelling 100 and Wordchains were significant predictors. Stepwise regression

Chapter 6 196
shows that Phoneme Deletion add only . 03 to the R2, and this might be the reason why
Phoneme Deletion does not have a significant impact in predicting reading latencies
using the Full Entry regression Method.
B Std. Error
Beta change
Step 1 Spelling 100 -0.021 0.00 -0.74** . 55 Step 2 Spelling 100 -0.014 0.00 -0.48** . 66 . 11 Wordchains -0.008 0.00 -0.42** Step 3 Spelling 100 -0.011 0.00 -0.38** . 69 . 03 Wordchains -0.007 0.00 -0.37** Phoneme deletion -0.026 0.01 -0.23*
Table 6.37. Summary of Stepwise Regression Analysis for variables predicting
reading ability in Year 5 Albanian children using Reading Latency as the dependent
variable. Note: * p<. 05, ** p<. 001.
B Std. Error Beta (Constant) 3.377 0.83 NWR 0.014 0.25 0.01 Comprehension 100 -0.002 0.01 -0.02 RAN Alphanumeric -0.237 0.13 -0.24 RAN Colour and Object 0.142 0.18 0.08 Phoneme deletion -0.021 0.01 -0.18 Wordchains -0.006 0.00 -0.29* Generic Speed 0.048 0.16 0.03 CPM 0.002 0.01 0.02 Spelling 100 -0.010 0.00 -0.35*
Table 6.38. Summary of Full Entry Regression Analysis for variables predicting
reading ability in Year 5 Albanian children using Reading Latency as the dependent
variable [R2=. 71, F(9,50)=13.84**]. Note: * p<. 05, **p<. 001.

Chapter 6
6.3.9.3 OMRT
Stepwise regression for Year 5 (Table 6.39) shows that NWR and RAN
197
Alphanumeric are significant predictors of OMRT. Full Entry regression (Table 6.40)
reveals that only NWR was the significant predictor.
B Std. Beta change Error
Step 1 NWR 1.433 0.16 0.78** . 60 Step 2 NWR 0.943 0.23 0.51** . 66 . 06 RAN Alphanumeric 0.365 0.13 0.35*
Table 6.39. Summary of Stepwise Regression Analysis for variables predicting
reading ability in Year 5 Albanian children using OMRT as the dependent variable.
Note: * p<. 05, ** p<. 001.
B Std. Error Beta (Constant) -1.528 0.82 NWR 0.693 0.27 0.37* Comprehension 100 0.016 0.01 0.10 RAN Alphanumeric 0.255 0.16 0.25 RAN Colour and Object 0.247 0.20 0.13 Phoneme deletion 0.016 0.01 0.14 Wordchains 0.002 0.00 0.10 Generic Speed 0.135 0.19 0.08 CPM 0.010 0.01 0.10 Spelling 100 -0.009 0.01 -0.14
Table 6.40. Summary of Full Entry Regression Analysis for variables predicting
reading ability in Year 5 Albanian children using OMRT as the dependent variable
[R2=. 71, F(9,45)--11.93**). Note: * p<. 05, **p<. 001.
6.3.10 Conclusion on Predictors of Reading
Table 6.41 represents a summary of all significant predictors for each
dependent variable examined in this regression analysis.
Chapter 6 198
Reading 100 accuracy. Overall, Phoneme Deletion and NWR tasks are the best
predictors of Reading 100 accuracy. Phoneme Deletion is a significant predictor for
the entire sample and individual years regardless of the regression method used.
NWR does not appear to be significant in Year 1.
RAN Colours and Objects appears to be a significant predictor for all of the
Albanian sample during the Stepwise regression, whereas in the Full entry regression
it is replaced by Spelling 100. RAN Colours and Objects is also significant in Year 1,
regardless of regression methods used.
Finally, the word comprehension variable explains a significant amount of the
variance for Year 3, a result supported by both regression methods.
To summarise, Phoneme Deletion and NWR are the best predictors of Reading
100 in Albanian children.
Reading Latency. Regression analysis for reading latencies is less clear compared to
the Reading 100 analysis. RAN Alphanumeric, Spelling 100, and CPM are the best
predictors for the entire Albanian sample. Across the years, RAN Alphanumeric is
only significant in Year 3 (Full Entry method), whereas CPM does not appear to be
significant for any of the years. Unlike CPM, Spelling 100 is a significant predictor
of reading latencies in Year 1 and the best predictor in Year 5 regardless of the
regression method used. For Year 1 and 3, NWR is the best predictor but does not
appear to be significant in Year 5. The Wordchains variable is the second best
significant for Year 3 (Full Entry method) and Year 5 (both methods).
Chapter .6
199
Finally, the best predictor of Reading 100 does not appear to be a very good
predictor for reading latencies as it significant only in Year 1 (Full Entry method) and
Year 5 (Stepwise regression).
To summarise, NWR is the best predictor for Years 1 and 3. Spelling 100 is
the best predictor for Year 5. This variable together with the Wordchains variable
explain most of the variance of Latency 100 in Year 5.
OMRT. For the OMRT, NWR is the best predictor of the entire Albanian sample and
throughout the 3 year-groups. The Wordchains variable, which is the second best
predictor for the entire Albanian sample, appears to be significant only in Year 3.
CMP is also a significant predictor of OMRT in Year 3.
Finally, Spelling 50 is a significant predictor in Year 1 (Full Entry method),
and RAN Alphanumeric is significant only in Year 5 (Stepwise regression).
To conclude, NWR is the best predictor of OMRT regardless of the regression
method used.
6.3.11 Comparison of patterns for the three reading relating
variables
Overall, the regression analysis pattern is not entirely similar between Reading
100, Latency 100 and OMRT. They seem to tap different skills. The only predictor
that these variables have in common is NWR.
H. 4.1. Phonological awareness. NWR and Phoneme deletion will be the main
predictors of reading ability in Year 1.
From the regression analysis on reading related variables (Reading 100,
Latency 100, and OMRT), it is clear that NWR and Phoneme Deletion are the main

Chapter 6 200
predictors. This supports hypothesis H. 4.1. However, there are other significant
variables that predict reading ability. RAN Colours and Objects and Spelling tasks
are significant predictors, but predict less of the variance than NWR and Phoneme
Deletion. In addition, phonological skills tasks are best the predictors in later years as
well as early years of literacy development.
The main conclusion here is that phonological awareness related tasks are the
main predictors of reading ability in Year 1.
H. 4.2. RAN. Like NWR and Phoneme deletion, the contribution of RAN to reading
will be present only in Year 1.
The findings of the regression analysis do support this hypothesis only when
reading accuracy is taken into account (Reading 100). For time-limited/related reading
measures like OMRT and Latency 100 the RAN tasks show somewhat unexpected
results. Rapid naming tasks (RAN Alphanumeric) are a significant predictor in Year3
for Latency 100 (Full Entry regression only), and in Year 5 for OMRT (Stepwise
regression only).
H. 4.3. Orthographic knowledge. Wordchains will become a good predictor of
reading ability in later years.
Regression analysis revealed that Hypothesis H. 4.3. was supported:
Wordchains task was found to be a significant predictor for Latency 100 and OMRT
for Year 3, and Latency 100 for Year 5.

0 N
b 1 oý Q
v
V
U. 0. 9Z4
dd
E
(n za t4
V po
:. yo
CL vvi E
LL. :::
u
ý3 u rn äzÜý
p0
EU oý cz
Vd
.3EVv oa n'
vý ärß ý
4) ceý
cd
pö_
y= p 0ä z
o py N
Cl) , 3,3 0u -Qo
Zäa; QZ
0 0 cn
Oy O ý cä
GC 11*
(A 3 '114
to * ;a c)
v°i3äc4
s äN
cz 14
11
cý O ce b v'1 3ö 11
z3 ý
U rr
u 1.0 oU
,
3Zäv°'ýý
O O
00 C lý
ý Y!
z
z¢. u aý vßi
Ü Nri,
e°O ä^ äO
z- rl.
O 0
U
cd
3 fl z
e cl a
3z u zä1. ý
C cl
z3ý"x
N i°.
M \o
Z :u
u' z
O vi n
3°' a Z V)
y
b r- 3ör, II
z3 ý
y C CIS
Z3
0
ÖO
EU ö z¢
II zäaL)
z °" z
0)
E
II 3 äö z
C)
0) 00
CO
a Q aý z CIO) dz
C ° a IQ n z3
�II dz
C) ° EN
C II zä
co 0 ¢u ý3
Q EUo
zaärýý
O 0 r. eo
sý
00 u z
d
ýn . öu ZL
V
d
öu zä ý
V d
y
3ou Zä Q4
dz
cl
00 dz "ý
ca
ö u' Zä
C .cQ o, y
Zcv? ¢op
z a; -
O VI bA
p.
0 il
oý w
aý b
v
. im Q
ý° y aý
on
aý a b cv o, o
b aý w w w
w 0 U_
'b N Qr
r. + A cý U
w ýn
.y
W O
cd
O
ti a b
ýý4

Chapter 6
6.3.12 Regression analysis for Spelling related tasks for all
Albanian children.
6.3.12.1 Spelling 100 Accuracy
The final step of Stepwise regression analysis (Table 6.42) for the entire
Albanian sample revealed that NWS, RAN Alphanumeric, Phoneme Deletion and
202
RAN Objects and Colours were the best predictors of spelling ability using Spelling
100 as the dependent variable. In the Full Entry regression none of the RAN variables
appeared significant; only NWS and Phoneme Deletion were best predictors (Table
6.43). From the final step of the Stepwise regression, it is evident that RAN Colours
and Objects explains only a small percentage of the variance (1%), and this could be
the reason why the effect of this variable is not strong enough to be significant in the
Full Entry Model.
B Std. Beta Rchange Error
Step 1 NWS - 1.524 0.12 0.70** . 49 Step 2 NWS 1.154 0.12 0.53** . 60 . 11 RAN Alphanumeric 11.222 1.65 0.37** Step 3 NWS 1.011 0.11 0.46** . 65 . 05 RAN Alphanumeric 8.769 1.63 0.29** Phoneme Deletion 1.094 0.22 0.26** Step 4 NWS 0.999 0.11 0.46** . 66
. 01 RAN Alphanumeric 4.949 2.43 0.16* Phoneme Deletion 1.158 0.22 0.27** RAN Objects and Colours 9.772 4.67 0.15*
Table 6.42. Summary of Stepwise Regression Analysis for variables predicting
spelling ability in Albanian using Spelling 100 as the dependent variable. Note: *
p<. 05, **P<. 001.

Chapter 6
B Std. Beta Error
203
(Constant) -7.286 8.52 NWS 0.974 0.12 0.45** Comprehension 100 -0.038 0.07 -0.03 RAN Alphanumeric 5.746 3.30 0.19 RAN Objects and Colours 9.406 4.80 0.15 Phoneme Deletion 0.928 0.25 0.22** Wordchains 0.039 0.07 0.05 Generic Speed -8.363 4.77 -0.15 CPM 0.255 0.14 0.11 Reading 100 0.090 0.08 0.07
Table 6.43. Summary of Full Entry Regression Analysis for variables predicting
spelling ability in Albanian using Spelling 100 as the dependent variable [R2=. 67,
F(9,170)=37.96**]. Note: * p<. 05, ** p<. 001.
6.3.12.2 Spelling 50 accuracy
When Spelling 50 was used as dependent variable for the entire Albanian
sample, an almost similar pattern as in Spelling 100 regression analysis emerged. In
the Stepwise regression (Table 6.44), NWS, RAN Alphanumeric and Phoneme
Deletion were best predictors, whereas in Full Entry regression, the rapid naming
variable failed to reach a significant level (Table 6.45).
B Std. Error Beta change
Step 1 NWS 0.599 0.05 0.67** . 45 Step 2 NWS 0.461 0.05 0.52** . 57 . 12 RAN Alphanumeric 4.835 0.74 0.37** Step 3 NWS 0.424 0.05 0.48** . 59 . 02 RAN Alphanumeric 4.118 0.75 0.32** Phoneme Deletion 0.326 0.10 0.18*
Table 6.44. Summary of Stepwise Regression Analysis for variables predicting
spelling ability in Albanian using the SPELLING 50 as the dependent variable. Note:
* p<. 05, **p<. 001.

Chapter 6
B Std. Error
Beta
(Constant) 14.113 4.55 NWS 0.404 0.05 0.45** Comprehension 50 -0.154 0.09 -0.12 RAN Alphanumeric 3.065 1.59 0.24 RAN Colours and Objects 3.870 2.17 0.15 Phoneme Deletion 0.318 0.11 0.18* Wordchains 0.029 0.04 0.09 Generic Speed -0.266 2.19 -0.01 CPM 0.034 0.07 0.04 OMRT -0.884 1.73 -0.05
204
Table 6.45. Summary of Full Entry Regression Analysis for variables predicting
spelling ability in Albanian using the SPELLING 50 as the dependent variable
[R2=. 61, F(9,156)=26.85**]. Note: * p<. 05, ** p<. 001.
6.3.13 Regression analysis for Spelling related tasks for Year 1
Albanian children.
6.3.13.1 Spelling 100 accuracy
In Year 1, both regression methods revealed that RAN Alphanumeric and
NWS were the best predictors of Spelling 100 (Tables 6.46 and 6.47). According to
the stepwise regression values, RAN Alphanumeric was the best predictor.
6.3.13.2 Spelling 50 accuracy
Using both regression methods, the same predictors as in Spelling 100 were
significant when Spelling 50 was used as the dependent variable (Table 6.48 and 6.49).
According to the stepwise regression values, RAN Alphanumeric was the best
predictor.

Chapter 6 205
B Std. Error
Beta change
Step 1 RAN Alphanumeric 45.125 5.76 0.72** . 51 Step 2 RAN Alphanumeric 35.119 5.42 0.56** . 65 . 14 NWS 0.973 0.21 0.40**
Table 6.46. Summary of Stepwise Regression Analysis for variables predicting
spelling ability in Year 1 Albanian children using Spelling 100 as the dependent
variable. Note: * p<. 05, ** p<. 001.
B Std. Error Beta (Constant) -4.492 13.88 NWS 0.834 0.22 0.34** Comprehension 100 -0.168 0.11 -0.12 RAN Alphanumeric 28.096 10.27 0.45* RAN Colour and Object 6.413 12.33 0.07 Phoneme deletion 0.572 0.45 0.15 Wordchains -0.007 0.25 0.00 Generic Speed 12.483 19.04 0.06 CPM 0.289 0.26 0.09 Reading 100 -0.044 0.12 -0.04
Table 6.47. Summary of Full Entry Regression Analysis for variables predicting
spelling ability in Year 1 Albanian children using Spelling 100 as the dependent
variable [R2=. 69, F(9,50)=12.50**]. Note: * p<. 05, ** p<. 001.
B Std. Error
Beta change
Step 1 RAN Alphanumeric 16.457 2.73 0.65** . 42 Step 2 RAN Alphanumeric 13.573 2.44 0.54** . 58
. 16 NWS 0.426 , 0.10 0.42**
Table 6.48. Summary of Stepwise Regression Analysis for variables predicting
spelling ability in Year 1 Albanian children using SPELLING 50 as the dependent
variable. Note: * p<. 05, ** p<. 001.
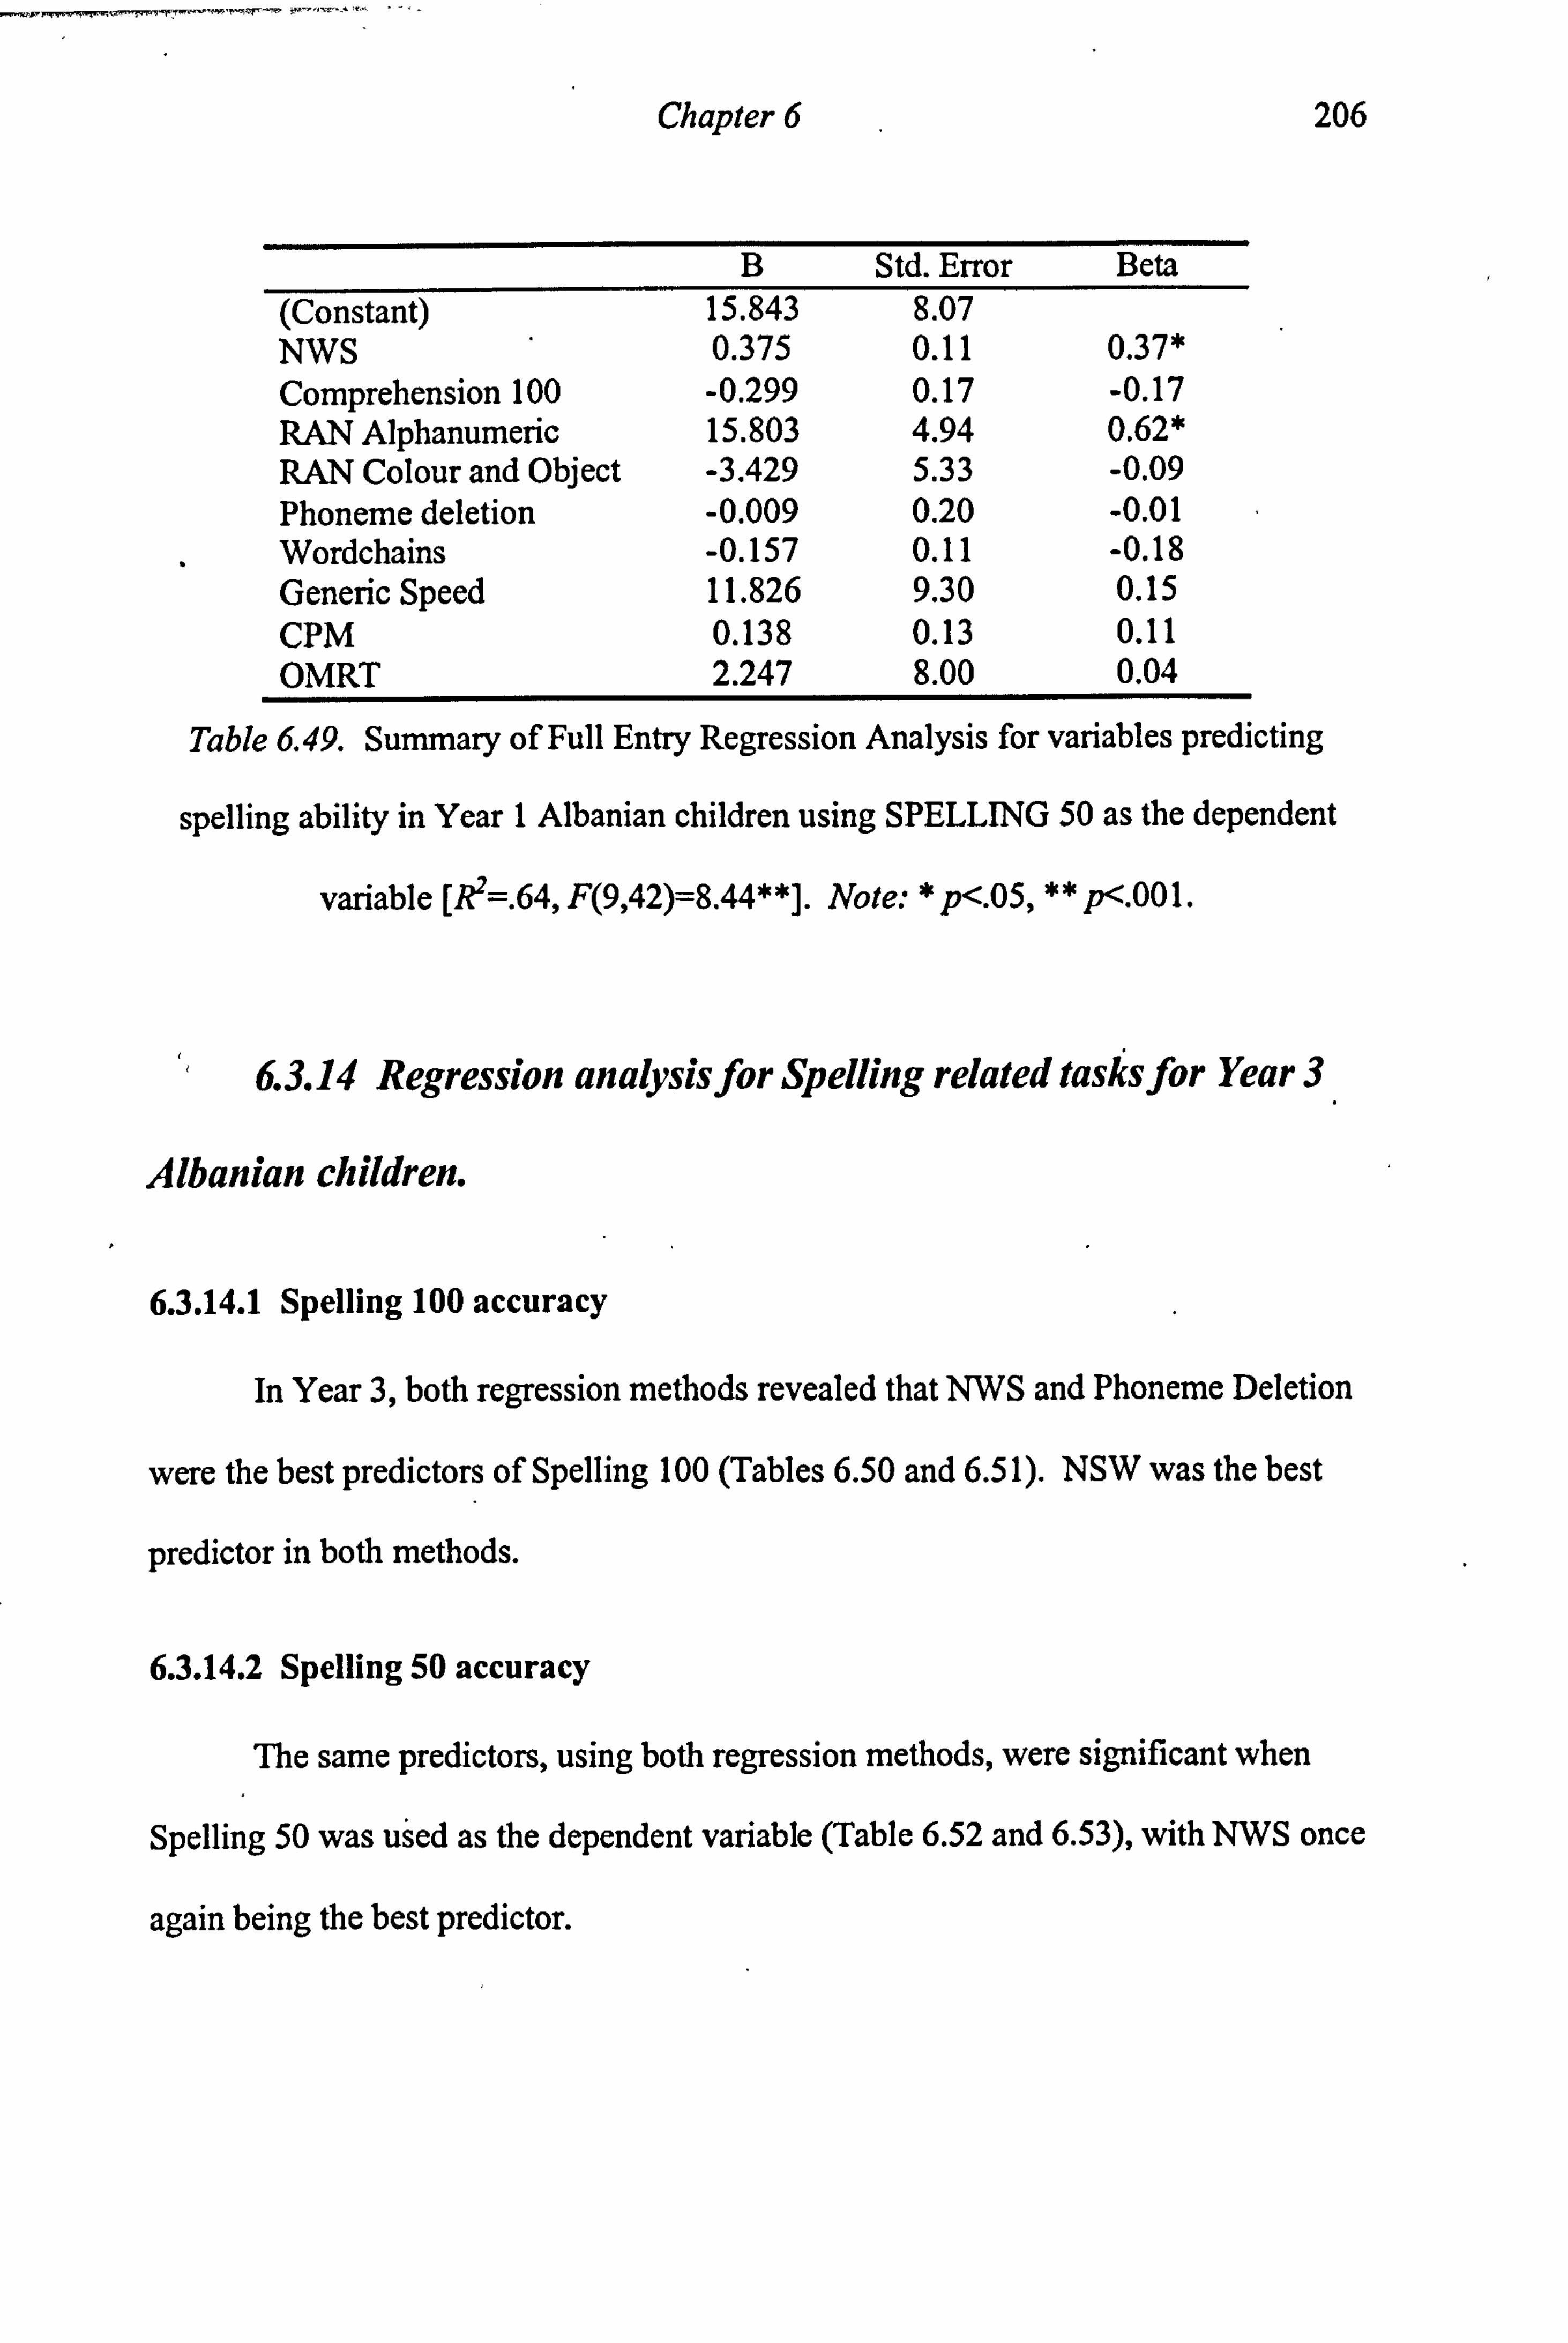
Chapter 6
B Std. Error Beta (Constant) 15.843 8.07 NWS 0.375 0.11 0.37* Comprehension 100 -0.299 0.17 -0.17 RAN Alphanumeric 15.803 4.94 0.62* RAN Colour and Object -3.429 5.33 -0.09 Phoneme deletion -0.009 0.20 -0.01 Wordchains -0.157 0.11 -0.18 Generic Speed 11.826 9.30 0.15 CPM 0.138 0.13 0.11 OMRT 2.247 8.00 0.04
206
Table 6.49. Summary of Full Entry Regression Analysis for variables predicting
spelling ability in Year 1 Albanian children using SPELLING 50 as the dependent
variable [R2=. 64, F(9,42)=8.44**]. Note: * p<. 05, ** p<. 001.
6.3.14 Regression analysis for Spelling related tasks for Year 3
Albanian children.
6.3.14.1 Spelling 100 accuracy
In Year 3, both regression methods revealed that NWS and Phoneme Deletion
were the best predictors of Spelling 100 (Tables 6.50 and 6.51). NSW was the best
predictor in both methods.
6.3.14.2 Spelling 50 accuracy
The same predictors, using both regression methods, were significant when
Spelling 50 was used as the dependent variable (Table 6.52 and 6.53), with NWS once
again being the best predictor.

Chapter 6 207
B Std. Error
Beta change
Step 1 NWS 1.177 0.20 0.60** . 37 Step 2 NWS 0.937 0.20 0.48** . 48 . 11 Phoneme Deletion 1.550 0.44 0.36**
Table 6.50. Summary of Stepwise Regression Analysis for variables predicting
spelling ability in Year 3 Albanian children using Spelling 100 as the dependent
variable. Note: * p<. 05, ** p<. 001.
B Std. Error Beta (Constant) -12.948 18.67 NWS 0.855 0.21 0.44** Comprehension 100 0.157 0.16 0.12 RAN Alphanumeric 3.449 8.04 0.08 RAN Colour and Object -1.900 10.27 -0.02 Phoneme deletion 1.271 0.58 0.30* Wordchains -0.116 0.20 -0.09 Generic Speed -12.816 9.34 -0.15 CPM 0.127 0.28 0.05 Reading 100- 0.240 0.18 0.17
Table 6.51. Summary of Full Entry Regression Analysis for variables predicting
spelling ability in Year 3 Albanian children using Spelling 100 as the dependent
variable [R2=. 54, F(9,50)=6.44**]. Note: * p<. 05, ** p<. 001.
B Std. Error
Beta change
Step 1 NWS 0.423 0.08 0.57** . 33 Step 2 NWS 0.342 0.08 0.46** . 42 . 09 Phoneme deletion 0.522 0.18 0.32*
Table 6.52. Summary of Stepwise Regression Analysis for variables predicting
spelling ability in Year 3 Albanian children using SPELLING 50 as the dependent
variable. Note: * p<. 05, **p<. 001.

Chapter 6
B Std. Error Beta (Constant) 11.022 8.60 NWS 0.322 0.09 0.44** Comprehension 100 0.070 0.16 0.05 RAN Alphanumeric 0.637 3.50 0.04 RAN Colour and Object 2.039 4.54 0.06 Phoneme deletion 0.501 0.22 0.31* Wordchains 0.012 0.09 0.02 Generic Speed 2.043 3.94 0.06 CPM -0.033 0.12 -0.03 OMRT -1.352 3.93 -0.06
208
Table 6.53. Summary of Full Entry Regression Analysis for variables predicting
spelling ability in Year 3 Albanian children using SPELLING 50 as the dependent
variable [R2=. 44, F(9,49)=4.30**]. Note: * p<. 05, ** p<. 001.
6.3.1 5 Regression analysis for Spelling related tasks for Year 5
Albanian children.
6.3.15.1 Spelling 100 accuracy
From the final step of Stepwise regression (Table 6.54), it was found that
NWS, Phoneme Deletion, RAN Objects and Colours and CPM were significant
predictors of Spelling 100 in Year 5. The same variables appeared to be significant
when Full Entry regression was used (Table 6.55). Both models explained a large
amount of the variability in, 82% and 84% respectively.

Chapter 6 209
B Std. Beta change Error
Step 1 NWS 1.538 0.12 0.86** . 74 Step 2 NWS 1.333 0.12 0.74** . 79 . 05 Phoneme Deletion 1.028 0.27 0.26** Step 3 NWS 1.214 0.13 0.68** . 81 . 02 Phoneme Deletion 1.027 0.26 0.26** RAN Colour and Object 9.229 4.21 0.14* Step 4 NWS 1.170 0.13 0.65** . 82 . 01 Phoneme Deletion 1.021 0.25 0.26** RAN Colour and Object 9.043 4.08 0.14* CPM 0.386 0.18 0.13*
Table 6.54. Summary of Stepwise Regression Analysis for variables predicting
spelling ability in Year 5 Albanian children using Spelling 100 as the dependent
variable. Note: * p<. 05, ** p<. 001.
B Std. Error Beta (Constant) 6.555 20.43 NWS 1.223 0.15 0.68** Comprehension 100 -0.130 0.21 -0.04 RAN Alphanumeric 1.306 3.26 0.04 RAN Colour and Object 9.727 4.78 0.15* Phoneme deletion 0.991 0.32 0.25* Wordchains 0.059
. 0.07 0.09 Generic Speed -7.036 4.47 -0.12 CPM 0.509 0.20 0.17* Reading 100 -0.097 0.11 -0.08
Table 6.55. Summary of Full Entry Regression Analysis for variables predicting
spelling ability in Year 5 Albanian children using Spelling 100 as the dependent
variable [R2=. 84, F(9,50)=28.44**]. Note: * p<. 05, ** p<. 001.

Chapter 6
6.3.15.2 Spelling 50 accuracy
210
Stepwise regression for Year 5, using Spelling 50 as the dependent variable
showed that NWS and Phoneme Deletion were the best predictors (Table 6.56).
However, the Full Entry regression identified NWS as the only significant predictor
(Table 6.57).
B Std. Error
Beta change
Step 1 NWS 0.699 0.06 0.83** . 70 Step 2 NWS 0.616 0.07 0.74** . 74 . 04 Phoneme deletion 0.414 0.15 0.23*
Table 6.56. Summary of Stepwise Regression Analysis for variables predicting
spelling ability in Year 5 Albanian children using SPELLING 50 as the dependent
variable. Note: * p<. 05, ** p<. 001.
B Std. Error Beta (Constant) 12.725 11.19 NWS 0.513 0.08 0.61** Comprehension 100 -0.198 0.20 -0.08 RAN Alphanumeric 1.311 2.16 0.08 RAN Colour and Object 4.061 2.75 0.13 Phoneme deletion 0.319 0.17 0.17 Wordchains 0.067 0.04 0.19 Generic Speed -2.799 2.66 -0.10 CPM 0.154 0.13 0.10 OMRT -1.595 1.89 -0.10
Table 6.57. Summary of Full Entry Regression Analysis for variables predicting
spelling ability in Year 5 Albanian children using SPELLING 50 as the dependent
variable [R2=. 78, F(9,45)=18.13**]. Note: * p<. 05, ** p<. 001.

Chapter 6 211
6.3.16 Conclusion on Predictors of Spelling.
Spelling 100 accuracy. Regression analysis reveals that NWS and Phoneme
Deletion are the best predictors of Spelling 100 accuracy for the entire sample as well
as across the year- groups (Table 6.41). The two rapid naming variables are
significant predictors for the entire sample only in the Stepwise regression. RAN
Alphanumeric is the best predictor of spelling ability in Year 1, whereas RAN
Colours and Object is one of the predictors for Year 5 for both regression methods.
CPM is also a significant predictor in Year 5.
To sum up, NWS and Phoneme Deletion are the best predictors of Spelling
100, apart form Year 1. In Year 1, RAN Alphanumeric is the best predictor followed
byNWS.
Spelling 50. Regression analysis shows a very similar pattern to Spelling 100
when Spelling 50 is used as the dependent variable. NWS and Phoneme Deletion are
the best predictors for the entire sample as well as for Years 3 and 5 regardless of the
regression method used. RAN Alphanumeric is the best predictor for Year 1,
followed by NWS. RAN Alphanumeric is also one of the significant predictors for
the entire Albanian sample, but only when Stepwise regression was used.
It was found that NWS was the only significant predictor of Spelling 50 in the
Full Entry regression for Year 5.
Unlike reading related variables (Reading 100, Latency 100, and OMRT), the
two spelling variables show extremely similar patters of predicting variables across
the year-groups.
H. 5.1. Phonological awareness. NWS and Phoneme deletion will be the main
predictors of spelling ability in Year 1.

Chapter 6 212
The surprising result was that RAN Alphanumeric was the best predictor of
both spelling tests. Regression analysis revealed that, after RAN Alphanumeric,
NWS was a significant predictor of spelling ability in Year 1, whereas Phoneme
Deletion did not reveal any significance (See Table 6.41). Therefore, hypothesis
H. 5. I. does not hold.
H. 5.2. Orthographic knowledge. It is expected that Wordchains will become the main
predictor of spelling ability in later years.
Regression analysis shows that the Wordchains variable does not appear to be
significant for Years 3 and 5. Instead, the phonological awareness tasks NWS and
Phoneme Deletion are always the best predictors, regardless of the regression method
or spelling tests. In addition, RAN Colours and Object and CPM are significant
predictors of Spelling 100 in Year 5. As a result, the current evidence for the
regression analysis does not support hypothesis H. 4.2.

Chapter 6 213
6.3.17 Reading and spelling comparisons
In the Albanian study, reading and spelling differences were assessed in
comparing the (I) accuracy scores, (2) error types and their frequency and (3) patterns
of relative contributions of different predicting variables.
6.3.17.1 Reading and Spelling accuracy
The figure below represents the distributions of Reading 100 and Spelling 100
scores for each year group. Both reading and spelling scores are very high, with Year
5 almost reaching ceiling. For every year reading scores are higher than spelling
scores. A small number of outliers are present.
100
80
E 60 O
O 40
20
oý N=
YEAR
- Reading 100
L Spelling 100
Figure 6.7. Boxplots to show the distributions ol'scores for the 100-word reacting
and spelling tests. (The middle line indicates the median and the higher and lower
hinges rcpt-esent the extreme scores)
60 60 60 60 60 60
Year 1 Year 3 Year 5

Chapter 6 214
Reading and spelling scores are significantly correlated. Table 6.58 shows that
the correlation between these variables gets stronger as children get older. Figure 6.8
shows that the strongest correlation is between reading and spelling scores of Year 5.
Reading
Spelling Year 1 Year 3 Year 5
Year 1 0.44** Year 3 0.52** Year 5 0.59**
Table 6.58. Correlation values between Reading and Spelling scores för the 100-word
tests. Note: ** p<. 001.
100
90
80
U, 0 70 U
Q)
a) U) 60
QQ QQQ
0 C3
oQQ
QQul
QQ"0Q ý"F
Q"ýQ Q " "Q 401o "
"QQ, L.
""I" t
""
I"" ""Q
"
Year 5
Year 3
" Year 1
60 70 80 90 100
Reading Scores
Figure 6.8. Reading and spelling scores tor the 100-word tests.
11.0.1. The Albanian orthography is highly transparent hi-directionally,
therefore there should be no discrepancy between children's reading and spelling
scores.

Chanter 6 215
A 2x3 repeated measures ANOVA Reading 100 with Spelling 100 by Year
group was conducted. No interaction was found for type of test (Reading 100 and
Spelling 100) and Year group (Years], 3, and 5). 1lowever, main effects of'l'est F(1,
59)=27.48, p<. 001 and Year P'(2,59)=16.32, I),. 001 were present.
Figure 6.9 indicates that Albanian children perform better in reading than
spelling. T-test analysis shows that there are significant ditlcrences between reading
and spelling tests of Year I and Year 3 children. This difference is not significant in
Year 5 [Year I t(59)=2.74, p<. 0l ; Year 3 t(59)=3.43, /)<. O i; Year 1 t(59)= 1.95, n. s. ].
The hypothesis that there should be no discrepancy between children's reading
and spelling scores in Albanian is not supported for Year I and 3, despite significant
correlations (H. 6.1. ).
100
90
80
70-
" 60 ;; Q Reading 100
50 0 Spelling 100
3 40
30
20
10
0 Year 1 Year 3 Year 5
Year Groups
Figure 6.9. Means and S. E. Mean for Reading 100 and SpellinglOO j or each year
group.
6.3.17.2 Reading and Spelling errors
11.6.2. The frequency of the three en-or types should he the same lür both reading and
Spelling.

Chapter 6 216
Figure 6.10 shows the frequency distributions of errors and error types for
Years 1,3, and 5 for Reading 100 and Spelling 100. Within each year-group and for
the entire Albanian sample, the total frequency of errors is much higher for spelling
than for reading scores.
Albanian children make more nonword errors than any other type of error.
However, nonword error frequency decreases as a function of age for both reading
and spelling, whereas the frequency for the whole word replacements remains almost
unchanged across the years.
From Tables 6.8,6.9, and Figure 6.10, it is evident that the overall error
patterns for reading and spelling are similar: within each year most of the errors are
nonword errors, followed by whole-word replacements, and null responses. Two
aspects of the error distribution are not similar. Firstly, as mentioned at the start of
this section, frequency of each error type is much higher for spelling than for reading.
Secondly, the ratio between the whole-word replacements and nonword errors
decreases much faster as a function of age in reading than in spelling.
To conclude, although the overall pattern of errors is similar between the two
tests for each year, the total error frequency and error type frequency are distinctively
different. Consequently, hypothesis H. 6.2. is not fully supported.

Chapter 6 2I
1200
1000
U 800
Q Null Response a 600 Word Replacement a_
400 [3 Nonword Error
w 200
Otj 1,1
ý
-1 1 -1
1 -1
1-1
-ký AN
yop pool
Figure 6.10. Error types and frequencies made during the reading and spelling tests
for each year group.
6.3.17.3 Reading and Spelling predictor comparisons
1-1.6.3. Due to the similar orthographic complexity for reading and spelling, the
relative contribution of phonological and orthographic skills should show similar
patterns for both reading and spelling development.
In order to match consequent analysis with English and Welsh speaking
children, the comparisons between OMRT and Spelling 50 will be the main interest.
From Table 6.41, NWR is the best predictor For the entire sample and in each
year, regardless of the regression method used for the OMRT-, whereas in Spelling 50,
NWS is the best predicting variable in every regression model, apart lärm Year 1,
where it is the second best predictor. These two predicting variables, which relate to
decoding and encoding skills, provide the only common pattern that occurs in the
regression analysis for OMR I and Spelling 50. The rest of the variables that predict

Chapter 6 218
variability in OMRT do not appear to predict anything in Spelling 50 and vice versa.
For example, Wordchains is the second best predictor only for reading rate for the
entire Albanian sample and for Year 3 children. Phoneme Deletion on the other hand,
is a significant predictor for the entire sample, Year 3 and 5 only in Spelling 50. The
RAN variables are significant predictors for the entire sample and for Year 1 in
Spelling 50; RAN Alphanumeric appears to be a predictor only in Year 5, in the
OMRT regression.
There is more similarity between Reading 100 vs. Spelling 100, and Reading
100 vs. Spelling 50.
To conclude, from the emerging pattern of predictors for OMRT and Spelling
50, hypothesis H. 6.3. is not fully supported.
6.4. Discussion
The data confirm most of the hypotheses set for examination at the start of the chapter.
With regard to the General Hypothesis, the findings confirmed and age effect
for all the tasks: older children performed better than younger ones.
6.4.1. Reading
Older children did better than younger children in reading accuracy and
reading rate. Experience on task, increasing amounts of learning instruction, print
exposure, and cognitive maturation are the logical reasons for this improvement.
With regard to the Reading 100 and reading strategy hypothesis, the findings related
to Year 1 of the pilot study were supported from the main study results: Year 1
children tend to read most of the words form the 100-word list (M=79.88), and they
's ýI?,, -,, -
Chapter 6 219
tend to rely on a slow grapheme phoneme conversion strategy. Long reading
latencies, together with the high proportion of nonword errors, indicate that Year 1
children rely on an alphabetic decoding strategy as demonstrated for reading of other
transparent orthographies by Wimmer and Hummer (1990), Ellis and Hooper (2001),
Spencer and Hanley (2003), and Seymour et al. (2003).
Considering the development of reading strategy as children get older, the
developmental models of Frith (1980) and Ehri (1992), which were proposed for
learning to lead in English, generalise here and suggest that young Albanian children
start at the alphabetic stage and by at least Year 5, reach the final orthographic stage
or use sight word reading. Indeed, there seems to be some evidence for this change
of strategy by children learning to read even in the very transparent orthography of
Albanian.
Firstly, it was found that younger children had longer latencies than older
children in Reading 100. In addition, the effects of log10 frequency and word length
were larger for Year 1 children than Year 3 and Year 5. The effect of word length
was larger than that of log10 frequency [Word length Year 1 R2=. 88; Year 3 R2=. 60;
Year 5 R2=. 60; log10 Frequency Year 1 R2=. 46, Year 3 R2=. 48, Year 5 R2=. 49].
However, because log 10 frequency and word length covary in the Albanian
words these results are difficult to interpret. A log 10 frequency effect suggests a
lexical reading strategy whereas a word length effect suggests a non-lexical reading
strategy. Because of the theoretical implications involved throughout this thesis,
being able to distinguish between these two effects and understanding how these
contribute to reading latencies is crucial. Stepwise regression analysis was carried out
where the order the predicting variables can be controlled. In Year 1 when Log 10
was entered first in the model 46% of reading latencies variability was accounted for.

Chapter 6 220
When word length was entered in the second step a further 45 % of the variability was
explained. When these two variables were entered in the model in the opposite order it
was found that word length alone accounted for 88% of the variability. The
introduction of LoglO frequency added very little to the final model (R2 increases by
only 3%). These results provide evidence that word length and log10 frequency
contribute to reading latencies. However, because most of the variance in the model
was explained by the word length effect it is suggested that the main reading strategy
used by Year 1 Albanian children is non-lexical. Word length continued to explain
most of the variance even for Years 3 and 5, however, its contribution was not as
large as in Year 1, whereas the contribution of log 10 frequency increased to 8 and 10
respectively. This suggests that there is a shift strategy used by older children who
have been exposed to print for a longer period of time. The regression findings for
Year 1, do not necessarily suggest that non- lexical reading is the only strategy
employed by these children (and older children). To argument this would be illogical.
Regularity of the orthography gives children confidence in trying to read new words.
Following this strategy they will develop a `self-teaching' mechanism, which allows
them to enlarge their sight-word reading lexicon (Share, 1995). Thus, the self-
teaching mechanism allows children to store the representation of a word in the
orthographic lexicon and use these representations for fast and successful reading.
The strong word length effect and the used of a non- lexical strategy is not surprising
when the reading test used is taken into account. The word list contained 100 items
many of which had not seen or heard before. Therefore, for low frequency unfamiliar
words the non-lexical strategy seem to be the best option in attempting to read these
items. However, for high frequency words a lexical strategy would be faster.

Chapter 6 221
The use of Stepwise regression analysis, where the order of the predicting
variables can be controlled, helps in distinguishing between the size log10 frequency
effect and word length effect. One way to check that the regression analysis is
producing a clear picture of the reading strategies used is to select test items where
log 10 frequency is varied but word length is kept constant and vice versa. This would
ensure a more direct interpretation of any effect of log 10 frequency and word length
on reading latencies.
Secondly, when the reliance on an alphabetic reading fails, the likely
pronunciation is a nonword. Indeed, the highest proportion of nonword errors was
made by Year 1 children, the least by Year 5 children. When reliance on lexical
access by means of partial visual analysis or partial phonetic cueing fails, the likely
result is a real word. In reverse pattern, Year 1 children made the smallest proportion
of whole-word replacement errors, whereas Year 5 children had the highest
proportion. These findings suggest that younger children rely more heavily on a GP
conversion reading strategy, whereas older children rely more partial visual analysis,
partial phonetic cueing or sight word recognition as suggested by the developmental
models of Frith and Ehri. These findings are also supported by the self-teaching
mechanism suggested by Share (1995), in which phonological recoding allows
children tö store the representation of a word in the orthographic lexicon and use these
representations for fast and successful reading.
Thirdly, if older children rely more heavily on partial visual recognition, then
the discrepancy between real word reading and nonword reading (the "lexicality
effect") should be larger for Year 5 children than Year 3 and Year 1 children. This
was exactly what was found. Although overall, children had better word reading rates

Chapter 6 222
at the OMRT than in NWR across the years, the discrepancy was larger for Year 5
children.
To conclude, word length effects, changes in error types and their proportions,
and discrepancies between rates of real word and nonword reading are consistent with
the hypothesis on reading strategy which suggests that younger children rely more
heavily on grapheme-phoneme conversion reading strategy, whereas older children
rely more partial visual analysis, partial phonetic cueing or sight word recognition
(H. 2.2).
6.4.2 Predictors of reading development
From the above findings on the change of reading strategy, the other
hypotheses set at the start of the chapter on reading predictors should also follow:
Phonologically related skills tasks such as Phoneme deletion and NWR should predict
reading skill in early children only, whereas orthographic awareness tasks should
predict more skilled reading.
Regression analysis was used in order to identify the predictors of Reading
100, Latency 100 and OMRT. For the entire sample, and within each year, Spelling
100 (or Spelling 50), Word Comprehension 100 (or Word Comprehension 50), NWR,
RAN Alphanumeric, RAN Objects and Colours, Phoneme Deletion, Wordchains,
CPM and Generic Speed were independent variables. To get a better picture of the
predicting patterns, two regression methods were used: Stepwise and Full Entry
method. In most of the analyses, both regression methods gave similar results.
Regression analysis for the entire Albanian sample was first carried out.
Overall, phonological skills tasks are the most frequent predictors of reading,
followed by orthographic skills tasks. For Reading 100, NWR and Phoneme

Chapter 6 223
Deletions were the best predictors. RAN Objects and Colours was also a predictor of
reading accuracy in Stepwise regression, whereas in full Entry regression, it was
replaced by Spelling 100. Latency 100 was best predicted by RAN Alphanumeric,
Spelling 100, and CPM. When OMRT was used as the dependent variable, for the
entire Albanian sample, NWR, and Wordchains were the only predictors of reading
rate.
The pattern of predictors varies when each year group is to taken into account.
Reading development models, based on English language research, suggest that in the
early years of literacy children rely on phonological skills; in later years the
contribution of orthographic skill becomes of primary importance. Are these findings
replicated in the current study, where the literacy skills of Albanian children were
examined? They are and they are not. Phonological skills predicted reading ability
of Albanian children across the age groups. The predicting power of orthographic
skills tasks was higher for older children, but this was secondary to the predicting
power of phonological related tasks.
When Reading 100 was used as the dependent variable in the regression
analysis phonological skills related tasks, Phoneme Deletion and NWR were the best
predictors of reading accuracy across the age groups. Orthographic skills hardly
contributed: Wordchains predicted no significant amount of variance. With regards to
reading accuracy, this suggests that phonological awareness tasks are the best
predictors of reading accuracy in young as well as skilled readers. It should be noted
here that ANOVA tests revealed no significant differences between the three age-
groups for the Phoneme Deletion tasks and yet this task was found to be the best
predictor of reading accuracy for every single year. At first this may seem an odd
result. However, the ANOVA finding indicates that in transparent orthographies

Chapter 6 224
phonological skills develop very quickly. Thus Phoneme Deletion may prove an easy
task even for normally developing Year 1 readers. The lack of significant differences
across the years, however, does not suggest that within a year group Phoneme
Deletion cannot contribute to reading accuracy. The Phoneme Deletion task requires
participants to manipulate sound of words they hear. Regression analysis suggests
that this ability is important in all stages of word reading.
When Reading Latencies were used as the dependent variable, the contribution
of phonological skills was most important in Years 1 and 3, but it is weak in Year 5.
The contribution of orthographic skills to reading latencies increases with age. In Year
3 Wordchains is a better predictor of latency than phonological tasks.
An unexpected finding was the high degree to which spelling skill predicted
reading: Spelling 100 was the best predictor in Year 5 and second best in Year 1. The
contribution of spelling in reading skills has been evident in previous studies (Ellis &
Cataldo, 1990). However, when OMRT was used as the dependent variable,
phonological tasks were the best predictors of reading rate across the three age groups.
The importance of orthographic skills was secondary to reading ability skills in Years
3 and 5.
In the current study, with regard to children learning to read in highly
transparent Albanian, phonological skills are the best predictors of reading
development. The contribution of orthographic skills increases as children become
more experienced in reading; however, these remain secondary to the phonological
skills.
The findings on these predicting patterns are similar in nature to that of
Sprenger-Charrolles. Siegel, and Bechennec (1997) who found that during literacy

Chapter 6 225
development even in highly opaque French, the role of the orthographic skills was
secondary to the role of phonological skills, which increased as a function of age.
The nature of the orthography encourages a reliance on alphabetical skills for
successful word decoding even in skilled readers. Alphabetic decoding for new words
is highly successful and this, in turn, makes Albanian children more confident to
attempt words they have never seen before.
6.4.3 Two reading tests: different predictors.
From the above patterns of best predictors it emerges that the Reading 100 test
is quite different from the Latency 100 and OMRT. The very nature of these
variables varies in the sense that Reading 100 relates to the accuracy regardless of
speed; Latency 100 and OMRT have the speed factor in common. Does this mean
that these two reading tests do not measure the same content?
Correlation analysis revealed that OMRT correlated more strongly with
Latency 100 than Reading 100. In order to further examine how these variables
related to each other, PCA with Varimax rotation was performed. Two components
were identified: the first reflected a general ability factor, whereas the second, a
literacy factor. Another interesting finding from the PCA was that the speeded tests,
except Generic Speed, loaded on both components. Hence, it appears that a speed
factor may be a confounding variable. Two Hierarchical regression analyses of
Latency 100 and OMRT were used, where Generic Speed was forced into the
equation. The results showed that, for both Latency 100 and OMRT, Generic Speed
explained a large amount of the variance in the first step. Nevertheless, in the
following step the initial significant predictors still predicted an additional and large
amount of variance. These findings indicate that Latency 100 and especially OMRT

Chapter 6 226
are not pure speed measures: these variables are affected by the real content of the
predictors.
The question set at the start of this section was whether two different reading
tests measured the same abilities. PCA and hierarchical regression showed OMRT is
also affected by the real content of predicting variables such as Wordchains and
Spelling. Therefore, both tests tap the same reading abilities, although OMRT has its
own speed component too. Mann and Wimmer (2002) found that RAN did not
predict the reading accuracy of German speaking children. Instead, it was the only
predictor of reading latency. In highly transparent scripts it is usually the fluency
measure, not accuracy, that discriminates between dyslexics and normal readers
(Wimmer 1993). Due to the transparency of the Albanian orthography and successful
use of phonological decoding, reading accuracy can be very high even for words that
have never been encountered before. This suggests that speeded reading measures
such as reading rate used in the current research can be more appropriate in examining
the literacy development of children learning to read and write in highly transparent
scripts.
However, one final observation that needs to be taken into account is the
number of errors committed during the OMRT. It was predicted that younger
children would make more errors than older children during the OMRT. The opposite
was found. One explanation is that this pattern of errors reflects the use of different
strategies as children get older. By the end of the first school year Albanian children
know that by applying GP conversion rules they are certain that the pronunciations of
words would be correct. But the use of such strategy can prove costly when faced
with time-limited reading tasks. Relying on GP conversion rules takes longer than
when relying on other strategies where representations for whole words or larger

Chapter 6 227
linguistic units than the graphemes are used. As a result even though Year Ichildren
make fewer errors than Year 5 children they also read fewer words than Year 5
children. Thus the number of words read correctly within one minute fails to properly
distinguish between a slow accurate strategy and a fast strategy with more errors.
This flaw in the design of time-limited reading tests makes the interpretations of the
results more difficult. Therefore, the use of other measures such as reading latencies
for single items or total reading time for all items would be more appropriate for
literacy research in highly transparent orthographies.
6.4.4 Conclusions on reading development
The present findings suggest that most of the hypotheses on reading
development are confirmed. Young learners of Albanian use an alphabetic decoding
strategy in reading, whereas older children use larger orthographic units and partial
visual information on word recognition. This is largely supported by the predicting
patterns of reading latencies and reading rates: although phonologically related tasks
are the best predictors of reading across the years, the contribution of orthographic
knowledge and rapid naming increase as children get older.
6.4.5 Spelling
As predicted, older children performed better at the spelling than did younger
children. However, there was no significant difference between the spelling scores of
Year 3 and Year 5 children, whatever the scoring scheme in spelling. With respect to
the spelling strategy, error types and their proportions differed across the years. The
overall pattern revealed that as children get older, the proportion of whole word
replacements increases, whereas the number of nonword errors decreases.
A high proportion of nonword errors indicate a reliance on PG conversion
strategy when spelling. A proportion of whole word replacements errors indicate a

Chapter 6 228
reliance on larger orthographic representations from the memory. In the current study,
the spelling errors suggest that younger children have a less developed orthographic
lexicon than older children. Nevertheless, the error patterns for Years 3 and 5, are not
different enough from those in Year 1 to provide convincing evidence that older
children who are learning to read and spell in a bi-directionally transparent
orthography rely mainly on larger units when spelling.
Lexicality effects were evident in each year. Overall, all children could spell
more real words than nonwords, with the ratio between spelling of real words and
nonwords staying more or less the same across all three year groups. Most Albanian
children use the alphabetic encoding strategy when spelling words or nonwords. As
the PG conversions are highly predictable they are confident in spelling even words
they have never seen before. From the error analysis and the comparisons of accuracy
scores on words and nonwords it can be said that younger children heavily rely on an
alphabetic decoding strategy. Older children, who have been exposed to literacy
activities for a longer period, may make use of larger orthographic units from memory;
however, they too rely heavily on an alphabetic encoding strategy when spelling.
Lexicality effects also support the dual-route theory of spelling (Barry, 1994). In
terms of the developmental models of Frith (1985) and Ehri (1986) it is clear that the
results of Year 1 children are in accordance with the initial alphabetic/phonological
stages. Exposure to print and experience on task allows children to use phonological
decoding/encoding to build their orthographic lexicon (Share, 1995).
6.4.6 Predictors of spelling ability
The pattern of predictors across the years was similar for both spelling tests.
This is not surprising as the score for Spelling 50 was derived from Spelling 100. For
the entire Albanian sample, NWS, RAN Alphanumeric and Phoneme Deletion were
Chapter 6
the best predictors in Stepwise regression. RAN Objects and Colours was the last
variable to predict a significant amount of variation in Spelling 100.
Developmental theories of spelling (Ehri, 1986; Henderson, 1985; Gentry,
1982) maintain that orthographic knowledge begins to contribute to children's
spelling when they have accumulated a considerable number of words that can be
229
recognised by sight. Treiman's (1993) observations of first grade spellings indicated
that there is plentiful evidence of orthographic knowledge in children's daily writing
work. She pursued this finding experimentally by administering an orthographic
constraints test consisting of 16 pairs of pronounceable nonwords. For each pair, one
of the nonwords conformed to a regular pattern; the other did not. She found that 1St
and 2°d grades chose the conforming item significantly more than 50% of the time.
Although the Albanian orthography is different from that of English, orthographic
knowledge still plays an important role in spelling of words throughout the literacy
development.
Year 1 analysis revealed that RAN Alphanumeric was the best predictor
followed by NWS. This was an unexpected finding. In contrast to the literacy
development research that has established a link between rapid naming and reading,
where rapid naming is thought to be an indicator of phonological processing skill
(Wagner & Torgesen, 1987) or automaticity skills (Bowers & Wolf, 1992), there is no
reason to believe that rapid naming should be related to early spelling.
One possible explanation is that the RAN task is related to short-term verbal
memory in the initial stages of spelling acquisition in Albanian. Whilst spelling new
words, novice spellers may continuously recall individual graphemes of a word until
the spelling of the word is complete. A difficulty in continuously naming
phonological information may discriminate between good and poor readers. Spring

Chapter 6 230
and Capps (1974) found that poor and good readers differed on continuous-list digit
naming and suggested that these differences were associated with dysfunctional
rehearsal and memory processes.
In Year 3, the contribution of RAN Alphanumeric disappears. Instead NWS
and Phoneme Deletion are the only predictors. They continue to be the best predictors
in Year 5. In addition, RAN Objects and Colours and CPM are predictors only for the
Spelling 100 task. Correlation coefficients in Years 3 and 5 show that spelling tasks
are more strongly related to phonological than orthographic measures.
A longitudinal study would be more appropriate to answer these questions as
cohort differences may be responsible for such findings. The lack of predicting power
of Wordchains is another issue that deserves attention. The orthographic task does
not predict spelling in any of the year groups.
To conclude, these data corroborates the existence of phonological skills in the
final developmental stages of literacy.
6.4.7 Reading and Spelling comparisons.
Do children who receive formal teaching instruction in a bi-directionally
transparent orthography read and spell at the same level from the beginning of literacy
development?
Direct reading and spelling comparisons were made between the accuracy
scores of 100-item reading and spelling tests. Analysis of variance (2x3) revealed a
main effect for age and a main effect for the type of test. Overall, reading scores were
higher than the spelling scores. Year 1 and 3 children read significantly more than
they could spell, whereas in Year 5. there was no difference. Therefore, only by the
age of 10, reading and spelling skills in Albanian children are at the same level.

Chapter 6 231
These findings failed to replicate the pilot's study results, where reading and spelling
scores within each year were not statistically different. Sample size differences may
be responsible for these different findings. The pilot study sample consisted of only
20 participants per year group compared to 60 in the main study. A second reason
that might explain these findings refers to the participant selection procedure. In the
pilot study only middle achieving pupils were selected- restriction of range can haw
serious consequences on accuracy scores as well as on exploratory analysis such as
regression analysis-whereas in the main study whole classes of children were
selected. Hence, the findings of the main study may be more valid than those of the
pilot study.
But if PG and GP conversions are perfect, why should younger children fail
to reach equal scores in both tests? Could this indicate that young children read and
write differently? Literacy research has suggested contrasting views. Bradley and
Bryant (1979,1985) view these skills as separate. They found that the same children
could read certain words they could not spell and vice versa. This led them to suggest
that different mechanisms are responsible for reading and spelling, and that the
strategies employed for each skill are different. In contrast to this, Gough, Juel and
Griffith (1992) assessed the reading and spelling ability of 20 children. They found
that these children showed inconsistencies in successive reading and spelling tasks.
This led them to suggest that the beginning reader read and spelled in the same way.
Such assumptions in languages like English may be due to the nature of the
orthography of the language. The case of the Albanian orthography is ideal for
further examining this issue because the asymmetries in performance cannot be due to
asymmetries in PG/GP correspondences. In the current study, Year 1 and 3 children
found reading easier than spelling: in Year 5 reading and spelling scores were

Chapter 6 232
relatively equal. Cossu, et al. (1995) examined reading and writing abilities of first
and second grade Italian children. They reported that in the highly transparent
orthography of Italian reading was easier than spelling. These findings do not
necessarily mean that in early literacy development these skills are run by
fundamentally two different mechanisms. Firstly, error data shows that for both
reading and spelling, nonword errors were the most common type of errors, whereas
the proportions of whole word replacement errors did not differ considerably across
the tasks (see Figure 6.10). In addition, the rate of nonword errors drops
proportionally in both tasks. This suggests that for both reading and spelling, similar
strategies are used or even that the same memory representations are responsible for
both reading and spelling.
Secondly, the correlation between reading and spelling increased across years.
In Year 1 correlation coefficient was . 48, in Year 3 was . 50, and in Year 5 was . 56.
All these correlations were highly significant, indicating that reading and spelling may
be interdependent rather than separate.
Nevertheless, two findings were different. The first finding relates to the ratio
of the reading rates between OMRT and NWR, and between Spelling 50 and NWS.
The differences between the reading tasks were more distinct than the differences
between the spelling tasks.
The second finding relates to the pattern of predictors. Overall, the patterns
had similarities in that phonological decoding was the best predictor in most years for
both reading and spelling. In reading, however, Wordchains and RAN Alphanumeric
were best predictors in Years 3 and 5. In spelling, RAN Alphanumeric was the best
predictor in Year 1. It could be that there are major cohort differentes, but this is
Chapter 6 233
unlikely as performance for the rest of the tests fits the general pattern on various
cognitive measures.
As mentioned earlier, RAN Alphanumeric being the best predictor of spelling
in Year 1 was not expected. If only Years 3 and 5 are examined, it emerges that
phonological skills tasks are the best predictors of reading and spelling variance and
that the orthographic skills are secondary, but in spelling the later skills are
developing at a slower rate than in reading. With respect to the phonological skills,
this is in line with the findings from Ellis and Cataldo (1990) and Cataldo and Ellis
(1988) that explicit phonological awareness predicted spelling in the first three years,
increasing over time. Furthermore, Sprenger-Charrolles et al. (1997), 'in a longitudinal
study of literacy acquisition in French, also found that in the early stages of learning,
phonological mediation was dominant and this contributed to the establishment of the
orthographic lexicon. More importantly, they found that "the orthographic procedure
develops later in spelling than in reading" (p. 355).
There are other reasons as to why reading and spelling scores are not similar.
Firstly, Albanian children read and spelled many words they had never seen before.
Reading a word can be completed in milliseconds; spelling takes longer. If a word is
new and long, the cognitive cost will be larger in spelling than in reading. If the
underlying representations for a word are incomplete, due to the variable short
memory demand or making use of context, one may be more likely to be successful at
reading than at spelling. The current study did not assess the working memory of the
participants: further research would be useful to answer this question.
Secondly, although reading and spelling may be similar, they require different
motor skills. In young learners the motor skills for language may mature earlier than
the fine motor skills required for spelling and hand movement.

Chapter 6 234
Thirdly, with regard to younger children reading and spelling differences may
depend on how long children spend learning to read versus learning to spell.
According to the Albanian curriculum teachers are supposed to spend an equal
number or hours for teaching reading and spelling. But human beings are constantly
exposed to written stimuli, which we process consciously or unconsciously, but we
rarely write down everything we see or hear, unless we have to. Therefore, due to the
experience on task, even though reading and spelling share the same mental
representations, reading will automatically be easier than spelling.
6.8.8 Conclusions
Older children perform better than younger children in most tasks including
reading and spelling. With respect to reading, young readers rely more on an
alphabetic decoding strategy. This in turn promotes the development of larger units in
the mental lexicon. Older children use larger phonemic units, and their reading is a
more-visually oriented strategy. In spelling, a change from smaller to larger
processing units is also evident, but this change is slower than in reading.
Phonological skills predict reading throughout the development. Orthographic skills
begin to contribute once a sight word vocabulary has been established.
In spelling, the predicting pattern for early readers was unusual: rapid naming
and NWS were the best predictors. In later years phonological awareness tasks were
the best predictors.

PAGE MISSING
IN ORIGINAL

Chapter 7 236
Chapter 7: Cross-language comparisons
7.1. Introduction
Albanian, English and Welsh children's reading and spelling abilities were
examined in detail in the three previous chapters. The present chapter attempts to
capture the effect of orthographic transparency on the development of reading and
spelling skills across the three languages.
Cross-language comparisons for reading and spelling ability are presented,
where the following hypotheses were examined.
H. 7.1. Reading Hypotheses
H. 7.1.1. Young children learning to read a transparent orthography such as
Albanian and Welsh should perform better in the OMRT test than English children
who are learning to read a deep orthography.
H. 7.1.2. Skilled English learners who have acquired orthographic knowledge
of their language should have similar reading rates to Albanian and Welsh skilled
readers.
H. 7.1.3. Young Albanian and Welsh children should perform better in the
NWR test than the English children.
H. 7.1.4. Older English readers, who with experience have acquired the GP
conversion rules, will have similar nonword reading rates as their Albanian and Welsh
counterparts.

Chapter 7
H. 7.2. Spelling Hypotheses
237
H. 7.2.1. In the early stages of literacy acquisition, the transparency of the
orthography will have an effect on spelling accuracy: Albanian children should have
higher spelling scores, closely followed by the Welsh children, whereas English
children should show the lowest accuracy scores.
H. 7.2.2. Young Albanian children should have higher NWS scores than Welsh
and English children.
H. 7.2.3. For both spelling and nonword spelling, the differences between the
language groups will be smaller for older children.
H. 7.3. Sub-skills Hypotheses
H. 7.3.1. For the reading rate, Albanian and Welsh will show similar
predicting patterns, whereas the English pattern will be different.
H. 7.3.2. For Spelling 50, none of the predicting patterns are expected to be
similar because of the different orthographic complexities for each language. With
regard to the degree of feed backward transparency (phoneme to grapheme), the
Albanian orthography is the most transparent orthography; the English orthography is
the least transparent, with Welsh in between Albanian and English.
H. 7.3.3. The nature of the written orthography will have an effect on the
awareness of spoken language: young Albanian and Welsh children should perform
better at phonological tasks (Phoneme Deletion, NWR, NWS) than English children.
H. 7.3.4. RAN Alphanumeric, but not RAN Objects and Colours, will be
associated with measures of reading ability.

Chapter 7 238
7.2. Participants r
A full description of participant selection procedures for the Albanian children
was presented in Chapter 6.
The data for the English and Welsh speaking children was taken from WDP
database (2003). In total 102 Year 2,94 Year 4 and 106 Year 6 English-speaking
children participated in the study, but not all the children completed all the tests. In
total 118 Year 2,92 Year 4 and 69 Year 6 Welsh-speaking children were selected, but
not all the children completed all the tests.
Table 7.1 shows the average age each age-group across languages. None of the
age-group comparisons were significantly different (p>. 05).
Albanian English Welsh
Age Mean age SD Mean age SD Mean age SD
Group (months) (months) (months)
1 86.77 4.34 87.56 3.81 87.62 3.98
2 112.10 5.16 110.32 3.16 110.86 3.43
3 135.65 4.80 134.58 4.93 136.46 4.00
Table 7.1. Mean age for each age-group and St. deviation across languages.
7.3. Materials
All the materials used here are described in Chapter 4, Section 4.3.
7.4. Results
In order to make sure that the basic, cognitive abilities are equivalent across the
three languages, two 3x3 Univariate ANOVAs examining the CPM and Generic
Speed scores were carried out. Significant differences were found between the
children for both tests. For the CPM test, there were significant main effects for
Language and Age [Language, F(2,684)=78.36, p<. 001; Age, F(2,684)=189.60,

Chapter 7 239
p<. 001]. The interaction between Age and Language was also significant
F(4,684)=3.57, p<. Ol. From Figure 7.1, it is clear that Albanian children performed
less well in the CPM task. Post-hoc analysis revealed that the differences between the
Albanian and English/Welsh children for each year group were significant (p<. 001).
Figure 7.2 shows that 8- and 10- year old Albanian children performed much
better at the Generic Speed task. Significant main effects for Language and Age were
found [Language, F( 2,716)=83.99, p<. 001; Age, F(2,716)=320.77, p<. 00I ]. The
interaction between Age and Language was also significant F( 4,684)=11.77, p<. 001.
Post-hoc analysis revealed that differences between the language groups were
significant (p<. 001).
CPM
40 35 I fi
30 25 t Albanian 20 English 15 Welsh 10 5 0
123
Age Group
Figure 7.1. Means and St. Deviation of the CPM for the three year groups in
Albanian, English and Welsh.

Chapter 7 240
Generic Speed
1.2 1
0.81- Albanian
0.6 English
0.4 Welsh
0.2
0 123
Age Group
Figure 7.2. Means and St. Deviation of the Generic Speed for the three year groups in
Albanian, English and Welsh.
The above unexpected differences between the Albanian children and British
children were statistically taken into account by using ANCOVAs, where CPM and
Generic Speed were used as covariates. Adjusted means and standard deviations are
presented in Table 7.2.
The rest of the results section is hypothesis driven, therefore, a hypothesis is
presented first, followed by the relevant analysis.

1.4 , it
N
tlý
oý
Ü
b Q N N en 10
N 00
-+ en en M
*: a 0
O Cý nO ON N , ý^L
N v,
00 .
O O M M te+l N N
Vii
Q N N -t
10 . ý
OM ý
N Ö
M M W O O Oý . . O l h
N º, ^ yy
°p M
No 1-
in +6, ON r.
00 t+1 ýp " pp O
W, O M
M M N
00
0
ý+
0
en N 00
N N M L v
ý O O oö O Ö
N fA N
aQ 03
QNi h Ni v
Ö N, v'i
N . O O M N ^ N
H N
O 00 N N 00 oM N N
C
O
O 00 ýO O Ö h Cl
Ago ~ p p M M N N
'V'
Q N T Q
^ ýO en N 0 .
r+
N
td
x O O 00 . -. ý6 O O h N
U
C4 w N NN en r- O ? 0 p O N
- M
"' N y N
N N 00 00 M N N b
O O C. ýD O O v1 N
;2 < (31, 4 O Ö
vii O O [h
M 00 .. . M .. + N 10 N M
en
O+ N
O N
N N
b M 00
^' M M N
l- M
10 OR
V. ý �
Q O O O; --4 1-Z O Ö %n C. 4)
3 .A .r
. o
h ýO v1
N Oý
O O
vY In
G) Cy"
C O p 00 N
N O N N
(4�+ 0
Q N N O N
M [-
O 0 en M
M N
ON N
y 0
Ö Ö 6 = t-: Ö O -n N . -
C w N OR
N ~ ON
" 0.0 0 00 rC)
wi 06 C; oý 00
Q M N N N
eý N ýt
N N 00
"d
y O O O+ , . 06 Ö Ö ý6
en Wl ý, 4 M ^' M Cý O M n y
it
p p e; V
M M 'ý O N 00 N b
00
r- : 5. '
o 7
Ö Ö
Cý y G] C
ßä ö > 0 z z E 2 ý o ä o cn L 3
U b 9
to r. aý
O z
b
RS U
r. +
.. r r. +
il U
b
äý
ä öý
a) U
r+ r"
3ý AÜ 0
0 0 U N
44
a2 O ö
"C3

Chapter 7
7.3.1. Reading hypothesis
7.3.1.1 OMR T
242
H. 7.1.1. Young children learning to read a transparent orthography such as
Albanian and Welsh should perform better in the OMRT test than English children
who are learning to read a deep orthography.
Reading rates across the languages were compared. ANCOVA revealed a
main effect for age-group but not for Language (Age-Group: F(2,402)=30.12,
p<. 001). Figure 7.3 shows that within each age-group, the mean reading rates are not
very different. The only significant difference found was between Albanian and
Welsh children in Age-Group 3.
These findings do not support hypothesis H. 7.1.1. No significant differences
were found between the reading rates of young Albanian/Welsh children and English
children.
H. 7.1.2. Skilled English learners should have similar reading rates with
Albanian and Welsh skilled readers.
This hypothesis is confirmed: in the last age-group, there were no differences
between English children and Albanian/Welsh children.
Figure 7.3 shows that for the older age-group Welsh children have the lower
reading rates. Post hoc comparisons, however, revealed significant difference
between Albanian and Welsh children. This was not expected.

Chapter 7
1.2
0.8 DAlbanian
0.6 m English
d 0.4 o Welsh
0.2
0 2.3.
Age Groups
243
Figure 7.3. OMRT means and SEM l or each age-group acres languages.
An additional observation made within the OMR"I' reading tasks was the
number of errors made by children of different language and age-groups.
The youngest Albanian group made fewer errors than the older Albanian group. The
opposite pattern was found for the Welsh and especially the English age-groups where,
as expected, younger children made more errors than older children. A two-way
ANOVA (3x3) revealed a significant main interaction between Language and Age-
group [F(2,40 1 )=4.83, p<. O I ]. Significant main effects were also found fur Age-
group [F(2,401)=259.88, p<. 00 I] and Language [F(4,401)=1 1.83, p<. 00I ]. Post-hoc
Bonferroni differences between each o! the groups are indicated in the table below.
Albanian English Welsh
M SD M SD M SD Age- 2.77 J 2.06 10.21 7.62 3.58 ° 3.26 group 1 (n=52) (n=34) (n=45) Age- 6.78 a 5.31 7.16 7.47 3.39 n 5.96 group 2 (n=59) (n=19) (n-46) Age- 5.80' 4.06 4.17 a 3.57 2.40 e 3 group 3 (n=55) (T1 52) (n- 48)
Fable 7.3. Means and St. Deviations of OMR"I' F, rrors for each language and
Age-group. Notc: " 1', For comparisons within each year group, means with different
letters were statistically significantly diFfcrent.

Chanter 7
7.3.1.2 NWR
244
11.7.1.3. Young Albanian and Welsh children should pcrfbrm better in the
NWR test than the English children.
H. 7.1.4. Older English readers will have similar nonword reading rates as their
Albanian and Welsh counterparts.
Figure 7.4 depicts means and standard errors for each age-group across
languages. This graph shows that Welsh children have higher nonword reading rates
than Albanian and English children. ANCOVA for NWR did not find an interaction;
however, main effects for Age and Language were present [Age, /E'(2,4O8)==23.39,
p<. 001; Language, F( 2,408)=20.43, p--. 001]. Overall, older children were
significantly better than younger children. Most importantly, post-hoc tests showed
that hypothesis H. 7.1.4. was not supported by the current findings, whereas
hypothesis H. 7.1.3. was partly supported: although there were no significant
differences between Albanian and English children, Welsh children performed
significantly better at this task than their English and Albanian counterparts regardless
of age-group.
-tea 0.8 3 0.7- C 0.6 ö0 0 5 QAlbanian
L- cn .
0.4 o English Mm 0.3
f f
Q Welsh ZW 0 2
. c 0.1 m W ý -. - 0 -I
1.2.3.
Age Groups
Figure 7.4. NWR means and SEM fier each age-group across languages.

Chapter 7
7.3.2 Spelling hypothesis
7.3.2.1 Spelling 50
24 5
ii. 7.2.1. In the early stages of literacy acquisition, the transparency of the
orthography will have an effect on spelling accuracy: Albanian children should have
higher spelling scores, closely followed by the Welsh children, whereas English
children should show the lowest accuracy scores.
Analysis of covariance for Spelling 50 found an interaction between Age and
Language, as well as main effects for each variable [Interaction /'(4,661)=23.97,
p<. 001. Main effects: Age, E(2,66 I )=34.12, p<. 001; Language, h(2,661)=133.20,
p<. 001]. Overall, older children spelt significantly more words than younger children.
Figure 7.5 shows that Albanian children have significantly higher spelling accuracy
scores than Welsh and English children regardless of the age-group. Welsh children
have better scores than the English children--these differences are significant only 1ör
Year 2 and 4 children. Overall, these findings are in line with hypothesis 11.7?. 1
50 45
cn 40 '0 35
30 0Albanian
ö 25 II English 0 20 D Welsh
E 15 z 10
5 0
2.3.
Age groups
Figure 7.5. Spelling 50 means and SIAM fier each age-group across languages.
Chapter 7
7.3.2.2 NWS
246
H. 7.2.2. Young Albanian children should have higher NWS scores than Welsh
and English children.
Analysis of covariance for NWS found a significant interaction between Age
and Language, as well as main effects for each variable [Interaction F(4,658)=27.74,
p<. 001. Main effects: Age, F(2,658)=19.60, p<. 001; Language, F(2,658)=70.83,
p<. 001]. Overall, older children were significantly better than younger children.
Figure 7.6 shows that Age-Group 1 and 2 Albanian children have the highest nonword
spelling accuracy scores. No significant differences were found for the last age-group.
These findings fully support hypothesis H. 7.2.2.
H. 7.2.3. For both spelling and nonword spelling the differences between the
language groups will be smaller for older children.
From Figures 9.5 and 9.6 it is clear that the differences between the Albanian
children and the English and Welsh children decrease for older children. This is
evident for both real word and especially for nonword spelling. In Spelling 50,
although the differences between languages become smaller, Albanian children
continue to spell more words than the English children of the same age. In NWS, the
Welsh children reach the same level as the Albanian children by the age of eight. By
the age of 10 there are no significant differences among the three language- groups.
Hence, hypothesis H. 7.2.3. is fully corroborated by these findings.

Chapter 7 247
50 45
L
3 40 o 35
30 o Albanian L- v0 25 m English
20 OWelsh Zä 15
f=0 10
5 0
2.3.
Age groups
Figure 7.6. NWS means and SIAM för each age-tToup across languages.
7.3.3 Sub-skills hypotheses
H. 7.3.3. The nature of the written orthography will have an effect on the
awareness of spoken language: young Albanian and Welsh children should peril rm
better at phonological tasks (Phoneme Deletion, NWR, NWS) than English children.
7.3.3.1 Phoneme Deletion
Analysis of covariance for Phoneme Deletion Ibund an interaction between
Age and Language, as well as main effects for each variable [Interaction
P(4,400)=6.66, p<. 001. Main effects: Age, F(2,400)=5.08, p<. ()1; Language,
F(2,400)=7.60, p<. 00I]. Overall, older children were significantly better at deleting
phonemes than younger children. Figure 7.7 shows that Year I Albanian children
have higher phoneme deletion scores than Welsh and English children. Welsh
children have better scores than the English children. In Age-( iroups 2 and 3 there
are no significant differences between the groups.

Chapter 7 248
30
25
Ün 20 0Albanian ýº OC
4) ä 15 M English U) OWelsh
z 10 C
5 L
0 -- 1. 2.3.
Age groups
Figure 7.7. Phoneme Deletion means and SEM for each age-group across languages.
7.3.3.2 RAN Alphanumeric
Age and Language main effects were found when RAN Alphanumeric was
used as the dependent variable in the analysis ofcovariance [Age, /'(2,41)0)=57.16,
p<. 001; Language, F(2,400)=5.29, p<. 01 ]. An interaction between these variables
was also significant [F(4,400)=3.84, p<. 0l ]. As expected, oller children could nanmc
alphanumeric stimuli faster than younger children. Significant diflcrences between
languages were found within each age-group. In Age-Group 1, English children were
faster than Albanian children; in Age-Group 2 there was a difference between English
and Welsh children; and in Age-Group 3 the English children were slower than the
Welsh children (see Figure 7.8). Differences within each age-group were not expected.

Chapter 7 249
.5
1I:.
0.5
0 2.
Age groups
Figure 7.8. RAN Alphanumeric means and SEM for each age-group across
languages.
7.3.3.3 RAN Objects and Colours
When RAN Objects and Colours was used as the dependent variable in the
analysis of covariance only a main effect of Age was found. [Age, F(2,405)=46.93,
p<. 001]. As expected, older children could name pictures and colours stimuli faster
than younger children (see Figure 7.9). A main effect for Language and a first order
interaction for Language and Age were absent.

Chanter 7 250
1.4
U) 1.2 Ei
'a 1 ,0 o0Q Albanian
d 0.8
.0® English
Z 0.6 Q Welsh Z 0.4
02
0 2.3.
Age groups
Figure 7.9. RAN Objects and Colours means and SEM 1or each age-group across
languages.
7.3.3.4 Wordchains
With regard to Wordchains, analysis of covariance bound an interaction
between Age and Language, as well as main effects lbr each variable [Interaction
F(4,672)=9.53, p<. 001. Main effects: Age, E(2,672)=51.37, p<. O I Language,
F(2,672)=136.92, p<. 001 ]. Overall, older children were significantly better at
splitting Wordchains correctly than younger children. Figure 7.10 shows that within
each age-group, English children have the highest scores. Albanian and Welsh
children's scores are not different for the younger children. Nevertheless, the mean
differences between these two languages in Age-Groups 2 and 3 are significant-
Welsh children performed better than Albanian children.

Chapter 7 251
100 ß 0 90
80 Q t 00
c ö=
70- 60 50
QAlbanian
v English v 40 Q Welsh
E
1
Z HH 9 t
± 1 2.3.
Age groups
Figure 7.10. Wordchains means and SEM for each age-group across languages.
7.3.4 Word Comprehension
Age and Language main effects were found when Word Compression was
used as the dependent variable in the analysis of covariance [Age, /E(2,398)=32.67,
p<. 001; Language, F(2,398)=72.30, p<. 00I ]. An interaction between these variables
was absent. As expected, older children knew more word meanings than younger
children. What is surprising is that for the first two age-groups (see Figure 7.11), is
that Albanian children knew more word meanings than English and Welsh children.
Word compression differences were not significant for the older Albanian and English
children. Welsh children had the lowest scores, even in Year 6.

Chapter 7 252
50 ö 45 = 40
35
Q 4) 30 Q Albanian V0
25 M English
m 20 Q Welsh 15
C 10 5
0 2.3.
Age groups
Figure 7.11. Word comprehension means and SIN For each age-group across
languages.
7.3.5 Second language reading and spelling
The Welsh children who took part in this study came from farmfies and
schools where Welsh is the predominant language. I lowever, the exposure to Fnglish
cannot be fully avoided, especially for older children. The purpose of this analysis
was to compare the English reading and spelling skills of Wclsh bilingual children
with those of the monolingual English children. The mean reading rate of English
words read by the Year 4 Welsh children was . 70 words/second (SI)=. 25) compared
with . 70 words/sec (SI)-=. 28) for the English children; and .
85 words/second (SI)=:. 25)
for Year 6 Welsh children, compared with . 88 words/sec (S1). 30) for the Fnglish
children. These results were not statistically different (1<1). In spelling, the mean
number of English words spelled correctly by Year 4 Welsh children was 32.60
(SJ . 91), compared with 27.47 words (SL 1 1.52) for the Fnglish children. In Ycar
6 the f; nglish word spelling scores of Welsh and Fnglish children were 33.24 words
Chapter 7 253
(SD=8.47) and 34.88words (SD=9.79) respectively. The only difference was in the
spelling tasks in Year 4 [t(l28)=-2.54, p<. 05)].
7.3.6 Reading and Spelling predictors
The final part of the results section compares the predicting pattern of reading
and spelling in Albanian, English and Welsh. First correlation analysis is presented;
this is followed by regression analysis.
7.3.6.1 Correlation analysis
The line graphs in Figure 7.12 represent the correlation between OMRT and
the rest of the tasks administered in this research for each language and age-group.
Overall, for the Albanian and Welsh children NWR, RAN Alphanumeric and
Wordchains are the variables that correlate most highly with OMRT.
In English, Spelling 50 is the variable that correlates most highly with OMRT.
In addition there is an increase of correlation for Wordchains as a function of aW.
Figure 7.13 represents the correlation coefficients between Spelling 50 and the
rest of the tasks administered for each language and age-group. Whilst in Albanian
and Welsh, Spelling 50 correlates most highly with NWS, for the first two English
age-groups, it is OMRT that has the highest correlation with Spelling 50.
Furthermore, the correlation for Wordchains for the English children increases as a
function of age.

N
rý
of a
'v
0) C E
c rn
Z N C C N ýp O
Z äý a ý? N Q Q
N C
E
0 E u Ü
' cr c r ö c 2 ö
<n 2 U Q 0 d 0
r ce) o
N
X
Cl)
a
I
N L
W
Cl)
t ö)
NC Co
O1 C
Q
ÖOOÖQO
s; uai3!. 4903 UO12 eJJO3
O
11.1
U
0
cC
0 U
cr-. 0
fs.
bA
L z x
m ö
m
c
N
ýý
Z U0
ö ) 0
ul C O
wa C
] ýp
O G/ E
- VJ .5 A L
U ~ mý ý ý U
3: o z U<Ü ä C5
M N
N
t i CF)
L
C) C
W
O i
N L rn N
Q CD
C f6 C f9
m
ýt N
Q
N
00 CD N O N V O O OO 9 O
sTuaio! 4a03 uoileiauuoo
O kr)
bA
C)
cf
v_ U
rE
v
O U O
Gl.
v
Mi
i
Chapter 7
7.3.6.2 Regression analysis
255
H. 7.3.1. For the reading rate Albanian and Welsh will show similar predicting
patterns.
In Table 7.4, a summary of all significant predictors identified in Stepwise
regression for each language is presented. The pattern of significant predictors for
Albanian and Welsh is extremely similar. In Age-Group 1 NWR is the best predictor
for both languages. The second best predictor is different (Spelling 50 for Albanian
and RAN Alphanumeric for Welsh children). The predicting pattern for the rest of the
age-groups is almost identical. NWR and Wordchains are best predictors of Age-
Group 2, whereas NWR and RAN Alphanumeric are the best predictors of Age-
Groups 3. The only difference is that in Age-Group 2 CPM is a significant predictor
in Albanian. Overall the predicting patterns are similar, in that phonological skills are
the best predictors of reading; therefore, hypothesis H. 7.3.1 is supported.
H. 7.3.2. For Spelling 50, none of the predicting patters are expected to be
highly similar due to the different orthographic complexities for each language.
With regard to spelling the Albanian orthography is most transparent;
followed by Welsh which has very few irregularities; and finally by English, which is
considered to be one of the most deep orthographies. The predicting patterns
presented in Table 7.4 show little resemblance across the languages. The Albanian
and Welsh patterns show some similarities, but not as clearly as the similarities
observed in OMRT predicting patterns. One similarity is that NWS seem to be an
important predictor for both languages. However, in Year 4, NWS does not predict
spelling ability of Welsh children. Another similarity is that the same variables

Chapter 7
predict spelling in Albanian and English in Age-Group 2. The lack of striking
similarities for Spelling 50 support hypothesis H. 7.3.2.
256
H. 7.3.4. RAN Alphanumeric but not RAN Objects and Colours will be
associated with measures reading ability.
Regression analysis results presented on Table 7.4 are also supportive of
hypothesis H. 7.3.4. Only RAN Alphanumeric predicted reading ability in Albanian
and Welsh children. Additionally, correlations between RAN Alphanumeric and
OMRT were much stronger than correlations between RAN Objects and Colours and
OMRT.

Chapter 7 257
Age-Group 1 Age-Group 2 Age-Group 3 OMRT Albanian NWR NWR NWR
Spelling 50 Wordchains RAN CPM Alphanumeric
R2=. 67 R2=. 61 R2=. 66
English Spelling 50 Spelling 50 Wordchains Spelling 50
R2=. 68 R2=. 71 R2=. 56 Welsh NWR NWR NWR
RAN Wordchains RAN Alphanumeric Alphanumeric R2=. 77 R2=. 89 R2=. 46
Spelling 50 Albanian RAN NWS NWS
Alphanumeric Phoneme Del. Phoneme Del. NWS R2=. 58 R2=. 42 R2=. 74
English OMRT NWS Wordchains Phoneme Del. Phoneme Del. NWS
RAN C. & O. R2=. 81 R2=. 82 R2=. 71
Welsh NWS Wordchains NWS Phoneme Del. Generic Speed CPM
R2=. 75 R2=. 81 R2=. 77
Table 7.4. Predicting patterns of OMRT and Spelling 50 for each language and age-
group
7.5. Discussion
This chapter compared reading, spelling and various cognitive abilities of
Albanian, English and Welsh children at three different age-groups (6- to 7-year olds,
8- to 9-year olds and 10- toI 1-year olds). The education system in England and Wales
is similar as all children start formal education at the age of 5. In Albania, children
start school at the age of 6 with little or no preschool literacy training. As a result, the

Chapter 7 258
Albanian sample although matched for chronological age, had received less formal
literacy instruction than the English and Welsh children.
7.5.1 Reading and spelling across languages
The first issue addressed was the effect of orthographic depth in reading and
spelling development in alphabetic scripts. Reading and spelling abilities were
examined using frequency matched reading lists with 50-items of decreasing log10
frequency. Analysis of variance revealed that Albanian children had lower CPM
scores but higher Generic Speed scores. Hence, for the rest of the cross-language
comparisons CPM and Generic Speed were used as covariates.
To test reading ability, a time-limited test was used (OMRT). Whilst an age
effect was present, no language effect was found. This finding was not anticipated.
Many previous research findings (e. g., Spencer & Hanley, 2003; Ellis & Hooper,
2001, Wimmer & Goswami, 1994; Seymour at al., 2003), including the data presented
in the pilot study in Chapter 5, have consistently identified differences across
languages differing in orthographic transparency. Children who learn to read a
transparent orthography tend to rely on an alphabetic principle when reading. This
allows them to read more accurately and be more confident in trying new wflrds.
Seymour et al. (2003) presented a classification of European languages according to
their orthographic depth at the level of GP correspondences. In comparison to the
other orthographies included in that study, English was the most inconsistent when
placed on the continuum of orthographic transparency. In degrees of increasing
consistency, it was followed by French, Dutch and Swedish, German and Spanish,
and Finnish as the most consistent orthography that displays regular and symmetrical
GP correspondences. The rate of reading development in English was more than
twice as slow as in more orthographically transparent orthographies. Seymour et al.

Chapter 7 259
argued that syllabic complexity and orthographic depth are responsible for the cross-
language differences.
With regard to the OMRT error rates it was found that the youngest Albanian
group made fewer errors than the older Albanian group. The opposite pattern was
found for the Welsh and especially the English age-groups where younger children
made more errors than older children. These different patterns or error rates suggest
that Albanian children use a different reading strategy to that of the English children
However, in the main study, processing speed is a major confounding variable
with the OMRT. Although Albanian children may be able to read unfamiliar words,
the strategy they use is slow and time consuming. English children who can be very
fast at reading high frequency familiar words may struggle when trying to apply GP
conversion rules to infrequent words. Thus the number of words read correctly within
one minute fails to properly distinguish between a slow accurate strategy and a fast
strategy with more errors. This flaw in the design of time limited reading tests
(including OMRT) makes the interpretations of the results more difficult. Due to
limited resources and to the short period of time available to collect the cross-
linguistic data, it was decided that OMRT would be used in the main study. This
seemed convenient at the time of the data collection process. Here it is acknowledged
that this was not the best choice. The use of reading accuracy and reading latencies for
individual items would have been more appropriate for the purposes of this thesis.
If the test was not time limited, significant differences would have been
observed at least for the first age-group. Indeed, the results from the pilot study
presented in Chapter 5 support this as Albanian children could read more words than
English children. In addition, Hanley et al. (2004) re-examined reading abilities of
English and Welsh children (Spencer & Hanley, 2003) who had been in formal

Chapter 7 260
schooling for six years. They found that, when reading regular words, most of the
English children had caught up with children learning to read Welsh In the current
study, there was a significant difference between Albanian and Welsh for the oldest
age-group; however, this was not anticipated.
With regard to NWR no differences were found for the Albanian and English
children regardless of age-group. Wimmer and Goswami (1994) and Landerl (2000)
found that German-speaking children had substantially higher scores for pseudoword
reading tasks than English children. The Welsh children outperformed both Albanian
and English children on NWR. Once again this result was unexpected but similarly to
the real word reading (OMRT), reading speed is a confounding variable. Furthermore,
the Welsh children have received formal literacy education for a longer period than
Albanian children. Therefore, they have had more opportunities to learn and thus may
be faster at accessing the sound representations of graphemes.
Hanley et al. (2004), assessed reading abilities of English and Welsh children.
They found that an advantage of learning to read in a transparent orthography was
absent in 10-year-olds. The main study presented in this thesis failed to find an
advantage of orthographic transparency in learning to read across even in very young
children. However, strong evidence for such an advantage was found for the spelling
tasks. Moreover, it was found that such an advantage continued to be present even in
Albanian and Welsh children's spelling even in Age-Group 3. Albanian children
spelled more words than English and Welsh children; Welsh children spelled more
words than the English children. This replicates data from other transparent
orthographies studies, such as that of Wimmer and Landerl (1997) who reported that
German children who had received formal instruction for 8 to 9 months, showed

Chapter 7 261
higher accuracy for spelling vowel phonemes and consonant clusters than English
children. Spelling accuracy differences got smaller for older children; nevertheless,
the Albanian children continued to spell significantly more words than their English
and Welsh counterparts.
High predictability of GP correspondences encourages young Albanian
children to rely on phonological encoding. The asymmetry between phoneme and
grapheme correspondences in English encourages English children to rely on larger
orthographic units. Nevertheless, more empirical data is necessary to validate this
assumption.
Analysis of covariance for NWS revealed that Year 1 Albanian children could
spell more nonwords than their age matched English and Welsh counterparts. This
indicates that a one-to-one conversion strategy is more effective in highly transparent
orthographies than in non transparent ones. The development of phonological
encoding skills depends upon the transparency of the orthography: Welsh children
performed similarly to the Albanian children in the second age-group, whereas for the
oldest children no differences were found. The more transparent the orthography, the
faster is the development and reliance on GP conversion strategy for spelling.
7.5.2 Awareness of the structure of the spoken language
These findings on NWS suggests that orthographic transparency also affects
the awareness of the structure of the spoken language. Phoneme Deletion analysis of
covariance revealed that in Age-Group 1, Albanian children had higher phoneme
deletion scores than Welsh *and English children; Welsh children had better scores
than the English children. No differences were found in Age-Groups 2 and 3. The
Phoneme Deletion task taps explicit phonological skills at the smallest unit-the

Chapter 7 262
single phoneme. Research has shown that explicit phonological awareness begins to
develop when formal schooling is introduced (Cossu et al., 1988; Morais et al., 1979).
This suggests that the more transparent the orthography being learned, the faster the
development of fine-grained phonological skills. Other studies comparing explicit
phonological awareness have found ceiling or close to ceiling effect for children
learning to read in a transparent orthography. For example, accuracy level was 100%
correct for Greek children (Porpodas, 1999), 97% for Italian children (Cossu et al.,
1988), 92% for German children (Wimmer, Landerl, Linorter, & Hummer, 1991).
Perfetti, Beck, Bell and Hughes (1987) found that the accuracy level of English
children was only 65 %. Hanley et al., (2004) found that English speaking children
had very low scores on tests of phoneme awareness; however they performed well on
the rhyme awareness test. According to Goswami (2002) English speaking children
exploit onset-rime skills, holistic patterns as well as GP recoding. The development
of multiple strategies for reading may be one reason why grapheme-phoneme
recoding might develop at a slower pace.
Further evidence that the awareness of the structure of the spoken language
and use of multiple strategies arises in deep orthographies comes from the
Wordchains analysis of covariance. It was found that English children consistently
outperformed Albanian and Welsh children. Welsh children split more Wordchains
than Albanian children in Age-Groups 2 and 3. This pattern indicates that the more
deep the orthography, the more likely the reliance on larger orthographic units will be.
The findings on NWS, Phoneme Deletion and Wordchains support the
findings presented in the pilot study: the nature of the orthography being learned
affects reading strategy. Successful reliance on GP conversion rules promotes the
development of fine-grained phonological skills; reliance on visual recognition of

Chapter 7 263
larger orthographic units promotes the development oforthographic skills. However,
the structure of the spoken language can affect children linguistic tasks scores.
Albanian, for example, has mainly an open syllable structure, whereas in English the
most common structure is CVC, with relatively few CV syllables (e. g., baby)(De Cara
& Goswami, 2002). The syllable structure of the languages assessed in this thesis was
not taken into account. Seymour et al. (2003) study classified languages on an
orthographic depth continuum, as well as on a syllable structure continuum. In their
study, a distinction was made between Romance languages (e. g., Italian, Spanish),
which have a high proportion of open CV syllables with few initial or final consonant
clusters and the Germanic languages (e. g. English, German), which have a
predominance of closed CVC syllables and complex consonant clusters in both onset
and coda position. In this respect Albanian is similar to the Romance languages.
They found that for simple syllable structure languages, lexicality effects were smaller,
and nonword reading accuracy was higher.
One major issue here is that experimenter errors occurred in the manipulation
and production of the English nonword items. Many of the items contained illegal
combinations of letters (e. g., sver, srice and sroop). This error penalises the English
scores in two ways. First, English children's NWR and NWS scores are less likely to
be accurate as the items with illegal combinations were more difficult to pronounce
and spell. Secondly, due to this difficulty, more time is needed to attempt each item.
Because, NWR is a time- limited test then English children would have had fewer
opportunities to attempt to read as many words as their Albanian and Welsh
counterparts. These errors undermine the argument that the transparency of the
orthography affects the structure of the spoken language.

Chapter 7 264
To summarise: the present cross-linguistic findings on NWS, Phoneme
Deletion and Wordchains, indicate that orthographic transparency affects the
awareness of the structure of the spoken language and reading strategies. These
findings suggest that transparent orthographies promote a fine-grained level of
phonological awareness in young children and that deep orthographies promote
coarse-grained awareness, which is based on word-specific orthographic
representations. However, this research failed to take into account the syllable
structure of the spoken language and more importantly, the English stimuli were
flawed. .
7.4.3 RAN tasks
With regard to the rapid naming tasks, older children are faster than younger
children. No differences were found for RAN Objects and Colours in any of the
language groups. Differences were found in RAN Alphanumeric-these results were
not expected. English children were faster than Albanian children in Age-Group 1,
but slower than the Welsh children in Age-Groups 2 and 3.
Automatic recognition of simple letters digits and words should not differ
across languages. Analysis of variance reveals no difference between Albanian and
Welsh children. This might indeed suggest that children learning to read in
transparent orthographies learn to rapidly name stimuli in a different way to children
who learn to read in deep orthographies. However, this argument is very unlikely to
hold because the stimuli used in each language are very familiar. Furthermore, no
previous studies have reported differences in RAN tasks across-linguistic, thus the
mixed pattern or RAN Alphanumeric tasks for English children are very difficult to
interpret. One other reason why the English data fluctuates across the year-groups is
that the sample size is too small: RAN data was available for 31 Year 2 children and

Chapter 7 265
only 18 Year 4 children. However, neither argument is convincing and further
research with larger sample sizes need to be carried out.
7.5.4 Second language reading and spelling
Second language reading and spelling of Year 4 and 6 Welsh children revealed
that they could read and spell English words at a similar level to that of age matched
English children. In Year 4 they could spell more English words than the English
children. These findings suggest that learning a transparent orthography does not
become a stumbling block when subsequently learning to read and spell in a deep
orthography. These findings replicate those of Hanley et al. (in press), who also
compared bilingual Welsh children with monolingual English-speaking age-matched
children.
7.5.5 Word Comprehension
Welsh children had the lowest Word Comprehension scores regardless of age-
group. Ellis and Hooper (2001) found similar results with Year 2 Welsh speaking
children. They attributed this finding to the fact that Welsh children living in North
Wales are bilingual.
Albanian children start school a year later than the English and Welsh children
and low SES should go against the comprehension levels of the Albanian children.
Duncan and Seymour (2000) have shown that low SES is associated with delayed
acquisition of foundation literacy skills. It remains to be confirmed whether the
similarities and differences observed in the current research apply across different
SES groups. Nevertheless, Word Comprehension analysis of covariance revealed that
Albanian children knew more word meanings than English and Welsh children. This
may be an effect of orthographic transparency in comprehension. The self teaching-

Chapter 7 266
mechanism, put forward by Share (1995), maintains that phonological recoding
allows children to achieve a direct access to meaning. Alphabetic reading results in
appropriate whole-word pronunciations while the corresponding orthographic. patterns
are continually restructuring. Hence, larger units of orthography can become
associated with larger units of pronunciation following sufficient exposure to print.
This, together with a combination of use of context and ability to successfully read
word they have never seen before, might help Albanian children expand their
semantic representations faster than children learning to read in less transparent
orthographies such as English.
7.5.6 Predicting patterns for OMRT
The final comparisons relate to the predicting patterns of reading and spelling
development across languages. For the OMRT it was predicted that because of the
transparency of the orthography, Welsh and Albanian predicting patters should be
relatively similar. This was exactly what was found. For both languages and for each
age-group (1) NWR reading was the best predictor, (2) Wordchains was the second
best predictor in Age-Group 2 and (3) RAN Alphanumeric was the second best
predictor in Age-Group 3. This suggests that children learning to read in similar
orthographies use similar component skills. Young Albanian and Welsh children tend
to rely on alphabetic decoding. As children get older, when reading, they use larger
units form the orthographic knowledge they have acquired. Two differences. between
Albanian and Welsh children in Age-Group 1 are: Spelling 50 being a predictor for
Albanian and RAN Alphanumeric being a predictor for Welsh. A contribution of
spelling to reading is well documented. According to Frith's model, in young learners,
it is alphabetic spelling that is the pacemaker of alphabetic reading. RAN
Alphanumeric being a predictor for Welsh but not for Albanian may be a result of

Chapter 7 267
reading experience: Welsh children had received one more year of formal reading
instruction. This allows Welsh children to be more familiar with alphanumeric
stimuli, which subsequently allows them to name these stimuli more quickly than
children who have had less literacy experience.
The feedforward consistency of the English orthography is not as regular as
that of Albanian and Welsh. This difference is reflected on the correlation and
regression analysis findings. The predicting pattern for English children is very
different from the other two language groups: Spelling 50 is the best predictor for the
first two age-groups and the second best for the last age-group; Wordchains is the best
predictor for the oldest children. Spelling 50 is a good predictor of skilled and
unskilled reading. Orthographic skills are the most important contributors to skilled
reading. This finding may also be interpreted under the framework of Friths's model,
which proposes in the second stage, alphabetic spelling is a pacemaker of alphabetic
reading. Therefore, overall the findings form all three languages are in line with the
second stage of Friths's model, as well as findings from Juel et al. (1986) and
Stanovich (1986). However, the high correlations between Wordchains and OMRT,
are also supportive of Triermn's (1993) findings that suggest that young children are
sensitive to orthographic conventions from an early stage.
For older children, however, orthographic transparency has an effect on the
predictors of reading rate. For Albanian and Welsh children, phonological tasks
continued to be the best predictors of OMRT even in Age-Group 3. For English
children, Wordchains was the best predictor. Therefore, only the English findings
fully support the final stage of Frith's model.
Due to the different levels of feed-backward consistency of the three
languages concerned, no striking similar patterns were found for spelling ability. In

Chapter 7 268
Albanian, the overall predicting pattern suggests a mediation of phonological skills
across the three age-groups.
In Welsh, the pattern is mixed with phonological skills mediation for the first
and last age-groups and orthographic skills mediation followed by phonological
mediation for the second age-group. It could be that cross- language transfer takes
place in these children who subsequently learn a deep orthography. The second
explanation is that these differences may be due to cohort differences. Whilst the
predictor of the first and last age-groups may indicate a similarity between the age-
matched Albanian children, the predictors for the middle age- groups are very different.
The findings from the Albanian and Welsh children support the second stage of
Frith's model but regression analysis does not provide any evidence for the final stage,
which suggests that orthographic reading is the pacemaker of orthographic spelling
(especially in Albanian). However, Sprenger-charroles et al. (1997) have suggested
that the orthographic procedure develops later in spelling than in reading.
The predicting pattern of the English children is different from that of
Albanian and Welsh children. A phonological mediation is relevant for the first two
age- groups. For the oldest children regression analysis revealed an orthographic skills
mediation followed by phonological skills. Along similar lines, Cataldo and Ellis
(1988), and Ellis and Cataldo (1990) found that the contribution of explicit phoneme
awareness to spelling ability in the first three years of formal schooling increased over
time; however, it accounted for growth in reading only in Age-Group 1. Bums and
Richgels (1989) also found that the influence of phonological awareness was more
important in explaining early spelling than early reading development. They
examined children's invented spelling not in terms of accuracy buk in terms of
phonological plausibility. Four-year-old children who could produce invented

Chapter 7 269
spellings were compared with children who could not spell on a battery of tests
comprising reading skill, letter knowledge and phoneme segmentation. The non-
spellers were inferior to their peers who were inventive spellers in letter-sound
knowledge, and segmentation skills, although only 44% of later group could read.
Burns and Richgels concluded that in the early stage of literacy development,
phonemic segmentation and letter-sound knowledge were vital precursors of spelling
ability, whereas reading was a related but separate skill from word writing.
In addition, a reciprocal relationship between reading and spelling was
apparent for Year 2 English children: OMRT predicted Spelling 50 and vice versa. In
older children only Spelling 50 continues to predict OMRT. Several studies have
obtained a reciprocal longitudinal relationship between reading and spelling (e. g.
Foorman, Francis, Novy & Liberman, 1991). Most importantly, Ellis and Cataldo
(1990) found that early spelling predicted later reading, whereas . the effect of early
reading on later spelling was much weaker.
Overall, the English data supports the final two stages of Firth's model of
reading and spelling development (1985), which propose that alphabetic spelling is
the pacemaker for alphabetic reading, and that orthographic reading is the pacemaker
of orthographic spelling.
These findings provide support for two suggestions: 1) phonological abilities
are fundamental to literacy development in alphabetic scripts and the contribution of
orthographic skills increases with age; 2) orthographic transparency has an effect on
the sub-skills involved in literacy development.
7.5.7 Conclusion
The effect of orthographic depth was examined in children learning to read
and spell Albanian, English and Welsh. Reading rate differences did not show any

Chapter 7 270
advantages for children learning to read transparent orthographies. This result was
due to the way reading ability was measured.
In spelling, the orthographic depth effect obtained was large: Albanian
children spelled more words than the English and Welsh children. Following
experience, highly predictable GP correspondences allow children to quickly build
and rely upon the orthographic knowledge. The orthographic depth effect is evident
only in spelling because the spelling tasks-both for real word spelling and nonword
spelling-were not time limited.
Orthographic depth has consequences in phonological orthographic skill
development. Young children learning to read in transparent Albanian show high
scores on explicit phoneme awareness, whereas children learning to read in the deep
orthography of English showed highest accuracy scores for the Wordchains task.
As expected, the predicting patterns of OMRT for Albanian and Welsh were
almost identical. For spelling the patterns were less similar. It is suggested that
phonological abilities are fundamental to literacy development in alphabetic scripts
and the contribution of orthographic skills increases with age.

Chapter 8 271
Chapter 8: Final Discussion
8.1. Introduction
This Chapter is divided into two main sections. In the first section a general
discussion is presented; the second section highlights some of the current
methodological limitations, and makes suggestions for future research.
As there are no known studies on the acquisition of reading and spelling in the
Albanian language, additional efforts have been made to examine the development of
the literacy skills in Albanian.
8.2. General Discussion
The present research shows a number of effects of orthographic transparency
on the literacy development of young children learning to read in Albanian, English
and Welsh. It was found that: (1) Year 1 Albanian children could read more words
than Welsh and English children of the same age who had received one more year of
formal teaching instruction; (2) young Welsh and Albanian children use a different
reading strategy from that of English children; (3) Albanian children outperformed
Welsh and English children in spelling of words and non-words across three different
age-groups; (4) young Albanian children were better at phoneme deletion, whereas
English children were better at separating chains of words, and (5) the predicting
pattern of phonological and orthographic skills was affected by orthographic
transparency. These findings indicate that orthographic transparency affects: the rate
reading and acquisition, the sort of reading and spelling strategy children use, young

Chapter 8 272
children's structure of the awareness of the spoken language and the contribution of
related sub-skills to reading and spelling development.
8.2.1 Pilot study: Reading rate
In the pilot study, reported in Chapter 5, it was found that Year 1 Albanian
children could read more words of their language then their age- matched Year 2
Welsh counterparts, who in turn, could read more than the English children. These
data triangulates and confirms the conclusions of Ellis and Hooper (2001) with
respect to the effect of orthographic transparency on the rate of reading acquisition
and the strategies children use in the beginning stages of learning to read. These
findings are consistent with other studies of the effect of transparency on rate of
acquisition (e. g., Wimmer and Goswami, 1994; Öney & Durgunoglu, 1997; Seymour
et al., 2003; Spencer & Hanley, 2003), and provide further support for the
Orthographic Depth Hypothesis which suggests that reading development may
depend on the consistency of the written language (Lukatela, Carello, Shankweiler &
Liberman, 1995).
8.2.2 Pilot study: Reading strategy
Two strands of evidence show that beginning readers in the shallow
orthography of Albanian rely on a grapheme-phoneme conversion strategy: the strong
effect of word length on their reading latency, and their high proportion of nor-word
errors.
Albanian children's reading latencies were greatly affected by word length.
This is consistent with their attempting to pronounce long, novel, or infrequent words
by phonological recoding using a left-to-right parse, thus, the more letters in a row,

Chapter 8 273
the longer the production time. This suggests that young children learning to read in
transparent orthographies rely on a phonological reading strategy when reading new
or unfamiliar word items.
The second strand of evidence comes from reading error analyses. Unlike their
English counterparts, the Albanian children made more non-word errors than any
other kind of error. This high proportion of non-word errors suggests that their
reading strategy relies heavily on alphabetic recoding, as demonstrated for reading of
other transparent scripts such as German (Wimmer & Hummer, 1990) and Welsh
(Spencer & Hanley, 2003). When phonological recoding goes wrong, the likely
pronunciation error is a nonword; when whole-word lexical access on the basis of
partial visual analysis goes wrong or when partial phonetic cueing is employed, the
likely result is a word. A phonological reading strategy also means that children are
prepared to `have a go' at reading any word: despite the fact that the Albanian
children have had less time on task of reading than the English children, they tended
to make very few null responses. Thus, the regularity of orthography gives children
greater confidence in trying to read new words. Following this strategy they will
develop a `self-teaching' mechanism, which allows them to enlarge their sight-word
reading lexicon (Share, 1995).
8.2.3 Pilot study: Word Comprehension
The word comprehension level of the Year 1 Albanian children was superior
to that of Welsh children. Albanian children gave accurate definitions for 50% of the
words, compared to the English children 45%, and Welsh children 36%. The finding
that the Year 1 monolingual Albanian children performed better in word
comprehension than did Year 2 bilingual Welsh children of the same age is consistent

Chapter 8 274
with Ellis and Hooper's (2001) suggestion that their Welsh children's low
comprehension scores may be a consequence of bilingualism.
8.2.4 Main study: Reading rate
In Chapter 9, the literacy development of Year 1,3 and 5 Albanian children
was compared with that of age-matched Year 2,4 and 6 English and Welsh children.
Data analysis for the OMRT failed to show any advantage for Albanian and Welsh
children. This result was not anticipated. Previous research findings (e. g., Spencer &
Hanley, 2003, Ellis & Hooper, 2001; Seymour et al., 2003), including the data
presented in the pilot study, have consistently identified differences across languages
differing in orthographic transparency. This result is due to the nature of the reading
test used: OMRT it is a time- limited test where children have to read as many words
as possible. Although Albanian and Welsh children may be at a great advantage when
reading unfamiliar words, the alphabetic decoding strategy on which they rely with
confidence, is slow. English children who can be very fast at reading high frequency
familiar words may struggle when trying to apply GP conversion rules to infrequent
words. As a result, reading scores across languages ̀ balance out. If the test was not
time limited, significant differences would have been observed for at least the first
age-group.
No differences were found for the Albanian and English children in the NWR,
but the Welsh children's NWR rate was significantly higher than the other two
language groups. This pattern was not expected. One reason why Welsh children
read more words than the Albanian group is that they have been exposed to print for a
longer period.
Chapter 8 275
There are two explanations as to why Welsh children read more nonwords
than English children. First, the transparency and regularity of the Welsh orthography
helps Welsh children to be more confident in correctly applying a GP conversion
strategy. Second, experimenter errors occurred when creating the English nonwords.
Several, nonwords contained illegal letter combinations. These would have slowed
the reading speed of the English children. However, as already mentioned in the
previous chapters, processing speed is a major confounding variable with the OMRT.
The number of words/nonwords read correctly within one minute fail to properly
distinguish between a slow accurate strategy and a fast strategy with more errors. This
confounding substantially weakens all the related conclusions on reading rate, reading
strategy and. the true contribution of the phonological and orthographic skills to
reading development.
8.2.5 Main study: Word Comprehension
With regard to the Word Comprehension test, Albanian children knew more
word meanings than English and Welsh children. The self teaching mechanism, put
forward by Share (1995), maintains that phonological recoding allows children to
achieve a direct access to meaning. Alphabetic reading results in appropriate whole-
word pronunciations while the corresponding orthographic patterns are continually
restructuring. Hence, larger units of orthography can become associated with larger
units of pronunciation following sufficient exposure to print. This, together with a
combination of use of context and ability to successfully read words they have never
seen before might help Albanian children expand their semantic representations faster
than children learning to read in less transparent orthographies such as English. With
respect to the Welsh comprehension scores, Hanley et al. (in press) found that Welsh
Chapter 8 276
children performed poorly on a reading comprehension test, suggesting that the
advantage of orthographic transparency does not extend to word comprehension. As
Ellis and Hooper (2001) suggested, poor word comprehension scores of Welsh
children may have been due to the exposure of a second language. However, further
research is needed to understand and extend these cross-language comparisons of
word comprehension.
8.2.6 Main study: Spelling rate
Although cross- language differences were not found in reading, a persistent
difference was found in spelling': Albanian children spelt more words than English
and Welsh children, and Welsh children spelt more words than the English children.
This replicates data from German language studies. Wimmer and Landerl (1997), for
example, found that German children who had received formal instruction between 8
and 9 months, had higher accuracy for spelling vowel phonemes and consonant
clusters than English children.
Across the three age-groups, the differences in spelling accuracy were smaller
for older children. However, Albanian children continued to spell significantly more
words than their English and Welsh counterparts in each age-group. High
predictability of grapheme and phonemes correspondences encourages younger and
older Albanian children to rely on the successful phonological encoding strategy.
NWS scores significantly differ across the languages: Age-Group 1 Albanian
children spelt more nonwords than age-matched Welsh children, who in turn spelt
more than English children. As Albanian is more transparent than Welsh, and Welsh
is more transparent than English, this finding is a clear indication of the effect of
1 Spelling 50 was not a time limited test

Chapter 8 277
orthographic depth on spelling skills. Albanian children are very confident in
applying phoneme-grapheme conversion rules in spelling. Knowledge of letter names
and their highly consistent sound correspondences allow Albanian and Welsh children
to spell with high accuracy. Welsh children performed similarly to the Albanian
children in the second age-group, whereas for the oldest children no differences were
found. The more transparent the orthography, the faster is the development and
reliance on GP conversion strategy for spelling.
The observed patterns of performance for NWR and NWS are not similar.
Given that both tasks assess phonological skill one would have expected to find
similar patterns across languages. However, it is difficult directly compare these tasks
because the measurement method differs-NWR is a timed task whereas NWS is not.
In addition, as already mentioned at the end of Section 8.2.4 the English language
NWR and NWS tasks are further confounded in that they contain items with illegal
combination of letters. This can be another reason why English children NWS scores
are significantly below to those of Albanian and Welsh children.
8.2.7Awareness of the structure of the spoken language
These findings on NWS suggest that orthographic transparency also affects the
awareness of the structure of the spoken language (i. e., the development of
phonological skills is significantly affected by the transparency of the orthography).
Indeed, in the Phoneme Deletion task, Albanian Age-Group 1 children outperformed
Welsh children, who in turn outperformed English children of the same age. These
findings on phoneme deletion strongly suggest that transparent orthographies promote
a fine-grained level of phonological awareness in young children. Knowledge of
letter names and their highly consistent sound correspondences allow Albanian and

Chapter 8 278
Welsh children to perform NWS and Phoneme Deletion tasks with ease. This does
not mean that a fine-grained awareness is not developed in children learning to read
deep orthographies. The current findings suggest that this development may be
delayed in English speaking children. Instead, young children learning to read and
spell in deep orthographies may develop orthographic representations of spoken
words at a different level. On the Wordchains task, for example, the advantage of the
English children and the poorer performance of the Albanian children, within each
age-group, is noticeable. This suggests that deep orthographies promote coarse-
grained awareness, which is based on word-specific orthographic representations.
This is supportive of Goswami et al. (1998) study, which suggests that children use
analogies in reading-these analogies would reflect grapheme-phoneme relations in
transparent orthographies and rime-based coding in deep orthographies.
However, this thesis failed to take into account the syllable structure of the
languages concerned. Albanian has a mainly an open syllable structure (CV).
English and Welsh tend to have more CVC structures. The structure of the spoken
language can potentially affect children's performance on various phonological tasks.
Another problem identified here relates to the stimuli used for the English NWR and
NWS tasks. Due to experimenter error items that contained illegal letter
combinations were included in the final version of these tasks, thus putting English
children at a disadvantage when they read/spelt these items. These errors undermine
the argument that the transparency of the orthography affects the structure of the
spoken language.

Chapter 8 279
8.2.8 The contribution of phonological and orthographic skills to
literacy development
Reading. In this thesis an attempt was made to identify which sub-skills
predict reading and spelling at different ages. It was predicted that for both reading
and spelling, phonologically related tasks would predict literacy development in
young children, whereas the orthographic task would be the best predictor in older
children. With regard to reading, Albanian and Welsh predicting patterns were very
similar. Phonological tasks were the best predictors in all age-groups, whereas
Wordchains was the second best predictor in Age-Group 2, suggesting that the
contribution of phonological skills is the most important skill in reading whereas the
contribution of orthographic skills increases over time but is secondary in highly
transparent orthographies. The pattern for predicting English reading was very
different. Phonological tasks did not predict reading. Instead, spelling skills was the
only predictor for the first two age-groups. For the last age-group, Wordchains was
the best predictor. Correlation data for the English speaking children revealed that the
correlation coefficient between Spelling 50 and OMRT decreased as a function of age
whereas the coefficients between Wordchains and OMRT increased. These findings
suggest that the English predicting pattern is in line with Frith's model (1985), which
suggests that in the second stage alphabetic spelling is the pacemaker of alphabetic
reading and in the third stage orthographic reading is the pacemaker of the
orthographic spelling.
In fact, regression findings from all three languages are supportive of the
second stage of Frith's model. However, the high correlations between Wordchains
and OMRT are also supportive of Treiman's (1993) findings that suggest that young
children are sensitive to orthographic conventions from an early stage. Overall, these

Chapter 8 280
patterns suggest that orthographic depth affects the nature of sub-skills involved in
reading development.
Spelling. With regard to spelling skills, the predicting patterns across the
languages were different. It was expected that phonological skills would predict early
spelling whereas orthographic skills would predict skilled spelling. Only the English
data provided evidence for this pattern.
In Albanian only the contribution of phonological skills was evident in all age-
groups, whereas in Welsh, Wordchains was the best predictor in Age-Group 2 but did
not appear in the other two age-groups, in which the phonological skills tasks were
the only predictors.
In orthographies where the phoneme-grapheme rules are regular and consistent,
relying on a phonological recoding strategy when spelling seems to be a sensible
strategy regardless of literacy experience. This does not mean that children learning
to spell in highly transparent orthographies rely only on phonological recoding.
Sprenger-Charroles et al. (1997), for example, have suggested that the orthographic
procedure develops later in spelling than in reading. In deeper orthographies,
reliance on letter names alone will not produce the correct spelling; reliance on word-
specific level of information such as that of onsets and rimes may be more practical
(Goswami & Bryant, 1990).
Furthermore, the findings from the regression analysis, once again highlight
the scientific debate over the universality of stage theories of literacy development.
As suggested by Wimmer and Hummer (1990) reading strategies children adopt
depend upon the language the children learn.

Chapter 8 281
To conclude, the sub-skills that contribute to the development of spelling
ability differ depending on the depth of the orthography being learnt: the deeper the
orthography, the larger the contribution of orthographic skill to reading development.
However, various confounding related to the choice of tests and selection of test items
(OMRT, NWR, NWS and Wordchains), make it very difficult to correctly interpret
the contribution of phonological and orthographic skills.
8.2.9. Additional research findings in Albanian
To date, little research has been conducted to examine the effect of the
extremely transparent orthography of Albanian on reading and spelling acquisition.
As a result, further tests and analysis were carried out with children from this
language group. In addition to the OMRT, a 100-word reading test was administered -
to Albanian children. The results provided further evidence of the development of
reading strategy. First, reading latencies were larger and the world length effect was
stronger for youngest Albanian children. Second, the type and frequency of reading
errors varied across the years. The highest proportion of nonword errors was made by
Year 1 children and the least by Year 5 children. The reverse pattern of distribution
occurred for whole-word replacement errors. Third, the lexicality effect for reading
was larger for Year 5 than Year 1 children. These findings provide further support for
the hypothesis that younger Albanian children rely more heavily on grapheme-
phoneme conversion reading strategy, whereas older children rely on bigger
orthographic units, such as onset, rime, or sight word recognition as suggested by the '
developmental models of Frith (1985) and Ehri (1999).
A 100-word spelling test was used to assess spelling development-this was
matched for written frequency to the Reading 100 test. Lexicality effects existed in

Chapter 8 282
each age-group but these remained similar across the year-groups. Error analysis
revealed similar patterns to the Reading 100 errors: the highest proportion of nonword
errors was made by Year 1 children, whereas the highest proportion of whole-word
replacement errors were made by Year 5 children. Therefore, from the error analysis
and the lexicality effects it can be concluded that younger and older Albanian children
rely heavily on an alphabetic decoding strategy. Given the extremely transparent
orthography of Albanian, relying on a phonological encoding strategy in spelling
seems to be a sensible strategy to use regardless of literacy experience.
8.3 Current limitations and suggestions for future research
Future research is needed in order to discover how children learn to read and
spell, and how the current findings can be used in applied settings with children who
display reading and spelling difficulties. This section highlights some the limitations
of this study. For most of the limitations described, possible solutions and
improvements that can be employed in future research are suggested.
8.3.1. Current limitations
Creating comparable measures for reading and spelling across- languages can
prove a very difficult task. In the current research reading and spelling tests were
matched for written frequency (Ellis & Hooper, 2001). The written text corpora used
for selecting word items for the reading and spelling tests came from adult written
language rather than child input. It is very unlikely that the particularities of a text corpus
might significantly affect the higher frequency words of a language, but they can have a
great impact upon frequency estimates of less common words. Thus, lack of adequate
representation may result in measurement error. It would be more sensible if the text

Chapter 8 283
corpora were made up solely of children's written literature. In the Albanian text
corpus an attempt to include children's books was made, however, this is not
sufficient in making sure that an adequate representation is achieved. When the
current research began no text corpus was available for Albanian, thus creating this
took a considerable amount of time. This was because the availability of electronic
texts was scarce. This meant that certain materials that were not comparable to the
English and Welsh text corpora were included in the Albanian corpus (e. g., the Bible,
translated in Albanian). This difference in materials would certainly result in very
different word items being selected for the reading tests. For example, one of the
items in Albanian was the word Jezu `Jesus'. This issue is a matter of concern as it
undermines the theoretical basis for choosing frequency matched items. Therefore, if
research of this kind is to continue, larger text corpora are a necessity. A need for a
proper Albanian text corpus has been identified by other academics. Efforts to create
such a corpus have recently already started and the future of a good and balanced
Albanian text corpus is looking bright2.
Another issue that deserves attention is the age at which children start school.
This is not a problem for the English and Welsh children as the education system is
the same. In Albania children start school at the age of 6-years. Could the advantages
of Albanian children on reading and spelling be due to the late print exposure? It is
not clear if the cognitive maturity of these older children helps them grasp faster the
alphabetic principle than children who start earlier but who may not be ready. In
order to address this issue, comparisons between the development of literacy skills of
monolingual English (and/or Albanian) children who start school at 5 and children
2 Findings as well as various problems that have come to light through this thesis were presented at the

Chapter 8
who start at 6-years-old would be appropriate. This kind of study would definitely
provide hard evidence whether the age at which children are introduced to literacy
severely affects their ability to develop reading and spelling skills.
Other sub-skills variables of theoretical value should have been taken into
account. For example, a measure on short-term working memory skills or letter
knowledge would have been helpful for further analysis in spelling development.
284
The vocabulary measure in the pilot study was based on BPVS 11 (1997). This
vocabulary test is standardized for English but not for Albanian children. Therefore
the data collected from the Albanian children should be carefully treated. The
Albanian version was created by translating the English items into Albanian-during
the translation process the level of difficulty was not taken into account, therefore,
these scores may not serve as an accurate index of children's vocabulary knowledge.
Indeed, there is a need for standardized vocabulary tests in Albanian. The availability
of such tests would make cross-linguistic comparisons much easier.
The Orthographic Awareness Test used in the pilot study had low reliability.
There is disagreement as to what the content and structure of an orthographic tasks
should be as most of these can be regarded as phonological skills tasks rather than
orthographic tasks. In the main study, Wordchains were used as a measure of
orthographic skills. Because this is a time- limited test, performance is enhanced if
children have accurate orthographic representation of the words stored in memory.
However, a major problem was that this task actually involved reading real words,
therefore it is not surprising that reading and Wordchains are highly correlated. The
choice of this test was somewhat naive because it is not the best task to examine
orthographic skills. The limitations of the Wordchains task and NWR English task,
first Albanian Corpus Initiative workshop (University of Osnabrueck, Germany, September 2004).

Chapter 8- 285
have several implications in that the interpretations of results related to the
contribution of orthographic skills to literacy development and the effect of
orthographic depth to the awareness of the structure of the spoken language may not
be entirely reliable. In this thesis, phonological awareness was found to be a major
contributor to literacy development, ho, %ever, several tasks were used to measure this
awareness at the phonemic level (e. g., Phoneme Deletion, NWR, NWS, RAN).
Therefore, in order to thoroughly measure the true contribution of orthographic skills
to literacy a range of orthographic awareness tasks should be used (e. g., orthographic
awareness, orthographic choice task, Wordchains, etc. ). Furthermore, Principal
Component Analysis can be used to see if separate factors will be identified for
phonological and orthographic related tasks.
Albanian children were administered 100-word reading and spelling tests,
where reading latencies and error frequency types for both reading and spelling gave
insight to the development of literacy strategies. Using 100-word tests with Welsh
English children would be necessary to examine whether a shift of strategies occurs
during reading and spelling development. Furthermore, if the findings are replicated
in other transparent (e. g., Greek, Spanish, Italian, German) and deep (e. g., Danish,
French) orthographies it would increase the external validity of the study.
This study was limited to single word reading. Adams (1990) suggests that
during reading, children can make a great use of contextual guessing. Therefore,
single word reading in which accuracy, latencies and error types measures can be
obtained, speeded reading tests, and reading in context, should be employed in order
to have a robust measure of reading ability across languages.

Chapter 8 286
With regard to the development of phonological awareness development,
many studies have shown that initially young children show a sensitivity to the
syllable level, followed by the onset/rime and finally to the phoneme level as a
function of age (Treiman, 1987; Goswami & Bryant, 1990). Liberman et al. (1974)
found that 4 and 5-year-old children found it easy to segment words into syllables, but
not into phonemes. Is this the case with Albanian children? Pre-school phonological
skills of Albanian children need to be examined. Several tasks can be used to assess
these skills. For example, an oddity task can be used to measure the phonological
sensitivity at the onset/rime level (Bradley & Bryant, 1983). Another useful task is
the tapping task: this can be used to measure the development of phonological
awareness at the syllable and phoneme level (Liberman et al., 1974). The
same/different judgement task (Treiman & Zukowski, 1991) can was used to measure
the development of phonological awareness at syllable, onset-rime and phoneme level.
In this thesis, phonological awareness was measured only at the phoneme level.
However, research has shown, that young English children are more sensitive to the
larger linguistic units (e. g. onset and rime). If tasks that assess phonological
awareness at the larger units are used then it would be expected that their contribution
in the regression analysis would be evident. For example, Hanley et al. (2004)
showed that phonemic tasks were more closely related to reading ability of Welsh
children, whereas rhyme judgement ability was the best predictor of English-speaking
children. If further research is carried out in Albanian it is expected that Albanian-
speaking children will perform at a level similar to the Welsh-speaking children.
In order to have reliable and valid conclusions from regression analysis results,
a large number of participant is required, especially if there is a large number of
independent variables. Tabachnick and Fidell (2001) recommend the following

Chapter 8 287
formula to work out the required sample size for multiple regression analysis: N= 50
+ 8m, where m is the number of Independent Variables (IV). Thus, if there are 10 IVs,
then necessary the sample size would be 130 [50 +(8)(10)=130]. The current thesis
examined the contributions of phonological and orthographic skills to literacy.
Höwever, if the causal relationship between these skills and reading/spelling is to be
further examined a longitudinal study would be required. This type of study would
make it possible to investigate which levels of phonological awareness predict later
reading and spelling development. This would provide more evidence as to whether
the developmental literacy models of Frith (1985) and Ehri (1997,1999) apply to
highly transparent orthographies such as Albanian, as well as they apply to deep
orthographies such as English.
To date, evidence of dyslexia in Albanian has not yet been presented. This,
however, does not indicate that reading and spelling difficulties do not exist in the
very transparent orthography of Albanian. Hoxhallari (2000) interviewed experienced
primary school teachers in Albania. Many of them had come across children who had
excellent general intelligence and social skills but could never do well even in `easy'
reading and spelling tasks. Furthermore, Paulesu et al. s' (2001) neuroimaging
findings strongly suggest a case for the universality of dyslexia, and how orthographic
transparency may help dyslexic children during their literacy development. However,
whilst the neuroimaging studies suggest a universal basis for dyslexia (Paulesu et al.,
2001), behavioural studies suggest that the nature and prevalence of dyslexia might
differ between orthographies (Landerl et al., 1997). Wimmer (1993), for example,
found that German-speaking dyslexic children did not show accuracy but speed
deficits. The development ofdyslexia screening tools for Albanian is important. If

Chapter 8 288
these tools are successful in identifying dyslexic children, the next step would be to
examine where there is there evidence for reduced incidence in Albanian.
Orthographic depth is not the only factor that affects literacy. According to
researchers like Duncan and Seymour (2000) and Lundberg (2002), Social Economic
Status (SES) is one of the main variables that affect literacy development. Albanian
children are greatly disadvantaged to their British counterparts as they come from
schools in a country which is a much less wealthy than Britain, with concomitantly
fewer resources to invest in education and health. In countries with strong economies
and high levels ofhealth and adult literacy, most students become competent readers
(Elley, 1994). Limited access to written materials and parental involvement in literacy
support can seriously affect the initial steps of literacy development, and may easily
outstrip any facilitating effects of orthographic transparency.
Children examined in this thesis were taught by different teachers, in different
schools, in different countries. Indeed, it is extremely difficult to balance teaching
methods and environments across countries. It is advantageous that the English and
Welsh data came from the same region of Wales. Nevertheless, their ethos may be
very different from the Albanian education style. The main aim of this thesis was to
examine reading and spelling development of children learning to read and write in
Albanian because research of this nature does not yet exist. The main achievement of
the present research was that a start in this new research field concerning Albanian
has been made. This is only the beginning and the methodologies used need further
improvement. However, despite cultural, educational, socio-economic differences
across countries it is important to make every possible effort to carry out cross-
linguistic comparisons. It was equally important to compare the Albanian language
findings to other orthographies. In this thesis Albanian children were compared with

Chapter 8 289
English and Welsh children. By carrying out such comparisons the Albanian findings
are brought closer to the ongoing cross- linguistic research happening in different
countries. Furthermore, by comparing Albanian literacy, development with the pattern
of development in English- and Welsh-speaking children it is possible to provide
further support for the universality of theories of literacy development.
Finally, it is the aim of the author of this thesis to make the Albanian Ministry
of Education aware of the current research findings and challenge their decision to
prescribe a whole-word (Global) teaching method of reading. Given the extreme bi-
directional transparency of the Albanian orthography, this teaching method is
unreasonable. Phonics based teaching methods would be more practical in teaching
literacy.
8.5. Final conclusions
To conclude, the findings of this thesis suggest that ortho graphic transparency
affects the development of reading and spelling abilities. However, the current
research has several methodological problems which substantially weaken the validity
of the conclusions. In addition, cultural, sociological and educational factors which
were not measure here may easily outstrip any facilitating effects of orthographic
transparency.
1- Orthographic depth affects the reading accuracy of young children.
Albanian children could read more words of their language than either Welsh or
English children.
2- Orthographic transparency affects the reading strategy of young children.
Evidence from reading error types and word length effect suggest that Albanian and
Chapter 8 290
Welsh children seem to rely more on alphabetic decoding whereas English children
seem to rely more on partial visual analysis. But word length effect and log 10
frequency are confounded hence, one cannot be entirely sure that there are distinct
strategy differences.
3- Orthographic transparency affects the spelling accuracy of young children.
Albanian children could spell more words of their language than either Welsh or
English children.
4- Orthographic transparency affects the spelling strategies of young children.
Children learning to spell in bi-directionally transparent orthographies like Albanian
may -use letter names and rely on the perfect sound- letter correspondences for spelling
more often than children learning to spell in more opaque orthographies. Different to
spellers of less transparent orthographies, Albanian children may continue to use
sound- letter correspondences even for skilled spelling. Children learning to spell in
deep orthographies may rely on spelling by analogy based on larger word units (e. g.
onset and rime).
5- Orthographic transparency affects the awareness of the structure of the
spoken language. Albanian children's phonemic skills develop very fast in
comparison to English children, with Welsh children being in between the two.
English children seem to make use of word-specific orthographic representations
effectively. Two major problems undermine this conclusion. The NWR and NWS
tasks for English contained items with illegal letter combinations. NWR is further
confounded because it is a time limited test and it fails to distinguish between slow
and accurate and a fast and inaccurate reading strategy.
6- Orthographic transparency affects the contribution of sub-skills to reading
development-the deeper the orthography, the larger the contribution of orthographic

Chapter 8 291
skill to reading development. Whilst the contribution of phonological skills to early
reading skill was evident in all three languages, in Albanian and Welsh the
contribution of orthographic skill increases over time but is secondary to phonological
skills. For English children orthographic skill was the most important contributor of
reading for the oldest age-group. However, the Wordchains, task is more of a reading
task than orthographic skills task thus failing to properly measure orthographic skills.
Furthermore, the NWR and NWS tasks for English contained items with illegal letter
combinations. These limitations also apply to the conclusion below.
7- Orthographic transparency affects the contribution of sub-skills to spelling
development. Phonological tasks were the best predictor of early spelling in all three
languages examined. The contribution of the Wordchains task (orthographic skills)
was the best predictor of skilled spelling for the English sample, but did not appear as
a predictor in any of the Albanian age-groups. Hence, in orthographies where the
phoneme-grapheme rules are consistent, relying on a phonological recoding strategy
when spelling seems to be a sensible strategy even in skilled spelling. In deep
orthographies reliance on letter names alone will not produce the correct spelling;
reliance on word-specific knowledge may be necessary.
8- It is suggested that further literacy development research is needed
particularly in Albanian where research of this kind is non-existent.

References 292
References
Abboud, A., & Sugar, D. (1997). SuperLab (Version 1.03) [Computer Software].
Phoenix: Cedrus Corporation.
ACER (2002). Common country assessment: Albania. Albanian Centre for Economic
Research. Retrieved 20 January 2003, from: http: //www. acer. org. aV Adams, M. J. (1990). Beginning to read: Thinking and learning about print. London: MIT
Press.
Anderson, R. C., Wilson, P. T., & Fielding, L. G. (1988). Growth in reading and how
children spend their time outside of school. Reading Research Quarterly, 23,
285-303.
Ball, M. J. (1988). The use of Welsh: a contribution to sociolinguistics. Clevedon:
Multilingual Matters.
Baker, C. (1993). Foundations of bilingual education and bilingualism. Multilingual
Matters.
Barker, K,. Torgesen, J. K., & Wagner, R. K. (1992). The role of orthographic processing
skills on five different reading tasks. Reading Research Quarterly, 27,334-345.
Baluch, B., & Besner, D. (1991). Visual word recognition: Evidence for strategic control
of lexical and non- lexical routines in oral reading. Journal of Experimental
Psychology: Learning, Memory and Cognition, 17,644-652.
Barron, R. W. (1994). The sound-to-spelling connection: Orthographic activation in
auditory word recognition and its implications for the acquisition of phonological
awareness and literacy skills. In V. W. Berninger (Ed. ), The varieties of
orthographic knowledge I: theoretical and developmental issues. (Vol. 1, pp. 219-
242). Dordrecht, The Netherlands: Kluwer.
Barry, C. (1994). Spelling routes (or roots or rutes). In G. D. A. Brown & N. C. Ellis
(Eds. ) Handbook of spelling (pp27-49). New York, John Wiley.
Barry, C., & De Bastiani, P. (1997). Lexical priming of nonword spelling in the regular
orthography of Italian. Reading and Writing: An Interdisciplinary Journal, 9,
499-517.

References 293
Basho, F. (1969). Nje analize matematike e formimit to fjaleve shqipe prej rrokjeve.
Buletini i shkencave natyrore, 1,51-63.
Basho, F. (1974). Nje shikim statistikor i sistemit fonetik dhe grafik to gjuhes shqipe.
Buletini i shkencave natyrore, 4,23-47.
Bast, J. (1995). The development of individual differences reading ability.
Amsterdam/Duivendcrecht: Paedologisch Instituut.
Bast, J., & Reitsma, P. (1997). Matthew effects in reading: A comparison of latent growth
curve models and simplex models with structured means. Multivariate Behavioral
Research, 32 (2), 13 5-167.
Baayen, R H., Piepenbrock, R, & Van Rijn, H. (1995). The Celex Lexical Database
Release 2. Centre for lexical information, Max Planck Institute for
Psycholinguistics, Nijmegen
Bevington, G. L. (1974) Albanian phonology. Otto Harrassowitz, Wiesbaden.
Beauvois, M. F. & Derouesne, J. (1981). Lexical or orthographic agraphia. Brain, 104,
21-49.
Besner, D., & Smith, M. C. (1994). Basic processes in reading: Is orthographic depth
hypothesis sinking? In R. Frost and L. Katz (Eds. ), Orthography, Phonology
Morphology and Meaning (pp. 45-66). Amsterdam: Elesvier Science Publishers.
Besner, D., Patterson, K., Lee, L., & Hilderbrandt, N (1992). Two forms of Japanese
Kana: Phonolgically but orthographically interchangeable. Journal of Experimental Psychology: Learning, Memory and Cognition.
Bissex, G. L. (1980). GNYSAT WRK A child learns to read and write. Cambridge, MA:
Harvard University Press.
Bloomfield, L. (1933). Language. New York: Holt, Rinehard and Winston.
Bopp, F. (1854). Über das Albanesische in seinen verwandtschaftlichen Beziehungen.
Berlin.
Bowers, P. G., Golden, J., Kennedy, A., & Young, A. (1994). The varieties of
orthographic knowledge. Vol. I. " Theoretical and developmental issues.
Dordrecht: Kluwer Academic Publishers.

References 294
Bowers, P. G., & Wolf, M. (1993). Theoretical links among naming speed, precise timing
mechanisms and orthographic skill in dyslexia. Reading and Writing: An
Interdisciplinary Journal, 5,69-85.
Bowey, J. A., & Francis, J. (1991). Phonological analysis as a function of age and
exposure to reading instruction. Applied Psycholinguistics, 12,91-121.
Bradley, L. L. & Bryant, P. E. (1979). The independence of reading and spelling in
backward and normal readers. Developmental Medicine and Child Neurology, 21,
504-514.
Bradley, L., and Bryant. P. E. (1983). Categorizing sounds and learning to read -a causal
connection. Nature, 301,419-21.
Bradley, L., & Bryant, RE. (1985). Rhyme and reason in reading and spelling. Ann
Arbor. University of Michigan Press.
Brady, S., Fowler, A., Stone, B., & Windbury, N. (1994). Training phonological
awareness: A study with inner-city kindergarten children. Annals of Dyslexia, 44,
26-59.
Braten, I., Lie, A., Andreassen, R. & Olaussen, B. S. (1999). Leisure time reading and
orthographic processes in word recognition among Norwegian third- and fourth-
grade students, Reading and Writing: An Interdisciplinary Journal 11,65-88.
Brooks, L. (1977). Visual pattern in fluent word identification. In A. S. Reber and D. L.
Scarborough (Eds. ), Toward a psychology of reading (pp. 143-181). Hillsdale,
NJ: Erlbaum Associates. Bruce, D. (1964). An analysis of word sounds by young children. British Journal of
Educational Psychology, 34,158-170.
Bruck, M. (1990). Word-recognition skills of adults with childhood diagnoses of dyslexia. Developmental Psychology, 26,439-454.
Bruck, M., & Waters, G. (1988). An analysis of spelling errors of children who differ in
their reading and spelling skills. Applied Psycholinguistics, 9,77-92.
Bruck, M. & Waters, G. (1989). An analysis of the component reading and spelling skills
of good readers-good spellers, good readers-poor spellers, and poor readers-poor
spellers. In T. Carr & B. A. Levy (Eds), Reading and its Development:
Component Skills Approaches (pp. 161-206). New York: Academic Press.

References 295
Bryant, MacLean, & Crossland, (1990). Rhyme and alliteration, phoneme detection, and
learning to read. Developmental Psychology, 26(3), 429-438.
Bums, J. M. & Richgels, D. J. (1989). An investigation of task requirements associated
with the invented spellings of 4-year-olds with above average intelligence.
Journal of Reading Behavior, 21,1-14.
Byrne, B., & Fielding Barnsley, R. (1993). Evaluation of a program to teach phonics
awareness to young children: A 1-year follow up. Journal ofEducation Psychology, 85,1-21.
Byrne, B., & Fielding- Barnsley, R. (1995). Evaluation of a program to teach phonics
awareness to young children: A 2- and 3-year follow up and a newpre-school trial. Journal of Education Psychology, 87,488-503.
Byrne, B. (1984). On teaching articulatory phonetics via an orthography. Memory &
Cognition, Il, 181-189.
Campbell, R. (1983). Writing nonwords to dictation. Brain and Language, 19,153-178.
Campbell, R. (1985). When children write nonwords to dictation. Journal of Experimental Child Psychology, 40,130-151.
Caravolas, M. & Bruck, M. (1993). The effect of the oral and written language input on
children's phonological awareness: a cross- linguistic study. Journal of Experimental Child Psychology, 55,1-30.
Cataldo, S. & Ellis, N. (1988). Interactions in the development of spelling, reading and
phonological skills. Journal of Research in Reading, 11(2), 86-109. Chaney, C. (1994). Language devebpment, metalinguistic awareness, and emergent
literacy skills of 3-year-old children in relation to social class. Applied
Psycholinguistics, 15,371-394.
Chomsky, N. & M. Halle (1968). The Sound Pattern of English. New York: Harper and.
Row.
Cipielewski, J., & Stanovich, K. E. (1992). Predicting growth in reading ability from
children's exposure to print. Journal of Experimental Child Psychology, 54,74-
89.
Coltheart, M. (1978). Lexical access in simple reading tasks. In G. Underwood (Ed. ),
Strategies of information processing (pp. 151-216). London: Academic Press.

References 296
Coltheart, M. (1982). The psycholinguistic analysis of acquired dyslexias: Some
illustrations. Philosophical Transactions of the Royal Society, B298,151-164.
Coltheart, M., Curtis, B. Atkins, P. and Haller, M (1993). Models of reading aloud: Dual-
route and para11el-distributed-processing approaches. Psychological Review, 100,
589-608.
Compton, D. L., & Carlisle, J. F. (1994). Speed of word recognition as a distinguishing
characteristic of reading disabilities. Educational Psychology Review, 6,115-140.
Coulman, F. (1996). The Blackwell Encyclopedia of Writing Systems. Oxford:
Blackwell.
Cossu, G. (1999). The acquisition of the Italian orthography. In M. Harris and G. Hatano
(Eds. ), Learning to read and write: A cross-linguistic perspective (pp. 10-33).
Cambridge University Press.
Cossu, G., & Marshall, J. C. (1990). Are cognitive skills a prerequisite for learning to
read and write? Cognitive Neuropsychology, 7,21-40.
Cossu, G., Shankweiler, D., Liberman, I. Y., Katz, L. & Tola, G. (1988). Awareness of
phonological segments and reading ability in Italian children. Applied
Psycholinguistics 9,1-16.
Crystal, D. (1987). The Cambridge encyclopedia of language. Cambridge: Cambridge
University Press.
Cunningham, A. E., Perry, K. E., & Stanovich, K. E. (2001). Converging evidence for the
concept of orthographic processing. Reading and Writing: An Interdisciplinary
Journal, 14,549-568.
Cunningham, A. E., & Stanovich, K. E. (1993). Children's literacy environments and
early word recognition skills. Reading and Writing: An Interdisciplinary Journal,
5,193-204. Cunningham, A. E., & Stanovich, K. E. (1990). Assessing print exposure and orthographic
processing skills in children: a quick measure of reading experience. Journal of Educational Psychology, 82,733-740.
Daniels, P. T., & Bright, W. (1996). The world's writing systems. New York: Oxford
University Press.
References 297
Davis, C. (2005). Shallow vs Non-shallow Orthographies and learning to read. Research
Report, OECD-CERI.
De Jong, P. F, & Van der Leij, A. (1999). Specific contributions of phonological abilities
to early reading acquisition: results from a Dutch latent variable longitudinal
study. Journal of Educational Psychology, 91,3,450-476.
de Jong, P. F., & van der Leij, A. (2002). Effects of phonological abilities and linguistic
comprehension on the development of reading. Scientific Studies ofReading, 6,
51-78.
De Jong, P. (1998). Working memory deficits of reading disabled children. Journal of Experimental Child Psychology, 70,75-95.
Denckla, M. B. (1972). Color naming in dyslexic boys. Cortex, 8,164-176.
Denckla, M. B., & Rudel, R. G. (1974). `Rapid automised' naming of pictured objects,
colours, letters and numbers by normal children. Cortex, 10,186-202.
Denckla, MB., & Rudel, R. G. (1976). Rapid automatised names (R. A. N. ): Dyslexia
differentiated from other learning disabilities. Neuropsychologia, 14 471-479.
DIES (2003). Guided reading: supporting transition from Key stage 1 to Key stage 2:
materials for teachers. Nottingham.
Dodi, A. and Gjinari, J. (1983). Fonetika. Vol II of Fonetika dhe Gramatika e gjuhes se sotme letrare Shgipe. Akademia e RPS to Shqiperise.
Downing, J. A. (1962). The augmented Roman alphabet. London: Casell. Drizari, N. (1957). Albanian-English and English -Albanian dictionary. New York:
Ungar.
Duncan, L. G. & Seymour, 'P. H. K. (2000). Socio-economic differences in foundation-
level literacy. British Journal of Psychology, 91,145-166.
Dunn, L., Dunn, L., Whetton, C., Burley, I. (1997). The British Picture Vocabulary Scale
second edition testbook. Windsor. NFER.
Dunn, L., & Markwardt, F. (1970). Peabody individual achievement test. Circle Pines,
MN: American Guidance Service.
Ehri, L. C. (1986). Sources of difficulty in learning to spell and read. Advances in
Developmental and Behavioural Paediatrics, 7,121 - 195.

References 298
Ehri, L C. (1997). Sight word learning in normal readers and dyslexics. In B. Blachman
(Ed. ), Foundations of reading acquisition and dyslexia: Implications for early intervention (pp. 163-190). Mahwah, NJ: Erlbaum.
Ehri, L. C. (1992). Reconceptualizing the development of sight word reading and its
relationship to recoding. In P. B. Gough, L. C. Ehri, & R. Treiman (Eds. ),
Reading acquisition (pp. 107-144). Hillsdale, NJ: Erlbaum.
Ehri, L. C. (1999). Phases of development in learning to read words. In, J, Oakhill & R.
Beard (Eds. ), Reading Development and the teaching of reading. Oxford:
Blackwell Publishers.
Eimas, P. D., Siqueland, E. R, Jusczyk, P. W., & Vigorito, J. (1971). Speech perception in infants. Science, 171,303-306.
Ellis, A. W. (1993). Reading, Writing, and Dyslexia: A Cognitive Analysis. (2nd ed. ).
London: LEA.
Ellis, N. C. & Cataldo, S. (1990). The role of spelling in learning to read. Language and Education, 4,1-28.
Ellis, N. C., & Hooper, A. M. (2001). It is easier to learn to read in Welsh than in English:
Effects of orthographic transparency demonstrated using frequency- matched
cross-linguistic reading tests. Applied Psycholinguistics, 22,571-599.
Ellis, N. & Large, B. (1987). The development of reading: as you seek so shall you fmd.
British Journal of Psychology, 78,1-28.
Ellis, N. C., Natsume, M., Stavropoulou, K., Hoxhallari L., et al. (2004). Assessing
reading acquisition in syllabic, alphabetic, and logographic scripts. Reading
Research Quarterly, 39,4,438-468.
Ellis, N. C., O'Dochartaigh, C., Hicks, W., Morgan, M., & Laporte, N. (2001). _Cronfa
Electroneg o Gymraeg/A 1 million word lexical database and frequency count for
Welsh. University ofWales Bangor. released over the internet August 2001.
Available: http: //www. bangor. ac. uk/ar/cb/Ceg/ceg__eng. html.
Evans, H, M., & Tomas, W. O. (1953). Y Geriadur Newydd (The New Welsh Dictionary).
Llyfrau'r Dryw: Llandybie.
References 299
Feldman, L. B, Kostic, A., Lukatela, G., & Turvey, M. T. (1983). An evaluation of the
"basic orthographic syllabic structure" in a phonologically shallow orthography.
Psychological Research, 45,55-72.
Feldman, L. B, & Turvey, M. T. (1983). Word recognition in Serbo-Croatian is
phonologically analytic. Journal of Experimental Psychology: Human Perception
and Performance, 9,288-298.
Foorman, B. R. (1994). Phonological and orthographic processing: Separate but equal? In
V. W. Beminger (Ed. ) The varieties of orthographic knowledge I: theoretical and developmental issues (pp. 27-71). Dordrecht: Kluwer.
Foorman, B. R. (1995). Research on "The Great Debate": Code-oriented versus whole language approaches to reading instruction. School Psychology Review, 24,376-
392.
Foorman, B. R., Francis, D. J., Novy, D. M. & Liberman, D. (1991). How letter-sound
instruction mediates progress in first- grade reading and spelling. Journal of
Educational Psychology 83,456-469.
Forster, K. I., & Chambers, S. (1973). Lexical access and naming time. Journal of Verbal
Learning and Verbal Behaviour, 12,627-635.
Fowler, A. (1991). How early phonological development might set the stage for phoneme
awareness. In S. Brady & D. Shankweiler (Eds. ), Phonological processes in
literacy (pp. 97-117). Hillsdale, NJ: Erlbaum.
Fox, B., and D. K. Routh. 1976. Phonemic analysis and synthesis as word-attack skills. Journal of Educational Psychology, 68,70-74.1984.
Fox, B., & Routh, D. K. (1984). Phonemic analysis and synthesis as word-attack skills:
Revisited. Journal of Educational Psychology, 76,1059-1064.
Frith, U. (1985). Beneath the surface of developmental dyslexia. In K. Patterson, M.
Coltheart and J. Marshall (Eds. ), Surface dyslexia (pp. 301-330). London:
Erlbaum.
Funnell, F. (1983). Phonological processes in reading: new evidence from acquired dyslexia. British Journal of Psychology, 74,159-180.

References
Gathercole, S. E., Willis, C., & Baddeley, A. D. (1991). Differentiating phonological
memory and awareness of rhyme: Reading and vocabulary development in
children. British-Journal of Psychology, 82,387-406.
Gelb, I. J. (1963). A study of writing (2nd ed. ). Chicago: University of Chicago Press.
Gentry, J. (1982). An analysis of developmental spelling in GYNS at work. Reading
Teacher, 36,192-201.
Sandra, D. (1999). Onsets and rimes in a phonologically transparent orthography:
differences between good and poor beginning readers of Dutch. Brain and
Language 68,284-290.
300
Geva, E., Wade-Woolley, L., & Shany, M. (1993). The concurrent development of spelling
and decoding in two different orthographies. Journal of Reading Behavior, 25,383-
406.
Glushko, R. J. (1979). The organization and activation of orthographic knowledge in
reading aloud. Journal of Experimental Psychology: Human Perception and
Performance, 5,674-691.
Gombert, J. E. (1992). Metalinguistic development. London: Harvester Wheatsheaf.
Goswami, U. (1986). Children's use of analogy in learning to read: A developmental
study. Journal of Experimental Child Psychology, 42,73-83.
Goswami, U. C. (2000). Phonological and lexical processes. In M. L. Kamil, RB.
Mosenthal, PD. Pearson, & R. Barr (Eds. ), Handbook of reading research (Vol. 3,
pp. 251-267). Mahwah, NJ: Lawrence Erlbaum Associates.
Goswami (2002). In the Beginning Was the Rhyme? A Reflection on Hulme, Hatcher,
Nation, Brown, Adams, and Stuart (2002). Journal of Experimental Child
Psychology, 82,47-57.
Goswami, U., & Bryant, P. (1990). Phonological skills and learning to read. London:
Lawrence Erlbaum Associates.
Goswami, U., Gombert, J. E. & de Barrera, L. (1998). Children's orthographic
representations and linguistic transparency: Nonsense word reading in English,
French and Spanish. Journal of Applied Psycholinguistics, 19,153-162.
Goswami, U., & Mead, F. (1992). Onset and rime awareness and analogies in reading. Reading Research Quarterly, 27,153-162.

References 301
Gough, P. B., Juel, C., & Griffith, P. L. (1992). Reading, spelling, and the orthographic
cipher. In P. B. Gough, L. C. Ehri, & R. Treiman (Eds. ), Reading acquisition (pp.
35-48). Hillsdale, NJ: Erlbaum.
Greaney, K., Tunmer, W., & Chapman, J. W. (1997). The use of rime-based orthographic
analogy training as an intervention strategy for reading disabled children. In B.
Blachman (Eds. ), Foundations of reading acquisition and dyslexia: Implications
for early intervention (pp. 327-345). Hillsdale, NJ: Lawrence Erlbaum Associates.
Holopainen, L., Ahonen, T., & Lyytinen, H. (2001). Predicting delay in reading
achievement in a highly transparent language. Journal of Reading Disabilities, 5,
401-413.
Hanley, J. R., Masterson, J., Spencer, L& Evans, D. (in press). How long do the
advantages of learning to read a transparent orthography last? An investigation of the reading skills and incidence of dyslexia in Welsh children at 10-years of age. The Quarterly Journal of Experimental Psychology.
Hatcher, P., Hulme, C., & Ellis, A. (1994). Ameliorating reading failure by integrating
the teaching of reading and phonological skills: The phonological linkage
hypothesis. Child Development, 65,41-57.
Henderson, E. H. (1982). Orthography and word recognition in reading, Academic
Press: New York.
Henderson, E. H., & Beers, J. W. (1980). Developmental and cognitive aspects of learning
to spell. Newark, DE: International Reading Association.
Hoien, T., Lundberg, I., Stanovich, K. E., & Bjaalid, I. (1995). Components of
phonological awareness. Reading and Writing: An Interdisciplinary Journal, 7,
171-188.
Hoxhallari, L. (2000, unpublished). Teacher's beliefs about learning to read Albanian,
English and Welsh: The effect of a regular orthography. U. W. Bangor.
Hoxhallari, L., van Daal, V. H. P., & Ellis, N. C. (2004). Learning to read in Albanian: a
skill easily acquired. Scientific Studies of Reading, 8 (2), 153-166.
Huang, H-S & Hanley, J. R. (1997). A longitudinal study of phonological awareness,
visual skills and Chinese reading acquisition amongst first graders in Taiwan.
International Journal of Behavioral Development, 20,249-268.

References
Hung, D. L., & Tzeng, O. J. L. (1981). Orthographic variation and visual information
processing. Psychological Bulletin, 90,377-414.
Ilhan, R& Brendan, W. S. (2005). Acquired Dyslexia in a Turkish-English Speaker.
Annals of Dyslexia,
Jacobson, C. & Lundberg, I. (2000). Early prediction of individual growth in reading.
Reading and Writing. An Interdisciplinary Journal, 13,273-296.
302
Jones, D. G. (1988). Literary Welsh. In M. J. Ball (Eds. ), The use of Welsh: a contribution
to sociolinguistics. Clevedon: Multilingual Matters.
Juel, C., Griffith, P., & Gough, P. (1986). Acquisition of literacy: A longitudinal study of
children in first and second grade. Journal of Educational Psychology, 78,437-
447.
Just, M. A., & Carpenter, P. A. (1980). A theory of reading: From eye fixations to
comprehension. Psychological Review, 87,329-354.
Koolstra, C. M., van der Voort, T. H. A., & Vooijs, M. W. (1991). Buitenschools
mediagebruik als voorspeller van technisch en begrijpend lezen. Pedagogische
Studien, 68,114-124.
Kyöstiö, O. K. (1980). Is learning to read easy in a language in which the grapheme-
phoneme correspondences are regular? In J. F. Kavanagh & R. L. Venezky (eds. ),
Orthography, reading and dyslexia (pp. 35-49). Baltimore: University Park Press.
Landauer, T. K., Ross, B. H., & Didner, R. S. (1979). Processing visually presented single
words: A reaction time analysis [technical memorandum]. Murray Hill, Nj: Bell
Laboratories.
Landerl, K. (2000). Influences of orthographic consistency and reading instruction on the
development of nonword reading skills. European Journal of Psychology of
Education, 15,239-257.
Lennox, C., & Siegel, L. S (1998). Phonological and orthographic process in good and
poor spellers. In C. Hulme & R. M. Joshi (Eds. ), Reading and spelling: development and disorders. New Jersey: Lawrence Eribaum Associates, Inc.
Lennox, C. & Siegel, L. (1993). Visual and phonological spelling errors in subtypes of
children with learning disabilities, Applied Psycholinguistics, 14,473488.

References
Lewis, H. (1943). Yr elfin ladin yn yr iaith Gymraeg. Gwasg Prifysigol Cymry
Caerdydd. Cardiff: William Lewis.
Liberman, I. Y. (1985). Phonology and the Problems of Learning to Read and Write.
Special Issue, RASE, 6,6.
Liberman, I., Shankweiler, D., Fischer, F., & Carter, B. (1974). Explicit syllable and
phoneme segmentation in the young child. Journal of Experimental Child
Psychology, 18,201-212.
Lloshi, Xh. (1999). Albanian. In: Hindrichs, U. (Eds. ), Handbuch der Südosteuropa-
Linguistik (pp. 277-299). Wiesbaden: Harrassowitz Verlag,
Lovett M. W. (1987): A developmental approach to reading disability: Accuracy and
303
speed criteria of normal and deficient reading skill. Child Development, 58,234-
260.
Lukatela, K., Carello, C., Shankweiler, D., & Liberman, I. Y. (1995). Phonological
awareness in illiterates: Observations from Serbo-Croatian. Applied
Psycholinguistics, 16,463-487.
Lukatela, G., Lukatela, K., Carello, C., & Turvey, M. T. (1999). Effect of frequency and
phonological ambiguity on naming Serbo-Croatian words. European Journal of Cognitive Psychology, 11,1-16.
Lundberg, I. (2002). The child's route into reading and what can go wrong. Dyslexia, 8,
1-13.
Lundberg, I., Frost, J., & Petersen, O. P. (1988). Effects of an extensive program for
stimulating phonological awareness in pre-school children. Reading Research
Quarterly, 23,263-283
Lundberg, I., Olofsson, A., & Wall, S. (1980). Reading and spelling skills in the first
school years predicted from phonemic awareness skills in kindergarten.
Scandinavian Journal of Psychology, 21,159-173.
Maclean, M., Bryant, P., & Bradley, L. (1987). Rhymes, nursery rhymes, and reading in
early childhood. Merrill-Palmer Quarterly, 33,255-281.
Manis, F. R., Szeszulski, P. A., Holt, L. K., & Graves, K. (1990). Variation in component
word recognition and spelling skills among dyslexic children and normal readers.

References 304
In T. H. Carr and B. A. Levy (Eds. ), Reading and its development: Component
skills approaches (pp. 207-259). New York: Academic Press.
Mann, V. A., & Ditunno, P. (1990). Phonological deficiencies: Effective predictors of future reading problems. In G. Pavlidis (Ed. ), Persspectives on dyslexia (Vol. 2,
pp. 105-131). New York: Wiley.
Mann, V. & Wimmer, H. (2002). Phoneme awareness and pathways into literacy: A
comparison of German and American children. Reading and Writing, 15,653-
682.
Marsh, G., Friedman, M. P., Welch, V., & Desberg, P. (1981). A cognitive-
developmental approach to reading acquisition. In G. E. MacKinnon & T. G.
Waller (Eds. ), Reading research: Advances in Theory and Practice (Vol. 3,
pp. 199-221). New York: Academic.
Mayer, M. S, Wood, F. B., Hart, L. A., & Felton, R. H. (1998). Longitudinal course of
rapid naming in disabled and nondisabled readers. Annals of Dyslexia, 48,91-
114.
McBride-Chang, C., Manis, F. R., Seidenberg, M. S., Custodio, R. G., & Doi, L. M.
(1993). Print exposure as a predictor of word reading and reading comprehension in disabled and nondisabled readers. Journal of Educational Psychology, 85,230-
238.
McCarthy, R. and Warrington, E. K. (1986) Phonological reading: phenomena and
paradoxes. Cortex, 22,359-380.
McClelland, J. L., & Rumelhart, D. E. (1981). An interactive activation model of context
effects in letter perception: Part 1. An account of basic findings. Psychological
Review, 88,375-407.
Metsala, J., & Walley, A. (1998). Spoken vocabulary growth and the segmental
restructuring of lexical representations: precursors to phonemic awareness and
early reading ability. In J. Metsala & L. Ehri (Eds. ), Word recognition in
beginning literacy (pp. 89-120). Mahwah, NJ: Erlbaum.
Miller-Guron L. (1998). Wordchains. Windsor: NFER-Nelson

References 305
Monsell, S., Doyle, M. C., & Haggard, P. N. (1989). Effects of frequency on visual word
recognition tasks: Where are they? Journal of Experimental Psychology: General,
118,43-71.
Morais, J., Alegria, J., & Content, A. (1987). The relationship between segmental
analysis and alphabetic literacy: An interactive view. Cahiers de Psychologie
Cognitive, 7,1-24.
Morais, J., Cary, L., Alegria, J., & Bertelson, P. (1979). Does awareness of speech as a
sequence of phones arise spontaneously? Cognition, 7,323-331.
Morais, J., Mousty, P., & Kolinsky, R. (1998). Why and how phoneme awareness helps
learning to read. In C. Hulme & R. M. Joshi (Eds. ), Reading and spelling:
Development and disorders (pp. 127-152). Mahwah, NJ, USA: Lawrence
Eribaum Associates, Inc., Publishers.
Morton, J. (1969). Interaction of information in word recognition. Psychological Review,
76,165-178.
Müller, K., & Brady, S. (2001). Correlates of early reading performance in a transparent
orthography. Reading and Writing: An Interdisciplinary Journal, 14,757-799.
Nash, G. D. (1991). Victorian School days in Wales. Cardiff: University of Wales Press.
Näslund, J. C., & Schneider, W. (1996). Kindergarten letter knowledge, phonological
skills, and memory processes: Relative effects on early literacy. Journal of
Experimental Child Psychology, 62,30-59.
Newmark L. (1998). Albanian -English dictionary. New York: Oxford University Press.
Olson, R. K., Forsberg, H., & Wise, B. (1994). Genes, environment, and development of
orthographic skills. In V. W. Benninger (Ed. ) The varieties of orthographic
knowledge I: theoretical and developmental issues (pp. 27-71). Dordrecht:
Kluwer.
Olson, R., Kliegl, R., Davidson, B. J., & Foltz, G. (1985). Individual developmental
differences in reading disability. In T. G. Waller (ed. ), Reading research:
Advances in theory and practice (Vol. 4, pp. 1-64). New York: Academic.
Olson, R. K. & Wise, B. W., Conners, F., & Rack, J. (1990). Organisation, heritability,
and remediation of component word recognition and language skills in disabled

References 306
readers. In T. H. Carr & B. A. Levy (Eds. ), Reading and its development:
component skills approach (pp. 261-322). New York: Academic Press.
Öney & Durgunoglu (1997). Beginning to read in Turkish: A phonologically transparent
orthography. Applied Psycholinguistics, 18,1-15.
Oney & Goldman (1984). Decoding and comprehension skills in Turkish and English:
Effects of the regularity of grapheme-phoneme correspondences. Journal of Educational Psychology, 76,557-568.
Paap, K. R., & Noel, R. W. (1991). Dual-route models of print to sound: Still a good horse race. Psychological Research, 53,13-24.
Paulesu E, Demonet J-F, Fazio F, McCrory E, Chanoine V, Brunswick N, et al. (2001).
Dyslexia: Cultural Diversity and Biological Unity. Science, 291,2165-2167.
Pennington, B., McCabe, S. D, Lefly, D. L., Bookman, M. O., Kimberling, W. J., & Lubs,
H. A. (1986). Spelling errors in adults with a form of familial dyslexia. Child
Development, 57,1001-1013.
Pitman, J. (1969). The late Dr Mont Follick-An appraisal. IN W. Hass (Ed. ), Alphabets
for English. Manchester: Manchester University Press.
Porpodas, C. D. (1999). Patterns of phonological and memory processing in beginning
readers and spellers of Greek. Journal of Learning Disabilities, 32,406-416.
Posner, M. I. & Snyder, C. R. (1975a). Facilitation and inhibition in the processing of
signals. In P. M. A. Rabbitt & S. Domic (Eds. ), Attention and performance, Vol. 5
(pp. 669-682). New York: Academic.
Posner, M. I. & Snyder, C. R. R. (1975b). Attention and cognitive control. In R. L. Solso
(Ed. ), Information processing and cognition: The Loyola Symposium (pp. 55-85).
Hillsdale, NJ: Erlbaum.
Öney, B. & Durgunoglu, A. Y. (1997). Beginning to read in Turkish: A phonologically transparent orthography. Applied Psycholinguistics 18,1-15.
Preston, K. A. (1935). The speed of word perception and its relation to reading ability. Journal of General Psychology, 13,199-203.
Perfetti, C. A., Beck, I., Bell, L., & Hughes, C. (1987). Phonemic knowledge and learning
to read are reciprocal: A longitudinal study of first grade children. Merrill-Palmer
Quarterly, 33,283-319.

References 307
Pitman, J. (1969). The late Dr Mont Follick-An appraisal. In Haas (Ed. ), Alphabets
for English. Manchester: Manchester University Press.
Rayner, K., & Duffy, S. A. (1986). Lexical complexity and fixation times in reading:
Effects of word reading frequency, verb complexity, and lexical ambiguity.
Memory & Congition, 14,191-20 1.
Raven, J. C. (1958). Standard Progressive Matrices; Sets A. B, C, D and E. London:
Cambridge University Press. Lewis & Co. Ltd.
Read, C. (1971). Pre-school children's knowledge of English phonology. Harvard
Educational Review, 41,1-34.
Read, C. (1975). Children's categorization of speech sounds in English, NCTE Research
Report No. 17. Urbana, IL, USA: National Council of Teachers of English.
Read, C. (1986). Children's creative spelling. London: Routledge and Kegan Paul. Read.
C., Zhang, Y., Nie, H., & Ding, B. (1986). The ability of manipulate speech sounds
depends on knowing alphabetic writing. Cognition, 24,31-44.
Roach, P. (1983). English phonetics and phonology :a practical course. Cambridge:
Cambridge University Press.
Rodrigo, L. M. & Jimenez, G. J. E. (1999). An analysis of the word naming errors of
normal readers and reading disabled children in Spanish. Journal of Research in
Reading, 22,180-197.
Rubestein, H., Garfield, L., & Millikan, J. A. (1970). Homographic entries in the internal
lexicon: Journal of Verbal Learning and Verbal Behaviour, 9,487-494.
Rubenstein, H., Lewis, S. S., & Rubenstein, M. A. (1971) Homographic entries in the
internal lexicon: Effects of systematicity and relative frequency of meanings.
Journal of Verbal Learning and Verbal Behaviour, 10,57-62.
Seidenberg, M. S., & McClelland, J. L. (1989) A distributed developmental model of word
recognition and naming. Psychological review, 96,523-568.
Shallice T. (1981) Phonological agraphia and the lexical route in writing. Brain, 104,
413-429.
Share, D. L. (1995). Phonological recoding and self-teaching: sina qua non of reading
acquisition. Cognition, 55,151-218.

References 308
Share, D. L., & Stanovich, K. E. (1995). Cognitive processes in early reading
development: Accommodating individual differences into a model of acquisition.
Issues in Education, 1,1-57.
Seymour, P. H. K., Aro, M., & Erskine, J. M. (2003). Foundation literacy acquisition in
European orthographies. British Journal of Psychology, 94,143-174.
Seymour, P. H. K., Duncan, L. G., & Bolik, F. M. (1999). Rhymes and phonemes in the
common unit task: Replications and implications for beginning reading. Journal
of Research in Reading, 22,113-130.
Siegel, L. S (1994). Phonological processing deficits as the basis of developmental
dyslexia: Implications for remediation. In G. Humphries & J. Riddoch (Eds. ),
Cognitive Neruopsychology and cognitive rehabilitation (pp. 392-400). Hove,
England: Lawrence Erlbaum Associates.
Siegel, L. S., Geva, E., & Share, D. (1990). The development of orthographic skills in
normal and disabled readers. Unpublished manuscrips.
Siegel, L. S., & Ryan, E. B. (1988). Development of grammatical- sensitivity,
phonological, and short-term memory skills in normally achieving and learning
disabled children. Developmental Psychology, 24,28-37.
Siegel, L. S., Share, D., Geva, E. (1995). Evidence for superior orthographic skills in
dyslexics. Psychological Science, 6,4,250-254.
Skendi, S. (1976). The Albanian National Awakening 1878-1912. Princeton University
Press.
Snowling, M. (1998). Dyslexia as a phonological deficit: Evidence and implications.
Child Psychology & Psychiatry, 3,4-11.
Snowling, M. J. & Hulme, C. (1999). A connectionist perspective on reading and its
difficulties. In Lundberg, I., Tonessen, F. E. & Austad, I. (Eds). Dyslexia:
Advances in Theory and Practice (45-58). Dordrecht: Kluwer
Spencer, LL., H. (2000). The role of phonological awareness in the beginning reading of
Welsh and English speaking children. Unpublished doctoral dissertation,
University of Liverpool, Liverpool, UK.
References 309
Spencer, LL. H. & Hanley, R. J. (2003). The effect of orthographic consistency on
reading and phonological awareness in children learning to read in Wales. British
Journal of Psychology, 94,1-28.
Sprenger-Charrolles, L., Siegel, L. S., & Bechennec, D. (1997). Beginning reading and
spelling acquisition in French: a longitudinal study. In Perfetti, C. A., Rieben, L.,
& Fayol, M. (Eds) Learning to Spell: Research, Theory and Practice across
Languages (pp. 339-360). New Jersey: Erlbaum,
Stage, S. A., & Wagner, R. K. (1992). Developmental of young children' phonological
and orthographic knowledge as revealed by their spellings. Developmental
Psychology, 28,287-296. , Stanovich, K. E. (1980). Toward an interactive-compensatory model of individual
differences in the development of reading fluency. Reading Research Quarterly,
16,32-71.
Stanovich, K. E., & West, R. (1989). Exposure to print and orthographic processing.
Reading and research Quarterly, 24,402-433.
Stanovich, K. E., & Siegel, L. S. (1994). The phenotypic performance profile of reading- disabled children: A regression based test of the phonological-core variable difference model. Journal of Educational Psychology, 86,24-53.
Stuart, M., & Coltheart, M. (1988). Does reading develop in a sequence of stages? Cognition, 30,139-181.
Sunseth, K. & Bowers, P. G. (1997). The relationship between digit naming speed and
orthography in children with and without phonological deficits. Paper presented
at the annual conference for the Society for the Scientific Study of Reading,
Chicago.
Tabachnick, B. G., and Fidell, L. S. (2001). Using Multivariate Statistics (4th ed. )
Boston: Allyn and Bacon.
The Academy Reinvented (1999). Newsletter of the Welsh Academy.
Thorstad, G. (1991). The effect of Orthography and the Acquisition of Literacy skills. British Journal of Psychology, 82,527-537.
Torgesen, J. K., Wagner, R. K., Rashotte, C. A., Burgess, S., & Hecht, S. (1997).
Contributions of phonological awareness and rapid automatic naming ability to
References 310
the growth of word-reading skills in second- to firth-grade children. Scientific
studies of reading, 1,161-185.
Treiman, R. (1993). Beginning to Spell: A Study of First-Grade Children. Oxford: Oxford
University Press.
Treiman, R. (1994). Use of consonant letter names in beginning spelling. Developmental
Psychology, 30,567-580.
Treiman, R. (1997). Spelling in normal children and dyslexics. In B. A. Blachman (Ed. ),
Foundations of reading acquisition and dyslexia: Implications for early intervention (pp. 191-218). Mahwah, NJ: Lawrence Eribaum Associates, Inc.
Treiman, R. (1985). Spelling of stop consonants after /s/ by children and adults. Applied
Psycholinguistics, 6,261-282.
Treiman, R. (1987). On the relationship between phonological awareness and literacy.
Cahiers de Psychologie Cognitive, 7,524-529.
Treiman, R., Mullennix, J. W., Bijeljac-Babic, R., & Richmond-Welty, D. (1995). The
special role of rimes in the description, use, and acquisition of English
orthography. Journal of Experimental Psychology: General, 124,107-136.
Treiman, R. & Zukowski, A. (1991). Levels of phonological awareness. In S. A. Brady &
D. P. Shankweiler (Eds), Phonological Processes in Literacy (pp. 67-83).
Hillsdale, NJ: LEA.
Upward, C. (1992). Teaching Literacy first, Traditional English Orthography second. In C. M. Sterling and C. Robson (Eds. ), Psychology Spelling and Education.
Multilingual Matters. Clevedon.
Van Den Bos, K. P., Zijlstra, B. J. H. & Spelberg, H. C. L. (2002). Life span data on
continuous naming speeds of numbers, letters, colors, and pictured objects, and
word reading speed. Scientific Studies of Reading, 6,25-49.
Van den Bos, K. (1998). IQ, phonological awareness, and continuous-naming speed
related to Dutch children's performance an two word identification tests. Dyslexia, 4,73-89.
Vellutino, F. R., Scanlon, D. M., & Chen, R. S. (1995). The increasing inextricable
relationship between orthographic and phonological coding in learning to read:

References 311
Some reservations about current methods of operationalizing orthographic coding.
In V. W. Berninger (Ed. ), the varieties of orthographic knowledge II.,
Relationships to phonology, reading, and writing (pp. 47-111). Dordrecht:
Kluwer.
Venezky, R. L. (1995). How English is read: Grapheme-phoneme regularity and
orthographic structure in word recognition. In I. Taylor, and Olson, D. R. (Eds. ),
Scripts and literacy: Reading and learning to read alphabets, syllabaries, and
characters (pp. 111- 129). Netherlands: Kluwer Academic Publishing.
Venezky, (1976). English orthography: Its graphical structure and its relation to sound. Reading Research Quarterly, 2,75-106.
Wagner, R. K., Torgesen, J. K., Rashotte, C. A., Hecht, S. A., Barker, T. A., Burgess, S. R.,
Donuahue, J., & Garon, T. (1997). Changing relations between phonological
processing abilities and word- level reading as children develop from beginning to
skilled readers: A5 year longitudinal study. Developmental Psychology, 33,468-
479.
Wagner, R. K., Torgesen, J. K., & Rashotte, C. A. (1994). Development of read ing-related
phonological processing abilities: New evidence for bidirectional causality from
a latent variable longitudinal study. Developmental Psychology, 30,73-87.
Wagner, R. K., & Torgesen, J. K. (1987). The nature of phonological processing and its
causal role in the acquisition of reading skills. Psychological Bulletin, 101,192-
212.
Walley, A. (1993). The role of vocabulary development in children's spoken word
recognition and segmentation ability. Developmental Review, 13,286-350.
Walsh, D. J., Price, G. G., & Gillingham, M. G. (1988). The critical but transitory
importance of letter naming. Reading research Quarterly, 23,108-122.
Wang, M. & Geva, E. (2003). Spelling acquisition of novel English phonemes in Chinese
children. Reading and Writing: An Interdisciplinary Journal, 16(4), 325-348.
Welsh Language Board (2002). Welsh-speaking Secondary school. Material accessed from the internet in June 2003. Available: http: //www. bwrdd-yr-iaith. org. uk/

References 312
Willows, D. & Geva, E. (1995). What Is Visual in Orthographic Processing?. In V. W.
Benninger (Ed. ), The varieties of orthographic knowledge II: Relationships to
phonology, reading, and writing (Vol. 2, pp. 355-376). Dordrecht: Kluwer.
Wimmer, H. (1993). Characteristics of developmental dyslexia in a regular writing
system. Applied Psycholinguistics. 14,1-33.
Wimmer, H. & Goswami, U. (1994). The influence of orthographic consistency on
reading development: word recognition in English and German children.
Cognition 51, '19-103.
Wimmer, H. & Hummer, P. (1990). How German speaking first graders read and spell:
doubts on the importance of the logographic stage. Applied Psycholinguistics
11,349-368.
Wimmer, H& Landerl, K (1997). How learning to spell German differs from learning to
spell English. In Perfetti, C. A., Rieben, L., & Fayol, M. (Eds) Learning to Spell:
Research, Theory and Practice across Languages (pp. 81-96). New Jersey:
Erlbaum,
Wimmer, H., Landed, K. & Scneider, W. (1994). The role of rhyme awareness in
learning to read a regular orthography. Journal ofDevelopmental Psychology 12,
253-266.
Winuner, H., Landerl, K., Linorter, R. & Hummer, P. (1991). The relationship of
phonemic awareness to reading acquisition: More consequence than precondition but still important. Cognition, 40,219-249.
Wolf, M. & Bowers, P. G. (1999). The double-deficit hypothesis for the developmental
dyslexia. Journal of Educational Psychology, 91(3), 1-24.
Xhumari, K. (2003). Abetare. Tirane: Shtepia Botuese e Librit Shkollor.
Ziegler, J. C., Stone, G. 0., & Jacobs, A. M. (1997). What's the pronunciation for - OUGH and the spelling for /u/? A database for computing feedforward and feedback inconsistency in English. Behavior Research Methods, Instruments, &
Computers, 29,600-618.
Ziegler, J. C., Perry, C., Jacobs, A. M., & Braun, M. (2001) Identical words are read differently indifferent languages. Psychological Science, 12,379-384.

References 313
Ziegler, J. C., & Goswami, U. (2005). Reading acquisition, developmental dyslexia and
skilled reading across languages: a psycholinguistic grain size theory.
Pscyhological Bulletin, 131,3-29.
Zipf. G. K. (1965). Psychobiology of Languages. Mass. MIT Press.
Zoccolotti, P., De Luca, M., Di Pace, E., Judica, A., Orlandi, M., & Spinelli, D. (1999)
Markers of developmental surface dyslexia in a language (Italian) with high
grapheme-phoneme correspondence. Applied Psycholinguistics, 20,191-216.

PAGE MISSING
IN ORIGINAL

Appendices 315
Appendices
Albanian, Welsh and English LoglO frequencies and 316 Appendix 1
percentages of children who correctly read the words aloud Appendix 2 NWR and NWS items (Pilot Study) 320 Appendix 3 Blending Segmenting and tasks 321 Appendix 4 Orthographic Awareness Task 322 Appendix 5 Rapid Naming tasks (Pilot Study) 323 Appendix 6 BPVS-II in Albanian 327 Appendix 7 Coloured Progressive Matrices answer sheet. 328 Appendix
.8 Generic Speed. 329
Appendix 9 Computerised reading test-Albanian main study (Reading 100) 330 Appendix 10 OMRT word items in Albanian, English and Welsh 331 Appendix 11 Spelling 100 in Albanian 332 Appendix 12 NWR and NWS items in Albanian, English and Welsh 333 Appendix 13 CPM: Main study 334 Appendix 14 RAN: Main study 335 Appendix 15 Phoneme Deletion tasks in Albanian, English and Welsh 350 Appendix 16 Wordchains Albanian 351 Appendix 17 Wordchains English 355 Appendix 18 Wordchains Welsh 358 Appendix 19 Spelling 50 word-items in Albanian, English and Welsh 361

Appendices
Appendix 1
316
Albanian, Welsh and English Log 10 frequencies and percentages of children who
correctly read the words aloud.
Albanian Welsh English Test Word
number Word LoglO % read
frequency correct Word Log 10 % read
frequency correct Word
Log 10 frequenc
y % read correct
1 tc'you' 4.83 95 yn'in' 4.74 95 the 4.78 100
2 e'of, 4 . 83 100 y'the' 4.65 100 of 4.48 85
3 nd 'in' 4.78 100 i'to' 4.51 100 and 4.46 100
4 dhe 'and' 4.73 90 a'and' 4.51 100 a 4.67 100
5 Pof 4 . 69 100 o ̀ from' 3.99 100 to 4.30 100
6 qd 'that'. 4.64 100 ar 'on' 4.42 100 in 4.27 100
7 per 'for' 4.59 100 ei 'his/her' 4.19 100 it 4.05 100
8 me'with' 4.54 100 yr 'the' 4.16 85 i 4.04 100
9 nje'one' 4.49 100 ac'and' 3.95 100 is 3.97 100
-10 nga'from' 4.44 90 oedd'was' 4.15 100 he 3.95 100
11 ka'has' 4.40 100 bod'to be' 4.06 100 that 3.88 100
12 me 'more' 4.35 95 mae 'is' 3.96 100 with 3.84 100
13 se 'that' 4.30 100 am 'about' 3.88 100 be 3.79 100
14 eshte'is' 4.25 95 and 'but' 3.78 95 at 3.75 100
15 do'want' 4.15 100 cu ̀ their' 3.72 75 was 3.73 100
16 nuk `not' 4.11 90 fel 'like' 3.69 95 not 3.71 90
17 se 'by' 4.06 95 a 'with' 3.60 100 this 3.68 100
18 u `to them' 4.01 100 ni 'us' 3.54 100 by 3.64 95
19 por 'but' 3.96 100 61 'back' 3.45 85 from 3.62 100
20 edhe'and' 3.91 100 nid'not' 3.40 100 we 3.56 100
21 ai 'he' 3.86 90 dim 'nothing' 3.36 100 there 3.53 85
22 si 'how' 3.82 100 iawn 'very' 3.32 95 if 3.48 95
23 tij 'his' 3.77 95 mawr'big' 3.29 100 as 3.44 100
24 kane'have' 3.72 100 fy'my' 3.26 75 out 3.40 85
25 po'yes' 3.67 100 trwy'through' 3.21 65 them 3.37 95
26 duke'whilst' 3.62 90 nhw'them' 3.17 90 has 3.33 100
27 jand'are' 3.57 95 rhaid'haveto' 3.15 95 then 3.27 100
28 kishte 'had' 3.53 100 chi 'you' (formal) 3.11 100, now 3.24 85
29 shume 'many' 3.48 100 meddai 'said he' 3.07 100 people 3.16 85
30 keti 'this' 3.48 100 plant'children' 3.01 95 any 3.10 75
31 to 'them' 3.43 95 bach 'small' 2.98 100 don't 3.05 100

Appendices 317
32 prej `from' 3.38 95 eto 'again' 2.94 100 over 3.00 85
33 gjithd 'all' 3.33 95 dwy 'two' 2.89 45 never 2.95 95
34 gene 'were' 3.28 80 blwyddyn 'year' 2.84 90 going 2.90 95
35 sipas 'according' 3.24 100 nifer'many' 2.80 85 how 2.86 90
36 disa 'some' 3.19 95 pethau 'things' 2.77 95 same 2.82 65
37 ne'we' 3.14 80 arno 'on it' 2.73 85 though 2.76 20
38 para'before' 3.09 85 cyfarfod 'meeting' 2.69 60 himself 2.71 95
39 deri 'until' 3.04 95 bore'morning' 2.66 100 much 2.61 100
40 jete'life' 3.00 95 newid 'to change' 2.62 95 seen 2.58 90
41 kam 'have' 2.95 100 dosbarth 'class' 2.59 100 moment 2.52 60
42 policise 'of the
police' 2.90 75 cwmni `company' 2.55 80 political 2.48 5
43 ose ̀or' 2.85 95 union'exactly' 2.52 70 itself 2.45 95
44 cilet `who' 2.80 85 ambell 'some' 2.48 90 I'll 2.41 95
45 menyre 'maner' 2.75 70 gelIid'one can' 2.44 75 education 2.37 15
46 tjere'others' 2.71 75 gweithredu 'to
operate' 2.40 55 use 2.33 80
47 neper 'through' 2.66 85 siwr 'sure' 2.36 40 particular 2.29 5
48 o ̀ o' - like in: o God 2.61 100 cylch 'cirlce' 2.32 85 short 2.26 75
49 lidhur 'connected' 2.56 85 helpu 'to help' 2.28 90 information 2.22 30
50 jene 'are' 2.51 90 cariad'love' 2.25 90 rate 2.15 45
51 deklaruar'declared' 2.46 45 cefais 'i had' 2.21 90 find 2.11 75
52 rast ̀ case' 2.42 85 cymuned 'community' 2.17 45 thought 2.07 60
53 Jezu'Jesus' 2.37 95 cymharu 'to compare' 2.14 60 arms 2.03 70
54 ditet `days' 2.32 65 croes 'cross' 2.10 65 found 1.98 75
55 ati 'father' 2.27 65 cefnogaeth 'support' 2.06 40 complete 1.94 60
56 vrare'killed' 2.22 75 coeden'tree' 2.02 85 costs 1.89 45
57 bera ̀did' 2.17 55 gwragedd'wives' 1.98 55 top 1.85 85
58 gjithnje 'always' 2.13 80 Ilinell 'line' 1.94 90 progress 1.81 20
59
komisariatit 'of the
commissariat' 2.08 25
cenedlaetholdeb
'nationalism' 1.89 15 quick 1.77 65
60
Rakipi - Albanian
name 2.03 75 medr 'metre' 1.84 65 protection 1.73 10
61 prokurori
'prosecutor' 1.98 60 ynghynt'before'
1.79 20 accident 1.69 20
62 yt 'yours' 1.93 80 ardderchog 'excellent' 1.75 60 typical 1.63 10
63 firmosur'signed' 1.88 70 daliai 'hold' 1.70 50 cheap 1.59 60
64 rrethit 'of the cirlce' 1.84 85 tei 'tie' 1.64 60 title 1.53 35
65 mal 'mountain' 1.79 90 goblygiadau 1.59 25 1.49 40

Appendices 318
`implications' enterprise
66 njihet `get to know' 1.74 60 dwsin `dozen' 1.53 60 cheque 1.45 0
67 lashte'ancient' 1.69 70
awgrymir 'it is
suggested' 1.48 20 procedure 1.38 10
68 date 'date' 1.64 75 caeodd `shut' 1.41 40 poetry 1.32 25
69 gendrimi `the stay' 1.59 70 cyfeiriwyd 'referred' 1.34 15 perception 1,26 0
70 personale 'personal' 1.55 60 amserau 'times' 1.28 30 acute 1.20 20
71 paguaje'to pay' 1.50 65
awgrymog
'suggestive' 1.20 25 restraint 1.11 0
72 flasim ̀ speak' 1.45 75
datblygwyd
`developed' 1.11 5 monetary 1.04 15
73
organizate
`organisation' 1.40 45 trefol 'town-like' 1.00 45 sound 0.95 35
74 prodhimit
'production' 1.35 60 prydyddion 'poets' 0.90 20 bliss 0.90 25
75 varrit `grave' 1.30 75 segurdod 'idleness' 0.78 15 outrage 0.78 30
76 verifikuar `verify' 1.26 60 babandod 'infancy' 0.70 5 echoing 0.70 15
77 s'eshte'isn't' 1.21 75 melltithio `to curse' 0.48 25 blind 0.60 25
78 ndan `separate' 1.16 70 grymuster'power' 0.30 30 attache 0.48 0
79 valen `wave' 1.11 80 moliannau `to praise' 0.00 35 cryptic 0.30 0
80 gjashtedhjete ̀sixty' 1.06 65 achwynwr
`complainant' 0.00 15 marigolds 0.00 15
81 liderit 'lider' 1.01 65 pechai ̀ to sin' 0.00 15 precipitously 0.00 0
82 mjegull 'fog' 0.97 80 pegiau 'pegs' 0.00 30 gourmet 0.00 0
83 thelluar 'deepened' 0.92 55 esgeulusai 'would
neglect' 0.00 10 guitars 0.00 5
84
grindjet
'quarrellings' 0.87 65 maindy 'stone-cottage' 0.00 25 punctuated 0.00 0
85
perhershme
`permanent' 0.82 25
ymyriadau
'retirement' 0.00 20 distinctively 0.00 0
86
deklarimi
'declaration' 0.77 75 socedi `sockets' 0.00 25 subtraction 0.00 5
87
premtimeve
'promises' 0.72 70 nodweddwyd'was' 0.00 20 occurrences 0.00 0
88 klani `klan' 0.68 80 troisai `would turn' 0.00 10 resignedly 0.00 0
89 hum `sludge' 0.63 80 rhifais `i numbered' 0.00 30 disgusted 0.00 0
90 rivalitet 'rivalry' 0.58 60 gweinydd 'waiter' 0.00 20 governorship 0.00 5
91 numrash ̀numbers' 0.53 70
ddi-amod
`unconditional' 0.00 25 architecturally 0.00 0
92 mirenjohjeje 0.48 10 ymneilltuad 0.00 10 0.00 5

Appendices 319
'gratefulness' `retirement' fiercer
93 servilizmi 'servility' 0.43 45
tanseiliwyd 'was
undermined' 0.00 20 nightingale 0.00 5
94
milleniumit
'millennium' 0.39 30 torgest'rupture' 0.00 15 antechamber 0.00 0
95 nishan'mole' 0.34 75 talwch 'pay' 0.00 30 moron 0.00 0
96
parakalimin
`parade' 0.19 80
gogledd-gorllewinol
'north-western' 0.00 20 militaristic 0.00 0
97 tepertit'excess' 0.14 55 trwmbal 'lorry trailer' 0.00 20 slung 0.00 5
98
imperialiste
'imperialist' 0.10 40
dychwela 'would
return' 0.00 15 maxims 0.00 5
99 levdoni 'worship' 0.05 65 cywydd-un-cwpled
'type of welsh peotry' 0.00 5 marquees 0.00 0 100 shkumes 'chalk' 0.00 80 treigla 'mutate' 0.00 25 moped 0.00 5
(logl Utrequencles Albanian M=Z. 4 . ), ND = 1.402; English M= 2.058, SD = 1.459; Welsh M-2.0678, SD
= 1.453)

Appendices
Appendix 2
NWR and NWS items (Pilot Study).
Nonword reading items
Nonword spelling
items
1 fyj nek 2 vet dut
3 byr fet 4 mej ube
5 nun suj 6 sog kir
7 nas per 8 zeg lyg
9 jom aly
10 bep tic
11 hyke ekte
12 kema dege
13 pade pige 14 divu pazi
15 dyfe fahe
16 beke pana 17 tebe keze
18 dida murd
19 furd vege 20 mubi bati
320
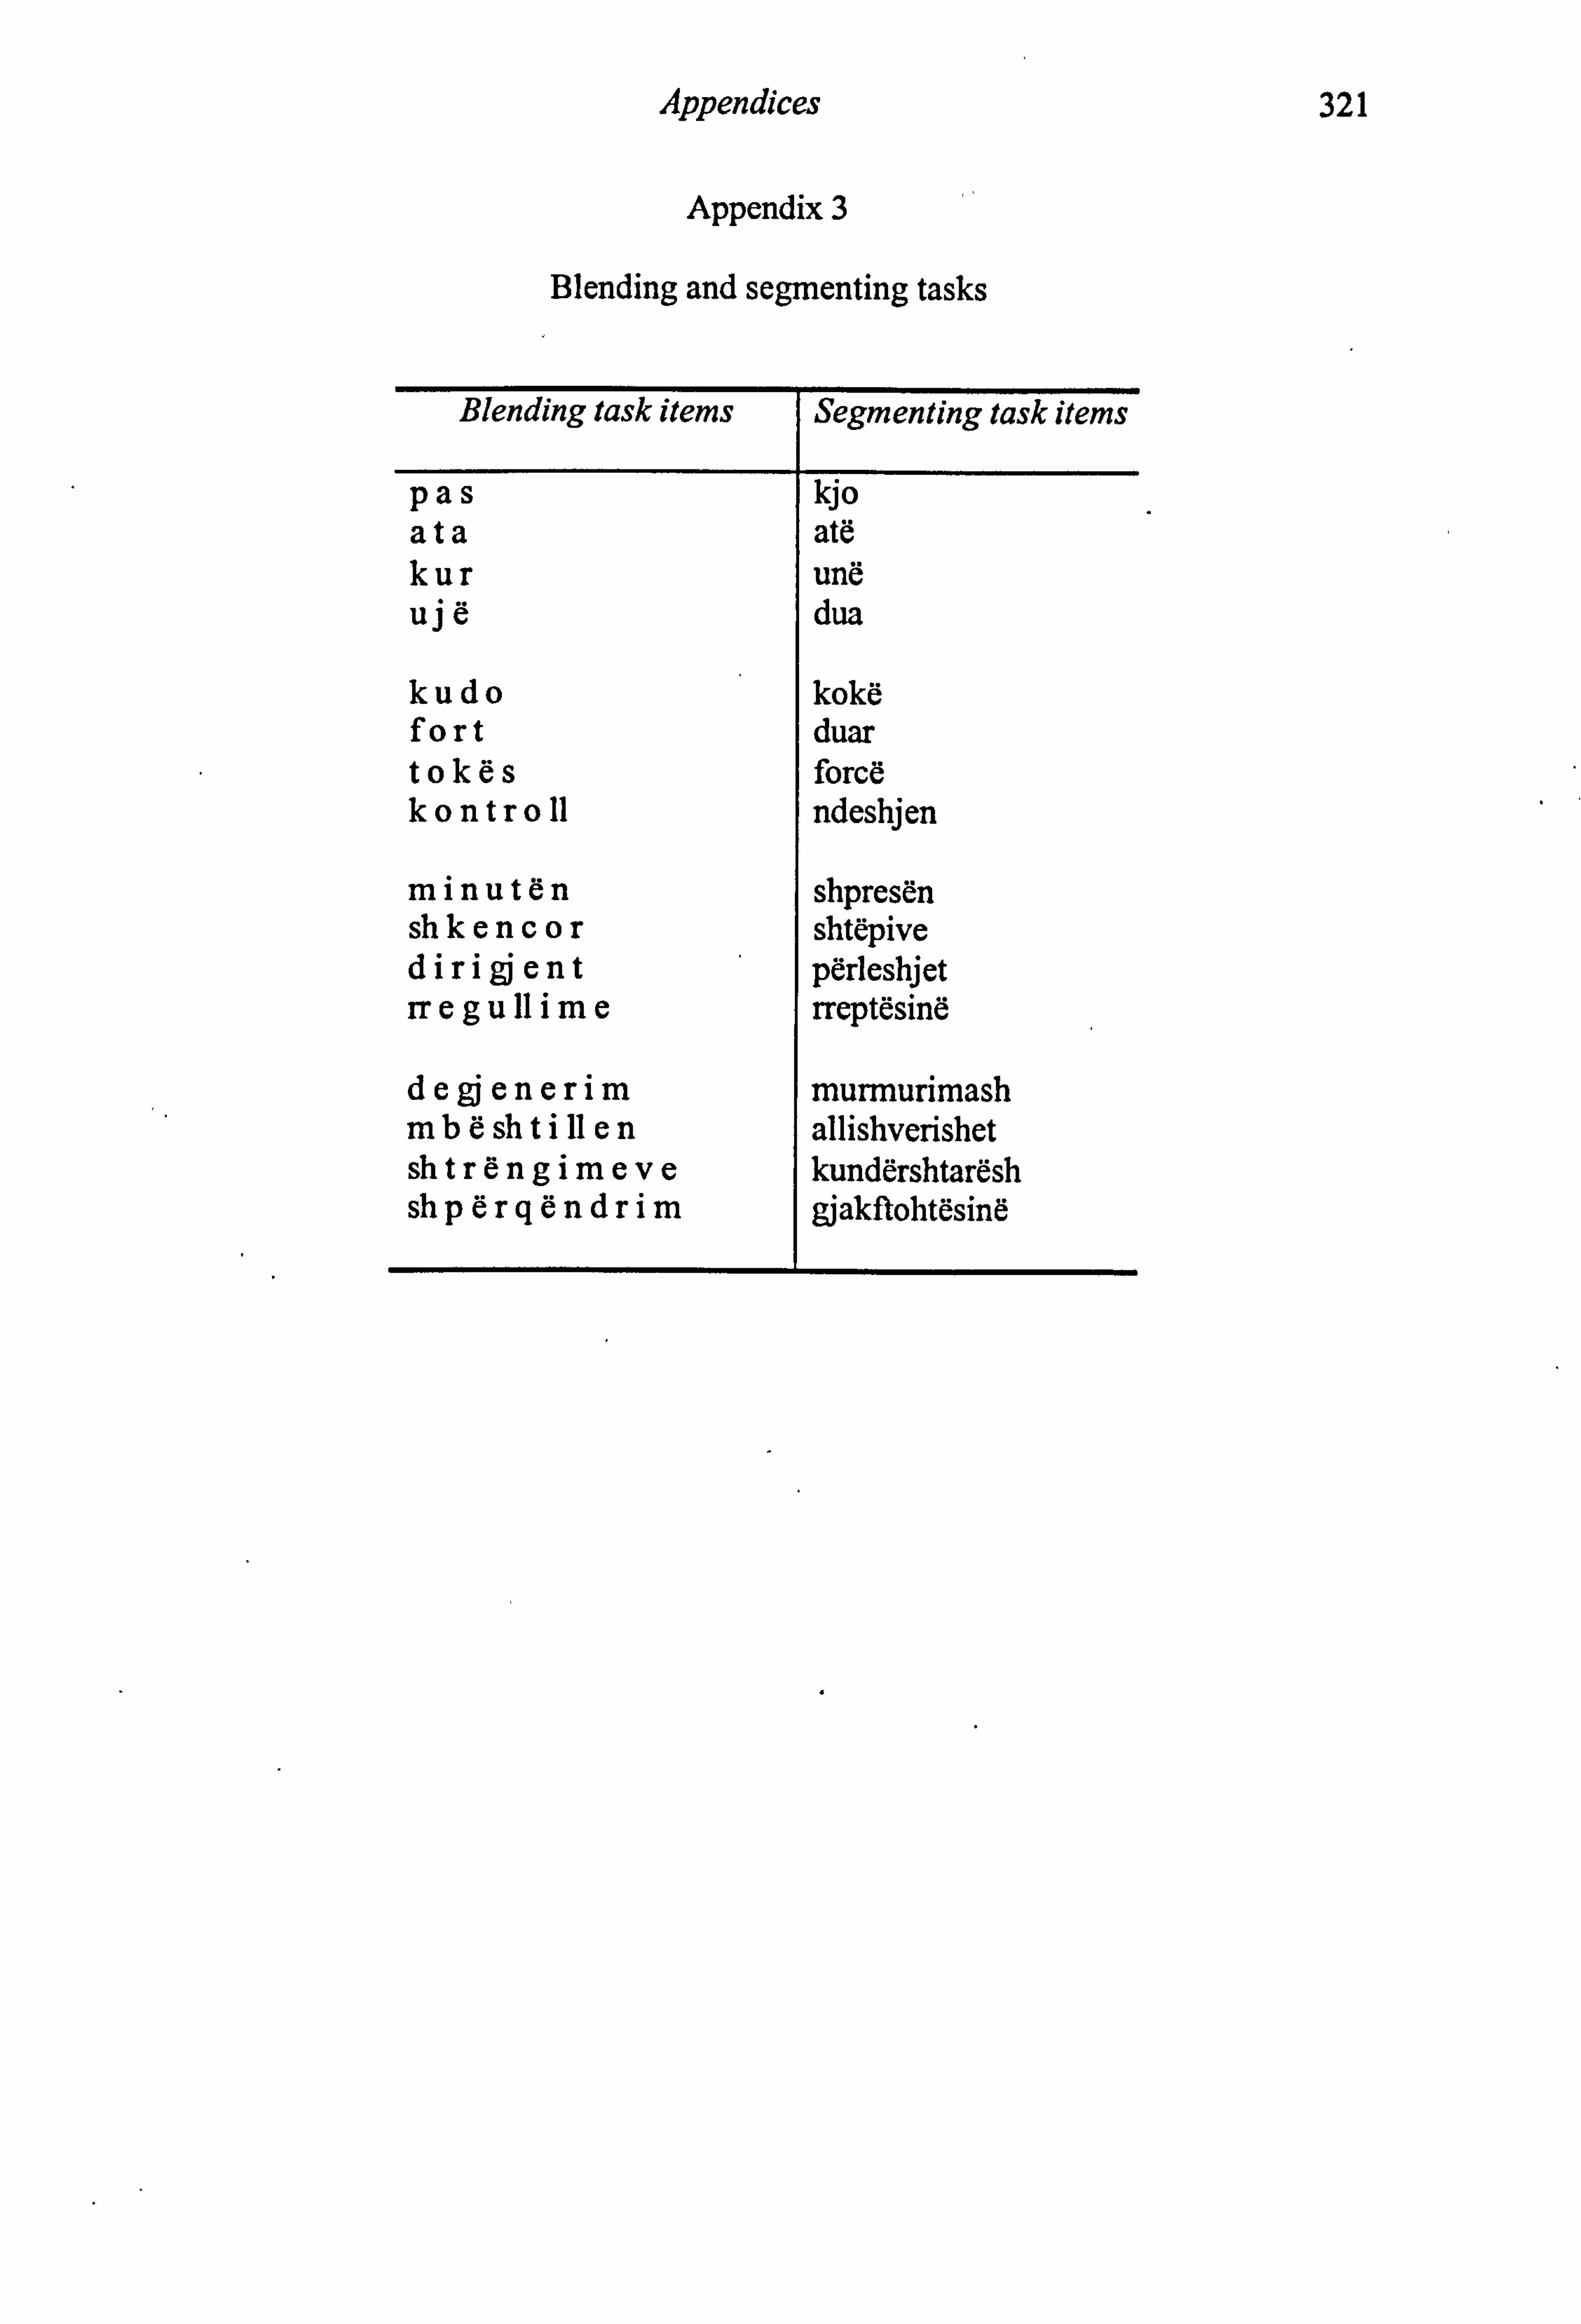
Appendices 321
Appendix 3
Blending and segmenting tasks
Blending task items I Segmenting task items
pas kjo ata ate kur und uje dua
kudo koke fort duar tokes force kontro 11 ndeshjen
minuten shpresen sh kencor shtepive dirigjent perieshjet rr egu 11 ime rreptesine
de gj enerim murmurimash mbe sh ti 11 en allishverishet sh trengimeve kundershtaresh sh p6rgendrim gjakftohtesine

Appendices 322
Appendix 4
Orthographic Awareness Task
stal mtal
mink mind
sast sasf
fleb dleb
kbad mbad bitt bilm
cfav cfav liks likv
gnen gen bent bemt
skep spep
paft path
parg rapg
zakm zakt Ibom blom
zken zben
xnel nxel

Digits
47 92 79 21 12 94 49 71 17 24
Appendices
Appendix 5
Rapid Naming Tasks (Pilot Study)
9 4 7 9 7 2 1 4 2 9
27 79 12 41 29 71 94 79 41 17
323

Letter Naming
ES AT SA TP PT AE EA' SP PS TE
Appendices
A E S A S T P E T A
TS SA PT EP TA SP AE SA EP PS
324

Colour naming
a'
ý
Appendices
a-
25
8
ff
a.
a
ý(` tt s`
I

Appendices 326
Object naming
rýý!
ý,
l

Appendices 327
Appendix 6 BPVS-II in Albanian
Administrimi I Ushtrimit 1 Fillo duke i pergatitur pjesemarresit me faqet A, B, C. dhe D. 4. Perdor Grupin bazor me to ulet per to Ilogaritur rezultatin perfundimtar.
2. Kur Sllon nje grup tjalesh perdorite gjitha fjalet S. Grupi me to larte vendoset kur tete ose me shume gabime behen ne emertim. 3. Grupf bazor vendoset kur asnje gabim auk eshte bere ne emertimin e figurave. 6. Perdor Grupin me to larte per to Ilogaritur rezultatin perflmdimtar.
Gr. I Fillo me moshat 2.5.3 Pergjigjia
1 1 0 2 2 0 3 2 0 4 4 0 5 4 0 6 3 0
7 4 0 g 1 0
9 3 0 10 2 0 11 1 0 12 3 0
Numuri i gabimeve
Gr. 4 Fillo me moshat 8-9 Pergjigjfa
37 dajre 1 0 38 kwshtjellw 2 0 39 dry 4 0 40 teleskop 3 0 41 pikon 2 0 42 gjigante 3 0 43 me push 4 0 44 vrimw hunde 1 0 45 46
rrwnjw penme
1 3
0 0
47 zhytje 2 0 48 lwng 4 0
Numuri i itabimeve Gr. 7 Fillo me moshat 12 Pergjigjia
73 mirwpritje 4 0
74 bri degw 1 0 75 orbitw 1 0 76 pwrplasje 1 0 77 ßyrw 4 0 78 duartrokitur 3 0
79 ushquese 3 0
80 pershtatet 2 0
81 mbikatkw 2 0 82 zvarranik 2 0
83 rnnglallje 3 0 84 lidh 4 0
Numuri i gabimeve
Gr. 10 Pergjigjia
109 2 0
I10 4 0 III 1 0 112 4 0 113 3 0 114 3 0 115 3 0 116 1 0 117 2 0 118 1 0 119 2 0 120 4 0
Numuri i gabimeve
Gr. 2 Fillo me moshat 4-5 Pergjigjia
13 2 0 14 I 0 15 4 0 16 2 0 17 2 0 18 4 0 19 4 0 20 1 0 21 3 0 22 3 0 23 3 0 24 1 0
Numuri i gabimeve
Gr. S Fillo me moshat 10 Pergjigjla
49 bagazh 3 0 50 dentist 3 0 51 nuselalw 2 0 52 twrhegje 1 0 53 koshere I 0 54 e gwzuar 4 0 55 glob 3 0 56 iinatosur 4 0 57 mocal 1 0 58 kamarjer 2 0 59 tablw e qitjes 2 0 60 shqiponjw 4 0
Numuri i gabimeve
Gr. 8 Fillo me moshat 13-15 PergJlepa
85 2 0 86 2 0
87 3 0 88 1 0 89 2 0 90 3 0 91 1 0 92 3 0 93 4 0 94 4 0
95 1 0 96 4 0
Numuri i gabimeve
Gr. 11 Pergjigjia
121 1 0 122 2 0 123 2 0 124 3 0 125 4 0 126 1 0 127 1 0 128 2 0 129 3 0
130 4 0 131 4 0 132 3 0
Numuri i gabimeve
Gr. 3 Fillo me moahat 6-7 Pergjlgjla
25 Paketim 4 0 26 Fruta 1 0 27 Nuhat 3 0 28 Shigjete 1 0 29 MCaues 2 0 30 Plot 3 0 31 Arri 4 0 32 Uchtrim fizik 4 0 33 Monedh8 2 0 34 Kthetra 1 0 35 Mat 2 0 36 QCrim 3 0
Numuri f abimeve
Gr. 6 Fillo me mochat 11 Perg)Igjia
61 palw 2 0 62 vjen 4 0
63 64
gypor interviston
2 l
0 0
65 hungwrim 1 0 66 ilac 4 0 67 bishtajw 1 0 68 drith 4 0 69 pedals' 3 0 70 grabitqar 2 0 71 ballkon 3 0 72 ndot 3 0
Numeri i gabimeve
Gr. 9 Fillo me moshat 16-21 Pergjlgjla
97 4 0 98 3 0 99 2 0
100 4 0
101 3 0 102 2 0 103 4 0
104 3 0
105 I a 106 2 0 107 1 0 108 1 0
Numuri 1 gabimeve
Gr. 12 Pergjlgjia
133 1 0 134 4 0 135 2 0 136 1 0 137 3 0 138 3 0 139 4 0
140 3 0 141 1 0 142 2 0 143 4 0 144 2 0
Numuri i gabimeve
Llogaritja e rrezultatit perfundimtar:
Numuri i fundit i Grupit me to lane
minus gabimet
rrezuitati perfundimtar:
Shenime mbi nxenesin:

Appendices
Appcndlx 7
Coloured Progressive Matrices answer slicet.
Emri:
Al 1 2 3 4 5 6 A2 1 2 3 4 5 6 A3 1 2 3 4 5 (0 A4 1 2 3 4 5 6 A5 1 2 3 4 5 6 A6 1 2 3 4 5 6 A7 1 2 3 4 5 6 A8 1 2 3 4 5 6 A9 1 2 3 4 5 6 A10 1 2 3 4 5 6 A11 1 2 3 4 5 6 A12 1 2 3 4 5 6
1 2 3 4 5 6 AB1 1 2 3 4 5 6 AB2 1 2 3 4 5 6 AB3 1 2 3 4 5 6 AB4 1 2 3 4 5 6 AB5 1 2 3 4 5 6 AB6 1 2 3 4 5 6 AB7 1 2 3 4 5 6 AB8 1 2 3 4 5 6 AB9 1 2 3 4 5 6 AB10 1 2 3 4 5 6 AB11 1 2 3 4 5 6 AB12 1 2 3 4 5 6
1 2 3 4 5 6 B1 1 2 3 4 5 6 B2 1 2 3 4 5 6 B3 1 2 3 4 5 6 B4 1 2 3 4 5 6 B5 1 2 3 4 5 6 B6 1 2 3 4 5 6 B7 1 2 3 4 5 6 B8 1 2 3 4 5 6 B9 1 2 3 4 5 6 B10 1 2 3 4 5 6 B11 1 2 3 4 5 6 B12 1 2 3 4 5 6
328

Appendices
Appendix 8
Generic Speed
A B
329
1+1 = 2-1 = 2+1 = 3-2 = 3+0 = 4-2 = 4+1= 3-0= 2+3 = 5-2 =
7+2 = 8-3 = 3+5 = 6-0 = 0+7 = 9-2 = 2+5 = 7-5 = 4+3 = 8-6 =
6+3 = 7-4 = 4+3= 8-7= 8+1 = 7-6 = 1+6 = 8-3 = 5+2 = 6-5 =
1+7 = 9-6 = 4+5= 5-1= 6+2 = 6-3 = 0+9= 4-1= 2+4 = 7-4 =
2+2 = 9-0 = 3+1 = 8-2 = 1+0 = 7-3 = 3+3 = 1-1 = 0+2= 9-1=

Appendices
Appendix 9 Computerised reading test-Albanian main study (Reading 100)
330
N. Words Rank Freq/million LoglOFre Length N. Words Rank Fre million LoglOFreq Length 1 ate 46 1973 3.30 3 51 banesen 2115 44 1.64 7 2 berg 54 1757 3.24 4 52 burrat 2294 41 1.61 6
3 mos 56 1680 3.23 3 53 shdrbimin 2464 38 1.58 9
4 mbi 59 1467 3.17 3 54 kompanisd 2677 35 1.54 9
5 keshtu 66 1328 3.12 6 55 pakta 2915 32 1.51 5
6 to 70 1258 3.10 2 56 lagjes 3112 30 1.48 6 7 mire 77 1177 3.07 4 57 amerikandt 3335 28 1.45 10
8 duhet 81 1119 3.05 5 58 dell 3585 26 1.41 4 9 kishin 88 1047 3.02 6 59 bere 3829 24 1.38 4
10 vetd 92 930 2.97 4 60 arrihet 4126 22 1.34 7 11 asnj5 97 869 2.94 5 61 deshmitaret 4506 20 1.30 11
12 ashtu 101 832 2.92 5 62 shdndetdsia 4697 19 1.28 11
13 policise 107 778 2.89 8 63 sigurojnd 5152 17 1.23 9 14 pjes5 114 719 2.86 5 64 ekzistuese 5421 16 1.20 10
15 ose 118 687 2.84 3 65 ke etas 5733 15 1.18 11
16 ndaj 132 637 2.80 4 66 tregua 6091 14 1.15 6
17 fund 143 578 2.76 4 67 shkelin 6509 13 1.11 7
18 di a 149 544 2.74 5 68 valdn 6963 12 1.08 5
19 Sig 158 509 2.71 3 69 bankö 7464 11 1.04 5
20 njerl 171 469 2.67 5 70 liderit 8021 10 1.00 7
21 asgje 190 437 2.64 5 71 me ull 8724 9 0.95 7 22 gjera 207 389 2.59 5 72 studion 8731 9 0.95 7 23 politike 218 367 2.56 8 73 theiluar 9602 8 0.90 8
24 vendin 233 344 2.54 6 74 fik 10567 7 0.85 3
25 keni 255 318 2.50 4 75 antikomuniste 10568 7 0.85 13
26 fare 274 299 2.48 4 , 76 thesin 11814 6 0.78 6
27 gind 297 274 2.44 4 77 shumtet 11818 6 0.78 7
28 treguar 315 255 2.41 7 78 premtimeve 13364 5 0.70 10
29 veq 335 236 2.37 3 79 padrejta 13370 5 0.70 8
30 'en! 374 220 2.34 4 80 braziliane 15544 4 0.60 10
31 ca 405 204 2.31 2 81 lundrimin 15547 4 0.60 9
32 plot 430 187 2.27 4 82 viq 16467 4 0.60 3
33 koha 462 175 2.24 4 83 rivalitet 18483 3 0.48 9
34 grupi 505 161 2.21 5 84 avarive 18496 3 0.48 7 35 ngritur 546 150 2.18 7 85 profane 18497 3 0.48 7
36 kulturds 603 139 2.14 8 86 gishterinjt5 18656 3 0.48 12
37 gjashtd 655 129 2.11 7 87 milleniumit 23014 2 0.30 11
38 mendjen 720 120 2.08 7 88 adhuruesit 23019 2 0.30 10
39 vetes 791 111 2.05 5 89 reformatore 23025 2 0.30 11
40 takimin 852 103 2.01 7 90 spikeda 23029 2 0.30 8
41 jashtem 939 95 1.98 7 91 vatrds 23113 2 0.30 6
42 rritur 1009 88 1.94 6 92 im erialiste 31699 1 0.00 12
43 merren 1089 82 1.91 6 93 adaptimin 31707 1 0.00 9
44 thoni 1193 76 1.88 5 94 gargafet 31718 1 0.00 8
45 drejtorit , 1282 70 1.85 9 95 if vdoni 31720 1 0.00 7
46 heret 1391 65 1.81 5 96 tremujorit 31726 1 0.00 10
47 shtetin 1506 60 1.78 7 97 vujatur 32629 1 0.00 7
48 vdshtirdsi 1632 56 1.75 10 98 noteri 33981 1 0.00 6
49 munduar 1766 52 1.72 7 99 efikasitet 34517 1 0.00 10
50 an5s 1925 48 1.68 4 100 goma 43016 1 0.00 4

Appendices
Appendix 10
OMRT word items in Albanian, English and Welsh Albanian English Welsh
I. ate one pob 2 mos only mal 3 keshtu even ein 4 mire were daeth 5 kishin back cyfer 6 asnjd also math 7 policisd going gwir 8 ose I'm pawb 9 fund against dy
10 Sig year ceisio 11 asgjd child ohonynt 12 politike party dosbarth 13 keni lot sefyllfa 14 qind car cymorth 15 veg business perthynas 16 ca coming arwain 17 koha paper pymtheg 18 ngritur present tystiolaeth 19 gjasht5 find byddwch 20 vetes play uniongyrchol 21 jashtdm relationship ninnau 22 merren wide esbonio 23 drejtorit rain gyrrwr 24 shtetin appropriate hogiau 25 munduar plenty dyled 26 banesf n asks brown 27 shdrbimin Roman ysbrydion 28 pakta photographs gemau 29 amerikandt medieval gweddw 30 bere risks hunaniaeth 31 ddshmitardt objectives cychod 32 sigurojnö disarmament Mamau 33 kryeqytetas partners troedfeddi 34 shkelin prosperity pelydrau 35 bankd mornings arbenigo 36 mjegull today copaon 37 thelluar racing ffigyrau 38 antikomuniste disgrace coediog 39 shumtet outbreak postyn 40 padrejta medicines amherffaith 41 lundrimin click gweinyddiad 42 rivalitet identities gwirfoddolodd 43 profane squinting dianaf 44 milleniumit shrimps harmoni 45 reformatore fermentation cynffonnau 46 vatrds mortuary newynu 47 adaptimin docility difesur 48 Idvdoni omitted clinig 49 vujatur cots geirda 50 efikasitet baptized calliodd
331

Appendices
Appendix 11 Spelling test-Albanian main study (Spelling 100)
332
N. Words Rank Fre million LoglOFre Length N. Words Rank Fre /million LoglOFreq Length
1 ju 47 1972 3.29 2 51 njLrit 2116 44 1.64 6
2 ku 53 1807 3.26 2 52 specialistdve 2295 41 1.61 13
3 saj 57 1563 3.19 3 53 rlamentit 2462 38 1.58 11
4 tjeter 61 1397 3.15 6 54 ngritjen 2676 35 1.54 8
5 ti 63 1385 3.14 2 55 vullnetit 2918 32 1.51 9
6 herd 68 1305 3.12 4 56 dikujt 3111 30 1.48 6
7 tan! 72 1234 3.09 4 57 ndnvlzoi 3336 28 1.45 8
8 ato 80 1131 3.05 3 58 ngrihej 3569 26 1.41 7
9 ditd 87 1064 3.03 4 59 studimit 3831 24 1.38 8 10 jete 91 931 2.97 4 60 prodhimit 4125 22 1.34 9
11 kam 96 876 2.94 3 61 gdllol 4630 20 1.30 6
12 ateherd 102 818 2.91 7 62 kontakt 4698 19 1.28 7
13 atyre 105 799 2.90 5 63 ndanö 5154 17 1.23 5
14 a 111 731 2.86 1 64 mesazhi 5420 16 1.20 7
15 tepdr 120 680 2.83 5 65 'md 5730 15 1.18 7
16 vend 134 628 2.80 4 66 pörkohesisht 6079 14 1.15 12
17 mdnyrd 146 562 2.75 6 67 guxonte 6510 13 1.11 7
18 tek 151 533 2.73 3 68 vlerdsimit 6965 12 1.08 10
19 duket 161 500 2.70 5 69 shpinds 7453 11 1.04 7
20 mua 172 469 2.67 3 70 gjeografik 8129 10 1.00 10
21 shgipdri 191 436 2.64 8 71 minoritetit 8728 9 0.95 11
22 0 205 401 2.60 1 72 perbdrje 8729 9 0.95 8 23 miliond 220 363 2.56 7 73 afron 9605 8 0.90 5
24 nd&r 232 345 2.54 4 74 rindjet 10561 7 0.85 8
25 erdhi 256 318 2.50 5 75 avokatin 10594 7 0.85 8
26 shkurt 272 299 2.48 6 76 rrdzohej 11813 6 0.78 8
27 thane 298 274 2.44 5 77 reagime 11815 6 0.78 7
28 akoma 314 256 2.41 5 78 lehtdsuese 13365 5 0.70 10 29 bd 337 236 2.37 2 79 kurs 13479 5 0.70 4
30 doli 390 211 2.32 4 80 klani 15540 4 0.60 5
31 shgipdria 406 204 2.31 9 81 kufizime 15545 4 0.60 8
32 fjala 431 186 2.27 5 82 dush 15900 4 0.60 4
33 pese 463 175 2.24 4 83 mirdnjohjeje 18485 3 0.48 12
34 krijuar 502 162 2.21 7 84 paskan 18488 3 0.48 6 35 dhjetd 547 150 2.18 6 85 tabeldn 18623 3 0.48 7
36 rd 604 138 2.14 2 86 tiro d 18625 3 0.48 6
37 ndodhet 657 129 2.11 7 87 nishan 23015 2 0.30 6
38 s'ishte 723 119 2.08 7 88 binjakezim 23021 2 0.30 10
39 zyrtare 788 111 2.05 7 89 eliminohej 23028 2 0.30 10
40 pasha 854 103 2.01 5 90 pushtuesve 23031 2 0.30 10 41 prokurori 938 95 1.98 9 91 quash 26525 2 0.30 5
42 dera 1010 88 1.94 4 92 marrdhenie 31703 1 0.00 10
43 paster 1097 82 1.91 6 93 botanikdn 31714 1 0.00 9 44 fytyra 1192 76 1.88 6 94 persddrejti 31715 1 0.00 11
45 opozita 1283 70 1.85 7 95 pies 31722 1 0.00 5
46 dakord 1393 65 1.81 6 96 tratativd 31806 1 0.00 9
47 pesuar 1505 60 1.78 6 97 gjdmime 32565 1 0.00 7
48 prerntuar 1631 56 1.75 premtuar 98 mbedhja 33318 1 0.00 7 49 fshatrat 1772 52 1.72 fshatrat 99 bojkotojnL 35079 1 0.00 10
50 projektet 1927 48 1.68 projektet 100 bujk 47986 1 0.00 4
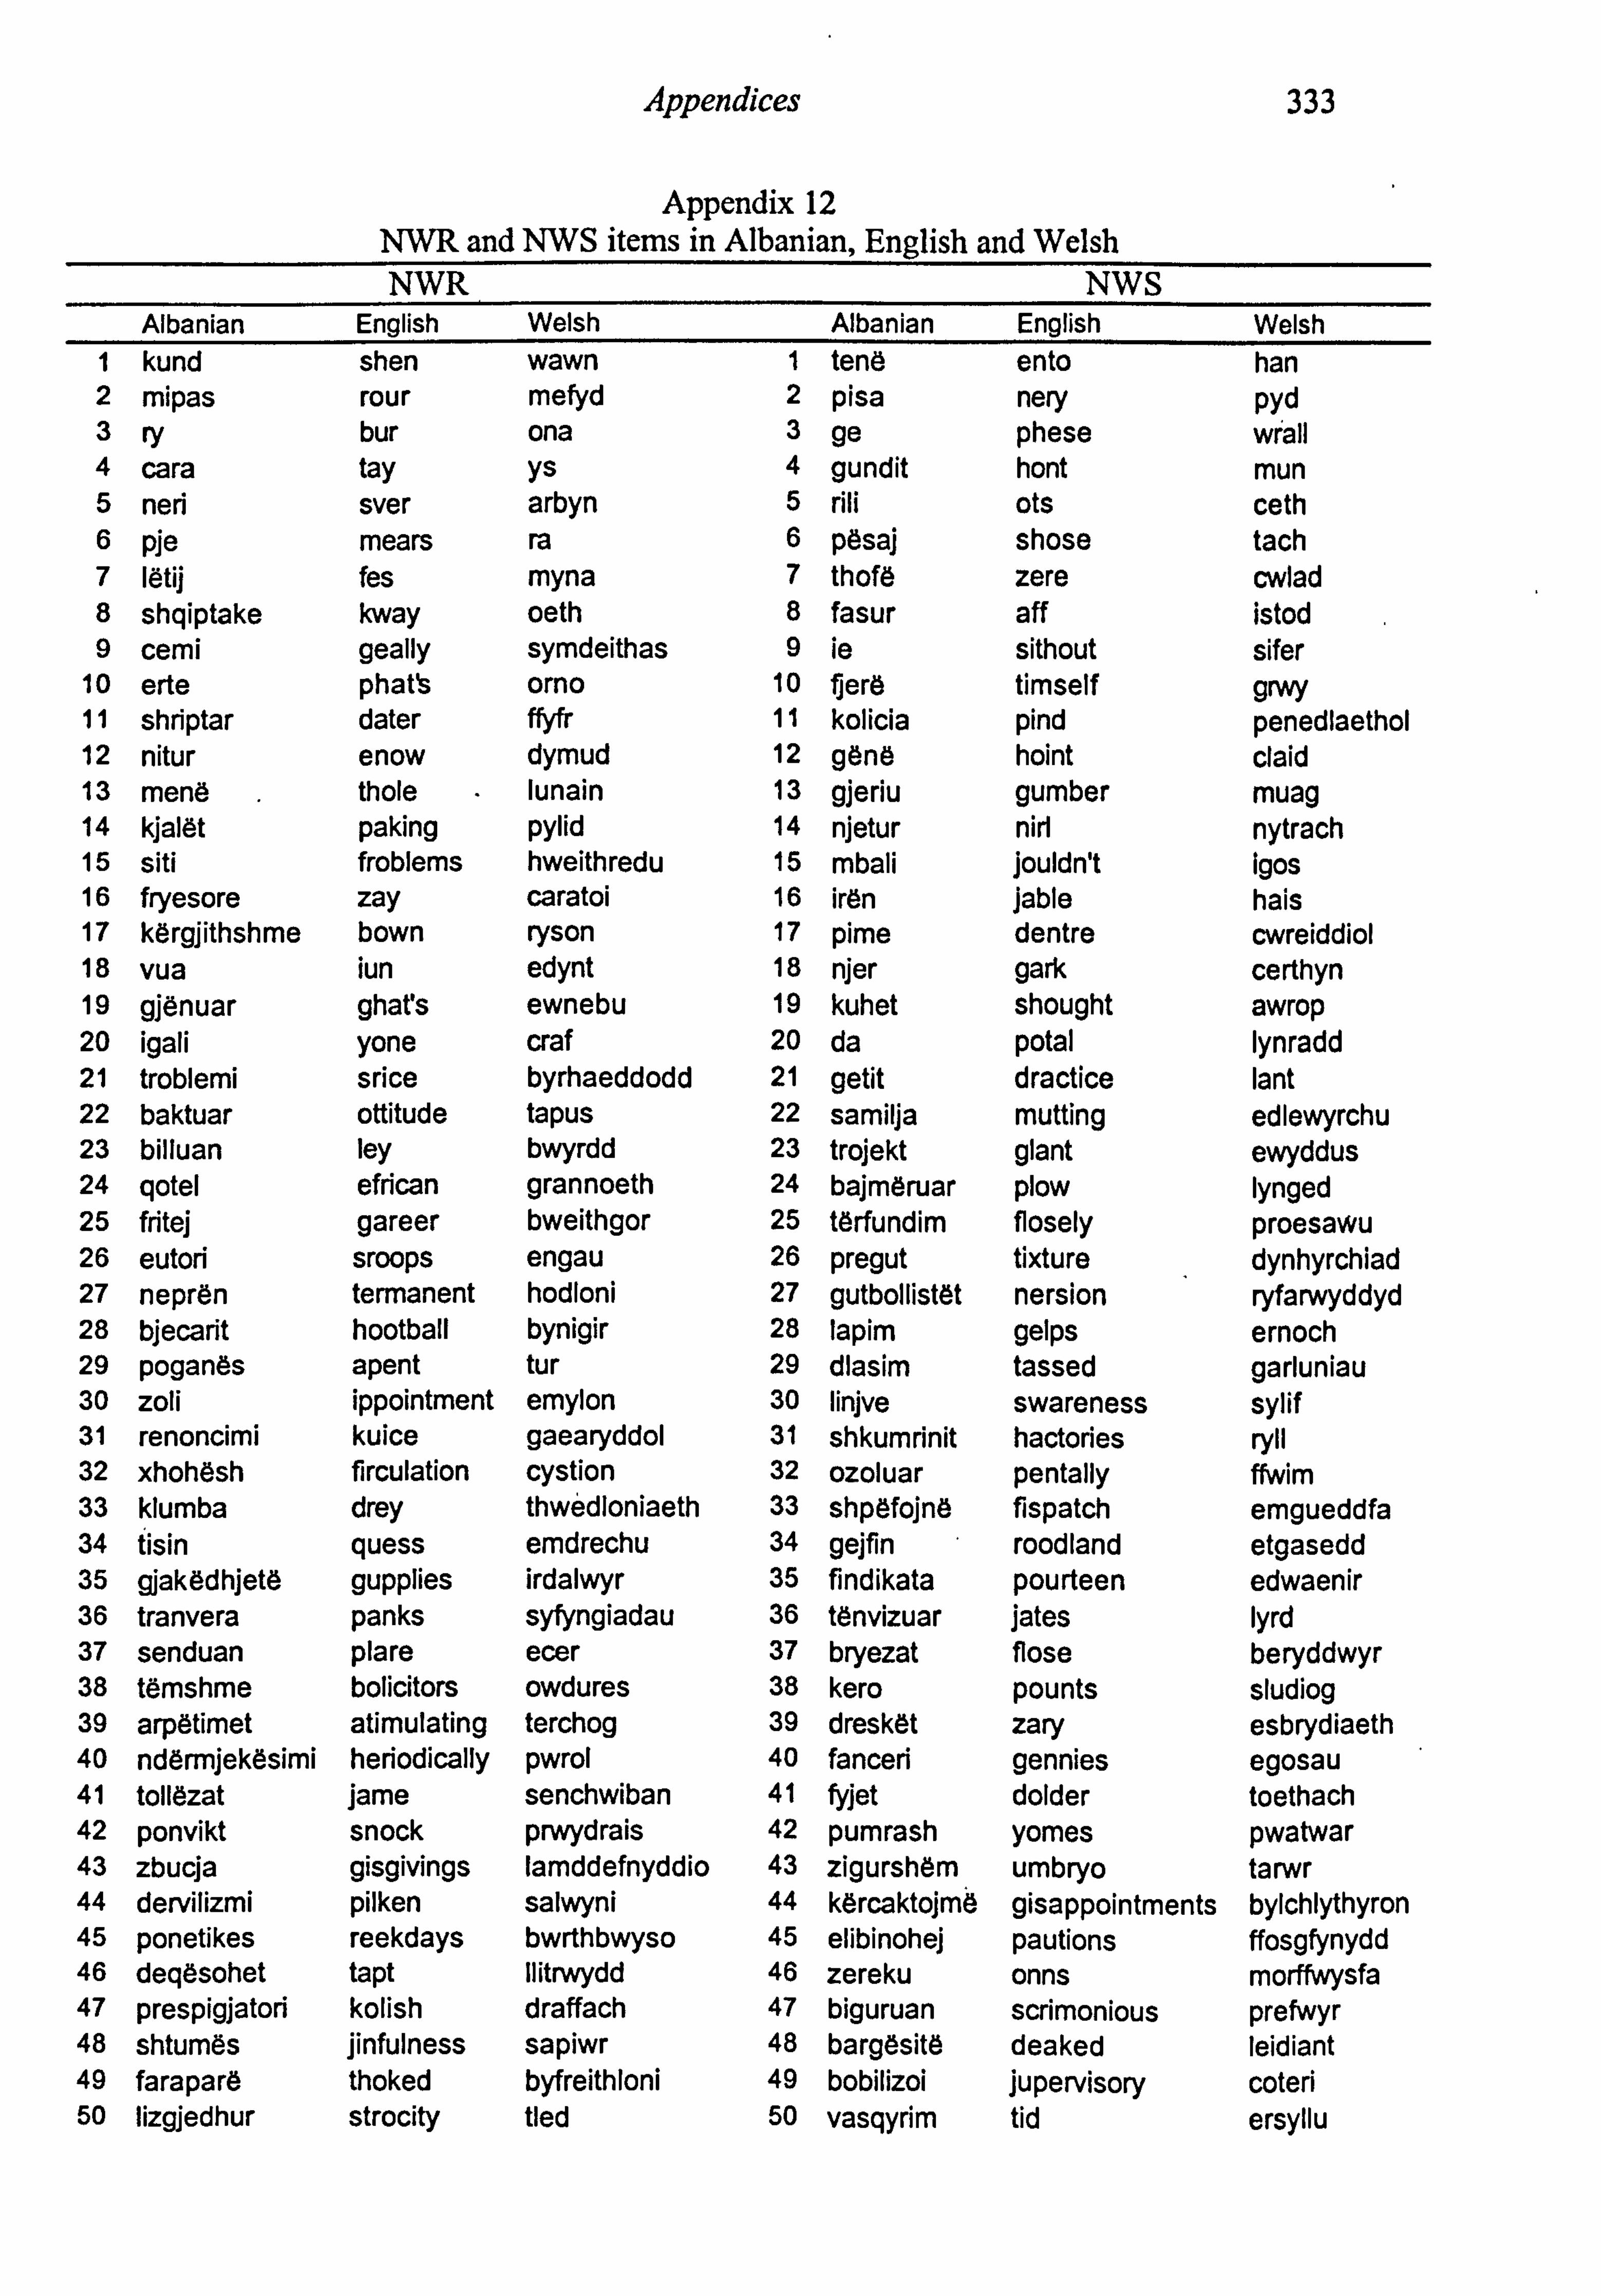
Appendices 333
Appendix 12 NWR and NWS items in Albanian, English and Welsh NWR NWS
Albanian English Welsh Albanian English Welsh 1 kund shen wawn I tend ento han 2 mipas rour mefyd 2 pisa nery pyd 3 ry bur ona 3 ge phese wrall 4 cara tay ys 4 gundit hont mun 5 nevi sver arbyn 5 rill ots ceth 6 pje mears ra 6 pesaj shose tach 7 Ietij fes myna 7 thof6 zere cwlad 8 shqiptake kway oeth 8 fasur aff istod 9 cemi geally symdeithas 9 le sithout sifer
10 erte phat's orno 10 fjer6 timself grwy 11 shriptar dater ffyfr 11 kolicia pind penedlaethol 12 nitur enow dymud 12 gene hoint claid 13 meng thole lunain 13 gjeriu gumber muag 14 kjalet paking pylid 14 njetur nirl nytrach 15 siti froblems hweithredu 15 mbali jouldn't igos 16 fryesore zay caratoi 16 iren jable hais 17 kergjithshme bown ryson 17 pime dentre cwreiddiol 18 vua iun edynt 18 njer gark certhyn 19 gjenuar ghat's ewnebu 19 kuhet shought awrop 20 igali yone craf 20 da potal lynradd 21 troblemi srice byrhaeddodd 21 getit dractice lant 22 baktuar ottitude tapus 22 samilja mutting edlewyrchu 23 billuan ley bwyrdd 23 trojekt giant ewyddus 24 qotel efrican grannoeth 24 bajmdruar plow lynged 25 fritej gareer bweithgor 25 terfundim flosely proesawu 26 eutori sroops engau 26 pregut fixture dynhyrchiad 27 neprt n termanent hodloni 27 gutbollistet nersion ryfarwyddyd 28 bjecarit hootball bynigir 28 lapim gelps ernoch 29 poganes apent tur 29 dlasim tassed garluniau 30 zoli ippointment emylon 30 linjve swareness sylif 31 renoncimi kuice gaearyddol 31 shkumrinit hactories ryll 32 xhohesh firculation cystion 32 ozoluar pentally ffwim 33 klumba drey thwedloniaeth 33 shpefojne fispatch emgueddfa 34 tisin quess emdrechu 34 gejfin roodland etgasedd 35 gjakddhjet6 gupplies irdalwyr 35 findikata pourteen edwaenir 36 tranvera panks syfyngiadau 36 tenvizuar jates lyrd 37 senduan plare ecer 37 bryezat flose beryddwyr 38 tdmshme bolicitors owdures 38 kero pounts sludiog 39 arp6timet atimulating terchog 39 dresket zary esbrydiaeth 40 ndermjekesimi heriodically pwrol 40 fanceri gennies egosau 41 tollezat jame senchwiban 41 fyjet dolder toethach 42 ponvikt snock prwydrais 42 pumrash yomes pwatwar 43 zbucja gisgivings lamddefnyddio 43 zigurshem umbryo tarwr 44 dervilizmi pilken salwyni 44 kercaktojm6 gisappointments bylchlythyron 45 ponetikes reekdays bwrthbwyso 45 elibinohej pautions ffosgfynydd 46 degesohet tapt Ilitrwydd 46 zereku onns morffwysfa 47 prespigjatori kolish draffach 47 biguruan scrimonious prefwyr 48 shtumes jinfulness sapiwr 48 bargdsit6 deaked leidiant 49 farapard thoked byfreithloni 49 bobilizoi jupervisory coteri 50 lizgjedhur strocity tied 50 vasgyrim tid ersyllu

Appendices
Appendix 13
CPM Answer Sheet: Main study
13-4
Al AB1 B1
A2 AB 2 B 2---
A3 AB3 B3
A4 AB4 B4
A5 AB5 B5
A6 AB6 B6
A7 AB 7 B7 --------- -
A8 AB8 B8
A9 AB9 B9
A10 AB 10 B10
A11 AB11 B11
A12 AB12 B12 ---

Appendices
Appendix 14
Rapid naming tasks: Main study
Letters
E T S A
S E. T P
A S A T
S P E P
T A P E
P T A A
T S P S
P E S T
E A E S
APTE
P
A
P
T
S
E
A
T
E
S
335

Digits
Appendices
2 3 1 5 8
1 2 3 8 5
5 1 5 3 8
1 8 2 8 3
3 5 8 2 1
8 3 5 5 2
3 1 8 1 5
8 2 1 3 3
2 5 2 1 2
5 8 3 2 1
336'

Appendices 337
Nun
nj e
tre
pese
tete
dy
pese
nj e
tre
dy
tete
terals: Albanian
pese
dy
nj e
tete
tre
dy
pese
tete
tre
nj e
dy pese tre
pese nje pese
nj e tre dy
tre dy nj e
tete pese tete
nj e tete pese
tre tre dy
dy tete nj e
tete nj e tete
pese dy tre

Appendices 338
Numerals: English
one five two five three
three two five one five
five one one three two
eight eight three two one
two three eight five eight
five two one eight five
one five three three two
three eight two eight one
two three eight one eight
eight one five two three

Appendices 339
Numerals Welsh
un pump dau pump tri
tri dau pump un pump
pump un un tri dau
wyth wyth tri dau un
dau tri wyth pump, wyth
pump dau un wyth pump
un pump tri tri dau
tri wyth dau wyth un
dau tri wyth un wyth
wyth un pump dau tri

Object naming: Albanian
ie T
rý! 144
A
rt _. ß
Appendices
9
AP 1
r!
rte
ýw
rý
9 r ý!
k
9
340
04

Appendices
Object naming: English and Welsh
341
a ä.
,
as
(If-'opt
aä j
ää ```ý//ýý
. ýýý
`
ýe ä
ýýý ýý ýý
}` ý_L ff.
yam;
,äh
ýý
ý `ý
ýý! '
ý_
1ý
'ý
, ý^ aa
ýý",, .
rT ,
~ý `)
ýý
ýý, iý 1
,,,,. 1ýký ~ ýýt-J
._
ty }"' aa

Appendices 342
Word Picture naming: Albanian
top zog qen ore peme
qen top zog peme ore
or" qen ore zog peme
qen peme top p em e"', zog
zog ore peme top qen
peme zog ore ore top
zog qen peme qen ore
peme top qen zog zog
top ore top qen top
ore peme zog top qen

Appendices 343
Word Picture naming: English
ball boat
cat ball
man
cat
boat
hat
boat
hat
ball
man
cat
hat
man
boat
cat
ball
man
hat
cat man hat
boat hat man
man boat hat
ball hat boat
hat ball cat
man man ball
hat cat man
cat boat boat
ball cat ball
boat ball cat

Appendices 344
Word Picture naming: Welsh
cwch dyn het cath pel
het cwch dyn pel cäth
cath het cath dyn pel
het pel cwch pel dyn
dyn cath pel cwch het
pel dyn cath path cwch
dyn het pel het cath
pel cwch het dyn dyn
cwch cath cwch het cwch
cath pel dyn cwch het

Appendices
Colour naming: Albanian
4i
0
QQ 00
0m
[71
___H

Appendices 346
Colour naming: English and Welsh
0
QQ 0
0
0
[: 1 101: 1 1: 1
[: 1 [: 1 El 00
El 001: 1 El
0 El [: 1 [: 1

Appendices 347
Word colour naming: Albanian
blu i kuq gri i kuq i zi
i zi gri i kuq blu i kuq
i kuq i verdhe blu i zi gri
i verdhe blu i zi gri blu
gri i zi i verdhe i kuq i verdhe
i kuq gri blu i verdhe i kuq
blu i kuq i zi i zi gri
i zi i verdhe gri i verdhe blu
gri i zi i verdhe blu i verdhe
i verdhe blu i kuq gri i zi

Appendices 348
Word colour naming: English
blue red orange red black
black orange red blue red
red blue blue black orange
yellow yellow black orange blue
orange black yellow red yellow
red orange blue yellow red
blue red black black orange
black yellow orange yellow blue
orange black yellow blue yellow
yellow blue red orange black

Appendices 349
Word colour naming: Welsh
oren melyn coch melyn glas
glas coch melyn oren melyn
melyn oren oren glas coch
du du glas coch oren
coch glas du melyn du
melyn coch oren du melyn
oren melyn glas glas coch
glas du coch du oren
coch glas du oren du
du oren melyn coch glas

Appendices
Appendix 15 Phoneme Deletion tasks in Albanian, English and Welsh
Albanian
350
He 'a e tingulllit to are He 'a e tin lllit to fundit Ile 'a e tin lllit to mezit Word Answer YS Word Answer YQ Word Answer Y S2
1 Lo pd ope 11 Lexo' lexo 21 Test Tet 2 Kale ale 12 Vend Ven 22 Pikture Piture 3 Dora ora 13 Shoqen Shoqe 23 Stoa Soa 4 cati ati 14 Film Fil 24 Gjume Gjue 5 Rinor inor 15 Akull Aku 25 Shkemb Shemb 6 Princi rinci 16 Beton Beto 26 Kes htu Ketu 7 Varke arke 17 Shkop Shko 27 Cakto Cato 8 Shtepi tepi 18 Kovac Kova 28 Shtate Shate 9 Sekret ekret 19 Market Marke 29 Feste Fete 10 Drase rase 20 Shtyp Shty 30 Trafik Trafik
English Delete First Sound Delete Last Sound Delete Medial Sound Word Answe
r Y fl Word Answer Y
S2 Word Answer Y
f2 1 List ist 11 Flap Fla 21 Test Tet 2 Clip lip 12 Wind Win 22 Skin Sin 3 Pink ink 13 Green Gree 23 So Soa 4 Bread read 14 Film Fil 24 Sleep Seep 5 Minor inor 15 Scream Screa 25 Rabbit Rait 6 Prince rince 16 Crust Cn. is 26 Chunky Chuny 7 Salad alad 17 Trainer Traine 27 Temple Teple
8 Stamp tamp 18 Plant Plan 28 Story Stoy 9 Secret ecret 19 Basket Baske 29 Tar et Taret 10 Dragon ragon 20 Silent Silen 30 Traffic Traic
Welsh Dileu'r Swn Cyntaf Dileu'r Swn Olaf Dileu'r Swn Canol
Gair Ateb Y0 Gair Ateb Y S2 Gair Ateb Y C2
1 Punt unt 11 Olaf Ola 21 Lamp lap
2 Glaw law 12 Mynd myn 22 Pawb pwb 3 Pine inc 13 Braw bra 23 Soffa Soa
4 Braf raf 14 Ffilm ffil 24 Cloff Coff
5 Papur apur 15 Sgert sger 25 Nifer Nier
6 Draig raig 16 Gwynt gwyn 26 Crafu crau 7 Salad alad 17 Seren sere 27 hanner haer
8 Stamp tamp 18 Plant plan 28 Stori Stoi
9 Carchar archar 19 Basged basge 29 Targed Tared
10 Prysur rysur 20 Tenant tenan 30 Traffig Traig

Appendices
Appendix 16
Wordchains: Albanian
Shembull:
351
Rerekafeblu tingulidrushakadhelper mjelmebardhebaltd 3
raktekapsemace dhelodernjerezligen gengjxhamcizme 6
kermilllagradio merimangeshtepiduall vjeterkopeshtrosemjekör s
hafurcelaj bluzepasgyredollappaster Iopateshtratxhep 12

Appendices 352
toppunemolle gypqajdere kepucegjoksparkmish 3
Iimonbukedjathe fagerosevazo plazhgaderrrotedritare 6
farekampmakine trupfarmetasgafore 6mbdlrrushpul6 9
bebepirunmagjikblete kafshearrestol dhomdkafazzvarr6 12
Fundvalleec faredrejtegencopd shenj6rrushhallo 15
ngasbukefemijelag Iugedriteflluske gepepeshkldng 18
keterfrutegazdjale pastevijedrejte uluthyuejshko 21
kugedarkekrem delehakohe rekercevdllalojö 24
dyganrrugecaj sallatedoktorfurxhilule kovetulleshi 27
tavolinelilaverethike erretdrekestuhi shkundpostemiu 30
njefyellgytet pyetjeaksionliber hapgershifleteveri 33
ftohtenatelaj faqembyllhapfshat sprirancdkamionlaps 36
tetezjejmotor dytefjaletridhjet sahatmesueslumturkendoj 39
metermjegullbarzjarr tokeletershtat6 derrkokethonj 42

Appendices 353
dhjetedjegmuaj mbesejetelaj trasherrotulldhembmadh 45
mbremjemiserpiano shegerlartedrite kalifushekutimur '48
kygorebarishterrit pinguinbietren katrorqyrkdhimbje 51,
Iagpeseveture shkoppresnumerthelle gishtvarkdgime 54
ikagodasnateminute borakugmillion tigerthuapaster 57
kopjomavindjej gomeshtegtrafiknot Idmojluankemb6 60
trishtuarkaterlojesy ngrohteflamurmird mprehtdshurdherdy 63
gjumizog semurelakrorpuder IekurdujkkengerendÖ 66
pritetrashefytyre egerpallatthuakeq vajzogbryl 69
ngaskofshebishtfushe sapunndertoshkruaj ujddashurithate 72
vogelflokecekan eredyrrudhezemer xhuxhprekbalend 75
kazannatyrehunde vrridrejtojgjatekujdes anijeegerdelfin 78
gjirafebarkgesh verberlarttroket moterinsektbuzÖflakd 81

Appendices 354
portokallvirusmaceloje garendihmolexo veshmirezanÖ 84
fatmbretbie guritreburreshi njezetujepaste 87
uletfrymemajmun mizegojemizeboj6 kecbimekyg 90
shpresengrijzeze druakullnjezetjave tavolinekrahuthunder 93
Iundrokrizeshtepi gafeqenrrethkasap biemiktako 96
giellkollebalonebirre hollevonelufto getedhepiktur6 99
gjuhekitarekafe bardhetapekuarc vogelhyjcirkbie 102
dentistpize kohelilahenaflas marrarigrua 105
qepprincbeko butelopalepurmengjes bejparazile 108
bluzakonmuzike shesurrejnxetekarrote flaslodhpeme 111
vendpylldoctor shtyjthajpjate shtrydhmendojpageverd 114
pamjeylldite sportvraplitardajo folepersonluaj 117
djellnjejam geshkercevajze boreshpejtthekfryj 120

Appendices
Appendix 17
Wordchains: English
Example:
355
sandcoffeeblue soundwoodjokefox swanbrightmud 3
rocketpegcat soiltoypeoplepond Iambglassboot 6
snaiiwetradio spiderhomebull oldgardengoosechin 9
eatbrushwash vestmirrorfridgeplain spadebedcombl 12

Appendices 356
ballworka le potcrydoor shoechestparkmeat
lemonbreadcheese cheekduckjar beachtentwheelwindow
beancampcar shellfarmbowlcrab sweet ra ehen
bab orkma icbee animalnutchair roomzoocrawl 12
skirtdancewalk berryrightpuppychip si n earaunt 15
drivefoodchildwet s oonli htbubble onionfrogjuice
-
18
a efruitg asbo caketrackfair seatbreakgo
yellowdinnercream sheepsnackweather cloud ho brother ame 24
shoproadtea saladnursebakerdaisy bucketbrickrain 27
desklilacwineknife darklunchstorm shakeposthamster 30
oneflutetown questionactionbook o encher a er ole 33
coldni htbath pagecloseyawnvillage anchortruckpen 36
eightboilmotor secondwordthousand clockteacherhappysinq 39
yardmistgrassfire earthietterhundred pigheadclaw 4
thirteenburnmonth niecelifemop thickroundtoothbig 45
evenin com iano sugarloudlamp horsefieldtrunkwall 48
lockhourweed row penguinbuytrain s uareleather ain 51
splashtencar stickcutnumberdeep fin erboatfur 54
ski hurte eminute sleetpinkmillion tigertoeclean 57
recordbruisefeel t re athtrafficswim smoothlionfoot 60
sadfivefuneye warmflagnice sharpdeafsix

Appendices 357
Kneemousebat sick ie owder skinwolfsonghard
holdthickface roughfiatnaiinasty hambirdelbow
ridele tail round soapbuildwrite paddlelovecrisp
smallhairhammer windtwofrownheart trollticklewhale 75
dishnaturenose y oung leadlon care shi monsterdol hin 78
giraffebarkwriggle blindhighbeat sisterbeetlelipflame 81
oran ebu etdoll racehelpread earfinefairy 84
luck ueenrin rockthreemanfog twelvewaterpasta 87
lowbreathmonkey antmouthflypaint qoatplantkey 90
ho efreezeblack oakicetwentyweek tablehandhoof 93
sailhumphouse neckdogcirclebutcher fallfriendmeet 96
sk cou hkitebeer thinlatefight uietdust icture 99
ton ue uitarbrown white lu ebble elfcreepcircusdial 102
dentistdrinkvoice time ur lemoonwhis er buzzbearwoman 105
sew rincessbless softcowrabbitmoming tickmoneybell 108
greencommonmusic sellhatehotcarrot talktiredtree Ill
lawnforestdoctor swin d late s ueezethink a milk 114
watchstarday s ortrunro euncle shoutpersonplay 117
sunfou 'am lau h'um irl snow uicktoastblow 120

Appendices
Appendix 18
Wordchains: Welsh
Esiampl:
358
rhawcoffiglas clochprenauroen prygolaumwd 3
rocedpegcath priddcarpobipwll oenglasdoli 6
gafrhetradio neidrgwelytarw hengarddgwyddgan 9
topbrwswal sgertdrychtostplaen rhawgwelypethcrib 12

Appendices 359
pobgwaithafal potcriodrws cigsiopcuroparc
lemonbaracaws bochbuwchjar traeth abeliol nffenestr 6
ffamaescar croenffarmplascosi melysorenhen
babifforcstorimab anifail en lud rhawllecrib
sgertdawnswedi diodchwithbuwchbloc pincpaisawel 15
rrubw d lantwal llwybwthyniamp moronbrogadiod 18
acerffrwythnaibach torthtracffair setmyndtorri 21
melynciniocael mochsnactywydd haulhonmod b er 24
siopfforddte saladnyrsbabanderwen bwcedbric law 27
des iwsfforc dadciniostorm sialc ramhances 30
fflamtuatref cwestiwnacenll ra orcadach a ur aent 33
oemosbath pamagosiawndinas an ortc en 36
wythbancmanwl sbectol airmiliwn cloctebotha usca p 39
iiardniwlqwairtop riddll th rhalen mochhaulclawr 42
tiwnabwlbmis nithilaethmop trwmrowndmawrdant 45
noswaithcorn piano siwgrllewlamp caercaetrwncwal 48
claw h rawn en winbachtren s ertlled oen 51
starr de car ludca rhifaud n byseddcwchblew 54
hoffnaideichmunud cwsgpincmiliwn tei rb s las 57
rha lenb sfel teiarlwctraffigswil II nllewtroed 60
rist um h leli wediffla neis siopdausut

Appendices 360
cnocbatcaws sal ei owdr croenblaiddca cated 66
taltewffarm blinfflatnaidnofio hamadaresgid 69
rowndcoesta Ilawr sychbudrwrth pabellplaslwc 72
bachgwallthanner gwyntdaufforddcalon treftrwynwedi 75,
plasnaturceg ifanct nnu ofal lion anferthdolffin 78
moch nbanc s of dalluwchbeic siocberwillobrawd 81
orenbodpelldol rashel coch ebolffinffair 84
lwcsachcaws crai niwitrid n chwaerdaupasta 87
Ilai ntmwnci to ce aent gafrplantci 90
hafrhewidu oeru ainrhewd dd bwrddllawtroed 93
h lh liftri pencathcylchcigydd dalffrindgweld 96
setcaeltagucwrw hirhw r aircoes arafllwchlluniau 99
tafodgitarbrown gwynplwqpedair elicriosyrcasdail 10
docto edllais amsermel nhaulwardrob batbethdynes 105
setpalasbwrw sychchwaerdafadnoson ticarianrhad 10
glashydrefcerdd gwyntCribmorondu crai blincroes ill
Ilawnhosandoctor pincsychplas s ertllaethrhadtal
wedisetdydd stamprhesrhaffbrawd sio sebon laen 117
hauljamtri lawrnaidmerch santcartref w nt 2

Appendices
Appendix 19
Spelling 50 word-items in Albanian, English and Welsh Albanian English Welsh
1 ju no Ile 2 saj other mi 3 ti because mwy 4 tani have rhoi 5 dit6 down iaith 6 kam never oes 7 atyre much arbennig 8 teper work blaen 9 menyrd though doedd
10 duket fact cyrraedd 11 shgiperi night golwg 12 milion6 important dilyn 13 erdhi enough adran 14 than6 upon toni 15 be less draw 16 shgiperia rest roeddwn 17 pese came Ilwybr 18 dhjetd simple nodi 19 ndodhet knows ganddi 20 zyrtare department geni 21 prokurori sorry dieithr 22 paster bottle sioe 23 opozita benefit cynrychioli 24 pesuar actual blwydd 25 fshatrat airport safodd 26 nj6dt painting rheilffyrdd 27 parlamentit self amheus 28 vullnetit owner camgymeriad 29 nenvizoi inspector hyn 30 studimit necessity almaeneg 31 gelloi via bygythiol 32 ndan6 Victoria brysiodd 33 jetojme admission syniadaeth 34 guxonte trips ffasiynau 35 shpines outward lampau 36 minoritetit exams sloganau 37 afron comprehension ysbwriel 38 avokatin triumphant petryal 39 reagime booklet lawntiau 40 kurs boulders Ilogi 41 kufizime dreaded tocio 42 mirenjohjeje thanking esgyrnog 43 tabelen saga ceisiant 44 nishan semantic cyfrannol 45 eliminohej discretionary hysbysebwr 46 quash crimson goddefgar 47 botanikön tithe ymaddasu 48 pijes perilously mathemategwr 49 gjemime remarriage ymatebol 50 bojkotojne horseman brafiach
361