Large-scale flow structures in particle–wall collision at low Deborah numbers
20
European Journal of Mechanics B/Fluids 26 (2007) 511–530 Large-scale flow structures in particle–wall collision at low Deborah numbers M. Guala a , A. Stocchino b,∗ a Institute for Environmental Engineering, ETH Zurich, Switzerland b DIAM, Università di Genova, Via Montallegro 1, 16145 Genova, Italy Received 18 April 2005; received in revised form 5 September 2006; accepted 12 October 2006 Available online 28 November 2006 Abstract PIV measurements of two dimensional velocity fields during the rebound of a steel spherical particle colliding a wall are provided in Newtonian fluids (distilled water and aqueous solution of Glycerol) and in a viscoelastic shear thinning fluid (aqueous solution of carboxymethyl cellulose). The experiments are designed in order to reproduce the same conditions in which the coefficient of restitution was observed to be significantly affected by viscoelasticity at the typical scales of the lubrication layer [A. Stocchino, M. Guala, Particle–wall collision in shear thinning fluids, Exp. Fluids 65 (2005) 17–46]. In such conditions, the Deborah number, which is a measure of the relevance of the viscoelastic effects compared to the inertial effects, is however relatively low. The aim of the present study is to investigate the relative influence of the elasticity and of the shear thinning character of the non- Newtonian fluid on the large scale flow structures triggered by the particle impact. Special attention is dedicated to the definition of a proper viscosity when the non-Newtonian fluid is involved. In this respect, a scaling argument is suggested to derive the value of the viscosity for an assigned rate of strain ˙ γ , given a constitutive law of the kind τ = τ( ˙ γ), where τ is the shear stress. The scaling analysis is supported by previous works on particle settling in non-Newtonian fluids and by recent studies on the flow structures that form as a consequence of a particle–wall collision in Newtonian fluids. The experimental validation of the proposed scaling is provided by first choosing a Newtonian fluid with viscosity equal to the non-Newtonian viscosity and, then, carrying out a comparative analysis of the large-scale vortical structure formed during the collision-rebound process. The statistical analysis suggests that the large scale flow structures observed during the Glycerol experiment and the CMC solution experiment behaves similarly in term of spatial and temporal scales. Therefore, at least for the values of the dimensionless parameters investigated, the shear thinning character of the non-Newtonian fluid employed is dominant with respect of its viscoelasticity. © 2006 Elsevier Masson SAS. All rights reserved. Keywords: Particle rebound; Viscoelastic fluid; Shear thinning fluid; PIV 1. Introduction Particle–wall collision in viscous fluids is still an open field for both experimental and numerical investigations due to the complex interactions between fluid and solid mechanics occurring in a very narrow region and in a very short time scale. The relevance of the problem is acknowledged in many industrial [1,2] and environmental [3] phenomena * Corresponding author. E-mail address: [email protected] (A. Stocchino). 0997-7546/$ – see front matter © 2006 Elsevier Masson SAS. All rights reserved. doi:10.1016/j.euromechflu.2006.10.004
-
Upload
independent -
Category
Documents
-
view
4 -
download
0
Transcript of Large-scale flow structures in particle–wall collision at low Deborah numbers

European Journal of Mechanics B/Fluids 26 (2007) 511–530
Large-scale flow structures in particle–wall collisionat low Deborah numbers
M. Guala a, A. Stocchino b,∗
a Institute for Environmental Engineering, ETH Zurich, Switzerlandb DIAM, Università di Genova, Via Montallegro 1, 16145 Genova, Italy
Received 18 April 2005; received in revised form 5 September 2006; accepted 12 October 2006
Available online 28 November 2006
Abstract
PIV measurements of two dimensional velocity fields during the rebound of a steel spherical particle colliding a wall are providedin Newtonian fluids (distilled water and aqueous solution of Glycerol) and in a viscoelastic shear thinning fluid (aqueous solutionof carboxymethyl cellulose). The experiments are designed in order to reproduce the same conditions in which the coefficient ofrestitution was observed to be significantly affected by viscoelasticity at the typical scales of the lubrication layer [A. Stocchino,M. Guala, Particle–wall collision in shear thinning fluids, Exp. Fluids 65 (2005) 17–46]. In such conditions, the Deborah number,which is a measure of the relevance of the viscoelastic effects compared to the inertial effects, is however relatively low. Theaim of the present study is to investigate the relative influence of the elasticity and of the shear thinning character of the non-Newtonian fluid on the large scale flow structures triggered by the particle impact. Special attention is dedicated to the definitionof a proper viscosity when the non-Newtonian fluid is involved. In this respect, a scaling argument is suggested to derive the valueof the viscosity for an assigned rate of strain γ̇ , given a constitutive law of the kind τ = τ (γ̇ ), where τ is the shear stress. Thescaling analysis is supported by previous works on particle settling in non-Newtonian fluids and by recent studies on the flowstructures that form as a consequence of a particle–wall collision in Newtonian fluids. The experimental validation of the proposedscaling is provided by first choosing a Newtonian fluid with viscosity equal to the non-Newtonian viscosity and, then, carrying outa comparative analysis of the large-scale vortical structure formed during the collision-rebound process. The statistical analysissuggests that the large scale flow structures observed during the Glycerol experiment and the CMC solution experiment behavessimilarly in term of spatial and temporal scales. Therefore, at least for the values of the dimensionless parameters investigated, theshear thinning character of the non-Newtonian fluid employed is dominant with respect of its viscoelasticity.© 2006 Elsevier Masson SAS. All rights reserved.
Keywords: Particle rebound; Viscoelastic fluid; Shear thinning fluid; PIV
1. Introduction
Particle–wall collision in viscous fluids is still an open field for both experimental and numerical investigations dueto the complex interactions between fluid and solid mechanics occurring in a very narrow region and in a very shorttime scale. The relevance of the problem is acknowledged in many industrial [1,2] and environmental [3] phenomena
* Corresponding author.E-mail address: [email protected] (A. Stocchino).
0997-7546/$ – see front matter © 2006 Elsevier Masson SAS. All rights reserved.doi:10.1016/j.euromechflu.2006.10.004
512 M. Guala, A. Stocchino / European Journal of Mechanics B/Fluids 26 (2007) 511–530
involving non-dilute suspensions, where particle–particle collisions have been observed to play a significant role. Inparticular, recent developments in the modeling of particle-laden flows have shown that a clear understanding of theseeffects would be of considerable help to allow for a deeper insight of the two ways coupling interactions betweenparticles and turbulence and, eventually, to model particle entrainment. Numerical simulations have been successfullycarried out in the case of low particle concentration where no particle–particle interactions have to be taken intoaccount, showing that the presence of particles may act towards the modulation of turbulence and/or towards particlepreferential concentration, also known as clustering, e.g. see [4] and references herein. The extension of these resultsto high particle concentration flows is problematic via experimental approach due to the strong opacity of the mixtures,which does not allow for the use of non-intrusive optical methods. Moreover, two phase flows where the liquid phaseis non-Newtonian are common in natural environments, e.g. debris flow and lava mud, and they represent serioushazards for urban communities in mountain and volcanic regions. Recent developments in the understanding of debrisflow dynamics [5] pose some questions on the effects of collisions between cobbles or stones carried by the mud onthe local production of Reynolds stresses. Thus, particle wall collisions in viscous fluids represent a benchmark forthe modeling of particle–particle interactions.
Most of the experiments in the literature were designed to investigate collisions in relatively simple cases, e.g. aspherical particle impacting a rigid wall, providing measurements of particle trajectory and particle velocity. Moreover,in the case of Newtonian fluids, a great number of the published works concern the evaluation of the coefficient ofrestitution, defined as the ratio of the moduli of the rebound (wr ) and the impact (wi ) velocity, as a function ofthe Stokes number. The effect of a viscous Newtonian fluid on the coefficient of restitution has been extensivelyaddressed both theoretically [6] and experimentally, see for example [7–10] among others. However, all the mentionedcontributions leave out the behavior of the surrounding fluid and the flow generated by the particle impact. Recently,flow visualizations have been reported by Eames and Dalziel [11] focusing on the effects of the flow structures formedduring the impact on the resuspension of the surrounding dust, with Reynolds number varying between 500 and 3100.In their visualization, the wake vortices shed during the settling of the particle, and traveling with the particle velocity,were observed to be driven by inertial forces over the particle, once the latter hit the wall and was impeded to rebound.Great care was devoted to the study of the interaction between the wake vortices, defined as a primary structure, anda secondary vortex formed by the deflection of the first structure on the particle surface in the absence of a rebound.More recently, Ten Cate et al. [12] performed PIV measurements to validate lattice-Boltzmann simulation of particle–wall collision in a viscous Newtonian fluid at low Reynolds number. In the latter contribution the Stokes number wasmaintained below its critical value, which has been found to be approximately 10 by Gondret et al. [10] and confirmedby Stocchino and Guala [13], so that no rebound was observed.
Regarding the non-Newtonian fluid, a great effort has been dedicated in these last decades to the study of theparticle settling in a variety of non-Newtonian fluids (e.g. viscoelastic, inelastic, shear thinning), with the purpose ofmeasuring basic quantities, such as the terminal velocity and the drag on the sphere, and of comparing the resultswith Newtonian experiments, see for example [14–20]. Recently Stocchino and Guala [13] measured experimentallythe coefficient of restitution of a spherical particle impacting a rigid wall immersed in the same viscoelastic shearthinning fluid of the present investigation. It was found that viscoelasticity plays a relevant role causing the coefficientof restitution to increase with respect to the Newtonian rebound for the same Stokes number. Starting from the latterobservation, the aim of the present work is to investigate whether or not the non-Newtonian properties of the fluid(viscoelasticity and/or shear thinning behavior) may influence the large scale flow structures formed during the impact.In particular, the relative importance of viscoelastic effects compared to the shear thinning character of the fluid willbe analyzed in detail. When a non-Newtonian fluid is involved a great care has to be taken in the definition of the mainfluid properties, in particular the viscosity η is no longer a property of the fluid itself, but of the flow conditions, i.e.η = η(γ̇ ), where γ̇ is the rate of strain. Thus, it is required to assign a specific value to the rate of strain γ̇ in order toevaluate the viscosity from the constitutive law. In the following, we suggest a scaling argument that leads to defineunivocally the rate of strain γ̇ representative of the flow condition. The proposed scaling is developed in analogy withthe mentioned works on the pure settling in non-Newtonian fluid and on the work of Eames and Dalziel [11] and often Cate et al. [12], where the dominant scales of the vortical structure are clearly depicted. Moreover, we propose astatistical description of the flow in terms of large-scale dominant features, based on which we extend the comparisonwith the experiments performed in Newtonian fluids.
We proceed as follows. In Section 2 we briefly summarize the major theoretical aspects of the problem. In Section 3we describe the experimental apparatus, while in Section 4 we discuss the scaling argument that leads to the choice

M. Guala, A. Stocchino / European Journal of Mechanics B/Fluids 26 (2007) 511–530 513
of the experimental parameters. Section 5 is dedicated to the discussion of the experimental results. Conclusions aresummarized in a final section.
2. Theoretical background
A great deal of research has been dedicated to the description and to the modeling of particle–wall collision in aviscous fluid. A breakthrough in the understanding of above problem is represented by the work of Davis et al. [6],who emphasized the importance of the viscous dissipation in the lubrication layer, i.e. the thin fluid region between theimpacting sphere and the wall. The authors provided a coupled analysis of the dynamics of the lubrication layer andthe deformation of the rigid surfaces (particle and wall) enlightening the dependence of the coefficient of restitutionon the Stokes number St and the elasticity parameter ε. The first is defined as:
St = 2mwi
3πμD2= 1
9
ρp
ρf
Re, Re = ρf
Dwi
μ, (1)
where D is the diameter of the spherical particle, ρp and ρf are the particle and fluid densities respectively, m is theparticle mass, μ is the fluid dynamic viscosity and Re is the particle Reynolds number. The elasticity parameter isgiven by:
ε = θμwiD3/2
8z5/20
, (2)
where z0 is the distance between the two approaching surfaces at which the velocity assumes the values wi , θ =(1 − ν2
1)/πE1 + (1 − ν22)/πE2 and ν1, ν2 and E1,E2 are the Poisson’s ratio and Young’s moduli of elasticity for
the spherical particle and the wall respectively. The above theoretical arguments have been supported by severalexperimental results, see for example [7–10], and recently expanded to include also the role of the particle surfaceroughness [8]. Note that the contributions mentioned above focused exclusively on the motion of the particle.
When the fluid surrounding the impacting particle is non-Newtonian, different fluid properties and dissipativemechanisms start to play an important role. In the literature, most of the work published focused the attention onthe pure settling under gravity of a spherical particle inside a cylindrical container [14–20]. In particular, Mena et al.[14] performed a sequence of experiments of particle settling in different fluids (Newtonian, viscoelastic, inelastic andconstant viscosity elastic) with the aim to study the influence of the rheological properties on the drag force. Besides,they investigated also the wall effects on the drag force varying the ratio between the particle radius and the radius ofthe cylindrical container. All the experiments were conducted in the creeping flow regime, i.e. Re � 1, increasing theDeborah number up to values around 3. The authors also tested the validity of small perturbation theories and inelasticanalyses comparing the theoretical studies with their experimental measurements. Becker and McKinley [15] focusedtheir attention on the acceleration of a spherical particle that, starting from rest, settles immersed in a viscoelastic fluid(PIB Boger fluid). They reported experimental observations and numerical results in a range of Deborah numbersbetween 0.4 and 11, whereas the Reynolds number was maintained below 1. On the contrary, Jones et al. [16] used adifferent fluid for the same problem; in fact, they employed two different constant-viscosity elastic fluid varying theDeborah number between 0.2 and 5. Argon et al. [17] and Rajagopalan et al. [18] addressed the problem of a spheresettling under gravity through a cylindrical tube filled with viscoelastic fluid, comparing numerical results obtainedby means of finite elements simulations with detailed velocity measurements. Indeed, laser Doppler velocimetrywas employed to measure the fluid velocity in the vicinity of the settling particle in order to validate the numericalsimulations over a wide range of Deborah numbers.
The influence of the presence of more than one particle settling in a viscoelastic fluid has been experimentallyinvestigated in the work of Bot et al. [20]. They performed the experiments keeping the Reynolds number low enoughto ensure the validity of the Stokes regime, while the Deborah number was increased in order to reach value around 30.
As shown in the cited works, the presence of a non-Newtonian fluid may affect considerably the settling of aspherical particle either during the accelerating phase or its terminal velocity, since the drag on the sphere dependsstrongly on the fluid properties. When both elasticity and shear thinning effects are to be considered, at least twodimensionless groups should be considered: the Reynolds number, as already defined (provided that the viscosity

514 M. Guala, A. Stocchino / European Journal of Mechanics B/Fluids 26 (2007) 511–530
of the fluid μ is replaced by the proper viscosity for an assigned rate of strain η(γ̇ )) and the Deborah number De,representing the ratio between a characteristic relaxation time for the fluid (λ) and the convective time scale (a/w):
De = λw
a, (3)
where a is the particle radius and w a characteristic velocity scale. In the following, λ is considered as the Maxwellrelaxation time defined as a function of the first normal stress N1 and is given by:
λ = N1
2ηγ̇ 2. (4)
Finally, the elasticity number E might be introduced and it is defined as the ratio between the Deborah number andthe Reynolds number, E = De/Re. It can be interpreted as the ratio of the elastic stresses to the inertial stress or,alternatively in non steady motion, as the ratio of the elastic time scale for growth of elastic stresses, proportional to λ,to the viscous time scale (ρf a2/η), typical of vorticity diffusion [15].
All the previous expressions require a definition of a characteristic rate of strain γ̇ in order to evaluate the normalstress N1, the viscosity η and finally the relaxation time λ. Regarding the particle settling in a confined container,it was found that at small Deborah number (De � 1) there was no difference with the drag force predicted for aNewtonian fluid [19], which implies that the elasticity of the fluid is irrelevant in that regime. Moreover, Mena et al.[14] suggested that the shear thinning behavior can be represented selecting an appropriate Newtonian fluid with aviscosity equal to the non-Newtonian viscosity that corresponds to a rate of strain γ̇ = ws/D, where ws is the terminalvelocity. On the contrary, at intermediate values of the Deborah number the elasticity of the fluid begins to affect thesedimentation of the spherical particle and an important drag reduction, higher than 25%, occurs. Furthermore, athigher values of the Deborah number the drag increases again and it exceeds the Newtonian value [16].
In Stocchino and Guala [13] the increase of the coefficient of restitution was related to (i) the elasticity of the fluid,through the effects of the normal stress N1 in the lubrication layer; (ii) the shear thinning behavior of the fluid, throughthe reduction of the viscosity in regions where the rate of strain increases of two orders of magnitude. In fact, in suchregions, the relevant length scale is no longer the particle diameter, as in the case of pure settling, but the thickness ofthe lubrication layer z0, which is estimated to be of order of O(D/100) or less [8].
In the following we propose a scaling argument, based on all the results mentioned in this section, in order to studythe flow structures triggered by the impact of a spherical particle against a rigid wall. We intend to show that thebehavior of these macro scale flow structures in the case of a viscoelastic shear thinning fluid at low Deborah numberis equivalent to the case of a Newtonian fluid with a proper viscosity.
3. Experimental apparatus
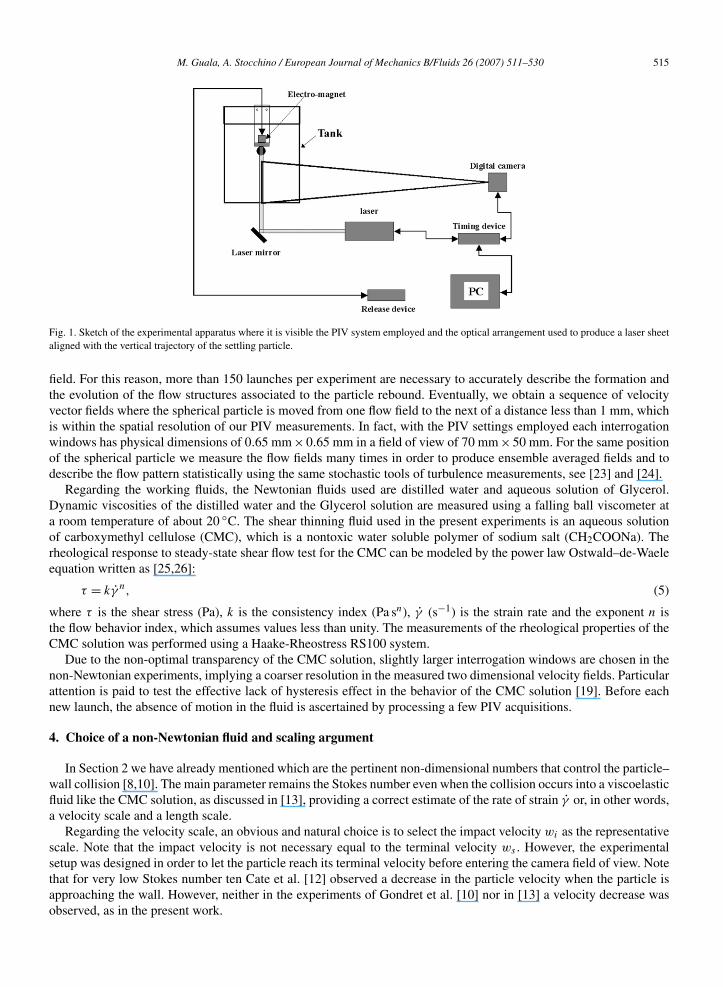
The experiments are carried out in a cubic Perspex tank with the linear dimension of 50 cm and a glass bottom2.5 cm thick. The horizontal dimensions of the tank are such to avoid any influence of the lateral wall. A sphericalnickel-steel particle is released by means of an electromagnetic device located 15 cm above the bottom wall. The mainparticle properties can be summarized as follows: diameter D = 1 cm, density ρp = 8.105 g/cm3, Young’s modulus of201 GPa and Poisson’s ratio of 0.23. Measurements of two dimensional flow fields at different times, before and afterparticle rebound, are performed by a Particle Image Velocimetry (PIV) acquisition system in double exposure mode(one pulse per frame) with a pulse separation of about 800 µs. Since velocity is expected to vary from substantiallyzero to the particle velocity, of order of 1 m s−1 in the very close surroundings of the particle, the pulse separation ischosen to be optimal for intermediate velocity values, of order of 0.1–0.2 m s−1.
A cylindrical and a spherical lens converts a laser beam generated by two 30 Hz Nd:Yag lasers into a laser sheet of0.4 mm thickness and of planar dimensions suitable to illuminate the area of interest. The laser sheet is then alignedvertically with the center of the sphere using a coated laser mirror and entered the tank through the glass bottom.With this optical arrangement, the particle settles and bounces remaining within the laser sheet, allowing velocitymeasurements around it for the entire experiment. However, as unavoidable consequence, the shadow behind theparticle makes velocity measurements in the wake impossible. A sketch of the experimental apparatus is shown inFig. 1. A similar experimental setup has been used by ten Cate et al. [12] and, also in that case, no velocity vectorswere measured in the particle wake. The acquisition rate of the used PIV system is limited to a frequency of 10 Hz,therefore, a single launch of the spherical particle is not sufficient to describe the entire time evolution of the flow
M. Guala, A. Stocchino / European Journal of Mechanics B/Fluids 26 (2007) 511–530 515
Fig. 1. Sketch of the experimental apparatus where it is visible the PIV system employed and the optical arrangement used to produce a laser sheetaligned with the vertical trajectory of the settling particle.
field. For this reason, more than 150 launches per experiment are necessary to accurately describe the formation andthe evolution of the flow structures associated to the particle rebound. Eventually, we obtain a sequence of velocityvector fields where the spherical particle is moved from one flow field to the next of a distance less than 1 mm, whichis within the spatial resolution of our PIV measurements. In fact, with the PIV settings employed each interrogationwindows has physical dimensions of 0.65 mm × 0.65 mm in a field of view of 70 mm × 50 mm. For the same positionof the spherical particle we measure the flow fields many times in order to produce ensemble averaged fields and todescribe the flow pattern statistically using the same stochastic tools of turbulence measurements, see [23] and [24].
Regarding the working fluids, the Newtonian fluids used are distilled water and aqueous solution of Glycerol.Dynamic viscosities of the distilled water and the Glycerol solution are measured using a falling ball viscometer ata room temperature of about 20 ◦C. The shear thinning fluid used in the present experiments is an aqueous solutionof carboxymethyl cellulose (CMC), which is a nontoxic water soluble polymer of sodium salt (CH2COONa). Therheological response to steady-state shear flow test for the CMC can be modeled by the power law Ostwald–de-Waeleequation written as [25,26]:
τ = kγ̇ n, (5)
where τ is the shear stress (Pa), k is the consistency index (Pa sn), γ̇ (s−1) is the strain rate and the exponent n isthe flow behavior index, which assumes values less than unity. The measurements of the rheological properties of theCMC solution was performed using a Haake-Rheostress RS100 system.
Due to the non-optimal transparency of the CMC solution, slightly larger interrogation windows are chosen in thenon-Newtonian experiments, implying a coarser resolution in the measured two dimensional velocity fields. Particularattention is paid to test the effective lack of hysteresis effect in the behavior of the CMC solution [19]. Before eachnew launch, the absence of motion in the fluid is ascertained by processing a few PIV acquisitions.
4. Choice of a non-Newtonian fluid and scaling argument
In Section 2 we have already mentioned which are the pertinent non-dimensional numbers that control the particle–wall collision [8,10]. The main parameter remains the Stokes number even when the collision occurs into a viscoelasticfluid like the CMC solution, as discussed in [13], providing a correct estimate of the rate of strain γ̇ or, in other words,a velocity scale and a length scale.
Regarding the velocity scale, an obvious and natural choice is to select the impact velocity wi as the representativescale. Note that the impact velocity is not necessary equal to the terminal velocity ws . However, the experimentalsetup was designed in order to let the particle reach its terminal velocity before entering the camera field of view. Notethat for very low Stokes number ten Cate et al. [12] observed a decrease in the particle velocity when the particle isapproaching the wall. However, neither in the experiments of Gondret et al. [10] nor in [13] a velocity decrease wasobserved, as in the present work.
516 M. Guala, A. Stocchino / European Journal of Mechanics B/Fluids 26 (2007) 511–530
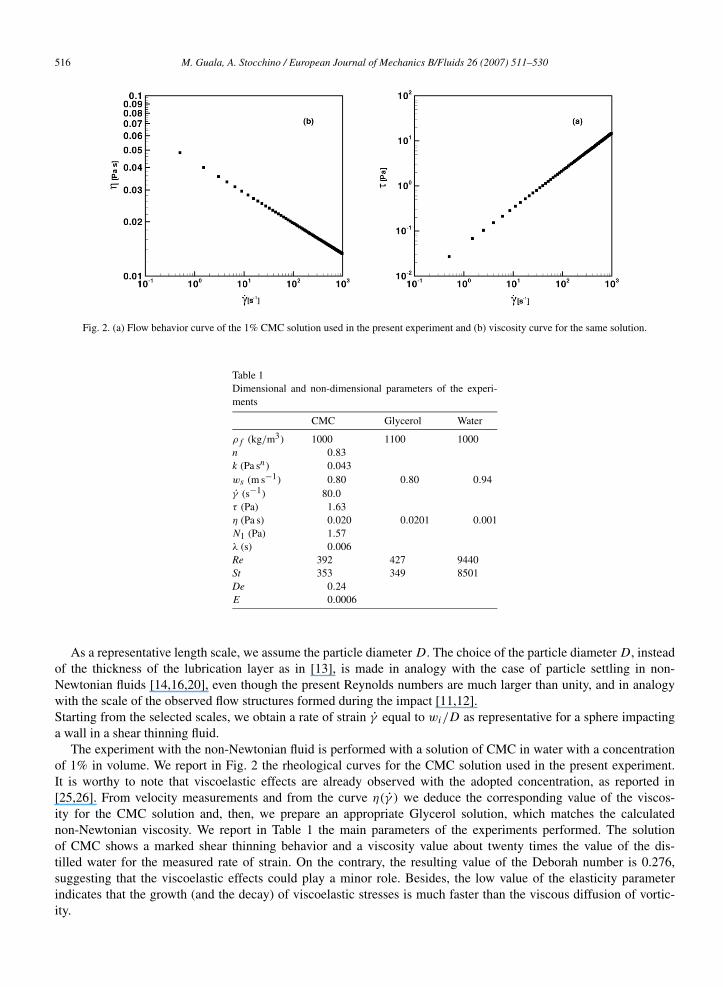
Fig. 2. (a) Flow behavior curve of the 1% CMC solution used in the present experiment and (b) viscosity curve for the same solution.
Table 1Dimensional and non-dimensional parameters of the experi-ments
CMC Glycerol Water
ρf (kg/m3) 1000 1100 1000n 0.83k (Pa sn) 0.043ws (m s−1) 0.80 0.80 0.94γ̇ (s−1) 80.0τ (Pa) 1.63η (Pa s) 0.020 0.0201 0.001N1 (Pa) 1.57λ (s) 0.006Re 392 427 9440St 353 349 8501De 0.24E 0.0006
As a representative length scale, we assume the particle diameter D. The choice of the particle diameter D, insteadof the thickness of the lubrication layer as in [13], is made in analogy with the case of particle settling in non-Newtonian fluids [14,16,20], even though the present Reynolds numbers are much larger than unity, and in analogywith the scale of the observed flow structures formed during the impact [11,12].Starting from the selected scales, we obtain a rate of strain γ̇ equal to wi/D as representative for a sphere impactinga wall in a shear thinning fluid.
The experiment with the non-Newtonian fluid is performed with a solution of CMC in water with a concentrationof 1% in volume. We report in Fig. 2 the rheological curves for the CMC solution used in the present experiment.It is worthy to note that viscoelastic effects are already observed with the adopted concentration, as reported in[25,26]. From velocity measurements and from the curve η(γ̇ ) we deduce the corresponding value of the viscos-ity for the CMC solution and, then, we prepare an appropriate Glycerol solution, which matches the calculatednon-Newtonian viscosity. We report in Table 1 the main parameters of the experiments performed. The solutionof CMC shows a marked shear thinning behavior and a viscosity value about twenty times the value of the dis-tilled water for the measured rate of strain. On the contrary, the resulting value of the Deborah number is 0.276,suggesting that the viscoelastic effects could play a minor role. Besides, the low value of the elasticity parameterindicates that the growth (and the decay) of viscoelastic stresses is much faster than the viscous diffusion of vortic-ity.

M. Guala, A. Stocchino / European Journal of Mechanics B/Fluids 26 (2007) 511–530 517
5. Discussion of the experimental results
In this section we present the measurements obtained from the three benchmark experiments with the selected fluidsdescribed in the previous section. Together with the two dimensional velocity fields, the out-of-plane component ofvorticity and the swirling strength are calculated to help the understanding of the formation and evolution of the macroscale flow structures. We first present the experimental results regarding the settling of the sphere before the impact,then, the measurements during the rebound of the particle. Finally, we present a statistical description of the large-scale vortical structures in three consecutive situations, (i) before the collision, (ii) after the first rebound while theparticle is still moving upward, (iii) before the second rebound while the particle is moving downward.
5.1. Particle settling
During the particle settling there is no ambiguity in the choice of the representative scales of the flow as the particlediameter D and the settling velocity ws . The choice of the working fluids (Glycerol and CMC solutions) was madesuch to obtain the same viscosity η = 0.02 Pa s for a rate of strain γ̇ = ws/D = 80 s−1. The representativenessof such values for γ̇ is supported by the estimates of the particle settling velocity ws = 0.8 m/s, which exhibits noappreciable difference between the Glycerol solution and the CMC solution. However the above scaling might not holdin the whole flow field since the viscosity in the non-Newtonian case varies with the local rate of strain. Therefore,we expect that the velocity field in the surrounding of the settling particle may exhibit some minor differences whencomparing flow measurements, in the Glycerol and in the CMC solutions, even during the particle settling.
In Fig. 3 ensemble averaged vector fields during the particle settling, together with contours of the ensembleaveraged vertical velocity component, are shown for the experiments performed with distilled water (a), Glycerolsolution (b) and CMC solution (c). In Fig. 3(d) the profiles of the vertical component of the averaged velocity in axiswith the center of the particle are plotted in the three cases. We first observe that the maximum values of the measuredvertical velocity in the case of the Glycerol solution and of the CMC solution are quite similar, consistently with theestimates of the particle velocity, while the decaying of the velocity profiles as we move away from the particle isquite different. An explanation of the latter aspect will be proposed in the following.
Moreover, in all the three cases the maximum velocity is not located in the proximity of the particle but approxi-mately 0.2D below its lower edge of the falling particle. This shift is present in all three condition and is thus probablydue to a combination of the following errors: (i) non-optimal pulse lag for high velocity values; (ii) light reflectionsfrom the edge of the particle surface that prevent a correct velocity measurement in the close surroundings of the par-ticle; (iii) errors derived from averaging instantaneous flow fields in which the particle position is known with someuncertainties.
A close inspection of the iso-velocity contour in Fig. 3 (a), (b) and (c) reveals that a significant portion of fluidbelow the particle, of the order of D, is affected by the settling motion of the sphere. In particular, choosing a velocityvalue of about 1% of the settling velocity, this region of influence is found to extend from the lower edge of theparticle up to approximately 1.0D (water), 1.15D (Glycerol solution), 1.33D (CMC solution). The difference ofabout 0.2D between the Glycerol solution and the CMC solution might not be fully explained only by the sources oferror mentioned above. Indeed, the differences in the areas delimited by the contours in Fig. 3 (b) and (c) appear toincrease towards weak velocity values. We propose the following interpretation. The relevant time scales during theparticle settling are the particle advection time scale τp,a = D/ws – or, in general, an advection time scale τa = D/w –and the momentum diffusion time scale τν = ρD2/μ, which is a measure of the diffusion of momentum into the fluidover a distance of one particle diameter. The latter depends on the dynamic viscosity and, thus, it is supposed to changewith the local rate of strain when the non-Newtonian fluid is considered. Although the Reynolds number Re = τν/τp,a
is large enough for the inertial effect to be dominant, we infer that in the annular region of fluid extending about 1D
below the particle, the strain rate should decrease down to values much smaller than ws/D. Therefore, as we movefurther from the particle, the two working fluids are no longer expected to own to the same viscosity, with increasingdifferences towards the weak strain regions. Indeed, the viscosity of the CMC solution should increase accordinglyto its rheological curve shown in Fig. 2(b), whereas the Newtonian viscosity remains unchanged. A two order ofmagnitude decrease in the vertical velocity leads to an increase by a factor 2 in the dynamic viscosity (assuming aconstant length scale). Such decrease in the velocity scale implies that at a distance of about 1D from the particle,τν and τa are of the same order of magnitude and, in such regions, the different behavior of Glycerol and CMC

518 M. Guala, A. Stocchino / European Journal of Mechanics B/Fluids 26 (2007) 511–530
Fig. 3. Ensemble averaged vector field during particle settling together with the contour of the averaged vertical velocity component w: water (a),Glycerol solution (b), and CMC solution (c). Profiles of the vertical velocity is axis with the center of the particle are show in panel (d).
Table 2Values of the advection time scale, diffusion time scale and the corresponding Reynolds number, as defined in the text, at different location alongthe vertical line x = 0 for the Glycerol and CMC solution. The values of the different quantities are deduced from the ensemble-averaged flowfields of Fig. 3
z/D Glycerol CMC
τa τν Re τa τν Re η (Pa s)
1.4 0.286 5.473 19.1 0.165 3.160 19.2 0.03161.2 0.127 5.473 43.1 0.125 3.313 26.5 0.03021.0 0.194 5.473 28.2 0.167 3.155 18.9 0.03170.8 0.358 5.473 15.3 0.280 2.890 10.3 0.03460.6 0.606 5.473 9.0 0.535 2.589 4.8 0.03860.4 0.897 5.473 6.1 0.813 2.411 3.0 0.0415
solutions can be appreciated. We report in Table 2 the values of the advection time scale τa , the diffusion time scaleτν and the corresponding value of the Reynolds number, as defined above, in different locations along the vertical linex = 0 for either the Glycerol experiment or the CMC experiment. For the CMC solution the values of the viscosity arealso inserted in the table. These values are computed starting from the ensemble averaged flow fields shown in Fig. 3.As we expect the diffusion time scale of the CMC solution decrease as we move away from the particle, in accordancewith the increase of its viscosity. The greater values of τν of the Glycerol solution is responsible of the faster decay ofthe velocity as shown in Fig. 3(d) with respect to the non-Newtonian case. This is even more evident for the distilled

M. Guala, A. Stocchino / European Journal of Mechanics B/Fluids 26 (2007) 511–530 519
water where the diffusion time scale is of order 102, causing the profile of the vertical velocity to decay much fasterthan with the other two fluids.
Finally, the present observations suggest that, despite of the experimental errors, the diffusion of momentum inregions of weak shear is able to act more efficiently in the CMC solution, causing the region of fluid that experiencesthe presence of the falling particle to be larger with respect to its Newtonian counterpart.
5.2. Particle rebound
We show in Fig. 4(a) a sequence of images of fluorescent dye during a particle–wall collision in clear water,in which the Reynolds number is approximately 104. Images were taken by a 500 fps camera. Fluorescent dye waslocated at the bottom wall and in the particle settling path such to be entrained in the wake vortices behind the particle.Moreover, a small amount of glass beads of density of about 2600 kg m−3 and diameter ranging 250–500 µm werelocated at the bottom wall. The flow region was illuminated by a continuous laser sheet (laser thickness of aboutD/10). In each frame the time has been indicated considering the instant of the impact as t = 0 s. In plate (a) of Fig. 4the first two frames show the particle still settling before the impact with the bottom wall, part of the wake behind theparticle is visible. Starting from the impact t = 0 s to the frame at t = 0.01 s � D/wi , which corresponds to the timerequired by the particle to move upwards of one diameter, the wake vortex continues to move downwards, rolling overthe particle, driven by its inertia and by a self-induced motion caused by its vorticity field. After the impact, the wake-shed vortices are attracted below the particle by a pressure gradient between these structures and the surrounding fluidgenerated by the motion of the particle itself. In plate (b) of Fig. 4 a magnified images shows the instant at t = 0.006 swhere it is clearly visible how the wake vortex is drawn under the particle. In the experiments of Eames and Dalziel[11] a secondary vortex of opposite sign is generated as the wake-shed vortex goes past the particle. The secondaryvortex is a consequence of a boundary layer separation along the particle surface due to its curvature. This secondaryvortex as the time goes breaks into two different structures: part of it remains confined in a region between the particleand the bottom wall, whilst a second part is advected by the primary vortex, becoming sheet-like, and, eventually, itenvelops the wake vortex, see Fig. 2 plates (e–j) of [11]. The effect of this secondary vorticity field of opposite sign onthe wake vortex is to divert its motion onto an inclined direction with respect to the wall. In the present experiment,the secondary vortex is not observed neither in the visualization nor in the measured flow fields. It is reasonable tosuppose that the rebound of the particle does not enable the secondary vortex to be generated. However, vorticity ofthe opposite sign with respect to the primary vortex is observed between the latter and the wall in a sheet-like form, aswe will show in the following. At a time equal to 0.02 s (� 2D/wi ), plate (a) of Fig. 4, the wake vortices are still belowthe particle, while new structures appears as a consequence of the vertical motion of the sphere. The sign of rotationof these new wake vortices is opposite with respect to the primary ones, as will be shown from the measured flowfields. These structures has been observed also by Eames and Dalziel [11], studying the flow around a sphere movingimpulsively from rest at the bottom wall. As time increases, t � 3–8D/wi , the primary vortices propagate away fromthe impact point, weakening their intensity because of viscous dissipation. In plate (c) of Fig. 4 an enlargement ofthe frame at t = 0.03 s (� 3D/wi ) is presented, showing the presence of trailing vorticity behind the particle, asthis moves away from the wall. Vorticity is generated by the motion of the particle and part of it is concentrated inthe wake vortices – high concentration of fluorescent dye just below the particle – and the rest is left behind in theform of trailing vorticity, as described also in [11]. In the present experiment the particle is free to rebound more thanonce, therefore, the flow structures responsible of the appearance of trailing vorticity are then destroyed by the fallingparticle itself before the second rebound.
In the rest of the section we discuss the results obtained by the measured velocity fields, integrating and expandingthe observations presented above based on the visualization.
The main output of PIV measurements is a sequence of two-dimensional vector fields at different times. Startingfrom the above flow fields, we have estimated other fluid mechanical quantities to identify the main features of the phe-nomenon under investigation. To help the identification of the vortical structures at each time step we have calculatedthe swirling strength λci for each vector filed. The quantity λci is defined as the positive imaginary part of the complexeigenvalue of the tensor of the local velocity gradients [21], and it is more efficient than the vorticity to identify avortex, since it is not affected by region of pure shear. The wake-shed vortex is expected to have a toroidal shape andto intersect the laser sheet leaving a pair of vortices as a typical signature. Fig. 5 shows a typical sequence of instan-taneous vectors fields together with contours of swirling strength of the Glycerol experiment, plates (a.1–c.1), and ofthe CMC experiments, plates (a.2–c.2). For sake of clarity we have not inserted an analogue sequence for the distilled

520 M. Guala, A. Stocchino / European Journal of Mechanics B/Fluids 26 (2007) 511–530
Fig. 4. Sequence of images obtained during a particle wall collision. Fluorescent dye is entrained in the wake vortices and it is also located in thebottom wall (a). Plates (b) and (c) depicts the wake vortices traveling towards the wall while the particle is bouncing back and the formation oflarge scale structure, respectively.
water experiment. In particular, plates (a.1) and (a.2) correspond to the particle impact where it is visible part of thewake vortex behind the falling particle. Plates (b.1) and (b.2) show the flow fields after a time equal to ∼ 1.5D/wi
while the particle is still moving upwards, see for comparison Fig. 4 for t = 0.014 s. The wake vortices are clearlyidentified close to the bottom wall, while a pair of vortices appears just behind the rising particle as a consequence ofthe generation of vorticity during the particle motion. Finally, in plates (c.1) and (c.2) a later instant when the particle

M. Guala, A. Stocchino / European Journal of Mechanics B/Fluids 26 (2007) 511–530 521
Fig. 5. Instantaneous flow fields at different times together with contours of the swirling strength λci for Glycerol solution, (a-c.1), and CMCsolution, (a-c.2). Panel (a.1-2): particle impact; Plate (b.1-2): flow fields after t ∼ 1.5D/wi , the vortices close to the bottom wall are the vorticesshed during the particle settling, while the vortices below the particle are generated by the upward motion of the particle itself; Panel (c.1-2); inthese flow fields the particle is moving again toward the wall, destroying the vorticity field generated during its upward motion. Meanwhile, theprimary vortices are propagating laterally.
is again moving downwards is presented for both fluids. At this time the wake-shed vortex has moved away fromthe impact point driven by the self-induced motion associated with its vorticity field. Comparing the measurementsobtained with Glycerol and CMC shown in Fig. 5 no significant differences have been recognized in term of velocityfields and vortical structures evolution, i.e. swirling strength distribution and intensity, suggesting that the flow gener-ated by the impact of the particle depends mainly on the shear thinning character of the non-Newtonian fluid. Someresidual difference detectable from the instantaneous flow fields may be ascribed to the lower spatial resolution of thevelocity measurements in the CMC experiments.
In the description of the flow visualization we have claimed that the primary wake vortex is attracted below theparticle after the rebound by a pressure gradient, generated by the rising sphere, between the vortex itself and thesurrounding fluid. In an attempt to support the above statement, we analyzed an instantaneous flow field obtained ashort time after the rebound of the particle (Fig. 6). We notice that the vortex core is located at a distance smaller

522 M. Guala, A. Stocchino / European Journal of Mechanics B/Fluids 26 (2007) 511–530
Fig. 6. Instantaneous flow field after the rebound in the Glycerol experiment while the particle is moving away from the bottom wall: contour ofthe pressure gradient modulus |∇p| =
√(∂p/∂x)2 + (∂p/∂z)2. The intensity of |∇p| suggests that the fluid is accelerating between points 1 and 2
and between points 4 and 5, at the same time, decelerating between points 2 and 3 and between points 5 and 6.
than the particle radius D/2 from the impact region. This observed distance is also smaller compared to the onederived statistically (discussed in the next section) and corresponding to the most probable location of the vortex coreafter the particle rebound. This suggests, in agreement with the flow visualization in Fig. 4, that the wake vortexis recalled towards the impact point, before expanding radially. Superimposed on the flow field in Fig. 6 we showthe modulus of the pressure gradient, defined as |∇p| = √
(∂p/∂x)2 + (∂p/∂z)2. We have computed the pressuregradients starting from the instantaneous velocity field following the procedure suggested by Imaichi and Ohmi [22].We acknowledge some limitation of the above computation, in particular we disregard the time dependence of thevelocity fields, so that we employ the steady two-dimensional Navier–Stokes equations as in [22]. However, on aqualitatively ground, we expect to infer useful information. The distribution of the modulus of the pressure gradientis related to the acceleration/deceleration that the fluid experiences during the motion of the particle. In fact, from aclose inspection of Fig. 6, the intensity of the modulus of the pressure gradient suggests that the fluid is acceleratingbetween the points labeled 1 and 2 in the figure and between the points labeled 4 and 5. In the meanwhile, the fluidundergoes an intense deceleration between point 2 and 3 and point 5 and 6. The acceleration/deceleration between 1, 2and 3 is due to the upstream influence of the particle motion, typical of a flow around a spherical body. The interactionbetween the wake-shed vortex and the bottom wall is the reason of the pressure gradient distribution along point 4, 5and 6.
5.3. Flow adjacent to the bottom wall
In this section, we discuss the characteristics of the flow adjacent to the bottom wall triggered during the impactand its interactions with the primary wake vortices. Fig. 7 shows two instantaneous velocity fields at the impactduring the experiment with Glycerol solution plate (a) and CMC solution plate (b) together with contours of out-of-plane vorticity ωy . The vorticity field is coherent with the qualitative description presented at the beginning ofthe paragraph. On a qualitatively ground, the distribution of the out-of-plane vorticity ωy in the two cases is quitesimilar in term intensity and distribution. However, some differences are detectable, in particular, the vorticity fieldseems more intense around the particle in the case of Glycerol solution with respect to the CMC experiment. Thesame difference is observed in the thin layer close to the bottom. These differences may be ascribed either to someexperimental errors, as already pointed out, or to small scales mechanisms that, unfortunately, occur at scales too

M. Guala, A. Stocchino / European Journal of Mechanics B/Fluids 26 (2007) 511–530 523
(a)
(b)
Fig. 7. Instantaneous flow fields before the collision together with contours of vorticity ωy for Glycerol solution (a), and CMC solution (b). Notethat the particle center is located 7 mm above the wall.
small compared with the accuracy of the present measurements. Note, however, that the fields shown in Fig. 7 are twoinstantaneous, chosen because the particle was at the same height. As mentioned above, a more quantitative analysiswill be presented in the next section.
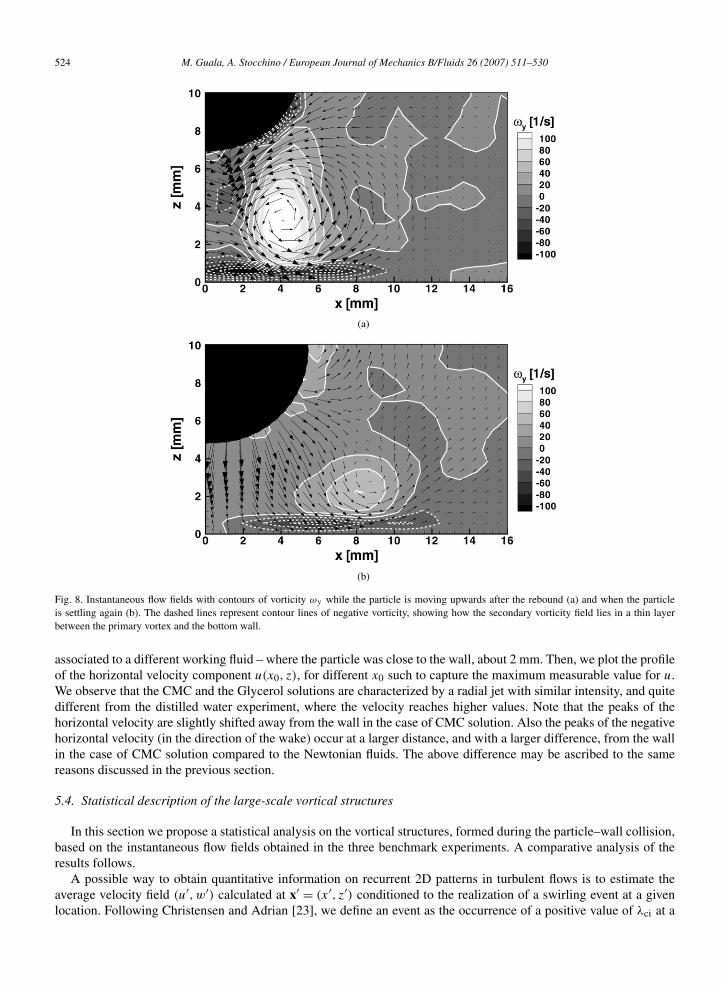
During the impact, a jet of fluid is created by the particle close to the bottom wall and the sign of the associatedvorticity field is coherent with Eames and Dalziel [11] observation and opposite with respect to the primary vortex.However, the evolution of this sheet-like layer of vorticity is quite different from the description of the previousauthors. In fact, we observe that this secondary vorticity field remains trapped between the primary vortex and thebottom wall, while the wake vortex propagates away, as shown in Fig. 8 in which two different instant after therebound are reported for the Glycerol experiment. On the contrary, Eames and Dalziel [11] state that this vorticity isrelated to part of what they called secondary vortex and that the secondary vortex wraps around the primary vortex asit moves away from the impact. The reason for this apparent discrepancy may be attributed to: in the present study theparticle is free to rebound and, thus, the secondary vortex has no time to develop as in [11]; the spatial resolution ofthe measurements is not accurate enough to capture so fine scale flows.
We have finally performed a comparison between the three working fluids in term of large scale velocity profiles.In particular, in Fig. 9 we report a comparison between the instantaneous profiles of the horizontal component of thevelocity detected in different horizontal location, immediately at the side of the particle, chosen such as to capturethe maximal jet velocity. To prepare the plot of Fig. 9, we have selected three instantaneous flow fields – each one
524 M. Guala, A. Stocchino / European Journal of Mechanics B/Fluids 26 (2007) 511–530
(a)
(b)
Fig. 8. Instantaneous flow fields with contours of vorticity ωy while the particle is moving upwards after the rebound (a) and when the particleis settling again (b). The dashed lines represent contour lines of negative vorticity, showing how the secondary vorticity field lies in a thin layerbetween the primary vortex and the bottom wall.
associated to a different working fluid – where the particle was close to the wall, about 2 mm. Then, we plot the profileof the horizontal velocity component u(x0, z), for different x0 such to capture the maximum measurable value for u.We observe that the CMC and the Glycerol solutions are characterized by a radial jet with similar intensity, and quitedifferent from the distilled water experiment, where the velocity reaches higher values. Note that the peaks of thehorizontal velocity are slightly shifted away from the wall in the case of CMC solution. Also the peaks of the negativehorizontal velocity (in the direction of the wake) occur at a larger distance, and with a larger difference, from the wallin the case of CMC solution compared to the Newtonian fluids. The above difference may be ascribed to the samereasons discussed in the previous section.
5.4. Statistical description of the large-scale vortical structures
In this section we propose a statistical analysis on the vortical structures, formed during the particle–wall collision,based on the instantaneous flow fields obtained in the three benchmark experiments. A comparative analysis of theresults follows.
A possible way to obtain quantitative information on recurrent 2D patterns in turbulent flows is to estimate theaverage velocity field (u′,w′) calculated at x′ = (x′, z′) conditioned to the realization of a swirling event at a givenlocation. Following Christensen and Adrian [23], we define an event as the occurrence of a positive value of λci at a

M. Guala, A. Stocchino / European Journal of Mechanics B/Fluids 26 (2007) 511–530 525
Fig. 9. Instantaneous z-profiles at x0 = 6.3,7,7.7,8.4 mm of the fluid velocity component in the x direction, u(z), as depicted in figure (d) forwater, (a), Glycerol, (b) and CMC, (c).
given location (x), i.e. we seek for the flow field statistically associated with the presence of a vortex unambiguouslylocated at a right-hand side of the impact region. Stochastic estimation provides the best linear estimate, in a meansquare sense, of conditional averages [24]:
⟨u′
j (x′)|λci(x)
⟩ ≈ Ljλci(x), j = 1,2, (6)
where x = (x, z), u1 = u, u2 = w and the kernel Lj is determined by minimizing the mean square error between theestimate and the conditional average, leading to the following relationship:
⟨u′
j (x′)|λci(x)
⟩ ≈ 〈λci(x)u′j (x
′)〉〈λci(x)λci(x)〉 λci(x). (7)
The vortex cores spread through a region of the flow which ranges about a particle diameter D in the vertical directionand extends a few particle diameters in the horizontal direction. In fact, the vortex structure evolves substantiallyparallel to the wall, with no systematic evidence of lift-up phenomena. It is thus possible to define a fluid region wherethe flow field depends mainly on the x coordinate, i.e. on the distance from the impact point, while it can be assumedhomogeneous in z. Note that it is not strictly important where the vortex is precisely located in the z direction, once itis confined within a layer of thickness of the order of the particle diameter. Hence, the given event λci(x) can be chosen

526 M. Guala, A. Stocchino / European Journal of Mechanics B/Fluids 26 (2007) 511–530
as λci(xref). The non-normalized two point correlation between swirling strength and velocity can be thus written inthe form:
⟨u′
j (x′)λci(x)
⟩ = ⟨λci(xref, z)u
′(x, z + rz)⟩, (8)
where rz spans in the vertical direction within a layer of fluid close to the wall of thickness of the order of theparticle diameter. Since the event is unambiguously determined by the scalar variable λci(xref), one can assume anypositive value for such quantity. The estimate of the conditionally-averaged velocity field is then determined by a twodimensional vector field, whose magnitude is globally amplified or damped by the choice of λci(xref). The resultingtwo dimensional pattern is therefore affected by the choice of a different swirling strength intensity only through ascaling factor. Furthermore, since the stochastically-estimated velocity field is strongest around the event point andweaker in its neighborhood, the length of each vector is not representative of the real flow. This procedure allows toobtain information only about persistent patterns of vortex cores with no distinction on their swirling magnitude. Thisanalysis can be performed several times varying the xref location of the given swirling event.
In order to detect the most probable location of the vortex structure at the side of the impact region, we select theevent such that the two point correlation coefficient of the swirling strength ρλλ(x, xref, rz) is maximum, i.e. whereswirling motions are statistically concentrated among all their possible realizations. It reads:
ρλλ(x, xref, rz) = 〈λci(xref, z)λ′ci(x, z + rz)〉
(σλ(xref)σλ(x)), (9)
where σ refers to the root-mean square of the given quantity. Since the correlation coefficient is normalized, thelocation xref that allows for the highest correlation of swirling motions does not depend on the vortex intensity, butonly on the most persistent flow configuration, i.e. where the signature of the toroidal structure on the laser sheetis most likely located. In Fig. 10, an example of the results obtained by the analysis discussed above is presented.In particular, different contour plots of ρλλ(x, xref, rz) for different location xref are shown for the CMC solution.Changing the values of xref it is always possible to find a location where the two point correlation has a maximum, inthe example of Fig. 10 (the lowest panel) a maximum is found around a position xref � 7 mm.
Moreover, we calculate the averaged flow fields conditioned to the occurrence of a swirling event located wherethe peak of the ρλλ(x, xref, rz) correlation coefficient occurs, such to obtain the two-dimensional flow configuration ofthe vortex structure, after each impact, at the most probable location. We repeat the calculation of both the two pointcorrelation and the consequent averaged conditioned flow field for the three benchmark fluids analyzed in the presentinvestigation. This procedure yields a quantitative statistical description of the vortical structures generated during theparticle impact in the three cases, allowing for a direct comparison.
In Fig. 11 the conditional averaged flow field, after the first rebound is presented in two successive time moments,showing two consecutive steps of the evolution of the vortical structure in the three fluids. A first observation regardsthe distilled water experiment; in fact, the vortex core in this case is located farther, 9 mm and 12.5 mm after the firstand before the second rebound respectively, if compared with the Glycerol, 7.5 mm and 10 mm after the first andbefore the second rebound respectively, and CMC solutions, 7 mm and 10.5 mm after the first and before the secondrebound respectively.
This result is not unexpected since the formation and the evolution of a vortical structures is strongly influenced bythe advection of vorticity and thus by inertial forces. This is reflected in the fact that the Reynolds number is an orderof magnitude higher in the case of water, compared to the Glycerol and the CMC solutions, mostly due to the lowervalue of the dynamic viscosity of the fluid (the settling velocity in water is only 17% higher). It is also consistent withthe larger velocity observed in the radial jet in the water case.
A more interesting result regards the comparison between the Glycerol solution and the CMC solution. Fig. 11suggests that the two fluids have the same statistical behavior with good approximation. The reconstructed flowpatterns seem to evolve similarly regardless the viscoelastic character of the CMC. This implies that even for thenon-Newtonian fluid here investigated the viscosity (for a given particle size and impact velocity) is still the mainproperty that controls the flow and, therefore, its shear thinning character more than its elasticity.
We remind that the Glycerol used in the experiments was selected with a viscosity that matched the non-Newtonianviscosity evaluated on the flow properties. This suggests that the proposed choice for the typical velocity scale (wi )and length scale (D), discussed in Section 4, well describes the evolution of the flow pattern observed, at least for lowDeborah numbers. This result could be considered as an extension of previous conclusions drawn on the pure settling

M. Guala, A. Stocchino / European Journal of Mechanics B/Fluids 26 (2007) 511–530 527
Fig. 10. ρλλ(x, xref, rz) contour for different xref in the case of CMC solution: we note a maximum for xref � 7 mm.
in non-Newtonian fluid, where the same scaling was adopted and no significant differences with the Newtonian casewere detected for De � 1 [14,19], although in the present investigation the Reynolds number assumes value much

528 M. Guala, A. Stocchino / European Journal of Mechanics B/Fluids 26 (2007) 511–530
Fig. 11. Conditional averaged flow field after the 1st impact for maximum ρλλ(x, xref, rz): water (top panel), Glycerol solution (mid panel), andCMC solution (bottom panel). Note that, after the first rebound, the flow fields have been divided into two subsets (i) earlier time, while the particleis moving upward, (left column) (ii) later time, while the particle is moving downward before impacting a second time (right column).
greater than unity. Thus, the results presented suggest that the elasticity is ineffective on the flow structures generatedby the impact of a spherical particle on a rigid wall. The evolution of the vortical structures occurs on a time scale moreconsistent with the inertial time scale than with the relaxation time. However, this does not imply that the elasticityhas a minor role in the complex interaction between the particle and the wall, as shown in [13]. Note that the valueof the Deborah number is affected by the scales selected. In fact, if we use the scales proper for the lubrication layerin which the diameter is no longer the representative length scale, we obtain, for the same experimental parameter(particle diameter, CMC concentration, impact velocity) of the present study, a Deborah number much higher, namelya value equal to 2.6, indicating a more significant role of the elastic stresses at those scales.
6. Conclusions
The phenomenology of particle–wall collision and rebound in Newtonian and viscoelastic shear thinning fluids(De � 1) has been analyzed experimentally by means of Particle Image Velocimetry. Results confirm the key role of

M. Guala, A. Stocchino / European Journal of Mechanics B/Fluids 26 (2007) 511–530 529
the particle wake vortices on the formation of a large-scale vortical structures caused by the particle impact against thebottom wall (see Eames and Dalziel [11]). The comparative analysis on such vortical motions performed in the caseof water, aqueous solution of Glycerol (Newtonian) and aqueous solution of CMC (non-Newtonian, shear thinning,weakly viscoelastic), showed that their key features mainly depend on the Reynolds number. In the present workthe Reynolds number is varied through the dynamic viscosity. The CMC aqueous solution have the same apparentviscosity, for a given shear rate γ̇ = wi/D, of the glycerol solution. Therefore the shear thinning character of thenon-Newtonian fluid is, though in the most simple way, taken into account. The comparative analysis was carried outfocusing on both the instantaneous and the statistical behavior of the vortical structures, formed during the particleimpact. No significant differences were observed comparing the large scale features of the flow, in Glycerol and CMCsolutions with De � 1. Minor differences between the above two fluids may be ascribed to small scales mechanismsthat occur at scales beyond the resolution of the present measurements. Moreover, the effect of elasticity, which issignificant in the lubrication layer [13], seems to be ineffective on the scales typical of the vortical structures observed.Results suggest that, for the large scale structures of this flow, the Reynolds number dependency can be extended to thecase of shear thinning fluids, provided an appropriate scaling for the necessary to define the proper viscosity η = τ/γ̇ .We acknowledge the limitations of the present study in the limited number of benchmark cases, further experimentswould be required to extend the present observation to more viscoelastic fluids and to different particles (for a rangeof values of wi/D). However we can speculate that, regardless of the variety of viscoelastic fluids, the true limitingfactor to the extension of known theories to the case of non-Newtonian fluids through the apparent viscosity, dependsmainly on the limited range of scales displayed by the flow, i.e. whether a single velocity and a single length scale canbe chosen or not.
Acknowledgements
Support from the Fondazione Cassa di Risparmio di Verona, Vicenza, Belluno and Ancona (RIMOF Project)is acknowledged. The authors are thankful to the Hydraulic Laboratory at DIAM, Genova and to Dr. Liberzon atETH Zurich. The first author gratefully acknowledge also funding by the ETH research commission under grant TH15/04-2. The anonymous referees are acknowledged for their helpful comments.
References
[1] W.C. Hinds, Aerosol Technology, second ed., Wiley, New York, 1999.[2] C. Crowe, M. Sommerfeld, Y. Tsuji, Multiphase Flows with Droplets and Particles, CRC Press LLC, 1998.[3] P. Coussot, Mudflow Rheology and Dynamics, IAHR Monograph Series, Balkema, 1997.[4] A. Ferrante, S. Elgobashi, On the physical mechanisms of two way coupling in particle-laden isotropic turbulence, Phys. Fluids 15 (2) (2003)
315–329.[5] R.M. Iverson, The physics of debris flow, Rev. Geophys. 35 (3) (1997) 245–296.[6] R.H. Davis, J.M. Serayssol, E.J. Hinch, The elastohydrodynamic collision of two spheres, J. Fluid Mech. 163 (1986) 479–497.[7] G. Barnocky, R.H. Davis, Elastohydrodynamic collision and rebound of spheres: Experimental verification, Phys. Fluids 31 (1988) 1324–
1329.[8] G. Joseph, J.R. Zenit, M.L. Hunt, A.M. Rosenwinkel, Particle–wall collision in a viscous fluid, J. Fluid Mech. 433 (2001) 329–346.[9] R.H. Davis, D.A. Rager, B.T. Good, Elastohydrodynamic rebound of spheres from coated surfaces, J. Fluid Mech. 468 (2002) 107–119.
[10] P. Gondret, M. Lance, L. Petit, Bouncing motion of spherical particles in fluids, Phys. Fluids 14 (2) (2002) 643–652.[11] I. Eames, S.B. Dalziel, Dust resuspension by the flow around an impacting sphere, J. Fluid Mech. 403 (2000) 305–328.[12] A. ten Cate, C.H. Nieuwstad, J.J. Derhsen, H.E.A. Van den Akker, Particle imaging velocimetry experiments and lattice-Boltzman simulations
on a single sphere settling under gravity, Phys. Fluids 14 (11) (2002) 4012–4025.[13] A. Stocchino, M. Guala, Particle–wall collision in shear thinning fluids, Exp. Fluids 65 (2005) 17–46.[14] B. Mena, O. Manero, L.G. Leal, The influence of rheological properties on the slow flow past spheres, J. Non-Newtonian Fluid Mech. 26
(1987) 247–275.[15] L.E. Becker, G.H. McKinley, The unsteady motion of a sphere in a viscoelastic fluid, J. Rheol. 38 (2) (1994) 377–403.[16] W.M. Jones, A.H. Price, K. Walters, The motion of a sphere falling under gravity in a constant-viscosity elastic liquid, J. Non-Newtonian
Fluid Mech. 53 (1994) 175–196.[17] M.T. Arigo, D. Rajagopalan, N. Shapley, G.H. McKinley, The sedimentation of a sphere through an elastic fluid. Part 1. Steady motion,
J. Non-Newtonian Fluid Mech. 60 (1995) 225–257.[18] D. Rajagopalan, M.T. Arigo, G.H. McKinley, The sedimentation of a sphere through an elastic fluid. Part 2. Transient motion, J. Non-
Newtonian Fluid Mech. 65 (1996) 17–46.[19] G. Gheissary, B.H. van den Brule, Unexpected phenomena observed in particle settling velocity in non-Newtonian media, J. Non-Newtonian
Fluid Mech. 67 (1996) 1–18.

530 M. Guala, A. Stocchino / European Journal of Mechanics B/Fluids 26 (2007) 511–530
[20] E.T.G. Bot, M.A. Hulsen, B.H.A.A. van den Brule, The motion of two spheres falling along their line of centres in a Borger fluid, J. Non-Newtonian Fluid Mech. 79 (1998) 191–212.
[21] M.S. Chong, A.E. Perry, B.J. Cantwell, A general classification of three dimensional flow field, Phys. Fluids 2 (5) (1990) 765–777.[22] K. Imaichi, K. Ohmi, Numerical processing of flow-visualization pictures-measurements of two-dimensional vortex flow, J. Fluid Mech. 129
(1983) 283–311.[23] K.T. Christensen, R.J. Adrian, Statistical evidence of hairpin vortex packets in wall turbulence, J. Fluid Mech. 431 (2001) 433–443.[24] R.J. Adrian, B.J. Jones, Y. Hassan, C.K. Nithianandan, A.T.C. Tung, Approximation of turbulent conditional averages by stochastic estimation,
Phys. Fluids 1 (6) (1989) 992–998.[25] M.T. Ghanam, M.N. Esmail, Rheological properties of carboxymethyl cellulose, J. Appl. Polym. Sci. 64 (1997) 289–301.[26] M. Edali, M.N. Esmail, G.H. Vatistas, Rheological properties of high concentrations of carboxymethyl cellulose solutions, J. Appl. Polym.
Sci. 79 (2001) 1787–1801.