
Language Impaired Children's Listening to Speech in Noise A ...
187
Language Impaired Children’s Listening to Speech in Noise A Deficit to be Remediated? Csaba David RedeyNagy Department of Speech, Hearing and Phonetic Sciences University College London A thesis submitted for the degree of Doctor of Philosophy February 2016
-
Upload
khangminh22 -
Category
Documents
-
view
1 -
download
0
Transcript of Language Impaired Children's Listening to Speech in Noise A ...

Language Impaired Children’s Listening to Speech in Noise
A Deficit to be Remediated?
Csaba David Redey-‐Nagy
Department of Speech, Hearing and Phonetic Sciences
University College London
A thesis submitted for the degree of Doctor of Philosophy
February 2016
2 LANGUAGE IMPAIRED CHILDREN’S LISTENING TO SPEECH IN NOISE
Declaration
I, Csaba Dávid Rédey-‐Nagy, confirm that the work presented in this thesis is my own. Where information has been derived from other sources, this has been clearly indicated.
Csaba Rédey-‐Nagy
LANGUAGE IMPAIRED CHILDREN’S LISTENING TO SPEECH IN NOISE
3
Acknowledgements I would like to express my gratitude to my main supervisor, Professor Stuart Rosen, who could have given up on me many times, but did not. He guided me patiently even when I asked basic questions, particularly concerning statistics. He waited when I was not ready, which was the case most of the time. The conversations may not always have been strictly about my research or research at all, but if anything I enjoyed those chats even more than the research related teaching. His insights and way of thinking about this area of enquiry is accurate and thorough and I hope I have managed to learn at least some of the attitude he displays towards speech and hearing science.
Special thanks go to my second supervisor, Dr. Lorna Halliday, who was well-‐suited to complement Stuart’s support on the more personal level. Her understanding and calm enthusiasm will have an effect on me long after I finish my studies, I am sure. I am thankful to Professor Chris Donlan and to the departments at the Division of PALS for awarding me the teaching assistantship that enabled me to carry out this research.
I received an enormous amount of help from Steve Nevard in practical matters in the speech lab from calibrating the devices used in my experiments to ways of recording and editing speech material, for which I’d like to thank him. I cannot imagine the speech lab without him now that he has retired! My thanks also go to Mike Coleman for being so helpful in the initial planning of my training programme, Marcin Pacyna and Dave Cushing for helping out with computers and other daily affairs. I should also mention my gratitude to Sarah Alleemudder for being so supportive and flexible in financial matters, Natalie Wilkins (Berry) for being the best and most knowledgeable admin officer of all time and Muhsin Abubakar for being simply a nice and kind welcome at the entrance of Chandler House.
I am extremely grateful to the schools, speech and language therapists, teachers and teaching assistants through whom the most important element of this research project was made available: the participating children and their parents. My thanks go specifically to Linda Hinton, the teachers and TAs at Applegarth; Liz Reeves, Laura Wyllie and the TAs at Greenacres; Monal Gajjar at Oakington. I also thank Konstantinos Vasileiou for the fruitful cooperative work and his help with testing. I am grateful to Richard Glaves and Siobhain Prendergast for giving their voice for the training programme.
The research related activity was not all I spent my time on during my years at UCL. Teaching on the BSc and MSc Speech and Language Sciences courses under the guidance of Dr. Rachel Rees was one of the most enjoyable and rewarding academic experiences one could ask for. Rachel is a fantastic colleague and amazing teacher from whom I learnt a tremendous amount both about university teaching and the clinical science of speech and language therapy. I am grateful to Rachel for this opportunity and to every other member of staff with whom I had the chance to co-‐teach. I feel this was a unique and precious experience for me that I will remember fondly for a long time to come.
Other UCL departments also provided support to PhD students in the form of courses and workshops. I am specially thankful to Dr. Rosalind Duhs whose course on teaching in higher education I excessively enjoyed, and it changed my perspectives in their foundations not only on academic teaching and learning, but indeed, on life, no less.
I give thanks to my fellow PhD students whose informal support and companionship was a great addition to my learning experience. Last, but not least I’d like to thank all my friends in

4 LANGUAGE IMPAIRED CHILDREN’S LISTENING TO SPEECH IN NOISE
London including Elyas and Elias, who encouraged me to keep going and supported me whenever I needed support; my thanks also go to my friend Anshul in Canada who was the best support I could get in the final months of this huge endeavour.
LANGUAGE IMPAIRED CHILDREN’S LISTENING TO SPEECH IN NOISE
5
Abstract
The objective of the research described below was to investigate the speech
perceptual skills of children with specific language impairment (SLI), and the
relationship between auditory attention and speech perceptual skills in SLI and age-‐
matched controls. Computerised tasks were used to explore the perception of
connected speech in the presence of various types of maskers. Apart from the
language measures, auditory attention skills, phonological short-‐term memory and
processing and literacy skills were also investigated. The SLI group was expected to
perform less well on all these tasks, including the attention measures. Their
performance on the speech in noise tasks was of particular interest as few systematic
studies have investigated this before. Results generally confirmed a difference in
speech perceptual abilities, phonological processing and literacy skills, but not in
auditory attention. Most deficits were present only in a subgroup of the SLI children,
while others performed similarly to controls. Following the perception study, a six-‐
week auditory training regime was designed and administered in a subgroup of the
language-‐impaired children. Measures of speech perception in noise were conducted
before and after the training and a follow-‐up assessment of language, attention and
literacy abilities was carried out to investigate gains, their generalisation and retention.
Implications of the study to language-‐impaired children’s education and therapy are
discussed.
6 LANGUAGE IMPAIRED CHILDREN’S LISTENING TO SPEECH IN NOISE
TABLE OF CONTENTS
ACKNOWLEDGEMENTS 3
ABSTRACT 5
LIST OF TABLES 9
LIST OF FIGURES 9
CHAPTER 1 INTRODUCTION 14
1.1 Language impairment – putting it in historical context 14
1.2 Deficits in specific language impairment 16 1.2.1 Deficits in morpho-‐syntax 17 1.2.2 Deficits in semantics 17 1.2.3 Deficits in phonology 18 1.2.4 Memory deficits 18 1.2.5 Motor deficits 20 1.2.6 General cognitive skills 20 1.2.7 Speech perception in SLI 21 1.2.8 Categorical perception in SLI 26 1.2.9 Role of attention in SLI 28
1.3 Auditory training 32
1.4 Objective of the present project 35
CHAPTER 2 STUDY ONE: SPEECH PERCEPTION IN NOISE, CATEGORICAL PERCEPTION AND ATTENTION IN SLI 38
2.1 Background 38 2.1.1 Ethics approval 38
2.2 Method 38 2.2.1 Participants 38 2.2.2 Test battery 40 2.2.3 Procedure 46 2.2.4 Equipment 47
2.3 Results 47 2.3.1 Effects of age and group 47 2.3.2 Attention levels 62 2.3.3 Attention and speech perception 64
2.4 DISCUSSION 65

LANGUAGE IMPAIRED CHILDREN’S LISTENING TO SPEECH IN NOISE
7
CHAPTER 3 STUDY TWO: SPEECH PERCEPTION IN VARIOUS TYPES OF NOISE IN SLI 69
3.1 Background 69
3.2 Method 70 3.2.1 Participants 70 3.2.2 Test battery 73 3.2.3 Procedure 81 3.2.4 Equipment 82
3.3 Results 82 3.3.1 Sustained auditory attention 84 3.3.2 Effects of age and group on speech perception 86 3.3.3 Speech perception and language 106 3.3.4 Non-‐word repetition 108 3.3.5 Literacy and speech perception 113 3.3.6 Discussion 116
CHAPTER 4 STUDY THREE: AUDITORY TRAINING IN SLI 122
4.1 Background 122
4.2 Participants 122
4.3 Pre-‐training assessments 123 4.3.1 Screening 123 4.3.2 Language assessment 124 4.3.3 Attention measures 124 4.3.4 Non-‐word repetition task 124 4.3.5 Literacy skills 125 4.3.6 Speech perception measures 126
4.4 Equipment 126
4.5 The training programme 127 4.5.1 Background 127 4.5.2 Structure and use of the iPad app Noisy Castle 128 4.5.3 Training plan for each child 129 4.5.4 Starting the game 129
4.6 Post-‐training assessments 138
4.7 Results 139 4.7.1 Shortcomings of the study 139 4.7.2 Effects on speech perception 140 4.7.3 SRT changes during training 143
4.8 Discussion 146
CHAPTER 5 DISCUSSION 149
5.1 Attention across groups and age 149
5.2 Speech perception in noise 150
8 LANGUAGE IMPAIRED CHILDREN’S LISTENING TO SPEECH IN NOISE
5.3 Categorical perception 152
5.4 Conclusion 153
REFERENCES 155
APPENDICES 165
Appendix 1 165
Appendix 2 166
Appendix 3 167
Appendix 4 169
Appendix 5 170
Appendix 6. 171
Appendix 7. 175
Appendix 8. 180
LANGUAGE IMPAIRED CHILDREN’S LISTENING TO SPEECH IN NOISE
9
List of Tables Table 1: Age of participants, language and non-‐verbal scores 40 Table 2: Identity of the SLI+SPD participants in the three conditions whose z>2.33 with their z-‐scores in brackets 61 Table 3: Comparison of the TD and SLI groups by age, non-‐verbal and language scores 72 Table 4: Comparison of the groups as four groups by age, non-‐verbal and language scores 73 Table 5: Effects of age, group and their interaction in the seven conditions in two groups, TD and SLI 92 Table 6: Effects of age, group and their interaction in the seven conditions in four groups 93 Table 7: Identity of children with z<>1.65 (in the two-‐group analysis) 106 Table 8: Mean z-‐scores of the two and four groups in the seven conditions 107 Table 9: Results of t-‐tests on the baseline measures of the trained and untrained groups 142
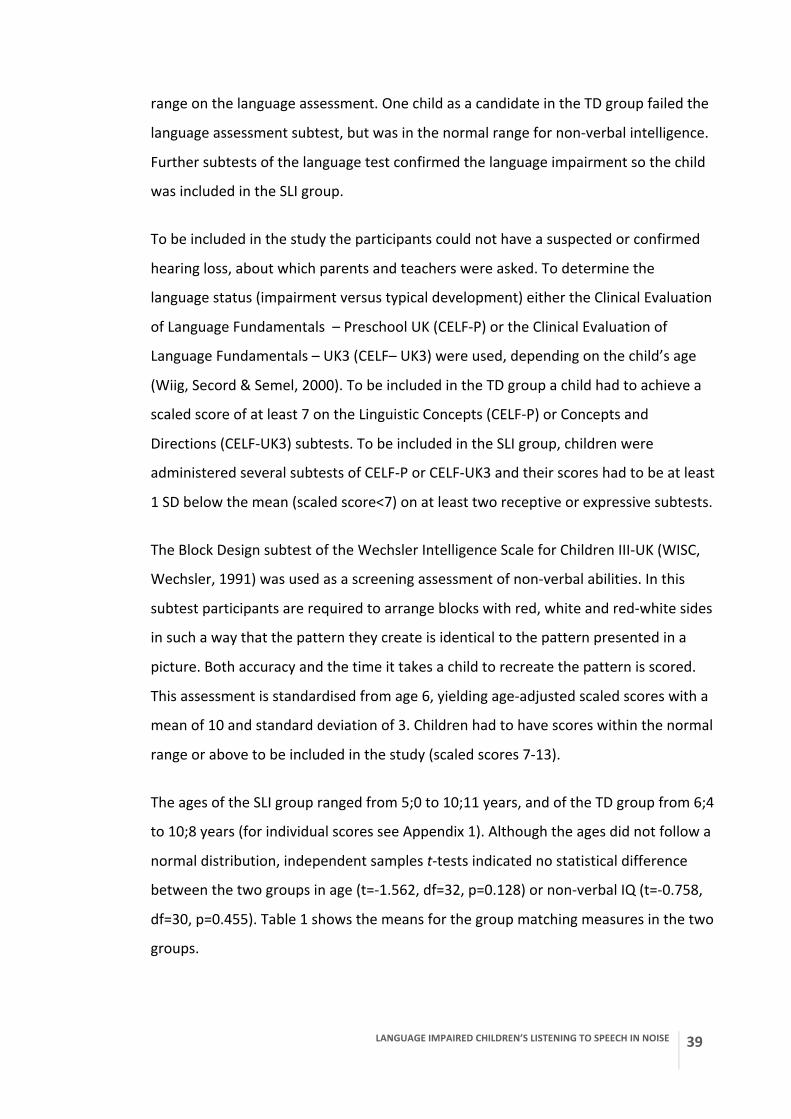
List of Figures Figure 1: An example of stimulus pictures displayed in the Who is right? task. Here the target word is ‘dog’ 42 Figure 2: An example adaptive track from Who is Right? 43 Figure 3: Graph of a typical response function and adaptive track in the pea-‐bee task 44 Figure 4: An example of the stimulus response pad in the CCRM task 45 Figure 5: Scatterplot of the SRTs in the Who is right? task in the two groups 48 Figure 6: Boxplot displaying the effect of group on the speech reception threshold 49
Figure 7: Scatterplot of the SRTs in the two groups with regression lines fitted 50
10 LANGUAGE IMPAIRED CHILDREN’S LISTENING TO SPEECH IN NOISE
Figure 8: A scatterplot showing the effect of age on the slope (in log10) on the bi:/pi: task in both groups (including all trials) 52 Figure 9: A scatterplot showing the effect of age and group on the slope (in log10) (responses to mid-‐range stimuli only) 53 Figure 10: Results in the speech-‐spectrum noise condition in the two groups 55 Figure 11: Scatterplot of z-‐scores (standardised residuals controlled for age). Five data points of the SLI group and one in the TD group are clearly visible as falling outside the normal range, while all others are within the normal range 56 Figure 12: Scatterplot displaying the SRTs of the two groups in the modulated speech noise condition 57 Figure 13: Scatterplot of the data in the modulated noise condition after the removal of the SLI+SPD children’s data with regression lines showing improvement with age in both groups 58 Figure 14: Scatterplot of the SRTs in the interfering speaker condition with regression lines showing improvement with age in the TD group, but no improvement in the SLI group 59 Figure 15: Scatterplot of the results in the interfering speaker condition displaying the different rate of improvement with age in the two groups 60 Figure 16: Boxplots displaying the TEA-‐Ch scaled scores in the two groups 62 Figure 17: Scatterplot showing the distribution of the TEACh scaled scores in the two groups 63 Figure 18: Scatterplot of the TEACh z-‐scores in the two groups 64 Figure 19: The stimulus response pad on the CCRM task (Study 2) 76 Figure 20: An example of a 7x7 randomised Latin square 77 Figure 21: Process of transforming speech into noise-‐vocoded speech: The sentence is first filtered into the required number of frequency bands, then the amplitude envelope is extracted and smoothed and finally wide-‐band noise is modulated in each frequency range using this amplitude envelope (Davis et al., 2005) 81 Figure 22: Boxplots visually demonstrating that the difference between the two groups was non-‐significant on the sustained attention task, TEA-‐Ch 86
LANGUAGE IMPAIRED CHILDREN’S LISTENING TO SPEECH IN NOISE
11
Figure 23: Scatterplot showing the correlation of scores on the attention and receptive language tests in the two groups separately. The correlation is significant in the TD group, but not in the SLI group 87 Figure 24: Barplot comparing the SRT means in the monolingual SLI and TD groups 89 Figure 25: Boxplots comparing the SRTs of the groups in the seven conditions 90 Figure 26: Boxplots displaying the z-‐scores of the SRTs in the seven conditions 91 Figure 27: Scatterplot of the results of the two groups in the speech-‐shaped noise condition. This suggests an interaction, a different effect of age in the two groups, however, the data point in the top right corner is responsible for this interaction 94 Figure 28: Scatterplot of z-‐scores with a line at z=1.65 indicating the normal range 95 Figure 29: Scatterplot of the z-‐scores in the speech-‐spectrum noise condition analysed as four groups with a line at z=1.65 96 Figure 30: Boxplots showing the overlap of the four groups without the SLI children that fall outside the normal range (z>1.65) 96 Figure 31: Scatterplot of the SRTs in the opposite-‐sex talker condition in two groups. Note that the regression lines indicate an interaction, which however did not reach significance 97 Figure 32: Z-‐scores of the opposite sex condition indicating the 10 data points in the SLI group that are outside the normal range 98 Figure 33: Scatterplot of the opposite-‐sex talker condition in the four groups 99 Figure 34: In the four-‐group analysis in the opposite sex condition the majority (60%) of the children with SLI fell outside the normal range 99 Figure 35: Scatterplot of the same-‐sex talker condition in two groups 100 Figure 36: Histogram displaying the distribution of the data points in the four groups 101 Figure 37: Scatterplot of the monotone condition in the four groups. Note the crossing regression lines appear to suggest an interaction, which did not reach significance 102 Figure 38: Scatterplot of the low-‐pass filtered condition in the two groups 102
12 LANGUAGE IMPAIRED CHILDREN’S LISTENING TO SPEECH IN NOISE
Figure 39: Histogram of the distribution of the data points in the four groups in the low-‐pass filtered condition 103 Figure 40: Scatterplot of the two groups in the spectrally-‐rotated condition 104 Figure 41: Scatterplot of the four groups in the single-‐channel vocoded conditon 105 Figure 42: Scatterplot showing receptive language scores and SRTs in the low-‐pass filtered speech condition (left) and expressive language scores and SRTs in the spectrally-‐rotated speech conditions (right) 108 Figure 43: Boxplots comparing the two groups on the CNRep raw scores 109 Figure 44: The two groups generally improved as they got older, but the variability was very high among the younger children in the SLI group 110 Figure 45: Boxplots comparing the EAL groups separately on the CNRep raw scores 110 Figure 46: Scatterplot of the four groups showing that they all improved with age, albeit at somewhat different rate (this was not significant) 111 Figure 47: The distribution of CNRep z-‐scores with a line at z=-‐1.65 111 Figure 48: Scatterplot of the mean CCRM z-‐scores against CNRep z-‐scores showing a significant correlation in the SLI group 113 Figure 49: Scatterplot of the TOWRE scores in the four groups with a line at SS=75.25 (1.65 SD below the mean) 115 Figure 50: Scatterplot demonstrating the relationship between scores on the dyslexia screen and the non-‐word repetition test in the SLI group 116 Figure 51: Conceptual model of auditory object formation, attention and its interactions with bottom-‐up and top-‐down processes 119 Figure 52: Starting page of the app Noisy Castle 131 Figure 53: Ground floor of the castle with entrance to the three rooms 132 Figure 54: Room 1 with a cat in the cage 133 Figure 55: Room 2 has a dog in the cage to free 134
LANGUAGE IMPAIRED CHILDREN’S LISTENING TO SPEECH IN NOISE
13
Figure 56: The stimulus pair in room 3 for coat – goat 136 Figure 57: In room 4 a pair of monkeys are to be freed from the cage 137 Figure 58: An example of words/pictures in room 4, two phonologically similar words appear together along with two other pictures with no phonological similarity 137 Figure 59: An example of the cow, three of which appear on one page and utter a word 138 Figure 60: The living room in which various objects are to be placed 139 Figure 61: The castle garden with three dinosaurs out of which selecting the Stegosaurus or the Tyrannosaurus Rex will start one of the two stories 140 Figure 62: Boxplots of the trained group’s SRTs in the three conditions: no significant improvement, if any, occurred 144 Figure 63: Boxplots of the control group’s results at the two times of testing 145 Figure 64: Boxplots of the TEA-‐Ch scaled scores before (Time 1) and 15 weeks after the training (Time 2) showing a significant improvement in the trained group 146 Figure 65: SRT changes of participant SLI5 in the various training tasks 147 Figure 66: SRT changes of participant SLI12 during training in the various tasks 147 Figure 67: SRT changes of participant SLI38 during training in the various tasks 148 Figure 68: Mean SRTs of all participants in each task 149

14 LANGUAGE IMPAIRED CHILDREN’S LISTENING TO SPEECH IN NOISE
Chapter 1 Introduction
Learning to understand and produce spoken language within a few years of birth is one
of the greatest achievements of humans. It appears to take surprisingly little effort,
even less of which is conscious. With the acquisition of language children will have
access to a range of educational and social experiences that determine their
subsequent personal and social life. The firm foundations of the process of language
acquisition are laid down in a mere two years and in about five years the system of
rules and operations of the mother tongue, also called grammar, is practically
mastered (Fromkin, Rodman & Hyams, 2007:322).
A significant proportion of children, however, fail to develop their language skills
within the usual time frame and to the expected level, for no known neurological,
perceptual or psychosocial reasons. This developmental disorder, called specific
language impairment (SLI) is estimated to occur in approximately 7% of otherwise
typically developing children (Tomblin, Records, Buckwalter, Zhang, Smith & O’Brien,
1997). Typical features of SLI include the late appearance of first words and a general
delay in language development with morphosyntax and/or semantics being more
impaired than other areas of language (Bishop, 1997:21). SLI has been identified in
many countries including several languages of the world (Leonard, 2000:116). Its
causes, however, remain poorly understood.
1.1 Language impairment – putting it in historical context
The study of language difficulties in children is not as recent as the lack of knowledge
about it in today’s societies would suggest. As early as in 1822 a French physician, Gall,
in his book Organology reported the existence of children “who know not how to
speak, although they are not idiots, and understand nearly as well as other children,
who speak” (Gall, 1835:24). According to the Austrian phoniatrician, Luchsinger, prior

LANGUAGE IMPAIRED CHILDREN’S LISTENING TO SPEECH IN NOISE
15
to this in 1757, a physician named Delius “in his work De Alalia et Aphonia described
and correctly named” the condition (Luchsinger & Arnold, 1959:25; Leonard, 2014).
Following Gall’s description for most of the 19th century such children were studied
and described by physicians who took an interest in children’s language development
and its deficits. Their publications, however, and the knowledge gathered on this
disorder do not represent a continuous and systematic information build-‐up to the
present day and their contributions were largely forgotten by the 20th century.
The term most authors used in the latter half of the 19th century was “congenital
aphasia” and although some drew parallels between the grammatical difficulties of
some adults with acquired aphasia and those of children with “congenital aphasia”,
grammar was not included in the description of the condition until the 20th century.
While the focus in this period was on the speech output and language comprehension
was considered normal, by the beginning of the 20th century some authors began to
recognise subtypes of the condition such as “congenital word deafness” (McCall,
1911), in which children have severe comprehension difficulties as well. As
neurological damage was not found in these children, it was proposed that attention
and memory limitations might be behind the disorder (Treitel, 1893). Thus, in the
course of the 20th century, “congenital aphasia” slowly included comprehension
deficits and individuals whose utterances are longer than single words, but still not at
the age-‐expected level.
Research on language disorders in the course of the 20th century slowly uncovered the
characteristics of this condition and the intervention language impaired children
benefit from. Then, from the 1970’s onwards research into this disorder intensified
with the advancement of cognitive sciences. The identification and therapy of the
condition became more and more an integral part of paediatric speech and language
therapy work. Instead of congenital aphasia, developmental dysphasia was in use until
the 1980’s when the descriptive term “specific language impairment” began to appear
in the literature.

16 LANGUAGE IMPAIRED CHILDREN’S LISTENING TO SPEECH IN NOISE
Today work concerning specific language impairment (SLI) is a fundamental part of a
speech and language therapist’s (SLT) training and professional life. When compared
to other conditions and disorders on the SLT caseload, SLI is one of the very few that
no other professional in the areas of health or education is equipped to deal with in
terms of identification, diagnosis and treatment. In this sense SLI is specific to the
clinical discipline of speech and language therapy itself and may form a central identity
of the profession. Most other disorders are treated by several professionals who are all
informed and trained in their management. Autism, for example, may be treated by a
SLT for the social communication aspects, but behavioural specialists, occupational
therapists, and in some countries special teachers for autism are also part of the care
team. SLI as a disorder is not only not addressed outside the SLT profession, but is also
practically unknown in wider society and, regrettably, by education professionals.
Furthermore, as Dorothy Bishop puts it “In contrast to dyslexia and autism, SLI is a
neglected condition not only in research, but also in debates about policy and
practice” (Bishop, Clark, Conti-‐Ramsden, Norbury & Snowling, 2012, p.259). SLI is a
complex, multifactorial and heterogeneous developmental disorder and as such, its
manifestation and exact nature vary to a high degree (Bishop, 2014:49). Interactions
between other areas of the cognitive realm, other developmental features as well as
environmental and genetic factors result in an unpredictable number of possible
phenotypes that may change over developmental time in any individual found to have
SLI (Conti-‐Ramsden & Botting, 1999).
The piece of research described here was therefore motivated by all of the above
issues. Adding to the understanding of the aetiology, the classification, the
identification or the treatment of SLI, would be of clear value to science and to all
individuals working with or affected by SLI.
1.2 Deficits in specific language impairment
The language of children with SLI are characterised by impairments in lexical,
morphological and syntactic development both in the receptive and expressive
domains (Bishop, 2014; Leonard, 2014). The more serious deficit occurs typically in the
LANGUAGE IMPAIRED CHILDREN’S LISTENING TO SPEECH IN NOISE
17
areas of syntax and grammatical morphology (Leonard, 1998; Leonard & Weber-‐Fox,
2012:827).
1.2.1 Deficits in morpho-‐syntax
Children with SLI have difficulty comprehending and producing specific types of
syntactic relationships (Leonard, 2014:85). Common examples in the literature are the
use of bound pronouns, reflexives and reversible passives (van der Lely, 1996),
obligatory grammatical morphemes such as past tense, third-‐person singular and the
copula (Leonard, 2012:827; Oetting & Hadley, 2009). Utterances are shorter and less
complex than those of same-‐age typically developing peers (Van der Lely, Rosen &
McClelland, 1998), tense and agreement morphemes are used inconsistently for a
prolonged period (Leonard, 2014:224). Accuracy is reduced in sentence repetition
tasks and difficulty is present in comprehending sentences with complex syntactic
structure.
1.2.2 Deficits in semantics
Children with SLI acquire their first words late (Leonard, 2014:43). Their early lexical
development, however, matches that of younger typically developing (TD) children in
terms of the types of words they learn, their comprehension being better than their
production and in the way they learn novel vocabulary (Leonard, Schwartz, Allen,
Swanson, & Loeb, 1989). Verb production, on the other hand, appears to be more
impaired than other parts of the lexicon in the pre-‐school years (Leonard, 1998). The
lexical deficit in language impairment is not limited to the size of vocabulary. Semantic
organisation skills and the level of semantic specification also lag behind those of age-‐
matched TD peers (McGregor, 1997). Although not universally part of the language
impairment, word-‐finding difficulty has been found in 25% of children with SLI
(Dockrell, Messer, George & Wilson, 1998).
Phonological processing deficits may underlie and contribute to SLI children’s
decreased ability to acquire new words and their full semantic specifications. Deficits
18 LANGUAGE IMPAIRED CHILDREN’S LISTENING TO SPEECH IN NOISE
in phonological skills are therefore considered part of the language impairment
(Leonard, 1982).
1.2.3 Deficits in phonology
Among the numerous hypotheses giving account of the deficits children with SLI have,
the phonological deficit theory is a major one (Leonard, Dromi, Adam & Zadunaisky-‐
Ehrlich, 2000; Chiat, 2001). Several studies have demonstrated or hypothesised the
existence of such a deficit (Joanisse & Seidenberg, 1998; Bortolini & Leonard, 2000).
Chiat (2001) goes as far as to suggest that a phonological deficit is the root cause of
subsequent semantic and syntactic difficulties. Several studies confirm the existence of
significant phonological differences between children with SLI and controls in various
languages such as English, Italian, French, Spanish, Catalan, Hebrew (Maillart & Parisse,
2006). Such phonemic deficits (i.e. difficulty with categorisation and identification of
phonemes) would come from a lower-‐level auditory perceptual deficit (Joanisse &
Seidenberg, 1998).
The picture is not so unambiguous, however, when we include all studies that looked
at phonological skills in SLI. Catts and colleagues found that children with SLI, who had
normal literacy skills, had only mild deficits in phonological awareness and non-‐word
repetition when compared with TD controls (Catts, Adlof, Hogan & Weismer, 2005).
The authors’ conclusion was that phonological impairment is not a major factor in SLI if
it occurs without dyslexia. Other studies confirmed these findings and showed normal
performance of 9-‐year-‐old children with SLI on phonological processing tasks (Bishop,
McDonald, Bird & Hayiou-‐Thomas, 2009), although subtle deficits were found in the
same children on other measures of phonological output and memory.
1.2.4 Memory deficits
A substantial body of literature supports the existence of phonological short-‐term
memory (PSTM) and working memory (WM) deficits in language impaired individuals
(Archibald & Gathercole, 2006; Gathercole & Baddeley, 1990.) A causal relationship
between phonological working memory difficulties and language impairment was

LANGUAGE IMPAIRED CHILDREN’S LISTENING TO SPEECH IN NOISE
19
suggested by Gathercole & Baddeley (1990), or an additive relationship by Archibald &
Joanisse (2009).
A working memory model that was first described by Baddeley and Hitch in 1974 has
been an important influence on research around memory and language in the past
decades. In this model, working memory is a system composed of three parts: the
central executive, the phonological loop and the visuo-‐spatial sketchpad. The central
executive controls communication within WM and is responsible for controlling and
retrieving information from other memory systems. The phonological loop contains a
short-‐term store and is implicated in articulatory control. The phonological loop stores
verbal information temporarily while other cognitive tasks are being carried out. This
process takes place in case of novel phonological input through which long-‐term
phonological representations can be created – the process of learning new words
(Baddeley, Gathercole & Papagno, 1998). The visuo-‐spatial sketchpad acts as a
capacity-‐limited, short-‐term store for visual information.
The model was later amended by Baddeley (2000) to include another component, the
episodic buffer. This is assumed to be the temporary storage system that intergates
information from different modalities by providing a temporary interface between the
phonological loop, visuospatial sketchpad and long-‐term memory. The episodic buffer
is also controlled by the central executive, which retrieves information from the store,
modifies or manipulates this information. The authors distinguish working memory
from PSTM by the amount of processing activity that is required (Archibald &
Gathercole, 2006). Working memory tasks require significant information processing in
addition to storage.
Gathercole and Baddeley (1990) proposed that in SLI there might be a deficit in the
phonological loop component of working memory. They supported their argument
with findings that showed SLI children’s poor ability to repeat non-‐words, especially
longer ones as compared to TD controls. Their findings could not be explained by
speech output difficulties as the articulation rates of both groups were similar.
Children with SLI were also not significantly impaired in discriminating nonword pairs.
20 LANGUAGE IMPAIRED CHILDREN’S LISTENING TO SPEECH IN NOISE
The authors concluded that the primary problem in SLI would be a deficit in PSTM.
Such deficits have indeed been found in subsequent studies (Briscoe & Rankin, 2009).
Evidence for visuo-‐spatial short-‐term memory deficits have also been found in children
with SLI (Hick, Botting & Conti-‐Ramsden, 2005; Cowan, Donlan, Newton & Lloyd,
2005). This suggests a more general short-‐term memory deficit in SLI which would be
heavily influenced by factors such as attention and the use of memory strategies.
1.2.5 Motor deficits
Apart from deficits in the cognitive realm, there is evidence of motor deficits as well in
children with SLI (for a review and meta-‐analysis of the literature, see Hill, 2001). A fair
proportion of children with developmental language difficulties would meet the
criteria for a diagnosis of developmental motor coordination disorder or dyspraxia
(Hill, 2001). While these deficits may be significant, the current investigation does not
extend to the exploration of motor difficulties associated with language impairment.
1.2.6 General cognitive skills
One of the main diagnostic criteria of SLI has been intact general cognitive skills or
non-‐verbal IQ as shown on the performance or non-‐verbal tasks of standard
psychological tests. It has been assumed that performance on such tasks within the
normal range means that children with SLI have no underlying cognitive deficits.
However, evidence suggests otherwise. Johnston and Smith (1989) demonstrated that
children with SLI performed worse on a non-‐verbal reasoning task than TD children.
The authors concluded that these children were also ‘thought-‐impaired’ apart from
their language difficulties.
Several other cognitive deficits have been reported in the literature such as difficulty
with mental rotation, short-‐term memory (see 1.2.4), speeded processing and
deductive reasoning. All these findings increasingly question the specificity of language
impairment as it was once assumed and point towards a combination of more general
deficits, most of which would be subclinical on their own (Kohnert, 2010; Leonard,
2014:11).
LANGUAGE IMPAIRED CHILDREN’S LISTENING TO SPEECH IN NOISE
21
1.2.7 Speech perception in SLI
Among the several sets of skills affecting language development, speech perception
has been a good candidate for examination and therefore a target for research. Speech
perception involves the detection, discrimination and classification of speech sounds
(Bishop, 1997:51). The literature abounds in reports of speech perception deficits in
SLI. A longstanding view first proposed by Eisenson (1968) and further developed by
Tallal and colleagues (Tallal & Piercy, 1975; Tallal & Stark, 1981; Tallal, Stark & Mellits,
1985 etc.) holds that a failure to form phonemic categories of speech sounds in SLI,
which Tallal assumed would come from a temporal processing deficit, could be the
primary deficit to which language impairment would be secondary. In their work, Tallal
and Piercy tested children on a temporal order judgement task, in which the
participants were asked to identify auditory stimuli. Pairs of synthetic vowels, then CV
syllables /ba: -‐ da:/ were presented in one of four possible sequences (A-‐A, A-‐B, B-‐A, B-‐
B). The duration of the stimuli and the interstimulus intervals (ISI) were varied. The
language impaired participants had particular difficulty identifying the syllables when
the ISIs were short. In the ensuing hypothesis, difficulties in discriminating brief or
rapidly changing sounds such as the vowel transition following a plosive, would
compromise the perception of speech, which would in turn challenge the normal
acquisition of morphology and syntax. The exact nature of how speech perceptual
deficits cause language impairment, however, is not clear (Joanisse & Seidenberg,
1998).
Some studies found normal auditory perception at least in some language impaired
children. Bernstein and Stark (1985), for example, examined SLI children from a study
four years earlier and found that the speech perception impairments of the majority
had resolved, even though their language difficulties persisted. However, we have to
be cautious with the interpretation of such results as evidence proving that speech
perception deficits are not necessary for language impairment to develop. The authors
themselves suggested that these children may have had perceptual difficulties in a
critical period of language development, which have resolved.
22 LANGUAGE IMPAIRED CHILDREN’S LISTENING TO SPEECH IN NOISE
Some findings have supported the presence of speech perceptual deficits and authors
endeavoured to explain how these led to grammatical difficulties. Using five
synthesised speech stimuli, Leonard, McGregor and Allen (1992) attempted to explore
the relationship between speech perception deficits claimed by Tallal and the use of
grammatical morphology in SLI. They suggested that children with SLI might have
specific problems in processing parts of the speech signal that have lower acoustic
salience or shorter relative duration. While the children with SLI were able to perceive
brief steady-‐state contrasts /i/ – /u/, they had difficulty perceiving the same vowel
contrasts when they were embedded within a longer duration context. They also
found discriminating the less salient /s/ – /∫/ in final unstressed positions and the stop
consonants /b/ -‐ /d/ difficult.
Evans et al. (2002) set out to further test the relationship between weak grammatical
morphology and poor speech perception ability in SLI by replicating Leonard et al.’s
study on older children using natural stimuli. They found that the use of inflectional
morphology by SLI children was not significantly correlated with their perception
abilities for the natural or synthetic speech contrast pairs. They suggested a possible
breakdown in linking phonological representations to grammatical ones in SLI.
A similar proposal was made by Joanisse and Seidenberg (1998) regarding the role of
phonological deficits in SLI. While they acknowledge that not necessarily all language
impaired children exhibit speech perceptual difficulties, if at least some do, the
relationship of these impairments and grammatical difficulties would have to be
explained. They suggest poor phonological representations as a result of abnormal
perception, which can then lead to difficulties acquiring morphology and syntax. In this
hypothesis, therefore, lower-‐level auditory perceptual deficits would lead to a
phonemic deficit, which manifests in poor phonological representations.
Ziegler and colleagues found that SLI children had poorer than normal identification of
consonants in the presence of a masking noise (Ziegler, Pech-‐Georgel, George, Alario &
Lorenzi, 2005). Under optimal listening conditions, however, they showed only subtle
deficits of speech perception. The authors conclude that these children have serious
problems with noise exclusion, which will then have the already known consequence
LANGUAGE IMPAIRED CHILDREN’S LISTENING TO SPEECH IN NOISE
23
on their phonological development. They also suggest that speech perception in noise
should be part of clinical testing in the future. These results have played a major role in
inspiring the experiments described below.
The same group of researchers found evidence against the various temporal
processing accounts of SLI (Ziegler, Pech-‐Georgel, George & Lorenzi, 2011). They
investigated the perception of four phonetic categories in quiet, stationary and
amplitude-‐modulated noise with varying modulation rate. Speech perception deficits
were identified in SLI in all conditions. Of the four phonetic categories they used
voicing was found to be affected more than the others (place, manner and nasality),
which they see as evidence against attention and memory difficulties being the
underlying causes of the impairment and postulate that poor speech perception is, in
fact, the primary deficit in SLI.
Not all researchers have been able to demonstrate abnormal perception in language
impairment. A general limitation in information processing and speed in children with
SLI was evidenced by a study of synthetic speech comprehension by Reynolds and
Fucci (1998). Their findings did not indicate any auditory perceptual deficits in SLI and
did not demonstrate any difference in the way natural versus synthetic speech was
processed in impaired and typical language development other than that SLI children
had more difficulty comprehending both.
No consistent evidence for auditory deficits causing SLI was found by van der Lely,
Rosen and Adlard (2004), who investigated the auditory discrimination skills of
children with grammatical SLI for speech and non-‐speech sounds. Although group
differences were demonstrated and a larger proportion of the SLI group showed
normal auditory processing to non-‐speech than to speech, no relationship was
evidenced between the auditory and grammatical abilities. The substantial number of
individuals who performed within the normal range on the auditory tasks and yet are
language impaired, provide further evidence that there may not be a causal
relationship between speech perceptual deficits and SLI.
24 LANGUAGE IMPAIRED CHILDREN’S LISTENING TO SPEECH IN NOISE
1.2.7.1 Speech perception research
Research into the perception of speech takes place predominantly by computer
controlled manipulation of some aspects of speech such as the amplitude, frequency
or components of the speech signal and measurement of the experimental subject’s
behavioural response. Most often both the stimulus is presented on a computer and
the response is recorded by the computer. The addition of background noise is one
area of speech perception research, which aims to replicate real-‐life communication
situations and measure the subject’s behaviour, usually the highest level of tolerated
noise before deterioration of perception or understanding occurs.
Research into the perception of speech in the presence of background sounds,
however, introduces new complications. Noise maskers are used, which can influence
the target signal in different ways. As masking is an essential element of experimental
manipulation in the current studies, a brief description of maskers as used in the
literature is given here.
Studying the effects of background noise on the perception of speech is important as
this apparent feat of our auditory-‐cognitive system happens on a daily basis. The so-‐
called “cocktail party” effect has perplexed both speech and hearing scientists and,
indeed, anyone giving it a thought, for quite some time (Conway, Cowan & Bunting,
2001). How can we listen to one person and ignore the background babble and other
noises, yet detect relevant information immediately such as when our name is called?
Distinguishing the noises or maskers based on how they mask speech is useful and is
routinely done in hearing science research (Brungart, 2001). One common distinction
is that between energetic and informational masking.
In energetic masking the interfering effect of the masker arises primarily in the
cochlea. This occurs when both signals contain energy in the same critical bands at the
same time rendering portions of the target signal inaudible (Brungart, 2001). The
degree of energetic as well as informational masking of speech by noise is determined
by the frequency spectrum of the noise and its intensity compared to that of the
LANGUAGE IMPAIRED CHILDREN’S LISTENING TO SPEECH IN NOISE
25
speech signal. A common example for energetic masking is a steady-‐state wideband
noise presented together with the speech signal.
The relative intensity of the background noise to the target speech is expressed in the
signal-‐to-‐noise ratio (SNR). The SNR is greater when speech (“signal”) has a greater
intensity (perceived as louder) than the noise, and lower when the intensity of the
noise is greater. For example, if both signal and noise have the same intensity, the
SNR=0. For speech with greater intensity than the noise, the SNR will be a positive
number, and if the noise has a higher intensity, the SNR<0.
Informational masking, on the other hand, interferes with the target signal because it
has similar informational content potentially competing with the signal (Festen &
Plomp, 1990). The signal and the masker are both audible, but the listener has
difficulty differentiating the target signal from the distracter. The most obvious
example for this is an interfering talker – speech masking speech. Here the amplitude
modulations of natural speech allow only a small energetic masking effect. Most of the
masking comes from the informational masking effect, the competing informational
content of the masker. This is evidenced by the observation that the intelligibility of
attended speech masked by other speech is constant between -‐12 and 0 dB SNR and
decreases from then on as the SNR decreases (Brungart, 2001).
Although the distinction between energetic and informational masking is justified for
various acoustic and perceptual reasons, in masking speech with simultaneous speech
the overall performance is determined by the cumulative effects of energetic and
informational masking. It is, however, difficult to isolate the energetic and
informational elements on speech masked by speech. The effects of purely energetic
masking of speech are well documented in the literature, partly because of the
telephone industry (French & Steinberg, 1947; Fletcher & Galt, 1950). As energetic
speech masking depends entirely on the spectral overlap between the speech signal
and the masker, listening performance monotonically decreases with decreasing SNR.
For informational masking, apart from the SNR, the similarity of the target and masker
voices greatly determine performance. Such obvious difference in similarity is a same-‐

26 LANGUAGE IMPAIRED CHILDREN’S LISTENING TO SPEECH IN NOISE
sex interfering talker versus an opposite-‐sex talker (Festen & Plomp, 1990). In
informational masking, therefore the intelligibility depends on other factors than the
SNR as well. Such factors also include “glimpses” of the target signal as a result of the
amplitude modulations of the masker.
In the studies described in chapters 2-‐4 both energetic and informational maskers
were used and their different effects considered.
1.2.8 Categorical perception in SLI
In the perception of speech an essential skill is the ability to perceive phonemes in
distinct categories. Categorical perception is the tendency of our auditory perceptual
system to perceive acoustic items that vary in an acoustic property along a continuum
(e.g. voice onset time) not as continually changing percepts, but as belonging to
distinct categories (Kluender, 1994; Bishop, 2014). For example, by varying the voice
onset time (VOT) on a continuum from /bi:/ to /pi:/, VOT being the main distinguishing
feature of voiced-‐voiceless stop consonant contrasts in English, listeners hear a
discontinuous change from /bi:/ to /pi:/ at around 23 ms VOT. Also, discrimination of
sounds of a fixed acoustic difference is easier between categories than within
categories even if the difference between two sounds is the same. For example, two
sounds with a VOT of 18 ms and 28 ms would be readily distinguishable, while two
sounds with a VOT of 30 ms and 40 ms would more likely be perceived by listeners as
identical even though the difference is 10 ms for both sound pairs.
Categorical perception has been reported by some researchers to be deficient in
language impaired children. As before, the evidence for this is controversial.
Burlingame, Sussman, Gillam and Hay (2005) found the identification performance of
SLI children less consistent than that of an age-‐matched control group. The SLI children
had reduced sensitivity to phonetic changes on a phonemic categorisation task of /ba:/
-‐ /wa:/ and /da:/ -‐ /ja:/ syllables. Their finding supports the idea that in SLI the
identification of phonemes is deficient.
LANGUAGE IMPAIRED CHILDREN’S LISTENING TO SPEECH IN NOISE
27
Coady, Kluender and Evans (2005) used digitally modified real words to minimise
memory requirements in a categorical perception task. Under such conditions they
found no group difference in the labelling functions and discrimination of the two
groups of participants. Their conclusion is that SLI children may perform as well as TD
children when the memory load is minimised; therefore deficits on speech perception
tasks may not be due to a speech perception deficit per se, but may come from high
task demands.
In another study the same researchers presented natural and synthetic words and
non-‐word syllables to SLI and control children for identification and discrimination
(Coady, Evans, Mainela-‐Arnold & Kluender, 2007). No group difference was identified
in the perception of naturally spoken words and syllables, but SLI children were
impaired in their identification and discrimination of synthetic words and syllables.
Again, they conclude that speech perception deficits in SLI may come from high task
demands rather than actual perceptual impairments.
Impaired categorisation of synthetic /b/ -‐ /d/ phonemes in initial positions of CVC word
pairs was found in SLI children, but only when noise was added, in a more recent study
of SLI and dyslexic children (Robertson, Joanisse, Desroches & Ng, 2009). In dyslexia,
on the other hand, categorisation remained intact even after the addition of noise.
An interesting parallel of the auditory perception and categorisation of phonemes was
the subject of a study by Leybaert and colleagues who looked at audiovisual speech
perception and the McGurk effect in language impaired children (Leybaert, Macchi,
Huyse, Champoux, Bayard, Colin & Berthommier, 2014). They found a deficit in
phonemic categorisation in SLI not only in the auditory, but also in the visual modality.
This would support the hypothesis of intact peripheral processing of auditory
information in speech, but inefficient phonemic categorisation in both modalities. This
is in contrast to theories blaming lower-‐level auditory perceptual deficits for difficulties
in phonemic categorisation.
The above are but a few of the available studies on speech perceptual skills in SLI. The
exact nature and prevalence of speech perception deficits in language impaired
28 LANGUAGE IMPAIRED CHILDREN’S LISTENING TO SPEECH IN NOISE
children continues to be debated. When exploring the nature of this deficiency,
researchers have to go further than investigating only perception itself. It has been
suggested that other cognitive functions such as attention, may play an important role
in perception and directly or indirectly in the emergence of SLI (Leonard, 1998;
Spaulding, Plante & Vance, 2008). The need to include attention as a factor and assess
it in SLI has become widely recognised in the literature in recent years (Bishop,
Carlyon, Deeks & Bishop, 1999; Neville, Coffey, Holcomb & Tallal, 1993).
1.2.9 Role of attention in SLI
Some researchers have attributed SLI children’s poor performance on temporal
processing tasks to their limited general processing capacity (Leonard et al., 1992) or
poor attentional skills (Helzer, Champlin & Gillam, 1996). Hanson and Montgomery
(2002) investigated the effects of general processing capacity and sustained selective
attention on temporal processing performance of children with SLI. Children were
given a cognitively more demanding syllable identification task and a less demanding
syllable discrimination task, along with a sustained selective attention task. No group
difference was found on the attention task and the discrimination task between the SLI
and TD group, while on the identification task the SLI children performed worse than
their TD peers. The researchers interpreted these results as supporting the claim that
SLI children’s temporal processing ability per se is not deficient, but it is their limited
general processing capacity that resulted in this pattern of performance. Sustained
selective attention did not appear to play a role in children’s performance on these
tasks.
The question of the specificity of language impaired children’s slowed processing of
auditory stimuli was the target of an experiment by Schul, Stiles, Wulfeck and
Townsend (2004). They presented children with two versions of a visual discrimination
task, one requiring shifts of attention, the other not requiring any. Results indicated
that SLI children had slower visual processing and motor response, but performed
similarly to age-‐matched TD peers in their visual attentional orienting speed. This is
supportive of the hypothesis of generalised slower processing in SLI, but suggests that
LANGUAGE IMPAIRED CHILDREN’S LISTENING TO SPEECH IN NOISE
29
such children use their attentional orienting mechanisms similarly to TD children both
qualitatively and quantitatively.
The processing limitations in SLI were further corroborated by Im-‐Bolter, Johnson and
Pascual-‐Leone’s (2006) study of the role of executive function in language impairment.
The researchers found group differences between the SLI and TD groups in
performance on measures of mental attention, interruption and updating, but not
attention shifting. These are suggestive of domain-‐general processing limitations that
affect the ability to select task-‐relevant or irrelevant schemes.
Marton (2008) examined the executive functions, visuo-‐spatial processing and working
memory of children with SLI and their TD peers. Children with SLI, particularly those
with reportedly weak attention control, performed more poorly than their age-‐
matched peers on all visuo-‐spatial working memory tasks. The author concludes that
executive functions have a great impact on SLI children’s working memory
performance, regardless of domain and modality. Tasks requiring a high amount of
attentional control and executive functions are more difficult for SLI children than TD
children, no matter what modality they are in.
In an event-‐related potential (ERP) study, Stevens, Sanders and Neville (2006) asked
participants to attend selectively to one of two narrative stories presented
simultaneously. ERPs were recorded to linguistic and non-‐linguistic stimuli embedded
in the attended and unattended story. TD children showed amplified ERP response to
the attended stimuli as compared to the unattended ones. The ERP responses of SLI
children did not reflect any modulation by attention despite correct behavioural
performance. This is interpreted as evidence that children with SLI have marked and
specific deficits in the neural mechanisms of attention at the earliest stage of sensory
processing. The deficits in selective attention in early sensorineural processing may
underlie the diverse sensory and linguistic difficulties SLI children experience. It might
be important to point out that in this study attention was assessed in the context of a
linguistic task (attending to one story when another is presented simultaneously),
30 LANGUAGE IMPAIRED CHILDREN’S LISTENING TO SPEECH IN NOISE
therefore this deficit may still be restricted to the language system rather than being
domain general.
The proposal that sluggish attentional shifting abilities are behind the impaired
processing of rapid stimulus sequences in SLI was the subject of a study by Lum, Conti-‐
Ramsden & Lindell (2007). The authors found that adolescents with SLI had more
difficulty detecting the second of two visual targets when compared to controls. This
appeared to be due to a problem with disengaging and engaging visual attention. This
is interpreted as being consistent with previous reports of SLI children’s deficits in
rapid processing which may arise from more general attentional shifting constraints
rather than from problems with the sensory processing itself.
SLI children’s allocation of attention to speech sounds was explored in an ERP study by
Shafer, Ponton, Datta, Morr and Schwartz (2007). They found that TD children devoted
some attention to speech even when they were instructed to attend only to a visual
stimulus and ignore speech, while children with SLI did not manifest any attention to
speech in their ERPs. This seems to point towards the limited attentional resources in
SLI and poorer selective attention. Children with SLI are also less automatic in
allocating attention to speech than their TD counterparts, possibly as a natural
consequence of their receptive language difficulties.
The effect of language intervention on selective attention was the subject of another
study (Stevens, Fanning, Coch, Sanders & Neville, 2008). The authors found that
following intensive training of children with SLI on a computerised training programme
of language skills, not only did language scores increase, but the neural mechanisms of
selective attention as indicated by ERPs also showed enhancement. This again seems
to indicate that behind the deficient language skills in SLI, deficits of auditory attention
skills exist, which however, can be remediated through intensive training. This finding
contributed to the design of the intervention study described in this thesis.
Spaulding, Plante and Vance (2008) investigated sustained selective attention skills of
preschool children with SLI in different modalities. The children’s visual, non-‐verbal
auditory and linguistic sustained selective attention skills were assessed in two
LANGUAGE IMPAIRED CHILDREN’S LISTENING TO SPEECH IN NOISE
31
attentional load conditions. The SLI children performed more poorly on tasks requiring
auditory attention, both non-‐verbal and linguistic, but only under the high attentional
load condition. Their performance was comparable to their TD peers under the low
attentional load condition and in the visual modality. This seems to indicate separate
attentional capacities for different stimulus modalities and a non-‐language specific,
general auditory attention deficit in SLI. This contradicts Lum et al.’s and Marton’s
conclusion about the generalised attentional shifting difficulties regardless of modality.
Montgomery (2008) investigated two dimensions of attentional functioning in the real-‐
time processing of grammar by children with SLI: sustained focus of attention and
resource capacity/allocation. TD children outperformed SLI children on both attention
measures and a word-‐recognition reaction time task. As all these tasks were language-‐
based, this result is not surprising. For the SLI group, scores on the sustained attention
task and the concurrent processing-‐storage tasks significantly correlated with the
word-‐recognition reaction times, while in TD children the correlation did not reach
significance. It appears, the investigator concludes, that SLI children require sustained
attention and make use of their attentional resource capacity while processing simple
grammar. In TD children these attentional functions are not involved in the processing
of grammar.
The relation of auditory attention to complex sentence comprehension in SLI was
further investigated by Montgomery, Evans and Gillam (2009). Again, sustained
auditory attention and attentional resource capacity/allocation were related to
comprehension of complex sentences. Their results corroborated earlier findings that
in SLI the two variables significantly correlated with complex sentence comprehension,
but not in TD children. This confirmed that in SLI even simple sentence comprehension
requires significant auditory vigilance, a high level of attentional involvement,
something that sentence comprehension does not invoke in typically developing
children.
The non-‐specificity of sustained attention difficulties in SLI was also the outcome of
another study of sustained visual attention in SLI (Finneran, Francis & Leonard, 2009).
32 LANGUAGE IMPAIRED CHILDREN’S LISTENING TO SPEECH IN NOISE
The accuracy and response time of a group of SLI and TD children were analysed on a
visual continuous performance task. The children with SLI were significantly less
accurate, but not significantly slower than their TD peers. The researchers conclude
that SLI children have reduced capacity for sustained attention even in the absence of
clinically significant attention deficits. This attention difficulty is not limited to the
auditory modality.
A meta-‐analysis of sustained attention in children with language impairment was
conducted by Ebert and Kohnert (2011) supporting the existence of sustained
attention deficits both in the auditory and visual modalities. They do not exclude the
possibility that these attention difficulties contribute causally to the language
impairment.
It has been demonstrated that controversy concerning the exact role of attention in
the aetiology and perpetuation of SLI continues to prevail in the literature. It is
debated whether an attention deficit is necessarily present in language impaired
children, and if it is, whether it is limited to language, the auditory modality or is of a
general nature. If attention deficits prove to be a concurrent difficulty in SLI, the
question of causality still remains to be substantiated.
1.3 Auditory training
Auditory training is a possible management and intervention strategy for children with
hearing, listening or language difficulties. Training studies have been reported in the
literature with mixed results. At times nearly identical training regimes bring different
outcomes. For example, Halliday et al, (2012) attempted to replicate a study by Moore,
Rosenberg and Coleman (2005), but failed to do so despite using an almost identical
training programme. In an effort to explain the discrepant findings Halliday (2014)
compared the methodology and results of the two studies and concluded that the
trained group in Moore et al. (2005) showed more gains in phonological awareness
than the trained group in Halliday et al. (2012). Conversely, the control group in
Halliday et al. (2012) showed greater improvement than the control group in Moore et
al. (2005). It is concluded that several factors contributed to the difference in outcome
LANGUAGE IMPAIRED CHILDREN’S LISTENING TO SPEECH IN NOISE
33
such as randomisation, blinding, experimenter characteristics and treatment. The
importance of well-‐designed randomised controlled trials in assessing the efficacy of
auditory training is paramount.
Another challenge in evaluating the efficacy of auditory training programmes was
identified by Grube et al. (Grube, Cooper, Kumar, Kelly & Griffiths, 2014). They
investigated the relationship between auditory and language skills in a group of
children with dyslexic traits and a typically developing group. The dyslexic group
performed as well as controls on auditory measures, but more poorly on language.
Less correlation was identified between short-‐sequence processing and language skills
in the dyslexic group and there was an increase in correlation between language and
basic, single-‐sound processing. This supports the idea of an altered relationship
between auditory and language skills in atypical development making it problematic to
draw conclusions across populations.
A number of papers, particularly review articles, conclude that there is little evidence
to support the efficacy of auditory training, especially the generalisation of possible
gains. Fey et al. (2011) claim that their systematic review of 25 published studies
demonstrates that although auditory and language interventions can improve auditory
functioning in children with APD, the evidence is limited for any improvement being
due to the auditory features of the programmes as opposed to other factors such as
attention (Fey, Richard, Geffner, Kamhi, Medwetsky, Paul, Ross-‐Swain, Wallach,
Frymark & Schooling, 2011). The effect of auditory training on spoken and written
language is also questionable due to limited evidence.
Murphy and Schochat (2013) reviewed 29 published papers that met their stringent
criteria for evidence. They identified a shortage of evidence, particularly for the
hypothesised relationship between auditory temporal processing and language. They
conclude that future studies are needed to investigate the contribution of auditory
temporal training to language skills.
Similar was the outcome of a review by Wilson, Arnott and Henning (2013) who looked
at studies on electrophysiological outcomes following auditory training of children
34 LANGUAGE IMPAIRED CHILDREN’S LISTENING TO SPEECH IN NOISE
with auditory processing disorder (APD). They found limited evidence for auditory
training leading to measurable electrophysiological changes. They consider the
evidence base to be too small and weak to provide clear guidance on the use of
electrophysiological measures to detect training outcomes in APD.
Some published studies indicate clear auditory learning, but a lack of generalisation of
the learnt skill to unlearnt stimuli or to language. Millward and colleagues trained
three groups of typically developing children on different speech-‐in-‐noise tasks
(Millward, Hall, Ferguson & Moore, 2011). They found that all trained groups improved
on the task they were trained on, while transfer of training only occurred between
some training tasks. This allowed them to conclude that transfer of auditory training is
more likely when some stimulus dimensions (e.g.: tone frequency, speech, modulated
noise) are common in the training tasks and the outcome measures. This lack of
transfer and the need for outcome-‐specific training material, indeed, questions the
validity of auditory training with the aim of improving language skills.
Loo and colleagues reviewed published studies on the efficacy of commercially
available computer-‐based auditory training programmes such as FastForWord (FFW)
and Earobics (Loo, Bamiou, Campbell & Luxon, 2010). They established a lack of
improvement on language, reading and spelling as a result of the FFW and Earobics
programmes apart from improved phonological awareness skills. Non-‐speech and
simple speech sounds training could be effective for children’s reading skills as long as
the delivery is audio-‐visual. Further research is deemed necessary to substantiate
these findings.
Evidence for improved auditory skills, but lack of generalisation of these learnt skills
following training is provided by Halliday at al. (Halliday, Taylor, Millward and Moore,
2012). The researchers trained three groups of typically developing children on
different auditory tasks. Significant improvement was found in all trained groups on
the stimuli they were trained on, but these gains were not observed on nontrained
stimuli or on language skills.
LANGUAGE IMPAIRED CHILDREN’S LISTENING TO SPEECH IN NOISE
35
Finally, studies that may give more reason for optimism should also be mentioned as
these clearly evidence that auditory training has its place in the management of
listening and language difficulties. One such study proves the efficacy of auditory
training through the objective measure of the auditory brainstem response (ABR)
(Filippini, Befi-‐Lopes & Schochat, 2012). Children with typical development, auditory
processing disorder and specific language impairment were given a formal auditory
training programme. The ABRs with background noise of the SLI and APD groups
showed decreased latencies at the end of training as compared to the pre-‐training
measurements, thus moving closer to the control group’s latencies. Their improved
behavioural performance was therefore reflected in their ABRs.
A randomised controlled trial by Murphy at al. demonstrates the generalisation of
auditory training to memory, attention and language skills (Murphy, Peres, Zachi,
Ventura, Pagan-‐Neves, Wertzner & Schochat, 2015). Training was on computerised,
non-‐verbal tasks of frequency discrimination, ordering and backward-‐masking. Near-‐
transfer (auditory) and far-‐transfer (sustained attention, phonological working
memory and language) measures were taken before and after the training. Learning
generalisation from an auditory sensory training to a top-‐down skill, sustained
attention, was demonstrated.
As we have seen there is a large quantity of contradicting evidence on auditory
learning and generalisation as a result of auditory training. Most papers conclude that
the evidence is insufficient, while some found great variation in the way auditory skills
change following training. Some studies found improvement on the tasks trained, but
no generalisation of those skills to other related skills and language. Computerised and
commercially available training programmes have been found not to improve the
auditory skills they claim to improve. Finally, some studies identified improvement and
even generalisation of auditory skills to attention and language.
1.4 Objective of the present project
As we have seen, there has been extensive research on the auditory and speech
perceptual skills of children with SLI. In the past 15 years research has extended to
36 LANGUAGE IMPAIRED CHILDREN’S LISTENING TO SPEECH IN NOISE
attentional factors as well. Auditory training as a possible intervention to manage
auditory based language difficulties has also been added to this body of evidence base.
Although research results are far from being consistent, it appears that there is at least
a subgroup of children with SLI who have speech perceptual deficits — however, the
exact nature and cause of these deficits are still debated. It also seems true that SLI
children have attention difficulties, but again, research results are inconsistent
regarding the exact nature and extent of these deficits.
The first project proposes to compare the performance of children with SLI to controls
on a task of phonemic categorisation of synthetic syllables and on tasks involving the
perception of real words or sentences in difficult listening conditions. The notion of
speech perception deficits in SLI would gain support if differences on these tasks could
be demonstrated. Sustained auditory attention skills are also compared to those of TD
children. Through monitoring the attention levels during the tasks, the attentional
functioning of language impaired children is contrasted to the same in typical
development. Strong correlations between attention and speech perception could
indicate that speech perception deficits are, in fact, due to poor auditory attention
skills.
Following from the results of the first study presented in this paper the exact nature of
the difficulties SLI children experience when listening to speech in the presence of
noise is further investigated in the second study while also exploring their sustained
auditory attention skills. Finally, relationships between children’s speech perceptual
deficits, phonological processing and literacy skills are also considered. The study is
extended to children whose native language is not English, but who are receiving their
education in English as they live in an English speaking country. This is particularly
relevant in light of findings that bilinguals without any impairments already have a
deficit in speech perception in their second language under unfavourable listening
conditions (Tabri, Chacra & Pring, 2011).
The third study investigated the possibility of ameliorating the speech-‐in-‐noise deficits
in language impaired children with a computer-‐based auditory training programme.
The training is embedded in a set of interesting iPad games that children have to listen

LANGUAGE IMPAIRED CHILDREN’S LISTENING TO SPEECH IN NOISE
37
to via headphones. It takes the user from identification of single phonemes through
phonemic categorisation and single word tasks to sentences and narratives. Initial
training always takes place in quiet, which then changes to an adaptive speech-‐in-‐
noise task with various types of energetic and informational maskers based on the
results of the previous study. As we have seen above, the efficacy of auditory training
programmes is questionable, with the current training it is hoped that some evidence
will be gathered one way or another.
38 LANGUAGE IMPAIRED CHILDREN’S LISTENING TO SPEECH IN NOISE
Chapter 2 Study one: speech perception in noise, categorical perception and attention in SLI
2.1 Background
As a preliminary study to the main research project, this study was designed and data
collected on a smaller number of participants using three different auditory tasks. This
functioned as a basis on which I was able to design the main perception study
described in chapter 3.
2.1.1 Ethics approval The ethics application no. 3121/001 for this and the ensuing projects was approved by
the UCL Research Ethics Committee on 16 May 2011 for the duration of the project
until April 2013. Following a request, this was subsequently extended on 4 June 2013
until 1 March 2014. With this the legal requirements for ethical approval were fully
met.
2.2 Method
2.2.1 Participants
Seventeen children with SLI and seventeen age-‐matched TD children, aged 5-‐10 years,
were recruited and tested in South London primary schools and two language
impairment units specialised in meeting the needs of children with SLI. Schools were
asked to name children with and without language difficulties, whose parents were
then given an information letter and consent was obtained. Screening and testing took
place in the schools in relatively quiet rooms.
Parents and/or teachers were asked whether English was the first and main language
in the family and about any background difficulties/impairments such as autistic
spectrum disorder, hearing impairment or learning difficulty. Children with additional
impairments and with a bilingual background were excluded. Eleven children were
excluded due to English not being their first language. A further seven failed the non-‐
verbal screening test and one child at the language unit performed within the average
LANGUAGE IMPAIRED CHILDREN’S LISTENING TO SPEECH IN NOISE
39
range on the language assessment. One child as a candidate in the TD group failed the
language assessment subtest, but was in the normal range for non-‐verbal intelligence.
Further subtests of the language test confirmed the language impairment so the child
was included in the SLI group.
To be included in the study the participants could not have a suspected or confirmed
hearing loss, about which parents and teachers were asked. To determine the
language status (impairment versus typical development) either the Clinical Evaluation
of Language Fundamentals – Preschool UK (CELF-‐P) or the Clinical Evaluation of
Language Fundamentals – UK3 (CELF– UK3) were used, depending on the child’s age
(Wiig, Secord & Semel, 2000). To be included in the TD group a child had to achieve a
scaled score of at least 7 on the Linguistic Concepts (CELF-‐P) or Concepts and
Directions (CELF-‐UK3) subtests. To be included in the SLI group, children were
administered several subtests of CELF-‐P or CELF-‐UK3 and their scores had to be at least
1 SD below the mean (scaled score<7) on at least two receptive or expressive subtests.
The Block Design subtest of the Wechsler Intelligence Scale for Children III-‐UK (WISC,
Wechsler, 1991) was used as a screening assessment of non-‐verbal abilities. In this
subtest participants are required to arrange blocks with red, white and red-‐white sides
in such a way that the pattern they create is identical to the pattern presented in a
picture. Both accuracy and the time it takes a child to recreate the pattern is scored.
This assessment is standardised from age 6, yielding age-‐adjusted scaled scores with a
mean of 10 and standard deviation of 3. Children had to have scores within the normal
range or above to be included in the study (scaled scores 7-‐13).
The ages of the SLI group ranged from 5;0 to 10;11 years, and of the TD group from 6;4
to 10;8 years (for individual scores see Appendix 1). Although the ages did not follow a
normal distribution, independent samples t-‐tests indicated no statistical difference
between the two groups in age (t=-‐1.562, df=32, p=0.128) or non-‐verbal IQ (t=-‐0.758,
df=30, p=0.455). Table 1 shows the means for the group matching measures in the two
groups.

40 LANGUAGE IMPAIRED CHILDREN’S LISTENING TO SPEECH IN NOISE
Table 1: Age of the participants (in months), scaled scores on the block design and CELF receptive subtests; means and standard deviations in the two groups
Variable TD group mean (SD) SLI group mean (SD)
Age (months) 105.9 (20) 95.4 (19)
Language (CELF) score 11.47 (2.4) 4.7 (1.8)
Non-‐verbal score 10.8 (2.62) 10.01 (3.19)
2.2.2 Test battery
2.2.2.1 Attention measures
One subtest of the published and standardised Test of Everyday Attention for Children
(TEA-‐Ch) was used to assess each child’s baseline sustained auditory attention level
(Manly, Robertson, Anderson & Nimmo-‐Smith, 1998). In this subtest, (Walk, Don’t
Walk) the children have to listen to a beep tone at given intervals (“steps”) and mark a
footprint on a sheet of paper following each tone (for an example of the mark sheet
see Appendix 2). After a number of steps (beeps), which can be anywhere between 1
and 14, the beep sound is immediately followed by a crashing sound, which signals the
end of the walk and no mark should be put on that footprint. Four practice trials are
followed by 20 walks with gradually decreasing time intervals between the beep tones.
Thus, the child has to be in a permanently alert state and quickly give a motor
response. At the same time the response cannot become automatic as an inhibition of
a response is also necessary in this test. The test lasts for 6 minutes 51 seconds. Raw
scores are the number of correctly marked walks out of 20. Corresponding scaled
scores are obtained from the normative tables, for boys and girls separately in two-‐
year age-‐bands. As in most standardised tests, the mean is 10 with SD=3; therefore the
average range is 7-‐13.
2.2.2.2 The Who is right? words-‐in-‐noise test
The Who is right? task tests the ability to differentiate minimal phonetic contrasts in
simultaneous background noise. The task was modelled after the Words in Noise task
in Messaoud-‐Galusi, Hazan & Rosen (2011) with slight modifications. On each trial, the
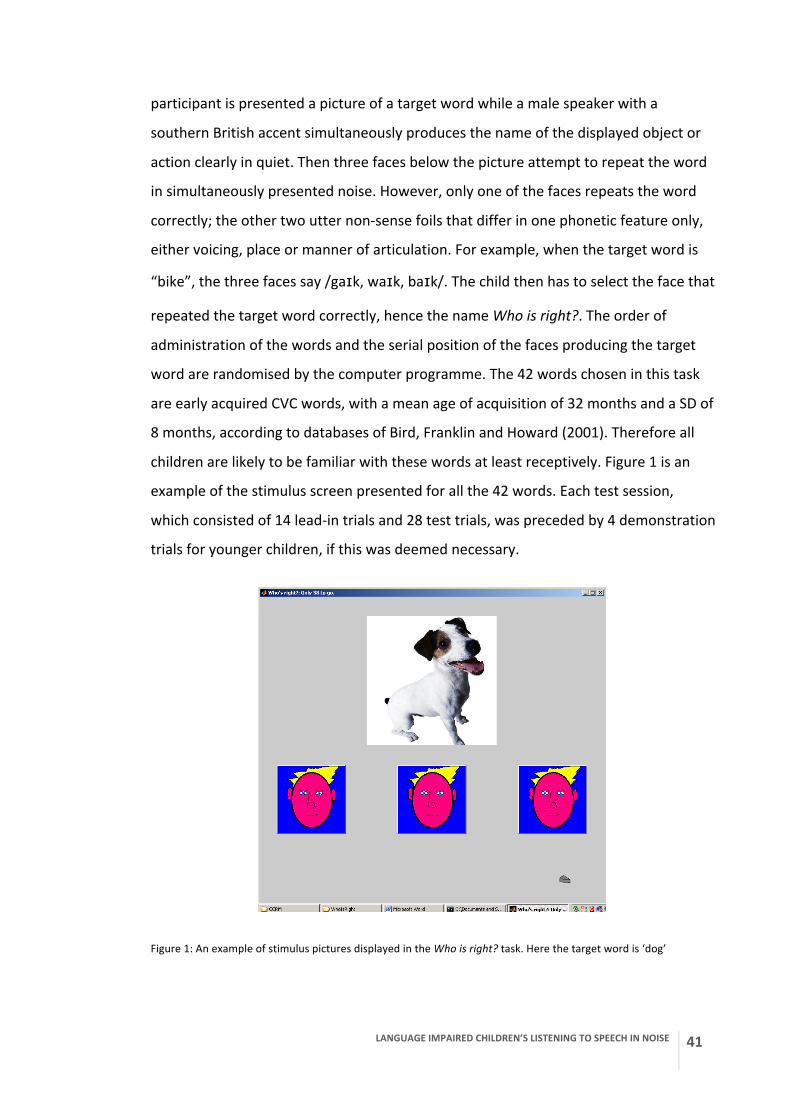
LANGUAGE IMPAIRED CHILDREN’S LISTENING TO SPEECH IN NOISE
41
participant is presented a picture of a target word while a male speaker with a
southern British accent simultaneously produces the name of the displayed object or
action clearly in quiet. Then three faces below the picture attempt to repeat the word
in simultaneously presented noise. However, only one of the faces repeats the word
correctly; the other two utter non-‐sense foils that differ in one phonetic feature only,
either voicing, place or manner of articulation. For example, when the target word is
“bike”, the three faces say /gaɪk, waɪk, baɪk/. The child then has to select the face that
repeated the target word correctly, hence the name Who is right?. The order of
administration of the words and the serial position of the faces producing the target
word are randomised by the computer programme. The 42 words chosen in this task
are early acquired CVC words, with a mean age of acquisition of 32 months and a SD of
8 months, according to databases of Bird, Franklin and Howard (2001). Therefore all
children are likely to be familiar with these words at least receptively. Figure 1 is an
example of the stimulus screen presented for all the 42 words. Each test session,
which consisted of 14 lead-‐in trials and 28 test trials, was preceded by 4 demonstration
trials for younger children, if this was deemed necessary.
Figure 1: An example of stimulus pictures displayed in the Who is right? task. Here the target word is ‘dog’
42 LANGUAGE IMPAIRED CHILDREN’S LISTENING TO SPEECH IN NOISE
The noise used was a speech-‐spectrum shaped noise. The signal-‐to-‐noise ratio (SNR)
was controlled by an adaptive procedure with a 2-‐down 1-‐up rule tracking thresholds
for 71% correct responses (Levitt, 1971). The SNR, therefore the relative audibility of
speech, decreases after every two correct responses and increases after every error in
steps of 3 dB. The reversals of the direction of the SNR change (either from descent to
ascent or ascent to descent) are used to calculate the speech reception threshold
(SRT), which is defined as the mean of the level of reversals in the test phase expressed
in dB SNR. As such, a lower number indicates better performance, i.e. more noise
tolerated. The test phase is preceded by a lead-‐in phase that starts with a high SNR
(+20 dB), which in a typical case tends to yield several correct responses, followed by
several incorrect responses. As this would distort the actual SRT of the individual,
results of the lead-‐in phase are not counted in the SRT. Figure 2 shows a typical
adaptive track of a listener.
Figure 2: An example adaptive track from Who is Right? The graph shows the SNR presented as a function of trial number showing correct responses in green and incorrect responses in red. The dotted vertical line divides the lead-‐in and test phases, the dotted horizontal line is the SRT as determined by the mean of the final reversals (circled in black) in the test phase.
2.2.2.3 The bee – pea categorical perception test
The bee -‐ pea categorical perception task aims to assess the identification of synthetic
syllables as /pi:/ or /bi:/. A picture of a frog appears on the computer screen and utters
a short syllable. The pictures of a bee and group of peas are visible in the bottom half
of the screen. The child is instructed to decide whether the frog says ‘bee’ or ‘pea’ and
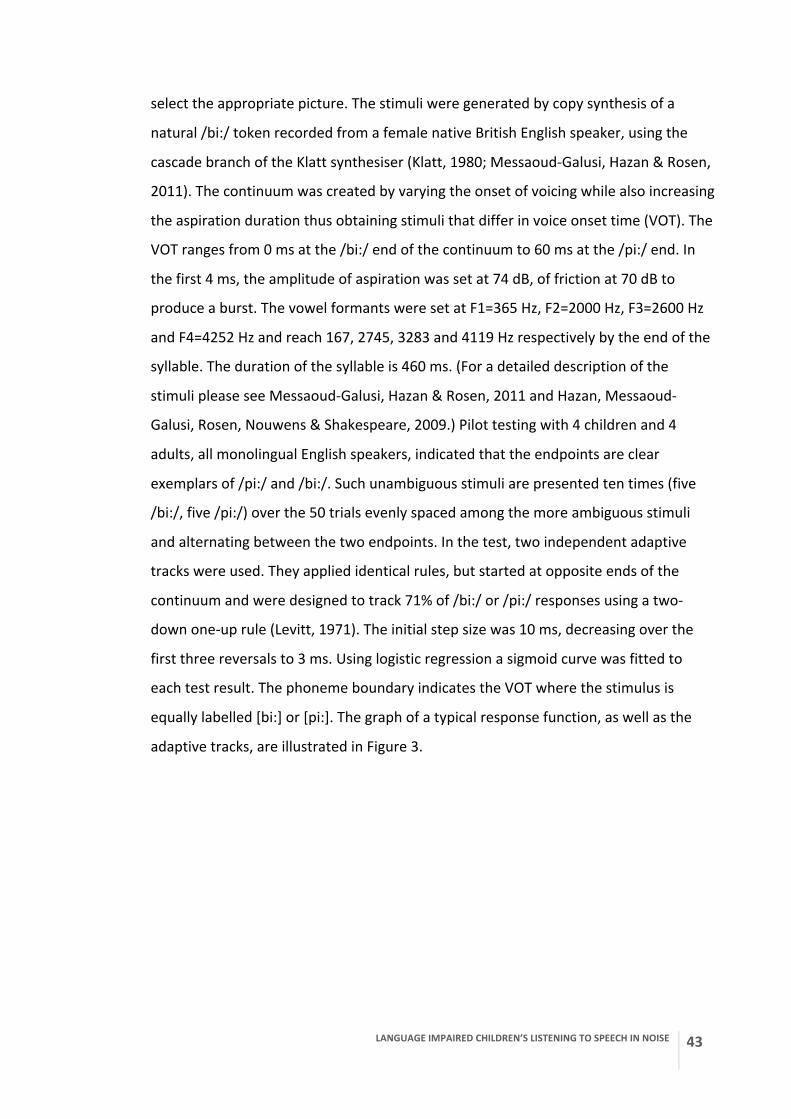
LANGUAGE IMPAIRED CHILDREN’S LISTENING TO SPEECH IN NOISE
43
select the appropriate picture. The stimuli were generated by copy synthesis of a
natural /bi:/ token recorded from a female native British English speaker, using the
cascade branch of the Klatt synthesiser (Klatt, 1980; Messaoud-‐Galusi, Hazan & Rosen,
2011). The continuum was created by varying the onset of voicing while also increasing
the aspiration duration thus obtaining stimuli that differ in voice onset time (VOT). The
VOT ranges from 0 ms at the /bi:/ end of the continuum to 60 ms at the /pi:/ end. In
the first 4 ms, the amplitude of aspiration was set at 74 dB, of friction at 70 dB to
produce a burst. The vowel formants were set at F1=365 Hz, F2=2000 Hz, F3=2600 Hz
and F4=4252 Hz and reach 167, 2745, 3283 and 4119 Hz respectively by the end of the
syllable. The duration of the syllable is 460 ms. (For a detailed description of the
stimuli please see Messaoud-‐Galusi, Hazan & Rosen, 2011 and Hazan, Messaoud-‐
Galusi, Rosen, Nouwens & Shakespeare, 2009.) Pilot testing with 4 children and 4
adults, all monolingual English speakers, indicated that the endpoints are clear
exemplars of /pi:/ and /bi:/. Such unambiguous stimuli are presented ten times (five
/bi:/, five /pi:/) over the 50 trials evenly spaced among the more ambiguous stimuli
and alternating between the two endpoints. In the test, two independent adaptive
tracks were used. They applied identical rules, but started at opposite ends of the
continuum and were designed to track 71% of /bi:/ or /pi:/ responses using a two-‐
down one-‐up rule (Levitt, 1971). The initial step size was 10 ms, decreasing over the
first three reversals to 3 ms. Using logistic regression a sigmoid curve was fitted to
each test result. The phoneme boundary indicates the VOT where the stimulus is
equally labelled [bi:] or [pi:]. The graph of a typical response function, as well as the
adaptive tracks, are illustrated in Figure 3.
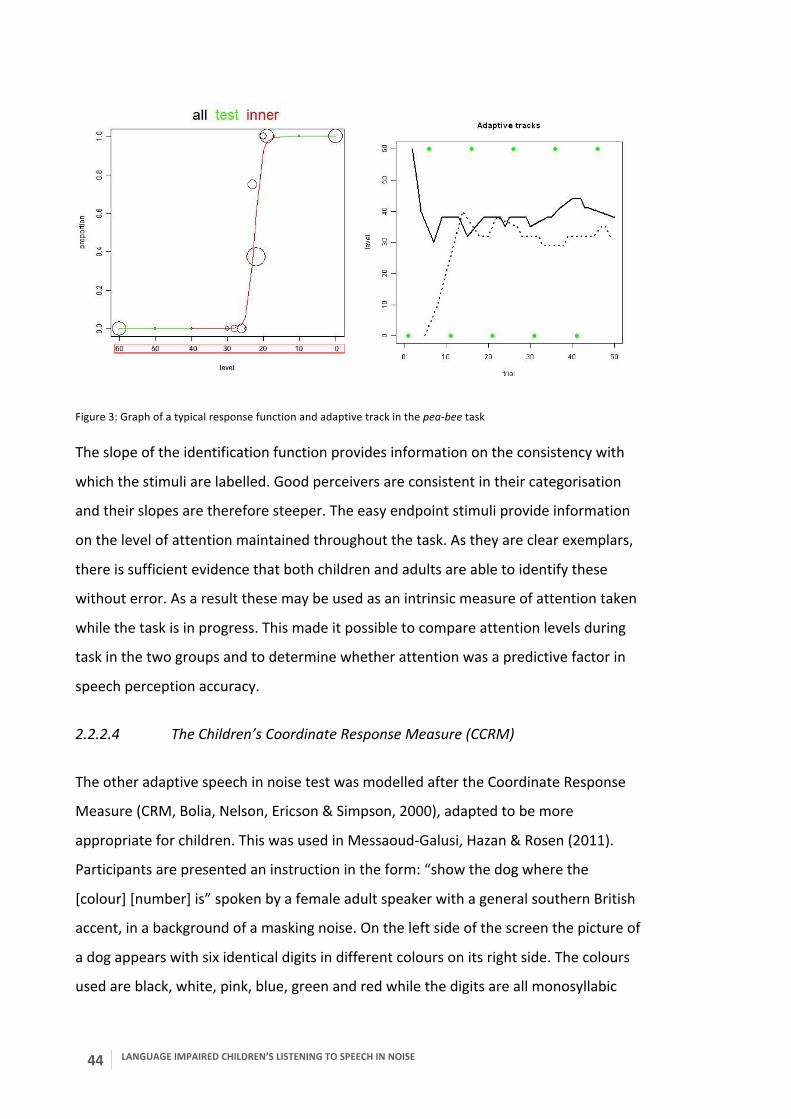
44 LANGUAGE IMPAIRED CHILDREN’S LISTENING TO SPEECH IN NOISE
Figure 3: Graph of a typical response function and adaptive track in the pea-‐bee task
The slope of the identification function provides information on the consistency with
which the stimuli are labelled. Good perceivers are consistent in their categorisation
and their slopes are therefore steeper. The easy endpoint stimuli provide information
on the level of attention maintained throughout the task. As they are clear exemplars,
there is sufficient evidence that both children and adults are able to identify these
without error. As a result these may be used as an intrinsic measure of attention taken
while the task is in progress. This made it possible to compare attention levels during
task in the two groups and to determine whether attention was a predictive factor in
speech perception accuracy.
2.2.2.4 The Children’s Coordinate Response Measure (CCRM)
The other adaptive speech in noise test was modelled after the Coordinate Response
Measure (CRM, Bolia, Nelson, Ericson & Simpson, 2000), adapted to be more
appropriate for children. This was used in Messaoud-‐Galusi, Hazan & Rosen (2011).
Participants are presented an instruction in the form: “show the dog where the
[colour] [number] is” spoken by a female adult speaker with a general southern British
accent, in a background of a masking noise. On the left side of the screen the picture of
a dog appears with six identical digits in different colours on its right side. The colours
used are black, white, pink, blue, green and red while the digits are all monosyllabic
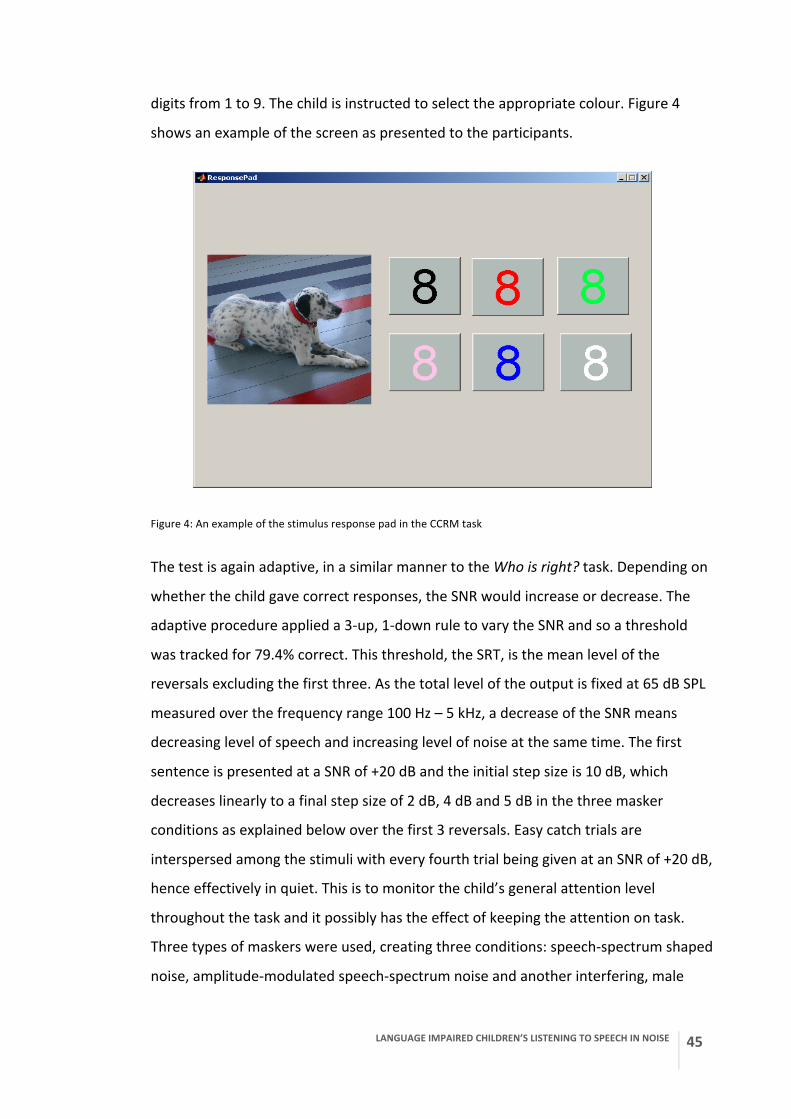
LANGUAGE IMPAIRED CHILDREN’S LISTENING TO SPEECH IN NOISE
45
digits from 1 to 9. The child is instructed to select the appropriate colour. Figure 4
shows an example of the screen as presented to the participants.
Figure 4: An example of the stimulus response pad in the CCRM task
The test is again adaptive, in a similar manner to the Who is right? task. Depending on
whether the child gave correct responses, the SNR would increase or decrease. The
adaptive procedure applied a 3-‐up, 1-‐down rule to vary the SNR and so a threshold
was tracked for 79.4% correct. This threshold, the SRT, is the mean level of the
reversals excluding the first three. As the total level of the output is fixed at 65 dB SPL
measured over the frequency range 100 Hz – 5 kHz, a decrease of the SNR means
decreasing level of speech and increasing level of noise at the same time. The first
sentence is presented at a SNR of +20 dB and the initial step size is 10 dB, which
decreases linearly to a final step size of 2 dB, 4 dB and 5 dB in the three masker
conditions as explained below over the first 3 reversals. Easy catch trials are
interspersed among the stimuli with every fourth trial being given at an SNR of +20 dB,
hence effectively in quiet. This is to monitor the child’s general attention level
throughout the task and it possibly has the effect of keeping the attention on task.
Three types of maskers were used, creating three conditions: speech-‐spectrum shaped
noise, amplitude-‐modulated speech-‐spectrum noise and another interfering, male
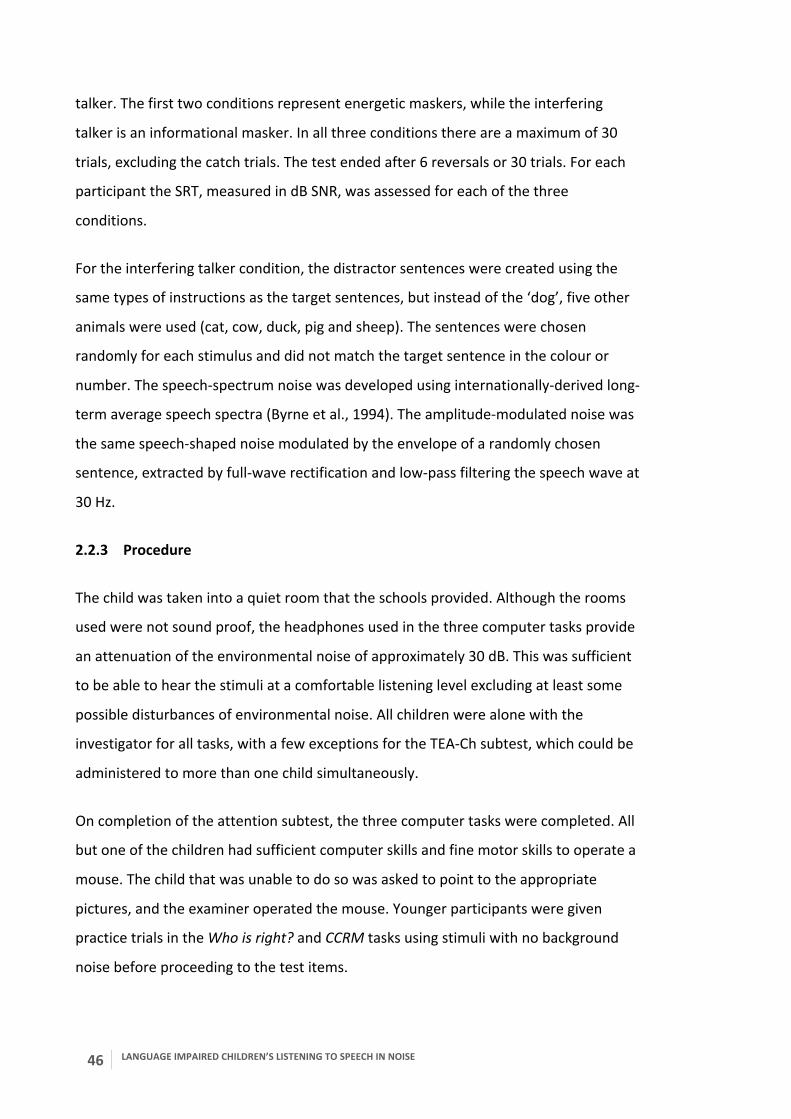
46 LANGUAGE IMPAIRED CHILDREN’S LISTENING TO SPEECH IN NOISE
talker. The first two conditions represent energetic maskers, while the interfering
talker is an informational masker. In all three conditions there are a maximum of 30
trials, excluding the catch trials. The test ended after 6 reversals or 30 trials. For each
participant the SRT, measured in dB SNR, was assessed for each of the three
conditions.
For the interfering talker condition, the distractor sentences were created using the
same types of instructions as the target sentences, but instead of the ‘dog’, five other
animals were used (cat, cow, duck, pig and sheep). The sentences were chosen
randomly for each stimulus and did not match the target sentence in the colour or
number. The speech-‐spectrum noise was developed using internationally-‐derived long-‐
term average speech spectra (Byrne et al., 1994). The amplitude-‐modulated noise was
the same speech-‐shaped noise modulated by the envelope of a randomly chosen
sentence, extracted by full-‐wave rectification and low-‐pass filtering the speech wave at
30 Hz.
2.2.3 Procedure
The child was taken into a quiet room that the schools provided. Although the rooms
used were not sound proof, the headphones used in the three computer tasks provide
an attenuation of the environmental noise of approximately 30 dB. This was sufficient
to be able to hear the stimuli at a comfortable listening level excluding at least some
possible disturbances of environmental noise. All children were alone with the
investigator for all tasks, with a few exceptions for the TEA-‐Ch subtest, which could be
administered to more than one child simultaneously.
On completion of the attention subtest, the three computer tasks were completed. All
but one of the children had sufficient computer skills and fine motor skills to operate a
mouse. The child that was unable to do so was asked to point to the appropriate
pictures, and the examiner operated the mouse. Younger participants were given
practice trials in the Who is right? and CCRM tasks using stimuli with no background
noise before proceeding to the test items.

LANGUAGE IMPAIRED CHILDREN’S LISTENING TO SPEECH IN NOISE
47
As attention was an important measure in the study, the order of administration of the
three tasks was randomised. The three conditions in the CCRM task were also
presented in a random order to counteract order effects. This was to control for the
natural decline of attention and consequent deterioration in performance and for the
potential learning effects.
2.2.4 Equipment
The auditory tasks were presented on a Dell PP01L laptop computer running Windows
XP via a pair of Sennheiser HD25-‐1 headphones. A computer mouse was used to select
the pictures where such responses were needed. For the attention test, the auditory
stimuli were played on a Wharfedale IP-‐200A portable CD/MP3 player using Hitachi
HS-‐AS-‐300 minispeakers to achieve sufficient audibility in the relatively loud ambient
noise of the schools.
2.3 Results
2.3.1 Effects of age and group
Children with SLI were compared to their age-‐matched TD peers on all experimental
tasks and on the sustained auditory attention measures. To do this, t-‐tests and a
general linear model were applied. On the experimental tasks, the scores obtained
were not controlled for age and it is expected that there will be an effect of age as well
as group on the speech perception and categorical perception tasks, and possibly an
interaction between group and age.
2.3.1.1 Speech reception thresholds (SRT) on the Who is right? task
Before analysing the data, the data points are represented in a scatterplot for general
inspection, Figure 5. Note that the SRTs are signal-‐to-‐noise ratios therefore a greater
number means less noise tolerated so poorer performance. This will be true of all SRTs
throughout this and the following studies.
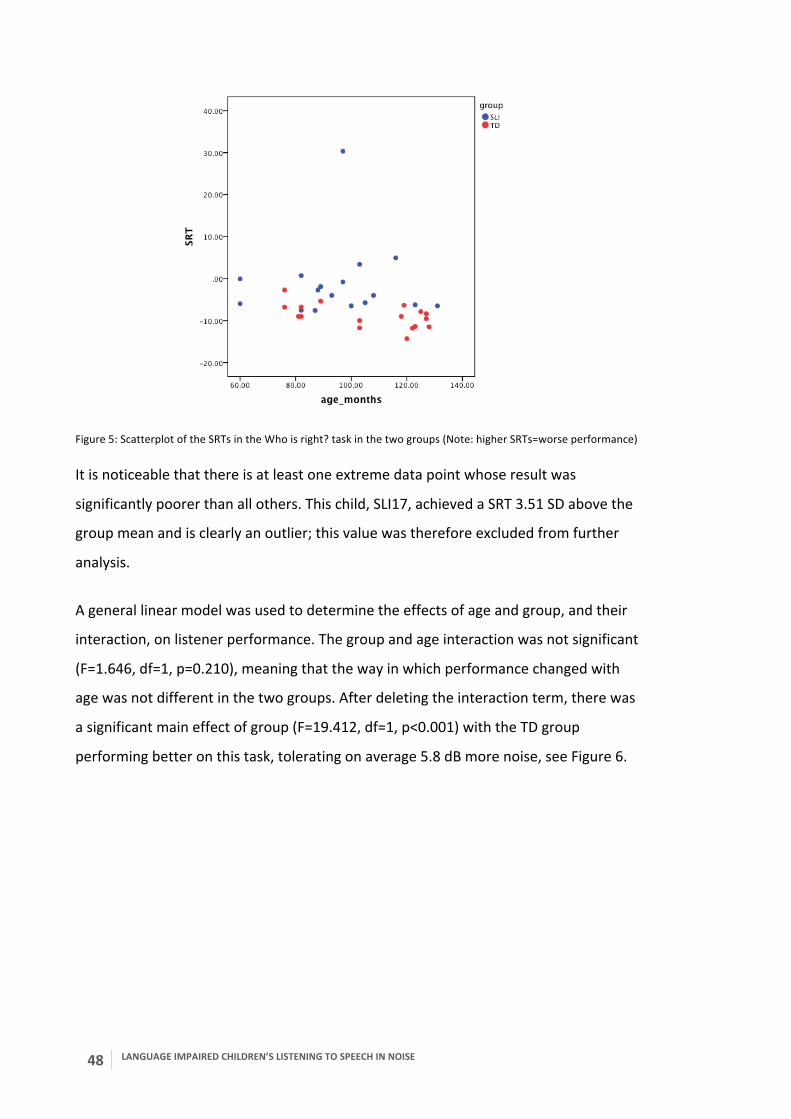
48 LANGUAGE IMPAIRED CHILDREN’S LISTENING TO SPEECH IN NOISE
Figure 5: Scatterplot of the SRTs in the Who is right? task in the two groups (Note: higher SRTs=worse performance) It is noticeable that there is at least one extreme data point whose result was
significantly poorer than all others. This child, SLI17, achieved a SRT 3.51 SD above the
group mean and is clearly an outlier; this value was therefore excluded from further
analysis.
A general linear model was used to determine the effects of age and group, and their
interaction, on listener performance. The group and age interaction was not significant
(F=1.646, df=1, p=0.210), meaning that the way in which performance changed with
age was not different in the two groups. After deleting the interaction term, there was
a significant main effect of group (F=19.412, df=1, p<0.001) with the TD group
performing better on this task, tolerating on average 5.8 dB more noise, see Figure 6.
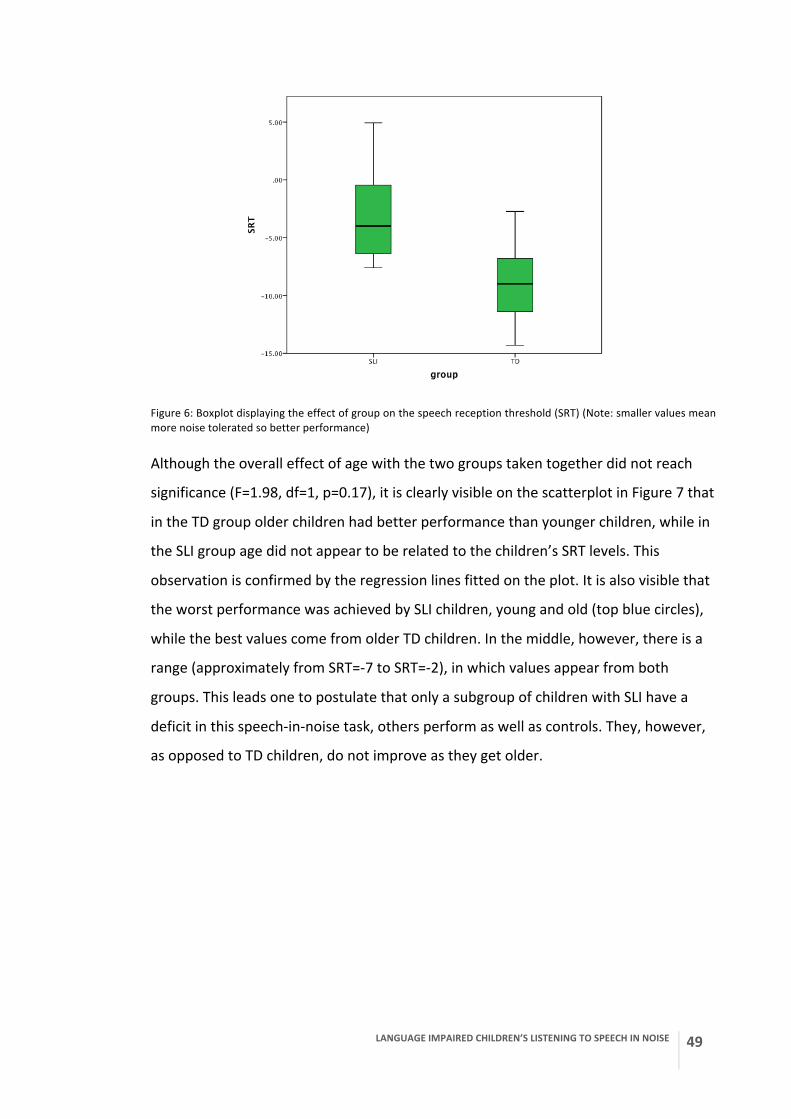
LANGUAGE IMPAIRED CHILDREN’S LISTENING TO SPEECH IN NOISE
49
Figure 6: Boxplot displaying the effect of group on the speech reception threshold (SRT) (Note: smaller values mean more noise tolerated so better performance)
Although the overall effect of age with the two groups taken together did not reach
significance (F=1.98, df=1, p=0.17), it is clearly visible on the scatterplot in Figure 7 that
in the TD group older children had better performance than younger children, while in
the SLI group age did not appear to be related to the children’s SRT levels. This
observation is confirmed by the regression lines fitted on the plot. It is also visible that
the worst performance was achieved by SLI children, young and old (top blue circles),
while the best values come from older TD children. In the middle, however, there is a
range (approximately from SRT=-‐7 to SRT=-‐2), in which values appear from both
groups. This leads one to postulate that only a subgroup of children with SLI have a
deficit in this speech-‐in-‐noise task, others perform as well as controls. They, however,
as opposed to TD children, do not improve as they get older.
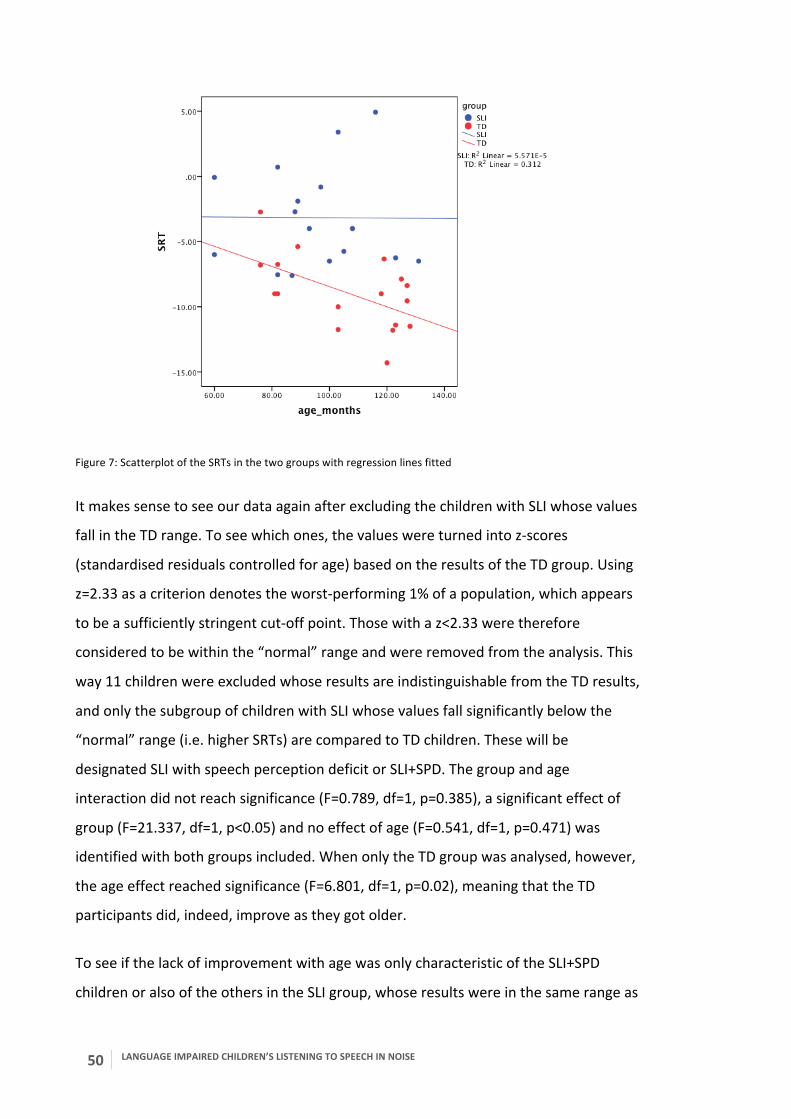
50 LANGUAGE IMPAIRED CHILDREN’S LISTENING TO SPEECH IN NOISE
Figure 7: Scatterplot of the SRTs in the two groups with regression lines fitted
It makes sense to see our data again after excluding the children with SLI whose values
fall in the TD range. To see which ones, the values were turned into z-‐scores
(standardised residuals controlled for age) based on the results of the TD group. Using
z=2.33 as a criterion denotes the worst-‐performing 1% of a population, which appears
to be a sufficiently stringent cut-‐off point. Those with a z<2.33 were therefore
considered to be within the “normal” range and were removed from the analysis. This
way 11 children were excluded whose results are indistinguishable from the TD results,
and only the subgroup of children with SLI whose values fall significantly below the
“normal” range (i.e. higher SRTs) are compared to TD children. These will be
designated SLI with speech perception deficit or SLI+SPD. The group and age
interaction did not reach significance (F=0.789, df=1, p=0.385), a significant effect of
group (F=21.337, df=1, p<0.05) and no effect of age (F=0.541, df=1, p=0.471) was
identified with both groups included. When only the TD group was analysed, however,
the age effect reached significance (F=6.801, df=1, p=0.02), meaning that the TD
participants did, indeed, improve as they got older.
To see if the lack of improvement with age was only characteristic of the SLI+SPD
children or also of the others in the SLI group, whose results were in the same range as
LANGUAGE IMPAIRED CHILDREN’S LISTENING TO SPEECH IN NOISE
51
the TD children’s (no speech perception deficit=SLI-‐SPD), the analysis was run again
with only the SLI-‐SPD values. No interaction was found (F=0.811, df=1, p=0.377), but
an effect of age (F=7.798, df=1, p=0.01) and, interestingly, group (F=10.42, df=1,
p=0.003). So the remaining SLI children, whose values fell within the range of z<2.33,
did improve with age just like the TD children. Their group results, however, still
differed statistically from the TD group possibly due to their values clustered around
the lower end of the range.
The standard deviations of the SNR of the reversals in the test phase were also
compared. Larger SDs could indicate less consistent perception, perhaps as a result of
poor or fluctuating attention, or fluctuating perceptual skills caused by environmental
priming (i.e. the effect of a noisy vs clear stimulus on the perception of the following
stimulus). An analysis indicated no interaction and no effect of age, but a significant
main effect of group (F=3.977, df=1, p=0.055), with the SLI group having 0.65 higher
mean. This is an indication of the SLI group’s less consistent and more fluctuating
performance on this task.
2.3.1.2 Syllable identification on the [pi: -‐ bi:] continuum
The effects of group and age on the slope of the identification function were analysed
in the bee – pea task. One participant (SLI14) was found to have labelled nearly all
stimuli randomly and no identification function and slope were obtained. The results
of this subject were excluded from further analysis. The distribution of the individual
slopes was highly skewed, so each slope was log transformed for further analysis to
make the data distributed more normally (a method also used by Messaoud-‐Galusi et
al., 2011, for the same experimental task). Using a general linear model analysis, no
interaction was found between group and age (F=0.669, df=1, p=0.42), nor group
effect (F=2.792, df=1, p=0.105), but a significant main effect of age (F=26.313, df=1,
p<0.001). Regression analysis indicated (r2=0.536, p<0.001) that 53.6% of the total
variance is accounted for by the correlation with age (Figure 8).
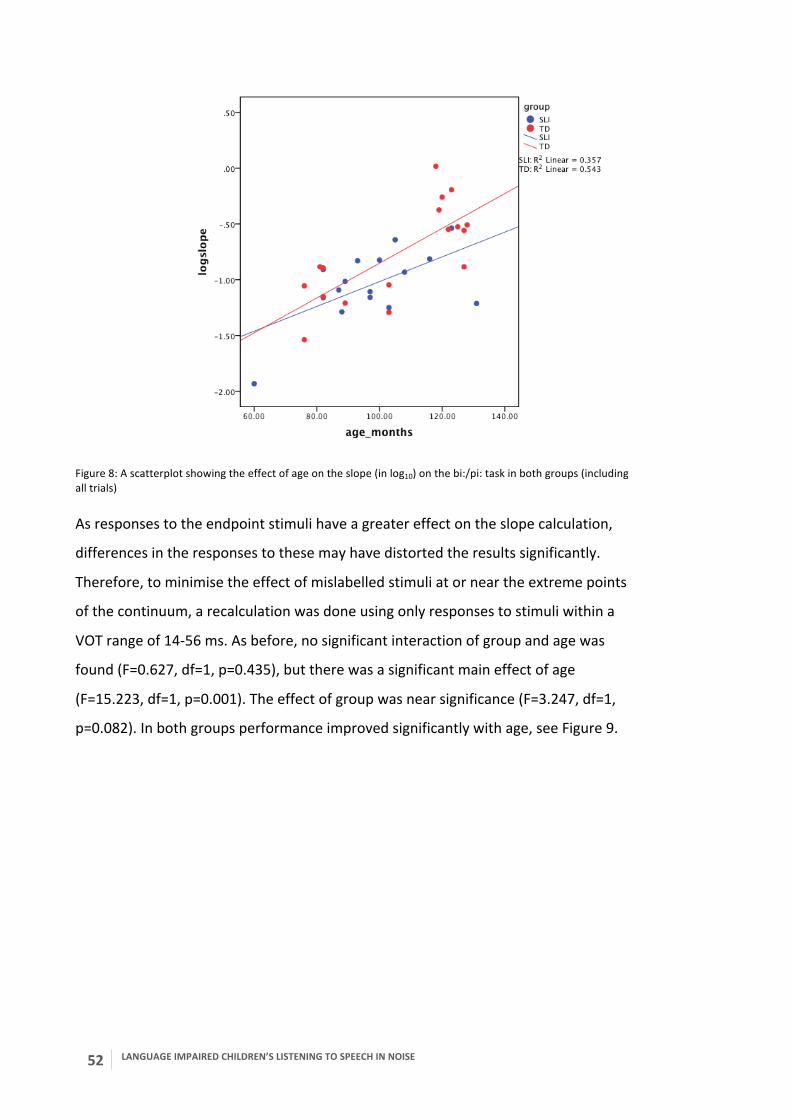
52 LANGUAGE IMPAIRED CHILDREN’S LISTENING TO SPEECH IN NOISE
Figure 8: A scatterplot showing the effect of age on the slope (in log10) on the bi:/pi: task in both groups (including all trials)
As responses to the endpoint stimuli have a greater effect on the slope calculation,
differences in the responses to these may have distorted the results significantly.
Therefore, to minimise the effect of mislabelled stimuli at or near the extreme points
of the continuum, a recalculation was done using only responses to stimuli within a
VOT range of 14-‐56 ms. As before, no significant interaction of group and age was
found (F=0.627, df=1, p=0.435), but there was a significant main effect of age
(F=15.223, df=1, p=0.001). The effect of group was near significance (F=3.247, df=1,
p=0.082). In both groups performance improved significantly with age, see Figure 9.

LANGUAGE IMPAIRED CHILDREN’S LISTENING TO SPEECH IN NOISE
53
Figure 9: A scatterplot showing the effect of age and group on the slope (in log10) (responses to mid-‐range stimuli only)
A comparison of the values of the phoneme boundary in a general linear model did not
indicate a group and age interaction (F=0.054, df=1, p=0.818), a group effect (F=0.967,
df=1, p=0.333), or age effect (F=0.605, df=1, p=0.443). The mean was 25.2 ms VOT in
the SLI group and 23.3 ms in the TD group. This is comparable to the adult phoneme
boundary, which is about 22 ms VOT (Messaoud-‐Galusi et al., 2011; Lisker &
Abramson, 1970).
2.3.1.3 Speech reception thresholds in the three noise conditions on the CCRM
task
Initial analysis of the data revealed that one participant in the SLI group (SLI13) did not
appear to understand the task, as the responses were random even to the catch trials
and no reversals or SRTs could be calculated. Therefore this subject was excluded from
analysis.
Before analysing the groups separately in the different conditions, the SRTs in the
conditions and the way in which the groups differed were considered. To compare the
conditions and groups, a 2 groups x3 conditions repeated measures ANOVA was
applied. This revealed a condition x group x age three-‐way interaction (F=4.006, df=2,
54 LANGUAGE IMPAIRED CHILDREN’S LISTENING TO SPEECH IN NOISE
p=0.023), which means that the groups differences were not the same in the three
conditions and the effect of age was also different in the two groups and three
conditions. The order of difficulty was determined by looking at the numerical value of
the SRT means. Based on this, both groups tolerated the most noise in the speech-‐
spectrum noise condition (SLI mean= -‐3 dB, TD mean= -‐6.1 dB). The next in order of
tolerated noise levels was the modulated noise condition in both groups (SLI mean= -‐
2.7 dB, TD mean= -‐5.9 dB) and the hardest condition for both groups proved to be the
interfering speaker condition (SLI mean= 10.2 dB, TD mean= -‐1.7). In order to account
for the different variances, age-‐adjusted z-‐scores were created from the SRTs based on
the TD group’s results. By definition, the means of the z-‐scores in the TD group were
therefore 0, while the SLI means were the following: speech-‐spectrum noise: 1.4,
modulated noise: 1.02, interfering speaker: 2.26. The SLI children therefore found the
interfering speaker to be the hardest listening condition, but the easiest was the
modulated noise condition. While numerically this was different, a t-‐test on the z-‐
scores means did not indicate significance (t=1.536, df=15, p=0.145). The order of
difficulty and what this might mean will be considered again in Study 2.
In the speech-‐spectrum noise condition an ANOVA was run using the general linear
model with group and age as the predictor variables and SRTs as the outcome variable.
This revealed no age and group interaction (F=0.961, df=1, p=0.335), a significant main
effect of group (F=4.299, df=1, p=0.047), and a main effect of age (F=4.271, df=1,
p=0.047). Figure 10 displays the results.

LANGUAGE IMPAIRED CHILDREN’S LISTENING TO SPEECH IN NOISE
55
Figure 10: Results in the speech-‐spectrum noise condition in the two groups
The mean SRT in the TD group was 3.1 dB lower (more noise tolerated) than in the SLI
group. However, on inspecting the scatterplot above it is visible that several data
points of the SLI children were in the same range as the TD data points and the group
difference may be caused by only a few very poorly performing SLI participants. To see
whether this is true all SRT scores were turned into z-‐scores based on the TD group’s
results. The following scatterplot shows the distribution of the z-‐scores in the two
groups, Figure 11.
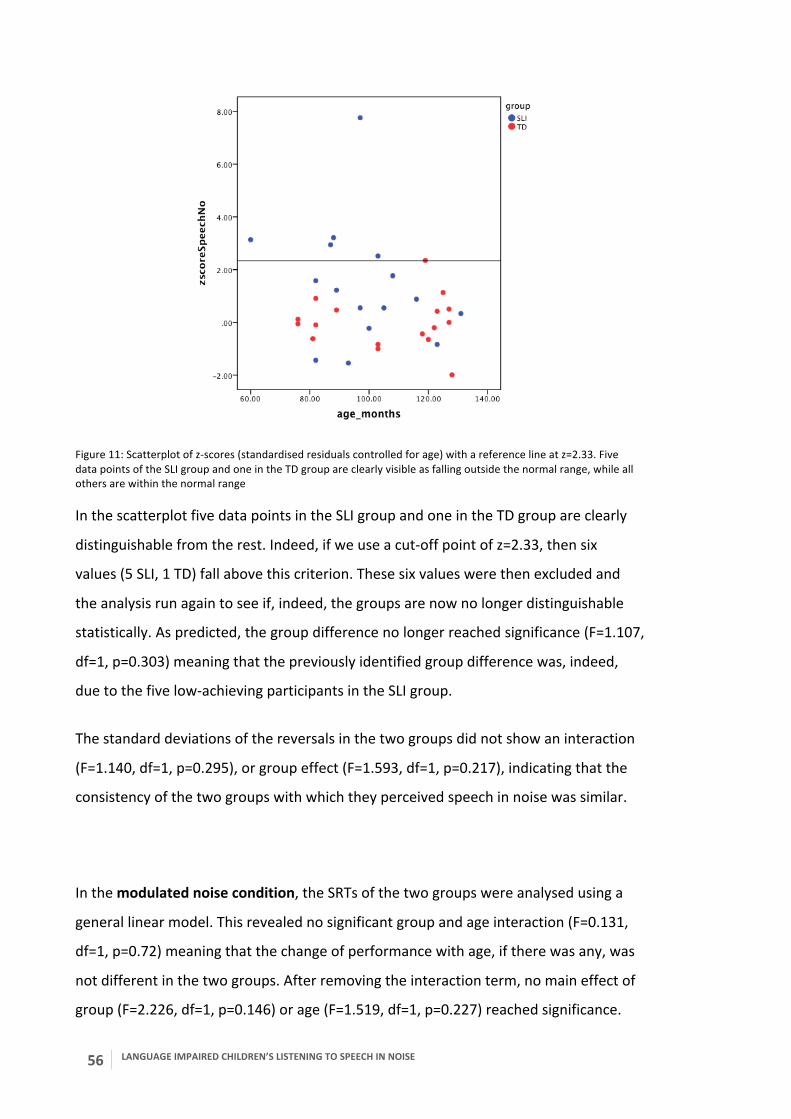
56 LANGUAGE IMPAIRED CHILDREN’S LISTENING TO SPEECH IN NOISE
Figure 11: Scatterplot of z-‐scores (standardised residuals controlled for age) with a reference line at z=2.33. Five data points of the SLI group and one in the TD group are clearly visible as falling outside the normal range, while all others are within the normal range In the scatterplot five data points in the SLI group and one in the TD group are clearly
distinguishable from the rest. Indeed, if we use a cut-‐off point of z=2.33, then six
values (5 SLI, 1 TD) fall above this criterion. These six values were then excluded and
the analysis run again to see if, indeed, the groups are now no longer distinguishable
statistically. As predicted, the group difference no longer reached significance (F=1.107,
df=1, p=0.303) meaning that the previously identified group difference was, indeed,
due to the five low-‐achieving participants in the SLI group.
The standard deviations of the reversals in the two groups did not show an interaction
(F=1.140, df=1, p=0.295), or group effect (F=1.593, df=1, p=0.217), indicating that the
consistency of the two groups with which they perceived speech in noise was similar.
In the modulated noise condition, the SRTs of the two groups were analysed using a
general linear model. This revealed no significant group and age interaction (F=0.131,
df=1, p=0.72) meaning that the change of performance with age, if there was any, was
not different in the two groups. After removing the interaction term, no main effect of
group (F=2.226, df=1, p=0.146) or age (F=1.519, df=1, p=0.227) reached significance.
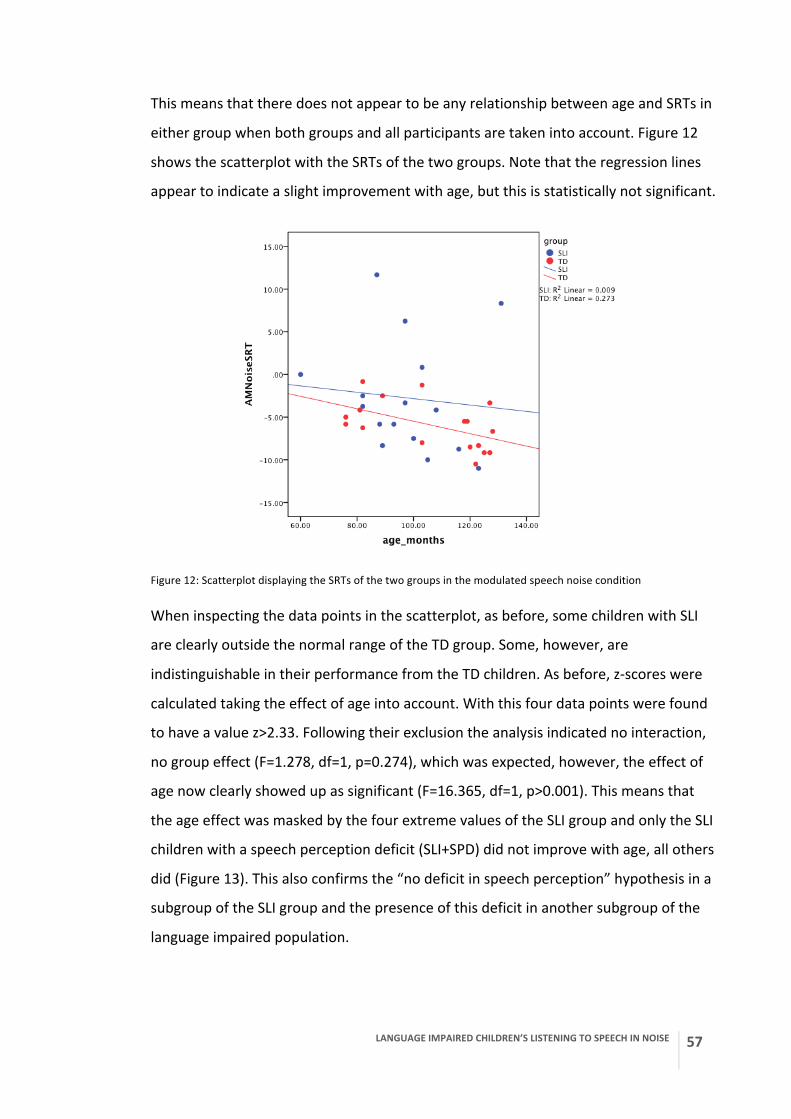
LANGUAGE IMPAIRED CHILDREN’S LISTENING TO SPEECH IN NOISE
57
This means that there does not appear to be any relationship between age and SRTs in
either group when both groups and all participants are taken into account. Figure 12
shows the scatterplot with the SRTs of the two groups. Note that the regression lines
appear to indicate a slight improvement with age, but this is statistically not significant.
Figure 12: Scatterplot displaying the SRTs of the two groups in the modulated speech noise condition
When inspecting the data points in the scatterplot, as before, some children with SLI
are clearly outside the normal range of the TD group. Some, however, are
indistinguishable in their performance from the TD children. As before, z-‐scores were
calculated taking the effect of age into account. With this four data points were found
to have a value z>2.33. Following their exclusion the analysis indicated no interaction,
no group effect (F=1.278, df=1, p=0.274), which was expected, however, the effect of
age now clearly showed up as significant (F=16.365, df=1, p>0.001). This means that
the age effect was masked by the four extreme values of the SLI group and only the SLI
children with a speech perception deficit (SLI+SPD) did not improve with age, all others
did (Figure 13). This also confirms the “no deficit in speech perception” hypothesis in a
subgroup of the SLI group and the presence of this deficit in another subgroup of the
language impaired population.
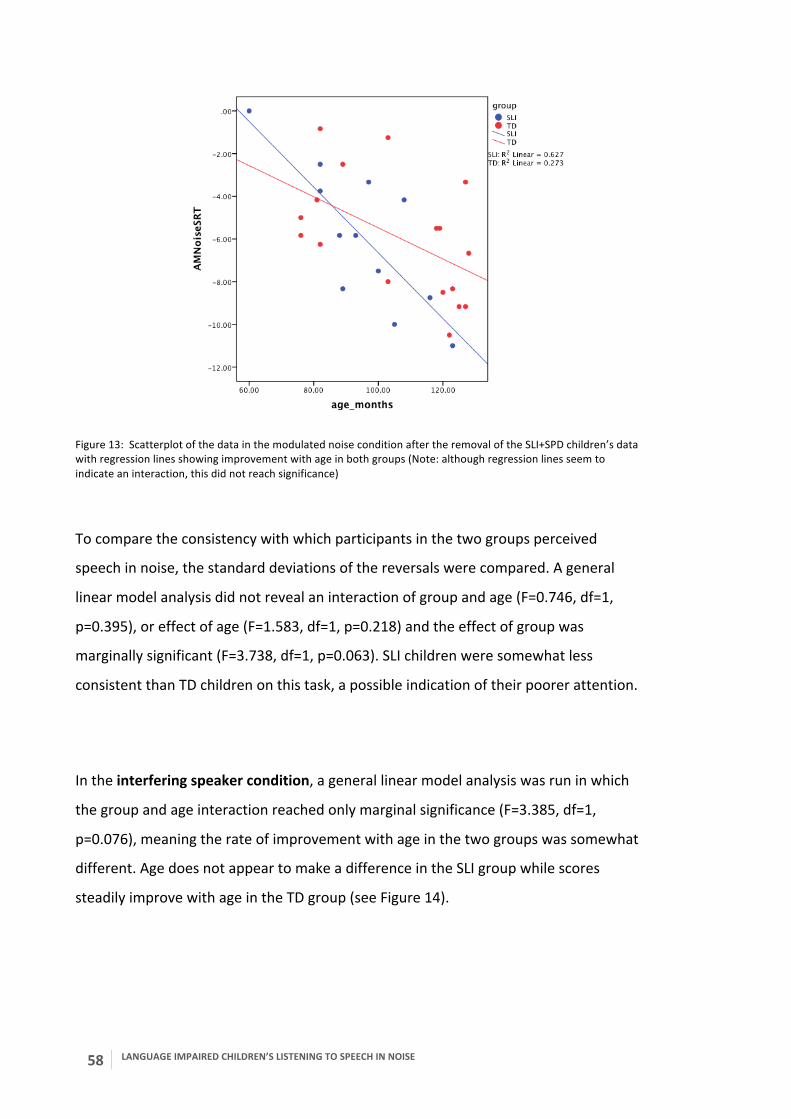
58 LANGUAGE IMPAIRED CHILDREN’S LISTENING TO SPEECH IN NOISE
Figure 13: Scatterplot of the data in the modulated noise condition after the removal of the SLI+SPD children’s data with regression lines showing improvement with age in both groups (Note: although regression lines seem to indicate an interaction, this did not reach significance)
To compare the consistency with which participants in the two groups perceived
speech in noise, the standard deviations of the reversals were compared. A general
linear model analysis did not reveal an interaction of group and age (F=0.746, df=1,
p=0.395), or effect of age (F=1.583, df=1, p=0.218) and the effect of group was
marginally significant (F=3.738, df=1, p=0.063). SLI children were somewhat less
consistent than TD children on this task, a possible indication of their poorer attention.
In the interfering speaker condition, a general linear model analysis was run in which
the group and age interaction reached only marginal significance (F=3.385, df=1,
p=0.076), meaning the rate of improvement with age in the two groups was somewhat
different. Age does not appear to make a difference in the SLI group while scores
steadily improve with age in the TD group (see Figure 14).
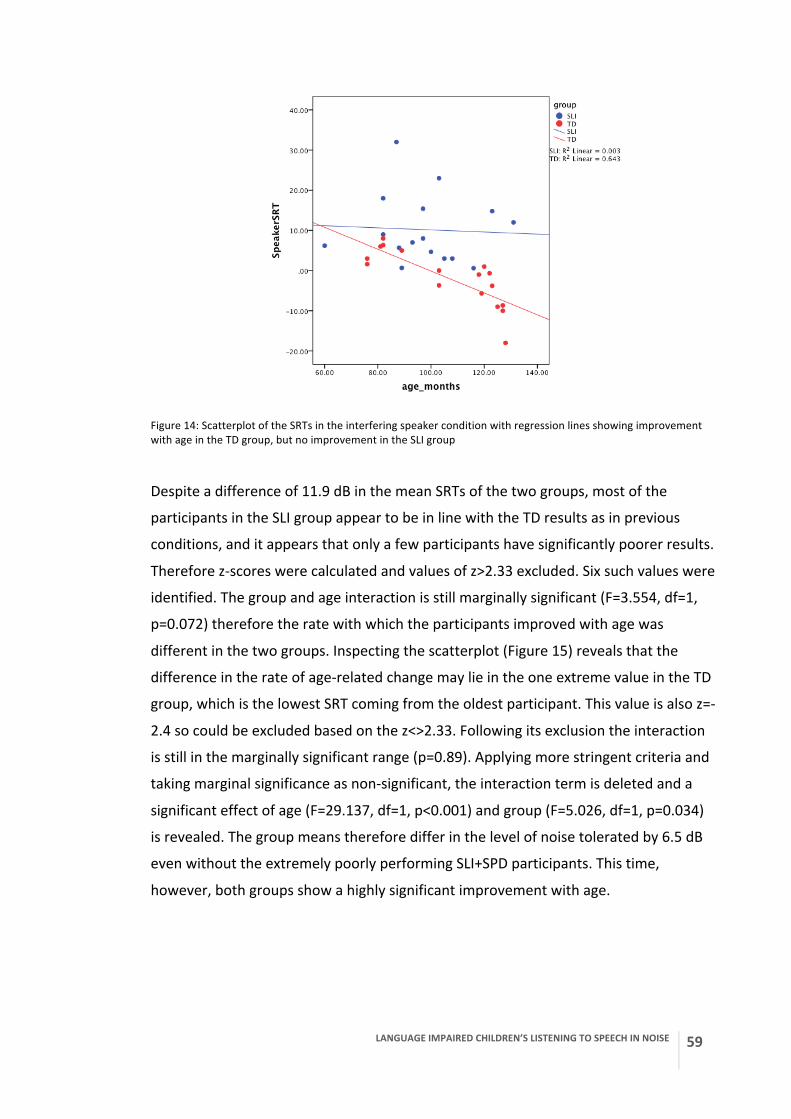
LANGUAGE IMPAIRED CHILDREN’S LISTENING TO SPEECH IN NOISE
59
Figure 14: Scatterplot of the SRTs in the interfering speaker condition with regression lines showing improvement with age in the TD group, but no improvement in the SLI group
Despite a difference of 11.9 dB in the mean SRTs of the two groups, most of the
participants in the SLI group appear to be in line with the TD results as in previous
conditions, and it appears that only a few participants have significantly poorer results.
Therefore z-‐scores were calculated and values of z>2.33 excluded. Six such values were
identified. The group and age interaction is still marginally significant (F=3.554, df=1,
p=0.072) therefore the rate with which the participants improved with age was
different in the two groups. Inspecting the scatterplot (Figure 15) reveals that the
difference in the rate of age-‐related change may lie in the one extreme value in the TD
group, which is the lowest SRT coming from the oldest participant. This value is also z=-‐
2.4 so could be excluded based on the z<>2.33. Following its exclusion the interaction
is still in the marginally significant range (p=0.89). Applying more stringent criteria and
taking marginal significance as non-‐significant, the interaction term is deleted and a
significant effect of age (F=29.137, df=1, p<0.001) and group (F=5.026, df=1, p=0.034)
is revealed. The group means therefore differ in the level of noise tolerated by 6.5 dB
even without the extremely poorly performing SLI+SPD participants. This time,
however, both groups show a highly significant improvement with age.
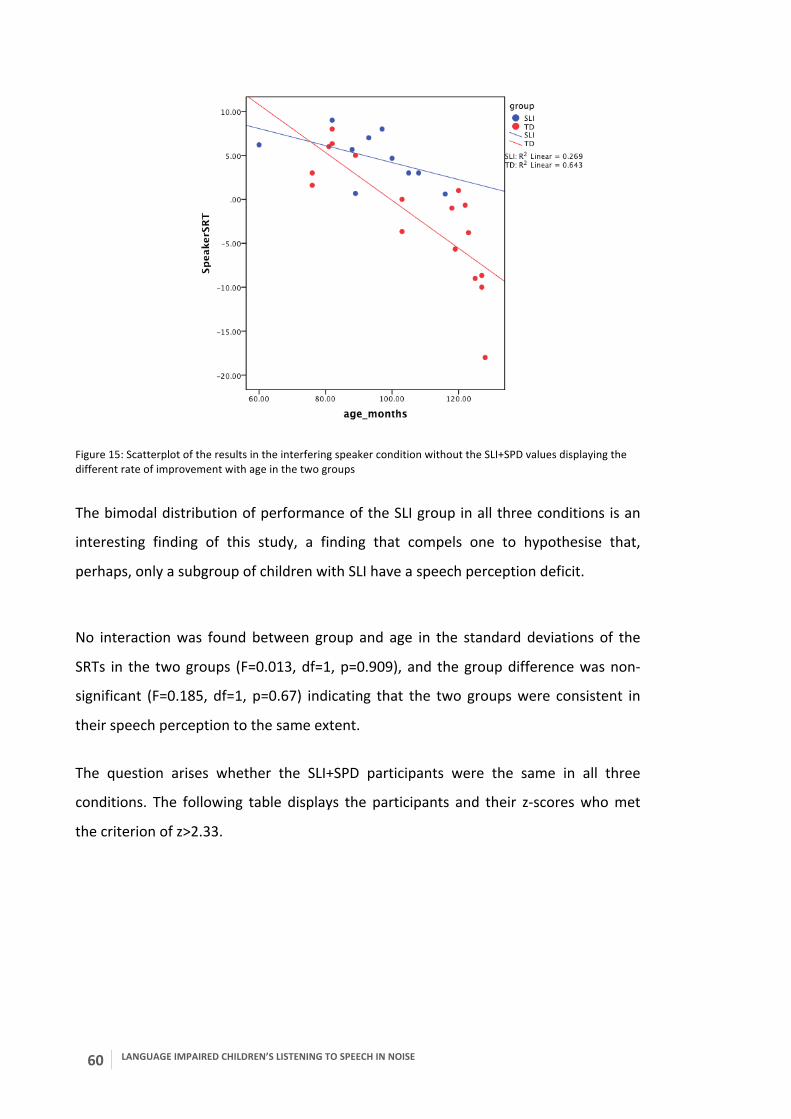
60 LANGUAGE IMPAIRED CHILDREN’S LISTENING TO SPEECH IN NOISE
Figure 15: Scatterplot of the results in the interfering speaker condition without the SLI+SPD values displaying the different rate of improvement with age in the two groups
The bimodal distribution of performance of the SLI group in all three conditions is an
interesting finding of this study, a finding that compels one to hypothesise that,
perhaps, only a subgroup of children with SLI have a speech perception deficit.
No interaction was found between group and age in the standard deviations of the
SRTs in the two groups (F=0.013, df=1, p=0.909), and the group difference was non-‐
significant (F=0.185, df=1, p=0.67) indicating that the two groups were consistent in
their speech perception to the same extent.
The question arises whether the SLI+SPD participants were the same in all three
conditions. The following table displays the participants and their z-‐scores who met
the criterion of z>2.33.
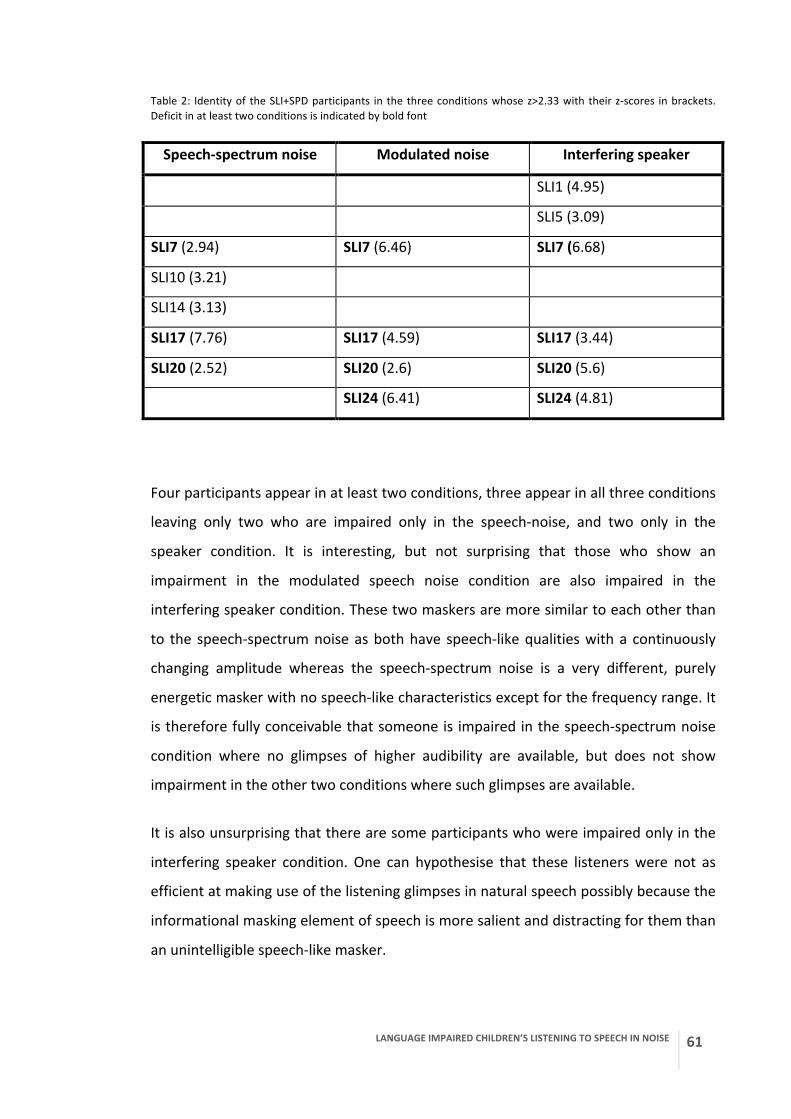
LANGUAGE IMPAIRED CHILDREN’S LISTENING TO SPEECH IN NOISE
61
Table 2: Identity of the SLI+SPD participants in the three conditions whose z>2.33 with their z-‐scores in brackets. Deficit in at least two conditions is indicated by bold font
Speech-‐spectrum noise Modulated noise Interfering speaker
SLI1 (4.95)
SLI5 (3.09)
SLI7 (2.94) SLI7 (6.46) SLI7 (6.68)
SLI10 (3.21)
SLI14 (3.13)
SLI17 (7.76) SLI17 (4.59) SLI17 (3.44)
SLI20 (2.52) SLI20 (2.6) SLI20 (5.6)
SLI24 (6.41) SLI24 (4.81)
Four participants appear in at least two conditions, three appear in all three conditions
leaving only two who are impaired only in the speech-‐noise, and two only in the
speaker condition. It is interesting, but not surprising that those who show an
impairment in the modulated speech noise condition are also impaired in the
interfering speaker condition. These two maskers are more similar to each other than
to the speech-‐spectrum noise as both have speech-‐like qualities with a continuously
changing amplitude whereas the speech-‐spectrum noise is a very different, purely
energetic masker with no speech-‐like characteristics except for the frequency range. It
is therefore fully conceivable that someone is impaired in the speech-‐spectrum noise
condition where no glimpses of higher audibility are available, but does not show
impairment in the other two conditions where such glimpses are available.
It is also unsurprising that there are some participants who were impaired only in the
interfering speaker condition. One can hypothesise that these listeners were not as
efficient at making use of the listening glimpses in natural speech possibly because the
informational masking element of speech is more salient and distracting for them than
an unintelligible speech-‐like masker.

62 LANGUAGE IMPAIRED CHILDREN’S LISTENING TO SPEECH IN NOISE
All in all it can be concluded that there was a trend for the same participants to have a
speech perception deficit (SPD) in all conditions, although no statistical evidence can
be provided based on such a small number of testees.
2.3.2 Attention levels
The group means of the TEA-‐Ch ‘Walk, Don’t Walk’ subtest scaled scores were
compared using an independent-‐samples t-‐test, as scaled scores are already age-‐
adjusted. This indicated a significant main effect of group (t=-‐1.258, df=32, p=0.003)
suggesting better attention in the TD group. Figure 16 displays the boxplots of the two
groups. One participant in the SLI group (SLI4) had a particularly high score on this
subtest (SS=12, which is 3.27 SD above the group mean), while none of the other
children with SLI achieved higher than SS=7. In fact only one more SLI child performed
within the normal range (SS=7) and all others showed a below normal performance on
this attention test (see Figure 17).
Figure 16: Boxplots displaying the TEA-‐Ch scaled scores in the two groups
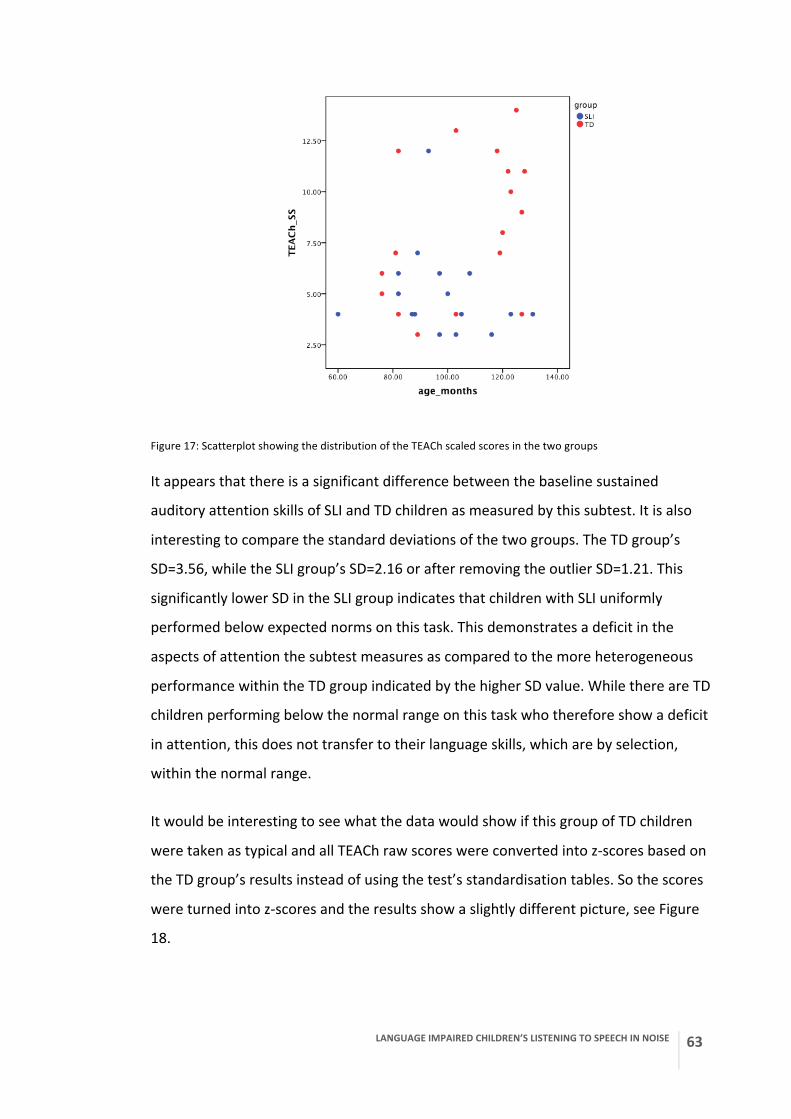
LANGUAGE IMPAIRED CHILDREN’S LISTENING TO SPEECH IN NOISE
63
Figure 17: Scatterplot showing the distribution of the TEACh scaled scores in the two groups
It appears that there is a significant difference between the baseline sustained
auditory attention skills of SLI and TD children as measured by this subtest. It is also
interesting to compare the standard deviations of the two groups. The TD group’s
SD=3.56, while the SLI group’s SD=2.16 or after removing the outlier SD=1.21. This
significantly lower SD in the SLI group indicates that children with SLI uniformly
performed below expected norms on this task. This demonstrates a deficit in the
aspects of attention the subtest measures as compared to the more heterogeneous
performance within the TD group indicated by the higher SD value. While there are TD
children performing below the normal range on this task who therefore show a deficit
in attention, this does not transfer to their language skills, which are by selection,
within the normal range.
It would be interesting to see what the data would show if this group of TD children
were taken as typical and all TEACh raw scores were converted into z-‐scores based on
the TD group’s results instead of using the test’s standardisation tables. So the scores
were turned into z-‐scores and the results show a slightly different picture, see Figure
18.
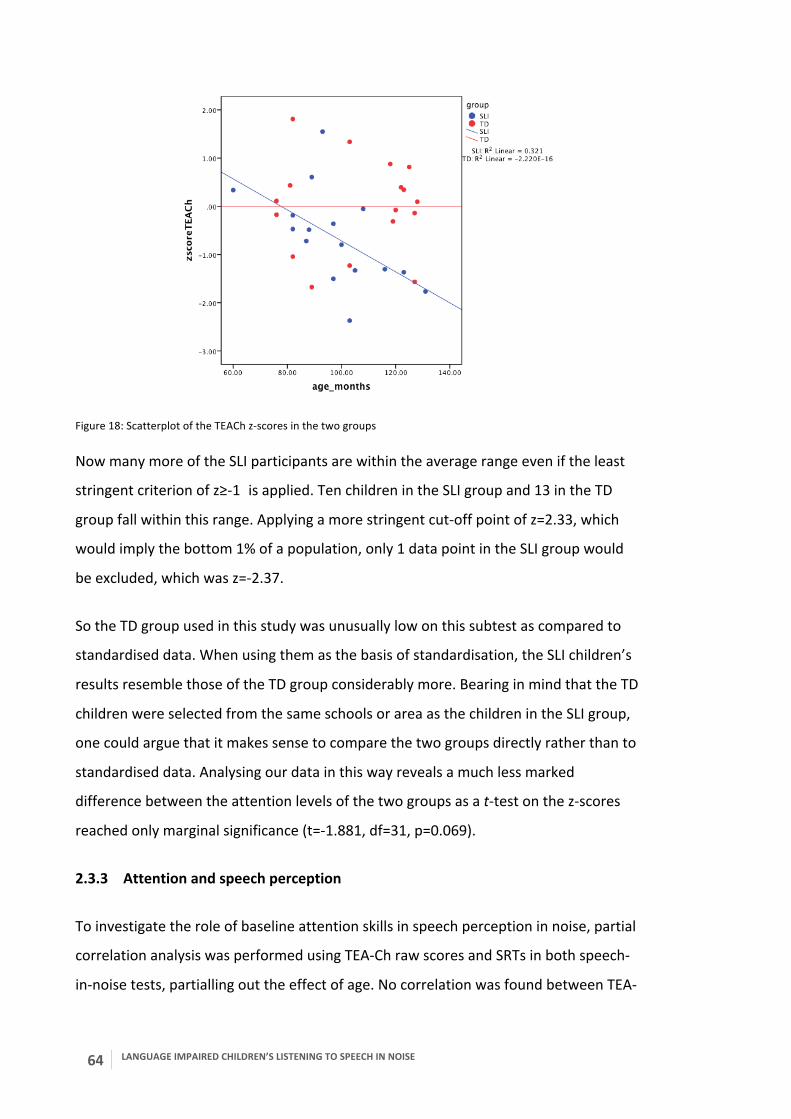
64 LANGUAGE IMPAIRED CHILDREN’S LISTENING TO SPEECH IN NOISE
Figure 18: Scatterplot of the TEACh z-‐scores in the two groups
Now many more of the SLI participants are within the average range even if the least
stringent criterion of z≥-‐1 is applied. Ten children in the SLI group and 13 in the TD
group fall within this range. Applying a more stringent cut-‐off point of z=2.33, which
would imply the bottom 1% of a population, only 1 data point in the SLI group would
be excluded, which was z=-‐2.37.
So the TD group used in this study was unusually low on this subtest as compared to
standardised data. When using them as the basis of standardisation, the SLI children’s
results resemble those of the TD group considerably more. Bearing in mind that the TD
children were selected from the same schools or area as the children in the SLI group,
one could argue that it makes sense to compare the two groups directly rather than to
standardised data. Analysing our data in this way reveals a much less marked
difference between the attention levels of the two groups as a t-‐test on the z-‐scores
reached only marginal significance (t=-‐1.881, df=31, p=0.069).
2.3.3 Attention and speech perception
To investigate the role of baseline attention skills in speech perception in noise, partial
correlation analysis was performed using TEA-‐Ch raw scores and SRTs in both speech-‐
in-‐noise tests, partialling out the effect of age. No correlation was found between TEA-‐

LANGUAGE IMPAIRED CHILDREN’S LISTENING TO SPEECH IN NOISE
65
Ch scores and SRTs on the Who is right? task in the SLI group (r=-‐0.006, p=0.981), or in
the TD group (r=-‐0.393, p=0.132).
No correlation was found between TEA-‐Ch raw scores and SRTs in the CCRM task in
any of the conditions: the speech noise condition in the SLI (p=0.49) and TD groups
(p=0.443), the modulated noise condition in the SLI group (p=0.4) or the TD group
(p=0.296), in the interfering speaker condition in the SLI group (p=0.14) and in the TD
group (p=0.425). Children’s baseline attention scores therefore, regardless of their
language skills, do not appear to bear any relevance in predicting their ability to
understand speech in noise.
The proportion of correct responses to the catch trials in the CCRM task, as an intrinsic
measure of attention was examined in the two groups. In all three conditions taken
together there were only four incorrect responses to all catch trials in the TD group
(out of a total number of 339, which is 1.18%), while in the SLI group the instances of
incorrect responses were 29 (out of 314, which is 9.24%). This indicates poorer
attention during task in the SLI group.
Further correlation analyses were conducted to establish any further relationships
between TEA-‐Ch raw scores and other measures of attention such as the standard
deviations on the speech-‐in-‐noise tasks, the proportion of correct responses to the
catch trials in the CCRM task, but no significant correlation was found between any of
these measures.
2.4 Discussion
Some findings of this study were expected and they confirmed the initial hypotheses,
while some others were somewhat surprising.
Generally, the typically developing children fared better in listening to speech in noise
than their age-‐matched language-‐impaired peers. The speech perceptual deficit in
language impairment was therefore confirmed. This deficit, however, was not the
66 LANGUAGE IMPAIRED CHILDREN’S LISTENING TO SPEECH IN NOISE
same in all tasks and conditions and did certainly not characterise all language
impaired individuals.
A significant group difference was identified in the presence of a speech-‐spectrum
shaped masker both when listening to single words and sentences. This difference
remained significant in the single word listening task even after excluding the
participants with severe speech perception deficits, but disappeared after their
exclusion in the listening to sentences task. It could be concluded that language
impaired children tend to be poor listeners overall, but this listening difficulty reaches
clinical significance only in a minority of cases. Most group differences, therefore,
come from a proportion of participants with significant deficits of speech perception in
noise. This divides the language impaired population into two fairly well
distinguishable subgroups, those with and without speech perception deficit.
It was interesting to find that these clinically significant perceptual deficits do not
appear to improve as children get older, unlike in typical development or in language
impairment without significant perceptual deficits. Although the small number of
participants in the current study makes it challenging to draw conclusions regarding
this, the lack of improvement with age was confirmed several times in different noise
conditions and can thus be regarded as a robust finding.
The phonemic categorisation ability of language impaired children on this task was not
different from controls. The phoneme boundary at which the perception of the
synthetic syllable changes from one to the other, in this case /bi:/ and /pi:/, also did
not differ in the two groups. These findings do not corroborate claims of deficits in
categorical perception in language impairment. In this task no noise was added so it
remains unanswered whether added noise would bring potential underlying
perceptual difficulties to the surface. As there was no indication that categorical
perception might have been an issue to be further explored, the addition of noise did
not take place and no more such tasks were used in further studies.
It was unexpected that in the modulated noise condition the two groups did not
perform differently even though there were four clearly distinguishable language
LANGUAGE IMPAIRED CHILDREN’S LISTENING TO SPEECH IN NOISE
67
impaired children with a speech perception deficit. Although these participants’
(SLI+SPD) presence did not make a difference in the group difference as it did not
reach significance with or without them, the SLI+SPD listeners masked the relationship
between age and speech perception scores. The children with a perceptual deficit did
not show an improvement with age, while all others, including the language impaired
children without a speech perceptual deficit, did.
It is hard to explain the lack of group difference in speech perception scores in the
modulated noise condition as opposed to other conditions. This masker is an energetic
masker, but it contains continuously changing acoustic energy similarly to a spoken
sentence (from which it was modelled) without any intelligible element. This means
that the listener may be able to utilise the glimpses of low amplitude noise available
with this masker and from the bits piece together the acoustic strings more efficiently
than where such glimpses are not available as with the speech-‐spectrum noise masker;
or where such glimpses may be available, but the intelligibility of the masker has a
further distracting effect as in the interfering speaker condition. This could be evidence
for language impaired children’s ability to use acoustic glimpses with a similar
efficiency to typically developing listeners and that it is the intelligibility of speech that
causes their less efficient perception of speech in noise.
Similarly to the other conditions, in the interfering speaker condition a subgroup of the
language impaired participants was found to have clinically significant deficit in speech
perception scores, while the others were comparable to the control group’s
performance. The two groups, however, still differed even after these clinically
significant values were excluded. So the speech perception deficit in the presence of
another talker is unequivocally demonstrated. As before, the language impaired
children with a perceptual deficit did not improve with age, unlike the rest of the
participants. The rate of change with age was more marked in the typically developing
group.
At a first glance, the attention scores of the SLI group were significantly lower than the
TD group’s. This difference, however, disappeared when the two groups were
68 LANGUAGE IMPAIRED CHILDREN’S LISTENING TO SPEECH IN NOISE
compared directly to each other rather than to standardised data. No correlation was
found between the attention measures and any language or speech perception scores.
The main findings of the current study were a clearly identifiable subgroup of SLI with
clinically significant speech perception deficit that was unrelated to the children’s age;
age related improvement in speech perception scores in the TD and SLI-‐SPD groups;
most marked speech perception deficit was in the interfering speaker condition; no
deficit in categorical perception and no significant difference in auditory attention.
LANGUAGE IMPAIRED CHILDREN’S LISTENING TO SPEECH IN NOISE
69
Chapter 3 Study two: speech perception in various types of noise in SLI
3.1 Background
It is clear from Study one that at least some children with SLI have a deficit in
perceiving speech in the presence of another talker. The question arises: what aspects
of this interfering speech are problematic? Is it the intelligibility of speech? Is it the
speech prosody that distracts language impaired children’s attention more than their
TD peers’? Or is it the complex acoustic signal that might overload their cognitive
system and thus result in impaired levels of perception? Could it be their poor ability
to modulate and shift their auditory attention?
When exploring these and similar questions, research in speech perception in noise
uses stimuli that are often masked by speech or other sounds. Adding masking sounds
to speech perception tasks, however, results in more than making the target stimulus
less audible. Auditory and other cognitive abilities that may not be necessary in
listening in quiet conditions are recruited and can make a difference in performance in
noise (Schneider, Li & Daneman, 2007). As maskers are varied acoustically, they
challenge the auditory perceptual system in different ways. For example, some noises
such as amplitude-‐modulated noise, have less masking effect than steady-‐state noise
in typical development and in adults with normal hearing. Namely, a release from
masking occurs when the intensity of the noise dips to lower levels and the target
speech can be “glimpsed” at much better SNR levels (Howard-‐Jones & Rosen, 1993).
SRTs therefore tend to be better in such conditions. There was an indication in Study 1
that language impaired children might also be able to benefit from these glimpses, but
is this really the case?
These questions led to the tasks and research design of the second study. To make
results relevant and potentially applicable in clinical practice in a cosmopolitan city
where data collection took place, children with a language background other than
English were also included. Their performance on the language and speech perceptual
tasks, however, was interpreted with caution as detailed below.
70 LANGUAGE IMPAIRED CHILDREN’S LISTENING TO SPEECH IN NOISE
3.2 Method
3.2.1 Participants
Twenty-‐eight children with SLI and twenty-‐eight age-‐matched TD children, aged 6-‐14
years, were recruited and tested in South London primary and secondary schools and
attached language units. Based on information from teachers, children with a known
hearing impairment, learning disability or conditions influencing communication skills
such as autism spectrum disorder were not invited to participate. Schools were asked
to name children with and without language difficulties, for whom parental consent
was then obtained following an information letter. Screening and testing took place in
the schools in a relatively quiet room.
Parents were also asked about any other difficulties/impairments such as attention
deficit disorder or auditory processing difficulties and whether English was the first
and main language in the family. Children with additional impairments were not
included. Parents whose children were exposed to any other language than English
were asked to complete a questionnaire about their children’s exposure and use of the
languages. With this it was determined whether a child should be considered bilingual
or having English as an additional language (EAL) or whether the exposure to other
languages was so limited that English could still be considered the child’s main
language. For the questionnaire see Appendix 3.
To be included in the study, all candidates were administered a pure-‐tone audiometric
screening test using the laptop and headphones described below, which they had to
pass at 25 dB HL in both ears at frequencies of 500Hz, 1kHz, 2kHz, 4kHz and 8kHz.
Calibrations were performed using a Brüel & Kjær 4153 artificial ear. Two children did
not pass the audiometric screening. One, however, was subsequently seen by an ENT
doctor and a small object was removed from her ear canal. A few weeks later this child
passed the hearing test and was thus included. In the SLI group two children had an
identified hearing loss and used hearing aids and were therefore not invited for the
study.
LANGUAGE IMPAIRED CHILDREN’S LISTENING TO SPEECH IN NOISE
71
The Block Design subtest of the Wechsler Intelligence Scale for Children – Fourth
Edition (WISC-‐IV, Wechsler, 2004) was used as a screening assessment of non-‐verbal
ability. Participants are required to arrange blocks with red, white and red-‐white sides
in such a way that the pattern they create is identical to the pattern presented in a
picture. Both the accuracy and the time it takes a child to recreate the pattern is
scored. This assessment is standardised from age 6, yielding age-‐adjusted scaled scores
with a mean of 10 and standard deviation of 3. Children had to have scores within the
normal range (scaled scores 7-‐13) or above to be included in the study. In the TD
group, eight children achieved below normal scores (< 7) on the non-‐verbal screening
task and were therefore excluded. Forty candidates were screened and tested.
Similarly to the first study, one child recruited for the TD group failed the language
assessment subtest, but was in the normal range for non-‐verbal intelligence. This child
was therefore considered for the SLI group and was administered further subtests of
the language assessment. The language impairment was confirmed along with average
non-‐verbal performance, so the child was included in the SLI group.
All children were administered the Test for Reception of Grammar 2 (TROG-‐2, Bishop,
2003) to assess receptive language skills and the Recalling Sentences subtest of the
Clinical Evaluation of Language Fundamentals-‐4UK (CELF-‐4, Semel, Wiig & Secord,
2006) to assess expressive language skills. Inclusion criteria in the TD group were a
scaled score of 7 or above on the CELF-‐4 and standard score of 85 or above on TROG-‐2.
Inclusion criteria in the SLI group were either a scaled score 6 or below on CELF-‐4, or
84 or less on TROG-‐2. Children with English as an additional language (EAL) were
included and tested, but standardised language assessment scores were not used for
inclusion/exclusion as these may falsely indicate a language delay. However, the
teachers of children with EAL were asked about their general language functioning and
whether any language difficulties were detected or suspected other than those due to
English not being the home language.
Table 3 compares the ages, scores on the non-‐verbal task and language scores in the
two groups of participants. The age in the TD group ranged from 6;2 to 14;11 years, in
the SLI group from 6;1 to 14;7 years. Age and non-‐verbal scores do not differ

72 LANGUAGE IMPAIRED CHILDREN’S LISTENING TO SPEECH IN NOISE
significantly, while scores on the language assessment, as would be expected by
definition, were significantly different. The means were compared using t-‐tests, which
showed the following: TROG t=-‐5.703, df=14, p<0.001, CELF-‐E t=-‐9.414, df=26, p<0.001
indicating that the SLI group performed significantly worse than the TD group and age
t=-‐0.579, df=54, p=0.565, non-‐verbal score t=0.799, df=54, p=0.428 indicating that the
two groups did not differ in age and non-‐verbal ability.
Table 3: Comparison of the TD and SLI groups (as two groups) by age, non-‐verbal and language scores
Variable TD group mean (SD) n=28
SLI group mean (SD) n=28
Age (years) 9.34 (1.89) 9.05 (1.88)
Non-‐verbal score 9.89 (2.25) 9.46 (1.73)
TROG – receptive language 93 (14) 69 (14)
CELF4 – expressive language 8.22 (2.95) 3.46 (3)
The groups were then separated into monolingual and EAL participants resulting in
four groups: TD, TD-‐EAL, SLI and SLI-‐EAL. These were also compared using a one-‐way
ANOVA and did not differ in age and non-‐verbal scores, but significantly differed in
TROG (F=15.338, df=3, p<0.001) and CELF4 (F=19.715, df=3, p<0.001).
Table 4: Comparison of the groups as four groups by age, non-‐verbal and language scores
Variable TD group mean (SD)
n=20
TD-‐EAL group mean (SD)
n=8
SLI group mean (SD) n=17
SLI-‐EAL group mean (SD)
n=11 Age (years) 9.44 (1.89) 9.08 (1.99) 9.00 (1.98) 9.1 (1.79)
Non-‐verbal score 10.05 (2.5) 9.5 (1.5) 9.06 (1.85) 10.09 (1.38)
TROG 103 (8) 83 (11) 68 (14) 70 (15)
CELF4 9.53 (2.0) 5.13 (2.6) 3.41 (3.0) 3.55 (3.1)
LANGUAGE IMPAIRED CHILDREN’S LISTENING TO SPEECH IN NOISE
73
3.2.2 Test battery
3.2.2.1 Attention measures
Three subtests of the TEA-‐Ch appeared to be suitable candidates to test relevant
aspects of attention, which were then administered to the first 12 TD children. These
were ‘Score!’, ‘Walk, Don’t Walk’ and ‘Code Transmission. The ‘Walk, Don’t Walk’
subtest is described in Chapter 2. In the ‘Score!’ subtest, children listen to bursts of
noise that are repeated at irregular intervals 9 to 15 times in each of the 10 tests,
which they have to count and state the number at the end of each test. The subtest
lasts for 6 minutes 17 seconds. Raw scores are the number of correctly counted noises
out of ten. In ‘Code Transmission’, a long list of numbers between 1 and 9 is heard
spoken by a woman with an American accent. Children are asked to listen out for two
5s in a row and state the number that came just before the 5s. The subtest lasts for 12
minutes 37 seconds. There are 40 numbers to be recalled and raw scores are the
amount of correctly recalled numbers. The raw scores of both subtests are converted
into scaled scores with a mean of 10 and SD of 3.
The first twelve TD participants were administered all three subtests described above.
It was subsequently decided that due to time constraints, effects of boredom and
fatigue and also owing to the limited information two of these subtests appeared to
provide, only the ‘Walk, Don’t Walk’ subtest would be retained in this study and in
Study 3 as part of the battery of pre-‐and post-‐ intervention tests. For further details of
selecting this subtest, see 3.3.1.
3.2.2.2 Non-‐word repetition task
Following the testing of the first 12 TD children, but prior to testing the SLI children, a
standardised non-‐word repetition task, the Children’s Test of Non-‐Word Repetition
(CNRep, Gathercole & Baddeley, 1996) was added to the test battery. The ability to
accurately repeat phonotactically possible, but non-‐existing words has been shown to
be a reliable clinical marker of SLI (Bishop, North & Donlan, 1996). The authors of the
CNRep, Gathercole and Baddeley (1990) proposed that non-‐word repetition measured
74 LANGUAGE IMPAIRED CHILDREN’S LISTENING TO SPEECH IN NOISE
phonological short-‐term memory, which is therefore deficient in SLI. It is also agreed
that such a task taps into phonological processing skills as no lexical and phonological
representations of non-‐words exist in the subject’s brain to execute a motor
programme. This consequently has to be planned online through accurate analysis and
perceptual decoding of the acoustic-‐phonetic information of the stimulus.
Since the focus of this study concerns auditory processing skills in children with
language impairment (with the potential of sub-‐classifying SLI children into those with
and without an auditory impairment), the use of a non-‐word repetition task is
expected to differentiate between these two subgroups. It will also provide
information about the extent to which attentional versus perceptual skills play a role in
the deficit in speech perception in SLI. It can be argued that CNRep is a simple task:
there is a low attentional load, and the words are presented in quiet as opposed to
noise. Therefore performance must reflect phonological, perceptual and processing
skills more than the ability to attend to the stimuli.
In CNRep 40 non-‐words are presented from a recording. The words are two to five
syllables in length, spoken by a male native English speaker with a standard southern
British accent. (Note: This may be different in the original test. The tape of the copy of
the test that was available was damaged, so the stimuli were newly recorded in an
anechoic chamber by a male British English native speaker PhD student.) Children’s
responses are digitally recorded. The test is standardised up to age 8;11 years, but all
children participating in the study were administered the test and scores were
converted into z-‐scores based on the TD group. In this way a direct comparison of the
two groups’ data was possible including the 9;0+ year-‐old participants.
3.2.2.3 Dyslexia screen
A screening test for specific reading difficulty was also introduced in Study 2 in the SLI
group and included in the test battery of Study 3 both before and after the
intervention. This was motivated by the substantial comorbidity between SLI and
specific literacy difficulties and findings that there may be a phonological element
behind this overlap in both impairments (Messaoud-‐Galusi & Marshall, 2010). As the
LANGUAGE IMPAIRED CHILDREN’S LISTENING TO SPEECH IN NOISE
75
current study indirectly explores phonological processing, it makes sense to establish
the link between reading ability, language impairment and phonological perceptual
and processing skills. Both SLI and specific literacy difficulties or developmental
dyslexia are heritable developmental language disorders that affect the acquisition of
spoken and written language. Just as SLI, dyslexia is a complex, heterogeneous
disorder, changing over development. Conventionally, as SLI is defined by poor
receptive and expressive language skills in relation to non-‐verbal IQ, so dyslexia
consists in reading and spelling impairments relative to verbal or nonverbal IQ
measures (Bishop, 1997; Bishop & Snowling, 2004; Snowling et al., 2000). Evidence
shows that many children diagnosed with SLI in the pre-‐school years go on to develop
literacy difficulties during their school careers (Snowling et al., 2000). The percentage
of children with SLI who also have dyslexia ranges from 13% to 62% in the literature,
but more recent studies with similar criteria tend to find the overlap between the two
conditions around 50-‐60% (McArthur, 2000).
The test used was the Test of Word Reading Efficiency (TOWRE, Torgesen, Wagner &
Rashotte, 1999). It consists of two subtests: a sight word efficiency subtest, in which
children read out a list of real words and a phonemic decoding efficiency subtest,
where children read a list of non-‐words. Both are timed and scored according to the
number of correctly read words. Raw scores are then converted into standard scores
with a mean of 100 and SD of 15. The test takes no more than 3 minutes to administer.
3.2.2.4 The Children’s Coordinate Response Measure (CCRM)
In this study the same CCRM test was used as in Study 1 with added conditions and a
few other modifications.
The adaptive procedure and the instructions heard were the same, but this time the
child responded with the number as well as the colour on the response pad, see Figure
19.

76 LANGUAGE IMPAIRED CHILDREN’S LISTENING TO SPEECH IN NOISE
Figure 19: The stimulus response pad on the CCRM task (Study 2)
The target colours and numbers are varied randomly. Getting the correct response by
chance is relatively low. For eight numbers and six colours there is a 1 in 48 chance of
guessing the correct one. No catch trials were used this time and seven different
maskers were introduced creating seven different conditions. To decrease the time it
takes to administer all seven subtasks, the test ended after 25 trials rather than 30.
To counteract the potential effects of fatigue, boredom or learning within the group,
the order of the maskers was randomised according to a 7x7 Latin square, where the
sequence of numbers in any row is random and no number appears twice in the same
row or column. An example for a randomised Latin square is shown in Figure 20.
The seven conditions were allocated numbers 1 to 7 and randomised in this way, thus
ensuring that within every batch of seven consecutive subjects each condition occurs
in every position within the series of the seven conditions.
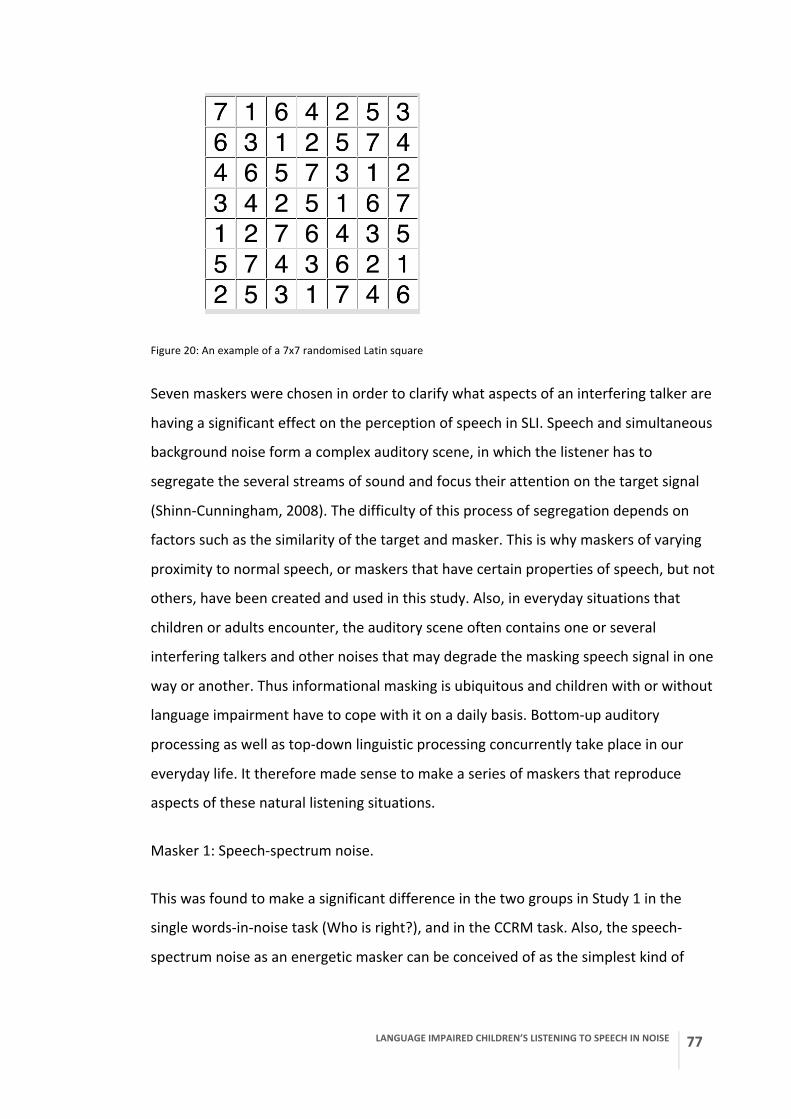
LANGUAGE IMPAIRED CHILDREN’S LISTENING TO SPEECH IN NOISE
77
Figure 20: An example of a 7x7 randomised Latin square
Seven maskers were chosen in order to clarify what aspects of an interfering talker are
having a significant effect on the perception of speech in SLI. Speech and simultaneous
background noise form a complex auditory scene, in which the listener has to
segregate the several streams of sound and focus their attention on the target signal
(Shinn-‐Cunningham, 2008). The difficulty of this process of segregation depends on
factors such as the similarity of the target and masker. This is why maskers of varying
proximity to normal speech, or maskers that have certain properties of speech, but not
others, have been created and used in this study. Also, in everyday situations that
children or adults encounter, the auditory scene often contains one or several
interfering talkers and other noises that may degrade the masking speech signal in one
way or another. Thus informational masking is ubiquitous and children with or without
language impairment have to cope with it on a daily basis. Bottom-‐up auditory
processing as well as top-‐down linguistic processing concurrently take place in our
everyday life. It therefore made sense to make a series of maskers that reproduce
aspects of these natural listening situations.
Masker 1: Speech-‐spectrum noise.
This was found to make a significant difference in the two groups in Study 1 in the
single words-‐in-‐noise task (Who is right?), and in the CCRM task. Also, the speech-‐
spectrum noise as an energetic masker can be conceived of as the simplest kind of
78 LANGUAGE IMPAIRED CHILDREN’S LISTENING TO SPEECH IN NOISE
noise stimulus with little inherent structure and as such, it has become a baseline
condition in speech-‐in-‐noise research in recent years.
Masker 2: Opposite-‐sex talker.
This used the same talker as in the interfering talker condition in Study 1 and was in
effect a replication of that condition.
Masker 3: Same-‐sex talker.
In this condition, the same distractor sentences were used as before, spoken by
another female speaker with a southern British accent. This was to compare the
effects of a more similar distractor to the stimulus versus the more distinguishable
opposite-‐sex talker and to see whether the difference in the two groups’ perceptual
ability is manifested in such a condition as well.
Masker 4: Monotone speech.
The same male distractor sentences as above were re-‐synthesised on a monotone
using the free software Praat (Boersma & Weenink, University of Amsterdam). The
fixed F0 for each sentence was set to the mean frequency of the original sentence. The
question asked here was: what happens to perception if the distractor has no pitch
changes, and is therefore monotonous, but is still fully intelligible?
Masker 5: Low-‐pass filtered speech.
The same distractor sentences as for maskers 1 and 4 were low-‐pass filtered at 4 kHz.
As the spectrally-‐rotated masker (see below) was created after low-‐pass filtering the
stimulus sentences at 4 kHz, it is possible that low-‐pass filtering alone may have had an
effect. To establish whether this was the case and to isolate the effects of spectral
rotation, this was a control condition for masker 6.

LANGUAGE IMPAIRED CHILDREN’S LISTENING TO SPEECH IN NOISE
79
Masker 6: Spectrally-‐rotated speech.
Using the same distractor sentences as for masker 1 above, this masker was created by
rotating the spectrum of the sound around a centre frequency of 2 kHz, such that high-‐
frequency energy became low-‐frequency and low-‐frequency became high. This process
followed the principles described in Blesser (1972). The speech-‐spectrum was first
limited to 4 kHz by low-‐pass filtering. This was necessary because after the rotation at
2 kHz, any energy in the speech signal above 4 kHz would be lost anyway. Through
rotation, each spectral component is shifted by exactly twice the amount of its
distance from 2000 Hz or 2* (2000 – f). A component at 500 Hz, for example, would be
transformed to 3500 Hz, while a component at 3000 Hz would become 1000 Hz. This
process does not remove the information contained in the frequency spectrum.
Instead, it creates a new signal that has all the spectral characteristics of the original
speech signal and has, in fact, one-‐to-‐one correspondence to the original speech.
As a result, this transformation renders the speech unintelligible, at least without a
significant amount of training (see Blesser, 1972). Blesser himself compares spectrally-‐
rotated speech to a “new language that happens to have the same vocabulary,
semantics and syntactic structure as English, but the actual sounds in the “language”
are alien or foreign.” Although periodicity is destroyed through this transformation
and the components form an inharmonic series, the perceived pitch contour of the
sentences and the overall intensity of the signal are retained after the process, albeit
in a weaker form for the pitch. The reason why such a masker was chosen in this
experiment was to explore the effects of a sound that has the spectral and acoustic
complexity of speech, but is not intelligible. The question to be answered using this
masker: is it the intelligibility of speech that has a more distracting or masking effect in
SLI than in TD or is it just the acoustic properties of the speech signal?
Masker 7: Single-‐channel vocoded speech.
Noise-‐vocoding is a method of distorting the speech signal which destroys spectral
details, but preserves temporal cues (Shannon, Zeng, Kamath, Wygonski & Ekelid
(1995). The original speech is divided up into frequency bands, the amplitude envelope
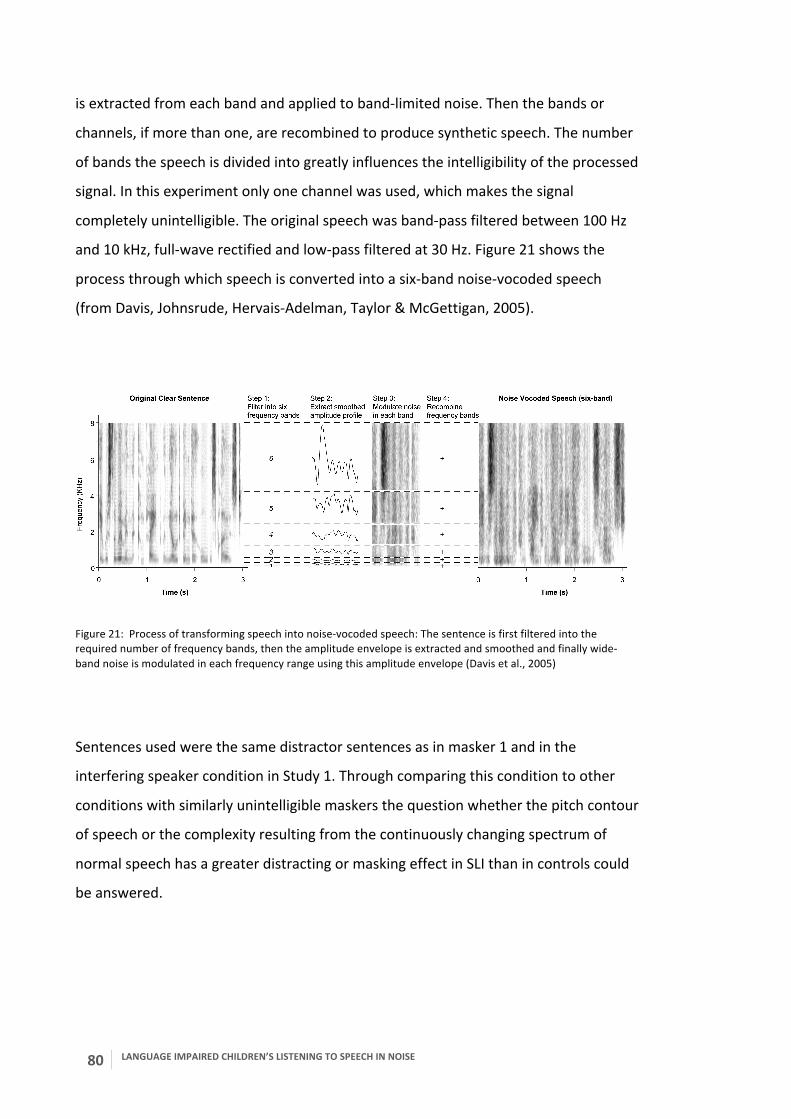
80 LANGUAGE IMPAIRED CHILDREN’S LISTENING TO SPEECH IN NOISE
is extracted from each band and applied to band-‐limited noise. Then the bands or
channels, if more than one, are recombined to produce synthetic speech. The number
of bands the speech is divided into greatly influences the intelligibility of the processed
signal. In this experiment only one channel was used, which makes the signal
completely unintelligible. The original speech was band-‐pass filtered between 100 Hz
and 10 kHz, full-‐wave rectified and low-‐pass filtered at 30 Hz. Figure 21 shows the
process through which speech is converted into a six-‐band noise-‐vocoded speech
(from Davis, Johnsrude, Hervais-‐Adelman, Taylor & McGettigan, 2005).
Figure 21: Process of transforming speech into noise-‐vocoded speech: The sentence is first filtered into the required number of frequency bands, then the amplitude envelope is extracted and smoothed and finally wide-‐band noise is modulated in each frequency range using this amplitude envelope (Davis et al., 2005)
Sentences used were the same distractor sentences as in masker 1 and in the
interfering speaker condition in Study 1. Through comparing this condition to other
conditions with similarly unintelligible maskers the question whether the pitch contour
of speech or the complexity resulting from the continuously changing spectrum of
normal speech has a greater distracting or masking effect in SLI than in controls could
be answered.

LANGUAGE IMPAIRED CHILDREN’S LISTENING TO SPEECH IN NOISE
81
3.2.3 Procedure
The child was taken into a quiet room that the schools provided. Although the rooms
used were not sound-‐proof, the headphones originally planned to be used in the
computer tasks provide an attenuation of the environmental noise of approximately
30 dB. This was sufficient to be able to hear the stimuli at a comfortable listening level
excluding at least some possible disturbances of environmental noise. The headphones
originally calibrated for the hearing screen, Telephonics TDH-‐39 headphones, do not
provide this attenuation. This proved to be a problem in the first school where testing
took place as the room was too noisy and the hearing test resulted in false indications
of a hearing impairment. Therefore the Sennheiser HD 25-‐1 headphones were also
calibrated with the audiometry software and were subsequently used for the hearing
screen as well as the computer tasks.
The screening always started with the hearing test. If a child passed it, the non-‐verbal
assessment was carried out. Testing was discontinued if a child failed either of these.
TD children with EAL background were administered the language assessment, but
standardised scores were not taken into account for inclusion. Instead, the child’s
teacher was asked if he/she suspected any language difficulties other than those
coming from English not being the child’s native language. If not, the child was
included in the TD-‐EAL group. In the initial phase of the study, four subtests of the
CELF4 were administered to obtain Core Language Index scores. It was felt, however,
that the time this took was too long for the amount of extra information it gave.
Subsequently, only one subtest was retained in the screening test battery as the
expressive language test (Recalling Sentences) and TROG2 was introduced to test for
receptive language.
Testing began with the control group. All three auditory subtests of the TEA-‐Ch were
administered to establish which one would rely on the type of sustained auditory
attention that is also necessary for language and is called upon in the perception of
speech in adverse conditions. After the first 12 children, only one subtest, the ‘Walk,
Don’t Walk’ was retained as explained above.
82 LANGUAGE IMPAIRED CHILDREN’S LISTENING TO SPEECH IN NOISE
On completion of the attention subtest(s), the CCRM task was administered. Younger
participants were usually given four practice trials with the speech-‐spectrum noise
masker before proceeding to the test items. The order of presentation of the seven
conditions was randomised as described earlier. After testing 12 TD children, but prior
to the completion of the first SLI child’s testing, the dyslexia screen and the non-‐word
repetition test were introduced. Only the children with SLI were screened for dyslexia,
and all participants were administered the non-‐word repetition test.
3.2.4 Equipment
The audiometric screen and the auditory tasks were presented on a MacBook Air
laptop (1.4 GHz Intel Core 2 Duo processor, 2 GB memory) running Bootcamp
Windows7 and on a Samsung NP-‐N145 netbook running Windows7 Starter. The
auditory tasks were administered via a pair of Sennheiser HD25-‐1 headphones. A
computer mouse was used to select the pictures where such responses were needed.
Where verbal response or expression was required (such as in the expressive language
assessment or the non-‐word repetition task), a Roland R-‐05 voice recorder was used to
record responses. Where auditory stimuli had to be played as part of standard
cognitive assessments (non-‐word repetition and attention tests), these were played on
an iPad using Hitachi HS-‐AS-‐300 minispeakers to achieve sufficient audibility in the
ambient noise of the schools.
3.3 Results
Children with SLI were compared to their age-‐matched TD peers on all experimental
tasks, on the sustained auditory attention measures, literacy and non-‐word repetition
tasks. The attention measures were also compared to the language scores and the
speech perception scores to see if any correlations exist. On the experimental tasks,
the scores obtained were not standardised and it is expected that there will be an
effect of age as well as group on these tasks and the possibility of an interaction
LANGUAGE IMPAIRED CHILDREN’S LISTENING TO SPEECH IN NOISE
83
between group and age. The statistical analyses used were usually a repeated
measures ANOVA in the general linear model of SPSS. This, however, does not indicate
the deviance of individual participants from the norm set by the control group. Also, as
one of the goals of this study was to determine which aspect of speech perception a
given language impaired individual showed abnormal performance in, a multiple case
study approach was deemed appropriate to reveal these. The approach was based on
the one used in a study of dyslexic adults by Ramus, Rosen, Dakin, Day, Castellote,
White & Frith (2003). For the purposes of determining deviance and not extreme
values as used in Study 1, the arbitrary cut-‐off point of z>1.65 was chosen. This is more
stringent than most widely used language and psychometric tests, where the below
normal threshold is -‐1 SD. In a normal distribution 1.65 SD corresponds to the 5th
percentile, which is considered by most relevant organisations such as NHS Trusts to
be the threshold of “clinical concern”.
In order to be accurate in the calculations, it was done in two steps, similarly to Ramus
et al.(2003). Occasionally control subjects may have abnormal results, which would
skew the z-‐score calculations and make the results less stringent. Therefore first z-‐
scores were calculated including all subjects, then those controls whose z>1.65 were
excluded and the scores recalculated. The z-‐score calculations were based on all the
TD children including the TD-‐EAL in the two-‐group analysis, which is a higher number
thus giving more accurate estimates, but takes the TD-‐EAL children as typical, while in
the four-‐group analysis only the TD children were used as the basis of norms excluding
the TD-‐EAL participants. This resulted in a somewhat lower number and potentially
less accuracy in the estimates, but more stringent in the sense that no EAL children
were deemed typical. In the two-‐group analysis the following number of such controls
were identified: in the speech-‐spectrum noise condition 2, in all other conditions 1. In
the four-‐group analysis: in the speech-‐spectrum condition 4, in the opposite-‐sex
condition 5, in the single-‐channel vocoded condition 2 and in all other conditions 1 or
none.
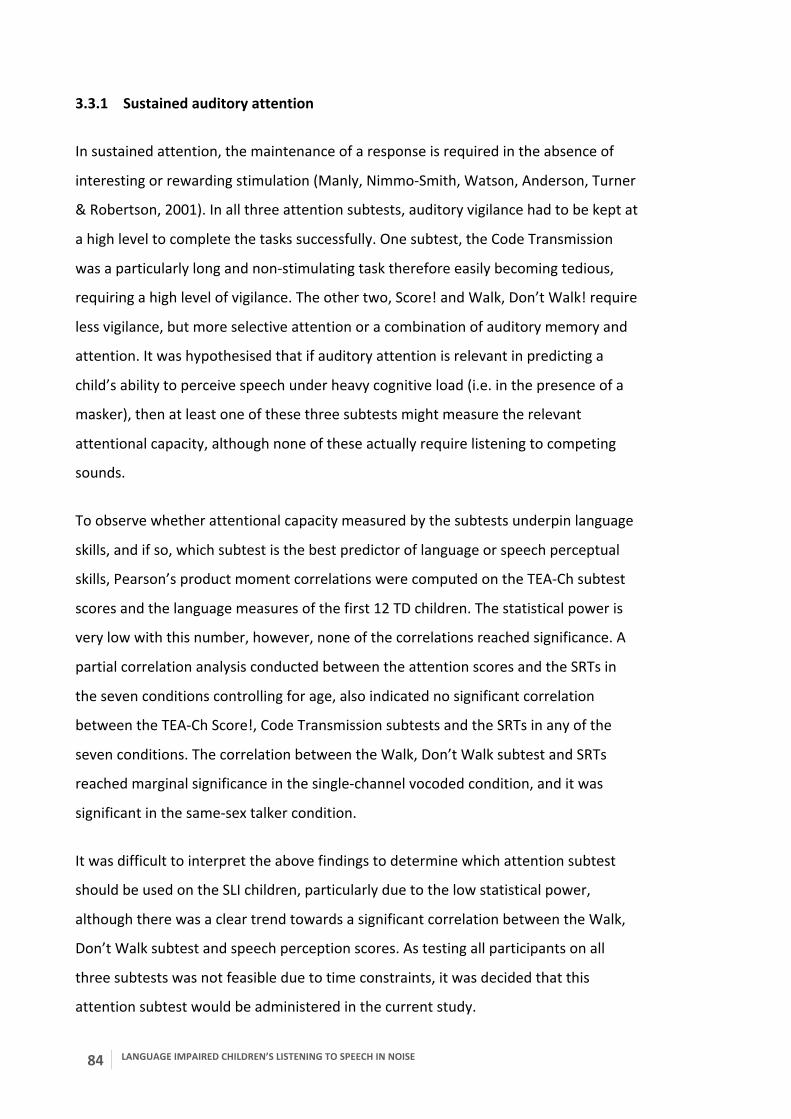
84 LANGUAGE IMPAIRED CHILDREN’S LISTENING TO SPEECH IN NOISE
3.3.1 Sustained auditory attention
In sustained attention, the maintenance of a response is required in the absence of
interesting or rewarding stimulation (Manly, Nimmo-‐Smith, Watson, Anderson, Turner
& Robertson, 2001). In all three attention subtests, auditory vigilance had to be kept at
a high level to complete the tasks successfully. One subtest, the Code Transmission
was a particularly long and non-‐stimulating task therefore easily becoming tedious,
requiring a high level of vigilance. The other two, Score! and Walk, Don’t Walk! require
less vigilance, but more selective attention or a combination of auditory memory and
attention. It was hypothesised that if auditory attention is relevant in predicting a
child’s ability to perceive speech under heavy cognitive load (i.e. in the presence of a
masker), then at least one of these three subtests might measure the relevant
attentional capacity, although none of these actually require listening to competing
sounds.
To observe whether attentional capacity measured by the subtests underpin language
skills, and if so, which subtest is the best predictor of language or speech perceptual
skills, Pearson’s product moment correlations were computed on the TEA-‐Ch subtest
scores and the language measures of the first 12 TD children. The statistical power is
very low with this number, however, none of the correlations reached significance. A
partial correlation analysis conducted between the attention scores and the SRTs in
the seven conditions controlling for age, also indicated no significant correlation
between the TEA-‐Ch Score!, Code Transmission subtests and the SRTs in any of the
seven conditions. The correlation between the Walk, Don’t Walk subtest and SRTs
reached marginal significance in the single-‐channel vocoded condition, and it was
significant in the same-‐sex talker condition.
It was difficult to interpret the above findings to determine which attention subtest
should be used on the SLI children, particularly due to the low statistical power,
although there was a clear trend towards a significant correlation between the Walk,
Don’t Walk subtest and speech perception scores. As testing all participants on all
three subtests was not feasible due to time constraints, it was decided that this
attention subtest would be administered in the current study.
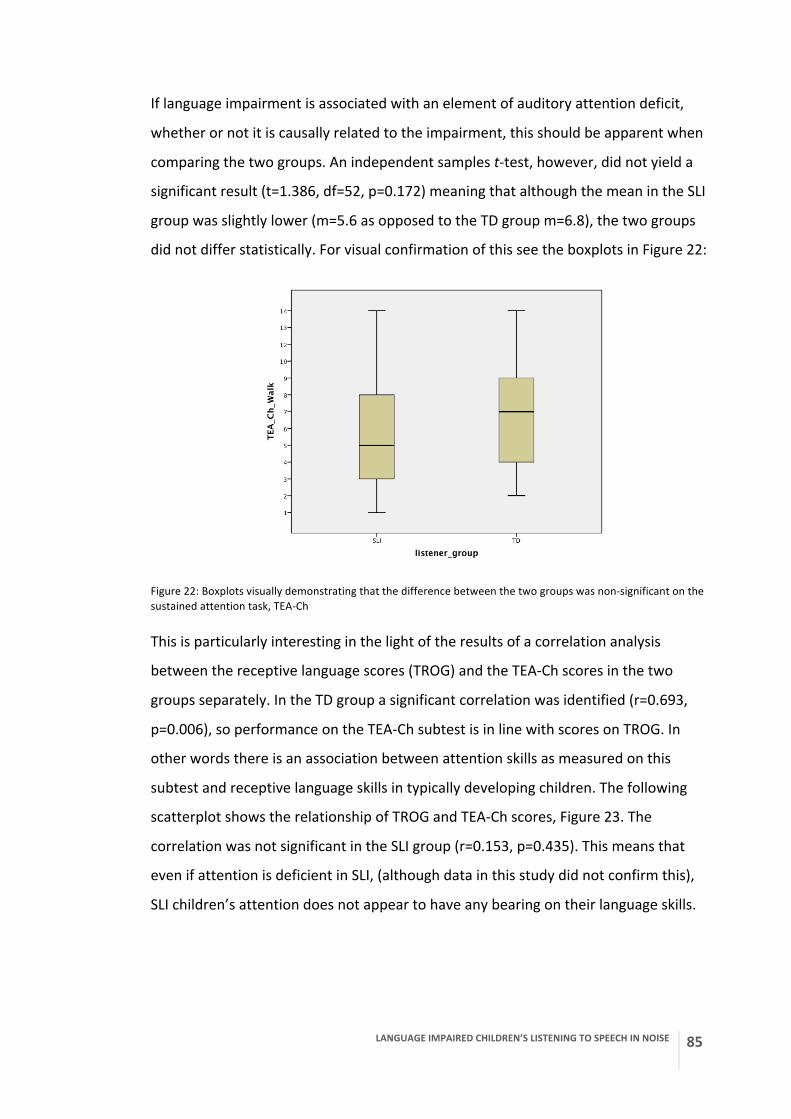
LANGUAGE IMPAIRED CHILDREN’S LISTENING TO SPEECH IN NOISE
85
If language impairment is associated with an element of auditory attention deficit,
whether or not it is causally related to the impairment, this should be apparent when
comparing the two groups. An independent samples t-‐test, however, did not yield a
significant result (t=1.386, df=52, p=0.172) meaning that although the mean in the SLI
group was slightly lower (m=5.6 as opposed to the TD group m=6.8), the two groups
did not differ statistically. For visual confirmation of this see the boxplots in Figure 22:
Figure 22: Boxplots visually demonstrating that the difference between the two groups was non-‐significant on the sustained attention task, TEA-‐Ch
This is particularly interesting in the light of the results of a correlation analysis
between the receptive language scores (TROG) and the TEA-‐Ch scores in the two
groups separately. In the TD group a significant correlation was identified (r=0.693,
p=0.006), so performance on the TEA-‐Ch subtest is in line with scores on TROG. In
other words there is an association between attention skills as measured on this
subtest and receptive language skills in typically developing children. The following
scatterplot shows the relationship of TROG and TEA-‐Ch scores, Figure 23. The
correlation was not significant in the SLI group (r=0.153, p=0.435). This means that
even if attention is deficient in SLI, (although data in this study did not confirm this),
SLI children’s attention does not appear to have any bearing on their language skills.
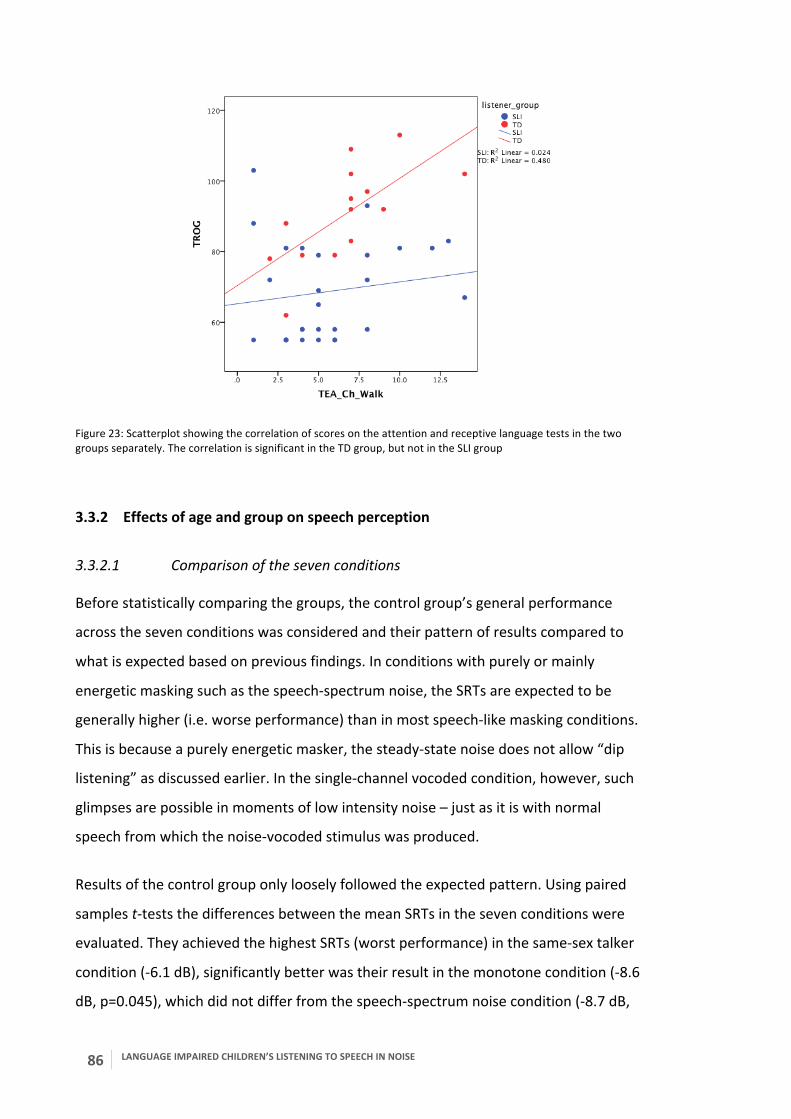
86 LANGUAGE IMPAIRED CHILDREN’S LISTENING TO SPEECH IN NOISE
Figure 23: Scatterplot showing the correlation of scores on the attention and receptive language tests in the two groups separately. The correlation is significant in the TD group, but not in the SLI group
3.3.2 Effects of age and group on speech perception
3.3.2.1 Comparison of the seven conditions
Before statistically comparing the groups, the control group’s general performance
across the seven conditions was considered and their pattern of results compared to
what is expected based on previous findings. In conditions with purely or mainly
energetic masking such as the speech-‐spectrum noise, the SRTs are expected to be
generally higher (i.e. worse performance) than in most speech-‐like masking conditions.
This is because a purely energetic masker, the steady-‐state noise does not allow “dip
listening” as discussed earlier. In the single-‐channel vocoded condition, however, such
glimpses are possible in moments of low intensity noise – just as it is with normal
speech from which the noise-‐vocoded stimulus was produced.
Results of the control group only loosely followed the expected pattern. Using paired
samples t-‐tests the differences between the mean SRTs in the seven conditions were
evaluated. They achieved the highest SRTs (worst performance) in the same-‐sex talker
condition (-‐6.1 dB), significantly better was their result in the monotone condition (-‐8.6
dB, p=0.045), which did not differ from the speech-‐spectrum noise condition (-‐8.7 dB,

LANGUAGE IMPAIRED CHILDREN’S LISTENING TO SPEECH IN NOISE
87
p=0.823). Non-‐significant was the difference between the speech-‐spectrum noise and
opposite-‐sex talker conditions (-‐10.5 dB, p=0.487), from which the single-‐channel
vocoded condition differed significantly (-‐12.7 dB, p=0.002); the low-‐pass filtered
condition was not different (-‐12.9 dB, p=0.599) and finally they tolerated the most
noise in the spectrally-‐rotated condition (-‐15.6 dB), which was again a significant
difference (p=0.002). It is documented in the literature that having a more similar
distractor to the target speech such as the voice of the same gender makes it harder to
segregate the two streams (Brungart, 2001; Brungart, Simpson, Ericson & Scott, 2001),
so the same-‐sex talker is expected to be one of the harder conditions, but it is
unexpected that it is harder than the speech-‐spectrum noise. This is also in contrast
with the order of difficulty in Study 1, where the easiest for both groups was the
speech-‐spectrum noise, then the modulated noise and the hardest was the interfering
speaker condition. The general trend is therefore that intelligible maskers are more
distracting than those unintelligible maskers where glimpses of higher audibility exist,
but no distracting effect of intelligible speech (informational masking) is present such
as in the spectrally-‐rotated and single-‐channel vocoded conditions.
A look at the means of the SRTs in the two groups excluding the EAL children in Figure
24 indicates that SLI listeners clearly have higher (i.e. worse) SRTs than controls
irrespective of condition, Figure 24. As we will see later in the detailed analysis, all of
these differences are significant. In the barplot it is also visible that the SLI group
follows the general pattern of performance of the TD group in that both groups found
the same-‐sex talker the hardest (1.3 dB) and the spectrally-‐rotated speech the easiest
(-‐10.8 dB) to ignore. The next conditions in order of difficulty for the SLI group were
the monotone (-‐0.9 dB), low-‐pass (-‐2.4 dB) and opposite-‐sex talker (-‐3.3 dB) conditions
before the speech-‐spectrum (-‐6.2 dB), single-‐channel vocoded (-‐9.3 dB) and spectrally-‐
rotated conditions (-‐10.8 dB). What this pattern of performance may indicate will be
discussed following the detailed analysis and comparison of the groups in the seven
conditions.
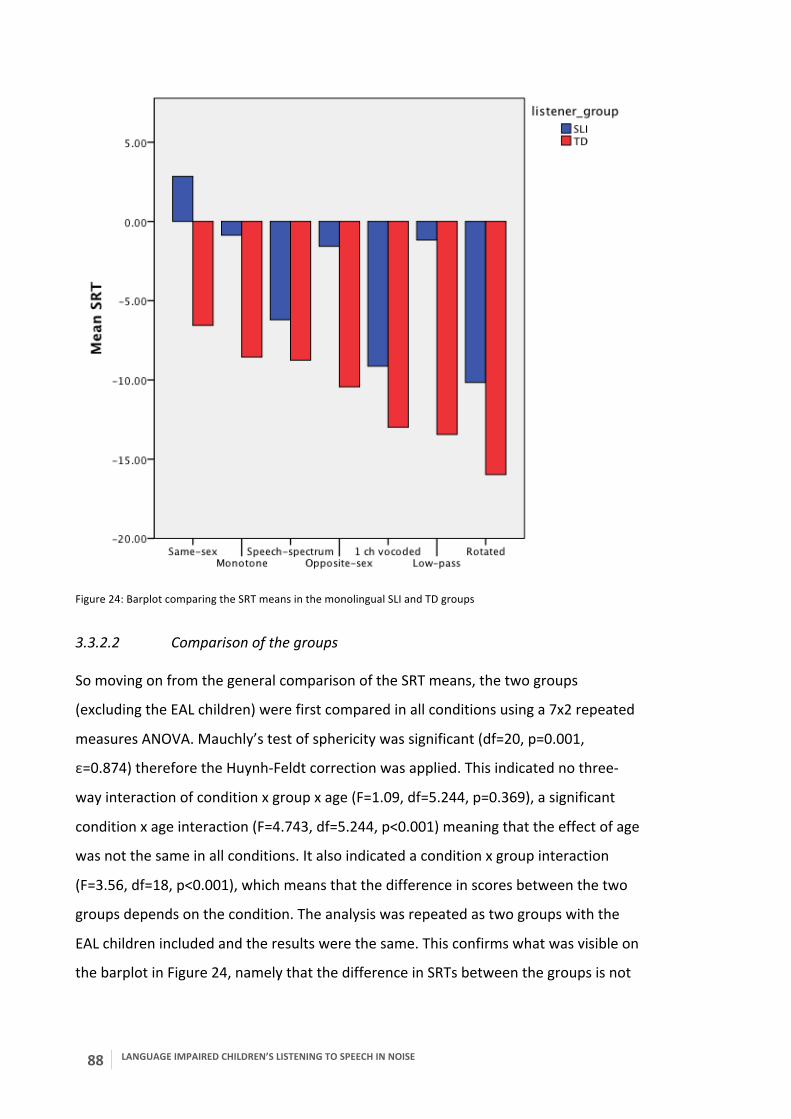
88 LANGUAGE IMPAIRED CHILDREN’S LISTENING TO SPEECH IN NOISE
Figure 24: Barplot comparing the SRT means in the monolingual SLI and TD groups
3.3.2.2 Comparison of the groups
So moving on from the general comparison of the SRT means, the two groups
(excluding the EAL children) were first compared in all conditions using a 7x2 repeated
measures ANOVA. Mauchly’s test of sphericity was significant (df=20, p=0.001,
ε=0.874) therefore the Huynh-‐Feldt correction was applied. This indicated no three-‐
way interaction of condition x group x age (F=1.09, df=5.244, p=0.369), a significant
condition x age interaction (F=4.743, df=5.244, p<0.001) meaning that the effect of age
was not the same in all conditions. It also indicated a condition x group interaction
(F=3.56, df=18, p<0.001), which means that the difference in scores between the two
groups depends on the condition. The analysis was repeated as two groups with the
EAL children included and the results were the same. This confirms what was visible on
the barplot in Figure 24, namely that the difference in SRTs between the groups is not

LANGUAGE IMPAIRED CHILDREN’S LISTENING TO SPEECH IN NOISE
89
the same in the seven conditions. To see how the scores differ, Figure 25 displays the
SRTs in boxplots.
Figure 25: Boxplots comparing the SRTs of the groups in the seven conditions
The boxplots indicate that while the difference between the groups differs in the
conditions, the variability is also significantly different. Therefore the SRTs were
converted into z-‐scores based on the control children’s results in each condition
adjusted for age. This way the variability is absorbed by the z-‐scores and is no longer
different in the various conditions making it possible to compare the magnitude of the
deficit. These were then analysed with the same 7x2 repeated measures ANOVA
design, but without the factor of age as the z-‐scores are already age adjusted. The
analysis indicated an interaction between condition and group (F=2.229, df=6,
p=0.041) so the difference in scores between the two groups still differs in the
conditions even after taking into account the difference in variability. Figure 26
displays the SRT z-‐scores.
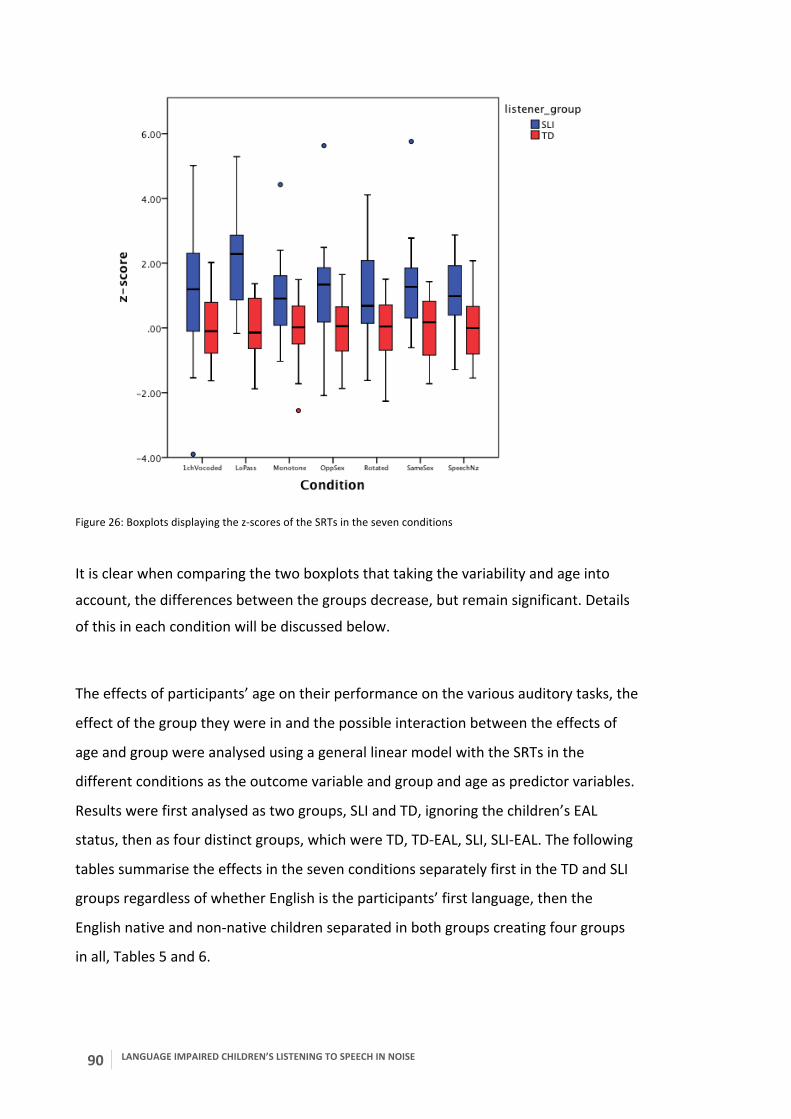
90 LANGUAGE IMPAIRED CHILDREN’S LISTENING TO SPEECH IN NOISE
Figure 26: Boxplots displaying the z-‐scores of the SRTs in the seven conditions
It is clear when comparing the two boxplots that taking the variability and age into
account, the differences between the groups decrease, but remain significant. Details
of this in each condition will be discussed below.
The effects of participants’ age on their performance on the various auditory tasks, the
effect of the group they were in and the possible interaction between the effects of
age and group were analysed using a general linear model with the SRTs in the
different conditions as the outcome variable and group and age as predictor variables.
Results were first analysed as two groups, SLI and TD, ignoring the children’s EAL
status, then as four distinct groups, which were TD, TD-‐EAL, SLI, SLI-‐EAL. The following
tables summarise the effects in the seven conditions separately first in the TD and SLI
groups regardless of whether English is the participants’ first language, then the
English native and non-‐native children separated in both groups creating four groups
in all, Tables 5 and 6.
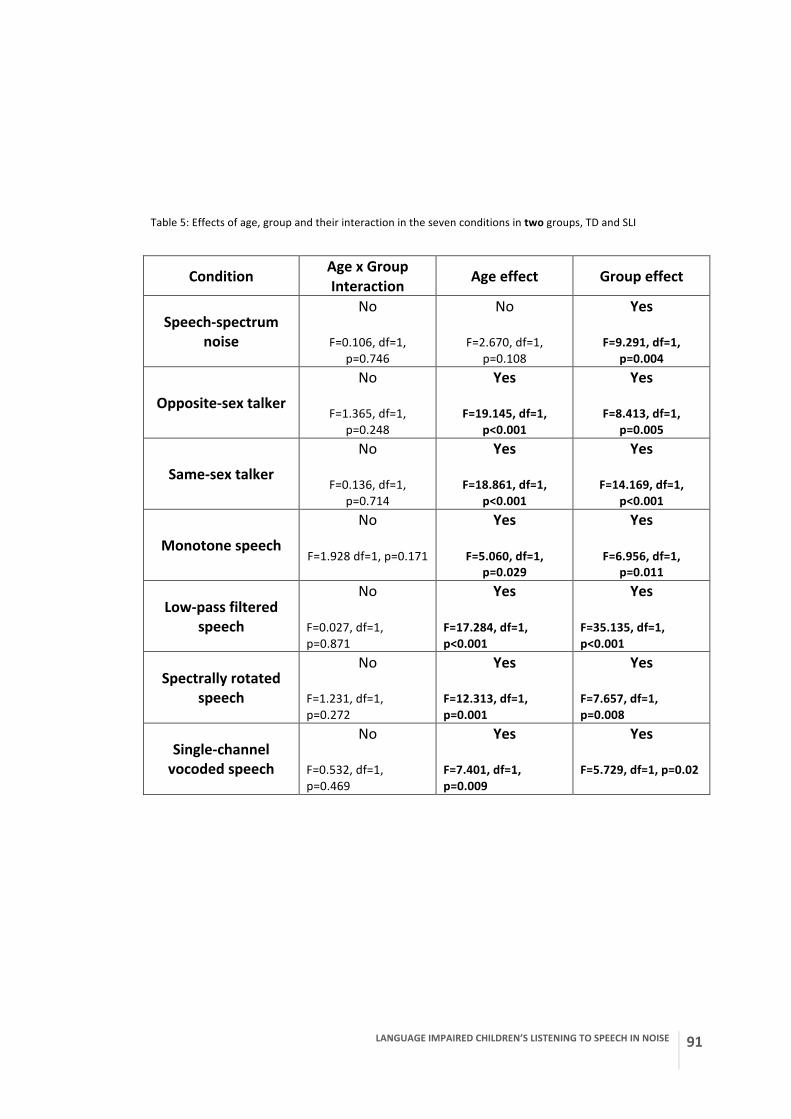
LANGUAGE IMPAIRED CHILDREN’S LISTENING TO SPEECH IN NOISE
91
Table 5: Effects of age, group and their interaction in the seven conditions in two groups, TD and SLI
Condition Age x Group Interaction Age effect Group effect
Speech-‐spectrum noise
No
F=0.106, df=1, p=0.746
No
F=2.670, df=1, p=0.108
Yes
F=9.291, df=1, p=0.004
Opposite-‐sex talker
No
F=1.365, df=1, p=0.248
Yes
F=19.145, df=1, p<0.001
Yes
F=8.413, df=1, p=0.005
Same-‐sex talker
No
F=0.136, df=1, p=0.714
Yes
F=18.861, df=1, p<0.001
Yes
F=14.169, df=1, p<0.001
Monotone speech
No
F=1.928 df=1, p=0.171
Yes
F=5.060, df=1, p=0.029
Yes
F=6.956, df=1, p=0.011
Low-‐pass filtered speech
No
F=0.027, df=1, p=0.871
Yes
F=17.284, df=1, p<0.001
Yes
F=35.135, df=1, p<0.001
Spectrally rotated speech
No
F=1.231, df=1, p=0.272
Yes
F=12.313, df=1, p=0.001
Yes
F=7.657, df=1, p=0.008
Single-‐channel vocoded speech
No
F=0.532, df=1, p=0.469
Yes
F=7.401, df=1, p=0.009
Yes
F=5.729, df=1, p=0.02
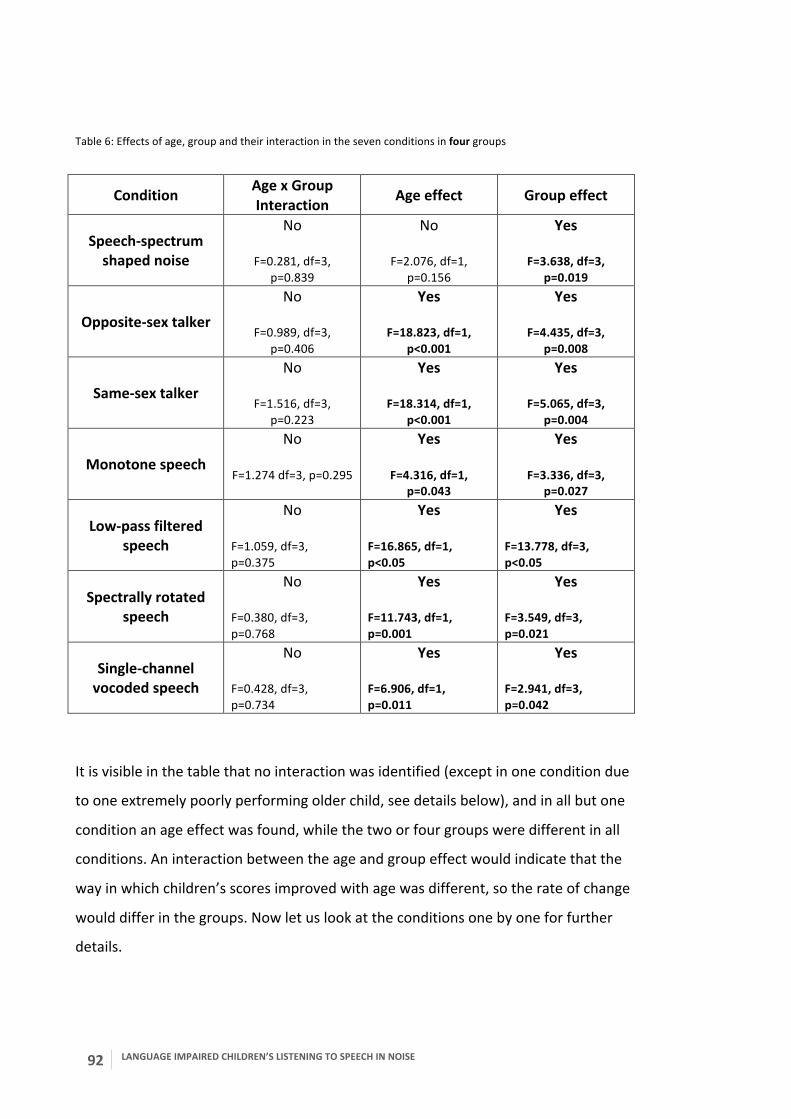
92 LANGUAGE IMPAIRED CHILDREN’S LISTENING TO SPEECH IN NOISE
Table 6: Effects of age, group and their interaction in the seven conditions in four groups
Condition Age x Group Interaction Age effect Group effect
Speech-‐spectrum shaped noise
No
F=0.281, df=3, p=0.839
No
F=2.076, df=1, p=0.156
Yes
F=3.638, df=3, p=0.019
Opposite-‐sex talker
No
F=0.989, df=3, p=0.406
Yes
F=18.823, df=1, p<0.001
Yes
F=4.435, df=3, p=0.008
Same-‐sex talker
No
F=1.516, df=3, p=0.223
Yes
F=18.314, df=1, p<0.001
Yes
F=5.065, df=3, p=0.004
Monotone speech
No
F=1.274 df=3, p=0.295
Yes
F=4.316, df=1, p=0.043
Yes
F=3.336, df=3, p=0.027
Low-‐pass filtered speech
No
F=1.059, df=3, p=0.375
Yes
F=16.865, df=1, p<0.05
Yes
F=13.778, df=3, p<0.05
Spectrally rotated speech
No
F=0.380, df=3, p=0.768
Yes
F=11.743, df=1, p=0.001
Yes
F=3.549, df=3, p=0.021
Single-‐channel vocoded speech
No
F=0.428, df=3, p=0.734
Yes
F=6.906, df=1, p=0.011
Yes
F=2.941, df=3, p=0.042
It is visible in the table that no interaction was identified (except in one condition due
to one extremely poorly performing older child, see details below), and in all but one
condition an age effect was found, while the two or four groups were different in all
conditions. An interaction between the age and group effect would indicate that the
way in which children’s scores improved with age was different, so the rate of change
would differ in the groups. Now let us look at the conditions one by one for further
details.

LANGUAGE IMPAIRED CHILDREN’S LISTENING TO SPEECH IN NOISE
93
1. Speech-‐spectrum noise
TD and SLI groups: First with all data included an interaction was identified (F=5.008,
df=1, p=0.03). When the data points are inspected on a scatterplot, however, it
becomes evident that the oldest SLI child had an extremely poor result (higher SRT)
which may have caused the interaction, Figure 27. This value is 3.9 SD above the mean
so using the general rule for outliers (± 3 SD), it is safe to exclude it from the analysis.
Figure 27: Scatterplot of the results of the two groups in the speech-‐shaped noise condition. This suggests an interaction, a different effect of age in the two groups, however, the data point in the top right corner is responsible for this interaction
It was therefore removed and the analysis run again. This time no interaction was
found and no effect of age reached significance, only the effect of group, as in Table 5
above.
Applying the multiple case study approach, to determine the deviance of the SLI
results, z-‐scores were calculated based on the TD group similarly to previous
calculations. Following the two-‐step calculation and using z=1.65 as the cut-‐off point, 8
children’s results in the SLI group fell outside the normal range and two in the TD
group, Figure 28. The z-‐scores obtained will be used later to calculate the average z-‐
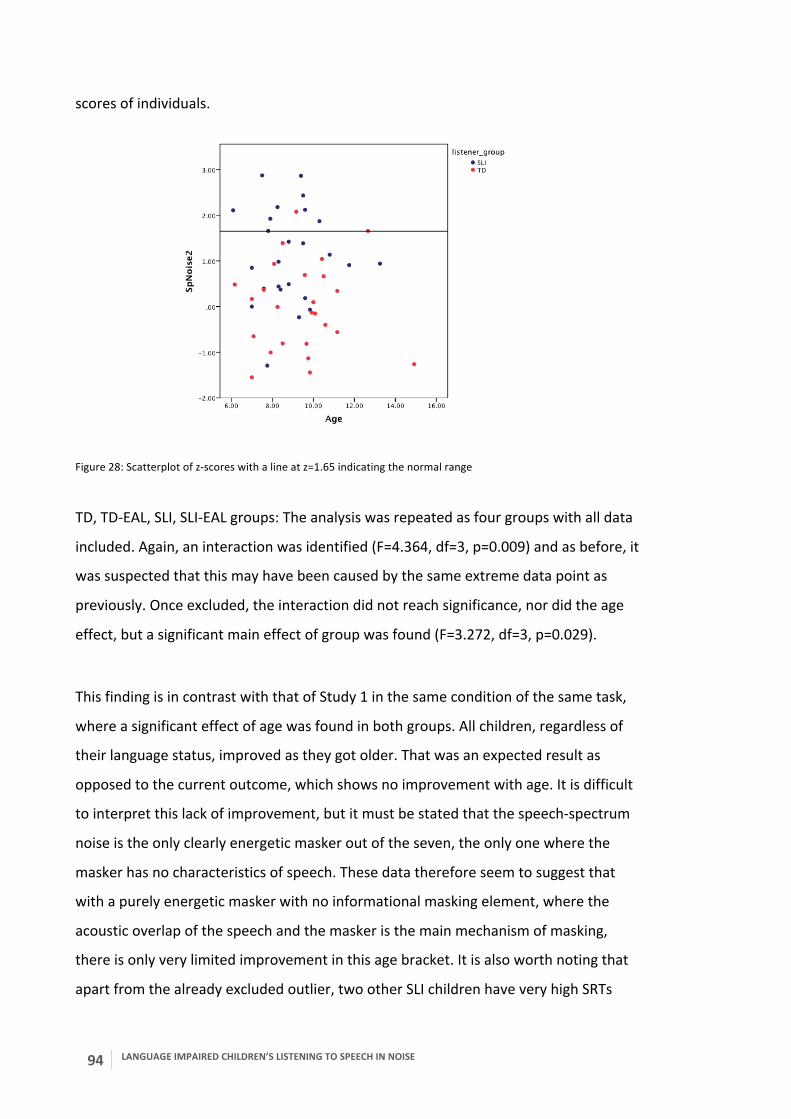
94 LANGUAGE IMPAIRED CHILDREN’S LISTENING TO SPEECH IN NOISE
scores of individuals.
Figure 28: Scatterplot of z-‐scores with a line at z=1.65 indicating the normal range
TD, TD-‐EAL, SLI, SLI-‐EAL groups: The analysis was repeated as four groups with all data
included. Again, an interaction was identified (F=4.364, df=3, p=0.009) and as before, it
was suspected that this may have been caused by the same extreme data point as
previously. Once excluded, the interaction did not reach significance, nor did the age
effect, but a significant main effect of group was found (F=3.272, df=3, p=0.029).
This finding is in contrast with that of Study 1 in the same condition of the same task,
where a significant effect of age was found in both groups. All children, regardless of
their language status, improved as they got older. That was an expected result as
opposed to the current outcome, which shows no improvement with age. It is difficult
to interpret this lack of improvement, but it must be stated that the speech-‐spectrum
noise is the only clearly energetic masker out of the seven, the only one where the
masker has no characteristics of speech. These data therefore seem to suggest that
with a purely energetic masker with no informational masking element, where the
acoustic overlap of the speech and the masker is the main mechanism of masking,
there is only very limited improvement in this age bracket. It is also worth noting that
apart from the already excluded outlier, two other SLI children have very high SRTs
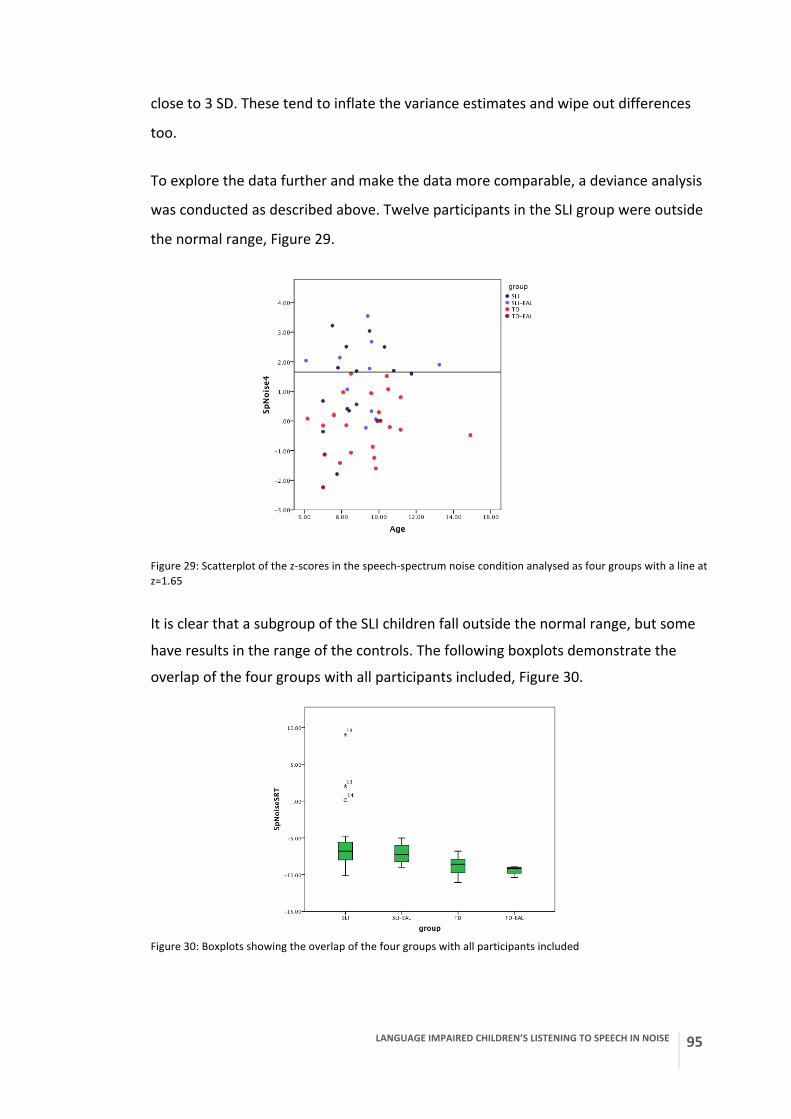
LANGUAGE IMPAIRED CHILDREN’S LISTENING TO SPEECH IN NOISE
95
close to 3 SD. These tend to inflate the variance estimates and wipe out differences
too.
To explore the data further and make the data more comparable, a deviance analysis
was conducted as described above. Twelve participants in the SLI group were outside
the normal range, Figure 29.
Figure 29: Scatterplot of the z-‐scores in the speech-‐spectrum noise condition analysed as four groups with a line at z=1.65
It is clear that a subgroup of the SLI children fall outside the normal range, but some
have results in the range of the controls. The following boxplots demonstrate the
overlap of the four groups with all participants included, Figure 30.
Figure 30: Boxplots showing the overlap of the four groups with all participants included
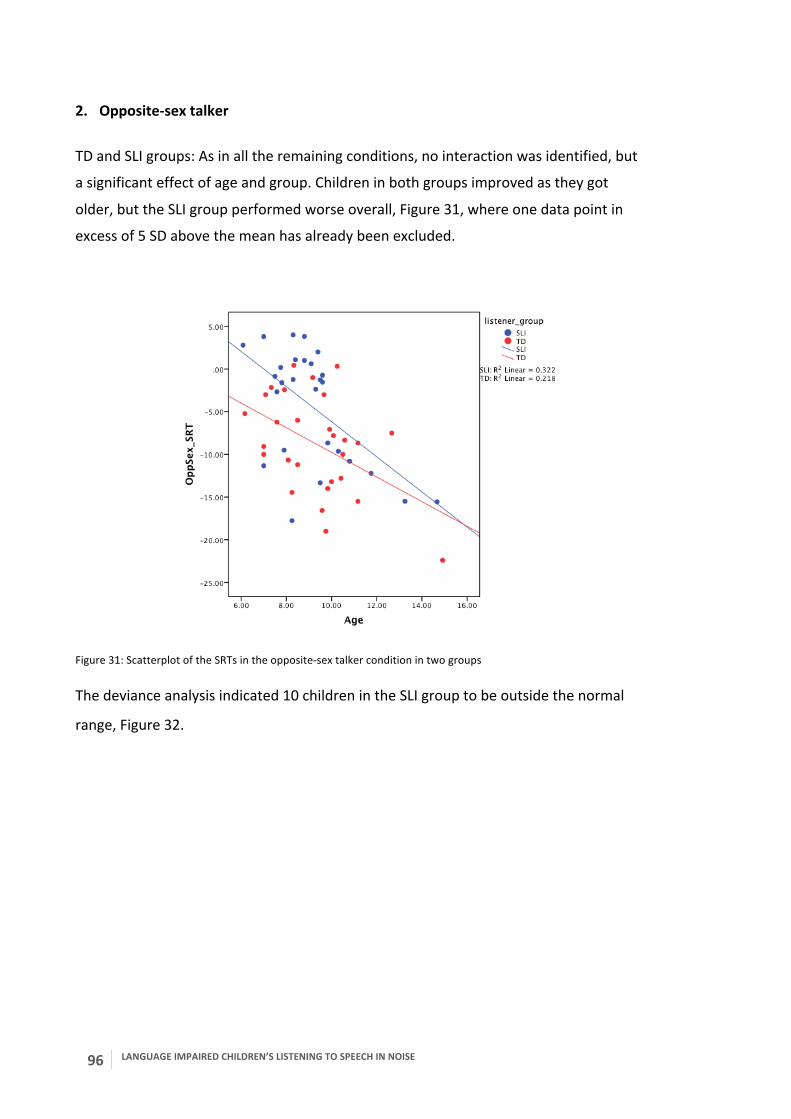
96 LANGUAGE IMPAIRED CHILDREN’S LISTENING TO SPEECH IN NOISE
2. Opposite-‐sex talker
TD and SLI groups: As in all the remaining conditions, no interaction was identified, but
a significant effect of age and group. Children in both groups improved as they got
older, but the SLI group performed worse overall, Figure 31, where one data point in
excess of 5 SD above the mean has already been excluded.
Figure 31: Scatterplot of the SRTs in the opposite-‐sex talker condition in two groups
The deviance analysis indicated 10 children in the SLI group to be outside the normal
range, Figure 32.
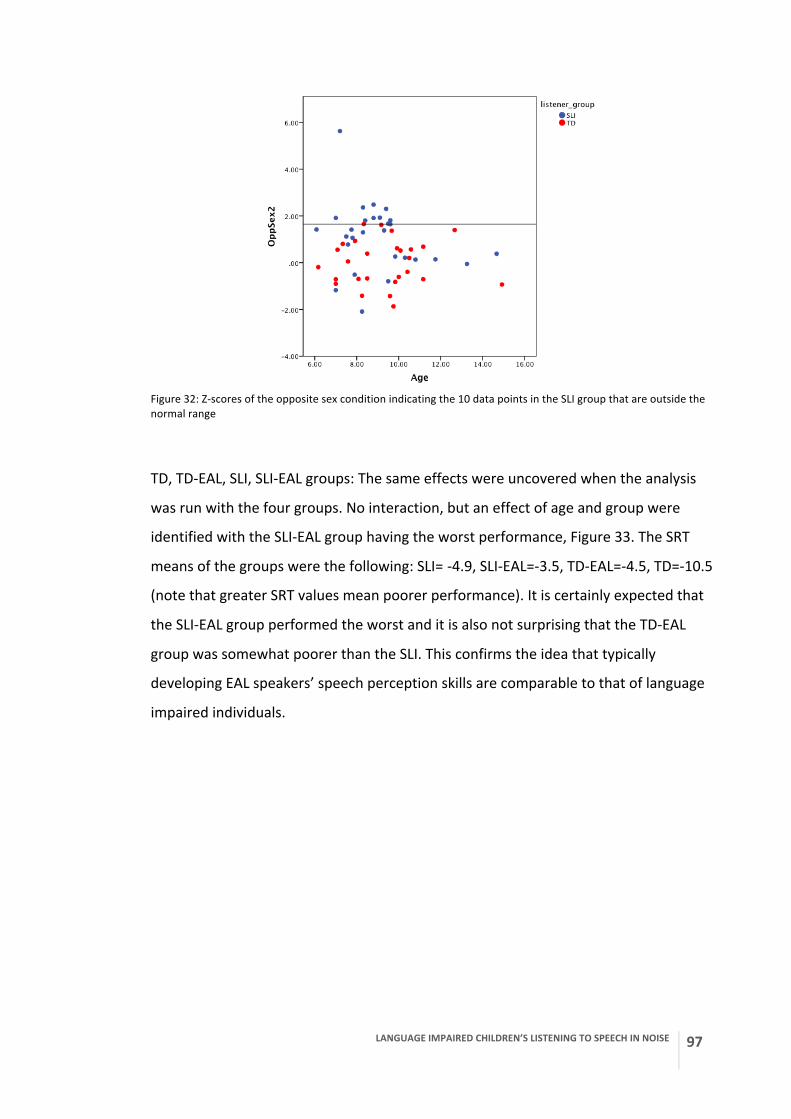
LANGUAGE IMPAIRED CHILDREN’S LISTENING TO SPEECH IN NOISE
97
Figure 32: Z-‐scores of the opposite sex condition indicating the 10 data points in the SLI group that are outside the normal range
TD, TD-‐EAL, SLI, SLI-‐EAL groups: The same effects were uncovered when the analysis
was run with the four groups. No interaction, but an effect of age and group were
identified with the SLI-‐EAL group having the worst performance, Figure 33. The SRT
means of the groups were the following: SLI= -‐4.9, SLI-‐EAL=-‐3.5, TD-‐EAL=-‐4.5, TD=-‐10.5
(note that greater SRT values mean poorer performance). It is certainly expected that
the SLI-‐EAL group performed the worst and it is also not surprising that the TD-‐EAL
group was somewhat poorer than the SLI. This confirms the idea that typically
developing EAL speakers’ speech perception skills are comparable to that of language
impaired individuals.
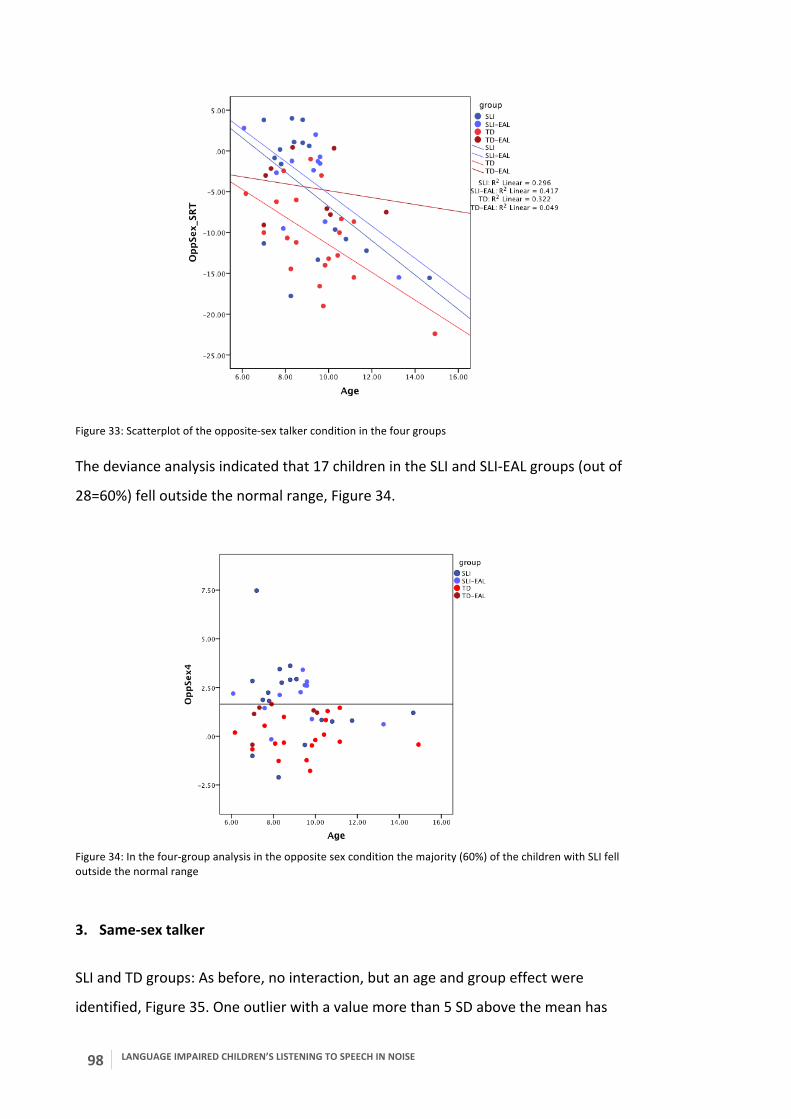
98 LANGUAGE IMPAIRED CHILDREN’S LISTENING TO SPEECH IN NOISE
Figure 33: Scatterplot of the opposite-‐sex talker condition in the four groups
The deviance analysis indicated that 17 children in the SLI and SLI-‐EAL groups (out of
28=60%) fell outside the normal range, Figure 34.
Figure 34: In the four-‐group analysis in the opposite sex condition the majority (60%) of the children with SLI fell outside the normal range
3. Same-‐sex talker
SLI and TD groups: As before, no interaction, but an age and group effect were
identified, Figure 35. One outlier with a value more than 5 SD above the mean has

LANGUAGE IMPAIRED CHILDREN’S LISTENING TO SPEECH IN NOISE
99
been excluded.
Figure 35: Scatterplot of the same-‐sex talker condition in two groups
Following the deviance analysis 10 participants fell outside the normal range.
TD, TD-‐EAL, SLI, SLI-‐EAL groups: No interaction was found, but both age and group
effect.
The deviance analysis this time identified 8 children as outside the normal range.
When inspecting the distribution of the data points in the four groups in Figure 36,
however, it is clear that even without the higest SRTs the distribution of the SLI and
SLI-‐EAL groups is highly skewed as compared to the control groups.
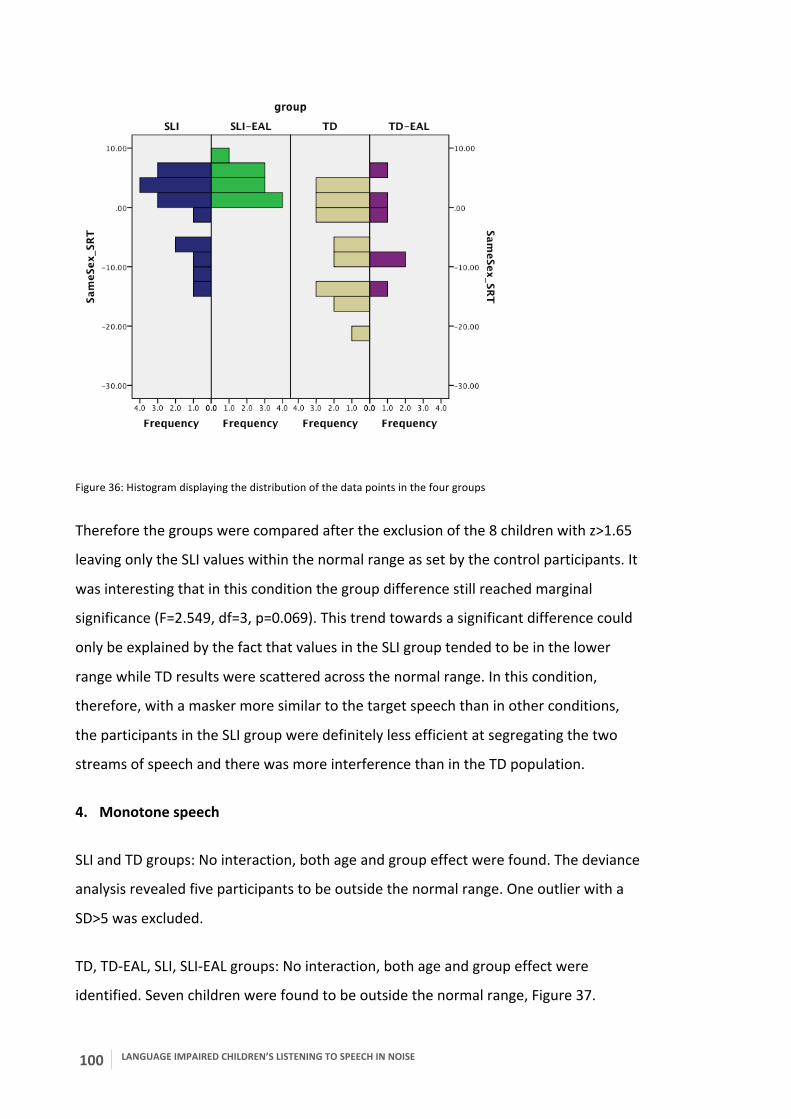
100 LANGUAGE IMPAIRED CHILDREN’S LISTENING TO SPEECH IN NOISE
Figure 36: Histogram displaying the distribution of the data points in the four groups
Therefore the groups were compared after the exclusion of the 8 children with z>1.65
leaving only the SLI values within the normal range as set by the control participants. It
was interesting that in this condition the group difference still reached marginal
significance (F=2.549, df=3, p=0.069). This trend towards a significant difference could
only be explained by the fact that values in the SLI group tended to be in the lower
range while TD results were scattered across the normal range. In this condition,
therefore, with a masker more similar to the target speech than in other conditions,
the participants in the SLI group were definitely less efficient at segregating the two
streams of speech and there was more interference than in the TD population.
4. Monotone speech
SLI and TD groups: No interaction, both age and group effect were found. The deviance
analysis revealed five participants to be outside the normal range. One outlier with a
SD>5 was excluded.
TD, TD-‐EAL, SLI, SLI-‐EAL groups: No interaction, both age and group effect were
identified. Seven children were found to be outside the normal range, Figure 37.
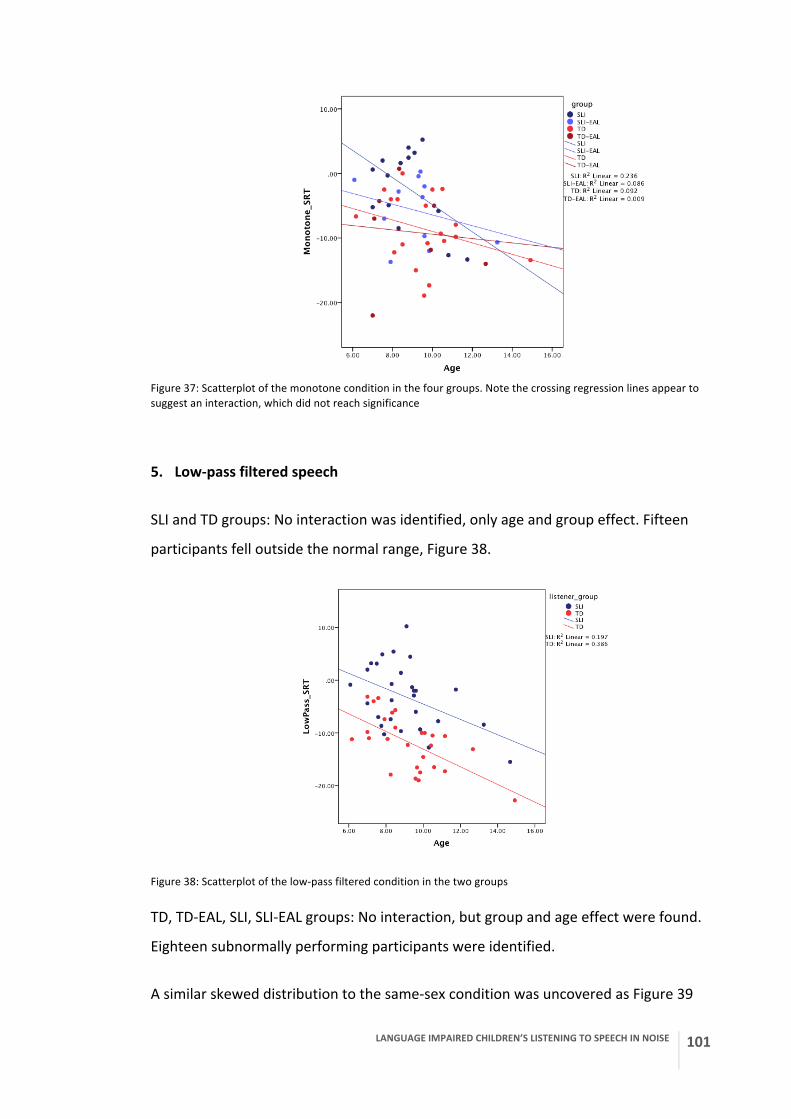
LANGUAGE IMPAIRED CHILDREN’S LISTENING TO SPEECH IN NOISE
101
Figure 37: Scatterplot of the monotone condition in the four groups. Note the crossing regression lines appear to suggest an interaction, which did not reach significance
5. Low-‐pass filtered speech
SLI and TD groups: No interaction was identified, only age and group effect. Fifteen
participants fell outside the normal range, Figure 38.
Figure 38: Scatterplot of the low-‐pass filtered condition in the two groups
TD, TD-‐EAL, SLI, SLI-‐EAL groups: No interaction, but group and age effect were found.
Eighteen subnormally performing participants were identified.
A similar skewed distribution to the same-‐sex condition was uncovered as Figure 39
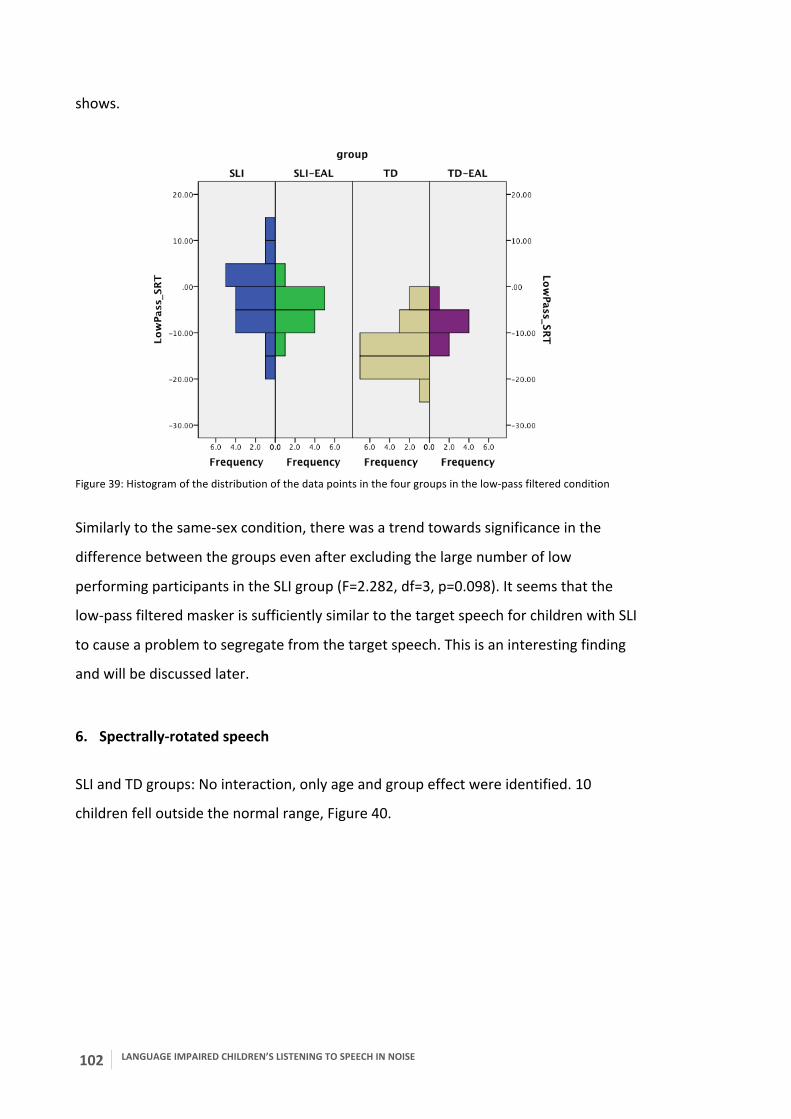
102 LANGUAGE IMPAIRED CHILDREN’S LISTENING TO SPEECH IN NOISE
shows.
Figure 39: Histogram of the distribution of the data points in the four groups in the low-‐pass filtered condition
Similarly to the same-‐sex condition, there was a trend towards significance in the
difference between the groups even after excluding the large number of low
performing participants in the SLI group (F=2.282, df=3, p=0.098). It seems that the
low-‐pass filtered masker is sufficiently similar to the target speech for children with SLI
to cause a problem to segregate from the target speech. This is an interesting finding
and will be discussed later.
6. Spectrally-‐rotated speech
SLI and TD groups: No interaction, only age and group effect were identified. 10
children fell outside the normal range, Figure 40.
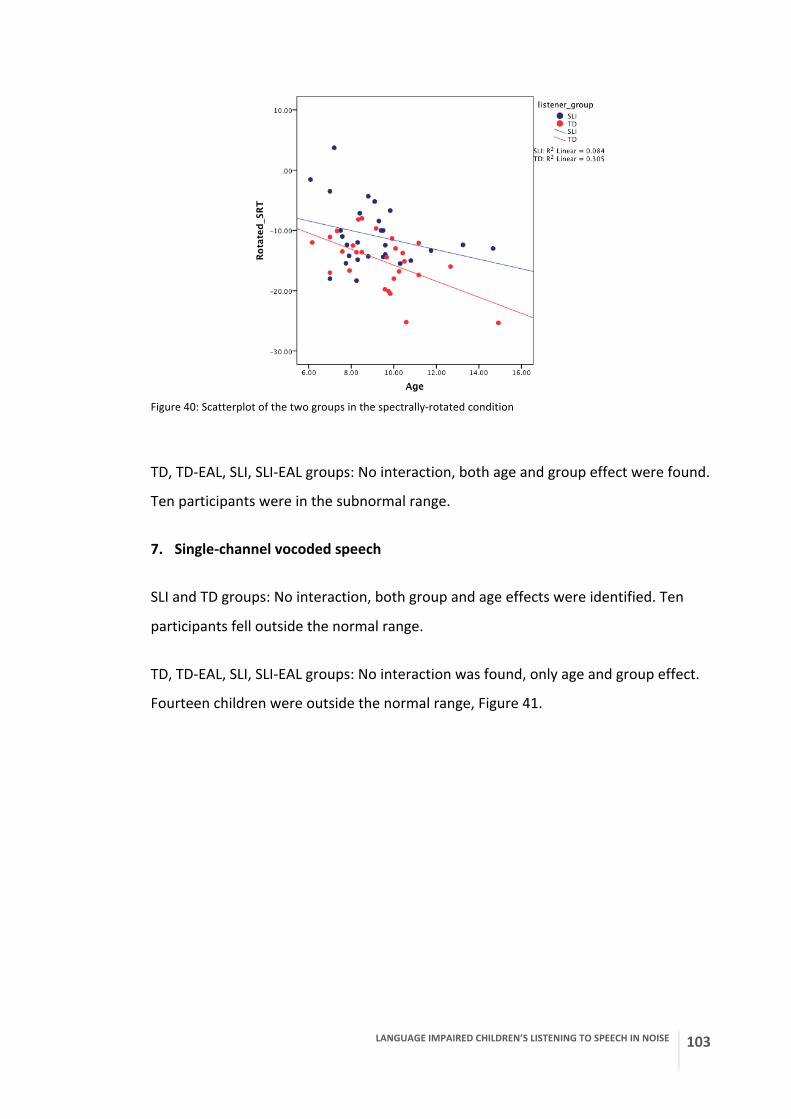
LANGUAGE IMPAIRED CHILDREN’S LISTENING TO SPEECH IN NOISE
103
Figure 40: Scatterplot of the two groups in the spectrally-‐rotated condition
TD, TD-‐EAL, SLI, SLI-‐EAL groups: No interaction, both age and group effect were found.
Ten participants were in the subnormal range.
7. Single-‐channel vocoded speech
SLI and TD groups: No interaction, both group and age effects were identified. Ten
participants fell outside the normal range.
TD, TD-‐EAL, SLI, SLI-‐EAL groups: No interaction was found, only age and group effect.
Fourteen children were outside the normal range, Figure 41.

104 LANGUAGE IMPAIRED CHILDREN’S LISTENING TO SPEECH IN NOISE
Figure 41: Scatterplot of the four groups in the single-‐channel vocoded conditon
3.3.2.3 Summary of the groups and conditions
Finally, the z-‐scores of each participant in the seven conditions were averaged yielding
one z-‐score, which is potentially a more accurate reflection of each child’s speech
perceptual ability. Using the usual criterion of z>1.65, 7 children were found to be
below the normal range in the two-‐group analysis and 11 children in the 4-‐group
analysis. Evidently, the four-‐group analysis is more stringent as it used only the
monolingual TD children to determine the normal range. Thus this will be used in the
remaining analysis henceforth. The 11 children identified as having a speech
perception deficit (SLI+SPD) represent 39.3% of the SLI group.
Table 7 summarises the results of the deviance analysis of the speech perception
results including the non-‐word repetition, attention and dyslexia scores with a tick
indicating scores below the normal range. The table will be referred back to in further
analyses.
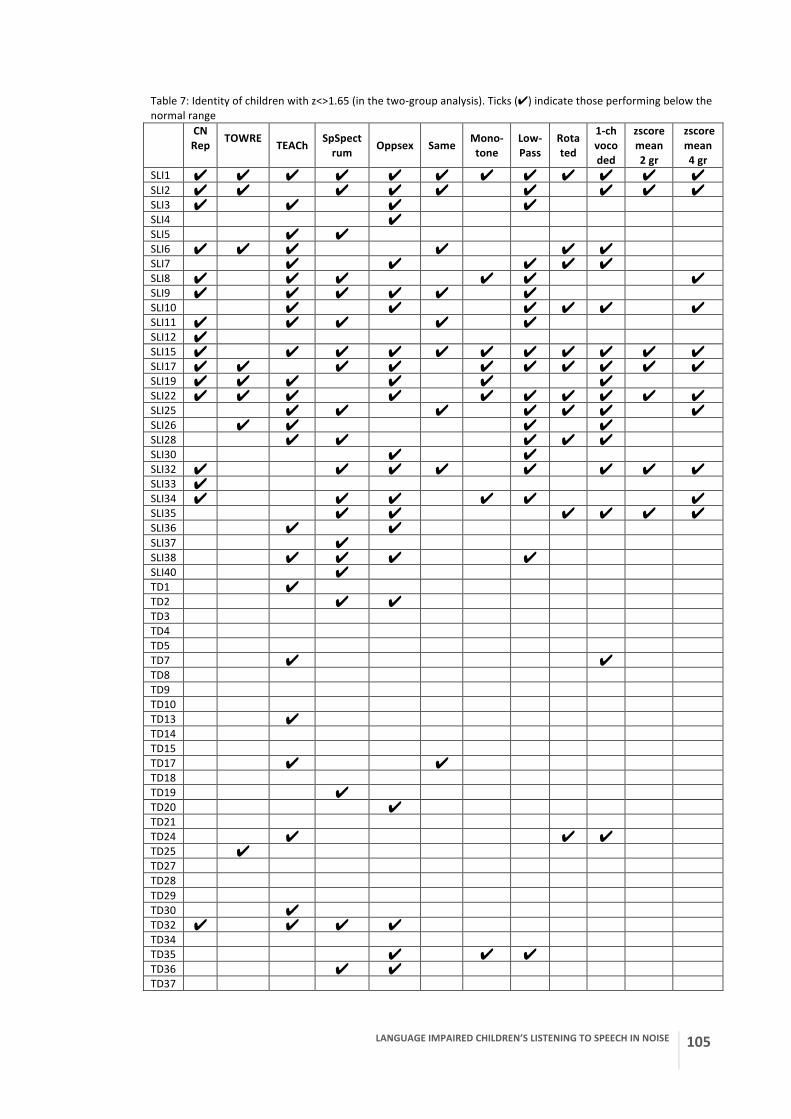
LANGUAGE IMPAIRED CHILDREN’S LISTENING TO SPEECH IN NOISE
105
Table 7: Identity of children with z<>1.65 (in the two-‐group analysis). Ticks (✔) indicate those performing below the normal range CN
Rep
TOWRE TEACh SpSpect
rum Oppsex Same Mono-‐tone
Low-‐Pass
Rota ted
1-‐ch voco ded
zscore mean 2 gr
zscore mean 4 gr
SLI1 ✔ ✔ ✔ ✔ ✔ ✔ ✔ ✔ ✔ ✔ ✔ ✔ SLI2 ✔ ✔ ✔ ✔ ✔ ✔ ✔ ✔ ✔ SLI3 ✔ ✔ ✔ ✔ SLI4 ✔ SLI5 ✔ ✔ SLI6 ✔ ✔ ✔ ✔ ✔ ✔ SLI7 ✔ ✔ ✔ ✔ ✔ SLI8 ✔ ✔ ✔ ✔ ✔ ✔ SLI9 ✔ ✔ ✔ ✔ ✔ ✔ SLI10 ✔ ✔ ✔ ✔ ✔ ✔ SLI11 ✔ ✔ ✔ ✔ ✔ SLI12 ✔ SLI15 ✔ ✔ ✔ ✔ ✔ ✔ ✔ ✔ ✔ ✔ ✔ SLI17 ✔ ✔ ✔ ✔ ✔ ✔ ✔ ✔ ✔ ✔ SLI19 ✔ ✔ ✔ ✔ ✔ ✔ SLI22 ✔ ✔ ✔ ✔ ✔ ✔ ✔ ✔ ✔ ✔ SLI25 ✔ ✔ ✔ ✔ ✔ ✔ ✔ SLI26 ✔ ✔ ✔ ✔ SLI28 ✔ ✔ ✔ ✔ ✔ SLI30 ✔ ✔ SLI32 ✔ ✔ ✔ ✔ ✔ ✔ ✔ ✔ SLI33 ✔ SLI34 ✔ ✔ ✔ ✔ ✔ ✔ SLI35 ✔ ✔ ✔ ✔ ✔ ✔ SLI36 ✔ ✔ SLI37 ✔ SLI38 ✔ ✔ ✔ ✔ SLI40 ✔ TD1 ✔ TD2 ✔ ✔ TD3 TD4 TD5 TD7 ✔ ✔ TD8 TD9 TD10 TD13 ✔ TD14 TD15 TD17 ✔ ✔ TD18 TD19 ✔ TD20 ✔ TD21 TD24 ✔ ✔ ✔ TD25 ✔ TD27 TD28 TD29 TD30 ✔ TD32 ✔ ✔ ✔ ✔ TD34 TD35 ✔ ✔ ✔ TD36 ✔ ✔ TD37

106 LANGUAGE IMPAIRED CHILDREN’S LISTENING TO SPEECH IN NOISE
As a final check the following table summarises the z-‐scores of the SLI and TD groups in
the seven conditions first including the EAL children in the respective groups, then
separately in four groups. The TD mean=0 in all conditions, by definition, and SD=0.98
in the two-‐group and SD=0.97 in the four-‐group analysis. A t-‐test indicated that the SLI
and TD groups differed in all conditions at a significance level of p<0.05.
Table 8: Mean z-‐scores of the two and four groups in the seven conditions
Condition SLI mean (SD) (2gr)
SLI mean (SD) (4gr)
SLI-‐EAL mean (SD)
TD EAL mean (SD)
SpNoise2gr 1.12 (1.04)
SpNoise4gr 1.28 (1.39) 1.41 (1.21) -‐0.84 (1.08)
OppSex2gr 1.18 (1.44)
OppSex4gr 1.88 (2.16) 1.89 (1.07) 0.95 (0.78)
SameSex2gr 1.30 (1.26)
SameSex4gr 1.02 (1.42) 1.47 (0.87) -‐0.06 (0.96)
Mono2gr 0.90 (1.17)
Mono4gr 1.31 (1.4) 0.47 (0.92) -‐0.20 (1.43)
LowPass2gr 1.98 (1.34)
LowPass4gr 2.28 (1.41) 1.88 (1.17) 0.65 (0.79)
Rotated2gr 1.01 (1.31)
Rotated4gr 1.09 (1.56) 1.11 (1.05) 0.61 (1.01)
Vocoded2gr 1.00 (1.8)
Vocoded4gr 1.81 (1.96) 1.21 (2.17) 0.75 (1.06) 3.3.3 Speech perception and language
To uncover the relationship between the language skills and speech perceptual skills,
Pearson’s product moment correlation analysis was applied on the language scores
and the SRTs in the seven noise conditions. This was first done on the whole data set
including all groups and it revealed significant correlation between the receptive
language scores on TROG and the SRTs in all conditions and also the expressive
language scores on CELF4 and the SRTs. However, when the language impaired and TD
groups are taken together as a whole, a correlation is not surprising as SLI children
have lower language scores by definition and we have seen that their SRTs are lower
as well in all conditions. Therefore, the correlation was explored in the SLI and TD
groups separately. In the SLI group no correlation reached significance between TROG
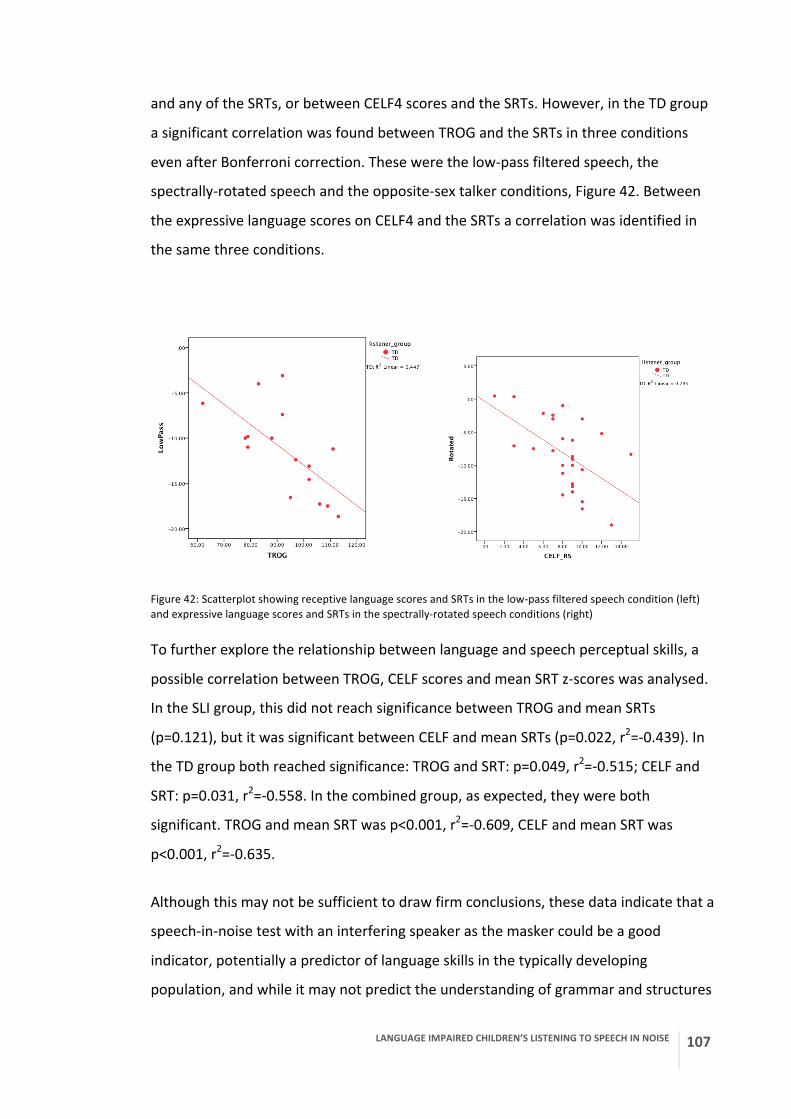
LANGUAGE IMPAIRED CHILDREN’S LISTENING TO SPEECH IN NOISE
107
and any of the SRTs, or between CELF4 scores and the SRTs. However, in the TD group
a significant correlation was found between TROG and the SRTs in three conditions
even after Bonferroni correction. These were the low-‐pass filtered speech, the
spectrally-‐rotated speech and the opposite-‐sex talker conditions, Figure 42. Between
the expressive language scores on CELF4 and the SRTs a correlation was identified in
the same three conditions.
Figure 42: Scatterplot showing receptive language scores and SRTs in the low-‐pass filtered speech condition (left) and expressive language scores and SRTs in the spectrally-‐rotated speech conditions (right)
To further explore the relationship between language and speech perceptual skills, a
possible correlation between TROG, CELF scores and mean SRT z-‐scores was analysed.
In the SLI group, this did not reach significance between TROG and mean SRTs
(p=0.121), but it was significant between CELF and mean SRTs (p=0.022, r2=-‐0.439). In
the TD group both reached significance: TROG and SRT: p=0.049, r2=-‐0.515; CELF and
SRT: p=0.031, r2=-‐0.558. In the combined group, as expected, they were both
significant. TROG and mean SRT was p<0.001, r2=-‐0.609, CELF and mean SRT was
p<0.001, r2=-‐0.635.
Although this may not be sufficient to draw firm conclusions, these data indicate that a
speech-‐in-‐noise test with an interfering speaker as the masker could be a good
indicator, potentially a predictor of language skills in the typically developing
population, and while it may not predict the understanding of grammar and structures
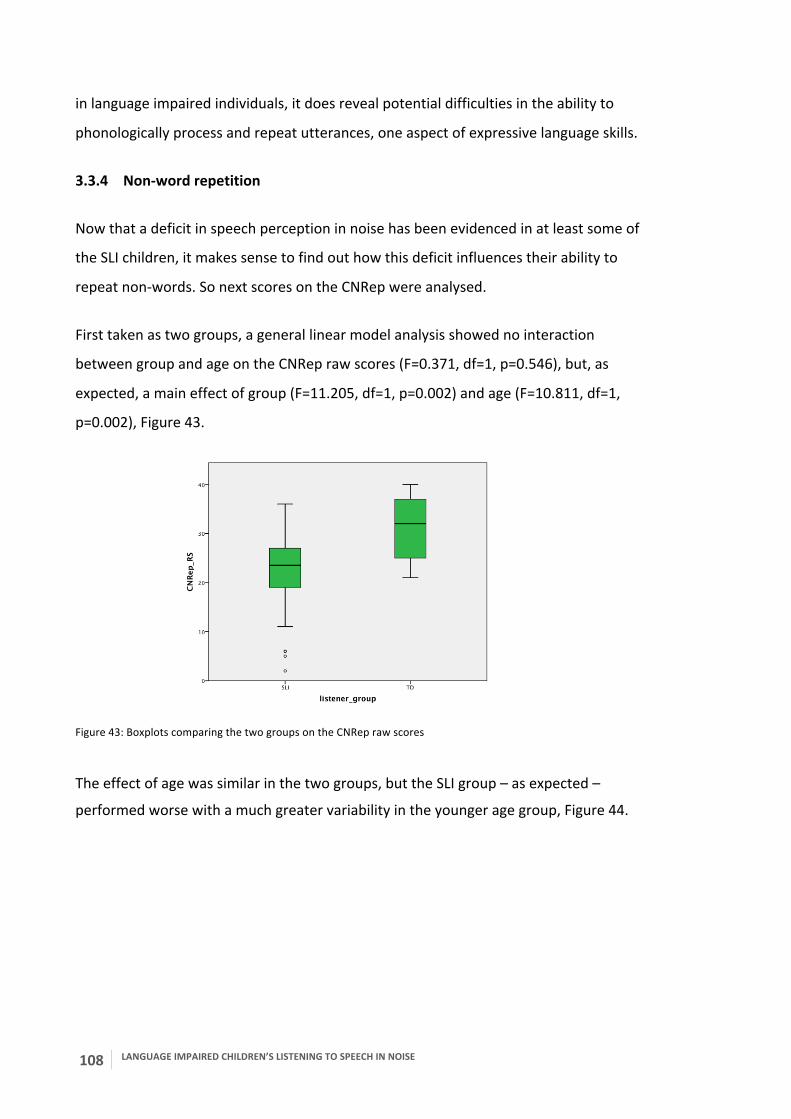
108 LANGUAGE IMPAIRED CHILDREN’S LISTENING TO SPEECH IN NOISE
in language impaired individuals, it does reveal potential difficulties in the ability to
phonologically process and repeat utterances, one aspect of expressive language skills.
3.3.4 Non-‐word repetition
Now that a deficit in speech perception in noise has been evidenced in at least some of
the SLI children, it makes sense to find out how this deficit influences their ability to
repeat non-‐words. So next scores on the CNRep were analysed.
First taken as two groups, a general linear model analysis showed no interaction
between group and age on the CNRep raw scores (F=0.371, df=1, p=0.546), but, as
expected, a main effect of group (F=11.205, df=1, p=0.002) and age (F=10.811, df=1,
p=0.002), Figure 43.
Figure 43: Boxplots comparing the two groups on the CNRep raw scores
The effect of age was similar in the two groups, but the SLI group – as expected –
performed worse with a much greater variability in the younger age group, Figure 44.
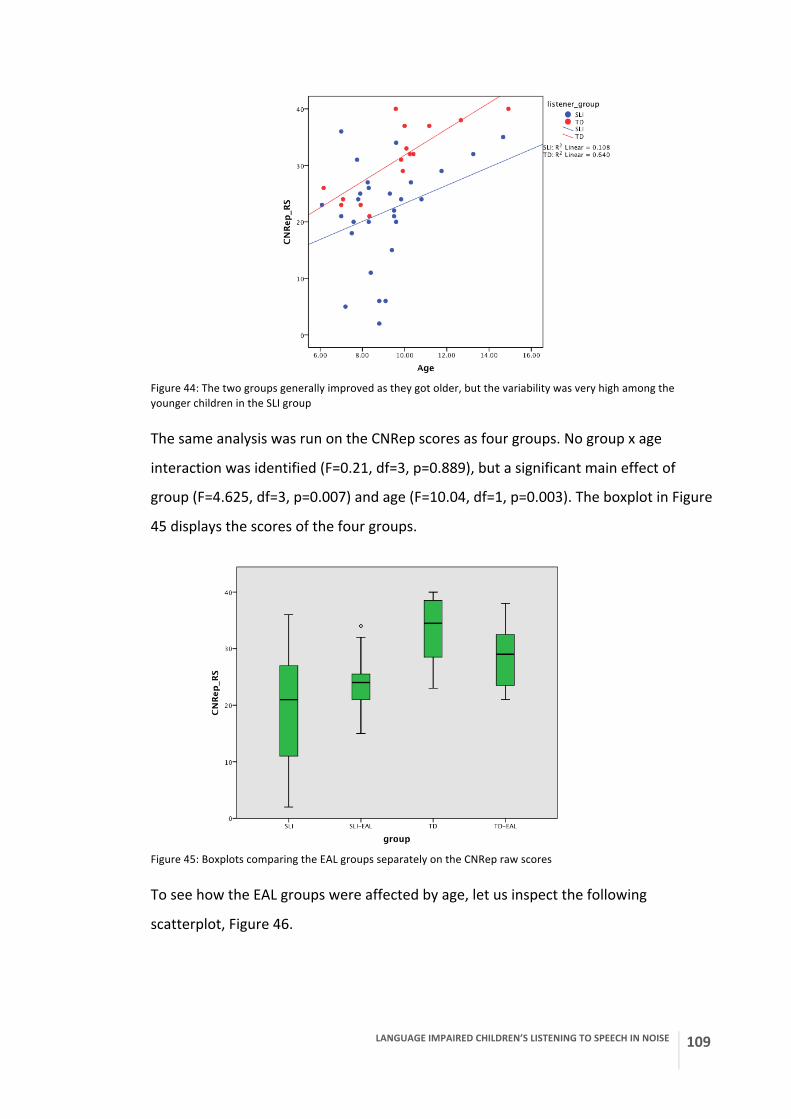
LANGUAGE IMPAIRED CHILDREN’S LISTENING TO SPEECH IN NOISE
109
Figure 44: The two groups generally improved as they got older, but the variability was very high among the younger children in the SLI group
The same analysis was run on the CNRep scores as four groups. No group x age
interaction was identified (F=0.21, df=3, p=0.889), but a significant main effect of
group (F=4.625, df=3, p=0.007) and age (F=10.04, df=1, p=0.003). The boxplot in Figure
45 displays the scores of the four groups.
Figure 45: Boxplots comparing the EAL groups separately on the CNRep raw scores
To see how the EAL groups were affected by age, let us inspect the following
scatterplot, Figure 46.
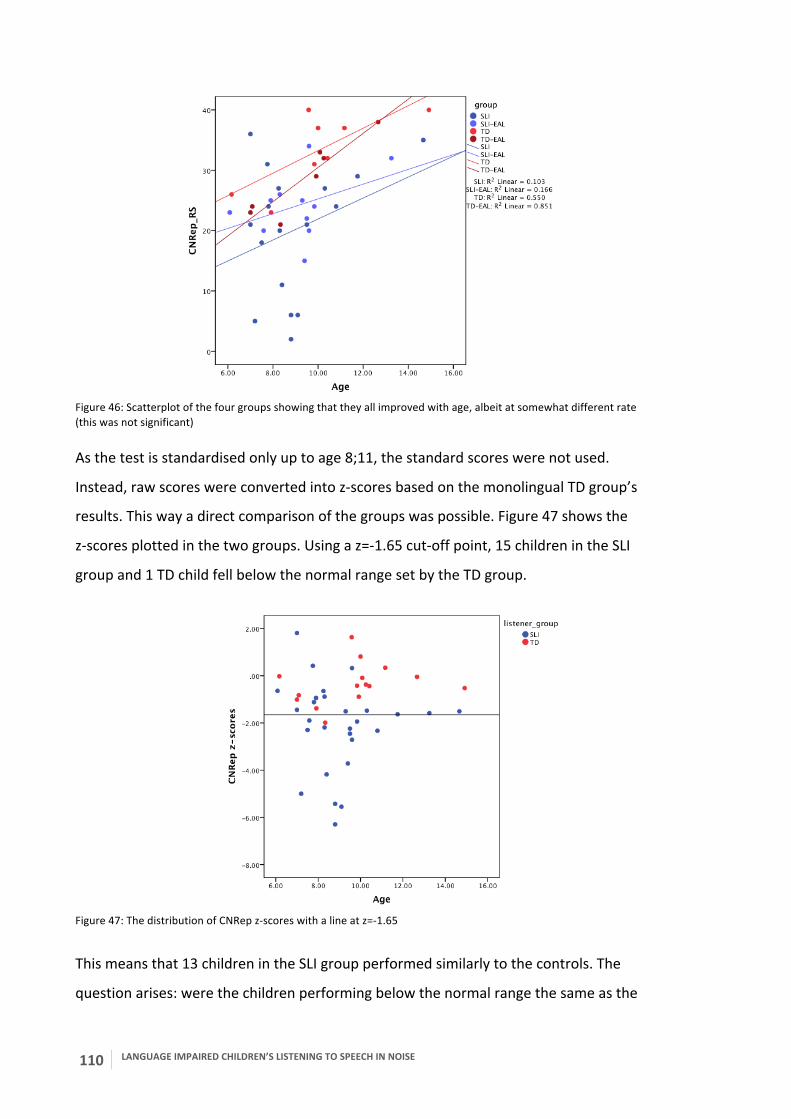
110 LANGUAGE IMPAIRED CHILDREN’S LISTENING TO SPEECH IN NOISE
Figure 46: Scatterplot of the four groups showing that they all improved with age, albeit at somewhat different rate (this was not significant)
As the test is standardised only up to age 8;11, the standard scores were not used.
Instead, raw scores were converted into z-‐scores based on the monolingual TD group’s
results. This way a direct comparison of the groups was possible. Figure 47 shows the
z-‐scores plotted in the two groups. Using a z=-‐1.65 cut-‐off point, 15 children in the SLI
group and 1 TD child fell below the normal range set by the TD group.
Figure 47: The distribution of CNRep z-‐scores with a line at z=-‐1.65
This means that 13 children in the SLI group performed similarly to the controls. The
question arises: were the children performing below the normal range the same as the
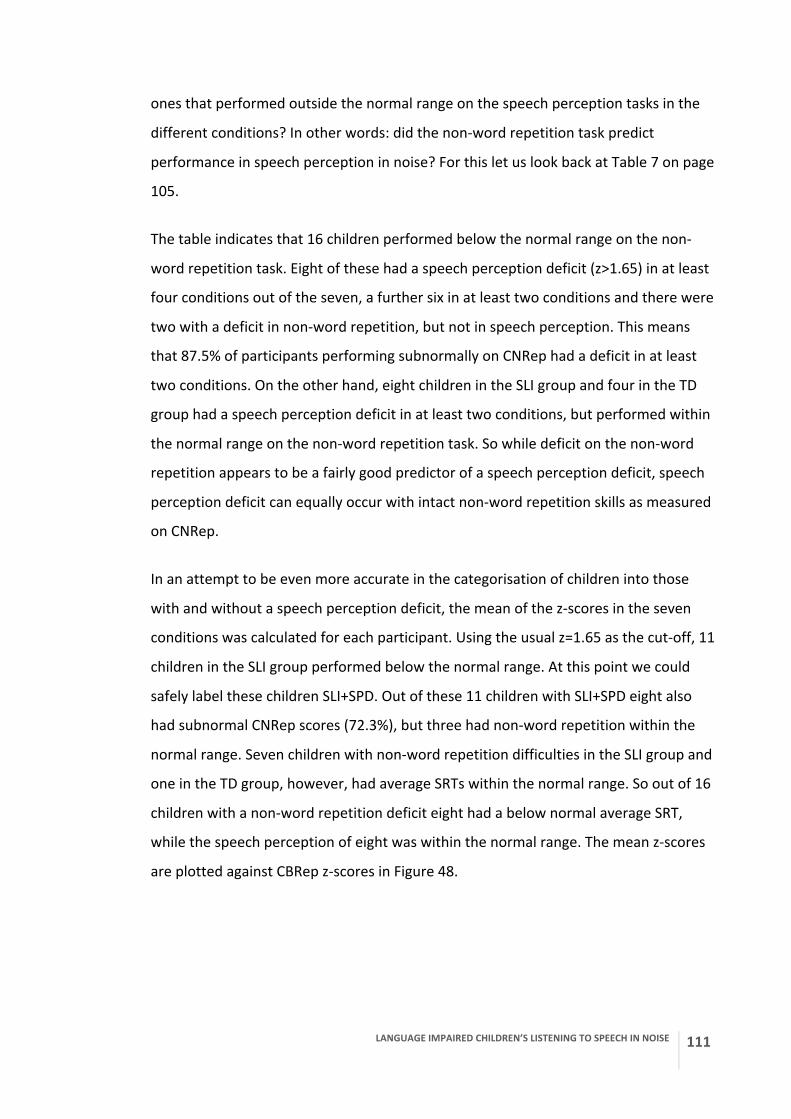
LANGUAGE IMPAIRED CHILDREN’S LISTENING TO SPEECH IN NOISE
111
ones that performed outside the normal range on the speech perception tasks in the
different conditions? In other words: did the non-‐word repetition task predict
performance in speech perception in noise? For this let us look back at Table 7 on page
105.
The table indicates that 16 children performed below the normal range on the non-‐
word repetition task. Eight of these had a speech perception deficit (z>1.65) in at least
four conditions out of the seven, a further six in at least two conditions and there were
two with a deficit in non-‐word repetition, but not in speech perception. This means
that 87.5% of participants performing subnormally on CNRep had a deficit in at least
two conditions. On the other hand, eight children in the SLI group and four in the TD
group had a speech perception deficit in at least two conditions, but performed within
the normal range on the non-‐word repetition task. So while deficit on the non-‐word
repetition appears to be a fairly good predictor of a speech perception deficit, speech
perception deficit can equally occur with intact non-‐word repetition skills as measured
on CNRep.
In an attempt to be even more accurate in the categorisation of children into those
with and without a speech perception deficit, the mean of the z-‐scores in the seven
conditions was calculated for each participant. Using the usual z=1.65 as the cut-‐off, 11
children in the SLI group performed below the normal range. At this point we could
safely label these children SLI+SPD. Out of these 11 children with SLI+SPD eight also
had subnormal CNRep scores (72.3%), but three had non-‐word repetition within the
normal range. Seven children with non-‐word repetition difficulties in the SLI group and
one in the TD group, however, had average SRTs within the normal range. So out of 16
children with a non-‐word repetition deficit eight had a below normal average SRT,
while the speech perception of eight was within the normal range. The mean z-‐scores
are plotted against CBRep z-‐scores in Figure 48.
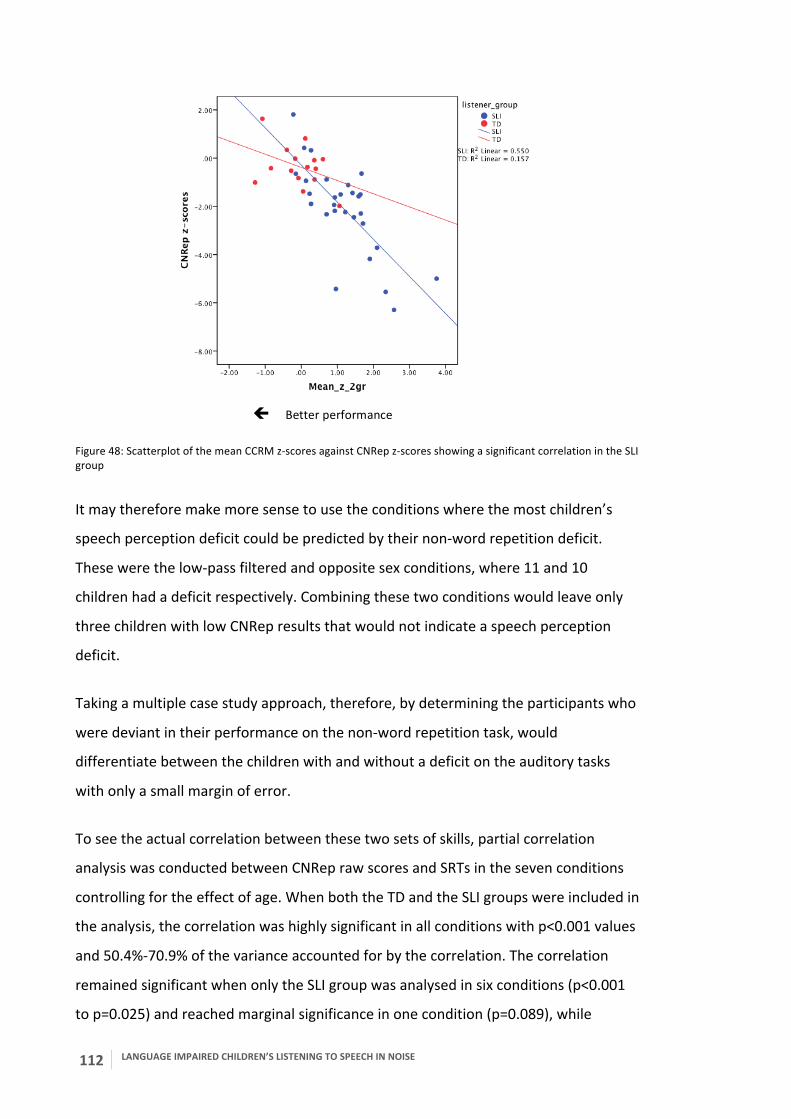
112 LANGUAGE IMPAIRED CHILDREN’S LISTENING TO SPEECH IN NOISE
Figure 48: Scatterplot of the mean CCRM z-‐scores against CNRep z-‐scores showing a significant correlation in the SLI group
It may therefore make more sense to use the conditions where the most children’s
speech perception deficit could be predicted by their non-‐word repetition deficit.
These were the low-‐pass filtered and opposite sex conditions, where 11 and 10
children had a deficit respectively. Combining these two conditions would leave only
three children with low CNRep results that would not indicate a speech perception
deficit.
Taking a multiple case study approach, therefore, by determining the participants who
were deviant in their performance on the non-‐word repetition task, would
differentiate between the children with and without a deficit on the auditory tasks
with only a small margin of error.
To see the actual correlation between these two sets of skills, partial correlation
analysis was conducted between CNRep raw scores and SRTs in the seven conditions
controlling for the effect of age. When both the TD and the SLI groups were included in
the analysis, the correlation was highly significant in all conditions with p<0.001 values
and 50.4%-‐70.9% of the variance accounted for by the correlation. The correlation
remained significant when only the SLI group was analysed in six conditions (p<0.001
to p=0.025) and reached marginal significance in one condition (p=0.089), while
ç Better performance
LANGUAGE IMPAIRED CHILDREN’S LISTENING TO SPEECH IN NOISE
113
significance was indicated only in two conditions in the TD group (p=0.028-‐p=0.029).
The correlation analysis was repeated using the mean z-‐scores on the speech
perception tasks (CCRM) and the z-‐scores on CNRep. These are already age-‐adjusted
so partial analysis was not necessary. Including both the TD and SLI groups in the
analysis the correlation was highly significant with p<0.001, r2=0.766. Taken the groups
separately, the correlation in the TD group did not reach significance (p=0.143), while
in the SLI group it did (r2=0.711, p<0.001). This is clearly visible in Figure 48 above.
Additionally, correlation between CNRep raw scores and the mean z-‐scores of the
seven conditions was evaluated partialling out the effect of age first in the two groups
together, then separately in the TD and SLI groups. In the combined groups the
correlation was highly significant at the p<0.001 level with 76.2% of the variance
accounted for by the correlation. In the TD group, it just failed to reach significance
(p=0.1) and in the SLI group it was again highly significant at p<0.001 with 75.6% of the
variance resulting from the correlation.
In summary, data were analysed in two different ways and both methods demonstrate
that non-‐word repetition skills are, indeed, consistent with speech perception scores
with a high degree of accuracy in language impaired children, but less so in typical
development.
3.3.5 Literacy and speech perception
To have a general idea about the distribution of standardised scores on the dyslexia
screen, TOWRE, let us look at the scatterplot first, Figure 49.
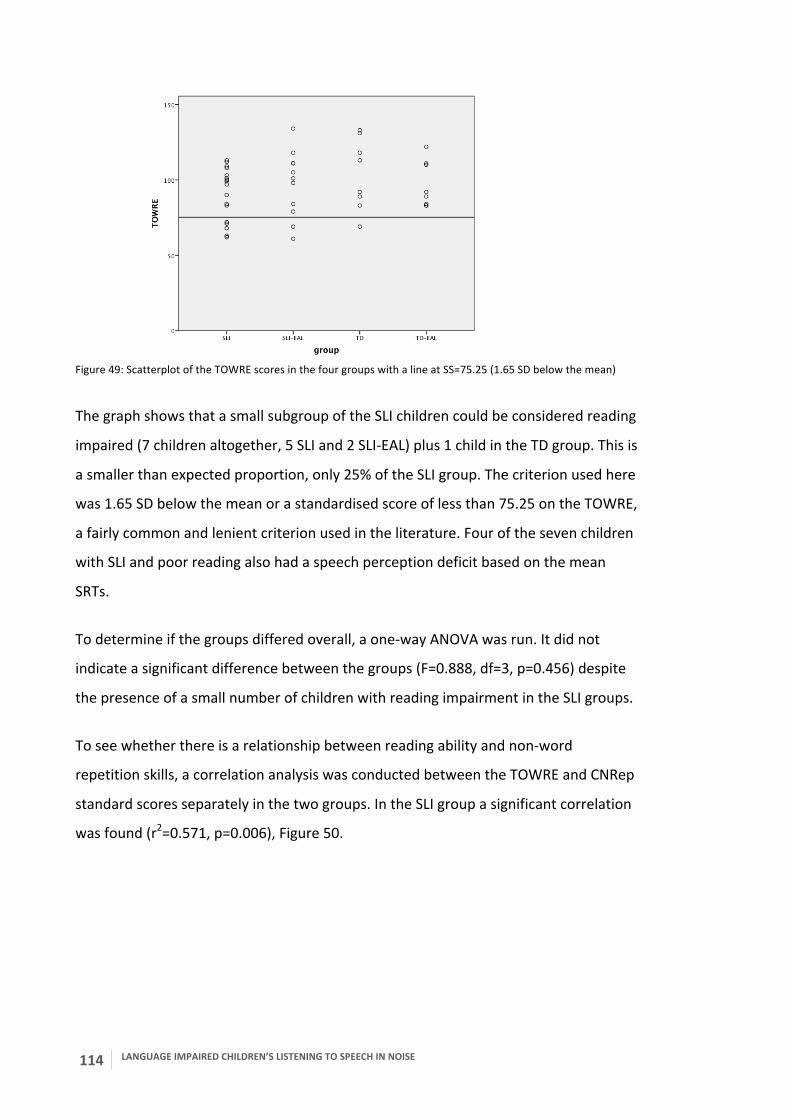
114 LANGUAGE IMPAIRED CHILDREN’S LISTENING TO SPEECH IN NOISE
Figure 49: Scatterplot of the TOWRE scores in the four groups with a line at SS=75.25 (1.65 SD below the mean)
The graph shows that a small subgroup of the SLI children could be considered reading
impaired (7 children altogether, 5 SLI and 2 SLI-‐EAL) plus 1 child in the TD group. This is
a smaller than expected proportion, only 25% of the SLI group. The criterion used here
was 1.65 SD below the mean or a standardised score of less than 75.25 on the TOWRE,
a fairly common and lenient criterion used in the literature. Four of the seven children
with SLI and poor reading also had a speech perception deficit based on the mean
SRTs.
To determine if the groups differed overall, a one-‐way ANOVA was run. It did not
indicate a significant difference between the groups (F=0.888, df=3, p=0.456) despite
the presence of a small number of children with reading impairment in the SLI groups.
To see whether there is a relationship between reading ability and non-‐word
repetition skills, a correlation analysis was conducted between the TOWRE and CNRep
standard scores separately in the two groups. In the SLI group a significant correlation
was found (r2=0.571, p=0.006), Figure 50.
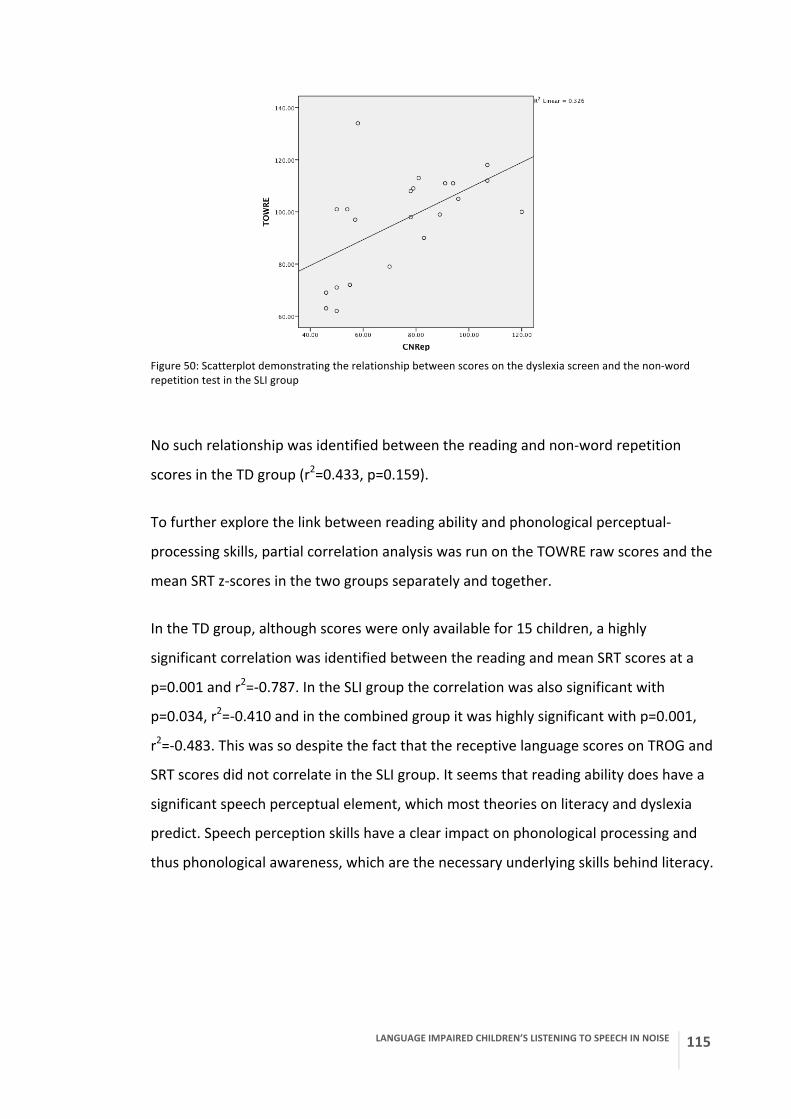
LANGUAGE IMPAIRED CHILDREN’S LISTENING TO SPEECH IN NOISE
115
Figure 50: Scatterplot demonstrating the relationship between scores on the dyslexia screen and the non-‐word repetition test in the SLI group
No such relationship was identified between the reading and non-‐word repetition
scores in the TD group (r2=0.433, p=0.159).
To further explore the link between reading ability and phonological perceptual-‐
processing skills, partial correlation analysis was run on the TOWRE raw scores and the
mean SRT z-‐scores in the two groups separately and together.
In the TD group, although scores were only available for 15 children, a highly
significant correlation was identified between the reading and mean SRT scores at a
p=0.001 and r2=-‐0.787. In the SLI group the correlation was also significant with
p=0.034, r2=-‐0.410 and in the combined group it was highly significant with p=0.001,
r2=-‐0.483. This was so despite the fact that the receptive language scores on TROG and
SRT scores did not correlate in the SLI group. It seems that reading ability does have a
significant speech perceptual element, which most theories on literacy and dyslexia
predict. Speech perception skills have a clear impact on phonological processing and
thus phonological awareness, which are the necessary underlying skills behind literacy.
116 LANGUAGE IMPAIRED CHILDREN’S LISTENING TO SPEECH IN NOISE
3.3.6 Discussion
In this study speech perception in noise was investigated in SLI through speech
reception thresholds in a modified version of the Coordinate Response Measure along
with attention, literacy and non-‐word repetition measures. Results partially follow the
trend laid down by previous investigations, but there are some surprising outcomes
too. One key observation is that only a subset of the SLI children showed impaired
speech perception ability in all of the noise conditions, but due to this subset of
extreme values children with SLI as a group achieved poorer SRTs with all noise
maskers.
Another outcome is that children with SLI showed significantly greater impairment
with intelligible speech maskers than with fluctuating or steady-‐state noise. The fact
that the three unintelligible maskers were the easiest for the children with SLI and
their results with all speech maskers were poorer than in the speech-‐spectrum
condition, where “dip-‐listening” is not available, could mean that they are less capable
of making use of the glimpses present in speech. The fact that in the single-‐channel
vocoded and spectrally-‐rotated conditions they fared relatively well, however, means
that they have the ability to make use of glimpses in such noise conditions. This
pattern could be explained with the intelligibility of speech rather than its acoustic
complexity and pitch contour. All maskers that contained intelligible speech proved to
be more distracting for the SLI children than the ones with similar acoustic complexity
or amplitude modulation, but no intelligibility. One may also hypothesise, based on
these data, that the speech perception deficit in SLI as compared to controls, which is
demonstrated by their higher SRTs in all conditions, comes from a decreased ability to
ignore intelligible speech in the background. Similarity of the target and masker seems
to make a big difference as the results in the same-‐sex versus the opposite-‐sex
conditions show. The relatively better results in the speech-‐spectrum condition may
indicate that the deficit in SLI is not in perception per se, but other top-‐down cognitive
processes may play a more important part than in controls.
Increased deficits in conditions with intelligible maskers as compared to unintelligible
ones and greater deficits with increasing target-‐masker similarity may indicate
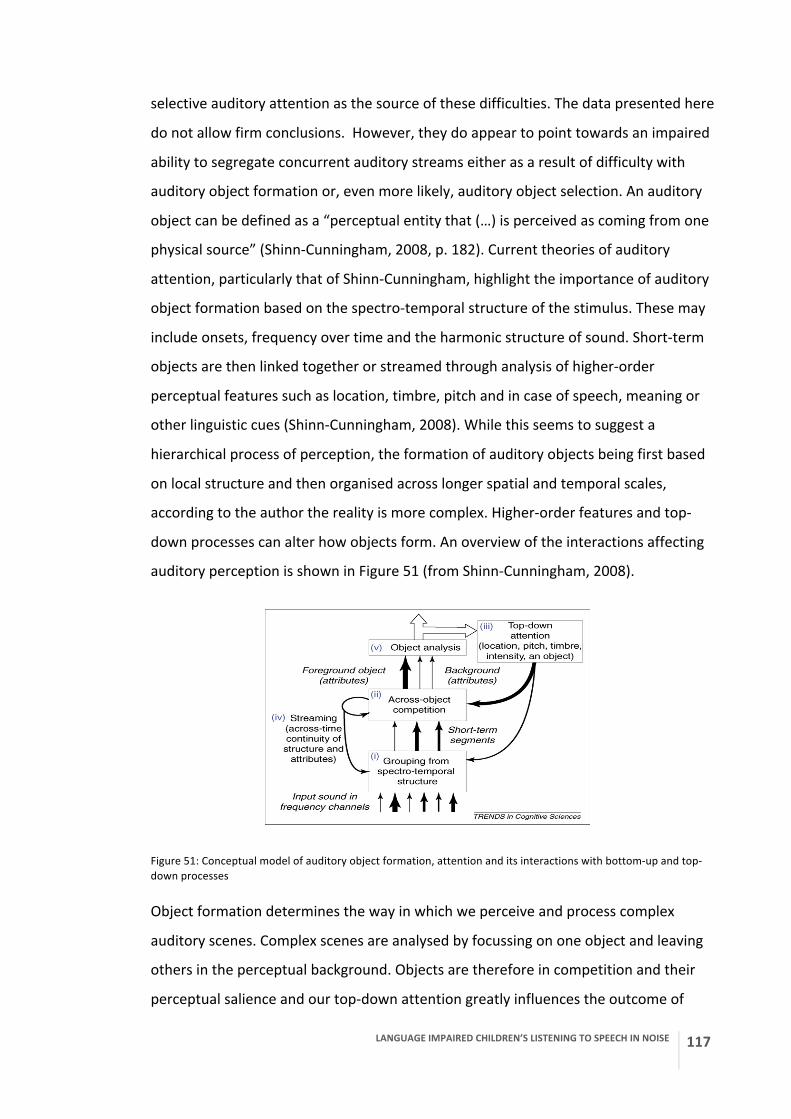
LANGUAGE IMPAIRED CHILDREN’S LISTENING TO SPEECH IN NOISE
117
selective auditory attention as the source of these difficulties. The data presented here
do not allow firm conclusions. However, they do appear to point towards an impaired
ability to segregate concurrent auditory streams either as a result of difficulty with
auditory object formation or, even more likely, auditory object selection. An auditory
object can be defined as a “perceptual entity that (…) is perceived as coming from one
physical source” (Shinn-‐Cunningham, 2008, p. 182). Current theories of auditory
attention, particularly that of Shinn-‐Cunningham, highlight the importance of auditory
object formation based on the spectro-‐temporal structure of the stimulus. These may
include onsets, frequency over time and the harmonic structure of sound. Short-‐term
objects are then linked together or streamed through analysis of higher-‐order
perceptual features such as location, timbre, pitch and in case of speech, meaning or
other linguistic cues (Shinn-‐Cunningham, 2008). While this seems to suggest a
hierarchical process of perception, the formation of auditory objects being first based
on local structure and then organised across longer spatial and temporal scales,
according to the author the reality is more complex. Higher-‐order features and top-‐
down processes can alter how objects form. An overview of the interactions affecting
auditory perception is shown in Figure 51 (from Shinn-‐Cunningham, 2008).
Figure 51: Conceptual model of auditory object formation, attention and its interactions with bottom-‐up and top-‐down processes
Object formation determines the way in which we perceive and process complex
auditory scenes. Complex scenes are analysed by focussing on one object and leaving
others in the perceptual background. Objects are therefore in competition and their
perceptual salience and our top-‐down attention greatly influences the outcome of
118 LANGUAGE IMPAIRED CHILDREN’S LISTENING TO SPEECH IN NOISE
which object is in focus. The perceptual unit of attention is the object (for further
explanation see Shinn-‐Cunningham, 2008), so the objects in a complex auditory scene
can cause perceptual interference. Shinn-‐Cunningham’s suggestion that “results of
many studies on informational masking can be explained by failures of object-‐based
attention” (p. 184) appears to be relevant to our current findings. In her model the
author explains that stimulus similarity in informational masking also functions by
affecting object formation and object selection. Similarity can cause target and masker
to be perceived as part of the same perceptual object instead of segregating them into
two streams. Equally, if the formation is successful, selecting the relevant object is also
made difficult by the similarity of the two objects. This is easy to imagine with our
same-‐sex talker masker where the two female voices with similar accents uttering
sentences of similar grammatical structure and vocabulary sufficiently resemble for
listeners to find it difficult to segregate them into two different streams to form two
distinct auditory objects, or even if this has been successfully done, to decide which
voice has uttered the relevant information.
The pattern of performance of the experimental group in this study can thus be
explained with an impaired ability in SLI to form auditory objects or to select auditory
objects in a complex auditory scene. This is ultimately a deficit in selective auditory
attention as explained above. If this is the case then why did the attention test used
(TEA-‐Ch) not indicate a group deficit? There could be several reasons for this. The most
obvious one is that the subtest used in this study may not measure selective auditory
attention that is necessary for object formation and selection. In the Walk, Don’t Walk
subtest children listen to beeps and are expected to give a behavioural response. No
overlapping sounds, no masking and therefore no particular difficulty is present to
form an auditory object and to focus attention on it. Moreover, the task does not
contain speech and is therefore significantly less complex than the auditory scene with
two speakers. It can be argued that for children with SLI an auditory experience
without speech is likely to be more attractive by nature than anything that contains
speech.
LANGUAGE IMPAIRED CHILDREN’S LISTENING TO SPEECH IN NOISE
119
Closer examination of the results of TEA-‐Ch, on the other hand, does indicate a
potential relationship between attention scores and SRTs on the speech perception
tasks. Similar to the process of determining which children were below the normal
range on the speech perception tasks in the different conditions, where the criterion
of z>1.65 was used, children with scores more than 1.65 SD below the mean (scaled
score < 5.05) were selected as SLI+attention deficit. These were then compared to the
children designated as SLI+SPD earlier also based on the 1.65 SD criterion. Table 7 (p.
105) shows the participants in all tasks and conditions who met these criteria.
When we inspect which participants with SLI had a deficit on the attention task we
notice that all these children had a speech perception deficit in at least one condition
(two children) or two or more conditions (15 children). In other words, all children
from the SLI group, but not the TD group, who had a significant deficit on the attention
task also had a deficit on the speech-‐in-‐noise task, although not all children with a
speech perception deficit in any number of conditions were found to have an attention
deficit.
Further evidence for the deficit in object formation and selection hypothesis comes
from a comparison of the children that met the deficit criterion in the various tasks
and conditions. On inspecting the table above, several children can be identified who
had a deficit in more than one condition or task. SLI+SPD children were not the same in
all conditions, but there were some who were found to have a deficit in several
conditions. If we select children that have a deficit in non-‐word repetition, we find that
all of these children have a speech perception deficit in 3.8 conditions on average.
While there are children with a speech perceptual deficit who do not fall below the
1.65 SD criterion on CNRep, all low performing children on CNRep show a deficit with
some masker. This seems to suggest that there might be a relationship between the
skills needed to repeat non-‐words and to listen to speech in noise. Taking Shinn-‐
Cunningham’s object formation hypothesis further and assuming that in SLI auditory
object formation is impaired, then it stands to reason to point to non-‐words where this
difficulty with object formation should also surface. For non-‐words there is no
phonological representation in the listener’s head and analysis of the phonological
120 LANGUAGE IMPAIRED CHILDREN’S LISTENING TO SPEECH IN NOISE
structure of the input has to be done efficiently online before motor commands can be
given to form the word. Here selecting the auditory object itself is not difficult as there
is no other auditory object in competition. However, through an efficient analysis of
the phonemic structure of the stimulus the listener will be able to repeat the non-‐
word, which is only possible if following successful formation of the auditory objects.
This, therefore, should show a deficit if object formation is problematic. Our data
confirm this.
Furthermore , the number and identity of the SLI+SPD children were compared
between the conditions. One interesting observation is a comparison of the same-‐sex
talker condition to the other conditions. In the same-‐sex talker condition the target
and masker similarity makes it harder to segregate the two streams. If object
formation is deficient in SLI, this condition will be affected more than any other. This is,
indeed, reflected in the SRTs being the highest in this condition. The number of
listeners, however, who performed below the normal range set by controls is lower
than in some other conditions; only 8 children met the criteria for SLI+SPD. Following
the exclusion of this subgroup, the remaining SLI group still differed significantly from
the TD group. If the similarity of the masker negatively influences the ability to
segregate the streams through an impaired ability to form an auditory object and
focus the attention on that selectively, participants in this condition are expected not
only to achieve higher SRTs (poorer performance) as a group, but also to be less
variable in their performance. The fact that after the exclusion of the SLI+SPD
participants, the remaining group was still significantly poorer than the control group
means that the SLI group is more homogenously impaired in this condition than in
others. This can be conceived of as indirect evidence that auditory object formation
and selection may be to blame for the poorer speech perception in SLI.
There is also indirect evidence for inconsistent SPD in SLI that can emerge here or
there. The low-‐pass filtered condition was the only other condition where the group
difference remained significant after the removal of the SLI+SPD children from the
analysis. This is particularly interesting if we inspect the table indicating how many
children met the SLI+SPD criteria. In this condition 18 children were given this label.
LANGUAGE IMPAIRED CHILDREN’S LISTENING TO SPEECH IN NOISE
121
This means that the variability was much greater than in the same-‐sex talker condition,
but even the remaining children had poor results that were not in the normal range of
the TD children. The low-‐pass filtered speech is fully intelligible, less similar to the
target than the same-‐sex talker, but it is a somewhat degraded signal, which could be
the reason why so many listeners had extreme results.
All in all only two children in the SLI group do not have a tick in any of the conditions in
table 7, meaning that all others have had extremely low results meeting the criteria for
SLI+SPD in at least one condition. There were three participants who had a deficit in six
or all seven conditions; all others were considered SLI+SPD in fewer conditions. This
shows that the children with SLI are much more likely to have a deficit on the
experimental tasks than controls, especially if their non-‐word repetition task already
shows a deficit. So although in all conditions only a subgroup of the SLI listeners were
impaired, across all conditions 26 out of the 28 fell below the normal range at least
once. So while the speech perceptual deficit may not be detectable in all tasks and
conditions in all children with SLI, it is there to surface when conditions demand.

122 LANGUAGE IMPAIRED CHILDREN’S LISTENING TO SPEECH IN NOISE
Chapter 4 Study three: auditory training in SLI 4.1 Background
The findings of Study 2 indicated an unequivocal speech perceptual impairment in the
presence of some types of masking noise, particularly human speech, in SLI as
compared to age-‐matched controls. Regardless of whether this is mainly a result of
auditory attention difficulties, less efficient auditory or general processing, impaired
executive function or frank perceptual impairment in challenging perceptual
circumstances in SLI, the question a clinician may immediately ask is whether this skill
can be ameliorated through systematic exposure to auditory tasks of increasing
difficulty. If so, will an improved speech perception ability result in improved language
skills thus indicating that such perceptual skills may be in a causal relationship with
language impairment? To find the answer to these scientifically and clinically relevant
questions, an auditory training study was designed and delivered to a group of children
with SLI, with appropriate outcome measures pre-‐and post training and after a
consolidation period.
4.2 Participants Twenty-‐four children with SLI were selected from the schools that also participated in
Study 2. Parental consent was obtained following a discussion with teachers about the
feasibility of the school conducting the 6-‐week training and of including the individual
children (see Appendix 5 for the letter sent to parents). Schools were asked to free one
or two teaching assistants to deliver the programme. A timetable was created to fit all
children in for the three 20-‐minute sessions a week for each child. Two of the three
schools had their own iPads, which were made available for the duration of the
programme. One school received two iPads that were purchased by the UCL
department using funds available for the project.
Of the 24 participants six children were used as a control group, who were tested
before and after the study, but did not participate in the training. A shortcoming of the
study was that despite a plan to randomise the selection of the control group and the
possibility of the post-‐tests being conducted by testers blind to the participant’s group,
LANGUAGE IMPAIRED CHILDREN’S LISTENING TO SPEECH IN NOISE
123
this could not be realised due to logistical constraints, the three sites of testing and the
small number of testers. As a result the children in the control group were all in one
school. This may have a potential bias as it is well-‐known that language units in
different boroughs of London may have slightly different criteria for accepting pupils in
terms of academic abilities. Theoretically, although the pre-‐training test battery
establishes the presence and absence of comparable skill sets in the verbal and non-‐
verbal areas, it does not reveal all relevant information about the participants, for
example their socioeconomic status. As all three language units cater for the needs of
language-‐impaired children in the whole borough in which they are located, it is
expected that in terms of socioeconomic status and academic abilities there would be
a variety of children at each language unit, regardless of the area in which the schools
are situated. For this reason it is assumed that the control group is a representative
sample of children with SLI and their gains or the lack thereof over the training period
can be compared to the children who were exposed to the training.
Once the groups were established, all participants were administered the pre-‐training
test battery, which included the screening tests to establish the children’s SLI status
and hearing and the measures of skills that the training was expected to have an
impact on.
4.3 Pre-‐training assessments
4.3.1 Screening
4.3.1.1 Audiometry Similarly to Study 2 all candidates in Study 3 were administered a pure-‐tone
audiometric screening test using the laptop and headphones described above, which
they had to pass at 25dBHL in both ears at frequencies of 500Hz, 1kHz, 2kHz, 4kHz and
8kHz. The headphones on the laptop using the audiometry software were calibrated
using a Brüel & Kjær 4153 artificial ear.
124 LANGUAGE IMPAIRED CHILDREN’S LISTENING TO SPEECH IN NOISE
4.3.1.2 Non-‐verbal intelligence The Block Design subtest of the Wechsler Intelligence Scale for Children III-‐UK (WISC,
Wechsler, 1991) was used as a screening assessment of non-‐verbal intelligence in this
study as well, which was described in previous chapters.
4.3.2 Language assessment
In Study 3 a subgroup of the same children were included as in the previous study in
the SLI group and one additional pupil. One year and 4-‐6 months passed after the
testing of the last children in Study 2, therefore the test-‐re-‐test effect was considered
negligible. The same language assessments (CELF4-‐UK Recalling Sentences and TROG2)
were administered immediately preceding the auditory training, but these scores were
not used for inclusion or exclusion as these participants were known to have language
difficulties. This time these measures were used to establish the children’s language
abilities pre-‐and post intervention.
4.3.3 Attention measures
The same auditory attention test as in Study 2, the ‘Walk, Don’t Walk’ subtest of the
TEA-‐Ch was included in the test battery. This decision was motivated by the fact that
the auditory training programme would require focussed auditory attention for 20
minutes, three times a week for six weeks, therefore an improvement of auditory
attention skills as measured by the test can be expected.
4.3.4 Non-‐word repetition task
The CNRep was used in the previous study, the inclusion of which was motivated by
the fact that this ability is a clinical marker of SLI (Bishop, North & Donlan, 1996). It
taps into phonological short-‐term memory, which appears to be problematic in SLI
(Gathercole & Baddeley, 1990) as well as phonological processing skills, which the
training is expected to target.

LANGUAGE IMPAIRED CHILDREN’S LISTENING TO SPEECH IN NOISE
125
Despite its low attentional load and relative simplicity, however, CNRep proved to be
an extremely difficult task for the majority of children with SLI. Due to this floor effect
in practical terms it showed little difference between the children within the SLI group.
Therefore for this sub-‐population the test is not sufficiently sensitive. Following a trial
test of another standardised non-‐word repetition task (one subtest of Nepsy – II,
Korkman, Kirk & Kemp, 2007), which appeared to be just as difficult therefore not
sufficiently sensitive to show individual differences within the group and potential
gains, for Study 3 it was decided that a new, simpler non-‐word repetition task would
be created. This is referred to as Vadey from the names of the two students creating it
(Vasileiou and Redey-‐Nagy). The invented non-‐words followed the pattern of CNRep
starting with single syllable non-‐words increasing to 5 syllables. There are three of
each word length making altogether 15 non-‐words. These were recorded as spoken by
a male native speaker of English with a southern British accent and played to the
children for repetition using the same equipment as in the other tasks. For a list of the
non-‐words see the Vadey record form in Appendix 3.
4.3.5 Literacy skills
The screening test for specific reading difficulty that was introduced in Study 2 was
also included in the test battery of Study 3 both before and after the intervention. This
was motivated by the substantial comorbidity between SLI and specific literacy
difficulties as described in previous chapters. As the auditory training targets
phonological processing as the skill underlying speech perceptual abilities, reading
skills can be expected to ameliorate along with language skills as a child’s speech
perception and phonological processing ability improve. The test was thus used to
measure a potential gain and generalisation to reading.
The test used was the same as in the previous study, the Test of Word Reading
Efficiency (TOWRE, Torgesen, Wagner & Rashotte, 1999).
126 LANGUAGE IMPAIRED CHILDREN’S LISTENING TO SPEECH IN NOISE
4.3.6 Speech perception measures
Measuring the speech perceptual abilities is the most direct way of determining the
success of the training programme as this is the very skill that is trained. It makes sense
to expect improvement in the way in which children are able to distinguish the target
speech from noise maskers as tasks requiring this skill were a large part of the training
material. Thus the training programme was designed to ameliorate the exact skills that
were found to be deficient in SLI in Study 2. This meant that the speech-‐in-‐noise test
used in Study 2 could have the potential of being the most sensitive measure of this
skill. For this reason, the same computerised test, CCRM, was used to establish the
children’s baseline speech perception in noise immediately preceding the auditory
training and to see their potential gains in the same ability at the completion of the
training, with four of the seven conditions. These were: 1. Same-‐sex talker, 2.
Spectrally rotated speech, 3. Low-‐pass filtered speech 4. Speech-‐spectrum shaped
noise. These were selected because they were found to be the hardest and easiest (1
and 2) or differed the most (3) in Study 2, and the speech-‐shaped noise condition is the
commonly used basic masker condition.
4.4 Equipment
The same computers were used for the pre-‐and post-‐tests as in Study 2 with the
auditory tasks administered via a pair of Sennheiser HD25-‐1 headphones. For the
auditory training the children used Sennheiser HD201 headphones attached to iPad 2
tablet devices. In the pre-‐and posttests a mouse was used to select the pictures where
such responses were needed. Verbal responses or expressions were recorded using a
Roland R-‐05 voice recorder. Auditory stimuli were played on an iPad using Hitachi HS-‐
AS-‐300 minispeakers.
The training itself was an app on an iPad, for which iPad 2 devices were used.
LANGUAGE IMPAIRED CHILDREN’S LISTENING TO SPEECH IN NOISE
127
4.5 The training programme
4.5.1 Background The training programme was developed based on the findings of Studies 1 and 2 and
targeted the skill that children with SLI had a deficit in as compared to controls. The
proposition behind the design of the intervention programme was that through
exposing the children to auditory activities in which they listen to speech in noise, this
skill may be ameliorated. There is some evidence, although not unequivocal, that
training a deficient auditory skill in this way results in the improvement of that skill
(Van Engen, 2012; Collet, Colin, Serniclaes, Hoonhorst, Markessis, Deltenre & Leybaert,
2012; Filippini, Befi-‐Lopes & Schochat, 2012; Loo, Rosen & Bamiou, 2015). However, it
is questionable whether generalisation of that skill to other related skills or sets of
abilities occurs (Halliday, Taylor, Millward & Moore, 2012; for a review of evidence see
Fey, Richard, Geffner, Kamhi, Medwetsky, Paul, Ross-‐Swain, Wallach, Frymark &
Schooling, 2011; Bellis, Chermak, Weihing & Musiek (2012), Fey, Kamhi & Richard
(2012). The goal of the current intervention was therefore to investigate whether
speech perceptual skills improve following an intensive training programme and
whether the improvement of this skill would have any effect on other skills,
particularly language and literacy skills.
A computerised auditory training game was developed for an iPad to be used with a
pair of headphones. The name of the app is Noisy Castle. The theme of the game is
that the participating child (player) has to go into different rooms of the castle and free
an animal that is locked up in each room in a cage. Each room has a “noisy” task that
the player has to do before the animal is freed. The child has to pay very good
attention to the sound or word(s) otherwise he or she may not be successful in freeing
the animal.
All sound stimuli and instructions were spoken by male and female native English
speakers with southern British accents. The picture stimuli were taken from free online
databases, some were already in use at UCL and some others were purchased. A

128 LANGUAGE IMPAIRED CHILDREN’S LISTENING TO SPEECH IN NOISE
professional iOS developer was employed to do the programming. The maskers were
taken from departmental databases and these include cafeteria noise, 2-‐, 4-‐ and 8-‐
talker babble noise, noise-‐vocoded babble noise, single-‐channel vocoded speech,
single female and male talkers speaking English, single child talkers speaking English
and speech-‐shaped noise.
4.5.2 Structure and use of the iPad app Noisy Castle
The app is essentially a series of seven auditory training tasks. Three of these are
divided into two or three subtasks. As the training tasks go from phoneme level
through word and sentence level to narratives, the children have to start at the
beginning and follow the hierarchical order that is built in the app. This means that
when the user logs on, they will only be allowed to continue where they left off and
will not be able to jump to another task.
Since listening is the main element of the game, schools and accompanying adults
(usually teaching assistants) were asked that the children should be in a quiet room
and use headphones that were provided.
LANGUAGE IMPAIRED CHILDREN’S LISTENING TO SPEECH IN NOISE
129
Figure 52: Starting page of the app Noisy Castle
4.5.3 Training plan for each child
The training regime was designed so that each child should use the game for three 20-‐
minute sessions a week for a period of six weeks. This would normally expose a child
to 6 hours of training. After logging on, the app times the session which automatically
stops after 20 minutes. If a child has started a task, but has not finished it when the
app stops, that task is counted as not done yet and it will be the first task the next time
the same child logs on.
4.5.4 Starting the game At the beginning of the first session the nature and goal of the game is explained to the
child by the adult (see Appendix 6 for the instructions given to schools). Each new
player has to register first and in subsequent sessions log on by choosing their name
and using the password that only the adults in the school know. This way no child is
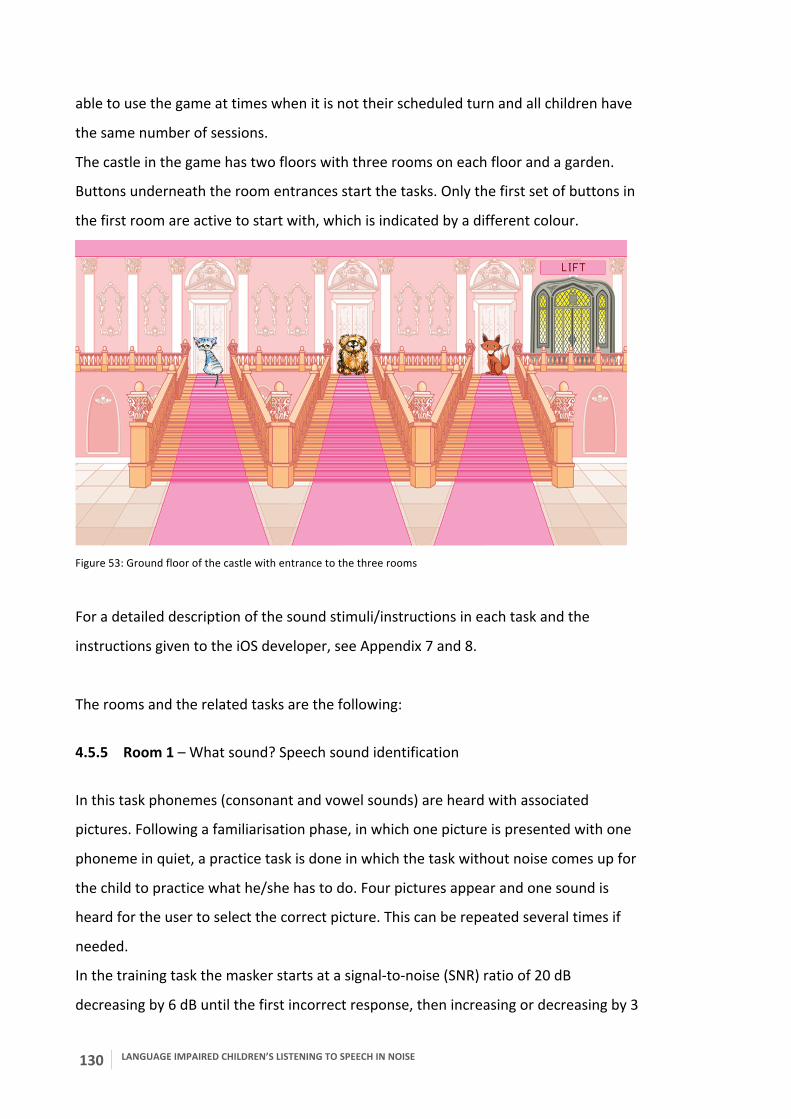
130 LANGUAGE IMPAIRED CHILDREN’S LISTENING TO SPEECH IN NOISE
able to use the game at times when it is not their scheduled turn and all children have
the same number of sessions.
The castle in the game has two floors with three rooms on each floor and a garden.
Buttons underneath the room entrances start the tasks. Only the first set of buttons in
the first room are active to start with, which is indicated by a different colour.
Figure 53: Ground floor of the castle with entrance to the three rooms
For a detailed description of the sound stimuli/instructions in each task and the
instructions given to the iOS developer, see Appendix 7 and 8.
The rooms and the related tasks are the following:
4.5.5 Room 1 – What sound? Speech sound identification
In this task phonemes (consonant and vowel sounds) are heard with associated
pictures. Following a familiarisation phase, in which one picture is presented with one
phoneme in quiet, a practice task is done in which the task without noise comes up for
the child to practice what he/she has to do. Four pictures appear and one sound is
heard for the user to select the correct picture. This can be repeated several times if
needed.
In the training task the masker starts at a signal-‐to-‐noise (SNR) ratio of 20 dB
decreasing by 6 dB until the first incorrect response, then increasing or decreasing by 3
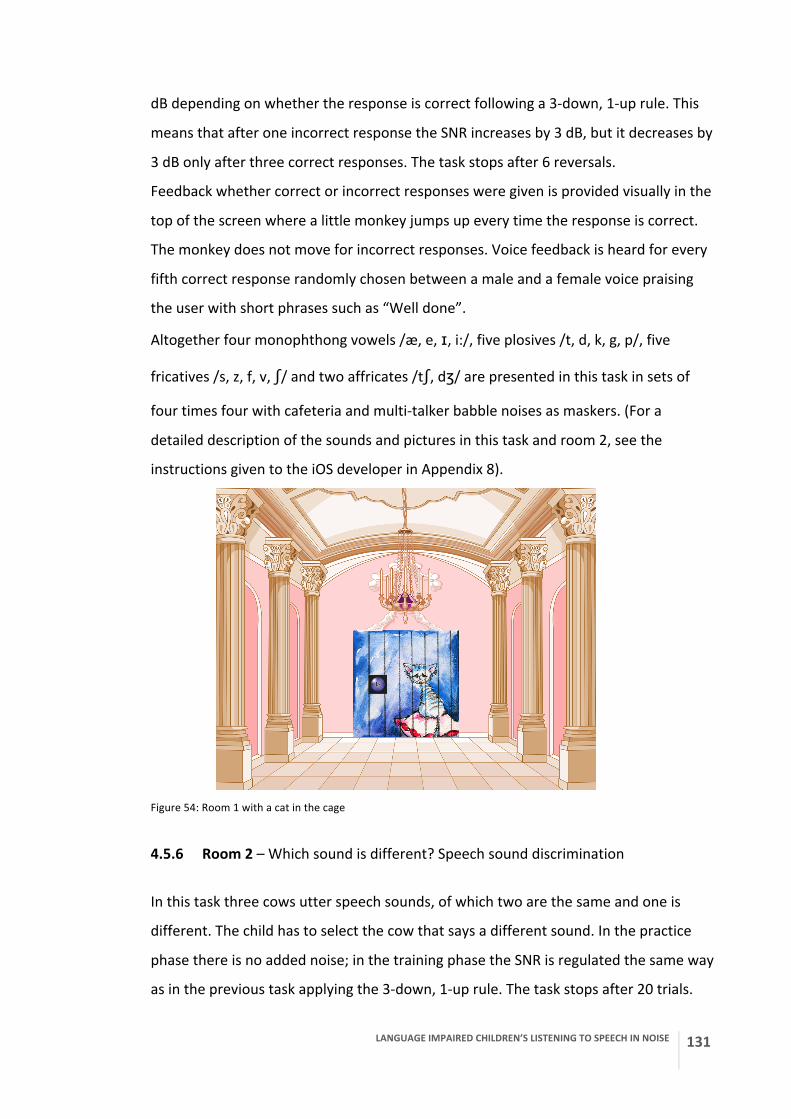
LANGUAGE IMPAIRED CHILDREN’S LISTENING TO SPEECH IN NOISE
131
dB depending on whether the response is correct following a 3-‐down, 1-‐up rule. This
means that after one incorrect response the SNR increases by 3 dB, but it decreases by
3 dB only after three correct responses. The task stops after 6 reversals.
Feedback whether correct or incorrect responses were given is provided visually in the
top of the screen where a little monkey jumps up every time the response is correct.
The monkey does not move for incorrect responses. Voice feedback is heard for every
fifth correct response randomly chosen between a male and a female voice praising
the user with short phrases such as “Well done”.
Altogether four monophthong vowels /æ, e, ɪ, i:/, five plosives /t, d, k, g, p/, five
fricatives /s, z, f, v, ʃ/ and two affricates /tʃ, dʒ/ are presented in this task in sets of
four times four with cafeteria and multi-‐talker babble noises as maskers. (For a
detailed description of the sounds and pictures in this task and room 2, see the
instructions given to the iOS developer in Appendix 8).
Figure 54: Room 1 with a cat in the cage
4.5.6 Room 2 – Which sound is different? Speech sound discrimination
In this task three cows utter speech sounds, of which two are the same and one is
different. The child has to select the cow that says a different sound. In the practice
phase there is no added noise; in the training phase the SNR is regulated the same way
as in the previous task applying the 3-‐down, 1-‐up rule. The task stops after 20 trials.

132 LANGUAGE IMPAIRED CHILDREN’S LISTENING TO SPEECH IN NOISE
The phonemes used are the same 16 phonemes as in task 1 and the first three triplets
are selected in such a way that the odd-‐one-‐out phoneme differs in two phonetic
aspects (voice and place or manner and place of articulation), while the remaining 17
odd-‐one-‐out phonemes differ in only one phonetic aspect (voice, place or manner, or
tongue position in case of vowels), thus requiring a greater listening effort for
discrimination.
The masker here is noise-‐vocoded speech using the same rules for SNR as in task 1.
No ‘correct’ or ‘incorrect’ feedback is given in this task, but after an incorrect response
the same stimulus triplet is repeated until a correct response is made.
Figure 55: Room 2 has a dog in the cage to free
4.5.7 Room 3 – This or that sound? Speech sound categorisation
In this task synthetic syllables are categorised by the child. The three pairs of syllables
are /bi: -‐ pi:/, /gəәʊt -‐ kəәʊt/ and /geɪt -‐ deɪt/ and the pictures of a bee or peas, a goat or
a coat and a gate or a date are selected. In the practice phase this is done without
added noise. Then the task in noise follows. The task stops after 30 trials.
The masker used is the cafeteria noise. The synthetic syllables were generated in the
following way:
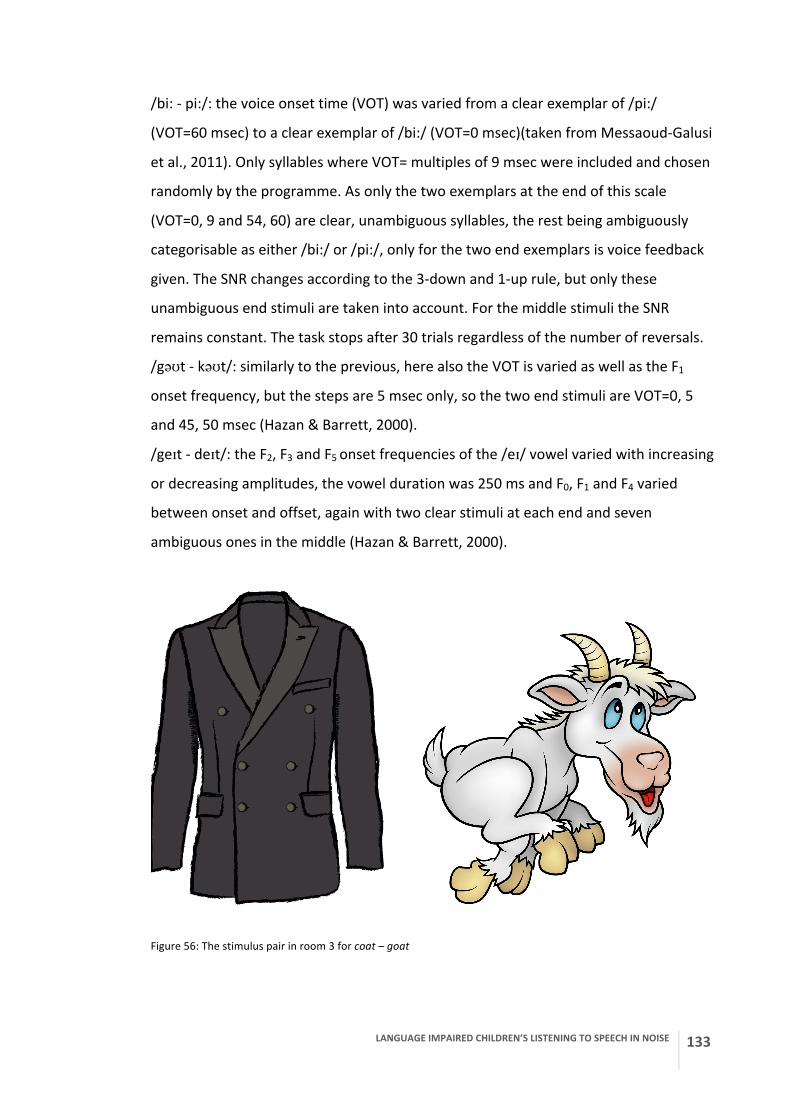
LANGUAGE IMPAIRED CHILDREN’S LISTENING TO SPEECH IN NOISE
133
/bi: -‐ pi:/: the voice onset time (VOT) was varied from a clear exemplar of /pi:/
(VOT=60 msec) to a clear exemplar of /bi:/ (VOT=0 msec)(taken from Messaoud-‐Galusi
et al., 2011). Only syllables where VOT= multiples of 9 msec were included and chosen
randomly by the programme. As only the two exemplars at the end of this scale
(VOT=0, 9 and 54, 60) are clear, unambiguous syllables, the rest being ambiguously
categorisable as either /bi:/ or /pi:/, only for the two end exemplars is voice feedback
given. The SNR changes according to the 3-‐down and 1-‐up rule, but only these
unambiguous end stimuli are taken into account. For the middle stimuli the SNR
remains constant. The task stops after 30 trials regardless of the number of reversals.
/gəәʊt -‐ kəәʊt/: similarly to the previous, here also the VOT is varied as well as the F1
onset frequency, but the steps are 5 msec only, so the two end stimuli are VOT=0, 5
and 45, 50 msec (Hazan & Barrett, 2000).
/geɪt -‐ deɪt/: the F2, F3 and F5 onset frequencies of the /eɪ/ vowel varied with increasing
or decreasing amplitudes, the vowel duration was 250 ms and F0, F1 and F4 varied
between onset and offset, again with two clear stimuli at each end and seven
ambiguous ones in the middle (Hazan & Barrett, 2000).
Figure 56: The stimulus pair in room 3 for coat – goat
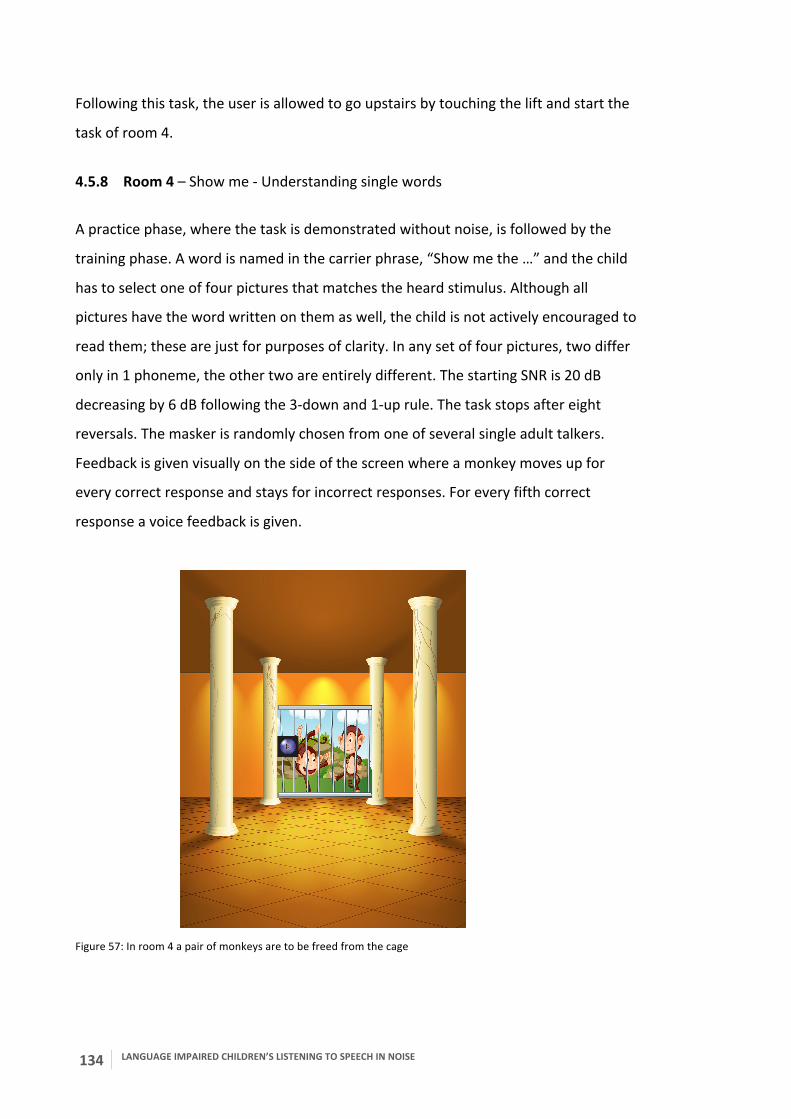
134 LANGUAGE IMPAIRED CHILDREN’S LISTENING TO SPEECH IN NOISE
Following this task, the user is allowed to go upstairs by touching the lift and start the
task of room 4.
4.5.8 Room 4 – Show me -‐ Understanding single words
A practice phase, where the task is demonstrated without noise, is followed by the
training phase. A word is named in the carrier phrase, “Show me the …” and the child
has to select one of four pictures that matches the heard stimulus. Although all
pictures have the word written on them as well, the child is not actively encouraged to
read them; these are just for purposes of clarity. In any set of four pictures, two differ
only in 1 phoneme, the other two are entirely different. The starting SNR is 20 dB
decreasing by 6 dB following the 3-‐down and 1-‐up rule. The task stops after eight
reversals. The masker is randomly chosen from one of several single adult talkers.
Feedback is given visually on the side of the screen where a monkey moves up for
every correct response and stays for incorrect responses. For every fifth correct
response a voice feedback is given.
Figure 57: In room 4 a pair of monkeys are to be freed from the cage
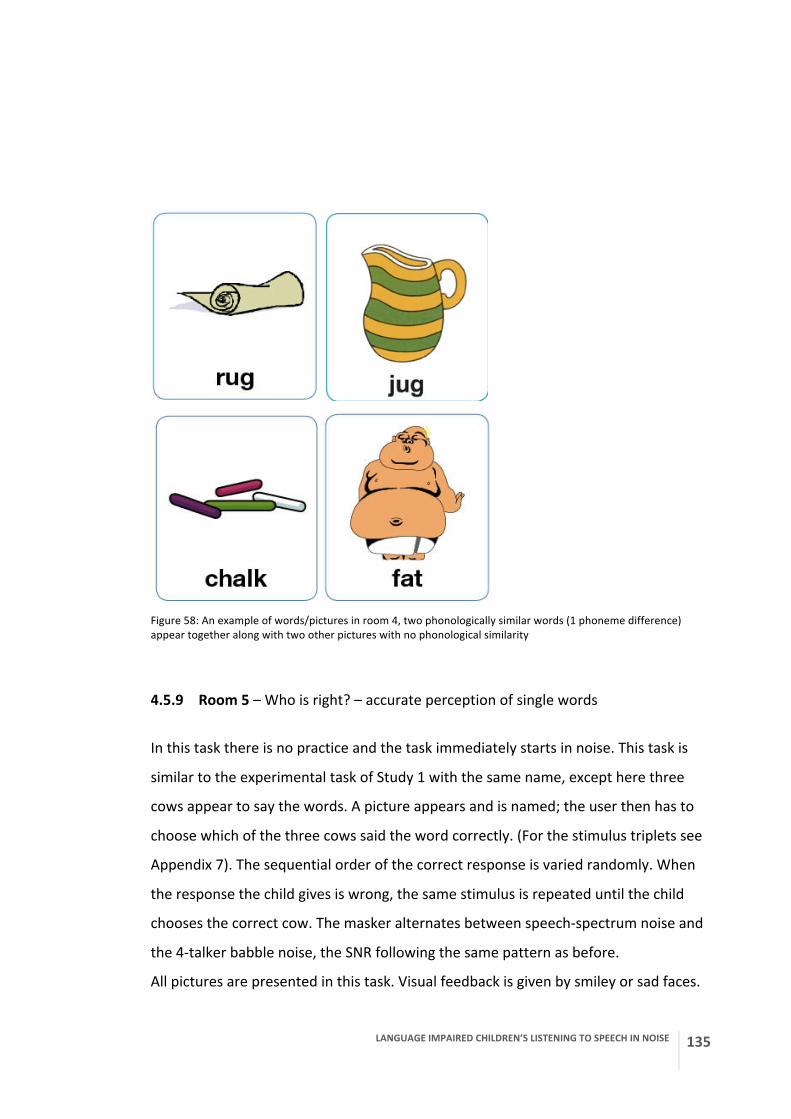
LANGUAGE IMPAIRED CHILDREN’S LISTENING TO SPEECH IN NOISE
135
Figure 58: An example of words/pictures in room 4, two phonologically similar words (1 phoneme difference) appear together along with two other pictures with no phonological similarity
4.5.9 Room 5 – Who is right? – accurate perception of single words
In this task there is no practice and the task immediately starts in noise. This task is
similar to the experimental task of Study 1 with the same name, except here three
cows appear to say the words. A picture appears and is named; the user then has to
choose which of the three cows said the word correctly. (For the stimulus triplets see
Appendix 7). The sequential order of the correct response is varied randomly. When
the response the child gives is wrong, the same stimulus is repeated until the child
chooses the correct cow. The masker alternates between speech-‐spectrum noise and
the 4-‐talker babble noise, the SNR following the same pattern as before.
All pictures are presented in this task. Visual feedback is given by smiley or sad faces.

136 LANGUAGE IMPAIRED CHILDREN’S LISTENING TO SPEECH IN NOISE
Figure 59: An example of the cow, three of which appear on one page and utter a word
4.5.10 Room 6 – Move them around – following instructions
In this task the child has to follow instructions and move objects/characters in a living
room to various locations or positions. Here there is no animal to free from a cage. The
aim is to place everything from the right hand side of the screen in the appropriate
position in the picture of a living room. (For the instructions see Appendix 7). The SNR
follows the same rule as in previous tasks and the masker is either single-‐channel
vocoded speech or children’s speech. The task stops after eight reversals or all the
instructions. There is no feedback in this task.
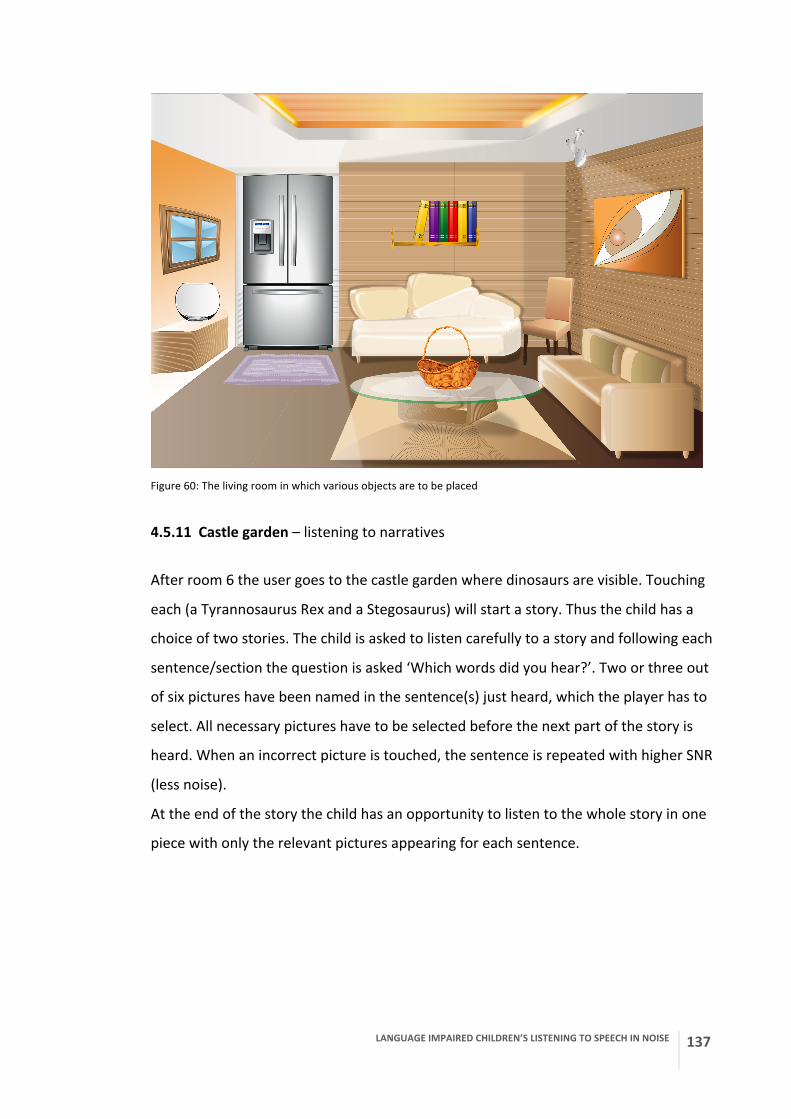
LANGUAGE IMPAIRED CHILDREN’S LISTENING TO SPEECH IN NOISE
137
Figure 60: The living room in which various objects are to be placed
4.5.11 Castle garden – listening to narratives
After room 6 the user goes to the castle garden where dinosaurs are visible. Touching
each (a Tyrannosaurus Rex and a Stegosaurus) will start a story. Thus the child has a
choice of two stories. The child is asked to listen carefully to a story and following each
sentence/section the question is asked ‘Which words did you hear?’. Two or three out
of six pictures have been named in the sentence(s) just heard, which the player has to
select. All necessary pictures have to be selected before the next part of the story is
heard. When an incorrect picture is touched, the sentence is repeated with higher SNR
(less noise).
At the end of the story the child has an opportunity to listen to the whole story in one
piece with only the relevant pictures appearing for each sentence.

138 LANGUAGE IMPAIRED CHILDREN’S LISTENING TO SPEECH IN NOISE
Figure 61: The castle garden with three dinosaurs out of which selecting the Stegosaurus or the Tyrannosaurus Rex will start one of the two stories With this the first cycle of all tasks has finished. One user has to go through all tasks in
this order three times before they can freely choose which one they wish to do. As one
session only lasts for 20 minutes, this is likely to happen only towards the end of the 6-‐
week training block.
4.6 Post-‐training assessments
Within a week following the completion of the six-‐week training all participants and
the waiting controls were administered the non-‐word repetition task (Vadey) and the
speech-‐perception task (CCRM). These were to gauge the immediate effects of the
training, which are expected to show first in the speech perceptual ability and from
there through immediate transfer in the ability to repeat non-‐words.
Then, in the follow-‐up assessment, which took place on average 15 weeks after the
training was completed (m=15.3, SD=5.2), the receptive and expressive language
assessments (TROG and CELF), the sustained attention task (TEA-‐Ch), the non-‐word
LANGUAGE IMPAIRED CHILDREN’S LISTENING TO SPEECH IN NOISE
139
repetition (Vadey) and the literacy test (TOWRE) were used to explore the retention
and generalisation of the potential gains following training.
4.7 Results
4.7.1 Shortcomings of the study
Organising the testing before and after the training and organising the training itself
proved to be an extremely difficult task for a single student as one has to rely heavily
on the cooperation of schools and their staff including the delivery of the training by
school staff. An MSc student, who tested the same children for his own study and an
undergraduate student temporarily employed by the department as a research
assistant were therefore involved in this study and were asked to do some of the
testing. Unfortunately, all these organisational challenges led to some inconsistencies
in data collection and some missing data.
Of the seven masker conditions used in study 2, four were selected as the speech
perception measures pre-‐ and post-‐intervention. These were the speech-‐spectrum
noise, the spectrally rotated, the low-‐pass filtered and the same-‐sex talker conditions.
All these were administered before and after the training in the training group and
after the training in the control group. Unfortunately, however, only data of the
spectrally rotated, opposite sex talker and the single-‐channel vocoded conditions are
available in the control group before the training. This means that the performance of
the control group in the two testings could only be compared in one condition. Taking
into account that only 6 children constituted the control group, this analysis would
have very little statistical power and it would not be possible to generalise the finding.
An attempt is therefore made to compare the previous results on the speech
perception tasks of both the training and control group participants to see whether an
improvement had taken place in the trained group over and above that attributable to
the time passed and natural maturation as well as the test – retest effect. The previous
results used were the CCRM data of Study 2.

140 LANGUAGE IMPAIRED CHILDREN’S LISTENING TO SPEECH IN NOISE
Another undesirable fact was that when the actually conducted training sessions were
added up, they amounted only to 3 hours and 43 minutes on average per child
(minimum=2 h 20 m, maximum=5 h 20 m, SD=0.73 h or 44 minutes). This significantly
falls short of the planned 6 hours of training, which almost certainly negatively
influenced the outcome of the study.
4.7.2 Effects on speech perception
The results of the CCRM speech-‐in-‐noise task in Study 2 were used as the baseline
measure. No significant difference was found between the two groups – trained and
controls -‐ in three of the four conditions, see Table 9.
Table 9: Results of t-‐test on the baseline measures of the trained and untrained groups
Condition t df p
Low-‐pass filtered 2.916 19 0.009
Spectrally rotated 1.534 19 0.142
Speech noise 1.057 20 0.303
Same-‐sex talker 0.714 19 0.484
Since the two groups differed in the low-‐pass filtered condition, possibly due to
sampling error or unsystematic variation, results were analysed only in the other three
conditions.
A repeated measures ANOVA was conducted to detect differences in the trained and
control groups between the first testing and the testing immediately following the
intervention, a 2 times x 2 groups x 3 CCRM conditions design.
This revealed no three-‐way interaction of time x group x condition (F=1.08, df=2,
p=0.349), but a significant interaction of time and condition (F=5.094, df=2, p=0.011)
meaning that the change from time 1 to time 2 differed between the three conditions.
It indicated no interaction of group and condition (F=0.21, df=2, p=0.812) so the
change – if any – differed in the three conditions in both groups, and no interaction of
time and group (F=0.122, df=1, p=0.730), which means the two groups did not change
differently from Time 1 (pre-‐training) to Time 2 (post-‐training). Unfortunately, this
result means that the trained group did not achieve any gains over and above those
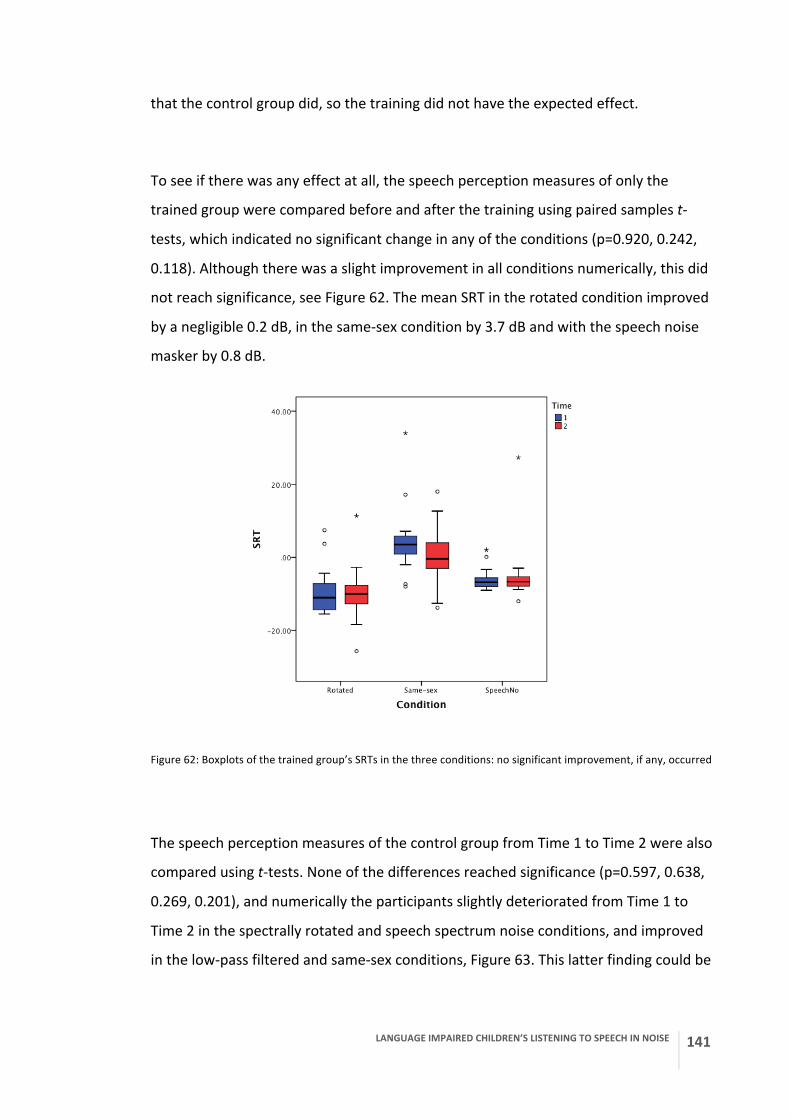
LANGUAGE IMPAIRED CHILDREN’S LISTENING TO SPEECH IN NOISE
141
that the control group did, so the training did not have the expected effect.
To see if there was any effect at all, the speech perception measures of only the
trained group were compared before and after the training using paired samples t-‐
tests, which indicated no significant change in any of the conditions (p=0.920, 0.242,
0.118). Although there was a slight improvement in all conditions numerically, this did
not reach significance, see Figure 62. The mean SRT in the rotated condition improved
by a negligible 0.2 dB, in the same-‐sex condition by 3.7 dB and with the speech noise
masker by 0.8 dB.
Figure 62: Boxplots of the trained group’s SRTs in the three conditions: no significant improvement, if any, occurred
The speech perception measures of the control group from Time 1 to Time 2 were also
compared using t-‐tests. None of the differences reached significance (p=0.597, 0.638,
0.269, 0.201), and numerically the participants slightly deteriorated from Time 1 to
Time 2 in the spectrally rotated and speech spectrum noise conditions, and improved
in the low-‐pass filtered and same-‐sex conditions, Figure 63. This latter finding could be
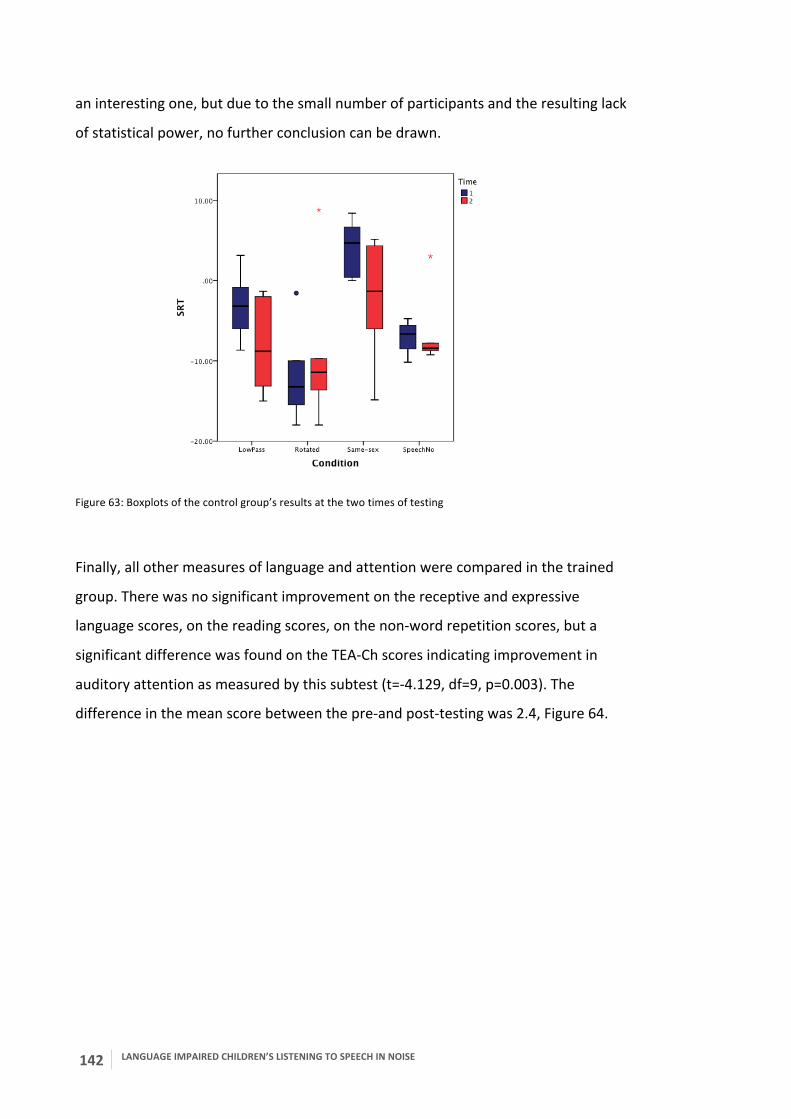
142 LANGUAGE IMPAIRED CHILDREN’S LISTENING TO SPEECH IN NOISE
an interesting one, but due to the small number of participants and the resulting lack
of statistical power, no further conclusion can be drawn.
Figure 63: Boxplots of the control group’s results at the two times of testing
Finally, all other measures of language and attention were compared in the trained
group. There was no significant improvement on the receptive and expressive
language scores, on the reading scores, on the non-‐word repetition scores, but a
significant difference was found on the TEA-‐Ch scores indicating improvement in
auditory attention as measured by this subtest (t=-‐4.129, df=9, p=0.003). The
difference in the mean score between the pre-‐and post-‐testing was 2.4, Figure 64.
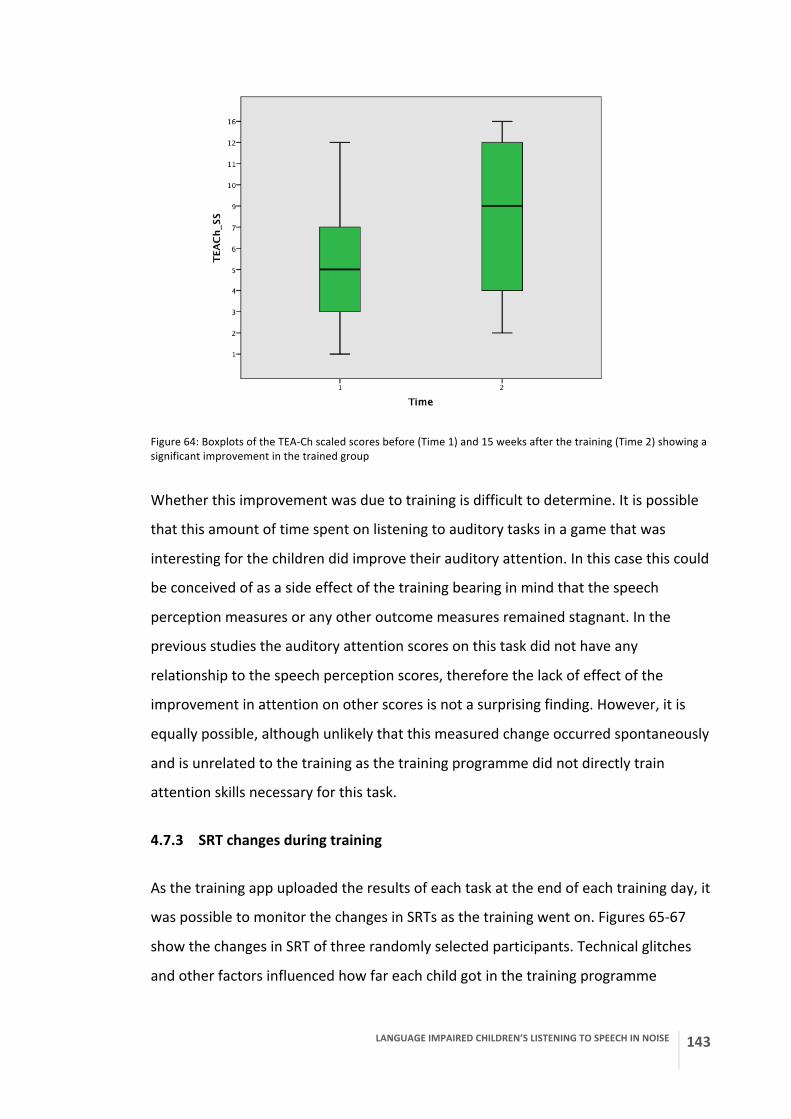
LANGUAGE IMPAIRED CHILDREN’S LISTENING TO SPEECH IN NOISE
143
Figure 64: Boxplots of the TEA-‐Ch scaled scores before (Time 1) and 15 weeks after the training (Time 2) showing a significant improvement in the trained group
Whether this improvement was due to training is difficult to determine. It is possible
that this amount of time spent on listening to auditory tasks in a game that was
interesting for the children did improve their auditory attention. In this case this could
be conceived of as a side effect of the training bearing in mind that the speech
perception measures or any other outcome measures remained stagnant. In the
previous studies the auditory attention scores on this task did not have any
relationship to the speech perception scores, therefore the lack of effect of the
improvement in attention on other scores is not a surprising finding. However, it is
equally possible, although unlikely that this measured change occurred spontaneously
and is unrelated to the training as the training programme did not directly train
attention skills necessary for this task.
4.7.3 SRT changes during training
As the training app uploaded the results of each task at the end of each training day, it
was possible to monitor the changes in SRTs as the training went on. Figures 65-‐67
show the changes in SRT of three randomly selected participants. Technical glitches
and other factors influenced how far each child got in the training programme
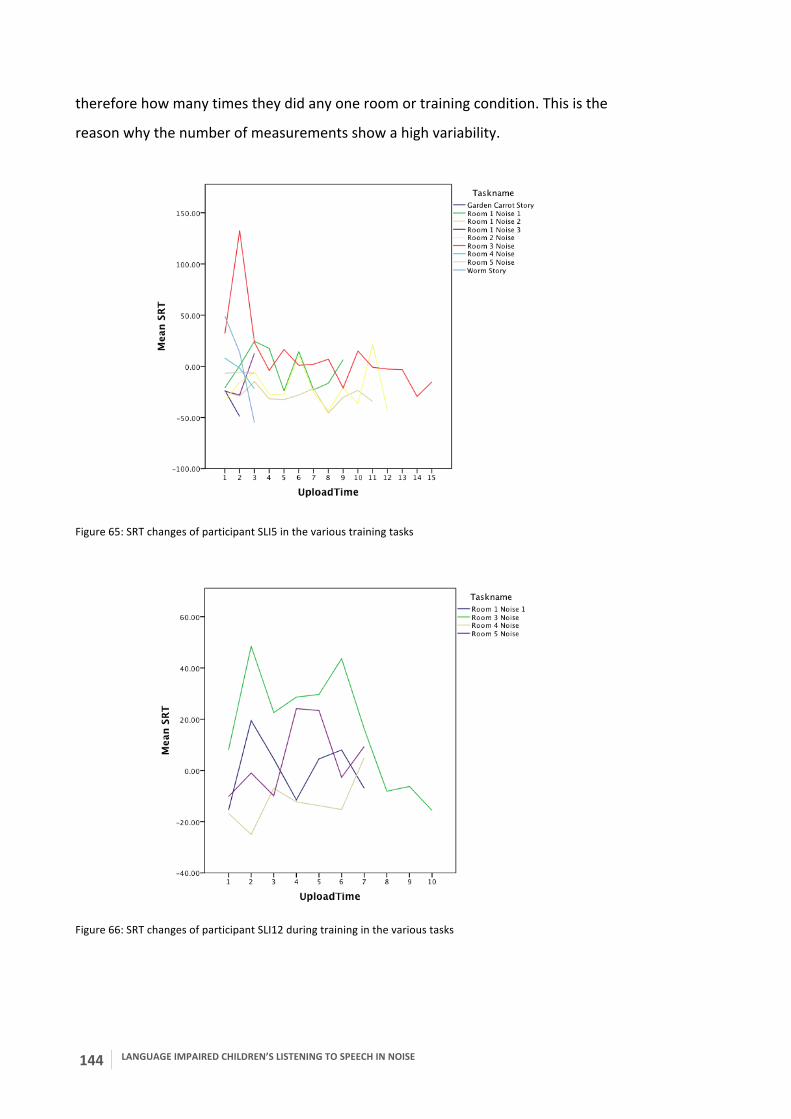
144 LANGUAGE IMPAIRED CHILDREN’S LISTENING TO SPEECH IN NOISE
therefore how many times they did any one room or training condition. This is the
reason why the number of measurements show a high variability.
Figure 65: SRT changes of participant SLI5 in the various training tasks
Figure 66: SRT changes of participant SLI12 during training in the various tasks

LANGUAGE IMPAIRED CHILDREN’S LISTENING TO SPEECH IN NOISE
145
Figure 67: SRT changes of participant SLI38 during training in the various tasks
No clearly discernible trend can be observed on these or any of the other participants’
results. The one definite trend is that the SRTs vary greatly as time goes by. However,
as gains are expected to be very small and hard to notice in each individual participant,
there is a higher chance of observing the overall trend as a result of training if the
results of all participants in each training task and each measurement was averaged.
Therefore mean SRTs were calculated for each measurement of each task taking into
consideration only those where at least four participants had a result. These are
plotted in Figure 68.

146 LANGUAGE IMPAIRED CHILDREN’S LISTENING TO SPEECH IN NOISE
Figure 68: Mean SRTs of all participants in each task
This time a clear trend towards improvement (lower SRT) is observable in all tasks
except Room 1 Noise 3, the Carrot Story and the Worm Story, where only two or three
measurements met the above conditions and were analysed.
The training programme, therefore, provided indirect evidence for improvement in
speech perception on the trained tasks as a result of training, even though this did not
generalise to the speech perception task used to measure potential gains. This finding
supports Halliday et al.’s (2012) finding of the lack of generalisation to untrained tasks
in typically developing children.
4.8 Discussion
Much work was invested in the planning and implementation of the training
programme described in this chapter, possibly more than the previous two studies
taken together. In spite of this, few tangible results have been achieved. The lack of
success of the auditory training could come from several factors.
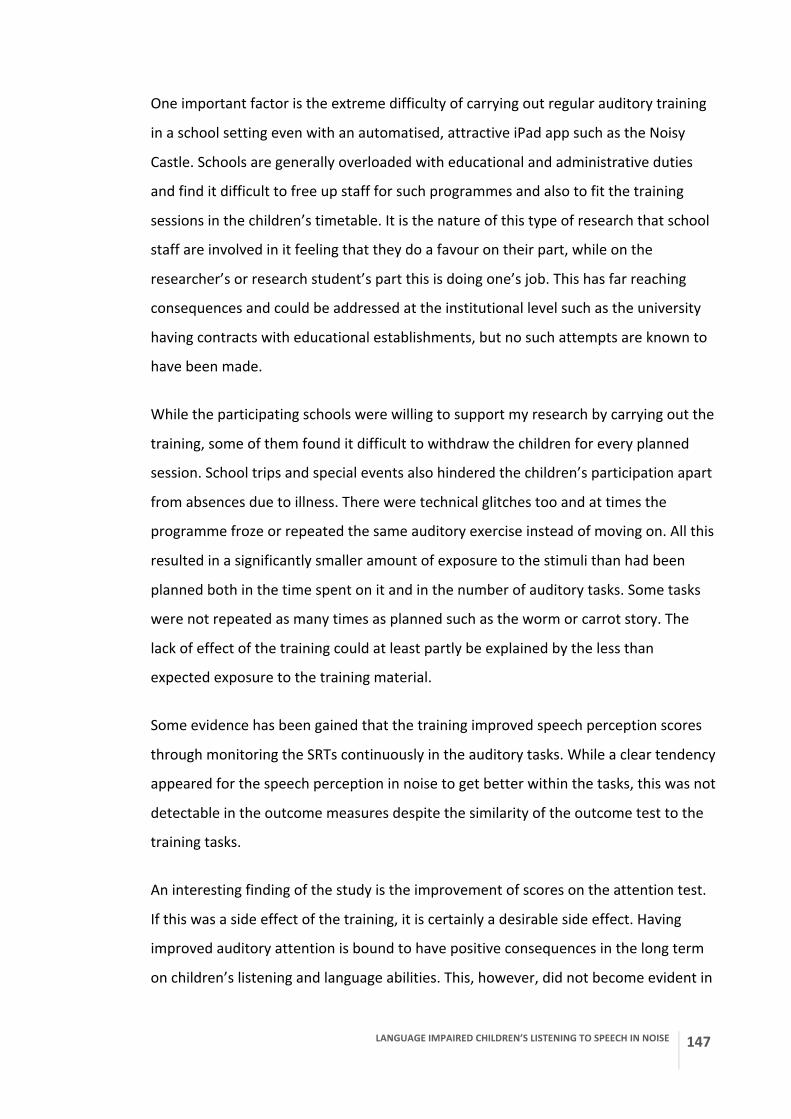
LANGUAGE IMPAIRED CHILDREN’S LISTENING TO SPEECH IN NOISE
147
One important factor is the extreme difficulty of carrying out regular auditory training
in a school setting even with an automatised, attractive iPad app such as the Noisy
Castle. Schools are generally overloaded with educational and administrative duties
and find it difficult to free up staff for such programmes and also to fit the training
sessions in the children’s timetable. It is the nature of this type of research that school
staff are involved in it feeling that they do a favour on their part, while on the
researcher’s or research student’s part this is doing one’s job. This has far reaching
consequences and could be addressed at the institutional level such as the university
having contracts with educational establishments, but no such attempts are known to
have been made.
While the participating schools were willing to support my research by carrying out the
training, some of them found it difficult to withdraw the children for every planned
session. School trips and special events also hindered the children’s participation apart
from absences due to illness. There were technical glitches too and at times the
programme froze or repeated the same auditory exercise instead of moving on. All this
resulted in a significantly smaller amount of exposure to the stimuli than had been
planned both in the time spent on it and in the number of auditory tasks. Some tasks
were not repeated as many times as planned such as the worm or carrot story. The
lack of effect of the training could at least partly be explained by the less than
expected exposure to the training material.
Some evidence has been gained that the training improved speech perception scores
through monitoring the SRTs continuously in the auditory tasks. While a clear tendency
appeared for the speech perception in noise to get better within the tasks, this was not
detectable in the outcome measures despite the similarity of the outcome test to the
training tasks.
An interesting finding of the study is the improvement of scores on the attention test.
If this was a side effect of the training, it is certainly a desirable side effect. Having
improved auditory attention is bound to have positive consequences in the long term
on children’s listening and language abilities. This, however, did not become evident in
148 LANGUAGE IMPAIRED CHILDREN’S LISTENING TO SPEECH IN NOISE
this study either because of the small amount of training or the short time between
improved attention and post-‐testing. If this improved attention translates into
practical, everyday attentional skills, which was not investigated in this study, this
would certainly be beneficial for children with poor attention. If even such a small
amount of training (3 hours 43 minutes on average) measurably improves attention,
such training could be and should be part of the management of attention difficulties.
For this further evidence would be necessary with more than one attention subtest.
This might be worth pursuing in the future.
For a potential intervention to replicate and correct the current one a similar training
regime should be used with strict guidelines on the time of exposure. It is not realistic
to increase the length of a training session, but it could either be delivered every day
as in other auditory training programmes such as FastForWord, or the period of
training could be longer than 6 weeks.
In any case computerised auditory training is only one of many possible interventions
and methods of remediating language difficulties. This study provides no evidence that
such an intervention is effective, but it also does not rule out that possibility. Any good
professional would only consider a computersied training programme as one of the
several interventions and therapeutic activities a child should be exposed to, not
anything to be used on its own. If used in conjunction with other appropriate
interventions and carefully selected therapy activities, computerised auditory training
may be a useful addition to the repertoire that could save time for the therapist and
keep a child interested.
LANGUAGE IMPAIRED CHILDREN’S LISTENING TO SPEECH IN NOISE
149
Chapter 5 Discussion
This study investigated speech perceptual skills in children with specific language
impairment as compared to typically developing children by investigating factors
contributing to atypical speech perception in the language impaired population.
Factors investigated were baseline auditory attention and sustained auditory attention
during tasks, categorical perception and the addition of different types of maskers to
speech including interfering speech, degraded speech and combinations of these. The
results were analysed to determine differences in typical and impaired language
development and to investigate the effect of age and attention on these parameters.
The deficits of SLI children’s speech perception in noise were further explored and the
types of noise that might cause a significant deterioration in perception was
investigated and related to other measures in the study.
Finally, an auditory training programme was designed and implemented with the aim
of ameliorating the deficits, but with limited success. Possible reasons for the failure of
the training programme have been discussed.
5.1 Attention across groups and age
An interesting finding of the first experiment regards the baseline attention levels of
SLI vs. TD children on the sustained auditory attention task. In this subtest of TEA-‐Ch
the sustained attention element is embedded in an interesting task that all the
children were seen to enjoy and perceive as a game. Children need to maintain
vigilance during this task, but response inhibition is also an important skill necessary
for this test. The automatic response after each tone has to be stopped at the last tone
immediately followed by the crashing sound that signals the end of the given ‘walk’.
Response inhibition has been found to be impaired in SLI (Henry, Messer & Nash,
2012). The test measures auditory attention, but it does not contain any speech or
linguistic elements, only non-‐speech noises. A significant difference was found
between the sustained attention level of children with and without language
impairment when results were compared to standardised data. This difference
between the groups disappeared, however, when the two groups were compared

150 LANGUAGE IMPAIRED CHILDREN’S LISTENING TO SPEECH IN NOISE
directly to each other, taking the TD children’s results as the norm. This latter finding
was confirmed by the second experiment, where no difference was identified between
two larger groups of TD and SLI children, even when compared to standardised data.
Although contradiction among research findings persists as to the specificity and type
of attention difficulties in SLI, a series of papers claim the existence of attention
deficits in SLI as compared to TD groups of children (see 1.2.9), a finding that has not
been corroborated by the present study. This confirms among others Spaulding et al.’s
(2008) results, who found a difference in children’s sustained auditory selective
attentional performance only under a condition of high attentional load, but not low
attentional load. One could argue that the TEA-‐Ch subtest used here does not place a
sufficiently high attentional load on the children, which is why the children with SLI
performed similarly to their TD peers. This is unlike listening to speech in adverse
conditions where the attentional load is significantly higher.
The proportion of incorrect responses to the catch trials in the CCRM task, however,
indicates a poorer ability in SLI to sustain auditory attention during a task that lasts a
few minutes. With the better, near ceiling performance, the TD group demonstrated
more efficient and stable auditory attention during the task than the SLI group.
This study was unable to directly verify possible claims that speech perception
difficulties in quiet or in noise could be a result of more general attention difficulties in
SLI even though there were indications that such difficulties may exist. While speech
perception in noise was found to be worse in SLI on most tasks, scores on these tasks
did not correlate with the measures of baseline or sustained attention during task. This
means that children with SLI had generally lower attention levels, but it was not
necessarily the worst attending children who had the worst speech perception scores.
This conclusion, unfortunately, leaves several questions unanswered.
5.2 Speech perception in noise
Results of the present study confirmed several times that SLI children performed more
poorly than TD children when perceiving speech in noise. Initial evidence came from
the Who is right? task in the first experiment. Not only did the SLI group achieve higher
thresholds (less noise tolerated), but they were also less consistent with more
LANGUAGE IMPAIRED CHILDREN’S LISTENING TO SPEECH IN NOISE
151
fluctuation in their performance. It can be argued that the source of this may be
fluctuating attention levels in the SLI group, as seen above, from which indirectly
follows that the observed speech perception deficits in noise may be attributable, at
least in part, to attention deficits.
Results of the CCRM task of study 2 indicated significant group differences in all three
conditions: in the speech-‐spectrum noise, the modulated speech-‐noise and the
interfering talker condition. The difference was the most marked with the interfering
talker masker where a subgroup of the SLI group with significant deficit (SLI+SPD) did
not show improvement with age, while all others did. This is in line with Ziegler at al.’s
(2005) results.
Interpreted in the context of Lyall’s (2009) findings about the development of speech
perceptual skills from childhood to adulthood, the implications of this result could be
the following. Lyall, whose results confirmed previous findings by Barwell (2006), Hall,
Grose, Buss and Dev (2002) and Wightman and Kistler (2005), found that children
differed most from adults when the masker was an the interfering speaker. Children
tolerated the least noise in this condition, while adults tolerated the most. Our present
finding appears to mirror this relationship between SLI and TD children’s perceptual
skills. The authors above attribute the difference between children and adults to the
difference in the maturity of the auditory system. They claim that the stronger effect
of informational masking in children might be a result of poorer attentional abilities,
inefficient processing ability and limitations on top down linguistic processes (Lyall,
2009; Hall et al., 2002; Wightman & Kistler, 2005). From this it follows that a general
immaturity or delayed maturation of auditory skills and selective attention as well as
poor use of top down processes may play a role in the speech perceptual difficulties
SLI children experience.
An effect of age was found in all conditions in the TD group and the SLI subgroup
without speech perception deficit (SLI-‐SPD). All these children performed better if they
were older. This confirms previous findings by Hall et al. (2002), who found
improvement of SRTs from 5 to 10 years of age for the speech-‐spectrum noise masker
in TD children; Wightman and Kistler (2005), who showed that performance in the
152 LANGUAGE IMPAIRED CHILDREN’S LISTENING TO SPEECH IN NOISE
presence of a speech masker improved over age in typical development and Lyall
(2009), who found improvement on all three masker conditions from ages 4;8 to 11;1
years, albeit at different rates. In our study SLI children with a significant speech
perception deficit (SLI+SPD), however, did not appear to improve as they got older.
The speech-‐spectrum noise used both in the Who is right? and the CCRM tasks yielded
a significant group difference and no improvement with age. The group difference was
due to a subgroup of the SLI children with a significant deficit, while other SLI
participants performed in line with their TD counterparts. This pattern was generally
reflected in other conditions as well, with the exception that in all other conditions
there was an improvement with age. However, the subgroup of the SLI group that had
a significant deficit, the SLI+SPD, usually did not show an age effect.
An interesting observation based on our current data is the order of the tolerated
noise level in the groups and the varying group differences that depended on the
condition. Based on these the observation is that the most marked difference between
the groups was in conditions with intelligible maskers both is the first and the second
study. The lowpass filtered condition caused the greatest deficit in SLI, but equally
large were the differences in the monotone, opposite-‐sex and same-‐sex talker
conditions. With unintelligible maskers the group differences were still significant, but
not as marked as before. The pattern of difficulty in SLI suggests that the deficit may
not be with perception itself, but with top-‐down cognitive processes. Such cognitive
skills are auditory stream segregation based on auditory attention, selective attention
as well as auditory object formation.
5.3 Categorical perception
This study found no difference between children with impaired and typical language
development in the identification of phonemes on the [pi: -‐ bi:] continuum, a result
consistent with Robertson et al. (2009). The only factor that played a role in the
consistency with which children labelled phonemes was their age. The older children
were, the more accurate their identification of the phonemes was. This is consistent
with findings that phoneme identification becomes more acute and continuously
matures in the course of development (Hazan & Barrett, 2000). The phoneme
LANGUAGE IMPAIRED CHILDREN’S LISTENING TO SPEECH IN NOISE
153
boundary occurred at or near adult values in both groups. This was not consistent with
Flege and Eefting’s (1986) finding, who detected a difference in the phoneme
boundary of stop consonants between children and adults, and Ohde and Scharf’s
(1988), who found the same for liquids.
5.4 Conclusion
Results from the present study support the following conclusions:
Children with specific language impairment perceive speech in some types of noise
with more difficulty than typically developing children. This appears as higher speech
reception thresholds, i.e. less noise tolerated for a given level of performance. This is
particularly marked when the noise is an interfering single talker, where the difference
in tolerable noise levels is as high as 10 dB between typically developing and
specifically language impaired groups of children. While an in-‐depth explanation for
this is yet to be found, possible reasons offered could be a maturational delay of the
auditory system and selective attention, parallel to such differences between TD
children and adults. Another reason could be the inefficient use of top-‐down processes
in SLI as opposed to typical development. Regardless of the causes, and its causality in
the emergence and evolution of SLI, however, the clinical and educational implications
of this result are far-‐reaching. Not only is it necessary for clinicians and teachers to be
aware of such difficulties when planning intervention strategies for these children, but
also adaptation of the classroom environment and teaching styles should be guided by
this knowledge.
There is no significant impairment in phonemic categorisation ability of SLI children
contrary to claims that this may be behind this developmental disorder. This is in line
with findings on dyslexic children’s phonemic categorisation skills (Messaoud-‐Galusi et
al., 2011). In this ability, SLI children appear to follow a similar developmental
trajectory as TD children.
Sustained auditory attention skills of children with SLI fall behind those of TD children.
This could be a result of a complex difficulty including attention itself and response
inhibition. It has been demonstrated that SLI children’s auditory attention is more
154 LANGUAGE IMPAIRED CHILDREN’S LISTENING TO SPEECH IN NOISE
fluctuating, less consistent and generally at a lower level during auditory tasks than
that of TD children. Direct correlation between attention and speech perception skills
could not be established, but there are indirect indications that point towards the
important role of attentional factors in speech perceptual ability.
It appears that children with SLI do have some deficit of auditory attention. They also
have speech perception deficits, but this has only been detected when listening to
speech in noise. A better understanding of the pattern of these deficits, their
interaction and causal relationships will help clinicians to plan more efficient
intervention strategies and educational establishments and parents to better design
the environment in which SLI children’s communication development can be
optimised.

LANGUAGE IMPAIRED CHILDREN’S LISTENING TO SPEECH IN NOISE
155
References
. Pp. 528. 45s. Anrep, A. (2011). Using catch trials to assess the role of attention in tests of speech perception for children. University College London, BSc Speech Sciences. Project supervised by Professor Stuart Rosen.
Archibald, L. & Gathercole, S. (2006). Short-‐term and working memory in specific language impairment. International Journal of Language and Communication Disorders 41:675-‐693.
Archibald, L. & Joanisse, M. (2009). On the sensitivity and specificity of nonword repetition and sentence recall to language and memory impairments in children. Journal of Speech, Language and Hearing Research 52:899-‐914.
Baddeley, A. & Hitch, G. (1974). Working memory. In: G. A. Bower (Ed.), The Psychology of Learning and Motivation. pp. 47-‐90. New York: Academic Press
Baddeley, A., Gathercole, S. & Papagno, C. (1998). The phonological loop as a language learning device. Psychological Review 105:158-‐173.
Baddeley, A. (2000). The episodic buffer: A new component of working memory? Trends in Cognitive Sciences 4:417-‐423.
Barwell, J. (2006). Listening to speech with interfering sounds. University College London, BSc Speech Sciences. Project supervised by Professor Stuart Rosen.
Bellis, T.J., Chermak, G.D., Weihing, J. & Musiek, F.E. (2012). Efficacy of auditory interventions for central auditory processing disorder: A response to Fey et al. (2011). Language, Speech and Hearing Services in Schools 43:381-‐386.
Bernstein, L. E. & Stark, R. E. (1985). Speech perception development in language-‐impaired children: a 4-‐year follow-‐up study. Journal of Speech and Hearing Disorders 50:21-‐30.
Bird, H., Franklin, S. & Howard, D. (2001). Age of acquisition and imageability ratings for a large set of words, including verbs and function words. Behaviour Research Methods, Instruments & Computers 1:73-‐79.
Bishop, D. (1997). Uncommon Understanding. Development and Disorders of Language Comprehension in Children. Hove: Psychology Press
Bishop, D., North, T. & Donlan, C. (1996). Nonword repetition as a behavioural marker for inherited language impairment: Evidence from a twin study. Journal of Child Psychology and Psychiatry and Allied Disciplines 37:391-‐403.
Bishop, D., Carlyon, R.P., Deeks, J.M. & Bishop, S.J. (1999). Auditory temporal processing impairment:neither necessary nor sufficient for causing language impairment in children. Journal of Speech, Language and Hearing Research 42:1295-‐1310.
Bishop, D. (2003). Test for Reception of Grammar Version 2. London: The Psychological Corporation

156 LANGUAGE IMPAIRED CHILDREN’S LISTENING TO SPEECH IN NOISE
Bishop, D. & Snowling, M. (2004). Developmental dyslexia and specific language impairment: same or different? Psychological Bulletin 134:858-‐886.
Bishop, D., McDonald, D., Bird, S. & Hayiou-‐Thomas, M. (2009). Children who read words accurately despite language impairment: Who are they and how do they do it? Child Development 80:593-‐605.
Bishop, D., Clark, B., Conti-‐Ramsden, G., Norbury, C. & Snowling, M. (2012). RALLI: An internet campaign for raising awareness of language learning impairments. Child Language Teaching and Therapy 28:259-‐262.
Bishop, D. (2014). Uncommon Understanding. Development and Disorders of Language Comprehension in Children. Hove: Psychology Press
Blesser, B. (1972). Speech perception under conditions of spectral transformation: I. Phonetic characetristics. Journal of Speech and Hearing Research 15:5-‐41.
Bolia, R. S., Nelson, W. T., Ericson, M. A. & Simpson, B. D. (2000). A speech corpus for multitalker communications research. Journal of the Acoustical Society of America 107:1065-‐1066.
Bortolini, U. & Leonard, L. B. (2000). Phonology and children with specific language impairment: status of structural constraints in two languages. Journal of Communication Disorders 33:131–150.
Briscoe, J. & Rankin, P. (2009). Exploration of a ‘Double-‐Jeopardy’ hypothesis within working memory profiles for children with specific language impairment. International Journal of Language and Communication Disorders 44:236-‐250.
Brungart, D. S. (2001). Informational and energetic masking effects in the perception of two simultaneous talkers. Journal of the Acoustical Society of America 109:1101-‐1109.
Brungart, D., Simpson, B., Ericson, M. & Scott, K. (2001). Informational and energetic masking effects in the perception of multiple simultaneous talkers. Journal of the Acoustical Society of America 110:2527-‐2538.
Burlingame, E., Sussman, H. M., Gillam, R.B. & Hay, J. F. (2005). An investigation of speech perception in children with specific language impairment on a continuum of formant transition duration. Journal of Speech, Language and Hearing Research 48:805-‐816.
Byrne, D., Dillion, H., Tran, K., Arlinger, S., Wilbraham, K., Cox, R., Hagerman, B., Hetu, R., Kei, J., Lui, C., Kiessling, J., Kotby, M. N., Nasser, N. H. A., El Kholy, W., Nakanishi, Y., Oyer, H., Powell, R., Stephens, D., Meredith, R., Sirimanna, T., Tavartkiladze, G., Fronlenkov, G., Westerman, S. & Ludvigsen, C. (1994). An international comparison of long-‐term average speech spectra. Journal of the Acoustical Society of America 96:2108-‐2120.
Catts, H. W., Adlof, S. M., Hogan, T. P. & Weismer, S. E. (2005). Are specific language impairment and dyslexia distinct disorders? Journal of Speech, Language and Hearing Research 48:1378-‐1396.
Chiat, S. (2001). Mapping theories of developmental language impairment: premises, predictions, and evidence. Language and Cognitive Processes 16:113–142.
LANGUAGE IMPAIRED CHILDREN’S LISTENING TO SPEECH IN NOISE
157
Coady, J. A., Kluender, K. R. & Evans, J. L. (2005). Categorical perception of speech by children with specific language impairments. Journal of Speech, Language and Hearing Research 48:944-‐959.
Coady, J. A., Evans, J. L., Mainela-‐Arnold, E. & Kluender, K. R. (2007). Children with specific language impairment perceive speech most categorically when tokens are natural and meaningful. Journal of Speech, Language and Hearing Research 50:41-‐57.
Collet, G., Colin, C., Serniclaes, W., Hoonhorst, I., Markessis, E., Deltenre, P. & Leybaert, J. (2012). Effect of phonological training in French children with SLI: Perspectives on voicing identification, discrimination and categorical perception. Research in Developmental Disabilities 33:1805-‐1818.
Conti-‐Ramsden, G. & Botting, N. (1999). Classification of children with specific language impairment: Longitudinal considerations. Journal of Speech, Language and Hearing Research 42:1195-‐1204.
Conway, A., Cowan, N. & Bunting, M. (2001). The cocktail party phenomenon revisited: The importance of working memory capacity. Psychonomic Bulletin and Review 8:331-‐335.
Cowan, R., Donlan, C., Newton, E. J. & Lloyd, D. (2005). Number skills and knowledge in children with specific language impairment. Journal of Educational Psychology 97:732-‐744.
Davis, M., Johnsrude, I., Hervais-‐Adelman, A., Taylor, K. & McGettigan, C. (2005). Lexical information drives perceptual learning of noise-‐vocoded speech. Journal of Experimental Psychology:General 134:222-‐241.
Dockrell, J. E., Messer, D., George, R. & Wilson, G. (1998). Children with word-‐finding difficulties – prevalence, presentation and naming problems. International Journal of Language and Communication Disorders 33:445-‐454.
Dollaghan, C. (1987). Fast mapping in normal and language-‐impaired children. Journal of Speech and Hearing Disorders 52:218-‐222.
Dudley, H. (1939). Remaking speech. The Journal of the Acoustical Society of America 11:169-‐177.
Ebert, K. D. & Kohnert, K. (2011). Sustained attention in children with primary language impairment: A meta-‐analysis. Journal of Speech, Language and Hearing Research 54:1372-‐1384.
Eisenson, J. (1968). Developmental dysphasia (dyslogia): A postulation of a unitary concept of the disorder. Cortex 4:184-‐200.
Evans, J., Viele, K., Kass, R. & Tang, F. (2002). Grammatical morphology and perception of synthetic and natural speech in children with specific language impairments. Journal of Speech, Language and Hearing Research 45:494-‐504.
Festen, J. & Plomp, R. (1990). Effects of fluctuating noise and interfering speech on the speech-‐reception threshold for impaired and normal hearing. Journal of the Acoustical Society of America 88:1725-‐1737.
158 LANGUAGE IMPAIRED CHILDREN’S LISTENING TO SPEECH IN NOISE
Fey, M.E., Richard, G.J., Geffner, D., Kamhi, A.G., Medwetsky, L., Paul, D., Ross-‐Swain, D., Wallach, G.P., Frymark, T. & Schooling, T. (2011). Auditory processing disorder and auditory/language interventions: An evidence-‐based systematic review. Language, Speech and Hearing Services in Schools 42:246-‐264.
Fey, M.E., Kamhi, A.G. & Richard, G.J. (2012). Auditory training for children with auditory processing disorder and language impairment: A response to Bellis, Chermak, Weihing and Musiek. Language, Speech and Hearing Services in Schools 43:387-‐392.
Filippini, R., Befi-‐Lopes, D.M. & Schochat, E. (2012). Efficacy of auditory training using the auditory brainstem response to complex sounds: Auditory processing disorder and specific language impairment. Folia Phoniatrica et Logopaedica 64:217-‐226.
Finneran, D., Francis, A. & Leonard, L. (2009). Sustained attention in children with specific language impairment. Journal of Speech, Language and Hearing Research 52:915-‐929.
Flege, J. E., Eefting, W. (1986). Linguistic and developmental effects on the production and perception of stop consonants. Phonetica 43:155-‐171.
Fletcher, H. & Galt, R. (1950). The perception of speech and its relation to telephony. Journal of the Acoustic Society of America 22:89-‐151.
French, N. & Steinberg, J. (1947). Factors governing the intelligibility of speech sounds. Journal of the Acoustic Society of America 19:90-‐119.
Fromkin, R., Rodman, R. & Hyams, N. (2007). An Introduction to Language. 8th Edition. USA: Thomson Wadsworth
Gall, F. J. (1835). Organology. Boston: Marsh, Capen & Lyon. p. 24, translated by Winslow Lewis
Gathercole, S. E. & Baddeley, A. D. (1990). Phonological memory deficits in language disordered children – Is there a causal connection? Journal of Memory and Language 29:336-‐360.
Gathercole, S. E. & Baddeley, A. D. (1996). The children’s test of nonword repetition. London: The Psychological Corporation
Grube, M., Cooper, F., Kumar, S., Kelly, T. & Griffiths, T. (2014). Exploring the role of auditory analysis in atypical compared to typical language development. Hearing Research 308:129-‐140.
Hall, J. W. III, Grose, J. H. , Buss, E. & Dev, M. B. (2002). Spondee recognition in a two-‐talker masker and a speech-‐shaped noise masker in adults and children. Ear and Hearing 23:159-‐165.
Halliday, L., Taylor, J., Millward, K. & Moore, D. (2012). Lack of generalization of auditory learning in typically developing children. Journal of Speech, Language and Hearing Research 55:168-‐181.
Halliday, L. (2014). A tale of two studies on auditory training in children: A response to the claim that ‘Discrimination training of phonemic contrasts enhances phonological processing in mainstream school children’ by Moore, Rosenberg and Coleman (2005). Dyslexia 20:101-‐118.
LANGUAGE IMPAIRED CHILDREN’S LISTENING TO SPEECH IN NOISE
159
Hanson, R. & Montgomery, J. (2002). Effects of general processing capacity and sustained selective attention on temporal processing performance of children with specific language impairment. Applied Psycholinguistics 23:75-‐93.
Hazan, V. & Barrett, S. (2000). The development of phonemic categorization in children aged 6-‐12. Journal of Phonetics 28:377-‐396.
Hazan, V., Messaoud-‐Galusi, S., Rosen, S., Nouwens, S. & Shakespeare, B. (2009). Speech perception abilities of adults with dyslexia: Is there any evidence for a true deficit? Journal of Speech, Language and Hearing Research 52:1510-‐1529.
Helzer, J.R., Champlin, C.A. & Gillam, R.B (1996). Auditory temporal resolution in specifically language-‐impaired and age-‐matched children. Perceptual and Motor Skills 83: 1171-‐1181.
Henry, L.A., Messer, D.J. & Nash, G. (2012). Executive functioning in children with SLI. Journal of Child Psychology and Psychiatry 53:37-‐45.
Hick, R., Botting, N. & Conti-‐Ramsden, G. (2005). Cognitive abilities in children with specific language impairment: Consideration of visuo-‐spatial skills. International Journal of Language and Communication Disorders 40:137-‐149.
Hill, E. (2001). Non-‐specific nature of specific language impairment: A review of the literature with regard to concomitant motor impairments. International Journal of Language and Communication Disorders 36:149-‐171.
Howard-‐Jones, P. & Rosen, S. (1993). Uncomodulated glimpsing in “checkerboard” noise. Journal of the Acoustic Society of America 93:2915-‐2922.
Im-‐Bolter, N., Jonhson, J. & Pascual-‐Leone, J. (2006). Processing limitations in children with specific language impairment: The role of executive function. Child Development 6:1822-‐1841.
Jackson, E., Leitao, S. & Claessen, M. (2015). The relationship between phonological short-‐term memory, receptive vocabulary and fast mapping in children with specific language impairment. International Journal of Language and Communication Disorders p. 1-‐13. Article in Press
Joanisse, M. F. & Seidenberg, M. S. (1998). Specific language impairment: a deficit in grammar or processing? Trends in Cognitive Sciences 2:240-‐247.
Johnston, J. & Smith, L. (1989). Dimensional thinking in language impaired children. Journal of Speech and Hearing Research 32:33-‐38.
Klatt, D. H. (1980). Software for A Cascade-‐Parallel Formant Synthesizer. Journal of the Acoustical Society of America, 67, 971-‐995.
Kluender, K.R. (1994). Speech perception as a tractable problem in speech science. In: M.A. Gernsbacher (Ed.) Handbook of Psycholinguistics. San Diego, CA:Academic Press
Kohnert, K. (2010). Bilingual children with primary language impairment: Issues, evidence and implications for clinical actions. Journal of Communication Disorders 43:456-‐473.
Leonard, L. (1982). Phonological deficits in children with developmental language impairment. Brain and Language 16:73-‐86.
160 LANGUAGE IMPAIRED CHILDREN’S LISTENING TO SPEECH IN NOISE
Leonard, L., Schwartz, R., Allen, G., Swanson, L. & Loeb, D. F. (1989). Unusual phonological behaviour and the avoidance of homonymy in children. Journal of Speech and Hearing Research 32:583-‐590.
Leonard, L., McGregor, K. & Allen, G. (1992). Grammatical morphology and speech perception in children with specific language impairment. Journal of Speech and Hearing Research 35:1076-‐1085.
Leonard, B. L. (1998). Children with Specific Language Impairment. Cambridge: MIT Press.
Leonard, B. L. (2000). Specific language impairment across languages. In Bishop, D. & Leonard, B. L. (Eds.), Speech and Language Impairments in Children. Hove:Psychology Press
Leonard, E., Dromi, E., Adam, G. & Zadunaisky-‐Ehrlich, S. (2000). Tense and finiteness in the speech of children with specific language impairment acquiring Hebrew. International Journal of Language and Commuication Disorders 35:319-‐335.
Leonard, B. L. & Weber-‐Fox, C. (2012). Specific Language Impairment: Processing Deficits in Linguistic, Cognitive and Sensory Domains. Book chapter in: The Handbook of the Neuropsychology of Language. Blackwell Publishing p. 826-‐846
Leonard, B. L. (2014). Children with Specific Language Impairment. 2nd Edition. Cambridge: MIT Press.
Levitt, H. (1971). Transformed up-‐down methods in psychoacoustics. The Journal of the Acoustical Society of America 467-‐477.
Leybaert, J., Macchi, L., Huyse, A., Champoux, F., Bayard, C., Colin, C. & Berthommier, F. (2014). Atypical audio-‐visual speech perception and McGurk effect in children with specific language impairment. Frontiers of Psychology 5:1-‐14.
Lisker, L. & Abramson, A. (1970). The voicing dimension: Some experiments in comparative phonetics. In: Hala, B., Romportl, M. & Janota, P. (Eds.), Proceedings of the Sixth International Congress of Phonetic Sciences, Prague, 1967 (pp. 569-‐573. Prague, Czechoslovakia: Academia
Loo, J., Bamiou, D., Campbell, N. & Luxon, L. (2010). Computer-‐based auditory training (CBAT): benefits for children with language-‐and reading-‐related difficulties. Developmental Medicine and Child Neurology 52:708-‐716.
Loo, J., Rosen, S. & Bamiou, D. (2015). Auditory training effects on the listening skills of children with auditory processing disorder. Ear & Hearing 37:38-‐47.
Luchsinger, R. & Arnold, G. E. (1959). Lehrbuch der Stimm-‐ und Sprachheilkunde. Vienna: Springer. p. 25
Lum, J., Conti-‐Ramsden, G. &Lindell, A. (2007). The attentional blink reveals sluggish attentional shifting in adolescents with specific language impairment. Brain and Cognition 63:287-‐295.
Lyall, Z. (2009). Development through childhood of perceptual skills in listening to speech in the presence of other sounds. University College London, BSc Speech Sciences. Project supervised by Professor Stuart Rosen.
LANGUAGE IMPAIRED CHILDREN’S LISTENING TO SPEECH IN NOISE
161
Maillart, C. & Parisse, C. (2006). Phonological deficits in French speaking children with SLI. International Journal of Language and Communication Disorders 41:253-‐274.
Manly, T., Robertson, I., Anderson, V. & Nimmo-‐Smith, I. (1998). Test of Everyday Attention for Children. London: Harcourt Assessment
Manly, T., Nimmo-‐Smith, I., Watson, P., Anderson, V., Turner, A. & Robertson, I. (2001). The Differential Assessment of Children’s Attention: The Test of Everyday Attention for Children (TEA-‐Ch), Normative Sample and ADHD Performance. Journal of Child Psychology and Psychiatry 42:1065-‐1081.
Marton, K. (2008). Visuo-‐spatial processing and executive functions in children with specific language impairment. International Journal of Language and Communication Disorders 2:181-‐200.
McArthur, G., Hogben, J., Edwards, V., Heath, S. & Mengler, E. (2000). On the “specifics” of specific reading disability and specific language impairment. Journal of Child Psychology and Psychiatry 41:869-‐874.
McCall, E. (1911). Two cases of congenital aphasia in children. British Medical Journal 2628-‐2632.
McGregor, K. K., (1997). The nature of word-‐finding errors of preschoolers with and without word-‐finding deficits. Journal of Speech, Language and Hearing Research 40:1232-‐1244.
Messaoud-‐Galusi, S., Hazan, V. & Rosen, S. (2011). Investigating speech perception in children with dyslexia: Is there evidence of a consistent deficit in individuals? Journal of Speech, Language and Hearing Research 54:1682-‐1701.
Messaoud-‐Galusi, S. & Marshall, C. (2010). Exploring the overlap between dyslexia and SLI: The role of phonology. Scientific Studies of Reading 14:1-‐7.
Millward, K., Hall, R., Ferguson, M. & Moore, D. (2011). Training speech-‐in-‐noise perception in mainstream school children. International Journal of Pediatric Otorhinolaryngology 75:1408-‐1417.
Montgomery, J. (2008). Role of auditory attention in real-‐time processing of simple grammar by children with specific language impairment: a preliminary investigation. International Journal of Language and Communication Disorders 5:499-‐527.
Montgomery, J., Evans, J. & Gillam, R. (2009). Relation of auditory attention and complex sentence comprehension in children with specific language impairment: A preliminary study. Applied Psycholinguistics 30:123-‐151.
Moore, D., Rosenberg, J. & Coleman, J. (2005). Discrimination training of phonemic contrasts enhances phonological processing in mainstream school children. Brain and Language 94:72-‐85.
Murphy, C. & Schochat, E. (2013). Effects of different types of auditory temporal training on language skills: a systematic review. Clinics 68:1364-‐1370.
162 LANGUAGE IMPAIRED CHILDREN’S LISTENING TO SPEECH IN NOISE
Murphy, C., Peres, A., Zachi, E., Ventura, D., Pagan-‐Neves, L., Wertzner, H. & Schochat, E. (2015). Generalization of sensory auditory learning to top-‐down skills in a randomized controlled trial. Journal of the American Academy of Audiology 26:19-‐29.
Negus, V.E. (1929). The Mechanism of the Larynx. pp. 528. London: Wm. Heinemann, Ltd.
Negus, V.E. (1929). The evolution and purpose of the larynx. The Lancet 5528:294.
Neville, H., Coffey, S., Holcomb, P. & Tallal, P. (1993). The neurobiology of sensory and language processing in language-‐impaired children. Journal of Cognitive Neuroscience 5:235-‐253.
Nishimura, T., Mikami, A., Suzuki, J. & Matsuzawa, T. (2006). Descent of the hyoid in chimpanzees: evolution of face flattening and speech. Journal of Human Evolution 21:244-‐254.
Oetting, J. & Hadley, P. (2009). Morphosyntax in child language disorders. In: R. Schwartz (Ed.) Handbook of child language disorders (pp. 341 – 364). New York:Psychology Press.
Ohde, R. N. & Scharf, D. J. (1988). Perceptual categorization and consistency of syhthesized /r – w/ continua by adults, normal children and /r/ misarticulating children. Journal of Speech and Hearing Research 31:556-‐568.
Praat, developed by Paul Boersma and David Weenink at the Phonetic Sciences Department, University of Amsterdam, Spuistraat 2101012VT, Amsterdam, The Netherlands
Provine, R.R. (2004). Walkie-‐talkie evolution: Bipedalism and vocal production. Behavioural and Brain Sciences 4:520-‐521.
Ramus, F., Rosen, S., Dakin, S., Day, B., Castellote, J., White, S. & Frith, U. (2003). Theories of developmental dyslexia: insights from a multiple case study of dyslexic adults. Brain 126:841-‐865.
Reynolds, M. E. & Fucci, D. (1998). Synthetic speech comprehension: A comparison of Children with normal and impaired language skills. Journal of Speech, Language and Hearing Research 41:458-‐466.
Robertson, E. K., Joanisse, M. F., Desroches, A. S. & Ng, S. (2009). Categorical speech perception deficits distinguish language and reading impairments in children. Developmental Science 12:753-‐767.
Schneider, B., Li, L. & Daneman, M. (2007). How competing speech interferes with speech comprehension in everyday listening situations. Journal of the American Academy of Audiology 18:559-‐572.
Schul, R., Stiles, J., Wulfeck, B. & Townsend, J. (2004). How ‘generalized’ is the ‘slowed processing’ in SLI? The case of visuospatial attentional orienting. Neuropsychologia 42:661-‐671.
Scott, S., Blank, C., Rosen, S. & Wise, R. (2000). Identification of a pathway for intelligible speech in the left temporal lobe. Brain 123:2400-‐2406.
Shafer, V., Ponton, C., Datta, H., Morr, M. & Schwartz, R. (2007). Neurophysiological indices of attention to speech in children with specific language impairment. Clinical Neurophysiology 118:1230-‐1243.

LANGUAGE IMPAIRED CHILDREN’S LISTENING TO SPEECH IN NOISE
163
Shannon, R., Zeng, F., Kamath, V., Wygonski, J., & Ekelid, M. (1995). Speech recognition with primarily temporal cues. Science 270: 303-‐304.
Shinn-‐Cunningham, B. (2008). Object-‐based auditory and visual attention. Trends in Cognitive Sciences 12:182-‐186.
Snowling, M., Bishop, D. & Stothard, S. (2000). Is preschool language impairment a risk factor for dyslexia in adolescence? Journal of Child Psychology and Psychiatry 41:587-‐600.
Spaulding, T., Plante, E. & Vance, R. (2008). Sustained selective attention skills of preschool children with SLI: Evidence for separate attentional capacities. Journal of Speech, Language and Hearing Research 51:16-‐34.
Stevens, C., Sanders, L. & Neville, H. (2006). Neurophysiological evidence for selective attention deficits in children with specific language impairment. Brain Research 1111:143-‐152.
Stevens, C., Fanning, J., Coch, D., Sanders, L. & Neville, H. (2008). Neural mechanisms of selective auditory attention are enhanced by computerized training: Electrophysiological evidence from language-‐impaired and typically developing children. Brain Research 1205:55-‐69.
Tabri, D, Chacra, K. M. & Pring, T. (2011). Speech perception in noise by monolingual, bilingual and trilingual listeners. International Journal of Language and Communication Disorders 46:411-‐422.
Tallal, P. & Piercy, M. (1975). Developmental aphasia: The perception of brief vowels and extended stop consonants. Neuropsychologia 13:69-‐74.
Tallal, P. & Stark, R. (1981). Speech acoustic-‐cue discrimination abilities of normally developing and language impaired children. Journal of the Acoustical Society of America 69: 568-‐574.
Tallal, P., Stark, R. & Mellits, D. (1985). Identification of language-‐impaired children on the basis of rapid perception and production skills. Brain and Language 25:314-‐322.
Tomblin, J., Records, N., Buckwalter, P., Zhang, X., Smith & O’Brien, M. (1997). Prevalence of specific language impairment in kindergarten children. Journal of Speech, Language and Hearing Research 40:1245-‐1260.
Torgesen, J. K., Wagner, R. K. & Rashotte, C. (1999). Test of Word Reading Efficiency. Austin: Proed
Treitel, L. (1892). Über Sprachstörung und Sprachentwicklung -‐ Hauptsächlich auf Grund von Sprachuntersuchungen in den Berliner Kindergärten. Archiv für Psychiatrie und Nervenkrankheiten 24:578-‐611.
Van der Lely, H. (1996). Specifically language impaired and normally developing children: Verbal passive vs adjectival passive sentence interpretation. Lingua 98:243-‐272.
Van der Lely, H., Rosen, S. & McClelland, A. (1998). Evidence for a grammar-‐specific deficit in children. Current Biology 8:1253-‐1258.
Van der Lely, H., Rosen, S. & Adlard, A. (2004). Grammatical language impairment and the specificity of cognitive domains: relations between auditory and language abilities. Cognition 94:167-‐183.

164 LANGUAGE IMPAIRED CHILDREN’S LISTENING TO SPEECH IN NOISE
Van Engen, K. J. (2012). Speech-‐in-‐speech recognition: A training study. Language and Cognitive Processes 27:1089-‐1107.
Wechsler, D. (1991). Wechsler Intelligence Scale for Children. 3rd Edition. Harcourt Assessment
Wechsler, D. (2004). Wechsler Intelligence Scale for Children. 4th Edition. Syndey, Australia:Harcourt Assessment
Weiner, P. S. (1986). The study of childhood language disorders: nineteenth century perspectives. Journal of Communication Disorders 19:1-‐47.
Wightman, F. L. & Kistler, D. J. (2005). Informational masking of speech in children: Effects of ipsilateral and contralateral distractors. Journal of the Acoustical Society of America 118: 3164-‐3176.
Wiig, E., Secord, W. & Semel, E. (2000). Clinical Evaluation of Language Fundamentals – Preschool UK. London: The Psychological Corporation
Wiig, E., Secord, W. & Semel, E. (2000). Clinical Evaluation of Language Fundamentals – UK3. 3rd Edition. London: The Psychological Corporation
Wiig, E., Secord, W. & Semel, E. (2006). Clinical Evaluation of Language Fundamentals – 4UK. 4th Edition. London: The Psychological Corporation
Wilson, W., Arnott, W. & Henning, C. (2013). A systematic review of electrophysiological outcomes following auditory training in school-‐age children with auditory processing deficits. International Journal of Audiology 52:721-‐730.
Ziegler, J. C., Pech-‐Georgel, C., George, F., Alario, F. & Lorenzi, C. (2005). Deficits in speech perception predict language learning impairment. PNAS 102:14110-‐14115.
Ziegler, J. C., Pech-‐Georgel, C., George, F. & Lorenzi, C. (2009). Speech-‐perception-‐in-‐noise deficits in dyslexia. Developmental Science 12:732-‐745.
Ziegler, J. C., Pech-‐Georgel, C., George, F. & Lorenzi, C. (2011). Noise on, voicing off: Speech perception deficits in children with specific language impairment. Journal of Experimental Child Psychology 110:362-‐372.

LANGUAGE IMPAIRED CHILDREN’S LISTENING TO SPEECH IN NOISE
165
Appendices
Appendix 1 Age of the participants (years;months), scaled scores on the block design, CELF receptive and expressive subtests and TEA-‐Ch subtest; means and standard deviations in the two groups
SLI group
Name Age Block design SS CELF-‐R SS CELF-‐E SS TEA-‐Ch SS
SLI1 10;3 10 4 4 4 SLI4 7;9 12 5.33 5 12 SLI5 6;10 12 6 9 6 SLI7 7;3 9 5.33 7 4 SLI8 8;9 8 6 3 4 SLI10 7;4 15 6.33 3 4 SLI11 7;5 11 5.66 7 SLI12 9;0 7 3.5 3 6 SLI13 5;0 9 7.33 6 4 SLI14 5;0 10 3.5 4 SLI15 6;10 19 4 5 5 SLI17 8;1 7 5 6 SLI18 9;8 8 6 4 3 SLI20 8;7 7 5 3 3 SLI22 8;1 7 1 1 3 SLI23 8;4 10 5 5 SLI24 10;11 9 1 3 4
Mean 7;11 10.01 4.7 4.27 4.94 SD 1;7 3.19 1.79 2.14 2.16
TD group
Name Age Block design SS CELF-‐R TEA-‐Ch SS TD1 10;3 16 15 10 TD2 10;5 16 15 14 TD3 10;0 9 15 8 TD6 10;7 7 11 9 TD8 9;11 13 13 7 TD10 10;8 9 11 11 TD11 10;7 8 9 4 TD12 10;2 11 13 11 TD13 9;10 12 13 12 TD15 6;10 11 10 4 TD16 6;4 11 9 6 TD17 6;9 10 10 7 TD18 6;4 11 7 5 TD19 6;10 9 13 12 TD20 7;5 8 9 3 TD21 8;7 11 12 4 TD22 8;7 9 10 13 Mean 8;10 10.8 11.5 8.2 SD 1;8 2.62 2.4 3.56

166 LANGUAGE IMPAIRED CHILDREN’S LISTENING TO SPEECH IN NOISE
Appendix 2 An example of the mark sheet in the TEA-‐Ch Walk, Don’t Walk subtest
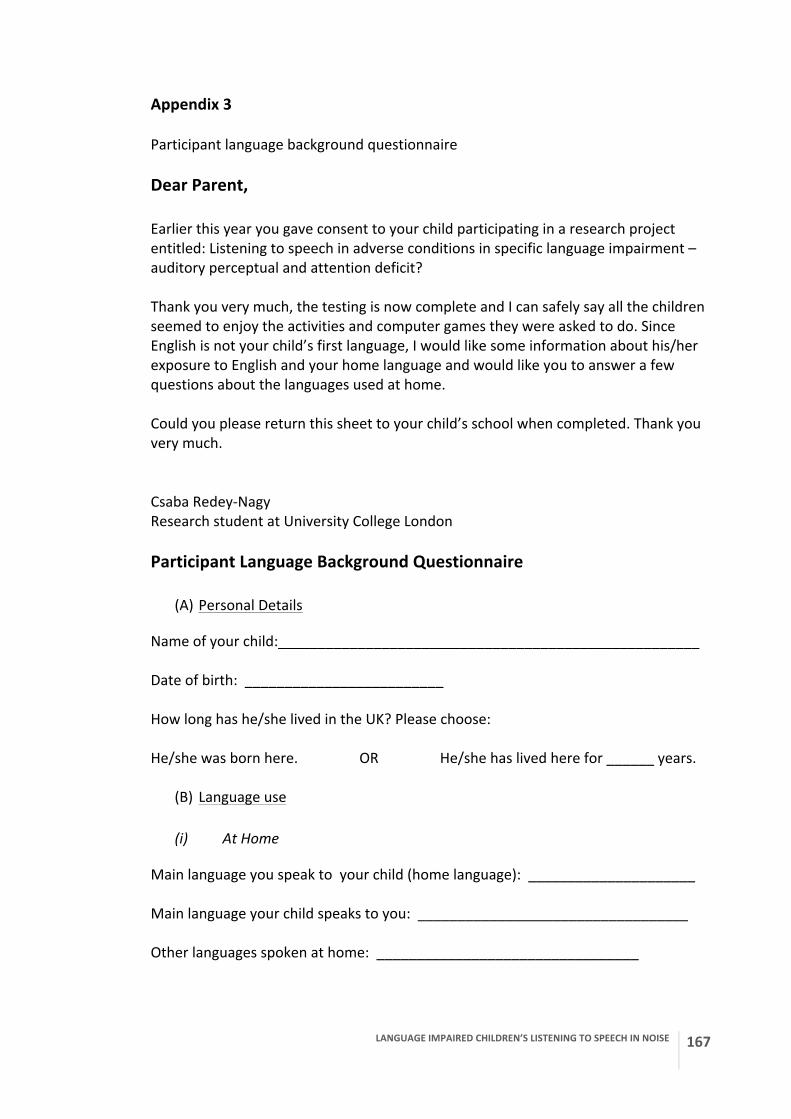
LANGUAGE IMPAIRED CHILDREN’S LISTENING TO SPEECH IN NOISE
167
Appendix 3 Participant language background questionnaire Dear Parent, Earlier this year you gave consent to your child participating in a research project entitled: Listening to speech in adverse conditions in specific language impairment – auditory perceptual and attention deficit? Thank you very much, the testing is now complete and I can safely say all the children seemed to enjoy the activities and computer games they were asked to do. Since English is not your child’s first language, I would like some information about his/her exposure to English and your home language and would like you to answer a few questions about the languages used at home. Could you please return this sheet to your child’s school when completed. Thank you very much. Csaba Redey-‐Nagy Research student at University College London Participant Language Background Questionnaire
(A) Personal Details
Name of your child:_____________________________________________________ Date of birth: _________________________ How long has he/she lived in the UK? Please choose: He/she was born here. OR He/she has lived here for ______ years.
(B) Language use
(i) At Home
Main language you speak to your child (home language): _____________________ Main language your child speaks to you: __________________________________ Other languages spoken at home: _________________________________
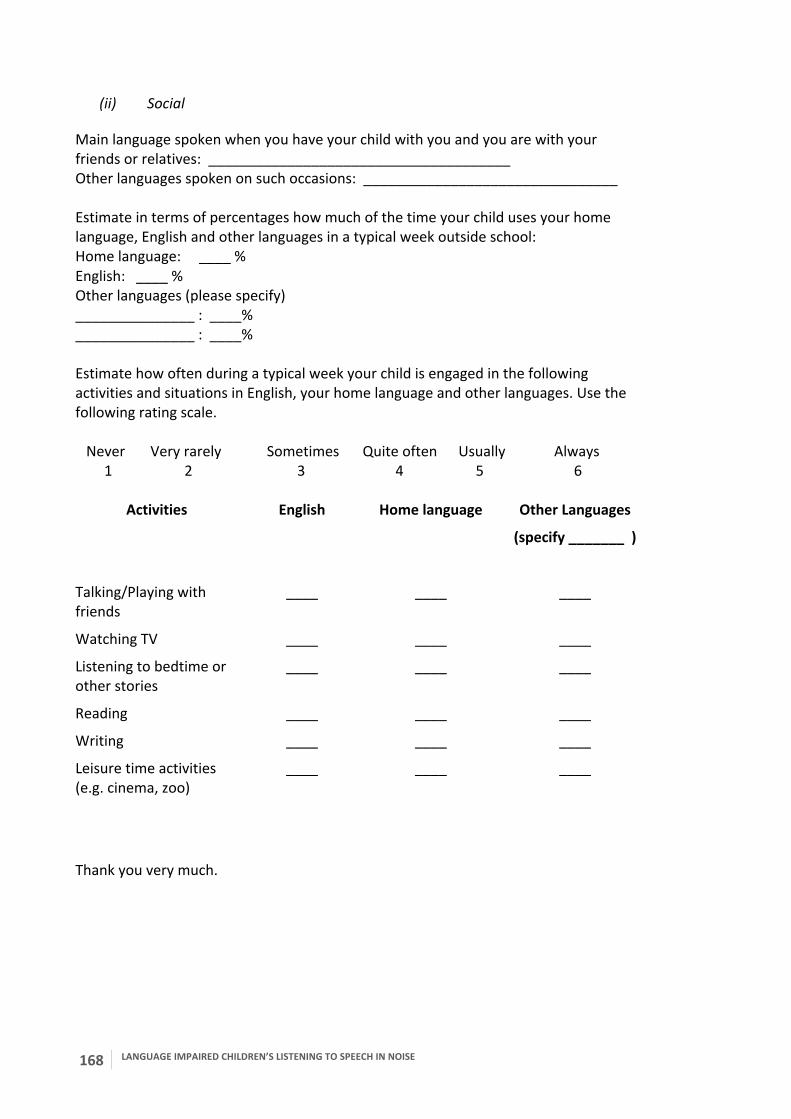
168 LANGUAGE IMPAIRED CHILDREN’S LISTENING TO SPEECH IN NOISE
(ii) Social
Main language spoken when you have your child with you and you are with your friends or relatives: ______________________________________ Other languages spoken on such occasions: ________________________________ Estimate in terms of percentages how much of the time your child uses your home language, English and other languages in a typical week outside school: Home language: ____ % English: ____ % Other languages (please specify) _______________ : ____% _______________ : ____% Estimate how often during a typical week your child is engaged in the following activities and situations in English, your home language and other languages. Use the following rating scale. Never Very rarely Sometimes Quite often Usually Always 1 2 3 4 5 6
Activities English Home language Other Languages
(specify _______ )
Talking/Playing with friends
____ ____ ____
Watching TV ____ ____ ____
Listening to bedtime or other stories
____ ____ ____
Reading ____ ____ ____
Writing ____ ____ ____
Leisure time activities (e.g. cinema, zoo)
____ ____ ____
Thank you very much.

LANGUAGE IMPAIRED CHILDREN’S LISTENING TO SPEECH IN NOISE
169
Appendix 4 Non-‐word repetition for children with language impairment (Vasiliou-‐Redey, 2013)(Vadey non-‐word rep) Child’s name:_________________________________________ DOB: _________________________
No. Item Response Score 1 tard 0 1 2 libe 0 1 3 geem 0 1 4 pummer 0 1 2 5 chooklet 0 1 2 6 mipsy 0 1 2 7 belomber 0 1 2 3 8 melory 0 1 2 3 9 fenallin 0 1 2 3 10 jilombation 0 1 2 3 4 11 sinareum 0 1 2 3 4 12 gafnabaisy 0 1 2 3 4 13 tromboletical 0 1 2 3 4 5 14 ralcabainerant 0 1 2 3 4 5 15 alistocratin 0 1 2 3 4 5 Column total Raw score
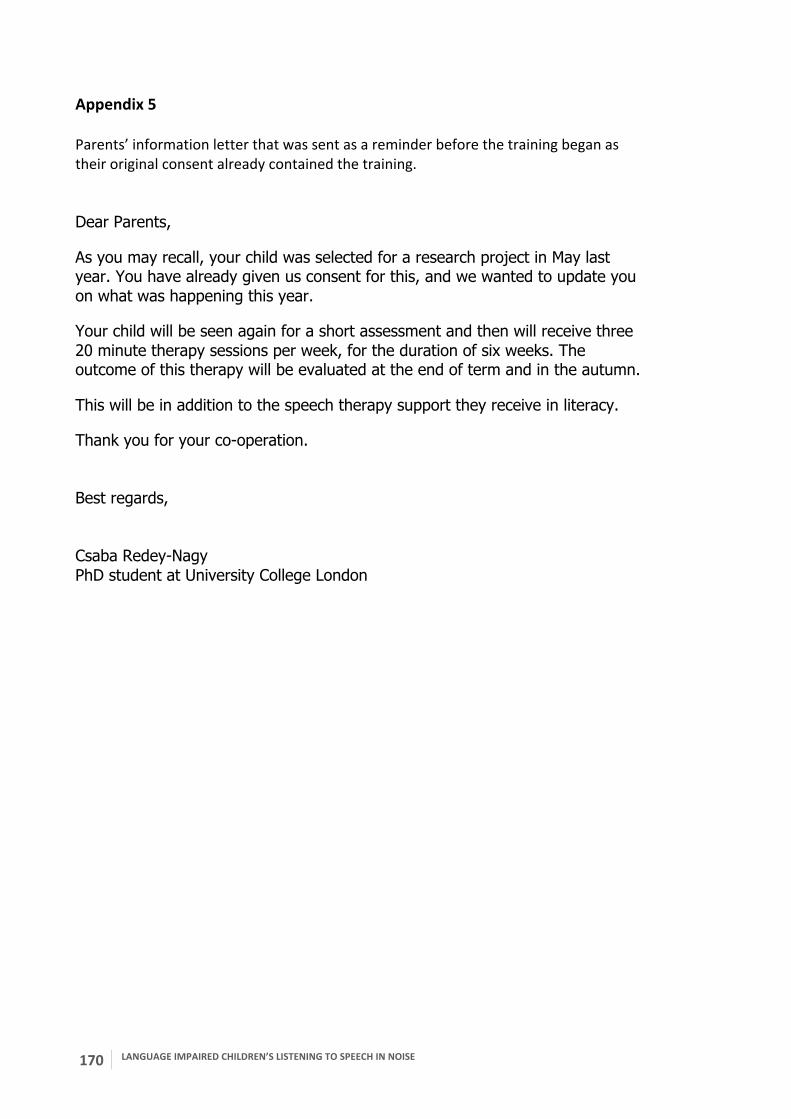
170 LANGUAGE IMPAIRED CHILDREN’S LISTENING TO SPEECH IN NOISE
Appendix 5 Parents’ information letter that was sent as a reminder before the training began as their original consent already contained the training. Dear Parents, As you may recall, your child was selected for a research project in May last year. You have already given us consent for this, and we wanted to update you on what was happening this year. Your child will be seen again for a short assessment and then will receive three 20 minute therapy sessions per week, for the duration of six weeks. The outcome of this therapy will be evaluated at the end of term and in the autumn. This will be in addition to the speech therapy support they receive in literacy. Thank you for your co-operation. Best regards, Csaba Redey-Nagy PhD student at University College London

LANGUAGE IMPAIRED CHILDREN’S LISTENING TO SPEECH IN NOISE
171
Appendix 6. Information leaflet given to the adults overseeing and accompanying the children’s training: Instructions for the iPad app Noisy Castle The app is a series of auditory training tasks for children aged 6 upwards. The training element focusses on children’s perception of speech in the presence of other sounds such as other speakers. It is therefore designed to improve the auditory perception through training the auditory attention skills such as selective attention. The training is the final study of my PhD research project entitled “Listening to speech in adverse conditions in specific language impairment – auditory perceptual and attention deficit?” and it follows on from my previous study in which I tested language impaired children’s speech perception in noise. As it is part of the research project, it is very important that all children use the game in the the same way and for the same amount of time. This is the only way to gather evidence for the effectiveness of the training programme. The training programme is made up of 7 different tasks. Three of these are divided into two or three subtasks. As the training tasks go from phoneme level through word and sentence level to narratives, it is important that the children start at the beginning and follow the hierarchical order that is built in the app. This means that when the user logs on, they will only be allowed to continue where they left off and will not be able to jump to anoher task. Since listening is the main element of the game, it is requested that the children should be in a quiet room using headphones that have been provided. Training plan for each child Each child should use the game for three 20-‐minute sessions a week for a period of six weeks. After logging on the app will time the session, a little timer will be visible in the bottom left corner, and it will automatically stop after 20 minutes. If a child has started a task, but has not finished it, that task will count as not done yet. Starting the game At the beginning of the first session the following is explained to the child (you may need to simplify your language depending on the child’s language level): “You are going to play a game called Noisy Castle on the iPad. In this game you will have to go into the rooms of the castle one by one, and in each room there is an animal in a cage. You have to free the animal. To free it you will have to do a task. As it’s a noisy castle, you will have to do some very good listening in each task because there will be noises, for example somebody else talking, a lot of people talking. Sometimes the noise will be quiet, sometimes very loud. If it’s too loud and you can’t hear anything else, don’t worry about it, this is normal. Just try and guess and the noise will be quiet again. You will be using headphones so you can hear things better.”
172 LANGUAGE IMPAIRED CHILDREN’S LISTENING TO SPEECH IN NOISE
When the child touches the button on the castle door, after zooming in the login page will appear. A first time user will be asked to register by writing their name (first name and last name initial only) and their date of birth. From the next time they just have to choose their name and log on. To register a new user a Teacher Password is required, this is noisy552. Then touch the Login/Register button and the game begins. First the downstairs three doors will appear with an animal in front of each, indicating what animal is in the room. The buttons to start the task are in front of the stairs. Only the first set of buttons in the first room are active to start with. Room 1 – What sound? Speech sound identification In this task speech sounds will be heard with associated pictures. The first set has 4, the second 8, the third 4. Only one set will be done in one session, then the child will have to go on to the next room. When the button Sounds 1 is pressed, the four pictures with their sounds will be presented. This can be repeated until the child is confident that he/she knows which picture stands for which sound. At this stage in order for the adult to hear the task, it is OK if the child doesn’t use the headphones yet. However, in that case he/she should hear them again at least once with the headphones. Then when the Practice 1 button is touched, the task without noise will come up for the child to practice what he/she has to do. Four pictures appear and one sound is heard and the child will have to select the correct picture. Again, it is OK if the child is not wearing the headphones at the beginning so that the adult can help if it is unclear what he/she has to do, but if this is the case, please ask the child to put on the headphones and do the practice again before going on to the In noise 1 task. It’s important, however, to make sure that the child understands what to do. In the In noise 1 task the noise starts relatively quietly and will increase after correct responses. The task will stop after a certain number of incorrect responses, which may mean that some children will finish the task faster than others. Following the first subtask in the What sound? room, the button for the single task of room two will be active. Room 2 – Which sound is different? Speech sound discrimination When the button Practice is touched, three cows will appear. They will utter speech sounds, two the same and one a different one. The child has to select the cow that says a different sound. In this practice phase there is no added noise, it is for the child to understand and learn what to do. Therefore here again it’s OK to do this first without the headphones, but as before make sure that the child does the practice items at least once with the headphones on for clearer hearing before going on to the In noise task. Then the In noise button is touched which starts the same task with noise in the background. For this the child has to wear the headphones. As before, the noise will be getting louder with each (later each 3) correct responses and will stop after 20 trials. Room 3 – This or that sound? Speech sound categorisation

LANGUAGE IMPAIRED CHILDREN’S LISTENING TO SPEECH IN NOISE
173
When Practice 1 is touched, the first task comes up, which is to categorise synthetic syllables from bee to pea and decide whether the syllable sounds more like this or like the other word. In the practice phase this is without added noise. As before the child can take off the headphones for the practice so that the adult can help understand what to do. Once the child knows, he/she should put the headphones back on and do a bit of practice before going on to the task In noise. Then the task in noise is done by the child. The task will stop after 30 trials. Following this subtask, the user will be allowed to go upstairs by touching the lift and start the task of room 4. Room 4 – Show me -‐ Understanding single words In Practice the task is demonstrated without noise as before. A word is named and the child will have to choose one of four pictures that has just been named. Although all pictures have the word written on them as well, the child is not actively encouraged to read them, these are just for clarity. The task will stop after a certain number of mistakes. In the second session (second day with the same child) after logging on the last unfinished task button will be active so that’s where the child starts. Room 5 – Who is right? – single word perception Here there is no practice, the task starts in noise right away. A picture appears and is named, the child listens. The child will have to then choose one of three cows that said the word correctly – the other two cows will say nonsense words that only differ from the target word in 1 speech sound. When the response is wrong, the same stimulus is repeated until the child chooses the correct cow. Room 6 – Move them around – following instructions In this task the child will have to move objects/characters in a room to various positions. Here there is no animal to free from a cage. The aim is to place everything from the right hand side on the picture of a living room. Note that at the moment several things can go on the same place. Story garden After room 6, when the red door on the left is touched, it opens revealing the garden with three dinosaurs. Touching the T. Rex will start the story about the carrot, touching the Stegosaurus will start the worm story. In this the child is asked to listen carefylly to a story and following each sentence/section the question is asked ‘Which words did you hear?’. Two or three out of six pictures have to be chosen because they will have been mentioned in the sentence. The task won’t go on until all necessary pictures are selected. When an incorrect picture is touched, the sentence is repeated with less noise. So the story goes on until the end, when the child will have an opportunity to listen to the whole story in one piece with only the relevant pictures appearing for each sentence.

174 LANGUAGE IMPAIRED CHILDREN’S LISTENING TO SPEECH IN NOISE
With this the first cycle of all tasks has finished. One user will have to go through all tasks in this order 3 times before they can freely choose which one they want to do. As 1 session is only 20 minutes long, this will only happen towards the end of the 6-‐week training block. When Room 1 is started for the second time following the completion of all other tasks, the buttons Sounds 2a, Practice 2a will be active. In order to revise the previous speech sounds, Sounds 1 can be heard again and Practice 1 practised if the child feels they can’t remember which sound was which picture. Once the Sounds in noise 2 is finished, the buttons for room 2 will become active. This task is the same as the first time, therefore if the child feels confident about what to do, he/she may immediately start with the In noise task. Once completed, the second subtask of room 3 will become active. Here it is advised that the child does the practice even if he/she remembers what to do as the words are different. Here the synthetic syllables are from goat to coat. After the practice, the In noise task is done, which again finishes after 30 trials. Following this room 4 will be active upstairs. Note that the animal in the cage will not appear as freed until all tasks in one room are done twice. This means that by the end of the first week when all three subtasks in room 1 and 3 are expected to be finished, the cat and the fox will not appear free yet. If the child wonders why, the explanation is that ‘You have to try even harder the next time so you can free the cat/fox’. They will return to this room after they finished all 6 rooms in the castle and the story garden tasks too. When they do the task the second time, however, the freed animal will appear. This is to keep the children as motivated as possible. (Can I have feedback about this please!) At the end of each day it is requested that the adult managing the training should send that day’s results to me by pressing the Home button in the app and touching the Upload Result button. The iPad has to be connected to wifi at this stage. The teacher’s password is needed again, which is noisy552. Thank you very much! Csaba Redey-‐Nagy

LANGUAGE IMPAIRED CHILDREN’S LISTENING TO SPEECH IN NOISE
175
Appendix 7. Instructions heard in each task in Noisy Castle. Room 1: Phoneme identification What sound is that? Choose the correct picture. Now listen very carefully! Room 2: Phoneme discrimination Which sound is different? Room 3: Phoneme categorisation What sound is that? Choose the correct picture. Room 4: Show me… Pictures appear with one other picture from the same group. The other two can be random, excluding the two that are already there.
1. horse house mouse 2. bud bus bun 3. bug jug drug mug rug 4. kite light night right 5. dog doll duck 6. egg peg pig 7. fan man 8. moon spoon 9. feet beat 10. food hoot 11. five pipe 12. hat bat fat mat cat 13. key bee tea three 14. ball call 15. bark beak bean bed beef bees 16. bike bite book 17. cart heart 18. heat hurt height 19. cut cup 20. cot hot 21. chalk cork stork talk fork 22. corn core 23. cheap sheep 24. cheat cheek 25. cheese chief 26. chin thin tin 27. shin ship fish 28. fin hen 29. eye lie tie pie
176 LANGUAGE IMPAIRED CHILDREN’S LISTENING TO SPEECH IN NOISE
30. ice lice slice 31. face pace space 32. kick pick thick tick chick 33. sick sock 34. door more raw 35. pale peel pile pool pull 36. pay say 37. shoe Sue two 38. shoes shoot suit 39. tar toe 40. wash watch what wasp 41. why white wife wipe wise 42. wine sign 43. cow owl
Room 5: Who is right? Who is right? Choose the cow that says the word correctly. Stimulus triplets:
1. mag – bag – pag 2. wath – dath – bath 3. med – bed – ped 4. wike – bike – gike 5. min – bin – gin 6. mird – bird – dird 7. bite – dite – gite 8. woat – boat – poat 9. wook – book – pook 10. woot – boot – poot 11. wus – bus – dus 12. cake – pake – gake 13. sair – chair – jair 14. comb – pomb – gomb 15. cough – pough – gough 16. cow – tow – gow 17. nig – dig – tig 18. nog – dog – gog 19. roll – doll – boll 20. zuck – duck – guck 21. fall – sall – vall 22. fish – hish – vish 23. five – shive – vive 24. foot – hoot – voot 25. fork – sork – vork 26. kite – pite – gite 27. dife – knife – mife 28. zaugh – laugh – waugh 29. neaf – leaf – weaf
LANGUAGE IMPAIRED CHILDREN’S LISTENING TO SPEECH IN NOISE
177
30. deg – leg – yeg 31. mone – one – lone 32. nain – rain – yain 33. zoad – road – yoad 34. sea – thea – zea 35. ting – sing – shing 36. soap – foap – zoap 37. suck – huck – zuck 38. sun – thun – zun 39. tumb – shumb – dhumb 40. sowel – towel – powel 41. malk – walk – ralk 42. bash – wash –rash 43. gatch – watch – ratch 44. bave – wave -‐ lave
Room 6: Moving things around Put the apple in the basket. Put the apple in the boy’s mouth. Put the apple in the girl’s mouth. Put the apple in the man’s mouth. Put the apple in the woman’s mouth. Move the boy to the window. Move the boy to the fridge. Move the boy to the table. Move the man to the window. Move the man to the fridge. Move the man to the table. Move the woman to the window. Move the woman to the fridge. Move the woman to the table. Put the cat on the sofa. Put the cat under the table. Put the cat on the chair. Put the woman on the sofa. Put the woman in the bathroom. Put the woman on the chair. Put the girl on the sofa. Put the girl in the bathroom. Put the girl on the chair.

178 LANGUAGE IMPAIRED CHILDREN’S LISTENING TO SPEECH IN NOISE
Put the dog on the mat. Put the dog under the table. Put the dog on the sofa. Put the ball on the chair. Put the ball under the table. Put the ball in the window. Put the fish in the fishbowl. Put the fish on the table. Put the fish under the chair. Put the book on the table. Put the book on the sofa. Put the book on the bookshelf. Put the glass on the table. Put the glass in the man’s hands. Put the glass in the woman’s hands. Castle Garden
The Carrot
There was a farmer. One day he decided to grow some carrots. So he went to his field
and began to dig. Then he planted some seeds.
The farmer gave the seeds some water. Then he went home and waited.
One day he went for a walk and he saw a big carrot! The farmer tried to pull the carrot
up…
He pulled, pulled, but he couldn’t pull the carrot up because it was too big!
So he asked his friend, the duck, ‘Help me!’ So together they pulled the carrot, but
they couldn’t pull the carrot up because it was too big!
So he asked his friends, the three little pigs, ‘Help me!’. So together they pulled the
carrot, but they couldn’t pull the carrot up because it was too big!
So he asked his friends, the seven dwarfs, ‘Help me!’. So together they pulled the
carrot, but they couldn’t pull the carrot up because it was too big!
Finally, he asked his big friend, the giant, ‘Help me!’. So together they pulled the
carrot, but they still couldn’t pull it up because it was too big!
So the farmer had a think and then said ‘I need everybody to pull the carrot.’ So
everybody pulled!
LANGUAGE IMPAIRED CHILDREN’S LISTENING TO SPEECH IN NOISE
179
They pulled, pulled, pulled and POP! Out popped the carrot!
The farmer invited all his friends to carry the carrot home. They went to the farmer’s
home and chopped up the carrot. They put it in a pot and made some soup.
Everybody had some soup until they all got full and tired and they all fell asleep.
The runaway worm Once there was a little worm who was unhappy living with his little brothers and
parents.
One day he decided to leave home and to discover the world outside their house.
So he walked and walked until he saw a flower with a lot of little worm friends in it. He
looked and he noticed they were his neighbours! He got scared so he quickly ran away
from them because he didn’t want them to recognise him.
So on he went and soon he saw a big chicken! ‘But chickens eat worms! I need to run
away before she sees me!’ And that’s just what he did. He quickly ran away from the
chicken because he didn’t want to be eaten.
He passed through meadows and mountains, rivers and valleys and one day an old
fisherman picked him up to put him on his hook to catch a fish.
When he was thrown in the water, a fish came to talk to him. ‘Hello, little worm, why
are you swimming in the water?’ The worm was shaking from fear and said, ‘The
fisherman is trying to catch a fish with me. I’m very scared.’ The fish said, ‘Don’t you be
afraid, little worm, I don’t eat worms.’ And with that the fish took the little worm off
the hook and he swam away with him. He swam all the way to the riverbank near the
little worm’s home. The fish helped the little worm out of the water and told him,
‘Never ever run away from your parents. They love you and want to protect you, with
them you’ll be safe and warm. The world outside is a dangerous place, a little worm
like you can get hurt easily.’ The little worm thanked the fish and ran back home into
his parents’ arms.
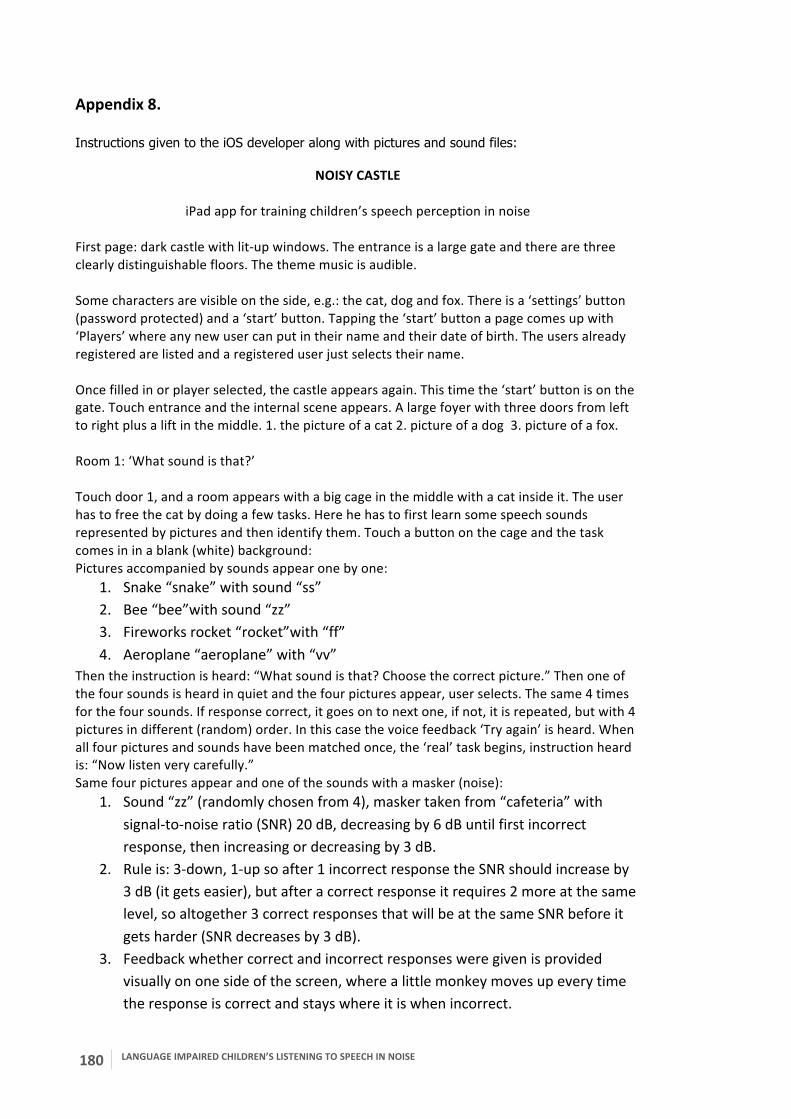
180 LANGUAGE IMPAIRED CHILDREN’S LISTENING TO SPEECH IN NOISE
Appendix 8. Instructions given to the iOS developer along with pictures and sound files:
NOISY CASTLE
iPad app for training children’s speech perception in noise
First page: dark castle with lit-‐up windows. The entrance is a large gate and there are three clearly distinguishable floors. The theme music is audible. Some characters are visible on the side, e.g.: the cat, dog and fox. There is a ‘settings’ button (password protected) and a ‘start’ button. Tapping the ‘start’ button a page comes up with ‘Players’ where any new user can put in their name and their date of birth. The users already registered are listed and a registered user just selects their name. Once filled in or player selected, the castle appears again. This time the ‘start’ button is on the gate. Touch entrance and the internal scene appears. A large foyer with three doors from left to right plus a lift in the middle. 1. the picture of a cat 2. picture of a dog 3. picture of a fox. Room 1: ‘What sound is that?’ Touch door 1, and a room appears with a big cage in the middle with a cat inside it. The user has to free the cat by doing a few tasks. Here he has to first learn some speech sounds represented by pictures and then identify them. Touch a button on the cage and the task comes in in a blank (white) background: Pictures accompanied by sounds appear one by one:
1. Snake “snake” with sound “ss” 2. Bee “bee”with sound “zz” 3. Fireworks rocket “rocket”with “ff” 4. Aeroplane “aeroplane” with “vv”
Then the instruction is heard: “What sound is that? Choose the correct picture.” Then one of the four sounds is heard in quiet and the four pictures appear, user selects. The same 4 times for the four sounds. If response correct, it goes on to next one, if not, it is repeated, but with 4 pictures in different (random) order. In this case the voice feedback ‘Try again’ is heard. When all four pictures and sounds have been matched once, the ‘real’ task begins, instruction heard is: “Now listen very carefully.” Same four pictures appear and one of the sounds with a masker (noise):
1. Sound “zz” (randomly chosen from 4), masker taken from “cafeteria” with signal-‐to-‐noise ratio (SNR) 20 dB, decreasing by 6 dB until first incorrect response, then increasing or decreasing by 3 dB.
2. Rule is: 3-‐down, 1-‐up so after 1 incorrect response the SNR should increase by 3 dB (it gets easier), but after a correct response it requires 2 more at the same level, so altogether 3 correct responses that will be at the same SNR before it gets harder (SNR decreases by 3 dB).
3. Feedback whether correct and incorrect responses were given is provided visually on one side of the screen, where a little monkey moves up every time the response is correct and stays where it is when incorrect.

LANGUAGE IMPAIRED CHILDREN’S LISTENING TO SPEECH IN NOISE
181
4. Voice feedback is provided for every 5th correct response randomly chosen from Voice feedback right’ folder
5. Task goes on until 6 reversals, then stops and next one comes up. (This may change if 6 reversals turn out to take too long). At the end of the task the average of the reversals is calculated as the speech reception threshold (SRT) and should be saved in a table (e.g.Excel) and at the end of a player’s session (from start to stop) all results should be automatically emailed (or when next connected to wifi) to c.redey-‐[email protected].
Pictures accompanied by sounds appear one by one:
1. Ant “ant” with sound “aa” 2. Frog “frog” with sound “e” 3. Robot “robot” with sound “ii” 4. Mouse “mouse” with sound “ee”
Same way as in first set: One of the four sounds is heard in quiet and the four pictures appear, user selects. Instruction heard: “What sound is that? Choose the correct picture.” The same 4 times for the four sounds. If response correct, it goes on to next one, if not, it is repeated, but with 4 pictures in different (random) order. If not correct the voice feedback ‘Try again’ is heard. Next set of four pictures accompanied by sounds appear:
1. Tap “tap” with “tt” 2. Drum “drum” with “dd” 3. Camera “camera” with “kk” 4. Bottle “bottle” with “gg”
Four pictures of the last 2 sets appear, one sound with a masker: Sound “aa” is heard with masker randomly chosen from “babble” and user selects picture. As before SNR starts at 20 dB, decreases by 6 dB, after first incorrect response increases by 3 dB and follows the 3-‐down-‐1-‐up rule. As now there are more pictures, it should stop after 8 reversals.
Last set: picture accompanied by sounds one by one:
1. Candle “candle” with “pp” 2. Baby hushed “baby” with “sh” 3. Train “train” with “ch” 4. Jack-‐in-‐the-‐box “jack” with “jj”
Now sets of 4 pictures randomly chosen from all 16 appear and one of the four sounds is heard with a masker (cafeteria or babble), user selects. Procedure is the same as the last one. Room 2: ‘Which sound is different?’ Touch door 2, it opens and a room appears similar to the previous room, a cage is visible with a dog in it. The task here in order to free the dog from the cage is to select which one of a set of three sounds is different. The sounds are the same as in the previous task. A standing funny cow appears three times in a row and the mouth opens when the sound is produced first in quiet:
1. ss – dd – ss

182 LANGUAGE IMPAIRED CHILDREN’S LISTENING TO SPEECH IN NOISE
2. ff – ff – zz 3. ee – aa – aa
If user is able to select which one is different, after three trials: Now listen very carefully! With masker (noise-‐vocoded folder) starting at 20 dB SNR decreasing by 6 dB applying the 3-‐down-‐1-‐up rule the following sounds are played:
1. tt – gg – gg 2. ss – zz – ss 3. vv – vv – ff 4. e – e – aa 5. ee – ii – ee 6. ee – aa – aa 7. ff – ff – zz 8. ss – tt – ss 9. sh – ss – ss 10. kk – kk – tt 11. dd – gg – dd 12. ff – ss – ss 13. ch – sh – sh 14. zz – zz – jj 15. jj – jj – ch 16. pp – tt – tt 17. ff – pp – ff 18. e – e – ii 19. vv – zz – zz 20. gg – dd – gg
At the end the average level of the reversals is calculated as the speech reception threshold (SRT) for each user. Room 3: “This or that word? Touch door 3, and a room with a fox in a cage appears. When the button on the cage is touched, the following tasks come up:
1. The writing “Which word did you hear?” appears in the middle at the same time as the question is heard (from Instructions folder: which word did you hear m2). On the two sides of the screen the pictures of a bee and some peas appear (Bee and Pea) and the synthetic syllables on the continuum from bee to pea are randomly picked from the folder Phoneme categorisation -‐> bee-‐pea. The user selects whether it was a bee or a pea that they heard. This is in quiet so it stops after 5 trials.
2. Feedback is given only when the first two or last two stimuli are played (0, 9, 54, 60) as these are the unambiguous, clear stimuli (basically here it can be said that the response is correct or not). For 0 and 9 the correct response is ‘pea’,
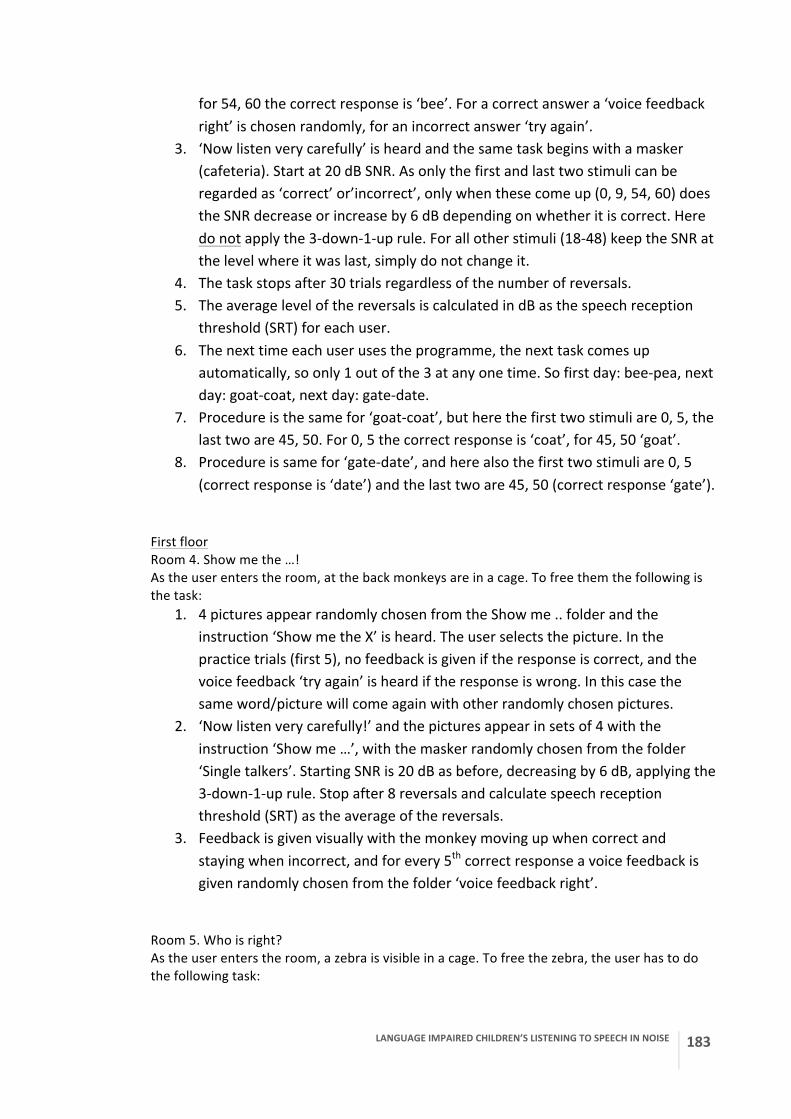
LANGUAGE IMPAIRED CHILDREN’S LISTENING TO SPEECH IN NOISE
183
for 54, 60 the correct response is ‘bee’. For a correct answer a ‘voice feedback right’ is chosen randomly, for an incorrect answer ‘try again’.
3. ‘Now listen very carefully’ is heard and the same task begins with a masker (cafeteria). Start at 20 dB SNR. As only the first and last two stimuli can be regarded as ‘correct’ or’incorrect’, only when these come up (0, 9, 54, 60) does the SNR decrease or increase by 6 dB depending on whether it is correct. Here do not apply the 3-‐down-‐1-‐up rule. For all other stimuli (18-‐48) keep the SNR at the level where it was last, simply do not change it.
4. The task stops after 30 trials regardless of the number of reversals. 5. The average level of the reversals is calculated in dB as the speech reception
threshold (SRT) for each user. 6. The next time each user uses the programme, the next task comes up
automatically, so only 1 out of the 3 at any one time. So first day: bee-‐pea, next day: goat-‐coat, next day: gate-‐date.
7. Procedure is the same for ‘goat-‐coat’, but here the first two stimuli are 0, 5, the last two are 45, 50. For 0, 5 the correct response is ‘coat’, for 45, 50 ‘goat’.
8. Procedure is same for ‘gate-‐date’, and here also the first two stimuli are 0, 5 (correct response is ‘date’) and the last two are 45, 50 (correct response ‘gate’).
First floor Room 4. Show me the …! As the user enters the room, at the back monkeys are in a cage. To free them the following is the task:
1. 4 pictures appear randomly chosen from the Show me .. folder and the instruction ‘Show me the X’ is heard. The user selects the picture. In the practice trials (first 5), no feedback is given if the response is correct, and the voice feedback ‘try again’ is heard if the response is wrong. In this case the same word/picture will come again with other randomly chosen pictures.
2. ‘Now listen very carefully!’ and the pictures appear in sets of 4 with the instruction ‘Show me …’, with the masker randomly chosen from the folder ‘Single talkers’. Starting SNR is 20 dB as before, decreasing by 6 dB, applying the 3-‐down-‐1-‐up rule. Stop after 8 reversals and calculate speech reception threshold (SRT) as the average of the reversals.
3. Feedback is given visually with the monkey moving up when correct and staying when incorrect, and for every 5th correct response a voice feedback is given randomly chosen from the folder ‘voice feedback right’.
Room 5. Who is right? As the user enters the room, a zebra is visible in a cage. To free the zebra, the user has to do the following task:
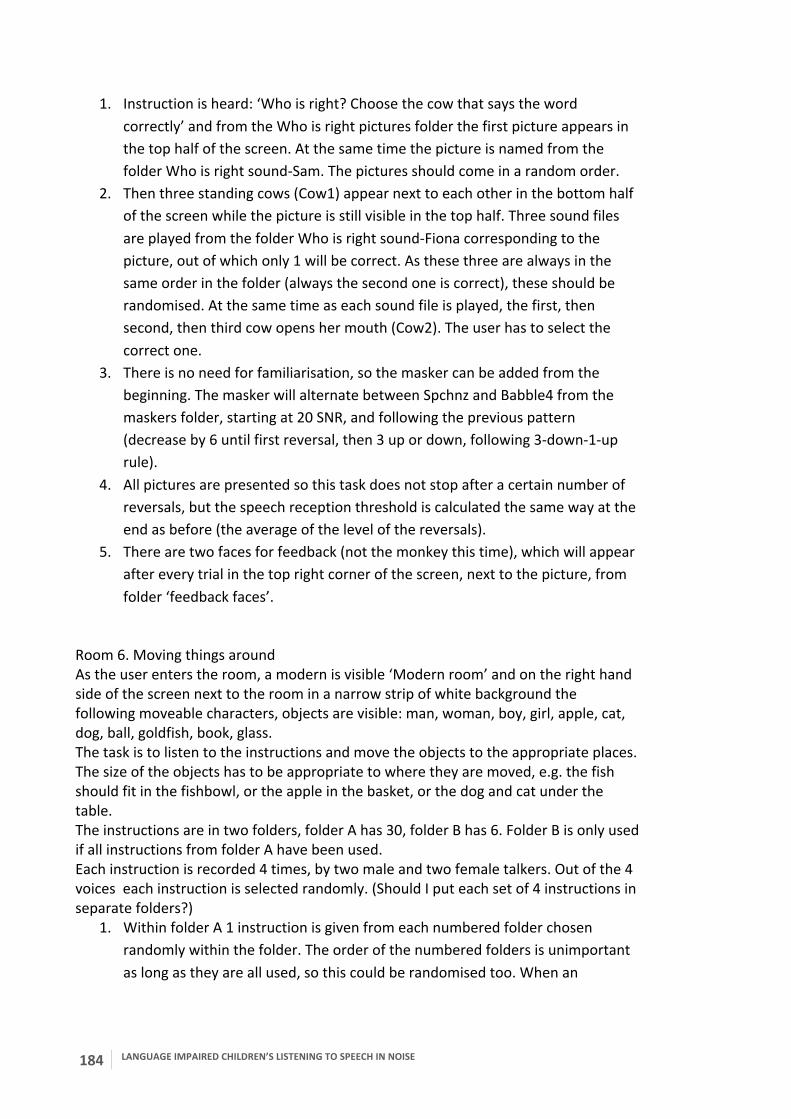
184 LANGUAGE IMPAIRED CHILDREN’S LISTENING TO SPEECH IN NOISE
1. Instruction is heard: ‘Who is right? Choose the cow that says the word correctly’ and from the Who is right pictures folder the first picture appears in the top half of the screen. At the same time the picture is named from the folder Who is right sound-‐Sam. The pictures should come in a random order.
2. Then three standing cows (Cow1) appear next to each other in the bottom half of the screen while the picture is still visible in the top half. Three sound files are played from the folder Who is right sound-‐Fiona corresponding to the picture, out of which only 1 will be correct. As these three are always in the same order in the folder (always the second one is correct), these should be randomised. At the same time as each sound file is played, the first, then second, then third cow opens her mouth (Cow2). The user has to select the correct one.
3. There is no need for familiarisation, so the masker can be added from the beginning. The masker will alternate between Spchnz and Babble4 from the maskers folder, starting at 20 SNR, and following the previous pattern (decrease by 6 until first reversal, then 3 up or down, following 3-‐down-‐1-‐up rule).
4. All pictures are presented so this task does not stop after a certain number of reversals, but the speech reception threshold is calculated the same way at the end as before (the average of the level of the reversals).
5. There are two faces for feedback (not the monkey this time), which will appear after every trial in the top right corner of the screen, next to the picture, from folder ‘feedback faces’.
Room 6. Moving things around As the user enters the room, a modern is visible ‘Modern room’ and on the right hand side of the screen next to the room in a narrow strip of white background the following moveable characters, objects are visible: man, woman, boy, girl, apple, cat, dog, ball, goldfish, book, glass. The task is to listen to the instructions and move the objects to the appropriate places. The size of the objects has to be appropriate to where they are moved, e.g. the fish should fit in the fishbowl, or the apple in the basket, or the dog and cat under the table. The instructions are in two folders, folder A has 30, folder B has 6. Folder B is only used if all instructions from folder A have been used. Each instruction is recorded 4 times, by two male and two female talkers. Out of the 4 voices each instruction is selected randomly. (Should I put each set of 4 instructions in separate folders?)
1. Within folder A 1 instruction is given from each numbered folder chosen randomly within the folder. The order of the numbered folders is unimportant as long as they are all used, so this could be randomised too. When an
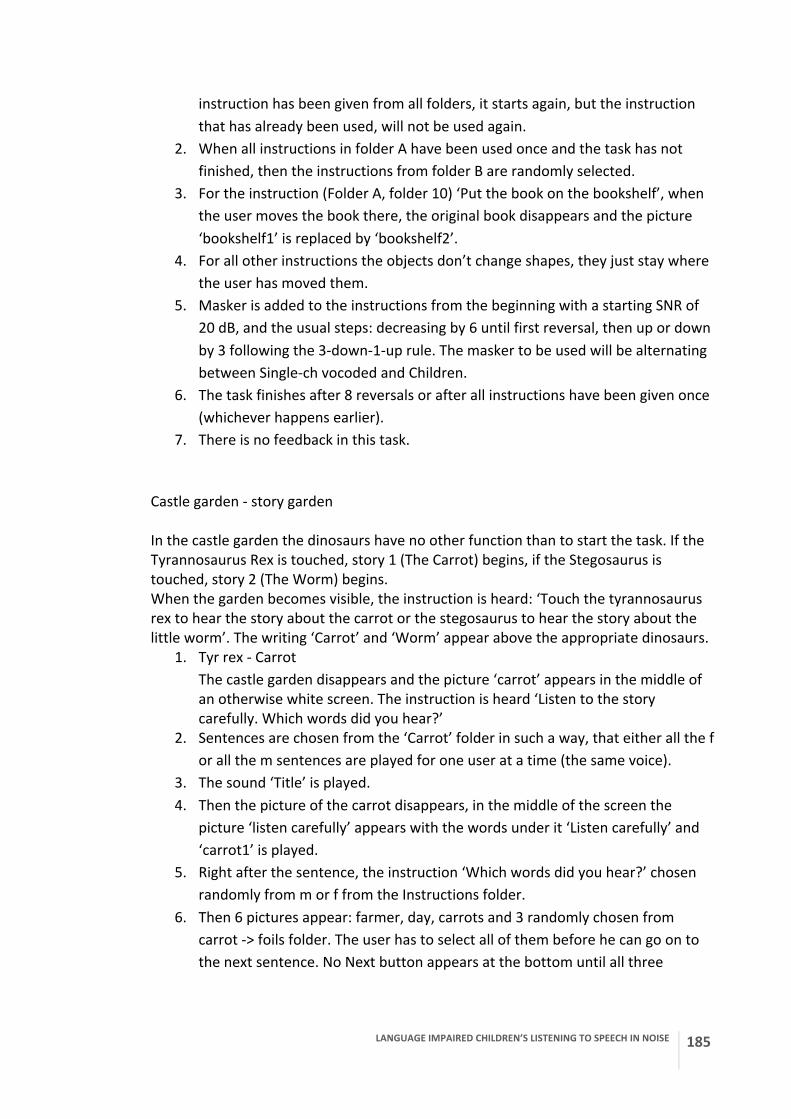
LANGUAGE IMPAIRED CHILDREN’S LISTENING TO SPEECH IN NOISE
185
instruction has been given from all folders, it starts again, but the instruction that has already been used, will not be used again.
2. When all instructions in folder A have been used once and the task has not finished, then the instructions from folder B are randomly selected.
3. For the instruction (Folder A, folder 10) ‘Put the book on the bookshelf’, when the user moves the book there, the original book disappears and the picture ‘bookshelf1’ is replaced by ‘bookshelf2’.
4. For all other instructions the objects don’t change shapes, they just stay where the user has moved them.
5. Masker is added to the instructions from the beginning with a starting SNR of 20 dB, and the usual steps: decreasing by 6 until first reversal, then up or down by 3 following the 3-‐down-‐1-‐up rule. The masker to be used will be alternating between Single-‐ch vocoded and Children.
6. The task finishes after 8 reversals or after all instructions have been given once (whichever happens earlier).
7. There is no feedback in this task. Castle garden -‐ story garden In the castle garden the dinosaurs have no other function than to start the task. If the Tyrannosaurus Rex is touched, story 1 (The Carrot) begins, if the Stegosaurus is touched, story 2 (The Worm) begins. When the garden becomes visible, the instruction is heard: ‘Touch the tyrannosaurus rex to hear the story about the carrot or the stegosaurus to hear the story about the little worm’. The writing ‘Carrot’ and ‘Worm’ appear above the appropriate dinosaurs.
1. Tyr rex -‐ Carrot The castle garden disappears and the picture ‘carrot’ appears in the middle of an otherwise white screen. The instruction is heard ‘Listen to the story carefully. Which words did you hear?’
2. Sentences are chosen from the ‘Carrot’ folder in such a way, that either all the f or all the m sentences are played for one user at a time (the same voice).
3. The sound ‘Title’ is played. 4. Then the picture of the carrot disappears, in the middle of the screen the
picture ‘listen carefully’ appears with the words under it ‘Listen carefully’ and ‘carrot1’ is played.
5. Right after the sentence, the instruction ‘Which words did you hear?’ chosen randomly from m or f from the Instructions folder.
6. Then 6 pictures appear: farmer, day, carrots and 3 randomly chosen from carrot -‐> foils folder. The user has to select all of them before he can go on to the next sentence. No Next button appears at the bottom until all three

186 LANGUAGE IMPAIRED CHILDREN’S LISTENING TO SPEECH IN NOISE
pictures are selected. If one of the wrong pictures is selected, the sentence ‘carrot1’ is played again. This happens until the correct pictures are selected.
7. In this task there is no familiarisation, the noise is added from the beginning. The SNR is the usual 20 dB, going down by 6 dB for every correct response until the first reversal, then following the 3-‐down-‐1-‐up rule changing by 3 dB. The masker is taken from the ‘Single talkers’ folder randomly (not always the same talker).
8. The picture and writing ‘Listen carefully’ appears again, every time a new sentence is being played. ‘carrot2’ is played.
9. The picture ‘Farmer planting seeds, Field, Dig’ and three others from foils appear. User selects same way as before.
10. ‘carrot3’, pictures: water, home and 4 random from foils. 11. ‘carrot4’, pictures: walk, carrot and 4 from foils. 12. ‘carrot5’, pictures: farmer, pull and 4 from foils. 13. ‘carrot6’, pictures: duck, pull and 4 from foils. 14. ‘carrot7’, pictures: three little pigs, carrot and 4 from foils. 15. ‘carrot8’, pictures: seven dwarfs, pull, carrot and 3 from foils. 16. ‘carrot9’, pictures: giant, pull, carrot and 3 from foils. 17. ‘carrot10’, pictures: farmer, think and 4 from foils. 18. ‘carrot11’, pictures: pull, carrot and 4 from foils. 19. ‘carrot12’, pictures: carry, home and 4 from foils. 20. ‘carrot13’, pictures: farmer, home, chop up and 3 from foils. 21. ‘carrot14’, pictures: pot, soup and 4 from foils. 22. ‘carrot15’, pictures: soup, tired, asleep and 3 from foils. 23. When the user has finished this last set of pictures, instead of the ‘Next’ button
it says ‘Whole story’. If this is pressed, all sentences from ‘Title’ to ‘carrot15’ are played one after another with the appropriate 2 or 3 pictures coming up during each sentence. This is with no noise. (If this is too difficult to do, maybe we can leave this out. Let’s talk about it.)
1. Stegosaurus – The Worm
The castle garden disappears and the picture ‘worm1’ appears in the middle of an otherwise white screen. The instruction is heard ‘Listen to the story carefully. Which words did you hear?’
2. Sentences are chosen from the ‘Worm’ folder in such a way, that either all the f or all the m sentences are played for one user at a time (the same voice).
3. The sound ‘Title’ is played. 4. Then the picture of the worm disappears, in the middle of the screen the
picture ‘listen carefully’ appears with the words under it ‘Listen carefully’ and ‘worm1’ is played.
LANGUAGE IMPAIRED CHILDREN’S LISTENING TO SPEECH IN NOISE
187
5. Right after the sentence, the instruction ‘Which words did you hear?’ chosen randomly from m or f from the Instructions folder.
6. Pictures: worm, unhappy, worm parents and 3 random. 7. Noise is added from the beginning the same way as before, the masker here is
taken from Castle garden -‐> Maskers -‐> Children (the others might be too short sections).
8. Rules about going on are the same as before. 9. worm2, pics: day, world, worm’s house and 3 random. 10. worm3, pics: walk, flower and 4 random. 11. worm4, pics: look, scared, run away and 3 random. 12. worm5, pics: chicken, run away and 4 random. 13. worm6, pics: run away, chicken and 4 random. 14. worm7, pics: mountain, river, old fisherman and 3 random. 15. worm8, pics: water, fish and 4 random. 16. worm9, pics: worm, swim and 4 random. 17. worm10, pics: shake, fisherman, scared and 3 random. 18. worm11, pics: fish, scared (afraid) and 4 random. 19. worm12, pics: fish, hook, worm’s home and 3 random. 20. worm13, pics: water, run away and 4 random. 21. worm14, pics: love, warm and 4 random. 22. worm15, pics: world, worm, fish and 3 random. 23. As in previous when the user has finished this last set of pictures, instead of the
‘Next’ button it says ‘Whole story’. If this is pressed, all sentences from ‘Title’ to ‘worm15’ are played one after another with the appropriate 2 or 3 pictures coming up during each sentence. This is with no noise.