KEI Industries31May21
14
Emkay Research is also available on www.emkayglobal.com and Bloomberg EMKAY<GO>. Please refer to the last page of the report on Restrictions on Distribution. In Singapore, this research report or research analyses may only be distributed to Institutional Investors, Expert Investors or Accredited Investors as defined in the Securities and Futures Act, Chapter 289 of Singapore. © Your success is our success Emkay India Equity Research | Consumer Durables June 1, 2021 Result Update KEI Industries Refer to important disclosures at the end of this report Expanding retail reach KEI posted healthy performance in Q4 with 17% yoy EBITDA growth, beating our estimate by 7%. EBIT margins across segments were impacted by the reclassification of un- allocable expenses and a related expense of Rs260mn pertaining to previous quarters. EBITDA margins in both the retail and institutional segments saw an improvement, and this is expected to sustain. Cable demand is holding up in Q1FY22, and management is confident about recovering the lost wire sales after current restrictions are eased. Working capital intensity rose to 120 days from 79 days in FY20. It should normalize after receiving Rs1.5bn of retention money in the EPC business. Going forward, the company will continue to purchase raw material supplies in cash to restrict rise in acceptances. In FY22, the management is targeting 25% growth in domestic institutional sale and 35%+ retail growth. We have raised FY22-23 EPS by 9-11% as we bake in 28-37bps higher EBITDA margins. Maintain Buy with a revised TP of Rs710 (14x Sep’23E EPS) vs. Rs554. Relative price chart Source: Bloomberg This report is solely produced by Emkay Global. The following person(s) are responsible for the production of the recommendation: Naval Seth [email protected] +91 22 6624 2414 Sonali Shah [email protected] +91 22 6624 2482 -20 -8 4 16 28 40 300 365 430 495 560 625 Jun-20 Aug-20 Oct-20 Nov-20 Jan-21 Mar-21May-21 % Rs KEI Industries (LHS) Rel to Nifty (RHS) All-round beat; PAT growth supported by lower finance charges: Standalone revenues declined slightly yoy but came in 4% ahead of estimates, driven by better-than-estimated performance of stainless steel wires and turnkey projects business. The yoy dip was due to lower EPC revenues and the execution of a large order in FY20. EBITDA grew 17% yoy, aided by lower employee costs (down 27% yoy) and other opex (down 15% yoy), while EBITDA margin expanded 178bps yoy. Gross margin contracted 137bps yoy, in line with estimates. PAT saw a 47% increase yoy, boosted by a 55% reduction in finance cost. EBIT and EBIT margins in all the three segments were impacted by the change in GST policy regarding un-allocable expenses. HT cable, HW/WW and SS wire segments registered strong growth, while others saw a decline. Outlook: When compared with peers, KEI’s performance was weak in FY21 due to higher skewness toward the institutional business and a deliberate reduction of the EPC business. C&W is relatively less impacted as infra and other projects are getting executed and real- estate activities are progressing despite ongoing lockdowns. Management reiterated its strategy of increasing retail sales, and aims to achieve 35% growth, driven by retail network expansion. It has already hired 100 new employees to aggressively push retail segment sales and to achieve 20% growth in dealer network in FY22. The company also aims to grow revenues by 25% in the domestic institutional business. Although working capital was impacted by the delay in receiving retention money, we believe that the focus on retail segment and reduction in EPC business should help it stabilize. The efforts to further reduce net debt and acceptances are also positive. Key risks: weak government spends on Infra, Power and other key sectors; delayed private capex recovery; market share loss; and continued commodity price inflation. Please see our sector model portfolio (Emkay Alpha Portfolio): Consumer Durables (page 11) CMP Target Price Rs 616 Rs 710 (▲) as of (May 31, 2021) 12 months Rating Upside BUY (■) 15.3 % Change in Estimates EPS Chg FY22E/FY23E (%) 8.6/11 Target Price change (%) 28.1 Target Period (Months) 12 Previous Reco BUY Emkay vs Consensus EPS Estimates FY22E FY23E Emkay 37.9 45.9 Consensus 35.6 43.1 Mean Consensus TP (12M) Rs 652 Stock Details Bloomberg Code KEII IN Face Value (Rs) 2 Shares outstanding (mn) 90 52 Week H/L 646 / 284 M Cap (Rs bn/USD bn) 55 / 0.76 Daily Avg Volume (nos.) 4,42,199 Daily Avg Turnover (US$ mn) 3.4 Shareholding Pattern Mar '21 Promoters 40.3% FIIs 18.5% DIIs 24.1% Public and Others 17.0% Price Performance (%) 1M 3M 6M 12M Absolute 18 23 45 121 Rel. to Nifty 11 15 21 36 Financial Snapshot (Consolidated) (Rs mn) FY20 FY21 FY22E FY23E FY24E Revenue 48,878 41,815 50,694 60,551 71,352 EBITDA 4,971 4,605 5,589 6,714 7,970 EBITDA Margin (%) 10.2 11.0 11.0 11.1 11.2 APAT 2,563 2,734 3,394 4,106 4,919 EPS (Rs) 28.6 30.4 37.9 45.9 55.0 EPS (% chg) 25.0 6.3 24.6 21.0 19.8 ROE (%) 22.4 16.6 17.6 18.0 18.1 P/E (x) 21.5 20.2 16.2 13.4 11.2 EV/EBITDA (x) 11.4 12.2 9.9 8.2 6.9 P/BV (x) 3.7 3.1 2.6 2.2 1.9 Source: Company, Emkay Research
-
Upload
khangminh22 -
Category
Documents
-
view
4 -
download
0
Transcript of KEI Industries31May21

Emkay Research is also available on www.emkayglobal.com and Bloomberg EMKAY<GO>. Please refer to the last page of the report on Restrictions on Distribution. In Singapore, this research report or research analyses may only be distributed to Institutional Investors, Expert Investors or Accredited Investors as defined in the Securities and Futures Act, Chapter 289 of Singapore.
©
Your success is our success
Emkay
India Equity Research | Consumer Durables
June 1, 2021
Result Update
KEI Industries Refer to important disclosures at the end of this report
Expanding retail reach
KEI posted healthy performance in Q4 with 17% yoy EBITDA growth, beating our estimate
by 7%. EBIT margins across segments were impacted by the reclassification of un-
allocable expenses and a related expense of Rs260mn pertaining to previous quarters.
EBITDA margins in both the retail and institutional segments saw an improvement, and
this is expected to sustain. Cable demand is holding up in Q1FY22, and management is
confident about recovering the lost wire sales after current restrictions are eased.
Working capital intensity rose to 120 days from 79 days in FY20. It should normalize after
receiving Rs1.5bn of retention money in the EPC business. Going forward, the company
will continue to purchase raw material supplies in cash to restrict rise in acceptances.
In FY22, the management is targeting 25% growth in domestic institutional sale and 35%+
retail growth. We have raised FY22-23 EPS by 9-11% as we bake in 28-37bps higher
EBITDA margins. Maintain Buy with a revised TP of Rs710 (14x Sep’23E EPS) vs. Rs554.
Relative price chart
Source: Bloomberg This report is solely produced by Emkay Global. The following person(s) are responsible for the production of the recommendation:
Naval Seth
+91 22 6624 2414
Sonali Shah
+91 22 6624 2482
-20
-8
4
16
28
40
300
365
430
495
560
625
Jun-20 Aug-20 Oct-20 Nov-20 Jan-21 Mar-21May-21
%Rs
KEI Industries (LHS) Rel to Nifty (RHS)
All-round beat; PAT growth supported by lower finance charges: Standalone revenues
declined slightly yoy but came in 4% ahead of estimates, driven by better-than-estimated
performance of stainless steel wires and turnkey projects business. The yoy dip was due to
lower EPC revenues and the execution of a large order in FY20. EBITDA grew 17% yoy,
aided by lower employee costs (down 27% yoy) and other opex (down 15% yoy), while
EBITDA margin expanded 178bps yoy. Gross margin contracted 137bps yoy, in line with
estimates. PAT saw a 47% increase yoy, boosted by a 55% reduction in finance cost. EBIT
and EBIT margins in all the three segments were impacted by the change in GST policy
regarding un-allocable expenses. HT cable, HW/WW and SS wire segments registered strong
growth, while others saw a decline.
Outlook: When compared with peers, KEI’s performance was weak in FY21 due to higher
skewness toward the institutional business and a deliberate reduction of the EPC business.
C&W is relatively less impacted as infra and other projects are getting executed and real-
estate activities are progressing despite ongoing lockdowns. Management reiterated its
strategy of increasing retail sales, and aims to achieve 35% growth, driven by retail network
expansion. It has already hired 100 new employees to aggressively push retail segment sales
and to achieve 20% growth in dealer network in FY22. The company also aims to grow
revenues by 25% in the domestic institutional business. Although working capital was
impacted by the delay in receiving retention money, we believe that the focus on retail
segment and reduction in EPC business should help it stabilize. The efforts to further reduce
net debt and acceptances are also positive. Key risks: weak government spends on Infra,
Power and other key sectors; delayed private capex recovery; market share loss; and
continued commodity price inflation.
Please see our sector model portfolio (Emkay Alpha Portfolio): Consumer Durables (page 11)
CMP Target Price
Rs 616 Rs 710 (▲) as of (May 31, 2021) 12 months
Rating Upside
BUY (■) 15.3 %
Change in Estimates
EPS Chg FY22E/FY23E (%) 8.6/11
Target Price change (%) 28.1
Target Period (Months) 12
Previous Reco BUY
Emkay vs Consensus
EPS Estimates
FY22E FY23E
Emkay 37.9 45.9
Consensus 35.6 43.1
Mean Consensus TP (12M) Rs 652
Stock Details
Bloomberg Code KEII IN
Face Value (Rs) 2
Shares outstanding (mn) 90
52 Week H/L 646 / 284
M Cap (Rs bn/USD bn) 55 / 0.76
Daily Avg Volume (nos.) 4,42,199
Daily Avg Turnover (US$ mn) 3.4
Shareholding Pattern Mar '21
Promoters 40.3%
FIIs 18.5%
DIIs 24.1%
Public and Others 17.0%
Price Performance
(%) 1M 3M 6M 12M
Absolute 18 23 45 121
Rel. to Nifty 11 15 21 36
Financial Snapshot (Consolidated)
(Rs mn) FY20 FY21 FY22E FY23E FY24E
Revenue 48,878 41,815 50,694 60,551 71,352
EBITDA 4,971 4,605 5,589 6,714 7,970
EBITDA Margin (%) 10.2 11.0 11.0 11.1 11.2
APAT 2,563 2,734 3,394 4,106 4,919
EPS (Rs) 28.6 30.4 37.9 45.9 55.0
EPS (% chg) 25.0 6.3 24.6 21.0 19.8
ROE (%) 22.4 16.6 17.6 18.0 18.1
P/E (x) 21.5 20.2 16.2 13.4 11.2
EV/EBITDA (x) 11.4 12.2 9.9 8.2 6.9
P/BV (x) 3.7 3.1 2.6 2.2 1.9
Source: Company, Emkay Research

KEI Industries (KEII IN) India Equity Research | Result Update
Emkay Research is also available on www.emkayglobal.com and Bloomberg EMKAY<GO>. Please refer to the last page of the report on Restrictions on Distribution. In Singapore, this research report or research analyses may only be distributed to Institutional Investors, Expert Investors or Accredited Investors as defined in the Securities and Futures Act, Chapter 289 of Singapore.
June 1, 2021 | 2
Exhibit 1: Actual vs. Estimates (Q4FY21)
(Rs mn) Actual Estimate % Variation
Comment Emkay Consensus Emkay Consensus
Revenue 12,463 11,985 13,506 4% -8% Due to stainless steel wire and turnkey projects
EBITDA 1,416 1,318 1,470 7% -4% On account of lower employee expenses
EBITDA, margin 11.4% 11.0% 10.9% 37 bps 48 bps
PAT 893 838 902 7% -1%
Source: Company, Bloomberg, Emkay Research
Exhibit 2: Summary of standalone quarterly financials
Rs mn Q4FY20 Q1FY21 Q2FY21 Q3FY21 Q4FY21 YoY (%) QoQ (%) FY21 FY20 YoY (%)
Net Sales 12,585 7,453 10,369 11,529 12,463 (1.0) 8.1 41,815 48,843 (14.4)
Raw Material 9134 5441 7409 8523 9217 0.9 8.1 30590 35392 (13.6)
as % of sales 72.6 73.0 71.5 73.9 74.0 73.2 72.5
Employee Cost 602 447 496 470 437 (27.3) (6.9) 1849 2276 (18.7)
as % of sales 4.8 6.0 4.8 4.1 3.5 4.4 4.7
Other operating expenses 1643 842 1281 1254 1393 (15.2) 11.1 4770 6214 (23.2)
as % of sales 13.1 11.3 12.3 10.9 11.2 11.4 12.7
Total Expenditure 11,379 6,730 9,186 10,247 11,047 (2.9) 7.8 37,210 43,882 (15.2)
EBITDA 1,206 723 1,184 1,282 1,416 17.4 10.4 4,605 4,960 (7.2)
Depreciation 137 146 142 145 145 5.7 (0.2) 578 567 2.0
EBIT 1,069 577 1,042 1,137 1,271 18.9 11.8 4,027 4,393 (8.3)
Other Income 24 86 36 53 25 5.1 (53.3) 201 165 21.8
Interest 277 168 150 130 125 (54.7) (4.0) 573 1292 (55.6)
PBT 816 495 928 1,060 1,171 43.5 10.5 3,654 3,267 11.9
Tax 207 133 246 264 278 34.1 5.4 921 716 28.7
PAT 608 362 682 796 893 46.7 12.1 2,733 2,551 7.1
Margins (%) (bps) (bps) (bps)
Gross Margin 27.4 27.0 28.5 26.1 26.0 (137) (3) 26.8 27.5 (69)
EBIDTA 9.6 9.7 11.4 11.1 11.4 178 24 11.0 10.2 86
EBIT 8.5 7.7 10.0 9.9 10.2 171 34 9.6 9.0 63
EBT 6.5 6.6 9.0 9.2 9.4 291 20 8.7 6.7 205
PAT 4.8 4.9 6.6 6.9 7.2 233 26 6.5 5.2 131
Effective Tax rate 25.4 26.8 26.5 24.9 23.8 (166) (114) 25.2 21.9 330
Source: Company, Emkay Research

KEI Industries (KEII IN) India Equity Research | Result Update
Emkay Research is also available on www.emkayglobal.com and Bloomberg EMKAY<GO>. Please refer to the last page of the report on Restrictions on Distribution. In Singapore, this research report or research analyses may only be distributed to Institutional Investors, Expert Investors or Accredited Investors as defined in the Securities and Futures Act, Chapter 289 of Singapore.
June 1, 2021 | 3
Exhibit 3: Segment-wise quarterly summary (standalone)
Rs mn Q4FY20 Q1FY21 Q2FY21 Q3FY21 Q4FY21 YoY (%) QoQ (%) FY21 FY20 YoY (%)
Cables 10,332 6,463 8,707 9,899 10,675 3.3 7.8 35,743 39,824 (10.2)
Stainless steel wires 393 208 335 412 462 17.5 12.0 1,417 1,375 3.0
Turnkey projects 3,701 1,764 2,477 2,929 2,597 (29.8) (11.3) 9,767 13,967 (30.1)
Less: Intersegment 1,841 980 1,150 1,710 1,271 (31.0) (25.7) 5,111 6,323 (19.2)
Net Sales 12,585 7,454 10,369 11,529 12,463 -1.0 8.1 41,816 48,843 (14.4)
PBIT
Cables 1,149 753 1,117 1,252 1,042 (9.3) -16.8 4,164 4,403 (5.4)
Stainless steel wires 42 1 22 32 9 (78.1) (71.3) 65 88 (25.7)
Turnkey projects 409 178 213 314 202 (50.5) (35.5) 907 1,637 (44.6)
Total PBIT 1,600 932 1,352 1,599 1,254 (21.6) (21.6) 5,137 6,128 (16.2)
Finance Costs 277 168 150 130 125 (54.7) (4.0) 573 1,292 (55.6)
Un-allocable expense 507 269 274 408 -42 (108.3) (110.3) 909 1570 (42.1)
as % of sales 4.0 3.6 2.6 3.5 -0.3 2.2 3.2
Exceptional Items 0 0 0 0 0 0 0
PBT 816 495 928 1,060 1,171 43.5 10.5 3,654 3,267 11.9
PBIT Margins (%) (bps) (bps) (bps)
Cables 11.1 11.6 12.8 12.6 9.8 (136) (289) 11.7 11.1 59
Stainless steel wires 10.8 0.5 6.7 7.9 2.0 (876) (585) 4.6 6.4 (178)
Turnkey projects 11.0 10.1 8.6 10.7 7.8 (325) (293) 9.3 11.7 (243)
Total PBIT 12.7 12.5 13.0 13.9 10.1 (265) (380) 12.3 12.5 (26)
Source: Company, Emkay Research
Other highlights
Revenue of Rs12.5bn was down 1% yoy but came in 4% ahead of our estimate, driven by
performance of stainless steel wires and turnkey projects segments.
The slight yoy dip in revenues was due to lower EPC revenues and the execution of one
large order in FY20.
EBITDA grew 17.4% yoy to Rs1.4bn, supported in part by lower-than-expected employee
costs (down 27% yoy). EBITDA margin expanded 178bps yoy to 11.4%.
Gross margins contracted 137bps yoy to 26%. Other operating expense declined 15.2%
yoy.
PAT grew 47% yoy to Rs893mn, supported by a 55% fall in interest expense.
ETR stood at 23.8% vs. 25.4% in Q4FY20.
Segment-wise performance
Cables: Performance was below our expectations, with revenue and EBIT coming in 5%
and 30% below estimates. Though revenue rose 3.3%, margins contracted 136bps yoy.
Stainless steel wires: Revenue grew 17.5% yoy to Rs462mn, with EBIT of Rs9mn. EBIT
margin stood at 2% vs. 10.8% in Q4FY20.
Turnkey projects: Revenue stood at Rs2.6bn - a 30% yoy decline. However, it was
meaningfully above our estimate. EBIT margins disappointed and narrowed 325bps yoy.
Balance sheet and working capital
Gross debt (incl. acceptances) stood at Rs6.3bn, while net debt position was Rs4.1bn vs.
Rs9.2bn at FY20-end.
KEI generated Rs1.3bn in FCF in FY21 vs. -Rs936mn in FY20.
Net working capital days increased to 120 days from 79 days in FY20 due to a fall in payable
days to 65 days from 87 days.
The pending order book stands at Rs25.6bn currently.

KEI Industries (KEII IN) India Equity Research | Result Update
Emkay Research is also available on www.emkayglobal.com and Bloomberg EMKAY<GO>. Please refer to the last page of the report on Restrictions on Distribution. In Singapore, this research report or research analyses may only be distributed to Institutional Investors, Expert Investors or Accredited Investors as defined in the Securities and Futures Act, Chapter 289 of Singapore.
June 1, 2021 | 4
Exhibit 4: Net debt position has improved due to healthy cash generation
Rs mn Q4FY19 Q2FY20 Q4FY20 Q2FY21 Q3FY21 Q4FY21
Gross Debt (excl. acceptances) 4,583 6,651 3,670 2,713 3,050 3,050
Cash 1,953 2,042 2,143 1,377 854 2,212
Net Debt 2,629 4,609 1,527 1,337 2,196 838
Source: Company, Emkay Research
Exhibit 5: Working capital days trend
Working capital days (TTM) Q4FY19 Q2FY20 Q4FY20 Q2FY21 Q3FY21 Q4FY21
Receivable 95 89 102 109 126 118
Inventory 60 76 65 59 58 67
payable 88 84 87 62 60 65
NWC 66 80 79 105 125 120
Source: Company, Emkay Research
Exhibit 6: EPC order book depleted by conscious scale down
Rs mn Q1FY20 Q2FY20 Q3FY20 Q4FY20 Q1FY21 Q2FY21 Q3FY21 Q4FY21
EPC 22,100 20,330 18,280 12,330 7,050 6,210 6,470 8,060
EHV 5,320 6,280 6,760 7,310 6,270 5,620 4,600 5,060
Cable 10,290 11,880 12,300 11,160 11,120 10,260 10,500 11,980
Export 6,430 5,210 4,390 1,640 5,070 4,540 4,430 510
Total 44,140 43,700 41,730 32,440 29,510 26,630 26,110 25,610
Source: Company, Emkay Research
Exhibit 7: Revenue growth was relatively stable yoy
Source: Company, Emkay Research
Exhibit 8: Gross margins contracted 137bps yoy
Source: Company, Emkay Research
Exhibit 9: EBITDA was 7% ahead of expectations
Source: Company, Emkay Research
Exhibit 10: PAT growth was supported by lower finance charges
Source: Company, Emkay Research
-40%
-20%
0%
20%
40%
-
3,000
6,000
9,000
12,000
15,000
Q4F
Y19
Q1F
Y20
Q2F
Y20
Q3F
Y20
Q4F
Y20
Q1F
Y21
Q2F
Y21
Q3F
Y21
Q4F
Y21
Rs m
n
Revenue Revenue growth
0.0%
6.0%
12.0%
18.0%
24.0%
30.0%
Q4F
Y19
Q1F
Y20
Q2F
Y20
Q3F
Y20
Q4F
Y20
Q1F
Y21
Q2F
Y21
Q3F
Y21
Q4F
Y21
Gross margin EBITDA margin
-60%
-30%
0%
30%
60%
-
300
600
900
1,200
1,500
Q4F
Y19
Q1F
Y20
Q2F
Y20
Q3F
Y20
Q4F
Y20
Q1F
Y21
Q2F
Y21
Q3F
Y21
Q4F
Y21
Rs m
n
EBITDA EBITDA growth
-30%
0%
30%
60%
90%
0
200
400
600
800
1000
Q4F
Y19
Q1F
Y20
Q2F
Y20
Q3F
Y20
Q4F
Y20
Q1F
Y21
Q2F
Y21
Q3F
Y21
Q4F
Y21
Rs m
n
PAT PAT growth

KEI Industries (KEII IN) India Equity Research | Result Update
Emkay Research is also available on www.emkayglobal.com and Bloomberg EMKAY<GO>. Please refer to the last page of the report on Restrictions on Distribution. In Singapore, this research report or research analyses may only be distributed to Institutional Investors, Expert Investors or Accredited Investors as defined in the Securities and Futures Act, Chapter 289 of Singapore.
June 1, 2021 | 5
Exhibit 11: Cable segment margins narrowed 136bps yoy due to reclassification of un-allocable expenses
Source: Company, Emkay Research
Exhibit 12: Changes in estimates
Particulars (Rs mn)
FY22E FY23E FY24E
Old Revised % Change Old Revised % Change Introduced
Revenue 50,614 50,694 0.2% 59,049 60,551 2.5% 71,352
EBITDA 5,439 5,589 2.8% 6,330 6,714 6.1% 7,970
EBITDA Margin % 10.7 11.0 28 bps 10.7 11.1 37 bps 11.2
PAT 3,126 3394 8.6% 3,701 4106 11.0% 4,919
EPS 34.9 37.9 8.6% 41.4 45.9 11.0% 55.0
Source: Company, Emkay Research
Exhibit 13: Key revenue and margin assumptions
Particulars FY18 FY19 FY20 FY21 FY22E FY23E FY24E
Revenues (Rs mn)
Cables 27,332 33,636 39,859 35,743 44,945 55,825 67,746
% growth 34% 23% 19% -10% 26% 24% 21%
Stainless steel wires 1,183 1,380 1,375 1,417 1,568 1,725 1,897
% growth 4% 17% 0% 3% 11% 10% 10%
Turnkey projects 9,561 10,333 13,967 9,767 10,252 10,252 10,252
% growth 42% 8% 35% -30% 5% 0% 0%
Less: inter-segmental -3,045 -3,039 -6,323 -5,111 -6,071 -7,251 -8,545
Net sales 35,031 42,310 48,878 41,815 50,694 60,551 71,352
% growth 24% 21% 16% -14% 21% 19% 18%
Segmental EBIT (Rs mn)
Cables 2,964 3,664 4,414 4,164 5,124 6,364 7,723
Stainless steel wires 71 91 88 65 72 79 87
Turnkey projects 1,038 1,422 1,637 907 1,128 1,128 1,128
EBIT (%)
Cables 10.8% 10.9% 11.1% 11.6% 11.4% 11.4% 11.4%
Stainless steel wires 6.0% 6.6% 6.4% 4.6% 4.6% 4.6% 4.6%
Turnkey projects 10.9% 13.8% 11.7% 9.3% 11.0% 11.0% 11.0%
Source: Company, Emkay Research
0.0%
3.0%
6.0%
9.0%
12.0%
15.0%
-
300
600
900
1,200
1,500
Q1F
Y19
Q2F
Y19
Q3F
Y19
Q4F
Y19
Q1F
Y20
Q2F
Y20
Q3F
Y20
Q4F
Y20
Q1F
Y21
Q2F
Y21
Q3F
Y21
Q4F
Y21
Rs m
nEBIT Cables EBITM Cables
KEI Industries (KEII IN) India Equity Research | Result Update
Emkay Research is also available on www.emkayglobal.com and Bloomberg EMKAY<GO>. Please refer to the last page of the report on Restrictions on Distribution. In Singapore, this research report or research analyses may only be distributed to Institutional Investors, Expert Investors or Accredited Investors as defined in the Securities and Futures Act, Chapter 289 of Singapore.
June 1, 2021 | 6
Con-call highlights
Outlook: Management expects 25% growth in domestic institutional sales and 35%+
growth in retail sales, with 25% volume growth (it will be higher if copper price inflation
continues in FY22). Management is targeting further reduction in net debt in FY22.
In Q1FY22, cable sales are intact despite ongoing lockdowns, while wire demand has
been impacted. Management is confident of recovering the lost sales in wires after
lockdowns are lifted.
The company has hired 100 new employee to strengthen its front-end marketing and
sales force. It was in a transformation mode in FY21 and is now targeting to expand its
retail network. From current dealer network strength of 1,655, the company is looking for
20% growth in FY22. Once the channel expansion is done, it will implement product
extension by launching 2-3 new products. This was delayed by Covid-19-led
disruption.
The company will effect another 8-10% price hike in Q1FY22 due to copper price
inflation.
EHV cables: Management is not seeing any threats from Finolex Cables as it does not
have requisite approvals to participate in tenders.
Exports: Although the order book fell to Rs510mn in Q4, management is confident of
achieving revenues of ~Rs5.5-6bn in FY22 (similar to that of FY21).
Cable sales to the power sector account for ~30% of total sales. In the solar cable category,
key competitors are Apar Industries and Polycab. Cable demand for solar capacity
expansion is higher as compared to thermal.
Finance cost reduction was driven by higher cash purchases. This has also led to a
reduction in acceptances. However, it impacted WC and return ratios.
EBITDA margins: The margin profile of retail has improved to 12% from 11%, while
institutional sales have seen an improvement to 10.3% from 9.5%. Employee cost reduction
is sustainable as the EPC business, which accounted for a significant number of
employees, has been intentionally scaled down.
Working capital: Rs1.5bn of working capital, held as retention money with respective
authorities for the EPC business, will be released in FY22.
The retention money in the EPC division was due in Q4 but will be received in Q1FY22.
Receivables: The company is targeting 2.5 months of total receivables in FY22 and
beyond, backed by increased share of retail sales and a reduction in EPC revenues.
Un-allocable expenses have reduced due to cross-charges issued under GST rules. They
have been reallocated to respective revenue streams. A one-time impact of Rs260mn
relating to the C&W segment was present in Q4FY21, leading to lower margins.
Capex: Due to the ongoing second wave of Covid-19, land parcel finalization for the new
plant has been delayed. Greenfield capex will now start from Q2FY22. The company has
sufficient capacity available to meet its FY22 revenue targets.
KEI Industries (KEII IN) India Equity Research | Result Update
Emkay Research is also available on www.emkayglobal.com and Bloomberg EMKAY<GO>. Please refer to the last page of the report on Restrictions on Distribution. In Singapore, this research report or research analyses may only be distributed to Institutional Investors, Expert Investors or Accredited Investors as defined in the Securities and Futures Act, Chapter 289 of Singapore.
June 1, 2021 | 7
Valuation charts
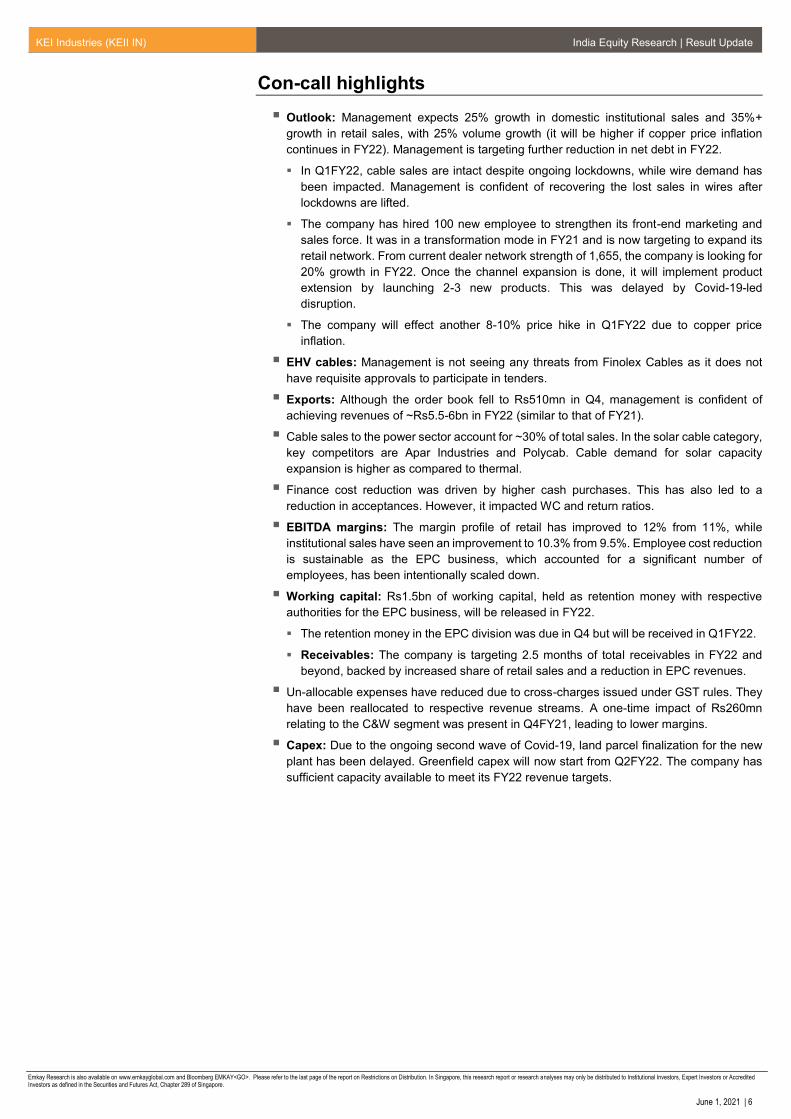
Exhibit 14: 1-year forward P/E valuation band
Source: Company, Bloomberg, Emkay Research
Exhibit 15: 1-year forward P/B valuation band
Source: Company, Bloomberg, Emkay Research
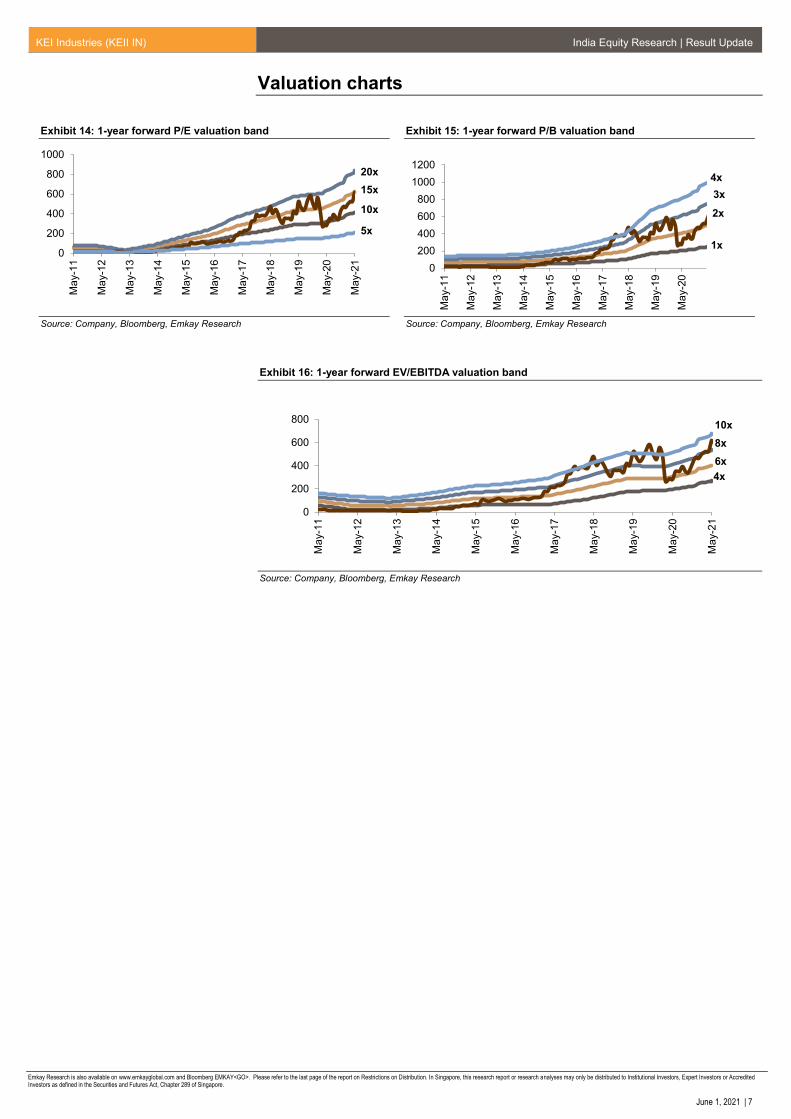
Exhibit 16: 1-year forward EV/EBITDA valuation band
Source: Company, Bloomberg, Emkay Research
0
200
400
600
800
1000
Ma
y-1
1
Ma
y-1
2
Ma
y-1
3
Ma
y-1
4
Ma
y-1
5
Ma
y-1
6
Ma
y-1
7
Ma
y-1
8
Ma
y-1
9
May-2
0
Ma
y-2
1
5x
10x
15x
20x
0
200
400
600
800
1000
1200
Ma
y-1
1
Ma
y-1
2
Ma
y-1
3
Ma
y-1
4
Ma
y-1
5
Ma
y-1
6
Ma
y-1
7
Ma
y-1
8
Ma
y-1
9
May-2
0
1x
2x
3x
4x
0
200
400
600
800
Ma
y-1
1
Ma
y-1
2
Ma
y-1
3
Ma
y-1
4
Ma
y-1
5
Ma
y-1
6
Ma
y-1
7
Ma
y-1
8
Ma
y-1
9
Ma
y-2
0
Ma
y-2
1
4x
6x
8x
10x

KEI Industries (KEII IN) India Equity Research | Result Update
Emkay Research is also available on www.emkayglobal.com and Bloomberg EMKAY<GO>. Please refer to the last page of the report on Restrictions on Distribution. In Singapore, this research report or research analyses may only be distributed to Institutional Investors, Expert Investors or Accredited Investors as defined in the Securities and Futures Act, Chapter 289 of Singapore.
June 1, 2021 | 8
Key Financials (Consolidated)
Income Statement
Y/E Mar (Rs mn) FY20 FY21 FY22E FY23E FY24E
Revenue 48,878 41,815 50,694 60,551 71,352
Expenditure 43,907 37,210 45,105 53,837 63,382
EBITDA 4,971 4,605 5,589 6,714 7,970
Depreciation 567 578 753 914 1,076
EBIT 4,404 4,027 4,836 5,799 6,894
Other Income 167 201 207 228 250
Interest expenses 1,292 573 508 540 570
PBT 3,279 3,654 4,536 5,488 6,573
Tax 716 921 1,142 1,381 1,654
Extraordinary Items 0 0 0 0 0
Minority Int./Income from Assoc. 0 1 0 0 0
Reported Net Income 2,563 2,734 3,394 4,106 4,919
Adjusted PAT 2,563 2,734 3,394 4,106 4,919
Balance Sheet
Y/E Mar (Rs mn) FY20 FY21 FY22E FY23E FY24E
Equity share capital 179 180 179 179 179
Reserves & surplus 14,893 17,601 20,700 24,591 29,252
Net worth 15,072 17,781 20,879 24,770 29,431
Minority Interest (1) 0 (1) (1) (1)
Loan Funds 3,666 2,850 2,538 2,698 2,852
Net deferred tax liability 308 295 295 295 295
Total Liabilities 19,046 20,925 23,711 27,762 32,576
Net block 5,536 5,371 6,650 7,765 8,718
Investment 8 12 8 8 8
Current Assets 27,033 24,686 27,439 32,197 38,046
Cash & bank balance 2,144 2,212 2,438 2,669 3,253
Other Current Assets 2,422 1,075 2,334 2,785 3,281
Current liabilities & Provision 13,643 9,215 10,457 12,279 14,267
Net current assets 13,390 15,470 16,982 19,919 23,780
Misc. exp 0 0 0 0 0
Total Assets 19,046 20,925 23,711 27,762 32,576
Cash Flow
Y/E Mar (Rs mn) FY20 FY21 FY22E FY23E FY24E
PBT (Ex-Other income) (NI+Dep) 3,112 3,454 4,329 5,260 6,323
Other Non-Cash items 0 0 0 0 0
Chg in working cap (4,338) (2,025) (1,286) (2,706) (3,277)
Operating Cashflow (130) 1,658 3,162 2,627 3,038
Capital expenditure (1,013) (372) (2,032) (2,029) (2,029)
Free Cash Flow (1,143) 1,286 1,130 598 1,009
Investments 10 (4) 4 0 0
Other Investing Cash Flow 946 0 (13) 0 0
Investing Cashflow 110 (176) (1,834) (1,801) (1,779)
Equity Capital Raised 21 1 (1) 0 0
Loans Taken / (Repaid) (2,328) (817) (312) 160 153
Dividend paid (incl tax) (276) (143) (178) (215) (258)
Other Financing Cash Flow 4,085 119 (104) 0 0
Financing Cashflow 210 (1,414) (1,102) (594) (675)
Net chg in cash 190 69 226 231 584
Opening cash position 1,953 2,144 2,212 2,438 2,669
Closing cash position 2,144 2,212 2,438 2,669 3,253
Source: Company, Emkay Research

KEI Industries (KEII IN) India Equity Research | Result Update
Emkay Research is also available on www.emkayglobal.com and Bloomberg EMKAY<GO>. Please refer to the last page of the report on Restrictions on Distribution. In Singapore, this research report or research analyses may only be distributed to Institutional Investors, Expert Investors or Accredited Investors as defined in the Securities and Futures Act, Chapter 289 of Singapore.
June 1, 2021 | 9
Key Ratios
Profitability (%) FY20 FY21 FY22E FY23E FY24E
EBITDA Margin 10.2 11.0 11.0 11.1 11.2
EBIT Margin 9.0 9.6 9.5 9.6 9.7
Effective Tax Rate 21.8 25.2 25.2 25.2 25.2
Net Margin 5.2 6.5 6.7 6.8 6.9
ROCE 27.5 21.2 22.6 23.4 23.7
ROE 22.4 16.6 17.6 18.0 18.1
RoIC 30.7 22.7 24.3 25.1 25.4
Per Share Data (Rs) FY20 FY21 FY22E FY23E FY24E
EPS 28.6 30.4 37.9 45.9 55.0
CEPS 35.0 36.9 46.3 56.1 67.0
BVPS 168.4 197.9 233.3 276.7 328.8
DPS 2.6 1.6 2.0 2.4 2.9
Valuations (x) FY20 FY21 FY22E FY23E FY24E
PER 21.5 20.2 16.2 13.4 11.2
P/CEPS 17.6 16.7 13.3 11.0 9.2
P/BV 3.7 3.1 2.6 2.2 1.9
EV / Sales 1.2 1.3 1.1 0.9 0.8
EV / EBITDA 11.4 12.2 9.9 8.2 6.9
Dividend Yield (%) 0.4 0.3 0.3 0.4 0.5
Gearing Ratio (x) FY20 FY21 FY22E FY23E FY24E
Net Debt/ Equity 0.1 0.0 0.0 0.0 0.0
Net Debt/EBIDTA 0.3 0.1 0.0 0.0 (0.1)
Working Cap Cycle (days) 84.0 115.7 104.7 104.0 105.0
Growth (%) FY20 FY21 FY22E FY23E FY24E
Revenue 15.5 (14.4) 21.2 19.4 17.8
EBITDA 12.8 (7.4) 21.4 20.1 18.7
EBIT 8.3 (8.6) 20.1 19.9 18.9
PAT 41.8 6.7 24.1 21.0 19.8
Quarterly (Rs mn) Q4FY20 Q1FY21 Q2FY21 Q3FY21 Q4FY21
Revenue 12,585 7,453 10,369 11,529 12,463
EBITDA 1,206 723 1,184 1,282 1,416
EBITDA Margin (%) 9.6 9.7 11.4 11.1 11.4
PAT 608 362 682 796 893
EPS (Rs) 6.8 4.0 7.6 8.9 10.0
Source: Company, Emkay Research
Shareholding Pattern (%) Mar-20 Jun-20 Sep-20 Dec-20 Mar-21
Promoters 40.5 40.5 40.3 40.3 40.3
FIIs 15.3 15.3 14.0 16.3 18.5
DIIs 24.7 23.4 24.1 23.5 24.1
Public and Others 19.5 20.8 21.6 19.9 17.0
Source: Capitaline

KEI Industries (KEII IN) India Equity Research | Result Update
Emkay Research is also available on www.emkayglobal.com and Bloomberg EMKAY<GO>. Please refer to the last page of the report on Restrictions on Distribution. In Singapore, this research report or research analyses may only be distributed to Institutional Investors, Expert Investors or Accredited Investors as defined in the Securities and Futures Act, Chapter 289 of Singapore.
June 1, 2021| 10
RECOMMENDATION HISTORY TABLE
Date Closing
Price TP
Period (months)
Rating Analyst
30-Jan-21 462 554 12m Buy Naval Seth
22-Dec-20 477 554 12m Buy Naval Seth
Source: Company, Emkay Research
RECOMMENDATION HISTORY CHART
Source: Bloomberg, Company, Emkay Research
210
293
376
459
542
625
02
-Ju
n-1
8
01
-De
c-1
8
01
-Ju
n-1
9
30
-No
v-1
9
30
-Ma
y-2
0
28
-No
v-2
0
29
-Ma
y-2
1
BUY Hold SellAccumulate Reduce PriceTarget Price

KEI Industries (KEII IN) India Equity Research | Result Update
Emkay Research is also available on www.emkayglobal.com and Bloomberg EMKAY<GO>. Please refer to the last page of the report on Restrictions on Distribution. In Singapore, this research report or research analyses may only be distributed to Institutional Investors, Expert Investors or Accredited Investors as defined in the Securities and Futures Act, Chapter 289 of Singapore.
June 1, 2021| 11
Emkay Alpha Portfolio – Consumer Durables
EAP sector portfolio
Company Name BSE200 Weight
EAP Weight OW/UW (%) OW/UW
(bps) EAP Weight
(Normalised)
Consumer Durables 0.87 0.86 -1% -1 100.00
Amber Enterprises 0.00 0.00 NA 0 0.00
Blue Star 0.00 0.00 NA 0 0.00
Crompton Greaves CE 0.21 0.22 5% 1 25.08
Dixon Technologies 0.00 0.01 NA 1 1.10
Havells India 0.29 0.28 -2% -1 32.67
KEI Industries 0.00 0.00 NA 0 0.00
Polycab India 0.03 0.04 6% 0 4.14
V-Guard Industries 0.00 0.00 NA 0 0.00
Voltas 0.26 0.26 0% 0 29.79
Whirlpool Of India 0.08 0.06 -29% -2 6.37
Cash 0.00 0.01 NA 1 0.86
Source: Emkay Research
* Not under coverage: Equal Weight
High Conviction/Strong Over Weight High Conviction/Strong Under Weight
Sector portfolio NAV
Base Latest
1-Apr-19 28-May-20 27-Nov-20 26-Feb-21 28-Apr-21 28-May-21
EAP - Consumer Durables 100.0 84.1 127.9 165.6 159.4 157.7
BSE200 Neutral Weighted Portfolio (ETF) 100.0 78.8 117.4 151.5 145.4 146.9
*Performance measurement base date 1st April 2019
Source: Emkay Research
Price Performance (%)
1m 3m 6m 12m
EAP - Consumer Durables -1.1% -4.8% 23.3% 87.4%
BSE200 Neutral Weighted Portfolio (ETF) 1.0% -3.0% 25.1% 86.4%
Source: Emkay Research
NAV chart
Source: Emkay Research
Please see our model portfolio (Emkay Alpha Portfolio): Nifty
Please see our model portfolio (Emkay Alpha Portfolio): SMID
“Emkay Alpha Portfolio – SMID and Nifty are a supporting document to the Emkay Alpha
Portfolios Report and is updated on regular intervals”
70
91
112
133
154
175
Apr-19 Jul-19 Oct-19 Jan-20 Apr-20 Aug-20 Nov-20 Feb-21 May-21
NAV
EAP - Consumer Durables BSE200 Neutral Weighted Portfolio (ETF)
Analyst: Naval Seth
Contact Details
+91 22 66242414
Sector
Consumer Durables, Media &
Entertainment, SMID and Telecom
Analyst bio
Naval holds an MBA in Finance and has
more than 12 years of experience in
equity research. His team currently
covers 19 stocks spread across three
different sectors.

KEI Industries (KEII IN) India Equity Research | Result Update
Emkay Research is also available on www.emkayglobal.com and Bloomberg EMKAY<GO>. Please refer to the last page of the report on Restrictions on Distribution. In Singapore, this research report or research analyses may only be distributed to Institutional Investors, Expert Investors or Accredited Investors as defined in the Securities and Futures Act, Chapter 289 of Singapore.
June 1, 2021| 12
Emkay Rating Distribution
Ratings Expected Return within the next 12-18 months.
BUY Over 15%
HOLD Between -5% to 15%
SELL Below -5%
Completed Date: 01 Jun 2021 03:19:30 (SGT) Dissemination Date: 01 Jun 2021 03:20:30 (SGT)
Sources for all charts and tables are Emkay Research unless otherwise specified.
GENERAL DISCLOSURE/DISCLAIMER BY EMKAY GLOBAL FINANCIAL SERVICES LIMITED (EGFSL): Emkay Global Financial Services Limited (CIN-L67120MH1995PLC084899) and its affiliates are a full-service, brokerage, investment banking, investment management and financing group. Emkay Global Financial Services Limited (EGFSL) along with its affiliates are participants in virtually all securities trading markets in India. EGFSL was established in 1995 and is one of India's leading brokerage and distribution house. EGFSL is a corporate trading member of Bombay Stock Exchange Limited (BSE), National Stock Exchange of India Limited (NSE), MCX Stock Exchange Limited (MCX-SX). EGFSL along with its subsidiaries offers the most comprehensive avenues for investments and is engaged in the businesses including stock broking (Institutional and retail), merchant banking, commodity broking, depository participant, portfolio management, insurance broking and services rendered in connection with distribution of primary market issues and financial products like mutual funds, fixed deposits. Details of associates are available on our website i.e. www.emkayglobal.com EGFSL is registered as Research Analyst with SEBI bearing registration Number INH000000354 as per SEBI (Research Analysts) Regulations, 2014. EGFSL hereby declares that it has not defaulted with any stock exchange nor its activities were suspended by any stock exchange with whom it is registered in last five years, except that NSE had disabled EGFSL from trading on October 05, October 08 and October 09, 2012 for a manifest error resulting into a bonafide erroneous trade on October 05, 2012. However, SEBI and Stock Exchanges have conducted the routine inspection and based on their observations have issued advice letters or levied minor penalty on EGFSL for certain operational deviations in ordinary/routine course of business. EGFSL has not been debarred from doing business by any Stock Exchange / SEBI or any other authorities; nor has its certificate of registration been cancelled by SEBI at any point of time. EGFSL offers research services to clients as well as prospects. The analyst for this report certifies that all of the views expressed in this report accurately reflect his or her personal views about the subject company or companies and its or their securities, and no part of his or her compensation was, is or will be, directly or indirectly related to specific recommendations or views expressed in this report. Other disclosures by Emkay Global Financial Services Limited (Research Entity) and its Research Analyst under SEBI (Research Analyst) Regulations, 2014 with reference to the subject company(s) covered in this report EGFSL and/or its affiliates may seek investment banking or other business from the company or companies that are the subject of this material. Our salespeople, traders, and other professionals may provide oral or written market commentary or trading strategies to our clients that reflect opinions that are contrary to the opinions expressed herein, and our proprietary trading and investing businesses may make investment decisions that may be inconsistent with the recommendations expressed herein. In reviewing these materials, you should be aware that any or all of the foregoing, among other things, may give rise to real or potential conflicts of interest including but not limited to those stated herein. Additionally, other important information regarding our relationships with the company or companies that are the subject of this material is provided herein. This report is not directed to, or intended for distribution to or use by, any person or entity who is a citizen or resident of or located in any locality, state, country or other jurisdiction where such distribution, publication, availability or use would be contrary to law or regulation or which would subject EGFSL or its group companies to any registration or licensing requirement within such jurisdiction. Specifically, this document does not constitute an offer to or solicitation to any U.S. person for the purchase or sale of any financial instrument or as an official confirmation of any transaction to any U.S. person. Unless otherwise stated, this message should not be construed as official confirmation of any transaction. No part of this document may be used by private customers in United Kingdom. All material presented in this report, unless specifically indicated otherwise, is under copyright to Emkay. None of the material, nor its content, nor any copy of it, may be altered in any way, transmitted to, copied or distributed to any other party, without the prior express written permission of EGFSL . All trademarks, service marks and logos used in this report are trademarks or registered trademarks of EGFSL or its Group Companies. The information contained herein is not intended for publication or distribution or circulation in any manner whatsoever and any unauthorized reading, dissemination, distribution or copying of this communication is prohibited unless otherwise expressly authorized. Please ensure that you have read “Risk Disclosure Document for Capital Market and Derivatives Segments” as prescribed by Securities and Exchange Board of India before investing in Indian Securities Market. In so far as this report includes current or historic information, it is believed to be reliable, although its accuracy and completeness cannot be guaranteed.
This publication has not been reviewed or authorized by any regulatory authority. There is no planned schedule or frequency for updating research publication relating to any issuer.
Please contact the primary analyst for valuation methodologies and assumptions associated with the covered companies or price targets Disclaimer for U.S. persons only: This research report is a product of Emkay Global Financial Services Limited (Emkay), which is the employer of the research analyst(s) who has prepared the research report. The research analyst(s) preparing the research report is/are resident outside the United States (U.S.) and are not associated persons of any U.S. regulated broker-dealer and therefore the analyst(s) is/are not subject to supervision by a U.S. broker-dealer, and is/are not required to satisfy the regulatory licensing requirements of Financial Institutions Regulatory Authority (FINRA) or required to otherwise comply with U.S. rules or regulations regarding, among other things, communications with a subject company, public appearances and trading securities held by a research analyst account. This report is intended for distribution to "Major Institutional Investors" as defined by Rule 15a-6(b)(4) of the U.S. Securities and Exchange Act, 1934 (the Exchange Act) and interpretations thereof by U.S. Securities and Exchange Commission (SEC) in reliance on Rule 15a 6(a)(2). If the recipient of this report is not a Major Institutional Investor as specified above, then it should not act upon this report and return the same to the sender. Further, this report may not be copied, duplicated and/or transmitted onward to any U.S. person, which is not the Major Institutional Investor. In reliance on the exemption from registration provided by Rule 15a-6 of the Exchange Act and interpretations thereof by the SEC in order to conduct certain business with Major Institutional Investors.

KEI Industries (KEII IN) India Equity Research | Result Update
Emkay Research is also available on www.emkayglobal.com and Bloomberg EMKAY<GO>. Please refer to the last page of the report on Restrictions on Distribution. In Singapore, this research report or research analyses may only be distributed to Institutional Investors, Expert Investors or Accredited Investors as defined in the Securities and Futures Act, Chapter 289 of Singapore.
June 1, 2021| 13
ANALYST CERTIFICATION BY EMKAY GLOBAL FINANCIAL SERVICES LIMITED (EGFSL) The research analyst(s) primarily responsible for the content of this research report, in part or in whole, certifies that the views about the companies and their securities expressed in this report accurately reflect his/her personal views. The analyst(s) also certifies that no part of his/her compensation was, is, or will be, directly or indirectly, related to specific recommendations or views expressed in the report. The research analyst (s) primarily responsible of the content of this research report, in part or in whole, certifies that he or his associate1 does not serve as an officer, director or employee of the issuer or the new listing applicant (which includes in the case of a real estate investment trust, an officer of the management company of the real estate investment trust; and in the case of any other entity, an officer or its equivalent counterparty of the entity who is responsible for the management of the issuer or the new listing applicant). The research analyst(s) primarily responsible for the content of this research report or his associate does not have financial interests2 in relation to an issuer or a new listing applicant that the analyst reviews. EGFSL has procedures in place to eliminate, avoid and manage any potential conflicts of interests that may arise in connection with the production of research reports. The research analyst(s) responsible for this report operates as part of a separate and independent team to the investment banking function of the EGFSL and procedures are in place to ensure that confidential information held by either the research or investment banking function is handled appropriately. There is no direct link of EGFSL compensation to any specific investment banking function of the EGFSL. 1 An associate is defined as (i) the spouse, or any minor child (natural or adopted) or minor step-child, of the analyst; (ii) the trustee of a trust of which the analyst, his spouse, minor child (natural or adopted) or minor step-child, is a beneficiary or discretionary object; or (iii) another person accustomed or obliged to act in accordance with the directions or instructions of the analyst. 2 Financial interest is defined as interest that are commonly known financial interest, such as investment in the securities in respect of an issuer or a new listing applicant, or financial accommodation arrangement between the issuer or the new listing applicant and the firm or analysis. This term does not include commercial lending conducted at the arm’s length, or investments in any collective investment scheme other than an issuer or new listing applicant notwithstanding the fact that the scheme has investments in securities in respect of an issuer or a new listing applicant.
COMPANY-SPECIFIC / REGULATORY DISCLOSURES BY EMKAY GLOBAL FINANCIAL SERVICES LIMITED (EGFSL):
Disclosures by Emkay Global Financial Services Limited (Research Entity) and its Research Analyst under SEBI (Research Analyst) Regulations, 2014 with reference to the subject company(s) covered in this report-: 1. EGFSL, its subsidiaries and/or other affiliates do not have a proprietary position in the securities recommended in this report as of June 1, 2021 2. EGFSL, and/or Research Analyst does not market make in equity securities of the issuer(s) or company(ies) mentioned in this Research Report Disclosure of previous investment recommendation produced: 3. EGFSL may have published other investment recommendations in respect of the same securities / instruments recommended in this research
report during the preceding 12 months. Please contact the primary analyst listed in the first page of this report to view previous investment recommendations published by EGFSL in the preceding 12 months.
4. EGFSL , its subsidiaries and/or other affiliates and Research Analyst or his/her relative’s does not have any material conflict of interest in the securities recommended in this report as of June 1, 2021.
5. EGFSL, its subsidiaries and/or other affiliates and Research Analyst or his/her relative’s does not have actual/beneficial ownership of 1% or more securities of the subject company at the end of the month immediately preceding the June 1, 2021
6. EGFSL, its subsidiaries and/or other affiliates and Research Analyst have not received any compensation in whatever form including compensation for investment banking or merchant banking or brokerage services or for products or services other than investment banking or merchant banking or brokerage services from securities recommended in this report (subject company) in the past 12 months.
7. EGFSL, its subsidiaries and/or other affiliates and/or and Research Analyst have not received any compensation or other benefits from securities recommended in this report (subject company) or third party in connection with the research report.
8. Securities recommended in this report (Subject Company) has not been client of EGFSL, its subsidiaries and/or other affiliates and/or and Research Analyst during twelve months preceding the June 1, 2021

KEI Industries (KEII IN) India Equity Research | Result Update
Emkay Research is also available on www.emkayglobal.com and Bloomberg EMKAY<GO>. Please refer to the last page of the report on Restrictions on Distribution. In Singapore, this research report or research analyses may only be distributed to Institutional Investors, Expert Investors or Accredited Investors as defined in the Securities and Futures Act, Chapter 289 of Singapore.
June 1, 2021| 14
RESTRICTIONS ON DISTRIBUTION
General This report is not directed to, or intended for distribution to or use by, any person or entity who is a citizen or resident of or located in any locality, state, country or other jurisdiction where such distribution, publication, availability or use would be contrary to law or regulation.
Australia This report is not for distribution into Australia.
Hong Kong This report is not for distribution into Hong Kong.
Indonesia This report is being distributed in Indonesia by PT DBS Vickers Sekuritas Indonesia.
Malaysia This report is not for distribution into Malaysia.
Singapore
This report is distributed in Singapore by DBS Bank Ltd (Company Regn. No. 16800306E) or DBSVS (Company Regn. No. 1860024G) both of which are Exempt Financial Advisers as defined in the Financial Advisers Act and regulated by the Monetary Authority of Singapore. DBS Bank Ltd and/or DBSVS, may distribute reports produced by its respective foreign entities, affiliates or other foreign research houses pursuant to an agreement under Regulation 32C of the financial Advisers Regulations. Singapore recipients should contact DBS Bank Ltd at 6327 2288 for matters arising from, or in connection with the report.
Thailand This report is being distributed in Thailand by DBS Vickers Securities (Thailand) Co Ltd.
United Kingdom
This report is disseminated in the United Kingdom by DBS Vickers Securities (UK) Ltd, ("DBSVUK"). DBSVUK is authorised and regulated by the Financial Conduct Authority in the United Kingdom.
In respect of the United Kingdom, this report is solely intended for the clients of DBSVUK, its respective connected and associated corporations and affiliates only and no part of this document may be (i) copied, photocopied or duplicated in any form or by any means or (ii) redistributed without the prior written consent of DBSVUK. This communication is directed at persons having professional experience in matters relating to investments. Any investment activity following from this communication will only be engaged in with such persons. Persons who do not have professional experience in matters relating to investments should not rely on this communication.
Dubai International Financial Centre
This research report is being distributed by DBS Bank Ltd., (DIFC Branch) having its office at units 608-610, 6th Floor, Gate Precinct Building 5, PO Box 506538, Dubai International Financial Centre (DIFC), Dubai, United Arab Emirates. DBS Bank Ltd., (DIFC Branch) is regulated by The Dubai Financial Services Authority. This research report is intended only for professional clients (as defined in the DFSA rulebook) and no other person may act upon it.
United Arab Emirates
This report is provided by DBS Bank Ltd (Company Regn. No. 196800306E) which is an Exempt Financial Adviser as defined in the Financial Advisers Act and regulated by the Monetary Authority of Singapore. This report is for information purposes only and should not be relied upon or acted on by the recipient or considered as a solicitation or inducement to buy or sell any financial product. It does not constitute a personal recommendation or take into account the particular investment objectives, financial situation, or needs of individual clients. You should contact your relationship manager or investment adviser if you need advice on the merits of buying, selling or holding a particular investment. You should note that the information in this report may be out of date and it is not represented or warranted to be accurate, timely or complete. This report or any portion thereof may not be reprinted, sold or redistributed without our written consent.
United States
DBSVUSA did not participate in its preparation. The research analyst(s) named on this report are not registered as research analysts with FINRA and are not associated persons of DBSVUSA. The research analyst(s) are not subject to FINRA Rule 2241 restrictions on analyst compensation, communications with a subject company, public appearances and trading securities held by a research analyst. This report is being distributed in the United States by DBSVUSA, which accepts responsibility for its contents. This report may only be distributed to Major U.S. Institutional Investors (as defined in SEC Rule 15a-6) and to such other institutional investors and qualified persons as DBSVUSA may authorize. Any U.S. person receiving this report who wishes to effect transactions in any securities referred to herein should contact DBSVUSA directly and not its affiliate.
Other jurisdictions In any other jurisdictions, except if otherwise restricted by laws or regulations, this report is intended only for qualified, professional, institutional or sophisticated investors as defined in the laws and regulations of such jurisdictions.
Emkay Global Financial Services Ltd.
CIN - L67120MH1995PLC084899
7th Floor, The Ruby, Senapati Bapat Marg, Dadar - West, Mumbai - 400028. India
Tel: +91 22 66121212 Fax: +91 22 66121299 Web: www.emkayglobal.com