KAT2A complexes ATAC and SAGA play unique roles in cell ...
37
HAL Id: hal-03401897 https://hal.archives-ouvertes.fr/hal-03401897 Submitted on 29 Oct 2021 HAL is a multi-disciplinary open access archive for the deposit and dissemination of sci- entific research documents, whether they are pub- lished or not. The documents may come from teaching and research institutions in France or abroad, or from public or private research centers. L’archive ouverte pluridisciplinaire HAL, est destinée au dépôt et à la diffusion de documents scientifiques de niveau recherche, publiés ou non, émanant des établissements d’enseignement et de recherche français ou étrangers, des laboratoires publics ou privés. KAT2A complexes ATAC and SAGA play unique roles in cell maintenance and identity in hematopoiesis and leukemia Liliana Arede, Elena Foerner, Selinde Sterre Wind, Rashmi Kulkarni, Ana Filipa Domingues, George Giotopoulos, Svenja Kleinwächter, Maximilian Mollenhauer-Starkl, Holly Davison, Aditya Chandru, et al. To cite this version: Liliana Arede, Elena Foerner, Selinde Sterre Wind, Rashmi Kulkarni, Ana Filipa Domingues, et al.. KAT2A complexes ATAC and SAGA play unique roles in cell maintenance and identity in hematopoiesis and leukemia. Blood Advances, The American Society of Hematology, 2021, 6 (1), pp.165-180. 10.1182/bloodadvances.2020002842. hal-03401897
-
Upload
khangminh22 -
Category
Documents
-
view
0 -
download
0
Transcript of KAT2A complexes ATAC and SAGA play unique roles in cell ...
HAL Id: hal-03401897https://hal.archives-ouvertes.fr/hal-03401897
Submitted on 29 Oct 2021
HAL is a multi-disciplinary open accessarchive for the deposit and dissemination of sci-entific research documents, whether they are pub-lished or not. The documents may come fromteaching and research institutions in France orabroad, or from public or private research centers.
L’archive ouverte pluridisciplinaire HAL, estdestinée au dépôt et à la diffusion de documentsscientifiques de niveau recherche, publiés ou non,émanant des établissements d’enseignement et derecherche français ou étrangers, des laboratoirespublics ou privés.
KAT2A complexes ATAC and SAGA play unique rolesin cell maintenance and identity in hematopoiesis and
leukemiaLiliana Arede, Elena Foerner, Selinde Sterre Wind, Rashmi Kulkarni, AnaFilipa Domingues, George Giotopoulos, Svenja Kleinwächter, Maximilian
Mollenhauer-Starkl, Holly Davison, Aditya Chandru, et al.
To cite this version:Liliana Arede, Elena Foerner, Selinde Sterre Wind, Rashmi Kulkarni, Ana Filipa Domingues, etal.. KAT2A complexes ATAC and SAGA play unique roles in cell maintenance and identity inhematopoiesis and leukemia. Blood Advances, The American Society of Hematology, 2021, 6 (1),pp.165-180. �10.1182/bloodadvances.2020002842�. �hal-03401897�
American Society of Hematology2021 L Street NW, Suite 900,Washington, DC 20036Phone: 202-776-0544 | Fax [email protected]
KAT2A complexes ATAC and SAGA play unique roles in cell maintenance and identity inhematopoiesis and leukemiaTracking no: ADV-2020-002842R3
Liliana Arede (Department of Haematology University of Cambridge, UK, United Kingdom) Elena Foerner(University of Cambridge, United Kingdom) Selinde Wind (University of Cambridge, United Kingdom) RashmiKulkarni (University of Cambridge, United Kingdom) Ana Filipa Domingues (University of Cambridge, UnitedKingdom) George Giotopoulos (University of Cambridge Department of Haematology, United Kingdom) SvenjaKleinwächter (University of Cambridge, United Kingdom) Maximilian Mollenhauer-Starkl (Brunel UniversityLondon, United Kingdom) Holly Davison (Brunel University London, United Kingdom) Aditya Chandru(University of Cambridge, United Kingdom) Ryan Asby (University of Cambridge Department of Haematology,United Kingdom) Ralph Samarista (Brunel University London, United Kingdom) Shikha Gupta (University ofCambridge, United Kingdom) Dorian Forte (Institute of Hematology "L. e A. Seràgnoli", Italy) AntonioCurti (Institute of Hematology, Italy) Elisabeth Scheer (Centre National de la Recherche Scientifique(CNRS), UMR7104, France) Brian Huntly (Department of Haematology, University of Cambridge, Cambridge,UK, United Kingdom) Laszlo Tora (Centre National de la Recherche Scientifique (CNRS), UMR7104, 67404Illkirch, France; Institut National de la Santé et de la Recherche Médicale (INSERM), U1258, 67404Illkirch, France, France) Cristina Pina (Centre for Genome Engineering and Maintenance - CenGEM; BrunelUniversity London, United Kingdom)
Abstract:Epigenetic histone modifiers are key regulators of cell fate decisions in normal and malignanthematopoiesis. Their enzymatic activities are of particular significance as putative therapeutic targetsin leukemia. In contrast, less is known about the contextual role in which those enzymatic activitiesare exercised, and specifically, how different macromolecular complexes configure the same enzymaticactivity with distinct molecular and cellular consequences. We focus on KAT2A, a lysineacetyltransferase responsible for Histone 3 Lysine 9 acetylation, which we recently identified as adependence in Acute Myeloid Leukemia stem cells, and that participates in 2 distinct macromolecularcomplexes: Ada Two-A-Containing (ATAC) and Spt-Ada-Gcn5-Acetyltransferase (SAGA). Through analysis ofhuman cord blood hematopoietic stem cells and progenitors, and of myeloid leukemia cells, we identifyunique respective contributions of the ATAC complex to regulation of biosynthetic activity inundifferentiated self-renewing cells, and of the SAGA complex to stabilisation or correct progression ofcell type-specific programs with putative preservation of cell identity. Cell type and stage-specificdependencies on ATAC and SAGA-regulated programs explain multi-level KAT2A requirements in leukemia andin erythroid lineage specification and development. Importantly, they set a paradigm against whichlineage specification and identity can be explored across developmental stem cell systems.
Conflict of interest: No COI declared
COI notes:
Preprint server: Yes; bioRxiv 10.1101/2020.05.14.096057
Author contributions and disclosures: CP conceived the study; L.A. and C.P. designed the study; L.A.,E.F., S.W., A.F.D., G.G., S.K., M.M-S. H.D., A.Ch., R.A., R.S., and S.G. collected and assembled data;G.G., D.F., A.Cu. E.S., B.J.P.H., and L.T. contributed critical reagents; L.A.; E.F.; S.W., R.K. andC.P. analysed data; L.A. and C.P. interpreted data; L.A. and C.P. wrote the manuscript. All authorsapproved the final version of the manuscript.
Non-author contributions and disclosures: No;
Agreement to Share Publication-Related Data and Data Sharing Statement: ChIP-seq and RNA-seq data havebeen deposited in GEO (accession numbers GSE128902 and GSE128512). All other requests can be emaileddirectly to the corresponding author.
Clinical trial registration information (if any):
Dow
nloaded from http://ashpublications.org/bloodadvances/article-pdf/doi/10.1182/bloodadvances.2020002842/1828797/bloodadvances.2020002842.pdf by guest on 29 O
ctober 2021

Arede 1
KAT2A complexes ATAC and SAGA play unique roles in cell maintenance and identity
in hematopoiesis and leukemia
Liliana Arede1,2
, Elena Foerner1*
, Selinde Wind1*
, Rashmi Kulkarni1, Ana Filipa
Domingues1, George Giotopoulos
1,3, Svenja Kleinwaechter
1, Maximilian Mollenhauer-
Starkl4, Holly Davison
4, Aditya Chandru
2, Ryan Asby
1,3, Ralph Samarista
4, Shikha
Gupta1,2
, Dorian Forte1,5
, Antonio Curti6, Elisabeth Scheer
7,8,9, Brian J.P. Huntly
1,3,
Laszlo Tora7,8,9
, Cristina Pina4,10#
1Department of Haematology,
2Department of Genetics and
3Wellcome Trust Cambridge
Stem Cell Institute, University of Cambridge, Cambridge, United Kingdom; 4College of
Health, Medicine and Life Sciences, Division of Biosciences, Brunel University London,
United Kingdom; 5Department of Experimental, Diagnostic and Specialty Medicine –
DIMES, Institute of Hematology "Seràgnoli", Bologna, Italy; 6IRCCS Azienda ospedaliero-
universitaria di Bologna, Istituto di Ematologia "Seràgnoli", Bologna, Italy; 7Institut de
Génétique et de Biologie Moléculaire et Cellulaire, 67404 Illkirch, France; 8Centre National
de la Recherche Scientifique (CNRS), UMR7104, 67404 Illkirch, France; 9Institut National
de la Santé et de la Recherche Médicale (INSERM), U1258, 67404 Illkirch, France and
10Centre for Genome Engineering and Maintenance (CenGEM), Brunel University London,
Uxbridge UB8 3PH, United Kingdom
*E.F. and S.W. contributed equally to this study
#Corresponding author ([email protected])
Text word count: 6089
Abstract word count: 197
Number of figures: 7
Number of tables: 0
Number of references: 57
RUNNING TITLE: KAT2A complexes in hematopoiesis and leukemia
Dow
nloaded from http://ashpublications.org/bloodadvances/article-pdf/doi/10.1182/bloodadvances.2020002842/1828797/bloodadvances.2020002842.pdf by guest on 29 O
ctober 2021

Arede 2
KEY POINTS
1. KAT2A is required at different stages of human cord blood erythroid development
with ATAC and SAGA complex specificity
2. KAT2A regulates leukemia cell maintenance and identity through specific
participation in ATAC and SAGA complexes
ABSTRACT
Epigenetic histone modifiers are key regulators of cell fate decisions in normal and
malignant hematopoiesis. Their enzymatic activities are of particular significance as putative
therapeutic targets in leukemia. In contrast, less is known about the contextual role in which
those enzymatic activities are exercised, and specifically, how different macromolecular
complexes configure the same enzymatic activity with distinct molecular and cellular
consequences. We focus on KAT2A, a lysine acetyltransferase responsible for Histone 3
Lysine 9 acetylation, which we recently identified as a dependence in Acute Myeloid
Leukemia stem cells, and that participates in 2 distinct macromolecular complexes: Ada Two-
A-Containing (ATAC) and Spt-Ada-Gcn5-Acetyltransferase (SAGA). Through analysis of
human cord blood hematopoietic stem cells and progenitors, and of myeloid leukemia cells,
we identify unique respective contributions of the ATAC complex to regulation of biosynthetic
activity in undifferentiated self-renewing cells, and of the SAGA complex to stabilisation or
correct progression of cell type-specific programs with putative preservation of cell identity.
Cell type and stage-specific dependencies on ATAC and SAGA-regulated programs explain
multi-level KAT2A requirements in leukemia and in erythroid lineage specification and
development. Importantly, they set a paradigm against which lineage specification and
identity can be explored across developmental stem cell systems.
INTRODUCTION
KAT2A is a histone acetyltransferase required for correct mesodermal specification in the
developing mouse embryo1. It stabilises pluripotency of mouse embryonic stem cells
2, and is
required for survival of neural stem and progenitor cells3. In hematopoiesis, Kat2a has been
shown to regulate proliferation and activation of T cell subsets4, and maturation of invariant
natural killer T (iNKT) cells5, and it restricts terminal differentiation of granulocytic cells
6.
We7 and others
6 have not found that Kat2a play a central role in hematopoietic stem cells. In
contrast, we have identified KAT2A as a requirement in Acute Myeloid Leukemia (AML)
cell lines and patient samples8. Using a conditional knockout mouse model, we showed that
Dow
nloaded from http://ashpublications.org/bloodadvances/article-pdf/doi/10.1182/bloodadvances.2020002842/1828797/bloodadvances.2020002842.pdf by guest on 29 O
ctober 2021
Arede 3
Kat2a loss results in transcriptional instability of general metabolic regulation programs such
as translation and ribosomal protein synthesis, leading to probabilistic loss of functional
leukemia stem-like cells7. Kat2a exerts transcriptional control through histone or non-histone
lysine acetylation, including in the examples cited within the hematopoietic system.
Specifically, regulation of leukemia stem-like cells7 and control of T-cell subset activation
4
are linked to histone 3 lysine 9 acetylation (H3K9ac) at gene promoters, a role that is
evolutionary conserved from the original identification of Gcn5 in yeast9, and associated with
transcriptional activation10
. Granulocytic and iNKT cell maturation, on the other hand,
depend on protein acetylation of key transcriptional regulators, respectively Cebpa6 and
Egr25. More recently, Kat2a has been shown to catalyse histone succinylation, another acyl
modification which, like H3K9ac, is associated with transcriptional activation11
.
KAT2A exerts its activity in the context of 2 macromolecular complexes,
Ada-Two-A-Containing (ATAC) and Spt-Ada-Gcn5-Acetyltransferase (SAGA) (Fig. 1A).
These complexes share the histone acetyl-transferase (HAT) activity by KAT2A, with a
single subunit difference within the HAT module (TADA2A in ATAC and TADA2B in
SAGA)12
. Additionally, the 2 complexes exhibit different chromatin specificities and regulate
distinct sets of genes13
. Integration of KAT2A in either complex is a requirement for its full
HAT activity14
, however analysis of their differential contributions to KAT2A function in a
given system has not been performed to date. The yeast KAT2A-containing SAGA was the
first multi-modular HAT complex to be isolated10
. Since then, several studies unveiled its
molecular architecture: SAGA comprises 19 subunits organised in 4 functionally distinct
modules15
, a structure highly conserved from yeast to human12
. In addition to the KAT2A
participating HAT module, which also includes TADA2B, TADA3 and CCDC101 (SGF29),
SAGA contains: (1) a H2B de-ubiquitination (DUB) module centred on USP22 enzymatic
activity; (2) a Core module comprising SPT20, which is specific to SAGA, and 5 TATA-
binding protein associated factors (TAFs), 3 of which are shared with TFIID; and (3) the
transcription factor interaction module, TRRAP. Two recent reports on the Cryo-EM
structure of the yeast SAGA complex described the interactions between the different
modules with key implications for gene activation16,17
. The SAGA Core module contains an
octamer-like fold that facilitates TBP loading onto TATA promoters17
; the two enzymatic
HAT and DUB modules connect flexibly to the Core16,17
, suggesting functional independence
between them. The ATAC complex, in turn, is exclusive to multicellular eukaryotes12
. It was
first linked to chromatin remodelling functions in Drosophila18
, where it preferentially targets
histone H419
. ATAC histone substrates in mammalian cells are less clear, although human
Dow
nloaded from http://ashpublications.org/bloodadvances/article-pdf/doi/10.1182/bloodadvances.2020002842/1828797/bloodadvances.2020002842.pdf by guest on 29 O
ctober 2021
Arede 4
ATAC preferentially modifies H320
. ATAC specific elements include DNA-binding subunit
ZZZ3, HAT module component TADA2A, and YEATS2, which is required for assembly of
the ATAC complex and has acetyl-reading activity21
. Moreover, ATAC comprises additional
HAT activity by KAT14, which is essential for ATAC assembly and required in embryonic
development22
. Additionally, both KAT2A-containing complexes have been implicated in
malignant transformation23
. ATAC-YEATS2 was shown to be highly amplified in non-small
cell lung cancer (NSCLC) and required for malignant cell survival21
. SAGA complex
cofactor TRRAP interacts with multiple proteins key to oncogenesis, such as c-Myc and E2F
proteins24
. Expression of SAGA USP22 associates with an oncogenic signature of poor
prognosis25
. However, recent studies propose a tumor suppressor function of USP2226
,
including in AML27
, suggesting dependency on cell context for functional consequences and
fate decisions.
Herein, we attempted to characterize the role of KAT2A-containing ATAC and SAGA
complexes in normal and leukemic blood cell function. We identified unique ATAC-specific
requirements for specification or propagation of early erythroid-committed progenitors,
which were distinct from the participation of the SAGA complex in progression of erythroid
differentiation. In AML cells, ATAC and SAGA controlled distinct aspects of biosynthetic
maintenance and identity preservation of leukemia cells, thus suggesting a dichotomy
between ATAC and SAGA-centred KAT2A functions that has implications for normal and
malignant developmental decisions.
METHODS
Cell lines
K562, MOLM13 and Kasumi-1 lines (kind gift from Brian Huntly, Cambridge, UK) and
KG1a (kind gift from Joanna Baxter, Cambridge Blood and Stem Cell Biobank) were
maintained in RPMI supplemented with 20% FBS (Fetal Bovine Serum, Invitrogen), 1%
Penicillin/Streptomycin/Amphothericin (P/S/A, Invitrogen) and 2mM L-Gln. HEK 293T
cells were grown in DMEM supplemented with 10% FBS, and P/S/A and L-Gln as above.
Cultures were kept at 37°C and 5% CO2.
Human CB CD34+ cells and AML patient samples
CB samples and AML patient samples were obtained with informed consent under local
ethical approval, REC 07MRE05-44 (Cambridge) and EC code number 94/2016/O/Tess
(Bologna). Mononuclear cells (MNC) were isolated by Ficoll-Paque density gradient
Dow
nloaded from http://ashpublications.org/bloodadvances/article-pdf/doi/10.1182/bloodadvances.2020002842/1828797/bloodadvances.2020002842.pdf by guest on 29 O
ctober 2021
Arede 5
(StemCell Technologies) centrifugation. CB MNC were enriched for CD34+ cells using the
RosetteSepTM Human CB CD34 Pre-Enrichment Cocktail (Stem Cell Technologies) as per
manufacturer’s instructions.
Lentiviral packaging and transduction
Viral constructs containing control shRNA (CTRLsh, non-eukaryotic gene targeting) or
shRNA targeting KAT2A (KAT2Ash), SGF29 (CCDC101sh), SUPT20H (SUPT20Hsh and
SUPT20sh2) USP22 (USP22sh), ZZZ3 (ZZZ3sh), TADA2A (TADA2Ash and TADA2Ash2),
and TADA2B (TADA2Bsh) (Supplemental Table 1) were packaged in HEK 293T cells as
previously described28
, using Turbofect (Thermo) or trans-IT (Mirus) as lipofection reagents.
Cell lines were transduced overnight with 1-2 T75 packaging flask-equivalents (FE)/106 cells
and washed the following day as described28
. GFP+ cells were sorted and used in downstream
assays 4 days later. CD34+ CB cells were pre-stimulated in serum-free medium (HSC
expansion medium XF, Miltenyi Biotec) with SCF, TPO and Flt3L (respectively 200, 20 and
20 ng/mL) for up to 24h and transduced overnight using 2FE/2-3*105 cells. Cells were
washed the following day and cultured in half the cytokine concentration for an additional 2-
3 days prior to sorting.
Colony-forming cell (CFC) assays
Sorted CB cells were seeded in methyl-cellulose-based semi-solid medium (StemMACS
HSC-CFU Media complete with EPO, Miltenyi Biotec) for assessment of multi-lineage
colony-forming activity. Sorted cells were counted and resuspended in IMDM 10% FBS
supplemented with P/S/A and 2mM L-Gln prior to addition to the semi-solid medium, which
was plated in duplicate onto 35mm-dishes, with 200-300 cells/dish. In the case of CFC assays
performed in the presence of the KAT2A inhibitor MB-3 (Abcam), this was added to the
methylcellulose in a final concentration of 200M, and dispersed by vortexing, prior to
addition of CB cells, as described8. Colonies were scored by microscopy at 10-12 days at the
point of full colony hemoglobinization.
Mixed lineage differentiation cultures
CB CD34+ cells were cultured for up to 7 days in serum-free liquid culture (StemSpan, Stem
Cell Technologies) in the presence of SCF, Flt3-L, IL-3, and IL-6 (1x CC100, Stem Cell
Technologies) and EPO 3U/l (R&D). Transduced CD34+ / HSC were seeded as GFP+ cells
Dow
nloaded from http://ashpublications.org/bloodadvances/article-pdf/doi/10.1182/bloodadvances.2020002842/1828797/bloodadvances.2020002842.pdf by guest on 29 O
ctober 2021
Arede 6
immediately after sorting. In other experiments, enriched CD34+ cells were resuspended in
serum-free medium and cytokines, in the presence on MB-3 (Abcam) 100M. Fresh
cytokines and, where appropriate, inhibitor and vehicle DMSO, were added every 2-3 days.
At different time points, cells were tested by flow cytometry for the presence of CD34,
CD13, and CD71/CD235a surface markers.
Erythroid differentiation and induction cultures
Transduced HSC were tested in erythroid differentiation conditions in serum-free liquid
culture (HSC expansion medium XF, Miltenyi Biotec) in the presence of hydrocortisone (10-
5M), SCF (100 ng/mL), TPO (10 ng/mL) and EPO (3U/mL). Cultures were followed up for 9
days with daily live and dead cell counts and regular flow cytometry analysis for CD34,
CD71 and CD235a markers (Supplemental Table 4). K562 cells were induced to the erythroid
lineage in the presence of 1.5% DMSO as described29
. Cells were monitored for
differentiation markers (CD71 and CD235a) and/or activation of erythroid-affiliated
molecular programs during a 6-day culture period.
AML-MS5 co-culture
MS5 murine bone marrow stromal cells were grown in IMDM supplemented with 10% FBS,
1% P/S/A and 2mM L-Gln. Cells were sub-cultured twice a week and passage 2 was used to
carry out experiments in 48-well plates. AML cells were thawed in PBS 2% FBS , 1 % P/S/A
and pre-stimulated with H5100 (Stem Cell Technologies) supplemented with IL-3 20 ng/mL,
G-CSF 20 ng/mL and TPO 20ng/mL (3GT, 1% HEPES, 1% P/S/A for approximately 4h.
Cells were then transduced with the desired lentiviral constructs in transduction media:
H5100 with SCF (100 ng/mL), Flt-3 (100 ng/mL), IL-3 (60 ng/mL), TPO (10 ng/mL), 1%
HEPES, 1% P/S/A. Cells were washed twice in PBS 2% FBS, 1 % P/S/A and once in H5100
1% P/S/A and seeded onto MS5 stroma. Cultures were kept at 37°C, 5% CO2 for up to three
weeks, with twice-weekly demi-population and fresh addition of H5100-3GT. For KAT2A
inhibition experiments, AML MNC were seeded onto MS-5 stroma in H5100-3GT in the
presence of 100M of MB-3 (Abcam) or DMSO (0.1%), and demi-populated as above with
fresh addition of MB-3. Cells were stained for flow cytometry analysis once a week
(Supplemental Table 4).
Dow
nloaded from http://ashpublications.org/bloodadvances/article-pdf/doi/10.1182/bloodadvances.2020002842/1828797/bloodadvances.2020002842.pdf by guest on 29 O
ctober 2021
Arede 7
Chromatin immunoprecipitation (ChIP)
For ChIP-sequencing, chromatin was prepared in duplicate from K562 cells (9 sonication
cycles, 30”ON/30”OFF) and immunoprecipitated using anti-SPT20 and anti-ZZZ3 sera
prepared in the Tora Lab13
. All procedures, including library preparation and sequencing
were performed as described7. For ChIP-qPCR, K562 cells were immunoprecipitated with
anti-H3K9ac antibody or rabbit IgG (Supplemental Table 2); eluted DNA was diluted and
quantified by SYBR green qPCR using 2μl DNA per triplicate reaction (primers in
Supplemental Table 3). Peak enrichments relative to rabbit IgG were determined using the
2ΔΔCt
method with a reference intergenic region or KRT5.
Statistical analysis
Statistical analysis was performed in GraphPad Prism 7 software (GraphPad Software). Data
are reported as mean ± SEM. Significance calculated by 2-tailed t-test at p<0.05 (see
individual figure legends for details).
RESULTS
KAT2A-containing ATAC and SAGA complexes have unique targets in hematopoietic cells
In order to identify unique ATAC and SAGA targets and characterize complex-specific roles
of KAT2A in the blood system, we performed chromatin immunoprecipitation followed by
next-generation sequencing (ChIP-seq) of ZZZ3 (ATAC-specific) and SPT20 (SAGA-
specific) subunits (Fig. 1A) in human K562 cells. K562 are a chronic myelogenous leukemia
cell line with multilineage potential: cells display aspects of molecular differentiation into
erythroid, megakaryocytic and macrophage identities under defined cytokine conditions29
; in
steady state, K562 cells represent immature leukemia blasts with self-renewal properties.
K562 cells have been previously used as a model for understanding molecular mechanisms of
normal, particularly erythroid, and malignant blood specification30-33
. We made use of
specific sera against human ZZZ3 and SPT20 and performed ChIP-seq experiments in
duplicate in self-renewing K562 cells. As in previous reports13
, we found limited overlap
between ATAC and SAGA targets (Fig. 1B; Supplemental File 1). Bound peaks were
preferentially found in the vicinity of the transcriptional start site (TSS) (Fig. 1C) and were
robustly enriched for ZZZ3 and SPT20 experimental targets, respectively (Fig. S1A-B), as
catalogued in the ENCODE database34
. ZZZ3 peaks were more proximal than SPT20’s, in
contrast with previously described enhancer association of ATAC complexes in lymphoblast
Dow
nloaded from http://ashpublications.org/bloodadvances/article-pdf/doi/10.1182/bloodadvances.2020002842/1828797/bloodadvances.2020002842.pdf by guest on 29 O
ctober 2021
Arede 8
and HeLa cells13
. Our results are nevertheless consistent with a distinct ZZZ3 ChIP-seq
experiment in human NSCLC cells, which revealed strong enrichment of ZZZ3 peaks in
regions ±1 kb of TSS21
. This suggests that ATAC-complex enhancer region occupancy may
be cell type or context-dependent. Interrogation of functional associations of ZZZ3 and
SPT20 peaks highlighted complex-specific biologies (Fig. S1C-D). These are reflected in
distinct gene ontology categories associated with complex-specific peaks, which encompass
RNA and ribosomal metabolism in the case of ATAC (Fig. 1D and S1C) and transcriptional
activity for SAGA (Fig. S1D). Moreover, SAGA specifically binds red blood cell-associated
genes (Fig. 1D), which may indicate a unique role in erythroid differentiation or identity.
Inspection of publicly available K562 ChIP-seq datasets in the ENCODE database confirmed
that SPT20 and ZZZ3-bound regions coincided with H3K9ac peaks, a hallmark of KAT2A
enzymatic activity (Fig. 1E)9. By making use of lentiviral-delivered shRNA targeting SPT20
or ZZZ3, we verified that selected SAGA and ATAC ChIP-seq target loci, did indeed reduce
promoter H3K9ac (Fig. 1F) upon SUPT20H and ZZZ3 knockdown (Fig. 1G, S1E),
respectively. The same target loci had reduced gene expression upon SUPT20H or ZZZ3 loss,
suggesting that the chromatin binding had activating consequences for gene expression in a
complex-specific manner (Fig. 1G). Observed gene expression changes could be partially
recapitulated upon KAT2A gene expression knockdown (Fig. S1F-G), particularly in respect
of ZZZ3-bound elements, which could reflect differential dependence and/or redundance of
histone acetyltransferase activity in either complex. Indeed, K562 cells were more clearly
dependent on ZZZ3 than on SPT20 for propagation in culture (Fig. S1H). Loss of KAT2A had
an intermediate effect (Fig. S1H), in line with independent activities of each complex in
hematopoietic cell maintenance and/or identity, which might be balanced by the action of
KAT2A.
We have recently established a role for KAT2A7,8
in maintenance of AML cells, which could
be akin to our observations in K562 cells. In contrast, we and others failed to identify a
specific requirement for Kat2a in normal mouse hematopoiesis6,7
, which contrasts with
SAGA SPT20 chromatin binding of erythroid lineage loci. We therefore sought to
systematically dissect SAGA and ATAC-mediated KAT2A contributions to normal and
myeloid leukemic hematopoiesis in primary and cultured human cells.
Dow
nloaded from http://ashpublications.org/bloodadvances/article-pdf/doi/10.1182/bloodadvances.2020002842/1828797/bloodadvances.2020002842.pdf by guest on 29 O
ctober 2021

Arede 9
ATAC is selectively required for erythroid specification from cord blood HSC
We started by inspecting putative differential functional contributions of SAGA and ATAC
complexes to normal human hematopoiesis by transducing CD34+ cord blood (CB) cells
with lentiviral-delivered ZZZ3 or SUPT20H shRNAs (Fig. 2A). We flow-sorted transduced
(GFP+) CD34+ cells as stem and multipotent progenitor cells (HSC) or as lineage-restricted
myelo-lymphoid (MLP), megakaryocytic-erythroid (MEP) and granulocytic-monocytic
(GMP) progenitors (Fig. 2B), and assessed their cell differentiation and proliferation potential
in colony-forming (CFC) progenitor assays (Fig. S2A). We did not observe differences in the
stem and progenitor proportions of transduced cells with either construct (Fig. S2B-C). In
contrast, CFC assay output revealed a unique defect in erythroid (E) specification from HSC
upon ZZZ3 loss (Fig. 2C), with no changes to generation of mixed-lineage (Mix) or GM
colonies. Colony formation from downstream lineage-restricted progenitors was not affected,
suggesting a unique requirement for ZZZ3 in early erythroid commitment, and a dispensable
role for the ATAC component post-erythroid commitment, as well as in the myelo-monocytic
lineages. SUPT20H expression knockdown, on the other hand, did not result in changes in
colony-forming efficiency from either HSC or lineage-restricted progenitors (Fig. 2D).
However, knockdown of the de-ubiquitinase component of the SAGA complex, USP22 (Fig.
S2D-E), resulted in loss of erythroid colony formation from committed MEP (Fig. S2F),
which did not significantly affect pre-commitment HSC and multipotent progenitors (Fig.
S2F). In agreement, proportions of CD34+ progenitors were unaffected (Fig. S2G). Taken
together, the data support contrasting roles for the ATAC and SAGA complexes in normal
human blood progenitor biology, with early erythroid lineage specification dependent on
ZZZ3. SAGA elements, in turn, participate in development of the erythroid lineage post-
commitment, as suggested by gene regulation in K562 cells, although their requirement may
be less absolute.
KAT2A regulates human CB erythroid progenitor specification and survival
Given the differential role of ATAC and SAGA elements in the erythroid lineage, we asked if
KAT2A itself was required in human CB progenitor specification or differentiation. To
reiterate, chemical inhibition of KAT2A activity at the 100M dose effective in AML cell
lines had not resulted in an overall reduction in colony-formation from CB CD34+ cells8, and
we and others had not found a requirement for Kat2a in mouse bone marrow
hematopoiesis1,2
. Nevertheless, re-inspection of Kat2a expression in bone marrow
Dow
nloaded from http://ashpublications.org/bloodadvances/article-pdf/doi/10.1182/bloodadvances.2020002842/1828797/bloodadvances.2020002842.pdf by guest on 29 O
ctober 2021
Arede 10
subpopulations of our conditional knockout model7 revealed that gene expression ablation in
MEP was less extensive than in myelo-monocytic cells (n=4; Mean±SD: 0.39±0.20 in MEP
vs 0.13±0.08 in GMP, 2-tailed t-test p-val = 0.054), compatible with selective preservation of
unexcised Kat2a allele-carrying MEP cells and a possible partial requirement for Kat2a
expression. In agreement, transduction of CB CD34+ cells with KAT2A shRNA resulted in a
significant and specific proportional decrease in KAT2A-depleted MEP (Fig. 3A), suggesting
a defect in specification of CB progenitors committed to the erythroid lineage. Inspection of
progenitor activity of CB CD34+ cells in CFC assays upon KAT2A knockdown (Fig. S3A) or
chemical inhibition (Fig. S3B) detected a reduction in erythroid colony formation. The same
reduction was observed upon depletion of the Tudor-domain protein SGF29 (gene
CCDC101) (Fig. S3C-D), a KAT2A partner common to SAGA and ATAC complexes.
Equally, culture of KAT2A knockdown (Fig. S3E) or MB-3 inhibited (Fig. S3F) CD34+ cells
in mixed-lineage differentiation conditions resulted in relative loss of differentiated erythroid
cells, compatible with hindered specification of the red blood cell lineage. Dissection of HSC
and progenitor CD34+ compartments revealed that loss of KAT2A affected erythroid lineage
output from both HSC and MEP (Fig. 3B) without changes to myelo-monocytic lineage
output (Fig. 3B), thus capturing both ATAC and SAGA-associated effects. Quantitative RT-
PCR transcriptional analysis of KAT2A knockdown HSC shows down-regulation of early
erythroid regulatory genes, namely GATA2 and EPOR, (Fig. 3C), a finding compatible with
the global reduction of erythroid and megakaryocytic programs apparent upon RNA-seq
analysis (Fig. 3D-E and Supplemental File 2). Analysis of effects of KAT2A knockdown on
cell cycle and apoptosis is suggestive of putative effects on cell survival peri-erythroid
commitment (Fig. S3G-H), with specific increases in apoptotic HSC and MEP, which do not
extend to other lineages. Taken together, the data support a function for KAT2A in
specification and/or survival of erythroid-megakaryocytic progenitors.
SAGA facilitates progression of erythroid differentiation
Colony-forming progenitor assays of CB CD34+ cells associated with loss of KAT2A-
containing ATAC complexes with impairment of early erythroid and megakaryocytic
specification (Fig. 2C). The data also suggested that KAT2A-containing SAGA complexes
may play a role in erythroid differentiation post-commitment (Fig. S2F). However, CFC
assays are end-point assays that do not permit a detailed dissection of mechanisms of
differentiation, and we attempted to overcome this limitation using a liquid culture system.
Differentiation of total CB CD34+ cells in the presence of hydrocortisone, SCF, TPO and
Dow
nloaded from http://ashpublications.org/bloodadvances/article-pdf/doi/10.1182/bloodadvances.2020002842/1828797/bloodadvances.2020002842.pdf by guest on 29 O
ctober 2021
Arede 11
EPO resulted in progressive loss of CD34 and accumulation of glycophorin A (CD235a)-
positive cells, denoting effective erythroid differentiation (Fig. 4A), which was not
qualitatively impaired upon KAT2A knockdown (Fig. 4B). However, erythroid differentiation
cultures initiated from KAT2A-depleted HSC were quantitatively impaired, being severely
restricted in their expansion (Fig. 4C). Reduced KAT2A knockdown cell growth was
accompanied by a general trend towards increased cell death (Fig. S4A), compatible with the
observed KAT2A role in HSC and MEP cell survival. To circumvent the limiting cell
numbers in transduced primary CB cultures, we inspected erythroid lineage progression and
associated molecular programs in K562 cells. Exposure of K562 cells to 1.5% DMSO
resulted in accumulation of CD235a+ cells and progressive loss of the earlier CD71
transferrin receptor (Fig. S4B) and was accompanied by loss of GATA2 and up-regulation of
EPOR and TAL1, denoting molecular erythroid lineage progression29
(Fig. S4C). DMSO-
induced erythroid cultures initiated by KAT2A knockdown cells followed a similar molecular
progression (Fig. 4D). In contrast, SUPT20H depletion significantly perturbed induction of
erythroid programs in K562 cells, which failed to down-regulate GATA2, and variably up-
regulated EPOR and TAL1, suggestive of a defect in lineage progression (Fig. 4D). We
confirmed the findings with a second SUPT20H shRNA (SUPT20Hsh2) (Fig. S4D-F).
Accordingly, inspection of the expression pattern of SAGA-specific elements during in vitro
maturation of committed erythroid progenitors from human CB35
showed that several
elements associate with late differentiation (Fig. S4G), including members of the Core, the
SAGA-specific HAT subunit TADA2B and the H2B de-ubiquitinase USP22 (Supplemental
File 3), which specifically affected erythroid colony-formation from MEP in human CB. In
contrast, inspection of the detailed single-cell profiling of erythroid development by Tusi et
al.36
captured Kat2a and Zzz3 enrichment, but no elements of the SAGA complex, at the
transition of multipotent progenitors to the erythroid and megakaryocytic lineages (Fig. S4H;
Supplemental File 4), compatible with an early specification role of ATAC that does not
extend into terminal erythroid differentiation. Indeed, loss of ZZZ3 allowed down-regulation
of GATA2 and up-regulation of TAL1 during K562 erythroid induction (Fig. 4D). However,
EPOR was not consistently up-regulated (Fig. 4D), a trend confirmed upon knockdown of a
second ATAC element, TADA2A (Fig. S4E), which resulted in minimal EPOR up-regulation,
which significantly lower than that observed for CTRLsh (1.52±0.13 TADA2Ash vs 3.19±0.49
CTRLsh fold change relative to undifferentiated cells; p=0.0214). Inspection of the K562
ZZZ3 ChIP-seq data showed binding of the EPOR locus in one of the 2 replicate samples
(Supplemental File 1 and Fig. S4I), and we checked if ZZZ3 knockdown resulted in loss of
Dow
nloaded from http://ashpublications.org/bloodadvances/article-pdf/doi/10.1182/bloodadvances.2020002842/1828797/bloodadvances.2020002842.pdf by guest on 29 O
ctober 2021

Arede 12
H3K9ac at the EPOR promoter. Indeed, we observed that ZZZ3, but not SUPT20H loss,
decreased EPOR H3K9 acetylation (Fig. 4E), suggesting that KAT2A requirement for early
erythroid specification may be mediated by ATAC control of EPOR expression and
downstream signalling. However, we could not detect consistent down-regulation of EPOR in
steady-state K562 cells upon ZZZ3 or TADA2A knockdown (Fig. S4J), suggesting that
regulation of EPOR by ATAC may be context-dependent, and not an absolute requirement
for KAT2A-mediated regulation of early erythroid specification or survival.
In conclusion, our analysis of normal erythroid lineage progression indicates that KAT2A
plays stage-specific roles, which differentially align with each of the two complexes it
integrates. On the one hand, KAT2A regulates specification and survival of erythroid
progenitors through participation in the ATAC complex, which controls biosynthetic activity,
and to some extent, EPOR expression. On the other hand, KAT2A fine-tunes progression of
erythroid lineage programs through participation in SAGA, which is only required in fully-
committed progenitors and may play a contributory rather than an absolute role. Notably,
SUPT20H regulation of erythroid molecular progression in K562 cells exceeds the
contribution of KAT2A itself. It is possible that SAGA complexes also utilise the orthologue
histone acetyltransferase KAT2B in this context, which can compensate for KAT2A loss.
Increased KAT2B expression in progressed erythroid differentiation, accompanying up-
regulation of SAGA elements (Supplemental File 3) is compatible with this view.
KAT2A complexes uniquely maintain proliferation and identity of MOLM13 AML cells
Having demonstrated that KAT2A-containing ATAC and SAGA complexes differentially
sustain early lineage establishment, and differentiation of erythroid progenitor cells from
human CB, we asked whether they also made specific contributions to AML biology. We
started by investigating the model AML cell line MOLM13, which we had previously shown
to be dependent on KAT2A expression and activity8. We knocked down expression of ATAC
elements ZZZ3 and TADA2A, and of SAGA components SUPT20H and TADA2B (Fig. 5A),
all of which, like KAT2A depletion, impacted expansion of MOLM13 cultures (Fig. S5A-B).
At a molecular level, depletion of ATAC, but not SAGA elements, impacted expression of
ribosomal protein genes (Fig. 5B), in line with a pervasive control of protein biosynthetic
activity by the ATAC complex, which we observed in K562 cells, and others also reported in
lung cancer cell lines depleted of ZZZ3 and YEATS2 expression21,37
. Analysis of expression
of self-renewal signature genes HOXA9 and HOXA10, showed a more extensive association
with ATAC elements (Fig. 5C). Interestingly, despite the selective impact of ATAC elements
Dow
nloaded from http://ashpublications.org/bloodadvances/article-pdf/doi/10.1182/bloodadvances.2020002842/1828797/bloodadvances.2020002842.pdf by guest on 29 O
ctober 2021
Arede 13
on gene expression, loss of both SUPT20H and ZZZ3 resulted in depletion of H3K9ac in the
respective ribosomal protein and HOX gene promoters (Fig. 5D), suggesting that locus
regulation may be more complex than the promoter binding observed in K562 cells. Loss of
KAT2A itself affects ribosomal protein gene expression, but not HOXA genes (Fig. 5B-C).
This recapitulates our MLL-AF9 Kat2a KO leukemia mouse model7, in which progressive
depletion of leukemia stem-like cells does not seem dependent on the classical Hoxa
signature. Despite some ambiguity at a molecular level, ATAC and SAGA complexes do
make a distinct cellular impact on the biology of MOLM-13 cells. Loss of ATAC ZZZ3 and
TADA2A arrest cell cycle progression in G0/G1 (Fig. 6A; Fig. S5C). The proliferation defect
is reflected by a reduced number of ZZZ3 knockdown cells entering cell division (Fig. 6B-C)
over a 3-day culture period (Fig. S5D), as captured by divisional tracking (Fig. S5E). We
asked if the proliferation defect consequent to ATAC loss affected MOLM13 cell self-
renewal, as measured by in vitro re-plating of CFC assays. Indeed, although neither ATAC
(TADA2A) nor SAGA (SUPT20H) knockdowns impacted initial colony-formation, ATAC
alone affected re-plating of colony assays (Fig. 6D and S5F), suggesting an effect on self-
renewal. In contrast, loss of SAGA SUPT20H resulted in extensive differentiation of
MOLM13 cells (Fig. 6E-F; Fig. S5G), suggesting a role in preservation of cell identity,
which is not unlike SAGA contribution to development of human erythroid cells. Despite a
trend towards enhanced apoptosis of KAT2A knockdown cells (Fig. 6G; Fig. S5H), which
could be an end-point consequence of enhanced differentiation (Fig. 6E-F; Fig. S5G), we did
not observe a consistent apoptotic response to knockdown of SAGA (SUPT20H and
TADA2B), or indeed ATAC (ZZZ3 and TADA2A) elements (Fig. 6G; Fig. S5H), suggesting
that control of cell survival is not central to KAT2A complex-mediated maintenance of
MOLM13 AML cells.
Overall, the data support distinct roles for ATAC and SAGA in the model AML cell line
MOLM13. ATAC controls biosynthetic activity and impacts self-renewal of MOLM13 cells
through molecular control of HOXA genes and regulation of cell division. SAGA, on the
other hand, preserves cell identity and impedes differentiation. The dichotomy of effects
captures different aspects of KAT2A regulation of MOLM13 cells and MLL-AF9-driven
leukemia7 and broadly aligns with differential participation of KAT2A complexes in normal
hematopoiesis.
Dow
nloaded from http://ashpublications.org/bloodadvances/article-pdf/doi/10.1182/bloodadvances.2020002842/1828797/bloodadvances.2020002842.pdf by guest on 29 O
ctober 2021
Arede 14
KAT2A-containing SAGA and ATAC complexes regulate cultured and primary
CD34+AML cells
Finally, we sought to extend our analysis of AML cells to include CD34+ lines not originally
covered by the screen that established KAT2A as a critical regulator of AML cells8.
Similarly, we investigated primary CD34+ AML patient samples, for which stem-like
compartments have been more clearly established38
. We initially focused on the CD34+ AML
cell lines KG1a and Kasumi1, both of which represent minimally differentiated AML
FAB M1 and M2, respectively, and carry distinct molecular abnormalities (KG1a,
FGFR1OP2-FGFR1 fusion; Kasumi1, RUNX1-RUNX1T1 fusion) representative of human
disease39,40
. In both models, loss of ATAC, but not SAGA elements, restricted cell cycle
progression (Fig. 7A; Fig. S6A). Similar to what had been observed in MOLM13 cells, none
of the cell lines displayed increased apoptosis in response to loss of KAT2A complexes (Fig.
S6B-C). We investigated differentiation consequences of loss of ATAC or SAGA
components in KG1a cells, and observed down-regulation of the CD34 marker by flow
cytometry upon ZZZ3 and SUPT20H loss (Fig. 7B-C). However, only SUPT20H knockdown
resulted in morphological differentiation along the monocytic lineage (Fig. 7D-E), supporting
the notion that the undifferentiated state of AML cells is sustained through SAGA activity.
Finally, we attempted to transduce primary CD34+ AML patient blasts (Supplemental Table
5) with our lentiviral vectors delivering shRNAs against KAT2A, SUPT20H or ZZZ3. We
could observe transduced GFP+ cells in less than 50% of the samples transduced, and kept
the cells in culture for 2-3 weeks in the presence of MS5 stroma, as described41
, following up
their expansion as well as the preservation of CD34+ and candidate phenotypic leukemia
stem-like (L-)GMP (Fig. S7A). Downregulation of KAT2A and ZZZ3, but, in the sample
analysed, not of SUPT20H, resulted in reduced expansion of transduced AML cells (Fig. 7F),
which specifically affected CD34+ (Fig. 7G) and/or L-GMP (Fig. 7H), suggesting a loss of
self-renewal potential. Chemical inhibition of KAT2A activity using MB-38 had a similar
effect on preservation of CD34+ cells (Fig. S7B), which impacted the proportion of L-GMP
(Fig. S7C).
Thus, the data suggest that KAT2A-containing complexes, particularly ATAC, play a role in
maintenance of candidate leukemia self-renewing CD34+ cells, with SAGA putatively
contributing to the AML differentiation block.
Dow
nloaded from http://ashpublications.org/bloodadvances/article-pdf/doi/10.1182/bloodadvances.2020002842/1828797/bloodadvances.2020002842.pdf by guest on 29 O
ctober 2021

Arede 15
DISCUSSION
In this study, we dissected the roles of KAT2A in normal and malignant human
hematopoiesis through analysis of the macromolecular complexes ATAC and SAGA, in
which KAT2A exerts its HAT activity. We have aligned the roles of ATAC with
maintenance of biosynthetic molecular activity, namely control of ribosomal protein and
translation-associated genes. SAGA, on the other hand, participates in activation or
maintenance of molecular programs underlying the characteristics of individual cell types, a
property we equate with preservation of cell identity.
In the context of normal hematopoiesis, ATAC control of ribosomal protein genes selectively
affects early stages of erythropoiesis, a lineage previously shown to be uniquely dependent on
ribosomal assembly and rates of protein synthesis42,43
, as captured by the selective erythroid
defects of congenital ribosomopathies such as Diamond-Blackfan Anemia44
. Selective loss of
individual ribosomal proteins45
or of global ribosomal protein regulators such as BMI146
have
been shown to associate with proliferation and survival of early erythroid committed cells,
with minimal changes to terminal differentiation. In the case of ATAC, the early nature of the
defect may be potentiated by deregulation of the EPOR locus, a candidate instructor of
erythroid lineage commitment47
. However, the transcriptional consequences of reduced
EPOR promoter acetylation upon ATAC loss are inconsistent, suggesting that it may
contribute to rather than drive the erythroid defect. In the context of leukemia, ribosomal
protein abundance and translational activity have been shown to sustain AML self-renewal42
.
We found that ribosomal protein genes are selectively affected by loss of ATAC elements,
which may nevertheless control other self-renewal associated genes, namely the underlying
HOXA signature associated with KMT2A/MLL rearrangements.
In contrast with the universal targeting of ribosomal protein genes by ATAC21,37
, SAGA may
not regulate a constant set of genes, but instead sustain the expression of the unique
transcriptomes of individual cell types. This could in part be achieved through control of
other transcriptional regulators, as suggested by the functional ChIP enrichments in our data.
In the context of normal hematopoiesis, SAGA may exert its putative identity control by fine-
tuning normal progression of erythroid programs, a role for which its requirement may be
contributory, rather than absolute. The fact that SAGA, as indeed ATAC, requirements seem
restricted to the erythroid lineage may reflect the distinctive nature of
erythroid/megakaryocytic commitment and differentiation, which segregate from the stem
cell root upstream of myeloid and lymphoid lineages48,49
with de novo establishment of
transcription programs50
. In the context of malignant hematopoiesis, SAGA participates in
Dow
nloaded from http://ashpublications.org/bloodadvances/article-pdf/doi/10.1182/bloodadvances.2020002842/1828797/bloodadvances.2020002842.pdf by guest on 29 O
ctober 2021
Arede 16
maintenance of the AML differentiation block, irrespective of the exact stage of cell
differentiation, compatible with a general control of cell identity through preservation of
existing transcriptional programs51
. Indeed, like KAT2A itself, we previously captured
several SAGA elements (SUPT20H, TRRAP, TAF5L, TAF6L, TAF12) as candidate genetic
vulnerabilities in AML cell lines in a CRISPR drop-out screen8. In contrast, we failed to
capture ATAC components in the same screen8, which nevertheless identified ribosomal
proteins as universal vulnerabilities. One possible explanation is that cultured AML cell lines
may be permissive to mild or moderate reduction in ribosomal assembly and protein
synthesis. Our observed milder consequences to cell expansion of ATAC element loss are
compatible with this view, as the screen readout8 was dependent on acute consequences to
proliferation or survival. Also, the specific ATAC-mediated defect of in vitro self-renewal of
colony-forming cells is progressively displayed, becoming apparent upon colony re-plating,
but not affecting initial colony formation. Nevertheless, ATAC biosynthetic regulatory
activities are required for supporting proliferation and, at least in some contexts self-renewal,
of cells dependent on SAGA-mediated regulation through putative stabilisation of their
unique transcriptional programs. The resulting KAT2A activity can be described as
preservation of the cellular status quo with minimal deviation towards alternative fate
choices.
Preservation of the cellular status quo as the suggested operating mode of KAT2A-containing
complexes is compatible with the role of KAT2A in sustaining, rather than initiating gene
transcription52
, as well as in stabilising promoter activity and minimising variability in
transcriptional output as recently described by us in leukemia7 and embryonic stem cells
2.
Control of transcriptional variability by KAT2A-like acetyltransferases is well established in
yeast GCN553
, which integrates a SAGA-like complex that was shown to regulate the global
transcriptome54
. Our7 and other
5 observations in mammalian cells is that Kat2a only
acetylates a subset of promoters, which are circumscribed into limited numbers of SAGA-
specific and ATAC-specific targets (this paper, and Krebs et al.13
). Although precise
identification of KAT2A complex targets may be limited by the tools available, the number
of promoters dependent on KAT2A for H3K9ac is restricted7, and functionally aligns with
the categories we captured for ATAC and SAGA binding, suggesting a more restricted use in
mammalian species as compared to yeast. Furthermore, our data suggest that ATAC and
SAGA control of gene transcription may be more specific than control of promoter H3K9
acetylation, indicating that specificity of transcriptional regulation by either complex may
rely on unique effects of their additional enzymatic activities, namely H2B de-ubiquitination
Dow
nloaded from http://ashpublications.org/bloodadvances/article-pdf/doi/10.1182/bloodadvances.2020002842/1828797/bloodadvances.2020002842.pdf by guest on 29 O
ctober 2021

Arede 17
by USP22 and H4 acetylation by KAT1455
. Accordingly, our inspection of USP22
requirements in erythropoiesis suggest that they align with the stage specificity of SAGA, but
may exceed the effects of loss of SUPT20H and more directly resemble post-commitment
contributions of KAT2A. Future studies investigating single and combined requirements of
ATAC and SAGA enzymatic subunits in locus and cellular regulation will enhance our
understanding of transcriptional control of cell state and fate decisions, including in leukemia
and the normal blood system.
In respect of control of transcriptional variability, it is somewhat surprising that Kat2a-
dependent promoters that respond to Kat2a KO with loss of H3K9ac and increased
transcriptional variability are enriched in ATAC-dependent translation-associated genes7, and
indeed enriched for ZZZ3 bound targets (ENCODE ChIP-Seq significance tool; p-val=1.94e-
4). Although both complexes regulate H3K9ac, control of transcriptional variability is
conserved from yeast, which only contains a SAGA-like complex. One possibility is that
ATAC and SAGA have evolved to nucleate distinct molecular functions of KAT2A. A more
trivial explanation is that SAGA being preferentially recruited to cell type-specific promoters,
comparison with ChIP-seq targets in different cell types may fail to detect enrichment despite
a similar molecular regulation. Future analysis of transcriptional variability in response to
parallel ATAC and SAGA-specific depletions in the same cell type should clarify this
discrepancy. Additional studies will also be needed to understand the discrepancies between
the identified requirements for KAT2A in human hematopoiesis and the broadly unperturbed
hematopoietic development in the mouse. As we pointed out, detailed analysis of our own
conditional Kat2a knockout model7 suggests a retention of MEP carrying unexcised Kat2a
alleles, compatible with a requirement in erythroid specification. Also, we reported reduced
mixed colony formation from HSC in Kat2a KO cells, which could portray a defect in early
erythroid specification. We did not observe defective colony formation from MEP, but cannot
exclude these may have been masked by persistence of unexcised cells. On the other hand, a
distinct conditional knockout model6 also failed to identify gross defects in hematopoiesis,
although detailed analysis of lineage specification was not performed. To date no other
knockouts of ATAC and SAGA subunits have been investigated in the hematopoietic system,
at the exception of Usp22, which did not affect stem and progenitor compartments or normal
myeloid differentiation27
, but had a surprising tumor suppressor effect in Kras-driven
transformation. However, a recent screen of deubiquitinating enzymes required for 4-week
bone marrow engraftment which identified Usp15 as a regulator of HSC activity in vitro and
Dow
nloaded from http://ashpublications.org/bloodadvances/article-pdf/doi/10.1182/bloodadvances.2020002842/1828797/bloodadvances.2020002842.pdf by guest on 29 O
ctober 2021
Arede 18
in vivo56
also identified Usp2227
as a possible hit, re-enforcing the notion that additional
analysis of ATAC and SAGA-mediated roles in mouse hematopoiesis is necessary.
In conclusion, we have identified unique requirements for ATAC and SAGA complexes in
normal and leukemic hematopoiesis that are suggestive of respective pervasive roles in
maintenance of biosynthetic activity and cell-type specific programs, through complex-
coordinated control of histone modifications and transcriptional stability. Individual cell types
may be differentially dependent on the activity of either complex, as suggested by a relatively
stronger dependence on ATAC at early stages of erythropoiesis. Indeed, this may pose an
opportunity for targeting of KAT2A activity through the SAGA complex in leukemia. In
support of the ATAC / SAGA functional dichotomy, a paper contemporary with this report
identifies distinct targets and roles of ATAC and SAGA elements in mouse embryonic stem
(ES) cells57
. Similar to our findings, it associates ATAC with regulation of ribosomal protein
genes and a pervasive control of pluripotency; SAGA, on the other hand, specifically
regulates naïve pluripotency genes, akin to a role in cell identity. However, the authors find
that SAGA and ATAC functional roles in mouse ES cells are independent of HAT activity57
,
which is distinct from our observations in the human haematopoietic system and, clearly, in
AML. Detailed understanding of distinct chromatin regulatory strategies of SAGA and
ATAC complexes for gene transcription, and their usage in different cells, will clarify the
discrepancy. This knowledge can be explored for stability or perturbation of cell fate in
regeneration and disease.
DATA SHARING STATEMENT
ChIP-seq and RNA-seq data have been deposited in GEO (accession numbers GSE128902
and GSE128512).
ACKNOWLEDGMENTS
This work was funded by a Rosetrees Trust PhD Studentship to LA (M650) and a Kay
Kendall Leukaemia Fund Intermediate Fellowship (KKL888) to CP. Work in the CP lab was
also funded by a Leuka John Goldman Fellowship for Future Science (2017) and a Wellcome
Trust/University of Cambridge ISSF Grant to CP. SG was funded by a Lady Tata Memorial
Trust PhD Studentship, a Trinity Henry Barlow Trust Studentship and by the Cambridge
Trust. This study was also supported by NIH RO1 grant, (1R01GM131626-01 to LT), by
Agence Nationale de la Recherche (ANR) Program grants; AAPG2019 PICen to LT, ANR
PRCI AAPG2019 EpiCAST to LT, and grant ANR-10-LABX-0030-INRT and a French State
Dow
nloaded from http://ashpublications.org/bloodadvances/article-pdf/doi/10.1182/bloodadvances.2020002842/1828797/bloodadvances.2020002842.pdf by guest on 29 O
ctober 2021
Arede 19
fund managed by the ANR under the frame program Investissements d’Avenir ANR-
10IDEX-0002-02 to IGBMC. Samples were provided by the Cambridge Blood and Stem Cell
Biobank, which is supported by the Cambridge NIHR BRC Wellcome Trust – MRC Stem
Cell Institute and the Cambridge Experimental Cancer Medicine Centre, UK. The authors
thank the Cell Phenotyping Hub NIHR BRC, the University of Cambridge – Department of
Pathology Flow Sorting Facility, and Dr Yanping Guo at the UCL Cancer Institute Flow
Cytometry Translational Technology Platform, for their expert support in cell sorting.
AUTHORSHIP
Contribution: CP conceived the study; L.A. and C.P. designed the study; L.A., E.F., S.W.,
A.F.D., G.G., S.K., M.M-S. H.D., A.Ch., R.A., R.S., and S.G. collected and assembled data;
G.G., D.F., A.Cu. E.S., B.J.P.H., and L.T. contributed critical reagents; L.A.; E.F.; S.W.,
R.K. and C.P. analysed data; L.A. and C.P. interpreted data; L.A. and C.P. wrote the
manuscript. All authors approved the final version of the manuscript.
Conflict of interests disclosure: The authors declare no conflict of interests.
Correspondence: Cristina Pina, College of Health, Medicine and Life Sciences, Division of
Biosciences, Brunel University London, Uxbridge UB8 3PH, United Kingdom; email:
REFERENCES
1. Xu W, Edmondson DG, Evrard YA, Wakamiya M, Behringer RR, Roth SY. Loss of
Gcn5l2 leads to increased apoptosis and mesodermal defects during mouse development.
Nature Genetics. 2000;26(2):229-232.
2. Moris N, Edri S, Seyres D, et al. Histone Acetyltransferase KAT2A Stabilizes
Pluripotency with Control of Transcriptional Heterogeneity. STEM CELLS.
2018;36(12):1828-1838.
3. Martinez-Cerdeno V, Lemen JM, Chan V, et al. N-Myc and GCN5 regulate
significantly overlapping transcriptional programs in neural stem cells. PLoS One.
2012;7(6):e39456.
4. Gao B, Kong Q, Zhang Y, et al. The Histone Acetyltransferase Gcn5 Positively
Regulates T Cell Activation. J Immunol. 2017;198(10):3927-3938.
5. Wang Y, Yun C, Gao B, et al. The Lysine Acetyltransferase GCN5 Is Required for
iNKT Cell Development through EGR2 Acetylation. Cell Rep. 2017;20(3):600-612.
Dow
nloaded from http://ashpublications.org/bloodadvances/article-pdf/doi/10.1182/bloodadvances.2020002842/1828797/bloodadvances.2020002842.pdf by guest on 29 O
ctober 2021
Arede 20
6. Bararia D, Kwok HS, Welner RS, et al. Acetylation of C/EBPα inhibits its
granulopoietic function. Nature communications. 2016;7:10968-10968.
7. Domingues AF, Kulkarni R, Giotopoulos G, et al. Loss of Kat2a enhances
transcriptional noise and depletes acute myeloid leukemia stem-like cells. Elife. 2020;9.
8. Tzelepis K, Koike-Yusa H, De Braekeleer E, et al. A CRISPR Dropout Screen
Identifies Genetic Vulnerabilities and Therapeutic Targets in Acute Myeloid Leukemia. Cell
Rep. 2016;17(4):1193-1205.
9. Brownell JE, Zhou J, Ranalli T, et al. Tetrahymena histone acetyltransferase A: a
homolog to yeast Gcn5p linking histone acetylation to gene activation. Cell.
1996;84(6):843851.
10. Grant PA, Duggan L, Cote J, et al. Yeast Gcn5 functions in two multisubunit
complexes to acetylate nucleosomal histones: characterization of an Ada complex and the
SAGA (Spt/Ada) complex. Genes Dev. 1997;11(13):1640-1650.
11. Wang Y, Guo YR, Liu K, et al. KAT2A coupled with the alpha-KGDH complex acts
as a histone H3 succinyltransferase. Nature. 2017;552(7684):273-277.
12. Spedale G, Timmers HTM, Pijnappel WWMP. ATAC-king the complexity of SAGA
during evolution. Genes & development. 2012;26(6):527-541.
13. Krebs AR, Karmodiya K, Lindahl-Allen M, Struhl K, Tora L. SAGA and ATAC
histone acetyl transferase complexes regulate distinct sets of genes and ATAC defines a class
of p300-independent enhancers. Mol Cell. 2011;44(3):410-423.
14. Riss A, Scheer E, Joint M, Trowitzsch S, Berger I, Tora L. Subunits of ADA-two-
Acontaining (ATAC) or Spt-Ada-Gcn5-acetyltrasferase (SAGA) Coactivator Complexes
Enhance the Acetyltransferase Activity of GCN5. J Biol Chem. 2015;290(48):28997-29009.
15. Liu G, Zheng X, Guan H, et al. Architecture of Saccharomyces cerevisiae SAGA
complex. Cell Discovery. 2019;5(1):25.
16. Wang H, Dienemann C, Stützer A, Urlaub H, Cheung ACM, Cramer P. Structure of
the transcription coactivator SAGA. Nature. 2020;577(7792):717-720.
17. Papai G, Frechard A, Kolesnikova O, Crucifix C, Schultz P, Ben-Shem A. Structure
of SAGA and mechanism of TBP deposition on gene promoters. Nature.
2020;577(7792):711-716.
18. Carré C, Ciurciu A, Komonyi O, et al. The Drosophila NURF remodelling and the
ATAC histone acetylase complexes functionally interact and are required for global
chromosome organization. EMBO reports. 2008;9(2):187-192.
Dow
nloaded from http://ashpublications.org/bloodadvances/article-pdf/doi/10.1182/bloodadvances.2020002842/1828797/bloodadvances.2020002842.pdf by guest on 29 O
ctober 2021
Arede 21
19. Suganuma T, Gutierrez JL, Li B, et al. ATAC is a double histone acetyltransferase
complex that stimulates nucleosome sliding. Nat Struct Mol Biol. 2008;15(4):364-372.
20. Helmlinger D, Tora L. Sharing the SAGA. Trends Biochem Sci. 2017;42(11):850861.
21. Mi W, Guan H, Lyu J, et al. YEATS2 links histone acetylation to tumorigenesis of
non-small cell lung cancer. Nature Communications. 2017;8(1):1088.
22. Guelman S, Kozuka K, Mao Y, et al. The Double-Histone-Acetyltransferase Complex
ATAC Is Essential for Mammalian Development. Molecular and Cellular Biology.
2009;29(5):1176-1188.
23. Koutelou E, Hirsch CL, Dent SY. Multiple faces of the SAGA complex. Curr Opin
Cell Biol. 2010;22(3):374-382.
24. McMahon SB, Van Buskirk HA, Dugan KA, Copeland TD, Cole MD. The novel
ATM-related protein TRRAP is an essential cofactor for the c-Myc and E2F oncoproteins.
Cell. 1998;94(3):363-374.
25. Schrecengost RS, Dean JL, Goodwin JF, et al. USP22 regulates oncogenic signaling
pathways to drive lethal cancer progression. Cancer Res. 2014;74(1):272-286.
26. Kosinsky RL, Helms M, Zerche M, et al. USP22-dependent HSP90AB1 expression
promotes resistance to HSP90 inhibition in mammary and colorectal cancer. Cell Death &
Disease. 2019;10(12):911.
27. Melo-Cardenas J, Xu Y, Wei J, et al. USP22 deficiency leads to myeloid leukemia
upon oncogenic Kras activation through a PU.1-dependent mechanism. Blood.
2018;132(4):423-434.
28. Pina C, May G, Soneji S, Hong D, Enver T. MLLT3 regulates early human erythroid
and megakaryocytic cell fate. Cell stem cell. 2008;2(3):264-273.
29. Sutherland JA, Turner AR, Mannoni P, McGann LE, Turc JM. Differentiation of
K562 leukemia cells along erythroid, macrophage, and megakaryocyte lineages. J Biol
Response Mod. 1986;5(3):250-262.
30. L. T. Lam, C. Ronchini, J. Norton, A. J. Capobianco, & E. H. Bresnick, Suppression
of Erythroid but Not Megakaryocytic Differentiation of Human K562 Erythroleukemic Cells
by Notch-1*. Journal of Biological Chemistry, 275 (2000) 19676–19684.
31. A. de Thonel, J. Vandekerckhove, D. Lanneau, S. Selvakumar, G. Courtois, A.
Hazoume, M. Brunet, S. Maurel, A. Hammann, J. A. Ribeil, Y. Zermati, A. S. Gabet, J.
Boyes, E. Solary, O. Hermine, & C. Garrido, HSP27 controls GATA-1 protein level during
erythroid cell differentiation. Blood, 116 (2010) 85–96.
Dow
nloaded from http://ashpublications.org/bloodadvances/article-pdf/doi/10.1182/bloodadvances.2020002842/1828797/bloodadvances.2020002842.pdf by guest on 29 O
ctober 2021
Arede 22
32. O. N. Kuvardina, J. Herglotz, S. Kolodziej, N. Kohrs, S. Herkt, B. Wojcik, T.
Oellerich, J. Corso, K. Behrens, A. Kumar, H. Hussong, H. Urlaub, J. Koch, H. Serve, H.
Bonig, C. Stocking, M. A. Rieger, & J. Lausen, RUNX1 represses the erythroid gene
expression program during megakaryocytic differentiation. Blood, 125 (2015) 3570–3579.
33. Yangyang Xie, Li Gao, Chunhui Xu, Liming Chu, Lei Gao, Ruichi Wu, Yu Liu, Ting
Liu, Xiao-jian Sun, Ruibao Ren, Jingyan Tang, Yi Zheng, Yong Zhou, & Shuhong Shen,
ARHGEF12 regulates erythropoiesis and is involved in erythroid regeneration after
chemotherapy in acute lymphoblastic leukemia patients. Haematologica, 105 (2020) 925–
936.
34. Kuleshov MV, Jones MR, Rouillard AD, et al. Enrichr: a comprehensive gene set
enrichment analysis web server 2016 update. Nucleic Acids Res. 2016;44(W1):W90-97.
35. Merryweather-Clarke AT, Atzberger A, Soneji S, et al. Global gene expression
analysis of human erythroid progenitors. Blood. 2011;117(13):e96-108.
36. Tusi BK, Wolock SL, Weinreb C, et al. Population snapshots predict early
haematopoietic and erythroid hierarchies. Nature. 2018;555(7694):54-60.
37. Mi W, Zhang Y, Lyu J, et al. The ZZ-type zinc finger of ZZZ3 modulates the ATAC
complex-mediated histone acetylation and gene activation. Nat Commun. 2018;9(1):3759.
38. Goardon N, Marchi E, Atzberger A, Quek L, Schuh A, Soneji S, et al. Coexistence of
LMPP-like and GMP-like leukemia stem cells in acute myeloid leukemia. Cancer Cell
(2011).
39. Gu TL, Goss VL, Reeves C, Popova L, Nardone J, Macneill J, et al. Phosphotyrosine
profiling identifies the KG-1 cell line as a model for the study of FGFR1 fusions in acute
myeloid leukemia. Blood. 2006;108(13):4202-4
40. Larizza L, Magnani I, Beghini A. The Kasumi‐1 cell line: a t(8;21)‐kit mutant model
for acute myeloid leukemia. Leuk Lymphoma. 2005;46:247‐255.
41. Schuringa JJ, Schepers H. Ex vivo assays to study self‐renewal and long‐term
expansion of genetically modified primary human acute myeloid leukemia stem cells.
Methods Mol Biol. 2009;538:287‐300.
42. Signer RA, Magee JA, Salic A, Morrison SJ. Haematopoietic stem cells require a
highly regulated protein synthesis rate. Nature. 2014;509(7498):49-54.
43. J. A. Magee & R. A. J. Signer, Developmental Stage-Specific Changes in Protein
Synthesis Differentially Sensitize Hematopoietic Stem Cells and Erythroid Progenitors to
Impaired Ribosome Biogenesis. Stem Cell Reports, 16 (2021).
Dow
nloaded from http://ashpublications.org/bloodadvances/article-pdf/doi/10.1182/bloodadvances.2020002842/1828797/bloodadvances.2020002842.pdf by guest on 29 O
ctober 2021

Arede 23
44. R. K. Khajuria, M. Munschauer, J. C. Ulirsch, C. Fiorini, L. S. Ludwig, S. K.
McFarland, N. J. Abdulhay, H. Specht, H. Keshishian, D. R. Mani, M. Jovanovic, S. R. Ellis,
C. P. Fulco, J. M. Engreitz, S. Schütz, J. Lian, K. W. Gripp, O. K. Weinberg, G. S. Pinkus, L.
Gehrke, A. Regev, E. S. Lander, H. T. Gazda, W. Y. Lee, V. G. Panse, S. A. Carr, & V. G.
Sankaran, Ribosome Levels Selectively Regulate Translation and Lineage Commitment in
Human Hematopoiesis. Cell, 173 (2018).
45. K. Miyake, T. Utsugisawa, J. Flygare, T. Kiefer, I. Hamaguchi, J. Richter, & S.
Karlsson, Ribosomal Protein S19 Deficiency Leads to Reduced Proliferation and Increased
Apoptosis but Does Not Affect Terminal Erythroid Differentiation in a Cell Line Model of
Diamond-Blackfan Anemia. Stem Cells, 26 (2008).
46. R. Gao, S. Chen, M. Kobayashi, H. Yu, Y. Zhang, Y. Wan, S. K. Young, A. Soltis,
M. Yu, S. Vemula, E. Fraenkel, A. Cantor, Y. Antipin, Y. Xu, M. C. Yoder, R. C. Wek, S. R.
Ellis, R. Kapur, X. Zhu, & Y. Liu, Bmi1 Promotes Erythroid Development Through
Regulating Ribosome Biogenesis. STEM CELLS, 33 (2015).
47. A. Grover, E. Mancini, S. Moore, A. J. Mead, D. Atkinson, K. D. Rasmussen, D.
O’Carroll, S. E. W. Jacobsen, & C. Nerlov, Erythropoietin guides multipotent hematopoietic
progenitor cells toward an erythroid fate. Journal of Experimental Medicine, 211 (2014).
48. Carrelha J, Meng Y, Kettyle LM, et al. Hierarchically related lineage-restricted fates
of multipotent haematopoietic stem cells. Nature. 2018;554(7690):106-111.
49. Belluschi S, Calderbank EF, Ciaurro V, et al. Myelo-lymphoid lineage restriction
occurs in the human haematopoietic stem cell compartment before lymphoid-primed
multipotent progenitors. Nature Communications. 2018;9(1):4100.
50. Notta F, Zandi S, Takayama N, et al. Distinct routes of lineage development reshape
the human blood hierarchy across ontogeny. Science. 2016;351(6269):aab2116.
51. L. Arede & C. Pina, Buffering noise: KAT2A modular contributions to stabilization
of transcription and cell identity in cancer and development. Experimental Hematology, 93
(2021).
52. Jin Q, Yu LR, Wang L, Zhang Z, Kasper LH, Lee JE, et al. Distinct roles of
GCN5/PCAF-mediated H3K9ac and CBP/p300-mediated H3K18/27ac in nuclear receptor
transactivation. EMBO Journal 2011;30:249–62.
53. Raser JM, O’Shea EK. Control of stochasticity in eukaryotic gene expression.
Science 2004;304:1811–4.
Dow
nloaded from http://ashpublications.org/bloodadvances/article-pdf/doi/10.1182/bloodadvances.2020002842/1828797/bloodadvances.2020002842.pdf by guest on 29 O
ctober 2021
Arede 24
54. Baptista T, Grünberg S, Minoungou N, Koster MJE, Timmers HTM, Hahn S, Devys
D, Tora L. Mol Cell Oct. 5, 2017 ; 68:130-143.e5 .
55. Orpinell M, Fournier M, Riss A, et al. The ATAC acetyl transferase complex
controls mitotic progression by targeting non-histone substrates. The EMBO journal.
2010;29(14):2381-2394.
56. van den Berk P, Lancini C, Company C, et al. USP15 Deubiquitinase Safeguards
Hematopoiesis and Genome Integrity in Hematopoietic Stem Cells and Leukemia Cells. Cell
Reports. 2020;33(13):108533.
57. Fischer V, Plassard D, Ye T, et al. The related coactivator complexes SAGA and
ATAC control embryonic stem cell self-renewal through acetyltransferase-independent
mechanisms. Cell Reports. 2021;36:109598.
FIGURE LEGENDS
Figure 1. KAT2A-containing ATAC and SAGA complexes have unique targets in
hematopoietic cells.
(A) Schematic representation of the human ATAC (left) and SAGA (right) multiprotein
complexes. SAGA (right) is organized into distinct structural and functional modules, colored
similarly. The KAT2A-containing histone acetyltransferase (HAT) module is depicted in
orange and partially hared with ATAC (left), with exception of TADA2B, which is replaced
by TADA2A in ATAC. The histone de-ubiquitinase (DUB) module is shown in red; the Core
module, which includes SPT20, in blue. TF-binding module, TRRAP, is shown in yellow.
TATA-binding protein (TBP), in purple, is not part of the complex architecture but it
associates with SUPT3H to recruit SAGA to TATA box and facilitate transcription. The
ATAC complex does not have a modular organization. Its main structure is shown in green
and includes DNA-binding subunit ZZZ3. Subunits tested in this study are delineated with a
dashed line. (B) Venn-diagram of consensus ZZZ3 and SPT20 ChIP-seq binding from 2
independent experiments. (C) Genomic location of ZZZ3 (left) and SPT20 (right) ChIP-seq
binding in K562 cells. Summary of consensus peaks from 2 independent ChIP-seq
experiments is shown. (D) Representative ChIP-seq peak for ZZZ3 target in K562 cells
(RPS7) and representative ChIP-seq peak for SPT20 target in K562 cells (HBB). (E)
Publicly-available ChIP-seq tracks for H3K9ac (ENCFF257CLC) and ZZZ3
(ENCFF856KCV) in K562 cells at the RPS7 and HBB loci retrieved from the ENCODE
project portal (www.encodeproject.org). The RPS7 and HBB loci in (D) are represented
Dow
nloaded from http://ashpublications.org/bloodadvances/article-pdf/doi/10.1182/bloodadvances.2020002842/1828797/bloodadvances.2020002842.pdf by guest on 29 O
ctober 2021
Arede 25
confirming the presence of H3K9ac peaks and reproducing the selective ZZZ3 binding at
RPS7 also observed in our data. (F) H3K9ac ChIP-qPCR analysis of representative SPT20
and ZZZ3 targets upon knockdown in K562 cells. N3 independent experiments. Mean
SEM of enrichment relative to rabbit-IgG, with normalisation to control intergenic region
with no significant H3K9ac enrichment. Two-tailed t-test for significance *p<0.05. (G)
Quantitative RT-PCR analysis of expression of ATAC and SAGA complex targets in K562
cells. N3 independent experiments, mean ± SEM of gene expression relative to CTRLsh,
normalised to HPRT1 housekeeping gene. Two-tailed t-test for significance *p<0.05,
**p<0.01, ***p<0.001.
Figure 2. ATAC is selectively required for erythroid specification from CB HSC.
(A) Quantitative RT-PCR validation of SUPT20H and ZZZ3 knockdown in human cord
blood HSC. Representative experiment for SUPT20H; mean SEM of 2 individual
experiments for ZZZ3; gene expression relative to CTRLsh, normalised to HPRT1
housekeeping gene. Paired two-tailed t-test for significance *p<0.05. (B) Representative
sorting plot for transduced HSC and progenitor cells from CB. (C) Frequency of colony
forming efficiency (CFC) in the HSC/MPP, MEP, GMP and MLP compartments transduced
with ZZZ3sh. Mean ± SEM of 5 individual CB samples (4 for GMP, MLP). Two-tailed
paired t-test for significance; *p<0.05, **p<0.01 (D) Frequency of CFC efficiency in the
HSC/MPP, MEP, GMP and MLP compartments transduced with SUPT20Hsh. Mean ± SEM
of 4 individual CB samples. Two-tailed paired t-test for significance; no significant
differences.
Figure 3. KAT2A regulates human CB erythroid progenitor specification and survival.
(A) Proportion of KAT2Ash transduced CB HSC and progenitors. Mean ± SEM of >7
individual sorting experiments. Two-tailed paired t-test for significance; *p<0.05, **p<0.01.
(B) Frequency of CFC efficiency in the HSC/MPP, MEP (top), GMP and MLP (bottom)
compartments transduced with KAT2Ash. Mean ± SEM of 7 individual CB samples. Two
tailed paired t-test for significance; *p<0.05, **p<0.01. (C) Quantitative RT-PCR analysis of
expression of erythroid-associated genes in KAT2Ash transduced HSC from individual CB
samples. N3 independent experiments, mean ± SEM of gene expression relative to CTRLsh,
Dow
nloaded from http://ashpublications.org/bloodadvances/article-pdf/doi/10.1182/bloodadvances.2020002842/1828797/bloodadvances.2020002842.pdf by guest on 29 O
ctober 2021
Arede 26
normalised to HPRT1 housekeeping gene. Two-tailed paired t-test for significance *p<0.05,
**p<0.01, ***p<0.001. (D) MA plot of RNA-seq gene expression analysis of differentially-
expressed (DE) genes (red) in CTRLsh vs KAT2Ash transduced HSC/MPP cells. (E) Gene Set
Enrichment Analysis (GSEA) plot for erythroid differentiation (right) and platelet signature
(left) in the RNA-seq data in (D). Gene signature identifiers are ADDYA Erythroid
Differentiation by HEMIN and GNATENKO Platelet signature, respectively, as obtained
from the UC San Diego and BROAD Institute Molecular Signatures Database (MSigDB).
Figure 4. KAT2A SAGA and ATAC complexes differentially affect erythroid lineage
progression.
(A) Erythroid (E) differentiation of HSC/MPP sorted from CD34+ cells of individual CB
samples transduced with CTRLsh (top) and KAT2Ash (bottom) in liquid cultures. CD34
marks HSC and progenitors; CD71 and CD235a mark early and late differentiated E cells.
Data summarise mean ± SEM of 4 independent differentiation experiments. (B) Flow
cytometry quantitative analysis of CTRLsh and KAT2Ash HSC in erythroid differentiation
cultures in (A). Representative plots. (C) Expansion of CTRLsh and KAT2Ash HSC in
erythroid differentiation cultures in (A). (D) Quantitative RT-PCR analysis of erythroid gene
expression progression in K562 cells transduced with KAT2Ash, SUPT20Hsh, or ZZZ3sh and
treated with 1.5% DMSO for erythroid molecular induction. Mean ± SD of N>3 independent
experiments; data are represented relative to day 0 normalised to HPRT1 housekeeping gene.
Two-tailed paired t-test for significance *p<0.05, **p<0.01, ***p<0.001. CTRLsh-transduced
cells for the same experiment shown in Fig. S4C. (E) H3K9ac ChIP-qPCR analysis of EPOR
locus in K562 cells upon SUPT20H and ZZZ3 knockdown. N3 independent experiments.
Mean SEM of enrichment relative to rabbit-IgG, with normalisation to control intergenic
region with no significant H3K9ac enrichment. Two-tailed t-test for significance *p<0.05.
Figure 5. ATAC and SAGA differentially impact histone acetylation and gene
expression in MOLM13 AML cells.
(A) Quantitative RT-PCR validation of KAT2A, SUPT20H and TADA2B (SAGA-specific
subunits) and ZZZ3 and TADA2A (ATAC-specific subunits) knockdown in MOLM-13 cells.
N3 independent experiments, mean ± SEM of gene expression relative to CTRLsh,
normalised to HPRT1 housekeeping gene. Two-tailed t-test for significance *p<0.05,
**p<0.01, ***p<0.001. (B) Quantitative RT-PCR analysis of ribosomal protein gene
Dow
nloaded from http://ashpublications.org/bloodadvances/article-pdf/doi/10.1182/bloodadvances.2020002842/1828797/bloodadvances.2020002842.pdf by guest on 29 O
ctober 2021
Arede 27
expression in MOLM-13 cells transduced with KAT2Ash, SAGA-specific SUPT20Hsh and
TADA2Bsh and ATAC-specific ZZZ3sh and TADA2Ash. N3 independent experiments,
mean ± SEM of gene expression relative to CTRLsh, normalised to HPRT1 housekeeping
gene. Two-tailed t-test for significance *p<0.05, **p<0.01, ***p<0.001. (C) Quantitative
RT-PCR analysis of self-renewal gene signature in MOLM-13 transduced with KAT2Ash,
SAGA-specific SUPT20Hsh and TADA2Bsh and ATAC-specific ZZZ3sh and TADA2Ash.
N=2 biological replicates, each run as 2 or 3 technical repeats; mean ± SEM of relative gene
expression relative to CTRLsh, normalised to HPRT1 housekeeping gene. Two-tailed nested
t-test for significance *p<0.05, **p<0.01, ***p<0.001. (D) H3K9ac ChIP-qPCR analysis of
ribosomal protein genes and self-renewal genes in MOLM-13 cells upon knockdown of
SAGA and ATAC elements, SUPT20H and ZZZ3, respectively. N3 independent
experiments. Mean SEM of enrichment relative to rabbit-IgG, with normalisation to control
region in KRT5 locus with no significant H3K9ac enrichment. Two-tailed t-test for
significance *p<0.05, **p<0.01, ***p<0.001
Figure 6. ATAC maintains self-propagation and SAGA blocks differentiation of
MOLM13 AML cells.
(A) Quantification of flow cytometry analysis of cell cycle in MOLM-13 cells transduced
with KAT2Ash, SAGA-specific SUPT20Hsh and TADA2Bsh and ATAC-specific ZZZ3sh and
TADA2Ash. Corresponding representative plots in Fig. S5C. Mean ± SEM of 3 independent
experiments. Two-tailed t-test for significance *p<0.05, **p<0.01. (B) Representative flow
cytometry plots of divisional tracking of MOLM-13 cells transduced with CTRLsh,
SUPT20Hsh and ZZZ3sh and loaded with the Tag-IT violet dye (Biolegend) after 3 days of
culture. Regions 0, 1 and 2 represent the number of cell divisions relative to initial loading
control (also see Fig. S5D-E). (C) Quantification of results in (B) representing the
distribution of MOLM-13 cells transduced with CTRLsh, SUPT20Hsh and ZZZ3sh undergone
0-2 cell divisions after 3 days in culture. Mean ± SEM of 3 independent experiments. Two-
tailed t-test for significance *p<0.05. (D) Colony re-plating of MOLM-13 cells transduced
with SUPT20Hsh1, SUPT20Hsh2 (SAGA) and TADA2Ash1 and TADA2Ash2 (ATAC) as a
measure of in vitro self-renewal. Mean ± SEM of 2-3 independent experiments. Two-tailed t-
test for significance *p<0.05. (E) Quantification of blast-like and differentiated cells in
MOLM-13 cultures transduced with CTRLsh, KAT2Ash, SUPT20Hsh and ZZZ3sh. Scoring of
3 randomly selected fields of >100 cells; Two-tailed t-test for significance; *p<0.05,
Dow
nloaded from http://ashpublications.org/bloodadvances/article-pdf/doi/10.1182/bloodadvances.2020002842/1828797/bloodadvances.2020002842.pdf by guest on 29 O
ctober 2021
Arede 28
**p<0.01, ****p<0.0001. (F) Representative photographs of MOLM-13 cytospins. White
arrow heads denote blast-like cells; black arrow heads denote differentiated cells. Scale 50
m. (G) Quantification of Annexin V+ apoptotic cells in MOLM13 cultures analysed by flow
cytometry (representative plots in Fig. S4F). Mean ± SEM of N>3 independent experiments.
Two-tailed t-test for significance.
Figure 7. KAT2A complex activity maintains propagation of undifferentiated cultured
and primary CD34+ AML cells.
(A) Quantification of flow cytometry analysis of cell cycle in Kasumi-1 cells transduced with
KAT2Ash, SUPT20Hsh and ZZZ3sh. Mean ± SEM of 3 independent experiments. Two-tailed
t-test for significance *p<0.05, **p<0.01. (B) Representative flow cytometry overlay plot of
analysis of undifferentiated marker CD34 in KG1a cells transduced with CTRLsh,
SUPT20Hsh and ZZZ3sh. (C) Quantification of CD34+ cells in transduced KG1a cells in (B).
N=3 independent experiments. Two-tailed t-test for significance *p<0.05, **p<0.01. (D)
Quantification of blast-like and differentiated cells in KG1a cultures transduced with
CTRLsh, SUPT20Hsh and ZZZ3sh. Scoring of 3 randomly selected fields of >100 cells; Two-
tailed t-test for significance; *p<0.05. (E) Representative photographs of KG1a cytospins.
White arrow heads denote blast-like cells; black arrow heads denote differentiated cells.
Scale 50 m. (F) Growth of human primary AML cells (CD34+ samples – details in
Supplemental File 5) transduced with CTRLsh, KAT2Ash, SUPT20Hsh or ZZZ3sh and
maintained in the MS5 co-culture system for 2-3 weeks. (G) Percentage of GFP+ CD34+
cells in AML samples in (F) analyzed at week 2 of the MS5 co-culture. Analysis gates are
presented in Fig. S6a. Data are normalized to global GFP level, to correct for unequal GFP
transduction levels. (H) Percentage of GFP+ GMP-like (L-GMP) cells at week 2 of the MS5
co-culture system in AML samples in (F). Analysis gates in Fig. S7A. GFP transduction
correction as in (G).
Dow
nloaded from http://ashpublications.org/bloodadvances/article-pdf/doi/10.1182/bloodadvances.2020002842/1828797/bloodadvances.2020002842.pdf by guest on 29 O
ctober 2021
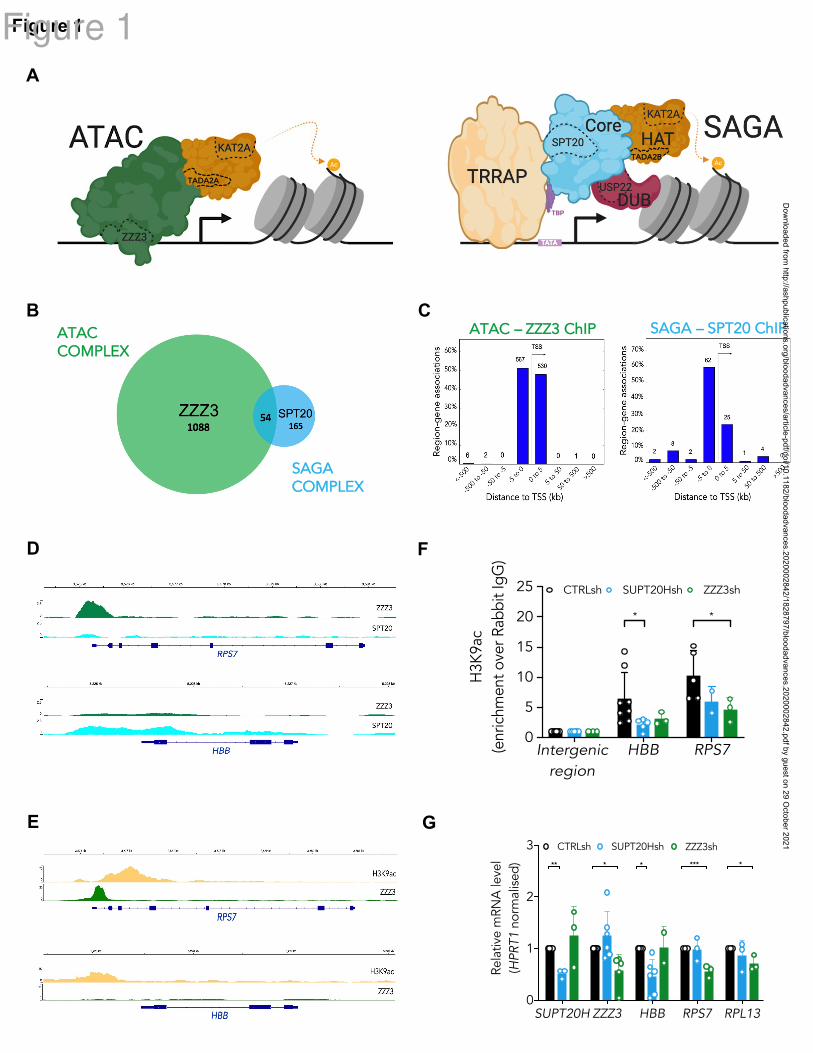
B C
Figure 1
ATAC
COMPLEX
SAGA
COMPLEX
SAGA – SPT20 ChIPATAC – ZZZ3 ChIP
D
E
F
A
G
SUPT20H ZZZ3 HBB RPS7 RPL13
0
1
2
3
Rela
tive m
RN
A level
(HPRT1 n
orm
alis
ed
)
SUPT20HshCTRLsh ZZZ3sh
** * * *** *
TADA2A
TADA2B
Intergenic
region
HBB RPS70
5
10
15
20
25
H3K
9ac
(enrich
ment
ove
r R
abb
it Ig
G)
CTRLsh SUPT20Hsh ZZZ3sh
* *
Figure 1D
ownloaded from
http://ashpublications.org/bloodadvances/article-pdf/doi/10.1182/bloodadvances.2020002842/1828797/bloodadvances.2020002842.pdf by guest on 29 October 2021
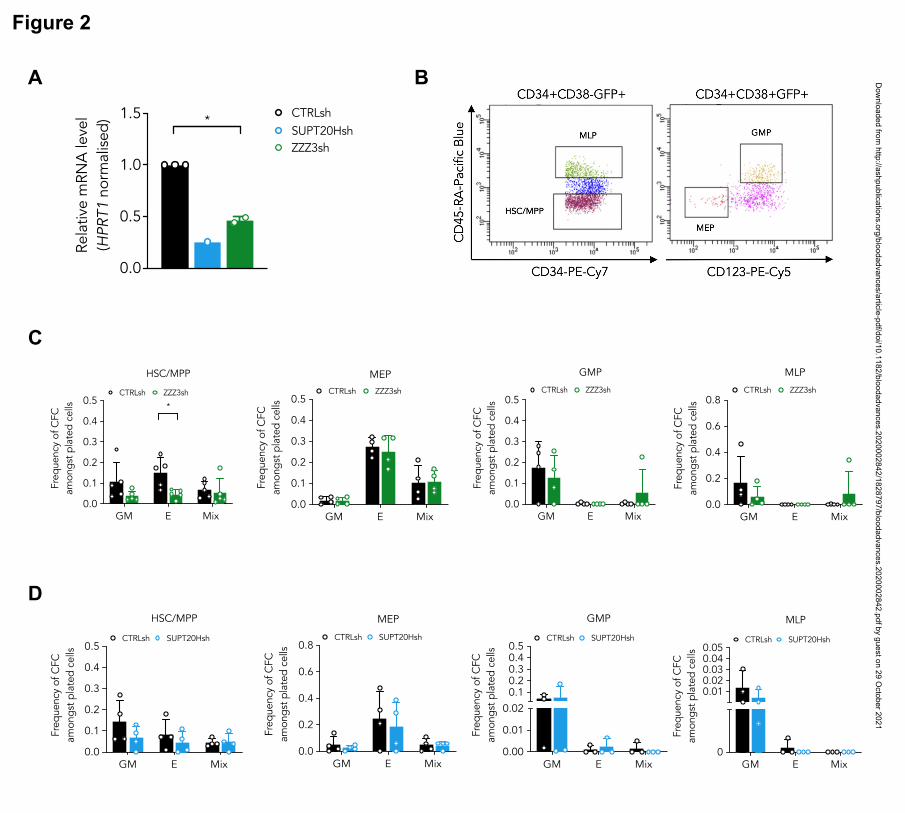
C
Figure 2
A B
GM E Mix 0
0.010.020.030.040.05
Fre
quency
of C
FC
amo
ng
st p
late
d c
ells
MLP
CTRLsh SUPT20Hsh
GM E Mix 0.00
0.01
0.02
0.10.20.30.40.5
Fre
quency
of C
FC
amo
ng
st p
late
d c
ells
GMP
CTRLsh SUPT20Hsh
GM E Mix 0.0
0.2
0.4
0.6
0.8
Fre
quency
of C
FC
amo
ng
st p
late
d c
ells
MLP
CTRLsh ZZZ3sh
GM E Mix 0.0
0.1
0.2
0.3
0.4
0.5
Fre
quency
of C
FC
amo
ng
st p
late
d c
ells
GMP
CTRLsh ZZZ3sh
GM E Mix 0.0
0.1
0.2
0.3
0.4
0.5
Fre
quency
of C
FC
amo
ng
st p
late
d c
ells
HSC/MPP
CTRLsh SUPT20Hsh
GM E Mix 0.0
0.2
0.4
0.6
0.8
Fre
quency
of C
FC
amo
ng
st p
late
d c
ells
MEP
CTRLsh SUPT20Hsh
GM E Mix 0.0
0.1
0.2
0.3
0.4
0.5
Fre
quency
of C
FC
amo
ng
st p
late
d c
ells
HSC/MPP
CTRLsh ZZZ3sh
*
GM E Mix 0.0
0.1
0.2
0.3
0.4
0.5
Fre
quency
of C
FC
amo
ng
st p
late
d c
ells
MEP
CTRLsh ZZZ3sh
D
0.0
0.5
1.0
1.5
Rela
tive m
RN
A level
(HPRT1 n
orm
alise
d) CTRLsh
SUPT20Hsh
ZZZ3sh
*
Dow
nloaded from http://ashpublications.org/bloodadvances/article-pdf/doi/10.1182/bloodadvances.2020002842/1828797/bloodadvances.2020002842.pdf by guest on 29 O
ctober 2021
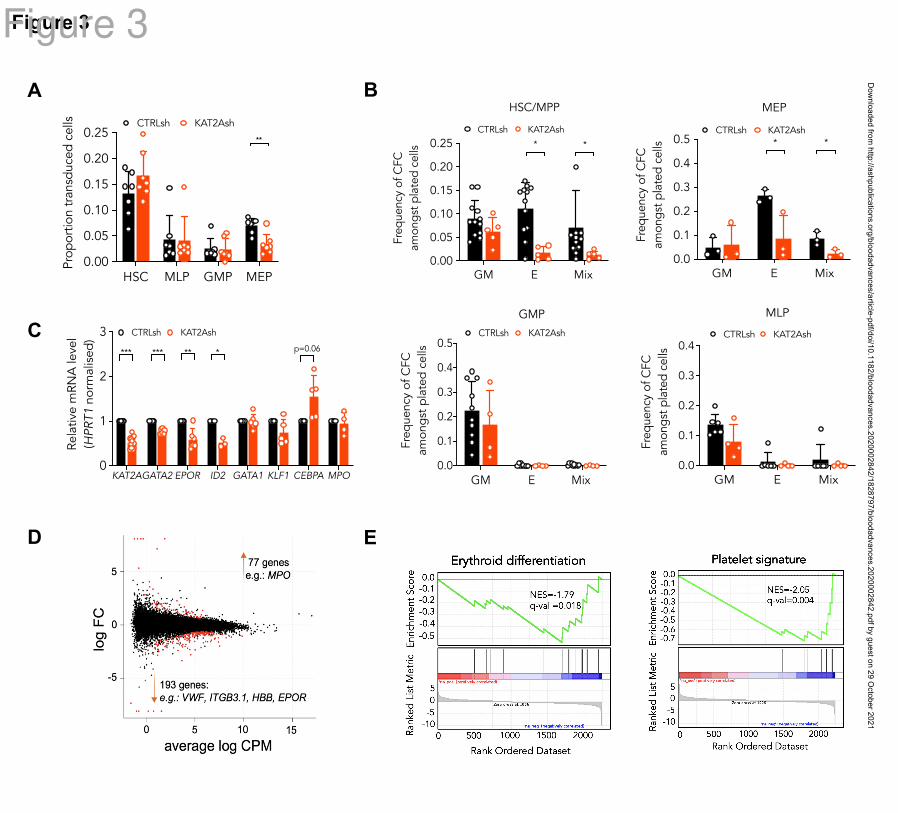
C
Figure 3
A B
D
HSC MLP GMP MEP0.00
0.05
0.10
0.15
0.20
0.25
Pro
po
rtio
n t
ransd
uce
d c
ells CTRLsh KAT2Ash
**
E
GM E Mix 0.00
0.05
0.10
0.15
0.20
0.25
Fre
quency
of C
FC
amo
ng
st p
late
d c
ells
HSC/MPP
CTRLsh KAT2Ash
**
GM E Mix 0.0
0.1
0.2
0.3
0.4
0.5
Fre
quency
of C
FC
amo
ng
st p
late
d c
ells
MEP
CTRLsh KAT2Ash**
GM E Mix 0.0
0.1
0.2
0.3
0.4
0.5
Fre
quency
of C
FC
amo
ng
st p
late
d c
ells
GMP
CTRLsh KAT2Ash
GM E Mix 0.0
0.1
0.2
0.3
0.4
Fre
quency
of C
FC
amo
ng
st p
late
d c
ells
MLP
CTRLsh KAT2Ash
KAT2AGATA2 EPOR ID2 GATA1 KLF1 CEBPA MPO0
1
2
3
Rela
tive
mR
NA
leve
l
(HPRT1 n
orm
alis
ed
)
CTRLsh KAT2Ash
*** *** ** * p=0.06
Figure 3D
ownloaded from
http://ashpublications.org/bloodadvances/article-pdf/doi/10.1182/bloodadvances.2020002842/1828797/bloodadvances.2020002842.pdf by guest on 29 October 2021

Figure 4
A B
D
C
E
3 6 90.0
0.2
0.4
0.6
0.8
1.0
Time (days)
Pro
po
rtio
n o
f ce
lls
in d
iffere
ntiat
ion c
ulture
CTRLsh
CD34 CD71 CD235a
3 6 90.0
0.2
0.4
0.6
0.8
1.0
Time (days)
Pro
po
rtio
n o
f ce
lls
in d
iffere
ntiat
ion c
ulture
KAT2Ash
CD34 CD71 CD235a
0 3 6 90
10
20
30
40
50E
xpan
sio
n o
f liv
e c
ells
(fold
chan
ge t
o d
ay 0
)
CTRLsh KAT2Ash
Time (days)
Day3 Day6 Day9
CTRLsh
KAT2Ash
Figure 4
Dow
nloaded from http://ashpublications.org/bloodadvances/article-pdf/doi/10.1182/bloodadvances.2020002842/1828797/bloodadvances.2020002842.pdf by guest on 29 O
ctober 2021
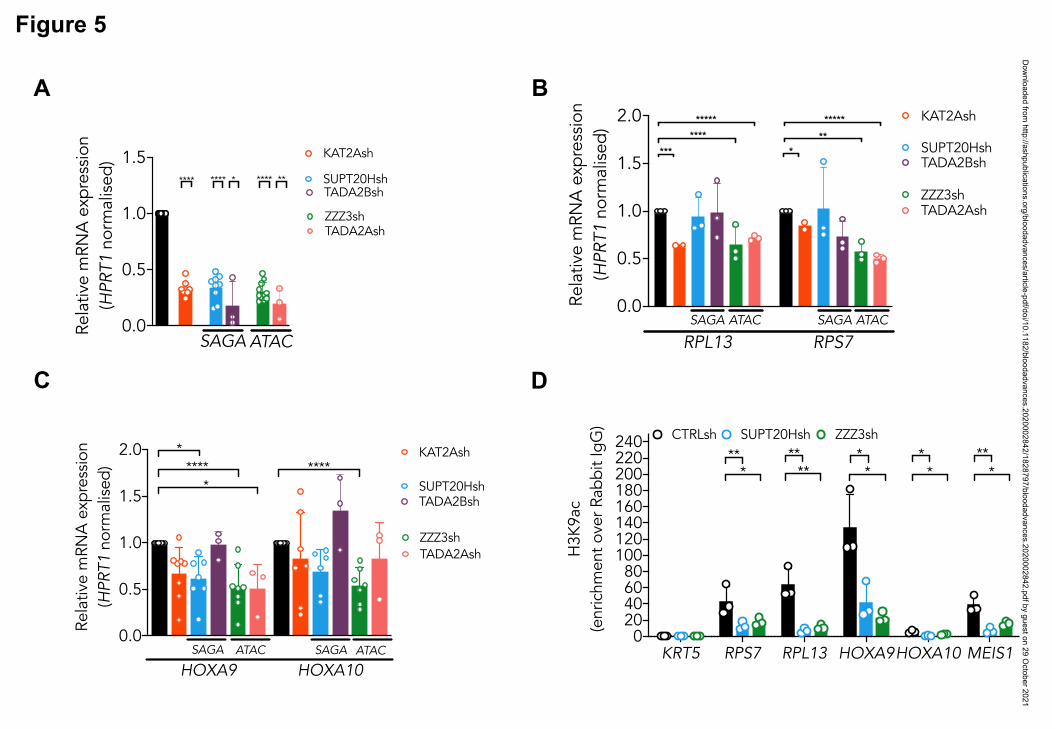
Figure 5
A B
C D
HOXA9 HOXA10
0.0
0.5
1.0
1.5
2.0
Rela
tive
mR
NA
exp
ress
ion
(HP
RT
1 n
orm
alis
ed
)
KAT2Ash
SUPT20Hsh
ZZZ3sh
****
TADA2Ash
TADA2Bsh *
*
****
SAGA ATAC SAGA ATAC
0.0
0.5
1.0
1.5
Rela
tive
mR
NA
exp
ress
ion
(HP
RT
1 n
orm
alis
ed
)
TADA2Ash
TADA2Bsh **** SUPT20Hsh
ZZZ3sh
**** * ****
SAGA ATAC
**
KAT2Ash
RPL13 RPS7
0.0
0.5
1.0
1.5
2.0
Rela
tive
mR
NA
exp
ress
ion
(HP
RT
1 n
orm
alis
ed
)
KAT2Ash
SUPT20HshTADA2Bsh
***
****
*
**
ZZZ3shTADA2Ash
***** *****
SAGA ATAC SAGA ATAC
KRT5 RPS7 RPL13 HOXA9HOXA10 MEIS1
020406080
100120140160180200220240
H3K
9ac
(enrich
ment
ove
r R
ab
bit Ig
G)
SUPT20HshCTRLsh ZZZ3sh
*
** ***
** *
*
*
**
*
Dow
nloaded from http://ashpublications.org/bloodadvances/article-pdf/doi/10.1182/bloodadvances.2020002842/1828797/bloodadvances.2020002842.pdf by guest on 29 O
ctober 2021
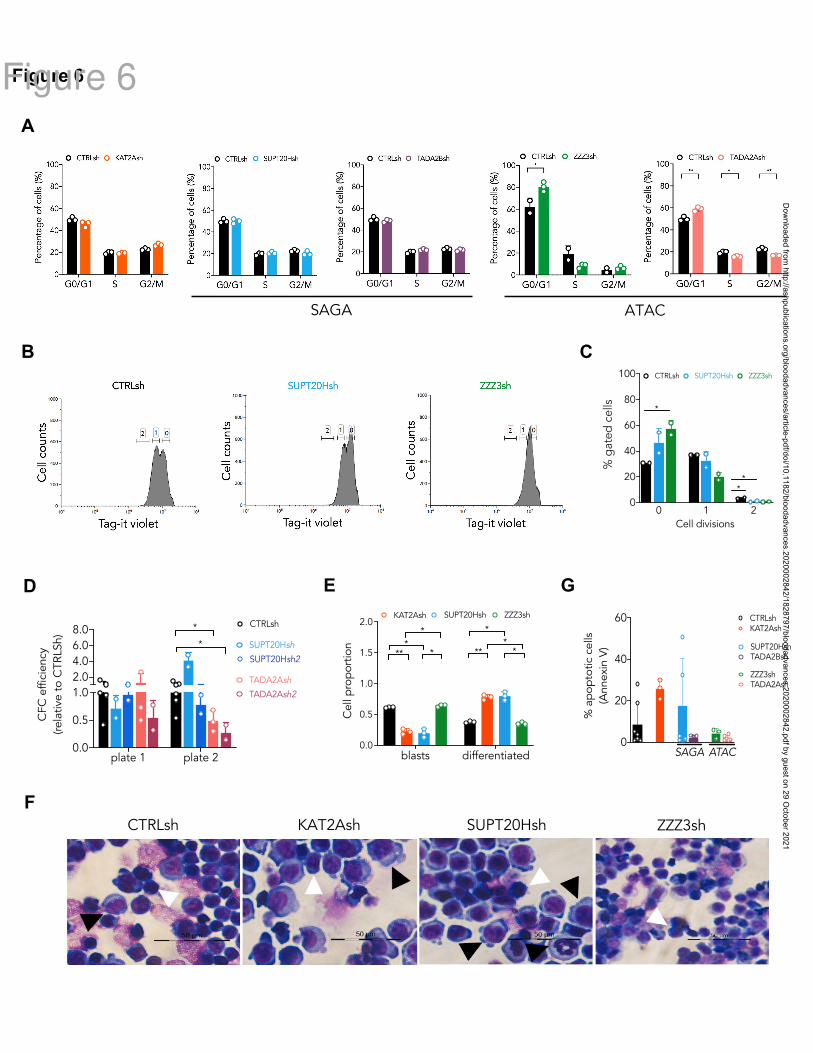
Figure 6
A
B C
SAGA ATAC
G
F
E
0 1 20
20
40
60
80
100
% g
ate
d c
ells
CTRLsh SUPT20Hsh ZZZ3sh
*
*
*
Cell divisions
0
20
40
60
% a
po
pto
tic
cells
(Annexi
n V
)CTRLshKAT2Ash
SUPT20Hsh
ZZZ3sh TADA2Ash
TADA2Bsh
SAGA ATAC blasts differentiated0.0
0.5
1.0
1.5
2.0
Cell
pro
po
rtio
n
KAT2Ash SUPT20Hsh ZZZ3sh
*
** ** *
** *
*
D
CTRLsh KAT2Ash SUPT20Hsh ZZZ3sh
plate 1 plate 20.0
0.5
1.0
2.0
4.0
6.0
8.0
CFC
effic
iency
(rela
tive
to
CT
RLS
h)
CTRLsh
SUPT20Hsh
SUPT20Hsh2
TADA2Ash
TADA2Ash2
*
*
Figure 6
Dow
nloaded from http://ashpublications.org/bloodadvances/article-pdf/doi/10.1182/bloodadvances.2020002842/1828797/bloodadvances.2020002842.pdf by guest on 29 O
ctober 2021
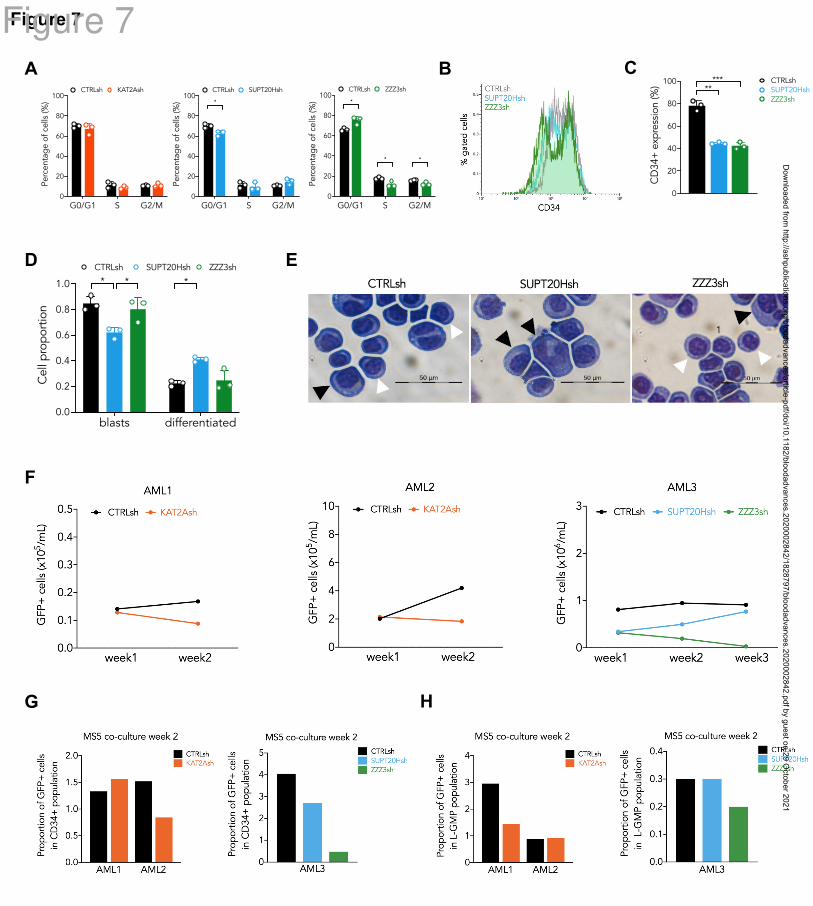
Figure 7
A
D
F
G
B C
E
H
1
0
20
40
60
80
100
CD
34+
exp
ress
ion (%
)
CTRLshSUPT20HshZZZ3sh
** ***
G0/G1 S G2/M0
20
40
60
80
100
Perc
enta
ge o
f ce
lls (%
)
CTRLsh SUPT20Hsh
*
G0/G1 S G2/M0
20
40
60
80
100
Perc
enta
ge o
f ce
lls (%
)
CTRLsh KAT2Ash
G0/G1 S G2/M0
20
40
60
80
100
Perc
enta
ge o
f ce
lls (%
)
CTRLsh ZZZ3sh
*
* *
blasts differentiated0.0
0.2
0.4
0.6
0.8
1.0
Cell
pro
po
rtio
n
CTRLsh SUPT20Hsh ZZZ3sh
* * *
Figure 7D
ownloaded from
http://ashpublications.org/bloodadvances/article-pdf/doi/10.1182/bloodadvances.2020002842/1828797/bloodadvances.2020002842.pdf by guest on 29 October 2021