Journal of Positive Behavior Interventions-2014-Lequia-1098300714548799
13
Journal of Positive Behavior Interventions 1–13 © Hammill Institute on Disabilities 2014 Reprints and permissions: sagepub.com/journalsPermissions.nav DOI: 10.1177/1098300714548799 jpbi.sagepub.com Article Students with autism spectrum disorders (ASD) characteris- tically demonstrate inflexible adherence to specific routines (American Psychiatric Association, 2000), which may lead to displays of challenging behaviors during transitions. The tendency to engage in problem behavior during transitions causes difficulties for the students with ASD and those in their immediate environment (e.g., teachers and peers). Large-scale survey studies (range = 84–176 participants) using the Behavior Problems Inventory (BPI-01; Rojahn, Matson, Lott, Esbensen, & Smalls, 2001) or the ASD– Behavior Problems for Children (ASD-BPC; Matson, Gonzales, & Rivet, 2008) report that 94% of the ASD popu- lation display some challenging behavior as reported by cli- nicians or parents (Jang, Dixon, Tarbox, & Granpeesheh, 2011; Matson, Wilkins, & Macken, 2009; McTiernan, Leader, Healy, & Mannion, 2011), of which 63% exhibit externalizing behaviors and 83% exhibit internalizing behaviors (Matson et al., 2009). Flannery and Horner (1994) suggested that the characteristic behavioral rigidity is due to a preference for highly predictable and consistent routines. In an eco-behavioral assessment, including repeated direct observations of preschool classrooms for an entire day, researchers found that students spend more than 20% of the school day engaging in some type of transition (Carta, Greenwood, & Robinson, 1987). Similar rates (25% of the day engaged in some type of transition) were observed by Schmit, Alper, Raschke, and Ryndak (2000). These data sug- gest that students who have difficulties with transitions may engage in high rates of challenging behavior. This is particu- larly problematic because challenging behavior is a common rationale for excluding students with ASD from educational programs and general education settings (Strain, Wilson, & Dunlap, 2011; Volkmar & Wiesner, 2009). Such difficulties can also limit the amount of academic instruction provided to students with ASD (Banda & Kubina, 2006; Sterling-Turner & Jordan, 2007) as well as their peers due to teachers’ need to use instructional time to respond to challenging behavior. Common challenging behaviors exhibited during transi- tions by students with ASD include aggression, inappropriate vocalizations, off-task behavior (e.g., engaging in tasks other 548799PBI XX X 10.1177/1098300714548799Journal of Positive Behavior InterventionsLequia et al. research-article 2014 1 University of Wisconsin–Madison, USA Corresponding Author: Jenna Lequia, University of Wisconsin–Madison, 1000 Bascom Mall, 435 Education Building, Madison, WI 53706, USA. Email: [email protected] Action Editor: Lee Kern Improving Transition Behaviors in Students With Autism Spectrum Disorders: A Comprehensive Evaluation of Interventions in Educational Settings Jenna Lequia, MS 1 , Kimber L. Wilkerson, PhD 1 , Sunyoung Kim, MEd 1 , and Gregory L. Lyons, MA 1 Abstract Students with autism spectrum disorders (ASD) often exhibit rigidity, which can lead to difficulties with transitions. Such difficulties can explain why students with ASD are placed in more restrictive educational environments. This review offers a quantitative synthesis of effects of interventions aimed to improve transitions of students with ASD and provides a descriptive overview of the quality of the included studies. Analyses focused on the main component of the intervention, topography of challenging behavior, and the type of transition expected of students with ASD. Activity schedules were most prominently used and most successful to ease transition difficulties. Strategies that align with preferences of students with ASD also successfully improved transitions. Practical implications and suggestions for future research are provided. Keywords challenging behavior(s), intervention(s), single-case designs, data analysis, studies, special education at UNIV ALABAMA LIBRARY/SERIALS on September 4, 2015 pbi.sagepub.com Downloaded from
Transcript of Journal of Positive Behavior Interventions-2014-Lequia-1098300714548799
Journal of Positive Behavior Interventions 1 –13© Hammill Institute on Disabilities 2014Reprints and permissions: sagepub.com/journalsPermissions.navDOI: 10.1177/1098300714548799jpbi.sagepub.com
Article
Students with autism spectrum disorders (ASD) characteris-tically demonstrate inflexible adherence to specific routines (American Psychiatric Association, 2000), which may lead to displays of challenging behaviors during transitions. The tendency to engage in problem behavior during transitions causes difficulties for the students with ASD and those in their immediate environment (e.g., teachers and peers). Large-scale survey studies (range = 84–176 participants) using the Behavior Problems Inventory (BPI-01; Rojahn, Matson, Lott, Esbensen, & Smalls, 2001) or the ASD–Behavior Problems for Children (ASD-BPC; Matson, Gonzales, & Rivet, 2008) report that 94% of the ASD popu-lation display some challenging behavior as reported by cli-nicians or parents (Jang, Dixon, Tarbox, & Granpeesheh, 2011; Matson, Wilkins, & Macken, 2009; McTiernan, Leader, Healy, & Mannion, 2011), of which 63% exhibit externalizing behaviors and 83% exhibit internalizing behaviors (Matson et al., 2009). Flannery and Horner (1994) suggested that the characteristic behavioral rigidity is due to a preference for highly predictable and consistent routines.
In an eco-behavioral assessment, including repeated direct observations of preschool classrooms for an entire day, researchers found that students spend more than 20% of the school day engaging in some type of transition (Carta,
Greenwood, & Robinson, 1987). Similar rates (25% of the day engaged in some type of transition) were observed by Schmit, Alper, Raschke, and Ryndak (2000). These data sug-gest that students who have difficulties with transitions may engage in high rates of challenging behavior. This is particu-larly problematic because challenging behavior is a common rationale for excluding students with ASD from educational programs and general education settings (Strain, Wilson, & Dunlap, 2011; Volkmar & Wiesner, 2009). Such difficulties can also limit the amount of academic instruction provided to students with ASD (Banda & Kubina, 2006; Sterling-Turner & Jordan, 2007) as well as their peers due to teachers’ need to use instructional time to respond to challenging behavior.
Common challenging behaviors exhibited during transi-tions by students with ASD include aggression, inappropriate vocalizations, off-task behavior (e.g., engaging in tasks other
548799 PBIXXX10.1177/1098300714548799Journal of Positive Behavior InterventionsLequia et al.research-article2014
1University of Wisconsin–Madison, USA
Corresponding Author:Jenna Lequia, University of Wisconsin–Madison, 1000 Bascom Mall, 435 Education Building, Madison, WI 53706, USA. Email: [email protected]
Action Editor: Lee Kern
Improving Transition Behaviors in Students With Autism Spectrum Disorders: A Comprehensive Evaluation of Interventions in Educational Settings
Jenna Lequia, MS1, Kimber L. Wilkerson, PhD1, Sunyoung Kim, MEd1, and Gregory L. Lyons, MA1
AbstractStudents with autism spectrum disorders (ASD) often exhibit rigidity, which can lead to difficulties with transitions. Such difficulties can explain why students with ASD are placed in more restrictive educational environments. This review offers a quantitative synthesis of effects of interventions aimed to improve transitions of students with ASD and provides a descriptive overview of the quality of the included studies. Analyses focused on the main component of the intervention, topography of challenging behavior, and the type of transition expected of students with ASD. Activity schedules were most prominently used and most successful to ease transition difficulties. Strategies that align with preferences of students with ASD also successfully improved transitions. Practical implications and suggestions for future research are provided.
Keywordschallenging behavior(s), intervention(s), single-case designs, data analysis, studies, special education
at UNIV ALABAMA LIBRARY/SERIALS on September 4, 2015pbi.sagepub.comDownloaded from

2 Journal of Positive Behavior Interventions
than what is expected), dropping to the floor, and elopement (Buschbacher & Fox, 2003; Horner, Carr, Strain, Todd, & Reed, 2002). Regardless of the topography and severity, without intervention, challenging behaviors are likely to con-tinue and increase in intensity (Murphy et al., 2005). Research has demonstrated that simple strategies (i.e., pre-planned sound stimuli) can facilitate smooth transitions for students without disabilities (Register & Humpal, 2007). Although these strategies may be effective with typically developing students, students with ASD generally require more substan-tial, individualized intervention strategies to reduce problem behavior during transitions.
Currently, there is no quantitative synthesis that specifi-cally evaluates the effects of interventions on transition behaviors in students with ASD in educational settings. Thus, the primary aim of this review was to perform such an evaluation. We examined three variables: the main compo-nent of intervention, the topography of challenging behav-ior, and the type of transition (i.e., within classroom, across classroom, exiting or entering school). In addition, we assessed the overall quality of the research studies. Specific research questions included the following:
Research Question 1: What interventions are used to improve transition behaviors?Research Question 2: What types of transitions are tar-geted for intervention?Research Question 3: What behavioral topographies are targeted during transitions?Research Question 4: Are interventions differentially effective depending on the main component of the inter-vention, behavioral topography, or transition type?Research Question 5: Are specific intervention types differentially effective depending on behavioral topogra-phies or targeted transitions?Research Question 6: Do research designs for included studies meet quality indicators?
Method
Inclusion Criteria
Five inclusion criteria were established a priori to deter-mine eligible studies: (a) at least one participant included in the study had to have a diagnosis of ASD and be between the ages of 3 and 21 years, (b) the intervention under evalu-ation had to be implemented in an educational setting, (c) the intervention under evaluation had to be aimed at improving transition behaviors of students, (d) the study must have used single-case research (SCR) methodology, and (e) the study must have been published in a peer-reviewed journal. Educational settings included any con-text where a child received instruction (e.g., an inclusive classroom, segregated classroom, or in-home educational
program). Transition behaviors were defined as those occurring when a student was expected to move from one activity to the next during the school day.
Search Procedure
First, electronic searches were conducted of five databases (i.e., PsycINFO, Academic Search Premier, ERIC, MEDLINE, and CINAHL Plus with Full Text) simultane-ously using the following keywords: autis*, Asperger*, developmental disab*, transition*, behavior*, intervention, and treatment. Keywords were connected by appropriate logical operators “or” and “and.” Of the 170 studies yielded by the database search, 10 fit the inclusion criteria. Most of the excluded studies were descriptive and did not evaluate an intervention using SCR. Ancestral searches of the 10 articles were completed to locate additional studies—result-ing in the identification of four studies. Thus, a total of 14 studies were included in this review. Sterling-Turner and Jordan (2007) noted the research base in the area of inter-ventions to address transitions for students with ASD is lim-ited; this is likely why so few studies met the inclusion criteria for this review as well.
Analysis of Included Studies
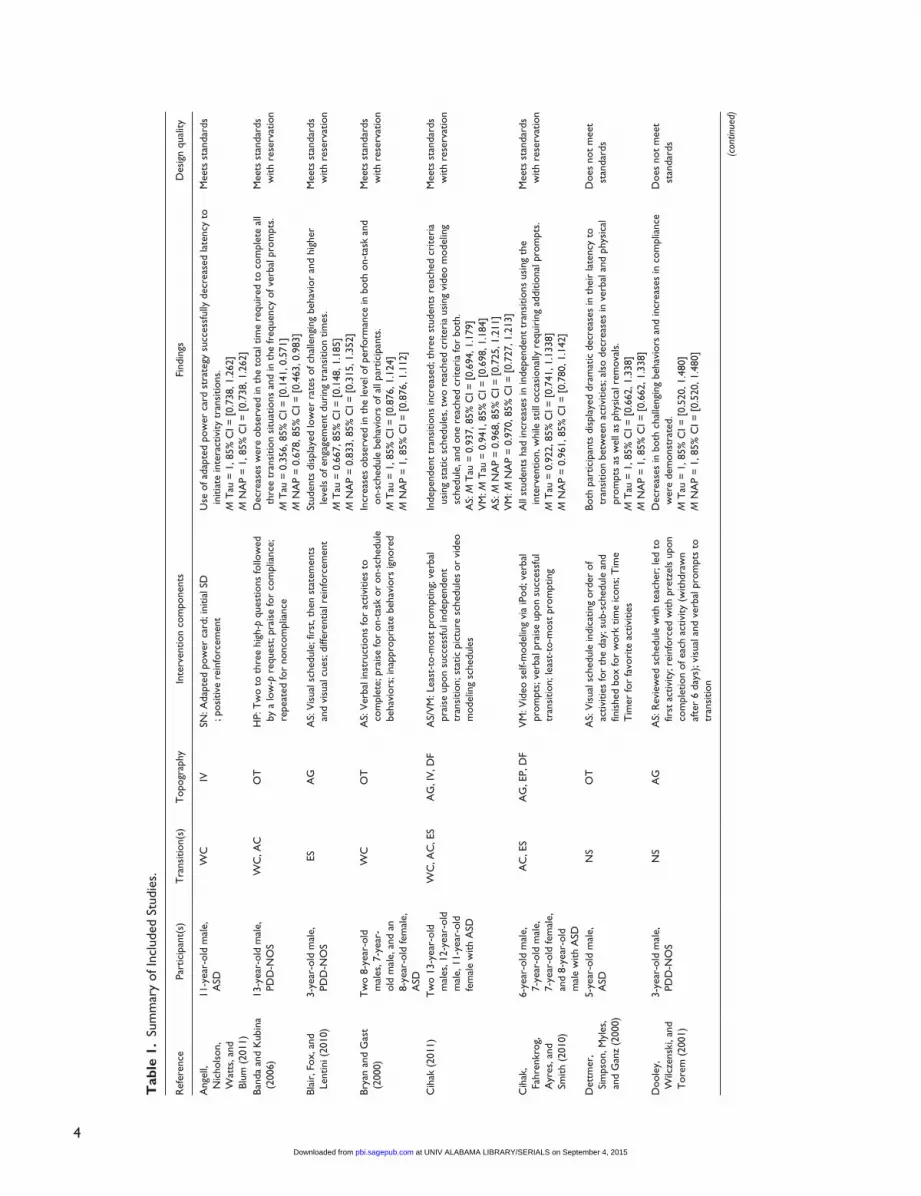
Included studies were quantitatively evaluated across the main component of the intervention, targeted topography of challenging behavior, and the targeted transition. Each of the 14 studies included in the review was categorized into one of six categories of main intervention component, defined as follows. Activity schedules (AS) are visual depic-tions of the sequence of activities for the day. Social narra-tives (SN) included Social Stories™ and power cards. Social Stories™ are short, individualized stories that high-light behavioral expectations for various social situations that a student may encounter and power cards are individu-alized cue cards that indicate a behavioral expectation. Video models (VM) are videos showing either the student or a model (e.g., same age peer) engaging in desired behaviors for the specific transition. The high-p procedure (HP) is a procedure where the individual is asked two to three high-probability questions (i.e., questions or requests that the stu-dent is likely to answer or comply with), followed by a low-probability request (i.e., targeted transition). For exam-ple, before requesting a student with ASD transition to a task that may be aversive, the teacher might request two to three tasks (e.g., give me a high five, ask how do you spell your name) that are typically responded to with high levels of compliance. Reinforcement-based procedures (RF) focus on providing a reinforcer following displays of appropriate transition behaviors. For a study to be categorized as RF, reinforcement had to be the only intervention component. Studies using reinforcement as part of the procedure for
at UNIV ALABAMA LIBRARY/SERIALS on September 4, 2015pbi.sagepub.comDownloaded from

Lequia et al. 3
implementation for another intervention were not included in this category. Peer-mediation (PM) consisted of a buddy system (i.e., typically developing peer with student with ASD) to facilitate proper transition behaviors. Studies were placed into a category based on the main component of the intervention under evaluation. Some studies evaluated more than one type of intervention; therefore, participant data were separated and placed in appropriate categories. For example, Cihak (2011) compared the use of VM and AS in four participants—each participant’s data for VM condi-tions were used in the video modeling category whereas participant data for AS condition were included in the AS category.
Targeted behaviors of each participant were categorized into one of the following five behavioral topographies. Aggression consisted of one or more behaviors with the potential to cause harm to self or others (e.g., pushing, destruction, scratching, hitting, kicking, and biting). Off task included requiring prompts by an adult to complete a transition. Inappropriate vocalizations consisted of verbal utterances deemed unacceptable due to the topic or the vol-ume of the utterance. Dropping to the floor consisted of physically falling to the floor or sitting on the floor when asked to transition. Elopement consisted of running away from the group during transitions. If one participant had multiple targeted behaviors that were not reported sepa-rately, data from the participant were used in each category of behavior that was targeted.
Studies were also categorized into one of the following three transition types. Across classroom transitions required ending an activity in one classroom to move to another classroom or other location outside the classroom, such as a locker in the hallway. Within classroom transitions required ending one activity and moving to another activity in the same classroom. Entering or exiting the school were transi-tions that required entering or exiting the school building. For studies that targeted more than one type of transition, only those that reported data separately for each type of transition were used in effect size calculations considering both the main component of the intervention and the type of transition.
Although acknowledging that use of effect sizes in SCR is still debated (see Parker & Hagan-Burke, 2007), we com-puted effect sizes for all of the included studies using Non-Overlap of All Pairs (NAP) as the main effect size measurement and Tau-U as a way to demonstrate added confidence for effect size results (Campbell, 2013; see Table 1). Procedures similar to those used by Lequia, Machalicek, and Rispoli (2012) were used to calculate effect sizes. Non-overlap indices are more robust than mean- or median-level changes across phases because such techniques compare each baseline data point with each intervention data point (Parker & Vannest, 2009). Parker, Vannest, and Davis (2011) suggested that connections to
nonparametric tests provide a rationale for use of some indi-ces (i.e., NAP) in SCR as a way to validate visual analysis. Moreover, there are currently no acceptable procedures for using only visual analysis to quantitatively synthesize SCR and conduct moderator analyses (Campbell, 2013). UnGraph (Biosoft, 2004; Shadish et al., 2009) was used to extract exact data from the included studies and an online calculator was used to compute effect sizes and 85% confi-dence intervals (CIs; Vannest, Parker, & Gonen, 2011). Forest plots were created to visually display the findings. Parker and Vannest (2009) suggested the following inter-pretation of NAP calculations: weak effect (0–0.65), mod-erate effect (0.66–0.92), and strong effect (0.93–1.0).
Each study’s research design was coded using a research design quality checklist that included criteria outlined by the What Works Clearinghouse (WWC) Procedures and Standards Handbook (U.S. Department of Education, 2011). Specific categories of quality indicators included experimental effect, inter-observer agreement (IOA), pro-cedural integrity, and social validity. Standards for two cat-egories were amended to reflect additional, more stringent, criteria suggested by Kennedy (2005) and Horner and col-leagues (2005). Specifically, for a study to be coded as meeting standards (MS) for IOA, such data needed to be collected for 30% of all sessions, rather than 20% as recom-mended by WWC (see Kennedy, 2005). In addition, the standard for procedural integrity was also amended to reflect criterion outlined by Horner and colleagues (2005), coded as MS if there was direct measurement of interven-tion implementation and meeting standards with reservation (MSR) if measured using self-report. Checklists are avail-able from authors on request.
Studies categorized as MS met all of the criteria for each category of quality indicator evaluated. Studies were coded as MSR if (a) demonstrations of experimental effect were coded as MSR or (b) either IOA or procedural integrity were coded as MSR and social validity data were not col-lected. Studies classified as not meeting standards (NMS) had two or more categories on the quality indicator check-list that did not meet criteria for meeting design quality standards.
IOA
Three types of IOA were calculated: study selection, article evaluation, and research design quality. IOA was computed by dividing the number of agreements by the number of agreements plus disagreements, and multiplying by 100. For study selection and article evaluation, procedures simi-lar to those used by Horner and colleagues (2002) were implemented to calculate IOA. For study selection, the sec-ond author independently coded a batch of 24 studies using a checklist to indicate whether each inclusion criterion was met. The batch of 24 studies included the 14 studies coded
at UNIV ALABAMA LIBRARY/SERIALS on September 4, 2015pbi.sagepub.comDownloaded from
4
Tab
le 1
. Su
mm
ary
of In
clud
ed S
tudi
es.
Ref
eren
cePa
rtic
ipan
t(s)
Tra
nsiti
on(s
)T
opog
raph
yIn
terv
entio
n co
mpo
nent
sFi
ndin
gsD
esig
n qu
ality
Ang
ell,
Nic
hols
on,
Wat
ts, a
nd
Blum
(20
11)
11-y
ear-
old
mal
e,
ASD
WC
IVSN
: Ada
pted
pow
er c
ard;
initi
al S
D
; pos
itive
rei
nfor
cem
ent
Use
of a
dapt
ed p
ower
car
d st
rate
gy s
ucce
ssfu
lly d
ecre
ased
late
ncy
to
initi
ate
inte
ract
ivity
tra
nsiti
ons.
M T
au =
1, 8
5% C
I = [
0.73
8, 1
.262
]M
NA
P =
1, 8
5% C
I = [
0.73
8, 1
.262
]
Mee
ts s
tand
ards
Band
a an
d K
ubin
a (2
006)
13-y
ear-
old
mal
e,
PDD
-NO
SW
C, A
CO
TH
P: T
wo
to t
hree
hig
h-p
ques
tions
follo
wed
by
a lo
w-p
req
uest
; pra
ise
for
com
plia
nce;
re
peat
ed fo
r no
ncom
plia
nce
Dec
reas
es w
ere
obse
rved
in t
he t
otal
tim
e re
quir
ed t
o co
mpl
ete
all
thre
e tr
ansi
tion
situ
atio
ns a
nd in
the
freq
uenc
y of
ver
bal p
rom
pts.
M T
au =
0.3
56, 8
5% C
I = [
0.14
1, 0
.571
]M
NA
P =
0.6
78, 8
5% C
I = [
0.46
3, 0
.983
]
Mee
ts s
tand
ards
w
ith r
eser
vatio
n
Blai
r, F
ox, a
nd
Lent
ini (
2010
)3-
year
-old
mal
e,
PDD
-NO
SES
AG
AS:
Vis
ual s
ched
ule;
firs
t, th
en s
tate
men
ts
and
visu
al c
ues;
diff
eren
tial r
einf
orce
men
tSt
uden
ts d
ispl
ayed
low
er r
ates
of c
halle
ngin
g be
havi
or a
nd h
ighe
r le
vels
of e
ngag
emen
t du
ring
tra
nsiti
on t
imes
.M
Tau
= 0
.667
, 85%
CI =
[0.
148,
1.1
85]
M N
AP
= 0
.833
, 85%
CI =
[0.
315,
1.3
52]
Mee
ts s
tand
ards
w
ith r
eser
vatio
n
Brya
n an
d G
ast
(200
0)T
wo
8-ye
ar-o
ld
mal
es, 7
-yea
r-ol
d m
ale,
and
an
8-ye
ar-o
ld fe
mal
e,
ASD
WC
OT
AS:
Ver
bal i
nstr
uctio
ns fo
r ac
tiviti
es t
o co
mpl
ete;
pra
ise
for
on-t
ask
or o
n-sc
hedu
le
beha
vior
s; in
appr
opri
ate
beha
vior
s ig
nore
d
Incr
ease
s ob
serv
ed in
the
leve
l of p
erfo
rman
ce in
bot
h on
-tas
k an
d on
-sch
edul
e be
havi
ors
of a
ll pa
rtic
ipan
ts.
M T
au =
1, 8
5% C
I = [
0.87
6, 1
.124
]M
NA
P =
1, 8
5% C
I = [
0.87
6, 1
.112
]
Mee
ts s
tand
ards
w
ith r
eser
vatio
n
Cih
ak (
2011
)T
wo
13-y
ear-
old
mal
es, 1
2-ye
ar-o
ld
mal
e, 1
1-ye
ar-o
ld
fem
ale
with
ASD
WC
, AC
, ES
AG
, IV
, DF
AS/
VM
: Lea
st-t
o-m
ost
prom
ptin
g; v
erba
l pr
aise
upo
n su
cces
sful
inde
pend
ent
tran
sitio
n; s
tatic
pic
ture
sch
edul
es o
r vi
deo
mod
elin
g sc
hedu
les
Inde
pend
ent
tran
sitio
ns in
crea
sed;
thr
ee s
tude
nts
reac
hed
crite
ria
usin
g st
atic
sch
edul
es, t
wo
reac
hed
crite
ria
usin
g vi
deo
mod
elin
g sc
hedu
le, a
nd o
ne r
each
ed c
rite
ria
for
both
.A
S: M
Tau
= 0
.937
, 85%
CI =
[0.
694,
1.1
79]
VM
: M T
au =
0.9
41, 8
5% C
I = [
0.69
8, 1
.184
]A
S: M
NA
P =
0.9
68, 8
5% C
I = [
0.72
5, 1
.211
]V
M: M
NA
P =
0.9
70, 8
5% C
I = [
0.72
7, 1
.213
]
Mee
ts s
tand
ards
w
ith r
eser
vatio
n
Cih
ak,
Fahr
enkr
og,
Ayr
es, a
nd
Smith
(20
10)
6-ye
ar-o
ld m
ale,
7-
year
-old
mal
e,
7-ye
ar-o
ld fe
mal
e,
and
8-ye
ar-o
ld
mal
e w
ith A
SD
AC
, ES
AG
, EP,
DF
VM
: Vid
eo s
elf-m
odel
ing
via
iPod
; ver
bal
prom
pts;
ver
bal p
rais
e up
on s
ucce
ssfu
l tr
ansi
tion;
leas
t-to
-mos
t pr
ompt
ing
All
stud
ents
had
incr
ease
s in
inde
pend
ent
tran
sitio
ns u
sing
the
in
terv
entio
n, w
hile
stil
l occ
asio
nally
req
uiri
ng a
dditi
onal
pro
mpt
s.M
Tau
= 0
.922
, 85%
CI =
[0.
741,
1.1
338]
M N
AP
= 0
.961
, 85%
CI =
[0.
780,
1.1
42]
Mee
ts s
tand
ards
w
ith r
eser
vatio
n
Det
tmer
, Si
mps
on, M
yles
, an
d G
anz
(200
0)
5-ye
ar-o
ld m
ale,
A
SDN
SO
TA
S: V
isua
l sch
edul
e in
dica
ting
orde
r of
ac
tiviti
es fo
r th
e da
y; s
ub-s
ched
ule
and
finis
hed
box
for
wor
k tim
e ic
ons;
Tim
e T
imer
for
favo
rite
act
iviti
es
Both
par
ticip
ants
dis
play
ed d
ram
atic
dec
reas
es in
the
ir la
tenc
y to
tr
ansi
tion
betw
een
activ
ities
; als
o de
crea
ses
in v
erba
l and
phy
sica
l pr
ompt
s as
wel
l as
phys
ical
rem
oval
s.M
Tau
= 1
, 85%
CI =
[0.
662,
1.3
38]
M N
AP
= 1
, 85%
CI =
[0.
662,
1.3
38]
Doe
s no
t m
eet
stan
dard
s
Doo
ley,
W
ilcze
nski
, and
T
orem
(20
01)
3-ye
ar-o
ld m
ale,
PD
D-N
OS
NS
AG
AS:
Rev
iew
ed s
ched
ule
with
tea
cher
; led
to
first
act
ivity
; rei
nfor
ced
with
pre
tzel
s up
on
com
plet
ion
of e
ach
activ
ity (
with
draw
n af
ter
6 da
ys);
visu
al a
nd v
erba
l pro
mpt
s to
tr
ansi
tion
Dec
reas
es in
bot
h ch
alle
ngin
g be
havi
ors
and
incr
ease
s in
com
plia
nce
wer
e de
mon
stra
ted.
M T
au =
1, 8
5% C
I = [
0.52
0, 1
.480
]M
NA
P =
1, 8
5% C
I = [
0.52
0, 1
.480
]
Doe
s no
t m
eet
stan
dard
s
(con
tinue
d)
at UNIV ALABAMA LIBRARY/SERIALS on September 4, 2015pbi.sagepub.comDownloaded from
5
Ref
eren
cePa
rtic
ipan
t(s)
Tra
nsiti
on(s
)T
opog
raph
yIn
terv
entio
n co
mpo
nent
sFi
ndin
gsD
esig
n qu
ality
Kut
tler,
Myl
es,
and
Car
lson
(1
998)
12-y
ear-
old
mal
e,
ASD
, FX
S,
inte
rmitt
ent
expl
osiv
e di
sord
er
WC
IV, D
FSN
: Soc
ial S
tori
es™
; cla
ssro
om p
ictu
re
sche
dule
; ind
ivid
ual p
ictu
re s
ched
ule;
re
info
rcem
ent
at d
esig
nate
d in
terv
als;
st
icke
r ch
arts
; poi
nt c
hart
s; t
oken
sys
tem
s
Dec
reas
es in
pre
curs
ors
to t
antr
um b
ehav
iors
wer
e di
spla
yed
upon
sy
stem
atic
intr
oduc
tion
and
with
draw
al o
f the
Soc
ial S
tory
™
com
pone
nt o
f the
inte
rven
tion.
M T
au =
0.9
89, 8
5% C
I = [
0.70
8, 1
.269
]M
NA
P =
0.9
94, 8
5% C
I = [
0.71
4, 1
.275
]
Doe
s no
t m
eet
stan
dard
s
Man
cil,
Hay
don,
an
d W
hitb
y (2
009)
Tw
o m
ales
and
one
fe
mal
e w
ith A
SD,
betw
een
ages
6
and
9
AC
AG
SN: S
ocia
l Sto
ry™
(pa
per
or c
ompu
ter
assi
sted
) re
ad d
urin
g la
st 5
min
of r
eadi
ng
time
All
stud
ents
dis
play
ed d
ecre
ases
in p
ushi
ng d
urin
g tr
ansi
tion
situ
atio
ns.
Pape
r: M
Tau
= 1
, 85%
CI =
[0.
753,
1.2
47]
CA
SST
: M T
au =
0.9
93, 8
5% C
I = [
0.76
9, 1
.218
]Pa
per:
M N
AP
= 1
, 85%
CI =
[0.
753,
1.2
47]
CA
SST
: M N
AP
= 0
.997
, 85%
CI =
[0.
740,
1.2
53]
Mee
ts s
tand
ards
w
ith r
eser
vatio
n
Mas
sey
and
Whe
eler
(20
00)
4-ye
ar-o
ld m
ale,
A
SDW
CA
GA
S: A
ctiv
ity s
ched
ule;
pro
mpt
s (v
erba
l, ge
stur
al, p
hysi
cal);
gra
duat
ed g
uida
nce
(mos
t-to
-leas
t)
Incr
ease
in t
ask
enga
gem
ent
duri
ng a
ll co
nditi
ons,
dec
reas
es in
ch
alle
ngin
g be
havi
or d
urin
g w
ork
and
lunc
h co
nditi
ons;
incr
ease
s in
ch
alle
ngin
g be
havi
ors
disp
laye
d du
ring
leis
ure
cond
ition
s.M
Tau
= 0
.555
, 85%
CI =
[0.
350,
0.7
60]
M N
AP
= 0
.778
, 85%
CI =
[0.
572,
0.9
83]
Doe
s no
t m
eet
stan
dard
s
Sain
ato,
Str
ain,
Le
febv
re, a
nd
Rap
p (1
987)
Tw
o 4-
year
-old
m
ales
and
one
3-
year
-old
mal
e,
seve
re A
SD
WC
, AC
OT
PM: T
rans
ition
with
a b
uddy
RF:
Chi
ld in
form
ed t
o go
to
area
and
rin
g be
ll
Both
inte
rven
tions
res
ulte
d in
incr
ease
s in
chi
ld r
ate
of m
ovem
ent
duri
ng t
rans
ition
s; h
owev
er, t
he b
ell s
eem
ed t
o ha
ve m
ore
dram
atic
im
prov
emen
t; de
crea
ses
in t
each
er p
rom
pts
wer
e ob
serv
ed a
s w
ell.
PM: M
Tau
= 0
.863
, 85%
CI =
[0.
690,
1.0
36]
RF:
M T
au =
0.9
95, 8
5% C
I = [
0.67
8, 1
.288
]PM
: M N
AP
= 0
.932
, 85%
CI =
[0.
758,
1.1
05]
RF:
M N
AP
= 0
.997
, 85%
CI =
[0.
827,
1.1
68]
Mee
ts s
tand
ards
w
ith r
eser
vatio
n
Schm
it, A
lper
, R
asch
ke, a
nd
Ryn
dak
(200
0)
6-ye
ar-o
ld m
ale,
A
SDW
C, A
C, E
SA
GA
S: P
hoto
grap
hic
cue
of n
ext
activ
ity
pres
ente
d to
chi
ld p
rior
to
tran
sitio
n tim
e al
ong
with
ver
bal c
ues
Giv
ing
adva
nce
notic
e of
an
activ
ity c
hang
e in
com
bine
d fo
rm o
f ve
rbal
and
pho
togr
aphi
c cu
es h
elpe
d to
red
uce
chal
leng
ing
beha
vior
M T
au =
0.8
20, 8
5% C
I = [
0.59
8, 1
.042
]M
NA
P =
0.9
10, 8
5% C
I = [
0.68
8, 1
.132
]
Doe
s no
t m
eet
stan
dard
s
Wat
ers,
Ler
man
, an
d H
ovan
etz
(200
9)
Tw
o 6-
year
-old
m
ales
, ASD
WC
AG
AS:
Vis
ual s
ched
ule
alon
e an
d w
ith D
RO
RF:
DR
O w
ithou
t sc
hedu
leIn
the
vis
ual s
ched
ule
only
con
ditio
n, t
here
was
no
chan
ge in
fr
eque
ncy
of c
halle
ngin
g be
havi
or. W
ith t
he in
clus
ion
of D
RO
and
ex
tinct
ion,
cha
lleng
ing
beha
vior
dec
reas
ed fo
r bo
th p
artic
ipan
ts.
Best
res
ults
with
vis
ual s
ched
ule,
DR
O a
nd e
xtin
ctio
n pr
oced
ures
im
plem
ente
d.A
S: M
Tau
= 0
.548
, 85%
CI =
[0.
242,
0.8
53]
RF:
M T
au =
0.8
58, 8
5% C
I = [
0.45
4, 1
.262
]A
S: M
NA
P =
0.7
74, 8
5% C
I = [
0.46
9, 1
.079
]R
F: M
NA
P =
0.9
29, 8
5% C
I = [
0.52
5, 1
.333
]
Doe
s no
t m
eet
stan
dard
s
Not
e. A
SD =
aut
ism
spe
ctru
m d
isor
der;
WC
= w
ithin
cla
ssro
om t
rans
ition
; IV
= in
appr
opri
ate
voca
lizat
ions
; SN
= s
ocia
l nar
rativ
es; D
S =
dis
crim
inat
ive
stim
ulus
; CI =
con
fiden
ce in
terv
al; N
AP
= n
on-o
verl
ap o
f all
pair
s; P
DD
-N
OS
= p
erva
sive
dev
elop
men
tal d
isor
der–
not
othe
rwis
e sp
ecifi
ed; A
C =
acr
oss
clas
sroo
m t
rans
ition
s; O
T =
off
task
; HP
= h
igh-
p pr
oced
ure;
ES
= e
nter
ing/
exiti
ng s
choo
l tra
nsiti
on; A
G =
agg
ress
ion;
AS
= a
ctiv
ity s
ched
ules
; D
F =
drop
ping
to
the
floor
; VM
= v
ideo
mod
els;
EP
= el
opem
ent;
NS
= no
t sp
ecifi
ed; F
XS
= fr
agile
X s
yndr
ome;
CA
SST
= C
ompu
ter-
Ass
iste
d So
cial
Sto
ry™
; PM
= p
eer-
med
iatio
n; R
F =
rein
forc
emen
t-ba
sed
proc
edur
es; D
RO
=
diffe
rent
ial r
einf
orce
men
t of
oth
er b
ehav
ior.
Tab
le 1
. (c
ont
inue
d)
at UNIV ALABAMA LIBRARY/SERIALS on September 4, 2015pbi.sagepub.comDownloaded from

6 Journal of Positive Behavior Interventions
as meeting all inclusion criteria by the first author and 10 randomly selected studies coded as not meeting all inclu-sion criteria by the first author (M = 99.3%; range = 83.3%–100%). For article evaluation, the first and third author independently extracted data on targeted behavioral topog-raphy, targeted transition, main component of intervention, and findings for each study (M = 98.2%, range = 75%–100%). For research design quality, the first and third authors independently coded each included study using the research design quality checklist described in the previous section (M = 98.1%; range = 90.9%–100%). Following independent initial coding for each type of IOA, authors discussed each disagreement until consensus on how an item should be coded was reached.
Results
Overview of Study Characteristics
Each study included one to four participants, with a total of 28 participants. Of the 28 participants from the included studies, 89% had diagnoses of ASD (n = 25 participants), 11% had diagnoses of pervasive developmental disorder–not otherwise specified (PDD-NOS; n = 3 participants), and 86% were male (n = 24 participants). Participants ranged in age from 3 to 13 years. All but one study had natural change agents (i.e., staff who regularly work with the student) implementing the intervention procedures for transitions and all transitions occurred in authentic settings. Nine stud-ies examined the effects of intervention strategies in segre-gated settings, four evaluated intervention effects in inclusive settings, and one study analyzed intervention effects in a home-based educational program. A summary of the included studies can be found in Table 1.
For each variable analyzed quantitatively, the number of contrasts (i.e., the number of times a phase without an inter-vention is compared with a phase with an intervention) used to calculate effect sizes is important to consider when inter-preting effect sizes. More contrasts included in effect size calculations allow for increased confidence of interpreta-tions using effect sizes. The number of contrasts was calcu-lated for each variable of interest: AS (n = 55 contrasts), SN (n = 47), HP (n = 8), VM (n = 20), RF (n = 5), PM (n = 3), aggression (n = 65), off-task behavior (n = 54), inappropri-ate vocalizations (n = 19), dropping to the floor (n = 14), elopement (n = 4), across classroom transitions (n = 37), within classroom transitions (n = 54), and entering or exit-ing school transitions (n = 2).
Main Component of Intervention
Effect sizes for most of the main components of the inter-ventions suggested strong effects: AS (n = 15 participants; M = 0.934, 85% CI = [0.858, 1.011]), SN (n = 5; M = 0.998,
85% CI = [0.858, 1.137]), VM (n = 8; M = 0.964, 85% CI = [0.819, 1.110]), RF (n = 5; M = 0.987, 85% CI = [0.830, 1.144]), and PM (n = 3; M = 0.932, 85% CI = [0.758, 1.105]). One study (Banda & Kubina, 2006) evaluated the effects of using HP on the behavior of one participant. The effect size for this study was 0.678, 85% CI = [0.463, 0.893], suggesting only a moderate effect in reducing off-task behavior during transitions. The effect size and CI of effect sizes of each study according to the main component of the intervention under evaluation in the study are visually displayed in a forest plot in Figure 1. Considering the qual-ity of the studies, one study that evaluated the use of SN was coded as MS. Nine studies met standards with reserva-tions (MSR) and assessed the use of AS (n = 3 studies), SN (n = 1), HP (n = 1), VM (n = 2), RF (n = 1), and PM (n = 1). Six studies were categorized as NMS; those studies evalu-ated the use of AS (n = 5), SN (n = 1), and RF (n = 1). A table that summarizes the results of the research design quality analysis is available from the authors on request.
Topography of Challenging Behavior
Similarly, the majority of the studies assessing the effects of interventions on various topographies of challenging behav-iors demonstrated strong effects: off-task behavior (n = 8 participants; M = 0.943, 85% CI = [0.864, 1.021]), inappro-priate vocalizations (n = 3; M = 1, 85% CI = [0.816, 1.184]), dropping to the floor (n = 3; M = 0.967, 85% CI = [0.759, 1.175]), and elopement (n = 1; M = 0.964, 85% CI = [0.552, 1.305]). Studies evaluating off-task behavior used the fol-lowing interventions: AS (n = 5; M = 1, 85% CI = [0.884, 1.116]), HP (n = 1; M = 0.678, 85% CI = [0.463, 0.893]), RF (n = 3; M = 0.997, 85% CI = [0.827, 1.168]), and PM (n = 3; M = 0.932, 85% CI = [0.758, 1.105]). Interventions used to evaluate inappropriate vocalizations include AS (n = 1; M = 1, 85% CI = [0.520, 1.480]), SN (n = 2; M = 1, 85% CI = [0.782, 1.218]), and VM (n = 1; M = 1, 85% CI = [0.520, 1.480]). Studies that assessed the effects of interventions on dropping to the floor used AS (n = 1; M = 0.975, 85% CI = [0.458, 1.442]), SN (n = 1; M = 0.987, 85% CI = [0.581, 1.134]), and VM (n = 2; M = 0.953, 85% CI = [0.672, 1.234]). The study that examined intervention effects on decreasing elopement for one participant used VM (M = 0.964, 85% CI = [0.552, 1.305]).
Combined, studies targeting aggression established moderate effects (n = 13 participants; M = 0.905, 85% CI = [0.815, 0.994]). Studies evaluating the effects of interven-tion on decreasing aggression during transitions analyzed the effects of AS (n = 9; M = 0.852, 85% CI = [0.733, 0.970]), SN (n = 3; M = 0.998, 85% CI = [0.832, 1.164]), VM (n = 4; M = 0.964, 85% CI = [0.757, 1.171]), and RF (n = 2; M = 0.929, 85% CI = [0.525, 1.333]). Figure 2 visu-ally depicts the effect sizes and CIs of individual studies according to the topography of the challenging behavior.
at UNIV ALABAMA LIBRARY/SERIALS on September 4, 2015pbi.sagepub.comDownloaded from
Lequia et al. 7
Figure 1. Forest plot of aggregated NAP and confidence intervals of effect sizes according to the main component of the intervention.Note. Vertical lines represent the suggested interpretation criteria (i.e., weak, moderate, strong) for effect sizes. NAP = non-overlap of all pairs.
at UNIV ALABAMA LIBRARY/SERIALS on September 4, 2015pbi.sagepub.comDownloaded from
8 Journal of Positive Behavior Interventions
Figure 2. Forest plot of aggregated NAP and confidence intervals of effect sizes according to the topography of challenging behavior.Note. Vertical lines represent the suggested interpretation criteria (i.e., weak, moderate, strong) for effect sizes. NAP = non-overlap of all pairs.
at UNIV ALABAMA LIBRARY/SERIALS on September 4, 2015pbi.sagepub.comDownloaded from

Lequia et al. 9
Considering research quality indicators, one study that evaluated intervention effects on dropping to the floor was coded as MS. Eleven studies were coded as MSR and assessed intervention effects on aggression (n = 4 studies), off-task behavior (n = 3), inappropriate vocalizations (n = 1), dropping to the floor (n = 2), and elopement (n = 1). Seven studies were categorized as NMS; those studies eval-uated the effects of interventions on aggression (n = 4), off-task behavior (n = 1), inappropriate vocalizations (n = 1), and dropping to the floor (n = 1).
Targeted Transitions
When considering transition type, intervention effects addressing both across classroom transitions (n = 15 partici-pants; M = 0.990, 85% CI = [0.802, 1.178]) and within classroom transitions (n = 18; M = 0.940, 85% CI = [0.855, 1.025]) demonstrated strong effects. Six studies examined interventions during transitions across different classrooms in the same building, but only two of those studies reported data specifically on across classroom transitions; the others combined intervention results for different types of transi-tions. For studies addressing across classroom transitions, the effects of AS (n = 1; M = 0.945, 85% CI = [0.414, 1.367]), VM, HP, SN (n = 3; M = 0.998, 85% CI = [0.832, 1.164]), RF, and PM on transition behaviors were evalu-ated. Nine of the 14 included studies (64%) assessed inter-vention effects during transitions within a classroom, with only 6 studies reporting data explicitly on within classroom transitions. The studies assessing effects of interventions for within classroom transitions included AS (n = 8; M = 0.929, 85% CI = [0.525, 1.333]), VM, SN (n = 2; M = 0.997, 85% CI = [0.806, 1.189]), PM, HP, and RF (n = 2; M = 0.929, 85% CI = [0.525, 1.333]). The combined effect sizes and CIs according to the type of transition expected of the student with ASD for each study are visually displayed in a forest plot in Figure 3.
Overall, the intervention effects for transitions for enter-ing or exiting school transitions suggested moderate effects (n = 11 participants), with a combined effect size of 0.853, 85% CI = [0.586, 1.120]. Four studies (29%) evaluated the effects of interventions on improving entering or exiting school transitions, with two explicitly reporting data on these transitions. Studies evaluating the effects of interven-tions on transition behaviors during these specific transi-tions examined the use of VM and AS (n = 2 participants; M = 0.853, 85% CI = [0.586, 1.053]). Considering the qual-ity of the included studies, one study that evaluated inter-vention effects on within classroom transitions was coded as MS. Twelve studies were coded as MSR and assessed intervention effects on within classroom transitions (n = 4 studies), across classroom transitions (n = 5), and entering or exiting school transitions (n = 3). Six studies were cate-gorized as NMS; those studies evaluated the effects of
interventions on within classroom transitions (n = 4), across classroom transitions (n = 1), and entering or exiting school transitions (n = 1).
Discussion
Despite the limited number of studies addressing transition difficulties for students with ASD in educational settings, this review indicates that all strategies evaluated in the lit-erature show promising effects. Across all variables ana-lyzed, there was overlap in the CIs of the mean effect sizes at the 85% confidence level. Thus, despite variability among average effect sizes across categories, we cannot say that the effects of interventions were significantly different between the different main components of intervention, the different topographies of challenging behavior, or the dif-ferent types of transitions. However, Figures 1 to 3 illustrate the variability in the amount of evidence included in the literature supporting the effects across these variables. As relevant studies are added to the literature, future quantita-tive syntheses should consider moderator analyses to ana-lyze potential interactions among these variables as well as participant characteristics that may contribute to and explain this variability. Below we provide an informal examination of the possible trends among and differences between inter-vention variables and possible interactions.
First, however, it is important to note several limitations of the current review. Selection bias may be reflected in the data provided by the included studies due to the lack of ran-dom assignment of participants to phases, or tiers in multiple baseline studies; this ultimately causes gaps in the conclu-sions we are able to draw. In addition, overall, there were a small number of participants and some studies only included one participant, which may limit the external validity of the data provided. Last, authors of the article completed the IOA procedures, which may lead to skewing of the IOA data.
Acknowledging these limitations, emerging trends are still evident when considering the variables of interest. Across the main components of intervention packages, AS resulted in highly variable effects, with more participants demonstrating moderate effects than strong effects. Other interventions (e.g., SN, VM) reported strong effects for more participants compared with the other strategies, sug-gesting that they may be most promising in addressing tran-sition difficulties. Across behavioral topographies, effect sizes suggest that interventions are more effective in reduc-ing less severe behaviors. For example, studies demonstrate only moderate effects in improving transitions in students who display aggression, while strong effects were demon-strated for students who display off-task behavior. No trends were evident in effect sizes for interventions across transi-tion type. However, there were fewer studies, and thus fewer demonstrations of experimental effects for entering or exiting school transitions.
at UNIV ALABAMA LIBRARY/SERIALS on September 4, 2015pbi.sagepub.comDownloaded from

10 Journal of Positive Behavior Interventions
Figure 3. Forest plot of aggregated NAP and confidence intervals of effect sizes according to the type of transition.Note. Vertical lines represent the suggested interpretation criteria (i.e., weak, moderate, strong) for effect sizes. NAP = non-overlap of all pairs.
at UNIV ALABAMA LIBRARY/SERIALS on September 4, 2015pbi.sagepub.comDownloaded from

Lequia et al. 11
Concurrent analyses of the main component of interven-tion within different topographies of behavior suggest cer-tain intervention strategies may be more promising in reducing specific topographies of challenging behaviors during transitions. For aggression, results indicated that SN and VM are promising techniques, whereas AS and RF both only resulted in moderate effects. For off-task behavior, three strategies (i.e., AS, RF, and PM) showed promising effects in improving student behavior during transitions. AS, SN, and VM were all found to have strong effects in reducing inappropriate vocalizations and dropping to the floor. Strong effects were also demonstrated using VM to reduce elopement.
Only a few of the studies included in the review reported data separately for the type of transition that was being tar-geted; but for those few, effect sizes were analyzed to deter-mine which intervention component was most effective for specific transitions. For within classroom transitions, results indicated that SN is a promising technique whereas AS and RF both only resulted in moderate effects. For across class-room transitions, both AS and SN demonstrated strong effects in improving student behavior. In terms of entering or exiting school transitions, the use of AS was examined and found to be moderately effective.
Different types of transitions require varying levels of response effort from the student, which can directly influ-ence the effectiveness of a behavioral intervention (Buckley & Newchok, 2005). Consider within classroom versus entering or exiting school transitions. Within classroom transitions consist of wrapping up one activity and moving to another within fairly close proximity. In contrast, enter-ing or exiting school transitions might consist of several expectations: finishing an activity that they are currently working on, putting materials away, identifying the materi-als that need to be brought home, and gathering belongings. This may explain why interventions targeting entering or exiting school transitions reported only moderate effect sizes.
Sterling-Turner and Jordan (2007) emphasized the importance of functional behavior assessments (FBA) in the selection of interventions. Three of the studies included in the current review utilized FBA procedures, which sup-ports the findings of a review suggesting that successful interventions for addressing the challenging behaviors of students with ASD in educational settings frequently did not utilize FBAs (Machalicek, O’Reilly, Beretvas, Sigafoos, & Lancioni, 2007). Given the emphasized importance of using FBAs in selecting interventions (Cooper, Heron, & Heward, 2007), procedures specific to transitions may need to be explored. For example, practitioners may consider evaluating the variables such as location change, activity initiation or termination, and preference of activity (McCord, Thomson, & Iwata, 2001) in their direct observa-tions during FBAs.
Practitioners must also consider the evidence base for an intervention for a specific context, but there is no easy method to do so. The use of forest plots to visually display data from a combination of studies with similar characteris-tics (e.g., targeted transition), in combination with consider-ation of the number of contrasts and the quality of the study, can facilitate appropriate interpretation of the evidence base of particular interventions by practitioners. The creation of a national database for special education intervention researchers to enter SCR data, which output forest plots of aggregate data from studies meeting minimal quality requirements, is a practical way to increase the dissemina-tion and accurate interpretation of the evidence behind par-ticular interventions. Due to the variation of intervention effects across this population of students, practitioners will still need to assess the ongoing effects of the intervention on student behavior to ensure optimal outcomes and identify alternative strategies as needed (Kalberg, Lane, & Menzies, 2010; Snell & Brown, 2011).
AS were the most commonly investigated intervention strategy across studies in this review. However, AS demon-strated variable effects (see Figure 1) in decreasing problem behavior associated with moving from one activity to another within a classroom. In addition, across interven-tions, studies that investigated AS had the highest propor-tion that did not meet quality standards. Therefore, we suggest that there is a need for more research, with increased rigor, to investigate the effects of AS. We also suggest future researchers investigate other interventions that have, thus far, shown to be highly effective for improving within class-room transitions, such as VM and SN to determine whether these strong effects are replicable. Comparison of effects across different types of interventions during various types of transitions is an important consideration for future research efforts.
Most of the included studies were coded as MS or MSR. Only half of the studies examined procedural integrity using either self-report or direct observation, and just over half of the studies considered social validity or maintenance of the intervention under examination. The use of a typically developing peer as a comparison is a potential method to objectively address the social validity of interventions, given that transitioning from one activity to the next is a high frequency and sometimes challenging task for students regardless of disability status. Researchers should also report data separately for each type of transition because, as evinced from this review, interventions were associated with differential effects across transition types.
Conclusion
The literature identifies a handful of effective strategies in improving transition behaviors in students with ASD in educational settings. Although AS have the most studies
at UNIV ALABAMA LIBRARY/SERIALS on September 4, 2015pbi.sagepub.comDownloaded from

12 Journal of Positive Behavior Interventions
evaluating their effectiveness during transitions, results suggest that other strategies are also effective. Forest plots are a promising mode for practitioners to determine and keep current on the evidence behind various interventions. In addition, researchers need to increase the quality of stud-ies used to evaluate intervention effects on challenging behaviors evoked by transitions in educational settings. Improving transition behaviors in educational settings may lead to other socially significant outcomes, including increased time spent in academic instruction and increased inclusion in general education settings.
Declaration of Conflicting Interests
The author(s) declared no potential conflicts of interest with respect to the research, authorship, and/or publication of this article.
Funding
The author(s) received no financial support for the research, authorship, and/or publication of this article.
References
*Denotes studies used in current review.American Psychiatric Association. (2000). Diagnostic and sta-
tistical manual of mental disorders (4th ed., text rev.). Washington, DC: Author.
*Angell, M. E., Nicholson, J. K., Watts, E. H., & Blum, C. (2011). Using a multicomponent adapted power card strategy to decrease latency during interactivity transitions for three chil-dren with developmental disabilities. Focus on Autism and Other Developmental Disabilities, 26, 206–217.
*Banda, D. R., & Kubina, R. M., Jr. (2006). The effects of a high-probability request sequencing technique in enhancing transition behaviors. Education & Treatment of Children, 29, 507–516.
Biosoft. (2004). UnGraph for Windows (Version 5.0). Cambridge, UK: Author.
*Blair, K. C., Fox, L., & Lentini, R. (2010). Use of positive behav-ior support to address the challenging behavior of young chil-dren within a community early childhood program. Topics in Early Childhood Special Education, 30, 68–79.
*Bryan, L. C., & Gast, D. L. (2000). Teaching on-task and on-schedule behaviors to high-functioning children with autism via picture activity schedules. Journal of Autism and Developmental Disorders, 30, 553–567.
Buckley, S. D., & Newchok, D. K. (2005). Differential impact of response effort within a response chain on the use of mands in a student with autism. Research in Developmental Disabilities, 26, 77–85.
Buschbacher, P. W., & Fox, L. (2003). Understanding and inter-vening with the challenging behavior of young children with autism spectrum disorder. Language, Speech, and Hearing Services in Schools, 34, 217–227.
Campbell, J. M. (2013). Commentary on PND at 25. Remedial and Special Education, 34, 20–25.
Carta, J. J., Greenwood, C. R., & Robinson, S. L. (1987). Application of an ecobehavioral approach to the evaluation
of early intervention programs. In R. Prinz (Ed.), Advances in behavioral assessment of children and families (Vol. 3, pp. 123–155) Greenwich, CT: JAI Press, Inc.
*Cihak, D. F. (2011). Comparing pictorial and video modeling activity schedules during transitions for students with autism spectrum disorders. Research in Autism Spectrum Disorders, 5, 433–441.
*Cihak, D. F., Fahrenkrog, C., Ayres, K. M., & Smith, C. (2010). The use of video modeling via a video iPod and a system of least prompts to improve transitional behaviors for students with autism spectrum disorders in the general education class-room. Journal of Positive Behavior Interventions, 12, 103–115.
Cooper, J. O., Heron, T. E., & Heward, W. L. (2007). Applied behavior analysis (2nd ed.). Upper Saddle River, NJ: Pearson.
*Dettmer, S., Simpson, R. L., Myles, B. S., & Ganz, J. B. (2000). The use of visual supports to facilitate transitions of students with autism. Focus on Autism and Other Developmental Disabilities, 15, 163–169.
*Dooley, P., Wilczenski, F. L., & Torem, C. (2001). Using an activity schedule to smooth school transitions. Journal of Positive Behavior Interventions, 3, 57–61.
Flannery, K. B., & Horner, R. H. (1994). The relationship between predictability and problem behavior for students with severe disabilities. Journal of Behavioral Education, 4, 157–176.
Horner, R. H., Carr, E. G., Halle, J., McGee, G., Odom, S., & Wolery, M. (2005). The use of single-subject research to iden-tify evidence-based practice in special education. Exceptional Children, 71, 165–179.
Horner, R. H., Carr, E. G., Strain, P. S., Todd, A. W., & Reed, H. K. (2002). Problem behavior interventions for young chil-dren with autism: A research synthesis. Journal of Autism and Developmental Disorders, 32, 423–446.
Jang, J., Dixon, D. R., Tarbox, J., & Granpeesheh, D. (2011). Symptom severity and challenging behavior in children with ASD. Research in Autism Spectrum Disorders, 5, 1028–1032.
Kalberg, J. R., Lane, K. L., & Menzies, H. M. (2010). Using sys-tematic screening procedures to identify students who are nonresponsive to primary prevention efforts: Integrating aca-demic and behavioral measures. Education & Treatment of Children, 33, 561–584.
Kennedy, C. (2005). Single-case designs for educational research. Boston, MA: Allyn & Bacon.
*Kuttler, S., Myles, B. S., & Carlson, J. K. (1998). The use of social stories to reduce precursors to tantrum behavior in a stu-dent with autism. Focus on Autism and Other Developmental Disabilities, 13, 176–182.
Lequia, J., Machalicek, W., & Rispoli, M. (2012). Effects of activity schedules on challenging behavior exhibited in chil-dren with autism spectrum disorders: A systematic review. Research in Autism Spectrum Disorders, 6, 480–492.
Machalicek, W., O’Reilly, M., Beretvas, N., Sigafoos, J., & Lancioni, G. (2007). A review of interventions to reduce chal-lenging behavior in school settings for students with autism spectrum disorders. Research in Autism Spectrum Disorders, 1, 229–246.
*Mancil, G. R., Haydon, T., & Whitby, P. (2009). Differentiated effects of paper and computer-assisted social stories™ on inappropriate behavior in children with autism. Focus on Autism and Other Developmental Disabilities, 24, 205–215.
at UNIV ALABAMA LIBRARY/SERIALS on September 4, 2015pbi.sagepub.comDownloaded from

Lequia et al. 13
*Massey, N. G., & Wheeler, J. J. (2000). Acquisition and general-ization of activity schedules and their effects on task engage-ment in a young child with autism in an inclusive pre-school classroom. Education and Training in Mental Retardation and Developmental Disabilities, 35, 326–335.
Matson, J. L., Gonzales, M. L., & Rivet, T. T. (2008). Reliability of the autism spectrum disorder-behavior problems for chil-dren (ASD-BPC). Research in Autism Spectrum Disorders, 2, 696–706.
Matson, J. L., Wilkins, J., & Macken, J. (2009). The relationship of challenging behaviors to severity and symptoms of autism spectrum disorders. Journal of Mental Health Research in Intellectual Disabilities, 2, 29–44.
McCord, B. E., Thomson, R. J., & Iwata, B. A. (2001). Functional analysis and treatment of self-injury associated with transi-tions. Journal of Applied Behavior Analysis, 34, 195–210.
McTiernan, A., Leader, G., Healy, O., & Mannion, A. (2011). Analysis of risk factors and early predictors of challeng-ing behavior for children with autism spectrum disorder. Research in Autism Spectrum Disorders, 5, 1215–1222.
Murphy, G. H., Beadle-Brown, J., Wing, L., Gould, J., Shah, A., & Holmes, N. (2005). Chronicity of challenging behaviors in people with severe intellectual disabilities and/or autism: A total population sample. Journal of Autism and Developmental Disorders, 35, 405–418.
Parker, R. I., & Hagan-Burke, S. (2007). Useful effect size interpre-tations for single case research. Behavior Therapy, 38, 95–105.
Parker, R. I., & Vannest, K. (2009). An improved effect size for single-case research: Nonoverlap of all pairs. Behavior Therapy, 40, 357–367.
Parker, R. I., Vannest, K., & Davis, J. L. (2011). Effect size in single-case research: A review of nine nonoverlap techniques. Behavior Modification, 35, 303–322.
Register, D., & Humpal, M. (2007). Using musical transitions in early childhood classrooms: Three case examples. Music Therapy Perspectives, 25, 25–31.
Rojahn, J., Matson, J. L., Lott, D., Esbensen, A. J., & Smalls, Y. (2001). The Behavior Problems Inventory: An instrument for the assessment of self-injury, stereotyped behavior and aggression/destruction in individuals with developmental
disabilities. Journal of Autism and Developmental Disorders, 31, 577–588.
*Sainato, D. M., Strain, P. S., Lefebvre, D., & Rapp, N. (1987). Facilitating transition times with handicapped preschool chil-dren: A comparison between peer-mediated and antecedent prompt procedures. Journal of Applied Behavior Analysis, 20, 285–291.
*Schmit, J., Alper, S., Raschke, D., & Ryndak, D. (2000). Effects of using a photographic cueing package during routine school transitions with a child who has autism. Mental Retardation, 38, 131–137.
Shadish, W. R., Brasil, I. C., Illingworth, D. A., White, K. D., Galindo, R., Nagler, E. D., & Rindskopf, D. M. (2009). Using UnGraph to extract data from image files: Verification of reliability and validity. Behavior Research Methods, 41, 177–183.
Snell, M. E., & Brown, F. (2011). Instruction of students with severe disabilities (7th ed.). Boston, MA: Pearson.
Sterling-Turner, H. E., & Jordan, S. S. (2007). Interventions addressing transition difficulties for individuals with autism. Psychology in the Schools, 44, 681–691.
Strain, P. S., Wilson, K., & Dunlap, G. (2011). Prevent-teach-reinforce: Addressing problem behaviors of students with autism in general education classrooms. Behavioral Disorders, 36, 160–171.
U.S. Department of Education. (2011). What works clearing-house: Procedures and standards handbook. Washington, DC: Institute of Education Sciences. Retrieved from http://ies.ed.gov/ncee/wwc/DocumentSum.aspx?sid=19
Vannest, K. J., Parker, R. I., & Gonen, O. (2011). Single Case Research: Web based calculators for SCR analysis (Version 1.0) [Web-based application]. College Station: Texas A&M University. Available from singlecaseresearch.org
Volkmar, F. R., & Wiesner, L. A. (2009). A practical guide to autism: What every parent, family member, and teacher needs to know. Hoboken, NJ: John Wiley.
*Waters, M. B., Lerman, D. C., & Hovanetz, A. N. (2009). Separate and combined effects of visual schedules and extinction plus differential reinforcement on problem behavior occasioned by transitions. Journal of Applied Behavior Analysis, 42, 309–313.
at UNIV ALABAMA LIBRARY/SERIALS on September 4, 2015pbi.sagepub.comDownloaded from